Embed Size (px)
Citation preview
FINAL REPORT
IMPROVING WATER CONSERVATION IN THE
MARBLE AND GRANITE INDUSTRY IN LEBANON
PREPARED FOR
ASSOCIATION OF LEBANESE INDUSTRIALISTS
WATER EFFICIENCY IN LEBANESE INDUSTRIES – WELI” PROGRAM
AUGUST 2019
Water Efficiency in Lebanese Industries Marble and Granite Industry
Geoflint s.a.r.l, Lebanon 1 Leb- Final Report-August 2019
Table of Contents 1. Introduction ........................................................................................................................ 4
2. Marble and Granite Industry Overview .............................................................................. 4
3. Project Overview ................................................................................................................ 5
4. Description of the Proposed Improvements in Wastewater Management Systems ........... 7
4.1. Settlement Pond........................................................................................................... 7
4.2. Silo/Shaped Sedimentation Tank ................................................................................ 8
4.3. Filter Press ................................................................................................................. 10
5. Methodology of the Water Audit ...................................................................................... 10
5.1. Data Acquisition and Site Inspection ........................................................................ 10
5.2. Water Mass Balance Analysis ................................................................................... 11
6. Summary of Auditing Results .......................................................................................... 12
6.1. Pre-development Auditing Results (Previous Conditions in the Industries) ............ 13
6.1.1. Water Consumption ........................................................................................... 13
6.1.2. Wastewater Management ................................................................................... 14
6.1.3. Sludge Management........................................................................................... 15
6.2. Post-Development Auditing Results ......................................................................... 18
6.2.1. Water Consumption ........................................................................................... 18
6.2.2. Wastewater Management ................................................................................... 19
6.2.3. Sludge Management........................................................................................... 20
7. Summary of Project Results ............................................................................................. 21
8. References ........................................................................................................................ 23
List of Figures Figure 4-1 Schematic flowchart of the wastewater management system .................................. 7
Figure 4-2 Typical section of a rectangular sedimentation tank showing operating zones ....... 8
Figure 4-3 Cross sectional view of settlement silo .................................................................... 9
Figure 4-4 Top view of settlement silo .................................................................................... 10
Figure 5-1 Water balance ......................................................................................................... 12
Figure 6 Sources of fresh water ............................................................................................... 14
Figure 7 Hydrogeology of audited project sites ....................................................................... 16
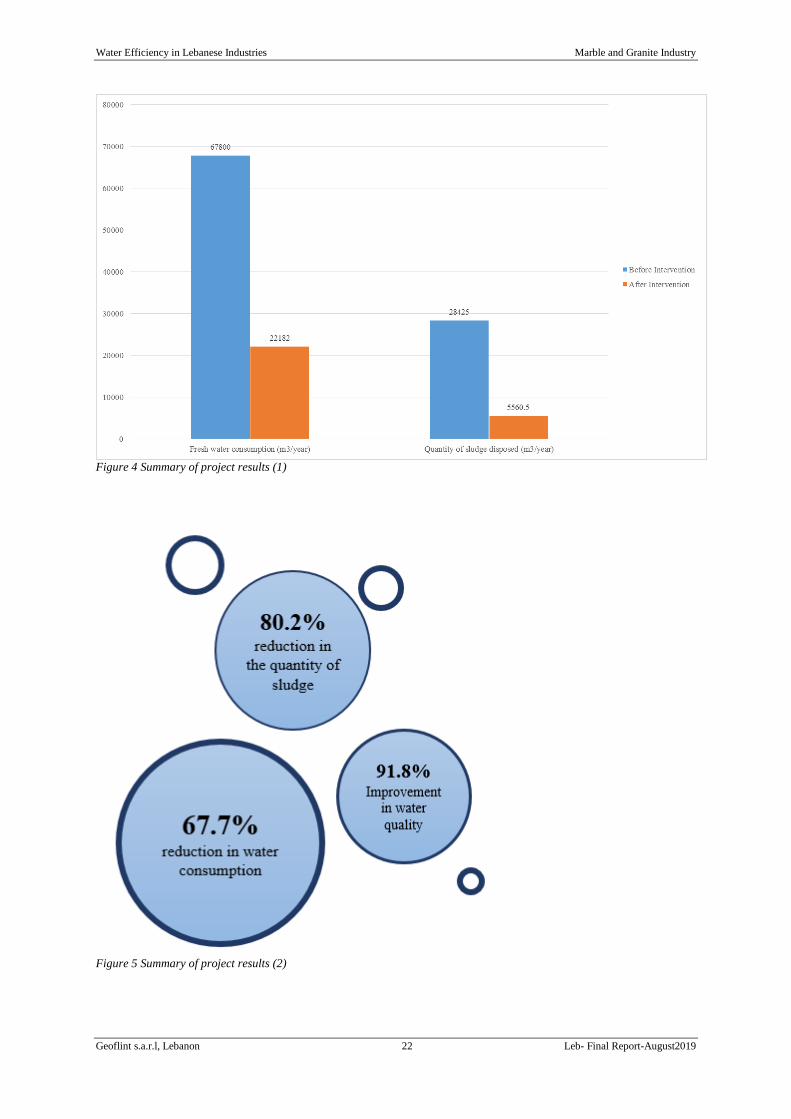
Figure 8 Summary of project results (1) .................................................................................. 22
Figure 9 Summary of project results (2) .................................................................................. 22
List of Tables Table 1 Marble and granite industries enrolled in the program ................................................. 6
Table 2Typical generated wastewater quality............................................................................ 7
Table 3 Water consumption (Pre-development phase) ............................................................ 13
Table 4 Physical characteristics of the reused water in the facilities ....................................... 14
Table 5 Quantity of disposed sludge (pre-development phase) ............................................... 15
Table 6 Percent reduction in water consumption (Post-development phase) .......................... 19
Table 7 Percent improvements in suspended solids level in water .......................................... 20

Water Efficiency in Lebanese Industries Marble and Granite Industry
Geoflint s.a.r.l, Lebanon 2 Leb- Final Report-August 2019
Table 8 Percent reduction in quantities of sludge (post-development phase) ......................... 20
Water Efficiency in Lebanese Industries Marble and Granite Industry
Geoflint s.a.r.l, Lebanon 3 Leb- Final Report-August 2019
Structure of the Report
This Final Report consists of one executive summary report as a main report and nine detailed
water audit reports for each of the nine marble and granite processing facilities. The reports are
organized as follow:
Annex 01 Ibrahim Mallah et Fils S.A.L. (IMF)
Annex 02 Mohammaad Jaafar & Co. "Rocky"
Annex 03 National Marble Company S.A.L.
Annex 04 Onyx for Trade and Industry
Annex 05 Ste. Georges Najem and sons - G.N.S. S.A.R.L.
Annex 06 Usine Nationale Des Blocs Et Carreaux (Boustany, Mallah & Co. S.A.R.L.)
Annex 07 Yazda Company S.A.R.L.
Annex 08 AbdulSatter Marble Group
Annex 09 Art &Decoration
Water Efficiency in Lebanese Industries Marble and Granite Industry
Geoflint s.a.r.l, Lebanon 4 Leb- Final Report-August 2019
1. Introduction
The marble and granite industry is a well-developed sector in Lebanon due to the presence of
valuable natural stones in the country. The size of the marble and granite market in Lebanon is
around $96.61M, where more than 400 industries and 600 traders exist (BlomInvest Bank,
2015). In general, marble and granite industries are known to be large consumers of water. The
equipment used in stone cutting processes require the use of large amounts of water, for
cooling, lubrication, and cleaning. Thus, significant quantities of wastewater are generated.
Achieving sustainability in industries is integral to efficient water management. In recognition
of the scarcity of water and the inevitable increase in the water demand of the industrial sector
in Lebanon, conservation and efficient use of existing water sources is becoming imperative.
In this context, the Association of Lebanese Industrialists (ALI) signed a partnership agreement
with the USAID-funded Lebanon Water Project (LWP), the Water Efficiency in Lebanese
Industries (WELI) Program on "Improving Water Conservation in the Marble and Granite
Industry in Lebanon". The program will provide financial incentives to promote the culture of
water conservation among Marble and Granite industries in Lebanon.
Accordingly, Geoflint s.a.r.l. was hired by ALI to provide marble and granite industries with
technical environmental consultancy services to promote both economically and
environmentally responsible use of water resources. As an initial stage, baseline water audits
were prepared for nine marble and granite industries in order to assess the water consumption
within the facilities and to identify opportunities to improve water use efficiency.
2. Marble and Granite Industry Overview
The processing of marble or granite to produce final marketable products entails cutting raw
dimensional stone into plates of defined shapes and sizes followed by surface polishing.
The production process involves water recirculation aiming to cool down the cutting and
polishing equipment and to control particulate matter emissions. Fine particles (<0.2 mm) are
generated during the cutting and polishing processes, where around 25-40% of the weight of
the block is produced as fine particles during the cutting process. Thus, large amount of water
is used to capture the produced particles, resulting in the generation of a high-in-solids effluent
(Taşdemir, Kurama, 2013).
The marble and granite industry mainly faces two major challenges related to water
management. First, the cutting and polishing processes involve large quantities of water, most
of which are reused. The majority of marble and granite processing industries utilize basic
physical treatment of the generated water (i.e. simple solid–liquid separation, settlement
basins). However, due to the high demand of water for the industrial and low retention time in
the treatment system, improper application of coagulants, improper management
practices...etc., the efficiency of the wastewater treatment system is generally low. The main
concerns related to the wastewater are related to the high levels of total solids and the high
turbidity of the water. If the turbidity of the reused water is higher than acceptable values, the
stone powders in the water may cause polishing problems during the processing of natural stone
and may lead to clogging of pipes. Consequently, the maximum turbidity of the clean water
should be less than 15 Nephelometric Turbidity Units (NTU) (Ersoy, Tosun, et al., 2009).
Water Efficiency in Lebanese Industries Marble and Granite Industry
Geoflint s.a.r.l, Lebanon 5 Leb- Final Report-August 2019
Moreover, from an environmental perspective, the generated wastewater, if not efficiently
treated, would negatively affect the physical, biological and chemical characteristics of both
the local water and soil quality, resulting in inevitable implications on both the environment
and the public health.
Second, which is a major challenge in stone cutting industries, is the high generation rates of
sludge. The generated sludge has high water content, making the handling process more
complicated. Studies indicate that 96% of slurry generating from the stone cutting process is
water while the solid particles represent only 4%. In general, industries discharge the generated
sludge in open basins for a certain period, until it is dry, and is later disposed in landfills or
open dumps. However, the current sludge management practices are causing impacts on land
use/ land cover, water resources, air quality and visual amenity of the sites. From an economic
perspective, the management of this waste poses a high operation cost on this industry, due to
the increase in costs of waste storage, transport, and disposal.
According to U.S. Environmental Protection Agency (EPA), 25 to 50% of water in marble and
granite industries can be saved by the careful attention to good water conservation practices
and minor modification of equipment. In this context, the WELI Program on "Improving Water
Conservation in the Marble and Granite Industry in Lebanon" aims to promote water
conservation measures in a selected number of industries. The proposed project outcomes
might serve as a success story to other industries in the sector and to other sectors.
3. Project Overview
The Water Efficiency in Lebanese Industries (WELI) Program on "Improving Water
Conservation in the Marble and Granite Industry in Lebanon" has the following objectives:
Promote water conservation at the industrial production chain level, by implementing
water saving measures along with related capital investments in advanced water
efficiency improvement technologies
Encourage small-scale innovative and low-cost infrastructure projects in industrial
wastewater treatment and reuse
Foster capacity building to further entice industries in water conservation and integrate
Corporate Social Responsibility actions towards cleaner production measures
After marble and granite industries applied for the WELI incentive rebate program and
submitted their proposals, baseline water audit were conducted to assess baseline conditions
related to water management in the facility. Afterwards, proposals were submitted by industries
to be evaluated and a post-installation water audit will be conducted. Accordingly, incentive
rebates will be provided to industries that have adopted technologies and practices to improve
water use efficiency.
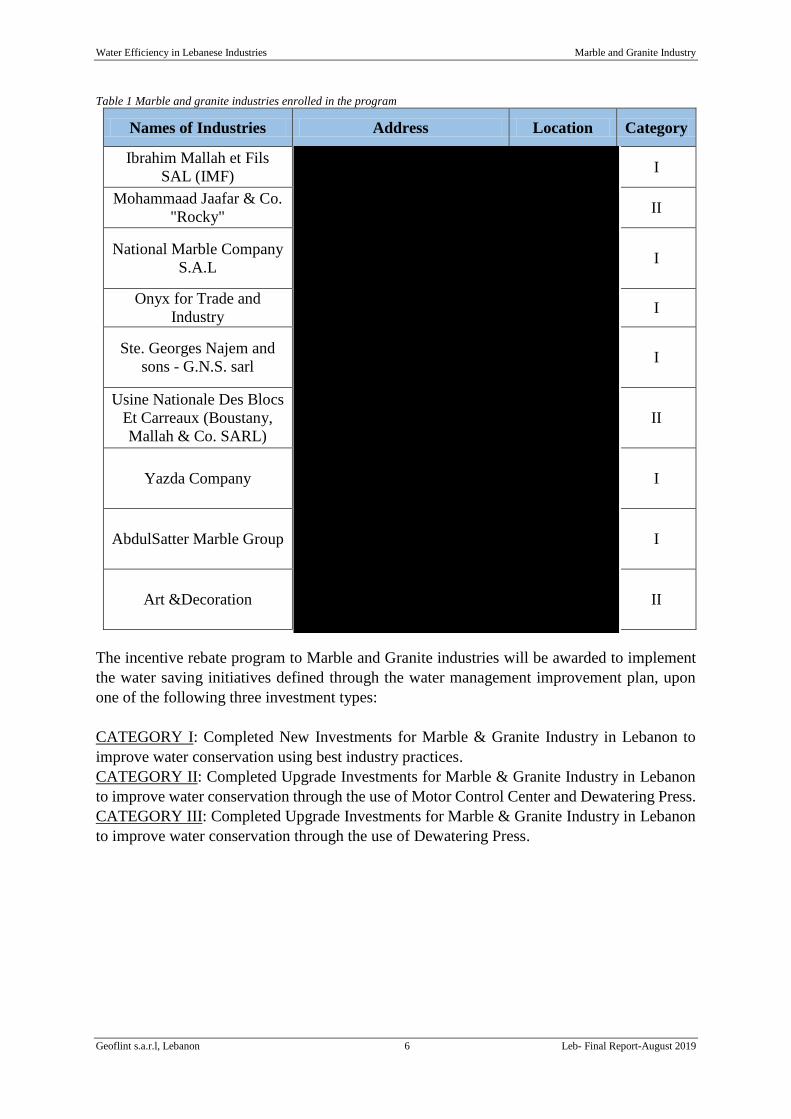
The marble and granite processing industries enrolled in the program are listed in the table
below:
Water Efficiency in Lebanese Industries Marble and Granite Industry
Geoflint s.a.r.l, Lebanon 6 Leb- Final Report-August 2019
Table 1 Marble and granite industries enrolled in the program
Names of Industries Address Location Category
Ibrahim Mallah et Fils
SAL (IMF) I
Mohammaad Jaafar & Co.
"Rocky" II
National Marble Company
S.A.L I
Onyx for Trade and
Industry I
Ste. Georges Najem and
sons - G.N.S. sarl I
Usine Nationale Des Blocs
Et Carreaux (Boustany,
Mallah & Co. SARL)
II
Yazda Company I
AbdulSatter Marble Group I
Art &Decoration II
The incentive rebate program to Marble and Granite industries will be awarded to implement
the water saving initiatives defined through the water management improvement plan, upon
one of the following three investment types:
CATEGORY I: Completed New Investments for Marble & Granite Industry in Lebanon to
improve water conservation using best industry practices.
CATEGORY II: Completed Upgrade Investments for Marble & Granite Industry in Lebanon
to improve water conservation through the use of Motor Control Center and Dewatering Press.
CATEGORY III: Completed Upgrade Investments for Marble & Granite Industry in Lebanon
to improve water conservation through the use of Dewatering Press.
Water Efficiency in Lebanese Industries Marble and Granite Industry
Geoflint s.a.r.l, Lebanon 7 Leb- Final Report-August 2019
4. Description of the Proposed Improvements in Wastewater
Management Systems
The main environmental concerns related to the generated wastewater from plants are the high
levels of solid and the turbidity of the water. The typical quality of the wastewater generated
from a stone cutting industry is presented in the table below.
Table 2Typical generated wastewater quality
Parameters Value
pH 7.2
Temperature (oC) 20
Turbidity (NTU) 390
Electrical Conductivity (μs/Cm) 12500
Total Solids (mg/L) 9600
Total Suspended Solids (mg/L) 2100
Total Dissolved Solids (mg/L) 7500 Source: Fahiminia, Ardani, et.al. 2013
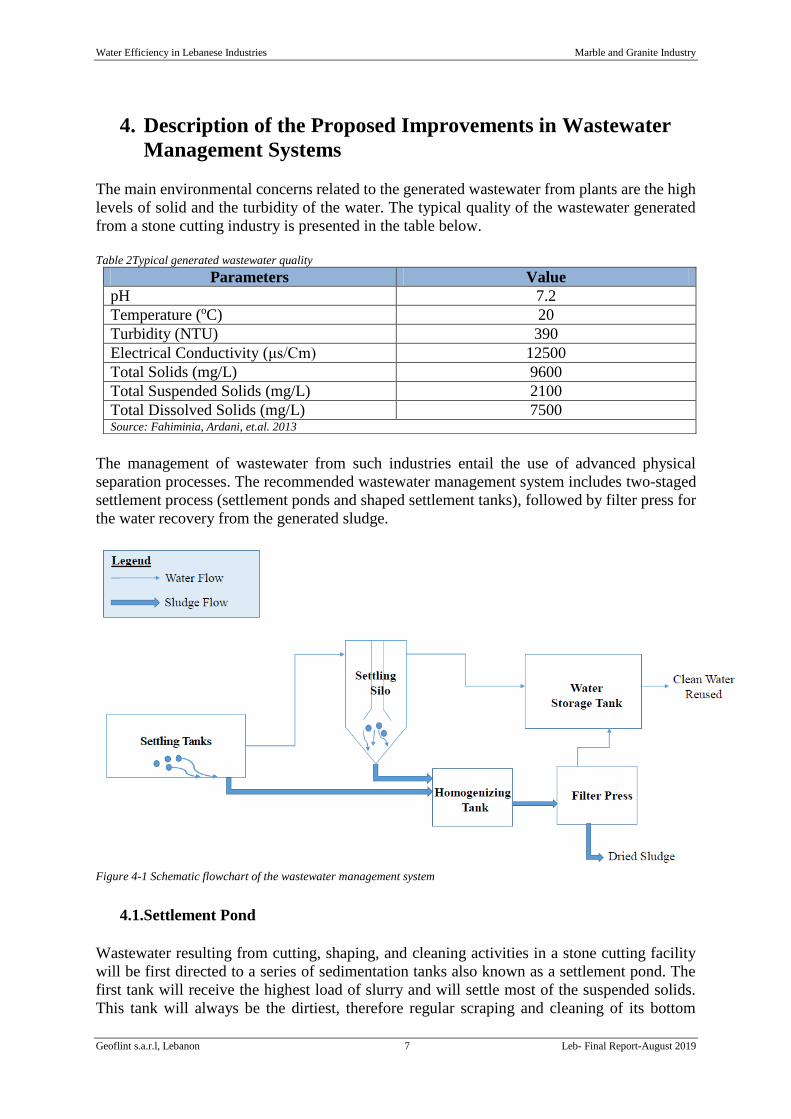
The management of wastewater from such industries entail the use of advanced physical
separation processes. The recommended wastewater management system includes two-staged
settlement process (settlement ponds and shaped settlement tanks), followed by filter press for
the water recovery from the generated sludge.
Figure 4-1 Schematic flowchart of the wastewater management system
4.1.Settlement Pond
Wastewater resulting from cutting, shaping, and cleaning activities in a stone cutting facility
will be first directed to a series of sedimentation tanks also known as a settlement pond. The
first tank will receive the highest load of slurry and will settle most of the suspended solids.
This tank will always be the dirtiest, therefore regular scraping and cleaning of its bottom
Water Efficiency in Lebanese Industries Marble and Granite Industry
Geoflint s.a.r.l, Lebanon 8 Leb- Final Report-August 2019
should occur. The layout typically includes between 2 and 4 sedimentations tanks, where the
last one will have the cleanest water and requires the least sludge removal activity. The overall
purpose of the sedimentation system is to allow for the slurry to settle out and receive clean
water at the effluent to be either directly reused in the facility or pumped to a settling silo shown
in Figure 4-1for further treatment (as will be the case in the audited stone cutting facilities).
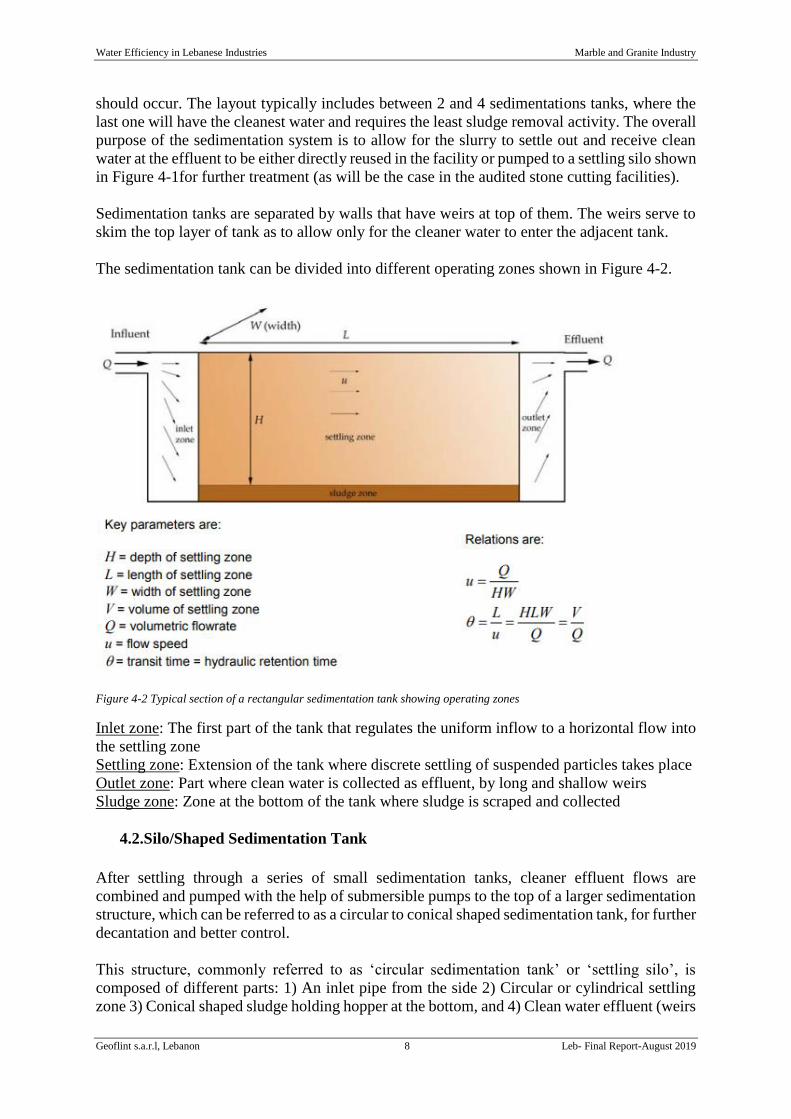
Sedimentation tanks are separated by walls that have weirs at top of them. The weirs serve to
skim the top layer of tank as to allow only for the cleaner water to enter the adjacent tank.
The sedimentation tank can be divided into different operating zones shown in Figure 4-2.
Figure 4-2 Typical section of a rectangular sedimentation tank showing operating zones
Inlet zone: The first part of the tank that regulates the uniform inflow to a horizontal flow into
the settling zone
Settling zone: Extension of the tank where discrete settling of suspended particles takes place
Outlet zone: Part where clean water is collected as effluent, by long and shallow weirs
Sludge zone: Zone at the bottom of the tank where sludge is scraped and collected
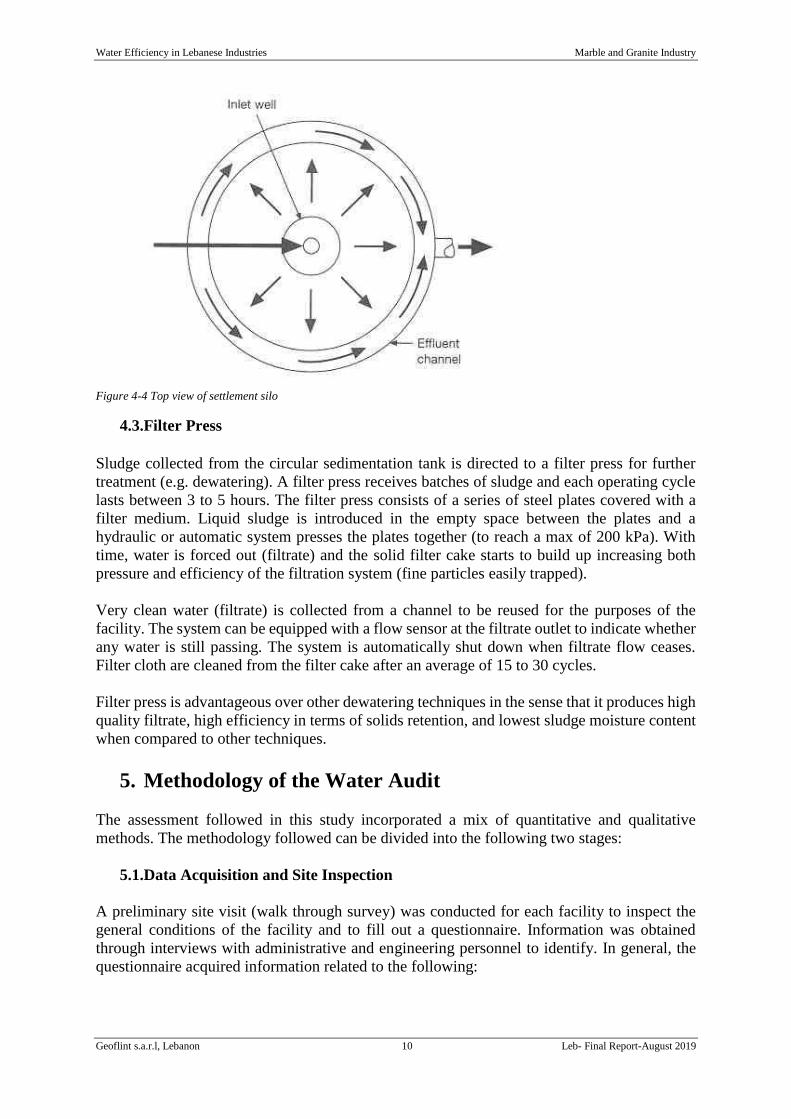
4.2.Silo/Shaped Sedimentation Tank
After settling through a series of small sedimentation tanks, cleaner effluent flows are
combined and pumped with the help of submersible pumps to the top of a larger sedimentation
structure, which can be referred to as a circular to conical shaped sedimentation tank, for further
decantation and better control.
This structure, commonly referred to as ‘circular sedimentation tank’ or ‘settling silo’, is
composed of different parts: 1) An inlet pipe from the side 2) Circular or cylindrical settling
zone 3) Conical shaped sludge holding hopper at the bottom, and 4) Clean water effluent (weirs
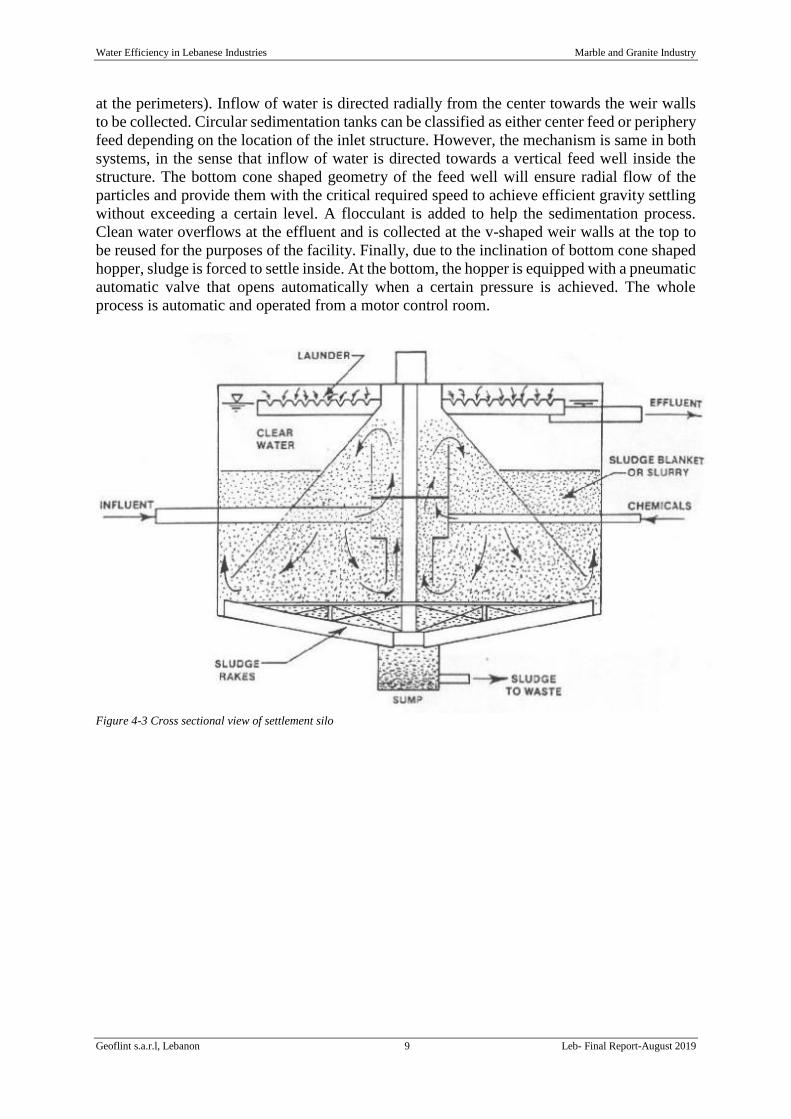
Water Efficiency in Lebanese Industries Marble and Granite Industry
Geoflint s.a.r.l, Lebanon 9 Leb- Final Report-August 2019
at the perimeters). Inflow of water is directed radially from the center towards the weir walls
to be collected. Circular sedimentation tanks can be classified as either center feed or periphery
feed depending on the location of the inlet structure. However, the mechanism is same in both
systems, in the sense that inflow of water is directed towards a vertical feed well inside the
structure. The bottom cone shaped geometry of the feed well will ensure radial flow of the
particles and provide them with the critical required speed to achieve efficient gravity settling
without exceeding a certain level. A flocculant is added to help the sedimentation process.
Clean water overflows at the effluent and is collected at the v-shaped weir walls at the top to
be reused for the purposes of the facility. Finally, due to the inclination of bottom cone shaped
hopper, sludge is forced to settle inside. At the bottom, the hopper is equipped with a pneumatic
automatic valve that opens automatically when a certain pressure is achieved. The whole
process is automatic and operated from a motor control room.
Figure 4-3 Cross sectional view of settlement silo
Water Efficiency in Lebanese Industries Marble and Granite Industry
Geoflint s.a.r.l, Lebanon 10 Leb- Final Report-August 2019
Figure 4-4 Top view of settlement silo
4.3.Filter Press
Sludge collected from the circular sedimentation tank is directed to a filter press for further
treatment (e.g. dewatering). A filter press receives batches of sludge and each operating cycle
lasts between 3 to 5 hours. The filter press consists of a series of steel plates covered with a
filter medium. Liquid sludge is introduced in the empty space between the plates and a
hydraulic or automatic system presses the plates together (to reach a max of 200 kPa). With
time, water is forced out (filtrate) and the solid filter cake starts to build up increasing both
pressure and efficiency of the filtration system (fine particles easily trapped).
Very clean water (filtrate) is collected from a channel to be reused for the purposes of the
facility. The system can be equipped with a flow sensor at the filtrate outlet to indicate whether
any water is still passing. The system is automatically shut down when filtrate flow ceases.
Filter cloth are cleaned from the filter cake after an average of 15 to 30 cycles.
Filter press is advantageous over other dewatering techniques in the sense that it produces high
quality filtrate, high efficiency in terms of solids retention, and lowest sludge moisture content
when compared to other techniques.
5. Methodology of the Water Audit
The assessment followed in this study incorporated a mix of quantitative and qualitative
methods. The methodology followed can be divided into the following two stages:
5.1.Data Acquisition and Site Inspection
A preliminary site visit (walk through survey) was conducted for each facility to inspect the
general conditions of the facility and to fill out a questionnaire. Information was obtained
through interviews with administrative and engineering personnel to identify. In general, the
questionnaire acquired information related to the following:
Water Efficiency in Lebanese Industries Marble and Granite Industry
Geoflint s.a.r.l, Lebanon 11 Leb- Final Report-August 2019
General operational practices:
Operating capacity
Operating hours per day
Operating days per week
Number of employees and residence of employees
Number of machines installed/ diameter of pipe installed on each machine
Area of facility/working areas
Water and wastewater management practices:
Source of fresh water
Uses of fresh water
Estimated water consumption (m3/day)
Presence/absence of water metering
Presence/absence of a connection to the sewerage system
Presence/absence of an on-site collection system for generated industrial wastewater
Presence/absence of a rainwater harvesting system
Description of the existing wastewater management system, if present
Frequency of sludge/slurry cleaning
Estimated water use for sludge/slurry cleaning
Presence/absence of incidents of pipes clogging and frequency of such incidents, if
present
Description of sludge management practices
Wastewater outlets from the audited facilities
Estimated water losses (Unaccounted for Water)
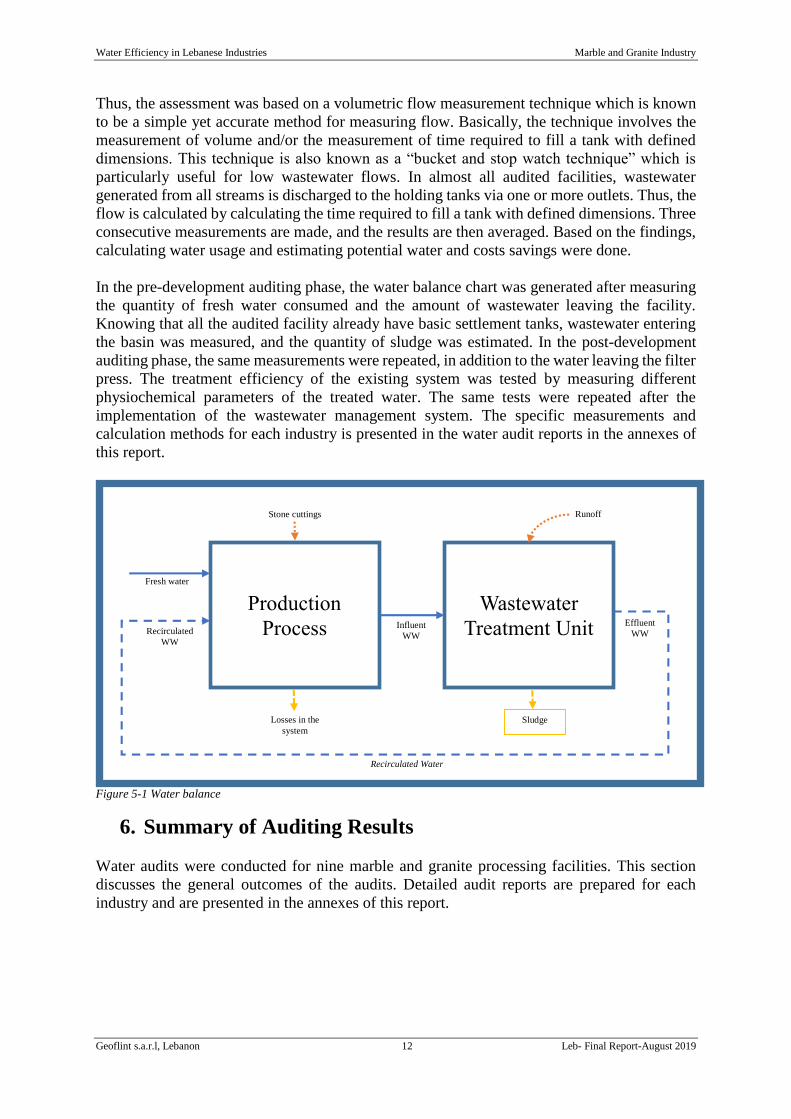
5.2.Water Mass Balance Analysis
For the technical evaluation of the existing wastewater management practices and the proposed
improvements, accurate flow measurement should be conducted. The analysis of water mass
balance in each facility is essential for the proper sizing of the proposed system and for its
proper efficiency.
Flow may be measured on an instantaneous or a continuous basis. The typical continuous
system consists of primary flow devices with sensors, recorder, and other components.
Whereas, the instantaneous flow measurements can be conducted by using a flow device. The
water audits in the marble and granite industries showed a little particularity due to the very
complex conditions in the facilities. The major difficulty in conducting continuous flow
measurements was because some industries relied on multiple sources of fresh water. For
example, one industry relied on nearby water streams with a variable seasonal flow, while other
relied on harvested rainwater…etc. Moreover, there is a huge variability in the operations as
marble and granite processing industries highly depend on market demands. Thus, water
consumption and wastewater generation rates are variable. Finally, in such industries, it is
difficult to quantify wastewater generation rates as wastewater includes contaminated storm
water runoff, cooling wastewater and in some cases dust suppression wastewater which are
challenging to quantitatively estimate.
Water Efficiency in Lebanese Industries Marble and Granite Industry
Geoflint s.a.r.l, Lebanon 12 Leb- Final Report-August 2019
Thus, the assessment was based on a volumetric flow measurement technique which is known
to be a simple yet accurate method for measuring flow. Basically, the technique involves the
measurement of volume and/or the measurement of time required to fill a tank with defined
dimensions. This technique is also known as a “bucket and stop watch technique” which is
particularly useful for low wastewater flows. In almost all audited facilities, wastewater
generated from all streams is discharged to the holding tanks via one or more outlets. Thus, the
flow is calculated by calculating the time required to fill a tank with defined dimensions. Three
consecutive measurements are made, and the results are then averaged. Based on the findings,
calculating water usage and estimating potential water and costs savings were done.
In the pre-development auditing phase, the water balance chart was generated after measuring
the quantity of fresh water consumed and the amount of wastewater leaving the facility.
Knowing that all the audited facility already have basic settlement tanks, wastewater entering
the basin was measured, and the quantity of sludge was estimated. In the post-development
auditing phase, the same measurements were repeated, in addition to the water leaving the filter
press. The treatment efficiency of the existing system was tested by measuring different
physiochemical parameters of the treated water. The same tests were repeated after the
implementation of the wastewater management system. The specific measurements and
calculation methods for each industry is presented in the water audit reports in the annexes of
this report.
Figure 5-1 Water balance
6. Summary of Auditing Results
Water audits were conducted for nine marble and granite processing facilities. This section
discusses the general outcomes of the audits. Detailed audit reports are prepared for each
industry and are presented in the annexes of this report.
Production
Process
Wastewater
Treatment Unit
Fresh water
Influent
WW
Losses in the
system
Sludge
Effluent
WW Recirculated
WW
Stone cuttings
Recirculated Water
Runoff
Water Efficiency in Lebanese Industries Marble and Granite Industry
Geoflint s.a.r.l, Lebanon 13 Leb- Final Report-August 2019
6.1.Pre-development Auditing Results (Previous Conditions in the Industries)
This section presents the results of the first auditing round conducted for the nine industries,
prior the project intervention and the installation of the wastewater treatment system (referred
to as pre-development phase).
6.1.1. Water Consumption
The marble and granite industries involve large quantities of water, most of which are reused.
The majority of marble and granite processing industries utilize basic physical treatment of the
generated water (i.e. simple solid–liquid separation, settlement basins). However, due to the
high demand of water for the industrial and low retention time in the treatment system,
improper application of coagulants, improper management practices...etc., the efficiency of the
wastewater treatment system is generally low. Therefore, fresh water is needed to make up for
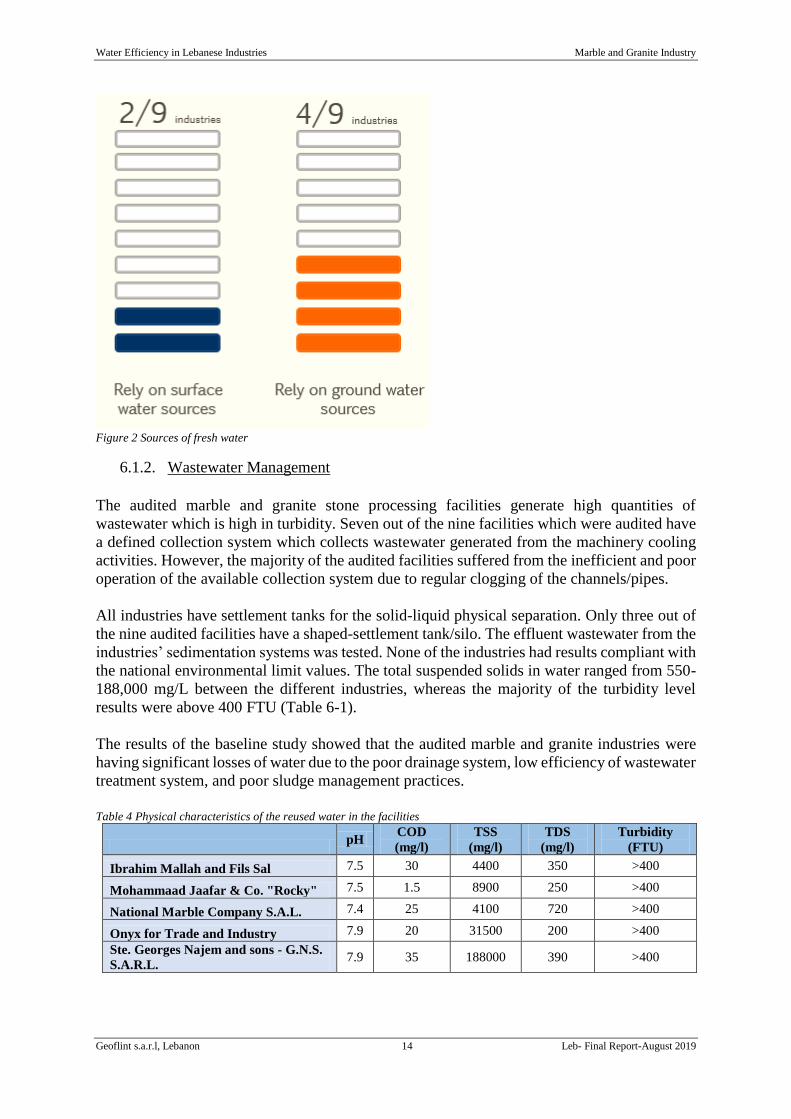
all losses. The nine audited industries used to consume around 67800 m3/year. Six out of the
nine industries rely on surface and ground water resources to replenish water losses in their
system.
Table 3 Water consumption (Pre-development phase)
Daily Fresh Water consumption
(m3/day)
Annual Fresh Water
consumption (m3/year)
Ibrahim Mallah et Fils SAL 16 4800
Mohammaad Jaafar & Co.
“Rocky” 10 3000
National Marble Company S.A.L. 72 21600
Onyx for Trade and Industry 15 4500
Ste. Georges Najem and sons -
G.N.S. sarl. 16.5 4950
Usine Nationale Des Blocs Et
Carreaux (Boustany, Mallah &
Co. S.A.R.L.) 64 19200
Yazda 4.5 1200
Abdessater Marble Group SARL
(AMG) 2 600
Art & Decoration 26 3000
TOTAL 226 67800
Water Efficiency in Lebanese Industries Marble and Granite Industry
Geoflint s.a.r.l, Lebanon 14 Leb- Final Report-August 2019
Figure 2 Sources of fresh water
6.1.2. Wastewater Management
The audited marble and granite stone processing facilities generate high quantities of
wastewater which is high in turbidity. Seven out of the nine facilities which were audited have
a defined collection system which collects wastewater generated from the machinery cooling
activities. However, the majority of the audited facilities suffered from the inefficient and poor
operation of the available collection system due to regular clogging of the channels/pipes.
All industries have settlement tanks for the solid-liquid physical separation. Only three out of
the nine audited facilities have a shaped-settlement tank/silo. The effluent wastewater from the
industries’ sedimentation systems was tested. None of the industries had results compliant with
the national environmental limit values. The total suspended solids in water ranged from 550-
188,000 mg/L between the different industries, whereas the majority of the turbidity level
results were above 400 FTU (Table 6-1).
The results of the baseline study showed that the audited marble and granite industries were
having significant losses of water due to the poor drainage system, low efficiency of wastewater
treatment system, and poor sludge management practices.
Table 4 Physical characteristics of the reused water in the facilities
pH
COD
(mg/l)
TSS
(mg/l)
TDS
(mg/l)
Turbidity
(FTU)
Ibrahim Mallah and Fils Sal 7.5 30 4400 350 >400
Mohammaad Jaafar & Co. "Rocky" 7.5 1.5 8900 250 >400
National Marble Company S.A.L. 7.4 25 4100 720 >400
Onyx for Trade and Industry 7.9 20 31500 200 >400
Ste. Georges Najem and sons - G.N.S.
S.A.R.L. 7.9 35 188000 390 >400
Water Efficiency in Lebanese Industries Marble and Granite Industry
Geoflint s.a.r.l, Lebanon 15 Leb- Final Report-August 2019
Usine Nationale Des Blocs Et
Carreaux (Boustany, Mallah & Co.
S.A.R.L.)
7.6 20 1000 480 80
Yazda Company s.a.r.l. 7.7 25 550 270 70
AbdulSatter Marble Group 7.2 240 2140 900 >400
Art &Decoration 6.6 740 44000 480 >400
ELVs (Discharge in sewerage
network) 6-9 500 600 - -
It was found that in industries where wastewater treatment was highly inefficient, fugitive dust
emissions were present. The effluent water is recirculated and reused in the production process.
Water rich in suspended solids is a probable factor leading to the generation of fugitive dusts.
Moreover, the inefficiently treated water was leading to the clogging of the collection system
in the industries. Nevertheless, industries which were recirculating the inefficiently treated
water were facing challenges due to the buildup of slurry around the production area and thus
causing losses in the recovery rate of wastewater and hence leading to occupational health and
safety hazards (i.e. slipping floor…).
6.1.3. Sludge Management
All audited facilities used to manage sludge inefficiently. All industries previously held sludge
in outdoor storage areas for drying, except for one industry which used to discharge it directly
into the sewerage network.
Table 5 Quantity of disposed sludge (pre-development phase)
Quantity of sludge disposed
(m3/day)
Quantity of sludge disposed
(m3/year)
Ibrahim Mallah et Fils SAL 6.45 1935
Mohammaad Jaafar & Co.
“Rocky” 4.5 1350
National Marble Company S.A.L. 34.5 10350
Onyx for Trade and Industry 6 1800
Ste. Georges Najem and sons -
G.N.S. sarl. 13 3900
Usine Nationale Des Blocs Et
Carreaux (Boustany, Mallah &
Co. S.A.R.L.)
15 4500
Yazda 2 600
Abdessater Marble Group SARL
(AMG) 0.3 90
Art & Decoration 13 3900
TOTAL 94.75 28425
The sludge is getting exposed to changing weather conditions (i.e. wind, rainfall), and
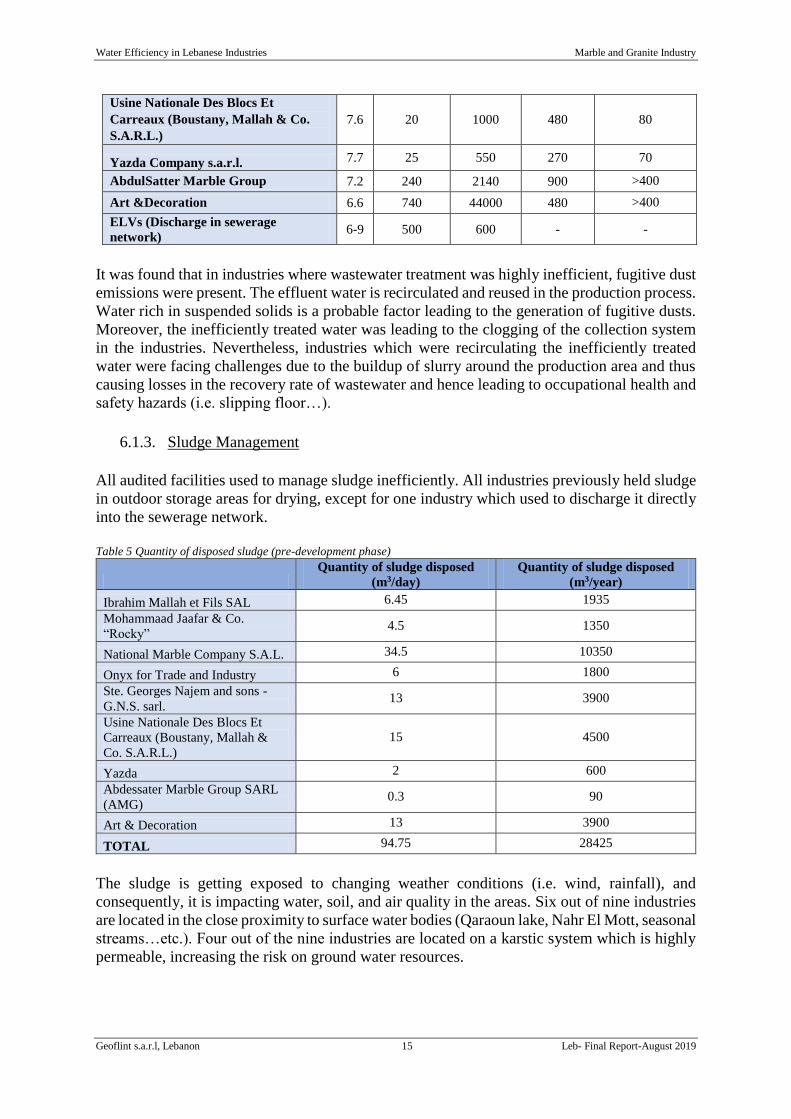
consequently, it is impacting water, soil, and air quality in the areas. Six out of nine industries
are located in the close proximity to surface water bodies (Qaraoun lake, Nahr El Mott, seasonal
streams…etc.). Four out of the nine industries are located on a karstic system which is highly
permeable, increasing the risk on ground water resources.
Water Efficiency in Lebanese Industries Marble and Granite Industry
Geoflint s.a.r.l, Lebanon 16 Leb- Final Report-August 2019
Figure 3 Hydrogeology of audited project sites
Furthermore, the inefficient water and wastewater management is resulting in economic losses
namely losses due to:
Fresh water costs (water tankers…)
Machinery and equipment maintenance (changing of blades…) where the stone
powders in the water may cause polishing problems during the processing of natural
stone and may lead to clogging of pipes.
Management of sludge piles, where generated sludge is occupying space, and is
incurring on the facility operational costs (machineries operation such as bobcats…)
Labor costs and time spent on the management of poorly operating wastewater
treatment system.
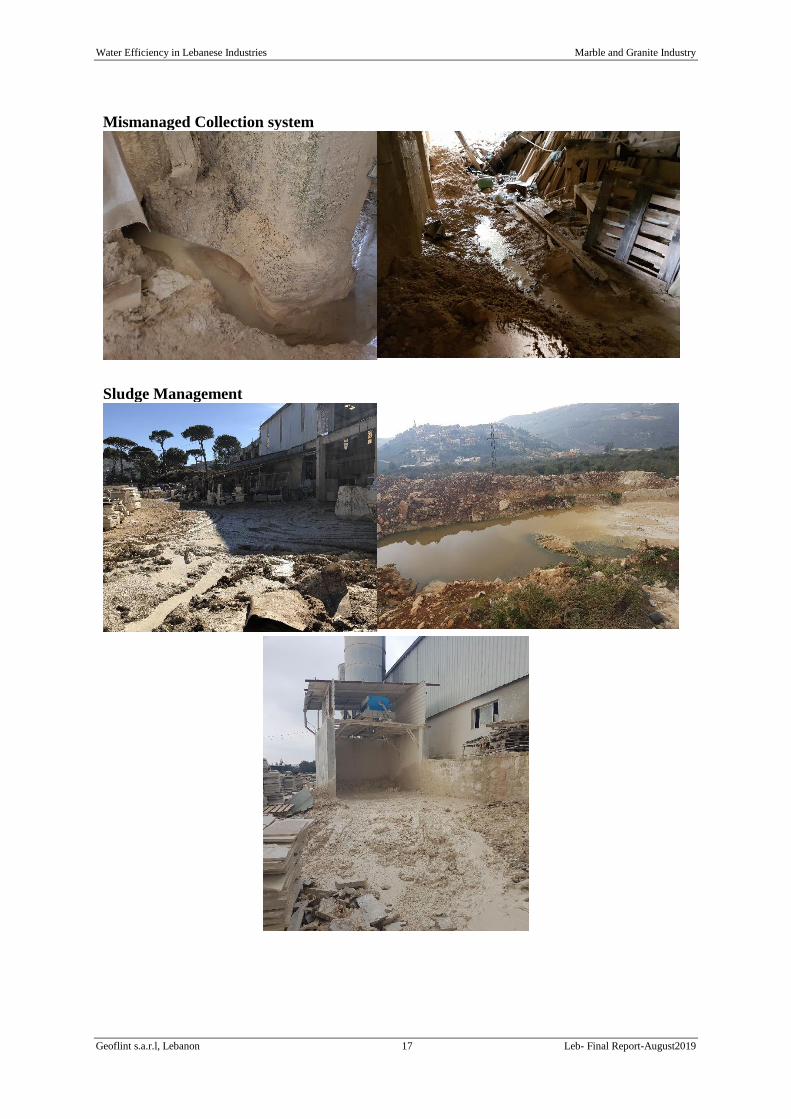
The figures below show some of the main problems faced by the audited facilities, namely,
problems with the collection system, sludge management, indoor air quality and storm water
runoff.
Water Efficiency in Lebanese Industries Marble and Granite Industry
Geoflint s.a.r.l, Lebanon 17 Leb- Final Report-August2019
Mismanaged Collection system
Sludge Management
Water Efficiency in Lebanese Industries Marble and Granite Industry
Geoflint s.a.r.l, Lebanon 18 Leb- Final Report-August2019
Fugitive Emissions
Stormwater Runoff
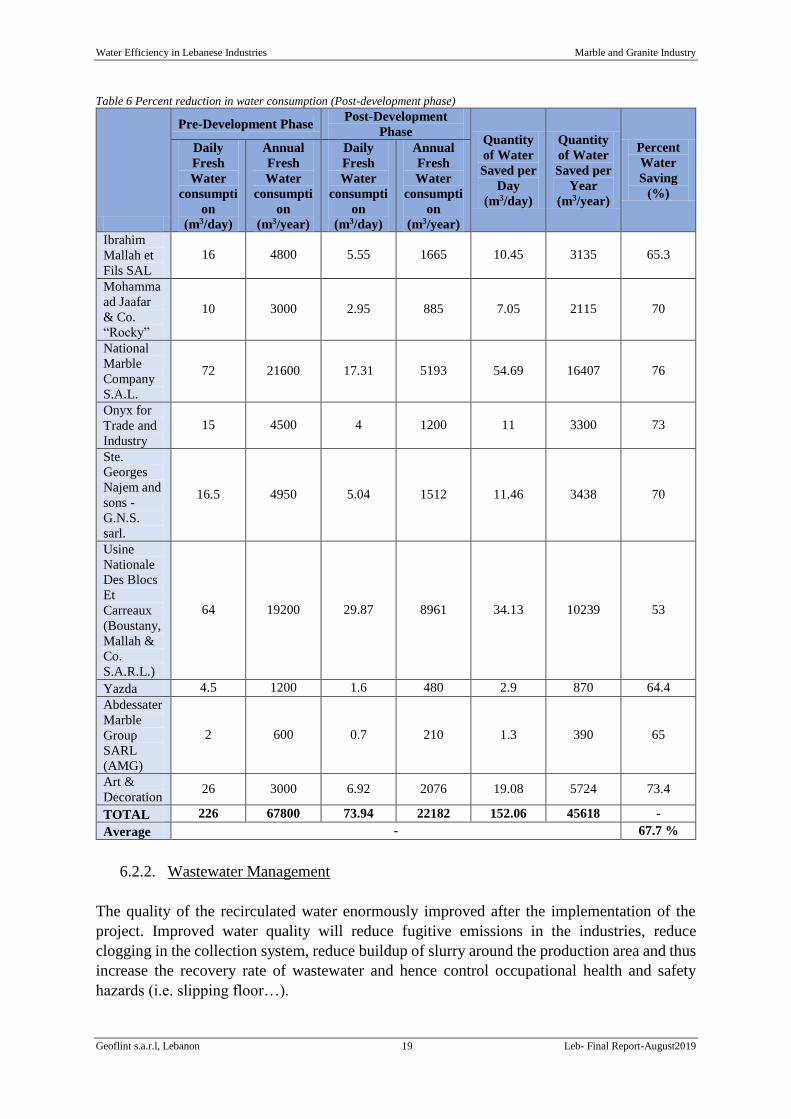
6.2.Post-Development Auditing Results
Post development audits were conducted to compare the impacts of the project intervention on
water consumption. Post-development audits have an important role in improving the future
performance and utility of the project. Moreover, this process of comparing predictions versus
actual or reflective assessment is of great importance to sustainability of projects (Sadler,
1988). For this purpose a post-water audit was performed for each of the nine industries in an
effort to conduct water consumption analysis and assess savings in water consumption.
6.2.1. Water Consumption
After the installation of the wastewater management system, high water savings were achieved
in the audited facilities, as shown in the table below.
Water Efficiency in Lebanese Industries Marble and Granite Industry
Geoflint s.a.r.l, Lebanon 19 Leb- Final Report-August2019
Table 6 Percent reduction in water consumption (Post-development phase)
Pre-Development Phase Post-Development
Phase Quantity
of Water
Saved per
Day
(m3/day)
Quantity
of Water
Saved per
Year
(m3/year)
Percent
Water
Saving
(%)
Daily
Fresh
Water
consumpti
on
(m3/day)
Annual
Fresh
Water
consumpti
on
(m3/year)
Daily
Fresh
Water
consumpti
on
(m3/day)
Annual
Fresh
Water
consumpti
on
(m3/year)
Ibrahim
Mallah et
Fils SAL
16 4800 5.55 1665 10.45 3135 65.3
Mohamma
ad Jaafar
& Co.
“Rocky”
10 3000 2.95 885 7.05 2115 70
National
Marble
Company
S.A.L.
72 21600 17.31 5193 54.69 16407 76
Onyx for
Trade and
Industry
15 4500 4 1200 11 3300 73
Ste.
Georges
Najem and
sons -
G.N.S.
sarl.
16.5 4950 5.04 1512 11.46 3438 70
Usine
Nationale
Des Blocs
Et
Carreaux
(Boustany,
Mallah &
Co.
S.A.R.L.)
64 19200 29.87 8961 34.13 10239 53
Yazda 4.5 1200 1.6 480 2.9 870 64.4
Abdessater
Marble
Group
SARL
(AMG)
2 600 0.7 210 1.3 390 65
Art &
Decoration 26 3000 6.92 2076 19.08 5724 73.4
TOTAL 226 67800 73.94 22182 152.06 45618 -
Average - 67.7 %
6.2.2. Wastewater Management
The quality of the recirculated water enormously improved after the implementation of the
project. Improved water quality will reduce fugitive emissions in the industries, reduce
clogging in the collection system, reduce buildup of slurry around the production area and thus
increase the recovery rate of wastewater and hence control occupational health and safety
hazards (i.e. slipping floor…).
Water Efficiency in Lebanese Industries Marble and Granite Industry
Geoflint s.a.r.l, Lebanon 20 Leb- Final Report-August2019
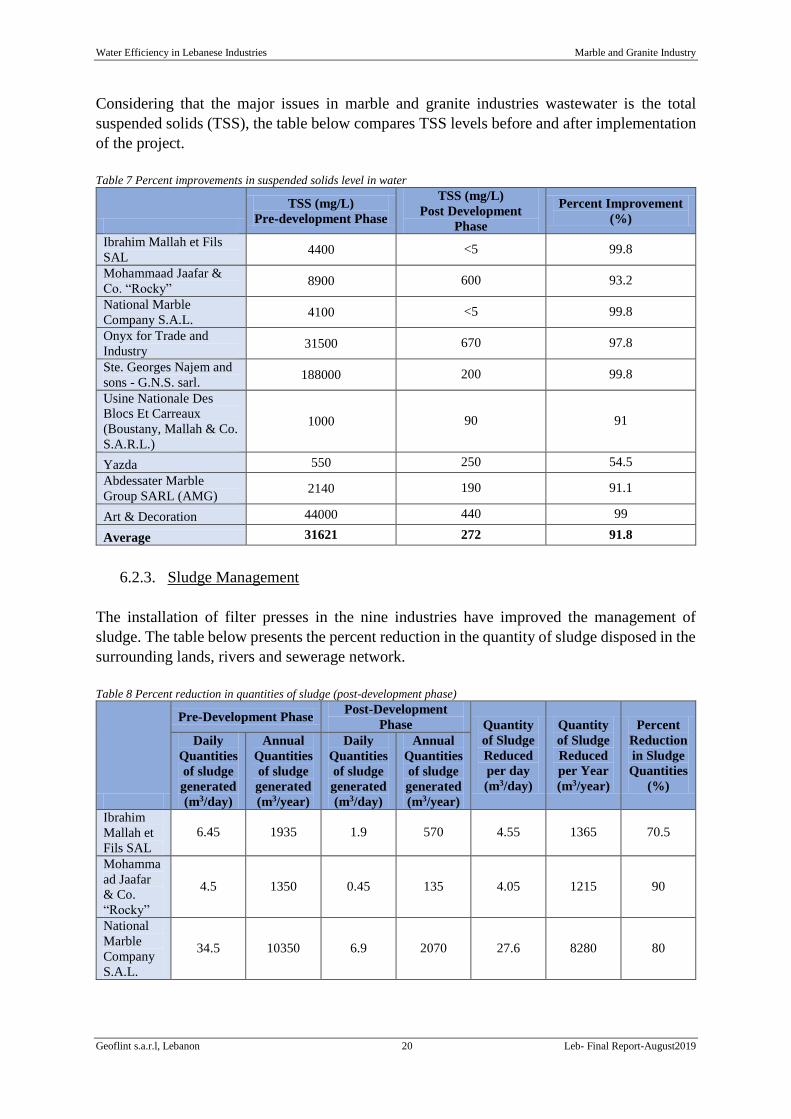
Considering that the major issues in marble and granite industries wastewater is the total
suspended solids (TSS), the table below compares TSS levels before and after implementation
of the project.
Table 7 Percent improvements in suspended solids level in water
TSS (mg/L)
Pre-development Phase
TSS (mg/L)
Post Development
Phase
Percent Improvement
(%)
Ibrahim Mallah et Fils
SAL 4400 <5 99.8
Mohammaad Jaafar &
Co. “Rocky” 8900 600 93.2
National Marble
Company S.A.L. 4100 <5 99.8
Onyx for Trade and
Industry 31500 670 97.8
Ste. Georges Najem and
sons - G.N.S. sarl. 188000 200 99.8
Usine Nationale Des
Blocs Et Carreaux
(Boustany, Mallah & Co.
S.A.R.L.)
1000 90 91
Yazda 550 250 54.5
Abdessater Marble
Group SARL (AMG) 2140 190 91.1
Art & Decoration 44000 440 99
Average 31621 272 91.8
6.2.3. Sludge Management
The installation of filter presses in the nine industries have improved the management of
sludge. The table below presents the percent reduction in the quantity of sludge disposed in the
surrounding lands, rivers and sewerage network.
Table 8 Percent reduction in quantities of sludge (post-development phase)
Pre-Development Phase Post-Development
Phase Quantity
of Sludge
Reduced
per day
(m3/day)
Quantity
of Sludge
Reduced
per Year
(m3/year)
Percent
Reduction
in Sludge
Quantities
(%)
Daily
Quantities
of sludge
generated
(m3/day)
Annual
Quantities
of sludge
generated
(m3/year)
Daily
Quantities
of sludge
generated
(m3/day)
Annual
Quantities
of sludge
generated
(m3/year)
Ibrahim
Mallah et
Fils SAL
6.45 1935 1.9 570 4.55 1365 70.5
Mohamma
ad Jaafar
& Co.
“Rocky”
4.5 1350 0.45 135 4.05 1215 90
National
Marble
Company
S.A.L.
34.5 10350 6.9 2070 27.6 8280 80
Water Efficiency in Lebanese Industries Marble and Granite Industry
Geoflint s.a.r.l, Lebanon 21 Leb- Final Report-August2019
Onyx for
Trade and
Industry
6 1800 0.53 159 5.47 1641 91.1
Ste.
Georges
Najem and
sons -
G.N.S.
sarl.
13 3900 4 1200 9 2700 69.2
Usine
Nationale
Des Blocs
Et
Carreaux
(Boustany,
Mallah &
Co.
S.A.R.L.)
15 4500 2.88 864 12.12 3636 80.8
Yazda 2 600 0.8 240 1.2 360 60
Abdessater
Marble
Group
SARL
(AMG)
0.3 90 0.035 10.5 0.265 79.5 88.3
Art &
Decoration 13 3900 1.04 312 11.96 3588 92
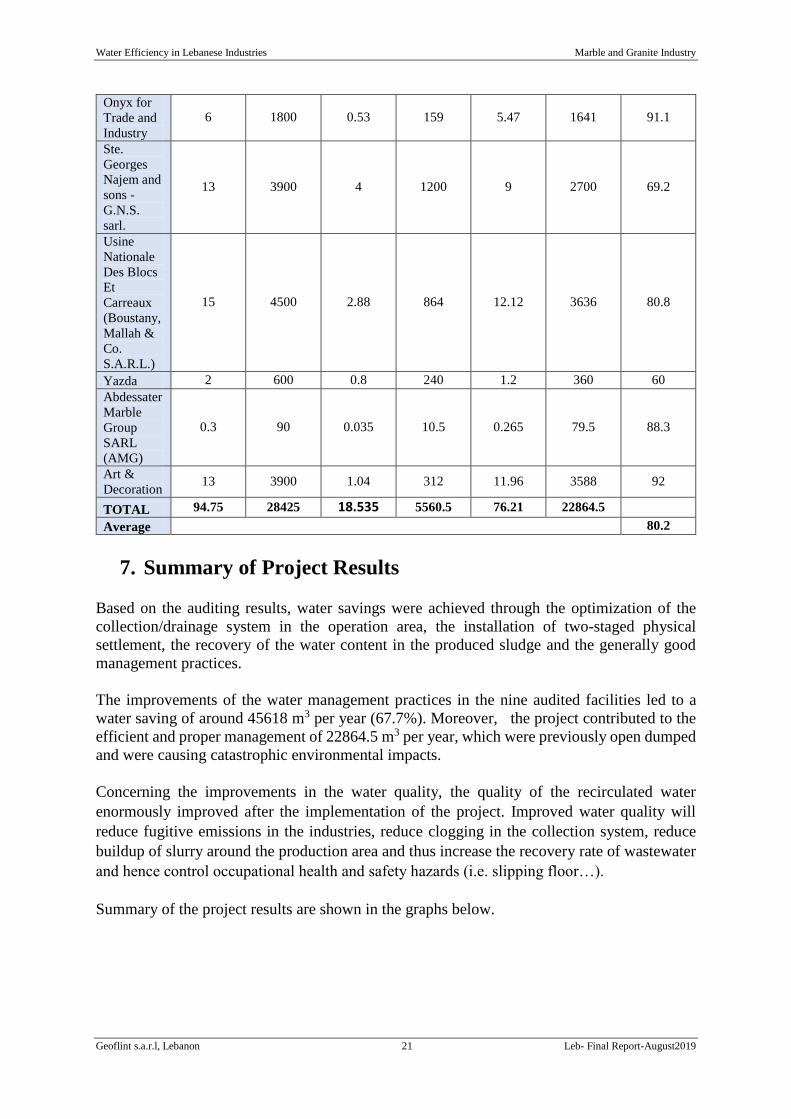
TOTAL 94.75 28425 18.535 5560.5 76.21 22864.5
Average 80.2
7. Summary of Project Results
Based on the auditing results, water savings were achieved through the optimization of the
collection/drainage system in the operation area, the installation of two-staged physical
settlement, the recovery of the water content in the produced sludge and the generally good
management practices.
The improvements of the water management practices in the nine audited facilities led to a
water saving of around 45618 m3 per year (67.7%). Moreover, the project contributed to the
efficient and proper management of 22864.5 m3 per year, which were previously open dumped
and were causing catastrophic environmental impacts.
Concerning the improvements in the water quality, the quality of the recirculated water
enormously improved after the implementation of the project. Improved water quality will
reduce fugitive emissions in the industries, reduce clogging in the collection system, reduce
buildup of slurry around the production area and thus increase the recovery rate of wastewater
and hence control occupational health and safety hazards (i.e. slipping floor…).
Summary of the project results are shown in the graphs below.
Water Efficiency in Lebanese Industries Marble and Granite Industry
Geoflint s.a.r.l, Lebanon 22 Leb- Final Report-August2019
Figure 4 Summary of project results (1)
Figure 5 Summary of project results (2)
Water Efficiency in Lebanese Industries Marble and Granite Industry
Geoflint s.a.r.l, Lebanon 23 Leb- Final Report-August2019
8. References
Andreoli, C. V., Von Sperling, M., Fernandes, F., & Ronteltap, M. (2017). Sludge
treatment and disposal. IWA publishing.
Bresters, A. R., Coulomb, I., Matter, B., Saabye, A., Spinosa, L., & Utvik, Å. (1997).
Management Approaches and Experiences: Sludge Treatment and Disposal.
Environmental Issues Series 7 European Environment Agency, Copenhagen, Denmark, 54.
Ersoy, B., Tosun, I., Günay, A., & Dikmen, S. (2009). Turbidity removal from
wastewaters of natural stone processing by coagulation/flocculation methods. CLEAN
Soil, Air, Water, 37(3), 225-232.
Fahiminia, M., Ardani, R., Hashemi, S., & Alizadeh, M. (2013). Wastewater treatment of
stone cutting industries by coagulation process.
Hanieh, A. A., AbdElall, S., & Hasan, A. (2014). Sustainable development of stone and
marble sector in Palestine. Journal of cleaner production, 84, 581-588.
Industry, N. S. (2009). Best Practices of the Natural Stone Industry.
Sadler, B. (1988) The evaluation of assessment: post-EIS research and process
development, in: P. Wathern (Ed) Environmental Impact Assessment: Theory and
Practice (London, Unwin Hyman).
Taşdemir, T., & Kurama, H. (2013). Fine particle removal from natural stone processing
effluent by flocculation. Environmental Progress & Sustainable Energy, 32(2), 317-324.
United States Environmental Protection Agency (EPA). (1974). Granite Industry
Wastewater Treatment. EPA-660/2-74-040.

ANNEX 01
Annex 01
Post- Development Water Audit Report Ibrahim Mallah et Fils S.A.L.
Nahr El Mott-Jdaideh
March 2019
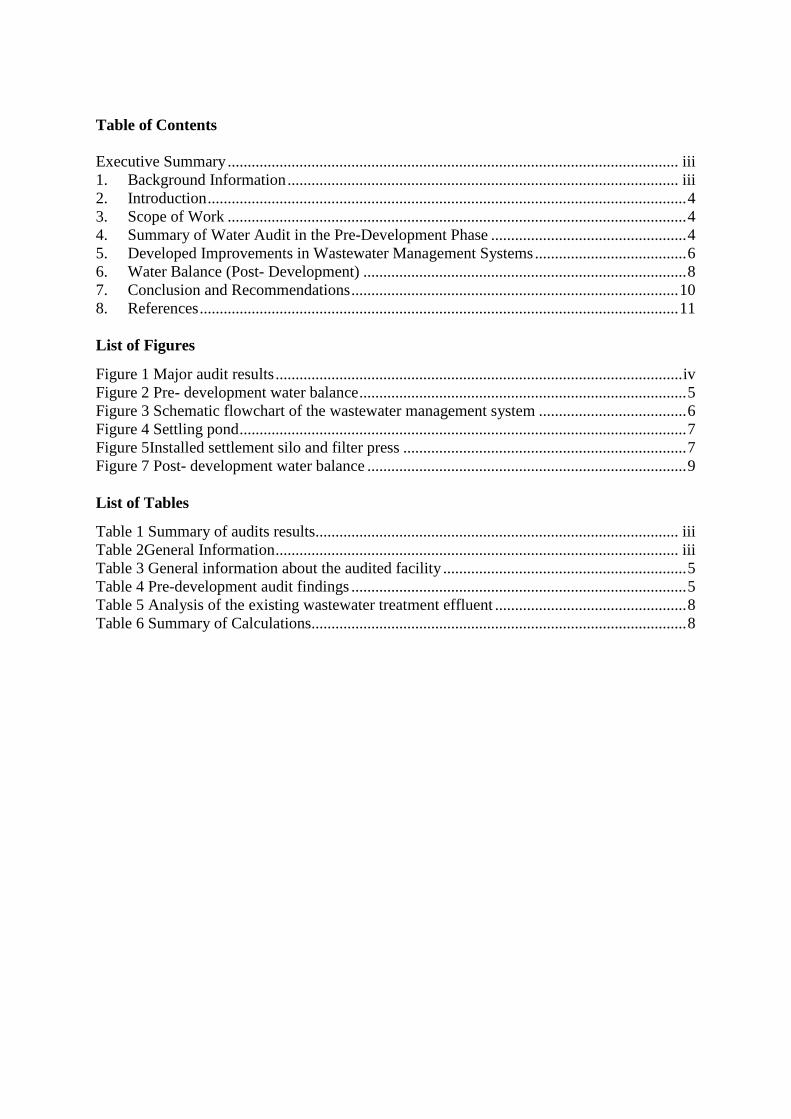
Table of Contents
Executive Summary ................................................................................................................. iii 1. Background Information .................................................................................................. iii 2. Introduction ........................................................................................................................ 4 3. Scope of Work ................................................................................................................... 4
4. Summary of Water Audit in the Pre-Development Phase ................................................. 4 5. Developed Improvements in Wastewater Management Systems ...................................... 6 6. Water Balance (Post- Development) ................................................................................. 8 7. Conclusion and Recommendations .................................................................................. 10 8. References ........................................................................................................................ 11
List of Figures
Figure 1 Major audit results ...................................................................................................... iv Figure 2 Pre- development water balance .................................................................................. 5 Figure 3 Schematic flowchart of the wastewater management system ..................................... 6 Figure 4 Settling pond ................................................................................................................ 7
Figure 5Installed settlement silo and filter press ....................................................................... 7
Figure 7 Post- development water balance ................................................................................ 9
List of Tables
Table 1 Summary of audits results........................................................................................... iii
Table 2General Information ..................................................................................................... iii Table 3 General information about the audited facility ............................................................. 5
Table 4 Pre-development audit findings .................................................................................... 5 Table 5 Analysis of the existing wastewater treatment effluent ................................................ 8
Table 6 Summary of Calculations.............................................................................................. 8
WELI Annex 01- Ibrahim Mallah et Fils SAL
Geoflint s.a.r.l, Lebanon iii Leb- Jdaideh–Water Audit-March 2019
Executive Summary
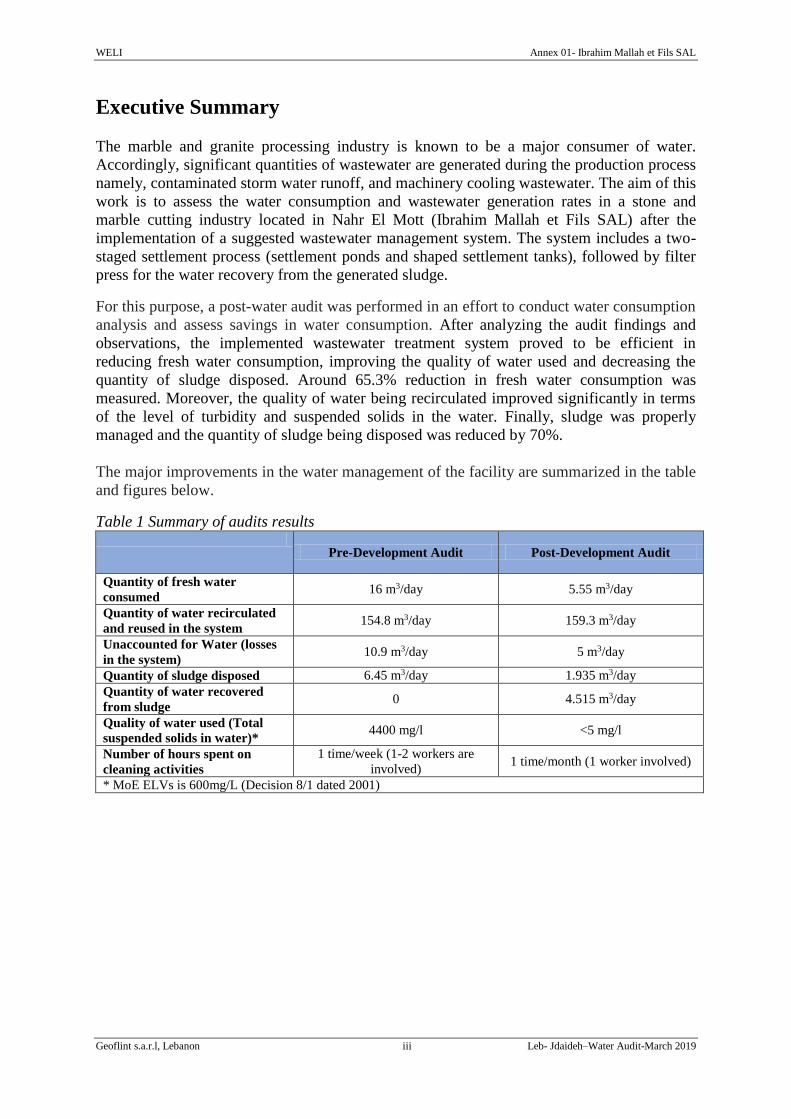
The marble and granite processing industry is known to be a major consumer of water.
Accordingly, significant quantities of wastewater are generated during the production process
namely, contaminated storm water runoff, and machinery cooling wastewater. The aim of this
work is to assess the water consumption and wastewater generation rates in a stone and
marble cutting industry located in Nahr El Mott (Ibrahim Mallah et Fils SAL) after the
implementation of a suggested wastewater management system. The system includes a two-
staged settlement process (settlement ponds and shaped settlement tanks), followed by filter
press for the water recovery from the generated sludge.
For this purpose, a post-water audit was performed in an effort to conduct water consumption
analysis and assess savings in water consumption. After analyzing the audit findings and
observations, the implemented wastewater treatment system proved to be efficient in
reducing fresh water consumption, improving the quality of water used and decreasing the
quantity of sludge disposed. Around 65.3% reduction in fresh water consumption was
measured. Moreover, the quality of water being recirculated improved significantly in terms
of the level of turbidity and suspended solids in the water. Finally, sludge was properly
managed and the quantity of sludge being disposed was reduced by 70%.
The major improvements in the water management of the facility are summarized in the table
and figures below.
Table 1 Summary of audits results
Pre-Development Audit Post-Development Audit
Quantity of fresh water
consumed 16 m3/day 5.55 m3/day
Quantity of water recirculated
and reused in the system 154.8 m3/day 159.3 m3/day
Unaccounted for Water (losses
in the system) 10.9 m3/day 5 m3/day
Quantity of sludge disposed 6.45 m3/day 1.935 m3/day
Quantity of water recovered
from sludge 0 4.515 m3/day
Quality of water used (Total
suspended solids in water)* 4400 mg/l <5 mg/l
Number of hours spent on
cleaning activities
1 time/week (1-2 workers are
involved) 1 time/month (1 worker involved)
* MoE ELVs is 600mg/L (Decision 8/1 dated 2001)
WELI Annex 01- Ibrahim Mallah et Fils SAL
Geoflint s.a.r.l, Lebanon iv Leb- Jdaideh–Water Audit-March 2019
Figure I Recorded improvements
Figure 1 Major audit results
WELI Annex 01- Ibrahim Mallah et Fils SAL
Geoflint s.a.r.l, Lebanon iii Leb- Jdaideh–Water Audit-March 2019
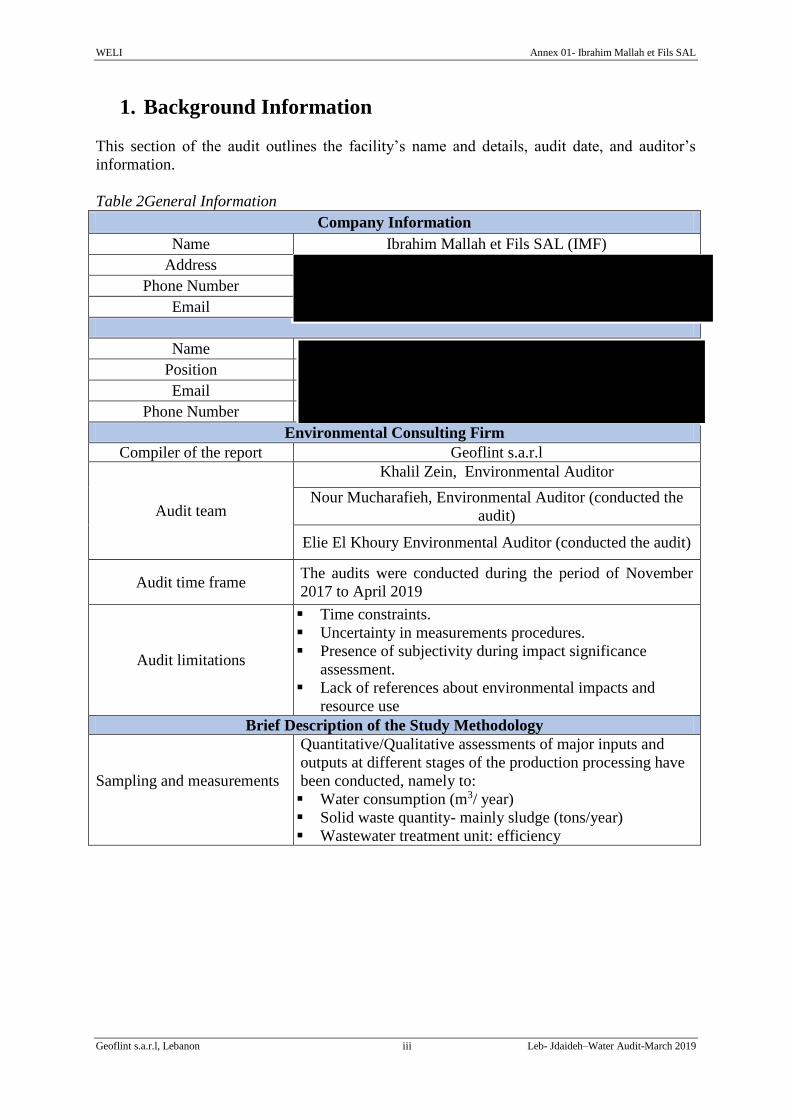
1. Background Information
This section of the audit outlines the facility’s name and details, audit date, and auditor’s
information.
Table 2General Information
Company Information
Name Ibrahim Mallah et Fils SAL (IMF)
Address
Phone Number
Name
Position
Phone Number
Environmental Consulting Firm
Compiler of the report Geoflint s.a.r.l
Audit team
Khalil Zein, Environmental Auditor
Nour Mucharafieh, Environmental Auditor (conducted the
audit)
Elie El Khoury Environmental Auditor (conducted the audit)
Audit time frame The audits were conducted during the period of November
2017 to April 2019
Audit limitations
Time constraints.
Uncertainty in measurements procedures.
Presence of subjectivity during impact significance
assessment.
Lack of references about environmental impacts and
resource use
Brief Description of the Study Methodology
Sampling and measurements
Quantitative/Qualitative assessments of major inputs and
outputs at different stages of the production processing have
been conducted, namely to:
Water consumption (m3/ year)
Solid waste quantity- mainly sludge (tons/year)
Wastewater treatment unit: efficiency
WELI Annex 01- Ibrahim Mallah et Fils SAL
Geoflint s.a.r.l, Lebanon 4 Leb- Jdaideh–Water Audit-March 2019
2. Introduction
Natural stones (such as marble, granite…etc.) are materials which have been extensively used
for a variety of building applications since ancient times. This reflects the belief that stones
are sustainable and durable material for construction works (Taşdemir, Kurama, 2013).
The marble and granite processing industry is known to be a major consumer of water.
Significant quantities of water are consumed to cool the saws during the production process
and to polish the final product. Accordingly, significant quantities of wastewater is generated
during the production process namely, contaminated storm water runoff, and machinery
cooling wastewater. Major environmental concerns are associated with the generated
wastewater considering its high alkalinity, and high levels of Total Suspended Solids (TSS).
Fine particles (<0.2 mm) are generated during the cutting and polishing processes, where
around 25-40% of the weight of the block is produced as fine particles during the cutting
process. Thus, large amounts of water is used to capture the produced particles (Taşdemir,
Kurama, 2013). In general, wastewater is treated by simple solid–liquid separation and is then
reused in the process. If the turbidity of the reused water is higher than acceptable values, the
stone powders in the water may cause polishing problems during the processing of natural
stone and may lead to clogging of pipes. Consequently, the maximum (residual) turbidity of
the clean water should be less than 15 Nephelometric Turbidity Units (NTU) (Ersoy, Tosun,
et al., 2009).
Moreover, if the generated wastewater is not managed properly, it would negatively affect the
physical, biological and chemical characteristics of both the local water and soil quality,
resulting in inevitable implications on both the environment and the public health. In this
context, a water audit was conducted for the marble and granite processing facility in Nahr El
Mott (Ibrahim Mallah et Fils SAL) in order to assess the water consumption within the
facility and to identify opportunities to improve water use efficiency.
3. Scope of Work
The aim of this post development audit is to compare the impacts of water consumption that
were assessed in the environmental audit conducted prior to project implementation with
those that actually arose after the implementation of the proposed interventions. Post-
development audit has an important role in improving the future performance and utility of
the project. Moreover, this process of comparing predictions versus actual or reflective
assessment is of great importance to sustainability of projects (Sadler, 1988).
This work will assess water consumption and wastewater generation rates after the
implementation of the wastewater management systems. For this purpose a post-water audit
was performed in an effort to conduct water consumption analysis and assess savings in water
consumption.
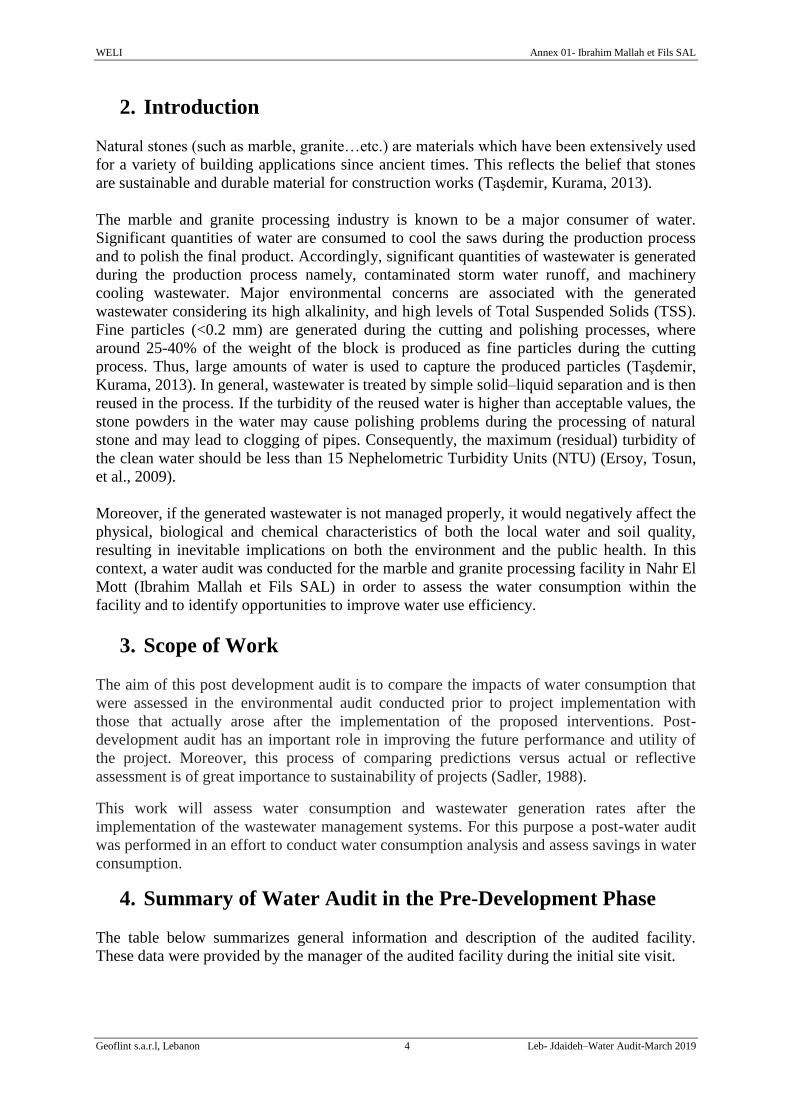
4. Summary of Water Audit in the Pre-Development Phase
The table below summarizes general information and description of the audited facility.
These data were provided by the manager of the audited facility during the initial site visit.
WELI Annex 01- Ibrahim Mallah et Fils SAL
Geoflint s.a.r.l, Lebanon 5 Leb- Jdaideh–Water Audit-March 2019
Table 3 General information about the audited facility
Capacity 50000-60000 m2/year
Number of Machines 12
Operating days per year 300 days/year
Operating hours/day 8 hours/day
Table 4 Pre-development audit findings
Water Source Public water source
Water tankers
Wastewater characteristics High levels of TSS, and turbidity
Wastewater Infrastructure Canals and bunds to collect the wastewater
Settlement pond (2)
Sludge Management Openly disposed
Cleaning of settlement tank schedule 1 time/week (1-2 workers are involved)
Fresh water consumption 16 m3/day
Recirculated wastewater 154.8 m3/day
Un-Accounted for Water 10.9 m3/day
Sludge Generated 6.45 m3/day
Figure 2 Pre- development water balance
Production
Process
Wastewater
Treatment Unit
Quantity of fresh
water entering the
processing plant
Influent
WW
Losses in the
system
Effluent
WW Recirculated
WW
Stone cuttings
Recirculated Water
Runoff
1.45 m3/d
16 m3/d
Sludge
6.45 m3/d
154.8 m3/d 161.3 m3/d
154.8 m3/d
10.9 m3/d
WELI Annex 01- Ibrahim Mallah et Fils SAL
Geoflint s.a.r.l, Lebanon 6 Leb- Jdaideh–Water Audit-March 2019
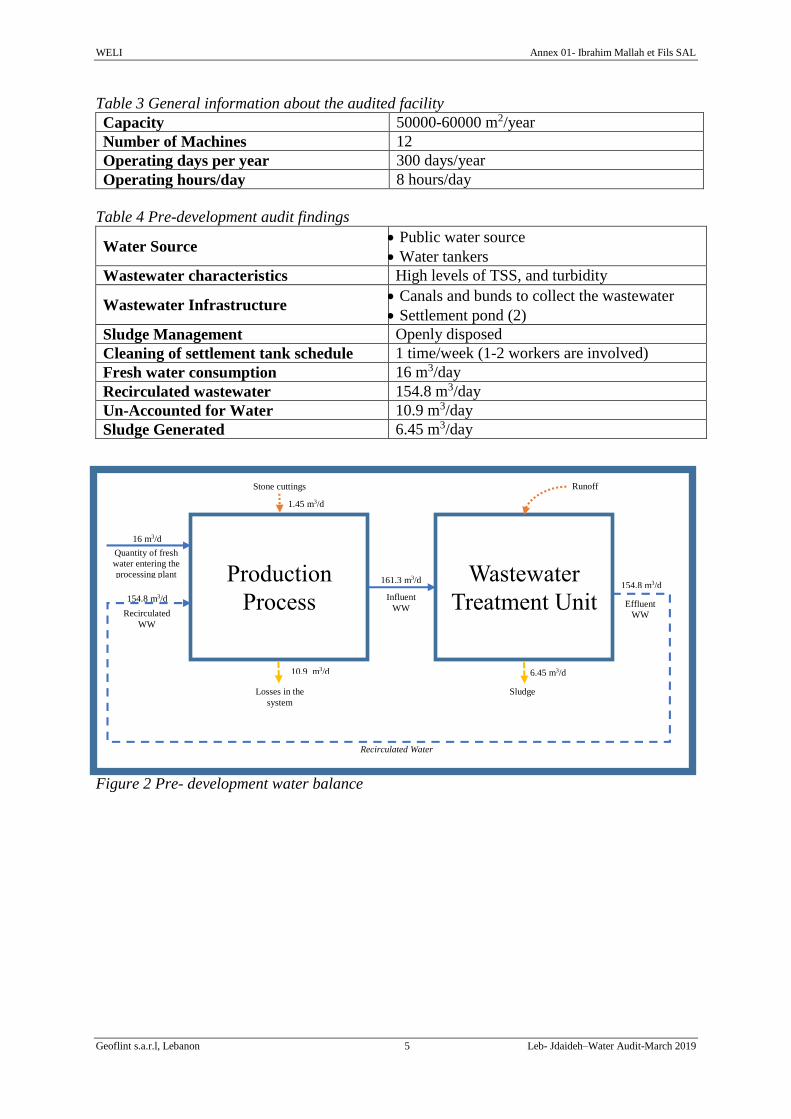
5. Developed Improvements in Wastewater Management
Systems
Ibrahim Mallah et Fils S.A.L. implemented the suggested wastewater management system
which includes a two-staged settlement process (settlement ponds and shaped settlement
tanks), followed by filter press for the water recovery from the generated sludge. A filter
press was recently installed to recover water from the generated sludge.
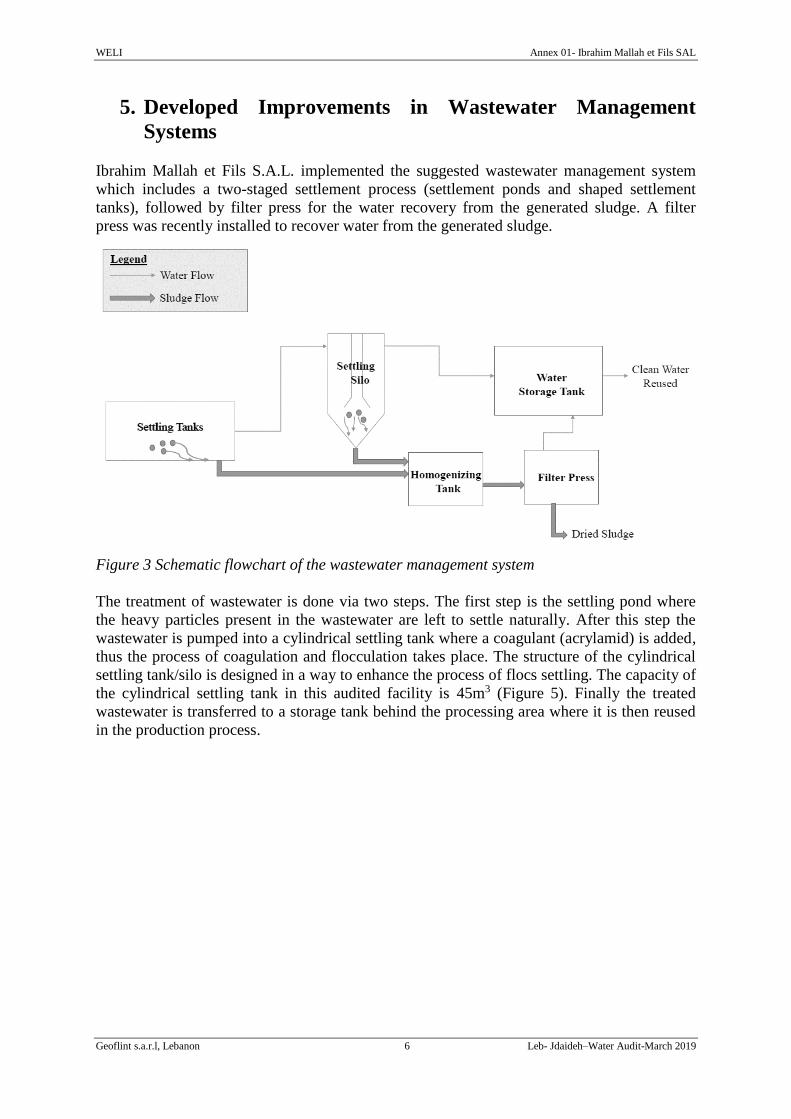
Figure 3 Schematic flowchart of the wastewater management system
The treatment of wastewater is done via two steps. The first step is the settling pond where
the heavy particles present in the wastewater are left to settle naturally. After this step the
wastewater is pumped into a cylindrical settling tank where a coagulant (acrylamid) is added,
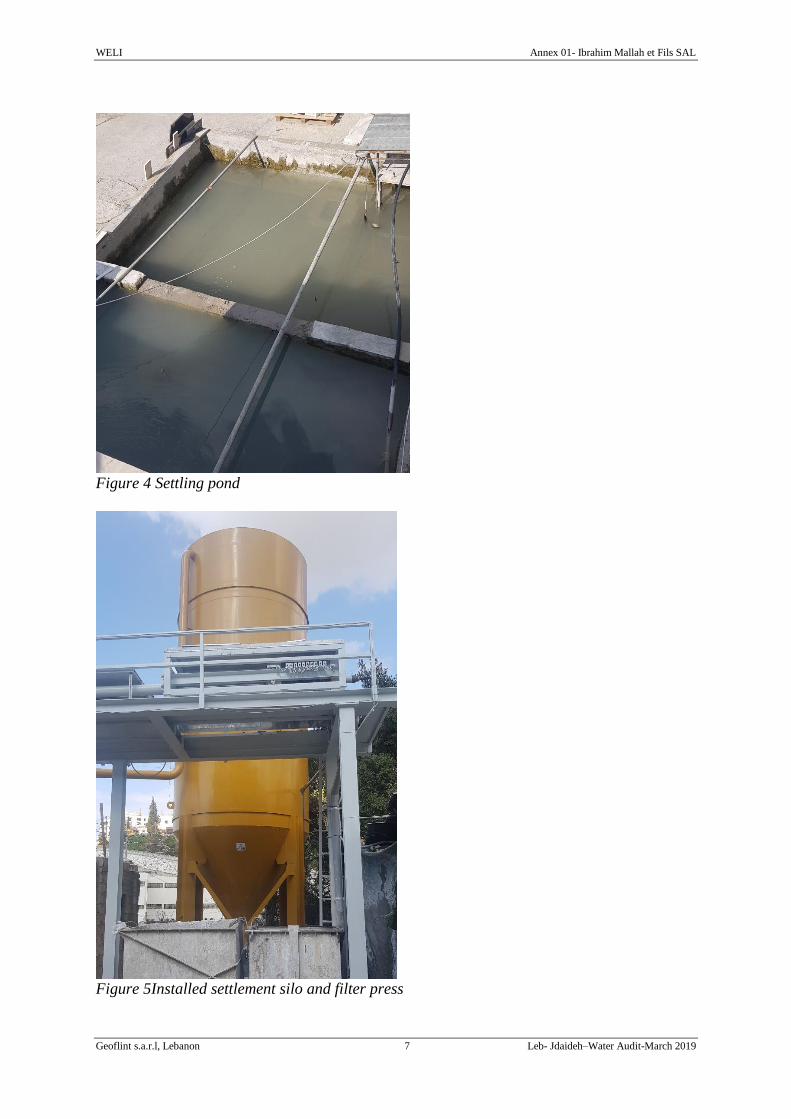
thus the process of coagulation and flocculation takes place. The structure of the cylindrical
settling tank/silo is designed in a way to enhance the process of flocs settling. The capacity of
the cylindrical settling tank in this audited facility is 45m3 (Figure 5). Finally the treated
wastewater is transferred to a storage tank behind the processing area where it is then reused
in the production process.
WELI Annex 01- Ibrahim Mallah et Fils SAL
Geoflint s.a.r.l, Lebanon 7 Leb- Jdaideh–Water Audit-March 2019
Figure 4 Settling pond
Figure 5Installed settlement silo and filter press
WELI Annex 01- Ibrahim Mallah et Fils SAL
Geoflint s.a.r.l, Lebanon 8 Leb- Jdaideh–Water Audit-March 2019
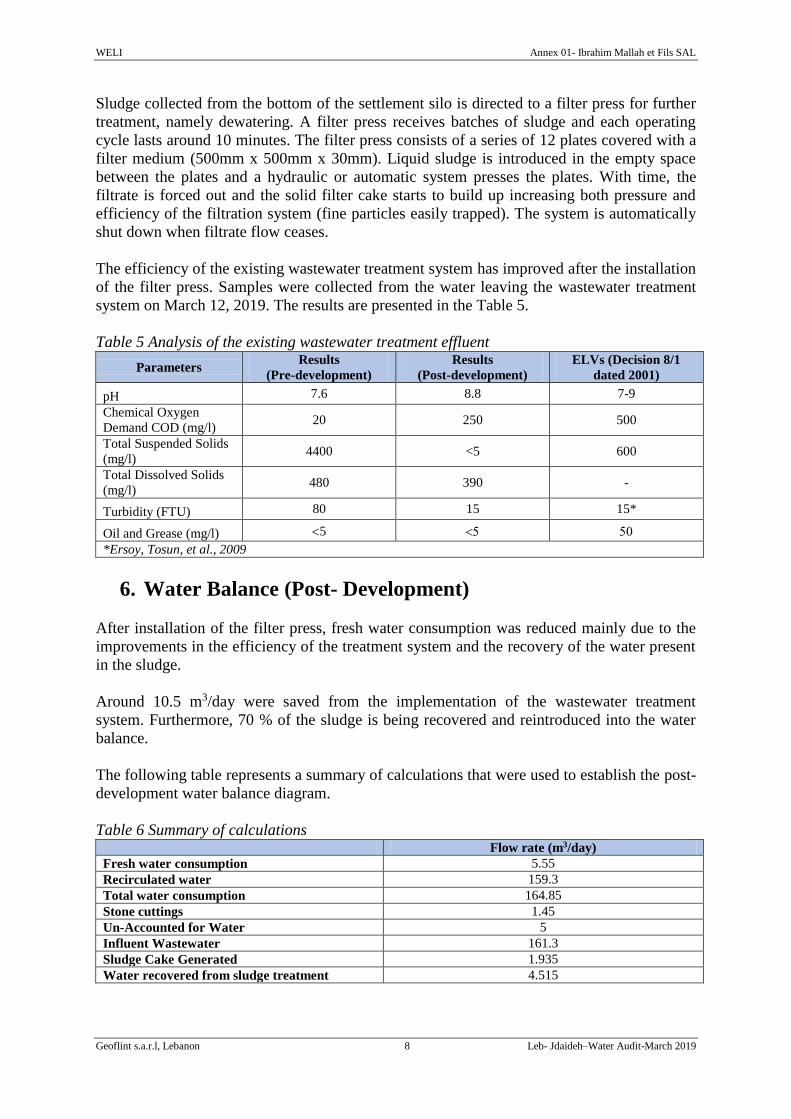
Sludge collected from the bottom of the settlement silo is directed to a filter press for further
treatment, namely dewatering. A filter press receives batches of sludge and each operating
cycle lasts around 10 minutes. The filter press consists of a series of 12 plates covered with a
filter medium (500mm x 500mm x 30mm). Liquid sludge is introduced in the empty space
between the plates and a hydraulic or automatic system presses the plates. With time, the
filtrate is forced out and the solid filter cake starts to build up increasing both pressure and
efficiency of the filtration system (fine particles easily trapped). The system is automatically
shut down when filtrate flow ceases.
The efficiency of the existing wastewater treatment system has improved after the installation
of the filter press. Samples were collected from the water leaving the wastewater treatment
system on March 12, 2019. The results are presented in the Table 5.
Table 5 Analysis of the existing wastewater treatment effluent
Parameters Results
(Pre-development)
Results
(Post-development)
ELVs (Decision 8/1
dated 2001)
pH 7.6 8.8 7-9
Chemical Oxygen
Demand COD (mg/l) 20 250 500
Total Suspended Solids
(mg/l) 4400 <5 600
Total Dissolved Solids
(mg/l) 480 390 -
Turbidity (FTU) 80 15 15*
Oil and Grease (mg/l) 5
*Ersoy, Tosun, et al., 2009
6. Water Balance (Post- Development)
After installation of the filter press, fresh water consumption was reduced mainly due to the
improvements in the efficiency of the treatment system and the recovery of the water present
in the sludge.
Around 10.5 m3/day were saved from the implementation of the wastewater treatment
system. Furthermore, 70 % of the sludge is being recovered and reintroduced into the water
balance.
The following table represents a summary of calculations that were used to establish the post-
development water balance diagram.
Table 6 Summary of calculations Flow rate (m3/day)
Fresh water consumption 5.55
Recirculated water 159.3
Total water consumption 164.85
Stone cuttings 1.45
Un-Accounted for Water 5
Influent Wastewater 161.3
Sludge Cake Generated 1.935
Water recovered from sludge treatment 4.515
WELI Annex 01- Ibrahim Mallah et Fils SAL
Geoflint s.a.r.l, Lebanon 9 Leb- Jdaideh–Water Audit-March 2019
In addition, a water balance diagram was generated in order to present the quantities of water
entering and leaving the whole system. The diagram also accounts for the quantities of water
lost and gained in the system.
Figure 6 Post- development water balance
Production
Process
Wastewater
Treatment Unit
Quantity of fresh
water entering the
processing plant
Influent
WW
Losses in the
system
Effluent
WW Recirculated
WW
Stone cuttings
Recirculated Water
Runoff
1.45 m3/d
5.55 m3/d
1.935 m3/d
154.8 m3/d 161.3 m3/d
159.3 m3/d
5 m3/d
Sludge cake Dewatered Sludge
4.515 m3/d
WELI Annex 01- Ibrahim Mallah et Fils SAL
Geoflint s.a.r.l, Lebanon 10 Leb- Jdaideh–Water Audit-March 2019
7. Conclusion and Recommendations
After analyzing the audit findings and observations, the implemented wastewater treatment
system proved to be efficient in reducing fresh water consumption, improving the quality of
water used and decreasing the quantity of sludge disposed. Around 65.3% reduction in fresh
water consumption was measured. Moreover, the quality of water being recirculated
improved significantly in terms of the level of turbidity and suspended solids in the water.
Improving the quality of water reduced machinery and equipment maintenance (changing of
blades…) where the stone powders in the water may cause polishing problems during the
processing of natural stone and may lead to clogging of pipes. Finally, sludge was properly
managed and the quantity of sludge being disposed was reduced by 70%.
The improvements in the efficiency of water and wastewater management is also resulting in
economic benefits due to reductions in:
Fresh water costs (water tankers…)
Machinery and equipment maintenance (changing of blades…)
Management of sludge piles, where generated sludge is occupying space, and is
incurring on the facility operational costs (machineries operation such as bobcats…)
Labor costs and time spent on the management of poorly operating wastewater
treatment system.
Nevertheless, several recommendations were identified to further improve environmental
management in the proposed facility. These recommendations are summarized below.
Consider rain water harvesting
Improve the efficiency of the wastewater treatment plant by:
o Applying the optimal dose and type of coagulant
o Inspecting the influent and effluent flow rates on a regular basis
Maintain or improve wastewater collection channels (i.e. increase height of sloping
sides) to avoid loss of water to the open ground
Regularly inspect the wastewater canals and bunds to prevent blockages
WELI Annex 01- Ibrahim Mallah et Fils SAL
Geoflint s.a.r.l, Lebanon 11 Leb- Jdaideh–Water Audit-March 2019
8. References
Ersoy, B., Tosun, I., Günay, A., & Dikmen, S. (2009). Turbidity removal from wastewaters
of natural stone processing by coagulation/flocculation methods. CLEAN–Soil, Air,
Water, 37(3), 225-232.
Sadler, B. (1988) The evaluation of assessment: post-EIS research and process
development, in: P. Wathern (Ed) Environmental Impact Assessment: Theory and
Practice (London, Unwin Hyman).
Taşdemir, T., & Kurama, H. (2013). Fine particle removal from natural stone processing
effluent by flocculation. Environmental Progress & Sustainable Energy, 32(2), 317-324.

ANNEX 02
Annex 02
Post- Development Water Audit Report Mohammaad Jaafar & Co. "Rocky"
Ain El Sifsafeh – Aley
January 2019
Table of Contents
Executive Summary ....................................................................................................................... iii 1. Background Information ........................................................................................................ iii 2. Introduction ............................................................................................................................. 4
3. Scope of Work ........................................................................................................................ 4 4. Summary of Water Audit in the Pre-Development Phase ...................................................... 4 5. Developed Improvements in Wastewater Management Systems ........................................... 6 6. Water Balance (Post- Development) ...................................................................................... 9 7. Conclusion and Recommendations ....................................................................................... 11
8. References ............................................................................................................................. 12
List of Figures
Figure 1 Major audit results ........................................................................................................... iv
Figure 2 Pre-development Water balance ....................................................................................... 5 Figure 3 Schematic flowchart of the wastewater management system .......................................... 6 Figure 4Bunds in the processing area ............................................................................................. 7
Figure 5 Settling pond ..................................................................................................................... 7 Figure 6 Installed settlement silo .................................................................................................... 8
Figure 7Design and dimension of the current cylindrical settling tank .......................................... 8 Figure 8 Installed filter press .......................................................................................................... 9 Figure 9 Water balance (post-development) ................................................................................. 10
List of Tables
Table 1 Summary of audits results................................................................................................. iii
Table 2 General Information .......................................................................................................... iii Table 3General information about the audited facility ................................................................... 5
Table 4 Pre-development audit findings ......................................................................................... 5 Table 5 Analysis of the existing wastewater treatment effluent ..................................................... 9 Table 6 Summary of Calculations................................................................................................. 10
WELI Annex 02- Mohammad Jaafar & Co.
Geoflint s.a.r.l, Lebanon iii Leb- Ain El Sifsafeh –Water Audit-Feb 2019
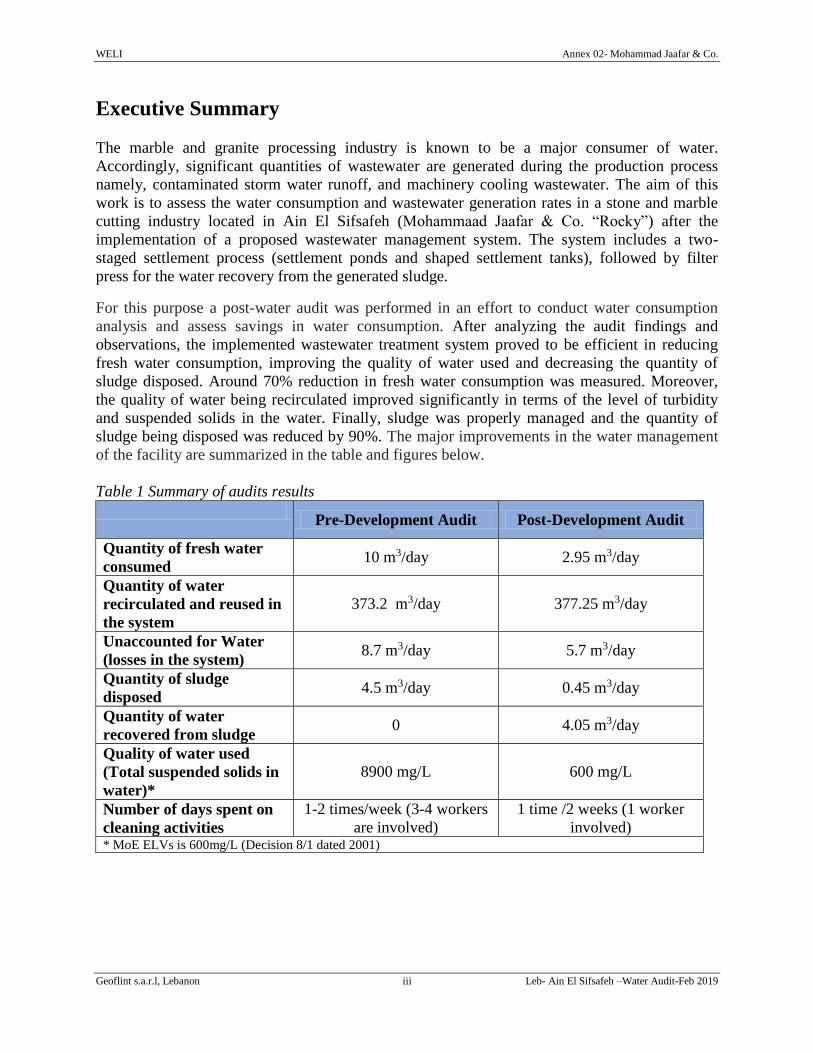
Executive Summary
The marble and granite processing industry is known to be a major consumer of water.
Accordingly, significant quantities of wastewater are generated during the production process
namely, contaminated storm water runoff, and machinery cooling wastewater. The aim of this
work is to assess the water consumption and wastewater generation rates in a stone and marble
cutting industry located in Ain El Sifsafeh (Mohammaad Jaafar & Co. “Rocky”) after the
implementation of a proposed wastewater management system. The system includes a two-
staged settlement process (settlement ponds and shaped settlement tanks), followed by filter
press for the water recovery from the generated sludge.
For this purpose a post-water audit was performed in an effort to conduct water consumption
analysis and assess savings in water consumption. After analyzing the audit findings and
observations, the implemented wastewater treatment system proved to be efficient in reducing
fresh water consumption, improving the quality of water used and decreasing the quantity of
sludge disposed. Around 70% reduction in fresh water consumption was measured. Moreover,
the quality of water being recirculated improved significantly in terms of the level of turbidity
and suspended solids in the water. Finally, sludge was properly managed and the quantity of
sludge being disposed was reduced by 90%. The major improvements in the water management
of the facility are summarized in the table and figures below.
Table 1 Summary of audits results
Pre-Development Audit Post-Development Audit
Quantity of fresh water
consumed 10 m3/day 2.95 m3/day
Quantity of water
recirculated and reused in
the system
373.2 m3/day 377.25 m3/day
Unaccounted for Water
(losses in the system) 8.7 m3/day 5.7 m3/day
Quantity of sludge
disposed 4.5 m3/day 0.45 m3/day
Quantity of water
recovered from sludge 0 4.05 m3/day
Quality of water used
(Total suspended solids in
water)*
8900 mg/L 600 mg/L
Number of days spent on
cleaning activities
1-2 times/week (3-4 workers
are involved)
1 time /2 weeks (1 worker
involved) * MoE ELVs is 600mg/L (Decision 8/1 dated 2001)
WELI Annex 02- Mohammad Jaafar & Co.
Geoflint s.a.r.l, Lebanon iv Leb- Ain El Sifsafeh –Water Audit-Feb 2019
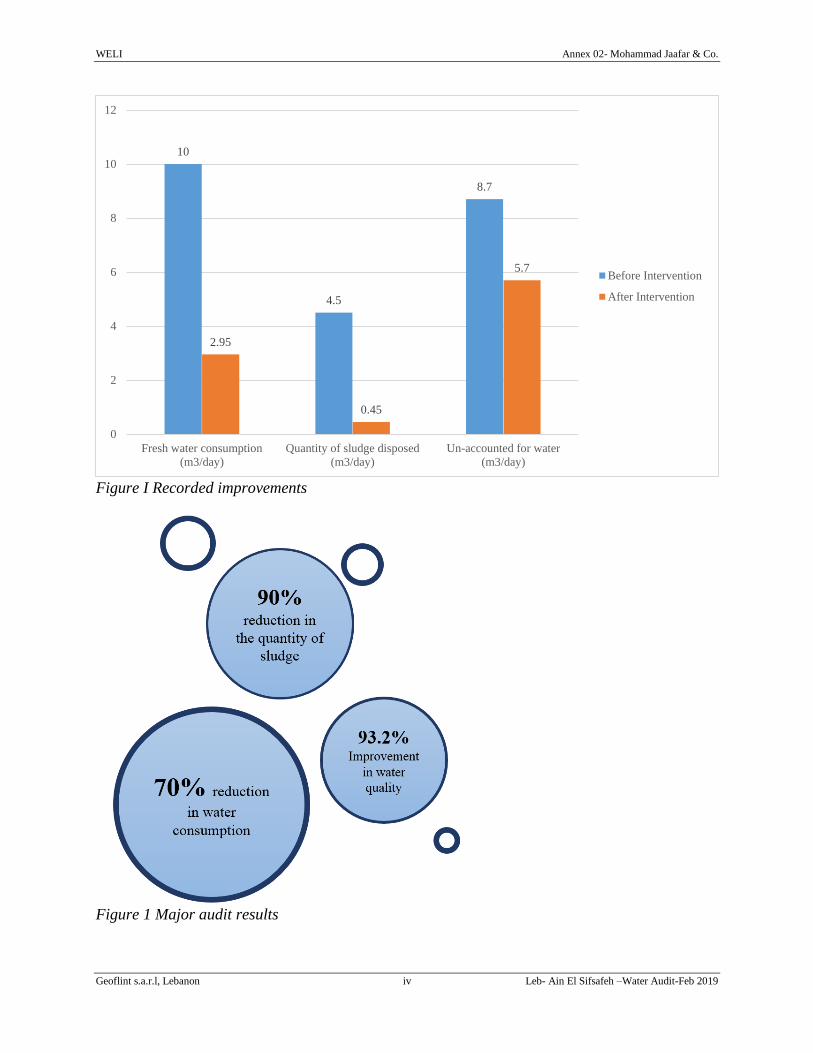
Figure I Recorded improvements
Figure 1 Major audit results
10
4.5
8.7
2.95
0.45
5.7
0
2
4
6
8
10
12
Fresh water consumption
(m3/day)
Quantity of sludge disposed
(m3/day)
Un-accounted for water
(m3/day)
Before Intervention
After Intervention
WELI Annex 02- Mohammad Jaafar & Co.
Geoflint s.a.r.l, Lebanon iii Leb- Ain El Sifsafeh –Water Audit-Feb 2019
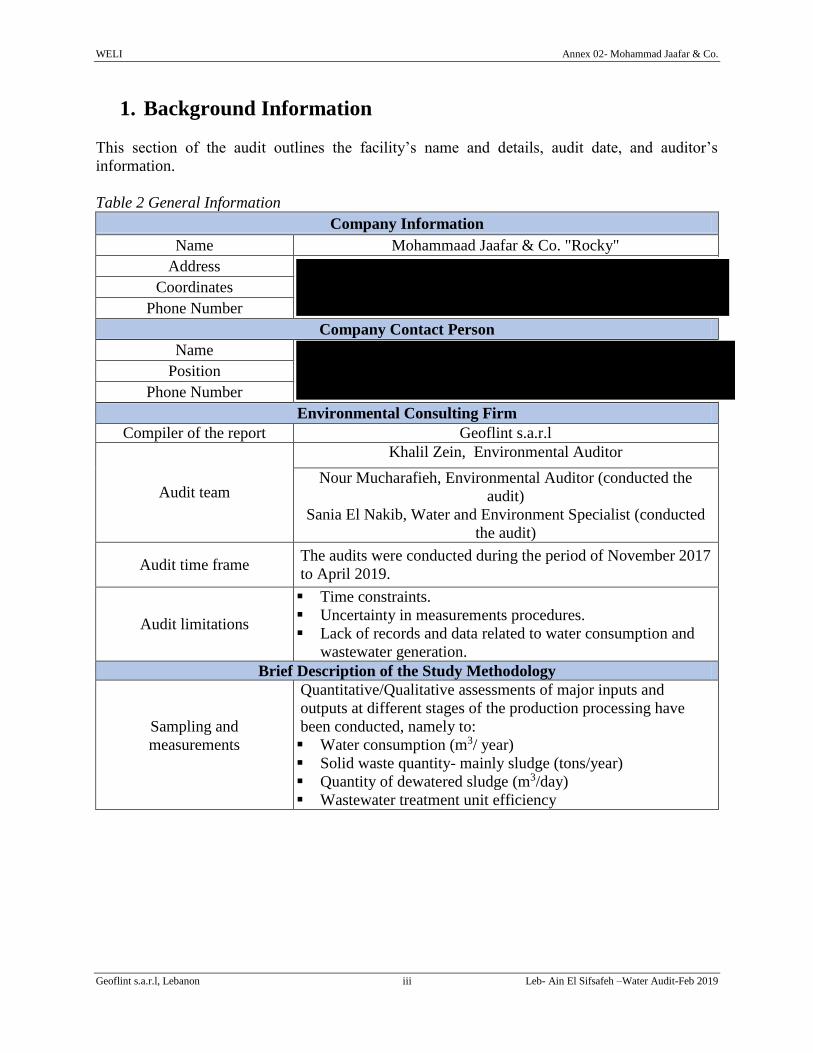
1. Background Information
This section of the audit outlines the facility’s name and details, audit date, and auditor’s
information.
Table 2 General Information
Company Information
Name Mohammaad Jaafar & Co. "Rocky"
Address
Coordinates
Phone Number
Company Contact Person
Name
Position
Phone Number
Environmental Consulting Firm
Compiler of the report Geoflint s.a.r.l
Audit team
Khalil Zein, Environmental Auditor
Nour Mucharafieh, Environmental Auditor (conducted the
audit)
Sania El Nakib, Water and Environment Specialist (conducted
the audit)
Audit time frame The audits were conducted during the period of November 2017
to April 2019.
Audit limitations
Time constraints.
Uncertainty in measurements procedures.
Lack of records and data related to water consumption and
wastewater generation.
Brief Description of the Study Methodology
Sampling and
measurements
Quantitative/Qualitative assessments of major inputs and
outputs at different stages of the production processing have
been conducted, namely to:
Water consumption (m3/ year)
Solid waste quantity- mainly sludge (tons/year)
Quantity of dewatered sludge (m3/day)
Wastewater treatment unit efficiency
WELI Annex 02- Mohammad Jaafar & Co.
Geoflint s.a.r.l, Lebanon 4 Leb- Ain El Sifsafeh –Water Audit-Feb 2019
2. Introduction
Natural stones (such as marble, granite…etc.) are materials which have been extensively used
for a variety of building applications since ancient times. This reflects the belief that stones
are sustainable and durable material for construction works (Taşdemir, Kurama, 2013).
The marble and granite processing industry is known to be a major consumer of water.
Significant quantities of water are consumed to cool the saws during the production process
and to polish the final product. Accordingly, significant quantities of wastewater is generated
during the production process namely, contaminated storm water runoff, and machinery
cooling wastewater. Major environmental concerns are associated with the generated
wastewater considering its high alkalinity, and high levels of Total Suspended Solids (TSS).
Fine particles (<0.2 mm) are generated during the cutting and polishing processes, where
around 25-40% of the weight of the block is produced as fine particles during the cutting
process. Thus, large amounts of water is used to capture the produced particles (Taşdemir,
Kurama, 2013). In general, wastewater is treated by simple solid–liquid separation and is then
reused in the process. If the turbidity of the reused water is higher than acceptable values, the
stone powders in the water may cause polishing problems during the processing of natural
stone and may lead to clogging of pipes. Consequently, the maximum (residual) turbidity of
the clean water should be less than 15 Nephelometric Turbidity Units (NTU) (Ersoy, Tosun,
et al., 2009).
Moreover, if the generated wastewater is not managed properly, it would negatively affect the
physical, biological and chemical characteristics of both the local water and soil quality,
resulting in inevitable implications on both the environment and the public health. In this
context, a water audit was conducted for the marble and granite processing facility in Ain El
Sifsafeh (Mohammaad Jaafar & Co. "Rocky") in order to assess the water consumption
within the facility and to identify opportunities to improve water use efficiency.
3. Scope of Work
The aim of this post development audit is to compare the impacts of water consumption that
were assessed in the environmental audit conducted prior to project implementation with
those that actually arose after the implementation of the proposed interventions. Post-
development audit has an important role in improving the future performance and utility of
the project. Moreover, this process of comparing predictions versus actual or reflective
assessment is of great importance to sustainability of projects (Sadler, 1988).
This work will assess water consumption and wastewater generation rates after the
implementation of the wastewater management systems. For this purpose a post-water audit
was performed in an effort to conduct water consumption analysis and assess savings in water
consumption.
4. Summary of Water Audit in the Pre-Development Phase
The table below summarizes general information and description of the audited facility.
These data were provided by the manager of the audited facility during the initial site visit.

WELI Annex 02- Mohammad Jaafar & Co.
Geoflint s.a.r.l, Lebanon 5 Leb- Ain El Sifsafeh –Water Audit-Feb 2019
Table 3General information about the audited facility
Facility Area 3500 m2
Capacity 21,000 to 30,000 m2/year
Number of Machines 12
Operating days per year 300 days/year
Operating hours/day 8-10 hours/day
Table 4 Pre-development audit findings
Water Source Water tankers, local seasonal stream
Wastewater characteristics High levels of TSS, and turbidity
Wastewater Infrastructure
Canals and bunds to collect the wastewater
Settlement pond
Settlement silo
Sludge Management Mixed with fresh water and directed into the
seasonal stream/or collected with delivery
truck and openly disposed
Cleaning of settlement tank schedule 1-2 times/week (3-4 workers are involved)
Fresh water consumption 10 m3/day
Recirculated wastewater 373.2 m3/day
Un-Accounted for Water 8.7 m3/day
Sludge Generated 4.5 m3/day
Production
Process
Wastewater
Treatment Unit
Quantity of fresh
water entering the
processing plant
Influent
WW
Losses in the
system
Effluent
WW Recirculated
WW
Stone cuttings
Recirculated Water
Runoff
3.25 m3/d
10 m3/d
Sludge
4.5 m3/d
373.2 m3/d 377.7 m3/d
373.2 m3/d
8.7 m3/d
Figure 2 Pre-development Water balance
WELI Annex 02- Mohammad Jaafar & Co.
Geoflint s.a.r.l, Lebanon 6 Leb- Ain El Sifsafeh –Water Audit-Feb 2019
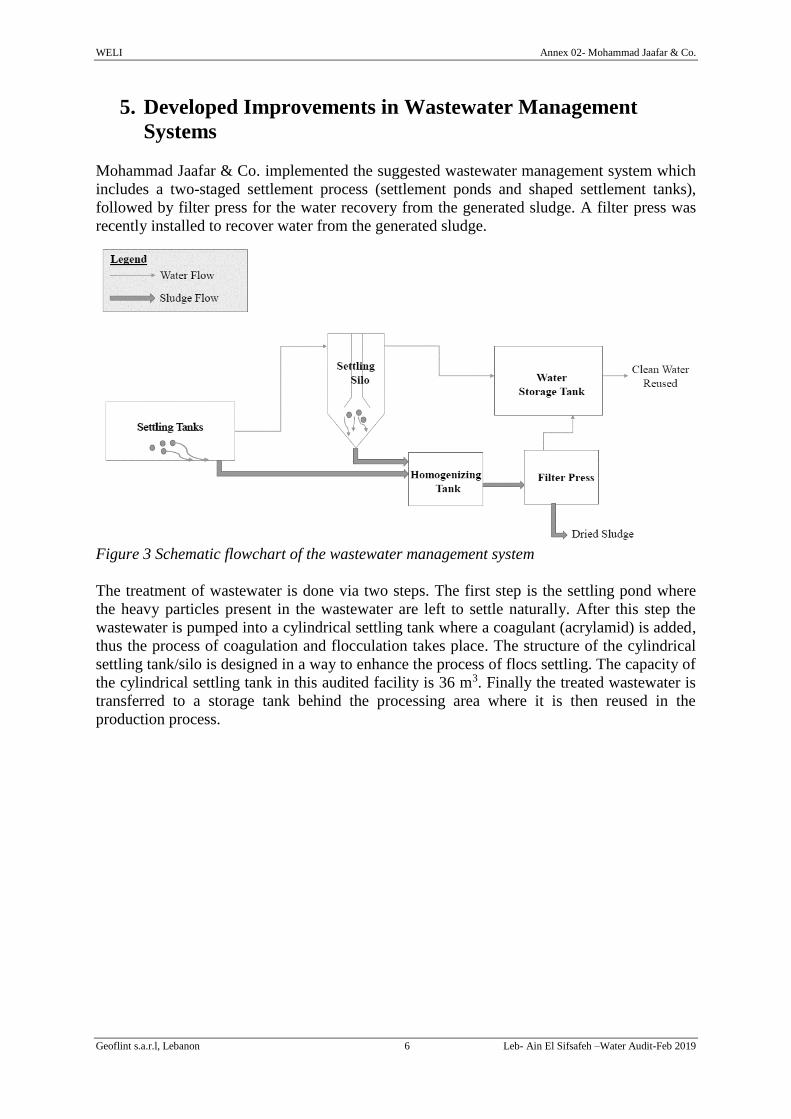
5. Developed Improvements in Wastewater Management
Systems
Mohammad Jaafar & Co. implemented the suggested wastewater management system which
includes a two-staged settlement process (settlement ponds and shaped settlement tanks),
followed by filter press for the water recovery from the generated sludge. A filter press was
recently installed to recover water from the generated sludge.
Figure 3 Schematic flowchart of the wastewater management system
The treatment of wastewater is done via two steps. The first step is the settling pond where
the heavy particles present in the wastewater are left to settle naturally. After this step the
wastewater is pumped into a cylindrical settling tank where a coagulant (acrylamid) is added,
thus the process of coagulation and flocculation takes place. The structure of the cylindrical
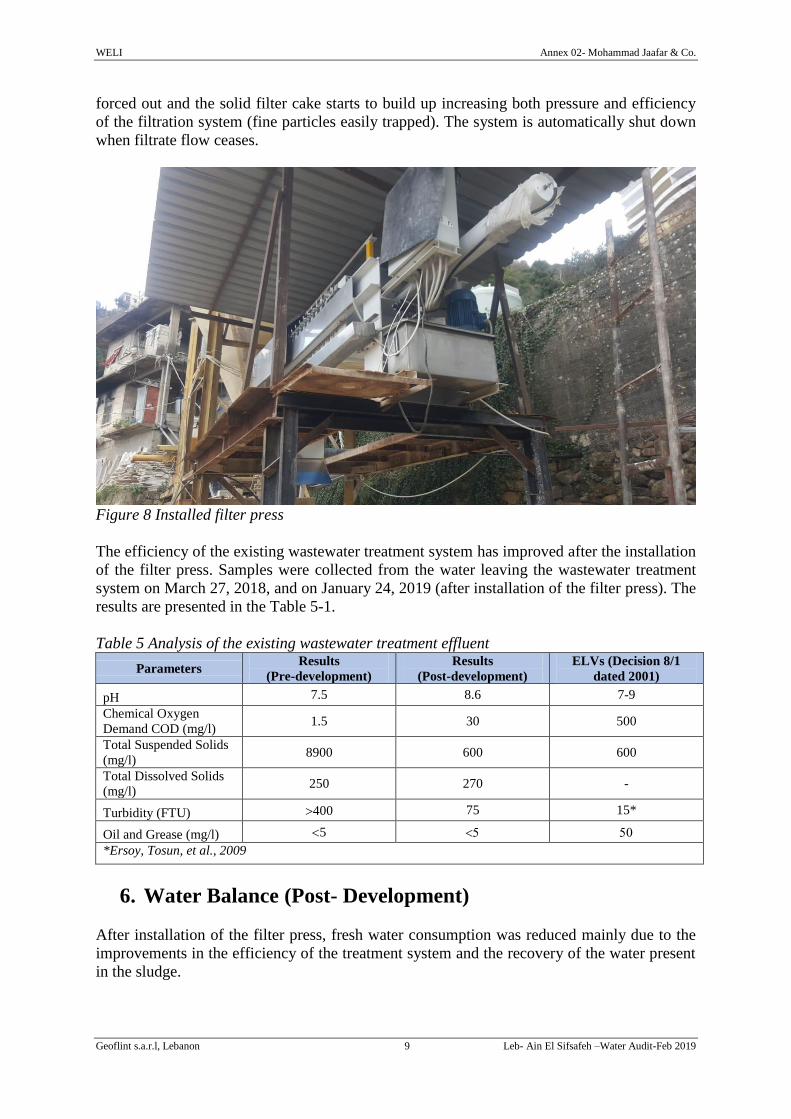
settling tank/silo is designed in a way to enhance the process of flocs settling. The capacity of
the cylindrical settling tank in this audited facility is 36 m3. Finally the treated wastewater is
transferred to a storage tank behind the processing area where it is then reused in the
production process.
WELI Annex 02- Mohammad Jaafar & Co.
Geoflint s.a.r.l, Lebanon 7 Leb- Ain El Sifsafeh –Water Audit-Feb 2019
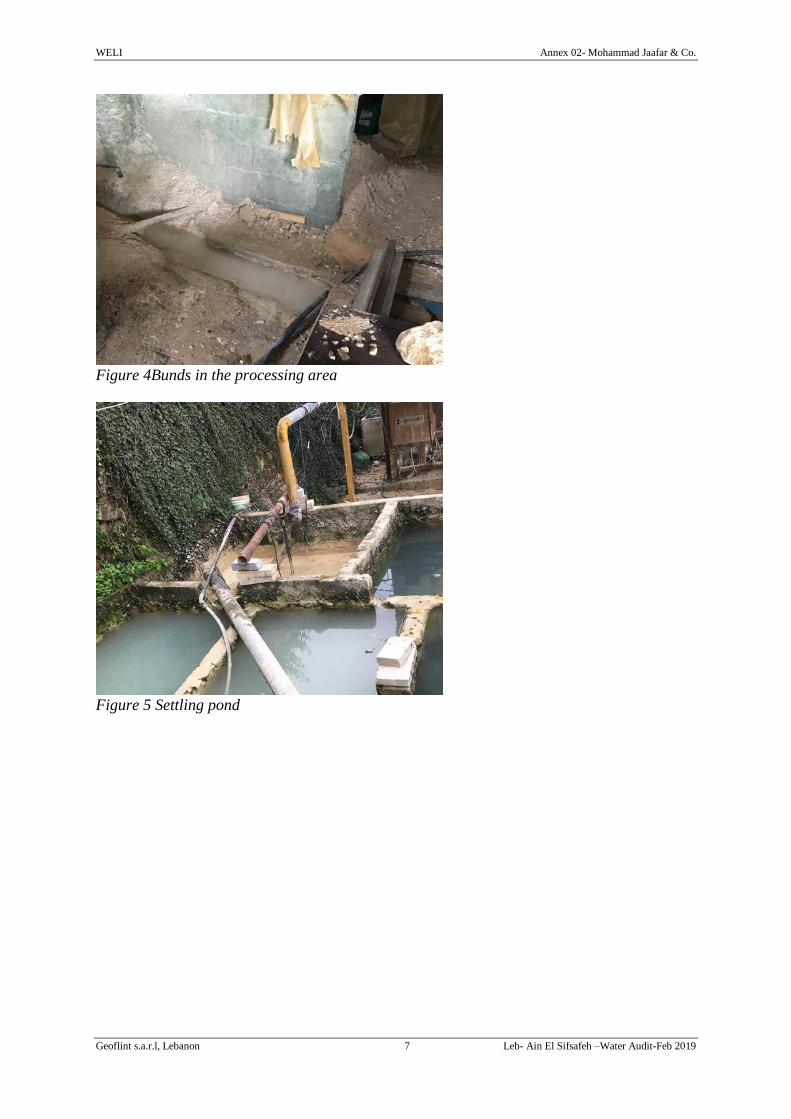
Figure 4Bunds in the processing area
Figure 5 Settling pond
WELI Annex 02- Mohammad Jaafar & Co.
Geoflint s.a.r.l, Lebanon 8 Leb- Ain El Sifsafeh –Water Audit-Feb 2019
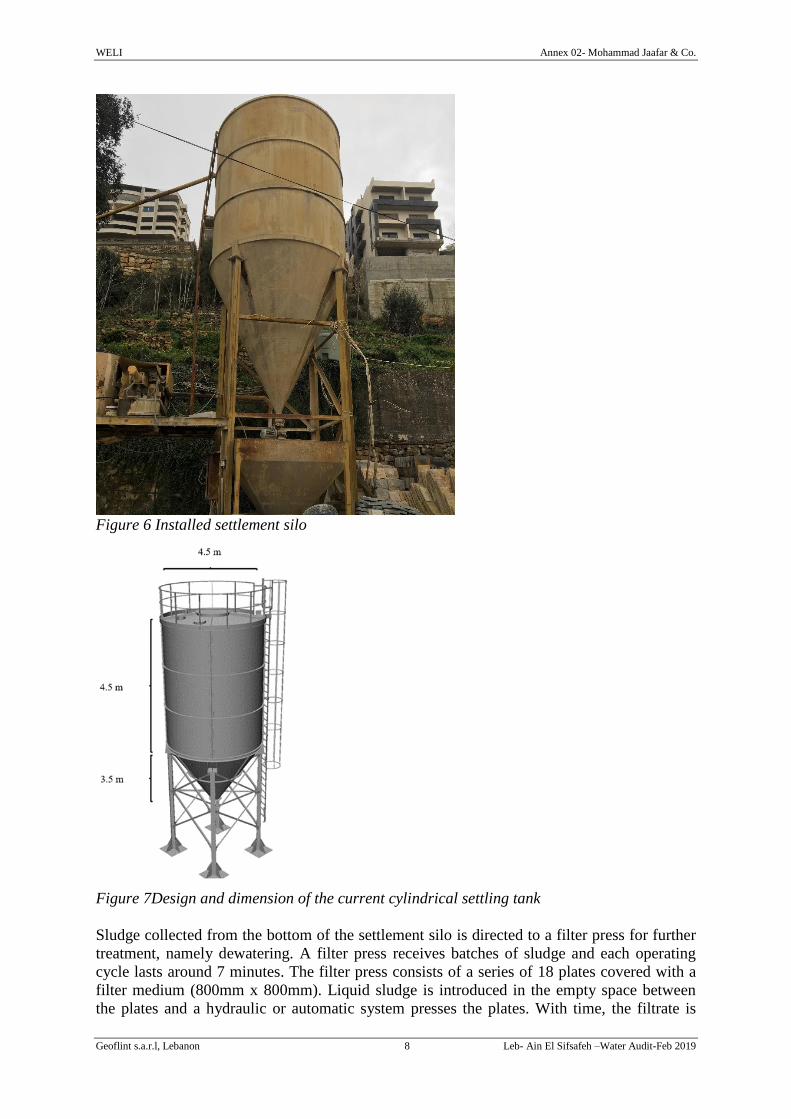
Figure 6 Installed settlement silo
Figure 7Design and dimension of the current cylindrical settling tank
Sludge collected from the bottom of the settlement silo is directed to a filter press for further
treatment, namely dewatering. A filter press receives batches of sludge and each operating
cycle lasts around 7 minutes. The filter press consists of a series of 18 plates covered with a
filter medium (800mm x 800mm). Liquid sludge is introduced in the empty space between
the plates and a hydraulic or automatic system presses the plates. With time, the filtrate is
WELI Annex 02- Mohammad Jaafar & Co.
Geoflint s.a.r.l, Lebanon 9 Leb- Ain El Sifsafeh –Water Audit-Feb 2019
forced out and the solid filter cake starts to build up increasing both pressure and efficiency
of the filtration system (fine particles easily trapped). The system is automatically shut down
when filtrate flow ceases.
Figure 8 Installed filter press
The efficiency of the existing wastewater treatment system has improved after the installation
of the filter press. Samples were collected from the water leaving the wastewater treatment
system on March 27, 2018, and on January 24, 2019 (after installation of the filter press). The
results are presented in the Table 5-1.
Table 5 Analysis of the existing wastewater treatment effluent
Parameters Results
(Pre-development)
Results
(Post-development)
ELVs (Decision 8/1
dated 2001)
pH 7.5 8.6 7-9
Chemical Oxygen
Demand COD (mg/l) 1.5 30 500
Total Suspended Solids
(mg/l) 8900 600 600
Total Dissolved Solids
(mg/l) 250 270 -
Turbidity (FTU) 400 75 15*
Oil and Grease (mg/l) 5
*Ersoy, Tosun, et al., 2009
6. Water Balance (Post- Development)
After installation of the filter press, fresh water consumption was reduced mainly due to the
improvements in the efficiency of the treatment system and the recovery of the water present
in the sludge.
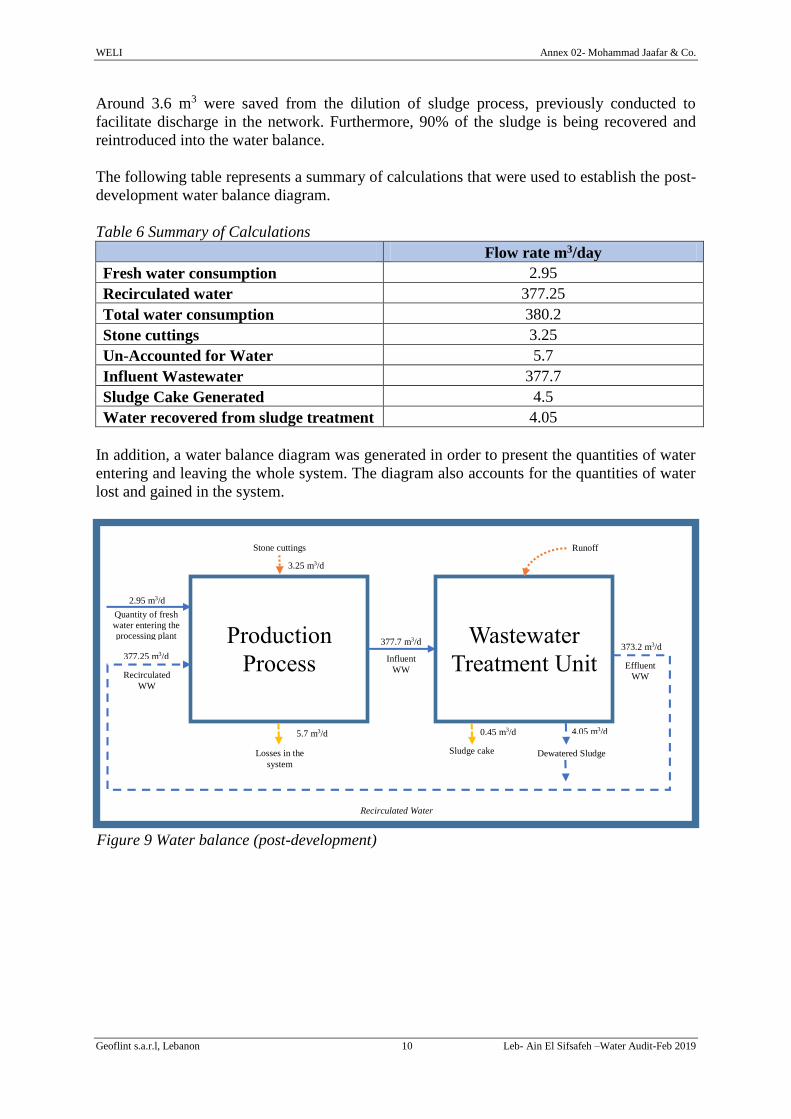
WELI Annex 02- Mohammad Jaafar & Co.
Geoflint s.a.r.l, Lebanon 10 Leb- Ain El Sifsafeh –Water Audit-Feb 2019
Around 3.6 m3 were saved from the dilution of sludge process, previously conducted to
facilitate discharge in the network. Furthermore, 90% of the sludge is being recovered and
reintroduced into the water balance.
The following table represents a summary of calculations that were used to establish the post-
development water balance diagram.
Table 6 Summary of Calculations
Flow rate m3/day
Fresh water consumption 2.95
Recirculated water 377.25
Total water consumption 380.2
Stone cuttings 3.25
Un-Accounted for Water 5.7
Influent Wastewater 377.7
Sludge Cake Generated 4.5
Water recovered from sludge treatment 4.05
In addition, a water balance diagram was generated in order to present the quantities of water
entering and leaving the whole system. The diagram also accounts for the quantities of water
lost and gained in the system.
Production
Process
Wastewater
Treatment Unit
Quantity of fresh
water entering the
processing plant
Influent
WW
Losses in the
system
Effluent
WW Recirculated
WW
Stone cuttings
Recirculated Water
Runoff
3.25 m3/d
2.95 m3/d
Dewatered Sludge
4.05 m3/d
373.2 m3/d 377.7 m3/d
377.25 m3/d
Figure 9 Water balance (post-development)
5.7 m3/d
Sludge cake
0.45 m3/d
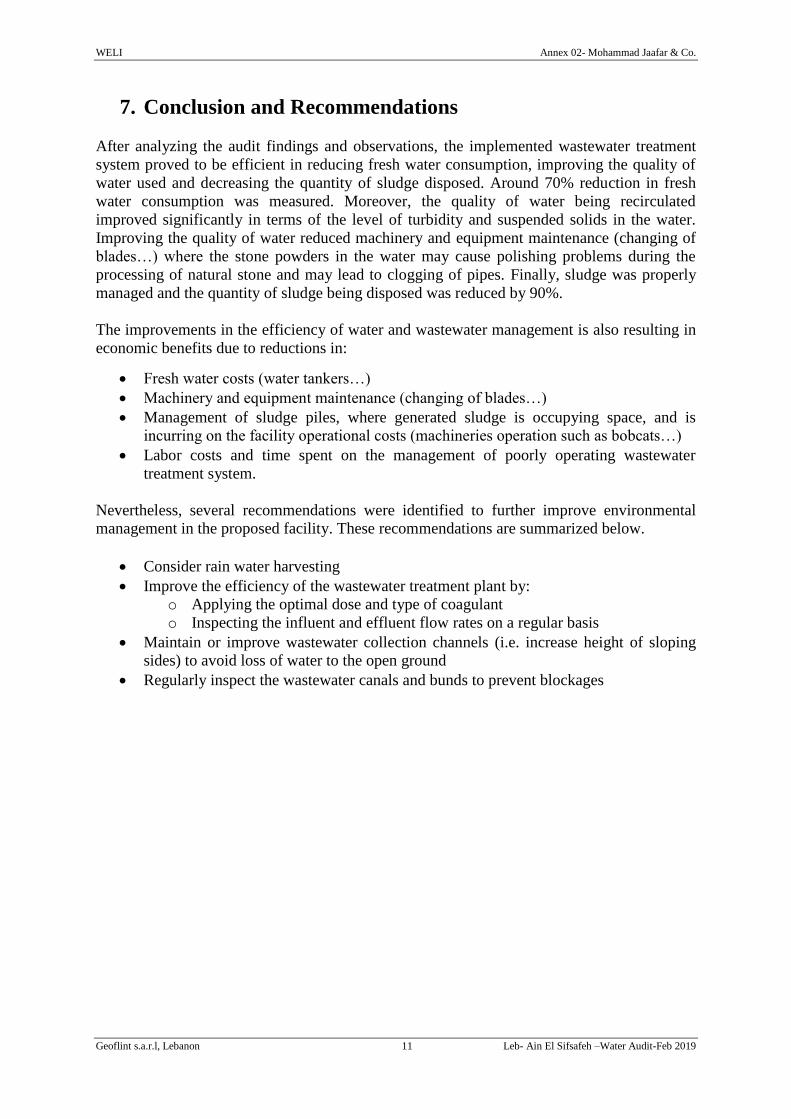
WELI Annex 02- Mohammad Jaafar & Co.
Geoflint s.a.r.l, Lebanon 11 Leb- Ain El Sifsafeh –Water Audit-Feb 2019
7. Conclusion and Recommendations
After analyzing the audit findings and observations, the implemented wastewater treatment
system proved to be efficient in reducing fresh water consumption, improving the quality of
water used and decreasing the quantity of sludge disposed. Around 70% reduction in fresh
water consumption was measured. Moreover, the quality of water being recirculated
improved significantly in terms of the level of turbidity and suspended solids in the water.
Improving the quality of water reduced machinery and equipment maintenance (changing of
blades…) where the stone powders in the water may cause polishing problems during the
processing of natural stone and may lead to clogging of pipes. Finally, sludge was properly
managed and the quantity of sludge being disposed was reduced by 90%.
The improvements in the efficiency of water and wastewater management is also resulting in
economic benefits due to reductions in:
Fresh water costs (water tankers…)
Machinery and equipment maintenance (changing of blades…)
Management of sludge piles, where generated sludge is occupying space, and is
incurring on the facility operational costs (machineries operation such as bobcats…)
Labor costs and time spent on the management of poorly operating wastewater
treatment system.
Nevertheless, several recommendations were identified to further improve environmental
management in the proposed facility. These recommendations are summarized below.
Consider rain water harvesting
Improve the efficiency of the wastewater treatment plant by:
o Applying the optimal dose and type of coagulant
o Inspecting the influent and effluent flow rates on a regular basis
Maintain or improve wastewater collection channels (i.e. increase height of sloping
sides) to avoid loss of water to the open ground
Regularly inspect the wastewater canals and bunds to prevent blockages
WELI Annex 02- Mohammad Jaafar & Co.
Geoflint s.a.r.l, Lebanon 12 Leb- Ain El Sifsafeh –Water Audit-Feb 2019
8. References
Ersoy, B., Tosun, I., Günay, A., & Dikmen, S. (2009). Turbidity removal from wastewaters
of natural stone processing by coagulation/flocculation methods. CLEAN–Soil, Air,
Water, 37(3), 225-232.
Sadler, B. (1988) The evaluation of assessment: post-EIS research and process
development, in: P. Wathern (Ed) Environmental Impact Assessment: Theory and
Practice (London, Unwin Hyman).
Taşdemir, T., & Kurama, H. (2013). Fine particle removal from natural stone processing
effluent by flocculation. Environmental Progress & Sustainable Energy, 32(2), 317-324.

ANNEX 03
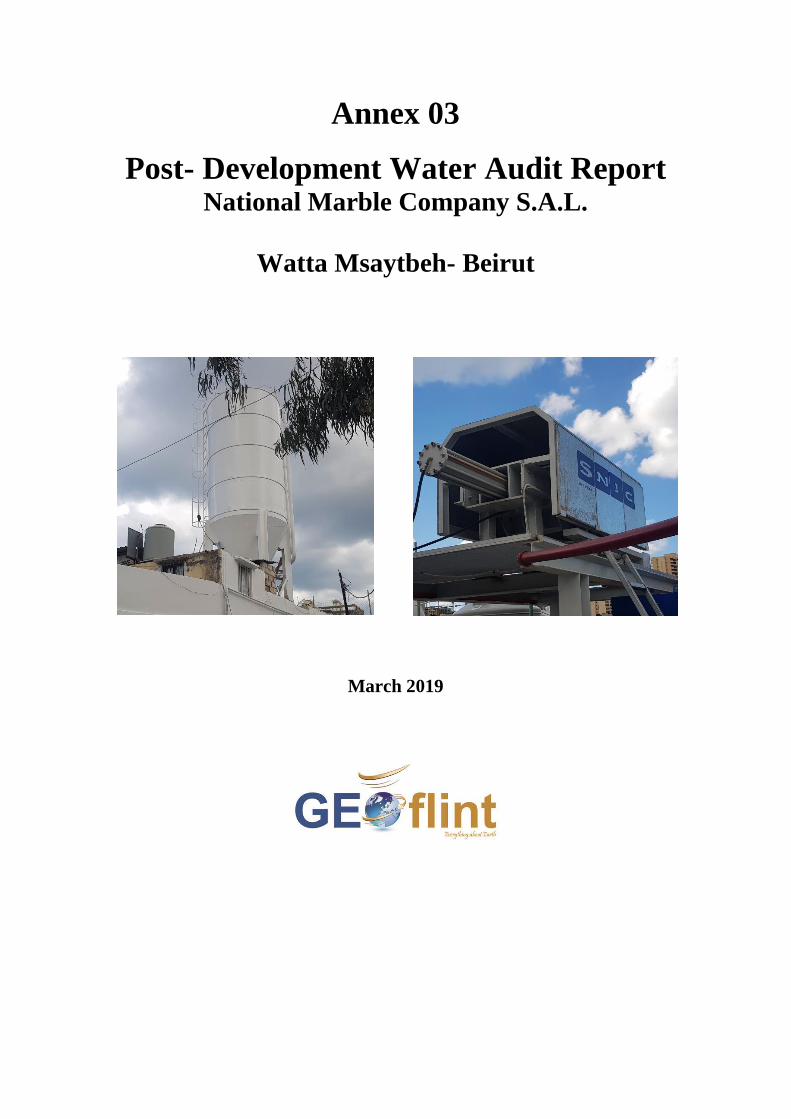
Annex 03
Post- Development Water Audit Report National Marble Company S.A.L.
Watta Msaytbeh- Beirut
March 2019
WELI Annex 03- National Marble Company SAL
Geoflint s.a.r.l, Lebanon 2 Leb- Watta Msaytbeh –Water Audit-April 2018
Table of Contents
1. Background Information .................................................................................................... 3 2. Introduction ........................................................................................................................ 6 3. Scope of Work ................................................................................................................... 6
4. Summary of Water Audit in the Pre-Development Phase ................................................. 6 5. Developed Improvements in Wastewater Management Systems ...................................... 8 6. Water Balance (Post- Development) ............................................................................... 11 7. Conclusion and Recommendations .................................................................................. 12 8. References ........................................................................................................................ 14
List of Figures
Figure 1 Major audit results ....................................................................................................... 4
Figure 4-1Water balance (pre-development audit-April 2018) ................................................. 7
Figure 5-1 Schematic flowchart of the wastewater management system .................................. 8 Figure 5-2 Settlement pond (1) .................................................................................................. 9
Figure 5-3 Settlement pond (2) .................................................................................................. 9 Figure 5-4 Schematic drawing of the installed settlement silo ................................................ 10 Figure 5-5 Installed settlement silo at National Marble Company .......................................... 10 Figure 5-6 Installed filter press ................................................................................................ 11
Figure 6-1Water balance (Post-development- January 2019) ................................................. 12
List of Tables
Table 1-1General Information ................................................................................................... 5 Table 4-1 General information about the audited facility .......................................................... 7
Table 4-2 Pre-development audit findings ................................................................................. 7
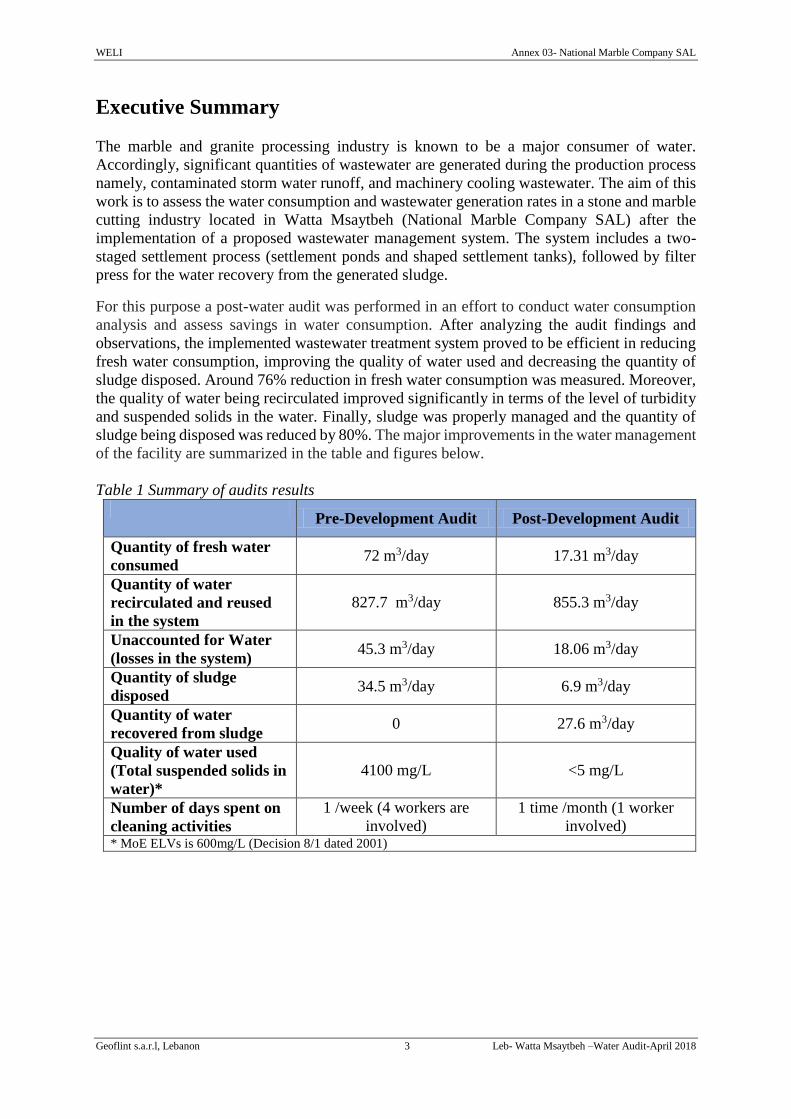
WELI Annex 03- National Marble Company SAL
Geoflint s.a.r.l, Lebanon 3 Leb- Watta Msaytbeh –Water Audit-April 2018
Executive Summary
The marble and granite processing industry is known to be a major consumer of water.
Accordingly, significant quantities of wastewater are generated during the production process
namely, contaminated storm water runoff, and machinery cooling wastewater. The aim of this
work is to assess the water consumption and wastewater generation rates in a stone and marble
cutting industry located in Watta Msaytbeh (National Marble Company SAL) after the
implementation of a proposed wastewater management system. The system includes a two-
staged settlement process (settlement ponds and shaped settlement tanks), followed by filter
press for the water recovery from the generated sludge.
For this purpose a post-water audit was performed in an effort to conduct water consumption
analysis and assess savings in water consumption. After analyzing the audit findings and
observations, the implemented wastewater treatment system proved to be efficient in reducing
fresh water consumption, improving the quality of water used and decreasing the quantity of
sludge disposed. Around 76% reduction in fresh water consumption was measured. Moreover,
the quality of water being recirculated improved significantly in terms of the level of turbidity
and suspended solids in the water. Finally, sludge was properly managed and the quantity of
sludge being disposed was reduced by 80%. The major improvements in the water management
of the facility are summarized in the table and figures below.
Table 1 Summary of audits results
Pre-Development Audit Post-Development Audit
Quantity of fresh water
consumed 72 m3/day 17.31 m3/day
Quantity of water
recirculated and reused
in the system
827.7 m3/day 855.3 m3/day
Unaccounted for Water
(losses in the system) 45.3 m3/day 18.06 m3/day
Quantity of sludge
disposed 34.5 m3/day 6.9 m3/day
Quantity of water
recovered from sludge 0 27.6 m3/day
Quality of water used
(Total suspended solids in
water)*
4100 mg/L <5 mg/L
Number of days spent on
cleaning activities
1 /week (4 workers are
involved)
1 time /month (1 worker
involved) * MoE ELVs is 600mg/L (Decision 8/1 dated 2001)
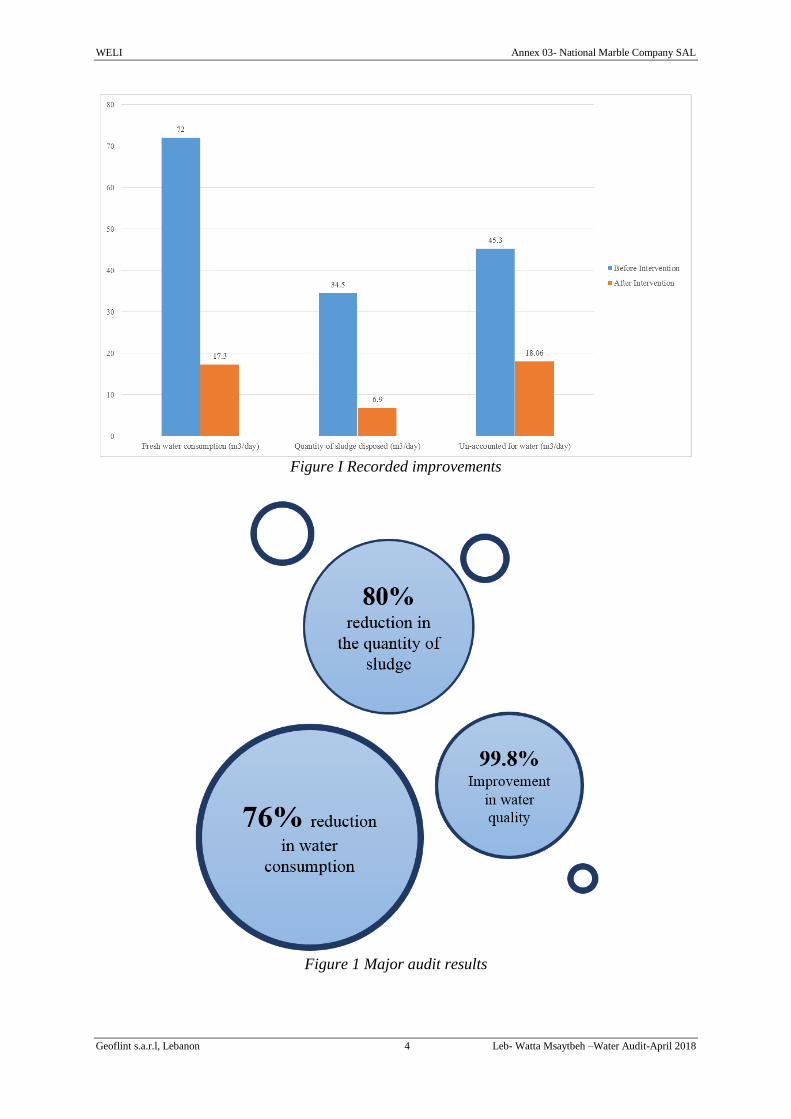
WELI Annex 03- National Marble Company SAL
Geoflint s.a.r.l, Lebanon 4 Leb- Watta Msaytbeh –Water Audit-April 2018
Figure I Recorded improvements
Figure 1 Major audit results
WELI Annex 03- National Marble Company SAL
Geoflint s.a.r.l, Lebanon 5 Leb- Watta Msaytbeh –Water Audit-April 2018
1. Background Information
This section of the audit outlines the facility’s name and details, audit date, and auditor’s
information.
Table 1-1General Information
Company Information
Name National Marble Company SAL
Address
Geographic Location
Phone Number
Company Contact Person
Name
Position
Phone Number
Environmental Consulting Firm
Compiler of the report Geoflint s.a.r.l
Audit team
Khalil Zein, Environmental Auditor
Nour Mucharafieh, Environmental Auditor (conducted the
audit)
Audit time frame The audits were conducted during the period of November
2017 to April 2019.
Audit limitations
Time constraints.
Uncertainty in measurements procedures.
Lack of records and data related to water consumption
and wastewater generation. .
Brief Description of the Study Methodology
Sampling and measurements
Quantitative/Qualitative assessments of major inputs and
outputs at different stages of the production processing have
been conducted, namely to:
Water consumption (m3/ year)
Solid waste quantity- mainly sludge (tons/year)
Wastewater treatment unit: efficiency
WELI Annex 03- National Marble Company SAL
Geoflint s.a.r.l, Lebanon 6 Leb- Watta Msaytbeh –Water Audit-Jan.2019
2. Introduction
Marble and granite processing industry is known to be a major consumer of water. Significant
quantities of water are consumed to cool the saws during the production process and to polish
the final product. Accordingly, significant quantities of wastewater is generated during the
production process namely, contaminated storm water runoff, and machinery cooling
wastewater. Major environmental concerns are associated with the generated wastewater
considering its high alkalinity, and high levels of Total Suspended Solids (TSS). Fine particles
(<0.2 mm) are generated during the cutting and polishing processes, where around 25-40% of
the weight of the block is produced as fine particles during the cutting process. Thus, large
amounts of water is used to capture the produced particles (Taşdemir, Kurama, 2013). In
general, wastewater is treated by simple solid–liquid separation and is then reused in the
process. If the turbidity of the reused water is higher than acceptable values, the stone powders
in the water may cause polishing problems during the processing of natural stone and may lead
to clogging of pipes. Consequently, the maximum (residual) turbidity of the clean water should
be less than 15 Nephelometric Turbidity Units (NTU) (Ersoy, Tosun, et al., 2009).
Moreover, if the generated wastewater is not managed properly, it would negatively affect the
physical, biological and chemical characteristics of both the local water and soil quality,
resulting in inevitable implications on both the environment and the public health. In this
context, a water audit was conducted for the marble and granite processing facility in Watta
Msaytbeh (National Marble Company SAL) in order to assess the water consumption within
the facility and to identify opportunities to improve water use efficiency.
This audited facility is of Category I as the wastewater management system requires the
installation of a shaped sedimentation tank (settlement silo) and a filter press for the
management of sludge.
3. Scope of Work
The aim of this post development audit is to compare the impacts of water consumption that
were assessed in the environmental audit conducted prior to project implementation with those
that actually arose after the implementation of the proposed interventions. Post-development
audit has an important role in improving the future performance and utility of the project.
Moreover, this process of comparing predictions versus actual or reflective assessment is of
great importance to sustainability of projects (Sadler, 1988).
This work will assess water consumption and wastewater generation rates after the
implementation of the wastewater management systems. For this purpose a post-water audit
was performed in an effort to conduct water consumption analysis and assess savings in water
consumption.
4. Summary of Water Audit in the Pre-Development Phase
The table below summarizes general information and description of the audited facility. These
data were provided by the manager of the audited facility during the initial site visit.
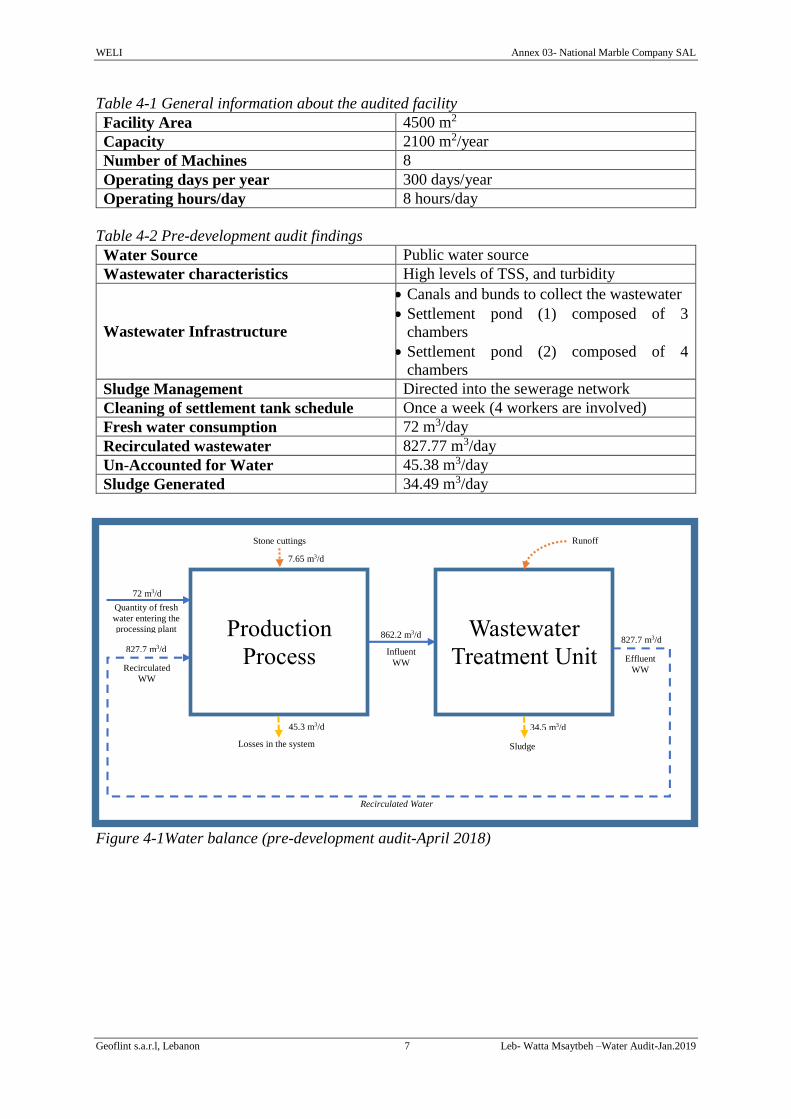
WELI Annex 03- National Marble Company SAL
Geoflint s.a.r.l, Lebanon 7 Leb- Watta Msaytbeh –Water Audit-Jan.2019
Table 4-1 General information about the audited facility
Facility Area 4500 m2
Capacity 2100 m2/year
Number of Machines 8
Operating days per year 300 days/year
Operating hours/day 8 hours/day
Table 4-2 Pre-development audit findings
Water Source Public water source
Wastewater characteristics High levels of TSS, and turbidity
Wastewater Infrastructure
Canals and bunds to collect the wastewater
Settlement pond (1) composed of 3
chambers
Settlement pond (2) composed of 4
chambers
Sludge Management Directed into the sewerage network
Cleaning of settlement tank schedule Once a week (4 workers are involved)
Fresh water consumption 72 m3/day
Recirculated wastewater 827.77 m3/day
Un-Accounted for Water 45.38 m3/day
Sludge Generated 34.49 m3/day
Figure 4-1Water balance (pre-development audit-April 2018)
Production
Process
Wastewater
Treatment Unit
Quantity of fresh
water entering the
processing plant
Influent
WW
Losses in the system
Effluent
WW Recirculated
WW
Stone cuttings
Recirculated Water
Runoff
7.65 m3/d
72 m3/d
Sludge
34.5 m3/d
827.7 m3/d 862.2 m3/d
827.7 m3/d
45.3 m3/d
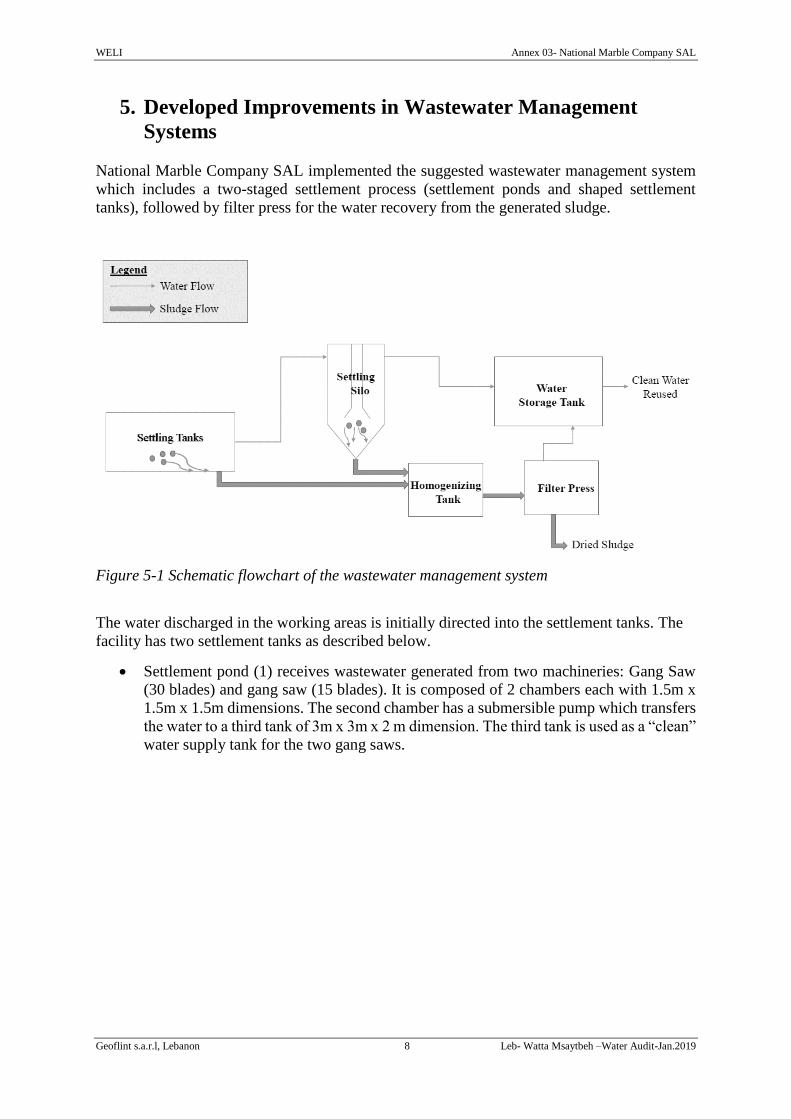
WELI Annex 03- National Marble Company SAL
Geoflint s.a.r.l, Lebanon 8 Leb- Watta Msaytbeh –Water Audit-Jan.2019
5. Developed Improvements in Wastewater Management
Systems
National Marble Company SAL implemented the suggested wastewater management system
which includes a two-staged settlement process (settlement ponds and shaped settlement
tanks), followed by filter press for the water recovery from the generated sludge.
Figure 5-1 Schematic flowchart of the wastewater management system
The water discharged in the working areas is initially directed into the settlement tanks. The
facility has two settlement tanks as described below.
Settlement pond (1) receives wastewater generated from two machineries: Gang Saw
(30 blades) and gang saw (15 blades). It is composed of 2 chambers each with 1.5m x
1.5m x 1.5m dimensions. The second chamber has a submersible pump which transfers
the water to a third tank of 3m x 3m x 2 m dimension. The third tank is used as a “clean”
water supply tank for the two gang saws.
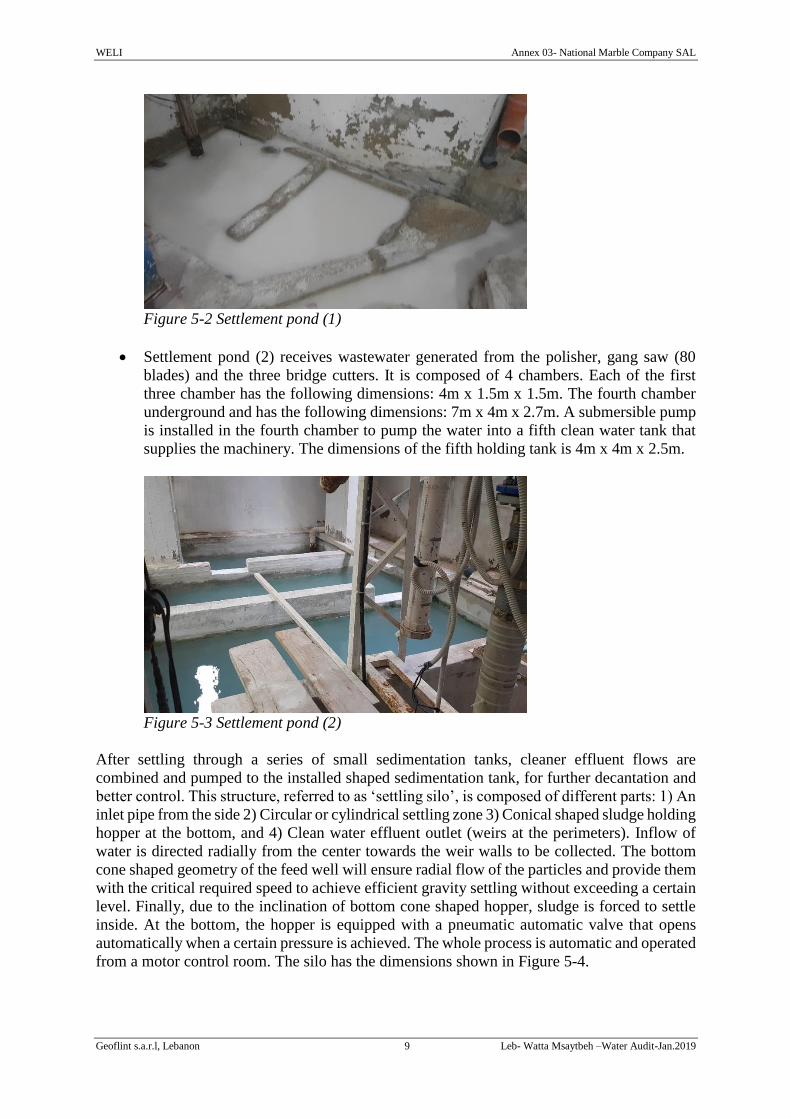
WELI Annex 03- National Marble Company SAL
Geoflint s.a.r.l, Lebanon 9 Leb- Watta Msaytbeh –Water Audit-Jan.2019
Figure 5-2 Settlement pond (1)
Settlement pond (2) receives wastewater generated from the polisher, gang saw (80
blades) and the three bridge cutters. It is composed of 4 chambers. Each of the first
three chamber has the following dimensions: 4m x 1.5m x 1.5m. The fourth chamber
underground and has the following dimensions: 7m x 4m x 2.7m. A submersible pump
is installed in the fourth chamber to pump the water into a fifth clean water tank that
supplies the machinery. The dimensions of the fifth holding tank is 4m x 4m x 2.5m.
Figure 5-3 Settlement pond (2)
After settling through a series of small sedimentation tanks, cleaner effluent flows are
combined and pumped to the installed shaped sedimentation tank, for further decantation and
better control. This structure, referred to as ‘settling silo’, is composed of different parts: 1) An
inlet pipe from the side 2) Circular or cylindrical settling zone 3) Conical shaped sludge holding
hopper at the bottom, and 4) Clean water effluent outlet (weirs at the perimeters). Inflow of
water is directed radially from the center towards the weir walls to be collected. The bottom
cone shaped geometry of the feed well will ensure radial flow of the particles and provide them
with the critical required speed to achieve efficient gravity settling without exceeding a certain
level. Finally, due to the inclination of bottom cone shaped hopper, sludge is forced to settle
inside. At the bottom, the hopper is equipped with a pneumatic automatic valve that opens
automatically when a certain pressure is achieved. The whole process is automatic and operated
from a motor control room. The silo has the dimensions shown in Figure 5-4.
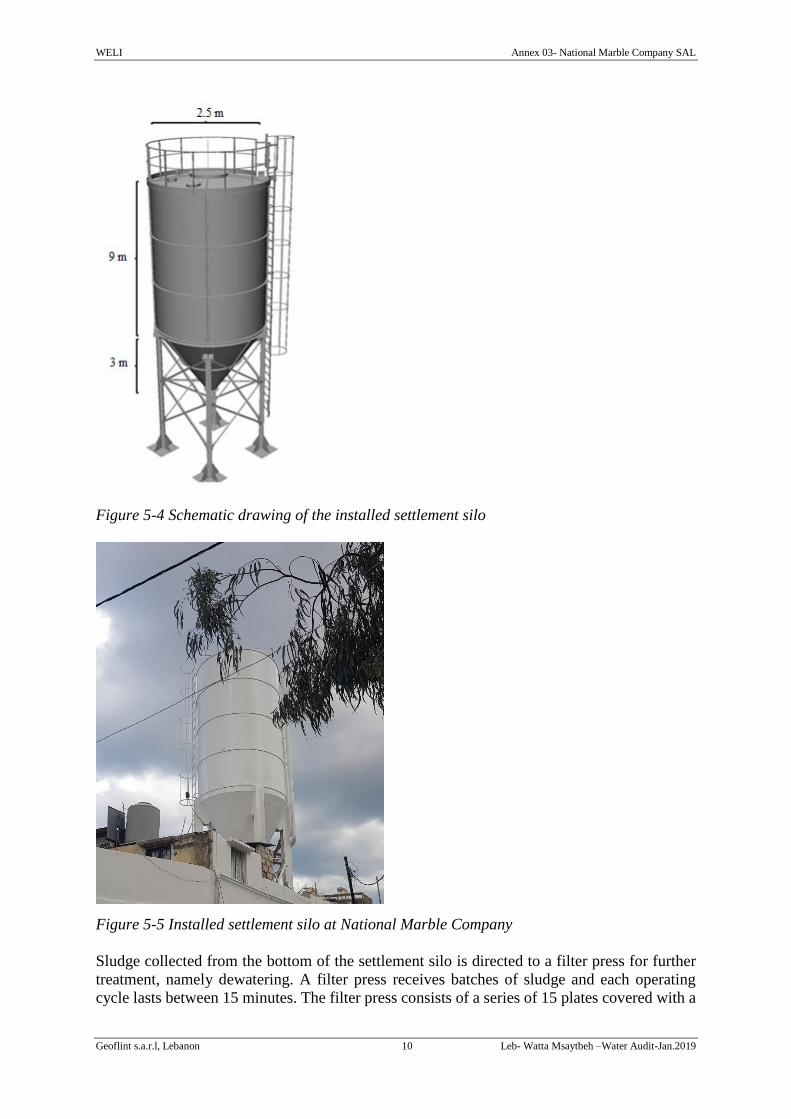
WELI Annex 03- National Marble Company SAL
Geoflint s.a.r.l, Lebanon 10 Leb- Watta Msaytbeh –Water Audit-Jan.2019
Figure 5-4 Schematic drawing of the installed settlement silo
Figure 5-5 Installed settlement silo at National Marble Company
Sludge collected from the bottom of the settlement silo is directed to a filter press for further
treatment, namely dewatering. A filter press receives batches of sludge and each operating
cycle lasts between 15 minutes. The filter press consists of a series of 15 plates covered with a
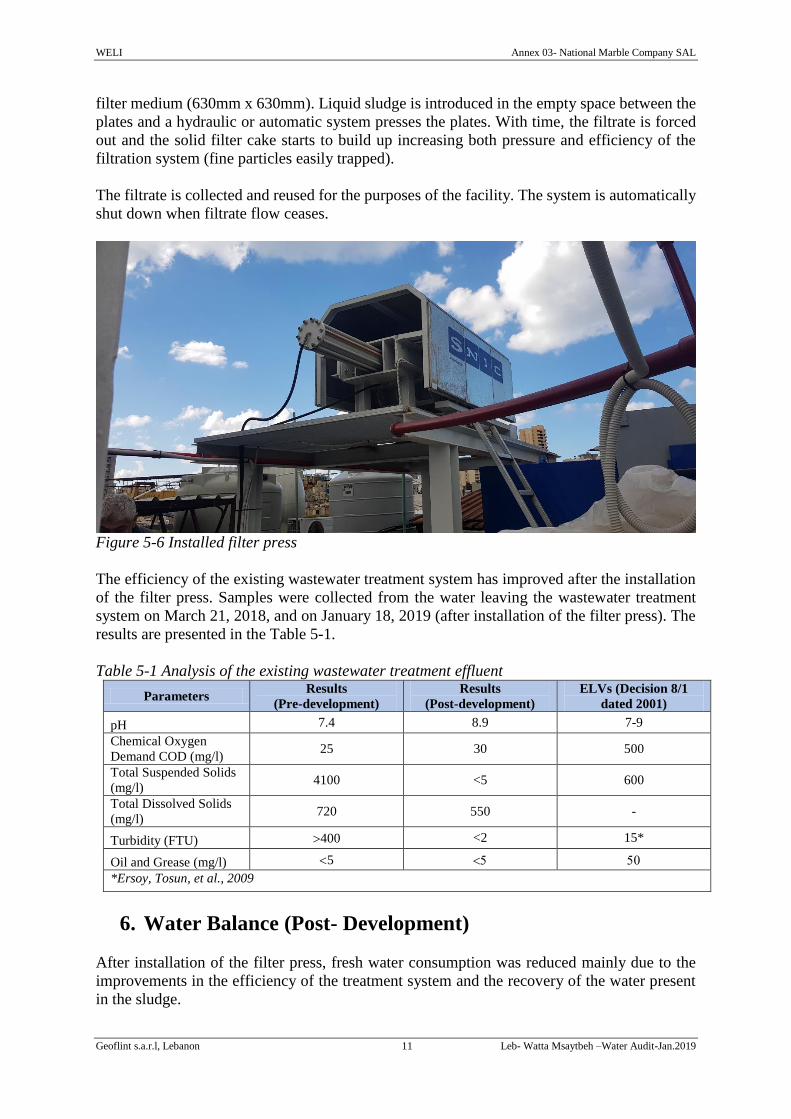
WELI Annex 03- National Marble Company SAL
Geoflint s.a.r.l, Lebanon 11 Leb- Watta Msaytbeh –Water Audit-Jan.2019
filter medium (630mm x 630mm). Liquid sludge is introduced in the empty space between the
plates and a hydraulic or automatic system presses the plates. With time, the filtrate is forced
out and the solid filter cake starts to build up increasing both pressure and efficiency of the
filtration system (fine particles easily trapped).
The filtrate is collected and reused for the purposes of the facility. The system is automatically
shut down when filtrate flow ceases.
Figure 5-6 Installed filter press
The efficiency of the existing wastewater treatment system has improved after the installation
of the filter press. Samples were collected from the water leaving the wastewater treatment
system on March 21, 2018, and on January 18, 2019 (after installation of the filter press). The
results are presented in the Table 5-1.
Table 5-1 Analysis of the existing wastewater treatment effluent
Parameters Results
(Pre-development)
Results
(Post-development)
ELVs (Decision 8/1
dated 2001)
pH 7.4 8.9 7-9
Chemical Oxygen
Demand COD (mg/l) 25 30 500
Total Suspended Solids
(mg/l) 4100 <5 600
Total Dissolved Solids
(mg/l) 720 550 -
Turbidity (FTU) 400 <2 15*
Oil and Grease (mg/l) 5
*Ersoy, Tosun, et al., 2009
6. Water Balance (Post- Development)
After installation of the filter press, fresh water consumption was reduced mainly due to the
improvements in the efficiency of the treatment system and the recovery of the water present
in the sludge.
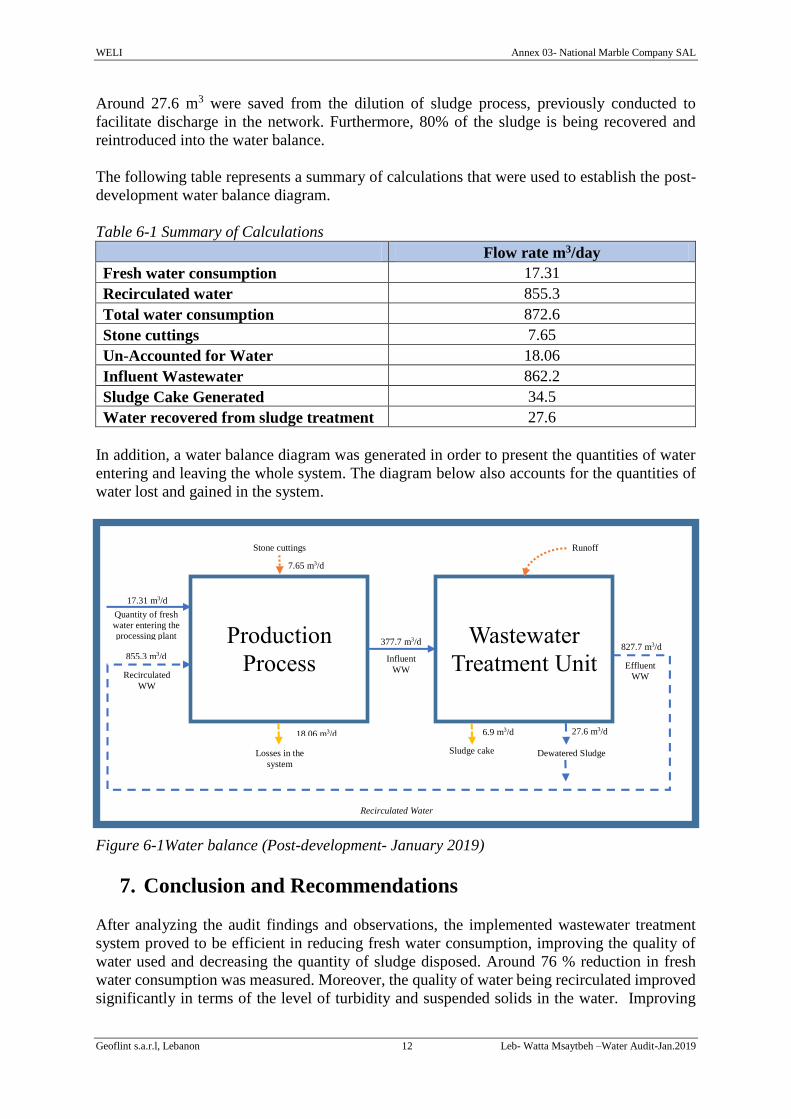
WELI Annex 03- National Marble Company SAL
Geoflint s.a.r.l, Lebanon 12 Leb- Watta Msaytbeh –Water Audit-Jan.2019
Around 27.6 m3 were saved from the dilution of sludge process, previously conducted to
facilitate discharge in the network. Furthermore, 80% of the sludge is being recovered and
reintroduced into the water balance.
The following table represents a summary of calculations that were used to establish the post-
development water balance diagram.
Table 6-1 Summary of Calculations
Flow rate m3/day
Fresh water consumption 17.31
Recirculated water 855.3
Total water consumption 872.6
Stone cuttings 7.65
Un-Accounted for Water 18.06
Influent Wastewater 862.2
Sludge Cake Generated 34.5
Water recovered from sludge treatment 27.6
In addition, a water balance diagram was generated in order to present the quantities of water
entering and leaving the whole system. The diagram below also accounts for the quantities of
water lost and gained in the system.
Figure 6-1Water balance (Post-development- January 2019)
7. Conclusion and Recommendations
After analyzing the audit findings and observations, the implemented wastewater treatment
system proved to be efficient in reducing fresh water consumption, improving the quality of
water used and decreasing the quantity of sludge disposed. Around 76 % reduction in fresh
water consumption was measured. Moreover, the quality of water being recirculated improved
significantly in terms of the level of turbidity and suspended solids in the water. Improving
Production
Process
Wastewater
Treatment Unit
Quantity of fresh
water entering the
processing plant
Influent
WW
Losses in the
system
Effluent
WW Recirculated
WW
Stone cuttings
Recirculated Water
Runoff
7.65 m3/d
17.31 m3/d
Dewatered Sludge
27.6 m3/d
827.7 m3/d 377.7 m3/d
855.3 m3/d
18.06 m3/d
Sludge cake
6.9 m3/d
WELI Annex 03- National Marble Company SAL
Geoflint s.a.r.l, Lebanon 13 Leb- Watta Msaytbeh –Water Audit-Jan.2019
the quality of water reduced machinery and equipment maintenance (changing of blades…)
where the stone powders in the water may cause polishing problems during the processing of
natural stone and may lead to clogging of pipes. Finally, sludge was properly managed and the
quantity of sludge being disposed was reduced by 80%.
The improvements in the efficiency of water and wastewater management is also resulting in
economic benefits due to reductions in:
Fresh water costs (water tankers…)
Machinery and equipment maintenance (changing of blades…)
Management of sludge piles, where generated sludge is occupying space, and is
incurring on the facility operational costs (machineries operation such as bobcats…)
Labor costs and time spent on the management of poorly operating wastewater
treatment system.
Nevertheless, several recommendations were identified to further improve environmental
management in the proposed facility. These recommendations are summarized below.
Consider rain water harvesting
Improve the efficiency of the wastewater treatment plant by:
o Applying the optimal dose and type of coagulant
o Inspecting the influent and effluent flow rates on a regular basis
Maintain or improve wastewater collection channels (i.e. increase height of sloping
sides) to avoid loss of water to the open ground
Regularly inspect the wastewater canals and bunds to prevent blockages
WELI Annex 03- National Marble Company SAL
Geoflint s.a.r.l, Lebanon 14 Leb- Watta Msaytbeh –Water Audit-Jan.2019
8. References
Sadler, B. (1988) The evaluation of assessment: post-EIS research and process development,
in: P. Wathern (Ed) Environmental Impact Assessment: Theory and Practice (London, Unwin
Hyman).

ANNEX 04
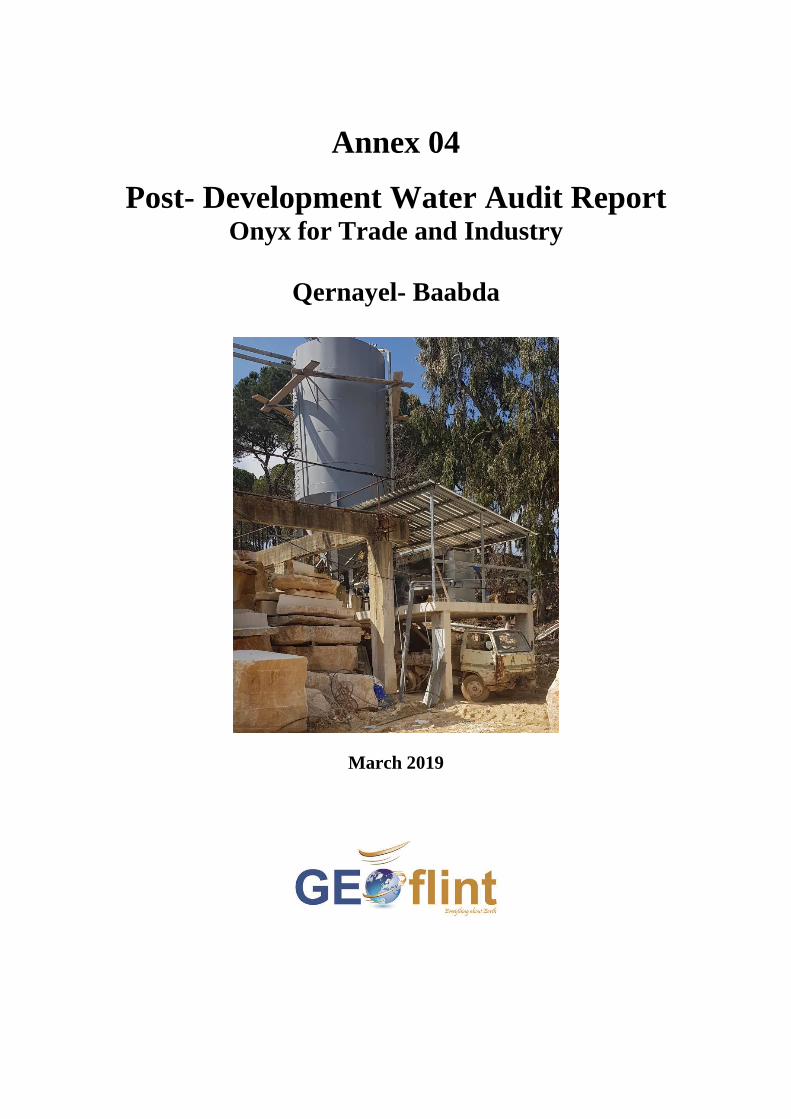
Annex 04
Post- Development Water Audit Report Onyx for Trade and Industry
Qernayel- Baabda
March 2019
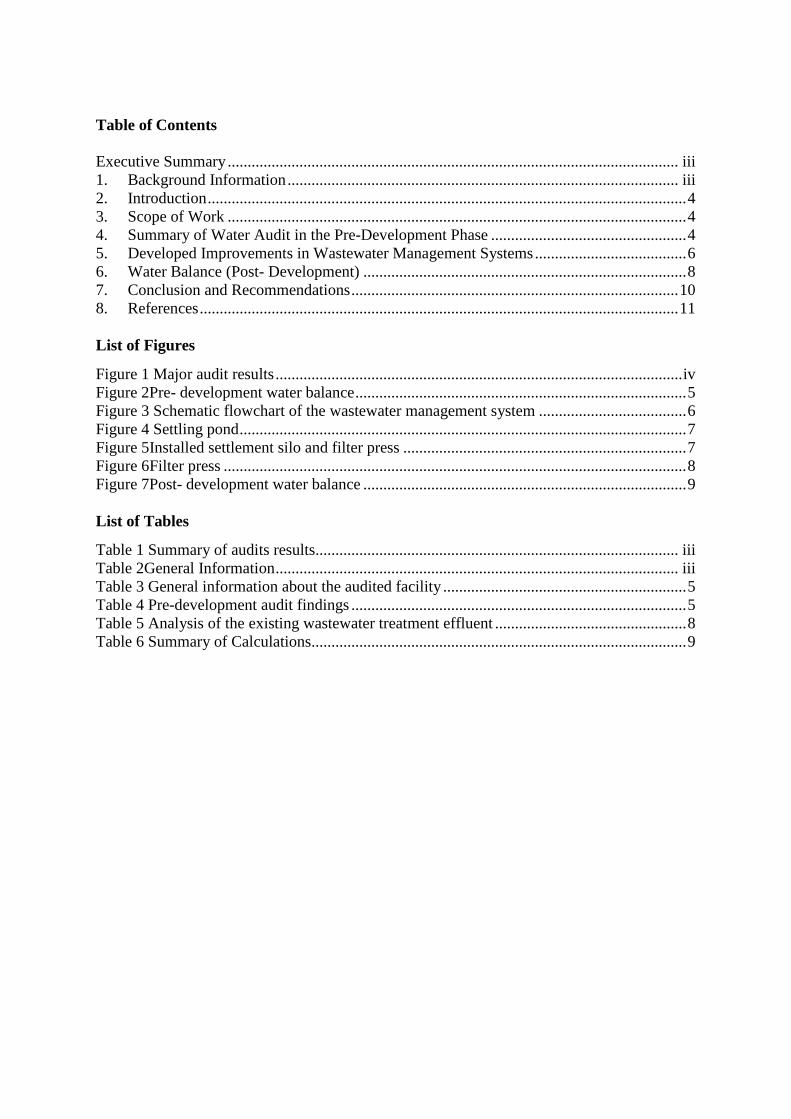
Table of Contents
Executive Summary ................................................................................................................. iii 1. Background Information .................................................................................................. iii 2. Introduction ........................................................................................................................ 4 3. Scope of Work ................................................................................................................... 4
4. Summary of Water Audit in the Pre-Development Phase ................................................. 4 5. Developed Improvements in Wastewater Management Systems ...................................... 6 6. Water Balance (Post- Development) ................................................................................. 8 7. Conclusion and Recommendations .................................................................................. 10 8. References ........................................................................................................................ 11
List of Figures
Figure 1 Major audit results ...................................................................................................... iv Figure 2Pre- development water balance ................................................................................... 5 Figure 3 Schematic flowchart of the wastewater management system ..................................... 6 Figure 4 Settling pond ................................................................................................................ 7
Figure 5Installed settlement silo and filter press ....................................................................... 7
Figure 6Filter press .................................................................................................................... 8 Figure 7Post- development water balance ................................................................................. 9
List of Tables
Table 1 Summary of audits results........................................................................................... iii Table 2General Information ..................................................................................................... iii
Table 3 General information about the audited facility ............................................................. 5 Table 4 Pre-development audit findings .................................................................................... 5
Table 5 Analysis of the existing wastewater treatment effluent ................................................ 8 Table 6 Summary of Calculations.............................................................................................. 9

WELI Annex 04- Onyx for Trade and Industry
Geoflint s.a.r.l, Lebanon iii Leb- Qernayel –Water Audit-March 2019
Executive Summary
The marble and granite processing industry is known to be a major consumer of water.
Accordingly, significant quantities of wastewater are generated during the production process
namely, contaminated storm water runoff, and machinery cooling wastewater. The aim of this
work is to assess the water consumption and wastewater generation rates in a stone and
marble cutting industry located in Qernayel (Onyx for Trade and Industry) after the
implementation of a suggested wastewater management system. The system includes a two-
staged settlement process (settlement ponds and shaped settlement tanks), followed by filter
press for the water recovery from the generated sludge.
For this purpose a post-water audit was performed in an effort to conduct water consumption
analysis and assess savings in water consumption. After analyzing the audit findings and
observations, the implemented wastewater treatment system proved to be efficient in
reducing fresh water consumption, improving the quality of water used and decreasing the
quantity of sludge disposed. Around 73% reduction in fresh water consumption was
measured. Moreover, the quality of water being recirculated improved significantly in terms
of the level of turbidity and suspended solids in the water. Finally, sludge was properly
managed and the quantity of sludge being disposed was reduced by 92%.
The major improvements in the water management of the facility are summarized in the table
and figures below.
Table 1 Summary of audits results
Pre-Development Audit Post-Development Audit
Quantity of fresh water
consumed 15 m3/day 4 m3/day
Quantity of water recirculated
and reused in the system 626.4 m3/day 631.87 m3/day
Unaccounted for Water (losses
in the system) 14.45 m3/day 8.62 m3/day
Quantity of sludge disposed 6 m3/day 0.53 m3/day
Quantity of water recovered
from sludge 0 5.47 m3/day
Quality of water used (Total
suspended solids in water)* 31500 mg/l 670 mg/l
Number of hours spent on
cleaning activities 2 hours /day (2 workers involved) 0.14 hours/day (1 worker involved)
* MoE ELVs is 600mg/L (Decision 8/1 dated 2001)
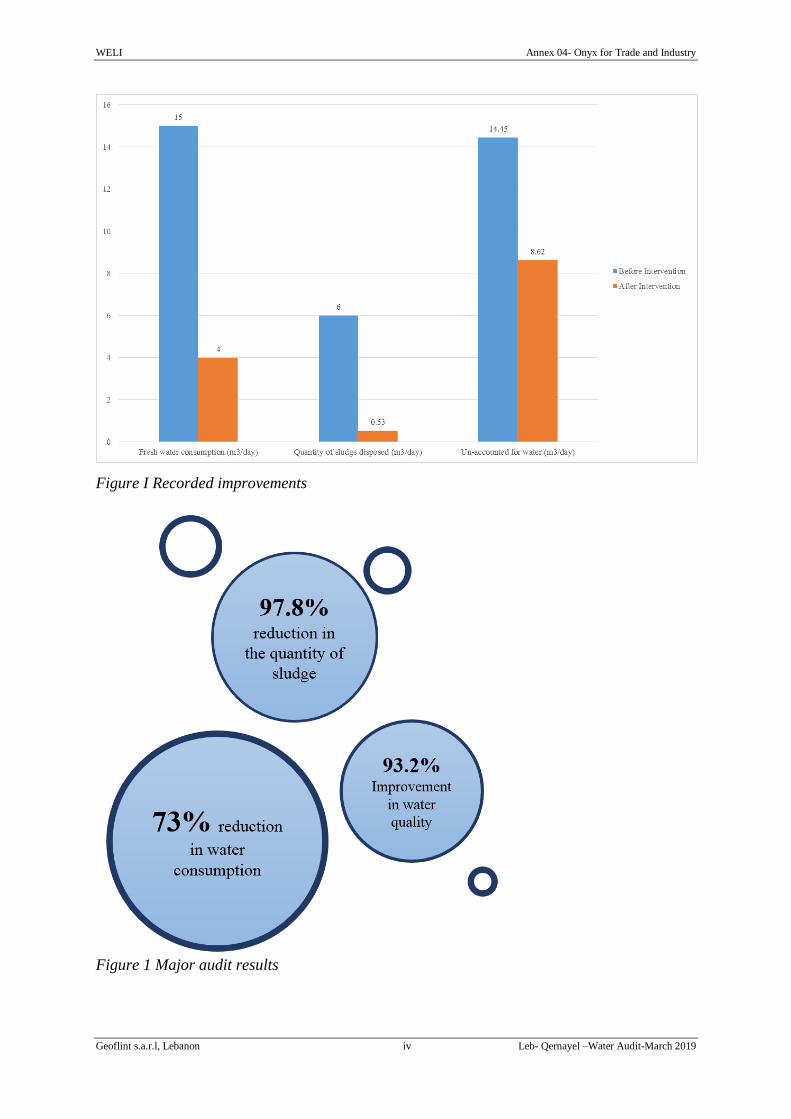
WELI Annex 04- Onyx for Trade and Industry
Geoflint s.a.r.l, Lebanon iv Leb- Qernayel –Water Audit-March 2019
Figure I Recorded improvements
Figure 1 Major audit results
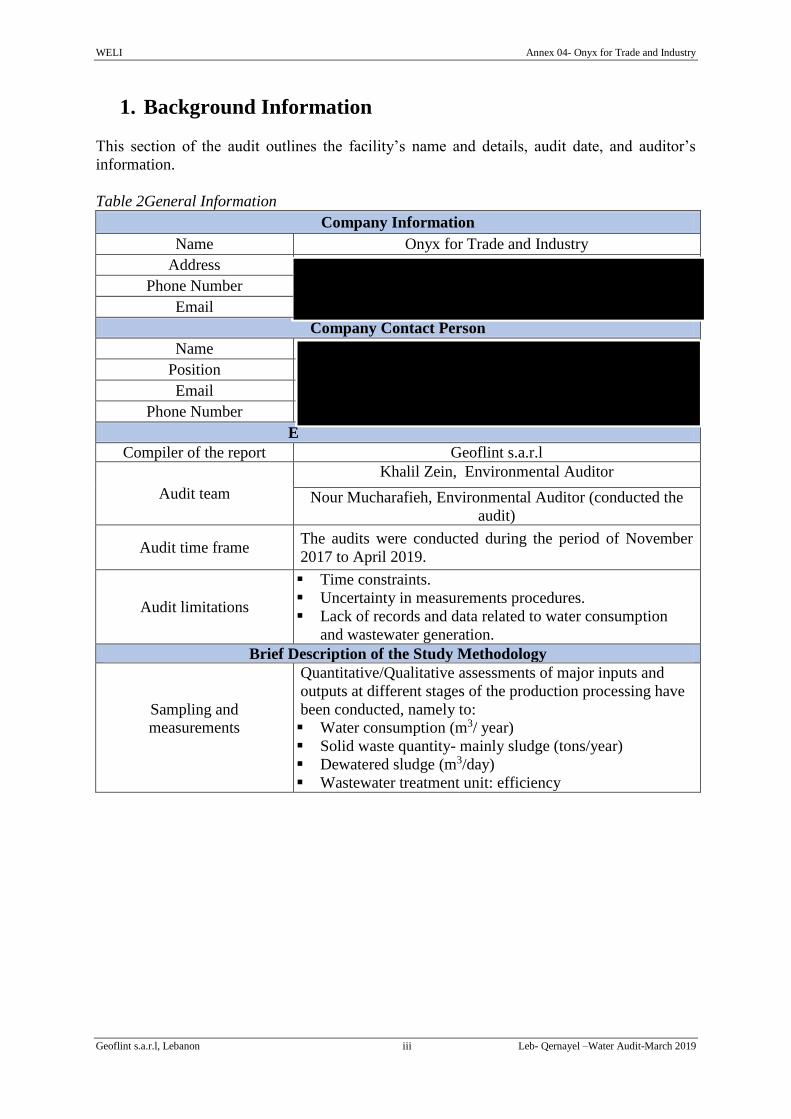
WELI Annex 04- Onyx for Trade and Industry
Geoflint s.a.r.l, Lebanon iii Leb- Qernayel –Water Audit-March 2019
1. Background Information
This section of the audit outlines the facility’s name and details, audit date, and auditor’s
information.
Table 2General Information
Company Information
Name Onyx for Trade and Industry
Address
Phone Number
Company Contact Person
Name
Position
Phone Number
E
Compiler of the report Geoflint s.a.r.l
Audit team
Khalil Zein, Environmental Auditor
Nour Mucharafieh, Environmental Auditor (conducted the
audit)
Audit time frame The audits were conducted during the period of November
2017 to April 2019.
Audit limitations
Time constraints.
Uncertainty in measurements procedures.
Lack of records and data related to water consumption
and wastewater generation.
Brief Description of the Study Methodology
Sampling and
measurements
Quantitative/Qualitative assessments of major inputs and
outputs at different stages of the production processing have
been conducted, namely to:
Water consumption (m3/ year)
Solid waste quantity- mainly sludge (tons/year)
Dewatered sludge (m3/day)
Wastewater treatment unit: efficiency

WELI Annex 04- Onyx for Trade and Industry
Geoflint s.a.r.l, Lebanon 4 Leb- Qernayel –Water Audit-March 2019
2. Introduction
Natural stones (such as marble, granite…etc.) are materials which have been extensively used
for a variety of building applications since ancient times. This reflects the belief that stones
are sustainable and durable material for construction works (Taşdemir, Kurama, 2013).
The marble and granite processing industry is known to be a major consumer of water.
Significant quantities of water are consumed to cool the saws during the production process
and to polish the final product. Accordingly, significant quantities of wastewater is generated
during the production process namely, contaminated storm water runoff, and machinery
cooling wastewater. Major environmental concerns are associated with the generated
wastewater considering its high alkalinity, and high levels of Total Suspended Solids (TSS).
Fine particles (<0.2 mm) are generated during the cutting and polishing processes, where
around 25-40% of the weight of the block is produced as fine particles during the cutting
process. Thus, large amounts of water is used to capture the produced particles (Taşdemir,
Kurama, 2013). In general, wastewater is treated by simple solid–liquid separation and is then
reused in the process. If the turbidity of the reused water is higher than acceptable values, the
stone powders in the water may cause polishing problems during the processing of natural
stone and may lead to clogging of pipes. Consequently, the maximum (residual) turbidity of
the clean water should be less than 15 Nephelometric Turbidity Units (NTU) (Ersoy, Tosun,
et al., 2009).
Moreover, if the generated wastewater is not managed properly, it would negatively affect the
physical, biological and chemical characteristics of both the local water and soil quality,
resulting in inevitable implications on both the environment and the public health. In this
context, a water audit was conducted for the marble and granite processing facility in
Qernayel (Onyx for Trade and Industry) in order to assess the water consumption within the
facility and to identify opportunities to improve water use efficiency.
3. Scope of Work
The aim of this post development audit is to compare the impacts of water consumption that
were assessed in the environmental audit conducted prior to project implementation with
those that actually arose after the implementation of the proposed interventions. Post-
development audit has an important role in improving the future performance and utility of
the project. Moreover, this process of comparing predictions versus actual or reflective
assessment is of great importance to sustainability of projects (Sadler, 1988).
This work will assess water consumption and wastewater generation rates after the
implementation of the wastewater management systems. For this purpose a post-water audit
was performed in an effort to conduct water consumption analysis and assess savings in water
consumption.
4. Summary of Water Audit in the Pre-Development Phase
The table below summarizes general information and description of the audited facility.
These data were provided by the manager of the audited facility during the initial site visit.
WELI Annex 04- Onyx for Trade and Industry
Geoflint s.a.r.l, Lebanon 5 Leb- Qernayel –Water Audit-March 2019
Table 3 General information about the audited facility
Facility Area 8500 m2
Capacity 3000-4000 ton/year
Number of Machines 17
Operating days per year 290-300 days/year
Operating hours/day 8 hours/day
Table 4 Pre-development audit findings
Water Source
Well water and private water tankers during
the summer season
Harvested rainwater during the winter
Wastewater characteristics High levels of TSS, and turbidity
Wastewater Infrastructure
Canals and bunds to collect the wastewater
Settlement pond
Settlement silo
Sludge Management Openly disposed
Cleaning of settlement tank schedule Daily (1-2 workers are involved)
Fresh water consumption 15 m3/day
Recirculated wastewater 626.4 m3/day
Un-Accounted for Water 14.45 m3/day
Sludge Generated 6 m3/day
Figure 2Pre- development water balance
Production
Process
Wastewater
Treatment Unit
Quantity of fresh
water entering the
processing plant
Influent
WW
Losses in the
system
Effluent
WW Recirculated
WW
Stone cuttings
Recirculated Water
Runoff
5.45 m3/d
15 m3/d
Sludge
6 m3/d
626.4 m3/d 632.4 m3/d
626.4 m3/d
14.45 m3/d
WELI Annex 04- Onyx for Trade and Industry
Geoflint s.a.r.l, Lebanon 6 Leb- Qernayel –Water Audit-March 2019
5. Developed Improvements in Wastewater Management
Systems
Onyx for Trade and Industry implemented the suggested wastewater management system
which includes a two-staged settlement process (settlement ponds and shaped settlement
tanks), followed by filter press for the water recovery from the generated sludge. A filter
press was recently installed to recover water from the generated sludge.
Figure 3 Schematic flowchart of the wastewater management system
The treatment of wastewater is done via two steps. The first step is the settling pond where
the heavy particles present in the wastewater are left to settle naturally. After this step the
wastewater is pumped into a cylindrical settling tank where a coagulant (acrylamid) is added,
thus the process of coagulation and flocculation takes place. The structure of the cylindrical
settling tank/silo is designed in a way to enhance the process of flocs settling. The capacity of
the cylindrical settling tank in this audited facility is 70 m3 (Figure 5-4). Finally the treated
wastewater is transferred to a storage tank behind the processing area where it is then reused
in the production process.
WELI Annex 04- Onyx for Trade and Industry
Geoflint s.a.r.l, Lebanon 7 Leb- Qernayel –Water Audit-March 2019
Figure 4 Settling pond
Figure 5Installed settlement silo and filter press
WELI Annex 04- Onyx for Trade and Industry
Geoflint s.a.r.l, Lebanon 8 Leb- Qernayel –Water Audit-March 2019
Figure 6Filter press
Sludge collected from the bottom of the settlement silo is directed to a filter press for further
treatment, namely dewatering. A filter press receives batches of sludge and each operating
cycle lasts around 12 minutes. The filter press consists of a series of 17 plates covered with a
filter medium (800mm x 800mm x 70mm). Liquid sludge is introduced in the empty space
between the plates and a hydraulic or automatic system presses the plates. With time, the
filtrate is forced out and the solid filter cake starts to build up increasing both pressure and
efficiency of the filtration system (fine particles easily trapped). The system is automatically
shut down when filtrate flow ceases.
The efficiency of the existing wastewater treatment system has improved after the installation
of the filter press. Samples were collected from the water leaving the wastewater treatment
system on March 11, 2019. The results are presented in the Table 5-1.
Table 5 Analysis of the existing wastewater treatment effluent
Parameters Results
(Pre-development)
Results
(Post-development)
ELVs (Decision 8/1
dated 2001)
pH 7.9 8.6 7-9
Chemical Oxygen
Demand COD (mg/l) 20 25 500
Total Suspended Solids
(mg/l) 31500 670 600
Total Dissolved Solids
(mg/l) 200 200 -
Turbidity (FTU) >400 350 15*
Oil and Grease (mg/l) <5
*Ersoy, Tosun, et al., 2009
6. Water Balance (Post- Development)
After installation of the filter press, fresh water consumption was reduced mainly due to the
improvements in the efficiency of the treatment system and the recovery of the water present
in the sludge.
WELI Annex 04- Onyx for Trade and Industry
Geoflint s.a.r.l, Lebanon 9 Leb- Qernayel –Water Audit-March 2019
Around 5.47 m3/day were saved from the dilution of sludge process, previously conducted to
facilitate discharge in the network. Furthermore, 91.1 % of the sludge is being recovered and
reintroduced into the water balance.
The following table (Table 5-3) represents a summary of calculations that were used to
establish the post-development water balance diagram.
Table 6 Summary of Calculations
Flow rate m3/day
Fresh water consumption 4
Recirculated water 631.87
Total water consumption 635.87
Stone cuttings 5.45
Un-Accounted for Water 8.92
Influent Wastewater 632.4
Sludge Cake Generated 6
Water recovered from sludge treatment 5.47
In addition, a water balance diagram was generated in order to present the quantities of water
entering and leaving the whole system. The diagram also accounts for the quantities of water
lost and gained in the system.
Figure 7Post- development water balance
Production
Process
Wastewater
Treatment Unit
Quantity of fresh
water entering the
processing plant
Influent
WW
Losses in the
system
Effluent
WW Recirculated
WW
Stone cuttings
Recirculated Water
Runoff
5.45 m3/d
4 m3/d
0.53 m3/d
626.4 m3/d 632.4 m3/d
631.87 m3/d
8.92 m3/d
Sludge cake Dewatered Sludge
5.47 m3/d

WELI Annex 04- Onyx for Trade and Industry
Geoflint s.a.r.l, Lebanon 10 Leb- Qernayel –Water Audit-March 2019
7. Conclusion and Recommendations
After analyzing the audit findings and observations, the implemented wastewater treatment
system proved to be efficient in reducing fresh water consumption, improving the quality of
water used and decreasing the quantity of sludge disposed. Around 73% reduction in fresh
water consumption was measured. Moreover, the quality of water being recirculated
improved significantly in terms of the level of turbidity and suspended solids in the water.
Improving the quality of water reduced machinery and equipment maintenance (changing of
blades…) where the stone powders in the water may cause polishing problems during the
processing of natural stone and may lead to clogging of pipes. Finally, sludge was properly
managed and the quantity of sludge being disposed was reduced by 92%.
The improvements in the efficiency of water and wastewater management is also resulting in
economic benefits due to reductions in:
Fresh water costs (water tankers…)
Machinery and equipment maintenance (changing of blades…)
Management of sludge piles, where generated sludge is occupying space, and is
incurring on the facility operational costs (machineries operation such as bobcats…)
Labor costs and time spent on the management of poorly operating wastewater
treatment system.
Nevertheless, several recommendations were identified to further improve environmental
management in the proposed facility. These recommendations are summarized below.
Consider rain water harvesting
Improve the efficiency of the wastewater treatment plant by:
o Applying the optimal dose and type of coagulant
o Inspecting the influent and effluent flow rates on a regular basis
Maintain or improve wastewater collection channels (i.e. increase height of sloping
sides) to avoid loss of water to the open ground
Regularly inspect the wastewater canals and bunds to prevent blockages

WELI Annex 04- Onyx for Trade and Industry
Geoflint s.a.r.l, Lebanon 11 Leb- Qernayel –Water Audit-March 2019
8. References
Ersoy, B., Tosun, I., Günay, A., & Dikmen, S. (2009). Turbidity removal from wastewaters
of natural stone processing by coagulation/flocculation methods. CLEAN–Soil, Air,
Water, 37(3), 225-232.
Sadler, B. (1988) The evaluation of assessment: post-EIS research and process
development, in: P. Wathern (Ed) Environmental Impact Assessment: Theory and
Practice (London, Unwin Hyman).
Taşdemir, T., & Kurama, H. (2013). Fine particle removal from natural stone processing
effluent by flocculation. Environmental Progress & Sustainable Energy, 32(2), 317-324.

ANNEX 05

Annex 05
Post- Development Water Audit Report Ste. Georges Najem and sons - G.N.S. sarl.
Bchaaleh-Batroun
March 2019
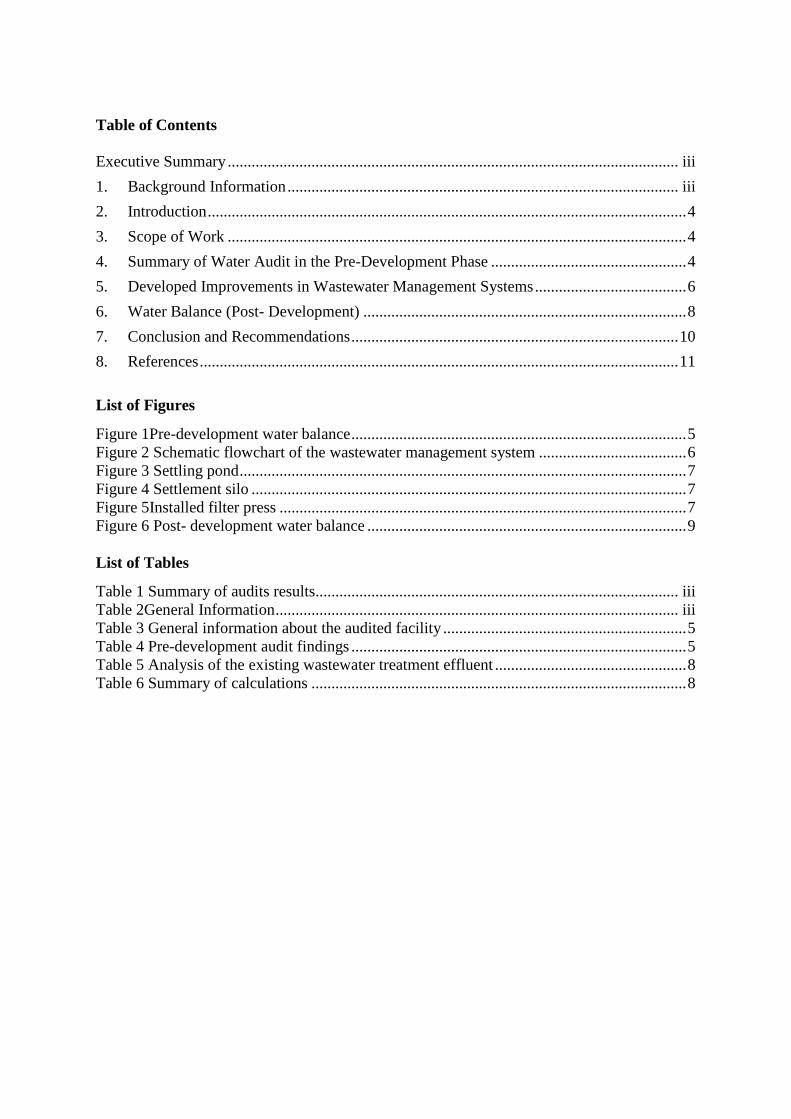
Table of Contents
Executive Summary ................................................................................................................. iii
1. Background Information .................................................................................................. iii
2. Introduction ........................................................................................................................ 4
3. Scope of Work ................................................................................................................... 4
4. Summary of Water Audit in the Pre-Development Phase ................................................. 4
5. Developed Improvements in Wastewater Management Systems ...................................... 6
6. Water Balance (Post- Development) ................................................................................. 8
7. Conclusion and Recommendations .................................................................................. 10
8. References ........................................................................................................................ 11
List of Figures
Figure 1Pre-development water balance .................................................................................... 5 Figure 2 Schematic flowchart of the wastewater management system ..................................... 6 Figure 3 Settling pond ................................................................................................................ 7
Figure 4 Settlement silo ............................................................................................................. 7 Figure 5Installed filter press ...................................................................................................... 7
Figure 6 Post- development water balance ................................................................................ 9
List of Tables
Table 1 Summary of audits results........................................................................................... iii
Table 2General Information ..................................................................................................... iii
Table 3 General information about the audited facility ............................................................. 5 Table 4 Pre-development audit findings .................................................................................... 5 Table 5 Analysis of the existing wastewater treatment effluent ................................................ 8 Table 6 Summary of calculations .............................................................................................. 8
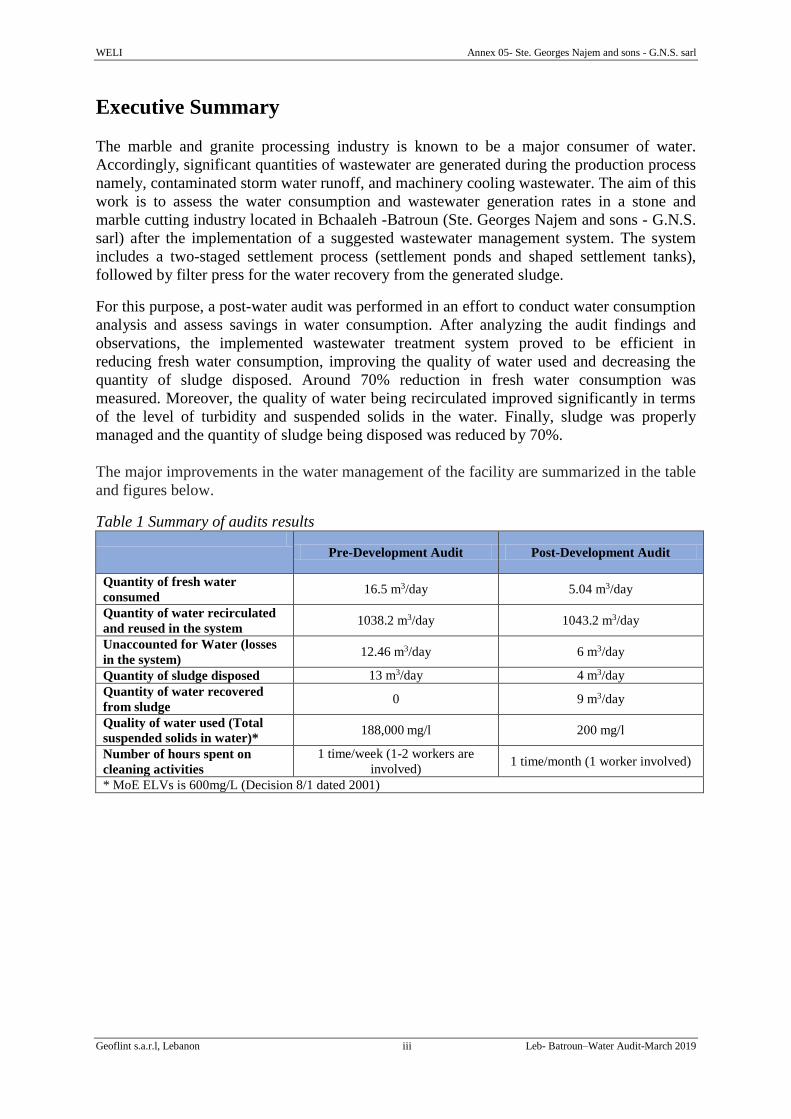
WELI Annex 05- Ste. Georges Najem and sons - G.N.S. sarl
Geoflint s.a.r.l, Lebanon iii Leb- Batroun–Water Audit-March 2019
Executive Summary
The marble and granite processing industry is known to be a major consumer of water.
Accordingly, significant quantities of wastewater are generated during the production process
namely, contaminated storm water runoff, and machinery cooling wastewater. The aim of this
work is to assess the water consumption and wastewater generation rates in a stone and
marble cutting industry located in Bchaaleh -Batroun (Ste. Georges Najem and sons - G.N.S.
sarl) after the implementation of a suggested wastewater management system. The system
includes a two-staged settlement process (settlement ponds and shaped settlement tanks),
followed by filter press for the water recovery from the generated sludge.
For this purpose, a post-water audit was performed in an effort to conduct water consumption
analysis and assess savings in water consumption. After analyzing the audit findings and
observations, the implemented wastewater treatment system proved to be efficient in
reducing fresh water consumption, improving the quality of water used and decreasing the
quantity of sludge disposed. Around 70% reduction in fresh water consumption was
measured. Moreover, the quality of water being recirculated improved significantly in terms
of the level of turbidity and suspended solids in the water. Finally, sludge was properly
managed and the quantity of sludge being disposed was reduced by 70%.
The major improvements in the water management of the facility are summarized in the table
and figures below.
Table 1 Summary of audits results
Pre-Development Audit Post-Development Audit
Quantity of fresh water
consumed 16.5 m3/day 5.04 m3/day
Quantity of water recirculated
and reused in the system 1038.2 m3/day 1043.2 m3/day
Unaccounted for Water (losses
in the system) 12.46 m3/day 6 m3/day
Quantity of sludge disposed 13 m3/day 4 m3/day
Quantity of water recovered
from sludge 0 9 m3/day
Quality of water used (Total
suspended solids in water)* 188,000 mg/l 200 mg/l
Number of hours spent on
cleaning activities
1 time/week (1-2 workers are
involved) 1 time/month (1 worker involved)
* MoE ELVs is 600mg/L (Decision 8/1 dated 2001)
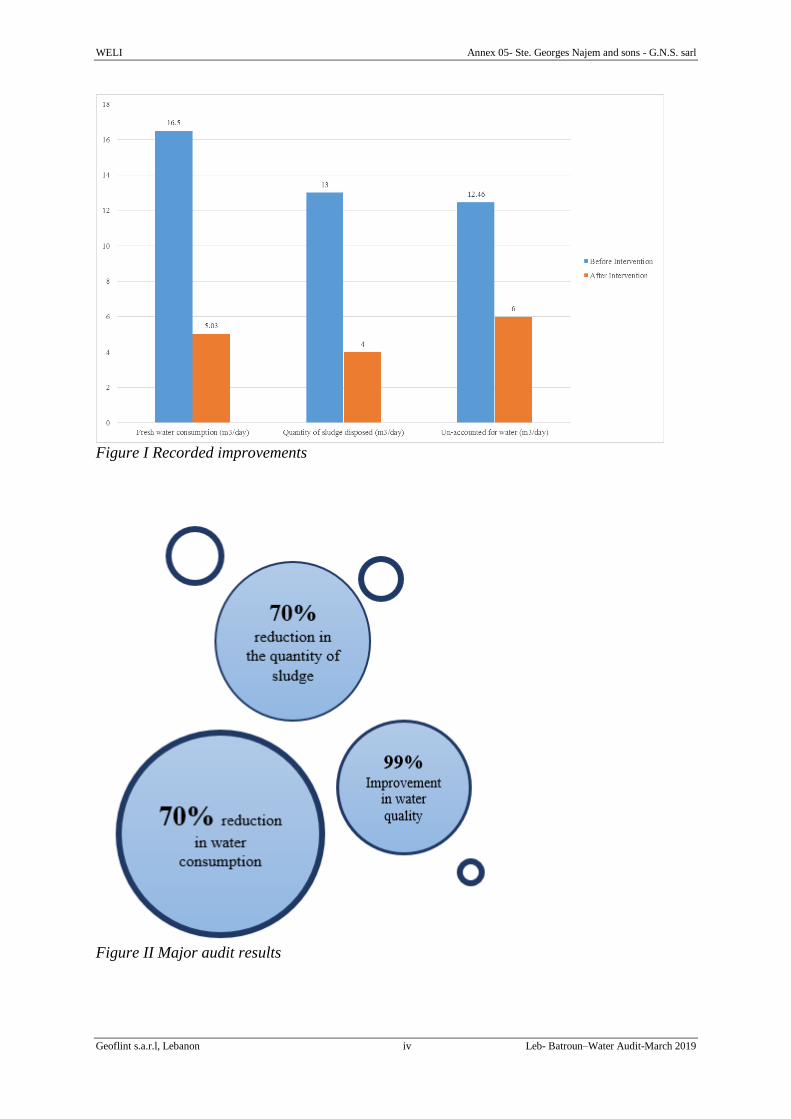
WELI Annex 05- Ste. Georges Najem and sons - G.N.S. sarl
Geoflint s.a.r.l, Lebanon iv Leb- Batroun–Water Audit-March 2019
Figure I Recorded improvements
Figure II Major audit results
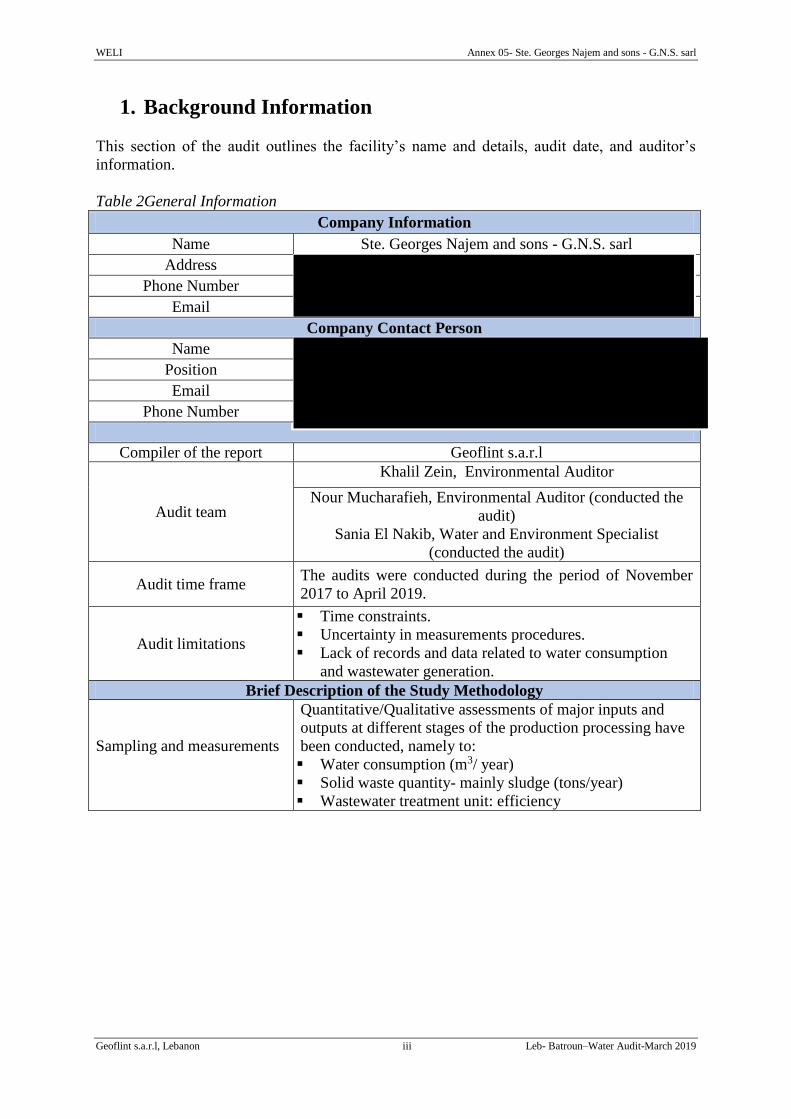
WELI Annex 05- Ste. Georges Najem and sons - G.N.S. sarl
Geoflint s.a.r.l, Lebanon iii Leb- Batroun–Water Audit-March 2019
1. Background Information
This section of the audit outlines the facility’s name and details, audit date, and auditor’s
information.
Table 2General Information
Company Information
Name Ste. Georges Najem and sons - G.N.S. sarl
Address
Phone Number
Company Contact Person
Name
Position
Phone Number
Compiler of the report Geoflint s.a.r.l
Audit team
Khalil Zein, Environmental Auditor
Nour Mucharafieh, Environmental Auditor (conducted the
audit)
Sania El Nakib, Water and Environment Specialist
(conducted the audit)
Audit time frame The audits were conducted during the period of November
2017 to April 2019.
Audit limitations
Time constraints.
Uncertainty in measurements procedures.
Lack of records and data related to water consumption
and wastewater generation.
Brief Description of the Study Methodology
Sampling and measurements
Quantitative/Qualitative assessments of major inputs and
outputs at different stages of the production processing have
been conducted, namely to:
Water consumption (m3/ year)
Solid waste quantity- mainly sludge (tons/year)
Wastewater treatment unit: efficiency
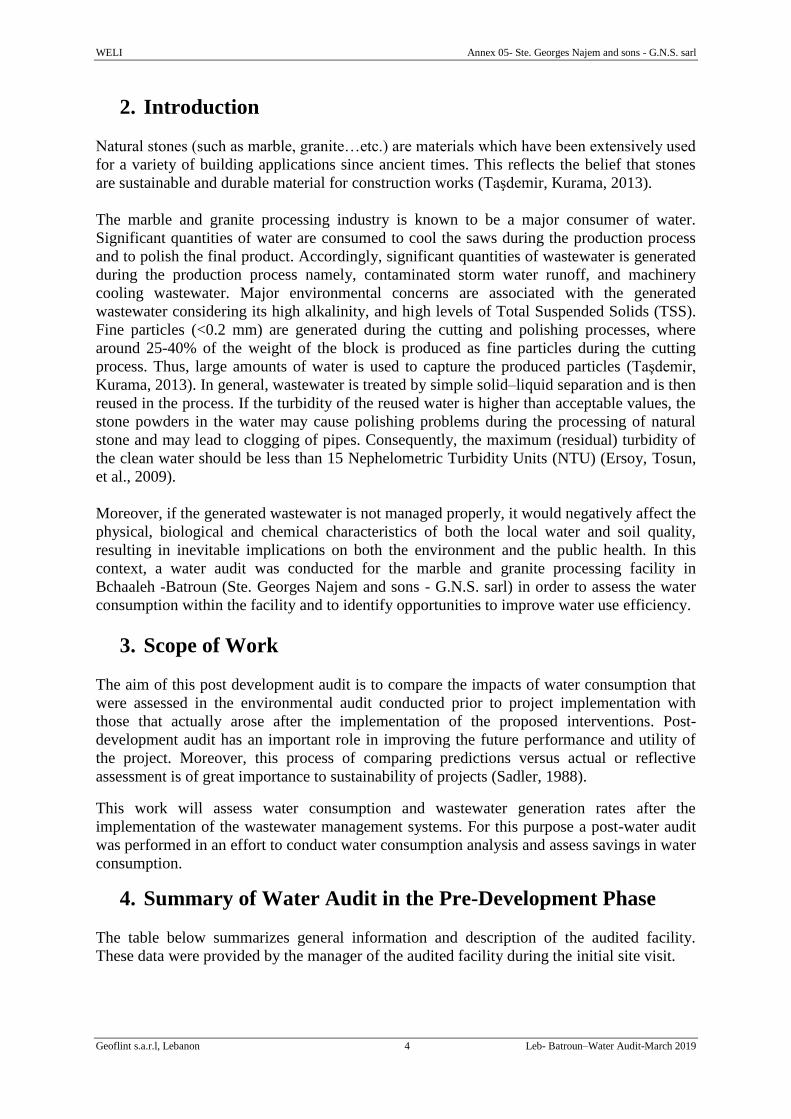
WELI Annex 05- Ste. Georges Najem and sons - G.N.S. sarl
Geoflint s.a.r.l, Lebanon 4 Leb- Batroun–Water Audit-March 2019
2. Introduction
Natural stones (such as marble, granite…etc.) are materials which have been extensively used
for a variety of building applications since ancient times. This reflects the belief that stones
are sustainable and durable material for construction works (Taşdemir, Kurama, 2013).
The marble and granite processing industry is known to be a major consumer of water.
Significant quantities of water are consumed to cool the saws during the production process
and to polish the final product. Accordingly, significant quantities of wastewater is generated
during the production process namely, contaminated storm water runoff, and machinery
cooling wastewater. Major environmental concerns are associated with the generated
wastewater considering its high alkalinity, and high levels of Total Suspended Solids (TSS).
Fine particles (<0.2 mm) are generated during the cutting and polishing processes, where
around 25-40% of the weight of the block is produced as fine particles during the cutting
process. Thus, large amounts of water is used to capture the produced particles (Taşdemir,
Kurama, 2013). In general, wastewater is treated by simple solid–liquid separation and is then
reused in the process. If the turbidity of the reused water is higher than acceptable values, the
stone powders in the water may cause polishing problems during the processing of natural
stone and may lead to clogging of pipes. Consequently, the maximum (residual) turbidity of
the clean water should be less than 15 Nephelometric Turbidity Units (NTU) (Ersoy, Tosun,
et al., 2009).
Moreover, if the generated wastewater is not managed properly, it would negatively affect the
physical, biological and chemical characteristics of both the local water and soil quality,
resulting in inevitable implications on both the environment and the public health. In this
context, a water audit was conducted for the marble and granite processing facility in
Bchaaleh -Batroun (Ste. Georges Najem and sons - G.N.S. sarl) in order to assess the water
consumption within the facility and to identify opportunities to improve water use efficiency.
3. Scope of Work
The aim of this post development audit is to compare the impacts of water consumption that
were assessed in the environmental audit conducted prior to project implementation with
those that actually arose after the implementation of the proposed interventions. Post-
development audit has an important role in improving the future performance and utility of
the project. Moreover, this process of comparing predictions versus actual or reflective
assessment is of great importance to sustainability of projects (Sadler, 1988).
This work will assess water consumption and wastewater generation rates after the
implementation of the wastewater management systems. For this purpose a post-water audit
was performed in an effort to conduct water consumption analysis and assess savings in water
consumption.
4. Summary of Water Audit in the Pre-Development Phase
The table below summarizes general information and description of the audited facility.
These data were provided by the manager of the audited facility during the initial site visit.
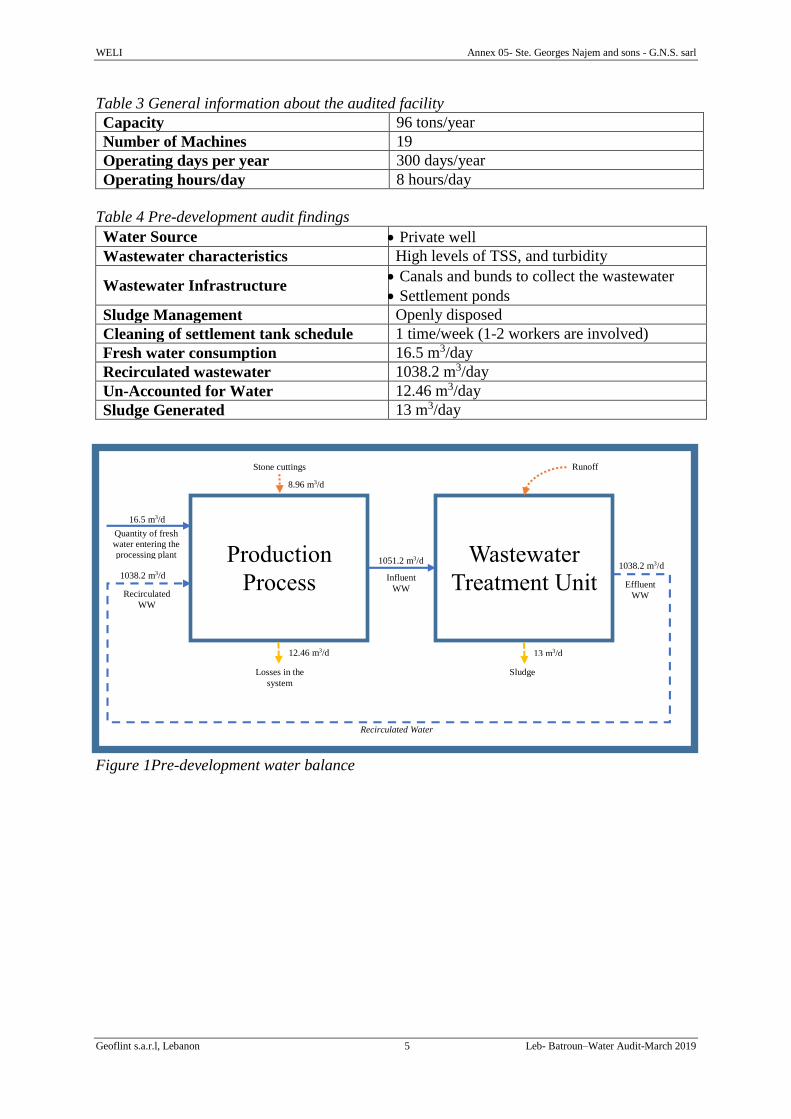
WELI Annex 05- Ste. Georges Najem and sons - G.N.S. sarl
Geoflint s.a.r.l, Lebanon 5 Leb- Batroun–Water Audit-March 2019
Table 3 General information about the audited facility
Capacity 96 tons/year
Number of Machines 19
Operating days per year 300 days/year
Operating hours/day 8 hours/day
Table 4 Pre-development audit findings
Water Source Private well
Wastewater characteristics High levels of TSS, and turbidity
Wastewater Infrastructure Canals and bunds to collect the wastewater
Settlement ponds
Sludge Management Openly disposed
Cleaning of settlement tank schedule 1 time/week (1-2 workers are involved)
Fresh water consumption 16.5 m3/day
Recirculated wastewater 1038.2 m3/day
Un-Accounted for Water 12.46 m3/day
Sludge Generated 13 m3/day
Production
Process
Wastewater
Treatment Unit
Quantity of fresh
water entering the
processing plant
Influent
WW
Losses in the
system
Effluent
WW Recirculated
WW
Stone cuttings
Recirculated Water
Runoff
8.96 m3/d
16.5 m3/d
Sludge
13 m3/d
1038.2 m3/d 1051.2 m3/d
1038.2 m3/d
12.46 m3/d
Figure 1Pre-development water balance

WELI Annex 05- Ste. Georges Najem and sons - G.N.S. sarl
Geoflint s.a.r.l, Lebanon 6 Leb- Batroun–Water Audit-March 2019
5. Developed Improvements in Wastewater Management
Systems
Ste. Georges Najem and sons - G.N.S. sarl implemented the suggested wastewater
management system which includes a two-staged settlement process (settlement ponds and
shaped settlement tanks), followed by filter press for the water recovery from the generated
sludge. A filter press was recently installed to recover water from the generated sludge.
Figure 2 Schematic flowchart of the wastewater management system
The treatment of wastewater is done via two steps. The first step is the settling pond where
the heavy particles present in the wastewater are left to settle naturally. After this step the
wastewater is pumped into a cylindrical settling tank where a coagulant (acrylamid) is added,
thus the process of coagulation and flocculation takes place. The structure of the cylindrical
settling tank/silo is designed in a way to enhance the process of flocs settling. The cylindrical
settling tank in this audited facility has a height of 7m and diameter of 2m (Figure 4). Finally
the treated wastewater is transferred to a storage tank behind the processing area where it is
then reused in the production process.
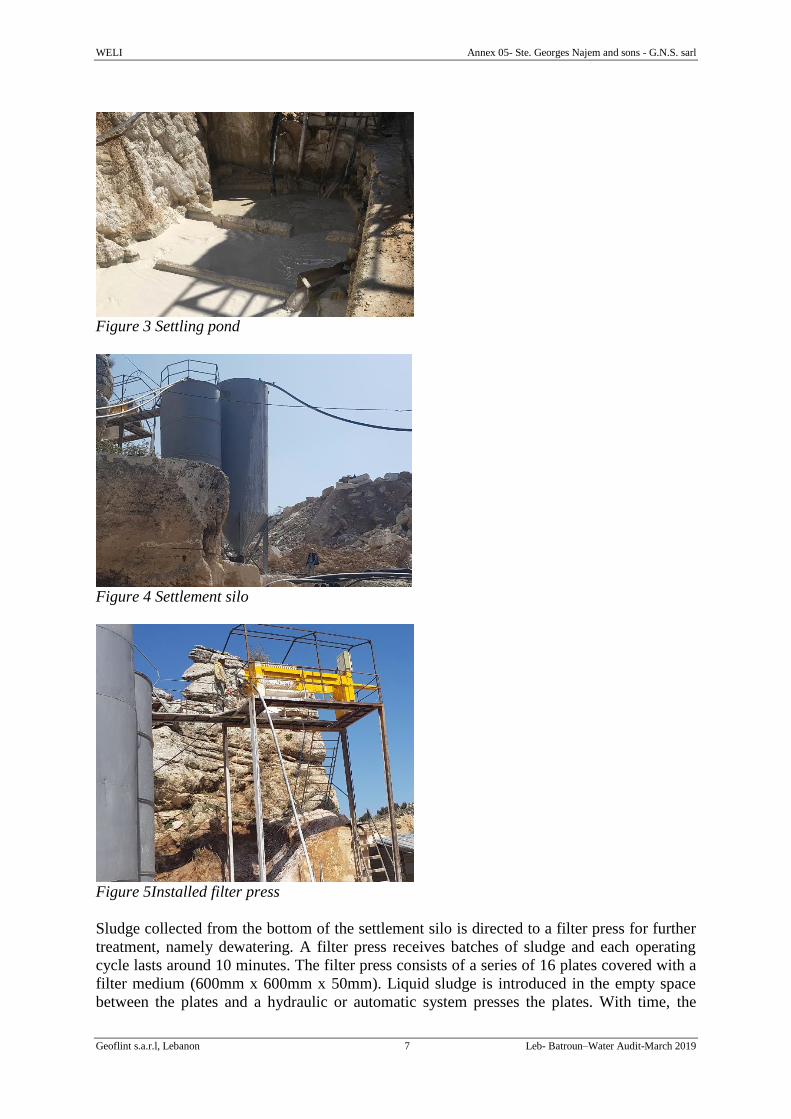
WELI Annex 05- Ste. Georges Najem and sons - G.N.S. sarl
Geoflint s.a.r.l, Lebanon 7 Leb- Batroun–Water Audit-March 2019
Figure 3 Settling pond
Figure 4 Settlement silo
Figure 5Installed filter press
Sludge collected from the bottom of the settlement silo is directed to a filter press for further
treatment, namely dewatering. A filter press receives batches of sludge and each operating
cycle lasts around 10 minutes. The filter press consists of a series of 16 plates covered with a
filter medium (600mm x 600mm x 50mm). Liquid sludge is introduced in the empty space
between the plates and a hydraulic or automatic system presses the plates. With time, the
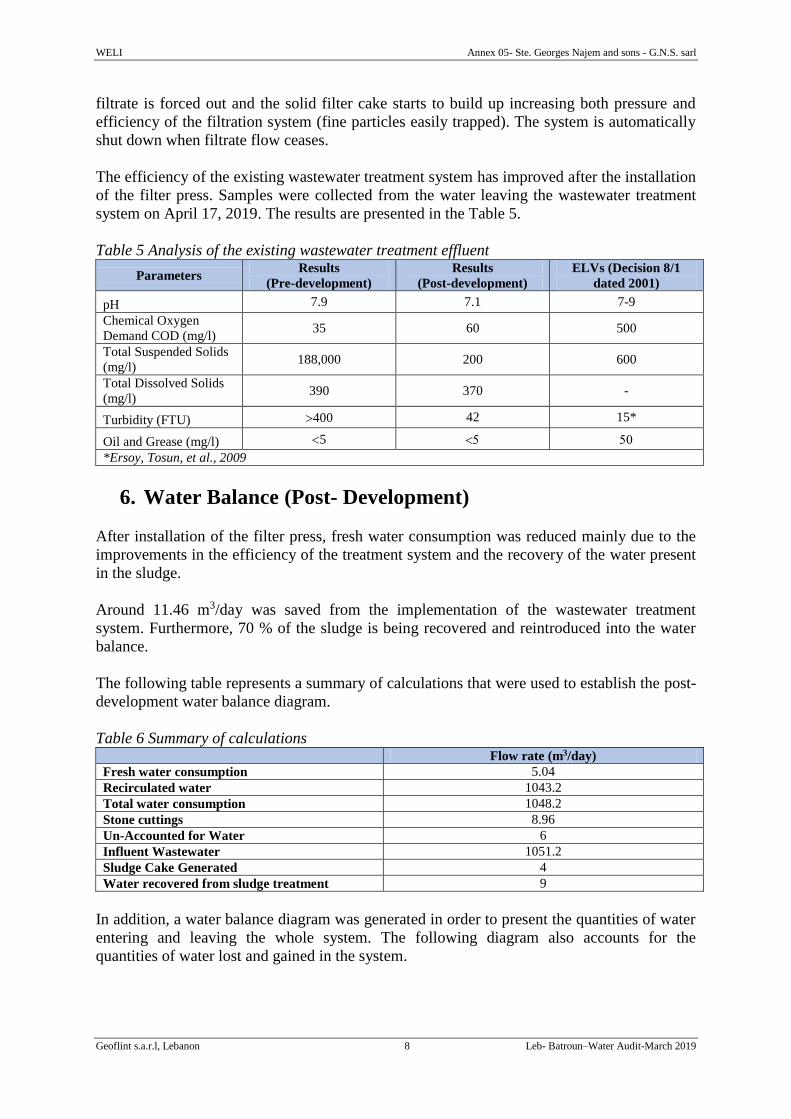
WELI Annex 05- Ste. Georges Najem and sons - G.N.S. sarl
Geoflint s.a.r.l, Lebanon 8 Leb- Batroun–Water Audit-March 2019
filtrate is forced out and the solid filter cake starts to build up increasing both pressure and
efficiency of the filtration system (fine particles easily trapped). The system is automatically
shut down when filtrate flow ceases.
The efficiency of the existing wastewater treatment system has improved after the installation
of the filter press. Samples were collected from the water leaving the wastewater treatment
system on April 17, 2019. The results are presented in the Table 5.
Table 5 Analysis of the existing wastewater treatment effluent
Parameters Results
(Pre-development)
Results
(Post-development)
ELVs (Decision 8/1
dated 2001)
pH 7.9 7.1 7-9
Chemical Oxygen
Demand COD (mg/l) 35 60 500
Total Suspended Solids
(mg/l) 188,000 200 600
Total Dissolved Solids
(mg/l) 390 370 -
Turbidity (FTU) 400 42 15*
Oil and Grease (mg/l) 5
*Ersoy, Tosun, et al., 2009
6. Water Balance (Post- Development)
After installation of the filter press, fresh water consumption was reduced mainly due to the
improvements in the efficiency of the treatment system and the recovery of the water present
in the sludge.
Around 11.46 m3/day was saved from the implementation of the wastewater treatment
system. Furthermore, 70 % of the sludge is being recovered and reintroduced into the water
balance.
The following table represents a summary of calculations that were used to establish the post-
development water balance diagram.
Table 6 Summary of calculations Flow rate (m3/day)
Fresh water consumption 5.04
Recirculated water 1043.2
Total water consumption 1048.2
Stone cuttings 8.96
Un-Accounted for Water 6
Influent Wastewater 1051.2
Sludge Cake Generated 4
Water recovered from sludge treatment 9
In addition, a water balance diagram was generated in order to present the quantities of water
entering and leaving the whole system. The following diagram also accounts for the
quantities of water lost and gained in the system.
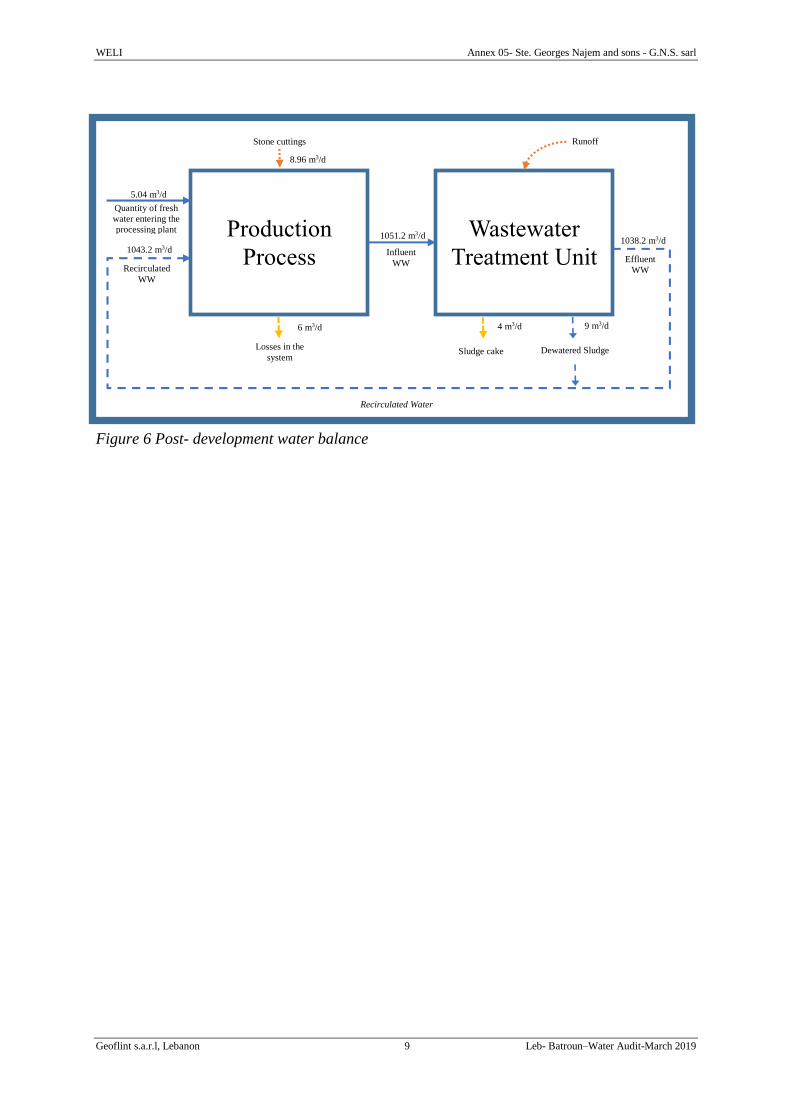
WELI Annex 05- Ste. Georges Najem and sons - G.N.S. sarl
Geoflint s.a.r.l, Lebanon 9 Leb- Batroun–Water Audit-March 2019
Figure 6 Post- development water balance
Production
Process
Wastewater
Treatment Unit
Quantity of fresh
water entering the
processing plant
Influent
WW
Losses in the
system
Effluent
WW Recirculated
WW
Stone cuttings
Recirculated Water
Runoff
8.96 m3/d
5.04 m3/d
4 m3/d
1038.2 m3/d 1051.2 m3/d
1043.2 m3/d
6 m3/d
Sludge cake Dewatered Sludge
9 m3/d

WELI Annex 05- Ste. Georges Najem and sons - G.N.S. sarl
Geoflint s.a.r.l, Lebanon 10 Leb- Batroun–Water Audit-March 2019
7. Conclusion and Recommendations
After analyzing the audit findings and observations, the implemented wastewater treatment
system proved to be efficient in reducing fresh water consumption, improving the quality of
water used and decreasing the quantity of sludge disposed. Around 70% reduction in fresh
water consumption was measured. Moreover, the quality of water being recirculated
improved significantly in terms of the level of turbidity and suspended solids in the water.
Improving the quality of water reduced machinery and equipment maintenance (changing of
blades…) where the stone powders in the water may cause polishing problems during the
processing of natural stone and may lead to clogging of pipes. Finally, sludge was properly
managed and the quantity of sludge being disposed was reduced by 70%.
The improvements in the efficiency of water and wastewater management is also resulting in
economic benefits due to reductions in:
Fresh water costs (water tankers…)
Machinery and equipment maintenance (changing of blades…)
Management of sludge piles, where generated sludge is occupying space, and is
incurring on the facility operational costs (machineries operation such as bobcats…)
Labor costs and time spent on the management of poorly operating wastewater
treatment system.
Nevertheless, several recommendations were identified to further improve environmental
management in the proposed facility. These recommendations are summarized below.
Consider rain water harvesting
Improve the efficiency of the wastewater treatment plant by:
o Applying the optimal dose and type of coagulant
o Inspecting the influent and effluent flow rates on a regular basis
Maintain or improve wastewater collection channels (i.e. increase height of sloping
sides) to avoid loss of water to the open ground
Regularly inspect the wastewater canals and bunds to prevent blockages
WELI Annex 05- Ste. Georges Najem and sons - G.N.S. sarl
Geoflint s.a.r.l, Lebanon 11 Leb- Batroun–Water Audit-March 2019
8. References
Ersoy, B., Tosun, I., Günay, A., & Dikmen, S. (2009). Turbidity removal from wastewaters
of natural stone processing by coagulation/flocculation methods. CLEAN–Soil, Air,
Water, 37(3), 225-232.
Sadler, B. (1988) The evaluation of assessment: post-EIS research and process
development, in: P. Wathern (Ed) Environmental Impact Assessment: Theory and
Practice (London, Unwin Hyman).
Taşdemir, T., & Kurama, H. (2013). Fine particle removal from natural stone processing
effluent by flocculation. Environmental Progress & Sustainable Energy, 32(2), 317-324.

ANNEX 06
Annex 06
Post- Development Water Audit Report Usine Nationale Des Blocs Et Carreaux (Boustany,
Mallah & Co. S.A.R.L.)
Zouk Mosbeh
July 2019
WELI Annex 06- Usine Nationale Des Blocs Et Carreaux
Geoflint s.a.r.l, Lebanon ii Leb-Zouk Mosbeh–Water Audit-July 2019
Table of Contents
Executive Summary ................................................................................................................. iii 1. Background Information .................................................................................................... 1
2. Introduction ........................................................................................................................ 2 3. Scope of Work ................................................................................................................... 2 4. Summary of Water Audit in the Pre-Development Phase ................................................. 2 5. Developed Improvements in Wastewater Management Systems ...................................... 3 6. Water Balance (Post- Development) ................................................................................. 5
7. Conclusion and Recommendations .................................................................................... 7 8. References .......................................................................................................................... 8
List of Figures
Figure 1Pre-development water balance .................................................................................... 3 Figure 2 Schematic flowchart of the wastewater management system ..................................... 4
Figure 3 Settlement silo and filter press .................................................................................... 5 Figure 4Post- development water balance ................................................................................. 6
List of Tables
Table 1 Summary of audits results........................................................................................... iii
Table 1-1General Information ................................................................................................... 1 Table 2 General information about the audited facility ............................................................. 3 Table 3 Pre-development audit findings .................................................................................... 3
Table 4 Analysis of the existing wastewater treatment effluent ................................................ 5
Table 5 Summary of calculations .............................................................................................. 5
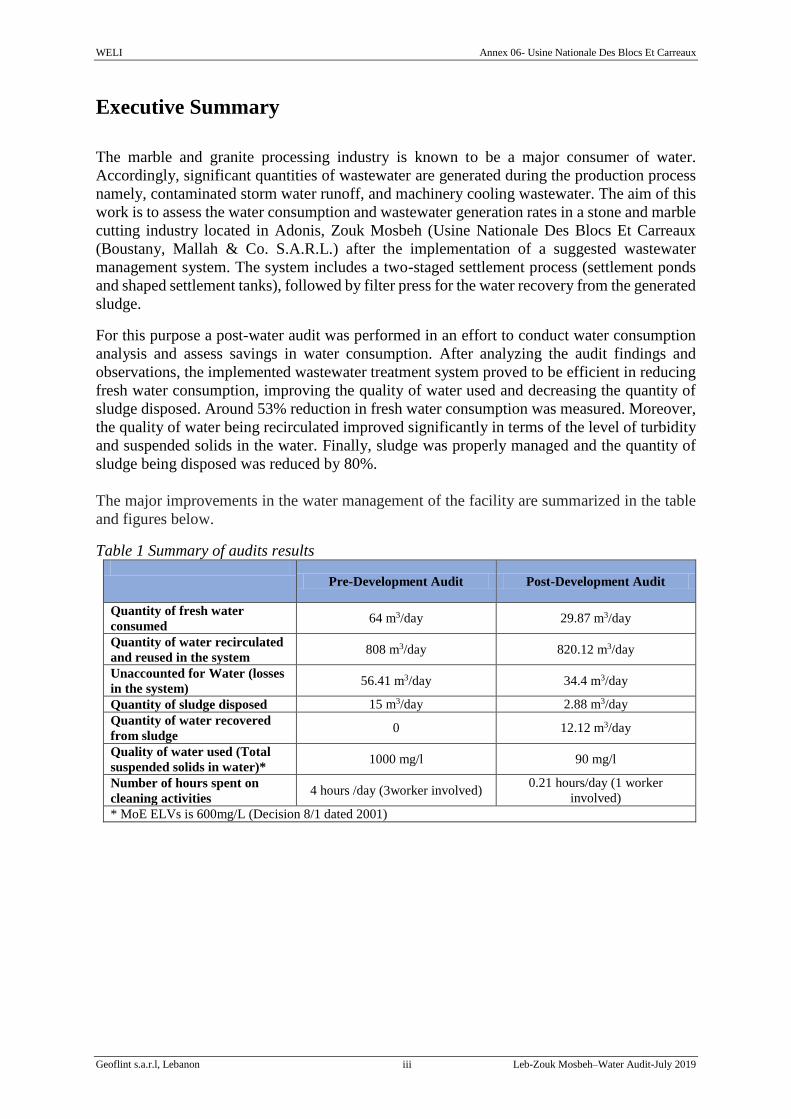
WELI Annex 06- Usine Nationale Des Blocs Et Carreaux
Geoflint s.a.r.l, Lebanon iii Leb-Zouk Mosbeh–Water Audit-July 2019
Executive Summary
The marble and granite processing industry is known to be a major consumer of water.
Accordingly, significant quantities of wastewater are generated during the production process
namely, contaminated storm water runoff, and machinery cooling wastewater. The aim of this
work is to assess the water consumption and wastewater generation rates in a stone and marble
cutting industry located in Adonis, Zouk Mosbeh (Usine Nationale Des Blocs Et Carreaux
(Boustany, Mallah & Co. S.A.R.L.) after the implementation of a suggested wastewater
management system. The system includes a two-staged settlement process (settlement ponds
and shaped settlement tanks), followed by filter press for the water recovery from the generated
sludge.
For this purpose a post-water audit was performed in an effort to conduct water consumption
analysis and assess savings in water consumption. After analyzing the audit findings and
observations, the implemented wastewater treatment system proved to be efficient in reducing
fresh water consumption, improving the quality of water used and decreasing the quantity of
sludge disposed. Around 53% reduction in fresh water consumption was measured. Moreover,
the quality of water being recirculated improved significantly in terms of the level of turbidity
and suspended solids in the water. Finally, sludge was properly managed and the quantity of
sludge being disposed was reduced by 80%.
The major improvements in the water management of the facility are summarized in the table
and figures below.
Table 1 Summary of audits results
Pre-Development Audit Post-Development Audit
Quantity of fresh water
consumed 64 m3/day 29.87 m3/day
Quantity of water recirculated
and reused in the system 808 m3/day 820.12 m3/day
Unaccounted for Water (losses
in the system) 56.41 m3/day 34.4 m3/day
Quantity of sludge disposed 15 m3/day 2.88 m3/day
Quantity of water recovered
from sludge 0 12.12 m3/day
Quality of water used (Total
suspended solids in water)* 1000 mg/l 90 mg/l
Number of hours spent on
cleaning activities 4 hours /day (3worker involved)
0.21 hours/day (1 worker
involved)
* MoE ELVs is 600mg/L (Decision 8/1 dated 2001)
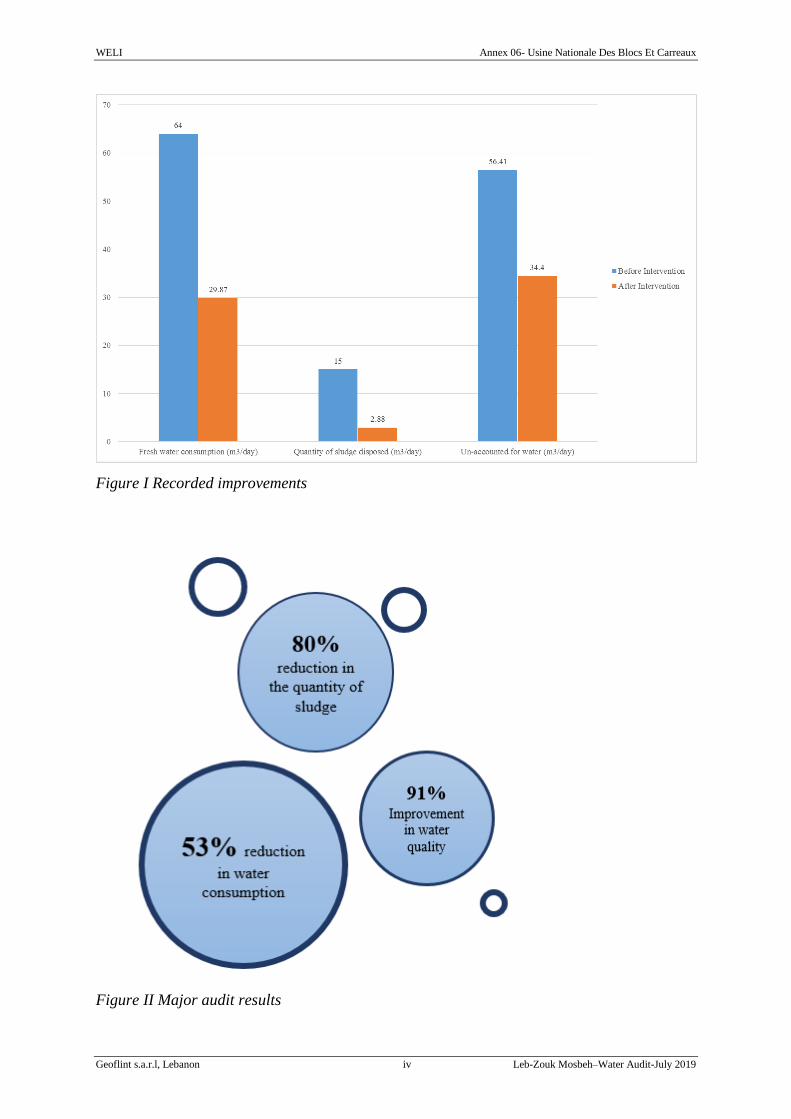
WELI Annex 06- Usine Nationale Des Blocs Et Carreaux
Geoflint s.a.r.l, Lebanon iv Leb-Zouk Mosbeh–Water Audit-July 2019
Figure I Recorded improvements
Figure II Major audit results
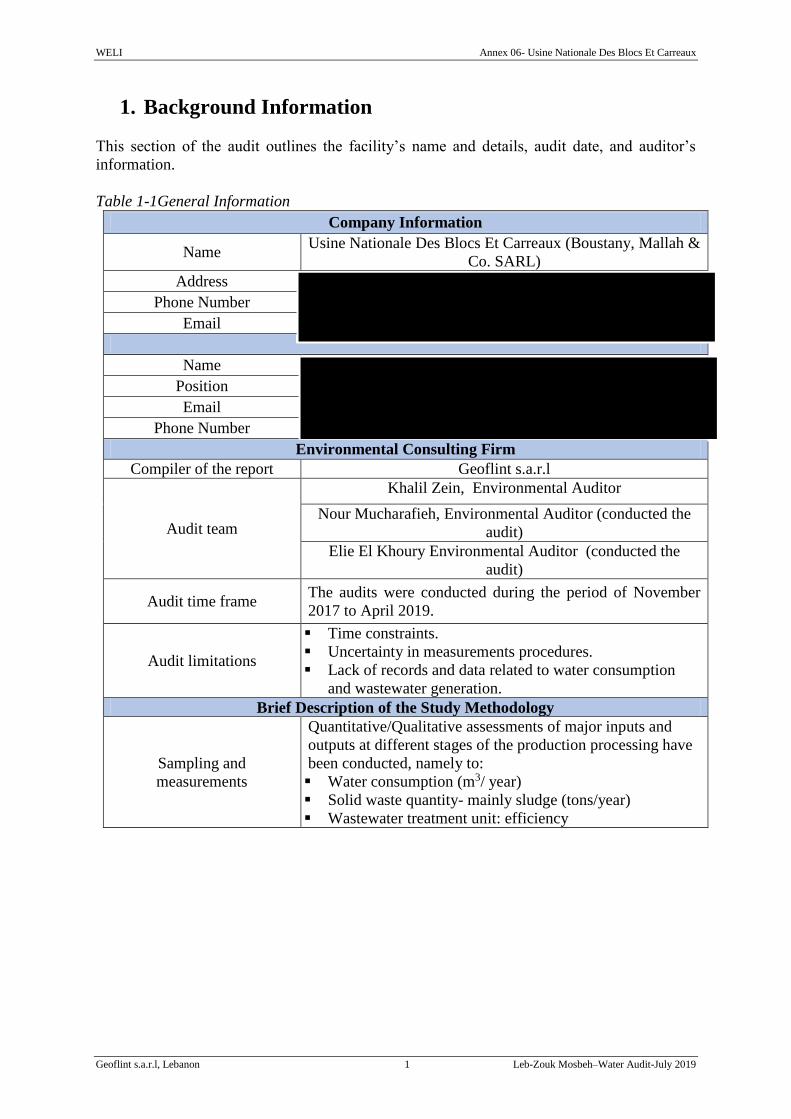
WELI Annex 06- Usine Nationale Des Blocs Et Carreaux
Geoflint s.a.r.l, Lebanon 1 Leb-Zouk Mosbeh–Water Audit-July 2019
1. Background Information
This section of the audit outlines the facility’s name and details, audit date, and auditor’s
information.
Table 1-1General Information
Company Information
Name Usine Nationale Des Blocs Et Carreaux (Boustany, Mallah &
Co. SARL)
Address
Phone Number
Name
Position
Phone Number
Environmental Consulting Firm
Compiler of the report Geoflint s.a.r.l
Audit team
Khalil Zein, Environmental Auditor
Nour Mucharafieh, Environmental Auditor (conducted the
audit)
Elie El Khoury Environmental Auditor (conducted the
audit)
Audit time frame The audits were conducted during the period of November
2017 to April 2019.
Audit limitations
Time constraints.
Uncertainty in measurements procedures.
Lack of records and data related to water consumption
and wastewater generation.
Brief Description of the Study Methodology
Sampling and
measurements
Quantitative/Qualitative assessments of major inputs and
outputs at different stages of the production processing have
been conducted, namely to:
Water consumption (m3/ year)
Solid waste quantity- mainly sludge (tons/year)
Wastewater treatment unit: efficiency
WELI Annex 06- Usine Nationale Des Blocs Et Carreaux
Geoflint s.a.r.l, Lebanon 2 Leb-Zouk Mosbeh–Water Audit-July 2019
2. Introduction
Natural stones (such as marble, granite…etc.) are materials which have been extensively used
for a variety of building applications since ancient times. This reflects the belief that stones are
sustainable and durable material for construction works (Taşdemir, Kurama, 2013).
The marble and granite processing industry is known to be a major consumer of water.
Significant quantities of water are consumed to cool the saws during the production process
and to polish the final product. Accordingly, significant quantities of wastewater is generated
during the production process namely, contaminated storm water runoff, and machinery
cooling wastewater. Major environmental concerns are associated with the generated
wastewater considering its high alkalinity, and high levels of Total Suspended Solids (TSS).
Fine particles (<0.2 mm) are generated during the cutting and polishing processes, where
around 25-40% of the weight of the block is produced as fine particles during the cutting
process. Thus, large amounts of water is used to capture the produced particles (Taşdemir,
Kurama, 2013). In general, wastewater is treated by simple solid–liquid separation and is then
reused in the process. If the turbidity of the reused water is higher than acceptable values, the
stone powders in the water may cause polishing problems during the processing of natural stone
and may lead to clogging of pipes. Consequently, the maximum (residual) turbidity of the clean
water should be less than 15 Nephelometric Turbidity Units (NTU) (Ersoy, Tosun, et al., 2009).
Moreover, if the generated wastewater is not managed properly, it would negatively affect the
physical, biological and chemical characteristics of both the local water and soil quality,
resulting in inevitable implications on both the environment and the public health. In this
context, a water audit was conducted for the marble and granite processing facility in Zouk
Mosbeh (Usine Nationale Des Blocs Et Carreaux (Boustany, Mallah & Co. S.A.R.L.) in order
to assess the water consumption within the facility and to identify opportunities to improve
water use efficiency.
3. Scope of Work
The aim of this post development audit is to compare the impacts of water consumption that
were assessed in the environmental audit conducted prior to project implementation with those
that actually arose after the implementation of the proposed interventions. Post-development
audit has an important role in improving the future performance and utility of the project.
Moreover, this process of comparing predictions versus actual or reflective assessment is of
great importance to sustainability of projects (Sadler, 1988).
This work will assess water consumption and wastewater generation rates after the
implementation of the wastewater management systems. For this purpose a post-water audit
was performed in an effort to conduct water consumption analysis and assess savings in water
consumption.
4. Summary of Water Audit in the Pre-Development Phase
The table below summarizes general information and description of the audited facility. These
data were provided by the manager of the audited facility during the initial site visit.
WELI Annex 06- Usine Nationale Des Blocs Et Carreaux
Geoflint s.a.r.l, Lebanon 3 Leb-Zouk Mosbeh–Water Audit-July 2019
Table 2 General information about the audited facility
Facility Area 15,000 m2
Capacity 35,000 m2
Number of Machines 21
Operating days per year 340 days/year
Operating hours/day 7:30 am – 4:30 pm (9 hours)
Number of Employees 30 labor + 10 employees
Table 3 Pre-development audit findings
Water Source Public water
Well water
Wastewater characteristics High levels of TSS, and turbidity
Wastewater Infrastructure Canals and bunds to collect the wastewater
Settlement pond and silo
Sludge Management Openly disposed
Cleaning of settlement tank schedule Daily (1-2 workers are involved)
Fresh water consumption 64 m3/day
Recirculated wastewater 808 m3/day
Un-Accounted for Water 56.41 m3/day
Sludge Generated 15 m3/day
5. Developed Improvements in Wastewater Management
Systems
Usine Nationale Des Blocs Et Carreaux (Boustany, Mallah & Co. SARL) implemented the
suggested wastewater management system which includes a two-staged settlement process
(settlement ponds and shaped settlement tanks), followed by filter press for the water recovery
Production
Process
Wastewater
Treatment Unit
Quantity of fresh
water entering the
processing plant
Influent
WW
Losses in the
system
Effluent
WW Recirculated
WW
Stone cuttings
Recirculated Water
Runoff
7.41 m3/d
64 m3/d
Sludge
15 m3/d
808 m3/d 823 m3/d
808 m3/d
56.41 m3/d
Figure 1Pre-development water balance
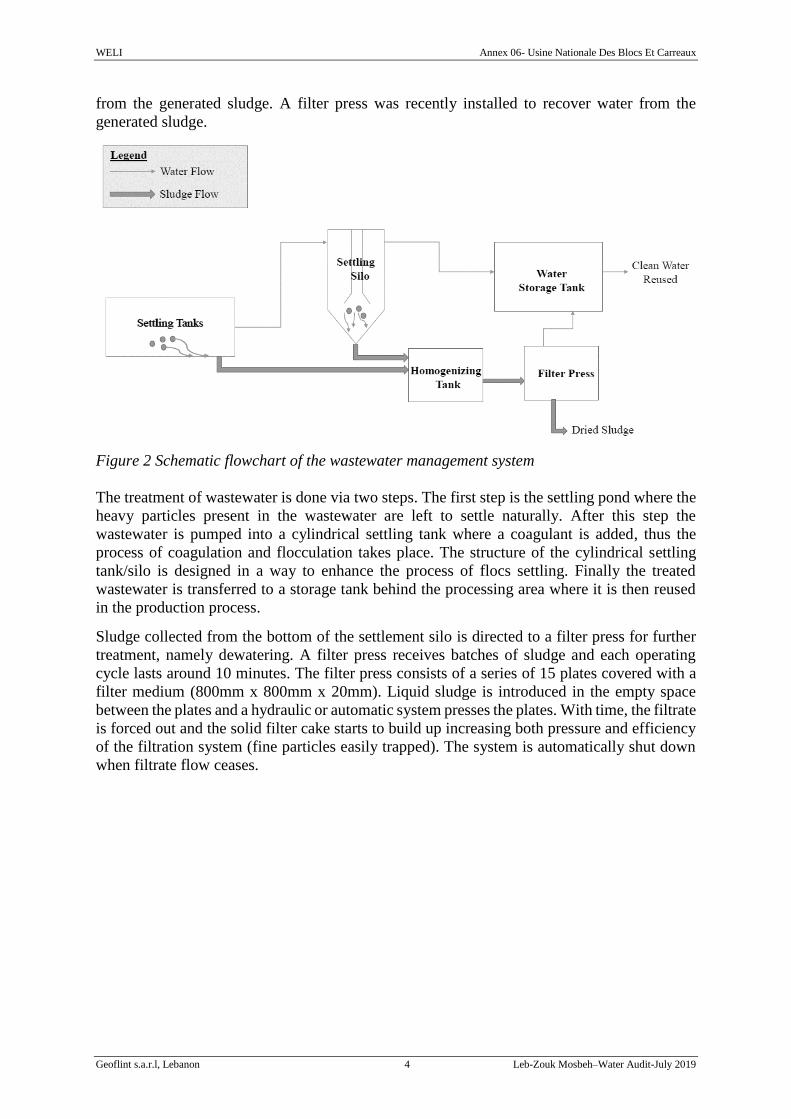
WELI Annex 06- Usine Nationale Des Blocs Et Carreaux
Geoflint s.a.r.l, Lebanon 4 Leb-Zouk Mosbeh–Water Audit-July 2019
from the generated sludge. A filter press was recently installed to recover water from the
generated sludge.
Figure 2 Schematic flowchart of the wastewater management system
The treatment of wastewater is done via two steps. The first step is the settling pond where the
heavy particles present in the wastewater are left to settle naturally. After this step the
wastewater is pumped into a cylindrical settling tank where a coagulant is added, thus the
process of coagulation and flocculation takes place. The structure of the cylindrical settling
tank/silo is designed in a way to enhance the process of flocs settling. Finally the treated
wastewater is transferred to a storage tank behind the processing area where it is then reused
in the production process.
Sludge collected from the bottom of the settlement silo is directed to a filter press for further
treatment, namely dewatering. A filter press receives batches of sludge and each operating
cycle lasts around 10 minutes. The filter press consists of a series of 15 plates covered with a
filter medium (800mm x 800mm x 20mm). Liquid sludge is introduced in the empty space
between the plates and a hydraulic or automatic system presses the plates. With time, the filtrate
is forced out and the solid filter cake starts to build up increasing both pressure and efficiency
of the filtration system (fine particles easily trapped). The system is automatically shut down
when filtrate flow ceases.
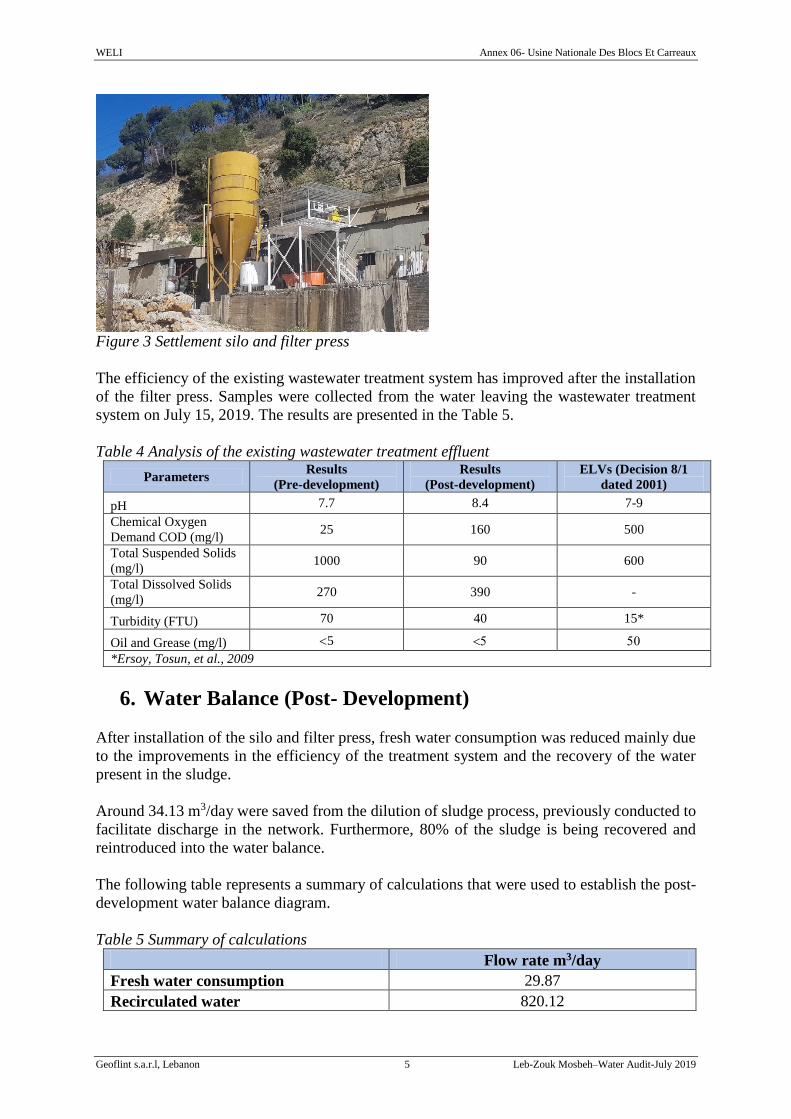
WELI Annex 06- Usine Nationale Des Blocs Et Carreaux
Geoflint s.a.r.l, Lebanon 5 Leb-Zouk Mosbeh–Water Audit-July 2019
Figure 3 Settlement silo and filter press
The efficiency of the existing wastewater treatment system has improved after the installation
of the filter press. Samples were collected from the water leaving the wastewater treatment
system on July 15, 2019. The results are presented in the Table 5.
Table 4 Analysis of the existing wastewater treatment effluent
Parameters Results
(Pre-development)
Results
(Post-development)
ELVs (Decision 8/1
dated 2001)
pH 7.7 8.4 7-9
Chemical Oxygen
Demand COD (mg/l) 25 160 500
Total Suspended Solids
(mg/l) 1000 90 600
Total Dissolved Solids
(mg/l) 270 390 -
Turbidity (FTU) 70 40 15*
Oil and Grease (mg/l) 5
*Ersoy, Tosun, et al., 2009
6. Water Balance (Post- Development)
After installation of the silo and filter press, fresh water consumption was reduced mainly due
to the improvements in the efficiency of the treatment system and the recovery of the water
present in the sludge.
Around 34.13 m3/day were saved from the dilution of sludge process, previously conducted to
facilitate discharge in the network. Furthermore, 80% of the sludge is being recovered and
reintroduced into the water balance.
The following table represents a summary of calculations that were used to establish the post-
development water balance diagram.
Table 5 Summary of calculations
Flow rate m3/day
Fresh water consumption 29.87
Recirculated water 820.12
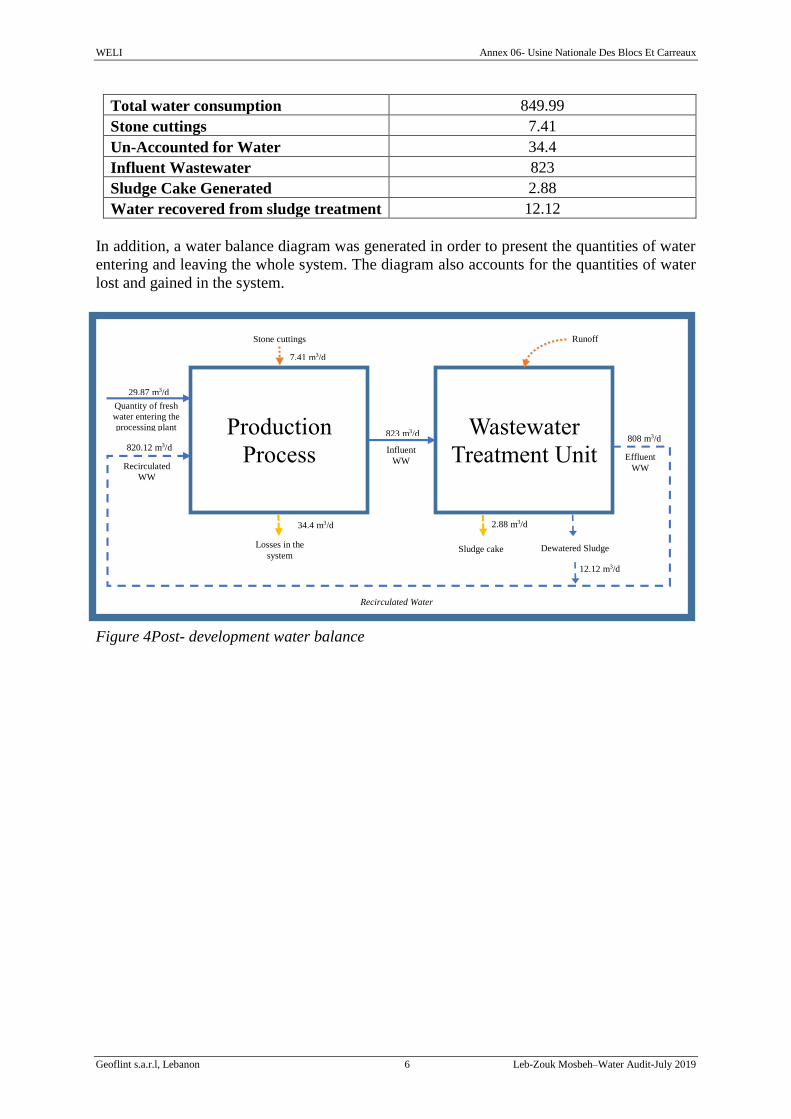
WELI Annex 06- Usine Nationale Des Blocs Et Carreaux
Geoflint s.a.r.l, Lebanon 6 Leb-Zouk Mosbeh–Water Audit-July 2019
Total water consumption 849.99
Stone cuttings 7.41
Un-Accounted for Water 34.4
Influent Wastewater 823
Sludge Cake Generated 2.88
Water recovered from sludge treatment 12.12
In addition, a water balance diagram was generated in order to present the quantities of water
entering and leaving the whole system. The diagram also accounts for the quantities of water
lost and gained in the system.
Figure 4Post- development water balance
Production
Process
Wastewater
Treatment Unit
Quantity of fresh
water entering the
processing plant
Influent
WW
Losses in the
system
Effluent
WW Recirculated
WW
Stone cuttings
Recirculated Water
Runoff
7.41 m3/d
29.87 m3/d
2.88 m3/d
808 m3/d 823 m3/d
820.12 m3/d
34.4 m3/d
Sludge cake Dewatered Sludge
12.12 m3/d
WELI Annex 06- Usine Nationale Des Blocs Et Carreaux
Geoflint s.a.r.l, Lebanon 7 Leb-Zouk Mosbeh–Water Audit-July 2019
7. Conclusion and Recommendations
After analyzing the audit findings and observations, the implemented wastewater treatment
system proved to be efficient in reducing fresh water consumption, improving the quality of
water used and decreasing the quantity of sludge disposed. Around 53% reduction in fresh
water consumption was measured. Moreover, the quality of water being recirculated improved
significantly in terms of the level of turbidity in the water. Improving the quality of water
reduced machinery and equipment maintenance (changing of blades…) where the stone
powders in the water may cause polishing problems during the processing of natural stone and
may lead to clogging of pipes. Finally, sludge was properly managed and the quantity of sludge
being disposed was reduced by 80%.
The improvements in the efficiency of water and wastewater management is also resulting in
economic benefits due to reductions in:
Fresh water costs (water tankers…)
Machinery and equipment maintenance (changing of blades…)
Management of sludge piles, where generated sludge is occupying space, and is
incurring on the facility operational costs (machineries operation such as bobcats…)
Labor costs and time spent on the management of poorly operating wastewater
treatment system.
Nevertheless, several recommendations were identified to further improve environmental
management in the proposed facility. These recommendations are summarized below.
Consider rain water harvesting
Improve the efficiency of the wastewater treatment plant by:
o Applying the optimal dose and type of coagulant
o Inspecting the influent and effluent flow rates on a regular basis
Maintain or improve wastewater collection channels (i.e. increase height of sloping
sides) to avoid loss of water to the open ground
Regularly inspect the wastewater canals and bunds to prevent blockages

WELI Annex 06- Usine Nationale Des Blocs Et Carreaux
Geoflint s.a.r.l, Lebanon 8 Leb-Zouk Mosbeh–Water Audit-July 2019
8. References
Ersoy, B., Tosun, I., Günay, A., & Dikmen, S. (2009). Turbidity removal from wastewaters
of natural stone processing by coagulation/flocculation methods. CLEAN–Soil, Air,
Water, 37(3), 225-232.
Sadler, B. (1988) The evaluation of assessment: post-EIS research and process development,
in: P. Wathern (Ed) Environmental Impact Assessment: Theory and Practice (London,
Unwin Hyman).
Taşdemir, T., & Kurama, H. (2013). Fine particle removal from natural stone processing
effluent by flocculation. Environmental Progress & Sustainable Energy, 32(2), 317-324.

ANNEX 07
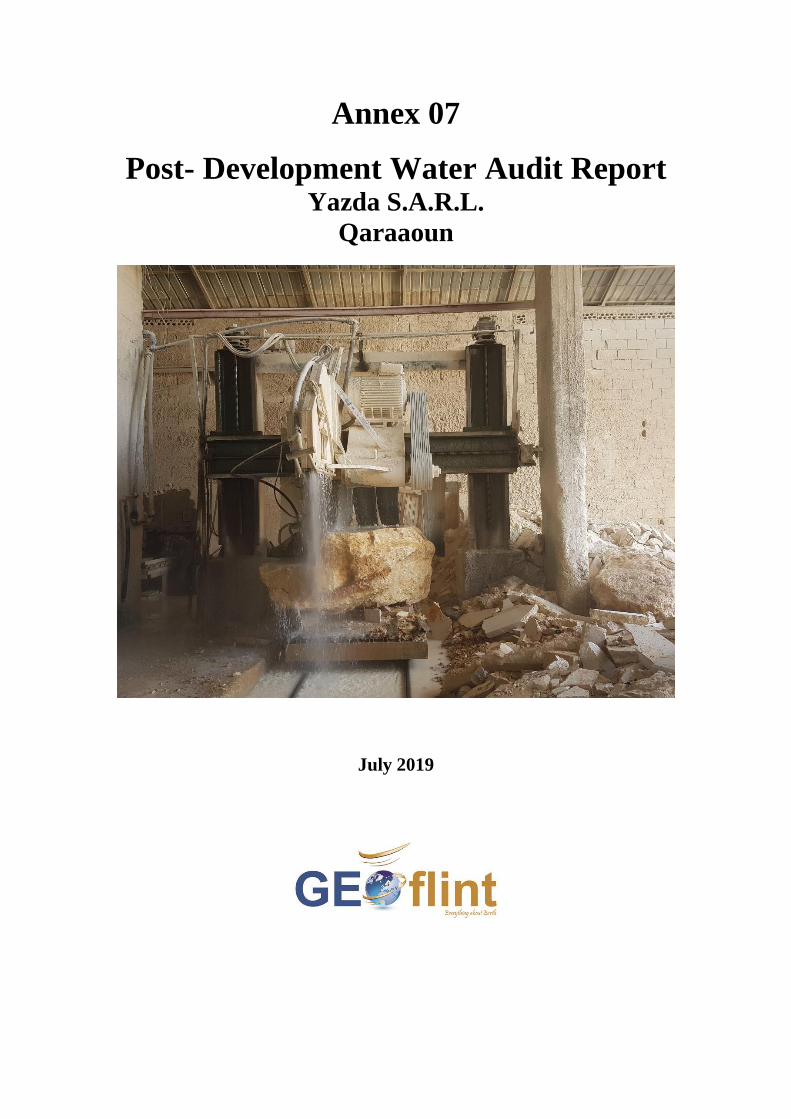
Annex 07
Post- Development Water Audit Report Yazda S.A.R.L.
Qaraaoun
July 2019
WELI Annex 07-Yazda Company SARL
Geoflint s.a.r.l, Lebanon ii Leb-Qaraaoun–Water Audit-July 2019
Table of Contents
Executive Summary ................................................................................................................. iii 1. Background Information .................................................................................................... 1 2. Introduction ........................................................................................................................ 2
3. Scope of Work ................................................................................................................... 2 4. Summary of Water Audit in the Pre-Development Phase ................................................. 2 5. Developed Improvements in Wastewater Management Systems ...................................... 3 6. Water Balance (Post- Development) ................................................................................. 6 7. Conclusion and Recommendations .................................................................................... 8
8. References .......................................................................................................................... 9
List of Figures
Figure 1Pre-development water balance .................................................................................... 3 Figure 2 Schematic flowchart of the wastewater management system ..................................... 4 Figure 3 Settlement silo ............................................................................................................. 5 Figure 4 Filter press ................................................................................................................... 6 Figure 5Post- development water balance ................................................................................. 7
List of Tables
Table 1 Summary of audits results........................................................................................... iii
Table 1-1General Information ................................................................................................... 1 Table 3 General information about the audited facility ............................................................. 3
Table 4 Pre-development audit findings .................................................................................... 3 Table 5 Analysis of the existing wastewater treatment effluent ................................................ 6 Table 6 Summary of Calculations.............................................................................................. 7
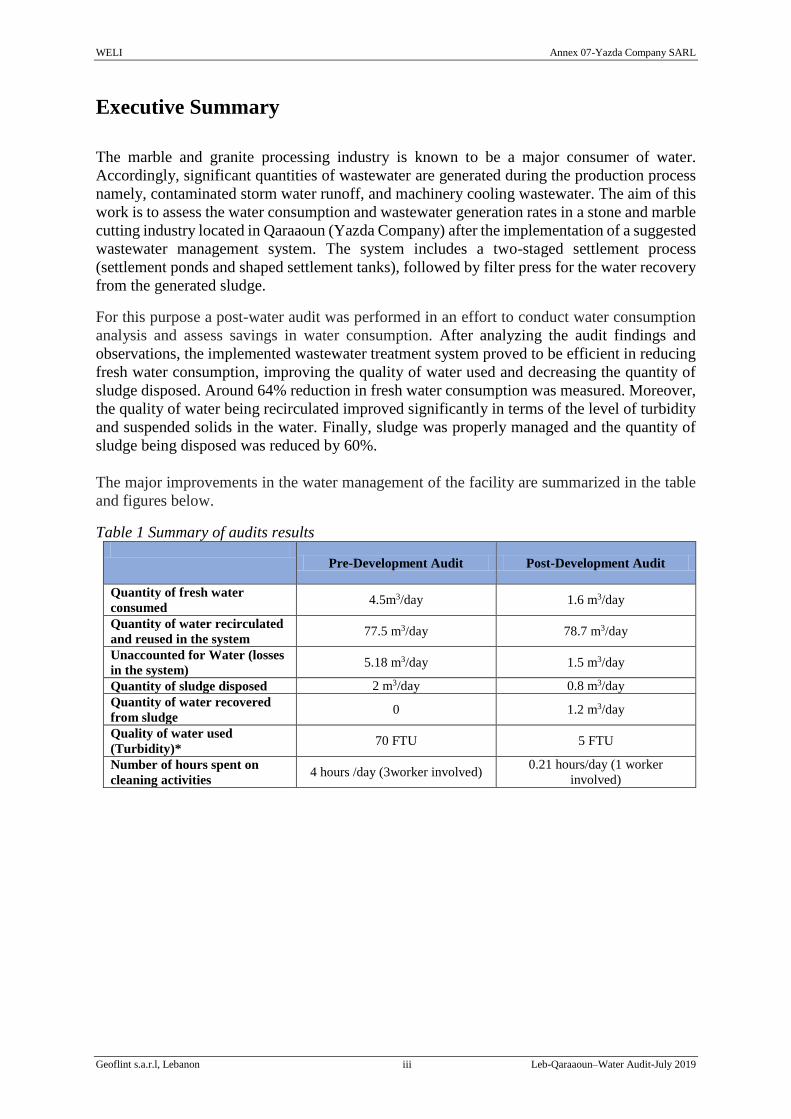
WELI Annex 07-Yazda Company SARL
Geoflint s.a.r.l, Lebanon iii Leb-Qaraaoun–Water Audit-July 2019
Executive Summary
The marble and granite processing industry is known to be a major consumer of water.
Accordingly, significant quantities of wastewater are generated during the production process
namely, contaminated storm water runoff, and machinery cooling wastewater. The aim of this
work is to assess the water consumption and wastewater generation rates in a stone and marble
cutting industry located in Qaraaoun (Yazda Company) after the implementation of a suggested
wastewater management system. The system includes a two-staged settlement process
(settlement ponds and shaped settlement tanks), followed by filter press for the water recovery
from the generated sludge.
For this purpose a post-water audit was performed in an effort to conduct water consumption
analysis and assess savings in water consumption. After analyzing the audit findings and
observations, the implemented wastewater treatment system proved to be efficient in reducing
fresh water consumption, improving the quality of water used and decreasing the quantity of
sludge disposed. Around 64% reduction in fresh water consumption was measured. Moreover,
the quality of water being recirculated improved significantly in terms of the level of turbidity
and suspended solids in the water. Finally, sludge was properly managed and the quantity of
sludge being disposed was reduced by 60%.
The major improvements in the water management of the facility are summarized in the table
and figures below.
Table 1 Summary of audits results
Pre-Development Audit Post-Development Audit
Quantity of fresh water
consumed 4.5m3/day 1.6 m3/day
Quantity of water recirculated
and reused in the system 77.5 m3/day 78.7 m3/day
Unaccounted for Water (losses
in the system) 5.18 m3/day 1.5 m3/day
Quantity of sludge disposed 2 m3/day 0.8 m3/day
Quantity of water recovered
from sludge 0 1.2 m3/day
Quality of water used
(Turbidity)* 70 FTU 5 FTU
Number of hours spent on
cleaning activities 4 hours /day (3worker involved)
0.21 hours/day (1 worker
involved)
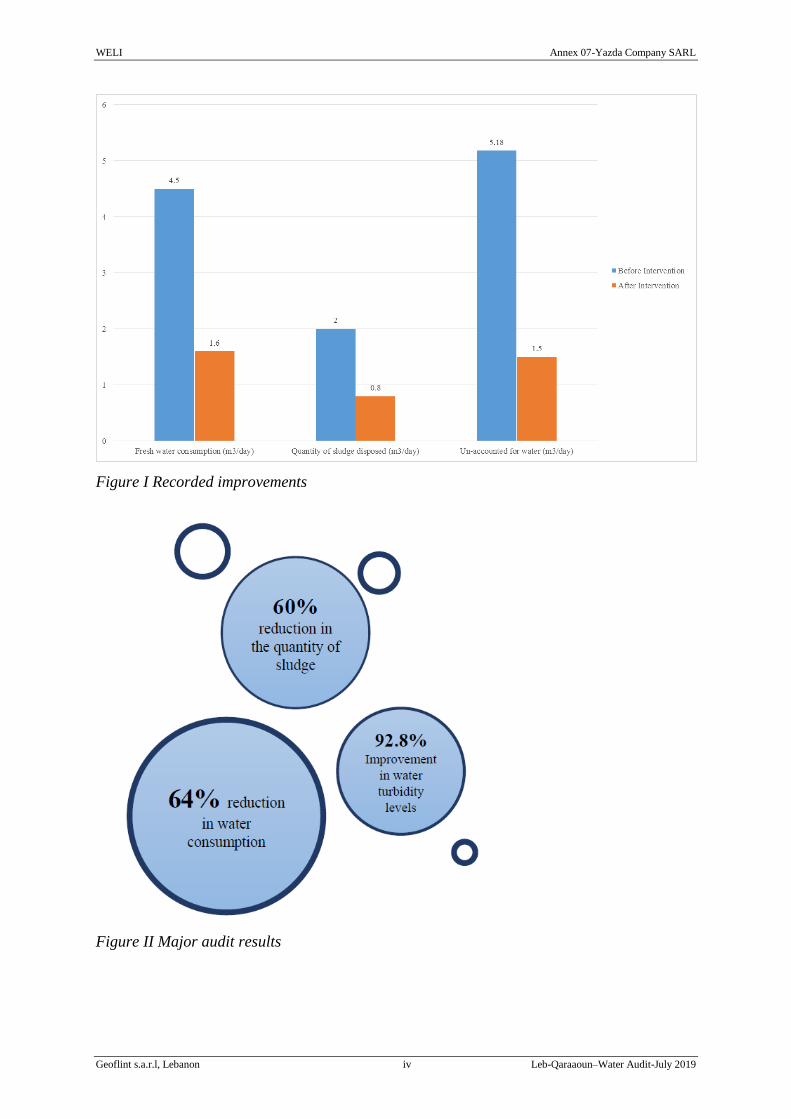
WELI Annex 07-Yazda Company SARL
Geoflint s.a.r.l, Lebanon iv Leb-Qaraaoun–Water Audit-July 2019
Figure I Recorded improvements
Figure II Major audit results
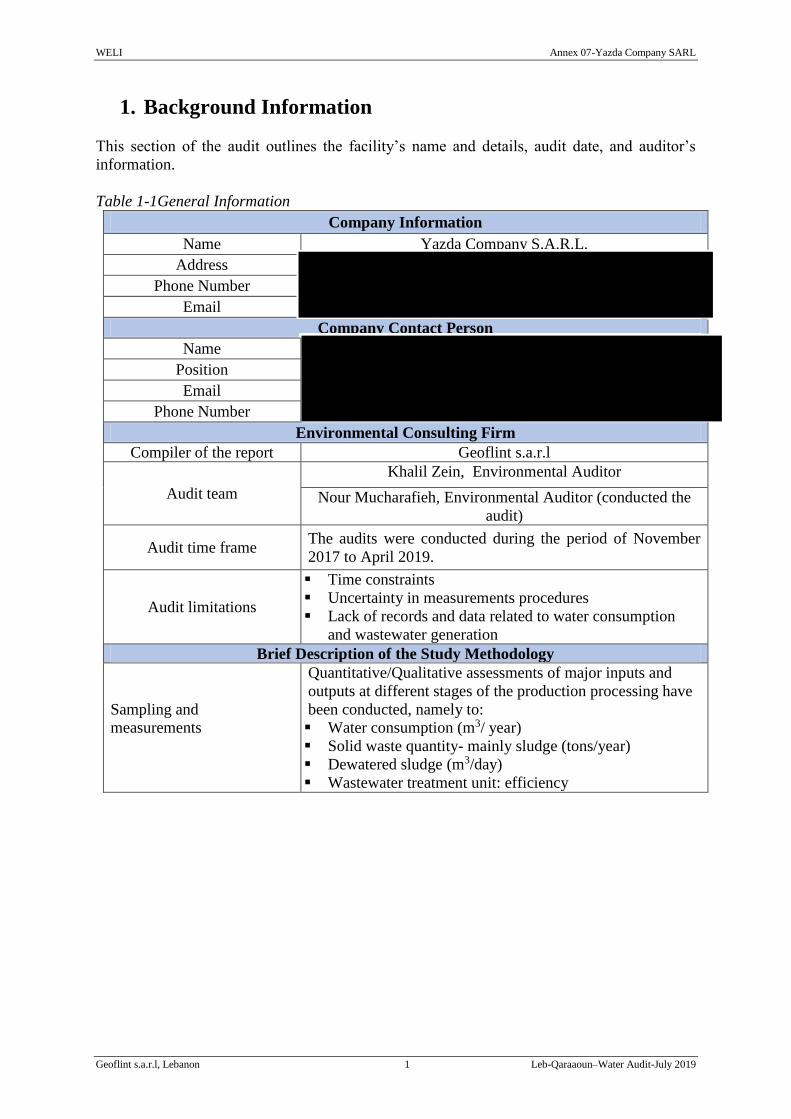
WELI Annex 07-Yazda Company SARL
Geoflint s.a.r.l, Lebanon 1 Leb-Qaraaoun–Water Audit-July 2019
1. Background Information
This section of the audit outlines the facility’s name and details, audit date, and auditor’s
information.
Table 1-1General Information
Company Information
Name Yazda Company S.A.R.L.
Address
Phone Number
Company Contact Person
Name
Position
Phone Number
Environmental Consulting Firm
Compiler of the report Geoflint s.a.r.l
Audit team
Khalil Zein, Environmental Auditor
Nour Mucharafieh, Environmental Auditor (conducted the
audit)
Audit time frame The audits were conducted during the period of November
2017 to April 2019.
Audit limitations
Time constraints
Uncertainty in measurements procedures
Lack of records and data related to water consumption
and wastewater generation
Brief Description of the Study Methodology
Sampling and
measurements
Quantitative/Qualitative assessments of major inputs and
outputs at different stages of the production processing have
been conducted, namely to:
Water consumption (m3/ year)
Solid waste quantity- mainly sludge (tons/year)
Dewatered sludge (m3/day)
Wastewater treatment unit: efficiency
WELI Annex 07-Yazda Company SARL
Geoflint s.a.r.l, Lebanon 2 Leb-Qaraaoun–Water Audit-July 2019
2. Introduction
Natural stones (such as marble, granite…etc.) are materials which have been extensively used
for a variety of building applications since ancient times. This reflects the belief that stones are
sustainable and durable material for construction works (Taşdemir, Kurama, 2013).
The marble and granite processing industry is known to be a major consumer of water.
Significant quantities of water are consumed to cool the saws during the production process
and to polish the final product. Accordingly, significant quantities of wastewater is generated
during the production process namely, contaminated storm water runoff, and machinery
cooling wastewater. Major environmental concerns are associated with the generated
wastewater considering its high alkalinity, and high levels of Total Suspended Solids (TSS).
Fine particles (<0.2 mm) are generated during the cutting and polishing processes, where
around 25-40% of the weight of the block is produced as fine particles during the cutting
process. Thus, large amounts of water is used to capture the produced particles (Taşdemir,
Kurama, 2013). In general, wastewater is treated by simple solid–liquid separation and is then
reused in the process. If the turbidity of the reused water is higher than acceptable values, the
stone powders in the water may cause polishing problems during the processing of natural stone
and may lead to clogging of pipes. Consequently, the maximum (residual) turbidity of the clean
water should be less than 15 Nephelometric Turbidity Units (NTU) (Ersoy, Tosun, et al., 2009).
Moreover, if the generated wastewater is not managed properly, it would negatively affect the
physical, biological and chemical characteristics of both the local water and soil quality,
resulting in inevitable implications on both the environment and the public health. In this
context, a water audit was conducted for the marble and granite processing facility in Qaraaoun
(Yazda Company SARL) in order to assess the water consumption within the facility and to
identify opportunities to improve water use efficiency.
3. Scope of Work
The aim of this post development audit is to compare the impacts of water consumption that
were assessed in the environmental audit conducted prior to project implementation with those
that actually arose after the implementation of the proposed interventions. Post-development
audit has an important role in improving the future performance and utility of the project.
Moreover, this process of comparing predictions versus actual or reflective assessment is of
great importance to sustainability of projects (Sadler, 1988).
This work will assess water consumption and wastewater generation rates after the
implementation of the wastewater management systems. For this purpose a post-water audit
was performed in an effort to conduct water consumption analysis and assess savings in water
consumption.
4. Summary of Water Audit in the Pre-Development Phase
The table below summarizes general information and description of the audited facility. These
data were provided by the manager of the audited facility during the initial site visit.
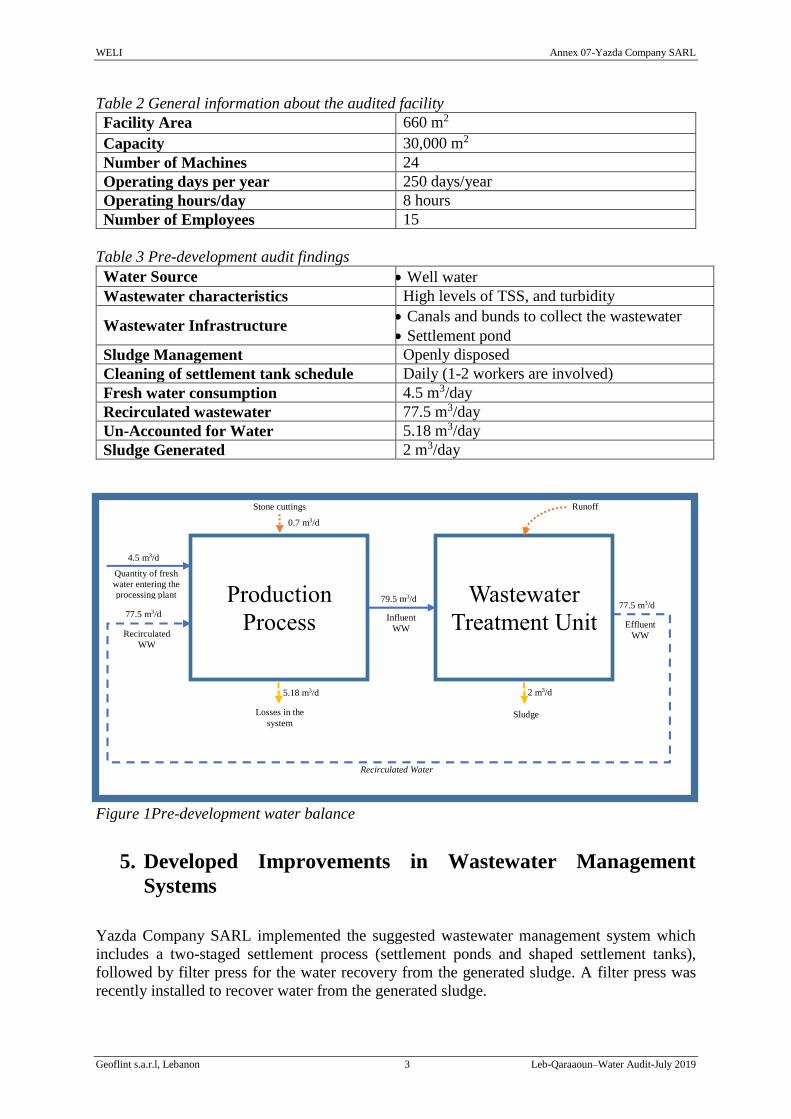
WELI Annex 07-Yazda Company SARL
Geoflint s.a.r.l, Lebanon 3 Leb-Qaraaoun–Water Audit-July 2019
Table 2 General information about the audited facility
Facility Area 660 m2
Capacity 30,000 m2
Number of Machines 24
Operating days per year 250 days/year
Operating hours/day 8 hours
Number of Employees 15
Table 3 Pre-development audit findings
Water Source Well water
Wastewater characteristics High levels of TSS, and turbidity
Wastewater Infrastructure Canals and bunds to collect the wastewater
Settlement pond
Sludge Management Openly disposed
Cleaning of settlement tank schedule Daily (1-2 workers are involved)
Fresh water consumption 4.5 m3/day
Recirculated wastewater 77.5 m3/day
Un-Accounted for Water 5.18 m3/day
Sludge Generated 2 m3/day
5. Developed Improvements in Wastewater Management
Systems
Yazda Company SARL implemented the suggested wastewater management system which
includes a two-staged settlement process (settlement ponds and shaped settlement tanks),
followed by filter press for the water recovery from the generated sludge. A filter press was
recently installed to recover water from the generated sludge.
Production
Process
Wastewater
Treatment Unit
Quantity of fresh
water entering the
processing plant
Influent
WW
Losses in the
system
Effluent
WW Recirculated
WW
Stone cuttings
Recirculated Water
Runoff
4.5 m3/d
77.5 m3/d
5.18 m3/d 2 m3/d
0.7 m3/d
79.5 m3/d 77.5 m3/d
Sludge
Figure 1Pre-development water balance
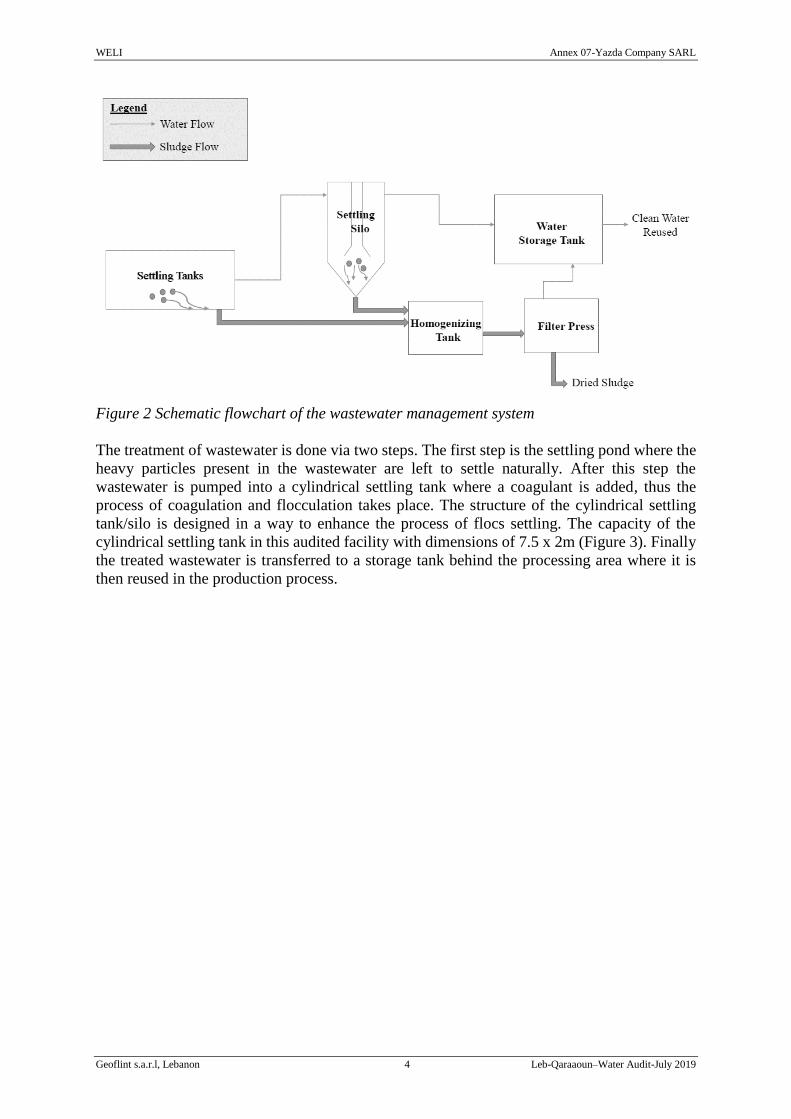
WELI Annex 07-Yazda Company SARL
Geoflint s.a.r.l, Lebanon 4 Leb-Qaraaoun–Water Audit-July 2019
Figure 2 Schematic flowchart of the wastewater management system
The treatment of wastewater is done via two steps. The first step is the settling pond where the
heavy particles present in the wastewater are left to settle naturally. After this step the
wastewater is pumped into a cylindrical settling tank where a coagulant is added, thus the
process of coagulation and flocculation takes place. The structure of the cylindrical settling
tank/silo is designed in a way to enhance the process of flocs settling. The capacity of the
cylindrical settling tank in this audited facility with dimensions of 7.5 x 2m (Figure 3). Finally
the treated wastewater is transferred to a storage tank behind the processing area where it is
then reused in the production process.
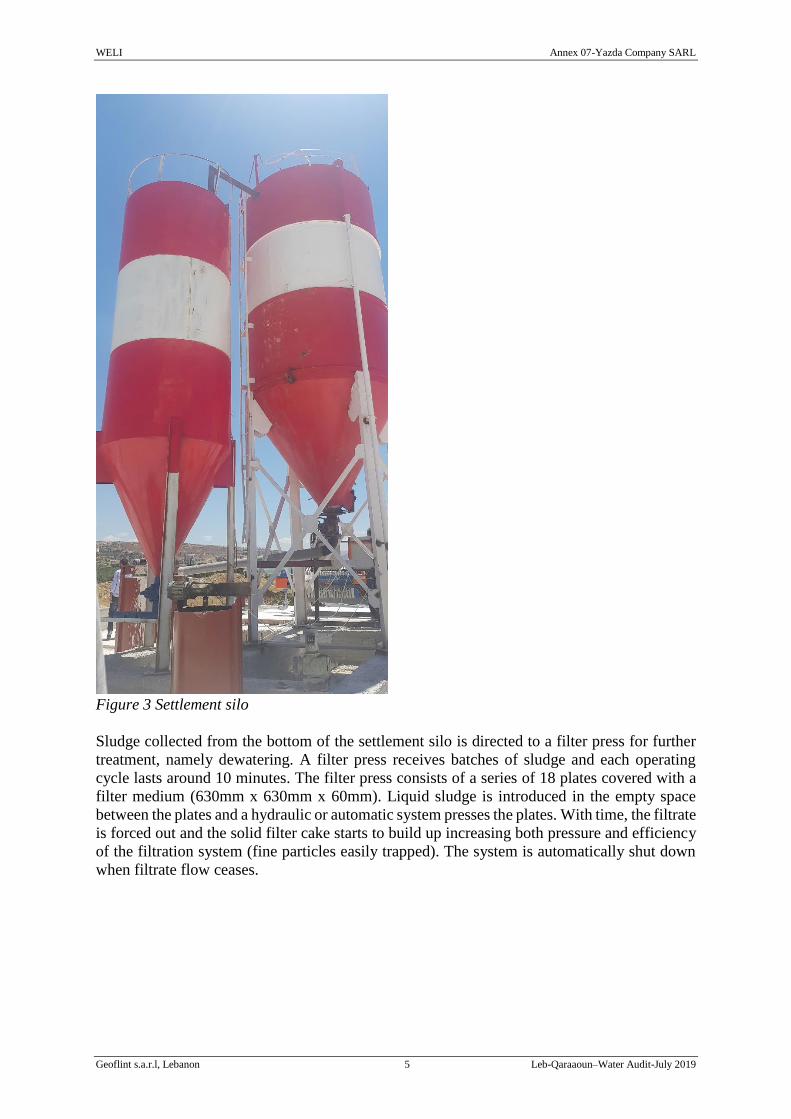
WELI Annex 07-Yazda Company SARL
Geoflint s.a.r.l, Lebanon 5 Leb-Qaraaoun–Water Audit-July 2019
Figure 3 Settlement silo
Sludge collected from the bottom of the settlement silo is directed to a filter press for further
treatment, namely dewatering. A filter press receives batches of sludge and each operating
cycle lasts around 10 minutes. The filter press consists of a series of 18 plates covered with a
filter medium (630mm x 630mm x 60mm). Liquid sludge is introduced in the empty space
between the plates and a hydraulic or automatic system presses the plates. With time, the filtrate
is forced out and the solid filter cake starts to build up increasing both pressure and efficiency
of the filtration system (fine particles easily trapped). The system is automatically shut down
when filtrate flow ceases.
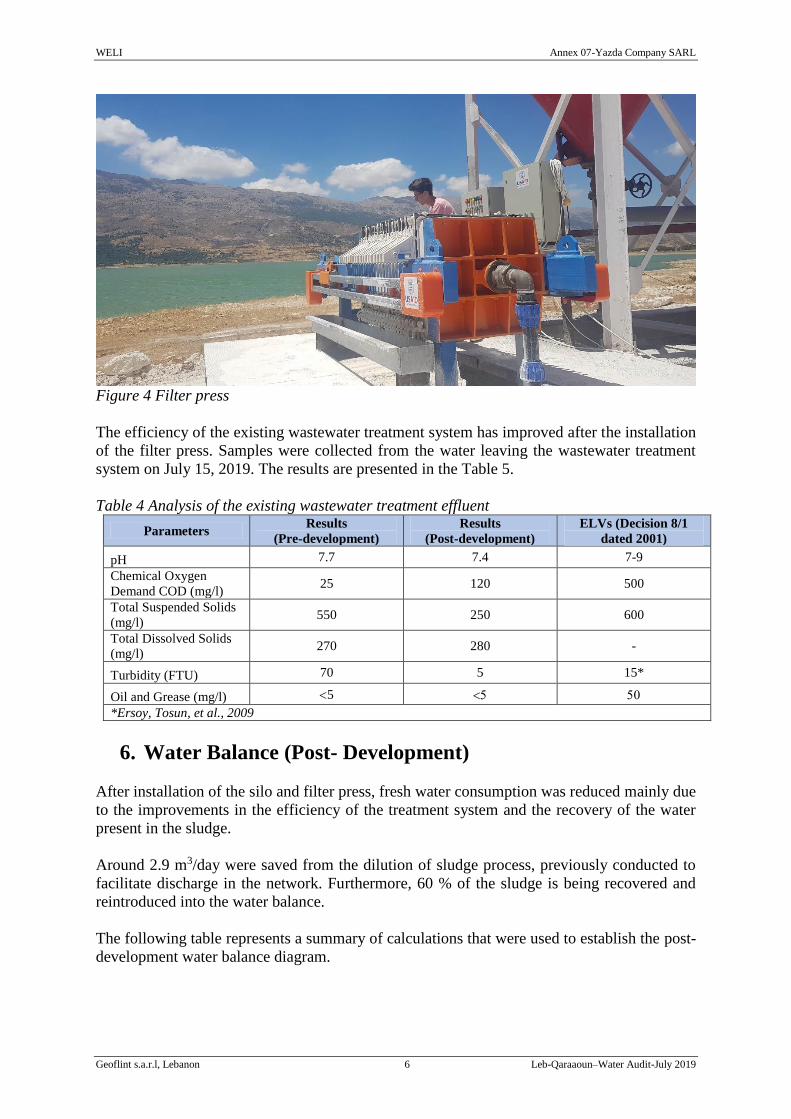
WELI Annex 07-Yazda Company SARL
Geoflint s.a.r.l, Lebanon 6 Leb-Qaraaoun–Water Audit-July 2019
Figure 4 Filter press
The efficiency of the existing wastewater treatment system has improved after the installation
of the filter press. Samples were collected from the water leaving the wastewater treatment
system on July 15, 2019. The results are presented in the Table 5.
Table 4 Analysis of the existing wastewater treatment effluent
Parameters Results
(Pre-development)
Results
(Post-development)
ELVs (Decision 8/1
dated 2001)
pH 7.7 7.4 7-9
Chemical Oxygen
Demand COD (mg/l) 25 120 500
Total Suspended Solids
(mg/l) 550 250 600
Total Dissolved Solids
(mg/l) 270 280 -
Turbidity (FTU) 70 5 15*
Oil and Grease (mg/l) 5
*Ersoy, Tosun, et al., 2009
6. Water Balance (Post- Development)
After installation of the silo and filter press, fresh water consumption was reduced mainly due
to the improvements in the efficiency of the treatment system and the recovery of the water
present in the sludge.
Around 2.9 m3/day were saved from the dilution of sludge process, previously conducted to
facilitate discharge in the network. Furthermore, 60 % of the sludge is being recovered and
reintroduced into the water balance.
The following table represents a summary of calculations that were used to establish the post-
development water balance diagram.
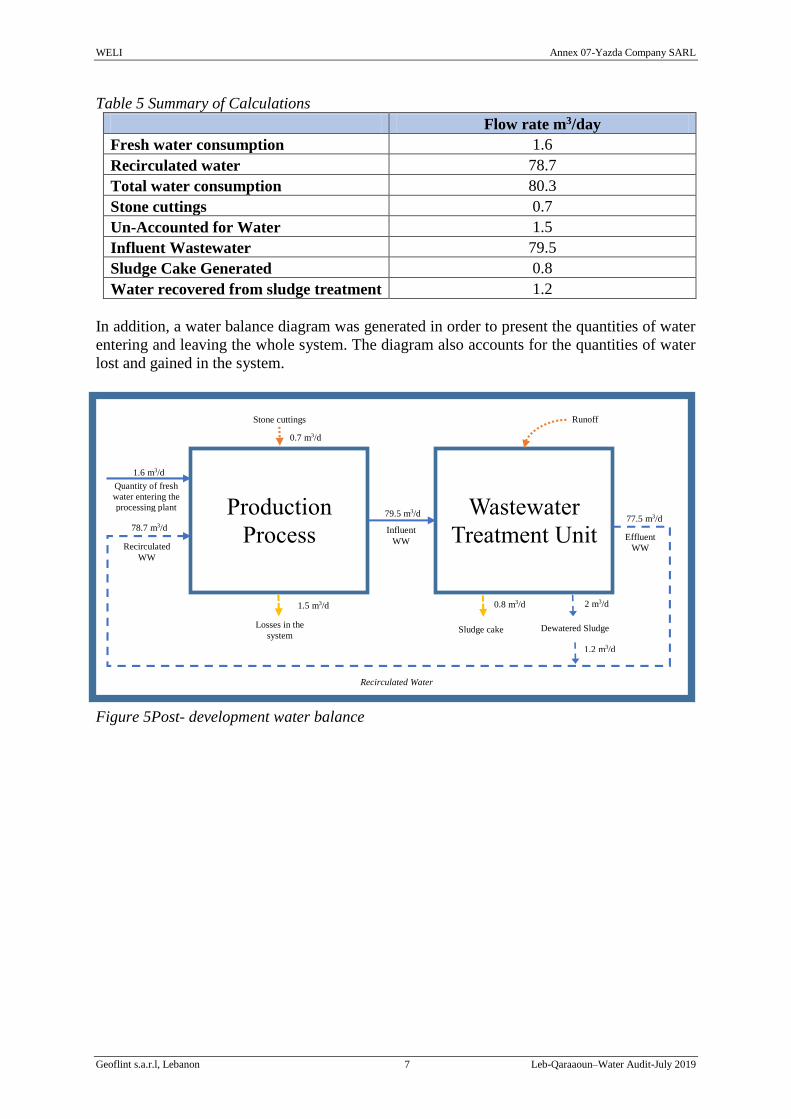
WELI Annex 07-Yazda Company SARL
Geoflint s.a.r.l, Lebanon 7 Leb-Qaraaoun–Water Audit-July 2019
Table 5 Summary of Calculations
Flow rate m3/day
Fresh water consumption 1.6
Recirculated water 78.7
Total water consumption 80.3
Stone cuttings 0.7
Un-Accounted for Water 1.5
Influent Wastewater 79.5
Sludge Cake Generated 0.8
Water recovered from sludge treatment 1.2
In addition, a water balance diagram was generated in order to present the quantities of water
entering and leaving the whole system. The diagram also accounts for the quantities of water
lost and gained in the system.
Figure 5Post- development water balance
Production
Process
Wastewater
Treatment Unit
Quantity of fresh
water entering the
processing plant
Influent
WW
Losses in the
system
Effluent
WW Recirculated
WW
Stone cuttings
Recirculated Water
Runoff
0.7 m3/d
1.6 m3/d
0.8 m3/d
77.5 m3/d 79.5 m3/d
78.7 m3/d
1.5 m3/d
Sludge cake Dewatered Sludge
2 m3/d
1.2 m3/d
WELI Annex 07-Yazda Company SARL
Geoflint s.a.r.l, Lebanon 8 Leb-Qaraaoun–Water Audit-July 2019
7. Conclusion and Recommendations
After analyzing the audit findings and observations, the implemented wastewater treatment
system proved to be efficient in reducing fresh water consumption, improving the quality of
water used and decreasing the quantity of sludge disposed. Around 64% reduction in fresh
water consumption was measured. Moreover, the quality of water being recirculated improved
significantly in terms of the level of turbidity in the water. Improving the quality of water
reduced machinery and equipment maintenance (changing of blades…) where the stone
powders in the water may cause polishing problems during the processing of natural stone and
may lead to clogging of pipes. Finally, sludge was properly managed and the quantity of sludge
being disposed was reduced by 60%.
The improvements in the efficiency of water and wastewater management is also resulting in
economic benefits due to reductions in:
Fresh water costs (water tankers…)
Machinery and equipment maintenance (changing of blades…)
Management of sludge piles, where generated sludge is occupying space, and is
incurring on the facility operational costs (machineries operation such as bobcats…)
Labor costs and time spent on the management of poorly operating wastewater
treatment system.
Nevertheless, several recommendations were identified to further improve environmental
management in the proposed facility. These recommendations are summarized below.
Consider rain water harvesting
Improve the efficiency of the wastewater treatment plant by:
o Applying the optimal dose and type of coagulant
o Inspecting the influent and effluent flow rates on a regular basis
Maintain or improve wastewater collection channels (i.e. increase height of sloping
sides) to avoid loss of water to the open ground
Regularly inspect the wastewater canals and bunds to prevent blockages
WELI Annex 07-Yazda Company SARL
Geoflint s.a.r.l, Lebanon 9 Leb-Qaraaoun–Water Audit-July 2019
8. References
Ersoy, B., Tosun, I., Günay, A., & Dikmen, S. (2009). Turbidity removal from wastewaters
of natural stone processing by coagulation/flocculation methods. CLEAN–Soil, Air,
Water, 37(3), 225-232.
Sadler, B. (1988) The evaluation of assessment: post-EIS research and process development,
in: P. Wathern (Ed) Environmental Impact Assessment: Theory and Practice (London,
Unwin Hyman).
Taşdemir, T., & Kurama, H. (2013). Fine particle removal from natural stone processing
effluent by flocculation. Environmental Progress & Sustainable Energy, 32(2), 317-324.

ANNEX 08
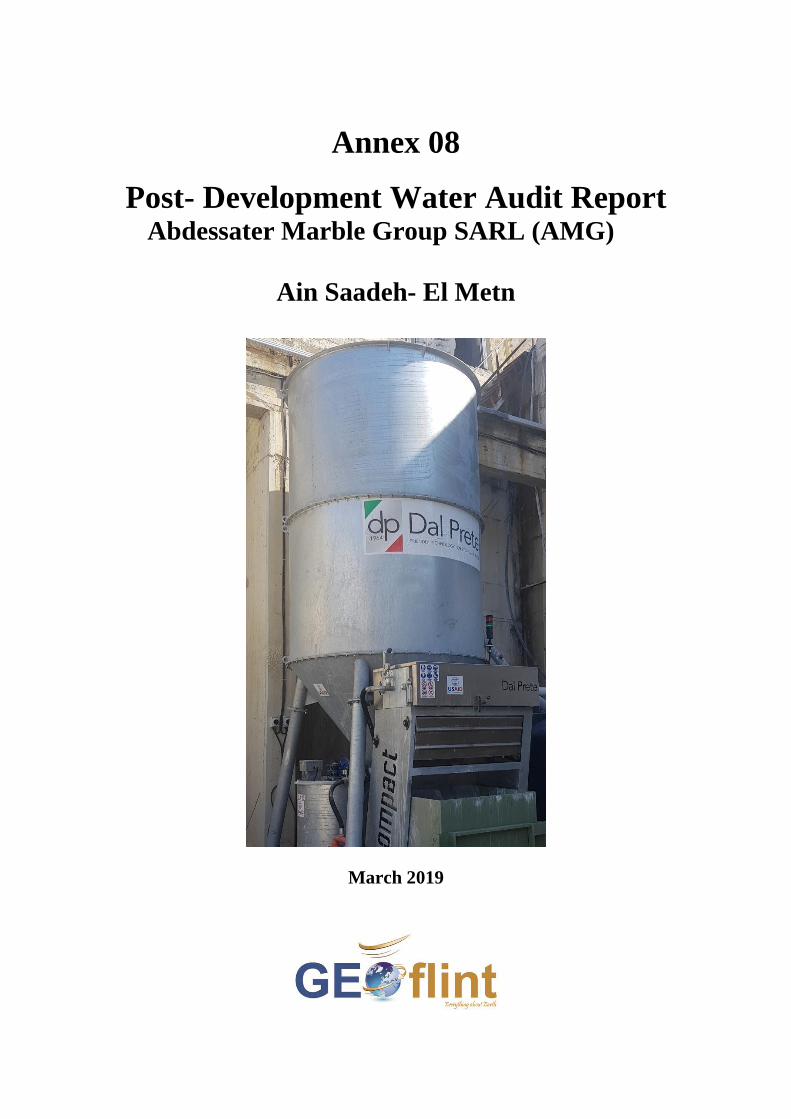
Annex 08
Post- Development Water Audit Report Abdessater Marble Group SARL (AMG)
Ain Saadeh- El Metn
March 2019
Table of Contents
Executive Summary ................................................................................................................. iii 1. Background Information .................................................................................................. iii 2. Introduction ........................................................................................................................ 4 3. Scope of Work ................................................................................................................... 4
4. Summary of Water Audit in the Pre-Development Phase ................................................. 4 5. Developed Improvements in Wastewater Management Systems ...................................... 6 6. Water Balance (Post- Development) ................................................................................. 8 7. Conclusion and Recommendations .................................................................................. 10 8. References ........................................................................................................................ 11
List of Figures
Figure 1 Major audit results ...................................................................................................... iv Figure 4-1Pre-development water balance ................................................................................ 5 Figure 2 Schematic flowchart of the wastewater management system ..................................... 6 Figure 3 Settling pond ................................................................................................................ 7
Figure 4Installed settlement silo and filter press (compact design) ........................................... 7
Figure 5Post- development water balance ................................................................................. 9
List of Tables
Table 1 Summary of audits results........................................................................................... iii
Table 2General Information ..................................................................................................... iii Table 3 General information about the audited facility ............................................................. 5
Table 4 Pre-development audit findings .................................................................................... 5 Table 5 Analysis of the existing wastewater treatment effluent ................................................ 8
Table 6 Summary of Calculations.............................................................................................. 8
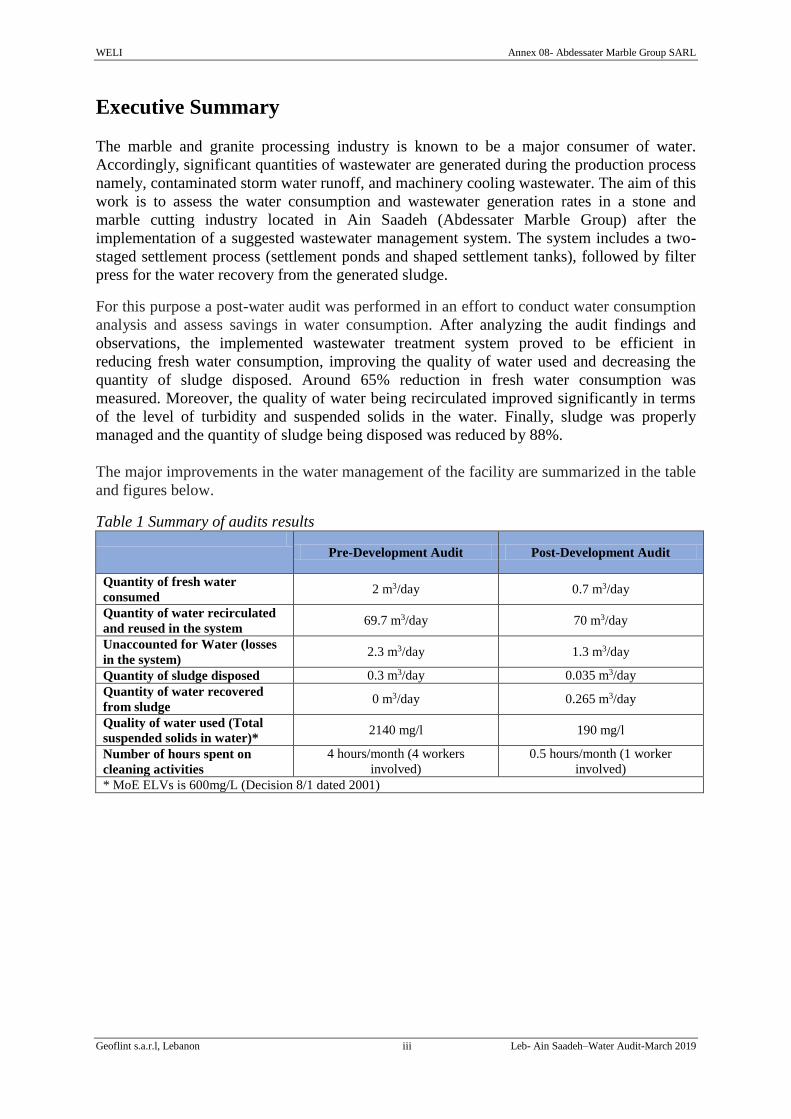
WELI Annex 08- Abdessater Marble Group SARL
Geoflint s.a.r.l, Lebanon iii Leb- Ain Saadeh–Water Audit-March 2019
Executive Summary
The marble and granite processing industry is known to be a major consumer of water.
Accordingly, significant quantities of wastewater are generated during the production process
namely, contaminated storm water runoff, and machinery cooling wastewater. The aim of this
work is to assess the water consumption and wastewater generation rates in a stone and
marble cutting industry located in Ain Saadeh (Abdessater Marble Group) after the
implementation of a suggested wastewater management system. The system includes a two-
staged settlement process (settlement ponds and shaped settlement tanks), followed by filter
press for the water recovery from the generated sludge.
For this purpose a post-water audit was performed in an effort to conduct water consumption
analysis and assess savings in water consumption. After analyzing the audit findings and
observations, the implemented wastewater treatment system proved to be efficient in
reducing fresh water consumption, improving the quality of water used and decreasing the
quantity of sludge disposed. Around 65% reduction in fresh water consumption was
measured. Moreover, the quality of water being recirculated improved significantly in terms
of the level of turbidity and suspended solids in the water. Finally, sludge was properly
managed and the quantity of sludge being disposed was reduced by 88%.
The major improvements in the water management of the facility are summarized in the table
and figures below.
Table 1 Summary of audits results
Pre-Development Audit Post-Development Audit
Quantity of fresh water
consumed 2 m3/day 0.7 m3/day
Quantity of water recirculated
and reused in the system 69.7 m3/day 70 m3/day
Unaccounted for Water (losses
in the system) 2.3 m3/day 1.3 m3/day
Quantity of sludge disposed 0.3 m3/day 0.035 m3/day
Quantity of water recovered
from sludge 0 m3/day 0.265 m3/day
Quality of water used (Total
suspended solids in water)* 2140 mg/l 190 mg/l
Number of hours spent on
cleaning activities
4 hours/month (4 workers
involved)
0.5 hours/month (1 worker
involved)
* MoE ELVs is 600mg/L (Decision 8/1 dated 2001)
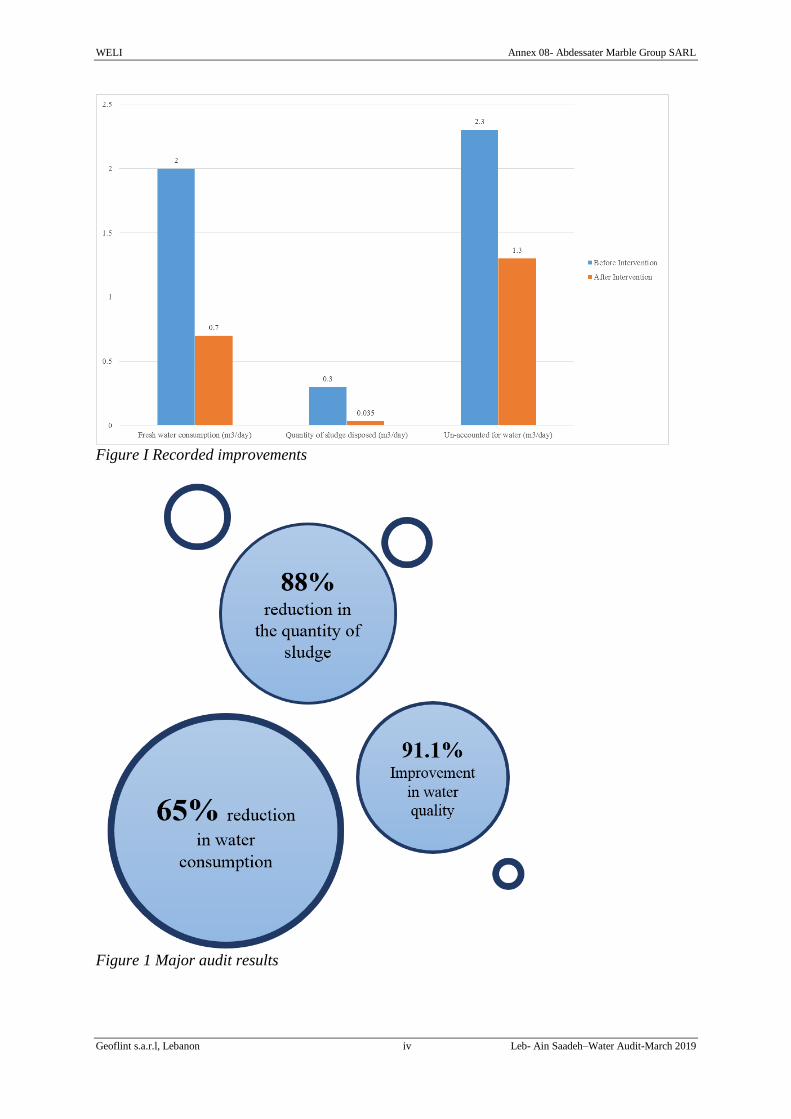
WELI Annex 08- Abdessater Marble Group SARL
Geoflint s.a.r.l, Lebanon iv Leb- Ain Saadeh–Water Audit-March 2019
Figure I Recorded improvements
Figure 1 Major audit results
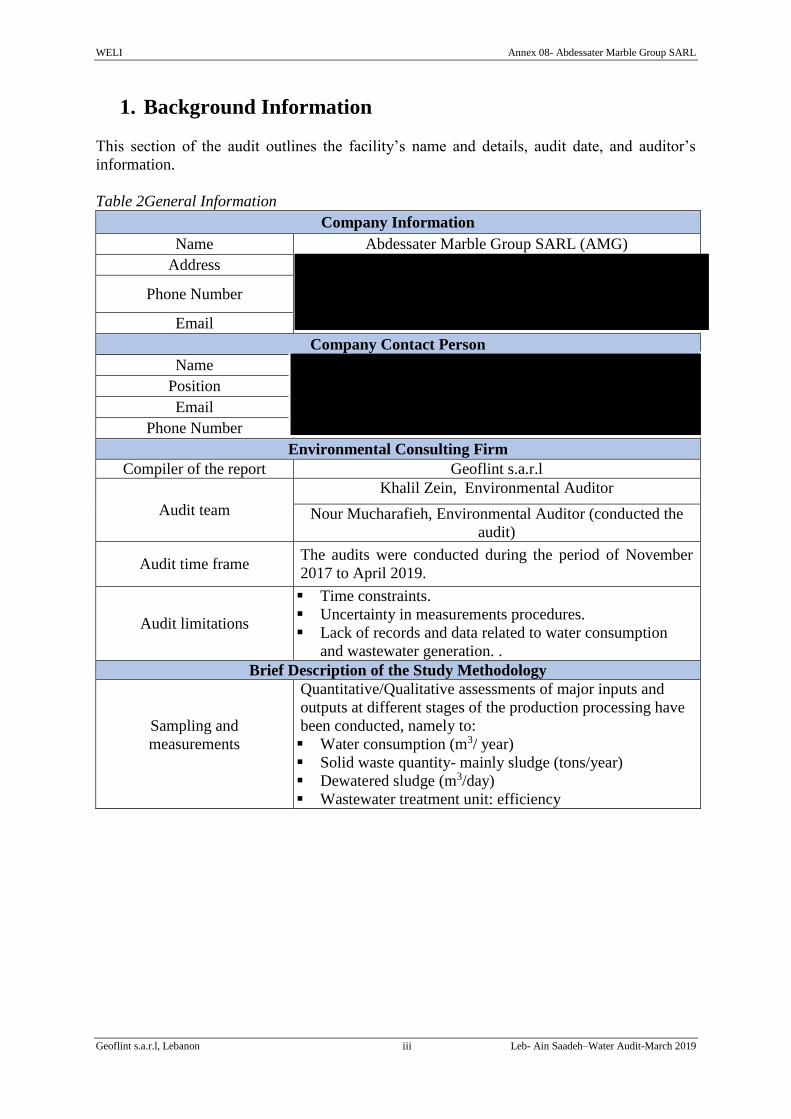
WELI Annex 08- Abdessater Marble Group SARL
Geoflint s.a.r.l, Lebanon iii Leb- Ain Saadeh–Water Audit-March 2019
1. Background Information
This section of the audit outlines the facility’s name and details, audit date, and auditor’s
information.
Table 2General Information
Company Information
Name Abdessater Marble Group SARL (AMG)
Address
Phone Number
Company Contact Person
Name
Position
Phone Number
Environmental Consulting Firm
Compiler of the report Geoflint s.a.r.l
Audit team
Khalil Zein, Environmental Auditor
Nour Mucharafieh, Environmental Auditor (conducted the
audit)
Audit time frame The audits were conducted during the period of November
2017 to April 2019.
Audit limitations
Time constraints.
Uncertainty in measurements procedures.
Lack of records and data related to water consumption
and wastewater generation. .
Brief Description of the Study Methodology
Sampling and
measurements
Quantitative/Qualitative assessments of major inputs and
outputs at different stages of the production processing have
been conducted, namely to:
Water consumption (m3/ year)
Solid waste quantity- mainly sludge (tons/year)
Dewatered sludge (m3/day)
Wastewater treatment unit: efficiency

WELI Annex 08- Abdessater Marble Group SARL
Geoflint s.a.r.l, Lebanon 4 Leb- Ain Saadeh–Water Audit-March 2019
2. Introduction
Natural stones (such as marble, granite…etc.) are materials which have been extensively used
for a variety of building applications since ancient times. This reflects the belief that stones
are sustainable and durable material for construction works (Taşdemir, Kurama, 2013).
The marble and granite processing industry is known to be a major consumer of water.
Significant quantities of water are consumed to cool the saws during the production process
and to polish the final product. Accordingly, significant quantities of wastewater is generated
during the production process namely, contaminated storm water runoff, and machinery
cooling wastewater. Major environmental concerns are associated with the generated
wastewater considering its high alkalinity, and high levels of Total Suspended Solids (TSS).
Fine particles (<0.2 mm) are generated during the cutting and polishing processes, where
around 25-40% of the weight of the block is produced as fine particles during the cutting
process. Thus, large amounts of water is used to capture the produced particles (Taşdemir,
Kurama, 2013). In general, wastewater is treated by simple solid–liquid separation and is then
reused in the process. If the turbidity of the reused water is higher than acceptable values, the
stone powders in the water may cause polishing problems during the processing of natural
stone and may lead to clogging of pipes. Consequently, the maximum (residual) turbidity of
the clean water should be less than 15 Nephelometric Turbidity Units (NTU) (Ersoy, Tosun,
et al., 2009).
Moreover, if the generated wastewater is not managed properly, it would negatively affect the
physical, biological and chemical characteristics of both the local water and soil quality,
resulting in inevitable implications on both the environment and the public health. In this
context, a water audit was conducted for the marble and granite processing facility in Ain
Saadeh (Abdessater Marble Group SARL) in order to assess the water consumption within
the facility and to identify opportunities to improve water use efficiency.
3. Scope of Work
The aim of this post development audit is to compare the impacts of water consumption that
were assessed in the environmental audit conducted prior to project implementation with
those that actually arose after the implementation of the proposed interventions. Post-
development audit has an important role in improving the future performance and utility of
the project. Moreover, this process of comparing predictions versus actual or reflective
assessment is of great importance to sustainability of projects (Sadler, 1988).
This work will assess water consumption and wastewater generation rates after the
implementation of the wastewater management systems. For this purpose a post-water audit
was performed in an effort to conduct water consumption analysis and assess savings in water
consumption.
4. Summary of Water Audit in the Pre-Development Phase
The table below summarizes general information and description of the audited facility.
These data were provided by the manager of the audited facility during the initial site visit.
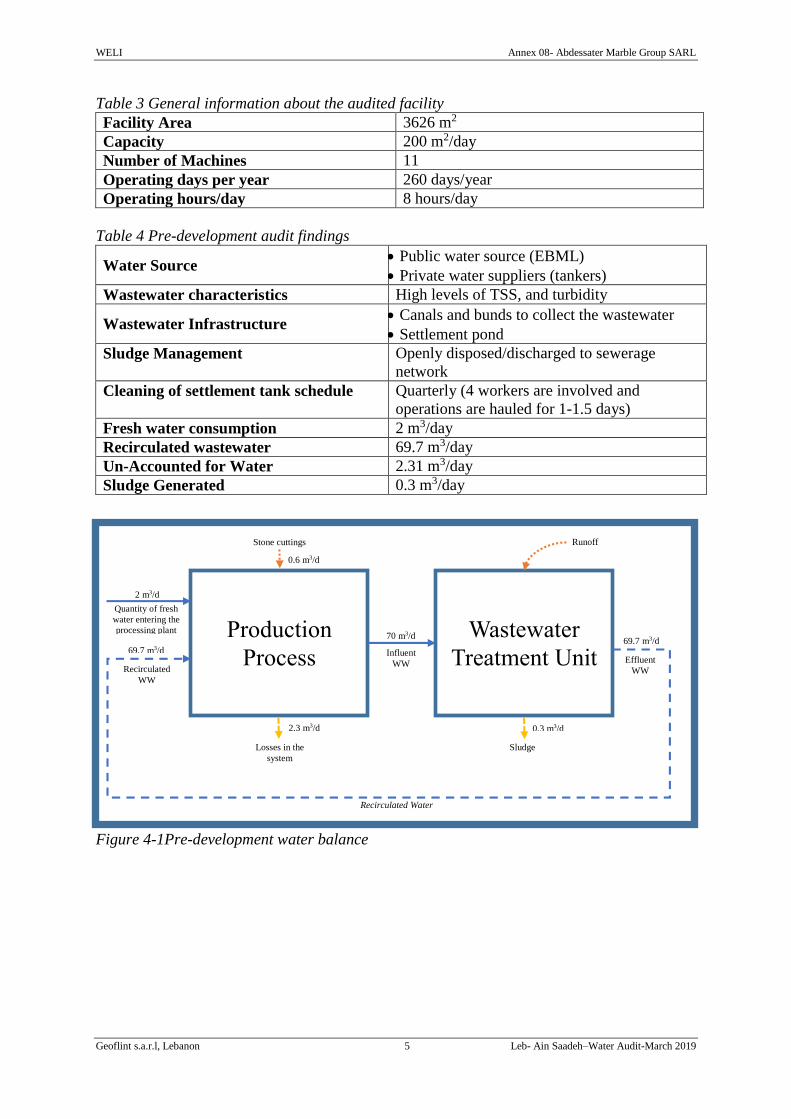
WELI Annex 08- Abdessater Marble Group SARL
Geoflint s.a.r.l, Lebanon 5 Leb- Ain Saadeh–Water Audit-March 2019
Table 3 General information about the audited facility
Facility Area 3626 m2
Capacity 200 m2/day
Number of Machines 11
Operating days per year 260 days/year
Operating hours/day 8 hours/day
Table 4 Pre-development audit findings
Water Source Public water source (EBML)
Private water suppliers (tankers)
Wastewater characteristics High levels of TSS, and turbidity
Wastewater Infrastructure Canals and bunds to collect the wastewater
Settlement pond
Sludge Management Openly disposed/discharged to sewerage
network
Cleaning of settlement tank schedule Quarterly (4 workers are involved and
operations are hauled for 1-1.5 days)
Fresh water consumption 2 m3/day
Recirculated wastewater 69.7 m3/day
Un-Accounted for Water 2.31 m3/day
Sludge Generated 0.3 m3/day
Figure 4-1Pre-development water balance
Production
Process
Wastewater
Treatment Unit
Quantity of fresh
water entering the
processing plant
Influent
WW
Losses in the
system
Effluent
WW Recirculated
WW
Stone cuttings
Recirculated Water
Runoff
0.6 m3/d
2 m3/d
Sludge
0.3 m3/d
69.7 m3/d 70 m3/d
69.7 m3/d
2.3 m3/d
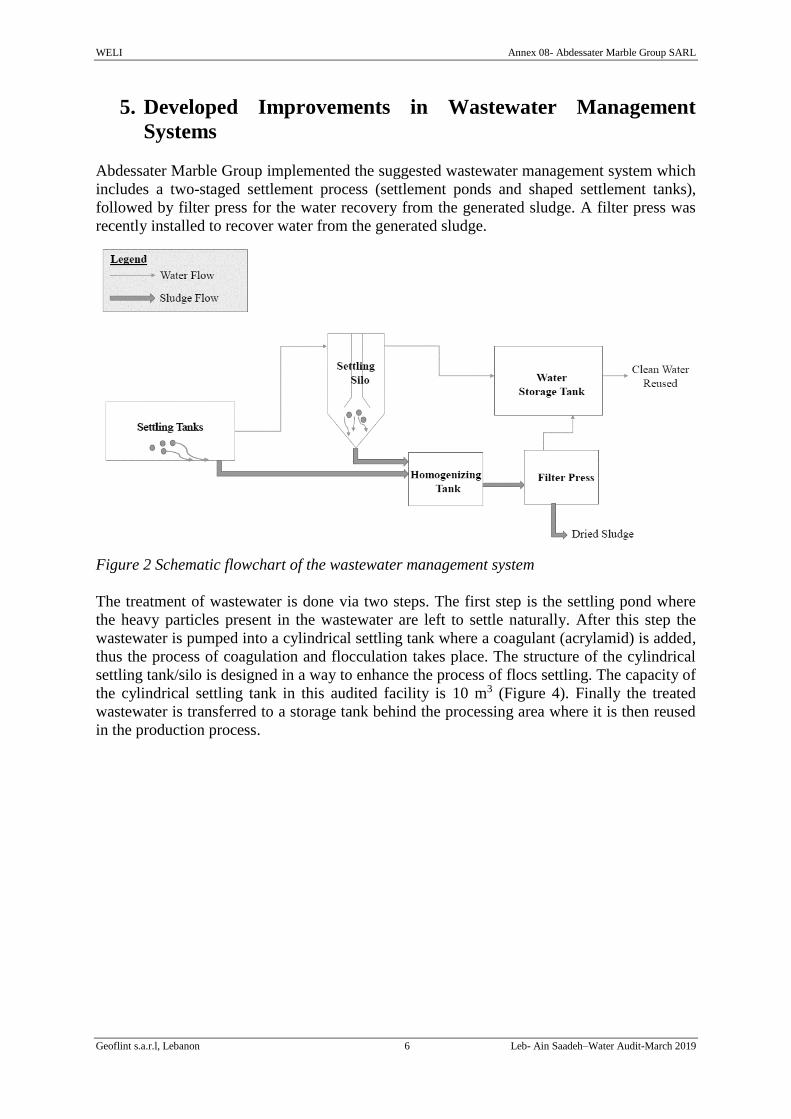
WELI Annex 08- Abdessater Marble Group SARL
Geoflint s.a.r.l, Lebanon 6 Leb- Ain Saadeh–Water Audit-March 2019
5. Developed Improvements in Wastewater Management
Systems
Abdessater Marble Group implemented the suggested wastewater management system which
includes a two-staged settlement process (settlement ponds and shaped settlement tanks),
followed by filter press for the water recovery from the generated sludge. A filter press was
recently installed to recover water from the generated sludge.
Figure 2 Schematic flowchart of the wastewater management system
The treatment of wastewater is done via two steps. The first step is the settling pond where
the heavy particles present in the wastewater are left to settle naturally. After this step the
wastewater is pumped into a cylindrical settling tank where a coagulant (acrylamid) is added,
thus the process of coagulation and flocculation takes place. The structure of the cylindrical
settling tank/silo is designed in a way to enhance the process of flocs settling. The capacity of
the cylindrical settling tank in this audited facility is 10 m3 (Figure 4). Finally the treated
wastewater is transferred to a storage tank behind the processing area where it is then reused
in the production process.
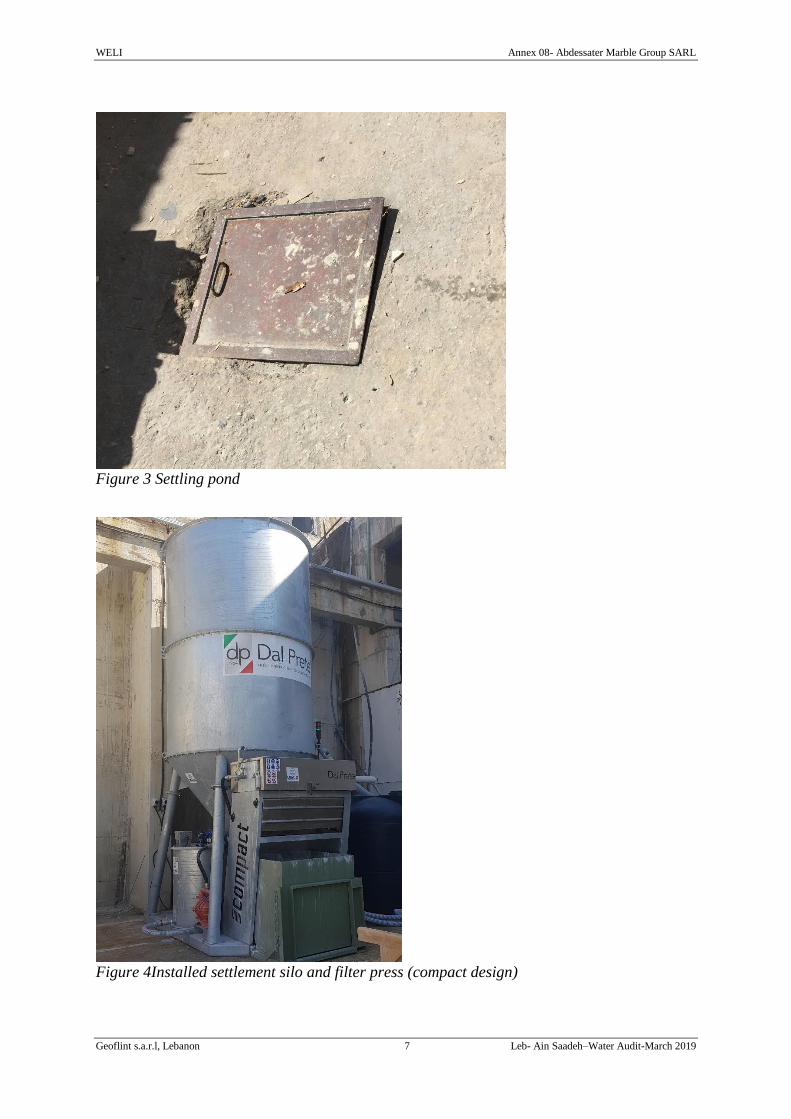
WELI Annex 08- Abdessater Marble Group SARL
Geoflint s.a.r.l, Lebanon 7 Leb- Ain Saadeh–Water Audit-March 2019
Figure 3 Settling pond
Figure 4Installed settlement silo and filter press (compact design)
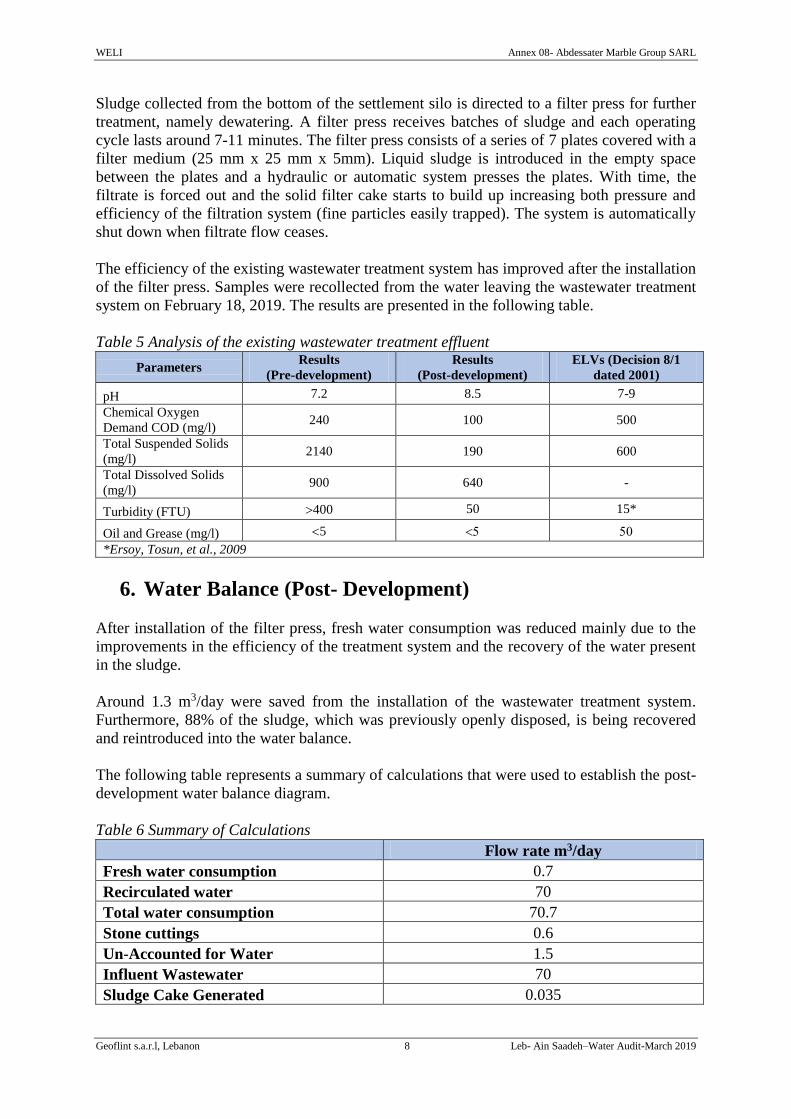
WELI Annex 08- Abdessater Marble Group SARL
Geoflint s.a.r.l, Lebanon 8 Leb- Ain Saadeh–Water Audit-March 2019
Sludge collected from the bottom of the settlement silo is directed to a filter press for further
treatment, namely dewatering. A filter press receives batches of sludge and each operating
cycle lasts around 7-11 minutes. The filter press consists of a series of 7 plates covered with a
filter medium (25 mm x 25 mm x 5mm). Liquid sludge is introduced in the empty space
between the plates and a hydraulic or automatic system presses the plates. With time, the
filtrate is forced out and the solid filter cake starts to build up increasing both pressure and
efficiency of the filtration system (fine particles easily trapped). The system is automatically
shut down when filtrate flow ceases.
The efficiency of the existing wastewater treatment system has improved after the installation
of the filter press. Samples were recollected from the water leaving the wastewater treatment
system on February 18, 2019. The results are presented in the following table.
Table 5 Analysis of the existing wastewater treatment effluent
Parameters Results
(Pre-development)
Results
(Post-development)
ELVs (Decision 8/1
dated 2001)
pH 7.2 8.5 7-9
Chemical Oxygen
Demand COD (mg/l) 240 100 500
Total Suspended Solids
(mg/l) 2140 190 600
Total Dissolved Solids
(mg/l) 900 640 -
Turbidity (FTU) 400 50 15*
Oil and Grease (mg/l) 5
*Ersoy, Tosun, et al., 2009
6. Water Balance (Post- Development)
After installation of the filter press, fresh water consumption was reduced mainly due to the
improvements in the efficiency of the treatment system and the recovery of the water present
in the sludge.
Around 1.3 m3/day were saved from the installation of the wastewater treatment system.
Furthermore, 88% of the sludge, which was previously openly disposed, is being recovered
and reintroduced into the water balance.
The following table represents a summary of calculations that were used to establish the post-
development water balance diagram.
Table 6 Summary of Calculations
Flow rate m3/day
Fresh water consumption 0.7
Recirculated water 70
Total water consumption 70.7
Stone cuttings 0.6
Un-Accounted for Water 1.5
Influent Wastewater 70
Sludge Cake Generated 0.035
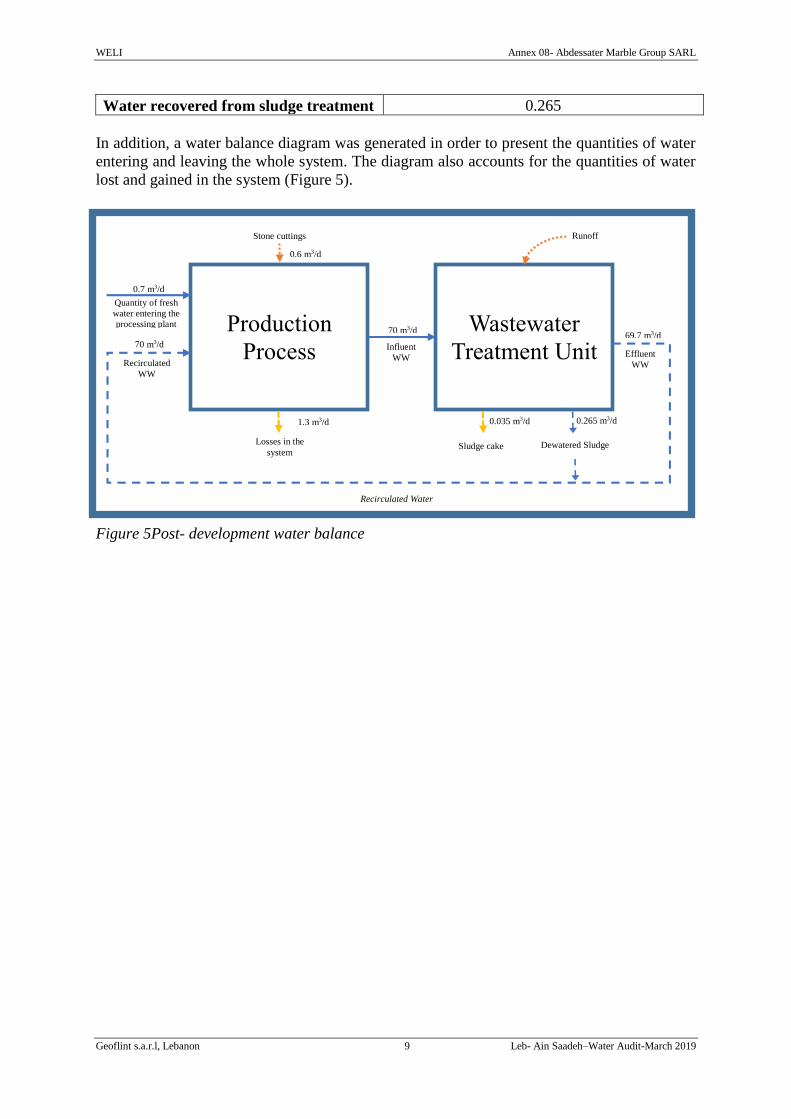
WELI Annex 08- Abdessater Marble Group SARL
Geoflint s.a.r.l, Lebanon 9 Leb- Ain Saadeh–Water Audit-March 2019
Water recovered from sludge treatment 0.265
In addition, a water balance diagram was generated in order to present the quantities of water
entering and leaving the whole system. The diagram also accounts for the quantities of water
lost and gained in the system (Figure 5).
Figure 5Post- development water balance
Production
Process
Wastewater
Treatment Unit
Quantity of fresh
water entering the
processing plant
Influent
WW
Losses in the
system
Effluent
WW Recirculated
WW
Stone cuttings
Recirculated Water
Runoff
0.6 m3/d
0.7 m3/d
0.035 m3/d
69.7 m3/d 70 m3/d
70 m3/d
1.3 m3/d
Sludge cake Dewatered Sludge
0.265 m3/d
WELI Annex 08- Abdessater Marble Group SARL
Geoflint s.a.r.l, Lebanon 10 Leb- Ain Saadeh–Water Audit-March 2019
7. Conclusion and Recommendations
After analyzing the audit findings and observations, the implemented wastewater treatment
system proved to be efficient in reducing fresh water consumption, improving the quality of
water used and decreasing the quantity of sludge disposed. Around 65 % reduction in fresh
water consumption was measured. Moreover, the quality of water being recirculated
improved significantly in terms of the level of turbidity and suspended solids in the water.
Improving the quality of water reduced machinery and equipment maintenance (changing of
blades…) where the stone powders in the water may cause polishing problems during the
processing of natural stone and may lead to clogging of pipes. Finally, sludge was properly
managed and the quantity of sludge being disposed was reduced by 88%.
The improvements in the efficiency of water and wastewater management is also resulting in
economic benefits due to reductions in:
Fresh water costs (water tankers…)
Machinery and equipment maintenance (changing of blades…)
Management of sludge piles, where generated sludge is occupying space, and is
incurring on the facility operational costs (machineries operation such as bobcats…)
Labor costs and time spent on the management of poorly operating wastewater
treatment system.
Nevertheless, several recommendations were identified to further improve environmental
management in the proposed facility. These recommendations are summarized below.
Consider rain water harvesting
Improve the efficiency of the wastewater treatment plant by:
o Applying the optimal dose and type of coagulant
o Inspecting the influent and effluent flow rates on a regular basis
Maintain or improve wastewater collection channels (i.e. increase height of sloping
sides) to avoid loss of water to the open ground
Regularly inspect the wastewater canals and bunds to prevent blockages

WELI Annex 08- Abdessater Marble Group SARL
Geoflint s.a.r.l, Lebanon 11 Leb- Ain Saadeh–Water Audit-March 2019
8. References
Ersoy, B., Tosun, I., Günay, A., & Dikmen, S. (2009). Turbidity removal from wastewaters
of natural stone processing by coagulation/flocculation methods. CLEAN–Soil, Air,
Water, 37(3), 225-232.
Sadler, B. (1988) The evaluation of assessment: post-EIS research and process
development, in: P. Wathern (Ed) Environmental Impact Assessment: Theory and
Practice (London, Unwin Hyman).
Taşdemir, T., & Kurama, H. (2013). Fine particle removal from natural stone processing
effluent by flocculation. Environmental Progress & Sustainable Energy, 32(2), 317-324.

ANNEX 09
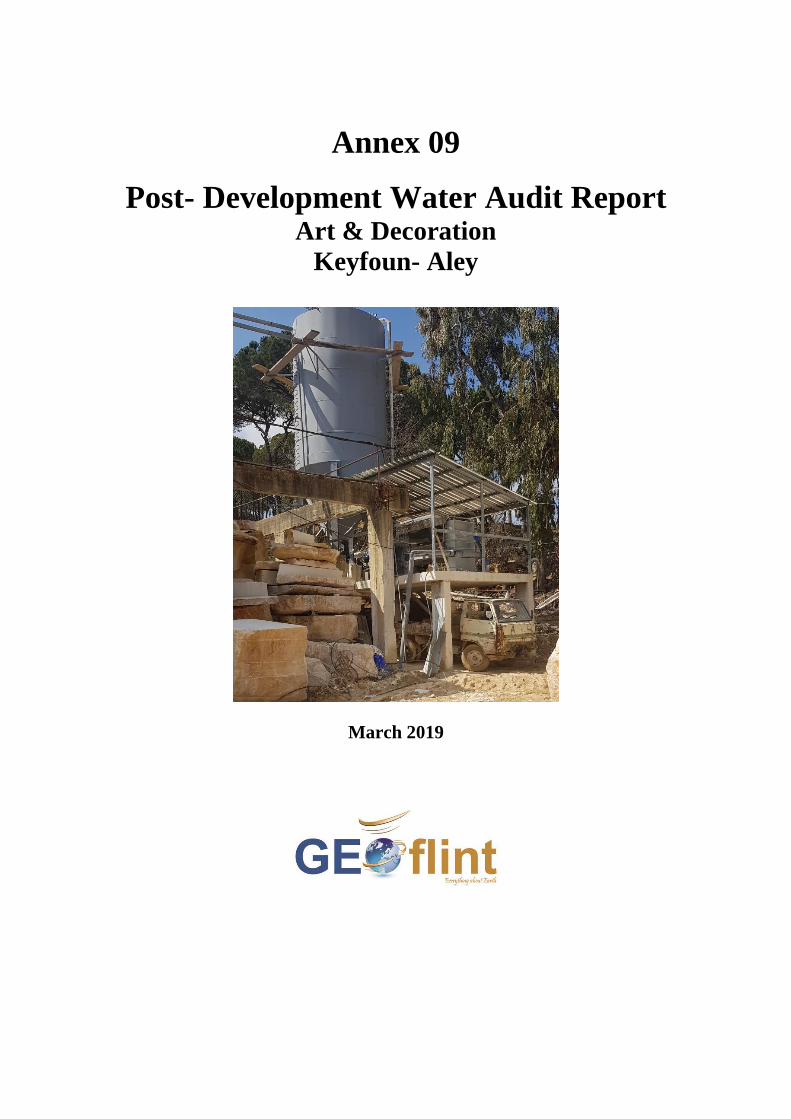
Annex 09
Post- Development Water Audit Report Art & Decoration
Keyfoun- Aley
March 2019
Table of Contents
Executive Summary ................................................................................................................. iii 1. Background Information .................................................................................................. iii 2. Introduction ........................................................................................................................ 4 3. Scope of Work ................................................................................................................... 4
4. Summary of Water Audit in the Pre-Development Phase ................................................. 4 5. Developed Improvements in Wastewater Management Systems ...................................... 6 6. Water Balance (Post- Development) ................................................................................. 8 7. Conclusion and Recommendations .................................................................................. 10 8. References ........................................................................................................................ 11
List of Figures
Figure 1 Major audit results ...................................................................................................... iv Figure 2Pre- development water balance ................................................................................... 5 Figure 3 Schematic flowchart of the wastewater management system ..................................... 6 Figure 4 Settling pond ................................................................................................................ 7
Figure 5 Shaped cylindrical settling tank/ storage tank ............................................................. 7
Figure 6 Filter press ................................................................................................................... 7 Figure 7Post- development water balance ................................................................................. 9
List of Tables
Table 1 Summary of audits results........................................................................................... iii Table 2General Information ..................................................................................................... iii
Table 3 General information about the audited facility ............................................................. 5 Table 4 Pre-development audit findings .................................................................................... 5
Table 5 Analysis of the existing wastewater treatment effluent ................................................ 8 Table 6 Summary of Calculations.............................................................................................. 8
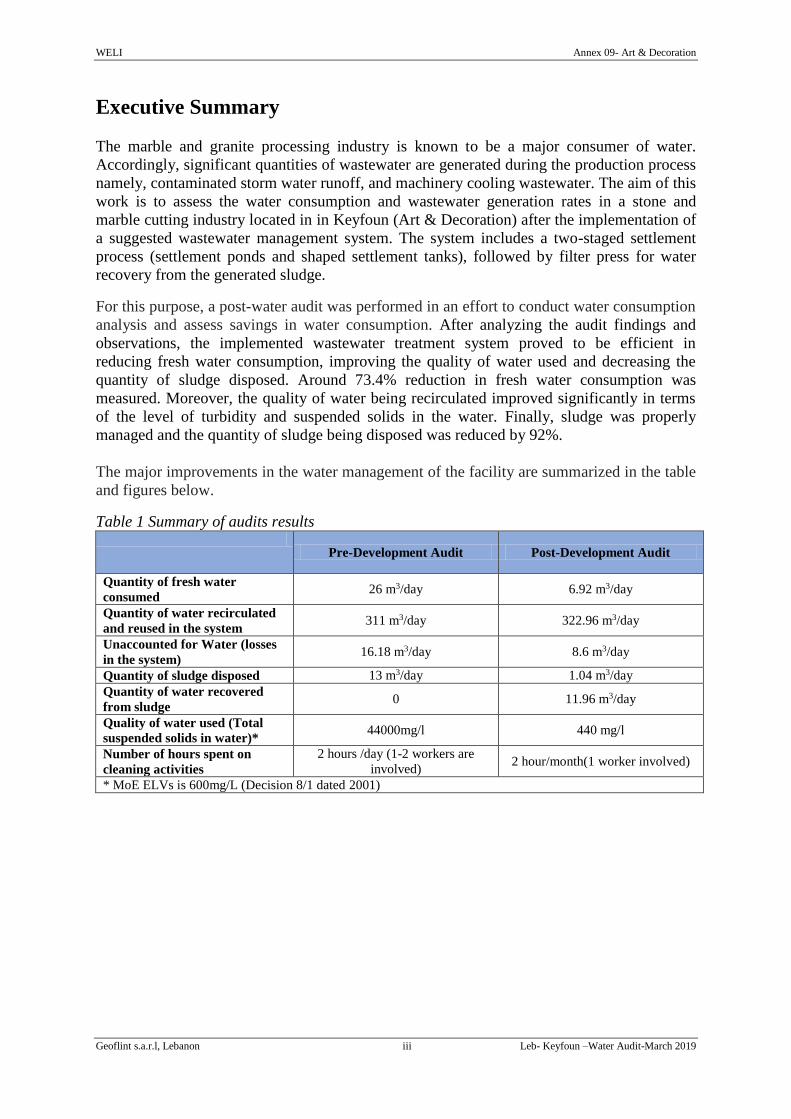
WELI Annex 09- Art & Decoration
Geoflint s.a.r.l, Lebanon iii Leb- Keyfoun –Water Audit-March 2019
Executive Summary
The marble and granite processing industry is known to be a major consumer of water.
Accordingly, significant quantities of wastewater are generated during the production process
namely, contaminated storm water runoff, and machinery cooling wastewater. The aim of this
work is to assess the water consumption and wastewater generation rates in a stone and
marble cutting industry located in in Keyfoun (Art & Decoration) after the implementation of
a suggested wastewater management system. The system includes a two-staged settlement
process (settlement ponds and shaped settlement tanks), followed by filter press for water
recovery from the generated sludge.
For this purpose, a post-water audit was performed in an effort to conduct water consumption
analysis and assess savings in water consumption. After analyzing the audit findings and
observations, the implemented wastewater treatment system proved to be efficient in
reducing fresh water consumption, improving the quality of water used and decreasing the
quantity of sludge disposed. Around 73.4% reduction in fresh water consumption was
measured. Moreover, the quality of water being recirculated improved significantly in terms
of the level of turbidity and suspended solids in the water. Finally, sludge was properly
managed and the quantity of sludge being disposed was reduced by 92%.
The major improvements in the water management of the facility are summarized in the table
and figures below.
Table 1 Summary of audits results
Pre-Development Audit Post-Development Audit
Quantity of fresh water
consumed 26 m3/day 6.92 m3/day
Quantity of water recirculated
and reused in the system 311 m3/day 322.96 m3/day
Unaccounted for Water (losses
in the system) 16.18 m3/day 8.6 m3/day
Quantity of sludge disposed 13 m3/day 1.04 m3/day
Quantity of water recovered
from sludge 0 11.96 m3/day
Quality of water used (Total
suspended solids in water)* 44000mg/l 440 mg/l
Number of hours spent on
cleaning activities
2 hours /day (1-2 workers are
involved) 2 hour/month(1 worker involved)
* MoE ELVs is 600mg/L (Decision 8/1 dated 2001)
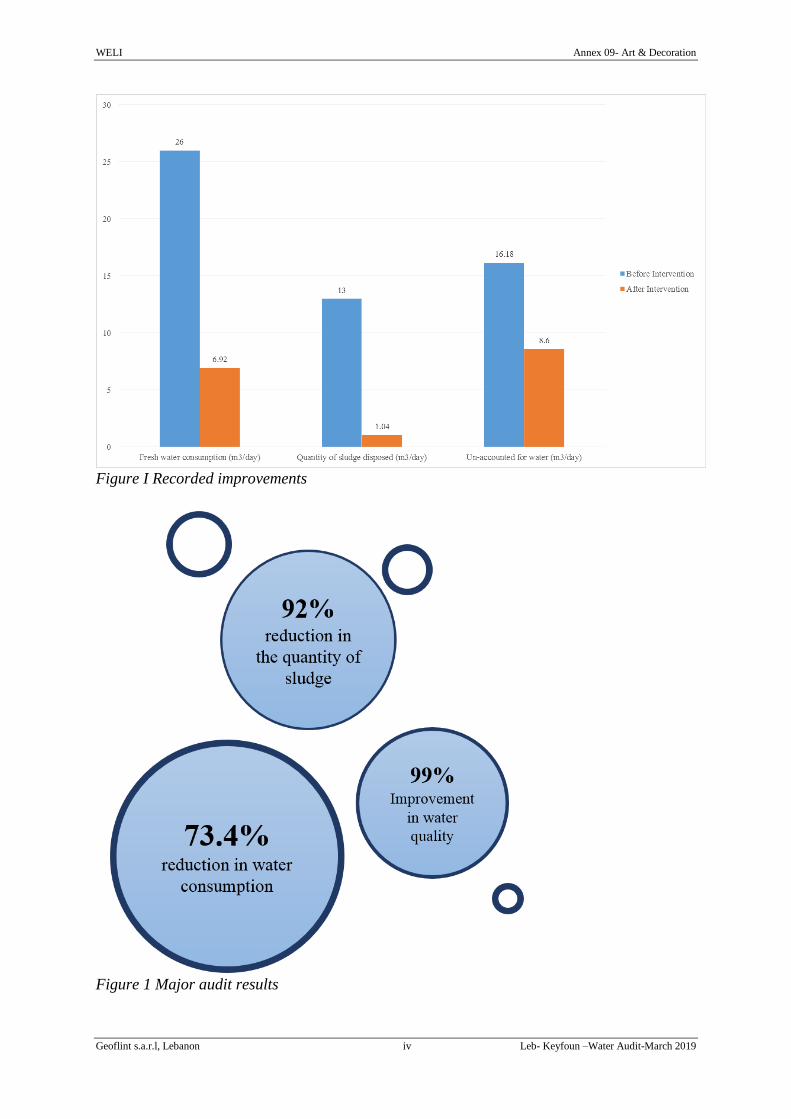
WELI Annex 09- Art & Decoration
Geoflint s.a.r.l, Lebanon iv Leb- Keyfoun –Water Audit-March 2019
Figure I Recorded improvements
Figure 1 Major audit results
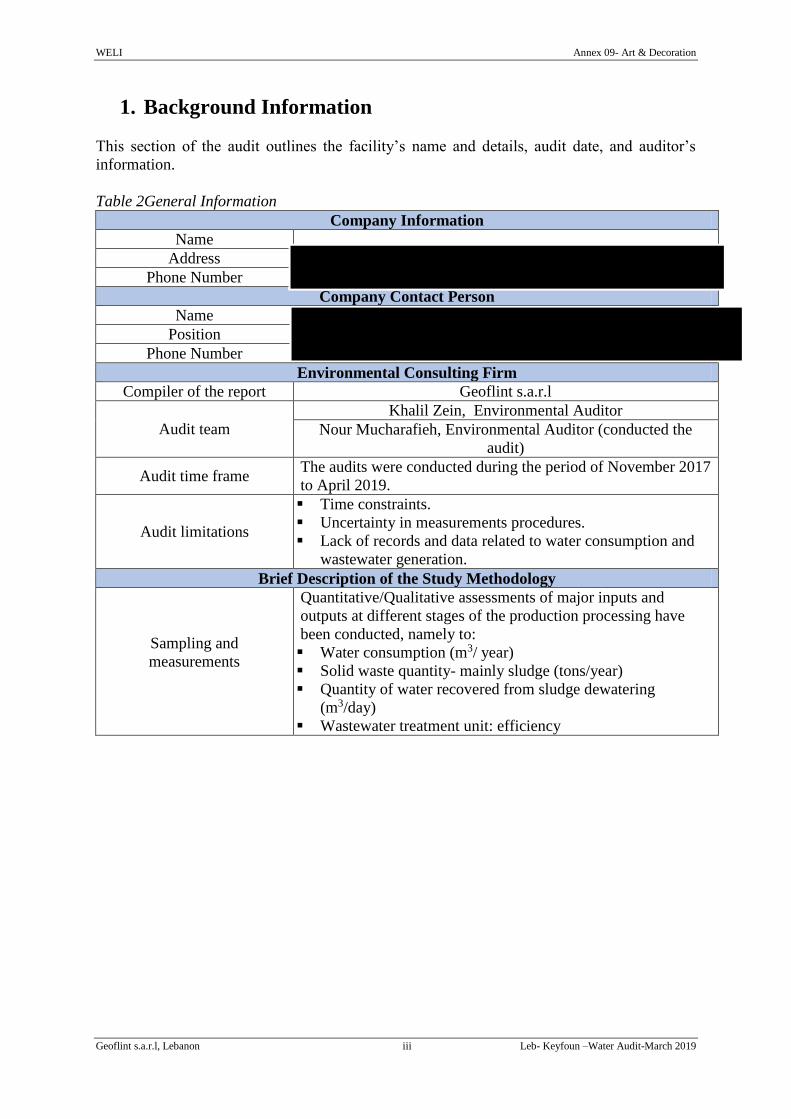
WELI Annex 09- Art & Decoration
Geoflint s.a.r.l, Lebanon iii Leb- Keyfoun –Water Audit-March 2019
1. Background Information
This section of the audit outlines the facility’s name and details, audit date, and auditor’s
information.
Table 2General Information
Company Information
Name
Address
Phone Number
Company Contact Person
Name
Position
Phone Number
Environmental Consulting Firm
Compiler of the report Geoflint s.a.r.l
Audit team
Khalil Zein, Environmental Auditor
Nour Mucharafieh, Environmental Auditor (conducted the
audit)
Audit time frame The audits were conducted during the period of November 2017
to April 2019.
Audit limitations
Time constraints.
Uncertainty in measurements procedures.
Lack of records and data related to water consumption and
wastewater generation.
Brief Description of the Study Methodology
Sampling and
measurements
Quantitative/Qualitative assessments of major inputs and
outputs at different stages of the production processing have
been conducted, namely to:
Water consumption (m3/ year)
Solid waste quantity- mainly sludge (tons/year)
Quantity of water recovered from sludge dewatering
(m3/day)
Wastewater treatment unit: efficiency
WELI Annex 09- Art & Decoration
Geoflint s.a.r.l, Lebanon 4 Leb- Keyfoun –Water Audit-March 2019
2. Introduction
Natural stones (such as marble, granite…etc.) are materials which have been extensively used
for a variety of building applications since ancient times. This reflects the belief that stones
are sustainable and durable material for construction works (Taşdemir, Kurama, 2013).
The marble and granite processing industry is known to be a major consumer of water.
Significant quantities of water are consumed to cool the saws during the production process
and to polish the final product. Accordingly, significant quantities of wastewater is generated
during the production process namely, contaminated storm water runoff, and machinery
cooling wastewater. Major environmental concerns are associated with the generated
wastewater considering its high alkalinity, and high levels of Total Suspended Solids (TSS).
Fine particles (<0.2 mm) are generated during the cutting and polishing processes, where
around 25-40% of the weight of the block is produced as fine particles during the cutting
process. Thus, large amounts of water is used to capture the produced particles (Taşdemir,
Kurama, 2013). In general, wastewater is treated by simple solid–liquid separation and is then
reused in the process. If the turbidity of the reused water is higher than acceptable values, the
stone powders in the water may cause polishing problems during the processing of natural
stone and may lead to clogging of pipes. Consequently, the maximum (residual) turbidity of
the clean water should be less than 15 Nephelometric Turbidity Units (NTU) (Ersoy, Tosun,
et al., 2009).
Moreover, if the generated wastewater is not managed properly, it would negatively affect the
physical, biological and chemical characteristics of both the local water and soil quality,
resulting in inevitable implications on both the environment and the public health. In this
context, a water audit was conducted for the marble and granite processing facility in in
Keyfoun (Art & Decoration) in order to assess the water consumption within the facility and
to identify opportunities to improve water use efficiency.
3. Scope of Work
The aim of this post development audit is to compare the impacts of water consumption that
were assessed in the environmental audit conducted prior to project implementation with
those that actually arose after the implementation of the proposed interventions. Post-
development audit has an important role in improving the future performance and utility of
the project. Moreover, this process of comparing predictions versus actual or reflective
assessment is of great importance to sustainability of projects (Sadler, 1988).
This work will assess water consumption and wastewater generation rates after the
implementation of the wastewater management systems. For this purpose a post-water audit
was performed in an effort to conduct water consumption analysis and assess savings in water
consumption.
4. Summary of Water Audit in the Pre-Development Phase
The table below summarizes general information and description of the audited facility.
These data were provided by the manager of the audited facility during the initial site visit.
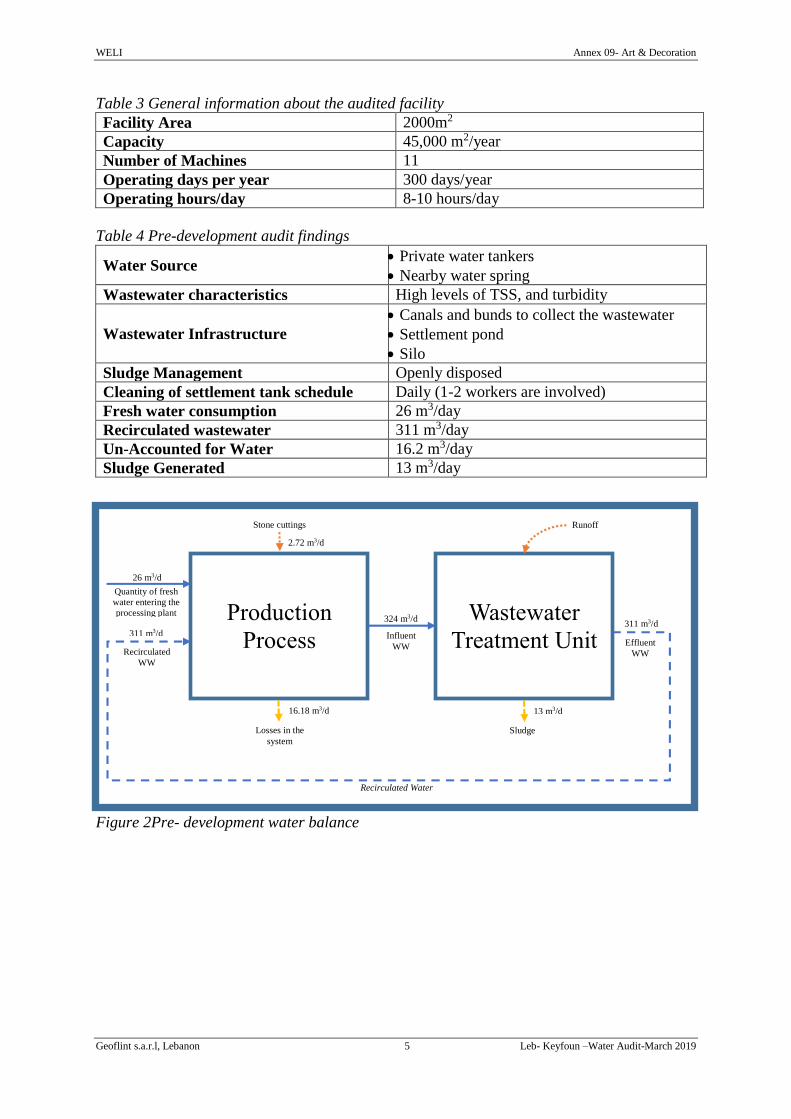
WELI Annex 09- Art & Decoration
Geoflint s.a.r.l, Lebanon 5 Leb- Keyfoun –Water Audit-March 2019
Table 3 General information about the audited facility
Facility Area 2000m2
Capacity 45,000 m2/year
Number of Machines 11
Operating days per year 300 days/year
Operating hours/day 8-10 hours/day
Table 4 Pre-development audit findings
Water Source Private water tankers
Nearby water spring
Wastewater characteristics High levels of TSS, and turbidity
Wastewater Infrastructure
Canals and bunds to collect the wastewater
Settlement pond
Silo
Sludge Management Openly disposed
Cleaning of settlement tank schedule Daily (1-2 workers are involved)
Fresh water consumption 26 m3/day
Recirculated wastewater 311 m3/day
Un-Accounted for Water 16.2 m3/day
Sludge Generated 13 m3/day
Figure 2Pre- development water balance
Production
Process
Wastewater
Treatment Unit
Quantity of fresh
water entering the
processing plant
Influent
WW
Losses in the
system
Effluent
WW Recirculated
WW
Stone cuttings
Recirculated Water
Runoff
2.72 m3/d
26 m3/d
Sludge
13 m3/d
311 m3/d 324 m3/d
311 m3/d
16.18 m3/d

WELI Annex 09- Art & Decoration
Geoflint s.a.r.l, Lebanon 6 Leb- Keyfoun –Water Audit-March 2019
5. Developed Improvements in Wastewater Management
Systems
Art and Decoration implemented the suggested wastewater management system which
includes a two-staged settlement process (settlement ponds and shaped settlement tanks),
followed by filter press for the water recovery from the generated sludge. A filter press was
recently installed to recover water from the generated sludge.
Figure 3 Schematic flowchart of the wastewater management system
The treatment of wastewater is done via two steps. The first step is the settling pond where
the heavy particles present in the wastewater are left to settle naturally. After this step the
wastewater is pumped into a cylindrical settling tank where a coagulant (acrylamid) is added,
thus the process of coagulation and flocculation takes place. The structure of the cylindrical
settling tank/silo is designed in a way to enhance the process of flocs settling. The capacity of
the cylindrical settling tank in this audited facility is 36 m3 (Figure 5). Finally the treated
wastewater is transferred to a storage tank behind the processing area where it is then reused
in the production process.
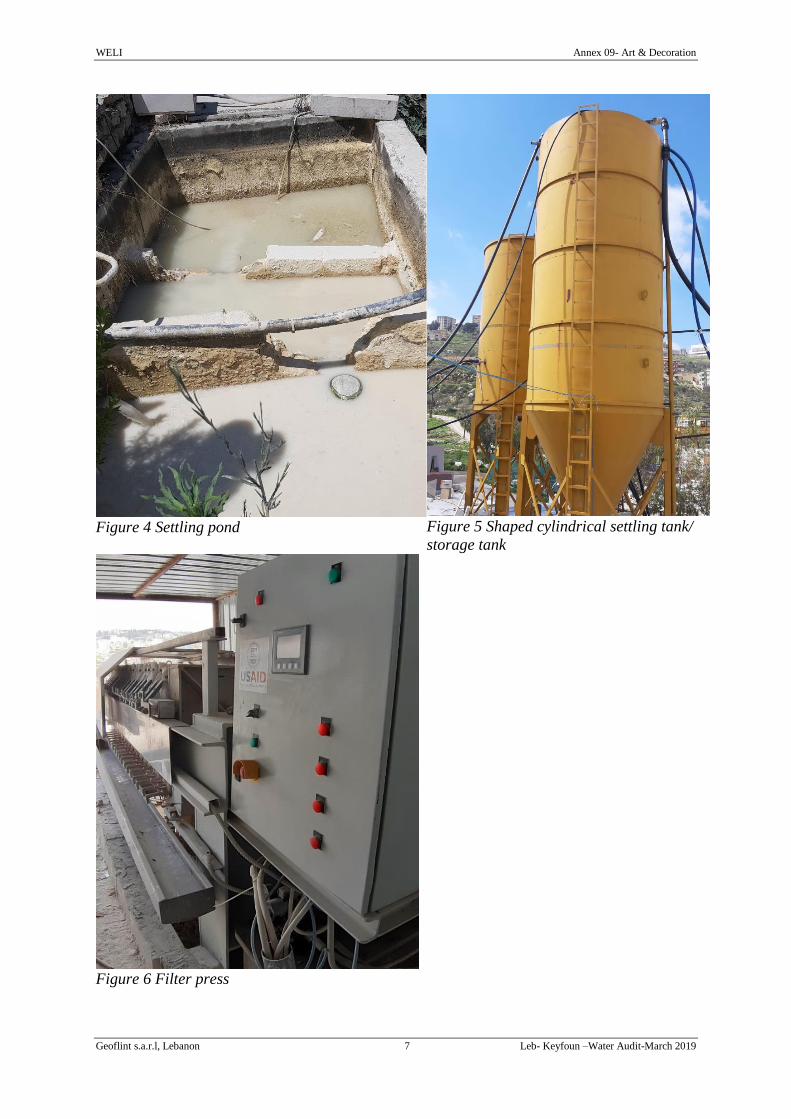
WELI Annex 09- Art & Decoration
Geoflint s.a.r.l, Lebanon 7 Leb- Keyfoun –Water Audit-March 2019
Figure 4 Settling pond
Figure 5 Shaped cylindrical settling tank/
storage tank
Figure 6 Filter press
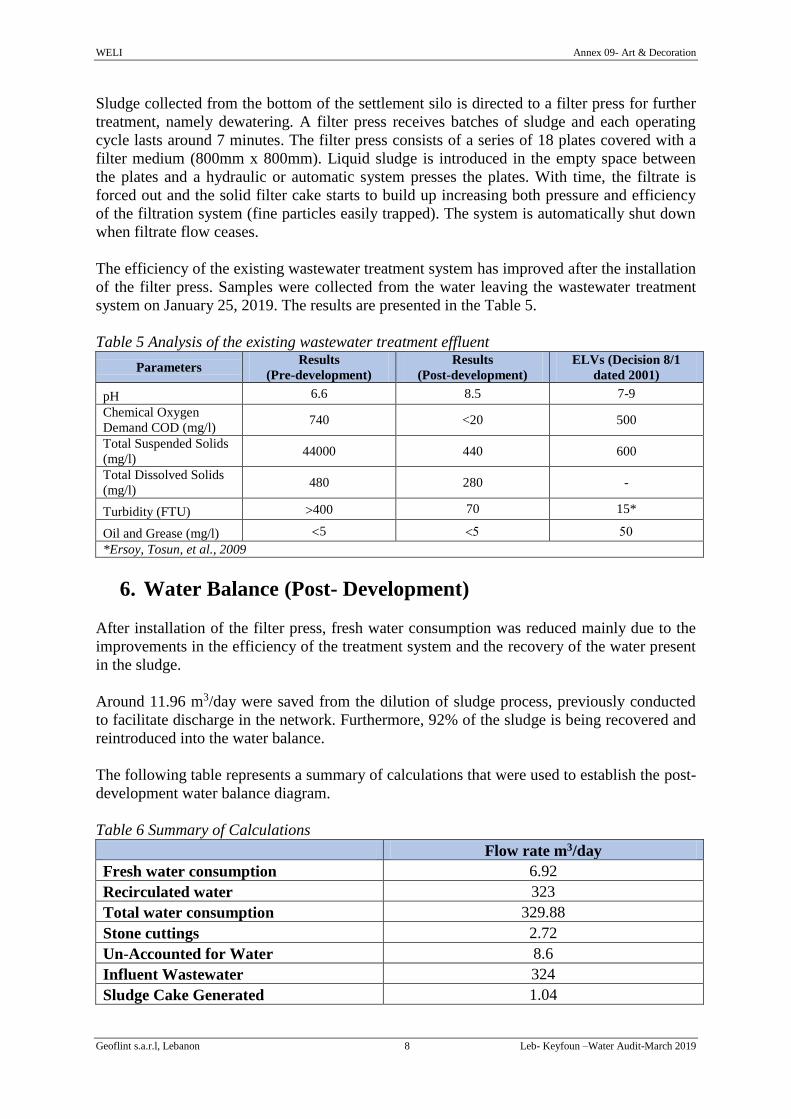
WELI Annex 09- Art & Decoration
Geoflint s.a.r.l, Lebanon 8 Leb- Keyfoun –Water Audit-March 2019
Sludge collected from the bottom of the settlement silo is directed to a filter press for further
treatment, namely dewatering. A filter press receives batches of sludge and each operating
cycle lasts around 7 minutes. The filter press consists of a series of 18 plates covered with a
filter medium (800mm x 800mm). Liquid sludge is introduced in the empty space between
the plates and a hydraulic or automatic system presses the plates. With time, the filtrate is
forced out and the solid filter cake starts to build up increasing both pressure and efficiency
of the filtration system (fine particles easily trapped). The system is automatically shut down
when filtrate flow ceases.
The efficiency of the existing wastewater treatment system has improved after the installation
of the filter press. Samples were collected from the water leaving the wastewater treatment
system on January 25, 2019. The results are presented in the Table 5.
Table 5 Analysis of the existing wastewater treatment effluent
Parameters Results
(Pre-development)
Results
(Post-development)
ELVs (Decision 8/1
dated 2001)
pH 6.6 8.5 7-9
Chemical Oxygen
Demand COD (mg/l) 740 <20 500
Total Suspended Solids
(mg/l) 44000 440 600
Total Dissolved Solids
(mg/l) 480 280 -
Turbidity (FTU) 400 70 15*
Oil and Grease (mg/l) 5
*Ersoy, Tosun, et al., 2009
6. Water Balance (Post- Development)
After installation of the filter press, fresh water consumption was reduced mainly due to the
improvements in the efficiency of the treatment system and the recovery of the water present
in the sludge.
Around 11.96 m3/day were saved from the dilution of sludge process, previously conducted
to facilitate discharge in the network. Furthermore, 92% of the sludge is being recovered and
reintroduced into the water balance.
The following table represents a summary of calculations that were used to establish the post-
development water balance diagram.
Table 6 Summary of Calculations
Flow rate m3/day
Fresh water consumption 6.92
Recirculated water 323
Total water consumption 329.88
Stone cuttings 2.72
Un-Accounted for Water 8.6
Influent Wastewater 324
Sludge Cake Generated 1.04
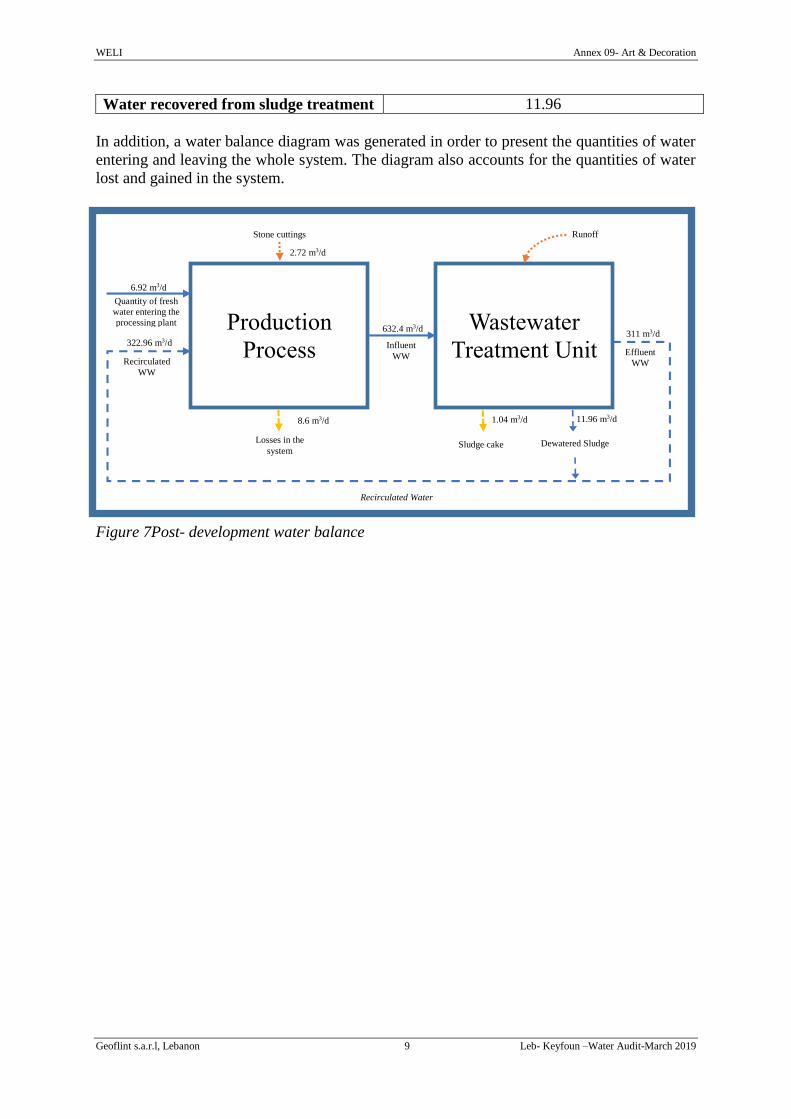
WELI Annex 09- Art & Decoration
Geoflint s.a.r.l, Lebanon 9 Leb- Keyfoun –Water Audit-March 2019
Water recovered from sludge treatment 11.96
In addition, a water balance diagram was generated in order to present the quantities of water
entering and leaving the whole system. The diagram also accounts for the quantities of water
lost and gained in the system.
Figure 7Post- development water balance
Production
Process
Wastewater
Treatment Unit
Quantity of fresh
water entering the
processing plant
Influent
WW
Losses in the
system
Effluent
WW Recirculated
WW
Stone cuttings
Recirculated Water
Runoff
2.72 m3/d
6.92 m3/d
1.04 m3/d
311 m3/d 632.4 m3/d
322.96 m3/d
8.6 m3/d
Sludge cake Dewatered Sludge
11.96 m3/d
WELI Annex 09- Art & Decoration
Geoflint s.a.r.l, Lebanon 10 Leb- Keyfoun –Water Audit-March 2019
7. Conclusion and Recommendations
After analyzing the audit findings and observations, the implemented wastewater treatment
system proved to be efficient in reducing fresh water consumption, improving the quality of
water used and decreasing the quantity of sludge disposed. Around 73.4% reduction in fresh
water consumption was measured. Moreover, the quality of water being recirculated
improved significantly in terms of the level of turbidity and suspended solids in the water.
Improving the quality of water reduced machinery and equipment maintenance (changing of
blades…) where the stone powders in the water may cause polishing problems during the
processing of natural stone and may lead to clogging of pipes. Finally, sludge was properly
managed and the quantity of sludge being disposed was reduced by 92%.
The improvements in the efficiency of water and wastewater management is also resulting in
economic benefits due to reductions in:
Fresh water costs (water tankers…)
Machinery and equipment maintenance (changing of blades…)
Management of sludge piles, where generated sludge is occupying space, and is
incurring on the facility operational costs (machineries operation such as bobcats…)
Labor costs and time spent on the management of poorly operating wastewater
treatment system.
Nevertheless, several recommendations were identified to further improve environmental
management in the proposed facility. These recommendations are summarized below.
Consider rain water harvesting
Improve the efficiency of the wastewater treatment plant by:
o Applying the optimal dose and type of coagulant
o Inspecting the influent and effluent flow rates on a regular basis
Maintain or improve wastewater collection channels (i.e. increase height of sloping
sides) to avoid loss of water to the open ground
Regularly inspect the wastewater canals and bunds to prevent blockages
WELI Annex 09- Art & Decoration
Geoflint s.a.r.l, Lebanon 11 Leb- Keyfoun –Water Audit-March 2019
8. References
Ersoy, B., Tosun, I., Günay, A., & Dikmen, S. (2009). Turbidity removal from wastewaters
of natural stone processing by coagulation/flocculation methods. CLEAN–Soil, Air,
Water, 37(3), 225-232.
Sadler, B. (1988) The evaluation of assessment: post-EIS research and process
development, in: P. Wathern (Ed) Environmental Impact Assessment: Theory and
Practice (London, Unwin Hyman).
Taşdemir, T., & Kurama, H. (2013). Fine particle removal from natural stone processing
effluent by flocculation. Environmental Progress & Sustainable Energy, 32(2), 317-324.


