Embed Size (px)
Citation preview
June 10, 2008 20:31 WSPC WS-JDE SPI-J076 00091
Journal of Developmental EntrepreneurshipVol. 13, No. 2 (2008) 167–184© World Scientific Publishing Company
FINANCIAL FUNDING OF IMMIGRANT BUSINESSES
NONNA KUSHNIROVICH
Department of Economics and ManagementInstitute for Immigration and Integration, Ruppin Academic Center
Emek Hefer 40250, [email protected]
SIBYLLE HEILBRUNN
Department of Business AdministrationInstitute for Immigration and Integration, Ruppin Academic Center
Emek Hefer 40250, [email protected]
Received August 2006Revised March 2008
This study investigates differences in financial funding between immigrant and non-immigrant busi-nesses and delineates factors influencing financial funding of immigrant businesses. Data for the studywere collected in Israel between 2000 and 2005. By combining convenient and snowball samples, 214native Israelis and 153 FSU immigrant entrepreneurs answered a questionnaire. We classified financialsources for immigrant businesses according to their affiliation to the ethnic community, and according totheir relation to official financial institutions. Our study revealed that the scope of funding of immigrantbusinesses is significantly smaller than that of non-immigrant businesses. Immigrant entrepreneurs aremore likely to finance their businesses from informal sources but they use fewer loans from familyand friends than non-immigrant entrepreneurs. We found that immigrant entrepreneurs who deal withco-ethnic clients do not use more ethnic sources of capital for financing their businesses: the share of co-ethnic clients does not influence the ratio of ethnic financial sources for both setting up and expandingimmigrant businesses. Our study revealed that governmental support in the terms of designated loansis the most salient factor influencing financial funding of immigrant businesses. The results suggestimportant implications for public policy.
Keywords: Immigrant entrepreneurs; financial funding; sources of capital.
1. Introduction
Immigrants in general — and immigrants to Israel specifically — usually face difficultiesentering the host country’s labor market. Consequently, the unemployment level of thesegroups is often high. The immigrants who came to Israel between 1989 and 2005 increasedIsrael’s population and labor force by some 20 percent. Approximately 85 percent of theseimmigrants were from the areas of the former Soviet Union (hereinafter referred to as FSU).According to the Israeli Central Bureau of Statistics, during 1998–2003 unemployment rates
167
June 10, 2008 20:31 WSPC WS-JDE SPI-J076 00091
168 N. Kushnirovich & S. Heilbrunn
among immigrants were on average 2 percent higher than that of the native population (LaborForce Survey Data, 2004).
Self-employment is a recognized viable alternative employment solution for immigrants.Nonetheless, the entrepreneurship rate of immigrants in Israel is significantly less than thatof the non-immigrant population. While entrepreneurs constitute 11.8 percent of the Israelilabor force, the share of entrepreneurs from the FSU immigrant community is only 5 percent(according to data from the Ministry of Industry, Trade, and Labor of Israel, 2005). Suchlimited involvement of immigrants in entrepreneurship may be a consequence of financialconstraints on immigrant businesses.
The purpose of the study was to investigate differences in financial funding betweenimmigrant and non-immigrant businesses and to delineate the factors influencing financialfunding of immigrant businesses.
2. Theoretical Approaches to Financial Funding of Immigrant Businesses
2.1. Classification of funding sources for immigrant businesses
A number of previous studies on immigrant entrepreneurship discussing resources avail-able to immigrant businesses also deal with the special issues of their financial funding(Waldinger et al., 1990; Toussaint-Comeau and Rhine, 2000; Raijman and Tienda, 2003).According to the resources theory of entrepreneurship espoused by Light and colleagues(Light and Bonacich, 1988; Light and Rosenstein, 1995), both class and ethnic resourcesshape the opportunities for establishing immigrant businesses. Immigrant entrepreneursdiffer from general business owners because they are endowed with ethnic resources. Immi-grant entrepreneurs are an ethnic bourgeoisie, not simply a bourgeoisie because, in additionto class resources, they also use ethnic resources (Light and Bonacich, 1988).
There are a range of studies devoted specifically to capitalization and financing of immi-grant businesses (Tseng, 1995; Yoon, 1995; Hosler, 1998; Yoo, 1998). They represent manydifferent approaches to the classification of financial resources for establishing immigrantbusinesses. Some researchers (Bates, 1997) use conventional standard classification of finan-cial capital: equity and debt (financial institution loans, loans from friends, rotating creditassociations, associates, family, and other). A similar approach was taken by Bond andTownsend (1999): loans (from banks, private lenders, mortgages, government programs,ethnic associations, immediate family, other relatives, friends or businesses associates, andsuppliers’ credit), gifts (immediate family and friends), and personal resources (personalsavings, credit cards, loans from other businesses/inventory, and partners contribution).
Other researchers divide the sources of financial capital according to the capital’s sup-pliers. Huck et al. (1999) delineated four large groups of financial sources: (a) personalresources; (b) informal sources, such as loans or gifts from family, friends, or businessassociates; (c) formal sources, such as bank loans; and (d) increments from other finan-cial institutes. Smallbone et al. (2003) used a similar classification of financial sources: ownfinancial (not formal and not informal) sources, and external sources: formal (banks, leasingcompanies, venture capital partners, loan funds, and grant awarding bodies) and informal(family and friends).
June 10, 2008 20:31 WSPC WS-JDE SPI-J076 00091
Financial Funding of Immigrant Businesses 169
In the literature, immigrant entrepreneurship is often described as ethnic entrepreneur-ship. Waldinger et al. (1990) defined ethnic entrepreneurship as a set of connections andregular patterns of interaction among people sharing a common national background ormigration experience. According to the ethnic approach, sources of capital may be dividedinto ethnic and non-ethnic. Light and Bonacich (1988) defined two groups of capital sources:external and internal to immigrants’ ethnic community. They asserted that most immigrantentrepreneurs’ capital sources are internal.
Commercial banks and credit companies usually do not represent ethnic ties, but some-times immigrant entrepreneurs borrow from branches of their home country’s banks. Thesebank loans could be regarded as an ethnic capital source. Co-ethnic owned banks in the hostcountry also fall into the ethnic financial resource category. Such banks are more predis-posed to make loans to immigrant entrepreneurs, defer their credit history, and take propertyin their home country as security. According to Tseng (1997), family financing and ethnicbanking can be seen as ethnic capital access.
Rotating credit associations and money brought from the home country are particularsources accessible only to immigrants. Rotating credit associations are a very popular capitalsource among immigrant entrepreneurs from Asia and West Africa (Yoon, 1995; Bates, 1997;Yoo, 1998; Collins, 2000). The members of such associations contribute fixed payments anddistribute the collected sum to one another. Every member receives the whole sum in turn.Light et al. (1990) ranked rotating credit associations as informal savings banks or, in otherwords, informal resources.
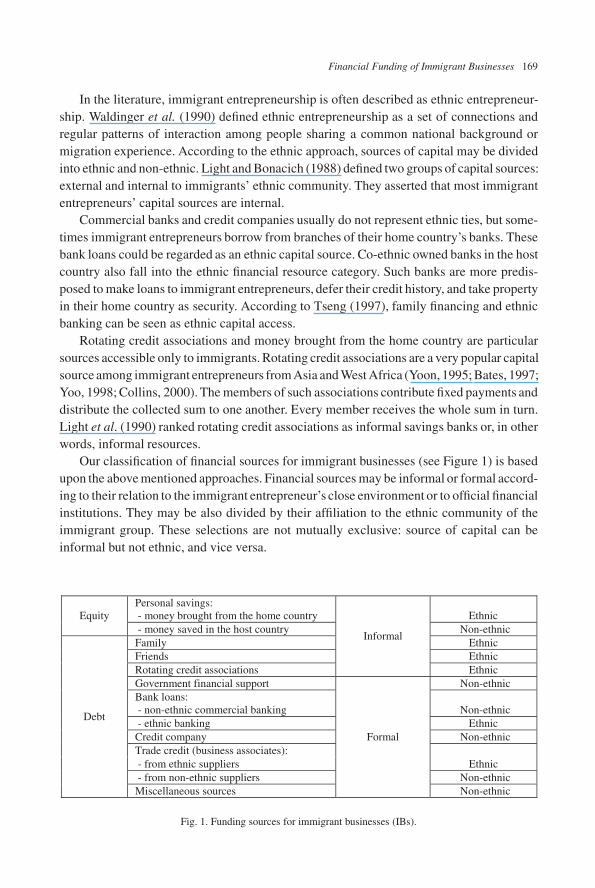
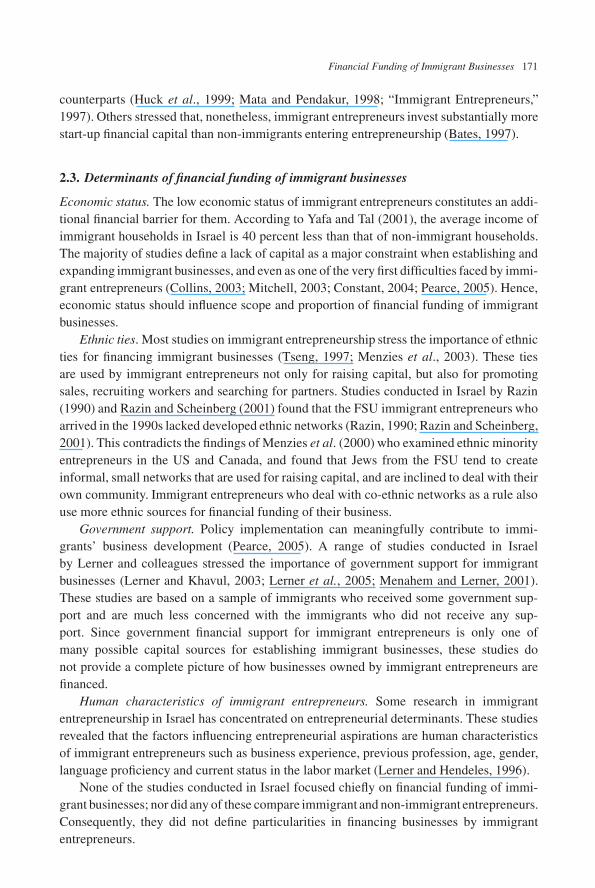
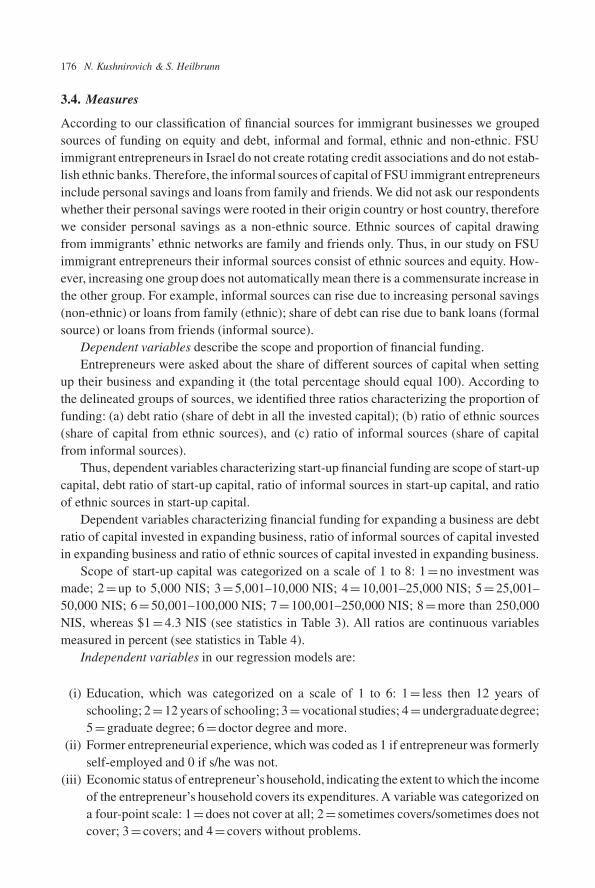
Our classification of financial sources for immigrant businesses (see Figure 1) is basedupon the above mentioned approaches. Financial sources may be informal or formal accord-ing to their relation to the immigrant entrepreneur’s close environment or to official financialinstitutions. They may be also divided by their affiliation to the ethnic community of theimmigrant group. These selections are not mutually exclusive: source of capital can beinformal but not ethnic, and vice versa.
Personal savings: - money brought from the home country Ethnic Equity - money saved in the host country Non-ethnic Family thnic Friends thnic Rotating credit associations
Informal
EEE
thnic Government financial support Non-ethnic Bank loans: - non-ethnic commercial banking Non-ethnic - ethnic banking Ethnic Credit company Non-ethnic Trade credit (business associates): - from ethnic suppliers Ethnic - from non-ethnic suppliers Non-ethnic
Debt
Miscellaneous sources
Formal
Non-ethnic
Fig. 1. Funding sources for immigrant businesses (IBs).
June 10, 2008 20:31 WSPC WS-JDE SPI-J076 00091
170 N. Kushnirovich & S. Heilbrunn
2.2. Proportion and scope of capital sources
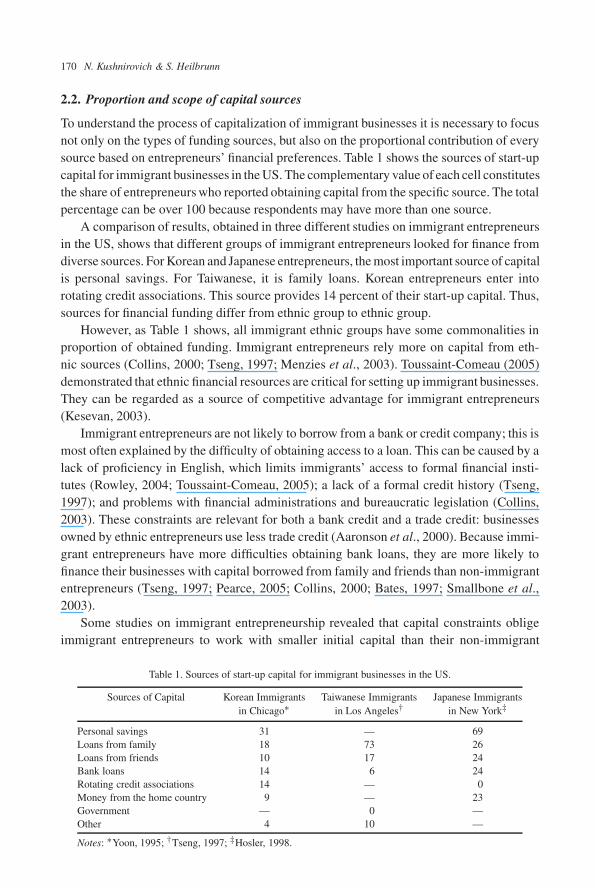
To understand the process of capitalization of immigrant businesses it is necessary to focusnot only on the types of funding sources, but also on the proportional contribution of everysource based on entrepreneurs’ financial preferences. Table 1 shows the sources of start-upcapital for immigrant businesses in the US. The complementary value of each cell constitutesthe share of entrepreneurs who reported obtaining capital from the specific source. The totalpercentage can be over 100 because respondents may have more than one source.
A comparison of results, obtained in three different studies on immigrant entrepreneursin the US, shows that different groups of immigrant entrepreneurs looked for finance fromdiverse sources. For Korean and Japanese entrepreneurs, the most important source of capitalis personal savings. For Taiwanese, it is family loans. Korean entrepreneurs enter intorotating credit associations. This source provides 14 percent of their start-up capital. Thus,sources for financial funding differ from ethnic group to ethnic group.
However, as Table 1 shows, all immigrant ethnic groups have some commonalities inproportion of obtained funding. Immigrant entrepreneurs rely more on capital from eth-nic sources (Collins, 2000; Tseng, 1997; Menzies et al., 2003). Toussaint-Comeau (2005)demonstrated that ethnic financial resources are critical for setting up immigrant businesses.They can be regarded as a source of competitive advantage for immigrant entrepreneurs(Kesevan, 2003).
Immigrant entrepreneurs are not likely to borrow from a bank or credit company; this ismost often explained by the difficulty of obtaining access to a loan. This can be caused by alack of proficiency in English, which limits immigrants’ access to formal financial insti-tutes (Rowley, 2004; Toussaint-Comeau, 2005); a lack of a formal credit history (Tseng,1997); and problems with financial administrations and bureaucratic legislation (Collins,2003). These constraints are relevant for both a bank credit and a trade credit: businessesowned by ethnic entrepreneurs use less trade credit (Aaronson et al., 2000). Because immi-grant entrepreneurs have more difficulties obtaining bank loans, they are more likely tofinance their businesses with capital borrowed from family and friends than non-immigrantentrepreneurs (Tseng, 1997; Pearce, 2005; Collins, 2000; Bates, 1997; Smallbone et al.,2003).
Some studies on immigrant entrepreneurship revealed that capital constraints obligeimmigrant entrepreneurs to work with smaller initial capital than their non-immigrant
Table 1. Sources of start-up capital for immigrant businesses in the US.
Sources of Capital Korean Immigrants Taiwanese Immigrants Japanese Immigrantsin Chicago∗ in Los Angeles† in New York‡
Personal savings 31 — 69Loans from family 18 73 26Loans from friends 10 17 24Bank loans 14 6 24Rotating credit associations 14 — 0Money from the home country 9 — 23Government — 0 —Other 4 10 —
Notes: ∗Yoon, 1995; †Tseng, 1997; ‡Hosler, 1998.
June 10, 2008 20:31 WSPC WS-JDE SPI-J076 00091
Financial Funding of Immigrant Businesses 171
counterparts (Huck et al., 1999; Mata and Pendakur, 1998; “Immigrant Entrepreneurs,”1997). Others stressed that, nonetheless, immigrant entrepreneurs invest substantially morestart-up financial capital than non-immigrants entering entrepreneurship (Bates, 1997).
2.3. Determinants of financial funding of immigrant businesses
Economic status. The low economic status of immigrant entrepreneurs constitutes an addi-tional financial barrier for them. According to Yafa and Tal (2001), the average income ofimmigrant households in Israel is 40 percent less than that of non-immigrant households.The majority of studies define a lack of capital as a major constraint when establishing andexpanding immigrant businesses, and even as one of the very first difficulties faced by immi-grant entrepreneurs (Collins, 2003; Mitchell, 2003; Constant, 2004; Pearce, 2005). Hence,economic status should influence scope and proportion of financial funding of immigrantbusinesses.
Ethnic ties. Most studies on immigrant entrepreneurship stress the importance of ethnicties for financing immigrant businesses (Tseng, 1997; Menzies et al., 2003). These tiesare used by immigrant entrepreneurs not only for raising capital, but also for promotingsales, recruiting workers and searching for partners. Studies conducted in Israel by Razin(1990) and Razin and Scheinberg (2001) found that the FSU immigrant entrepreneurs whoarrived in the 1990s lacked developed ethnic networks (Razin, 1990; Razin and Scheinberg,2001). This contradicts the findings of Menzies et al. (2000) who examined ethnic minorityentrepreneurs in the US and Canada, and found that Jews from the FSU tend to createinformal, small networks that are used for raising capital, and are inclined to deal with theirown community. Immigrant entrepreneurs who deal with co-ethnic networks as a rule alsouse more ethnic sources for financial funding of their business.
Government support. Policy implementation can meaningfully contribute to immi-grants’ business development (Pearce, 2005). A range of studies conducted in Israelby Lerner and colleagues stressed the importance of government support for immigrantbusinesses (Lerner and Khavul, 2003; Lerner et al., 2005; Menahem and Lerner, 2001).These studies are based on a sample of immigrants who received some government sup-port and are much less concerned with the immigrants who did not receive any sup-port. Since government financial support for immigrant entrepreneurs is only one ofmany possible capital sources for establishing immigrant businesses, these studies donot provide a complete picture of how businesses owned by immigrant entrepreneurs arefinanced.
Human characteristics of immigrant entrepreneurs. Some research in immigrantentrepreneurship in Israel has concentrated on entrepreneurial determinants. These studiesrevealed that the factors influencing entrepreneurial aspirations are human characteristicsof immigrant entrepreneurs such as business experience, previous profession, age, gender,language proficiency and current status in the labor market (Lerner and Hendeles, 1996).
None of the studies conducted in Israel focused chiefly on financial funding of immi-grant businesses; nor did any of these compare immigrant and non-immigrant entrepreneurs.Consequently, they did not define particularities in financing businesses by immigrantentrepreneurs.
June 10, 2008 20:31 WSPC WS-JDE SPI-J076 00091
172 N. Kushnirovich & S. Heilbrunn
A summary of the literature reveals the following main issues of financing immigrantbusinesses:
• Scope of Funding. Immigrant businesses need less initial investment than non-immigrantbusinesses (Mata and Pendakur, 1998; “Immigrant Entrepreneurs,” 1997).
• Proportion of Funding. Immigrant entrepreneurs are less likely to have a relationshipwith financial institutions, thereby requiring them to rely heavily on loans from familyand friends (Tseng, 1997; Pearce, 2005; Collins, 2000; Bates, 1997; Smallbone et al.,2003).
• Determinants of financial funding of immigrant businesses. The determinants of finan-cial funding of immigrant businesses are economic status of entrepreneur’s household(Collins, 2003; Mitchell, 2003; Constant, 2004; Pearce, 2005), education and experienceof the immigrant entrepreneur (Lerner and Hendeles, 1996; Lerner and Khavul, 2003),ethnic networks (Toussaint-Comeau, 2005), and receiving government financial support(Collins, 2003; Lerner and Khavul, 2003; Lerner et al., 2005).
• Ethnic networks and raising capital. Immigrant entrepreneurs tend to create informal,ethnic networks that are used for raising capital and are inclined to deal with their owncommunity (Menzies et al., 2000; Menzies et al., 2003; Toussaint-Comeau, 2005; Tseng,1997). Thus, for immigrant entrepreneurs, who are more likely to finance their busi-nesses from ethnic sources, co-ethnic dealing is important in non-financial spheres oftheir business activities as well.
2.4. Working hypotheses
Some studies on immigrant entrepreneurship revealed that the central difficulties of immi-grant entrepreneurs are a lack of capital and limited access to bank loans and credit (Constant,2004; Pearce, 2005). Because of capital constraints, immigrant entrepreneurs tend to investless start-up capital in their businesses than non-immigrant entrepreneurs (Huck et al., 1999;Mata and Pendakur, 1998; “Immigrant Entrepreneurs,” 1997) and are more likely to borrowcapital from such informal ethnic sources as family and friends than are non-immigrantentrepreneurs (Tseng, 1997; Pearce, 2005; Collins, 2000; Bates, 1997; Smallbone et al.,2003). Therefore, we expect that:
H1: The scope of funding of immigrant businesses is smaller than the scope of funding ofnon-immigrant businesses.
H2: Immigrant entrepreneurs are more likely to finance their businesses with loans fromfamily and friends than non-immigrant entrepreneurs, such that the share of capitalderiving from family and friends in funding of immigrant businesses is higher thanthat in funding of non-immigrant businesses.
Some studies revealed that policy implementation can meaningfully contribute to immi-grants’ business development (Pearce, 2005) and highlighted the importance of govern-mental support for immigrants’ incorporation (Menahem and Lerner, 2001). Lerner andKhavul (2003) found that the diversity of governmental support received by immigrantentrepreneurs does not affect their business’ survival, but they emphasized that the loans are
June 10, 2008 20:31 WSPC WS-JDE SPI-J076 00091
Financial Funding of Immigrant Businesses 173
still a significant factor in a business’ viability. Designated loans on favorable terms are theparticular source of capital available for immigrant entrepreneurs in Israel. Immigrants canreceive these loans from the Israeli Ministry of Immigrant Absorption. A certain percentageof the loan becomes a subsidy after three years. This loan should cover 65–80 percent of theneeded capital depending on the area, but the maximum sum for a loan is relatively small(only about US$8,300).
We expect that:
H3: Receiving a designated loan is the salient factor influencing financial funding of immi-grant businesses in terms of their scope and proportion.
Immigrants tend to create small ethnic networks and immigrant entrepreneurs widelyuse them. Ethnic dealing plays a role in mobilizing information and monetary resources forsmall ethnic businesses and promotes personal contacts and informal arrangements. In ourstudy we describe ethnic business dealings in terms of share of co-ethnic clients. Therefore,we expect that:
H4: Immigrant entrepreneurs who deal with co-ethnic clients also use more ethnic sourcesof capital for financing their businesses.
3. Method
3.1. Target research population
The target research population consisted of two groups of entrepreneurs: Israel-born and FSUimmigrant entrepreneurs who came to Israel between 1989 and 2005, and were operatingbusinesses at the time of answering the questionnaire. The business ventures owned byour target research population are spread all over the country and employ up to 50 people.This means that all the businesses under investigation are small businesses according to thedefinition of the Israel Small and Medium Enterprises Authority (2004).
3.2. Data collection
Data collection was based on a combination of convenient and snow-ball samples thatanswered a questionnaire including closed and open questions. The questionnaire took anaverage of one hour to complete and was conducted in the entrepreneurs’ native language.
Data was collected in two steps. In 2000–2002, we surveyed 74 FSU immigrantentrepreneurs. During 2004–2005, we surveyed 214 Israel-born entrepreneurs and 79 addi-tional FSU immigrant entrepreneurs. Hence, a total of 153 immigrants were surveyed.
The characteristics of the entrepreneurs and their businesses that took part in our studyare very similar to what was seen in the studies conducted in Israel by Razin and Scheinberg(2001), Lerner and Khavul (2003), and to a representative sample of entrepreneurs givenin the study of Nadiv and Shelah (2003) conducted by the Ministry of Industry, Trade andLabor of Israel. Consequently, we consider our sample to be representative of the populationof Israeli and FSU immigrant entrepreneurs.
June 10, 2008 20:31 WSPC WS-JDE SPI-J076 00091
174 N. Kushnirovich & S. Heilbrunn
3.3. Sample characteristics
3.3.1. Characteristics of entrepreneurs
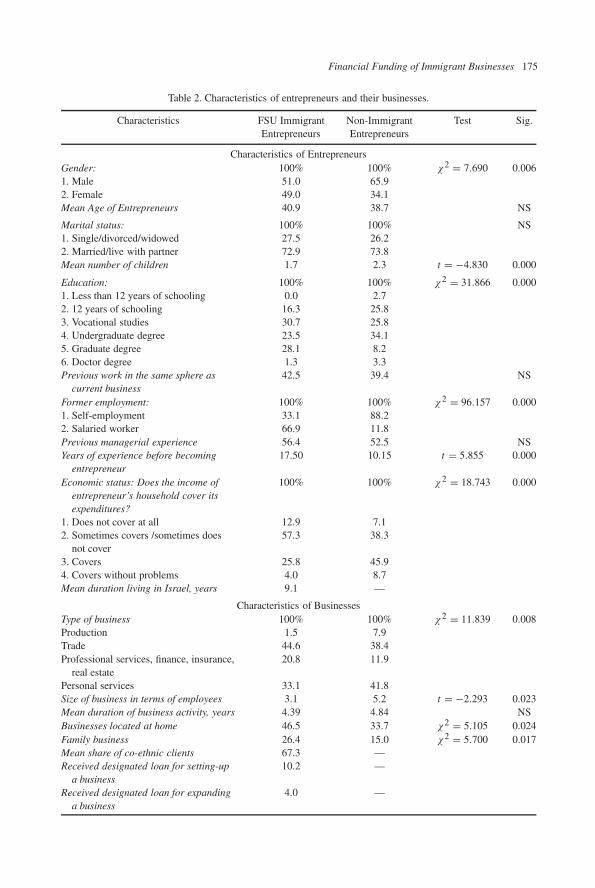
We found significant differences in characteristics between non-immigrant and immigrantentrepreneurs (Table 2). Among immigrant entrepreneurs, women own 1 half of all busi-nesses, whereas non-immigrant women entrepreneurs own only one-third of non-immigrantbusinesses. This fact reflects the high entrepreneurial activity of immigrant women.
Immigrant entrepreneurs are more educated than their colleagues; 83.6 percent of themhave earned at least some level of academic degree. Immigrant respondents have more workexperience before establishing their businesses (17.50 years for immigrants versus 10.15years for non-immigrant entrepreneurs) and less entrepreneurial experience (33.1 versus88.2%). There is no significant difference between the groups in age and previous managerialexperience. Nearly half of both immigrant and non-immigrant entrepreneurs had previousmanagerial experience and entered business spheres in which they had no former experience.
Immigrant entrepreneurs have fewer children than non-immigrant entrepreneurs (1.7versus 2.3). Nevertheless, there is no significant difference in the two groups’ family status.Nearly 70 percent of both immigrant and non-immigrant entrepreneurs are married. Theeconomic status of immigrant entrepreneurs is significantly lower than that of non-immigrantentrepreneurs (χ2 = 18.743; Sig. = 0.000).
To sum up, the immigrant business owner is 41 years old, married and has a highereducation degree. He/she has many years of experience as a salaried worker (17.50 years) butnot in the sphere of his/her current business, and has no previous entrepreneurial experience.Immigrant business owners have lived in Israel about 10 years on average and set up theircurrent businesses about 5.5 years after immigration.
3.3.2. Characteristics of immigrant businesses
The characteristics of businesses owned by immigrant entrepreneurs are significantly dif-ferent by type from those owned by non-immigrant entrepreneurs (Table 2). Immigrantentrepreneurs are more likely to provide professional services. This corresponds with theirhigh educational level. Non-immigrant entrepreneurs dominate in production and personalservices.
Immigrant businesses are smaller than those of non-immigrant entrepreneurs in terms ofemployees. The mean number of employees in immigrant business is 3.1, whereas in non-immigrant business it is 5.2 employees. Immigrants prefer to work from home, apparentlyto decrease business expenditures (46.5 percent of immigrant entrepreneurs versus 33.7 per-cent of non-immigrant entrepreneurs). They are more likely than Israel-born entrepreneursto establish family businesses (26.4 percent versus 15.0 percent). Immigrant businesses areco-ethnic oriented in terms of their clients — the mean share of co-ethnic clients is 67.3percent.
Our study revealed that there are no significant differences in the duration of businessactivity between immigrant and non-immigrant entrepreneurs (the mean period of operationfor immigrant businesses is 4.39 years versus 4.84 years for non-immigrant businesses).
June 10, 2008 20:31 WSPC WS-JDE SPI-J076 00091
Financial Funding of Immigrant Businesses 175
Table 2. Characteristics of entrepreneurs and their businesses.
Characteristics FSU Immigrant Non-Immigrant Test Sig.Entrepreneurs Entrepreneurs
Characteristics of EntrepreneursGender: 100% 100% χ2 = 7.690 0.0061. Male 51.0 65.92. Female 49.0 34.1Mean Age of Entrepreneurs 40.9 38.7 NS
Marital status: 100% 100% NS1. Single/divorced/widowed 27.5 26.22. Married/live with partner 72.9 73.8Mean number of children 1.7 2.3 t = −4.830 0.000
Education: 100% 100% χ2 = 31.866 0.0001. Less than 12 years of schooling 0.0 2.72. 12 years of schooling 16.3 25.83. Vocational studies 30.7 25.84. Undergraduate degree 23.5 34.15. Graduate degree 28.1 8.26. Doctor degree 1.3 3.3Previous work in the same sphere as
current business42.5 39.4 NS
Former employment: 100% 100% χ2 = 96.157 0.0001. Self-employment 33.1 88.22. Salaried worker 66.9 11.8Previous managerial experience 56.4 52.5 NSYears of experience before becoming
entrepreneur17.50 10.15 t = 5.855 0.000
Economic status: Does the income ofentrepreneur’s household cover itsexpenditures?
100% 100% χ2 = 18.743 0.000
1. Does not cover at all 12.9 7.12. Sometimes covers /sometimes does
not cover57.3 38.3
3. Covers 25.8 45.94. Covers without problems 4.0 8.7Mean duration living in Israel, years 9.1 —
Characteristics of BusinessesType of business 100% 100% χ2 = 11.839 0.008Production 1.5 7.9Trade 44.6 38.4Professional services, finance, insurance,
real estate20.8 11.9
Personal services 33.1 41.8Size of business in terms of employees 3.1 5.2 t = −2.293 0.023Mean duration of business activity, years 4.39 4.84 NSBusinesses located at home 46.5 33.7 χ2 = 5.105 0.024Family business 26.4 15.0 χ2 = 5.700 0.017Mean share of co-ethnic clients 67.3 —Received designated loan for setting-up
a business10.2 —
Received designated loan for expandinga business
4.0 —
June 10, 2008 20:31 WSPC WS-JDE SPI-J076 00091
176 N. Kushnirovich & S. Heilbrunn
3.4. Measures
According to our classification of financial sources for immigrant businesses we groupedsources of funding on equity and debt, informal and formal, ethnic and non-ethnic. FSUimmigrant entrepreneurs in Israel do not create rotating credit associations and do not estab-lish ethnic banks. Therefore, the informal sources of capital of FSU immigrant entrepreneursinclude personal savings and loans from family and friends. We did not ask our respondentswhether their personal savings were rooted in their origin country or host country, thereforewe consider personal savings as a non-ethnic source. Ethnic sources of capital drawingfrom immigrants’ ethnic networks are family and friends only. Thus, in our study on FSUimmigrant entrepreneurs their informal sources consist of ethnic sources and equity. How-ever, increasing one group does not automatically mean there is a commensurate increase inthe other group. For example, informal sources can rise due to increasing personal savings(non-ethnic) or loans from family (ethnic); share of debt can rise due to bank loans (formalsource) or loans from friends (informal source).
Dependent variables describe the scope and proportion of financial funding.Entrepreneurs were asked about the share of different sources of capital when setting
up their business and expanding it (the total percentage should equal 100). According tothe delineated groups of sources, we identified three ratios characterizing the proportion offunding: (a) debt ratio (share of debt in all the invested capital); (b) ratio of ethnic sources(share of capital from ethnic sources), and (c) ratio of informal sources (share of capitalfrom informal sources).
Thus, dependent variables characterizing start-up financial funding are scope of start-upcapital, debt ratio of start-up capital, ratio of informal sources in start-up capital, and ratioof ethnic sources in start-up capital.
Dependent variables characterizing financial funding for expanding a business are debtratio of capital invested in expanding business, ratio of informal sources of capital investedin expanding business and ratio of ethnic sources of capital invested in expanding business.
Scope of start-up capital was categorized on a scale of 1 to 8: 1=no investment wasmade; 2=up to 5,000 NIS; 3=5,001–10,000 NIS; 4=10,001–25,000 NIS; 5=25,001–50,000 NIS; 6=50,001–100,000 NIS; 7=100,001–250,000 NIS; 8=more than 250,000NIS, whereas $1=4.3 NIS (see statistics in Table 3). All ratios are continuous variablesmeasured in percent (see statistics in Table 4).
Independent variables in our regression models are:
(i) Education, which was categorized on a scale of 1 to 6: 1= less then 12 years ofschooling; 2=12 years of schooling; 3=vocational studies; 4=undergraduatedegree;5=graduate degree; 6=doctor degree and more.
(ii) Former entrepreneurial experience, which was coded as 1 if entrepreneur was formerlyself-employed and 0 if s/he was not.
(iii) Economic status of entrepreneur’s household, indicating the extent to which the incomeof the entrepreneur’s household covers its expenditures. A variable was categorized ona four-point scale: 1=does not cover at all; 2= sometimes covers/sometimes does notcover; 3= covers; and 4= covers without problems.
June 10, 2008 20:31 WSPC WS-JDE SPI-J076 00091
Financial Funding of Immigrant Businesses 177
(iv) Receiving a designated loan for setting up a business. A variable was coded as 1 if theentrepreneur received a designated loan and 0 if s/he did not receive.
(v) Receiving a designated loan for expanding a business. A variable was coded as 1 ifentrepreneur received designated loan and 0 s/he did not receive.
(vi) Share of co-ethnic clients. This is a continuous variable measured in percent.
There were no significant correlations among the independent variables.a
Statistics on independent variables are presented in Table 2. Non-immigrantentrepreneurs are ineligible for designated loans on favorable terms and the term “co-ethnicclients” does not make sense for them. Thus, three of the six independent variables are notrelevant for non-immigrant entrepreneurs. Regression analysis, therefore, is relevant for thesample of immigrant entrepreneurs only, answering the paper’s purpose to delineate factorsinfluencing financial funding of immigrant businesses.
4. Results
4.1. The scope of funding
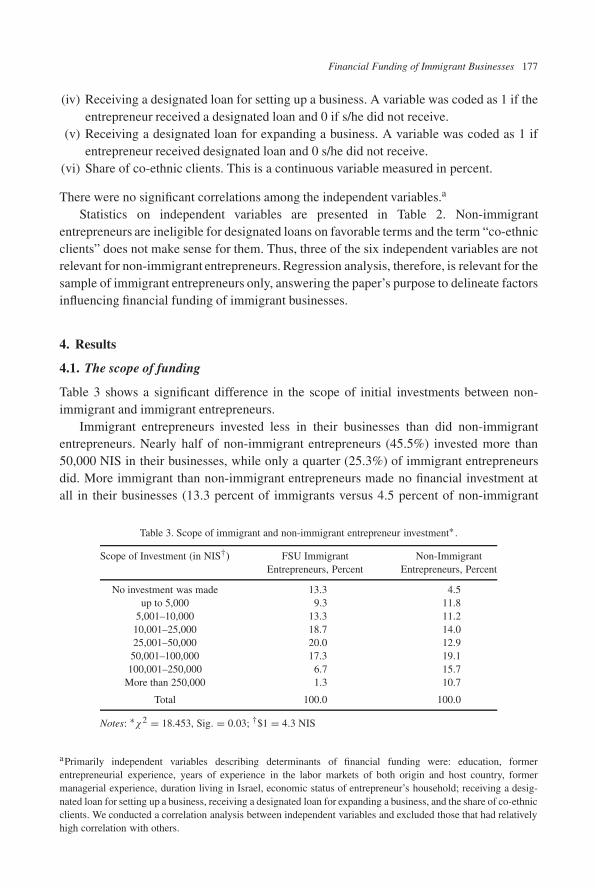
Table 3 shows a significant difference in the scope of initial investments between non-immigrant and immigrant entrepreneurs.
Immigrant entrepreneurs invested less in their businesses than did non-immigrantentrepreneurs. Nearly half of non-immigrant entrepreneurs (45.5%) invested more than50,000 NIS in their businesses, while only a quarter (25.3%) of immigrant entrepreneursdid. More immigrant than non-immigrant entrepreneurs made no financial investment atall in their businesses (13.3 percent of immigrants versus 4.5 percent of non-immigrant
Table 3. Scope of immigrant and non-immigrant entrepreneur investment∗ .
Scope of Investment (in NIS†) FSU Immigrant Non-ImmigrantEntrepreneurs, Percent Entrepreneurs, Percent
No investment was made 13.3 4.5up to 5,000 9.3 11.8
5,001–10,000 13.3 11.210,001–25,000 18.7 14.025,001–50,000 20.0 12.9
50,001–100,000 17.3 19.1100,001–250,000 6.7 15.7
More than 250,000 1.3 10.7
Total 100.0 100.0
Notes: ∗χ2 = 18.453, Sig. = 0.03; †$1 = 4.3 NIS
aPrimarily independent variables describing determinants of financial funding were: education, formerentrepreneurial experience, years of experience in the labor markets of both origin and host country, formermanagerial experience, duration living in Israel, economic status of entrepreneur’s household; receiving a desig-nated loan for setting up a business, receiving a designated loan for expanding a business, and the share of co-ethnicclients. We conducted a correlation analysis between independent variables and excluded those that had relativelyhigh correlation with others.
June 10, 2008 20:31 WSPC WS-JDE SPI-J076 00091
178 N. Kushnirovich & S. Heilbrunn
entrepreneurs). Thus, businesses owned by immigrant entrepreneurs have less initialinvestments.
Our first hypothesis (H1) that scope of funding of immigrant businesses is smaller thanthe scope of funding of non-immigrant businesses was supported.
4.2. Proportions of immigrant businesses’ financial funding
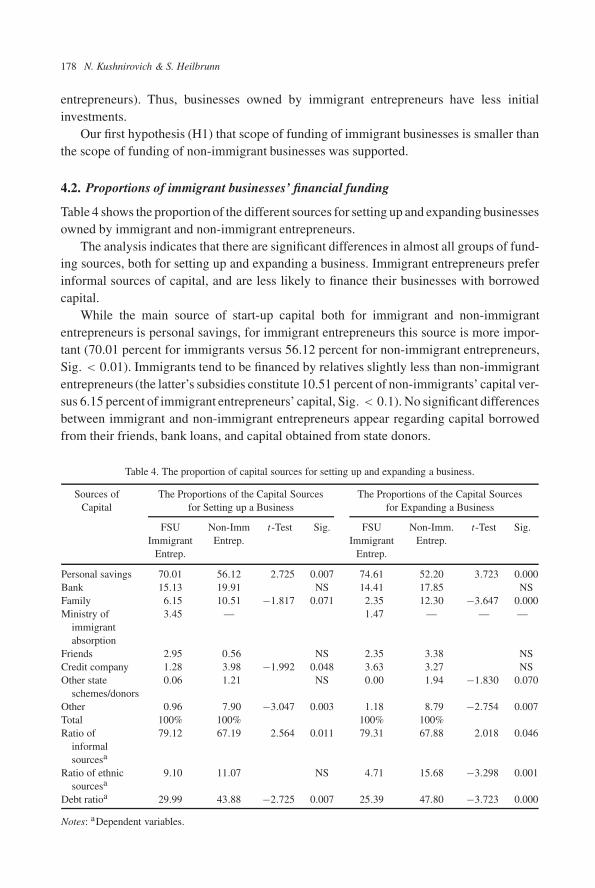
Table 4 shows the proportion of the different sources for setting up and expanding businessesowned by immigrant and non-immigrant entrepreneurs.
The analysis indicates that there are significant differences in almost all groups of fund-ing sources, both for setting up and expanding a business. Immigrant entrepreneurs preferinformal sources of capital, and are less likely to finance their businesses with borrowedcapital.
While the main source of start-up capital both for immigrant and non-immigrantentrepreneurs is personal savings, for immigrant entrepreneurs this source is more impor-tant (70.01 percent for immigrants versus 56.12 percent for non-immigrant entrepreneurs,Sig. < 0.01). Immigrants tend to be financed by relatives slightly less than non-immigrantentrepreneurs (the latter’s subsidies constitute 10.51 percent of non-immigrants’ capital ver-sus 6.15 percent of immigrant entrepreneurs’ capital, Sig. < 0.1). No significant differencesbetween immigrant and non-immigrant entrepreneurs appear regarding capital borrowedfrom their friends, bank loans, and capital obtained from state donors.
Table 4. The proportion of capital sources for setting up and expanding a business.
Sources of The Proportions of the Capital Sources The Proportions of the Capital SourcesCapital for Setting up a Business for Expanding a Business
FSU Non-Imm t-Test Sig. FSU Non-Imm. t-Test Sig.Immigrant Entrep. Immigrant Entrep.
Entrep. Entrep.
Personal savings 70.01 56.12 2.725 0.007 74.61 52.20 3.723 0.000Bank 15.13 19.91 NS 14.41 17.85 NSFamily 6.15 10.51 −1.817 0.071 2.35 12.30 −3.647 0.000Ministry of
immigrantabsorption
3.45 — 1.47 — — —
Friends 2.95 0.56 NS 2.35 3.38 NSCredit company 1.28 3.98 −1.992 0.048 3.63 3.27 NSOther state
schemes/donors0.06 1.21 NS 0.00 1.94 −1.830 0.070
Other 0.96 7.90 −3.047 0.003 1.18 8.79 −2.754 0.007Total 100% 100% 100% 100%Ratio of
informalsourcesa
79.12 67.19 2.564 0.011 79.31 67.88 2.018 0.046
Ratio of ethnicsourcesa
9.10 11.07 NS 4.71 15.68 −3.298 0.001
Debt ratioa 29.99 43.88 −2.725 0.007 25.39 47.80 −3.723 0.000
Notes: aDependent variables.
June 10, 2008 20:31 WSPC WS-JDE SPI-J076 00091
Financial Funding of Immigrant Businesses 179
Personal savings remain the largest source of capital also when expanding both immi-grant and non-immigrant businesses. Nonetheless, this source is still more importantfor immigrant entrepreneurs. It contributes 74.61 percent of capital needed by immi-grants for expanding their business versus 52.20 percent of that needed by non-immigrantentrepreneurs (Sig. < 0.000). Financial increments given by immigrants’ relatives forexpanding businesses are significantly fewer than those of non-immigrant businesses.
Accordingly, it is evident that immigrants tend to be financed less by relatives thannon-immigrant entrepreneurs both when setting-up and expanding their businesses. Thereare no significant differences between immigrant and non-immigrant businesses regard-ing friends’ increments. Hence, hypothesis H2 — that immigrant entrepreneurs are morelikely to finance their businesses with loans from family and friends than non-immigrantentrepreneurs, such that the share of capital deriving from family and friends in funding ofimmigrant businesses is higher than that in funding of non-immigrant businesses — is notsupported.
4.3. Factors influence financial funding of immigrant businesses
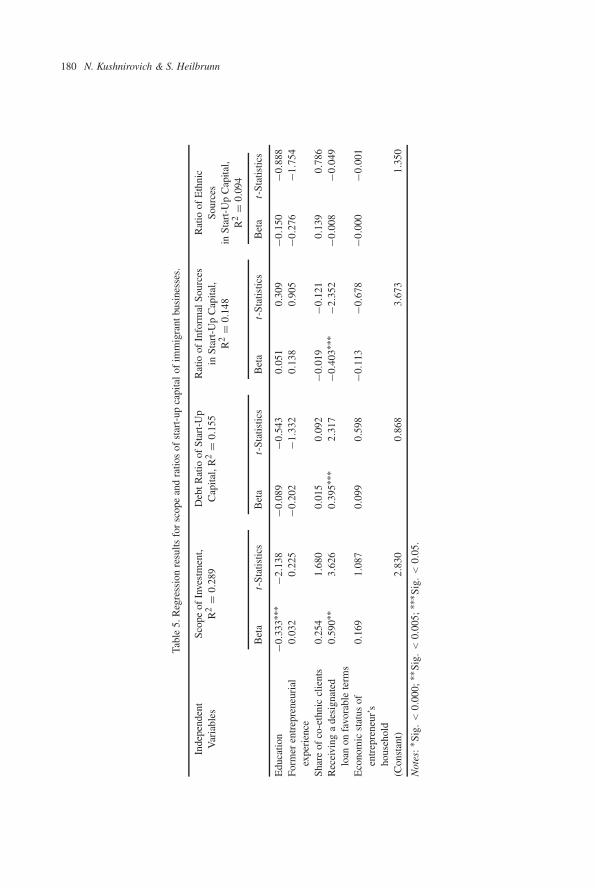
Our study examined which factors influence the scope and proportion of financial fundingof immigrant businesses. For start-up funding we ran a regression analysis for the followingvariables: scope of investment, debt ratio of start-up capital, ratio of informal resources instart-up capital, and ratio of ethnic resources in start-up capital. Table 5 shows the resultsof regression. The independent variables characterizing the immigrant entrepreneur andhis/her business were described in the “Method” section.
The analysis indicates there are two factors that significantly influence the scope of start-up capital: education and receiving a designated loan on favorable terms. More educatedimmigrant entrepreneurs invest less in setting-up their businesses. However, education doesnot influence ratios characterizing proportion of start-up financial funding.
Receiving a designated loan significantly increases the scope of initial investment. Thisincreases the debt ratio, reduces the ratio of informal sources, and does not influence theratio of ethnic sources. This is largely predictable, because entrepreneurs, who are less likelyto rely on personal savings, are more likely to borrow from all sources, including availabledesignated loans. Nevertheless, the fact that receiving a designated loan is a critical factorinfluencing both the scope and proportion of start-up capital is interesting.
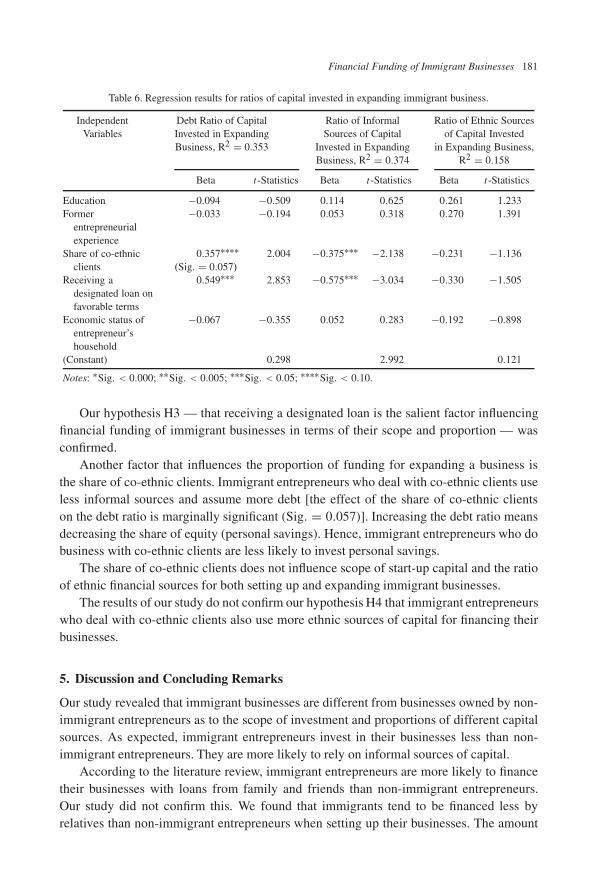
To examine which factors influence financial funding for expanding immigrant busi-nesses, we ran a regression analysis for the following three ratios: debt ratio of cap-ital invested in expanding a business, ratio of informal sources of capital invested inexpanding business, and ratio of ethnic sources of capital invested in expanding business(Table 6).
Receiving a designated loan influences the proportion of funding for expanding a busi-ness in the same way as the proportion of start-up funding: it increases the debt ratio,decreases the ratio of informal sources, and does not influence the ratio of ethnic sources.Thus, receiving this loan influences the scope and proportion of funding both for setting upand expanding businesses.
June 10, 2008 20:31 WSPC WS-JDE SPI-J076 00091
180 N. Kushnirovich & S. Heilbrunn
Tabl
e5.
Reg
ress
ion
resu
ltsfo
rsc
ope
and
ratio
sof
star
t-up
capi
tal
ofim
mig
rant
busi
ness
es.
Inde
pend
ent
Var
iabl
esSc
ope
ofIn
vest
men
t,R
2=
0.28
9D
ebtR
atio
ofSt
art-
Up
Cap
ital,
R2
=0.
155
Rat
ioof
Info
rmal
Sour
ces
inSt
art-
Up
Cap
ital,
R2
=0.
148
Rat
ioof
Eth
nic
Sour
ces
inSt
art-
Up
Cap
ital,
R2
=0.
094
Bet
at-
Stat
istic
sB
eta
t-St
atis
tics
Bet
at-
Stat
istic
sB
eta
t-St
atis
tics
Edu
catio
n−0
.333
∗∗∗
−2.1
38−0
.089
−0.5
430.
051
0.30
9−0
.150
−0.8
88Fo
rmer
entr
epre
neur
ial
expe
rien
ce0.
032
0.22
5−0
.202
−1.3
320.
138
0.90
5−0
.276
−1.7
54
Shar
eof
co-e
thni
ccl
ient
s0.
254
1.68
00.
015
0.09
2−0
.019
−0.1
210.
139
0.78
6R
ecei
ving
ade
sign
ated
loan
onfa
vora
ble
term
s0.
590∗
∗3.
626
0.39
5∗∗∗
2.31
7−0
.403
∗∗∗
−2.3
52−0
.008
−0.0
49
Eco
nom
icst
atus
ofen
trep
rene
ur’s
hous
ehol
d
0.16
91.
087
0.09
90.
598
−0.1
13−0
.678
−0.0
00−0
.001
(Con
stan
t)2.
830
0.86
83.
673
1.35
0
Not
es:∗
Sig.
<0.
000;
∗∗Si
g.<
0.00
5;∗∗
∗ Sig
.<
0.05
.
June 10, 2008 20:31 WSPC WS-JDE SPI-J076 00091
Financial Funding of Immigrant Businesses 181
Table 6. Regression results for ratios of capital invested in expanding immigrant business.
IndependentVariables
Debt Ratio of CapitalInvested in ExpandingBusiness, R2 = 0.353
Ratio of InformalSources of Capital
Invested in ExpandingBusiness, R2 = 0.374
Ratio of Ethnic Sourcesof Capital Invested
in Expanding Business,R2 = 0.158
Beta t-Statistics Beta t-Statistics Beta t-Statistics
Education −0.094 −0.509 0.114 0.625 0.261 1.233Former
entrepreneurialexperience
−0.033 −0.194 0.053 0.318 0.270 1.391
Share of co-ethnicclients
0.357∗∗∗∗ 2.004 −0.375∗∗∗ −2.138 −0.231 −1.136(Sig. = 0.057)
Receiving adesignated loan onfavorable terms
0.549∗∗∗ 2.853 −0.575∗∗∗ −3.034 −0.330 −1.505
Economic status ofentrepreneur’shousehold
−0.067 −0.355 0.052 0.283 −0.192 −0.898
(Constant) 0.298 2.992 0.121
Notes: ∗Sig. < 0.000; ∗∗Sig. < 0.005; ∗∗∗Sig. < 0.05; ∗∗∗∗Sig. < 0.10.
Our hypothesis H3 — that receiving a designated loan is the salient factor influencingfinancial funding of immigrant businesses in terms of their scope and proportion — wasconfirmed.
Another factor that influences the proportion of funding for expanding a business isthe share of co-ethnic clients. Immigrant entrepreneurs who deal with co-ethnic clients useless informal sources and assume more debt [the effect of the share of co-ethnic clientson the debt ratio is marginally significant (Sig. = 0.057)]. Increasing the debt ratio meansdecreasing the share of equity (personal savings). Hence, immigrant entrepreneurs who dobusiness with co-ethnic clients are less likely to invest personal savings.
The share of co-ethnic clients does not influence scope of start-up capital and the ratioof ethnic financial sources for both setting up and expanding immigrant businesses.
The results of our study do not confirm our hypothesis H4 that immigrant entrepreneurswho deal with co-ethnic clients also use more ethnic sources of capital for financing theirbusinesses.
5. Discussion and Concluding Remarks
Our study revealed that immigrant businesses are different from businesses owned by non-immigrant entrepreneurs as to the scope of investment and proportions of different capitalsources. As expected, immigrant entrepreneurs invest in their businesses less than non-immigrant entrepreneurs. They are more likely to rely on informal sources of capital.
According to the literature review, immigrant entrepreneurs are more likely to financetheir businesses with loans from family and friends than non-immigrant entrepreneurs.Our study did not confirm this. We found that immigrants tend to be financed less byrelatives than non-immigrant entrepreneurs when setting up their businesses. The amount
June 10, 2008 20:31 WSPC WS-JDE SPI-J076 00091
182 N. Kushnirovich & S. Heilbrunn
borrowed from relatives drops even more so when they expand their business. There are nosignificant differences between immigrant and non-immigrant businesses regarding friends’increments. Thus, immigrants are not likely to finance their businesses with capital borrowedfrom family and friends.
The main source of capital, both for immigrant and non-immigrant entrepreneurs, ispersonal savings. This fact is very surprising because, as it was mentioned in literaturereview, the economic status of FSU immigrant households in Israel is lower than that ofnon-immigrant households.
We examined which factors influence financial funding of immigrant businesses. Gov-ernmental support in the terms of designated loans is the most salient factor influencing finan-cial funding: receiving these loan influences the scope and proportion of funding both forsetting up and for expanding businesses. This finding is interesting because the share of des-ignated loans in funding of immigrant businesses is very small and even less than that of bankloans. Ninety-two percent of those who applied for a bank loan when starting their businessesdid not borrow from the Ministry of Immigrant Absorption. For entrepreneurs expandingtheir businesses, the share of those who applied to a bank, but not to the Ministry of Immi-grant Absorption, was similar (87.9 percent). This means that immigrant entrepreneurs needdesignated loans but have difficulty in accessing them. As mentioned above, for those whomanaged to receive the loan, the scope and proportion of funding are substantially affected.
Except for the support available to new immigrants from the Ministry of ImmigrantAbsorption (loans on favorable terms), immigrant entrepreneurs do not apply for other stateprograms for expanding their businesses, although these are open to all Israeli entrepreneurs,both non-immigrant and immigrants. To our utter surprise, not one of the immigrant respon-dents knew about other possible government funding sources. Our study brought to lightthe inefficiency of the existing government policy in this field and communication failuresbetween public institutions and immigrant entrepreneurs.
We found that two additional factors influence the financial funding of immigrant busi-nesses: the education level of the entrepreneurs and the share of co-ethnic clients. Moreeducated immigrant entrepreneurs invest less in setting-up their businesses. Education influ-ences only the scope of start-up capital and does not influence its proportion. Share of co-ethnic clients only influences the proportion of capital needed for business expanding anddid not influence start-up capital. Immigrant entrepreneurs who deal with co-ethnic clientsare less likely to invest personal savings. Summing up, these factors have only a minor andpointed influence on financial funding of immigrant businesses.
The literature review led us to anticipate that immigrants tend to create small ethnicnetworks. Managing these networks should enable them to take advantage of both finan-cial and non-financial resources. Therefore, we expected that immigrant entrepreneurs whodeal with co-ethnic clients also use more ethnic sources of capital for financing their busi-nesses. However, this hypothesis was not confirmed. Our study revealed that the share ofco-ethnic clients does not influence the ratio of ethnic financial sources for both setting upand expanding immigrant businesses.
Our study has some policy-oriented contributions. Receiving government financialsupport is an important factor, strongly influencing the financial funds of immigrant
June 10, 2008 20:31 WSPC WS-JDE SPI-J076 00091
Financial Funding of Immigrant Businesses 183
entrepreneurs. However, immigrant entrepreneurs do not fully utilize existing supportsystems.
This study was presented at the Israel Small and Medium Enterprises Authority and tospecialists of the Ministry of Immigrant Absorption.
Further studies should investigate the issue of ethnic versus non-ethnic immigrantentrepreneurship.
References
Aaronson, D, PF Huck and R Townsend (2000). Small-business access to trade credit: Some evi-dence of ethnic differences. Consumer and Community Affairs Policy Studies, 2000–2, FederalReserve Bank of Chicago.
Bates, T (1997). Financing small business creation: The case of Chinese and Korean immigrantentrepreneurs. Journal of Business Venturing, 12(2), 109–124.
Bond, P and R Townsend (1999). Formal and informal financing in a Chicago ethnic neighborhood.Economic Perspectives (II), Federal Reserve Bank of Chicago, 3–27.
Collins, J (2000). Ethnicity, gender and Australian entrepreneurs: Rethinking Marxist views on smallbusiness. Journal of Social Change and Critical Inquiry, 2. [www.uow.edu.au/arts/joscci].
Collins, J (2003). Cultural diversity and entrepreneurship: Policy responses to immigrant entrepreneursin Australia. Journal of Entrepreneurship & Regional Development, 15, 137–149.
Constant, A (2004). Immigrant versus native businesswomen: Proclivity and performance. DiscussionPaper No. 1234. Institute for the Study of Labor (IZA).
Hosler, A (1998). Japanese Immigrant Entrepreneurs in New York City: A New Wave of Ethnic Busi-ness. New York: Garland.
Huck, P, S Rhine, P Bond and R Townsend (1999). Small business finance in two Chicago minorityneighborhoods. Economic Perspectives, II, 46–62.
Immigrant Entrepreneurs (1997). Research Perspectives on Migration, 1(2), 1–15. [www.migrationpolicy.org/files/RPMVol1-No2.pdf].
Kesavan, R (2003). The OREO model of immigrant entrepreneurship: Application and hypothesisgeneration. Conference papers of ASBE (Association for Small Business & Entrepreneurship).
Labor Force Survey Data (2004). Israeli Central Bureau of Statistics [www1.cbs.gov.il/reader/y_labor/yearm_h_new.htm#7].
Lerner, M and Y Hendeles (1996). New entrepreneurs and entrepreneurial aspirations among immi-grants from the former USSR to Israel. Journal of Business Research, 36, 59–65.
Lerner, M and S Khavul (2003). Beating the odds in immigrant entrepreneurship: How does founderhuman capital compare to institutional capital in improving the survival of immigrant ownedbusinesses? Working Paper No 4/2003. Babson College.
Lerner, M, G Menahem and R Hisrich (2005). Does government matter? The impact of occupationalretraining, gender and ethnicity of immigrants’ incorporation. Journal of Small Business andEnterprise Development, (12)2, 192–210.
Light, I and E Bonacich (1988). Immigrant entrepreneurs: Koreans in Los Angeles, 1965–1982.Berkeley: University of California Press.
Light, I, I Kwuon and D Zhong (1990). Korean rotating credit associations in Los Angeles. Amerasia,16(1), 35–54.
Light, I and C Rosenstein (1995). Race, Ethnicity and Entrepreneurship in Urban America. New York:Aidine de Gruyter.
Mata, F and R Pendakur (1998). Immigration, labor force integration and the pursuit of self-employment. Working Paper Series No. 98–05. Vancouver Centre of Excellence.
June 10, 2008 20:31 WSPC WS-JDE SPI-J076 00091
184 N. Kushnirovich & S. Heilbrunn
Menahem, G and M Lerner (2001). An evaluation of the effect of public support in enhancing occupa-tional incorporation of former Soviet Union immigrants to Israel: A longitudinal study. Journalof Social Policy, 2, 307–331.
Menzies, T, G Brenner, LJ Filion and L Lowry (2000). Transitional entrepreneurship and bootstrapcapitalism: Social capital, networks and ethnic minority entrepreneurship. In Proc. 2nd BiennialMcGill Conference on International Entrepreneurship: Research New Frontiers. Montreal,Quebec, September 2000.
Menzies, T, G Brenner and L Filion (2003). Social capital, networks and ethnic minority entrepreneurs:Transnational entrepreneurship and bootstrap capitalism. In Globalization and Entrepreneur-ship: Policy and Strategy Perspectives, Etemad, H and R Wright (eds.), 125–151, Northampton,MA: Edward Elgar Publishing.
Mitchell, B (2003). The role of networks among entrepreneurs from different ethnic groups. The SmallBusiness Monitor, 1(1), 78–86.
Nadiv, R and S Shelah (2003). Entrepreneurs’ profile and employment characteristics 1970–2001.Study No. 13126. Ministry of Industry, Trade and Labor of Israel, Jerusalem.
Pearce, S (2005). Today’s immigrant woman entrepreneur. Immigration Policy in Focus, 4(1).[www.ailf.org/ipc/ipf011705.asp].
Razin, E (1990). Immigrant entrepreneurs in Israel, Canada and California. California Immigrants inWorld Perspective. The Conference Papers, Institute for Social Science Research.
Razin, E and D Scheinberg (2001). Immigrant entrepreneurs from the former USSR in Israel: Not thetraditional enclave economy. Journal of Ethnic and Migration Studies, 27(2), 259–276.
Raijman, R and M Tienda (2003). Ethnic foundations of economic transactions: Mexican and Koreanimmigrant entrepreneurs in Chicago. Ethnic and Racial Studies, 26(5), 783–801.
Rowley, T (2004). Entrepreneurship Means Adaptation. Editorials [www.rupri.org/editorial/Default.asp?edID=91&ACTION=READ].
Smallbone D, M Ram, D Deakins and R Baldock (2003). Access to finance by ethnic minority in theUK. International Small Business Journal, 21(3), 291–315.
Toussaint-Comeau, M (2005). Self-employed immigrants: An analysis of recent data. Essays on Issues.Chicago Fed Letter, No 213.
Toussaint-Comeau, M and S Rhine (2000). Ethnic immigrant enclaves and homeownership: A casestudy of an Hispanic community. Consumer Issues Research Series, Federal Reserve Bankof Chicago Policy Studies [www.chicagofed.org/publications/publicpolicystudies/ccapolicystudy/pdf/cca-2000-6.pdf].
Tseng, YF (1995). Beyond little Taipei: Taiwanese immigrant businesses in Los Angeles. InternationalMigration Review, 29, 33–58.
Tseng, YF (1997). Ethnic resources as forms of social capital: A study on Chinese immigrantentrepreneurship in Los Angeles. Taiwanese Sociological Research, 1, 169–205.
Yafa, N and D Tal (2001). FSU immigrants, Statistical, 17 [www.cbs.gov.il/statistical/immigrants.pdf].Waldinger, R, H Aldrich and R Ward (1990). Ethnic Entrepreneurs: Immigrant Business in Industrial
Societies. Sage Publications.Yoo, J (1998). Korean Immigrant Entrepreneurs in America. New York: Garland Publishing.Yoon, I (1995). The growth of Korean immigrant entrepreneurship in Chicago. Ethnic and Racial
Studies, 18(2), 315–335.


