Embed Size (px)
Citation preview
University of Wollongong Thesis Collections
University of Wollongong Thesis Collection
University of Wollongong Year
Financial integration of the MENA
emerging stock markets
Hazem Ali MarashdehUniversity of Wollongong
Marashdeh, Hazem Ali, Financial integration of the MENA emerging stock markets, PhDthesis, School of Economic and Information Systems, University of Wollongong, 2006.http://ro.uow.edu.au/theses/543
This paper is posted at Research Online.
http://ro.uow.edu.au/theses/543
NOTE
This online version of the thesis may have different page formatting and pagination from the paper copy held in the University of Wollongong Library.
UNIVERSITY OF WOLLONGONG
COPYRIGHT WARNING
You may print or download ONE copy of this document for the purpose of your own research or study. The University does not authorise you to copy, communicate or otherwise make available electronically to any other person any copyright material contained on this site. You are reminded of the following: Copyright owners are entitled to take legal action against persons who infringe their copyright. A reproduction of material that is protected by copyright may be a copyright infringement. A court may impose penalties and award damages in relation to offences and infringements relating to copyright material. Higher penalties may apply, and higher damages may be awarded, for offences and infringements involving the conversion of material into digital or electronic form.
Financial Integration of the MENA Emerging Stock
Markets
A thesis submitted in fulfillment of the requirements for the award of the degree
Doctor of Philosophy
from
University of Wollongong
by
Hazem Ali Marashdeh
BEc (Economics and Accounting), Jordan
MEc (Economics), Jordan
School of Economic and Information System
2006

ii
Certification
I, Hazem Marashdeh, declare that this dissertation, submitted in fulfillment of the
requirement for the award of Doctor of Philosophy in the faculty of commerce,
University of Wollongong, is wholly my own work unless otherwise referenced or
acknowledged. The document has not been submitted for qualifications at any other
academic institution.
Hazem Marashdeh
December 2005

iii
Dedication
To the dearest friend
my father
Ali Marashdeh

iv
Acknowledgments
I would like to express my sincere gratitude and appreciation to my supervisor
Associate Professor Edger Wilson for his supervision, guidance and encouragement
throughout the study. His profound knowledge and experience provided me with the
opportunity to broaden my knowledge and to make a significant progress. Also I would
like to thank Associate Professor Amnon Livermore for his supervision through most of
the study. His insight into economic theory and creative comments were of a great
assistance. And I would like to thank Dr. Abbas Valadkhani for his supervision in the
final stages of the study. His exceptional editing skills and invaluable suggestions
always inspired me to strive for quality work.
I would like to thank my wife Diana Bakir for her love, care and extraordinary
support throughout my long study period. Dear Diana, you will always be in my heart.
I am very grateful to my parents, for their blessing, encouragement and support
throughout the duration of this study. Also I would like to thank my dearest brother,
Mones and my sisters, Arwa, Rabab, Aram, Demh, Layla, Lama and Farah for their
encouragement and support. Also, I would like to thank my father and mother-in-law
for their support.
Also, I would like to express my sincere thanks to my colleagues at the faculty
of commerce, Akhsyim Afandi, Mosayeb Bahlavani, Min Shrestha, Maen Al-hawari
and Reetu Verma. I have greatly benefited from their comments throughout my study
period. Finally, I would also like to thank Dr. Aktham Maghyereh for his help at the
early stage of this study.
v
Abstract
The main objective of this study is to examine the financial integration among
four emerging stock markets in the Middle East and North Africa (MENA) region,
namely, Egypt, Turkey, Jordan and Morocco. Their interrelationships with three
developed markets, the US, UK and Germany, are also examined. The motivation
behind this study is that, although a lot of research has been focused on stock market
integration, the emphasis has been mostly on developed markets. Stock market
integration in the MENA region has not been investigated deeply enough despite the
region being of a global economic and political importance.
To attain this objective, the study conducts recent econometric techniques on the
monthly time series of stock market price indices. It starts with testing for a unit root in
the presence of structural change at an unknown time of the break, using the
Innovational Outlier (IO) model. To empirically examine the financial integration, the
study utilizes the newly proposed autoregressive distributed lag (ARDL) approach to
cointegration. The ARDL approach has been recognized as more preferable in
estimating the long-run equilibrium relationship than other cointegration approaches in
small samples with mixed order process. Finally, the study explores the short and long-
run dynamic relationships among these markets using Granger-causality within a
correctly specified vector error correction model (VECM).
The empirical results indicate that all variables show evidence of non-
stationarity, even in the presence of structural change. The endogenously determined
times of the breaks for all markets coincide with observed real events which affected
each market. This result is consistence with the efficient market hypothesis as the non-
stationarity random walk is associated with the weak form of the efficient market
hypothesis. Consequently, this result emphasises that the stock markets in the MENA
region are efficient.
The cointegration test results show that there are long-run equilibrium
relationships among all stock markets in the MENA region. This indicates that stock
markets in the MENA region move together in the long-run. So, at the regional level all
markets are integrated. At the same time no long-run equilibrium relationship is found
between MENA markets and developed markets. This means that the MENA stock
markets are segmented from developed markets. However, Egypt was the exceptional
vi
case; the study found that the stock market of Egypt has long-run equilibrium
relationship with the US and UK markets.
The implications of these findings are analysed at two levels, the regional and
international. At the regional level, the existence if cointegration among the MENA
markets implies the existence of the law of one price (LOOP). This means that the
potential of regional investors for obtaining abnormal profits through portfolio
diversification is limited in the long-run. The reason for this is that as the MENA stock
markets are cointegrated, abnormal profits will be arbitraged away in the long-run.
However, despite no arbitrage opportunities in the long-run, investors can still achieve
arbitrage profits through portfolio diversification in the short-run.
At the international level, the results show that stock markets in Turkey, Jordan
and Morocco are not integrated with developed markets. This means that there is no
long-run impact from developed stock markets towards these markets. However, a long-
run relationship is found between Egypt and both US and UK when Egypt is a
dependent variable. Based on these results, there are opportunities for international
investors to obtain long-run gains through international portfolio diversification in stock
markets of Turkey, Jordan and Morocco. Also at the same time, investors from these
three countries have the opportunities to obtain long-run gains through investing in
developed markets. The existence of long-run relationships between Egypt and both US
and UK implies that the potential for investors from the Egyptian stock market to obtain
abnormal profit through portfolio diversification in the US and UK is limited in the
long-run. However, there are opportunities for achieving abnormal profit by investing in
Germany as it is not cointegrated with the MENA markets. In the short-run, arbitrage
opportunities and possible profits may also be achieved from diversification as the
LOOP may not hold.
In addition to these findings, an important contribution is made by this study. It
contradicted Granger’s (1986) theory on the relationship between the existence of
cointegration and market efficiency. Granger (1986) asserted that the existence of
cointegration between two stock prices implies the ability to predict each price
movement, which indicates market inefficiency. Also, this study does not fully agree
with another stream of studies, such as Wallace (1992), Baffes (1994), Engle (1996),
Ahlgren and Antell (2002) and Masih and Masih (2002) in which they asserted that
cointegration does not necessarily imply market inefficiency or efficiency. However,
what this study tries to bring out is that if cointegration exists between two stock
vii
markets then these markets are efficient in the long-run because the existence of
cointegrated vector implies the (LOOP). Therefore, little or no arbitrage opportunities or
possible benefit can be achieved from the diversification of a portfolio across markets.
However, with the short-run error correction model (ECM), there could exist arbitrage
opportunities and possible benefits from diversification. That is, the LOOP may not
hold in the short run.
The results of Granger-causality test based on the vector error correction model
(VECM) reveal the existence of short-run causal relationships among the MENA
markets. This means that these markets influence each other. Also, the results show that
developed markets influenced stock markets in the MENA region. In the short-run,
there is unidirectional Granger-causality running from stock prices in Turkey, Morocco,
the US and UK to Egypt. Also, there is unidirectional Granger-causality running from
Germany and the US towards Turkey. In addition, The UK and Turkey are found to
Granger-cause the stock prices in Jordan. Finally, there is a unidirectional Granger-
causality from Germany to Morocco.
Finally, despite the empirical results show that there is a possibility of an
increase in the portfolio equity flow to the MENA stock markets, the statistics of
portfolio equity flow show little portfolio inflow to the region from developed countries
over the period of study. Some of the reasons behind this situation are that most of these
markets are still from some perspective underdeveloped, vulnerable to macroeconomic
shocks and political instability in the region. Based on this, the study suggests that huge
efforts should be carried on to improve the institutional reforms in these markets and
increase the degree of openness for foreign capital. Also increasing the markets
capitalization and adopting new technology are very crucial factors for attracting equity
portfolio to the region.

viii
Table of Contents
Certification ii Dedication iii Acknowledgment iv Abstract v Table of Contents viii List of Tables xi List of Figures xii Abbreviations xiii Publication from the research xiv Chapter 1. Introduction
1.1 Background of the Study 1
1.2 Objective of the Study 4
1.3 Data and Methodology 7
1.3.1 Data Sources 7
1.3.2 Method of the Study 8
1.4 Structure of the Study 9
Chapter 2. The Early Theoretical Models Relating to Stock Market Integration
2.1 Introduction 12
2.2 The Notion of Stock Markets Integration 13
2.3 The Early Theoretical Studies Relating to Stock Markets Integration 18
2.4 Asset Pricing Model for Testing Stock Market Integration 22
2.5 Arbitrage Pricing Theory (APT) for Testing Stock Markets Integration
30
2.6 Alternative Approaches for Testing Stock Markets Integration 36
2.7 Conclusion 38
Chapter 3. The Recent Techniques Relating to Stock Market Integration: The Cointegration Approach
3.1 Introduction 40
3.2 Cointegration Approach for Testing Stock Market Integration 41
3.3 The Asian Financial Crisis and Stock Market Integration 54
3.4 Efficient Market Hypothesis 60
3.4.1 Cointegration and Stock Market Efficiency 61
3.4.2 More Evidences on Stock Markets Efficiency 66
3.4.3 A new Approach for the Relationship between Cointegration and Efficiency
67
3.5 The Integration of the Emerging Stock Markets in the MENA Region 69
ix
3.6 Conclusion 77
Chapter 4. Features and Characteristics of the Emerging Stock Markets in the MENA Region
4.1 Introduction 78
4.2 General Economic Features of the MENA Region 80
4.3 An Overview of the Emerging Stock Markets in the MENA Region 87
4.3.1 Stock Market Liberalization of the Emerging Stock markets in MENA Region
88
4.3.2 The Stock Market in Egypt 92
4.3.3 The Stock Market in Turkey 97
4.3.4 The Stock Market in Jordan 102
4.3.5 The Stock Market in Morocco 108
4.4 Conclusion 113
Chapter 5. Structural Changes and Efficiency in the MENA Stock Markets
5.1 Introduction 115
5.2 Data and descriptive statistics 116
5.3 The Conventional Augmented Dickey-Fuller (ADF) and Phillips– Perron (PP) Unit Root Tests
143
5.4 The Development of Testing for Structural Change 148
5.4.1 Procedures for Selecting the Order of the Lag 156
5.4.2 Procedures for Determining the Time of the Break 157
5.5 Testing for Structural Changes in MENA Stock Markets 158
5.6 The Random Walk Behavior and the Efficiency of the MENA Stock Markets
170
5.7 Conclusion 171
Chapter 6. Stock Market Integration in the MENA Region: Cointegration and Causality Tests
6.1 Introduction 173
6.2 The Autoregressive Distributed Lag (ARDL) Approach to Cointegration
174
6.3 Model Specification 179
6.4 Interpretation of the Results 183
6.4.1 Stock Market of Egypt 185
6.4.2 Stock Market of Turkey 188
6.4.3 Stock Market of Jordan 190
6.4.4 Stock Market of Morocco 192

x
6.5 Implications of the Empirical Results 195
6.6 Granger Causality 204
6.7 Conclusion 211
Chapter 7. Summary and Conclusions
7.1 Introduction 213
7.2 Summary of the Study 214
7.3 Implications of the Study 222
7.4 Contribution of the Study 224
7.5 Suggestions for Future Research 226
Appendices
Appendix A. Conventional Unit Root Tests 228
Appendix B. Cointegration and Causality Tests 238
Appendix C. Diagnostic Tests 243
Bibliography 247
xi
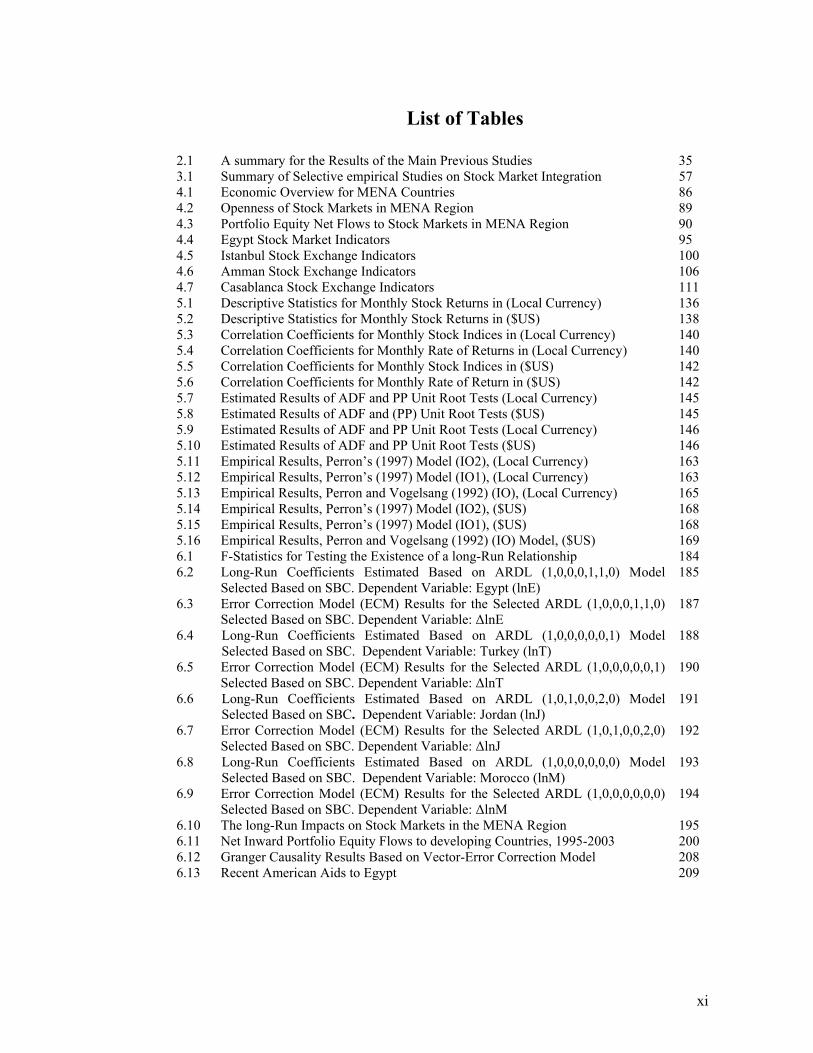
List of Tables
2.1 A summary for the Results of the Main Previous Studies 35 3.1 Summary of Selective empirical Studies on Stock Market Integration 57 4.1 Economic Overview for MENA Countries 86 4.2 Openness of Stock Markets in MENA Region 89 4.3 Portfolio Equity Net Flows to Stock Markets in MENA Region 90 4.4 Egypt Stock Market Indicators 95 4.5 Istanbul Stock Exchange Indicators 100 4.6 Amman Stock Exchange Indicators 106 4.7 Casablanca Stock Exchange Indicators 111 5.1 Descriptive Statistics for Monthly Stock Returns in (Local Currency) 136 5.2 Descriptive Statistics for Monthly Stock Returns in ($US) 138 5.3 Correlation Coefficients for Monthly Stock Indices in (Local Currency) 140 5.4 Correlation Coefficients for Monthly Rate of Returns in (Local Currency) 140 5.5 Correlation Coefficients for Monthly Stock Indices in ($US) 142 5.6 Correlation Coefficients for Monthly Rate of Return in ($US) 142 5.7 Estimated Results of ADF and PP Unit Root Tests (Local Currency) 145 5.8 Estimated Results of ADF and (PP) Unit Root Tests ($US) 145 5.9 Estimated Results of ADF and PP Unit Root Tests (Local Currency) 146 5.10 Estimated Results of ADF and PP Unit Root Tests ($US) 146 5.11 Empirical Results, Perron’s (1997) Model (IO2), (Local Currency) 163 5.12 Empirical Results, Perron’s (1997) Model (IO1), (Local Currency) 163 5.13 Empirical Results, Perron and Vogelsang (1992) (IO), (Local Currency) 165 5.14 Empirical Results, Perron’s (1997) Model (IO2), ($US) 168 5.15 Empirical Results, Perron’s (1997) Model (IO1), ($US) 168 5.16 Empirical Results, Perron and Vogelsang (1992) (IO) Model, ($US) 169 6.1 F-Statistics for Testing the Existence of a long-Run Relationship 184 6.2 Long-Run Coefficients Estimated Based on ARDL (1,0,0,0,1,1,0) Model
Selected Based on SBC. Dependent Variable: Egypt (lnE) 185
6.3 Error Correction Model (ECM) Results for the Selected ARDL (1,0,0,0,1,1,0) Selected Based on SBC. Dependent Variable: ∆lnE
187
6.4 Long-Run Coefficients Estimated Based on ARDL (1,0,0,0,0,0,1) Model Selected Based on SBC. Dependent Variable: Turkey (lnT)
188
6.5 Error Correction Model (ECM) Results for the Selected ARDL (1,0,0,0,0,0,1) Selected Based on SBC. Dependent Variable: ∆lnT
190
6.6 Long-Run Coefficients Estimated Based on ARDL (1,0,1,0,0,2,0) Model Selected Based on SBC. Dependent Variable: Jordan (lnJ)
191
6.7 Error Correction Model (ECM) Results for the Selected ARDL (1,0,1,0,0,2,0) Selected Based on SBC. Dependent Variable: ∆lnJ
192
6.8 Long-Run Coefficients Estimated Based on ARDL (1,0,0,0,0,0,0) Model Selected Based on SBC. Dependent Variable: Morocco (lnM)
193
6.9 Error Correction Model (ECM) Results for the Selected ARDL (1,0,0,0,0,0,0) Selected Based on SBC. Dependent Variable: ∆lnM
194
6.10 The long-Run Impacts on Stock Markets in the MENA Region 195 6.11 Net Inward Portfolio Equity Flows to developing Countries, 1995-2003 200 6.12 Granger Causality Results Based on Vector-Error Correction Model 208 6.13 Recent American Aids to Egypt 209
xii
List of Figures
4.1 Market Capitalization in Egypt Stock Exchange 1994-2004, $US Million 96 4.2 Trading Value in Egypt Stock Exchange 1994-2004, $US Million 96 4.3 Market Capitalization in Istanbul Stock Exchange 1994-2004, $US Million 101 4.4 Trading Value in Istanbul Stock Exchange 1994-2004, $US Million 101 4.5 Market Capitalization in Amman Stock Exchange 1994-2004, $US Million 107 4.6 Trading Value in Amman Stock Exchange 1994-2004, $US Million 107 4.7 Market Capitalization in Casablanca Stock Exchange 1994-2004, $US Million 112 4.8 Trading Value in Casablanca Stock Exchange 1994-2004, $US Million 112 5.1 Stock Price Indices in MENA region (Local Currency) 118 5.2 Stock Price Indices in MENA region ($US) 118 5.3 Stock Price Indices in All Countries ($US) 120 5.4 Monthly Stock Price Index in Egypt (Local Currency) 121 5.5 Monthly Stock Price Index in Egypt ($US) 121 5.6 Monthly Stock Price Index in Turkey (Local Currency) 122 5.7 Monthly Stock Price Index in Turkey ($US) 122 5.8 Monthly Stock Price Index in Jordan (Local Currency) 123 5.9 Monthly Stock Price Index in Jordan ($US) 123 5.10 Monthly Stock Price Index in Morocco (Local Currency) 124 5.11 Monthly Stock Price Index in Morocco ($US) 124 5.12 Monthly Stock Price Index in United Kingdom (Local Currency) 125 5.13 Monthly Stock Price Index in United Kingdom ($US) 125 5.14 Monthly Stock Price Index in Germany (Local Currency) 126 5.15 Monthly Stock Price Index in Germany ($US) 126 5.16 Monthly Stock Price Index in the United States 127 5.17 Monthly Rate of Return in Egypt (Local Currency) 128 5.18 Monthly Rate of Return in Egypt ($US) 128 5.19 Monthly Rate of Return in Turkey (Local Currency) 129 5.20 Monthly Rate of Return in Turkey ($US) 129 5.21 Monthly Rate of Return in Jordan (Local Currency) 130 5.22 Monthly Rate of Return in Jordan ($US) 130 5.23 Monthly Rate of Return in Morocco (Local Currency) 131 5.24 Monthly Rate of Return in Morocco ($US) 131 5.25 Monthly Rate of Return in United Kingdom (Local Currency) 132 5.26 Monthly Rate of Return in United Kingdom ($US) 132 5.27 Monthly Rate of Return in Germany (Local Currency) 133 5.28 Monthly Rate of Return in Germany ($US) 133 5.29 Monthly Rate of Return in United States (Local Currency) 134 5.30 Plots of the series and Estimated Timing of Structural Breaks 162
xiii
Abbreviations
ADF Augmented Dickey Fuller ADR American Depositary Receipts AFM Amman Financial Market APT Arbitrage Pricing Theory ARDL Autoregressive Distributed Lag ARVAR Augmented Restricted Vector Autoregression ASE Amman Stock Exchange AUVAR Augmented Unrestricted Vector Autoregression CAPM Capital Asset Pricing Model CASE Cairo and Alexandria Stock Exchange CMA Capital Market Authority CRDW Cointegration Regression Durbin Watson CSE Casablanca Stock Exchange ECM Error Correction Model ECT Error Correction Term EMH Efficient Market Hypothesis GARCH Generalized Autoregressive Conditional Heteroscedasticity GCC Gulf Cooperation Council GDP Gross Domestic Product GDR Global Depositary Receipts GNP Gross National Product HSBC Hong Kong and Shanghai Banking Corporation ICAPM International Asset Pricing Model IMF International Monetary Fund IPO International Public Offering IRF Impulse Response Function ISE Istanbul Stock Exchange JD Jordanian Dinar JJ Johansen-Juselius JSC Jordan Securities Commission LOOP Law of One Price MENA Middle East and North Africa OECD Organization for Economic Cooperation and Development OLS Ordinary Least Square PP Phillips and Perron SDC Securities Depository Centre UVAR Unrestricted Vector Autoregression VAR Vector Autoregressive Model VDC Variance Decomposition VECM Vector Error Correction Model WTO World Trade Organization
xiv
Publication from the Research
1 Marashdeh, H., 2005, “Testing For Structural Changes in MENA Equity Markets”, 46th NZAE Conference, New Zealand. This article has been considered as “a quality assured paper”. Available on line at: http://www.nzae.org.nz/conferences/2005/QA29-Hazem_Marashdeh.pdf
2 Marashdeh, H. and E. J. Wilson, 2005, “Structural Changes in the Middle East Stock Markets: The Case of Israel and Arab Countries”, University of Wollongong, Working Paper, 05-22. Available on line at:
http://www.uow.edu.au/commerce/econ/wpapers.html
3 Marashdeh, H., 2005, “Stock market integration in the MENA region: An application of the ARDL bound testing approach”, University of Wollongong, Working Paper, 05-27. Available on line at: http://www.uow.edu.au/commerce/econ/wpapers.html
4 Marashdeh, H, 2005, “Cointegration and efficiency: An empirical investigation of the Middle East stock markets”. A presentation delivered at Workshop of: “Mathematics in Finance”. Sponsored by School of Applied Mathematics and Statistics, University of Wollongong, 25th November 2005.
5 Marashdeh, H, 2005, “Interdependence of the MENA emerging stock markets: A Cointegration Approach”, Accepted to the 4th INFINITI Conference on International Finance, University of Dublin, Trinity College, Monday 12-Tuesday 13 June 2006.
6 Marashdeh, H. and Ali Saleh, 2006, “Re-visiting trade and Budget deficit in Lebanon: Critique”, University of Wollongong, Working Paper, 06-07. Available on line at:
http://www.uow.edu.au/commerce/econ/wpapers.html
1
Chapter One
Introduction
1.1 Background of the Study The analysis of the degree of international stock market integration has attracted a great
deal of interest in recent time. The term “stock market integration” refers to an area of
research in financial economics that covers many aspects of interrelationships between
stock markets. Market integration could be considered as a situation where there are no
impediments, such as legal restrictions, transaction costs, taxes and tariffs against the
trade in foreign assets or the mobility of portfolio equity flows. In the case of stock
market integration, all assets with the same level of risk have the potential to attract the
same return across all different markets.
The issues of financial integration of emerging stock markets have received a
great deal of interest of practitioners and academic researchers. Over the last two
decades a significant volume of research has been concerned with the integration of the
world’s major stock markets. The emerging stock markets in some developing countries
have achieved considerable improvements over the last two decades. Several factors
have played vital roles in these improvements, such as the conduct of sound
macroeconomic policies, stock markets reforms, privatization and financial
liberalization. One of the main reasons for this study focusing on emerging markets is
because there is an increase in funds flowing from developed markets toward
developing markets, and therefore these markets are becoming increasingly important in
terms of portfolio management (Hawawini, 1994).
2
It is important to define in more detail what constitutes definitions of stock
market. A stock market is considered as an emerging market if it has started a transition
process, growing in size and increasing in complexity. According to the International
Financial Corporation of the World Bank Emerging Markets Database, a stock market is
classified “emerging” if it is located in a low or middle income economy, and if its
invest able market capitalization is low relative to its per capita gross domestic product
(GDP).
Stock market integration has become a catchphrase in modern financial theory
and several arguments emphasize the desirability of market integration. One such
argument is based on the competitive auction-model. This model asserts that where
there are no barriers to capital movement, stock market integration leads to a more
efficient allocation of the world’s resources, and capital will seek higher returns to
investment, moving from stock markets where capital is relatively abundant to another
where capital is relatively scarce. These characteristics of stock markets enable the
competitive auction-model to function more effectively in order to equilibrate markets.
Another argument is that in case of integration among stock markets, the systematic risk
(market risk) becomes unsystematic risk (firm risk), and this kind of risk can be
diversified or eliminated by including the security as part of diversifiable portfolio.
For stock market integration to be effective requires sound macroeconomic
conditions and a sound domestic financial sector. Integration of stock markets causes all
risk factors to be traded at the same price. For example, if the stock markets in the
Middle East and North Africa (MENA) region are fully integrated then the business
cycle risk or the inflation risk would have the same price in all MENA markets. In other
words, stock market integration means that the law of one price is fully consistent
throughout all traded assets. In general it is believed that as markets become more
3
integrated, the cost of capital decreases, because the removal of investment barriers
allows for imported risk sharing between domestic and foreign agents.
This thesis examines the integration stock markets in the MENA region. In
particular, the study focuses on four emerging markets in this region, namely Egypt,
Turkey, Jordan and Morocco. These markets are considered to be relatively active
compared to other stock markets in the region. The study also, examines the integration
between these markets and the markets of the representative developed economies of
the US, UK and Germany. The MENA region is considered as one of the richest in the
world in terms of natural resource, qualified endowments and trained labour force, and
per capita GDP. The four countries that are considered in this study, have adopted
several sound macroeconomic policies over the last two decades which have contributed
to higher economic growth and to overcome macroeconomic imbalances in their
economies. These policies include financial liberalization, trade liberalization, openness
to foreign direct investment, implementation of sound economic management and
privatization programs. Moreover, these polices are considered as indispensable in order
for these countries to face the growing challenges that resulted from the recent changes
in the global economy. In addition to the economic importance of the MENA region, the
political developments have huge consequences on the international political stage
In order to examine the degree of financial integration of stock markets in the
MENA region, and between these markets and developed markets, this study starts with
testing for the presence of structural change. The tests for a unit root in the time series
of stock prices are unlike the conventional stationarity tests, which are found to be
biased towards the non-rejection of the null hypothesis of a unit root in the presence of
structural change. That is, the conventional unit root tests lack power in correctly
rejected the null hypothesis in the presence of structural changes. This study employs
4
the Innovational Outlier (IO) model proposed by Perron (1997) which models the break
as a gradual change in the trend function with an endogenously determined break date.
This procedure has not been applied to studying stock markets in the MENA region.
The second stage of the study in the financial integration among stock markets
in the MENA region (and between these markets and developed markets) utilizes the
newly proposed autoregressive distributed lag (ARDL) estimation approach. This
procedure is recognized as the preferred method in estimating the long-run cointegrating
relationship. This study also explores the short-run and the long-run dynamic
relationships for the stock markets in the MENA region as well as conducting Granger-
causality tests which are augmented with an error correction term. Finally, the study
considers the relationship between the existence of cointegration among stock markets
and the efficient market hypothesis (EMH).
1.2 Objective of the Study The main objective of this study is to examine the financial integration among the stock
markets of Egypt, Turkey, Jordan and Morocco, and between these markets and the
developed stock markets, of the US, UK and Germany. To attain this purpose, the thesis
aims to achieve the following:
1. To present an inclusive revision of the notion of stock market integration from
different points of view. Also, the study will present several arguments for the
desirability and benefits of international stock market integration. Moreover, the
study will review the early theoretical models relating to stock market
integration. In particular, the study analyzes the literature relating to stock
market integration using different models, such as the capital asset pricing
5
models (CAPM) and the arbitrage pricing theory (APT). Also the study will
explore some other alternative approaches for testing stock market integration
such as an innovative econometric methodology.
2. To critically review and analyze the recent techniques relating to the analysis of
stock market integration, such as cointegration techniques, generalized
autoregressive conditional heteroscedasticity (GARCH) model, Granger-
causality and vector autoregressive model (VAR). These techniques have been
applied to test for stock market integration in different regions in the world. The
cointegration approach has been widely recognized as the most suitable
approach for testing the co-movements between stock markets. This co-
movement indicates the existence of cointegration between them, which in fact
implies the existence of integration internationally between stock markets.
However, there will be a concentration on the studies that focus on the emerging
stock markets in the MENA region.
3. To outline the main features of the emerging stock markets in the MENA region.
By doing this, the study will concentrate on the main financial indicators in these
markets. These indicators include market capitalization, trading value, turnover
ratio and number of listed companies. Also the study will shed light on the
economies of these countries and on the macroeconomic polices adopted.
4. To test the unit root hypothesis in the presence of structural change at an
unknown time of the break, using Perron’s (1997) and Perron and Vogelsang
(1992) Innovational Outlier (IO) model. According to Perron (1989) most
economic time series are characterized by stochastic, rather than deterministic,
non-stationarity. Perron (1989) argued that macroeconomic time series may be
stationary if one allows for structural changes in the trend function of the
6
regression. When there are structural breaks present, the Dickey–Fuller statistics
are biased towards the non-rejection of unit root hypothesis. Moreover, if
structural changes exist in the data generating process which are not allowed for
in the specification of an econometric model. The results could be biased
towards the erroneous non-rejection of the non-stationarity hypothesis (Perron,
1997). However, according to the reviewed literature on the MENA region, this
issue has not been addressed in any known study. This study provides a new
contribution to the literature since there has not been any empirical study that
has used this technique when studying the stock markets in the MENA region.
5. To empirically estimate the long-run relationship among stock markets in the
MENA region, and between these markets and developed markets. This study
utilizes the newly proposed autoregressive distributed lag (ARDL) approach.
The ARDL procedure has been recognized as more preferable in estimating the
long-run cointegrating relationship than other cointegration approaches. One of
the ARDL features is that it is unlike conventional cointegration approaches
which concentrate on cases where the underlying variables are integrated of
order one. The ARDL approach is applicable irrespective of whether the
underlying regressors are all )0(I , all )1(I or mixed processes. Also, the ARDL
estimation procedure is more robust and performs well for small sample sizes
than other cointegration approaches. Using of the ARDL procedure in this thesis
is considered a significant contribution to the literature of stock market
integration in the MENA region since it has not been used before.
6. To construct standard Granger causality tests which are correctly specified to
include the lagged vector error correction term when variables are cointegrated
(VECM). This test helps explore the short and long-run dynamic relationships
7
among the MENA stock markets, and between them and developed markets.
The estimated long-run causal relationship among stock markets is based on the
error correction term. Granger (1988) asserts that neglecting the error correction
term when testing for causality among cointegrated variables leads to serious
biases due to filtering out low-frequency (long-run) information.
7. To explore the efficient market hypothesis and the relationship between the
existence of cointegration among stock markets and the efficiency of these
markets. Recently, there have been many contradictory views on this issue in the
last decade. Some have argued that the existence of cointegration between stock
markets implies that these markets are inefficient. Others have argued that the
existence of cointegration between markets implies nothing about efficiency or
inefficiency. This study will try to present different point of view in related to
this issue.
8. Finally, to shed more light on the consequences and implications of finding
integration among these markets. This study considers the effect of integration
on portfolio diversification and the portfolio equity net flows between stock
markets in the MENA region.
1.3 Data and Methodology 1.3.1 Data Sources This study uses monthly stock price indices for four stock markets in the MENA region,
namely, Egypt, Turkey, Jordan and Morocco and for three developed stock markets,
namely US, UK and Germany. The study covers the period December 1994 to June
8
2004. Different sources for the data have been used. The study depends on the following
sources:
1. Morgan Stanley Capital International (MSCI), (www.msci.com).
2. Standard & Poor’s, Emerging Stock Markets Factbook, 2002.
3. Standard & Poor’s, Global Stock Markets Factbook, 2005.
4. International Financial Statistics Yearbook (IFS), various issues.
5. The World Bank, Global Development Finance, CD ROM, 2004.
6. World Development Indicators database, April 2005.
7. Arab Monetary Fund, (www.amf.org.ae).
1.3.2 Method of the Study This study reviews different financial and economic approaches that have been
developed to measure stock market integration. By reviewing these approaches, the
study covers a range of important literature on this issue. A thorough discussion of the
early theoretical models such as capital asset pricing model (CAPM), and a review the
literature related to Arbitrage Pricing Theory (APT) are conducted. Moreover, this study
reviews the recent econometric techniques used for measuring stock market integration.
These techniques include different approaches to cointegration analysis, such as Engle-
Granger, Johansen-Juselius, autoregressive conditional hetroskedasticity (ARCH),
generalized autoregressive conditional hetroskedasticity (GARCH) model, vector
autoregressive (VAR) and the autoregressive distributed lag (ARDL) approaches.
In order to measure the integration of stock markets in the MENA region, the
analysis implements advanced techniques which test the unit root hypothesis in the
presence of structural change at an unknown time of the break. For this purpose, the
9
study uses Perron’s (1997) and Perron and Vogelsang (1992) Innovational Outlier (IO)
model.
The newly proposed autoregressive distributed lag (ARDL) procedure to
cointegration is used as more of the recent studies have indicated that the ARDL
approach is preferred in estimating the long-run cointegration relationships. The ARDL
procedure is applicable irrespective of whether the underlying regressors are
purely )0(I , purely )1(I or mutually cointegrated. Also, it is more robust and performs
well for small sample sizes – such as this study - than other cointegration techniques. In
addition to the ARDL model, the Granger-causality is used. This test is augmented with
a lagged error correction term when variables are cointegrated. The conducting of this
test helps to explore the short-run and long-run dynamic relationships among MENA
stock markets and between MENA markets and developed markets.
1.4 Structure of the Study This thesis proceeds as follows. Chapter 2 reviews most of the literature related to stock
markets integration in both developed and emerging stock markets. The chapter starts
with a revision of the notion of stock market integration. After that, it discusses the
early theoretical studies related to stock market integration, such as capital asset pricing
model (CAPM), arbitrage pricing theory (APT), and some other alternative approaches
for testing integration.
Chapter 3 presents an inclusive discussion of the literature that has used
cointegration approaches to examine stock market integration. It also presents an
analysis of the concept of efficient market hypothesis and how it functions in the case of
10
cointegration among stock markets. Finally, the chapter reviews relevant research on
stock market integration in the MENA region.
Chapter 4 presents a review of the general features of the four countries Egypt,
Turkey, Jordan and Morocco in the MENA region. At the same time it discusses the
main macroeconomic indicators for these countries. Following this general review, the
chapter presents a discussion for each stock market in terms of the main indicators for
each market such as market capitalization, turnover ratio, trading value and number of
listed companies.
Chapter 5 presents a descriptive analysis for the stock price indices in the
MENA region and some developed markets. It investigates some important statistical
characteristics of these markets. And empirically estimates the conventional Augmented
Dickey-Fuller (ADF) and Phillips-Perron (PP) unit root tests. As a significant
contribution by this study, this chapter analyzes the development of testing for structural
change, was firstly proposed by Perron (1989). Following this analysis, the study tests
the unit root hypothesis in the presence of endogenously determined structural change in
these stock markets.
Chapter 6 empirically estimates the integration among stock markets in the
MENA region, and between these markets and some representative developed markets
The study uses the recently developed autoregressive distributed lag (ARDL) model for
estimation. Moreover, the chapter estimates the Granger-causality among stock markets.
Based on the results of these approaches, the policy implications for the findings are
presented.
Chapter 7 summaries the major conclusions derived throughout the thesis. The
chapter presents a summary of the previous chapters and discusses the policy

11
implications of the major results. Finally, suggestions for future work are provided at
the end of the chapter.
12
Chapter Two
The Early Theoretical Models Relating to Stock Market
Integration
2.1 Introduction Over the last three decades a significant amount of research has focused on the issue of
stock market integration, and how to measure this integration. The term “stock markets
integration” refers to an area of research in financial economics that covers many aspects of
interrelationship across stock markets. Various schools of thoughts have been developed to
measure the integration of stock market. Some have used the correlation of the local market
return with the world return as a measure of integration; others have concentrated on the
investment restriction as indicators of integration.
A revolution in the field of portfolio theory started with the invented of assets
pricing models, such as Capital Asset Pricing Models (CAPM) and International Capital
Asset Pricing Models (ICAPM). According to these models, national markets are
considered to be integrated if securities with the same risk characteristics are priced the
same, even if they are traded on different markets. An alternative model to the CAPM is
what is called Arbitrage Pricing Theory (APT), which assumes that stock prices can be
influenced by not only the market risk, but also by several sources of systematic risk in the
economy.
13
The main objectives of this chapter are to consider and analyze the literature
relating to stock market integration that use different versions of asset pricing models, such
as (CAPM), and also review the literature relating to arbitrage pricing theory (APT). This
chapter consists of seven sections. Section 1 provides an introduction. Section 2 presents an
inclusive revision of the notion of stock market integration. Section 3 discusses the early
theoretical studies relating to stock market integration. Section 4 presents a thorough
discussion of the asset pricing models used for testing stock markets integration. Section 5
reviews the arbitrage pricing theory (APT) and the literature that uses this model for testing
stock market integration. Section 6 presents some alternative approaches for testing stock
market integration. Finally, the last section offers some concluding remarks.
2.2 The Notion of Stock Markets Integration Stock market integration could be considered as a status where there are no impediments,
such as legal restrictions, transaction costs, taxes, tariffs, and all types of controls against
the trading in foreign assets or on the mobility of portfolio equity flow. In the case of stock
market integration, all assets with the same level of risk grasp the same return across all
different markets.
Various schools of thought have been developed for measuring stock market
integration. In general, the common factor for most of these schools is the law of one price
(LOOP). That is, when transaction costs and taxes are not taken into account, identical
securities should carry the same price across all stock markets where such securities are
traded. In other words, if two or more markets are integrated then the identical securities
should be priced identically within both markets (Oxelheim, 2001). The existence of stock
14
market integration implies that stocks in all markets are exposed to the same risk factors
and the risk premia on each factor is the same in all markets.
Stulz (1981a) defined stock markets as being integrated “if assets with perfectly
correlated returns have the same price, regardless of the location in which they trade”. A
fully integrated market is defined as a situation where investors earn the same risk-adjusted
expected return on similar financial instruments in different national markets (Jorion and
Schwartz, 1986, p.603) which means no arbitrage profit to be achieved. In other words, if
the risk of an identical financial instrument is traded on the same price in different markets,
then it will be an indication of integration between these markets. However, a stock market
is considered to be more integrated, if there are stronger domestic returns depend on
contemporaneous world market shocks. This definition emphasizes not only the openness
of stock markets but also measures directly the extent to which shocks are transmitted
across stock markets. The transmission of a shock requires both the removal of barriers and
the capital itself flows across markets in order to take advantage of potential market
opportunities (Fratzscher, 2002). It is believed that, when a stock market is more fully
integrated, both the given market and the country’s economy will not be isolated from
external influence any more.
The rapid development of telecommunications and computer technology and the
widespread of using the Internet have been considered as important tools for making stock
markets practically and institutionally more integrated. These tools enable investors, agents,
traders, and all participants in stock markets to have the access to information, and
consequently the ability to manage their portfolios more efficiently.
15
Other important tools pertain to the removal, or at least the diminishing, of
government impediments that includes legal restrictions, transaction taxes, and all types of
controls against either the movement of capital or exchange and interest rates. All of these
steps have been known as “the liberalization process”. However, these improvements that
started in developed countries in 1970s and 1980s, continued during the 1990s in most
developing countries, and many countries are still adopting improvements (Akdogan,
1995).
Several arguments are presented for the desirability of international stock market
integration. According to Akdogan (1995, pp. 62-65) these arguments are:
1- Based on the competitive auction-model, and in case of no barriers to capital
movement, stock market integration leads to a more efficient allocation of the
world’s resources, and capital will seek higher returns to investment, moving from
capital market where capital is relatively abundant to another where capital is
relatively scarce. These characteristics of capital markets enable the competitive
auction-model to function more effectively to economically equilibrate the market.
2- In case of integration among all stock markets, the systematic risk (market risk)
becomes an unsystematic risk (firm-specific risk), and this kind of risk can be
diversified or eliminated away by including the security as part of diversifiable
portfolio.
3- It has been argued that corporate financial strategies depend on whether
international stock markets are integrated or not. In case of integrated market, all
firms can raise their capital with lower costs than firms do in a segmented market.
Also capital budgeting decisions for firms normally depends on their exposure to
international capital that is the marginal cost of capital of a firm that uses
16
international sources is lower than the marginal cost of capital of firm that uses only
domestic sources.
However, there are some developments that help this desirability of international
stock market integration. Narayan et al. (2004) mentioned some of these developments; the
removal of barriers across national borders that leads to increase the flow of capital, the
reduction in transaction costs and a commensurable increase in the flow of information, and
the important implication of stock markets integration for portfolio theory, which advocates
that investors diversify their assets across different stock markets provided that returns to
stocks in these markets are less than perfectly correlated with domestic market.
Financial market integration has several direct and indirect potential benefits;
Rangvid (2001) mentions some of the direct benefits as follows:
1- It allows for international capital flows to emerging markets, enabling these to
increase investment ratios thereby promoting real growth. In general, once funds
move freely between stock markets, this will give more momentum to these
markets.
2- It enables agents in the financial markets to price assets with identical risk patterns
in the same premises.
3- It allows for better risk sharing among agents who are trying diversifying their
consumption risk, as caused by differences in time patterns of returns to real capital
investment.
4- It enables agents to diversify risk in financial markets, and thus undertake projects
with higher expected returns for the same degree of risk
5- It lowers the cost of capital and smoothen the growth of investment.
17
Due to the indirect benefits, it has been widely accepted in the literature of this field
that integration plays a vital role in improving resource allocation through the financial
markets, thereby increasing safety of financial operations and also thereby strengthening
the domestic financial markets through such financial sector reforms. It is also believed that
it has an indirect positive effect on other economic sectors through its positive effect on
economic growth in general. Monetary policy, which is considered one of the main
economic policies, is affected greatly by the integration of stock markets, and this
integration itself has strong implications in international finance (Rutledge and Karim,
2004).
Also, it is widely accepted that economic and financial policies have a great
influence on the status of stock markets. Bekaert and Harvey (1995) state that, “whether a
market is integrated with the world capital markets or segmented is greatly influenced by
the economic and financial policies followed by its government or other regulatory
institutions”. By following this argument, many empirical studies have examined the
relationship between the degree of economic integration and the degree of stock market
integration.
However, the efficiency of assets allocation is considered as the main economic
reason that determines the integration of different stock markets. The flow of capital
between different countries depends on the difference between marginal productivities; that
is capital flows from those where the marginal productivity is low to those where marginal
productivity is high. According to this capital transfer, an equalization of marginal
productivity of capital of the different countries will be achieved, and welfare gains in all
the countries engaged in the process will be created.
18
2.3 The Early Theoretical Studies Relating to Stock Markets Integration
One of the earliest studies that designate the importance of diversification of risk was the
seminal work by Markowitz (1952). He revolutionizes the field of portfolio theory. He uses
a mean-variance efficient portfolio framework, a portfolio that has the highest expected
return at the given level of risk. His theory has been depicted graphically as the efficient
frontier model; but sometimes it is referred to as the efficient set. Markowitz (1952)
explains that diversification benefit could be achieved when additionally not highly
correlated securities are added into a portfolio. The model shows a simple geometric graph
of the trade-off between risk and return, the frontier itself is a composition of many
portfolios; more specifically the efficient portfolios are a subset of minimum variance
portfolios offering the highest return for each level of risk (Frino, et, al. 2001, pp. 139-141).
Going beyond Markowitz, Tobin (1958) argues that agents would diversify their
saving between a risk free asset and a single portfolio of risky assets. By combining a risk-
free asset with risky assets, it is possible to construct portfolios whose risk-return profiles
are superior to those of portfolios on efficient frontier. By doing this, what is called the
capital market line has been constructed as a tangent line to the efficient frontier that passes
through the risk-free rate.
Based on Markowitz’s work, and in the context of domestic market, Sharpe (1964),
Lintner (1965) and Mosin (1966) independently develop one of the most famous financial
equilibrium models, the capital asset pricing model, which is referred to as the CAPM. In
their model they assume that markets are segmented. The development of this model played
19
a very important role in establishing the foundation of the modern portfolio theory. CAPM
is “an equilibrium economic model for valuing stocks by relating risk and expected return”
(www.investorword.com). It provides a precise prediction on this relationship. The model
is graphically represented by the capital market line and is implied by the following
relationship:
[ ]fmifi rrrr −Ε+=Ε )()( β (2.1)
Where )( irΕ and )( mrΕ denote the expected return on security i and the market portfolio,
fr is the return on risk- free security1, and iβ (beta) measures the sensitivity of security i
to the market risk factor- the slope of the line-, and it is quantified by:
)var(),cov(
m
im
rrr
=β (2.2)
where ),cov( im rr is the covariance of returns of the i th asset with the market, )var( mr is the
total risk of the i th asset. This total risk can be partitioned into two parts by using ordinary
least squares as follow:
)var()var()var( 2 eRR mii += β (2.3)
where )var(2mi Rβ is the market risk (systematic risk) or the undiversifiable risk, which is
the portion of an asset’s risk that cannot be eliminated via diversification. This risk
indicates how including a particular asset in a diversified portfolio will contribute to the
riskness of the portfolio, in other words this sort of risk relates to general market
movements. )var(e is the firm- specific risk or (unsystematic risk) that can be diversified or
eliminated away (cancel out) by including the security as part of diversifiable portfolio.
1 In many empirical investigations, the U.S Treasury Bills are used as a proxy riskless rate of interest. See: Errunza, Losq and Padmanabhan (1992) and Ragunathan (1997).

20
According to Akdogan (1995) and Bekaert & Harvey (2003), the CAPM is based on
the following assumptions:
1- Investors care only about mean and variance factors, in other words they function as
mean and variance optimizers, their investment decisions based on expected return
and the variances of security return.
2- Investors are risk averse.
3- Assets returns are multivariate normally distributed.
4- Investors can borrow and lend at the same riskless rate.
5- There exists a free-risk asset.
6- Perfectly competitive markets and all information are reflected fully in prices.
7- There are no transactions costs and taxes.
8- Capital markets are in equilibrium.
9- All investors have “one-period” time horizon.
Arising from various versions of asset pricing models including CAPM, early
studies investigate issues of diversification and financial integration. According to these
models, national markets are considered to be integrated if securities with the same risk
characteristics are priced the same, even if they are traded on different markets.
Back to the CAPM, which firstly has been developed in the context of domestic
market, the idea of diversification is considered as the core concept of this model. Relying
on that, in the case of implementation of CAPM in a single country, there will be a unitary
price of risk, and the price of all assets reflects the level of systematic risk they possess, and
so the assets are considered to be integrated but in the same country. In this case, the
21
CAPM assumes markets are completely segmented. This approach has been used by Sharpe
(1964), Lintner (1965) and Black (1972).
An alternative model to the CAPM has been developed by Ross (1976). This model
is called the arbitrage pricing theory (APT). The APT is unlike CAPM, which involves
some unrealistic assumptions and that it has only one source of systematic risk (market
return). The APT model depends on no arbitrage conditions like CAPM. It assumes that
stock prices can be influenced not only by the market risk, but also by several sources of
systematic risk in the economy. These sources can be thought of as factors, in addition to
the market, like inflation, aggregate output, industry effect, interest rate…etc. (Mishkin,
1998). The model has the following general form:
i
n
iiii uFBBR ++=Ε ∑
=10)( (2.4)
where )( iRΕ : expected return of asset i
0B : a constant
nFF ...1 : values of factors from 1 to n
iB : sensitivity of asset return to particular factor
iu : residual term
Basically, most of the early theoretical research on market integration has been built
according to these two models, the CAPM and the APT.
22
2.4 Asset Pricing Model for Testing Stock Market Integration As mentioned earlier, the capital asset pricing model (CAPM) has been developed
assuming the case of a completely segmented market. On the other hand, asset pricing
models in the international context generally assume markets to be perfectly integrated.
These include studies like Solink (1974), Stulz (1981), Adler & Dumas (1983) and Dumas
& Solink (1995) who use a world CAPM with currency risk (exchange risk). Solink (1983),
and Cho, Eun, & Senbet (1986) who use world arbitrage pricing theory. Wheatley (1988)
uses a consumption-based asset pricing model. Harvey (1991) uses world CAPM. Within
this context multiple risk factor models studied by Ferson and Harvey (1994, 1997). The
international factor latent models were studied by Bekaert & Hordick (1992), Campbell &
Hamao (1992) and Harvey, Solink, & Zhou (1994). All of these approaches will be studies
in full details later in this chapter.
In reality, it is hard to find both cases - either perfectly segmented or perfectly
integrated markets –, in fact there are different kinds of barriers between capital markets.
These barriers take the form of capital control, transaction cost and taxes. These barriers
restrain the investors from diversifying their portfolios in different markets. They have been
considered as extra costs that international investors face. These costs play an important
role in determining where the investments will take place, either in local markets or abroad.
That is if these costs outweigh the benefits of diversification, then it is more likely that
these investment will take place in the local market or vice versa.
Black (1974) discusses these issues deeply. He develops an international capital
asset pricing model in which there are explicit barriers to international investment in the
23
form of a tax on holdings of assets in one country by residents of another country. His
theoretical model took the following form:
[ ]mmiii RRRR τβτ −−Ε=−−Ε )()( (2.5)
which after rearranging we obtain:
[ ]mmiii RRRR τβτ −−Ε++=Ε )()( (2.6)
where R is the short-term interest rate in country C
iτ : the tax rate on security i for investors in country C
)( mRΕ : the expected return of the market portfolio specific to country C
mτ : the tax rate on market portfolio for investors in country C
iβ : defining by the )var(),cov( mmi RRR , which is the systematic risk of
security i.
It is clear that equation 2.6 is a modified form of equation 2.1, which represents the
capital asset pricing model. So, if the taxes on international investments are
zero )0( == mi ττ then equation 2.6 will be the same as equation 2.1 that is CAPM. Black
also suggests a uniform tax rate across countries. By estimating this tax rate in his model, it
becomes much easier to estimate the strength of barriers to international investment in risky
assets.
Stehle (1977) asserts on the importance of the world market factor as a determinant
of assets returns. He uses the stock indices data for the US and ten other countries during
the period from December 1958 to December 1975. A CAPM framework is applied to test
the extent to which risk can be diversified in a segmented market and not in an international
market and vice versa (Ragunathan, 1997, p. 5). The results of Stehle’s estimations are
24
inconclusive, and the poor statistical results he got could indicate that these models may not
be well-specified.
In a similar work to Black (1974), Stulz (1981a) constructs a model of international
asset pricing in which a cost is associated with holding risky foreign securities. As in Black
(1974), Stulz (1981a) uses the proportional taxes to model barriers to international
investment. However, the investor in his study would pay taxes on absolute value rather
than the net value of her/his holding of foreign securities. For simplicity, Stulz assumes that
only domestic investors face the taxes on their foreign holdings. Stulz concludes that in
each country, all investors hold the same portfolio of risky assets. The key feature of Stulz
model is that there are some nontraded foreign assets. Based on that, for investors who face
barriers to international investment, the world market portfolio will be inefficient, and the
world market will not be in equilibrium.
Based on the international asset pricing model, Jorion and Schwartz (1986),
empirically examine the integration versus segmentation between Canadian stock market
and global North America market, the global North America markets have been represented
by US stock market. The study uses monthly rates of return from January 1963 to
December 1982. The results indicate that International CAPM was not a good description
of the pricing of Canadian securities. The study rejects the joint hypothesis of integration
between the Canadian stock market and the North American stock market, and shows
strong evidence of segmentation in the pricing stocks. Depending on these results, the study
indicates that legal barriers play an important role in causing this segmentation.
In the same direction of continuing the constructing of international asset pricing
models, Errunza and Losq (1985) postulate a mildly segmented market structure. In this
setting, mild segmentation occurs because investors from one country cannot invest in
25
stocks from another country, while investors from the other country do not face such
restrictions, and this leads to what is known as “market imperfection”. Also securities from
country 1 are eligible, and the securities from country 2 are ineligible for country 1.
Errunza and Losq examine the inability of some investors to trade in a particular class of
securities. They use the data from nine less developed countries and a random sample from
the US during the period 1976-1980. However, although their results accept the case of
mild segmentation, they are still inconclusive. They attribute this weakness to the kind of
restrictions imposed in the real world (Teng, 1998, p. 6). Errunza, Losq and Padmanabhan
(1992) use a maximum likelihood procedure to test the same model as in Errunza and Losq
(1985), their results are again inconclusive and similar to the previous one, which indicates
that the world capital markets are neither integrated nor segmented (Ragunathan, 1997,
p.5). However the use of the US Treasury bill rate as a proxy for risk rate is considered as a
shortcoming of their study, because this kind of rate is not used in emerging markets.
Buckberg (1995) uses a conditional international capital asset pricing model
(ICAPM) in an attempt to investigate whether emerging stock markets are part of global
financial market or not, and to what extent emerging markets behave like industrial markets
in relation to the world portfolio. According to Buckberg (1995, p. 57):
“Conditional refers to the use of conditioning information – some
information set 1−tZ - to calculate expected moments and to test properly
the ICAPM as a relation between expected returns and ex ante risk.”
Buckberg (1995) uses monthly data over the period 1977-1991 for twenty emerging
markets. The results indicate that six markets out of ten rejected ICAPM during the period
1977-1984. However, eighteen of the twenty markets are integrated with world markets
26
during the period 1984-1991. The study concludes that the main reason for this integration
to occur is the large capital inflows from industrial economies to these emerging markets
during 1980’s.
In a different methodology to the previous asset pricing studies, Bekaert and Harvey
(1995) develop an innovative econometric methodology, by employing a conditional
regime-switching model. Using this methodology allows for the degree of market
integration to change through time and so is the model allows for switching between
segmentation and integration by attaching probabilities to the respective asset pricing
models (Bekaert and Harvey, 1995). The model is considered as an innovative idea, since it
uses dynamic partial segmented / partial integrated instead of static segmented / integrated
paradigm. The model is conditional, that is the predetermined information is allowed to
affect the expected returns, covariance, variance, and the integration measure (Bekaert,
1995, p. 405). The model has the following general form:
[ ] [ ] [ ]tittititwtitttitit rrrrE ,11,1,,,111,,1 var)1(,cov −−−−−−− −+= λφλφ (2.7)
where tir , is the return on asset i at time t , twr , is the return on a value-weighted world
portfolio at time t , 1, −tiφ is the econometrician’s time-varying assessment of the likelihood
that the market is integrated and 1−tλ is the conditionally expected world price of
covariance risk for time t . The study uses the data of 12 emerging markets and 21
developed markets, and that is over the period 1975-1992. The study finds that some
emerging markets exhibit time-varying integration, others appear to be more integrated than
expected, and others are more segmented even though there is a free access to their capital
markets. The study suggests that it is not the case that world capital markets have become
27
more integrated. Despite a number of developing countries who have removed or relaxed
the restrictions on foreign stock ownership in the 1990’s, only 4 out of 12 countries have
higher integration measure in the same period. Another interesting result is that emerging
markets are characterized by high volatility, the standard deviations range from 18% in
Jordan to 53% in Taiwan, while developed markets characterized by relatively low
volatility comparing to emerging market, and the standard deviation range from 15% to
42%. Finally, the study indicates the existence of interrelationship between economic
growth and the status of capital market and the stage financial market development. This
interrelationship implies that economic growth is fundamentally linked to financial
integration.
In a recent study, Carrieri, Erronza and Hogan (2002) continue discussing the issue
of time-varying market integration for 8 emerging markets over the period 1976- 2000. The
GARCH-M methodology has been used to estimate the Errunza and Losq (1985) model
and empirically measure the time variation in market integration. They conclude that not
only the local risk is the most relevant factor in explaining the time variation of emerging
market return across the 8 countries, but also global risk is conditionally priced for some
markets. However, the study does not relate market integration to expected return. The
countries in the sample show wide range of integration alternatives from Argentina being
the most segmented to Mexico the most integrated. The study also shows that using the
correlations of market wide index return, as a measure of market integration is not a proper
measurement. In general the study shows that the degree of integration is higher in the
1990s. Finally, the study infers evidence that financial market development,
macroeconomic development and financial liberalization policies are very essential factors
for financial market integration.
28
Frank de Long and Frans A. de Roon (2002) use a similar model to the CAPM.
Their argument based on the notion that time variation in the integration level is important
for estimating the effects of liberalization on the cost of capital in emerging markets. In the
case of partially segmented market, the study considers the fraction of assets in an economy
that cannot be traded by foreign investors as a measure of market segmentation and has to
be held by domestic investors only which is called non-investable assets, whereas the asset
that can be traded freely refer to as investable assets. The effect of market segmentation or
integration on expected return for freely tradable (investable assets) and nontraded assets
(non-investable assets) has been estimated using a set of 30 emerging markets, which are
grouped into four regions Latin America, Asia and the Far East, Europe and the MENA
region, over the period 1988-2000. The study finds that the effect of the level of
segmentation or integration on the expected return in emerging markets exists in both kinds
of assets, although the results are weaker for the non investable assets than for the
investable assets. The expected returns in emerging markets are affected by the level of
segmentation not only in the country itself, but also by the level of segmentation in other
countries in the same region. The study also finds a significant time-variation in the betas
relative to the world portfolio, an annual increase of 0.09 in beta has been found due to the
decreased segmentation of the emerging markets.
Another asset pricing model that has been used in the literature to test the
integration of stock markets is the consumption-based asset pricing model. The basic idea
of this model asserts that the simple relation between consumption and assets return
captures the implication of complex dynamic international multi factor asset pricing model
(Campbell and Cochrane, 2000, p. 2863). Wheatly (1988), uses this model to test
international stock market integration. The model predicts that there is an asset pricing line
29
for each country that relates representative individuals expected real return on each asset to
the covariance of this return with growth in the individual’s real consumption. In this study,
the model predicts that each country has an asset pricing line (APL); this line relates the
expected real return to the covariance of this return with the growth in the individual’s real
consumption. He also suggests that markets are internationally integrated if assets of equal
risk, either located in one country or more, yield the same expected return. The joint
hypothesis will be rejected if securities lie at a significant distance from the (APL). The
study uses monthly data for U.S stock market and seventeen international markets and that
is from January 1960 to December 1985. The results do not reject the hypothesis, which
means the existence of stock markets integration.
Recently, CAPM has become more susceptible to criticism depending on the fact
that all investors are supposed to hold portfolio that contains both riskless portfolio and
market portfolio, which means that all investors hold the same combination of market
portfolio that contains all risky assets. In practice, however, it is still difficult to construct a
proxy that contains all assets (Agarwal, 2000).
30
2.5 Arbitrage Pricing Theory (APT) for Testing Stock Markets Integration
An alternative asset pricing model has been developed by the literature is the Arbitrage
Pricing theory (APT). A significant amount of literature has been using APT for testing
stock market integration. This model assumes that stock’s prices can be influenced by
several sources of systematic risk in the economy, other than the market risk. These sources
can be thought of as factors, in addition to the market.
In this context, Cho, Eun, and Senbet (1986) use the Arbitrage Pricing Theory
(APT) in an international setting to test stock market integration in eleven different
countries during the period (January 1973 - December 1983). They use the “Inter-battery
factor analysis” to estimate the common factor loading of two different groups of assets by
examining the inter-group sample covariance matrix only rather that the entire sample
covariance matrix. By doing so, they can alleviate the problem of variation of factor
structure, especially within countries. They also use Chow test method to measure the
validity of APT. The results of the cross-sectional test reject the joint hypothesis that the
international capital markets are integrated and that APT is valid internationally. The study
could not determine whether rejection of the joint hypothesis reflects segmentation of
capital markets or failure in the international APT.
Gultekin, Gultekin, and Penati (1989) use multi factor asset pricing model to test
stock markets integration or segmentation in U.S. and Japan. They hypothesize that market
segmentation could be either the result of government imposed barriers, or the individuals
attitudes and irrationality. The study uses weekly data during the period from January 1,
1977 to December 31, 1984. This period is divided into two sample periods, January 1977
31
to December 1980, and January 1981 to December 1984. These two samples are closed to
the year 1980, in which a big change in the capital control regime in Japan occurred, and
the enactment of the foreign exchange and foreign trade control law are completely
liberalized. The results indicate that the hypothesis of perfect integration has been rejected
before 1980 (before liberalization) and not rejected after 1980 (after liberalization). They
conclude that governments (public policies) could be a source of segmentation between
international stock markets. As a consequence of using weekly data, some economic
variables are not included, whereas stock market indices in the form of percentage change
are used, and this could be the a weakness of the study.
In a more comprehensive study, Korajczyk and Viallet (1989) investigate the
domestic and international version of the capital asset pricing model (CAPM) and the
arbitrage pricing theory (APT). They use the data on a large number of assets traded in four
countries, namely US, England, Japan and France, which is more than the countries in
Gultekin et al (1989) study, during the period January 1969 through December 1983. These
four markets represented nearly 65% of the world stock markets capitalization at the end of
19831. The study focuses on the following main issues. Firstly it investigates whether the
APT has greater explanatory power than CAPM domestically as well as internationally.
Secondly it investigates, whether international versions of the asset pricing models
outperforms or underperforms single economy versions. Finally, it investigates the
influence of changes in the regulation of international financial markets on the deviations of
returns from the predicted asset pricing relations. The findings of the study are as follows:
1 Market capitalization represents the aggregate value of a company or a stock. It is obtained by multiplying the number of shares outstanding by their current price per share. (http://wwwinvestorwords.com/2969/market_capitalization.html.)
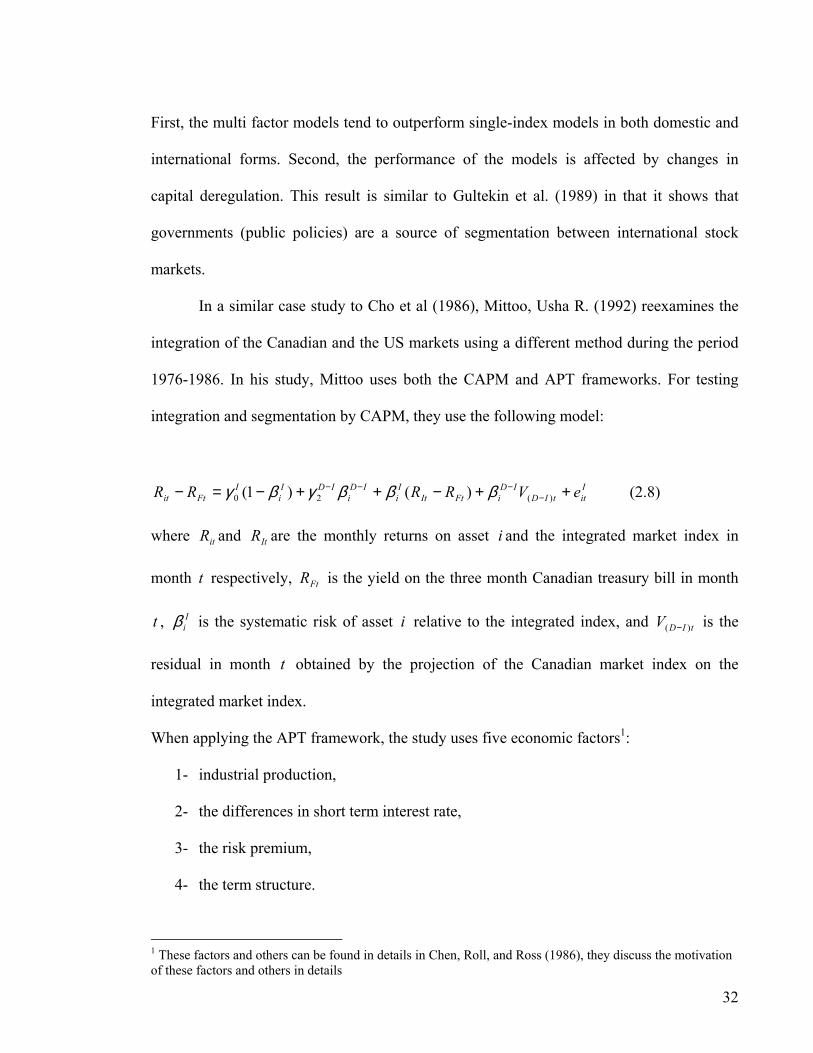
32
First, the multi factor models tend to outperform single-index models in both domestic and
international forms. Second, the performance of the models is affected by changes in
capital deregulation. This result is similar to Gultekin et al. (1989) in that it shows that
governments (public policies) are a source of segmentation between international stock
markets.
In a similar case study to Cho et al (1986), Mittoo, Usha R. (1992) reexamines the
integration of the Canadian and the US markets using a different method during the period
1976-1986. In his study, Mittoo uses both the CAPM and APT frameworks. For testing
integration and segmentation by CAPM, they use the following model:
IittID
IDiFtIt
Ii
IDi
IDIi
IFtit eVRRRR ++−++−=− −
−−−)(20 )()1( βββγβγ (2.8)
where itR and ItR are the monthly returns on asset i and the integrated market index in
month t respectively, FtR is the yield on the three month Canadian treasury bill in month
t , Iiβ is the systematic risk of asset i relative to the integrated index, and tIDV )( − is the
residual in month t obtained by the projection of the Canadian market index on the
integrated market index.
When applying the APT framework, the study uses five economic factors1:
1- industrial production,
2- the differences in short term interest rate,
3- the risk premium,
4- the term structure.
1 These factors and others can be found in details in Chen, Roll, and Ross (1986), they discuss the motivation of these factors and others in details
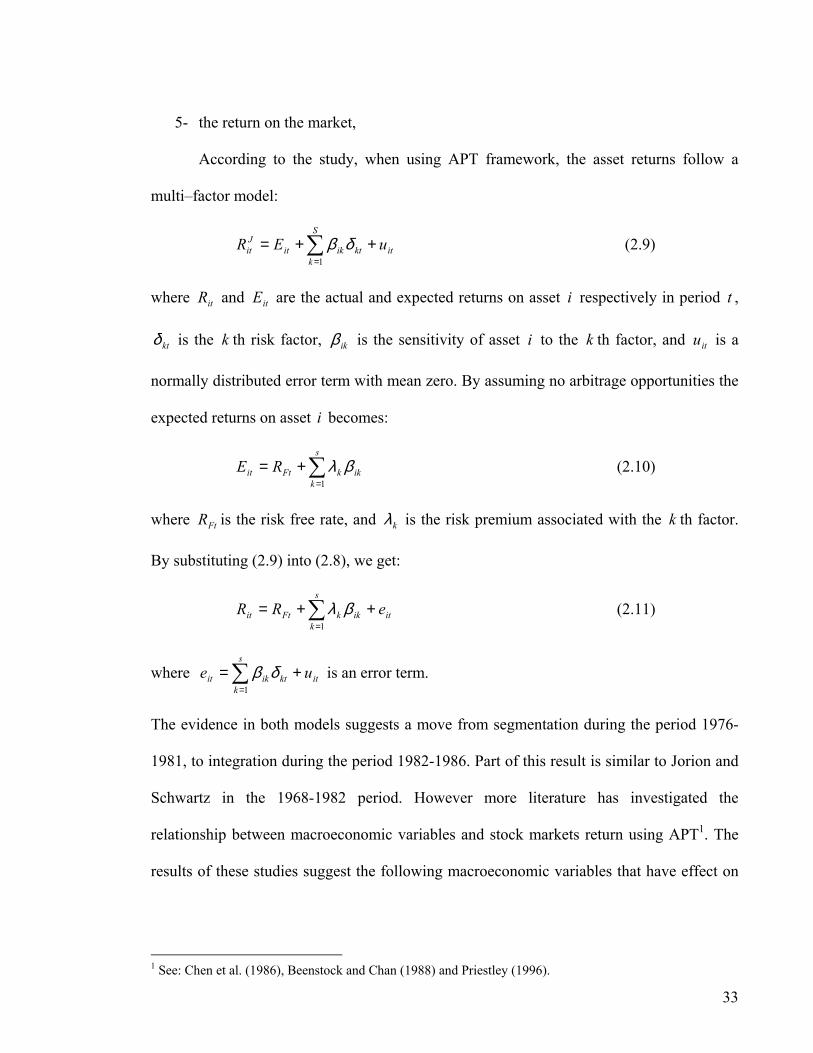
33
5- the return on the market,
According to the study, when using APT framework, the asset returns follow a
multi–factor model:
∑=
++=S
kitktikit
Jit uER
1
δβ (2.9)
where itR and itE are the actual and expected returns on asset i respectively in period t ,
ktδ is the k th risk factor, ikβ is the sensitivity of asset i to the k th factor, and itu is a
normally distributed error term with mean zero. By assuming no arbitrage opportunities the
expected returns on asset i becomes:
∑=
+=s
kikkFtit RE
1βλ (2.10)
where FtR is the risk free rate, and kλ is the risk premium associated with the k th factor.
By substituting (2.9) into (2.8), we get:
∑=
++=s
kitikkFtit eRR
1
βλ (2.11)
where ∑=
+=s
kitktikit ue
1δβ is an error term.
The evidence in both models suggests a move from segmentation during the period 1976-
1981, to integration during the period 1982-1986. Part of this result is similar to Jorion and
Schwartz in the 1968-1982 period. However more literature has investigated the
relationship between macroeconomic variables and stock markets return using APT1. The
results of these studies suggest the following macroeconomic variables that have effect on
1 See: Chen et al. (1986), Beenstock and Chan (1988) and Priestley (1996).

34
stock return: interest rate, expected inflation, unexpected inflation, industrial production,
input cost, money supply and exchange rate.
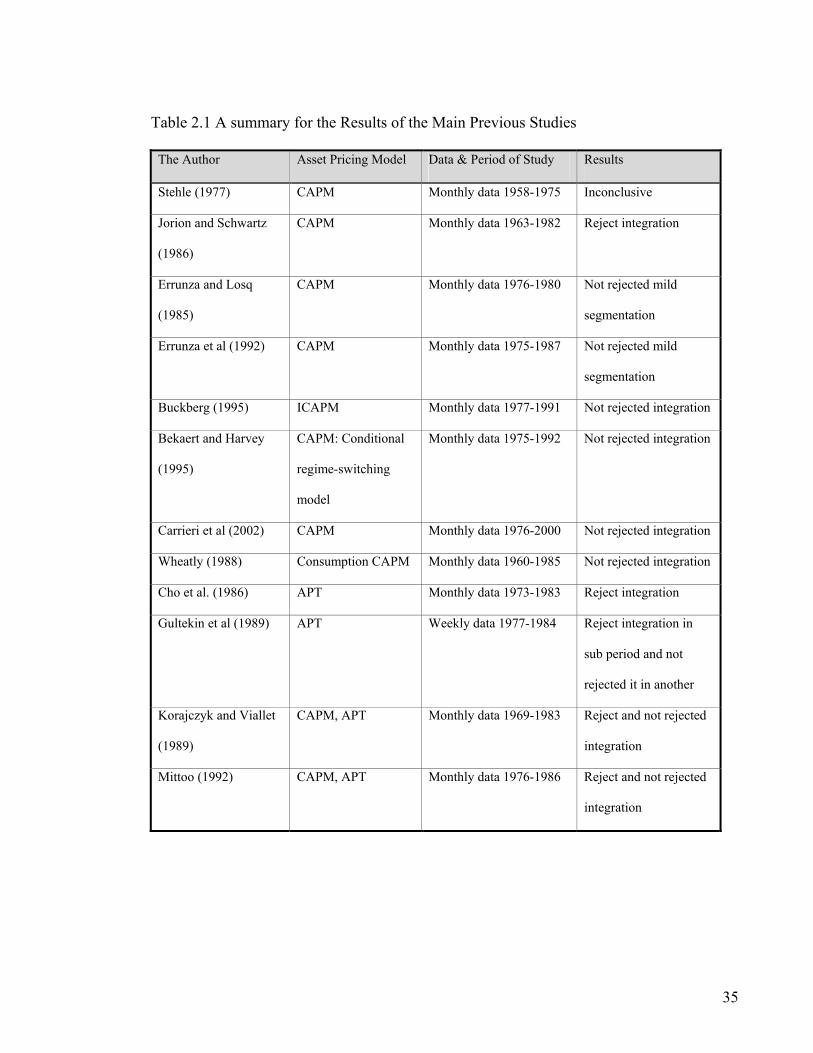
35
Table 2.1 A summary for the Results of the Main Previous Studies
The Author Asset Pricing Model Data & Period of Study Results
Stehle (1977) CAPM Monthly data 1958-1975 Inconclusive
Jorion and Schwartz
(1986)
CAPM Monthly data 1963-1982 Reject integration
Errunza and Losq
(1985)
CAPM Monthly data 1976-1980 Not rejected mild
segmentation
Errunza et al (1992) CAPM Monthly data 1975-1987 Not rejected mild
segmentation
Buckberg (1995) ICAPM Monthly data 1977-1991 Not rejected integration
Bekaert and Harvey
(1995)
CAPM: Conditional
regime-switching
model
Monthly data 1975-1992 Not rejected integration
Carrieri et al (2002) CAPM Monthly data 1976-2000 Not rejected integration
Wheatly (1988) Consumption CAPM Monthly data 1960-1985 Not rejected integration
Cho et al. (1986) APT Monthly data 1973-1983 Reject integration
Gultekin et al (1989) APT Weekly data 1977-1984 Reject integration in
sub period and not
rejected it in another
Korajczyk and Viallet
(1989)
CAPM, APT Monthly data 1969-1983 Reject and not rejected
integration
Mittoo (1992) CAPM, APT Monthly data 1976-1986 Reject and not rejected
integration
36
2.6 Alternative Approaches for Testing Stock Markets Integration
Different approaches have been used to test stock markets integration. Several studies have
used simple correlation and multiple regression models to test the market integration. The
correlation coefficients are measured either against stock prices or against standard
deviations of stock prices across stock markets, see: Akdogan (1995), Bhooca-com, A. &
Stansell, S.R. (1990) and Marashdeh (1994). However, it becomes clear that relying on
correlation analysis for testing integration or other phenomena is quite questionable. Many
studies have pointed to the problems of using this technique. One of them is that it does not
eliminate the spurious relationships. Some studies also show that “the conventional cross-
correlation coefficients are biased upwards during a period of increased volatility” (Wilson
et. al. p. 8, 2002).
Other studies have concentrated on the capital flow and its effect on stock markets
integration that is if there is capital flows between stock markets, it is an indication of
existence of integration (Erronza, et al. 1992). Some other intuitive techniques have been
adopted on the basis of monitoring volatility interaction for measuring the integration
(Darbar and Deb 1997). Some others have used coherence analysis; (see: Sewell Stansell
and Lee 1996).
Akdogan (1996) suggests different approach to measure the financial markets
integration; this approach depends on an international risk decomposition model. The study
introduces a quantifiable measure of market integration that can be used to rank countries
by their level of integration; first it starts with the single-index return generating, which is
given by:
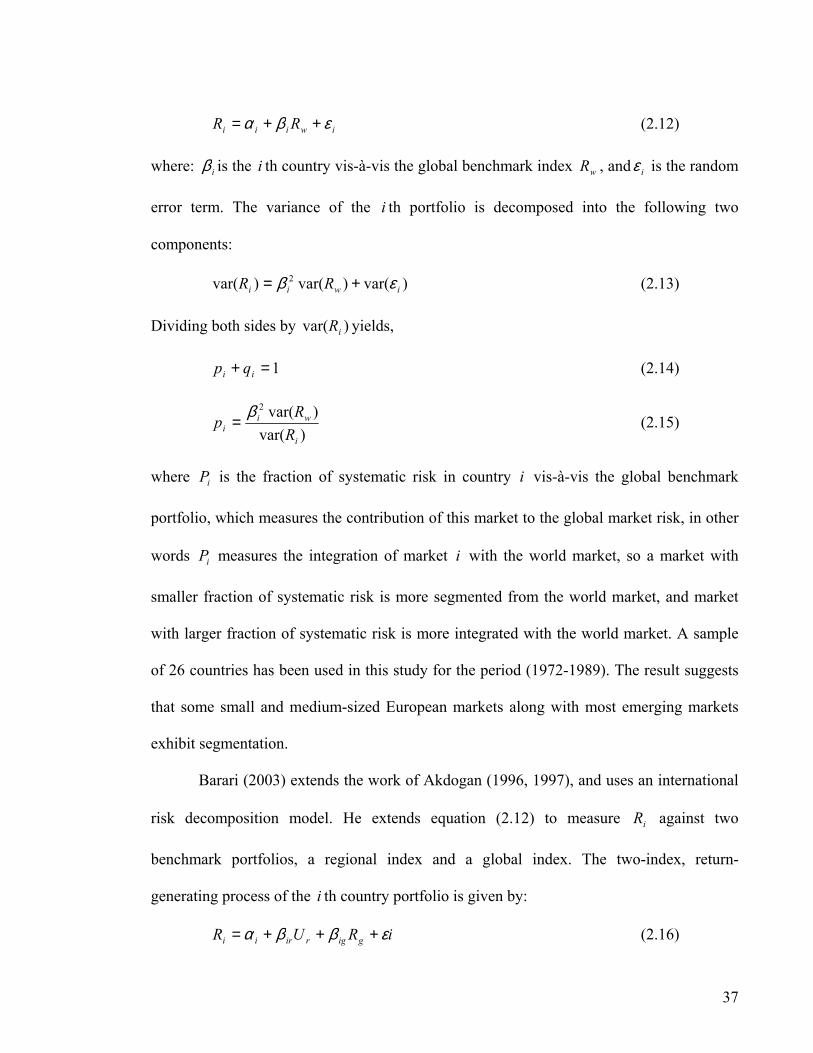
37
iwiii RR εβα ++= (2.12)
where: iβ is the i th country vis-à-vis the global benchmark index wR , and iε is the random
error term. The variance of the i th portfolio is decomposed into the following two
components:
)var()var()var( 2iwii RR εβ += (2.13)
Dividing both sides by )var( iR yields,
1=+ ii qp (2.14)
)var()var(2
i
wii R
Rp β= (2.15)
where iP is the fraction of systematic risk in country i vis-à-vis the global benchmark
portfolio, which measures the contribution of this market to the global market risk, in other
words iP measures the integration of market i with the world market, so a market with
smaller fraction of systematic risk is more segmented from the world market, and market
with larger fraction of systematic risk is more integrated with the world market. A sample
of 26 countries has been used in this study for the period (1972-1989). The result suggests
that some small and medium-sized European markets along with most emerging markets
exhibit segmentation.
Barari (2003) extends the work of Akdogan (1996, 1997), and uses an international
risk decomposition model. He extends equation (2.12) to measure iR against two
benchmark portfolios, a regional index and a global index. The two-index, return-
generating process of the i th country portfolio is given by:
iRUR gigririi εββα +++= (2.16)
38
The study empirically estimates the global and regional integration scores for a sample of
six Latin American countries, namely Argentina, Brazil, Chile, Colombia, Mexico, and
Venezuela, during the period 1988-2001. The results show that there was a move toward
regional integration but not global integration for most of the countries in the sample.
2.7 Conclusion
After reviewing the notion of stock markets integration, this chapter presents a
thorough discussion of the early theoretical models relating to stock markets integration;
such as asset pricing models and arbitrage pricing theory. According to the asset pricing
models, stock markets are considered to be integrated if securities with the same risk are
prices the same. So in the case of implementing CAPM, there will be a unitary price risk,
and the price of all assets reflects the level of systematic risk they possess, and so the assets
are considered to be integrated. Also, the chapter reviews another asset pricing model that
is the consumption-based asset pricing model, this model shows that the simple relation
between consumption and assets return captures the implication of complex dynamic
international multi factor asset pricing model.
Regarding the Arbitrage Pricing Theory (APT), this model assumes that stock
prices can be influenced by not only the market risk, but also by several sources of
systematic risk in the economy. In a contrast to the assets pricing models, some studies use
what is called a conditional regime-switching model, this model allows for switching
between segmentation and integration by attaching probabilities to the respective asset
pricing models.

39
Finally, the chapter reviewed some alternative approaches for testing stock market
integration. These approaches include the correlation coefficients approach, the capital flow
between stock markets; monitoring volatility interaction for measuring integration, and the
international risk decomposition model.
40
Chapter Three
The Recent Techniques Relating to Stock Market
Integration: the Cointegration Approach
3.1 Introduction There is a growing theoretical and empirical literature dealing with stock market
integration. Most of recent studies rely on recent econometrics techniques, such as
cointegration approaches, generalized autoregressive conditional heteroscedasticity
(GARCH) model. Granger-causality, vector autoregressive (VAR) model and variance
decomposition to measure the stock market integration among national stock markets.
As stock price indices trend to move together over a long period of time, this co-
movement indicates the existence of cointegration among stock price indices. This linkage
and co-movement among stock markets indices have been studies by several studies. At the
same time, more literature concerning finance has concentrated on the efficiency of stock
markets, and the relation between the existence of long-run equilibrium relationship among
stock markets and the efficiency of these markets. However, based on this literature,
controversial results have been provided depending on how the efficiency itself is
interpreted.
The main objectives of this chapter are to review the literature relating to using
different cointegration approaches for testing stock market integration. Also to review the
literature relating to Efficient Market Hypothesis (EMH), and the effect of the existence of
41
cointegration on the stock market efficiency. More concentration will be on the emerging
stock markets in the MENA (Middle East and North Africa) region. This chapter is divided
into six sections. Section 2 analyzes the use of cointegration for testing stock market
integration. Section 3 sheds some light on the Asian financial crises and stock market
integration. Section 4 discusses and analyzes the relationship between the Efficient Market
Hypothesis and stock market integration. Section 5 investigates the stock market integration
in MENA region. Finally, the last section offers some concluding remarks.
3.2 Cointegration Approach for Testing Stock Market
Integration In the last two sections, it has been realized that a huge volume of earlier research on
financial market integration has been done using capital asset pricing models or arbitrage
pricing theory. Most of recent studies have been using modern econometric techniques such
as Granger-causality analysis, generalized autoregressive conditional hetroskedasticity
(GARH) model, vector autoregressive model (VAR) and different approaches of
cointegration analysis, such as Johansen- Juselius approach, and the ARDL approach. In
this section a review of some of the literature that has been used the cointegration and
modern econometrics techniques will be presented.
One of the idiosyncrasies of stock prices is that over long period they trend to move
together and follow a common upward trend (Saini, et al. 2002). Many studies try to
calculate the number of common stochastic trends. If stock markets are integrated, it is
expected for the indices in these markets to display common trends. But since these indices
are nonstationary, then using cointegration method becomes necessary (Dickinson, 2000).
42
The existence of co-movements between the securities prices indicates stock market
integration. This co-movement, which indicates the existence of cointegration between two
stock markets, implies that one of the markets will help predicting the other market’s
returns, since a valid error correcting representation will exist. Also, they share at least one
common stochastic trend and they will tend to drift together over time.
The linkage and long-run co-movements among international stock markets either
developed or emerging have been studied by several researchers. Before delving into the
details of these studies, an important question should be raised here, and that is why shocks
in one market should affect other markets? Janakiramanan and Lamba (1998) mentioned
four factors that cause these influences:
1- Dominant economic power, actions taken by an influential economic power
country, like US, will have worldwide repercussions.
2- Macroeconomic variables in different countries play important role in determining
the cointegration among stock markets in these countries. Kasa (1992) finds that
when a comovement exists among stock markets, also a comovement among
macroeconomic variables in these courtiers exists.
3- Common investor groups, when two countries share geographical proximity and
have similar groups of investors in their markets, these markets are more likely to
influence each other. However, it is worth mentioning here that having common
economic and geographic ties do not necessarily lead the national stock markets to
follow the same stochastic trend (Chan, et al., 1997, p. 809).
4- Multiple stock listing, when a stock is listed in two countries at the same time, this
means that any shocks in one market will be transmitted to the other.
43
5- Indirect influences, when stock market (A) reacts directly to a shock in another
stock market, say (B), and when the same stock market (A) reacts indirectly to a
shock happened in another stock market, say (C), which already has been affected
by the initial shock from stock market (B).
In fact not only these factors that causes the comovements between stock markets,
the major global events, especially political conflicts that happen in some parts of the
world, such as the first and the second Gulf wars, and the September 11 attacks, have
caused a downward trend in different national stock markets at the same time.
To review the literature that uses modern econometric techniques, particularly the
use of cointegration, this present study starts with Kasa (1992) who tries to give evidence
related to the number of common trends in the stock markets of five major industrialized
countries namely US, Canada, Germany, England and Japan. More specifically the study
tries to count how many common stochastic trends exist in these countries. What are the
sources of these trends? Do they reflect the economic integration of international financial
markets, or are they cointegrated for other reasons? The study uses monthly and quarterly
data from January 1974 to August 1990. It uses Johansen’s maximum likelihood approach
(1990) to test for Cointegration. VAR(k) model is the starting point of this approach. It
takes the following form:
tktktt XAXAX εµ ++++= −− ...11 (3.1)
with some rearrangement Johansen rewrite the equation (3.1) as follows:
tktktktt XXXX εµ +Π+∆Γ++∆Γ+=∆ −+−−− 1111 ... (3.2)
where
tX : a vector of nonstationary variables.
44
),...( ttt AAI −−−−=Γ .1,...,1 −= ki
)...1( kt AA −−−−=Π
The long–run information in the tX process is summarized by the matrix Π , and the rank
of the matrix determines the number of cointegration vectors. So if matrix Π has rank r
then we conclude that there are r cointegrating relationships among elements of tX or
equivalently rn − common stochastic trends. The results indicate that the price indices for
the five stock markets are all cointegrated a round a single common stochastic trend. In the
long run, the total return indices are closely linked, which indicates the existence of
cointegration relationship. Kasa finds that Japanese market has the most important trend,
and Canada has the least important trend. The study takes the analysis a little bit further by
comparing the cointegration structure of stock prices with cointegration structure of their
dividend payments. So, the existence of stochastic trends among stock markets indices can
be explained by the common stochastic trends among dividends. Finally, the study
indicates that as these markets are perfectly correlated over long horizons, the gain from
international diversification have probably been overstated in the literature. However, Kasa
implies that, as national stock markets can deviate from the trend they show for several
years, then the benefits of diversification may still be achievable over the short-run. Kasa
indicates another two important results. Firstly, he finds a single common stochastic trend
when using capital international’s dividends data. Secondly, when using GNP data to proxy
for dividends, he finds a single common stochastic trend, which means that macroeconomic
variables play an important role in the long-run comovements of stock prices.
These results have been supported later by Janakiramanan and Lamba (1998) who
have speculated about the factors that cause national stock market to move together over
45
the long period, especially the “common investor groups” factor. In general, the findings of
Kasa (1992) show clear and strong link between financial integration and cointegration
among stock prices.
Regarding the effect of some macroeconomic variables on the stock market
movements, many studies investigate this issue, Campble and Ammer (1993) use vector
autoregression (VAR) to estimate the dynamic responses of the system when including
stock dividends, short-term interest rate and inflation as additional explanatory variables.
The results of their study indicate that the real long-term interest rate has a positive, but
minimal impact on the variance of excess stock returns, while the big impact is due to the
changes in forecasts of future dividends1.
In a similar approach to Kasa (1992), Corhay et al. (1993) use both the static
regression and the VAR-based maximum likelihood framework to estimate the degree of
stock market integration in five major European stock markets: France, Germany, Italy,
Netherlands and the United Kingdom, from 1st March 1975 to 30th September 1991. Using
weekly data during this period, the study finds evidence of cointegration between the stock
price series of these countries, except for Italian stock prices that do not seem to influence
this long run relationship.
In an attempt to analyze the benefit of international equity diversification for
Australian investors, Allen and Macdonald (1995) use a cointegration framework that
covers the period 1970-92. The study uses monthly data for 16 stock markets and uses the
standard Engle-Granger two-step ordinary least squares procedure. The study finds
1 Many researchers have focused on the relationship between integration of stock markets and the real economic integration, see Ammer and Mei (1996) who show that the stock index comovements is a good indicator of real economic integration. Another study by Dickinson (2000) considers stock index movement as a function of increasing real integration.
46
evidence of cointegration over the sample period between Australia and Canada, Australia
and UK, and Australia and Hong Kong. The results imply that Australians investors can
have a potential long-run portfolio diversification gains in other countries where no
evidence of cointegration have been found. The result of using Johansen maximum
likelihood procedure suggests that Australian market is cointegrated with Germany and
Switzerland markets, so the two techniques lead to different conclusions.
Masih and Masih (1997) examine the pattern of dynamic linkages among national
stock prices of four Asian countries, namely Taiwan, South Korea, Singapore and Hong
Kong, and four developed markets, Japan, US, UK and Germany. The authors use different
econometrics techniques including unit root testing, multivariate cointegration, and vector
error correction modeling (VECM). Forecast error variance decomposition (VDC) and
impulse response functions (IRFs). In particular the study employs a multivariate dynamic
framework, which allows for both short-run and long–run relationship to manifest over
time. The concept of cointegration is used to test whether the four Asian markets shared
any degree of long-run integration with developed markets. By using monthly data during
the period from January 1982 to June 1994, the study reaches to the following three
conclusions:
1- A cointegration between the Asian markets and the developed markets. This result-
according to the study- is important and valuable for assisting financial analysis.
2- The Granger–causal chain implied by the dynamic analysis (based on VECMs and
VDCs) suggests that the Hong Kong market predominantly led the other markets.
Hong Kong market was the initial receptor of exogenous shocks to its equilibrium
relationship and the other markets have to bear the burden of short-run adjustment.
47
The study finds short–run linkages ran from Korea to Taiwan, Taiwan to Singapore
and Singapore to Korea.
3- The US market plays an important role in dominating the region (four Asian
countries) by explaining the greatest percentage of variances in these Asian markets,
without being explained by any other market.
Another interesting result is that the Singaporean stock market does not significantly
influence the long-run relationship in both Japan and US vectors.
In a similar approach to Masih and Masih (1997), Phylaktis (1999) tries to see
whether there is an increase in the degree of capital market integration between Taiwan,
South Korea, Singapore and Hong Kong with the US and Japan, and to examine with which
of these two countries (US and Japan) the degree of capital market integration is grater. The
sample is divided into two sub-periods in order to examine the effect of deregulation. The
first period ended in December 1980 which represents the period of regulation, while the
second sub-period starts on January 1981, and ended in October 1993, which represents the
liberalization period. The study examines the capital market integration by looking at the
equalization of real interest rates using the cointegration methodology. The study uses
different indicators for capital market integration other than the one customarily used in the
literature. These indicators relate to the speed of adjustment of interest rate to re-establish
long-run equilibrium following a shock in one of the rates using innovation accounting
analysis. Finally the study explores the short-run dynamic through multivariate Granger-
causality test in order to find whether it is the real interest rate of US or of Japan that
derives the interest rate in the Pacific Basin countries. According to the study, the
multivariate approach is superior to the bivariate approach. The results indicate the
existence of integration and real interest rate parity in the Pacific Basin region and that the
48
degree of integration has increased in post-liberalization period in Singapore, Taiwan and
Korea. Another important result is that there is grater capital market integration with Japan
than with USA in the second sub-period, which shows the domination of Japan’s influence
over the region.
Chouldhry (1997) empirically investigates the long-run relationship between six
Latin American stock indices (Argentina, Brazil, Chile, Colombia, Mexico and Venezuela)
and United State. The study uses the log weekly stock indices from January 1989 to
December 1993. All of these markets are considered as emerging markets. The study is
looking for a possible multivariate long-run stationary relationship between these six Latin
Americans emerging stock markets themselves, and then between these markets and United
States stock price index. Empirical investigations are conducted by means of unit root tests,
cointegration tests, and error-correction models. To test cointegration, the study uses the
Johansen maximum likelihood approach, which is a multivariate cointegration test that can
identify the number of cointegration vectors:
∑=
−− +Π+∆Γ+=∆N
ittitit XXCX
11 η (3.3)
where tX is a vector of nonstationary variables.
Moreover the study uses error-correction model in order to capture the short-run dynamic
adjustment of cointegrated variables (Engle and Granger 1987). The model has the
following form:
ttti uXLACX εθ ++∆+=∆ −1)( (3.4)
where C is a vector of constant terms.
)(LA is a matrix of finite order lag polynomials.
49
The results find common stochastic trends between the different indices with and without
the United States index. This means that there is a long-run stationary relationship between
the six Latin American stock markets indices, and also between the indices of these markets
and the United States index. According to the study, this is due to the globalization of the
emerging markets in the late 1980’s and early 1990’s.
The relationship between stock markets integration and diversification has been
analyzed by many researchers1. The core idea of this relationship is that if stock markets
tend to move together in the long run, then the benefit of diversification portfolios a cross
these markets will be eliminated.
Garrett and Spyrou (1997) examine whether the finding of common trends is
sufficient to justify statements such as the long-run benefit to diversification that is
eradicated. More specifically, the study examines this issue in relation to emerging markets,
and how it will affect an investor in the UK and the US. The study uses monthly data over
the period from January 1976 to December 1994 in Argentina, Brazil, Chile and Mexico;
and over the period from January 1985 to December 1994 in India, Malaysia, the
Philippines, South Korea, Taiwan and Thailand. By implementing Johansen and Juselius
(1990) approach, the results suggest that both groups of countries (Latin American and
Asia-Pacific) are driven by one common stochastic trend for each region. The study still
argues that the composition of the common trend is limited to few markets that actually
react to it. So, this evidence suggests that emerging stock markets – in these two regions-
offer benefit in terms of diversification, even in the long run.
1 See Kasa (1992), and Corhay, Rad and Urbain (1993) and their references.
50
Janakiramanan and Lamba (1998) analyze the dynamic relationship between daily
returns of eight Pacific-Basin countries (Australia, Hong Kong, Japan, New Zealand,
Singapore, Indonesia, Malaysia, and Thailand) and the US over the period 1988-1996. The
study uses vector autoregression (VAR), which takes the following form:
)()()()(1
tektRkACtRp
k+−+= ∑
=
(3.5)
In order to analyze the dynamic relationship in the system, the (VAR) model is transformed
to its moving average form:
)()()(0
ktukCtRk
−=∑∞
=
(3.6)
So, by estimating equation (3.6), the study can trace the dynamic responses to shocks in the
system. The results exhibit a US influence on all other markets except for Indonesia, and
when the study excluded the US market from the VAR system it finds linkages between
these markets, which in turn and according to the study, are traced to the indirect influence
of the US market. Also the study finds a significant mutual influence between the markets
that are geographically and economically close to each other.
Rangvid (2001) uses a recursive common stochastic trends analysis to examine
whether European stock markets have become more integrated during the period 1960-
1999. Particularly, the study tests the hypothesis of increased convergence by calculating
the number of significant cointegration vectors at different times and investigates whether
this number increases as the sample period is extended. To test this hypothesis, the share
price indices for UK, France and Germany are used. The results indicate that the price
indices for the three countries share common stochastic trends over the whole sample, and
the recursive approach points towards an increase in the number of cointegration vectors as
51
the sample period extended. This increase in cointegration vectors implies that these
markets were being increasingly integrated during the last two decades, especially at the
early 1980s.
Nevertheless, this result has been criticized by Pascual (2003), who is concerned
about the validity of this result. He argues that the increasing values of the trace statistics-
that are already interpreted by Rangvid (2001) as an increase in cointegration- may be a
reflection of the higher power of the Johansen test as the sample size increase from 20 to
156 observations. Pascual (2003) presents an alternative approach to test the increasing of
stock market integration. The study estimates the time-path followed by the coefficient of
the error correction term (ECT). He studies the same countries as Rangvid (2001) during
the period 1964 to 1999.
Pascual (2003, p. 198) argues that:
“The error correction term (ECT) reflects deviations from the long-
run cointegration relationship, therefore the coefficient of the ECT
represents the speed adjustment to deviations from the long-run
equilibrium. Higher values of those coefficients can be interpreted as a
higher degree of stock market integration”.
However, the study comes to results different from Rangvid’s (2001). The cointegration
test shows an increasing financial integration in the case of France, but none in the case of
UK and Germany.
In a recent study by Tahai et al (2004), they investigates the financial cointegration
of the G7 stock markets. They employ monthly stock indices of the G7 during the period
from March 1978 to December 1997. To determine the integration indices, an )2(I VAR
model with two lags and trend restricted to lie in the cointegration space is estimated for the
52
seven stock markets. This model was developed by Johansen (1992), and takes the
following formula1:
∑−
=−−− +∆Ψ+Γ∆−Π=∆
2
1
211
2k
ititittt xxxx υ (3.7)
where tx (log of price index) is a ρ -dimensional vector of I(1) time series,
Π : a matrix which is used to determine the cointegration rank ( p) of the VAR,
tυ : an error having a nonsingular matrix,
∑−
=
Γ−=Γ1
1
k
iiI , ∑
−
=
Γ−=Ψ1k
iji and 2,...,1 −= ki .
This model is defined as a subclass of the VAR with parameters that satisfy the following
two reduced ranked conditions
βα ′=Π , where ,α β are rp × matrices of rank pr <
The results show comovements of stock returns of market indices of the G7. But
related to the diversification issue, the study- as many others- indicates that the investors
with long holding periods in perfectly cointegrated markets, gains from international
diversification may have been overstated in the literature.
Narayan et al. (2004) examine the dynamic linkages among the four stock markets
in South Asia, namely India, Pakistan, Sri Lanka and Bangladesh. The study covers the
period from 2 January 1995 to 23 November 2001. The autoregressive distributive lag
(ARDL) approach to cointegration is used to test for the existence of long-run relationships.
This approach involves two stages. At the first stage the existence of the long-run relation
between the four stock price indices is tested by computing the F-statistics. At the second
stage the coefficients of the long run relations are estimated (Pesaran and Pesaran, 1997).
1 For more information about Johansen’s model, see Appendix B, sections 4 and 5.

53
The study reaches three main findings. First, there is a long-run relationship between the
stock prices of the four countries when stock prices in Pakistan are considered as the
dependent variable. Second, in the long-run, stock prices in Bangladesh, India and Sri
Lanka Granger-cause stock price in Pakistan. In the short run there is unidirectional
Granger-causality from stock prices in Pakistan to India, stock prices in Sri Lanka to India
and from stock prices in Pakistan to India. Third, from Granger causality analysis, it is
found that Bangladesh is the most exogenous market. The ARDL approach used by the
study is a recent and advanced approach and it is preferred than other methods like Engle
and Granger (1987) and Johansen (1988). It also becomes one of the recent techniques for
cointegration for many reasons like being more robust for small sample sizes, and being
applied irrespective of whether the regressors are I(0) or I(1).
54
3.3 The Asian Financial Crisis and Stock Market Integration The Asian financial crisis in 1997 and 1998 is considered as the first emerging stock market
crisis with global impact. It started in some South Asian countries in July 1997 when the
Thai Baht was devaluated, followed by the crash of Hong Kong in the late of October 1997,
then the Korean crisis in November 1997, then the panic spread among many countries in
the region (China, India, Japan, Singapore, Hong Kong and Taiwan). Numerous studies
have discussed this crisis from different point of views. There is a consensus on some of the
main causative factors that created this crisis. Some of these factors were that the financial
system in these countries had relied upon an old technology, the capital markets were
poorly developed, the banks extended credit excessively, so the capital was misallocated
and went on without strong credit controls (Sheng and Tu, 2000, p. 346). The global impact
of the Asian financial crisis in 1997 and 1998 has been investigated by many researchers.
Some of those researchers concentrated on the issue of the relationship between this crisis
and stock market integration in different parts of the world. Others concentrated on the
cointegration among some Asian capital markets before, during, and after the crisis. Details
will be shown below.
Sheng and Tu (2000) investigate the linkage among some national stock markets
(12 Asian-Pacific countries) before and during the Asian financial crisis. They use
Johansen (1988) multivariate cointegration, the error correction model (ECM) and Granger
causality. In order to investigate the linkages among the markets, the data are divided into
two groups before the crisis of July 1, 1997 - June 30, 1998. When Thailand was excluded
from the cointegration testing due to its stationary properties, one cointegration vector
appeared during the period of the crisis but not before, and when it was included two
55
cointegration vectors appeared. This indicates that Thailand played an important role in the
crisis. When applying the Granger causality test, the result show that the US market causes
some Asian countries during the crisis, and only three markets feedback the US, namely
Hong Kong, South Korea and China.
Wang et al. (2003) investigate the effect of the financial crisis on the African
markets. The researchers examine both the global and regional integration of African stock
markets. They use a recent and well-developed technique of generalized impulse response
analysis (Persaran and Shin, 1998) to estimate dynamic causal linkage across the largest
five African stock markets (South Africa, Egypt, Morocco, Nigeria and Zimbabwe) and the
US market. The sample period consists of daily stock index closing prices from January
1996 to May 2002. The study starts with the VAR model of order (k):
∑=
− ++=k
ittitit eXYAY
1
ψ ),...,1( Tt = (3.8)
Impulsive response function is used for short-run dynamic linkages among the stock
markets. One weakness of this technique is its sensitivity to the ordering of variables when
the residual covariance matrix is non-diagonal. To overcome this problem, the general
impulse response analysis technique is used, this approach is invariant to the ordering of the
variables in the VAR model and it takes the following form:
∑∞
=−=∆
0iitit eCY ),...,2,1( Tt = (3.9)
where iC is the moving average coefficient, and it can be obtained from iA in the previous
equation. The study makes the following conclusions: Firstly, the interdependence among
the African markets was limited in the short as well as in the long-run, and the regional
integration between these markets was weakened after the 1997-1998 crisis, which is
56
opposite to Asian stock markets that demonstrate more positive regional integration after
the crisis. Secondly, the US has a significant influence on South Africa stock markets, but
not on the other African stock markets. Finally, the degree of integration among emerging
markets is showing a tendency for a change over time, especially around the periods
marked by financial crisis.
In a recent study by Yang et al. (2003), the same econometric techniques that used
by Wang et al. (2003) to estimate the long-run relationship and short-run dynamic casual
linkage across ten Asian emerging stock markets, in addition to the US and Japan. The
study uses daily index closing prices during three periods:
1- Pre-crisis (2 January 1995 – 31 December 1996)
2- During crisis (1 July 1997 – 30 June 1998)
3- Post- crisis (July 1998 – 15 May 2001)
The results show that these markets are more integrated after the crisis than before the
crisis. It also shows that the US has substantially influenced the Asian markets during the
three periods, but was not influenced by these markets. The degree of integration among
countries tends to be changed over time, especially around the periods marked by financial
crisis. However, Table 3.1 presents a summary for the results of the previous studies.
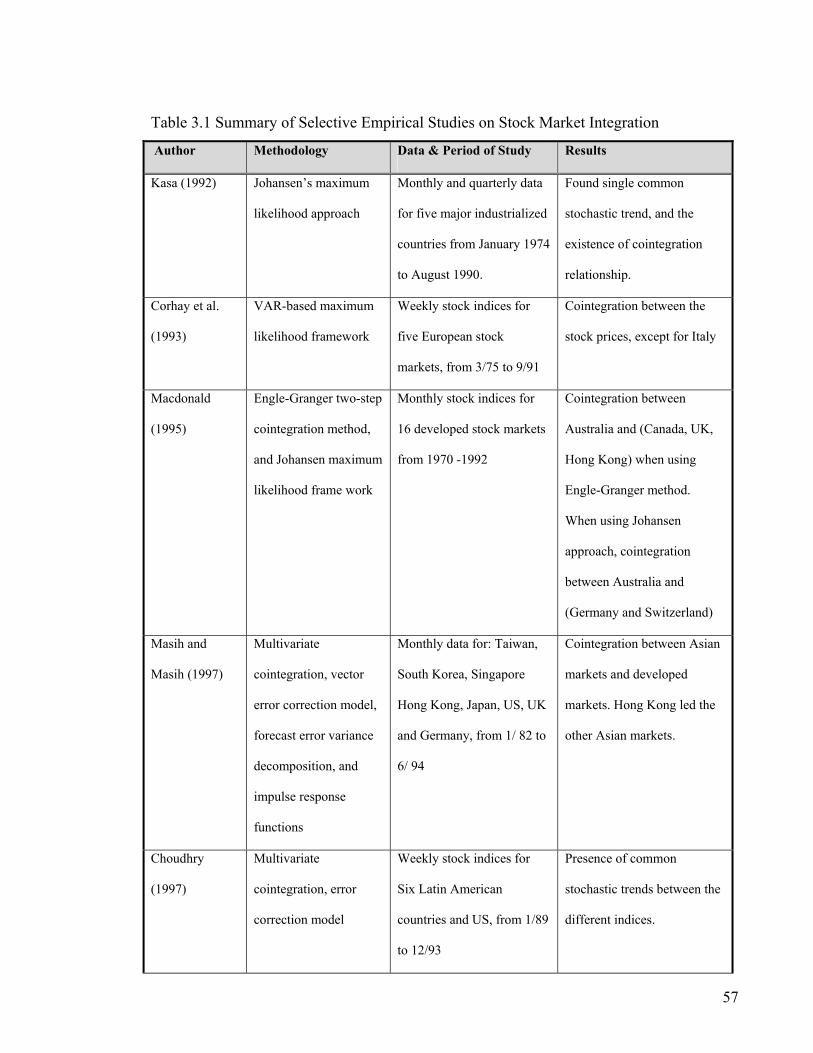
57
Table 3.1 Summary of Selective Empirical Studies on Stock Market Integration
Author Methodology Data & Period of Study Results
Kasa (1992) Johansen’s maximum
likelihood approach
Monthly and quarterly data
for five major industrialized
countries from January 1974
to August 1990.
Found single common
stochastic trend, and the
existence of cointegration
relationship.
Corhay et al.
(1993)
VAR-based maximum
likelihood framework
Weekly stock indices for
five European stock
markets, from 3/75 to 9/91
Cointegration between the
stock prices, except for Italy
Macdonald
(1995)
Engle-Granger two-step
cointegration method,
and Johansen maximum
likelihood frame work
Monthly stock indices for
16 developed stock markets
from 1970 -1992
Cointegration between
Australia and (Canada, UK,
Hong Kong) when using
Engle-Granger method.
When using Johansen
approach, cointegration
between Australia and
(Germany and Switzerland)
Masih and
Masih (1997)
Multivariate
cointegration, vector
error correction model,
forecast error variance
decomposition, and
impulse response
functions
Monthly data for: Taiwan,
South Korea, Singapore
Hong Kong, Japan, US, UK
and Germany, from 1/ 82 to
6/ 94
Cointegration between Asian
markets and developed
markets. Hong Kong led the
other Asian markets.
Choudhry
(1997)
Multivariate
cointegration, error
correction model
Weekly stock indices for
Six Latin American
countries and US, from 1/89
to 12/93
Presence of common
stochastic trends between the
different indices.
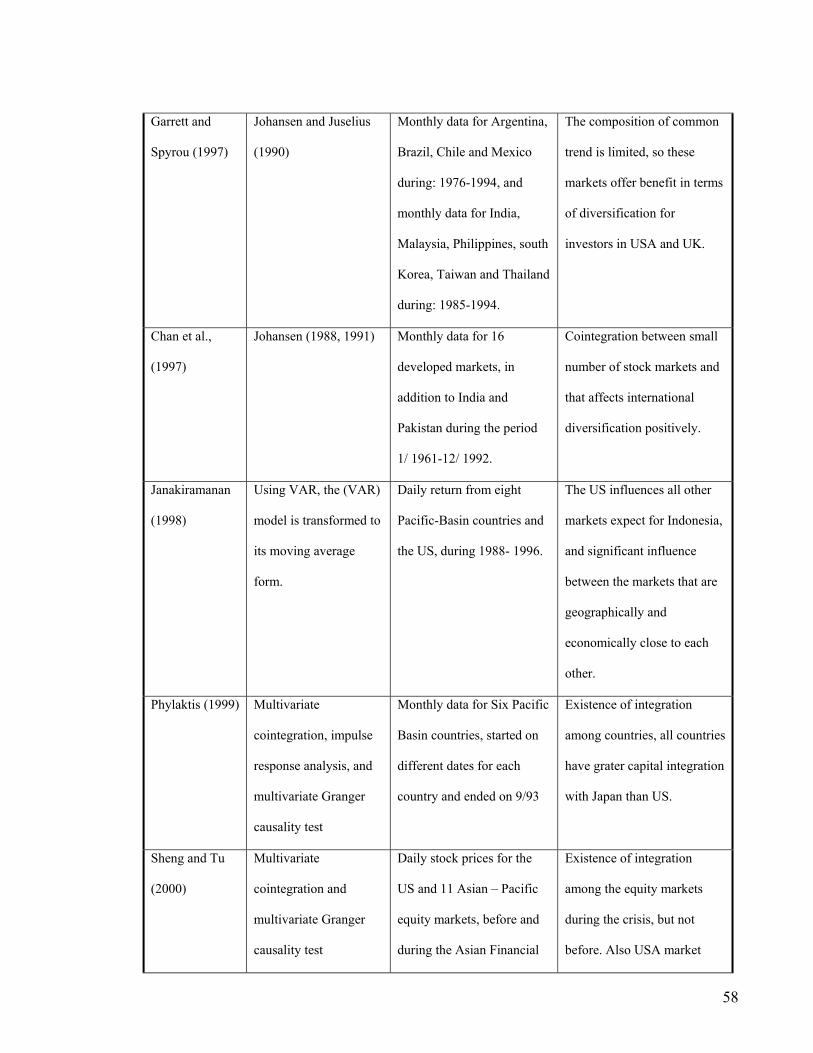
58
Garrett and
Spyrou (1997)
Johansen and Juselius
(1990)
Monthly data for Argentina,
Brazil, Chile and Mexico
during: 1976-1994, and
monthly data for India,
Malaysia, Philippines, south
Korea, Taiwan and Thailand
during: 1985-1994.
The composition of common
trend is limited, so these
markets offer benefit in terms
of diversification for
investors in USA and UK.
Chan et al.,
(1997)
Johansen (1988, 1991) Monthly data for 16
developed markets, in
addition to India and
Pakistan during the period
1/ 1961-12/ 1992.
Cointegration between small
number of stock markets and
that affects international
diversification positively.
Janakiramanan
(1998)
Using VAR, the (VAR)
model is transformed to
its moving average
form.
Daily return from eight
Pacific-Basin countries and
the US, during 1988- 1996.
The US influences all other
markets expect for Indonesia,
and significant influence
between the markets that are
geographically and
economically close to each
other.
Phylaktis (1999) Multivariate
cointegration, impulse
response analysis, and
multivariate Granger
causality test
Monthly data for Six Pacific
Basin countries, started on
different dates for each
country and ended on 9/93
Existence of integration
among countries, all countries
have grater capital integration
with Japan than US.
Sheng and Tu
(2000)
Multivariate
cointegration and
multivariate Granger
causality test
Daily stock prices for the
US and 11 Asian – Pacific
equity markets, before and
during the Asian Financial
Existence of integration
among the equity markets
during the crisis, but not
before. Also USA market
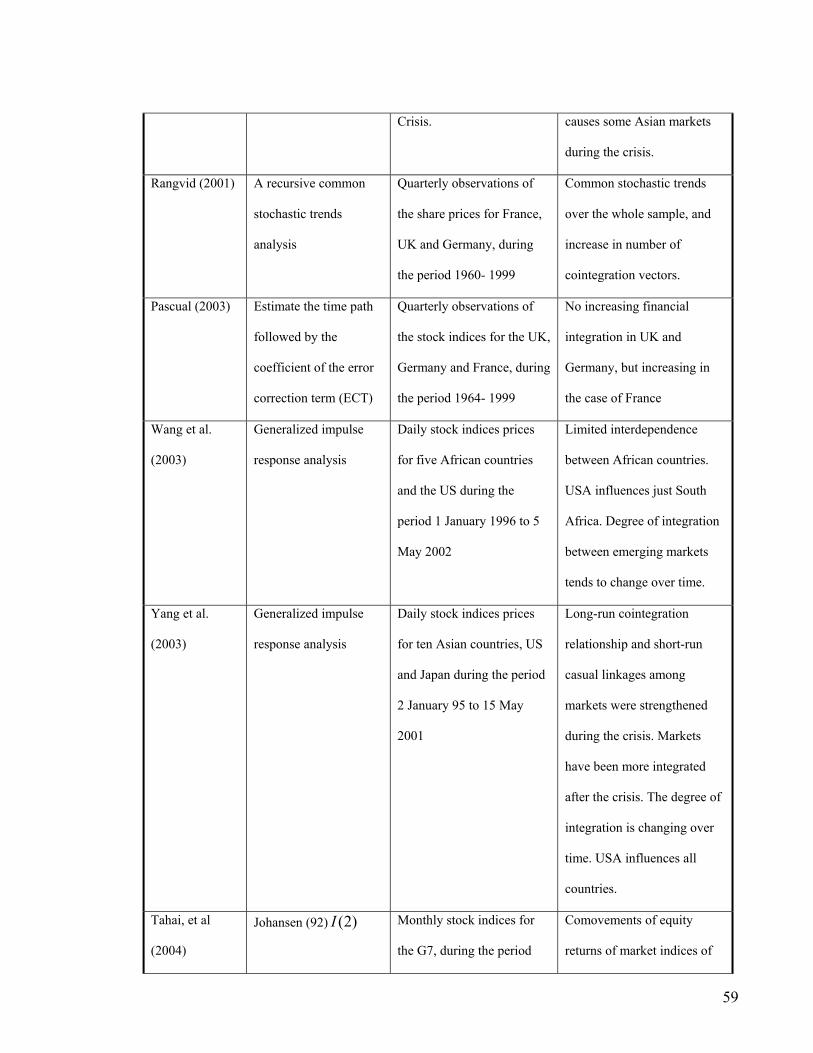
59
Crisis. causes some Asian markets
during the crisis.
Rangvid (2001) A recursive common
stochastic trends
analysis
Quarterly observations of
the share prices for France,
UK and Germany, during
the period 1960- 1999
Common stochastic trends
over the whole sample, and
increase in number of
cointegration vectors.
Pascual (2003) Estimate the time path
followed by the
coefficient of the error
correction term (ECT)
Quarterly observations of
the stock indices for the UK,
Germany and France, during
the period 1964- 1999
No increasing financial
integration in UK and
Germany, but increasing in
the case of France
Wang et al.
(2003)
Generalized impulse
response analysis
Daily stock indices prices
for five African countries
and the US during the
period 1 January 1996 to 5
May 2002
Limited interdependence
between African countries.
USA influences just South
Africa. Degree of integration
between emerging markets
tends to change over time.
Yang et al.
(2003)
Generalized impulse
response analysis
Daily stock indices prices
for ten Asian countries, US
and Japan during the period
2 January 95 to 15 May
2001
Long-run cointegration
relationship and short-run
casual linkages among
markets were strengthened
during the crisis. Markets
have been more integrated
after the crisis. The degree of
integration is changing over
time. USA influences all
countries.
Tahai, et al
(2004)
Johansen (92) )2(I Monthly stock indices for
the G7, during the period
Comovements of equity
returns of market indices of
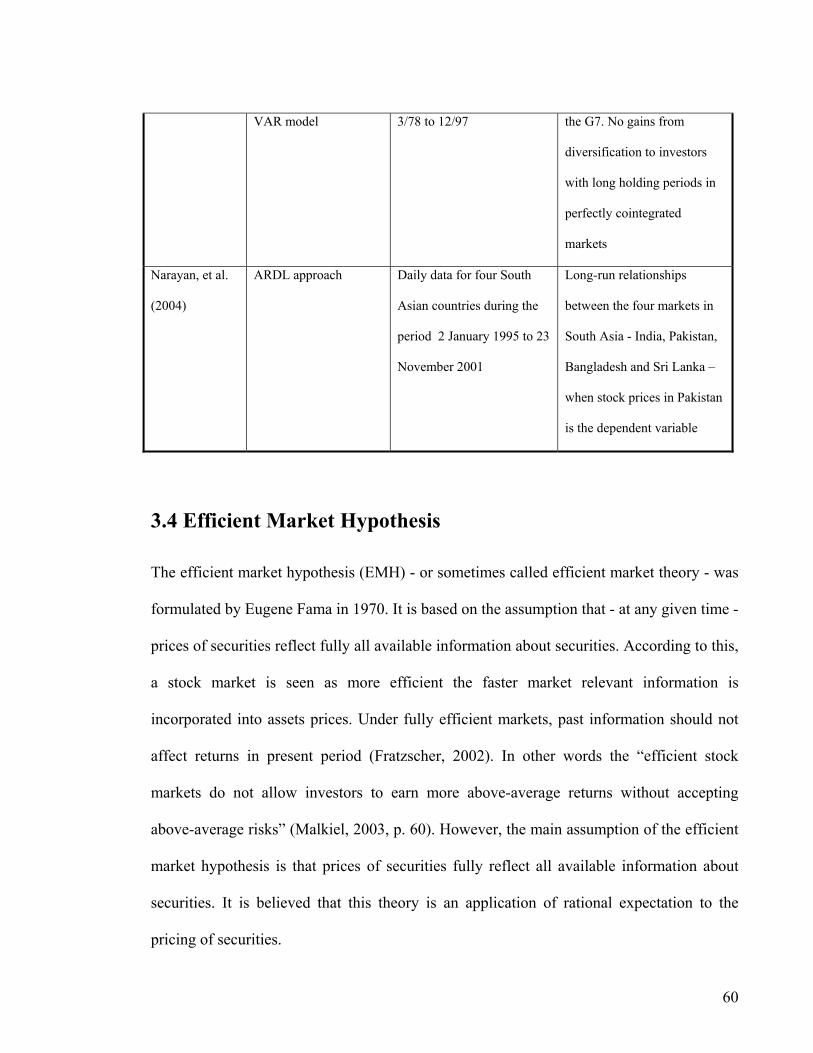
60
VAR model 3/78 to 12/97 the G7. No gains from
diversification to investors
with long holding periods in
perfectly cointegrated
markets
Narayan, et al.
(2004)
ARDL approach Daily data for four South
Asian countries during the
period 2 January 1995 to 23
November 2001
Long-run relationships
between the four markets in
South Asia - India, Pakistan,
Bangladesh and Sri Lanka –
when stock prices in Pakistan
is the dependent variable
3.4 Efficient Market Hypothesis The efficient market hypothesis (EMH) - or sometimes called efficient market theory - was
formulated by Eugene Fama in 1970. It is based on the assumption that - at any given time -
prices of securities reflect fully all available information about securities. According to this,
a stock market is seen as more efficient the faster market relevant information is
incorporated into assets prices. Under fully efficient markets, past information should not
affect returns in present period (Fratzscher, 2002). In other words the “efficient stock
markets do not allow investors to earn more above-average returns without accepting
above-average risks” (Malkiel, 2003, p. 60). However, the main assumption of the efficient
market hypothesis is that prices of securities fully reflect all available information about
securities. It is believed that this theory is an application of rational expectation to the
pricing of securities.
61
Fama (1970, p. 387) suggests sufficient - but not necessary - conditions for market
efficiency. These conditions are. Firstly, no transaction costs in trading securities; secondly
all information is available for free to all market participants; and thirdly, there is universal
agreement on the implications of the current information for current prices and distributions
of future prices of each security. EMH is classified into three categories according to the
notions of what is meant by the term “all available information”:
1- Weak efficient market hypothesis: asserts that all the information contained in the
history of past stock prices are reflected in today’s stock prices. This means that
technical analysis can not be used to obtain systematic gains1.
2- Semi-strong efficient market hypothesis: states that all publicly available relevant
information regarding the firm is fully reflected in the price of the stock, therefore
neither fundamental nor technical analysis can therefore be used by investors to
achieve gains2.
3- Strong efficient market hypothesis: states that all kinds of information, whether
public or private, are fully reflected in the stock prices. Therefore, no information -
even insider information - could give an investor an advantage of achieving gains.
3.4.1 Cointegration and Stock Market Efficiency Based on the previous discussion in the last section, the existence of any profits depends on
having different kinds of relevant information. This could comprise past, publicly or
privately available information. The essence of EMH is that stock prices should follow a
1 Technical analysis is to study past stock price data in an attempt to predict future price (Malkiel, 2003, p.59) 2 Fundamental analysis is the analysis of financial information of the firm to help investors select undervalued stock (Malkiel, 2003, p.59)
62
random walk, where the future price changes should be - for all practical purposes - random
and therefore unpredictable (Mishkin, 1998, p. 173). A consequence of this is that past
movements of the stock price cannot be used to predict future prices movements.
Malkiel (2003, p. 60) states that the logic of the random walk idea is that if the flow
of information is unimpeded and information is immediately reflected in stock prices, then
tomorrow’s prices change will reflect only tomorrow’s news and will be independent of the
price changes today. Thus the random walk hypothesis is associated with weak form of the
efficient market hypothesis, which asserts that all the information contained in the history
of yesterday’s stock prices are reflected in today’s stock prices.
However, the implications of finding cointegration for the efficient market
hypothesis (EMH) are unclear. Different points of views related to this issue have been
introduced over the last two decades. The first comment on the relationship between
cointegration and market efficiency was given by Granger (1986), who stated:
“If tx , ty are a pair of series from jointly efficient speculative markets, they
cannot be cointegrated, if the two prices were cointegrated, one can be
used to help forecast the other and this would contradict the efficient market
assumption” (Granger, 1986, p. 218).
This proposition simplifies that predictable movement in stock prices would provide
evidence of stock market inefficiency because the ability to predict prices would indicate
that all available information was not already included in stock prices. The implication of
this is that stock prices cannot be cointegrated (based on a definition of efficient markets)
as markets in which changes in stock prices is unpredictable (Dwyer and Wallace, 1992).
Moreover, the inefficiency is reflected in the share price residuals measured as the

63
difference between the actual share prices and the share price that would have been in the
absence of new information (Agarwal, 2000).
The relationship between cointegration and market efficiency has been under
investigation by several studies, and controversial results have been provided. Some of
these results emphasize Granger’s theory, others contradict it, whilst some provide with
different explanations for this relationship. This contradiction has made the EMH as one of
the most controversial areas in modern financial economics.
Despite a significant number of studies which have tested and analyzed the efficient
market hypothesis in different stock markets, only few studies have examined the
relationship between cointegration and market efficiency. Baillie and Bollerslev (1989)
conclude that Granger’s result can be interpreted as a violation of weak form efficiency.
Other studies such as McDonald and Taylor (1989), Coleman (1990), Chan and Lai (1993),
Arshanapalli and Doukas (1993), Palac-McMiken (1997) and Chan et al. (1997) indicate
that if stock markets are collectively efficient in the long-run, then stock prices for these
markets are not cointegrated, that means they have no long-run relationship.
In an empirical study of the efficiency and integration of eighteen national stock
markets (developed stock markets in addition to India and Pakistan), Chan et al. 1997,
argue that there is a contradiction between the efficiency of markets and the existence of
cointegration. In another words, if two markets are cointegrated, then they are not efficient
because the weak form of efficient market hypothesis will be violated. Possible arbitrage
profits can be therefore explored. The study examines the weak–form efficient market
hypothesis by using unit root tests of the null hypothesis that stock prices follow a random
walk. Non rejection means the stock market is weak-form efficient. Tests for cointegration
provide some evidence of cointegration between some stock markets. However, many stock
64
markets do not have long-run comovements which positively affect international
diversification.
Palac-McMiken (1997), in a similar study to Chan (1997), uses cointegration
analysis to test for the efficiency of five Asian stock markets. The results indicate that most
of these markets are linked with each other, and are therefore not collectively efficient. In
general, the study argues that if asset (stock) markets are collectively efficient in the long
run, then the prices of these assets are not cointegrated, with no long run relationship.
This point of view has been criticized by several other studies such as Dwyer and
Wallace (1992), Baffes (1994), Engel (1996), Masih and Masih (2001, 2002) and Ahlgren
and Antell (2002). All of these studies indicate that market efficiency does not preclude
cointegration, and because no empirical evidences have confirmed that predictability from
cointegration can lead to arbitrage opportunities, so cointegration does not necessarily
imply market inefficiency. In this context Dwyer and Wallace state that:
“Market efficiency defined as the lack of arbitrage opportunities, there is
no general equivalence between market inefficiency and cointegration or,
for that matter lack of cointegration” (Dwyer and Wallace, 1992, p. 325).
Moreover, Ahlgren and Antell (2002), contradict Granger’s theory, they state that:
“Cointegration does not necessary rule out stock market efficiency, and
that is because market efficiency does not rule out predictable stock returns
but rule out arbitrage opportunities from predictable returns” (Ahlgren and
Antell, 2002, p. 852).
However, it should be recognized that even if some anomalous behavior of stock
prices may exist, it does not create a portfolio trading opportunity that enables investors to
65
earn extraordinary risk adjusted returns (Malkiel, 2003, p 60). Even if EMH might lead to
drastically incorrect interpretations of events, such as major stock market bubbles (Shiller,
2003 p. 101), one should realize that EMH could still have credibility.
According to the relationship between stock markets efficiency, market
liberalization and integration, it is believed that as stock markets become more liberalized
and more integrated, prices should reflect the increased availability of information more
efficiently. Accordingly, the current price of the asset should embody all available
information (Laopodis, 2003).
Another explanation for this relationship has been introduced by Masih and Masih
(2002). The authors contradict Granger’s theory that in the presence of cointegration the
market efficiency hypothesis will be violated, as the predictability of one stock price can be
enhanced significantly by utilizing information on the other stock prices. At the same time,
they question whether predictability necessarily implies market efficiency or not. They state
that:
“Predictability implies nothing necessarily about inefficiency. A market is
inefficient only if by using the predictability one could earn risk-adjusted
excess returns. Therefore, one must be careful in concluding that
cointegration implies anything about market inefficiency or efficiency”
(Masih and Masih, 2002, p. 87).
Following Masih and Masih’s (2002) argument, Narayan et al. (2004) emphasize
that although the gains from international diversification for investors with long holding
periods are limited, investors can still reap arbitrage profits through international
diversification of stocks in the short-run. Even in the case of cointegration, when one can
predict stock prices through utilizing information on the other stock prices, the
66
predictability does not imply any thing about the risk-adjusted excess return. This does not
necessarily tell anything about market efficiency (Narayan, et al., p. 431). So it could be
said that predictability and market efficiency are basically two different themes. Therefore,
one should be careful to imply that cointegration implies efficiency or not.
3.4.2 More Evidences on Stock Markets Efficiency A valuable addition to the literature in this subject is the definition of efficient financial
markets introduced by Malkiel (2003, p. 60). He states that efficient financial markets are
markets which do not allow investors to earn above-average returns and arbitrage
opportunities without accepting above-average risk. Malkiel (2003) argues that despite
some anomalous behavior of stock prices does create portfolio trading opportunities which
enable investors to earn extraordinary risk adjustment return. This means that stock markets
are still efficient even if some interruptions or impediments happen.
Despite some studies have found short-run serial correlations and that the existence
of too many successive moves in the same direction, which means a rejection of the random
walk hypothesis for these markets, Malkiel (2003) opposes these views and defends the
random hypothesis of stock markets. He states that:
“While the stock markets may not be a mathematically perfect random walk,
it is important to distinguish statistical significant from economic
significant. The statistical dependencies giving rise to momentum are
extremely small and are not likely to permit investors to realize excess
returns” (Malkiel, 2003, p. 62)
Moreover, Malkiel (2003) criticizes some studies that argue that if the reaction for
new information, or important news, announcement is only grasped over a period of time,

67
stock prices will exhibit the positive serial correlation found by investors. He shows that the
evidence of efficiency occurring systematically in the stock market is often rather thin (see
Fama (1988) and Fama and French (1998)).
3.4.3 A new Approach for the Relationship between Cointegration and
Efficiency It is well-known that all financial instruments in the integrated stock markets tend to get the
same rate of return if these returns are adjusted for the risk and maturity. This rules out any
chance of arbitrage possibilities between stock markets, and indicates that efficient markets
are perfectly competitive and therefore integrated.
What this study tries to bring out and add to this discussion is that stock markets are
efficient in the long-run because the existence of cointegrated vector implies the law of one
price (LOOP). Therefore little or no arbitrage opportunities or possible benefit can be
achieved from the diversification portfolio from one market to another. Even if some
predictability exists, it does not imply any thing about arbitrage opportunities, however, it
may reflect time varying risk premiums and required rate of return for stock investors rather
than inefficiency (Malkiel, 2003).
So, market efficiency defined as the lack of arbitrage opportunities. Based on this
argument, the existence of cointegration between stock markets implies that there are no
arbitrage opportunities in the long-run. This means that these markets are efficient in the
long-run. Despite “bubbles” sometimes exist in the stock markets; these events happen for a
short period of time and do not last long, so it is less rational to conclude the inefficiency
from this event. However, with the short-run error correction model (ECM), arbitrage

68
opportunities and possible benefits could exist from diversification, as the LOOP may not
hold in the short run.
69
3.5 The Integration of the Emerging Stock Markets in the MENA Region
Numerous amount empirical studies have focused on the integration of developed stock
markets in different parts of the world, especially the US and Europe, and the linkage
between these two main regions and other emerging stock markets in Latin America, South
Asia and Pacific-Basin. However, stock market integration in the MENA region has not
been discussed deeply despite the exceptional economic importance of this region.
The integration among the MENA stock markets is essential because these markets
as a group could offer more investment opportunities that are not possible by each one
individually. Very few empirical studies have examined the integration among the
emerging stock markets in the MENA region. These studies have been conducted over
shorter periods of time and small number of markets (Neaime, 2002). Butler and Malaikah
(1992) examine the behavior of individual stock returns in two stock markets, Saudi Arabia
and Kuwait, over the period 1985-1989. They use serial correlation and run several tests to
evaluate the weak form of efficiency in these two stock markets. The study tries to
investigate the similarities and dissimilarities of these stocks, regarding exchange
mechanisms and efficiency. They conclude that institutional factors contribute to
operational inefficiency in Saudi Arabia stock market. This inefficiency includes trading
delay, illiquidity, market fragmentation and the absence of official markets makers.
Although the study concentrates on these important aspects, it does not investigate the
integration or liberalization issues in these markets.
70
One of the earliest studies that examine stock markets integration among the MENA
countries is by Darrat, et al. (2000). The study estimates the linkages among three emerging
markets in the MENA region; namely, the Cairo (Egypt), Casablanca (Morocco ) , and
Amman (Jordan), and then between them and the US stock market as a world market.
Cointegration techniques and error correction model are employed by the study. The study
uses a time-series cross sectional estimation for the three emerging markets and the US
during the period from October 1996 to August 1999. The study comes to the following
results:
1- It is possible for one market to drift away from other markets in the short-run, but
the Johansen-Juselius cointegration test shows the existence of long-run relationship
between the three MENA markets. In other words, the indices of these markets are
moving together in the long run. These long run comovements - according to the
study - are due to socio-economic or political factors that force all markets to move
together.
2- No significant cointegration has been found between these countries and the US.
This indicates that these markets are segmented from the international market the
(US market). Therefore, it is a good opportunity for investors to target these markets
to get the benefit from international diversification of financial risks.
3- Based on Gonzalo-Granger (1995) test, the results show that the Egyptian market as
the main driving force in the region, so it plays an important role in the financial
stability.
4- The Granger-causality test reveals that short–run causality primary runs from
Jordanian and Egyptian markets to the Moroccan’s market, without feedback.
71
However, the small size of the sample and the short period of time that is covered
are the main weak points in the study. Usually, the Johansen-Juselius approach is valid for
large sample size not for small sample like this sample. Other techniques such as the
autoregressive distributed lag (ARDL) is more robust and performs well for such a sample.
In his study about liberalization and financial integration in a group of stock
markets in the MENA region, namely Bahrain, Egypt, Jordan, Kuwait, Morocco, Saudi
Arabia and Turkey, Neaime (2002) uses Johansen (1991, 1995) efficient maximum
likelihood test to examine the existence of the long-term relationship among the MENA
markets themselves and between the MENA markets and the world markets represented by
the US, UK and French markets. By using weekly data, the study covers the period up to
December 2000, and starts differently according to the availability of data for each country
as follow: Amman, Istanbul since 1990, Morocco since 1992, Saudi Arabia, Egypt since
1993, Bahrain since 1995, Kuwait since 1994 (due to the Gulf war). The MENA markets
are divided into two groups. The first consists of three GCC1 countries: Bahrain, Kuwait,
and Saudi Arabia. The second: the rest of the countries. In order to identify the number of
cointegration vectors, the study uses the following multivariate cointegration test:
∑=
−− +∆++=∆k
itititt PPP
1121 εδββ (3.10)
where tP is a vector of nonstationary variables.
In order to investigate the direction of the relationship between the world main
stock markets and the MENA stock markets, the study employs the Engle and Granger
causality test as follows:
1 GCC related to Gulf Cooperation Council countries, they are oil-producing countries.
72
∑=
−−− +∆+∆++=∆3
1
*12110
mtmtmttt PPECP εαααα (3.11)
where tP represent the MENA index, 1α is the coefficient of the error correction term,
which reflects the adjustment of the dependent variable in the short run to its long-run
position, *tP is the series of the world financial markets. To examine the possibility of a bi-
directional relationship between the MENA index ( tP ) and the series of the world financial
markets ( *tP ), equation 3.11 is re-estimated after switching the place of tP∆ and *
tP∆ as
following:
∑=
−−− +∆+∆++=∆3
1,1
*12110
*
mtmtmttt PPECP εαααα (3.12)
The findings of the study can be summarized as follows:
1- The stock markets of Egypt, Jordan, Morocco and Turkey show a significant level
of cointegration with the world financial markets, which means that these markets
do not offer good opportunities for international investment that are seeking
diversification.
2- The financial integration between the previous markets is still weak.
3- GCC stock markets are integrated with each other, and the results indicate one co-
integrating vector at the 5 per cent significant level.
4- GCC stock markets are segmented from the rest of the world, which means they can
offer diversification potentials to foreign investors.
5- The results of using the Engle and Granger-causality test indicate that there is a
unidirectional effect from the world financial markets to the MENA markets.
73
6- The study indicates that the increase in liberalization between the MENA stock
markets will increase the efficiency of these markets and provide the investors with
a good opportunity to diversify their portfolios and reduce risks. It also mentions
other benefits of liberalizing the MENA stock markets that are reducing the
borrowing costs of local firms and enhancing economic growth.
Based on the previous analysis, Neaime (2002) study is considered more
comprehensive than earlier studies due to the number of countries involved and the period
of time covered. The main criticism of this study is that there is the asymmetry between the
title and the contents. The title includes the concept of liberalization, thereby giving the
indication that there should be a detailed discussion and analysis of this concept. However,
the study just mentions general results without relying on any deeply theoretical or
empirical basis. Moreover, the study indicates that the increase in liberalization will have
positive effect on the efficiency of the markets. However, this study does not mention how
this result has been reached.
Maghyereh (2003) examines the integration among four MENA emerging markets,
namely: Egypt, Jordan, Morocco and Turkey. According to the study, the investigation of
stock markets integration in the same geographical region helps providing evidence
concerning the degree of intra-regional trade and macroeconomic coordination. The study
employed a daily data for the national stock indices of the four markets during the period
from 28 November 1997 to 12 December 2002. In order to capture the dynamic interaction
among these four countries, the study uses a vector autoregression model (VAR), which
takes the following general formula:
∑=
− +Π+=m
stststt vzDz
1
(3.13)
74
The main finding of the study shows weak linkages among the four markets, but
still no market is found to be completely isolated. The Turkish stock market affects all other
markets, because it is relatively bigger than others. The Jordanian stock market is the most
open one, 3.5 per cent of its innovations are explained by other markets, and that indicates a
high degree of openness in comparison to other stock markets. The study suggests that this
weak integration among MEEMs stock markets gives the international and regional
investors many opportunities for portfolio diversification by investing in the MEEMs.
However, the study presents the following suggestions to make these markets more
attractive to the domestic and foreign capital (Maghyereh, 2003, p. 20):
1- Introducing a single region-wide electronic trading system.
2- Developing a uniform investment law and market oriented legal and regulatory
system.
3- Introducing transparent and accessible accounting and taxation treatment.
4- Providing appropriate mechanisms to settle disputes.
By comparing the results of this study with that of Neaime (2002), we notice
similarity regarding the weak linkages between stock markets of Egypt, Jordan, Morocco
and Turkey. However Neaime’s study seems more comprehensive than Maghyereh (2003),
as it includes three other Gulf countries. It also studies the integration not only among the
regional stock markets, but also between the stock markets in the MENA and the world
stock markets. However, the main criticism of Maghyereh (2003) is that it does not
examine the integration between the MENA stock markets and developed markets, as it
concentrates just on the geographical integration. Also, the study covers a short period of
time, which means the conventional cointegration approaches are not appropriate to be
75
used. Other technique such as ARDL is more robust and performs well for short periods
than conventional approaches.
The relationship between capital market liberalization and integration is
investigated by Darrat and Benkato (2003). Specifically, the authors examine the impact of
capital market liberalization on the integration of Istanbul Stock Exchange (ISE) in the
global market represented by the US, UK, Japan and Germany markets. However a more
important focus of the study have been whether and to what extent the removal of capital
controls makes emerging stock markets more integrated in the global market. This
important topic has not been investigated deeply enough. By using data set that covers a
period of more than 14 years, from January 1986 to March 2000, the study employs the
Johansen-Juselius (1990) efficient approach to test cointegration among the five stock
markets, and GARCH approach to measure volatility in stock returns of the five stock
markets. The sample is divided into two sub periods; before and after the removal of capital
controls in July 1989. This timeframe mark the liberalization date. The study incorporates
(0,1) dummy variables in the JJ testing model. It takes the value of one for every month
following the removal of capital controls, and zero otherwise. The results indicate the
following:
1- There is a robust cointegration relationship binding the ISE with the four matured
markets over the full estimated period.
2- There is no cointegration relation linking the ISE with the four matured markets
over the pre-market liberalization period.
3- There is a strong cointegration relation linking the ISE with the four matured
markets over the post-market liberalization period.
76
According to these results, it is clear that stock market liberalization in 1989 has a
substantial and positive impact on the integration between the ISE and matured markets.
Another important result, from the GARCH processes, suggests that ISE has become
considerably less volatile in the post-liberalization period.
It becomes much clearer that stock markets in the MENA region have not been
studied deeply enough, either with regard to the integration among these markets or their
interplay with other markets. More precisely, most of the studies that dealt with integration
among stock markets in the MENA region or between MENA markets and developed
markets have suffer either from shorter periods of time or smaller number of markets.
In contrast to previous studies, this current study will extend the period of the study
and the number of markets either the markets from MENA region or the developed
markets. Moreover, this study will use more recent approaches to test for the integration.
These approaches include testing for the unit root in the presence of structural changes and
the Autoregressive Distributed Lag (ARDL) model to test for the integration. Both of these
models will be discussed in the following chapters.
77
3.6 Conclusion This chapter presents and analyzes the extensive literature relating to stock market
integration in both developed and emerging markets. It covers most various schools of
thoughts that have been developed for measuring stock market integration, focusing on
theoretical background and empirical studies. The use of cointegration approach for
measuring the integration is also discussed through the chapter. Different cointegration
approaches have been employed by several studies for measuring stock market integration.
Numerous studies use the conventional approaches such as Engle-Granger and Johansen
and Juselius, others use the VAR model, and more of recent studies start using the ARDL
approach for the many advantages it has over other conventional approaches.
The relationship between the existence of cointegration between stock markets and
the efficiency of these markets is also reviewed in this chapter. Several studies provide
controversial results about this relationship. A new point of view regarding this issue is
adopted by this current study.
Finally, this chapter sheds more light on the integration of the emerging stock
markets in the MENA region, which has net been discussed deeply enough despite the
exceptional international importance of this region from economic and political
perspectives. Only three studies, discuss the integration among stock markets in the MENA
region. This shortage of studies gives incentive to discuss the stock markets integration in
the MENA region more deeply using recent techniques, including more stock markets and
covering long period of time, and this is what this current study tries to do.
78
Chapter Four
Features and Characteristics of the Emerging Stock
Markets in the MENA Region.
4.1 Introduction There is a growing recognition among all countries in the world regarding the need to
strengthen their economic performance in a suitable manner. This will enable them to
maintain their competitiveness in an extremely harsh international economic
environment. A highly developed financial system promotes efficiency and increases
economic growth. At the same time, macroeconomic stability is crucial for a well
developed financial system (Creane, et. al., 2004, p. 2).
Stock markets are an important part of the overall financial markets, and that is
for the following reasons (Rousseau and Wachtel, 2000):
1. Stock markets provide investors and entrepreneurs with a potential exit
mechanism. Countries with vibrant stock markets are more attractive to
venture capital than countries without stock markets.
2. The existence of stock markets facilitates capital inflow for both foreign
direct investment and portfolio investment. As international portfolio
investments have grown rapidly in recent years, the portfolio managers
have started looking for ways of diversifying their investments.
3. Stock markets provide the much needed liquidity for domestic and
international investors.
79
The emerging stock markets in the MENA region have achieved positive
developments during the last decade despite that they are established recently. They are
experiencing exceptional growth and favourable returns. Market capitalization in these
markets has been boosted by the privatization of public enterprises in most MENA
countries during the 1990’s especially in Egypt, Turkey, Jordan and Morocco. Despite
this development, and in regards to the market indicators, these markets are still far
behind developed stock markets and emerging stock markets in South East Asia and
Latin America.
The objective of this chapter is to outline the specific characteristics of four
main stock markets in the MENA region, namely, Egypt, Turkey, Jordan and Morocco.
These markets will be examined spaning from December 1994 to June 2004. The
discussion will also provide details of the structure and the main indicators of these
markets, such as the market capitalization, trading value, turnover ratio and number of
listed companies1. Moreover, the chapter presents an analytical review for the portfolio
equity flow to the MENA region over the period of the study.
This chapter is organized as follows: Section 2 presents general features of the
MENA region. Section 3 presents an overview of the emerging stock markets in the
MENA region, and is divided into four parts, each part providing an analysis of the
performance of each stock market during the period of study. The stock markets are:
Egypt Stock Exchange, Istanbul Stock Exchange, Amman Stock Exchange and
Casablanca Stock Exchange. The last section concludes the chapter.
1 The turnover ratio is defined as the value traded of shares in a year as a percentage of market capitalization of listed shares on an exchange (http://www.stockriders.com/en/help/glossary.asp).
80
4.2 General Economic Features of the MENA Region
The MENA region covers many countries extending from the Arabian Sea in the east to
the Atlantic Ocean in the west1. Most of these countries share a homogeneous culture,
religion, history and language. The MENA region is exceptionally rich in natural
resources, qualified labour force and has a large GDP and population.
During the last two decades, most countries in the MENA region, in particular
the countries that are considered in this study, have adopted several sound
macroeconomic policies. The reason for these kinds of policies is to achieve a higher
economic growth and to overcome some macroeconomic imbalances in their
economies. These policies include trade liberalization, financial liberalization, openness
to foreign direct investment, implementation of sound economic management and
privatization programs.
In addition to the economic importance of the region, it is playing a very
important role on the international political stage. The political developments in the
region have a marked effect on the international politics. This current study focuses on
the stock markets from four countries in this region namely Egypt, Turkey, Jordan and
Morocco. These markets are based in low and middle-income countries, as defined by
the World Bank. These countries have relatively active stock markets compared to other
markets in the region.
In the following section, a general review of the economic performance of these
countries is presented. Table 4.1 reports the main economic indicators for each country.
Turkey has the biggest economy among all MENA countries used by this study. Its
Gross Domestic Product (GDP) reached $ 257.59 billion in 2003, while the GDP in
1 Region is defined in terms of geography, it covers a continuous geographical land mass or share a common littoral (See El-Erian and Fischer, 1996, p. 2)
81
Egypt reached $ 82.43 billion. Both countries have almost the same population and
share many common features. Jordan is the smallest country amongst the group with a
GDP of $ 9.86 billion in the year 2003 and a population of around 5.47 million. The
GDP in Morocco was $ 43.73 billion in 2003.
The Egyptian economy witnessed macroeconomic imbalances during the
nineties due to fiscal and current account imbalances. Structural adjustment reforms and
an International Monetary Fund (IMF) stabilization program were launched to correct
these imbalances in all economic sectors and to improve the performance of the
economy. These programs include different policies such as privatization, liberalization
and the relaxation of restrictions on foreign investments. These programs have achieved
some success, such as reducing the budget deficit and inflation rates. There have also
been positive effects such as attracting an increased amount of foreign investment.
Despite this positive performance during the nineties, the Egyptian economy
was under enormous pressure during 2000 and 2003. International events including a
global downturn, the September 11 attacks and a sharp drop in oil prices, besides
national and regional events such as a sharp decrease in tourism revenue after Luxor
events1, and the continuing violence and political crisis in the Middle East have all
badly affected the economy by harming exports, foreign direct investments and tourism.
All of these factors together with the excessive spending on national infrastructure have
played a vital role in weakening the performance of the Egyptian economy. By January
2001, the Egyptian Pound devalued by 9.6%. After that, the central bank adopted more
flexible exchange rate policy; it again devaluated the Pound by 6.4% in August 2001
1 Luxor is an ancient city in southern Egypt. Thousands of international tourists visited Luxor each year. On the 17 November 1997 a massacre took place in Luxor when a group of radical Muslims massacred 62 tourists at the attraction. The tourist industry in Egypt was seriously affected by the resultants lump in visitors and remained depressed for at least the following five years. (http://www.wikipedia.org).
82
(The Hong Kong and Shanghai Banking Corporation (HSBC), 2003). The inflation rate,
measured by the CPI, increased from 2.3% in 2001 to 4.5% in 2003. The nominal GDP
decreased from $ 98.48 billions in 2001 to $ 89.85 billion in 2002 and kept decreasing
until reached $ 82.43 billion in 2003.
Regarding the Turkish economy, the most important events that affected its
performance were the Asian and Russian crises during 1997 and 19981, respectively.
Following the Russian crisis, the Turkish economy witnessed a high level of capital
outflow amounting to $ 6.8 billion as well as a reduction in domestic consumption and
external demand. As a result, export declined 4.2% in 1999 (The Central Bank of the
Republic of Turkey, 1999). Moreover, the deficit rose by 3.9 % in 1999, with most of
this deficit being financed by domestic borrowing. The financial and political crises in
November 2000 and February 2001 both had a huge negative impact on the Turkish
economy as real GDP decreased by 7.5%. Following these series of crises, a new
economic program was launched to reduce uncertainty in the financial markets,
complete the structural reform to promote economic efficiency, reduce the
hyperinflation rate, and re-structure the banking sector. However, the attack on the US
on the September 11 had also a negative impact on the Turkish economy. As a result of
these events, the economic program was revised to cover the period 2002-2004. This
program had a positive effect on the economy. During the period of implementing the
program, the Turkish Lira appreciated around 8% in nominal terms. Moreover, receding
uncertainties in the financial markets improved market expectations and the level of
expected inflation. By the end of 2002 the GDP growth rate reached 7.8% (Central
1 For more information on the Asian crisis, see section 3.3. The Russian crisis is a financial crisis started in August 1998. After recording its first year of positive economic growth since the fall of the Soviet Union, Russia experienced a comprehensive macroeconomic collapse, involving its exchange rate, the banking system and public debt. Russia was forced to default on its sovereign debt, devaluate the rouble and declared a suspension of payments by commercial banks to foreign creditors. (http://www.wikipedia.org).
83
Bank of Republic of Turkey, 2002). The year 2003 witnessed an improvement in the
Turkish economy. The nominal GDP rose to $ 240.38 billions in 2003 compared with $
183.89 billions in 2002. The main reasons behind this improvement were the ending of
the Iraqi operation in April 20031, the good performance in fiscal accounts and the
adjustment of the short-term interest rate. During the period 2002-2003, the inflation
rate was also harnessed from 45% to 25.3%. The main factors for this reduction were
the appreciation of the Turkish Lira against foreign currencies, the decline in real
wages, and the improvement in the cost conditions as a result of productivity
improvements (Central Bank of Republic of Turkey, 2003, p. 14).
Jordan has a small open economy. It is highly vulnerable to external shocks and
disturbances in the region. It was affected by the first Iraqi war with more than 300,000
returning Jordanian from the Gulf countries exacerbating unemployment. The high
unemployment ratio strained the government’s ability to provide essential infrastructure
such as education, health and other relevant services (Kanaan and Kardoosh, 2002, p.
10). During the period 1996-1999 economic growth in real terms was lower than
population growth; this had a negative impact on the standard of living. In 2000, the
economic growth in real term reached 4.7% and during this year Jordan also joined the
World Trade Organization (WTO). The September 11, 2001 attacks on the U S had
negative impacts on the Jordanian economy. The fourth quarter of 2001 witnessed a
decline in economic growth; it reached 3.1% compared with 4.65% in the first three
quarters compared to previous quarters. In the year 2002, the macroeconomic indicators
showed improvements in the performance of economic activities. GDP in fixed prices
grew by 4.8% in 2002 compared with 4.2% in 2001. At the same time however, the
1 The invasion of Iraq is known as “Iraqi operation”. This military operation against Iraq began on March 20 by the United States and Britain supplied 98% of the invading forces. The Iraqi Military was defeated and Baghdad fell on April 9, 2003. On May 1, 2003, U.S. President George Bush declared the end of this operation, terminating the Iraqi regime. (http://www.wikipedia.org).
84
external debt increased from (Jordanian Dinar) JD 4743 million in 2001 to JD 5123
million. In the year 2003, real GDP grew by 3.3% compared to 4.8% in 2002. The
mains reasons behind this lacklustre performance are the unfavourable economic and
political developments in the region. The main developments that affected the Jordanian
economy were the continuing increase in oil prices in international markets and the
continuing violence in the West Bank, Gaza and Iraq which had clear negative effects
on the Jordanian exports to both markets.
Morocco’s economic performance during the 1990’s was extremely poor; the
economic growth was less than 2 per annum. The main reason for this low level of
economic growth pertained to the deterioration in the agricultural sector. Morocco’s
economy depends heavily on the agricultural sector, which is normally affected by
severe droughts. This makes Morocco’s economy one of the most weather dependent in
the MENA region. The agricultural sector contributes around 20% of Morocco’s GDP.
Statistics show that almost 50% of Morocco's population depends directly on agriculture
production. Over the long term, Morocco will have to diversify its economy away from
agriculture to develop a more stable economic basis for growth
(http://www.traveldocs.com/ma/economy.htm). A trade agreement with the European
Union was signed in 1996. This agreement pushed for more improvements in the
private sector. The growth rate reached 6.5% in 1998. However, due to drought
conditions and insufficient rainfall, the growth rate fell to around -0.1% in 1999. This
deterioration in economic growth affected other sectors in the economy. In 2001,
favourable rainfall led to economic growth of 6%. Despite this high economic growth,
Morocco needs to improve other sectors in the economy, not just to depend on unstable
agricultural sector. Privatization programs, that took place in Morocco in the year 1993,
increased the capital inflow and thus enhanced the economy with regard to foreign
85
exchange. Morocco reports large foreign exchange inflows from the sale of a mobile
telephone license and partial privatization of the state-owned telecommunications
company. In 2003, real GDP growth reached to 6%, the nominal GDP reaches $ 43.73
billion. The primary economic challenge for Morocco is to accelerate growth in order to
reduce high levels of unemployment and underemployment. While overall
unemployment stands at 11.6%, this figure masks significantly higher urban
unemployment (currently at about 18%) (http://www.state.gov/r/pa/ei/bgn/5431.htm).
86
Table 4.1 Economic Overview of the MENA Countries
Sources: 1. Standards & Poor’s, 2002, Emerging Stock Market Factbook, New York, US 2. Standards & Poor’s, 2002, Global Stock Market Factbook, New York, US. 3. International Monetary Fund, 2004, International Financial Statistics, Yearbook, Washington DC.
87
4.3 An Overview of the Emerging Stock Markets in the MENA Region
The stock markets in the MENA region are considered as emerging markets. The phrase
“emerging market” is defined as a stock market that has started a transition process,
growing in size and the level of sophistication. According to the International Financial
Corporation of the World Bank and to Standard & Poor’s Emerging Markets Database,
a stock market is classified “emerging” if it is located in a low or middle income
“developing country”, and its investable market capitalization is low relative to its gross
domestic product (GDP) per capita. Despite investors’ perceptions of emerging markets
as being dominated by economic, social and political uncertainty, it is essential to
recognize that being classified as emerging market does not imply that these markets are
insignificant; on the contrary, some emerging stock markets are very active on the world
economic stage. A clear example is the emerging stock markets in South East Asian
countries (See Piesse and Hearn, 2002, p. 1711). In this context, Levine (2003)
emphasizes that countries with better financial systems are likely to grow faster than
those with less developed financial and banking sectors.
The emerging stock markets in developing countries and in the MENA region in
particular have improved rapidly in the last decade. Several factors have played vital
role in their improvements. These factors include the achievement of higher economic
growth, monetary stability, stock market reforms, privatisation, financial liberalization
and an institutional framework for investors (Claessens, et al., 2004). However, despite
these improvements in MENA emerging stock markets, some factors still hinder fast
progress and weaken portfolio equity flow to the region, which to some extent
undermines economic growth.
88
4.3.1 Stock Market Liberalization of the Emerging Stock markets in MENA Region
Stock market liberalization is a policy taken by a country’s government that allows
foreign investors to buy domestic shares from local stock market, and domestic
investors to invest in foreign stock markets. It has become a common financial
phenomenon during the last two decades. In fact, stock markets liberalization is
considered to be a main tool in financial liberalization that aims at integrating local
economy into the world economy (see: Bekaert et al, 2003 and Laopodis, 2003).
MENA countries started to liberalize their stock markets during the late eighties
and mid nineties. Table 4.2 reports the date of liberalization and a description of
liberalization for each country. The first country to liberalize its stock market was
Morocco in 1988; it allowed foreign investors to have complete access to the
Casablanca Stock Exchange. In 1989, Turkey also liberalized its stock market by
removing all restrictions for foreign investment. Egypt and Jordan liberalized their stock
markets in 1992 and 1995, respectively.
According to the World Bank (2004, p. 90), portfolio equity investment takes
place when investors purchase shares of a company through an International Public
Offering (IPO), or buy American or Global Depositary Receipts (ADRs or GDRs).
Moreover, venture capital investments and convertible bonds that give investors an
option to convert to equity at a later date are used as vehicles for portfolio equity flows.
89
Table 4.2 Openness of Stock Markets in the MENA Region
* ADR is the American Depositary Receipt. A negotiable certificate issued by a US bank representing a specific number of shares of a foreign stock traded on a US stock exchange. ADRs make it easier for Americans to invest in foreign companies, due to the widespread availability of dollar-denominated price information, lower transition costs, and timely dividend distribution (www.investorwords.com). Sources: Bekaert, et al. (2003) and www.worldbank.org/data.
The portfolio equity inflows to the MENA region have been low during the last
decade. Several reasons play major role for this low level of inflows compared to other
regions. One main reason is the small size of these markets compared with other
emerging markets (such as, China, India, Indonesia and many other markets) as well as
the small size of the market capitalization as a share of GDP. Countries in the MENA
region are prone to macroeconomic shocks and this causes investors in portfolio equity
some concern. Some studies point out that international financial crises have weakened
the global linkage of the emerging stock markets and made them more vulnerable to
external shocks (See Darrat and Benkato, 2003, p. 1090 and Phylaktis 1999).
Also, when talking about emerging stock markets in general and MENA markets
in particular, most portfolio investors are minority shareholders and may fear that they
will find their interests subordinated to these local owners (The World Bank, 2004). On
the other hand, more recent literature asserts that stock market developments depend on
a good legal system, which protects the rights of minority shareholders (Demirguc-Kunt
90
and Levine, 2001). Furthermore, and as has been mentioned previously, political
development in the MENA region has a large impact on the portfolio equity flow1.
Regarding the portfolio equity flow to stock markets in MENA region, table 4.3
shows that Turkey and Morocco received most of the portfolio equity flows during the
period 1994-1996. Egypt received significant flows of the equity portfolio during 1997
and that is as a result of privatization programs. After 1999, portfolio equity continues
to flow to all countries as a result of liberalization and privatization policies taken by
these countries. The reason why the equity inflow increases after the privatization is that
in the initial phases of privatization some shares of the public enterprises are bought by
non-resident investors, and as a result of this, the portfolio equity inflow increases (The
World Bank, 2004). However, in the year 2002 the MENA stock markets witness an
increase in the equity outflow from these markets to other markets. Generally, the
MENA emerging stock markets are still ranked far behind other emerging markets, such
as the East Asia stock markets, in related to portfolio equity flow.
Table 4.3 Portfolio Equity Net Flows to Stock Markets in the MENA Region ($US Million)
Source: The World Bank, Global Development Finance, CD ROM, 2004.
The financial sector in the MENA region is dominated by the commercial banks,
and the nonbank financial sector, which comprises stock market, corporate bond market,
1 The issue of portfolio equity flow will be discussed in details in chapter 6.
91
insurance companies, pension funds, and mutual funds, needs further development
(Creane, et. al., 2004, p. 5). The stock markets in the MENA region are considered
relatively small despite the region containing some of the developing world’s largest
institutional investors in the international bond market (El-Erian and Kumar, 1994, p.
15).
In the following sections, an inclusive review of the four stock markets in the
MENA region will be presented. To ensure comparability and consistency between all
stock markets, the study relies on Emerging Stock Markets Factbook, published by
Standard & Poor’s, for the main stock market indicators, and on Morgan Stanley’s
Capital International (www.msci.com) for the price indices.
92
4.3.2 The Stock Market in Egypt Formal stock market activity in Egypt began in 1888 when the Alexandria Stock
Exchange was established while Cairo Stock Exchange was established in 1903. Cairo
Stock Exchange became one of the most active markets in the world during the 1940’s
until a comprehensive nationalization program started in 1959. Since that date and up
till 1991 trading in the two markets was effectively dormant. In 1992, the government
introduced new legislation to enhance the capital market and to open the markets to
foreign portfolio investment; this legislation is known as the market law No. 95/19921.
This development has a positive impact on the market capitalization (Azab, 2002, p.
27). In December 1993, the two markets were linked electronically to form the Cairo
and Alexandria Stock Exchange (CASE) and screen trading began (HSBC, 2003, p. 6).
The CASE is quasi-government supervised by a securities regulator.
The Egyptian Stock Market has witnessed several improvements in its main
indicators over the last decade. It serves as a good example of a newly emerging stock
market with significant growth potential. Table 4.4 shows that the market capitalization
increased from $4,263 million in 1994 $20,830 million in 1997 and reached $32,838
million in 1999, it then reduced slightly $28,741 million in 2000 and $24,335 million in
2001. However, it increased from $26,338 in 2002 $27,847 in 2003. Figure 4.1 shows
significant increases in market capitalization during the period 1994-1999. The reasons
for this big jump in market capitalization are the liberalization and the privatization
1 The Capital Market Law No. 95/1992 includes the following main points (www.egyptianstocks.com):
1. Establishing an independent Capital Market Authority (CMA) charged with supervising and regulating the securities industries.
2. Establishing a legal framework to govern specialized capital markets companies. 3. Authorizing corporate bonds and eliminating the 7% ceiling. 4. Taxes on income from most stocks and bonds were eliminated. 5. Investors’ rights were strengthened by provisions prohibiting unfair market practices and foreign
investors were given full access to market. 6. Financial disclosure was strengthened. Publicly traded companies were required to follow
international accounting and auditing standard and companies were required to issue semiannual financial statements.
93
programs that were launched during the early nineties. The liberalization of the stock
market in 1992 followed by the first ADR introduction in 1996 opened the door for
foreign portfolio equity to flow into the stock market. In 2004, the market capitalization
has grown by 42.3% compared with 2003. In regards to the market capitalization as a
percentage of GDP, it is found to be very low in a comparison with developed markets
especially in 1994 when it reached 8%. Just in the last two years (2003 and 2004), this
percentage has increased significantly to 33% and 51%, respectively.
Regarding the number of listed companies, it declined from 700 in 1994 to 649
in 1996, and then started increasing from 861 in 1998 to 1,110 by the end of 2001.
Despite the number of listed companies increased to 1150 in 2002, it dropped off to 976
and 792 during 2003 and 2004, respectively.
The trading value increased from $757 million in 1994 to $5,859 million in
1997, despite a reduction by 14% in 1998; it increased to $9,038 million and $11,120
million in 1999 and 2000, respectively. However, the trading value dropped off to a
very low value in 2001, it reached $3,897 million, and kept decreasing in the following
year when it reached $3,278 million. In 2004, the stock market achieved some progress
which is reflected by the increase in the trading value to $5,608. Figure 4.2 shows the
trading value during the period 1994-2004.
The turnover ratio decreased from 18.7% in 1994 to 10.9% in 1995. After the
year 1995 and as a result of several privatization programs during the second half of the
nineties until the end of the year 2000, the CSAE received additional boost. This was
reflected in a significant increase in the turnover ratio, which is considered as an
indicator of the liquidity of the market. It increased from 22.2% to 33.5% in 1996 and
1997, respectively. By the end of the year 2000, it reached 34.7%. However, after this
94
increase in 2000, there was a dramatic drop to 10.2% in 2002. Over the last two years,
2003 and 2004, the turnover ratio increased significantly from 13.7% to 17.3%.
The year 2001, as it is reported in Table 4.3, witnessed a sharp drop in all market
indicators. Many factors caused this abysmal performance. The Egyptian economy was
under enormous pressure during 2000 and 2001. Some factors caused this pressure such
as sharp drop in oil prices, sharp decrease in tourism revenue after the Luxor events, and
the continuing violence and political crisis in the Middle East. All of these factors
played vital role in weakening the performance of the Egyptian economy. By January
2001, the Egyptian Pound had devalued by 9.6%. After that the central bank adopted a
more flexible exchange rate policy; it again devaluated the Pound by 6.4% in August,
2001. All of these events had a negative impact on the Egyptian Stock Market
indicators. At the end of 2000, the Egyptian stock market index dropped by 44%
compared to the beginning of the year, and by 36% in December, 2002 compared to its
performance in January 2001 (www.msci.com).
The Egyptian Stock Market, like other markets in the MENA region, is
dominated by commercial banks. Regarding companies with the largest market
capitalization, the “Commercial Intl. Bank” was in the front with a market capitalization
of $318.87 million at the end of 2001. This was followed by “MobiNil” and “Suez
Cement” with $274.32 million and $246.85 million, respectively
(www.egyptianstocks.com).
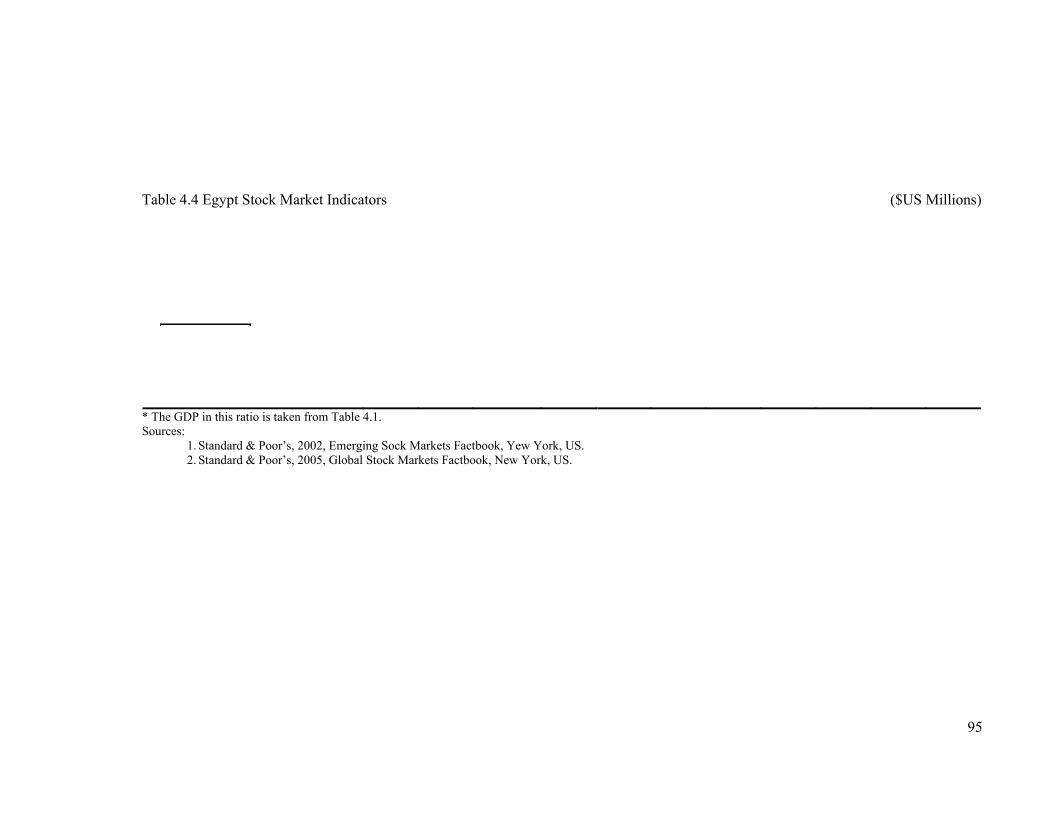
95
Table 4.4 Egypt Stock Market Indicators ($US Millions)
* The GDP in this ratio is taken from Table 4.1. Sources:
1. Standard & Poor’s, 2002, Emerging Sock Markets Factbook, Yew York, US. 2. Standard & Poor’s, 2005, Global Stock Markets Factbook, New York, US.
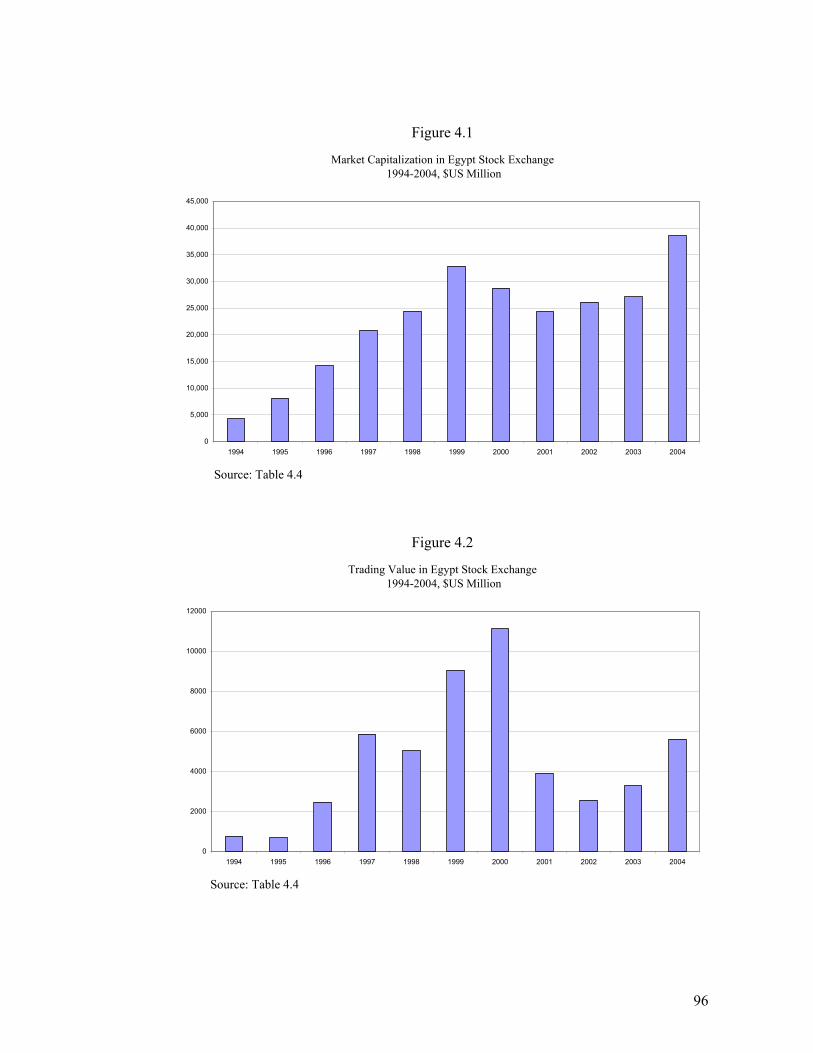
96
Figure 4.1
Market Capitalization in Egypt Stock Exchange 1994-2004, $US Million
0
5,000
10,000
15,000
20,000
25,000
30,000
35,000
40,000
45,000
1994 1995 1996 1997 1998 1999 2000 2001 2002 2003 2004
Source: Table 4.4
Figure 4.2
Trading Value in Egypt Stock Exchange 1994-2004, $US Million
0
2000
4000
6000
8000
10000
12000
1994 1995 1996 1997 1998 1999 2000 2001 2002 2003 2004
Source: Table 4.4
97
4.3.3 The Stock Market in Turkey The origin of the securities market in Turkey goes back to the second half of the 19th
century during the Ottoman Empire. The first securities market was established in 1866
under the name of the Dersaadet Securities Exchange. Since that date, numerous
political and economic events have occurred in Turkey and the region, which affected
all of the economic and financial systems in Turkey.
The Istanbul Stock Exchange (ISE) is the largest stock market in MENA region.
It was established in early 1986. It provides trading in equities, bonds and bills,
revenue-sharing certificates and international securities (www.ise.org). During the last
decade, the ISE has experienced different economic circumstances. They vary from a
cycle of growth to a crisis then a reform, each of these circumstances having a different
impact on the Turkish economy, and in particular on the Istanbul Stock Exchange.
Table 4.5 provides the main market indicators for the Istanbul Stock Exchange.
The ISE is considered as the region’s dominant stock market. The market
capitalization in the ISE is the largest among all stock market in the region; it
significantly increased from $21,605 million in 1994 to $61,090 million in 1997 and
kept increasing until the end of 1999 when it reached $112,716 million. One of the main
reasons for this huge increase in 1999 was the stand-by agreement that Turkey signed
with the IMF. The year 2002 witnessed a sharp decrease in market capitalization as it
reached $33,958 million. However, in the following two years (2003 and 2004) it
increased again to $68,379 million and $98,299 million, respectively. Figure 4.3 shows
market capitalization during the period 1994-2004. The market capitalization as a
percentage of the GDP was below 50% over the whole period. This is considered a low
level in comparison with developed markets. The year 1999 was the exceptional over
98
the whole period, in this year the market capitalization as a percentage of the GDP
reached 79%.
The trading value witnessed some volatility during the last decade; it increased
from $21,692 million in 1994 to $51,392 million in 1995 and despite some reductions in
1996, the trading value kept increasing until 2000. This increase was a reflection of the
optimistic atmosphere following the expectations of Turkey’s candidacy for the
European Union and the stand by agreement with the IMF. The growth rate of the
trading value between the years 2002 and 2004 reached 108.6%, which is already
reflected in the huge increase in the market capitalization during this period. Figure 4.4
shows the trading value for the whole period 1994-2004.
The turnover ratio in the ISE, which is an index of the market liquidity, is the
most active among all stock markets in the region. It increased from 94.2% in 1994 to
226.0% 1995. During 1996 and 1997 it decreased to 133.3% and 113.5% respectively.
Despite improvements in this ratio in 1998, it dropped again to 102.8% in 1999. In 2000
the turnover ratio reached 206.2%, which is a very high level compared with the year
before. Table 4.5 shows that after 1999 and until 2004, the turnover ratio witnessed
some volatility.
An important issue to be mentioned in this context is that in 1999 the ISE index
witnessed the best performance of the last decade; it increased by 119% between
January and July 1999, and increased by 172% between July and December 1999.The
rising continued until early 2000 (www.msci.com).
A main reason for this remarkable positive performance is the signing of several
bilateral protocols and memorandums between ISE and other local and foreign
organizations and stocks exchange markets in the Euro-Asian region during 1998 and
99
19991. Both the Asian financial crisis in 1997, and the Russian crisis in 1998 spread to
Turkey. The economy declined in six out of twelve quarters from 1998 to 2000. In
addition to the economic crises, internal political obstacles in the year 2000 had
negative impact on the economy as a whole and on the financial sector in particular
(www.erf.org.eg). As a result of these two financial crises it appeared that Turkey began
its own economic and financial crisis in 2000. As a result of this uncertainty, investors
in 2000 transferred around $7 billion out of the economy and between January and
August 2000 the ISE index crashed by 19%. In the year 2001 all market indicators
declined significantly, the market capitalization fell to $47,150 million compared with
$69,659 million in 2000. The trading value also crashed to $77,937 million compared
with $179,209 million in 2000, resulting in a 130% reduction in only one year. Different
factors played vital roll in this deterioration. These factors included the ongoing
political tension, and the collapse of the crawling-rate monetary regime, which ended in
60% lira devaluation. The ISE index fell by 63% during 2000. The number of listed
companies has increased from 176 companies in 1994 to 310 in 2001. It is clear that all
stock market indicators declined dramatically during 2001 as a result of the continuing
economic crisis.
1 The following memorandums and protocols have been signed between the Istanbul Stock Exchange and others markets (www.ise.org/about/majordev.htm):
1. In March 1998, a Memorandum of Understanding was signed between ISE and Baku Interbank Currency Exchange.
2. In May 1998, a protocol was signed between ISE and the Organization for Economic Cooperation and Development (OECD) in order to initiate a three-year ‘Securities market Development Program’ with the aim of providing assistance to the development of the securities markets in the Euro-Asian region and financing the relative projects.
3. In December 1998, the ISE signed a Memorandum of Cooperation with Small and Medium Industries Development Organization of Turkey (KOSGEB). Within the framework of this protocol, bilateral work is carried out in order to enable SMEs to offer their stock to the public and derive benefits from the capital market.
4. In June 1999, the ISE signed a Memorandum of Cooperation with London Stock Exchange. 5. In June 1999, the ISE signed a Memorandum of Cooperation with the Istanbul Chamber of
Industry, with an aim to increase the efficiency of capital markets in allocating funds for the Turkish Industry and increase its competitiveness thereof.
6. In June 1999, the ISE signed a Memorandum of Cooperation with the Stock Exchange of Republics of Kazakstan, Kyrgyzstan and Uzbekistan.
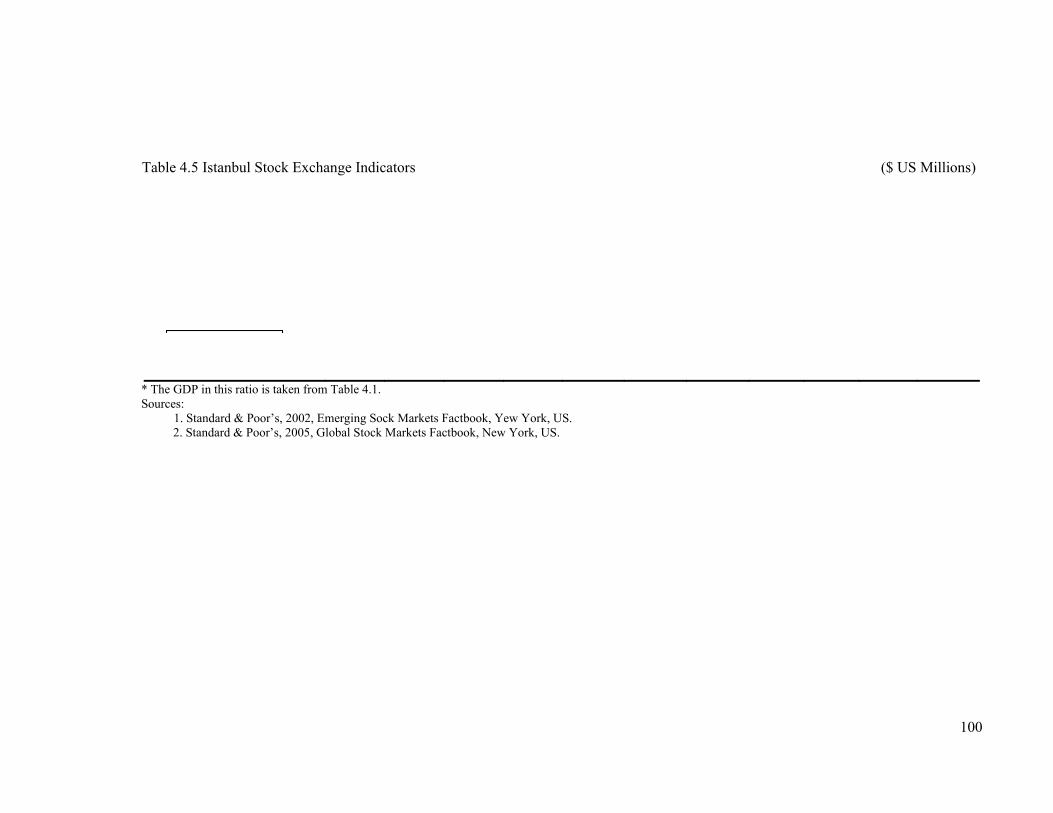
100
Table 4.5 Istanbul Stock Exchange Indicators ($ US Millions)
* The GDP in this ratio is taken from Table 4.1. Sources:
1. Standard & Poor’s, 2002, Emerging Sock Markets Factbook, Yew York, US. 2. Standard & Poor’s, 2005, Global Stock Markets Factbook, New York, US.
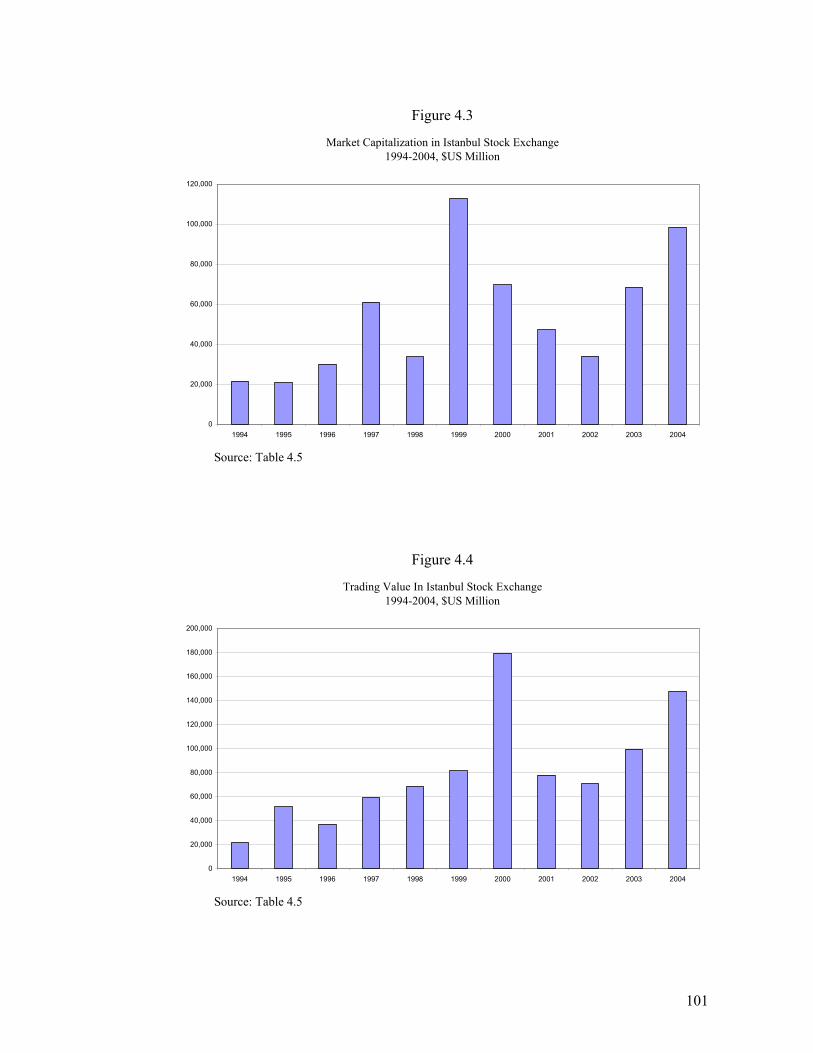
101
Figure 4.3
Market Capitalization in Istanbul Stock Exchange 1994-2004, $US Million
0
20,000
40,000
60,000
80,000
100,000
120,000
1994 1995 1996 1997 1998 1999 2000 2001 2002 2003 2004
Source: Table 4.5
Figure 4.4
Trading Value In Istanbul Stock Exchange 1994-2004, $US Million
0
20,000
40,000
60,000
80,000
100,000
120,000
140,000
160,000
180,000
200,000
1994 1995 1996 1997 1998 1999 2000 2001 2002 2003 2004
Source: Table 4.5
102
4.3.4 The Stock Market in Jordan The Amman Financial Market (AFM) was established in 1976, and started its first day
of business on January the 1st, 1978. It was the only stock exchange in Jordan. The
establishment of the Amman Financial Market was a major step on the path of
developing the financial sector in Jordan. It allowed the country to achieve the best
utilization of available financial resources (Al-Refa’i, 1999, p. 9). The main objectives
of the AFM were the followings (Amman Financial Market, 1976):
1. To mobilize savings by encouraging investments in securities, thereby
channelling savings to serve the interests of the national economy.
2. To regulate and control the issuance of securities and dealings. This is to
ensure the soundness, ease, and speed of transactions in accordance with
the financial interests of the country.
3. To collect statistical data, that is important to achieve market objectives.
The government introduced a modern securities law in June 1997. This law
separated the regularity function from the technical side of the market. However, in
1999, the Amman Financial Market was legally split up to create three capital market
institutions: the Jordan Securities Commission (JSC), the Securities Depository Centre
(SDC), and Amman Stock Exchange (ASE). On March 26, 2000 another significant
change was made, that is the Amman Stock Exchange switched from traditional face-to-
face trading between brokers to an electronic trading system. By instituting this change,
the ASE is one step closer to being a commercial entity controlled by brokers. Due to
these changes the trading system in ASE was able to operate more efficiently and is
now similar to most developed stock markets. It also provides a technical foundation for
future growth and development (Hayter, 2001).
103
Jordan’s stock market has witnessed several improvements in its main
indicators. Table 4.6 shows that the market capitalization increased from $4,594 million
in 1994 to $5,838 million in 1998 and to $6,316 million in 2001. However, in the year
2000 the market capitalization dropped to $4,943 million. The main reasons for this
reduction in performance are the limited in the investor confidence and political
development in the region. Most notable was the deterioration in the peace process and
the acceleration of violence in the Middle East at the end of 2000. These events had a
large negative impact on the ASE activity (Jordan Securities Commission, 2000). The
relaxation of monetary policy by the central bank did not help the market. In the year
2000, 42.5% of total market capitalization was owned by non-Jordanian entities, 8%
was owned by foreign governments and public intuitions and 13% by the Jordanian
government and public institutions (Saket, 2000, p. 50). It was only by the end of 2000
when the ASE began to witness significant improvements. Regarding the companies
with the largest market capitalization, the Arab Bank was still in the front, with a market
capitalization of $2,257.11 million at the end of 2001. The Housing Bank and the
Petroleum Refinery followed with $287.7 million and $107.69 million, respectively. For
the years 2002 and 2003, Figure 4.5 shows that market capitalization increased during
this period. In 2003, the ASE indicators showed remarkable performance not seen since
the establishment of the bourse in 1978. Market capitalization increased by 55% during
2002 and 2003. The upsurge in trading value by 95%, during the same period, reflects a
significant increase in the share price index. This outstanding performance was
concentrated in both the industrial and service sectors (Central Bank of Jordan, 2003). A
main reason for this high level of market capitalization was a significant increase in the
foreign portfolio equity flows, which reached JD 145.2 million in 2003 as compared to
JD 33.4 million in 2002 (Central Bank of Jordan, 2003). The year 2004 witnessed the
104
best performance for the ASE over the whole period (1994-2004). As it is shown in
table 4.6, all market indicators achieved the highest level. The market capitalization as a
percentage of the GDP increased from 76% in 1994 to 111% and 146% by the end of
2003 and 2004, respectively. By reaching to this high level in 2004, the ASE is breaking
the record since the establishment of the market in 1978. This very high rate could
reflect the importance of the stock market in the national economy. Moreover, it could
also reflect the importance of ASE from both regional and international perspectives.
The banking and finance sector leads the market capitalization.
Regarding the price index of the Amman Stock Exchange, during the year 2000,
it decreased from 147.304 in January 2000 to 116.059 in December 2000
(www.msci.com). This is a clear indication of the deterioration of the ASE performance
by the end of the year 2000. In the year 2001, the ASE performance was the strongest in
the Middle East. This is despite a two-week decline following the September 11 attacks.
The fourth quarter in 2001 was the year’s best performance.
The trading value as shown in Figure 4.6 experienced a large fall from $626
million in 1994 to $416 million in 2000 which is a reduction of 50%. But in the year
2000, the trading value in the secondary market, bonds market, the transaction-off-the
trading floor and the investment funds markets increased by 124.3% and reached $933
million. From this $933 million, 24% of the total trading value was by non-Jordanians
and 66% of the non-Jordanian trading value was by non-Arabs (Saket, 2000, p. 50). A
remarkable increase in trading value happened in 2003, when it reached $2,607 million
compared with $1,335 million in 2002. This is equal to a 95% increase in one year. The
significant increase in the foreign portfolio equity flows to the stock market also played
a major role in this increase. However, the year 2004 has witnessed the best
105
performance ever, as the trading value reached $ 5,328 million, which is equivalent to a
104.4% per annum growth.
The turnover ratio, which is an index for the liquidity of the market, varied from
13.0% in 1994 to 6.4% in 1996. In 2000, and as a result of limited investor confidence,
political instability in the neighbouring countries, and weak performance of the
economy, the ASE witnessed a sluggish in terms of trading value and turnover ratio (the
trading value reached $US 416 compared to $US 548 in 1999, also the turnover ratio
reached7.7% compared to 9.4% in 1999. However, the following years witnessed
improvements in all market indicators (see table 4.6). This boom at the ASE is believed
to be attributed to the improvement in the legislative and technical advancement of the
market and the bourse in general. In 2004, and as all other market indicators, turnover
ratio continued increasing as it reached 36.3% which is the highest level over the period
1994-2004.
106
Table 4.6 Amman Stock Exchange Indicators ($US Millions)
* The GDP in this ratio is taken from Table 4.1 Source: 1. Standard & Poor’s, 2002, Emerging Stock Markets Factbook, Yew York, US. 2. Standard & Poor’s, 2005, Global Stock Markets Factbook, New York, US.
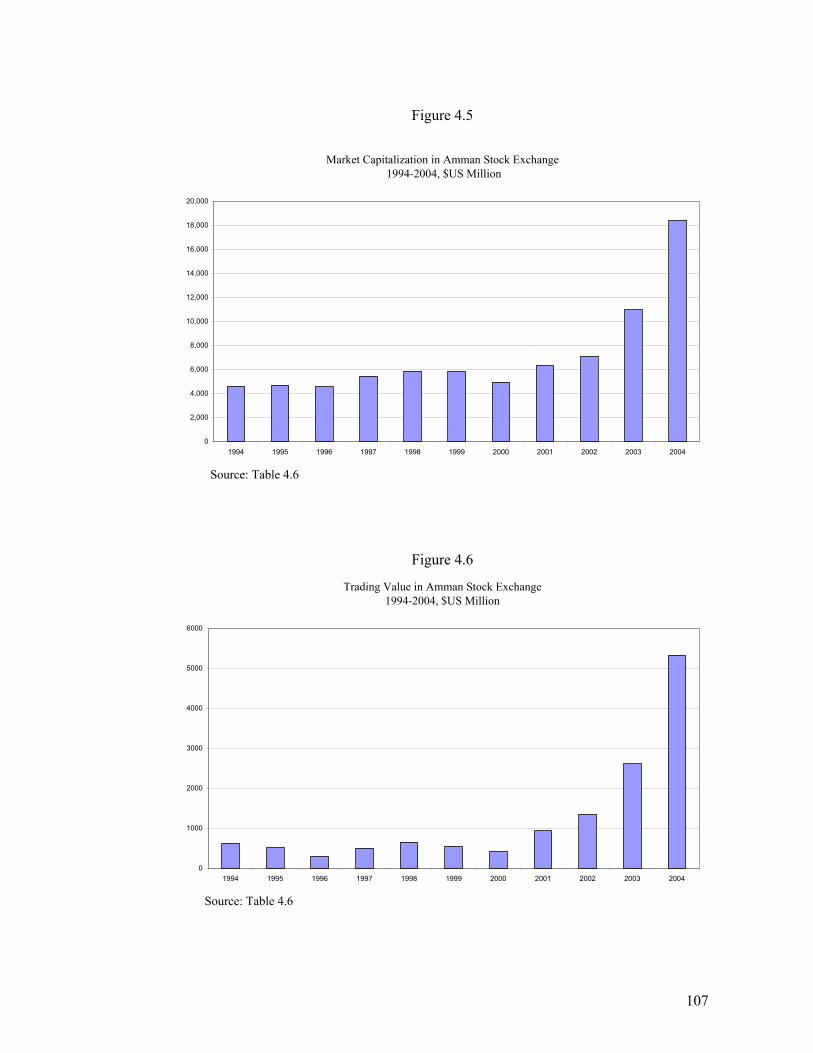
107
Figure 4.5
Market Capitalization in Amman Stock Exchange 1994-2004, $US Million
0
2,000
4,000
6,000
8,000
10,000
12,000
14,000
16,000
18,000
20,000
1994 1995 1996 1997 1998 1999 2000 2001 2002 2003 2004
Source: Table 4.6
Figure 4.6
Trading Value in Amman Stock Exchange 1994-2004, $US Million
0
1000
2000
3000
4000
5000
6000
1994 1995 1996 1997 1998 1999 2000 2001 2002 2003 2004
Source: Table 4.6
108
4.3.5 The Stock Market in Morocco The Casablanca Stock Exchange in Morocco (CSE) was established in 1929, it is the
third oldest stock market in Africa. The CSE was a state institution under the authority
of the Ministry of Finance. The CSE was a broker/dealer market, dominated by the
banking sector. It was characterized by a lack of transparency and small number of
individual investors. The exchange was extremely illiquid as many stocks did not trade
for several weeks (Ghysels and Cherkaoui, 2003).
A major financial reform for the financial sector, simultaneously with the
privatization program, took place in Morocco during 1993. One of the main objectives
of the program was to make fundamental changes in the operations of the stock market.
As a result of this program a dealer/market maker structure was created and a securities
commission was established to ensure shareholder protection and the market maker
became legally and financially autonomous (Ghysels and Cherkaoui, 2003). Also, as a
result of reform there are no restrictions for foreign participation.
Regarding the achievement of the CSE, Table 4.7 reports the main market
indicators over the period 1994-2004. The market capitalization increased consistently
until 1998. It increased from $4,376 million in 1994 to $5,951 million in 1995, and
continued to $12,177 million then $15,676 million during 1997 and 1998 respectively.
The remarkable increase during these five years was mainly because of a massive
privatization program and a positive progress of the financial reform that started in
1993, it was also aided by other political and economic developments. The Asian crisis
in 1997 and the crisis in Russia 1998 both had no effect on CSE. The main reason for
this was the low level of foreign activity during that period. This low level of foreign
activities had a positive effect of shielding the CSE from these crises. Due to a number
109
of taxes imposed during 19981, the performance of CSE was weakened during the
following two years. The market capitalization in 1999 decreased to $13,695 million
compared with $15,676 million in 1998. All market indicators had declined
significantly during the year 2000 and market capitalization reached $10,899. During
2001, the CSE also witnessed a decline in market capitalization and trading value. The
weak performance of the CSE during the last three years, particularly the year 2000,
was a result of different factors. The main factors were the stagnation in 2000 and the
instability in Western Sahara. Both of them caused a reduction in economic growth in
2001 (Standards & Poor’s, 2002, p. 241). After four years (1998-2002) of continuing
reduction in market capitalization and a near collapse in liquidity, the market
capitalization, as it shown in Figure 4.7, reached a remarkable level of $13,152 million
and $25,064 million in 2003 and 2004 respectively. This reflected a return of investor
confidence as portfolio equity flows increased during this period. As a percentage of
GDP, the market capitalization has varied from 14% in 1994 to 30% and 50% by the
end of 2003 and 2004 respectively.
Other market indicators showed an increase in value. The trading value
increased from $788 million in 1994 to $2,426 million in 1995. Despite a reduction of
82% in 1996, the trading value continued increasing for the following three years,
reaching $2,530 million in 1999. As Figure 4.8 shows, the trading value decreased
dramatically over the period 2000 to 2002 as compared with 1999. In 2004, trading
value reached $1,677 million, which is the highest level over the period 1994-2004.
This reflects a return of investor confidence in the stock market.
1 There are three different taxes imposed on the CSE:
1. National solidarity tax levied on all listed companies. 2. Capital gains tax of 10% on individuals and mutual funds, imposed by the Ministry of Finance. 3. A 20% tax on bond funds and a 15% tax on mixed funds.
110
The turnover ratio increased from 22.1% in 1994 to 45.9% in 1995, and sharply
decreased to 5.9% in 1996. During the following three years the average turnover ratio
was 12.6%, which is 0.27 of its value in 1995. During the years 2000, 2002 and 2003,
the turnover ratio witnessed a continuing reduction, while in 2004 it increased to 9.1%.
Regarding the number of listed companies, they did not increase significantly.
The increase was from 51 in 1994 to 55 in 1999. In 2004, this number decreased to 52
companies. In regards to the price index, it increased significantly during (1994-1998).
In December 1994 it increased from 100 to 300.651 in December 1998
(www.msci.com). As a consequence of the factors mentioned previously, (the new taxes
imposed in the CSE, the political instability in Western Sahara and stagnation during
2000), the price index declined to180.078 in December 2001.
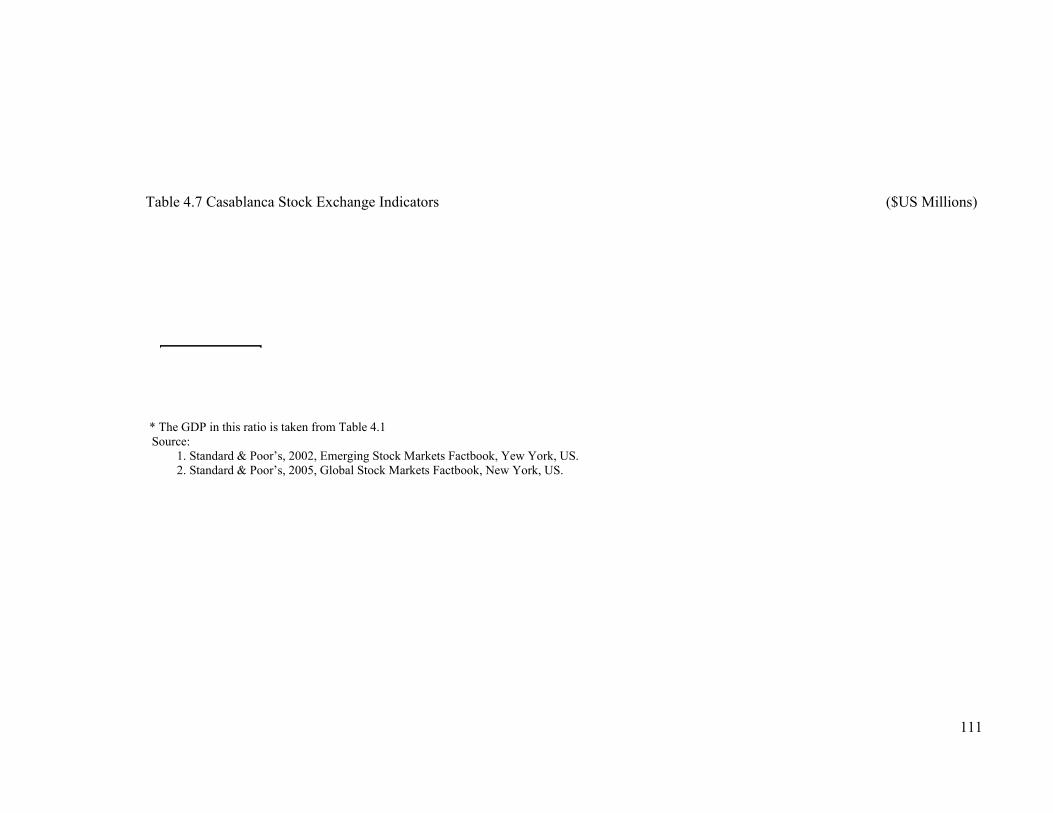
111
Table 4.7 Casablanca Stock Exchange Indicators ($US Millions)
* The GDP in this ratio is taken from Table 4.1 Source:
1. Standard & Poor’s, 2002, Emerging Stock Markets Factbook, Yew York, US. 2. Standard & Poor’s, 2005, Global Stock Markets Factbook, New York, US.
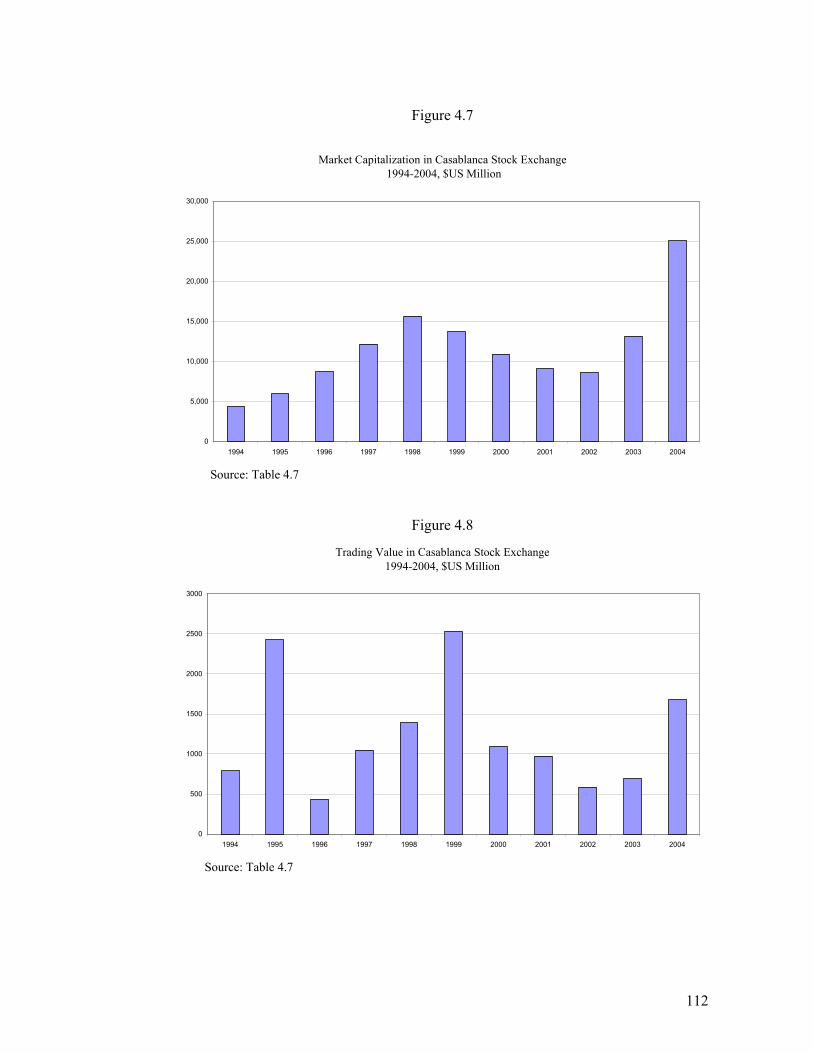
112
Figure 4.7
Market Capitalization in Casablanca Stock Exchange 1994-2004, $US Million
0
5,000
10,000
15,000
20,000
25,000
30,000
1994 1995 1996 1997 1998 1999 2000 2001 2002 2003 2004
Source: Table 4.7
Figure 4.8
Trading Value in Casablanca Stock Exchange 1994-2004, $US Million
0
500
1000
1500
2000
2500
3000
1994 1995 1996 1997 1998 1999 2000 2001 2002 2003 2004
Source: Table 4.7
113
4.4 Conclusion In this chapter, the features of the emerging stock markets in the MENA region are
revised and analysed. These markets include the Egypt Stock Exchange (ESE), Istanbul
Stock Exchange (ISE), Amman Stock Exchange (ASE) and Casablanca Stock Exchange
(CSE). The chapter starts with reviewing the general economic features in these four
small open economies in the MENA region, namely; Egypt, Turkey, Jordan and
Morocco.
The analysis shows that all of these countries witnessed macroeconomic
imbalances during the last decade. These imbalances are due to international and
domestic factors. The international factors are related to the Asian financial crisis in
1997, the Russian crisis in 1998, the drop in oil prices and the September 11 attacks in
2001. The domestic factors are different from one country to another, but the main
factors are the continuing violence and political crisis in the Middle East, the war in
Iraq, and the domestic macroeconomic imbalances in each of these countries.
The emerging stock markets in the MENA region have achieved considerable
improvements in the last decade due to several factors such as the achievement of
higher economic growth, monetary stability, stock markets reforms, privatisation,
financial liberalization and an institutional framework for investors. Most of the stock
markets in the MENA region have been liberalized during the late eighties and nineties.
As a result of this liberalization, foreign investors are allowed to purchase shares
without restrictions.
Regarding the main indicators for the stock markets, the analysis shows that
Turkey has the largest stock market among all other markets in the MENA region. The
market capitalization in the Istanbul Stock Exchange reached $98,299 million in the
year 2004, compared with $38,516 million for Egypt, $18,383 million for Jordan and
114
$25,064 million for Morocco for the same year. The market capitalization as a share of
GDP for all MENA stock markets, except for Jordan, is considered to be low in
comparison with developed markets. This sheds more light on the importance for these
markets to develop its market capitalization by attracting more of the international
equity portfolio flow.
Moreover, over the whole period of study, the turnover ratio indicates that the
Turkish stock market is the most active among all others. In 2004, the turnover ratio for
Turkish stock market reached $147,426 million, while in Egypt it just amounted to
$5,608 million, in Jordan it reached $5,325 million and in Morocco $1,677 million. In
general, this chapter provides a general review for the macroeconomic performance of
the MENA countries, and an inclusive analysis of the performance of the stock markets
in the MENA region over the period 1994-2004.
115
Chapter Five
Structural Changes and Efficiency in the MENA Stock
Markets
5.1 Introduction A significant amount of economic and statistical literature has focused on the unit root
hypothesis when using time series data. It becomes a preliminary procedure to test the
null hypothesis of a unit root against the alternative hypothesis of stationarity. For a
time series, stationarity in this context means that the fundamental form of the data
generating process remains the same over time. The unit root test considered as a
necessary preliminary step in testing for cointegration or causality because these
procedures required the series to be integrated of the same order. Different methods
have been used to test for stationarity; the commonly used methods are the Augmented
Dickey-Fuller (ADF) and Phillips and Perron (PP).
However, Perron (1989) argues that most economic time series are characterized
by stochastic rather than deterministic non stationarity. He shows that many apparent
non-stationarity macroeconomic variables are indeed stationary if one allows for
structural changes in the intercept or trends. When there are structural breaks present,
the Dickey–Fuller statistics are biased towards the non rejection of the existence of a
unit root (Ender, 2004, p. 200).
Two main aims for this chapter, Firstly, to test the unit root hypothesis using
both the conventional unit root tests and the unit root tests in the presence of structural
change at an unknown time of break. Secondly, investigate the efficient market
116
hypothesis in the MENA markets. This chapter is divided into seven sections. Section 2
presents a descriptive analysis of the statistical characteristics of the stock price indices
in the MENA region and selected developed markets. Section3 presents the results of
the ADF and PP unit root tests, with the theoretical background and the procedure of
testing the unit root hypothesis included in Appendix A. Section 4 presents a summary
of testing for stationarity in the presence of structural change. The procedures for
selecting the order of the lag, and endogenously determining the time of the break are
considered. Section 5 tests for the unit root hypothesis in the presence of structural
change. Section 6 analyzes the relationship between the random walk behavior and the
efficiency of the MENA stock markets. The last section concludes the chapter analysis.
5.2 Data and Descriptive Statistics This study employs monthly stock market indices for four major emerging stock
markets in the MENA region, namely Egypt, Turkey, Jordan, and Morocco. As
representative developed markets, the study uses monthly data for the US, UK, and
Germany.
As previously discussed in chapter four, the main indicators show the stock
markets in the MENA region are relatively active when compare them to other
emerging markets. Nevertheless, these markets have not been discussed deeply despite
the exceptional importance of this region and its economies on a world wide level.
The US and UK stock markets are included here because they are among the
largest stock markets in the world and play vital role in their economies. Moreover the
US is the largest economy in the world and all countries from the MENA region
(especially those used by this study) have strong economic relationships with the US.
117
Germany is also included because it is the largest economy in Europe and has a very
strong economic relationship with all countries in the MENA region, especially with
Turkey.
The data is obtained from Morgan Stanley Capital International (MSCI)
(www.msci.com) and covers 115 monthly observations for the period from December
1994 to June 20041. Following Koutmos (1996), Darrat (2003) and Tahai et al. (2004)
all stock prices are expressed in local currencies. Darrat (2003) asserts that
denominating stock prices in local currency incorporates hedging activities of investors
against foreign exchange rates. However, for an inclusive view, this study also
expresses all stock price indices in $US.
Monthly stock prices indices are used to avoid distortions common in weekly
and daily data arising from non-trading and non-synchronous trading. Less frequent
monthly observations provide a clearer picture of movements (see, Hung and Cheung,
1995 and Piesse and Hearn, 2002). Figure 5.1 shows the monthly stock price indices in
three countries from MENA region expressed in local currencies, namely Egypt, Jordan
and morocco2. Figure 5.1 shows that the three markets relatively have similar
movements during the period of study, despite some disturbances. By the mid of
nineties Egypt and Morocco experienced significant increase in their index, while
Jordan experienced modest increase during the period (1996-1997). The stock price
index in Egypt experienced another significant increase in its value during the second
half of 1999. This increase (as mentioned before in chapter four) was a result of several
privatization programs during that period. However, the three markets have also
experienced an increase in their indices during the period (2002-2004).
1 The reason for using data for ten years is because for some markets in the MENA region the data is not available before the December 1994. 2 Turkey is not included in figure 5.1 because the Turkish currency has experienced a large depreciation in its value during the period of study. Technically it could not be drown in the same figure as other countries. For a clear idea see Figures 5.6 and 5.7.
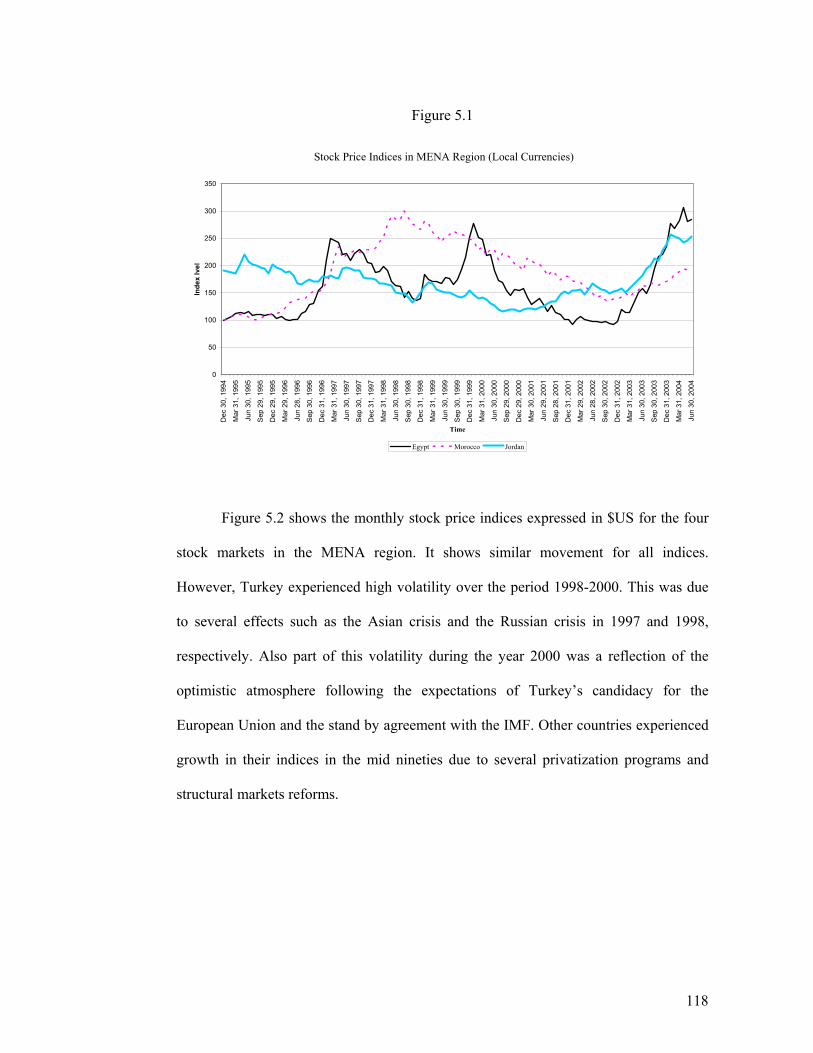
118
Figure 5.1
Stock Price Indices in MENA Region (Local Currencies)
0
50
100
150
200
250
300
350
Dec
30,
199
4
Mar
31,
199
5
Jun
30, 1
995
Sep
29,
199
5
Dec
29,
199
5
Mar
29,
199
6
Jun
28, 1
996
Sep
30,
199
6
Dec
31,
199
6
Mar
31,
199
7
Jun
30, 1
997
Sep
30,
199
7
Dec
31,
199
7
Mar
31,
199
8
Jun
30, 1
998
Sep
30,
199
8
Dec
31,
199
8
Mar
31,
199
9
Jun
30, 1
999
Sep
30,
199
9
Dec
31,
199
9
Mar
31,
200
0
Jun
30, 2
000
Sep
29,
200
0
Dec
29,
200
0
Mar
30,
200
1
Jun
29, 2
001
Sep
28,
200
1
Dec
31,
200
1
Mar
29,
200
2
Jun
28, 2
002
Sep
30,
200
2
Dec
31,
200
2
Mar
31,
200
3
Jun
30, 2
003
Sep
30,
200
3
Dec
31,
200
3
Mar
31,
200
4
Jun
30, 2
004
Time
Inde
x lv
el
Egypt Morocco Jordan
Figure 5.2 shows the monthly stock price indices expressed in $US for the four
stock markets in the MENA region. It shows similar movement for all indices.
However, Turkey experienced high volatility over the period 1998-2000. This was due
to several effects such as the Asian crisis and the Russian crisis in 1997 and 1998,
respectively. Also part of this volatility during the year 2000 was a reflection of the
optimistic atmosphere following the expectations of Turkey’s candidacy for the
European Union and the stand by agreement with the IMF. Other countries experienced
growth in their indices in the mid nineties due to several privatization programs and
structural markets reforms.
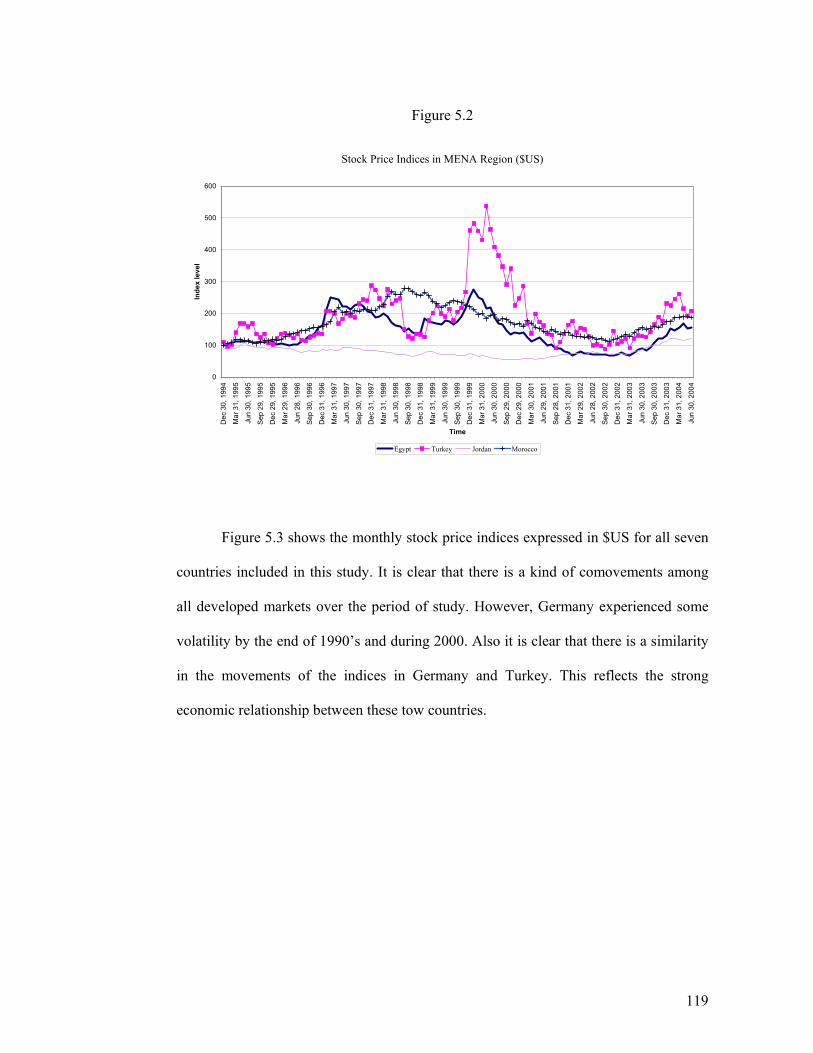
119
Figure 5.2
Stock Price Indices in MENA Region ($US)
0
100
200
300
400
500
600
Dec
30,
199
4
Mar
31,
199
5
Jun
30, 1
995
Sep
29, 1
995
Dec
29,
199
5
Mar
29,
199
6
Jun
28, 1
996
Sep
30, 1
996
Dec
31,
199
6
Mar
31,
199
7
Jun
30, 1
997
Sep
30, 1
997
Dec
31,
199
7
Mar
31,
199
8
Jun
30, 1
998
Sep
30, 1
998
Dec
31,
199
8
Mar
31,
199
9
Jun
30, 1
999
Sep
30, 1
999
Dec
31,
199
9
Mar
31,
200
0
Jun
30, 2
000
Sep
29, 2
000
Dec
29,
200
0
Mar
30,
200
1
Jun
29, 2
001
Sep
28, 2
001
Dec
31,
200
1
Mar
29,
200
2
Jun
28, 2
002
Sep
30, 2
002
Dec
31,
200
2
Mar
31,
200
3
Jun
30, 2
003
Sep
30, 2
003
Dec
31,
200
3
Mar
31,
200
4
Jun
30, 2
004
Time
Inde
x le
vel
Egypt Turkey Jordan Morocco
Figure 5.3 shows the monthly stock price indices expressed in $US for all seven
countries included in this study. It is clear that there is a kind of comovements among
all developed markets over the period of study. However, Germany experienced some
volatility by the end of 1990’s and during 2000. Also it is clear that there is a similarity
in the movements of the indices in Germany and Turkey. This reflects the strong
economic relationship between these tow countries.
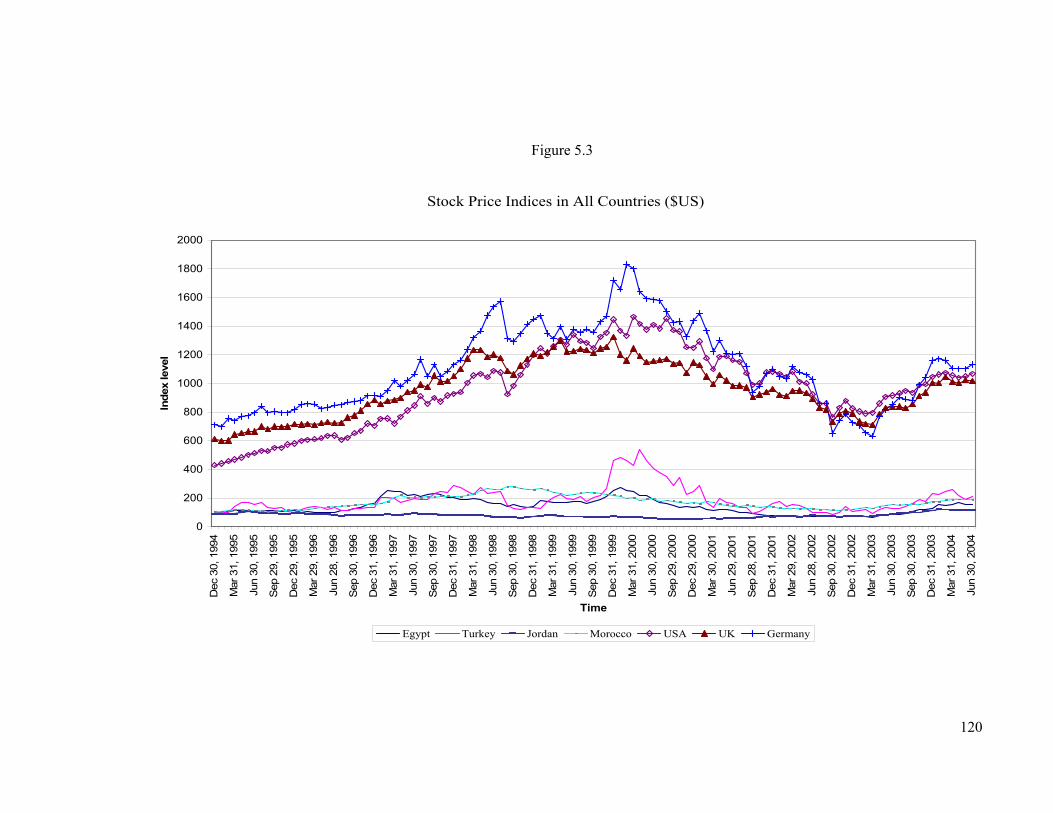
120
Figure 5.3
Stock Price Indices in All Countries ($US)
0
200
400
600
800
1000
1200
1400
1600
1800
2000
Dec
30,
199
4
Mar
31,
199
5
Jun
30, 1
995
Sep
29,
199
5
Dec
29,
199
5
Mar
29,
199
6
Jun
28, 1
996
Sep
30,
199
6
Dec
31,
199
6
Mar
31,
199
7
Jun
30, 1
997
Sep
30,
199
7
Dec
31,
199
7
Mar
31,
199
8
Jun
30, 1
998
Sep
30,
199
8
Dec
31,
199
8
Mar
31,
199
9
Jun
30, 1
999
Sep
30,
199
9
Dec
31,
199
9
Mar
31,
200
0
Jun
30, 2
000
Sep
29,
200
0
Dec
29,
200
0
Mar
30,
200
1
Jun
29, 2
001
Sep
28,
200
1
Dec
31,
200
1
Mar
29,
200
2
Jun
28, 2
002
Sep
30,
200
2
Dec
31,
200
2
Mar
31,
200
3
Jun
30, 2
003
Sep
30,
200
3
Dec
31,
200
3
Mar
31,
200
4
Jun
30, 2
004
Time
Inde
x le
vel
Egypt Turkey Jordan Morocco USA UK Germany
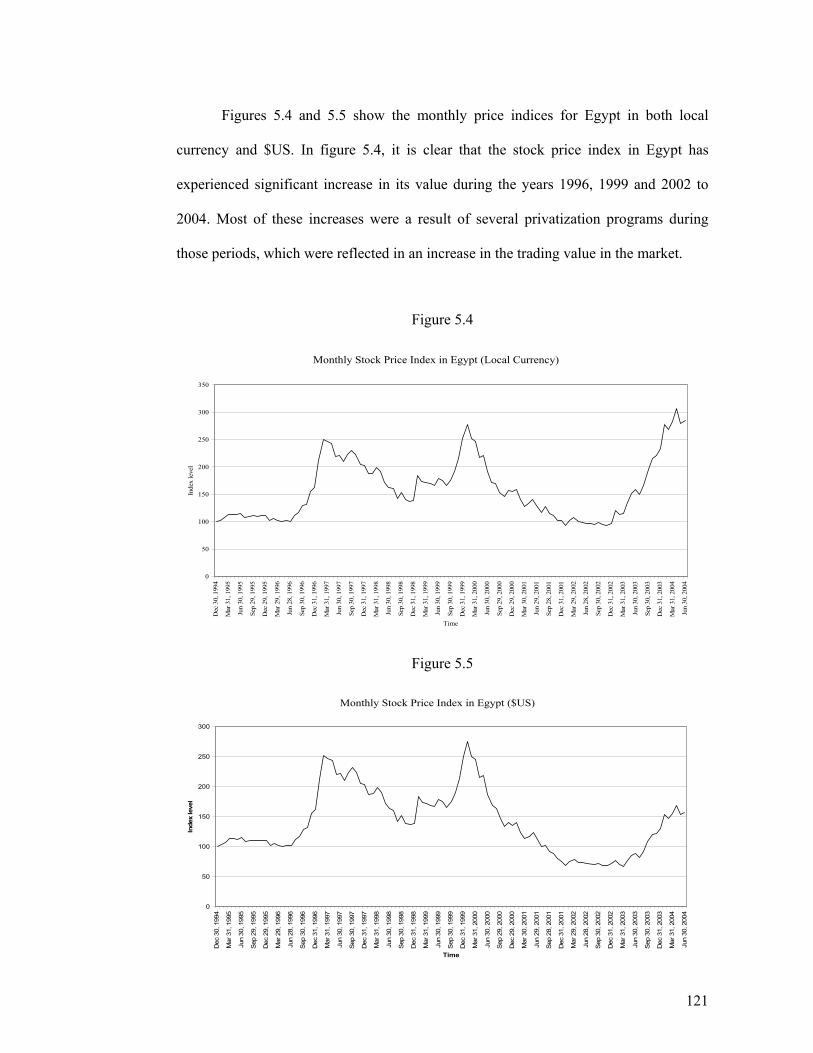
121
Figures 5.4 and 5.5 show the monthly price indices for Egypt in both local
currency and $US. In figure 5.4, it is clear that the stock price index in Egypt has
experienced significant increase in its value during the years 1996, 1999 and 2002 to
2004. Most of these increases were a result of several privatization programs during
those periods, which were reflected in an increase in the trading value in the market.
Figure 5.4
Monthly Stock Price Index in Egypt (Local Currency)
0
50
100
150
200
250
300
350
Dec
30,
199
4
Mar
31,
199
5
Jun
30, 1
995
Sep
29, 1
995
Dec
29,
199
5
Mar
29,
199
6
Jun
28, 1
996
Sep
30, 1
996
Dec
31,
199
6
Mar
31,
199
7
Jun
30, 1
997
Sep
30, 1
997
Dec
31,
199
7
Mar
31,
199
8
Jun
30, 1
998
Sep
30, 1
998
Dec
31,
199
8
Mar
31,
199
9
Jun
30, 1
999
Sep
30, 1
999
Dec
31,
199
9
Mar
31,
200
0
Jun
30, 2
000
Sep
29, 2
000
Dec
29,
200
0
Mar
30,
200
1
Jun
29, 2
001
Sep
28, 2
001
Dec
31,
200
1
Mar
29,
200
2
Jun
28, 2
002
Sep
30, 2
002
Dec
31,
200
2
Mar
31,
200
3
Jun
30, 2
003
Sep
30, 2
003
Dec
31,
200
3
Mar
31,
200
4
Jun
30, 2
004
Time
Inde
x le
vel
Figure 5.5
Monthly Stock Price Index in Egypt ($US)
0
50
100
150
200
250
300
Dec
30,
199
4
Mar
31,
199
5
Jun
30, 1
995
Sep
29, 1
995
Dec
29,
199
5
Mar
29,
199
6
Jun
28, 1
996
Sep
30, 1
996
Dec
31,
199
6
Mar
31,
199
7
Jun
30, 1
997
Sep
30, 1
997
Dec
31,
199
7
Mar
31,
199
8
Jun
30, 1
998
Sep
30, 1
998
Dec
31,
199
8
Mar
31,
199
9
Jun
30, 1
999
Sep
30, 1
999
Dec
31,
199
9
Mar
31,
200
0
Jun
30, 2
000
Sep
29, 2
000
Dec
29,
200
0
Mar
30,
200
1
Jun
29, 2
001
Sep
28, 2
001
Dec
31,
200
1
Mar
29,
200
2
Jun
28, 2
002
Sep
30, 2
002
Dec
31,
200
2
Mar
31,
200
3
Jun
30, 2
003
Sep
30, 2
003
Dec
31,
200
3
Mar
31,
200
4
Jun
30, 2
004
Time
Inde
x le
vel
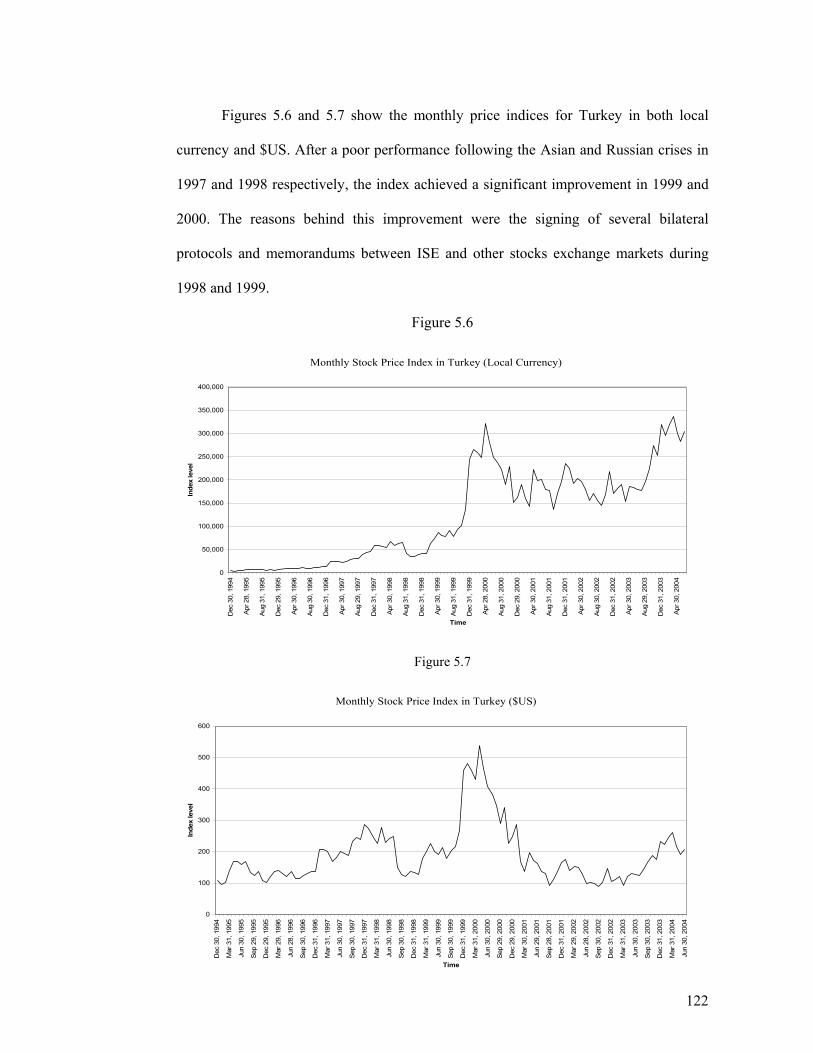
122
Figures 5.6 and 5.7 show the monthly price indices for Turkey in both local
currency and $US. After a poor performance following the Asian and Russian crises in
1997 and 1998 respectively, the index achieved a significant improvement in 1999 and
2000. The reasons behind this improvement were the signing of several bilateral
protocols and memorandums between ISE and other stocks exchange markets during
1998 and 1999.
Figure 5.6
Monthly Stock Price Index in Turkey (Local Currency)
0
50,000
100,000
150,000
200,000
250,000
300,000
350,000
400,000
Dec
30,
199
4
Apr 2
8, 1
995
Aug
31,
199
5
Dec
29,
199
5
Apr 3
0, 1
996
Aug
30,
199
6
Dec
31,
199
6
Apr 3
0, 1
997
Aug
29,
199
7
Dec
31,
199
7
Apr 3
0, 1
998
Aug
31,
199
8
Dec
31,
199
8
Apr 3
0, 1
999
Aug
31,
199
9
Dec
31,
199
9
Apr 2
8, 2
000
Aug
31,
200
0
Dec
29,
200
0
Apr 3
0, 2
001
Aug
31,
200
1
Dec
31,
200
1
Apr 3
0, 2
002
Aug
30,
200
2
Dec
31,
200
2
Apr 3
0, 2
003
Aug
29,
200
3
Dec
31,
200
3
Apr 3
0, 2
004
Time
Inde
x le
vel
Figure 5.7
Monthly Stock Price Index in Turkey ($US)
0
100
200
300
400
500
600
Dec
30,
199
4
Mar
31,
199
5
Jun
30, 1
995
Sep
29,
199
5
Dec
29,
199
5
Mar
29,
199
6
Jun
28, 1
996
Sep
30,
199
6
Dec
31,
199
6
Mar
31,
199
7
Jun
30, 1
997
Sep
30,
199
7
Dec
31,
199
7
Mar
31,
199
8
Jun
30, 1
998
Sep
30,
199
8
Dec
31,
199
8
Mar
31,
199
9
Jun
30, 1
999
Sep
30,
199
9
Dec
31,
199
9
Mar
31,
200
0
Jun
30, 2
000
Sep
29,
200
0
Dec
29,
200
0
Mar
30,
200
1
Jun
29, 2
001
Sep
28,
200
1
Dec
31,
200
1
Mar
29,
200
2
Jun
28, 2
002
Sep
30,
200
2
Dec
31,
200
2
Mar
31,
200
3
Jun
30, 2
003
Sep
30,
200
3
Dec
31,
200
3
Mar
31,
200
4
Jun
30, 2
004
Time
Inde
x le
vel
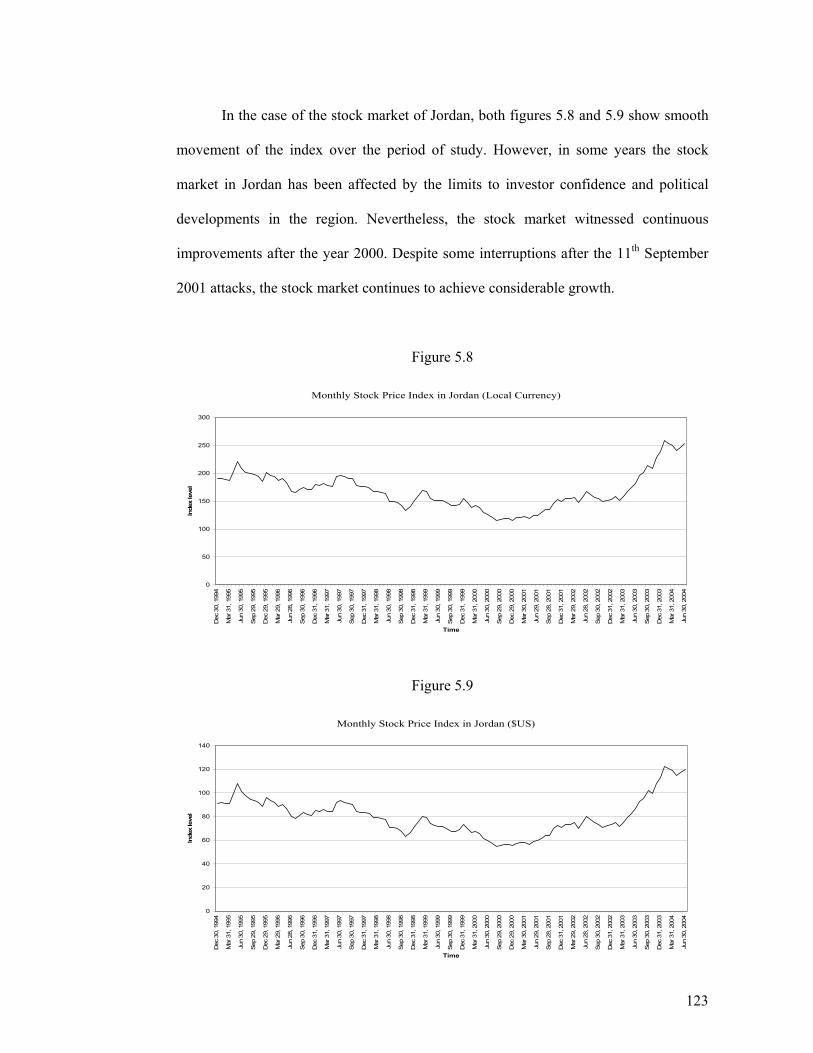
123
In the case of the stock market of Jordan, both figures 5.8 and 5.9 show smooth
movement of the index over the period of study. However, in some years the stock
market in Jordan has been affected by the limits to investor confidence and political
developments in the region. Nevertheless, the stock market witnessed continuous
improvements after the year 2000. Despite some interruptions after the 11th September
2001 attacks, the stock market continues to achieve considerable growth.
Figure 5.8
Monthly Stock Price Index in Jordan (Local Currency)
0
50
100
150
200
250
300
Dec
30,
199
4
Mar
31,
199
5
Jun
30, 1
995
Sep
29,
199
5
Dec
29,
199
5
Mar
29,
199
6
Jun
28, 1
996
Sep
30,
199
6
Dec
31,
199
6
Mar
31,
199
7
Jun
30, 1
997
Sep
30,
199
7
Dec
31,
199
7
Mar
31,
199
8
Jun
30, 1
998
Sep
30,
199
8
Dec
31,
199
8
Mar
31,
199
9
Jun
30, 1
999
Sep
30,
199
9
Dec
31,
199
9
Mar
31,
200
0
Jun
30, 2
000
Sep
29,
200
0
Dec
29,
200
0
Mar
30,
200
1
Jun
29, 2
001
Sep
28,
200
1
Dec
31,
200
1
Mar
29,
200
2
Jun
28, 2
002
Sep
30,
200
2
Dec
31,
200
2
Mar
31,
200
3
Jun
30, 2
003
Sep
30,
200
3
Dec
31,
200
3
Mar
31,
200
4
Jun
30, 2
004
Time
Inde
x le
vel
Figure 5.9
Monthly Stock Price Index in Jordan ($US)
0
20
40
60
80
100
120
140
Dec
30,
199
4
Mar
31,
199
5
Jun
30, 1
995
Sep
29, 1
995
Dec
29,
199
5
Mar
29,
199
6
Jun
28, 1
996
Sep
30, 1
996
Dec
31,
199
6
Mar
31,
199
7
Jun
30, 1
997
Sep
30, 1
997
Dec
31,
199
7
Mar
31,
199
8
Jun
30, 1
998
Sep
30, 1
998
Dec
31,
199
8
Mar
31,
199
9
Jun
30, 1
999
Sep
30, 1
999
Dec
31,
199
9
Mar
31,
200
0
Jun
30, 2
000
Sep
29, 2
000
Dec
29,
200
0
Mar
30,
200
1
Jun
29, 2
001
Sep
28, 2
001
Dec
31,
200
1
Mar
29,
200
2
Jun
28, 2
002
Sep
30, 2
002
Dec
31,
200
2
Mar
31,
200
3
Jun
30, 2
003
Sep
30, 2
003
Dec
31,
200
3
Mar
31,
200
4
Jun
30, 2
004
Time
Inde
x le
vel
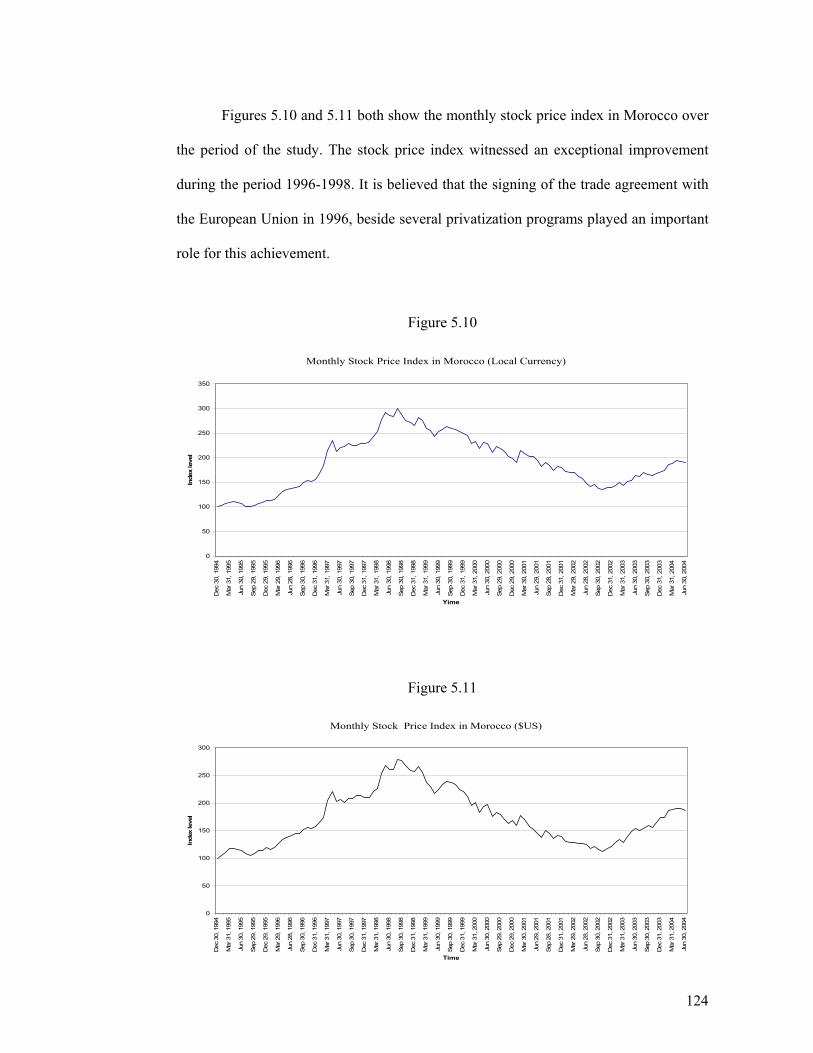
124
Figures 5.10 and 5.11 both show the monthly stock price index in Morocco over
the period of the study. The stock price index witnessed an exceptional improvement
during the period 1996-1998. It is believed that the signing of the trade agreement with
the European Union in 1996, beside several privatization programs played an important
role for this achievement.
Figure 5.10
Monthly Stock Price Index in Morocco (Local Currency)
0
50
100
150
200
250
300
350
Dec
30,
199
4
Mar
31,
199
5
Jun
30, 1
995
Sep
29, 1
995
Dec
29,
199
5
Mar
29,
199
6
Jun
28, 1
996
Sep
30, 1
996
Dec
31,
199
6
Mar
31,
199
7
Jun
30, 1
997
Sep
30, 1
997
Dec
31,
199
7
Mar
31,
199
8
Jun
30, 1
998
Sep
30, 1
998
Dec
31,
199
8
Mar
31,
199
9
Jun
30, 1
999
Sep
30, 1
999
Dec
31,
199
9
Mar
31,
200
0
Jun
30, 2
000
Sep
29, 2
000
Dec
29,
200
0
Mar
30,
200
1
Jun
29, 2
001
Sep
28, 2
001
Dec
31,
200
1
Mar
29,
200
2
Jun
28, 2
002
Sep
30, 2
002
Dec
31,
200
2
Mar
31,
200
3
Jun
30, 2
003
Sep
30, 2
003
Dec
31,
200
3
Mar
31,
200
4
Jun
30, 2
004
Yime
Inde
x le
vel
Figure 5.11
Monthly Stock Price Index in Morocco ($US)
0
50
100
150
200
250
300
Dec
30,
199
4
Mar
31,
199
5
Jun
30, 1
995
Sep
29, 1
995
Dec
29,
199
5
Mar
29,
199
6
Jun
28, 1
996
Sep
30, 1
996
Dec
31,
199
6
Mar
31,
199
7
Jun
30, 1
997
Sep
30, 1
997
Dec
31,
199
7
Mar
31,
199
8
Jun
30, 1
998
Sep
30, 1
998
Dec
31,
199
8
Mar
31,
199
9
Jun
30, 1
999
Sep
30, 1
999
Dec
31,
199
9
Mar
31,
200
0
Jun
30, 2
000
Sep
29, 2
000
Dec
29,
200
0
Mar
30,
200
1
Jun
29, 2
001
Sep
28, 2
001
Dec
31,
200
1
Mar
29,
200
2
Jun
28, 2
002
Sep
30, 2
002
Dec
31,
200
2
Mar
31,
200
3
Jun
30, 2
003
Sep
30, 2
003
Dec
31,
200
3
Mar
31,
200
4
Jun
30, 2
004
Time
Inde
x le
vel
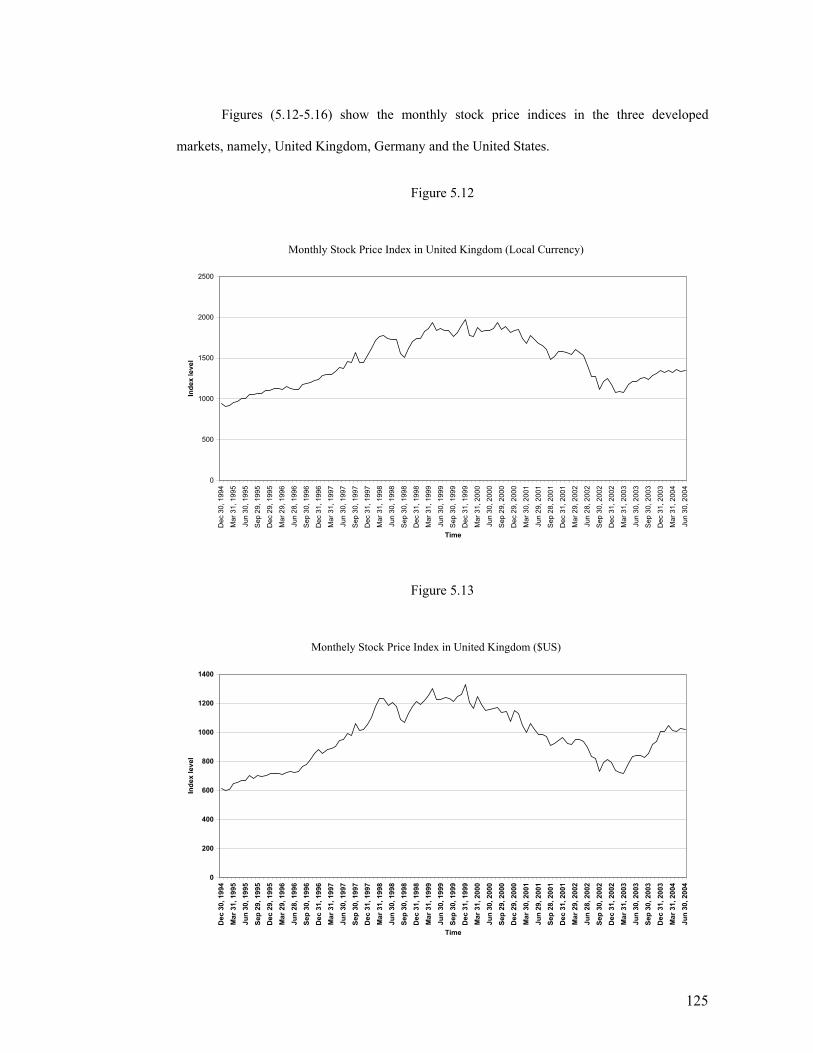
125
Figures (5.12-5.16) show the monthly stock price indices in the three developed
markets, namely, United Kingdom, Germany and the United States.
Figure 5.12
Monthly Stock Price Index in United Kingdom (Local Currency)
0
500
1000
1500
2000
2500
Dec
30,
199
4
Mar
31,
199
5
Jun
30, 1
995
Sep
29,
199
5
Dec
29,
199
5
Mar
29,
199
6
Jun
28, 1
996
Sep
30,
199
6
Dec
31,
199
6
Mar
31,
199
7
Jun
30, 1
997
Sep
30,
199
7
Dec
31,
199
7
Mar
31,
199
8
Jun
30, 1
998
Sep
30,
199
8
Dec
31,
199
8
Mar
31,
199
9
Jun
30, 1
999
Sep
30,
199
9
Dec
31,
199
9
Mar
31,
200
0
Jun
30, 2
000
Sep
29,
200
0
Dec
29,
200
0
Mar
30,
200
1
Jun
29, 2
001
Sep
28,
200
1
Dec
31,
200
1
Mar
29,
200
2
Jun
28, 2
002
Sep
30,
200
2
Dec
31,
200
2
Mar
31,
200
3
Jun
30, 2
003
Sep
30,
200
3
Dec
31,
200
3
Mar
31,
200
4
Jun
30, 2
004
Time
Inde
x le
vel
Figure 5.13
Monthely Stock Price Index in United Kingdom ($US)
0
200
400
600
800
1000
1200
1400
Dec
30,
199
4M
ar 3
1, 1
995
Jun
30, 1
995
Sep
29, 1
995
Dec
29,
199
5M
ar 2
9, 1
996
Jun
28, 1
996
Sep
30, 1
996
Dec
31,
199
6M
ar 3
1, 1
997
Jun
30, 1
997
Sep
30, 1
997
Dec
31,
199
7M
ar 3
1, 1
998
Jun
30, 1
998
Sep
30, 1
998
Dec
31,
199
8M
ar 3
1, 1
999
Jun
30, 1
999
Sep
30, 1
999
Dec
31,
199
9M
ar 3
1, 2
000
Jun
30, 2
000
Sep
29, 2
000
Dec
29,
200
0M
ar 3
0, 2
001
Jun
29, 2
001
Sep
28, 2
001
Dec
31,
200
1M
ar 2
9, 2
002
Jun
28, 2
002
Sep
30, 2
002
Dec
31,
200
2M
ar 3
1, 2
003
Jun
30, 2
003
Sep
30, 2
003
Dec
31,
200
3M
ar 3
1, 2
004
Jun
30, 2
004
Time
Inde
x le
vel
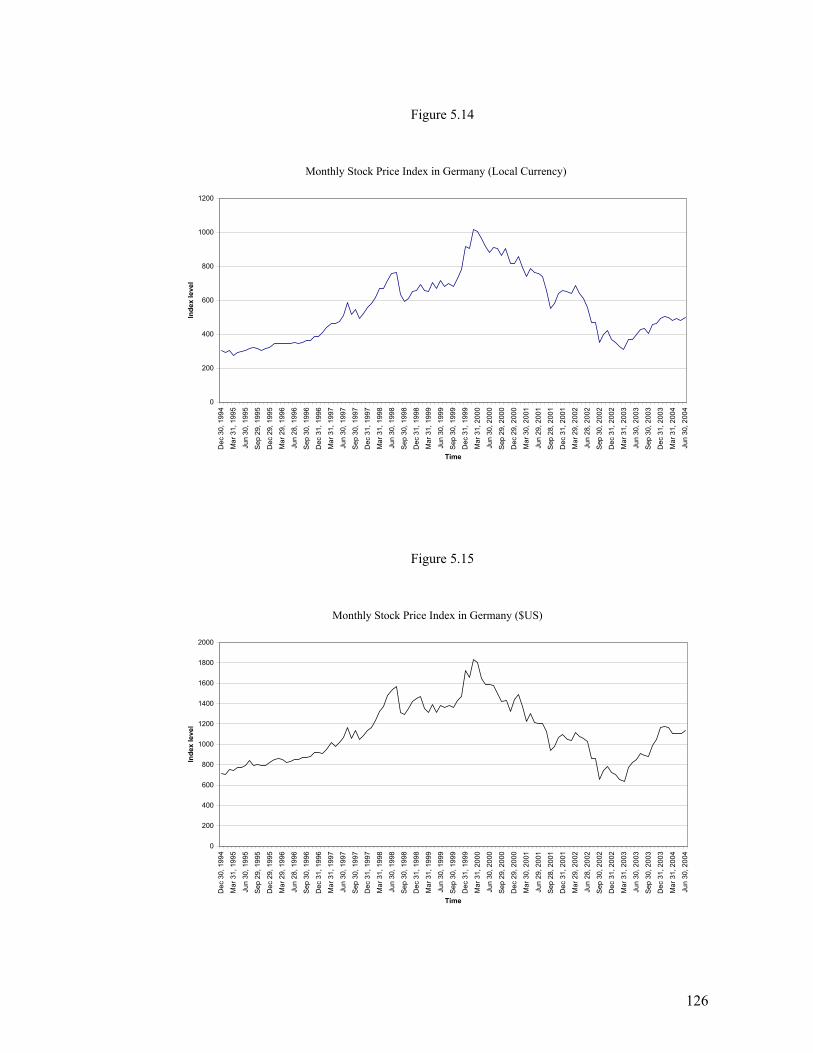
126
Figure 5.14
Monthly Stock Price Index in Germany (Local Currency)
0
200
400
600
800
1000
1200
Dec
30,
199
4
Mar
31,
199
5
Jun
30, 1
995
Sep
29,
199
5
Dec
29,
199
5
Mar
29,
199
6
Jun
28, 1
996
Sep
30,
199
6
Dec
31,
199
6
Mar
31,
199
7
Jun
30, 1
997
Sep
30,
199
7
Dec
31,
199
7
Mar
31,
199
8
Jun
30, 1
998
Sep
30,
199
8
Dec
31,
199
8
Mar
31,
199
9
Jun
30, 1
999
Sep
30,
199
9
Dec
31,
199
9
Mar
31,
200
0
Jun
30, 2
000
Sep
29,
200
0
Dec
29,
200
0
Mar
30,
200
1
Jun
29, 2
001
Sep
28,
200
1
Dec
31,
200
1
Mar
29,
200
2
Jun
28, 2
002
Sep
30,
200
2
Dec
31,
200
2
Mar
31,
200
3
Jun
30, 2
003
Sep
30,
200
3
Dec
31,
200
3
Mar
31,
200
4
Jun
30, 2
004
Time
Inde
x le
vel
Figure 5.15
Monthly Stock Price Index in Germany ($US)
0
200
400
600
800
1000
1200
1400
1600
1800
2000
Dec
30,
199
4
Mar
31,
199
5
Jun
30, 1
995
Sep
29, 1
995
Dec
29,
199
5
Mar
29,
199
6
Jun
28, 1
996
Sep
30, 1
996
Dec
31,
199
6
Mar
31,
199
7
Jun
30, 1
997
Sep
30, 1
997
Dec
31,
199
7
Mar
31,
199
8
Jun
30, 1
998
Sep
30, 1
998
Dec
31,
199
8
Mar
31,
199
9
Jun
30, 1
999
Sep
30, 1
999
Dec
31,
199
9
Mar
31,
200
0
Jun
30, 2
000
Sep
29, 2
000
Dec
29,
200
0
Mar
30,
200
1
Jun
29, 2
001
Sep
28, 2
001
Dec
31,
200
1
Mar
29,
200
2
Jun
28, 2
002
Sep
30, 2
002
Dec
31,
200
2
Mar
31,
200
3
Jun
30, 2
003
Sep
30, 2
003
Dec
31,
200
3
Mar
31,
200
4
Jun
30, 2
004
Time
Inde
x le
vel
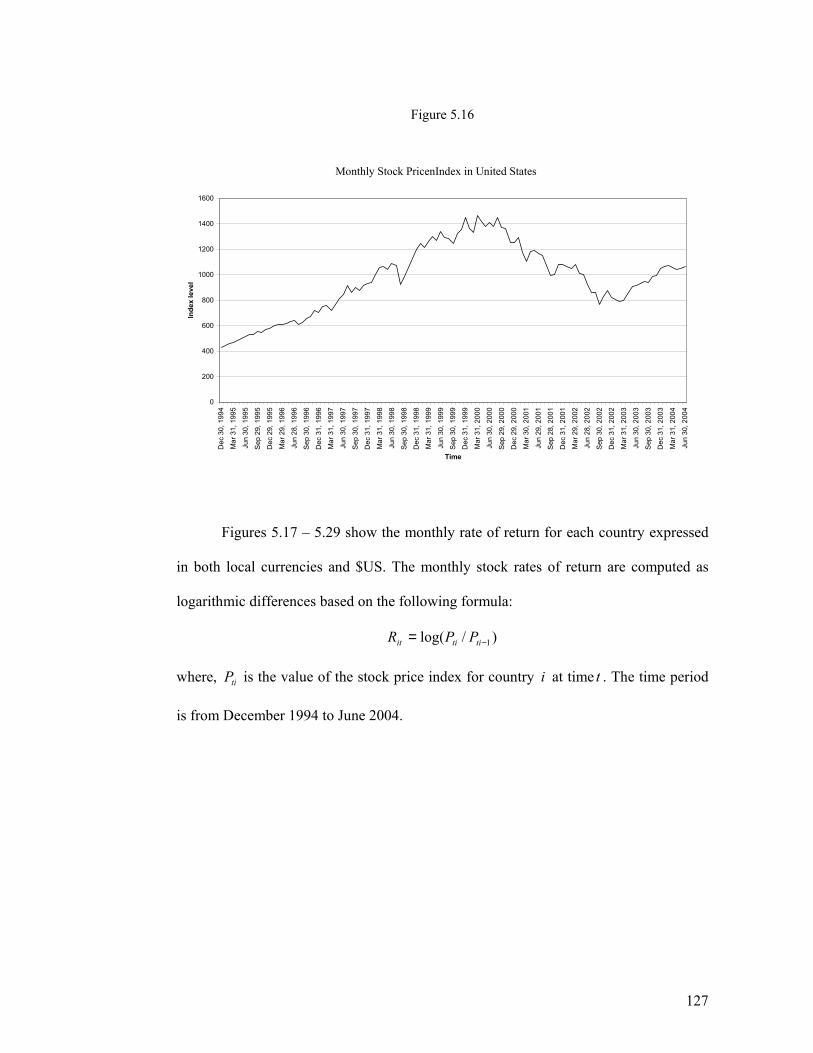
127
Figure 5.16
Monthly Stock PricenIndex in United States
0
200
400
600
800
1000
1200
1400
1600
Dec
30,
199
4
Mar
31,
199
5
Jun
30, 1
995
Sep
29,
199
5
Dec
29,
199
5
Mar
29,
199
6
Jun
28, 1
996
Sep
30,
199
6
Dec
31,
199
6
Mar
31,
199
7
Jun
30, 1
997
Sep
30,
199
7
Dec
31,
199
7
Mar
31,
199
8
Jun
30, 1
998
Sep
30,
199
8
Dec
31,
199
8
Mar
31,
199
9
Jun
30, 1
999
Sep
30,
199
9
Dec
31,
199
9
Mar
31,
200
0
Jun
30, 2
000
Sep
29,
200
0
Dec
29,
200
0
Mar
30,
200
1
Jun
29, 2
001
Sep
28,
200
1
Dec
31,
200
1
Mar
29,
200
2
Jun
28, 2
002
Sep
30,
200
2
Dec
31,
200
2
Mar
31,
200
3
Jun
30, 2
003
Sep
30,
200
3
Dec
31,
200
3
Mar
31,
200
4
Jun
30, 2
004
Time
Inde
x le
vel
Figures 5.17 – 5.29 show the monthly rate of return for each country expressed
in both local currencies and $US. The monthly stock rates of return are computed as
logarithmic differences based on the following formula:
)/log( 1−= titiit PPR
where, tiP is the value of the stock price index for country i at time t . The time period
is from December 1994 to June 2004.
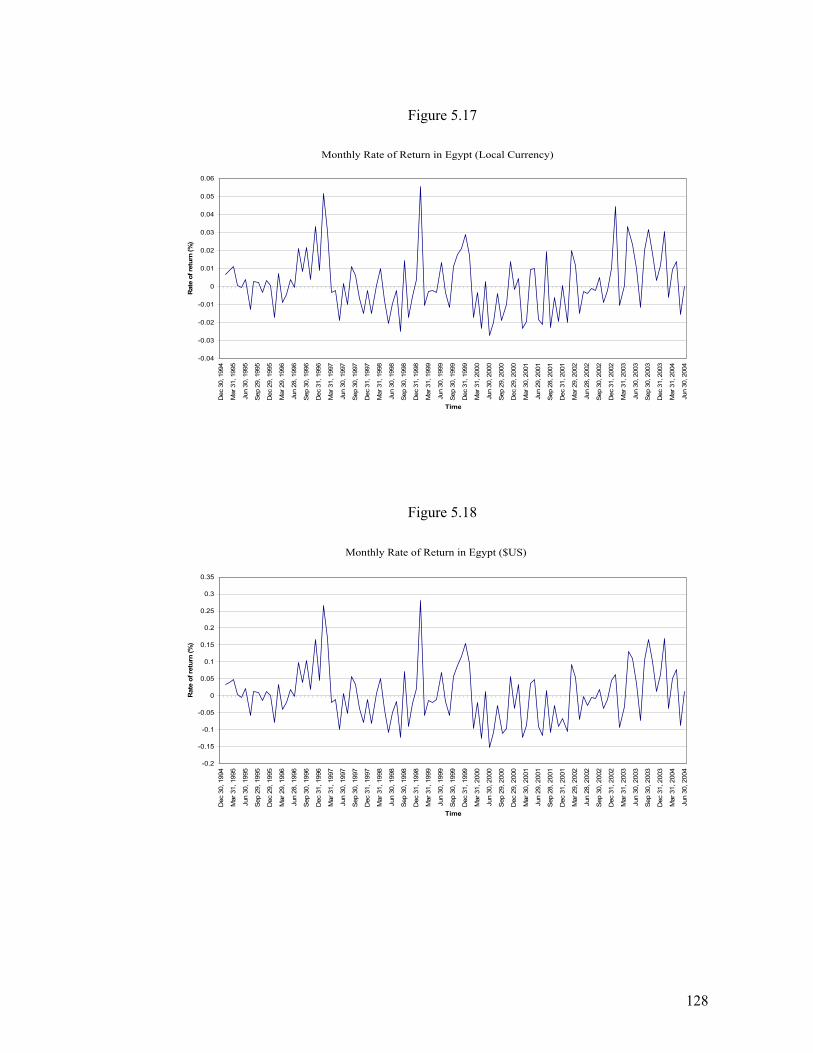
128
Figure 5.17
Monthly Rate of Return in Egypt (Local Currency)
-0.04
-0.03
-0.02
-0.01
0
0.01
0.02
0.03
0.04
0.05
0.06
Dec
30,
199
4
Mar
31,
199
5
Jun
30, 1
995
Sep
29, 1
995
Dec
29,
199
5
Mar
29,
199
6
Jun
28, 1
996
Sep
30, 1
996
Dec
31,
199
6
Mar
31,
199
7
Jun
30, 1
997
Sep
30, 1
997
Dec
31,
199
7
Mar
31,
199
8
Jun
30, 1
998
Sep
30, 1
998
Dec
31,
199
8
Mar
31,
199
9
Jun
30, 1
999
Sep
30, 1
999
Dec
31,
199
9
Mar
31,
200
0
Jun
30, 2
000
Sep
29, 2
000
Dec
29,
200
0
Mar
30,
200
1
Jun
29, 2
001
Sep
28, 2
001
Dec
31,
200
1
Mar
29,
200
2
Jun
28, 2
002
Sep
30, 2
002
Dec
31,
200
2
Mar
31,
200
3
Jun
30, 2
003
Sep
30, 2
003
Dec
31,
200
3
Mar
31,
200
4
Jun
30, 2
004
Time
Rat
e of
retu
rn (%
)
Figure 5.18
Monthly Rate of Return in Egypt ($US)
-0.2
-0.15
-0.1
-0.05
0
0.05
0.1
0.15
0.2
0.25
0.3
0.35
Dec
30,
199
4
Mar
31,
199
5
Jun
30, 1
995
Sep
29, 1
995
Dec
29,
199
5
Mar
29,
199
6
Jun
28, 1
996
Sep
30, 1
996
Dec
31,
199
6
Mar
31,
199
7
Jun
30, 1
997
Sep
30, 1
997
Dec
31,
199
7
Mar
31,
199
8
Jun
30, 1
998
Sep
30, 1
998
Dec
31,
199
8
Mar
31,
199
9
Jun
30, 1
999
Sep
30, 1
999
Dec
31,
199
9
Mar
31,
200
0
Jun
30, 2
000
Sep
29, 2
000
Dec
29,
200
0
Mar
30,
200
1
Jun
29, 2
001
Sep
28, 2
001
Dec
31,
200
1
Mar
29,
200
2
Jun
28, 2
002
Sep
30, 2
002
Dec
31,
200
2
Mar
31,
200
3
Jun
30, 2
003
Sep
30, 2
003
Dec
31,
200
3
Mar
31,
200
4
Jun
30, 2
004
Time
Rat
e of
retu
rn (%
)
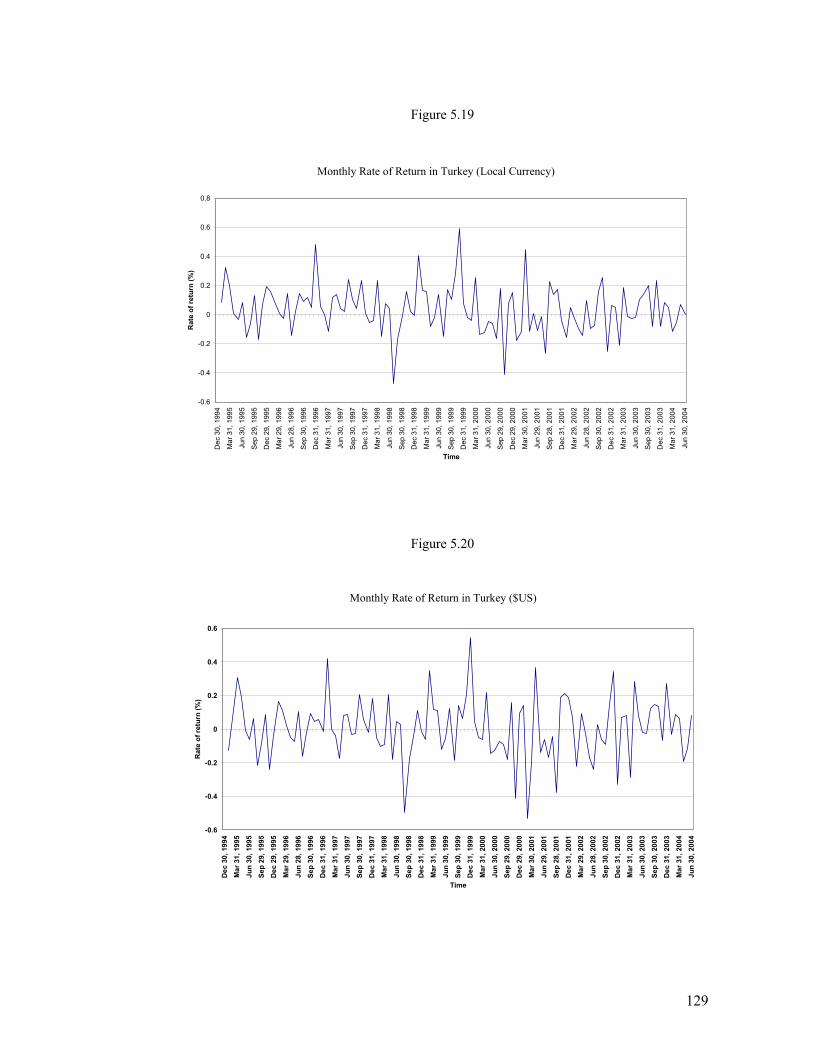
129
Figure 5.19
Monthly Rate of Return in Turkey (Local Currency)
-0.6
-0.4
-0.2
0
0.2
0.4
0.6
0.8
Dec
30,
199
4
Mar
31,
199
5
Jun
30, 1
995
Sep
29,
199
5
Dec
29,
199
5
Mar
29,
199
6
Jun
28, 1
996
Sep
30,
199
6
Dec
31,
199
6
Mar
31,
199
7
Jun
30, 1
997
Sep
30,
199
7
Dec
31,
199
7
Mar
31,
199
8
Jun
30, 1
998
Sep
30,
199
8
Dec
31,
199
8
Mar
31,
199
9
Jun
30, 1
999
Sep
30,
199
9
Dec
31,
199
9
Mar
31,
200
0
Jun
30, 2
000
Sep
29,
200
0
Dec
29,
200
0
Mar
30,
200
1
Jun
29, 2
001
Sep
28,
200
1
Dec
31,
200
1
Mar
29,
200
2
Jun
28, 2
002
Sep
30,
200
2
Dec
31,
200
2
Mar
31,
200
3
Jun
30, 2
003
Sep
30,
200
3
Dec
31,
200
3
Mar
31,
200
4
Jun
30, 2
004
Time
Rat
e of
retu
rn (%
)
Figure 5.20
Monthly Rate of Return in Turkey ($US)
-0.6
-0.4
-0.2
0
0.2
0.4
0.6
Dec
30,
199
4M
ar 3
1, 1
995
Jun
30, 1
995
Sep
29, 1
995
Dec
29,
199
5M
ar 2
9, 1
996
Jun
28, 1
996
Sep
30, 1
996
Dec
31,
199
6M
ar 3
1, 1
997
Jun
30, 1
997
Sep
30, 1
997
Dec
31,
199
7M
ar 3
1, 1
998
Jun
30, 1
998
Sep
30, 1
998
Dec
31,
199
8M
ar 3
1, 1
999
Jun
30, 1
999
Sep
30, 1
999
Dec
31,
199
9M
ar 3
1, 2
000
Jun
30, 2
000
Sep
29, 2
000
Dec
29,
200
0
Mar
30,
200
1Ju
n 29
, 200
1Se
p 28
, 200
1D
ec 3
1, 2
001
Mar
29,
200
2Ju
n 28
, 200
2Se
p 30
, 200
2D
ec 3
1, 2
002
Mar
31,
200
3Ju
n 30
, 200
3Se
p 30
, 200
3D
ec 3
1, 2
003
Mar
31,
200
4Ju
n 30
, 200
4
Time
Rat
e of
retu
rn (%
)
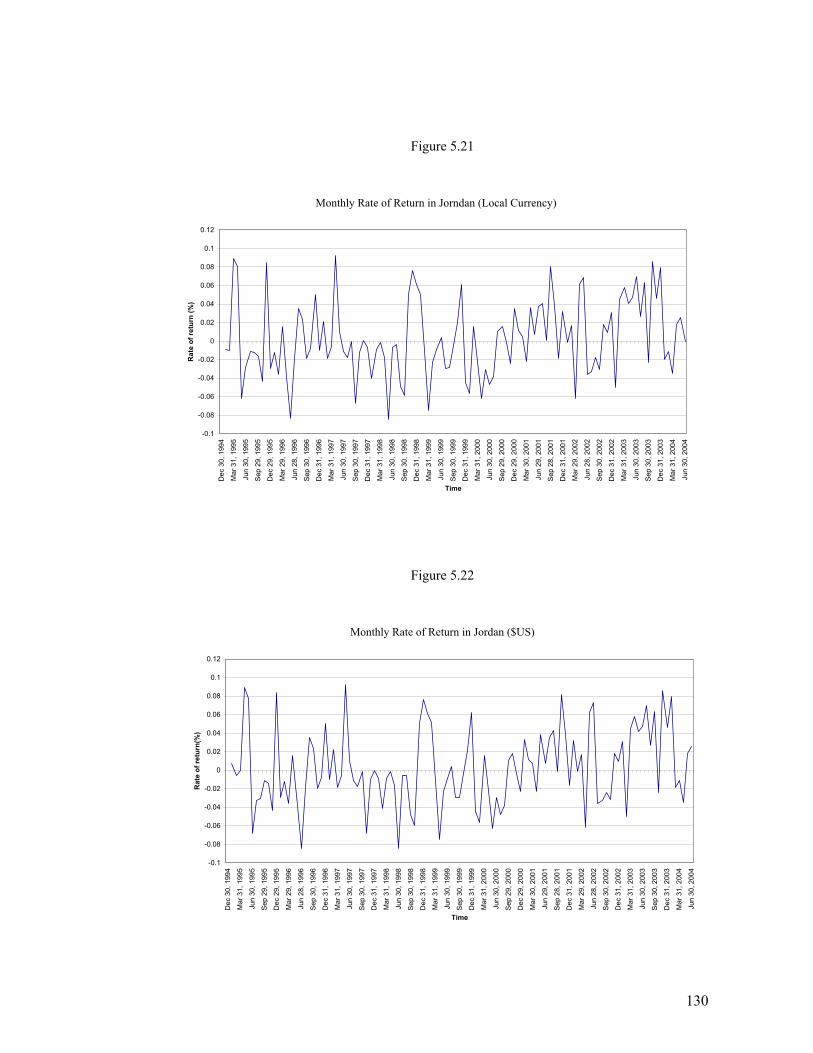
130
Figure 5.21
Monthly Rate of Return in Jorndan (Local Currency)
-0.1
-0.08
-0.06
-0.04
-0.02
0
0.02
0.04
0.06
0.08
0.1
0.12D
ec 3
0, 1
994
Mar
31,
199
5
Jun
30, 1
995
Sep
29,
199
5
Dec
29,
199
5
Mar
29,
199
6
Jun
28, 1
996
Sep
30,
199
6
Dec
31,
199
6
Mar
31,
199
7
Jun
30, 1
997
Sep
30,
199
7
Dec
31,
199
7
Mar
31,
199
8
Jun
30, 1
998
Sep
30,
199
8
Dec
31,
199
8
Mar
31,
199
9
Jun
30, 1
999
Sep
30,
199
9
Dec
31,
199
9
Mar
31,
200
0
Jun
30, 2
000
Sep
29,
200
0
Dec
29,
200
0
Mar
30,
200
1
Jun
29, 2
001
Sep
28,
200
1
Dec
31,
200
1
Mar
29,
200
2
Jun
28, 2
002
Sep
30,
200
2
Dec
31,
200
2
Mar
31,
200
3
Jun
30, 2
003
Sep
30,
200
3
Dec
31,
200
3
Mar
31,
200
4
Jun
30, 2
004
Time
Rat
e of
retu
rn (%
)
Figure 5.22
Monthly Rate of Return in Jordan ($US)
-0.1
-0.08
-0.06
-0.04
-0.02
0
0.02
0.04
0.06
0.08
0.1
0.12
Dec
30,
199
4
Mar
31,
199
5
Jun
30, 1
995
Sep
29,
199
5
Dec
29,
199
5
Mar
29,
199
6
Jun
28, 1
996
Sep
30,
199
6
Dec
31,
199
6
Mar
31,
199
7
Jun
30, 1
997
Sep
30,
199
7
Dec
31,
199
7
Mar
31,
199
8
Jun
30, 1
998
Sep
30,
199
8
Dec
31,
199
8
Mar
31,
199
9
Jun
30, 1
999
Sep
30,
199
9
Dec
31,
199
9
Mar
31,
200
0
Jun
30, 2
000
Sep
29,
200
0
Dec
29,
200
0
Mar
30,
200
1
Jun
29, 2
001
Sep
28,
200
1
Dec
31,
200
1
Mar
29,
200
2
Jun
28, 2
002
Sep
30,
200
2
Dec
31,
200
2
Mar
31,
200
3
Jun
30, 2
003
Sep
30,
200
3
Dec
31,
200
3
Mar
31,
200
4
Jun
30, 2
004
Time
Rat
e of
retu
rn(%
)
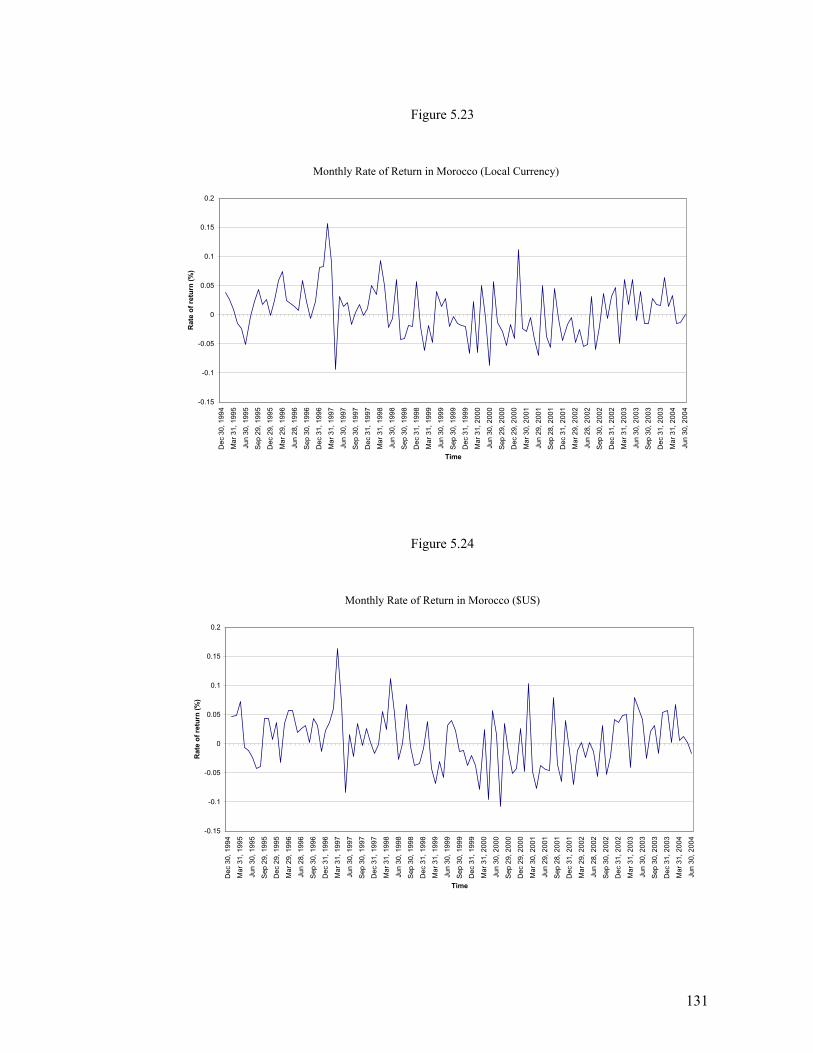
131
Figure 5.23
Monthly Rate of Return in Morocco (Local Currency)
-0.15
-0.1
-0.05
0
0.05
0.1
0.15
0.2
Dec
30,
199
4
Mar
31,
199
5
Jun
30, 1
995
Sep
29,
199
5
Dec
29,
199
5
Mar
29,
199
6
Jun
28, 1
996
Sep
30,
199
6
Dec
31,
199
6
Mar
31,
199
7
Jun
30, 1
997
Sep
30,
199
7
Dec
31,
199
7
Mar
31,
199
8
Jun
30, 1
998
Sep
30,
199
8
Dec
31,
199
8
Mar
31,
199
9
Jun
30, 1
999
Sep
30,
199
9
Dec
31,
199
9
Mar
31,
200
0
Jun
30, 2
000
Sep
29,
200
0
Dec
29,
200
0
Mar
30,
200
1
Jun
29, 2
001
Sep
28,
200
1
Dec
31,
200
1
Mar
29,
200
2
Jun
28, 2
002
Sep
30,
200
2
Dec
31,
200
2
Mar
31,
200
3
Jun
30, 2
003
Sep
30,
200
3
Dec
31,
200
3
Mar
31,
200
4
Jun
30, 2
004
Time
Rat
e of
retu
rn (%
)
Figure 5.24
Monthly Rate of Return in Morocco ($US)
-0.15
-0.1
-0.05
0
0.05
0.1
0.15
0.2
Dec
30,
199
4
Mar
31,
199
5
Jun
30, 1
995
Sep
29,
199
5
Dec
29,
199
5
Mar
29,
199
6
Jun
28, 1
996
Sep
30,
199
6
Dec
31,
199
6
Mar
31,
199
7
Jun
30, 1
997
Sep
30,
199
7
Dec
31,
199
7
Mar
31,
199
8
Jun
30, 1
998
Sep
30,
199
8
Dec
31,
199
8
Mar
31,
199
9
Jun
30, 1
999
Sep
30,
199
9
Dec
31,
199
9
Mar
31,
200
0
Jun
30, 2
000
Sep
29,
200
0
Dec
29,
200
0
Mar
30,
200
1
Jun
29, 2
001
Sep
28,
200
1
Dec
31,
200
1
Mar
29,
200
2
Jun
28, 2
002
Sep
30,
200
2
Dec
31,
200
2
Mar
31,
200
3
Jun
30, 2
003
Sep
30,
200
3
Dec
31,
200
3
Mar
31,
200
4
Jun
30, 2
004
Time
Rat
e of
retu
rn (%
)
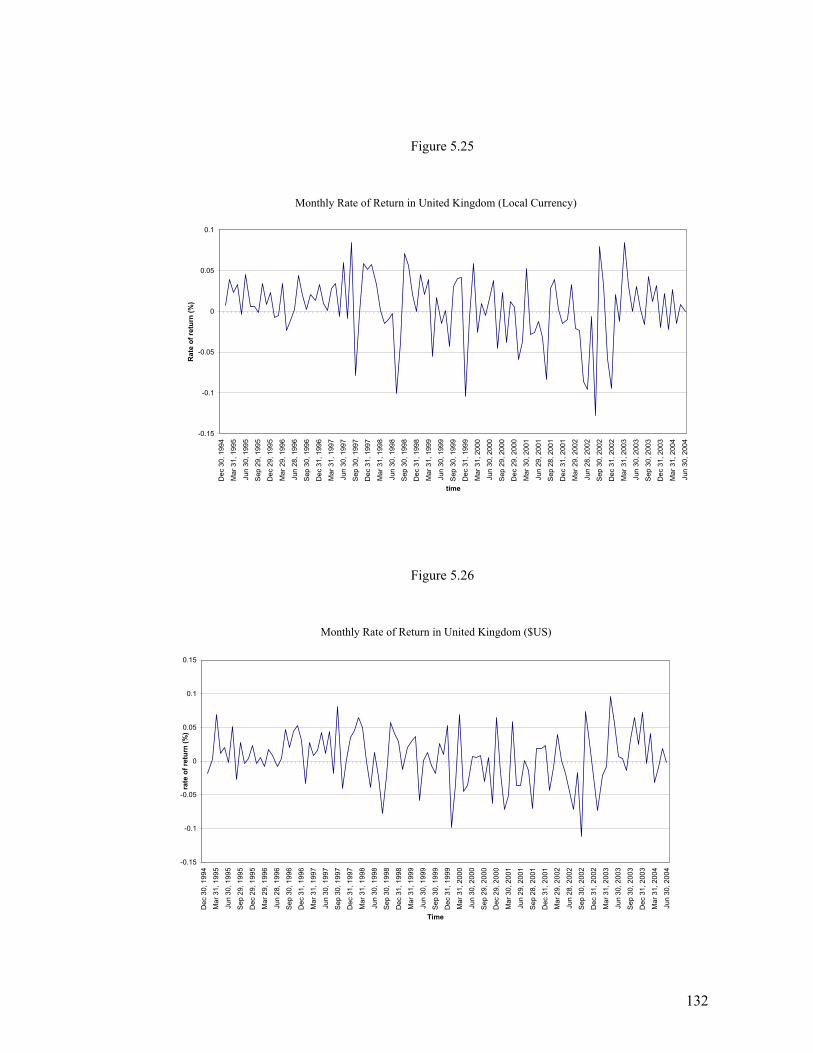
132
Figure 5.25
Monthly Rate of Return in United Kingdom (Local Currency)
-0.15
-0.1
-0.05
0
0.05
0.1D
ec 3
0, 1
994
Mar
31,
199
5
Jun
30, 1
995
Sep
29,
199
5
Dec
29,
199
5
Mar
29,
199
6
Jun
28, 1
996
Sep
30,
199
6
Dec
31,
199
6
Mar
31,
199
7
Jun
30, 1
997
Sep
30,
199
7
Dec
31,
199
7
Mar
31,
199
8
Jun
30, 1
998
Sep
30,
199
8
Dec
31,
199
8
Mar
31,
199
9
Jun
30, 1
999
Sep
30,
199
9
Dec
31,
199
9
Mar
31,
200
0
Jun
30, 2
000
Sep
29,
200
0
Dec
29,
200
0
Mar
30,
200
1
Jun
29, 2
001
Sep
28,
200
1
Dec
31,
200
1
Mar
29,
200
2
Jun
28, 2
002
Sep
30,
200
2
Dec
31,
200
2
Mar
31,
200
3
Jun
30, 2
003
Sep
30,
200
3
Dec
31,
200
3
Mar
31,
200
4
Jun
30, 2
004
time
Rat
e of
retu
rn (%
)
Figure 5.26
Monthly Rate of Return in United Kingdom ($US)
-0.15
-0.1
-0.05
0
0.05
0.1
0.15
Dec
30,
199
4
Mar
31,
199
5
Jun
30, 1
995
Sep
29,
199
5
Dec
29,
199
5
Mar
29,
199
6
Jun
28, 1
996
Sep
30,
199
6
Dec
31,
199
6
Mar
31,
199
7
Jun
30, 1
997
Sep
30,
199
7
Dec
31,
199
7
Mar
31,
199
8
Jun
30, 1
998
Sep
30,
199
8
Dec
31,
199
8
Mar
31,
199
9
Jun
30, 1
999
Sep
30,
199
9
Dec
31,
199
9
Mar
31,
200
0
Jun
30, 2
000
Sep
29,
200
0
Dec
29,
200
0
Mar
30,
200
1
Jun
29, 2
001
Sep
28,
200
1
Dec
31,
200
1
Mar
29,
200
2
Jun
28, 2
002
Sep
30,
200
2
Dec
31,
200
2
Mar
31,
200
3
Jun
30, 2
003
Sep
30,
200
3
Dec
31,
200
3
Mar
31,
200
4
Jun
30, 2
004
Time
rate
of r
etur
n (%
)
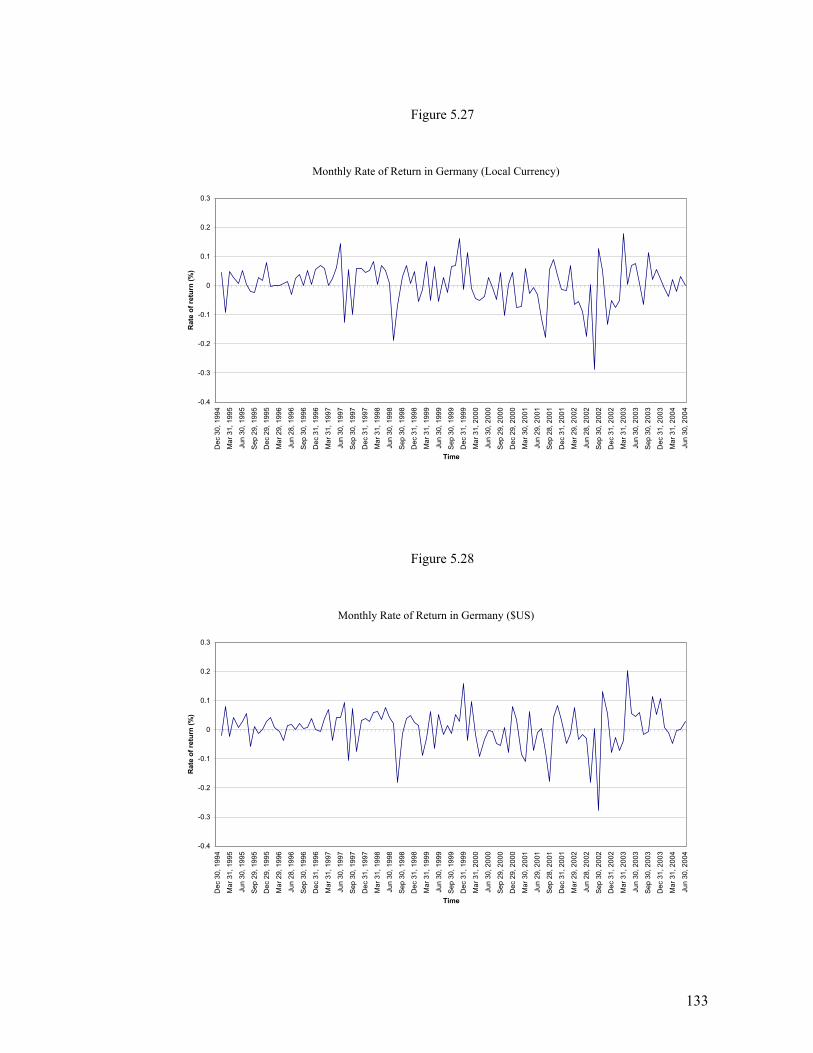
133
Figure 5.27
Monthly Rate of Return in Germany (Local Currency)
-0.4
-0.3
-0.2
-0.1
0
0.1
0.2
0.3
Dec
30,
199
4
Mar
31,
199
5
Jun
30, 1
995
Sep
29,
199
5
Dec
29,
199
5
Mar
29,
199
6
Jun
28, 1
996
Sep
30,
199
6
Dec
31,
199
6
Mar
31,
199
7
Jun
30, 1
997
Sep
30,
199
7
Dec
31,
199
7
Mar
31,
199
8
Jun
30, 1
998
Sep
30,
199
8
Dec
31,
199
8
Mar
31,
199
9
Jun
30, 1
999
Sep
30,
199
9
Dec
31,
199
9
Mar
31,
200
0
Jun
30, 2
000
Sep
29,
200
0
Dec
29,
200
0
Mar
30,
200
1
Jun
29, 2
001
Sep
28,
200
1
Dec
31,
200
1
Mar
29,
200
2
Jun
28, 2
002
Sep
30,
200
2
Dec
31,
200
2
Mar
31,
200
3
Jun
30, 2
003
Sep
30,
200
3
Dec
31,
200
3
Mar
31,
200
4
Jun
30, 2
004
Time
Rat
e of
retu
rn (%
)
Figure 5.28
Monthly Rate of Return in Germany ($US)
-0.4
-0.3
-0.2
-0.1
0
0.1
0.2
0.3
Dec
30,
199
4
Mar
31,
199
5
Jun
30, 1
995
Sep
29, 1
995
Dec
29,
199
5
Mar
29,
199
6
Jun
28, 1
996
Sep
30, 1
996
Dec
31,
199
6
Mar
31,
199
7
Jun
30, 1
997
Sep
30, 1
997
Dec
31,
199
7
Mar
31,
199
8
Jun
30, 1
998
Sep
30, 1
998
Dec
31,
199
8
Mar
31,
199
9
Jun
30, 1
999
Sep
30, 1
999
Dec
31,
199
9
Mar
31,
200
0
Jun
30, 2
000
Sep
29, 2
000
Dec
29,
200
0
Mar
30,
200
1
Jun
29, 2
001
Sep
28, 2
001
Dec
31,
200
1
Mar
29,
200
2
Jun
28, 2
002
Sep
30, 2
002
Dec
31,
200
2
Mar
31,
200
3
Jun
30, 2
003
Sep
30, 2
003
Dec
31,
200
3
Mar
31,
200
4
Jun
30, 2
004
Time
Rat
e of
retu
rn (%
)
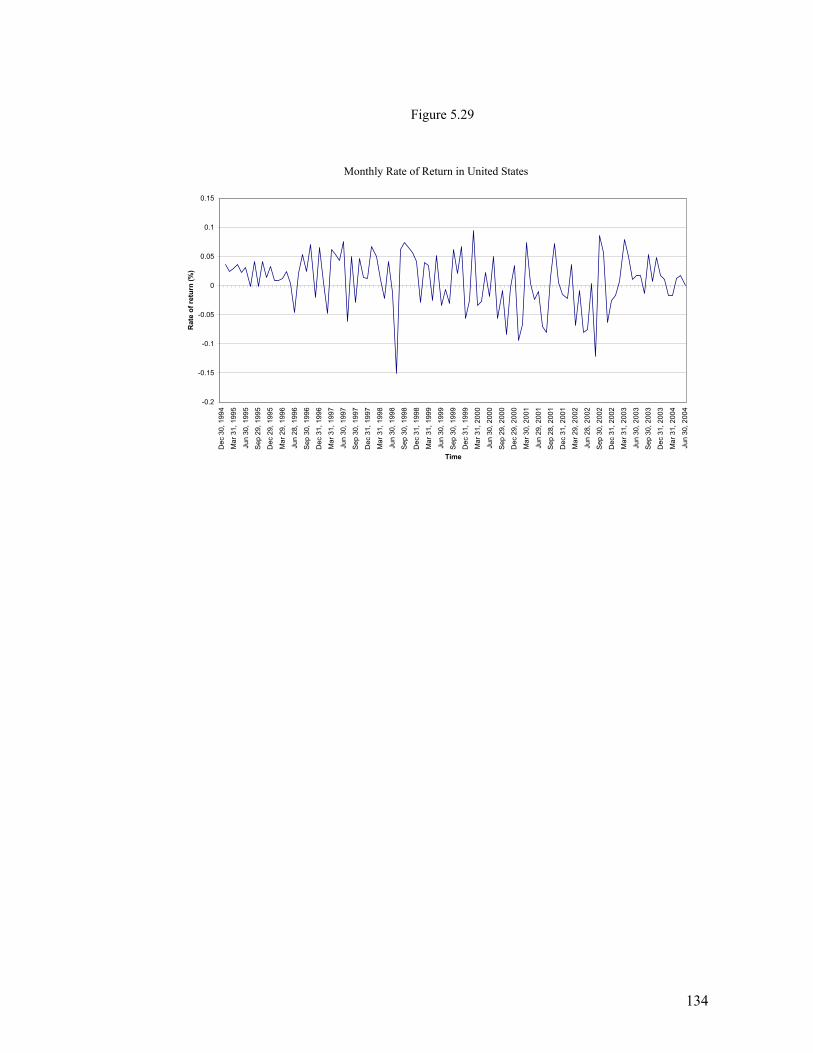
134
Figure 5.29
Monthly Rate of Return in United States
-0.2
-0.15
-0.1
-0.05
0
0.05
0.1
0.15
Dec
30,
199
4
Mar
31,
199
5
Jun
30, 1
995
Sep
29,
199
5
Dec
29,
199
5
Mar
29,
199
6
Jun
28, 1
996
Sep
30,
199
6
Dec
31,
199
6
Mar
31,
199
7
Jun
30, 1
997
Sep
30,
199
7
Dec
31,
199
7
Mar
31,
199
8
Jun
30, 1
998
Sep
30,
199
8
Dec
31,
199
8
Mar
31,
199
9
Jun
30, 1
999
Sep
30,
199
9
Dec
31,
199
9
Mar
31,
200
0
Jun
30, 2
000
Sep
29,
200
0
Dec
29,
200
0
Mar
30,
200
1
Jun
29, 2
001
Sep
28,
200
1
Dec
31,
200
1
Mar
29,
200
2
Jun
28, 2
002
Sep
30,
200
2
Dec
31,
200
2
Mar
31,
200
3
Jun
30, 2
003
Sep
30,
200
3
Dec
31,
200
3
Mar
31,
200
4
Jun
30, 2
004
Time
Rat
e of
retu
rn (%
)
135
The descriptive statistics of monthly stock returns in local currency for
the seven stock markets are reported in table 5.1. The highest average returns are
for Turkey of 3.83% with Egypt has the lowest average returns of 0.18%.
Regarding volatility, the Turkish stock market shows the highest volatility of
16.5% (as measured by the standard deviation), while Egypt has the lowest
volatility of 1.6%. Accordingly, it can be observed that the existence of high
volatility in a stock market is correlated with the existence of high returns. Egypt
and Turkey are very clear examples of this relationship. In terms of higher
moments, the distributions for all MENA monthly stock returns are skewed to
the right, which indicates that there is a greater probability of higher returns.
This compares with monthly stock returns in developed stock markets which are
skewed to the left, indicating a greater probability of lower returns. In addition,
most of the stock markets show an excess of kurtosis, with the coefficients of the
kurtosis grater than 3, indicating fat tails and sharp peaks. Jordan is the
exception with a low coefficient of kurtosis of 2.53, indicating the monthly stock
returns in Jordan are platykurtic (Thin tails). For testing normality, the Jarque-
Bera (JB) test shows that the null hypothesis, that the residuals are normally
distributed, can be rejected1.
1 Jarque-Bera (JB) statistics
−+24
)3(6
22 KSn follows the chi – square distribution with 2 degree of
freedom. However, for normally distributed variable, the skewness coefficient = 0, and the kurtosis coefficient = 3.
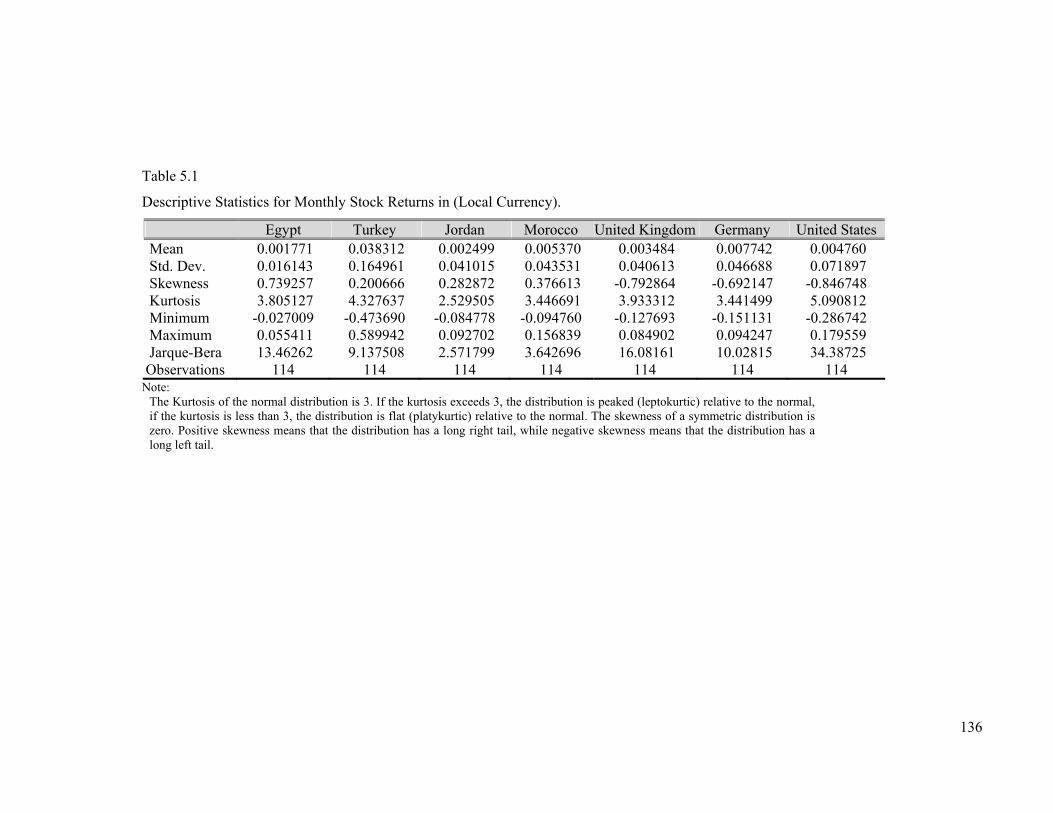
136
Table 5.1
Descriptive Statistics for Monthly Stock Returns in (Local Currency).
Egypt Turkey Jordan Morocco United Kingdom Germany United States Mean 0.001771 0.038312 0.002499 0.005370 0.003484 0.007742 0.004760 Std. Dev. 0.016143 0.164961 0.041015 0.043531 0.040613 0.046688 0.071897 Skewness 0.739257 0.200666 0.282872 0.376613 -0.792864 -0.692147 -0.846748 Kurtosis 3.805127 4.327637 2.529505 3.446691 3.933312 3.441499 5.090812 Minimum -0.027009 -0.473690 -0.084778 -0.094760 -0.127693 -0.151131 -0.286742 Maximum 0.055411 0.589942 0.092702 0.156839 0.084902 0.094247 0.179559 Jarque-Bera 13.46262 9.137508 2.571799 3.642696 16.08161 10.02815 34.38725 Observations 114 114 114 114 114 114 114
Note: The Kurtosis of the normal distribution is 3. If the kurtosis exceeds 3, the distribution is peaked (leptokurtic) relative to the normal, if the kurtosis is less than 3, the distribution is flat (platykurtic) relative to the normal. The skewness of a symmetric distribution is zero. Positive skewness means that the distribution has a long right tail, while negative skewness means that the distribution has a long left tail.
137
For an inclusive view, table 5.2 reports descriptive statistics for monthly stock
returns in $US. It shows that Turkey has also the highest average returns of 5.63%,
while Egypt has average returns of 3.93%. For Jordan and Morocco, it is found that the
average returns are very similar whether expressing the indices in local currencies or in
$US. Regarding the volatility, Turkey shows the highest volatility of 17.8%, while
Egypt shows a volatility of 8.1%. For both Jordan and Morocco, the volatility was
around 4% which is very low rate compared with other emerging markets. In terms of
higher moments, the distributions for Egypt, Jordan and Morocco are skewed to the
right. This is similar to the results in table 5.1. However, the distribution for Turkey is
skewed to the left when expressing the index in $US. This indicates the probability of
lower returns. Also, in similar results to table 5.1, most of the stock markets show an
excess of kurtosis, with the coefficients of the kurtosis grater than 3, indicating fat tails
and sharp peaks. Jordan is the exception with a low coefficient of kurtosis of 2.50,
indicating the monthly stock returns in Jordan are platykurtic (Thin tails).
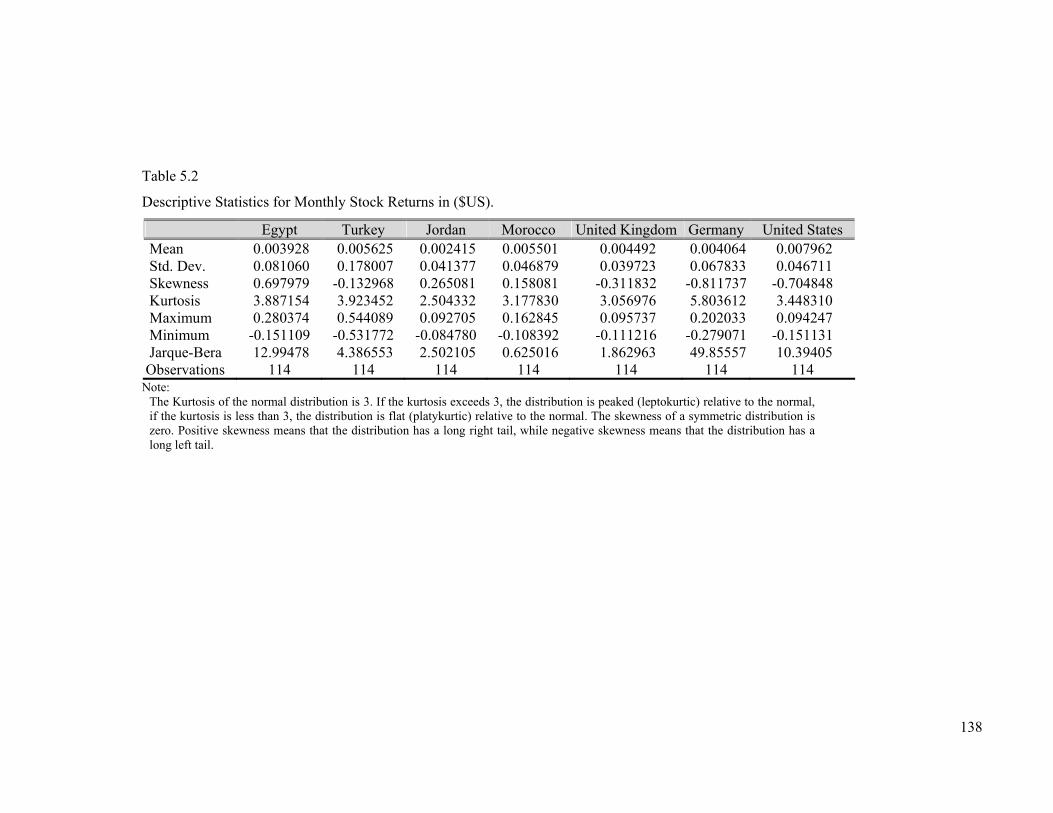
138
Table 5.2
Descriptive Statistics for Monthly Stock Returns in ($US).
Egypt Turkey Jordan Morocco United Kingdom Germany United States Mean 0.003928 0.005625 0.002415 0.005501 0.004492 0.004064 0.007962 Std. Dev. 0.081060 0.178007 0.041377 0.046879 0.039723 0.067833 0.046711 Skewness 0.697979 -0.132968 0.265081 0.158081 -0.311832 -0.811737 -0.704848 Kurtosis 3.887154 3.923452 2.504332 3.177830 3.056976 5.803612 3.448310 Maximum 0.280374 0.544089 0.092705 0.162845 0.095737 0.202033 0.094247 Minimum -0.151109 -0.531772 -0.084780 -0.108392 -0.111216 -0.279071 -0.151131 Jarque-Bera 12.99478 4.386553 2.502105 0.625016 1.862963 49.85557 10.39405 Observations 114 114 114 114 114 114 114
Note: The Kurtosis of the normal distribution is 3. If the kurtosis exceeds 3, the distribution is peaked (leptokurtic) relative to the normal, if the kurtosis is less than 3, the distribution is flat (platykurtic) relative to the normal. The skewness of a symmetric distribution is zero. Positive skewness means that the distribution has a long right tail, while negative skewness means that the distribution has a long left tail.
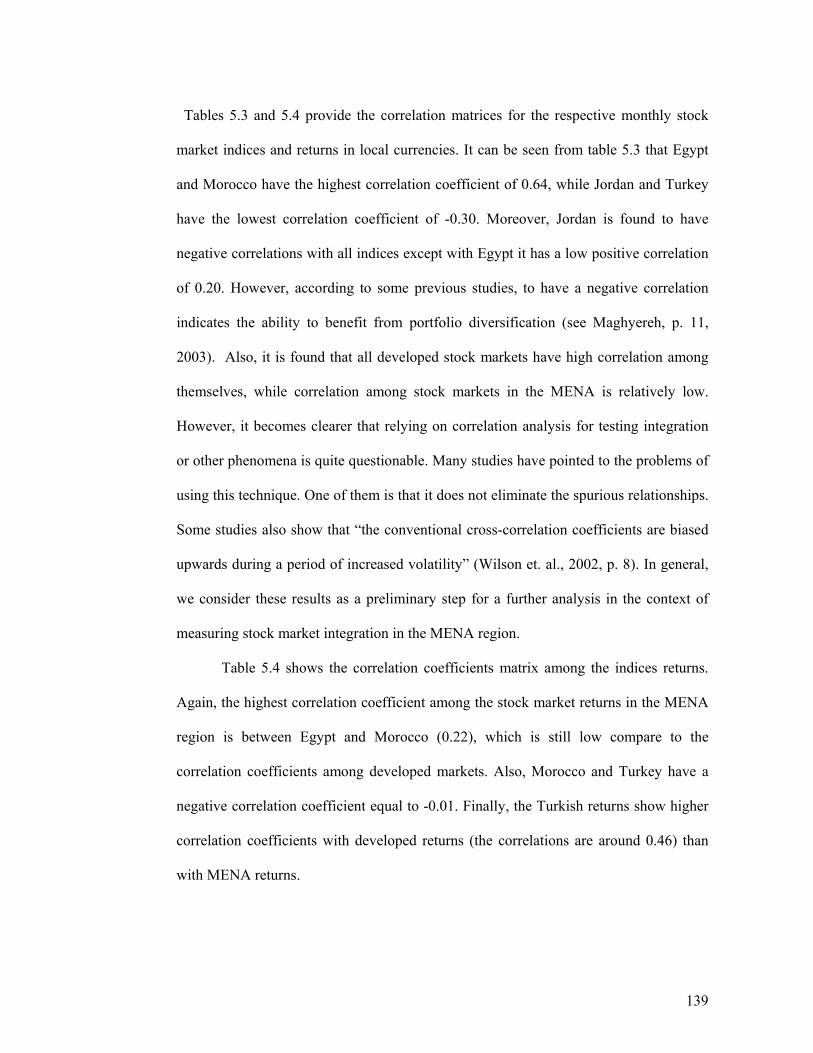
139
Tables 5.3 and 5.4 provide the correlation matrices for the respective monthly stock
market indices and returns in local currencies. It can be seen from table 5.3 that Egypt
and Morocco have the highest correlation coefficient of 0.64, while Jordan and Turkey
have the lowest correlation coefficient of -0.30. Moreover, Jordan is found to have
negative correlations with all indices except with Egypt it has a low positive correlation
of 0.20. However, according to some previous studies, to have a negative correlation
indicates the ability to benefit from portfolio diversification (see Maghyereh, p. 11,
2003). Also, it is found that all developed stock markets have high correlation among
themselves, while correlation among stock markets in the MENA is relatively low.
However, it becomes clearer that relying on correlation analysis for testing integration
or other phenomena is quite questionable. Many studies have pointed to the problems of
using this technique. One of them is that it does not eliminate the spurious relationships.
Some studies also show that “the conventional cross-correlation coefficients are biased
upwards during a period of increased volatility” (Wilson et. al., 2002, p. 8). In general,
we consider these results as a preliminary step for a further analysis in the context of
measuring stock market integration in the MENA region.
Table 5.4 shows the correlation coefficients matrix among the indices returns.
Again, the highest correlation coefficient among the stock market returns in the MENA
region is between Egypt and Morocco (0.22), which is still low compare to the
correlation coefficients among developed markets. Also, Morocco and Turkey have a
negative correlation coefficient equal to -0.01. Finally, the Turkish returns show higher
correlation coefficients with developed returns (the correlations are around 0.46) than
with MENA returns.
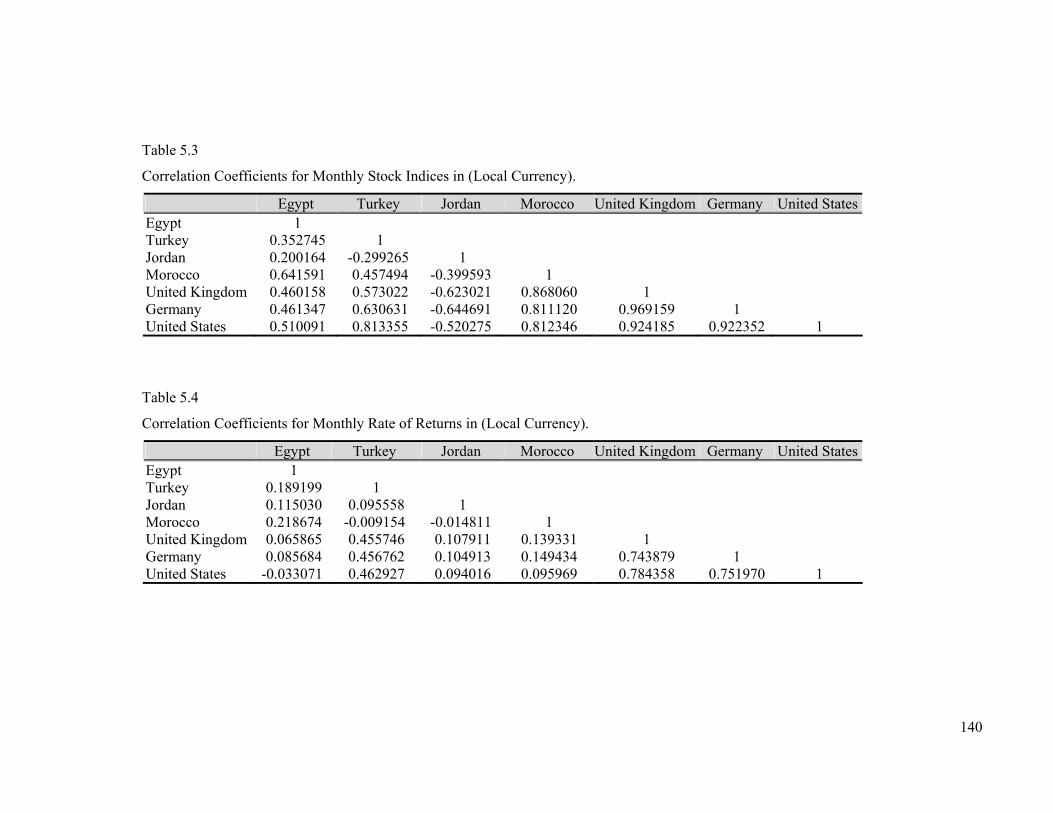
140
Table 5.3
Correlation Coefficients for Monthly Stock Indices in (Local Currency).
Egypt Turkey Jordan Morocco United Kingdom Germany United StatesEgypt 1 Turkey 0.352745 1 Jordan 0.200164 -0.299265 1 Morocco 0.641591 0.457494 -0.399593 1 United Kingdom 0.460158 0.573022 -0.623021 0.868060 1 Germany 0.461347 0.630631 -0.644691 0.811120 0.969159 1 United States 0.510091 0.813355 -0.520275 0.812346 0.924185 0.922352 1 Table 5.4
Correlation Coefficients for Monthly Rate of Returns in (Local Currency).
Egypt Turkey Jordan Morocco United Kingdom Germany United StatesEgypt 1 Turkey 0.189199 1 Jordan 0.115030 0.095558 1 Morocco 0.218674 -0.009154 -0.014811 1 United Kingdom 0.065865 0.455746 0.107911 0.139331 1 Germany 0.085684 0.456762 0.104913 0.149434 0.743879 1 United States -0.033071 0.462927 0.094016 0.095969 0.784358 0.751970 1
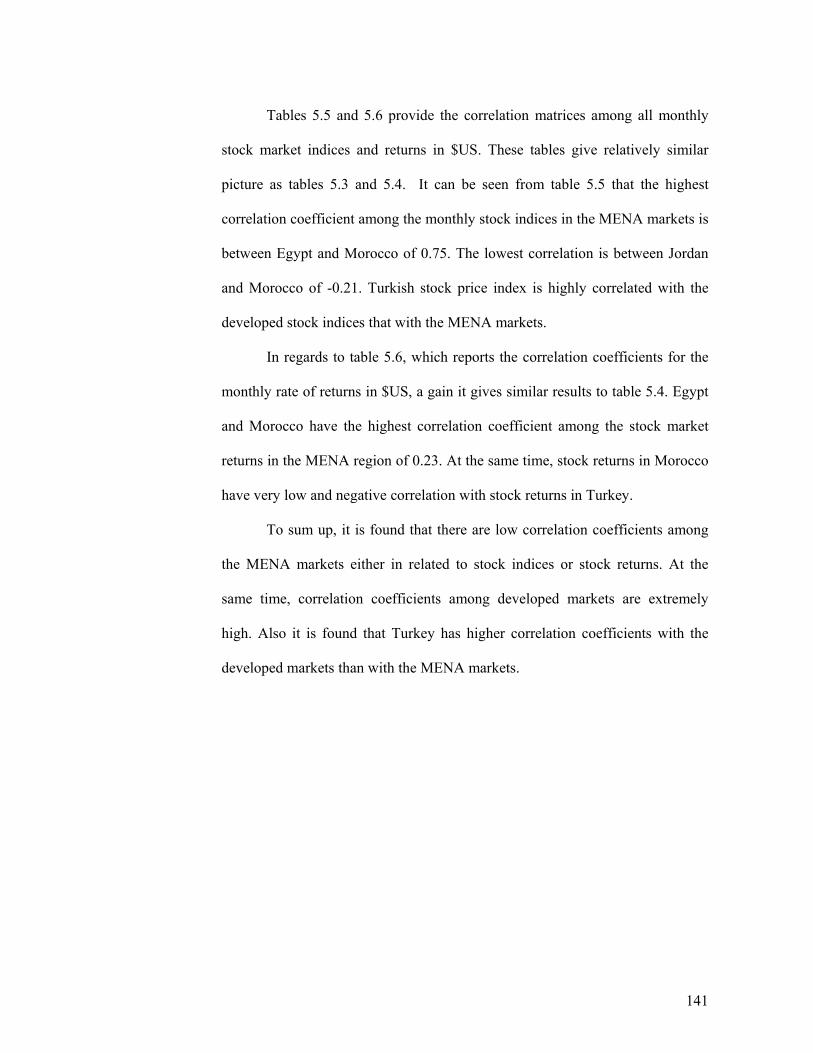
141
Tables 5.5 and 5.6 provide the correlation matrices among all monthly
stock market indices and returns in $US. These tables give relatively similar
picture as tables 5.3 and 5.4. It can be seen from table 5.5 that the highest
correlation coefficient among the monthly stock indices in the MENA markets is
between Egypt and Morocco of 0.75. The lowest correlation is between Jordan
and Morocco of -0.21. Turkish stock price index is highly correlated with the
developed stock indices that with the MENA markets.
In regards to table 5.6, which reports the correlation coefficients for the
monthly rate of returns in $US, a gain it gives similar results to table 5.4. Egypt
and Morocco have the highest correlation coefficient among the stock market
returns in the MENA region of 0.23. At the same time, stock returns in Morocco
have very low and negative correlation with stock returns in Turkey.
To sum up, it is found that there are low correlation coefficients among
the MENA markets either in related to stock indices or stock returns. At the
same time, correlation coefficients among developed markets are extremely
high. Also it is found that Turkey has higher correlation coefficients with the
developed markets than with the MENA markets.
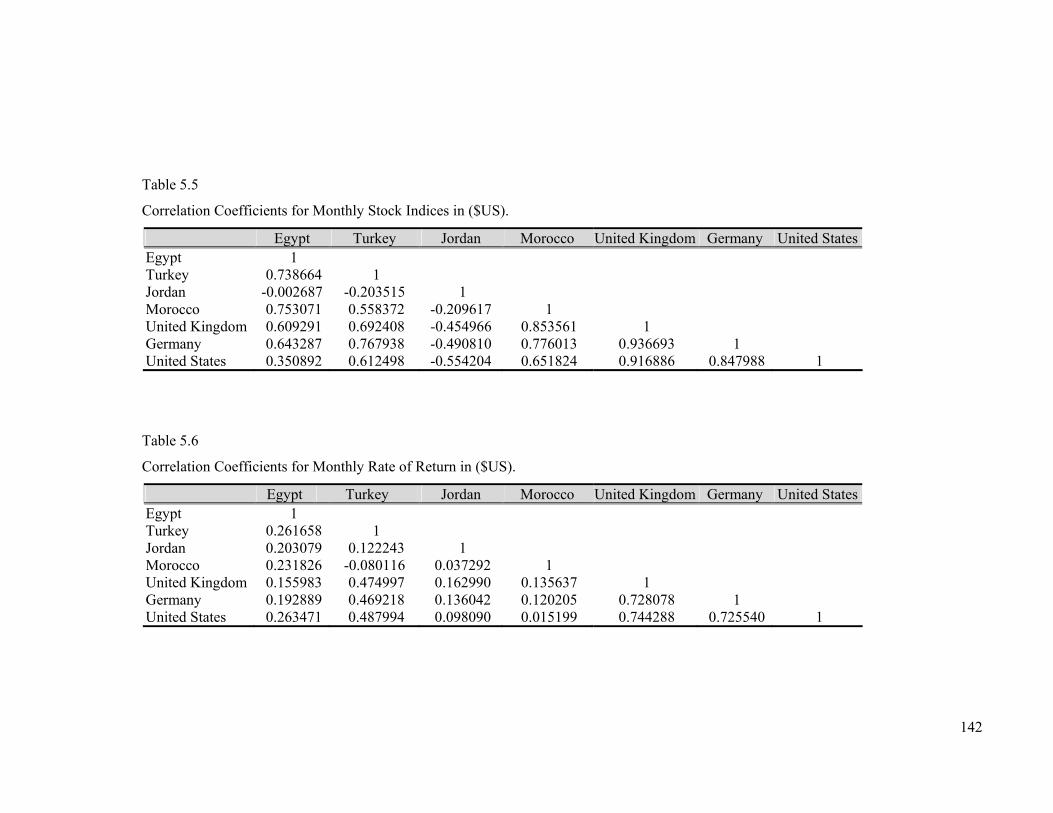
142
Table 5.5
Correlation Coefficients for Monthly Stock Indices in ($US).
Egypt Turkey Jordan Morocco United Kingdom Germany United StatesEgypt 1 Turkey 0.738664 1 Jordan -0.002687 -0.203515 1 Morocco 0.753071 0.558372 -0.209617 1 United Kingdom 0.609291 0.692408 -0.454966 0.853561 1 Germany 0.643287 0.767938 -0.490810 0.776013 0.936693 1 United States 0.350892 0.612498 -0.554204 0.651824 0.916886 0.847988 1
Table 5.6
Correlation Coefficients for Monthly Rate of Return in ($US).
Egypt Turkey Jordan Morocco United Kingdom Germany United StatesEgypt 1 Turkey 0.261658 1 Jordan 0.203079 0.122243 1 Morocco 0.231826 -0.080116 0.037292 1 United Kingdom 0.155983 0.474997 0.162990 0.135637 1 Germany 0.192889 0.469218 0.136042 0.120205 0.728078 1 United States 0.263471 0.487994 0.098090 0.015199 0.744288 0.725540 1
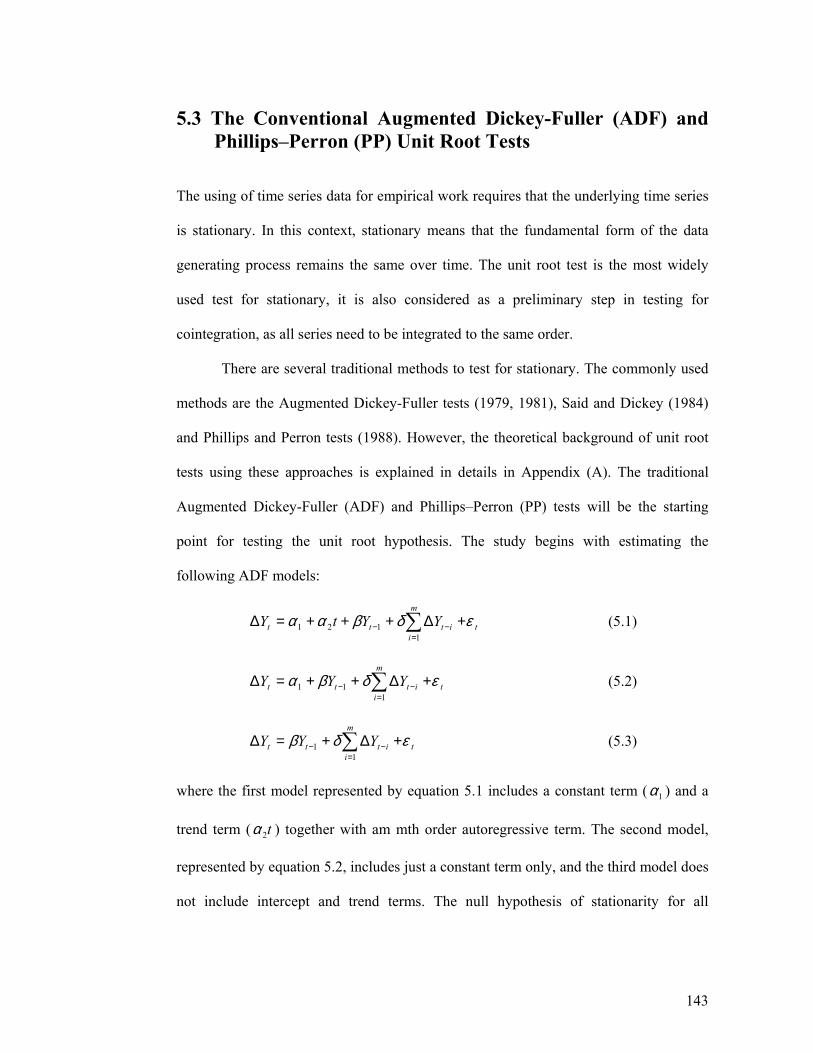
143
5.3 The Conventional Augmented Dickey-Fuller (ADF) and Phillips–Perron (PP) Unit Root Tests
The using of time series data for empirical work requires that the underlying time series
is stationary. In this context, stationary means that the fundamental form of the data
generating process remains the same over time. The unit root test is the most widely
used test for stationary, it is also considered as a preliminary step in testing for
cointegration, as all series need to be integrated to the same order.
There are several traditional methods to test for stationary. The commonly used
methods are the Augmented Dickey-Fuller tests (1979, 1981), Said and Dickey (1984)
and Phillips and Perron tests (1988). However, the theoretical background of unit root
tests using these approaches is explained in details in Appendix (A). The traditional
Augmented Dickey-Fuller (ADF) and Phillips–Perron (PP) tests will be the starting
point for testing the unit root hypothesis. The study begins with estimating the
following ADF models:
∑=
−− +∆+++=∆m
itittt YYtY
1121 εδβαα (5.1)
∑=
−− +∆++=∆m
itittt YYY
111 εδβα (5.2)
∑=
−− +∆+=∆m
itittt YYY
11 εδβ (5.3)
where the first model represented by equation 5.1 includes a constant term ( 1α ) and a
trend term ( t2α ) together with am mth order autoregressive term. The second model,
represented by equation 5.2, includes just a constant term only, and the third model does
not include intercept and trend terms. The null hypothesis of stationarity for all
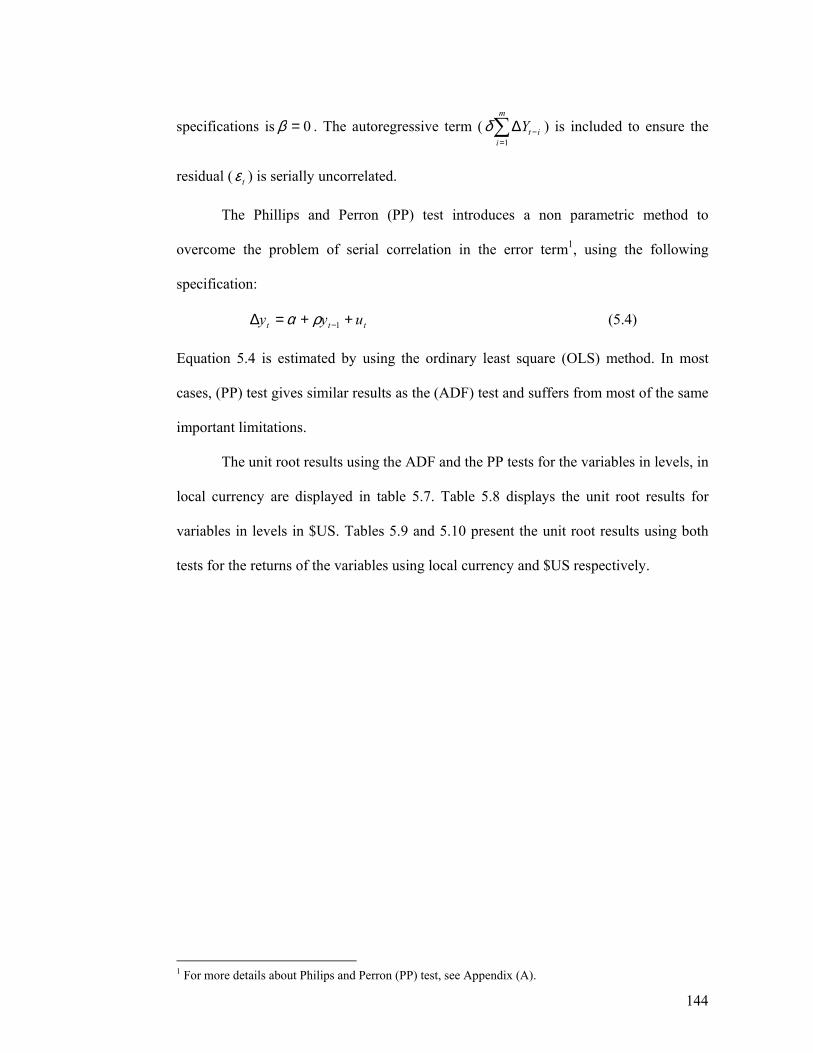
144
specifications is 0=β . The autoregressive term ( ∑=
−∆m
iitY
1
δ ) is included to ensure the
residual ( tε ) is serially uncorrelated.
The Phillips and Perron (PP) test introduces a non parametric method to
overcome the problem of serial correlation in the error term1, using the following
specification:
ttt uyy ++=∆ −1ρα (5.4)
Equation 5.4 is estimated by using the ordinary least square (OLS) method. In most
cases, (PP) test gives similar results as the (ADF) test and suffers from most of the same
important limitations.
The unit root results using the ADF and the PP tests for the variables in levels, in
local currency are displayed in table 5.7. Table 5.8 displays the unit root results for
variables in levels in $US. Tables 5.9 and 5.10 present the unit root results using both
tests for the returns of the variables using local currency and $US respectively.
1 For more details about Philips and Perron (PP) test, see Appendix (A).
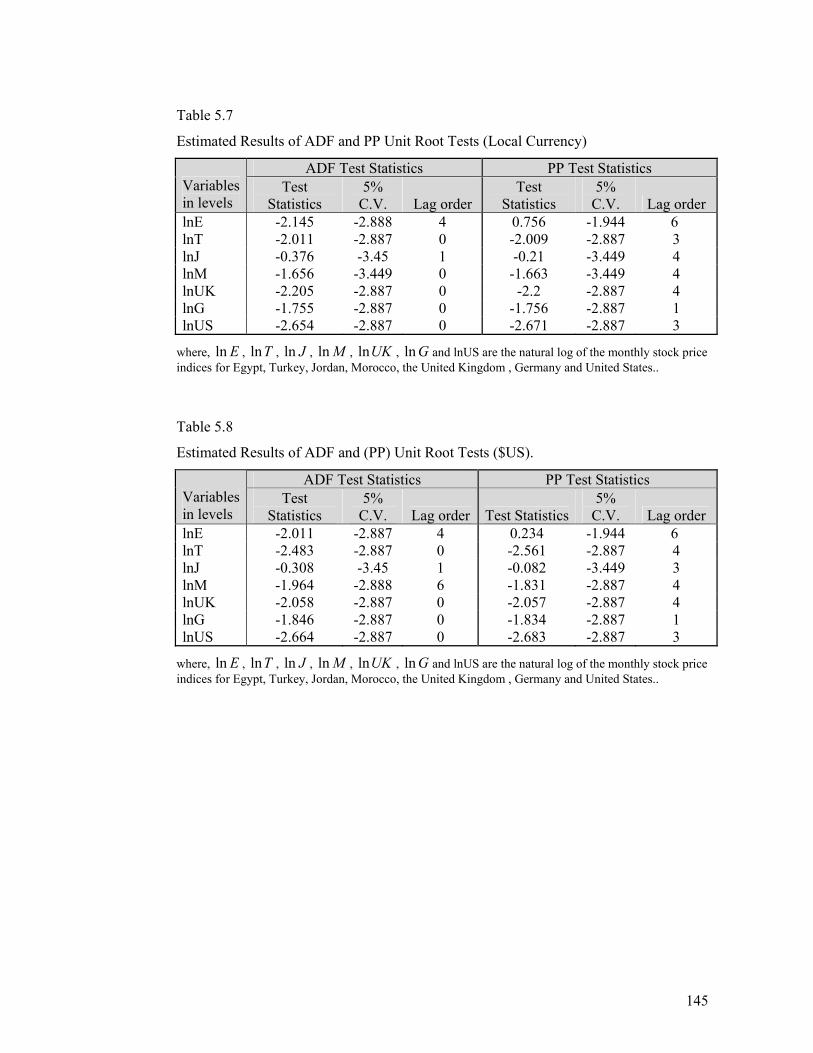
145
Table 5.7
Estimated Results of ADF and PP Unit Root Tests (Local Currency)
ADF Test Statistics PP Test Statistics Variables in levels
Test Statistics
5% C.V. Lag order
Test Statistics
5% C.V. Lag order
lnE -2.145 -2.888 4 0.756 -1.944 6 lnT -2.011 -2.887 0 -2.009 -2.887 3 lnJ -0.376 -3.45 1 -0.21 -3.449 4 lnM -1.656 -3.449 0 -1.663 -3.449 4 lnUK -2.205 -2.887 0 -2.2 -2.887 4 lnG -1.755 -2.887 0 -1.756 -2.887 1 lnUS -2.654 -2.887 0 -2.671 -2.887 3
where, Eln , Tln , Jln , Mln , UKln , Gln and lnUS are the natural log of the monthly stock price indices for Egypt, Turkey, Jordan, Morocco, the United Kingdom , Germany and United States..
Table 5.8
Estimated Results of ADF and (PP) Unit Root Tests ($US).
ADF Test Statistics PP Test Statistics Variables in levels
Test Statistics
5% C.V. Lag order Test Statistics
5% C.V. Lag order
lnE -2.011 -2.887 4 0.234 -1.944 6 lnT -2.483 -2.887 0 -2.561 -2.887 4 lnJ -0.308 -3.45 1 -0.082 -3.449 3 lnM -1.964 -2.888 6 -1.831 -2.887 4 lnUK -2.058 -2.887 0 -2.057 -2.887 4 lnG -1.846 -2.887 0 -1.834 -2.887 1 lnUS -2.664 -2.887 0 -2.683 -2.887 3
where, Eln , Tln , Jln , Mln , UKln , Gln and lnUS are the natural log of the monthly stock price indices for Egypt, Turkey, Jordan, Morocco, the United Kingdom , Germany and United States..
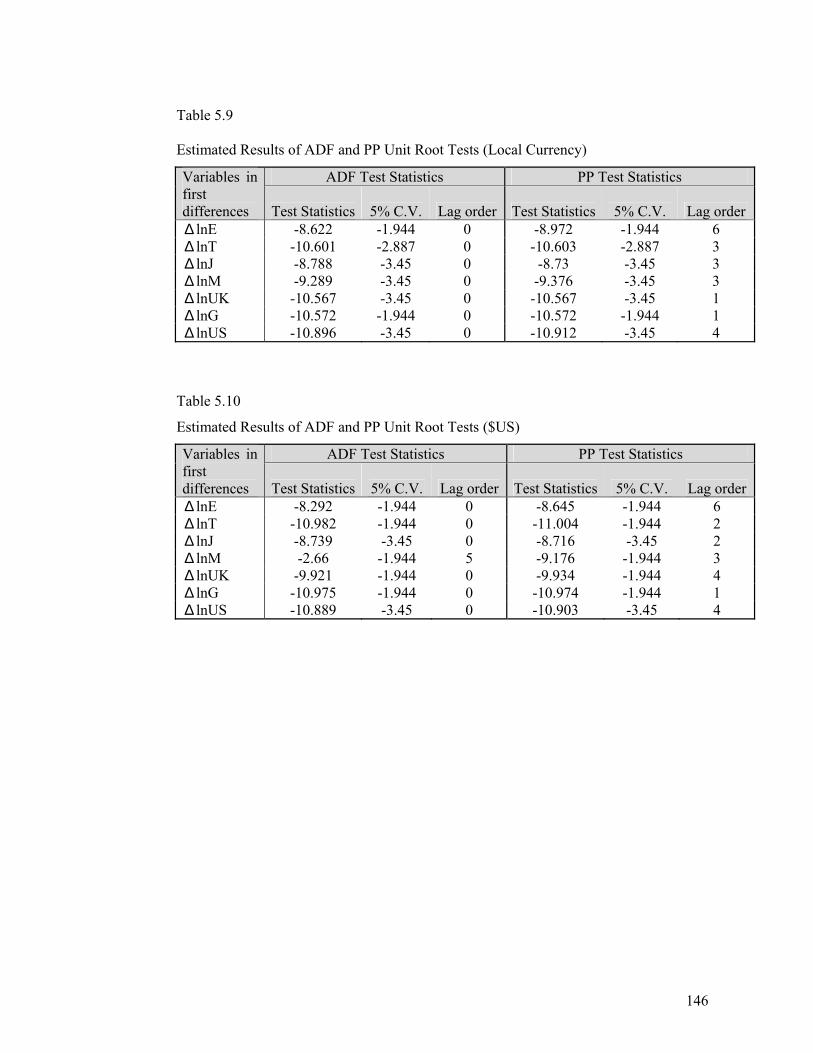
146
Table 5.9
Estimated Results of ADF and PP Unit Root Tests (Local Currency)
ADF Test Statistics PP Test Statistics Variables in first differences Test Statistics 5% C.V. Lag order Test Statistics 5% C.V. Lag order ∆ lnE -8.622 -1.944 0 -8.972 -1.944 6 ∆ lnT -10.601 -2.887 0 -10.603 -2.887 3 ∆ lnJ -8.788 -3.45 0 -8.73 -3.45 3 ∆ lnM -9.289 -3.45 0 -9.376 -3.45 3 ∆ lnUK -10.567 -3.45 0 -10.567 -3.45 1 ∆ lnG -10.572 -1.944 0 -10.572 -1.944 1 ∆ lnUS -10.896 -3.45 0 -10.912 -3.45 4
Table 5.10
Estimated Results of ADF and PP Unit Root Tests ($US)
ADF Test Statistics PP Test Statistics Variables in first differences Test Statistics 5% C.V. Lag order Test Statistics 5% C.V. Lag order ∆ lnE -8.292 -1.944 0 -8.645 -1.944 6 ∆ lnT -10.982 -1.944 0 -11.004 -1.944 2 ∆ lnJ -8.739 -3.45 0 -8.716 -3.45 2 ∆ lnM -2.66 -1.944 5 -9.176 -1.944 3 ∆ lnUK -9.921 -1.944 0 -9.934 -1.944 4 ∆ lnG -10.975 -1.944 0 -10.974 -1.944 1 ∆ lnUS -10.889 -3.45 0 -10.903 -3.45 4
147
The results reported in tables 5.7 and 5.8 fail to reject the null hypothesis of a
unit root for all monthly stock price indices (in the levels) denominated in both local
currency and $US. This indicates that all indices are non-stationary.
The same tests are applied to the first differences of the indices expressed in
both local currency and $US. The results from both tests reported in tables 5.9 and 5.10
reject the null hypothesis of non-stationarity for all indices. This means that all indices
become stationary if they differenced once and they therefore follow unit root process,
meaning they are integrated of order one I(1).
However, it is now well known that the conventional ADF and PP unit root tests
are biased towards the non-rejection of the unit root null hypothesis in the presence of
structural breaks. These tests lack power in the presence of structural breaks in the
series and they may fail to show whether a series is first difference stationary (Wilson,
et. al. 2003, p. 445). Structural change may occur in a time series for different reasons
such as economic and political crises, environmental crisis, institutional changes and
policy changes.
Perron (1989) perceives this phenomenon and proposes a unit root test that
allows for a structural change at a known date by incorporating dummy variables for the
structural change into the Augmented Dickey-Fuller (ADF) test. Subsequently a
significant amount of research which followed Perron (1989) suggests it is better to
consider a structural change at an unknown date in which the choice of the break point
is considered as endogenous. This is preferred because any arbitrary fixed date can be
subject to criticism of data mining (Lai, 2004). The theoretical background of these
newer tests of stationarity with structural changes is presented in the following section.
148
5.4 The Development of Testing for Structural Change During the last two decades, the properties of macroeconomic and financial time series
have received attention from both theoretical and empirical perspectives. A major
debate started since Nelsson and Plosser (1982) argued that current shocks have
permanent effects on the level of most macroeconomic and financial time series.
Nelsson and Plosser used the Dickey and Fuller (1979) test to find that most
macroeconomic and financial variables have a univariate time series structure with a
unit root. It is well known that random shocks have permanent effects under the
hypothesis of a unit root.
Since these results of Nelsson and Plosser (1982) there has been more attention
given to the effect of structural change on the level of macroeconomic and financial
time series. Structural change is usually interpreted as a change in the regression
parameters (Maddala and Kim, 2003, p. 399). This change can be viewed as a big shock
or infrequent events that have permanent effect on the level of the series.
Perron (1989) continued the debate by pointing out that in the presence of a
structural break, the various Dickey-Fuller test statistics are biased towards the non
rejection of a unit root (Enders, 2004). He argued that macroeconomic fluctuations are
indeed stationary if one allows for structural changes to affect the trend function. Perron
(1989) extended the unit root strategy to ensure a consistent testing procedure against
shifting trend functions (Mills, 1999).
Perron (1989) proposed a unit root test in which he incorporated dummy
variables into the Augmented Dickey-Fuller (ADF) test to allow for a single change in
the intercept of the trend function and/or a single change in the slope of the trend
function. This structural change is allowed at a known break date BT ( TTB <<1 ),
149
where BT is the time of a structural change. Determining the time of the break a priori
means that the date chosen was uncorrelated with the data and is related to an
exogenous event. Usually economic theory suggests that this event has an effect on the
series (Perron, 1997).
Perron (1989) introduced three different models under the null hypothesis:
Model (1) tttt eyTbdDy +++= −1)(µ (5.5)
Model (2) tttt eDUyy +−++= − )( 1211 µµµ (5.6)
Model (3) ttttt eDUTbdDyy +−+++= − )()( 1211 µµµ (5.7)
where 1)( =tTbdD if 1+= BTt , 0 otherwise, and tDU =1 if BTt > and
,)()( tt LBeLA υ=
),,0.(..~ 2συ diit with )(LA and )(LB pth and qth order polynomials, respectively, in
the lag operator L. The innovation series { te }is taken to be the ARMA ( p, q) type with
the orders p and q possibly unknown. This postulate allows the series { ty }to represent
quite general processes. More general conditions are possible and will be used in
subsequent theoretical derivations.
The first model (5.5) permits an exogenous change in the level of the series,
which is referred to as a “crash model”. Under the null hypothesis of a unit root a
dummy variable is included, and takes the value one at the time of the break. The
second model (5.6) permits an exogenous change in the rate of the growth and is
referred to as a “changing growth model”. Under the null hypothesis, the drift parameter
µ changes from 1µ to 2µ at time BT . The third model (5.7) permits an exogenous
change for both.
Under the alternative hypothesis, Perron (1989) introduces three alternative
models as follow:
150
Model (1) ttt eDUy +−++= )( 1211 µµβµ (5.8)
Model (2) ttt eDTty +∗−++= )( 121 βββµ (5.9)
Model (3) ttt eDTDUty +−+−++= )()( 1212111 ββµµβµ (5.10)
where Bt TtDT −=* and tDTt = if BTt > and 0 otherwise.
BT refers to the time of the break, i.e., the period at which the change in the parameters
of the trend function occurs.
The first model (5.8) permits a one-time change in the intercept of the trend
function. Whilst the second model (5.9) allows for a change in the slope of the trend
function. Model (5.10) allows for both changes in the level and the slope to take place
simultaneously (Perron, 1989, p. 1364).
Two different models that have different implications with respect to this
structural effect have since been introduced. The first is the Additive Outlier model that
allows for a sudden change to the trend function. The second is the Innovational Outlier
model that allows for a gradual change to the trend function. Perron (1989)
implemented tests for the presence of a unit root in a framework that directly extends
the Dickey-Fuller strategy by adding dummy variables to the regression. He employed
the following three Augmented Dickey-Fuller equations which he called models (1), (2)
and (3):
tit
k
iit
At
AAt
AAt eycyTbDdtDUy ˆˆˆ)(ˆˆˆˆ
11 +∆+++++= −
=− ∑αβθµ (5.11)
tit
k
iit
Bt
BBt
BBt eycyDTtDUy ˆˆˆ*ˆˆˆˆ
11 +∆+++++= −
=− ∑αγβθµ (5.12)
tit
k
i
Cit
Ct
Ct
CCt
CCt eycyTbDdDTtDUy ˆˆˆ)(ˆˆˆˆˆ
11 +∆++++++= −
=− ∑αγβθµ (5.13)
151
For model (1), the “crash hypothesis” involves 1=Aα , 0=Aβ , 0=Aθ ; Model
(2), the “breaking slope with no crash”: 1=Bα , 0=Bγ , 0=Bβ ; and Model (3) where
both effects are allowed: 1=Cα , 0=Cγ , 0=Cβ . Under the alternative hypothesis of
a “trend stationary” process, we expect 1,, <CBA ααα ; 0,, ≠CBA βββ ;
0,, ≠CBA θθθ . Finally, under the alternative hypothesis, ,, CA dd and Bθ should be
close to zero while under the null hypothesis they are expected to be significantly
different from zero.
The results of Perron’s (1989) tests surprisingly rejected the unit root hypothesis
for 11 out 14 series analyzed by Nelson and Plosser (1982). These results confirm the
idea that where there is a structural break, the Dickey-Fuller tests are biased towards the
non-rejection of a unit root. Nevertheless, the statistical approach by Perron (1989) has
been criticized by several subsequent studies for the assumption of a known break,
which is assumed to be given exogenously. The problem with this assumption is that the
choice of the break point is based on visual inspection of the data and that the problems
to pre-testing or data-mining can arise. The criticism was first pointed out by Christiano
(1992) and followed later by several others including Zivot and Andrews (1992),
Banerjee, Lumsdaine and Stock (1992), Perron and Vogelsang (1992) and Perron
(1997). All of these studies follow new procedures, in which the choice of the break
point is considered as endogenously determined.
The new strategy in these studies endogenizes the choice for the time of the
break. They used different approaches to implement this strategy. Zivot and Andrews
(1992) extended Perron’s (1989) test to allow for structural change at an unknown
break. They consider the following null hypothesis for the series )( ty in the model:
ttt eyy ++= −1µ (5.14)
152
Zivot and Andrews assert that with this null hypothesis there is no need for the dummy
variable BDT . The alternative hypothesis stipulates that y can be represented by a
trend-stationary process with possible structural change occurring at an unknown point
in time. They followed Perron’s models but without including the dummy variable
tTbD )( in models (1) and (2). Under the alternative hypothesis, Zivot and Andrews
(1992) introduce three alternative models:
Model (A) tjt
k
j
Ajt
AAt
AAt eycytbTDUy ˆˆˆˆ)ˆ(ˆˆ
11 +∆++++= −
=− ∑αβθµ (5.15)
Model (B) tjt
k
j
Bjt
Bt
BBBt eycybTDTty ˆˆˆ)ˆ(ˆˆˆ
11 +∆++++= −
=− ∑αγβµ (5.16)
Model (C) tjt
k
j
Cjt
Ct
CCt
CCt eycybTDTtbTDUy ˆˆˆ)ˆ(ˆˆ)ˆ(ˆˆ
11 +∆+++++= −
=− ∑αγβθµ
(5.17)
where 1)ˆ( =bTDU t if bTt > , 0 otherwise and bt TtbTDT −=)ˆ( if bTt > .
The k extra regressors in the preceding regressions are added to eliminate possible
nuisance-parameter dependencies in the limit distributions of the test statistics caused
by temporal dependence in the disturbances.
The critical values in Zivot and Andrews (1992) are different to the critical
values of Perron (1989). The reason for this difference is that the selection of the time of
the break ( )bT is treated as the outcome of an estimation procedure, rather than
predetermined exogenously. Perron’s critical values are too small in absolute value and
hence biased towards rejecting the unit root null (Mills, 1999, p. 93).
Zivot and Andrews’s results show less conclusive evidence against the unit root
hypothesis than Perron (1989). They couldn’t reject the unit root hypothesis for 5 of the
11 Nelson and Plosser series for which Perron rejected the unit root hypothesis at the
153
5% level. However, Zivot and Andrew emphasized that the reverse results for these 5
series should not be considered as providing evidence for the unit root hypothesis, in
stead the reverse should be viewed as they are less evidence against the unit root
hypothesis for many of the series.
The testing for the unit root hypothesis that allows for a possible change in the
level of the series occurring at an unknown break point was continued by Perron and
Vogelsang (1992). In their study they considered similar models to those of Perron
(1989) and Zivot and Andrews (1992) Additive Outlier model (AO) for a sudden
change and the Innovational Outlier model (IO) for a gradual change. These tests are
based on the minimal value of the t statistics on the sum of the autoregressive
coefficients over all possible breakpoints in the appropriate augmented autoregression
(Perron and Vogelsang, 1992, p. 303).
In the case of the Additive Outlier model (AO), the null hypothesis of a unit root
is parameterized as follows:
tttt wyTbDy ++= −1)(δ (5.18)
where 1)( =tTbD if 1+= bTt and 0 otherwise. The sequence of errors { tw } is
specified to be a stationary and invertible (autoregressive moving average) ARMA
(p, q) process. More specifically, twLA )(* = teLB )( , where te is iid (0, 2σ ) with finite
fourth moment. )(* LA and )(LB are polynomials in L of order p and q, respectively,
whose roots are assumed to be strictly outside the unit circle.
Under the alternative hypothesis, the series ( ty ) does not contain a unit root, and
it is represented as:
ttt DUcy υδ ++= (5.19)
154
where 1=tDU if bTt > and 0 otherwise. The sequence of errors { tυ } is a stationary
and invertible ARMA (p+1, q) process of the form tt eLBLA )()( =υ . The mean of the
series is c up to time bT and δ+c afterward.
In the case of using the Innovational Outlier model (IO), the null hypothesis of a
unit root is parameterized:
))()((1 tttt TbDeLyy θψ ++= − (5.20)
where )()()( 1* LBLAL −=ψ defines the moving average representation of the noise
function with )(* LA and )(LB as defined in (5.18).
The alternative hypothesis of the model is represented by:
))(( ttt DUeLay δφ ++= (5.21)
Models (5.20) and (5.21) can be approximated by the following regression:
(5.22)
under the null hypothesis of a unit root, α is equal to 1 (which also implies 0=δ ).
Hence the appropriate testing strategy is to use the t statistics for testing 1=α when the
previous regression is estimated by ordinary least square (OLS).
Perron (1997) re-examines his (1989) findings, with the time of the break
unknown. He presents a statistical procedure used to test for a unit root allowing for the
presence of structural change in the trend function occurring at most once. This change
is assumed to occur gradually (Innovational Outlier model) by including dummy
variables for the structural change into the Augmented Dickey-Fuller test. Three
parameterizations of structural break models have been considered, model 1, model 2
and model 3. Both models 1 and 2 are Innovational Outlier models taking the following
specifications:
∑=
−− +∆+++ + =k
ititittt t eycyTbDDU y
11)( αθδ µ
155
Model (1) allows for a one time change in the intercept of the trend function:
t
k
ititttt eycyTbDDUty ∑
=−− +∆+++++=
111)( αδθβµ (5.23)
where =tDU 1 if BTt > , 0 otherwise, and 1)( =tTbD if 1+= BTt , 0 otherwise.
Model (2) is the most inclusive model, allowing for the occurrence of both
changes in the intercept and in the slope of the trend function. It is performed using the
t-statistic for the null hypothesis: 1=α
t
k
itittttt eycyTbDDTDUty ∑
=−− +∆++++++=
111)( αδγθβµ (5.24)
where tDT = 1(t) if BTt > , 0 otherwise.
Model (3) is an Additive Outlier model that allows for a sudden and rapid
change to the trend function. This model uses a two-step procedure. First, the series is
de-trended as follows:
ttt yDTty ~* +++= γβµ (5.25)
where )(1*bt TtDT −= if bTt > , 0 otherwise.
The test is then performed using the t-statistic for 1=α in the regression:
∑=
−− +∆+=k
itititt eycyy
11
~~~ α (5.26)
In all of these regressions, Tb and k are treated as unknown.
Perron’s (1997) method is different from Zivot and Andrews (1992) in the
following aspects. First, the model estimated by Perron (1997) is considered the most
inclusive model in comparison with either Zivot and Andrews (1992) or Perron and
Vogelsang (1992). Perron retains the one-time dummy tTbD )( in regressions (1) and
(2). Second, he considers both the F-sig and t-sig procedures to select the truncation lag.
Third, he selects the break date using a test of significance on the coefficient of the
156
change in slope. The findings of Perron (1997) confirm the results presented in Perron
(1989), that is most of the rejections reported in Perron (1989) are confirmed. So,
Perron’s (1997) study is considered the most inclusive among all studies in testing for a
unit root in the presence of a structural change at an unknown time of the break. It is
therefore decided for this study to use Perron’s (1997) procedure.
5.4.1 Procedures for Selecting the Order of the Lag1 An important issue that should be considered when implementing the ADF test is how
to select the lag length. Several studies have observed that the size and the power
properties of the ADF test are sensitive to the lag length, (Hall (1994) and Ng and
Perron (1995)). Regarding this matter, there have been several methods on how to best
select the lag length. The most widely used are the Bayesian Information Criterion
(BIC) method by Schwartz (1978), the procedure used by Said and Dickey (1984) and
the general-to-specific method by Hall (1994). The method used by Said and Dickey
(1984) uses an F-test for the joint significance of the coefficient on the lagged first
differences of the data. The general-to-specific method based on the significant t-
statistic of the coefficient associated with the last included lag in the estimated
regression. In other words, we test the significance of the highest order lag, starting with
a maximum order of lag and reducing the order until the last lag becomes significant.
This determines the lag k and if no lags are significant then k is set to 0. According to
Ben-David and Papell (1997) the maximum order of lag should be set at 8 but most of
the statistical packages set the lag at 12. A two-sided 10% test based on the asymptotic
normal distribution is used to assess the significant of the last lags (Perron 1997). The
general to specific procedure is more preferable than other methods based on
1 These procedures have been used by most of the previous mentioned literature.
157
information criteria. Perron (1994, p. 139) indicates that “methods based on information
criteria tend to select very parsimonious models leading to tests with sometimes serious
size distortions”. However, this study will consider a general to specific procedure
rather than other methods based on information criteria.
5.4.2 Procedures for Determining the Time of the Break In order to determine the time of a break endogenously at an unknown break point, two
methods have been suggested by most of the previous studies such as Banerjee et al.
(1992), Zivot and Andrew (1992), Perron and Vogelsang (1992), Perron (1997), and
Vogelsang and Perron (1998). The first method is that the time of the break bT is
selected as the value, which minimizes the t-statistic for testing 1=α . The reason for
this selection is to make it more likely to reject the null hypothesis of 1=α (Wilson,
2004, p.16). In this context, Zivot and Andrews (1992) choose the break point that gives
the least favorable result for the null hypothesis.
The second method is that bT is selected as to minimize either the t-statistic on
the parameter associated with the change in the intercept ( θt ), or the t-statistic on the
change in the slope ( γt ), or both of them. According to Perron (1997) the break point is
selected using the maximum of the absolute value of ( θt ) or ( γt ), or both of them. After
calculating the t-statistic for 1=α , it is compared with their critical values. The critical
value depends on the proportion of the observation occurring priori to the break; this
proportion is denoted by TTb=λ , where T is the total number of observations. The
values of λ ranges between 0 and 1and the critical values are identical to the Dickey-
Fuller statistics when 0=λ and 1=λ . The structural change occurs when 10 << λ . If
158
the t-statistic is grater than the critical value calculated by Perron then reject the null
hypothesis of a unit root (Enders, 2004, pp. 203-204).
However, before applying these tests on the stock markets in the MENA region,
two comments are important to be mentioned at this stage. First, the power of these tests
has been questioned by Perron himself and others. They raise the issue of the trade-off
between the power of the test and the amount of information incorporated with respect
to the choice of break point (Perron, 1997, p. 378). That is, assuming an unknown break
point will be less powerful than if the break point is already known. Second, these tests
were recently extended again by allowing for the possibility of multiple endogenous
break points in the linear regression model. Several studies argue that allowing for the
possibility of two endogenous breaks points show more evidence against the unit root
hypothesis (Maddala and Kim, 2003). However, it is believe that when testing for a unit
root and allowing for structural change at an unknown break, by doing this, we are
finding the most significant break. Consequently the debate is still continuing and this
important area of research is attracting more researchers to join the debate.
5.5 Testing for Structural Changes in MENA Stock Markets Based on the brief review of the literature, it appears that Perron’s (1997) method is the
most inclusive. Perron proposes models (1) and (2) as Innovational Outlier models and
model (3) as an Additive Outlier model. All of these models have null hypothesis of I(1)
against the alternative hypothesis of I(0) with a structural change at an unknown time of
the break. This study will start with the least restrictive model (2), represented by
equation 5.24. This model allows for a gradual change in the trend function and
provides the most general specifications. It also allows for the occurrence of changes in
159
both the intercept and in the slope of the trend function. If the γ̂t is statistically not
significant, then the results of an (IO1) is considered.
The results of estimated model (2) are reported in table 5.11. These results
indicate that the stock price indices for all markets (in levels) show evidence of a non
stationarity, as the values of α̂t (in absolute value) for all variables are less than the
critical values. The α̂t for Egypt is -3.074, for Turkey is -4.671, for Jordan is -4.581,
and for Morocco is -3.487. These values are less than the critical value at 5%, which
equals to -5.57. Also, in the case of Turkey and Jordan, it is found that the coefficients
for all dummy variables and trends are significant. These results of model (2) for all
stock markets confirm the results of ADF and PP tests.
The time of the break for Turkey is found to be in 1999:7, while for Jordan is in
2001:12. Both of these breaks are represented by dotted lines in figure 5.30. These
breaks are found to be coinciding with the real events affecting both indices. This is also
clear when comparing the time of the break with the plot for each index. The stock
market in Turkey (ISE) has been affected by both of the Asian financial crisis in 1997
and the Russian crisis in 1998. Both crises had negative impacts on the Turkish
economy as a whole and on the financial sector in particular. This negative impact was
very clear over most of 1999. Despite some improvements in the beginning of 2000,
investors in 2000 (as a result of this uncertainty) transferred around $7 billion out of the
economy and between January and August 2000 the ISE index had crashed by 19%. In
the year 2001 all market indicators had declined significantly, the market capitalization
fell to $47,150 million compared with $69,659 million in 2000.
The stock market in Jordan has been affected by the limits to investor
confidence and political developments in the region especially the “Second Palestinian
160
Intifada”1. This Intifada casts its shadow on the Jordanian market during 2000. The
stock market witnessed continuous improvements after the year 2000. Despite some
interruptions after the 11th September 2001 attacks, the stock markets continued to
achieve significants growth in its indicators.
In the case of two monthly stock price indices, namely Egypt and Morocco, it is
found that the coefficients for all dummy variables are not significant. Specifically, the
coefficient of the γ̂t is statistically not significant. In this case, Model (1), which is
represented by equation 5.23, is applied for these two indices. As it is known, model (1)
allows for a one time change in the intercept of the trend function. The results for model
(1) are reported in table 5.122. All coefficients for both variables (Egypt and Morocco)
are significant. The α̂t for Egypt and Morocco are -3.205 and -3.525, respectively.
These values are less than the critical value (in absolute value) at 5%, which equals to -
4.80. These results of model (1) for stock markets in both Egypt and Morocco confirm
the results of ADF and PP tests.
Regarding the time of the break for each index, it is found that the time of break
in case of Egypt is in 2001:4, while for Morocco is in 1996:11. These times of the
breaks are represented by dotted lines in figure 5.30. These breaks are found to be
coinciding with the real events affecting both indices. The stock market in Egypt has
witnessed a sharp drop in all market indicators in the year 2000. The Egyptian economy
was under enormous pressure during 2000 and 2001 because of a sharp drop in oil
1 Intifada came into common usage in English as the popularized name for two recent Palestinian campaigns directed at ending the Israeli military occupation. These two uprisings have been significant aspects of the Israeli Palestinian conflict in recent years: 1. The first Intifada began in 1987. Violence declined in 1991 and came to an end with the signing
of the Oslo accords (August 1993) and the creation of the Palestinian National Authority. 2. The Al-aqsa Intifada (also known as the Second Palestinian Intifada or the Second Intifada) was
the violent Palestinian-Israeli conflict that began in September of 2000. (http://www.wikipidia.com).
2 Model (1) is run for all variables, even though our main aim is to show the results for the stock market indices for Egypt and Morocco.
161
prices, a sharp decrease in tourism revenue after Luxor events, and the continuing
violence and political crisis in the Middle East. All of these factors played a vital role in
weakening the performance of the Egyptian economy. By January 2001, the Egyptian
Pound was devalued by 9.6%. After that the central bank adopted a more flexible
exchange rate policy and further devalued the Pound by 6.4% in August 2001. All of
these events had a negative impact on the Egyptian Stock Market indicators.
The stock market in Morocco has witnessed a sharp drop in trading value
during 1996, which has a negative impact on the performance of Casablanca Price
index. Despite the huge reduction in the trading value during 1996, it is believed that the
signing of the trade agreement with the European Union in 1996 pushed for further
improvements in the private sector. This was reflected in the improved performance of
the Casablanca stock Exchange at the end of 1996 and during 1997 Moreover, the
results show that the time of the break for Morocco is the same when using both models
(1) and (2), is 1996: 11.
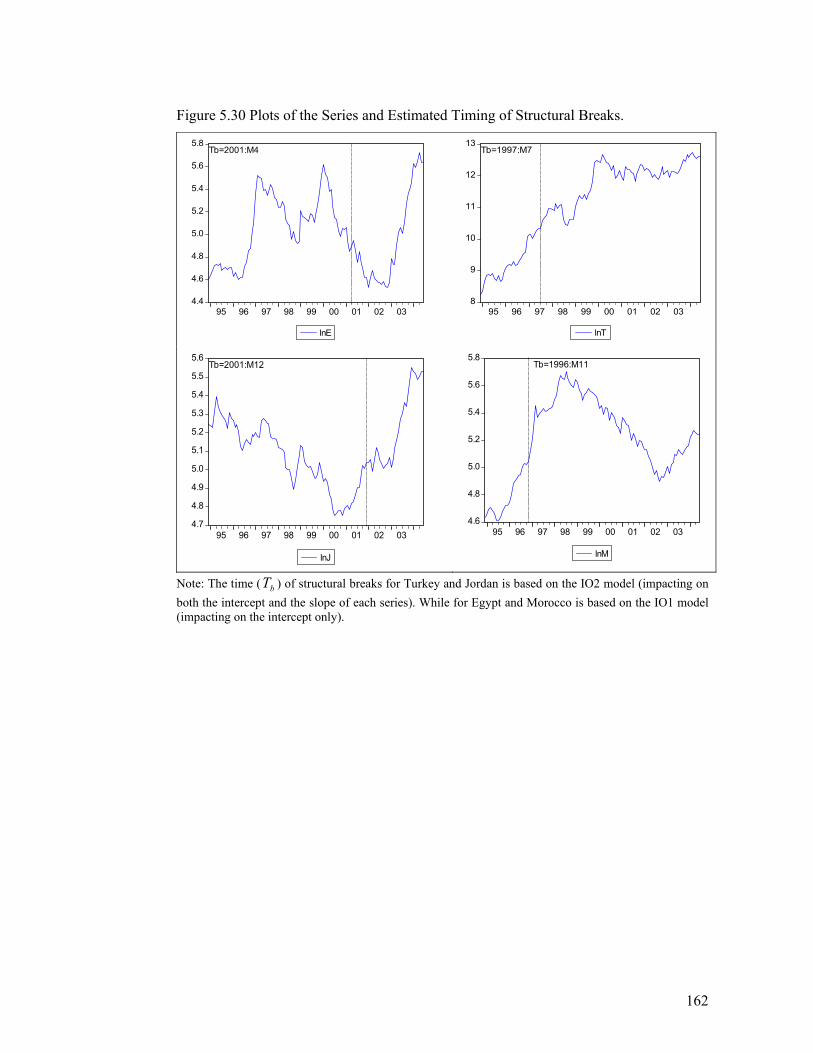
162
Figure 5.30 Plots of the Series and Estimated Timing of Structural Breaks.
4.4
4.6
4.8
5.0
5.2
5.4
5.6
5.8
95 96 97 98 99 00 01 02 03
lnE
Tb=2001:M4
8
9
10
11
12
13
95 96 97 98 99 00 01 02 03
lnT
Tb=1997:M7
4.7
4.8
4.9
5.0
5.1
5.2
5.3
5.4
5.5
5.6
95 96 97 98 99 00 01 02 03
lnJ
Tb=2001:M12
4.6
4.8
5.0
5.2
5.4
5.6
5.8
95 96 97 98 99 00 01 02 03
lnM
Tb=1996:M11
Note: The time ( bT ) of structural breaks for Turkey and Jordan is based on the IO2 model (impacting on both the intercept and the slope of each series). While for Egypt and Morocco is based on the IO1 model (impacting on the intercept only).
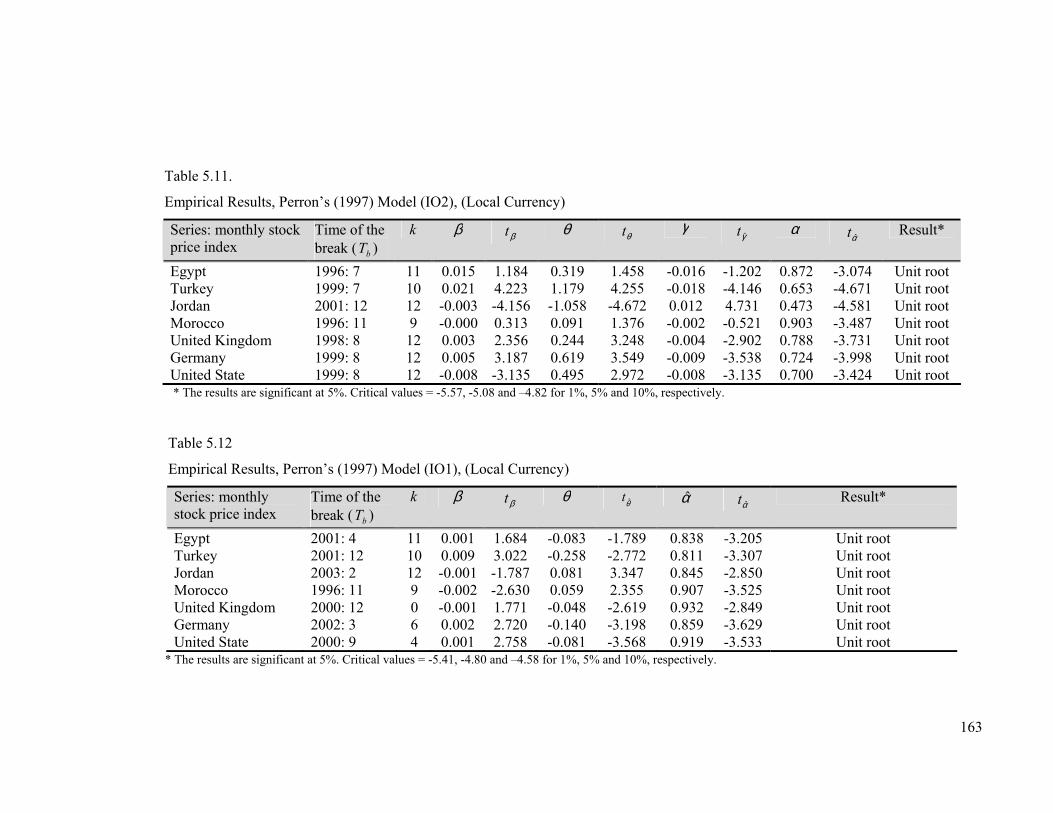
163
Table 5.11.
Empirical Results, Perron’s (1997) Model (IO2), (Local Currency)
Series: monthly stock price index
Time of the break ( )bT
k β βt θ θt γ γ̂t α
α̂t Result*
Egypt 1996: 7 11 0.015 1.184 0.319 1.458 -0.016 -1.202 0.872 -3.074 Unit root Turkey 1999: 7 10 0.021 4.223 1.179 4.255 -0.018 -4.146 0.653 -4.671 Unit root Jordan 2001: 12 12 -0.003 -4.156 -1.058 -4.672 0.012 4.731 0.473 -4.581 Unit root Morocco 1996: 11 9 -0.000 0.313 0.091 1.376 -0.002 -0.521 0.903 -3.487 Unit root United Kingdom 1998: 8 12 0.003 2.356 0.244 3.248 -0.004 -2.902 0.788 -3.731 Unit root Germany 1999: 8 12 0.005 3.187 0.619 3.549 -0.009 -3.538 0.724 -3.998 Unit root United State 1999: 8 12 -0.008 -3.135 0.495 2.972 -0.008 -3.135 0.700 -3.424 Unit root
* The results are significant at 5%. Critical values = -5.57, -5.08 and –4.82 for 1%, 5% and 10%, respectively.
Table 5.12
Empirical Results, Perron’s (1997) Model (IO1), (Local Currency)
Series: monthly stock price index
Time of the break ( )bT
k β βt θ θ̂t α̂ α̂t Result*
Egypt 2001: 4 11 0.001 1.684 -0.083 -1.789 0.838 -3.205 Unit root Turkey 2001: 12 10 0.009 3.022 -0.258 -2.772 0.811 -3.307 Unit root Jordan 2003: 2 12 -0.001 -1.787 0.081 3.347 0.845 -2.850 Unit root Morocco 1996: 11 9 -0.002 -2.630 0.059 2.355 0.907 -3.525 Unit root United Kingdom 2000: 12 0 -0.001 1.771 -0.048 -2.619 0.932 -2.849 Unit root Germany 2002: 3 6 0.002 2.720 -0.140 -3.198 0.859 -3.629 Unit root United State 2000: 9 4 0.001 2.758 -0.081 -3.568 0.919 -3.533 Unit root
* The results are significant at 5%. Critical values = -5.41, -4.80 and –4.58 for 1%, 5% and 10%, respectively.
164
In order to test for robustness, the Innovational Model (IO) by Perron and
Vogelsang (1992), represented by equation 5.22, is applied. This model allows for a
structural break in the mean of the series with the change supposed to affect the level of
the series gradually. The results for this approach are reported in table 5.13. Again the
results indicate that all variables show evidence of a non stationarity, as the values of α̂t
for all variables (in absolute value) are less than the critical values computed by Perron
and Vogelsang (1992). The coefficients of the dummy variable for the time of the break
tTbD )( for five variables, except for Morocco and Germany, are not significant. The
coefficient of the tTbD )( for Morocco is 2.843, while for Germany is 1.961. In general,
these results confirm the previous results by both the conventional unit root tests (ADF)
and (PP), and Perron (1997) models (2) and (1).
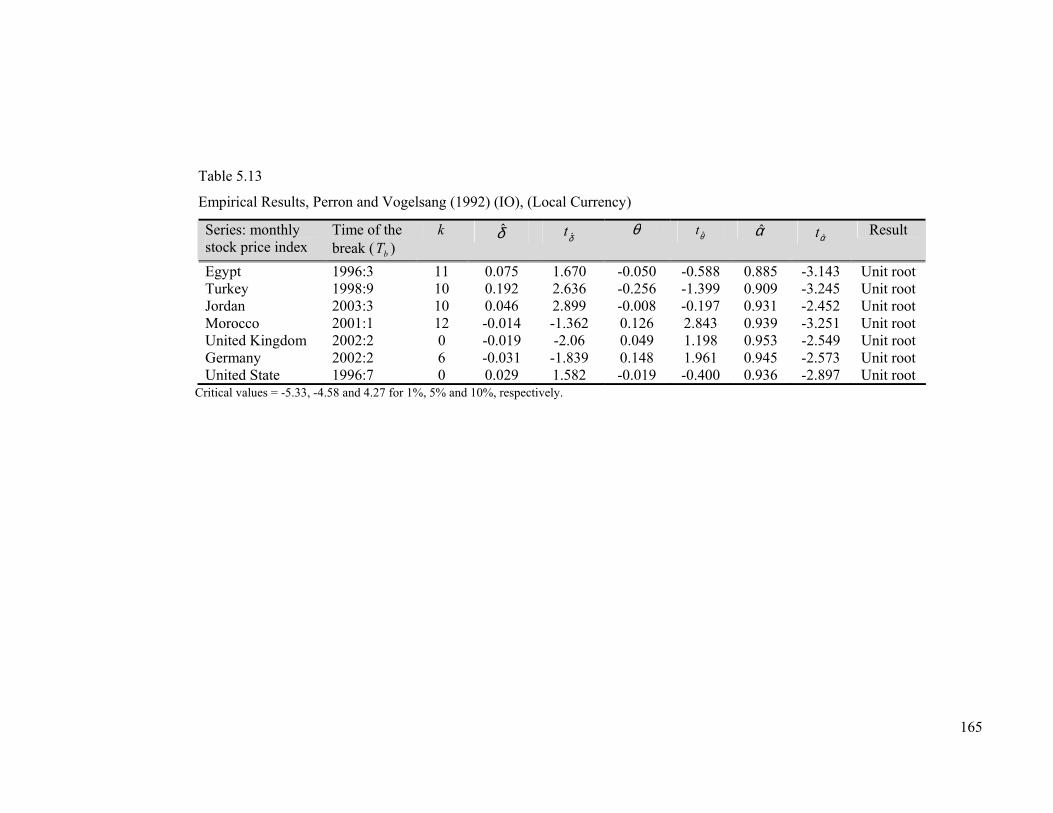
165
Table 5.13
Empirical Results, Perron and Vogelsang (1992) (IO), (Local Currency)
Critical values = -5.33, -4.58 and 4.27 for 1%, 5% and 10%, respectively.
Series: monthly stock price index
Time of the break ( )bT
k δ̂ δ̂t θ θ̂t α̂ α̂t Result
Egypt 1996:3 11 0.075 1.670 -0.050 -0.588 0.885 -3.143 Unit root Turkey 1998:9 10 0.192 2.636 -0.256 -1.399 0.909 -3.245 Unit root Jordan 2003:3 10 0.046 2.899 -0.008 -0.197 0.931 -2.452 Unit root Morocco 2001:1 12 -0.014 -1.362 0.126 2.843 0.939 -3.251 Unit root United Kingdom 2002:2 0 -0.019 -2.06 0.049 1.198 0.953 -2.549 Unit root Germany 2002:2 6 -0.031 -1.839 0.148 1.961 0.945 -2.573 Unit root United State 1996:7 0 0.029 1.582 -0.019 -0.400 0.936 -2.897 Unit root
166
All of these tests were based on expressing the stock market indices in local
currency. However, the same tests are redone by expressing the indices in $US. Tables
5.14 - 5.15 show the results using Perron (1997) Innovational Outlier models (2) and
(1). Starting with Innovational Outlier model (IO2), the results, reported in table 5.14,
indicate that all variables show evidence of a non-stationarity. The values of α̂t (in
absolute value) for all stock price indices in the MENA markets are less than the critical
values. However, the coefficients of the γ̂t are statistically not significant for Egypt,
Turkey and Morocco (just Jordan is found to be significant). In this case Innovational
Outlier model (1), which is represented by equation 5.23, is applied for these three
indices. As it is known, model (1) allows for a one time change in the intercept of the
trend function. The results for model (1) are reported in table 5.15. The values of α̂t (in
absolute value) for all stock price indices in the MENA markets are less than the critical
values. All dummy variables are significant except the coefficient of the trend in the
case of Egypt is statistically not significant.
In order to test for robustness, the Innovational Model (IO) by Perron and
Vogelsang (1992) is applied. This model allows for a structural break in the mean of the
series with the change supposed to affect the level of the series gradually. The results
for this approach are reported in table 5.16. The results indicate that all variables show
evidence of a non-stationarity.
The results of conducting the unit root test in the presence of structural change
by expressing the indices in $US and local currency indicate that all variables show
evidence of a non-stationarity. However, some differences are observed between the
$US and the local currency results. These included the time of the structural break of the
estimated levels of significance of some of the tests. The reasons for observing these
differences could be because local currency incorporates hedging activities of investors
167
against foreign exchange rates, while expressing indices in $US does not incorporate
such activities. Moreover, the local currency could include variations such as exchange
rate movements, domestic inflation, domestic monetary policy and political
developments, all of them are incorporated in local currency but not $US. In terms of
detecting structural breaks, the local currency results are much closer to observed real
changes experienced by each country. This is consistent with the detected high levels of
significance of important estimated parameters. For these reasons, this study will
continue with local currency.
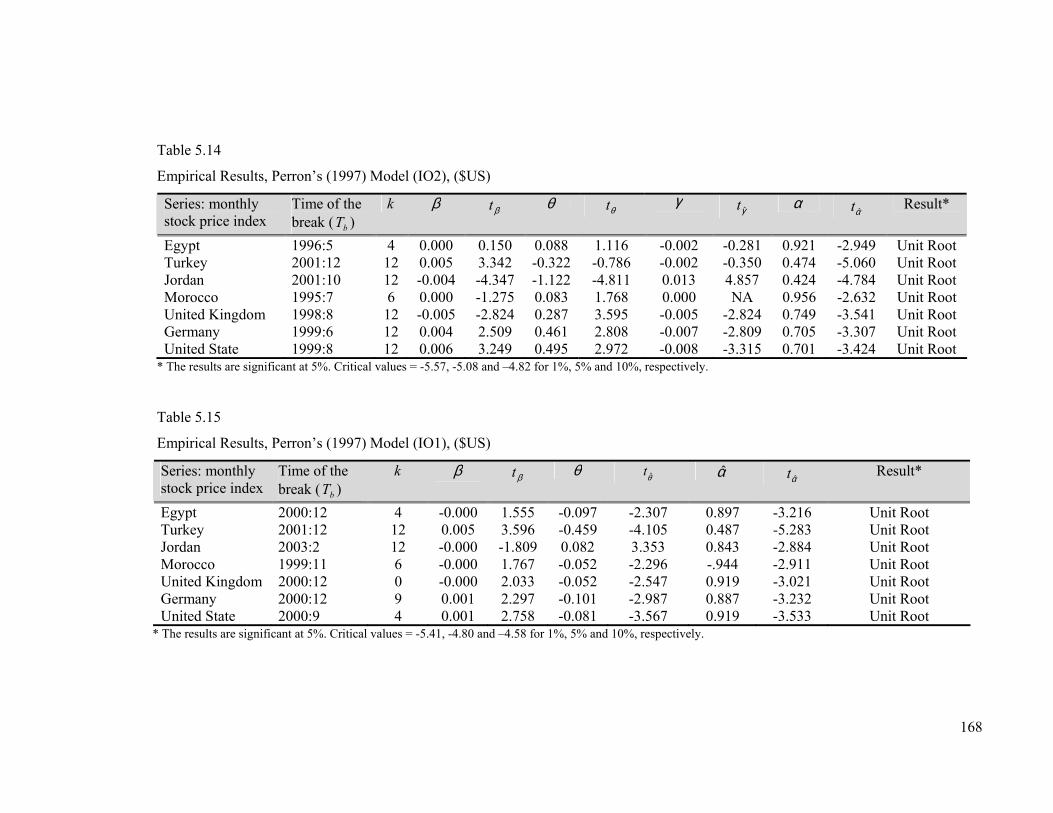
168
Table 5.14
Empirical Results, Perron’s (1997) Model (IO2), ($US)
Series: monthly stock price index
Time of the break ( )bT
k β βt θ θt γ γ̂t α
α̂t Result*
Egypt 1996:5 4 0.000 0.150 0.088 1.116 -0.002 -0.281 0.921 -2.949 Unit Root Turkey 2001:12 12 0.005 3.342 -0.322 -0.786 -0.002 -0.350 0.474 -5.060 Unit Root Jordan 2001:10 12 -0.004 -4.347 -1.122 -4.811 0.013 4.857 0.424 -4.784 Unit Root Morocco 1995:7 6 0.000 -1.275 0.083 1.768 0.000 NA 0.956 -2.632 Unit Root United Kingdom 1998:8 12 -0.005 -2.824 0.287 3.595 -0.005 -2.824 0.749 -3.541 Unit Root Germany 1999:6 12 0.004 2.509 0.461 2.808 -0.007 -2.809 0.705 -3.307 Unit Root United State 1999:8 12 0.006 3.249 0.495 2.972 -0.008 -3.315 0.701 -3.424 Unit Root
* The results are significant at 5%. Critical values = -5.57, -5.08 and –4.82 for 1%, 5% and 10%, respectively.
Table 5.15
Empirical Results, Perron’s (1997) Model (IO1), ($US)
Series: monthly stock price index
Time of the break ( )bT
k β βt θ θ̂t α̂ α̂t Result*
Egypt 2000:12 4 -0.000 1.555 -0.097 -2.307 0.897 -3.216 Unit Root Turkey 2001:12 12 0.005 3.596 -0.459 -4.105 0.487 -5.283 Unit Root Jordan 2003:2 12 -0.000 -1.809 0.082 3.353 0.843 -2.884 Unit Root Morocco 1999:11 6 -0.000 1.767 -0.052 -2.296 -.944 -2.911 Unit Root United Kingdom 2000:12 0 -0.000 2.033 -0.052 -2.547 0.919 -3.021 Unit Root Germany 2000:12 9 0.001 2.297 -0.101 -2.987 0.887 -3.232 Unit Root United State 2000:9 4 0.001 2.758 -0.081 -3.567 0.919 -3.533 Unit Root
* The results are significant at 5%. Critical values = -5.41, -4.80 and –4.58 for 1%, 5% and 10%, respectively.
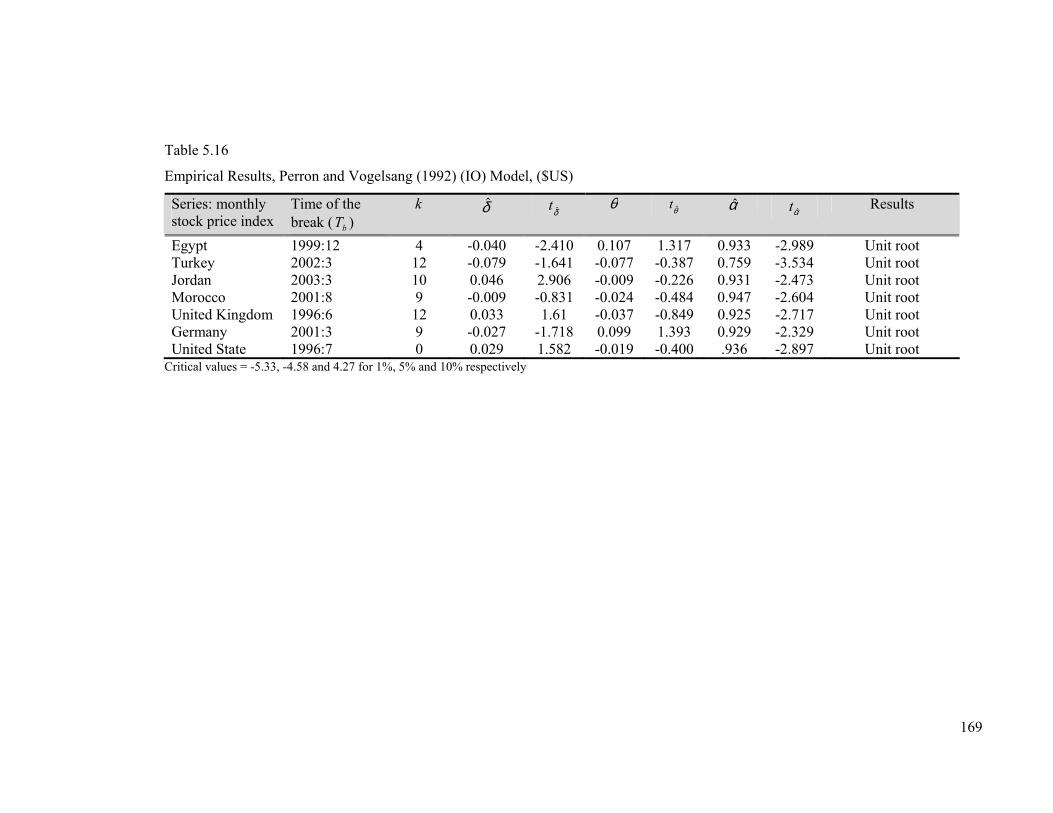
169
Table 5.16
Empirical Results, Perron and Vogelsang (1992) (IO) Model, ($US)
Critical values = -5.33, -4.58 and 4.27 for 1%, 5% and 10% respectively
Series: monthly stock price index
Time of the break ( )bT
k δ̂ δ̂t θ θ̂t α̂ α̂t Results
Egypt 1999:12 4 -0.040 -2.410 0.107 1.317 0.933 -2.989 Unit root Turkey 2002:3 12 -0.079 -1.641 -0.077 -0.387 0.759 -3.534 Unit root Jordan 2003:3 10 0.046 2.906 -0.009 -0.226 0.931 -2.473 Unit root Morocco 2001:8 9 -0.009 -0.831 -0.024 -0.484 0.947 -2.604 Unit root United Kingdom 1996:6 12 0.033 1.61 -0.037 -0.849 0.925 -2.717 Unit root Germany 2001:3 9 -0.027 -1.718 0.099 1.393 0.929 -2.329 Unit root United State 1996:7 0 0.029 1.582 -0.019 -0.400 .936 -2.897 Unit root
170
5.6 The Random Walk Behavior and the Efficiency of the MENA Stock Markets
In the pervious sections, we test for unit roots in the presence of structural
change using the Innovational Outlier models proposed by both Perron (1997) and
Perron and Vogelsang (1992). The results verify the main findings drawn form the ADF
and PP unit root tests. All the variables show evidence of a non-stationarity, which
means that all indices are integrated of order one I(1).
This indicates the efficiency of the MENA stock markets. The efficient stock
market is characterized by a random walk process, where the future prices should be
random and unpredictable. The random walk hypothesis is associated with the weak
form of the efficient market hypothesis. This asserts that all the information contained
in the history of yesterday’s stock prices are reflected in today’s stock prices.
The result of this study is identical to several previous that studies have
examined random walks in different stock markets in the world. These studies include
Dezelan (2000), Lee et al. (2001), Cheung and Coutts (2001), Smith et al. (2002) and
Narayan and Smith (2004). However, based on the previous results, all stock markets in
the MENA region are characterized by a unit root, which is consistence with the
efficient market hypothesis.
The presence of random walks in these stock markets plays an important role in
attracting foreign equity portfolio, boosting domestic saving and improving the pricing
and availability of capital. This has important implications for the allocation of capital
within an economy and hence overall economic development (Worthington and Higgs,
2003, p. 2).
171
5.7 Conclusion The main purpose of this chapter is to test for structural changes in selected stock
markets of the MENA region. The chapter starts with presenting some descriptive
statistics for the monthly returns of four emerging stock markets in the MENA region,
namely Egypt, Turkey, Jordan and Morocco and for three developed stock markets in
the US, UK and Germany. The study covers the period of December 1994 to June 2004.
The statistics show that Turkey has the highest average returns of 3.83%, and
volatility of 16.5% as measured by the standard deviation among all seven stock
markets. In comparison, Egypt has the lowest average returns of 0.18%, and the lowest
volatility of 1.6%. Moreover, the correlation matrices among all monthly stock markets
indices and returns show that most stock markets in MENA region are correlated with
each other, especially the Egyptian stock market is found to be highly correlated with all
MENA markets. However, Turkish index returns show higher correlation coefficients
with returns from developed countries than with MENA countries returns.
The conventional Augmented Dickey-Fuller (ADF) and Phillips-Perron (PP)
unit root tests are then conducted. The results fail to reject the null hypothesis of a unit
root for all monthly stock price indices using both local currency and $US. This
indicates that all indices are non stationary. The same tests are applied to the first
differences of the indices expressed in both local currency and $US and the results from
both tests reject the null hypothesis of non-stationarity across all indices. This means
that all indices become stationary if they are first differenced once. They therefore
follow a unit root process, which means that all indices are integrated of order one I(1).
The main aim of the chapter is to test for a unit root in the presence of structural
change at an unknown time of the break. The reason for this test is that when
performing these conventional unit root tests for a time series where there are structural
172
breaks, these tests are believed to be biased towards the non-rejection of the unit root
hull hypothesis. We use Innovational Outlier models proposed by Perron’s (1997) and
Perron and Vogelsang (1992). These more appropriate tests reinforce the main findings
drawn form the ADF and PP unit root tests that all the variables are integrated of order
one I(1). Regarding the endogenously determined time of the break for each stock
market, the results show that they coincide with the real events affected each stock price
index.
Finally, based on the result that all stock markets in the MENA region are
characterized by a random walk hypothesis, this indicates that these markets are
efficient. The reason behind this conclusion is because random walk hypothesis is
associated with the weak form of the efficient market hypothesis.
173
Chapter Six
Stock Market Integration in the MENA Region:
Cointegration and Causality Tests
6.1 Introduction A significant amount of recent research in empirical economics and finance has been
proposed to test for stock market integration. For this purpose a number of tests for
cointegration have been introduced over the past two decades. The most commonly
used cointegration tests are the Engle-Granger test (1987) that uses a two-step residual-
based procedure for testing the null of a no cointegration and Johansen’s test (1988,
1991, and 1995) that uses a system-based reduced rank regression approach1. In
addition to these two techniques, several others have been used such as Park’s
techniques (1990), and those of Phillips and Hansen (1990), Shin (1994) and Gregory
and Hansen (1996a, 1996b). The main feature for all of these methods is that they
concentrate on cases in which the underlying variables are integrated of order one.
However, a more advanced cointegration approach has been used recently by other
studies. This approach is the Autoregressive Distributed Lag (ARDL) approach to
cointegration.
The purpose of this chapter is to empirically estimate the integration among
stock markets in the MENA region, namely Egypt, Turkey, Jordan and Morocco, and
between the MENA region and the developed stock markets in the US, the UK and
Germany. The study will utilise the ARDL approach. The study of integration among
1 These two approaches have been analyzed in details in Appendix B.
174
the MENA stock markets and between these markets and developed stock markets is
essential to analyze the consequences of this integration, as the stock market integration
has several direct and indirect potential benefits. Also, an analysis will be presented
related to the implication of finding integration among these markets. An important
contribution made by this chapter is to shed more light on the effect of the existence of
cointegration among stock markets on the efficiency of the stock market. Moreover, this
chapter will test for the Granger-causality within a Vector Error Correction Model
(VECM). The main objective of this test thus is to explore the short and long-run
dynamic relationships among the MENA stock markets and between these markets and
developed markets.
This chapter is divided into seven sections. Section 2 presents an analytical
review for the Autoregressive Distributed Lag (ARDL) model. Section 3 describes the
specification of this model. The interpretation of the results is presented in section 4.
The implications of the empirical results are presented in section 5. Section 6 examines
the Granger causality test results, while the final section concludes the chapter.
6.2 The Autoregressive Distributed Lag (ARDL) Approach to Cointegration
This study utilizes the newly proposed autoregressive distributed lag (ARDL) approach,
recently developed and introduced by Pesaran and Shin (1995 and 1998), Pesaran et al.
(1996), Pesaran (1997) and Pesaran et al. (2001). More of the recent studies indicate
that ARDL approach is preferred in estimating the cointegration relation. It is preferred
over other methods like Engle and Granger (1987), Johansen (1988), Phillips and
Hansen (1990) and Gregory Hansen (1996).
175
The ARDL approach has been recognized as a more preferable approach than
other cointegration approaches for the following reasons:
1. Conventional cointegration methods concentrate on those cases in which the
underlying variables are integrated of order one, “which introduce a further
degree of uncertainty into the analysis of levels relationships” (Pesaran, et al.
2001, p. 289). The ARDL approach is applicable irrespective of whether the
underlying regressors are purely )0(I , purely )1(I or mutually cointegrated. The
statistic underlying this procedure is the Wald or F-statistic in a generalized
Dickey-Fuller type regression, which is used to test the significance of lagged
levels of the variables under consideration in a conditional unrestricted
equilibrium error correction model (ECM) (Pesaran, et al. 2001, pp. 289-290).
2. The pre-testing procedure in the unit root cointegration literature is particularly
problematic, where the power of the unit root tests is typically very low, and
there is a switch in the distribution function of the test statistics as one or more
roots of the tx process approach unity (Pesaran, 1997, p. 184).
3. Unlike most of the conventional cointegration procedures, which are valid for
large sample size, the ARDL approach is more robust and performs well for
small sample sizes – such as this study - than other cointegration techniques. In
this context, this study uses monthly data for 115 observations during the period
December 1994 to June 2004 and it is considered as a small sample size.
However, increasing the number observations by using daily or weekly data
does not add robustness to the cointegration results, because what matters is the
length of the period not the number of observations (Narayan, 2004).
4. More of the Monte Carlo results indicate strongly that the ARDL approach is
preferable to other methods of estimating the long-run coefficients in the light of
176
the sensitivity of the diagnostic test of the specification of the ECM to
alternative estimation methods (Gerrard and Godfrey, 1998).
5. By using the ARDL approach, one can estimate the long-run and the short-run
components of the model simultaneously. Furthermore, this method can
distinguish which series is the dependent variable from the F-test when
cointegration exists (Narayan and Narayan, 2003, 11). The ARDL approach
allows for the inclusion of deterministic or exogenous regressors in the
cointegration relation.
6. The ARDL approach is robust against simultaneous equation bias and
autocorrelation on the condition that the orders of the ARDL are adequately
selected on the basis of a priori knowledge or estimated using a model selection
procedure such as Akaike Information Criterion (AIC) or Schwarz-Bayesian
Criterion (SBC) (Laurencson et al., 2003, p. 28). However, Pesaran and Shin
(1998) insist that the using of SBC performs to some extent better than AIC, and
that is as the SBC is considered as amore consistent model selection criterion
than AIC.
7. Most of applied models, such as those based on the VAR methodology, are very
sensitive to the non-normality of the data. Several previous and recent studies,
such as Groslambert and Kassibrakis (1999), Hwang and Satchell (1999) and
Piesse and Hearn (2002), have questioned the validity of these models for
analyzing non-normal data.
For all the reasons mentioned before, this study will adopt the ARDL approach
to examine the long-run equilibrium relationship among stock price indices in the stock
markets in the MENA region and between these market and developed markets.
177
Based on the results of conducting unit root tests in the presence of structural
change, it is found that the times of the breaks for all indices coincided with real events
when expressing the indices in local currency. In this chapter, the investigation of the
long-run equilibrium relationship will be carried on using stock prices indices expressed
in local currency.
The ARDL approach involves estimating conditional error correction version of
the ARDL model for variables under estimation.
According to (Pesaran and Pesaran 1997 and Pesaran and Shin 2001) the
augmented ARDL ( ),...,,, 21 kqqqp is given by the following equation:
∑=
+′++=k
ittitiit wxqLaypL
10 ),(),( ελβα nt ,...,1=∀ (6.1)
where pp LLLpL αααα −−−−= ...1),( 2
21 ,
i
i
qiqiiiii LLLqL βββββ ++++= ...),( 2
210 ki ,...,2,1=∀ ,
ty is the dependent variable,
0a is the constant term,
L is the lag operator such that 1−= tt yLy , and
tw is 1×s vector of deterministic variables such as the intercept term, a time
trend variable, or exogenous variables with fixed lags.
The long-run elasticities are estimated by:
p
qiiiiii p
q
ˆ21
ˆ10
ˆ...ˆˆ1
ˆ...ˆˆ
)ˆ,1()ˆ,1(ˆ
αααβββ
αβφ
−−−+++
== ki ,...,2,1=∀ (6.2)
where p̂ and kiqi ,...,2,1,ˆ = are the selected (estimated) values of p̂ and kiqi ,...,2,1,ˆ = .
The long-run coefficients are estimated by:
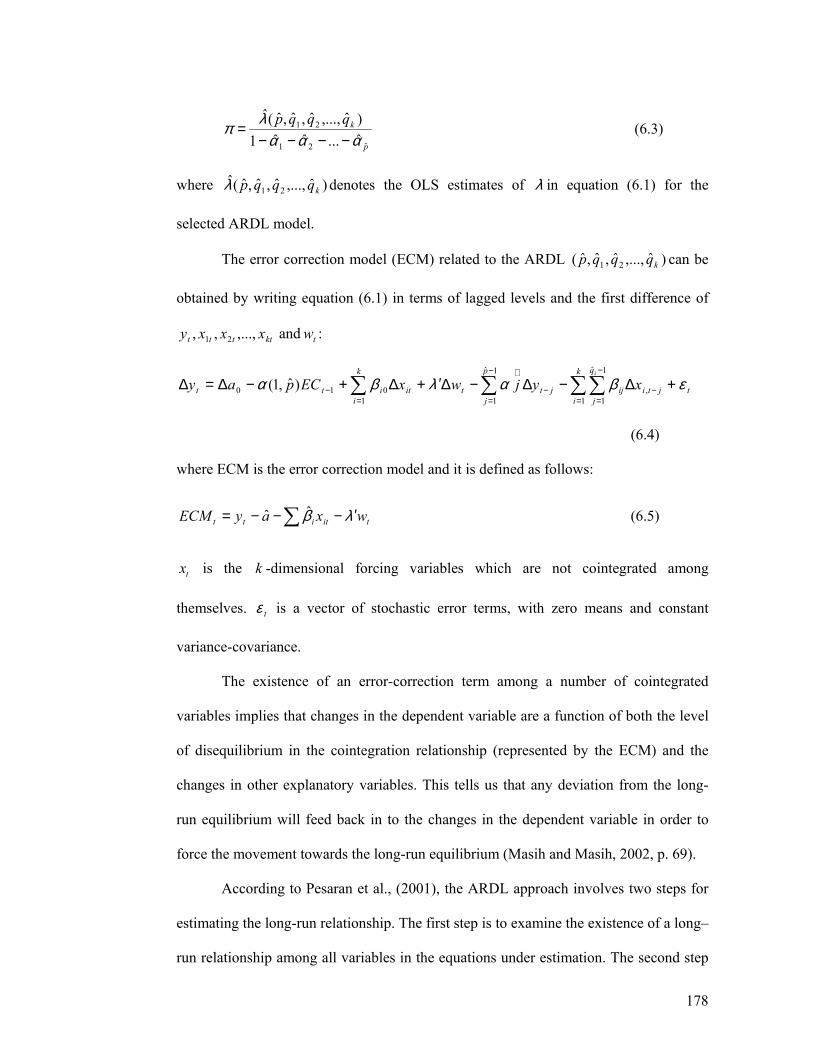
178
p
kqqqp
ˆ21
21
ˆ...ˆˆ1)ˆ,...,ˆ,ˆ,ˆ(ˆ
αααλπ
−−−−= (6.3)
where )ˆ,...,ˆ,ˆ,ˆ(ˆ 21 kqqqpλ denotes the OLS estimates of λ in equation (6.1) for the
selected ARDL model.
The error correction model (ECM) related to the ARDL )ˆ,...,ˆ,ˆ,ˆ( 21 kqqqp can be
obtained by writing equation (6.1) in terms of lagged levels and the first difference of
ktttt xxxy ,...,,, 21 and tw :
∑ ∑ ∑∑=
−
= =
−
=−−
∗
− +∆−∆−∆′+∆+−∆=∆k
i
p
j
k
i
q
jtjtiijjttititt
i
xyjwxECpay1
1ˆ
1 1
1ˆ
1,010 )ˆ,1( εβαλβα
(6.4)
where ECM is the error correction model and it is defined as follows:
∑ ′−−−= tititt wxayECM λβ̂ˆ (6.5)
tx is the k -dimensional forcing variables which are not cointegrated among
themselves. tε is a vector of stochastic error terms, with zero means and constant
variance-covariance.
The existence of an error-correction term among a number of cointegrated
variables implies that changes in the dependent variable are a function of both the level
of disequilibrium in the cointegration relationship (represented by the ECM) and the
changes in other explanatory variables. This tells us that any deviation from the long-
run equilibrium will feed back in to the changes in the dependent variable in order to
force the movement towards the long-run equilibrium (Masih and Masih, 2002, p. 69).
According to Pesaran et al., (2001), the ARDL approach involves two steps for
estimating the long-run relationship. The first step is to examine the existence of a long–
run relationship among all variables in the equations under estimation. The second step
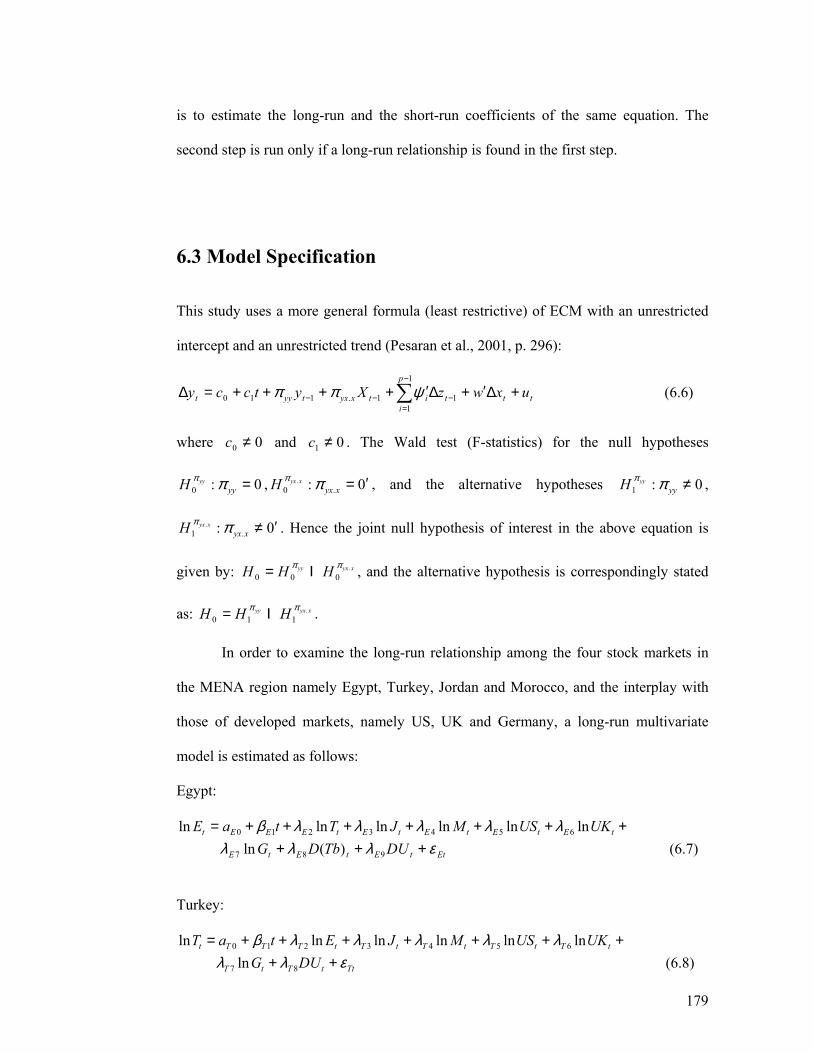
179
is to estimate the long-run and the short-run coefficients of the same equation. The
second step is run only if a long-run relationship is found in the first step.
6.3 Model Specification This study uses a more general formula (least restrictive) of ECM with an unrestricted
intercept and an unrestricted trend (Pesaran et al., 2001, p. 296):
ttt
p
iitxyxtyyt uxwzXytccy +∆′+∆′++++=∆ −
−
=−− ∑ 1
1
11.110 ψππ (6.6)
where 00 ≠c and 01 ≠c . The Wald test (F-statistics) for the null hypotheses
0:0 =yyyyH ππ , 0: .0
. ′=xyxxyxH ππ , and the alternative hypotheses 0:1 ≠yy
yyH ππ ,
0: .1. ′≠xyxxyxH ππ . Hence the joint null hypothesis of interest in the above equation is
given by: xyxyy HHH .000ππ Ι= , and the alternative hypothesis is correspondingly stated
as: xyxyy HHH .110ππ Ι= .
In order to examine the long-run relationship among the four stock markets in
the MENA region namely Egypt, Turkey, Jordan and Morocco, and the interplay with
those of developed markets, namely US, UK and Germany, a long-run multivariate
model is estimated as follows:
Egypt:
+++++++= tEtEtEtEtEEEt UKUSMJTtaE lnlnlnlnlnln 6543210 λλλλλβ EttEtEtE DUTbDG ελλλ +++ 987 )(ln (6.7)
Turkey:
+++++++= tTtTtTtTtTTTt UKUSMJEtaT lnlnlnlnlnln 6543210 λλλλλβ TttTtT DUG ελλ ++ 87 ln (6.8)
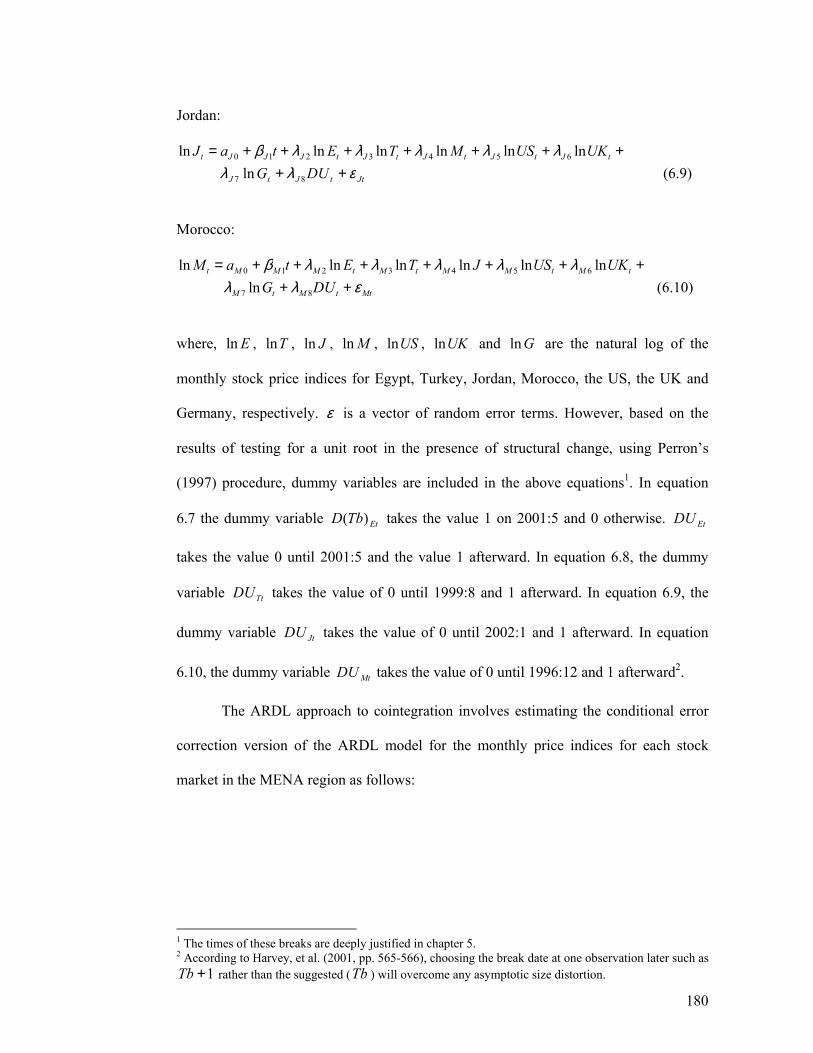
180
Jordan:
+++++++= tJtJtJtJtJJJt UKUSMTEtaJ lnlnlnlnlnln 6543210 λλλλλβ JttJtJ DUG ελλ ++ 87 ln (6.9)
Morocco:
+++++++= tMtMMtMtMMMt UKUSJTEtaM lnlnlnlnlnln 6543210 λλλλλβ MttMtM DUG ελλ ++ 87 ln (6.10)
where, Eln , Tln , Jln , Mln , USln , UKln and Gln are the natural log of the
monthly stock price indices for Egypt, Turkey, Jordan, Morocco, the US, the UK and
Germany, respectively. ε is a vector of random error terms. However, based on the
results of testing for a unit root in the presence of structural change, using Perron’s
(1997) procedure, dummy variables are included in the above equations1. In equation
6.7 the dummy variable EtTbD )( takes the value 1 on 2001:5 and 0 otherwise. EtDU
takes the value 0 until 2001:5 and the value 1 afterward. In equation 6.8, the dummy
variable TtDU takes the value of 0 until 1999:8 and 1 afterward. In equation 6.9, the
dummy variable JtDU takes the value of 0 until 2002:1 and 1 afterward. In equation
6.10, the dummy variable MtDU takes the value of 0 until 1996:12 and 1 afterward2.
The ARDL approach to cointegration involves estimating the conditional error
correction version of the ARDL model for the monthly price indices for each stock
market in the MENA region as follows:
1 The times of these breaks are deeply justified in chapter 5. 2 According to Harvey, et al. (2001, pp. 565-566), choosing the break date at one observation later such as
1+Tb rather than the suggested (Tb ) will overcome any asymptotic size distortion.
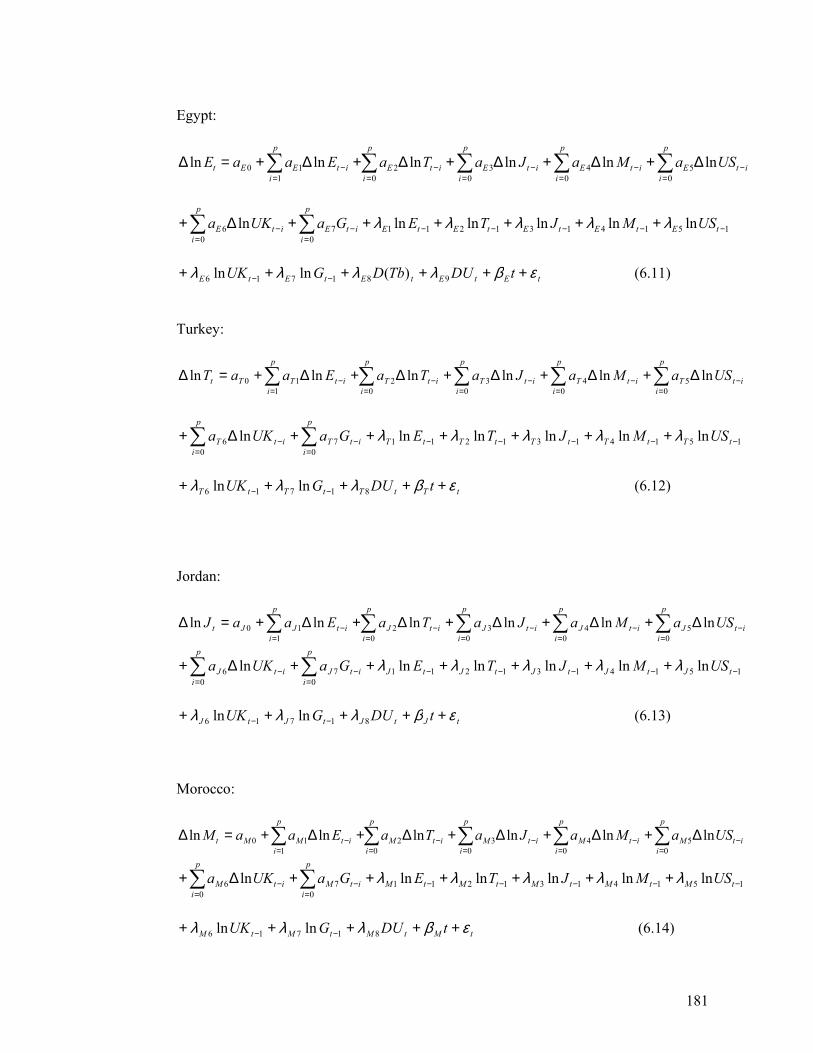
181
Egypt:
∑ ∑ ∑ ∑∑= = = =
−−−−=
− ∆+∆+∆+∆+∆+=∆p
i
p
i
p
i
p
iitEitEitEitE
p
iitEEt USaMaJaTaEaaE
0 0 0 05432
110 lnlnlnlnlnln
∑ ∑= =
−−−−−−− ++++++∆+p
i
p
itEtEtEtEtEitEitE USMJTEGaUKa
0 0151413121176 lnlnlnlnlnln λλλλλ
tEtEtEtEtE tDUTbDGUK εβλλλλ ++++++ −− 981716 )(lnln (6.11)
Turkey:
∑ ∑ ∑ ∑∑= = = =
−−−−=
− ∆+∆+∆+∆+∆+=∆p
i
p
i
p
i
p
iitTitTitTitT
p
iitTTt USaMaJaTaEaaT
0 0 0 05432
110 lnlnlnlnlnln
∑ ∑= =
−−−−−−− ++++++∆+p
i
p
itTtTtTtTtTitTitT USMJTEGaUKa
0 0151413121176 lnlnlnlnlnln λλλλλ
tTtTtTtT tDUGUK εβλλλ +++++ −− 81716 lnln (6.12)
Jordan:
∑ ∑ ∑ ∑∑= = = =
−−−−=
− ∆+∆+∆+∆+∆+=∆p
i
p
i
p
i
p
iitJitJitJitJ
p
iitJJt USaMaJaTaEaaJ
0 0 0 05432
110 lnlnlnlnlnln
∑ ∑= =
−−−−−−− ++++++∆+p
i
p
itJtJtJtJtJitJitJ USMJTEGaUKa
0 0151413121176 lnlnlnlnlnln λλλλλ
tJtJtJtJ tDUGUK εβλλλ +++++ −− 81716 lnln (6.13)
Morocco:
∑ ∑ ∑ ∑∑= = = =
−−−−=
− ∆+∆+∆+∆+∆+=∆p
i
p
i
p
i
p
iitMitMitMitM
p
iitMMt USaMaJaTaEaaM
0 0 0 05432
110 lnlnlnlnlnln
∑ ∑= =
−−−−−−− ++++++∆+p
i
p
itMtMtMtMtMitMitM USMJTEGaUKa
0 0151413121176 lnlnlnlnlnln λλλλλ
tMtMtMtM tDUGUK εβλλλ +++++ −− 81716 lnln (6.14)
182
For equations (6.11)-(6.14), the null hypothesis of no cointegration for each of the
dependent variables is: ( 0: 76543210 ======= λλλλλλλH ) and it is tested
against the alternative hypothesis ( 0: 76543211 ≠≠≠≠≠≠≠ λλλλλλλH ) by means
of F-statistics. The asymptotic distributions of the F-statistics are non-standard under
the null hypothesis of no cointegration relationship between the examined variables.
This is irrespective of whether the variables are purely )0(I or )1(I , or mutually
cointegrated.
Two sets of asymptotic critical values are provided by Pesaran and Pesaran
(1997). The first set assumes that all variables are )0(I while the second category
assumes that all variables are )1(I . If the computed F-statistics is greater than the upper
bound critical value, then we reject the null hypothesis of no cointegration and conclude
that there exists steady state equilibrium between the variables. If the computed F-
statistics is less than the lower bound critical value, then we can not reject the null of no
cointegration. If the computed F-statistics falls within the lower and upper bound
critical values, then the result is inconclusive. In this case, following Kremers, et al.
(1992) the error correction term will be a useful way of establishing cointegration. The
second step is to estimate the long-run coefficients of the same equation and the
associated ARDL error coercion models.
183
6.4 Interpretation of the Results The ARDL model requires a priori knowledge or estimation of the orders of the
extended ARDL. This appropriate modification of the orders of the ARDL model is
sufficient to simultaneously correct for residual serial correlation and the problem of
endogenous regressors (Pesaran and Shin, 1998, p. 386). The order of the distributed lag
on the dependent variable and the regressors is selected using either the Akaike
Information Criterion (AIC) or the Schwartz Bayesian Criterion (SBC). However,
depending on Monte Carlo evidence, Pesaran and Smith (1998) find that the SBC is
more preferable than the AIC; it is a parsimonious model that selects the smallest
possible lag length, while (AIC) selects the maximum relevant lag length. This study
will use the SBC as a lag selection criterion. However, given the small sample of
observations and the relatively large number of explanatory variables in each regression,
the maximum number of lags is set equal to 31. Recall that a significant F-statistics for
testing the joint level significance of the lagged level indicates the existence of long-run
relationship among variables involved in equations 6.11-6.14.
The results of the F-statistics are reported in Table 6.1. These results show that
in the case of equation 6.11, where stock price index of Egypt is dependent variable, we
have inconclusive outcome because the calculated F-statistics is less than the upper-
bound critical value but greater than the lower-bound. In this case, as has been
1 As this current study uses monthly data covering the period December 1994 to June 2004, the use of 12 as a maximum lag length means that the effective period is December 1995 to June 2004. In each equation we have 6 regressors and this means that the total number of regression to be estimated is equal to 809,825,4)112( 6 =+ . This is technically impractical, and the Microfit statistical software cannot compute this number. The only results that could be obtained are for 4 lags or less. However, all the results reported and estimated in this study are for 3 lags as they are an improvement over the results of 1, 2 or 4 lags. The study depends on a main contention to choose a low number of lag., that is according to Obben and Nugroho (2004, p. 12) in the case that the diagnostic tests are plausible, the potential cost of effecting 12 lags would far outweigh the benefit of getting more precise coefficients.
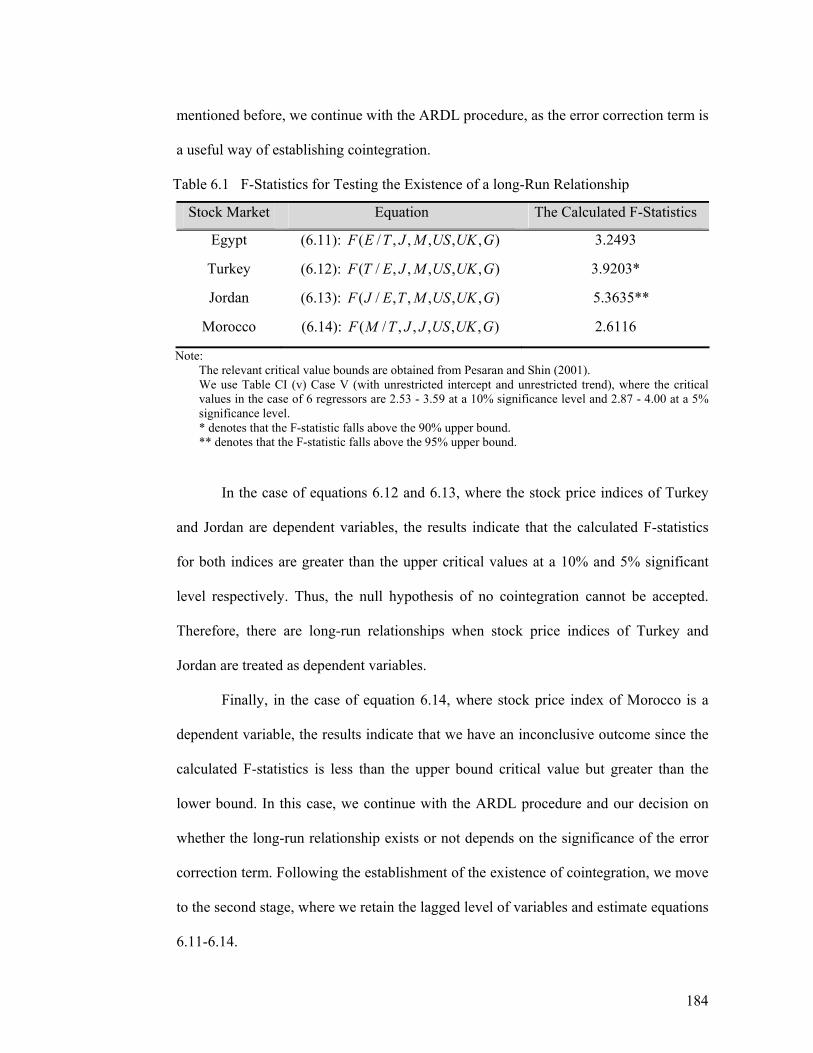
184
mentioned before, we continue with the ARDL procedure, as the error correction term is
a useful way of establishing cointegration.
Table 6.1 F-Statistics for Testing the Existence of a long-Run Relationship
Stock Market Equation The Calculated F-Statistics
Egypt (6.11): ),,,,,/( GUKUSMJTEF 3.2493
Turkey (6.12): ),,,,,/( GUKUSMJETF 3.9203*
Jordan (6.13): ),,,,,/( GUKUSMTEJF 5.3635**
Morocco (6.14): ),,,,,/( GUKUSJJTMF 2.6116
Note: The relevant critical value bounds are obtained from Pesaran and Shin (2001). We use Table CI (v) Case V (with unrestricted intercept and unrestricted trend), where the critical values in the case of 6 regressors are 2.53 - 3.59 at a 10% significance level and 2.87 - 4.00 at a 5% significance level. * denotes that the F-statistic falls above the 90% upper bound. ** denotes that the F-statistic falls above the 95% upper bound.
In the case of equations 6.12 and 6.13, where the stock price indices of Turkey
and Jordan are dependent variables, the results indicate that the calculated F-statistics
for both indices are greater than the upper critical values at a 10% and 5% significant
level respectively. Thus, the null hypothesis of no cointegration cannot be accepted.
Therefore, there are long-run relationships when stock price indices of Turkey and
Jordan are treated as dependent variables.
Finally, in the case of equation 6.14, where stock price index of Morocco is a
dependent variable, the results indicate that we have an inconclusive outcome since the
calculated F-statistics is less than the upper bound critical value but greater than the
lower bound. In this case, we continue with the ARDL procedure and our decision on
whether the long-run relationship exists or not depends on the significance of the error
correction term. Following the establishment of the existence of cointegration, we move
to the second stage, where we retain the lagged level of variables and estimate equations
6.11-6.14.
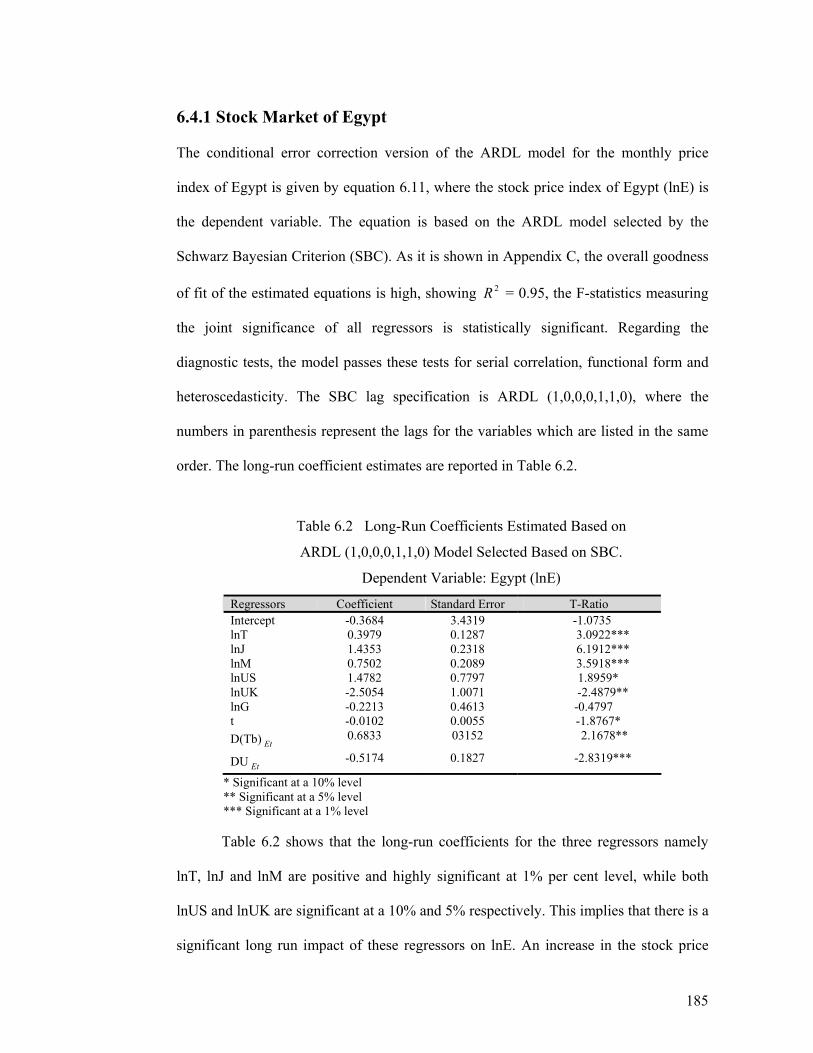
185
6.4.1 Stock Market of Egypt The conditional error correction version of the ARDL model for the monthly price
index of Egypt is given by equation 6.11, where the stock price index of Egypt (lnE) is
the dependent variable. The equation is based on the ARDL model selected by the
Schwarz Bayesian Criterion (SBC). As it is shown in Appendix C, the overall goodness
of fit of the estimated equations is high, showing 2R = 0.95, the F-statistics measuring
the joint significance of all regressors is statistically significant. Regarding the
diagnostic tests, the model passes these tests for serial correlation, functional form and
heteroscedasticity. The SBC lag specification is ARDL (1,0,0,0,1,1,0), where the
numbers in parenthesis represent the lags for the variables which are listed in the same
order. The long-run coefficient estimates are reported in Table 6.2.
Table 6.2 Long-Run Coefficients Estimated Based on
ARDL (1,0,0,0,1,1,0) Model Selected Based on SBC.
Dependent Variable: Egypt (lnE)
Regressors Coefficient Standard Error T-Ratio Intercept -0.3684 3.4319 -1.0735 lnT 0.3979 0.1287 3.0922*** lnJ 1.4353 0.2318 6.1912*** lnM 0.7502 0.2089 3.5918*** lnUS 1.4782 0.7797 1.8959* lnUK -2.5054 1.0071 -2.4879** lnG -0.2213 0.4613 -0.4797 t -0.0102 0.0055 -1.8767* D(Tb) Et 0.6833 03152 2.1678**
DU Et -0.5174 0.1827 -2.8319***
* Significant at a 10% level ** Significant at a 5% level *** Significant at a 1% level
Table 6.2 shows that the long-run coefficients for the three regressors namely
lnT, lnJ and lnM are positive and highly significant at 1% per cent level, while both
lnUS and lnUK are significant at a 10% and 5% respectively. This implies that there is a
significant long run impact of these regressors on lnE. An increase in the stock price
186
index of Turkey (lnT) by 1% will have a significant long-run impact on the stock price
index of Egypt (lnE) by 0.4%, whereas an increase in the stock price index of Jordan
(lnJ) by 1% will have a positive long run impact on the stock price index of Egypt by
1.44%. Also, an increase in the stock price index of Morocco (lnM) by 1% will have a
long-run impact on the stock price index of Egypt by 0.75%. This long-run impact of
the stock markets indices in the MENA regions on the Egyptian stock market indicates
that all of these indices are cointegrated with each other throughout the long term. In the
case of developed stock markets in the US, the UK and Germany, the results show that
both stock price indices in the US and the UK markets have long-run impact on the
stock price index of Egypt. An increase in stock price index of the US by 1% will have
a long-run impact on stock price index of Egypt by 1.48%. Also, an increase of stock
price index of the UK by 1% will have a negative impact on stock price index of Egypt
by 2.51%. The stock price index in Germany has no long-run effect on Egypt1.
Both dummy variables are highly significant. This indicates that the structural
change, which happens at the time of the break, has a long-run impact on stock price
index. In fact, the Egyptian economy was under enormous pressure during 2000 and
2001. Influencing factors on this pressure were: a sharp drop in oil prices, a sharp
decrease in tourism revenue after the events in Luxor city, and the continuing violence
and political crisis in the Middle East. All of these factors played a vital role in
weakening the performance of the Egyptian economy in general and the stock market in
particular. By January, 2001, the Egyptian Pound devalued by 9.6%. After that the
central bank adopted more flexible exchange rate policy; it again devaluated the Pound
by 6.4% in August, 2001.
1 Where the long-run coefficient is not significant, it maybe due to change valuation via bilateral exchange rate. Where trend is significant then this maybe picking up trend changes via bilateral exchange rate.
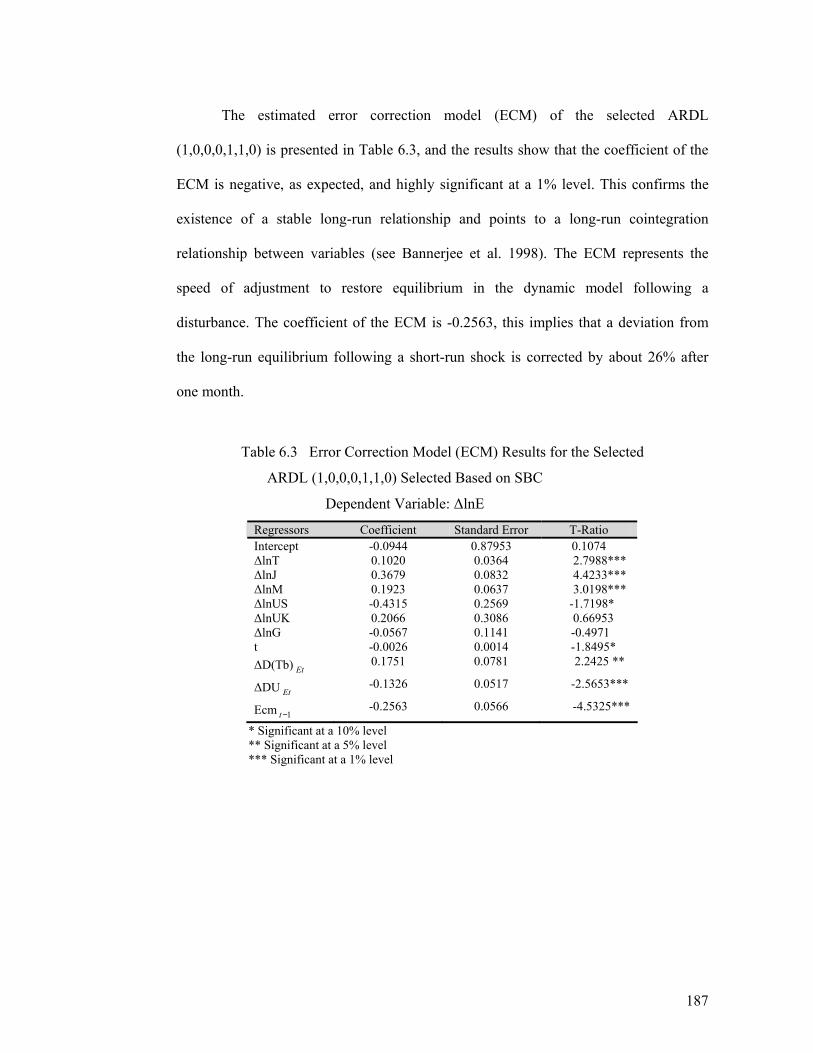
187
The estimated error correction model (ECM) of the selected ARDL
(1,0,0,0,1,1,0) is presented in Table 6.3, and the results show that the coefficient of the
ECM is negative, as expected, and highly significant at a 1% level. This confirms the
existence of a stable long-run relationship and points to a long-run cointegration
relationship between variables (see Bannerjee et al. 1998). The ECM represents the
speed of adjustment to restore equilibrium in the dynamic model following a
disturbance. The coefficient of the ECM is -0.2563, this implies that a deviation from
the long-run equilibrium following a short-run shock is corrected by about 26% after
one month.
Table 6.3 Error Correction Model (ECM) Results for the Selected
ARDL (1,0,0,0,1,1,0) Selected Based on SBC
Dependent Variable: ∆lnE
Regressors Coefficient Standard Error T-Ratio Intercept -0.0944 0.87953 0.1074 ∆lnT 0.1020 0.0364 2.7988*** ∆lnJ 0.3679 0.0832 4.4233*** ∆lnM 0.1923 0.0637 3.0198*** ∆lnUS -0.4315 0.2569 -1.7198* ∆lnUK 0.2066 0.3086 0.66953 ∆lnG -0.0567 0.1141 -0.4971 t -0.0026 0.0014 -1.8495* ∆D(Tb) Et 0.1751 0.0781 2.2425 **
∆DU Et -0.1326 0.0517 -2.5653***
Ecm 1−t -0.2563 0.0566 -4.5325***
* Significant at a 10% level ** Significant at a 5% level *** Significant at a 1% level
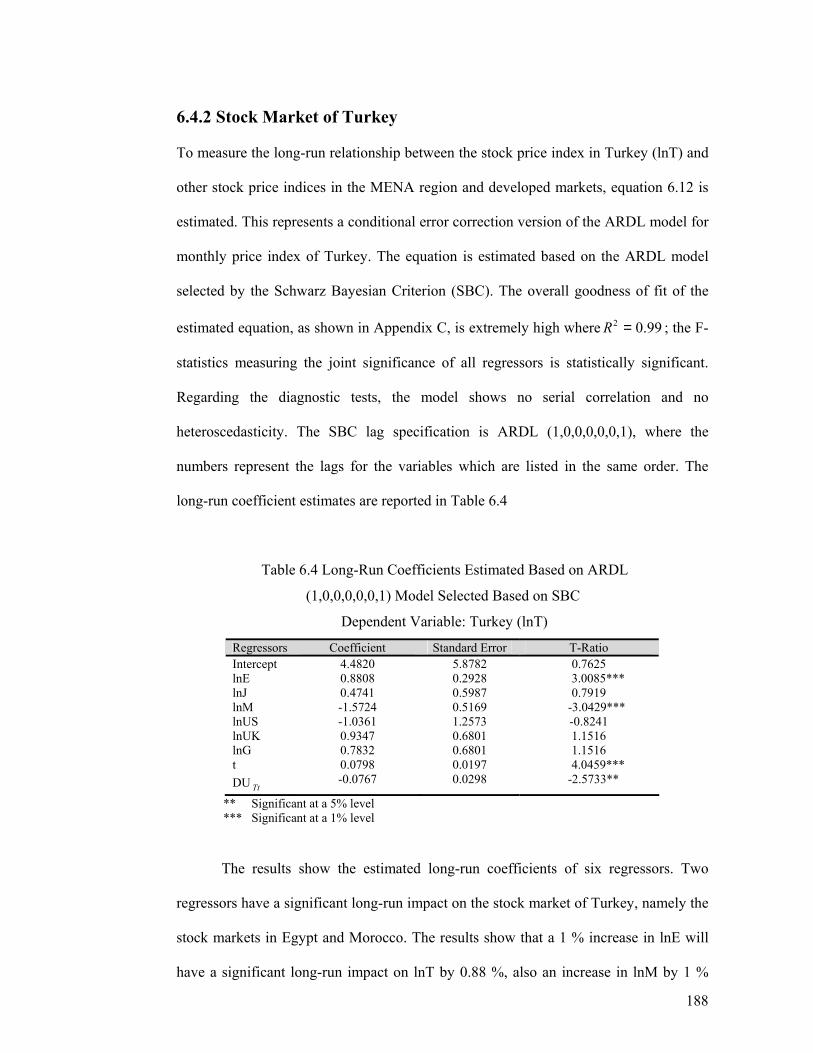
188
6.4.2 Stock Market of Turkey To measure the long-run relationship between the stock price index in Turkey (lnT) and
other stock price indices in the MENA region and developed markets, equation 6.12 is
estimated. This represents a conditional error correction version of the ARDL model for
monthly price index of Turkey. The equation is estimated based on the ARDL model
selected by the Schwarz Bayesian Criterion (SBC). The overall goodness of fit of the
estimated equation, as shown in Appendix C, is extremely high where 99.02 =R ; the F-
statistics measuring the joint significance of all regressors is statistically significant.
Regarding the diagnostic tests, the model shows no serial correlation and no
heteroscedasticity. The SBC lag specification is ARDL (1,0,0,0,0,0,1), where the
numbers represent the lags for the variables which are listed in the same order. The
long-run coefficient estimates are reported in Table 6.4
Table 6.4 Long-Run Coefficients Estimated Based on ARDL
(1,0,0,0,0,0,1) Model Selected Based on SBC
Dependent Variable: Turkey (lnT)
Regressors Coefficient Standard Error T-Ratio Intercept 4.4820 5.8782 0.7625 lnE 0.8808 0.2928 3.0085*** lnJ 0.4741 0.5987 0.7919 lnM -1.5724 0.5169 -3.0429*** lnUS -1.0361 1.2573 -0.8241 lnUK 0.9347 0.6801 1.1516 lnG 0.7832 0.6801 1.1516 t 0.0798 0.0197 4.0459*** DU Tt -0.0767 0.0298 -2.5733**
** Significant at a 5% level *** Significant at a 1% level
The results show the estimated long-run coefficients of six regressors. Two
regressors have a significant long-run impact on the stock market of Turkey, namely the
stock markets in Egypt and Morocco. The results show that a 1 % increase in lnE will
have a significant long-run impact on lnT by 0.88 %, also an increase in lnM by 1 %
189
will have a significant negative impact on lnT by 1.6 %. This gives the indication that
only stock markets in the MENA region have a long-run impact in the stock market of
Turkey. The coefficient of lnG is statistically not significant, which means that
Germany has no long-run impact on Turkey. However, the coefficient of ∆lnG in Table
6.5 is statistically significant at a 1 % level. This implies that although there is no
significant long-run impact of the stock price index of Germany on the stock price index
of Turkey, a change in the stock price index of Germany has a significant short-run
impact on the change of the stock price index of Turkey. This result confirms the
existence of a strong economic relationship between the two countries. However, the
statistics show that around 2.5 million people of Turkish origin live in Germany, and
Germany is the most important trading partner to Turkey. The volume of bilateral trade
in 2003 reached EUR 16 billion. Moreover, the largest number of foreign companies
investing in Turkey is German (see www.auswaertiges-amt.de).
The dummy variable in Table 6.4 is statistically significant at a 5 % level and
has a negative sign. This indicates that the structural change has a negative long-run
impact on the stock price index of Turkey. This structural change took place in 1999:7.
All events indicate that both the Asian and Russian crises in 1997 and 1998,
respectively, had a negative impact on the performance of the Istanbul Stock Exchange
(ISE). This negative impact can be observed during the 1999’s and early 2000 when the
ISE witnessed excessive volatility.
The error correction model ECM of the selected ARDL (1,0,0,0,0,0,1), as shown
in Table 6.5, is significant at a 1% level with the expected negative sign. The ECM
represents the speed of adjustment of the ∆lnT to its long-run equilibrium following a
shock. Moreover, this significant of the ECM confirms the existence of a stable long-
run relationship between the significant regressors and the dependent variable. The
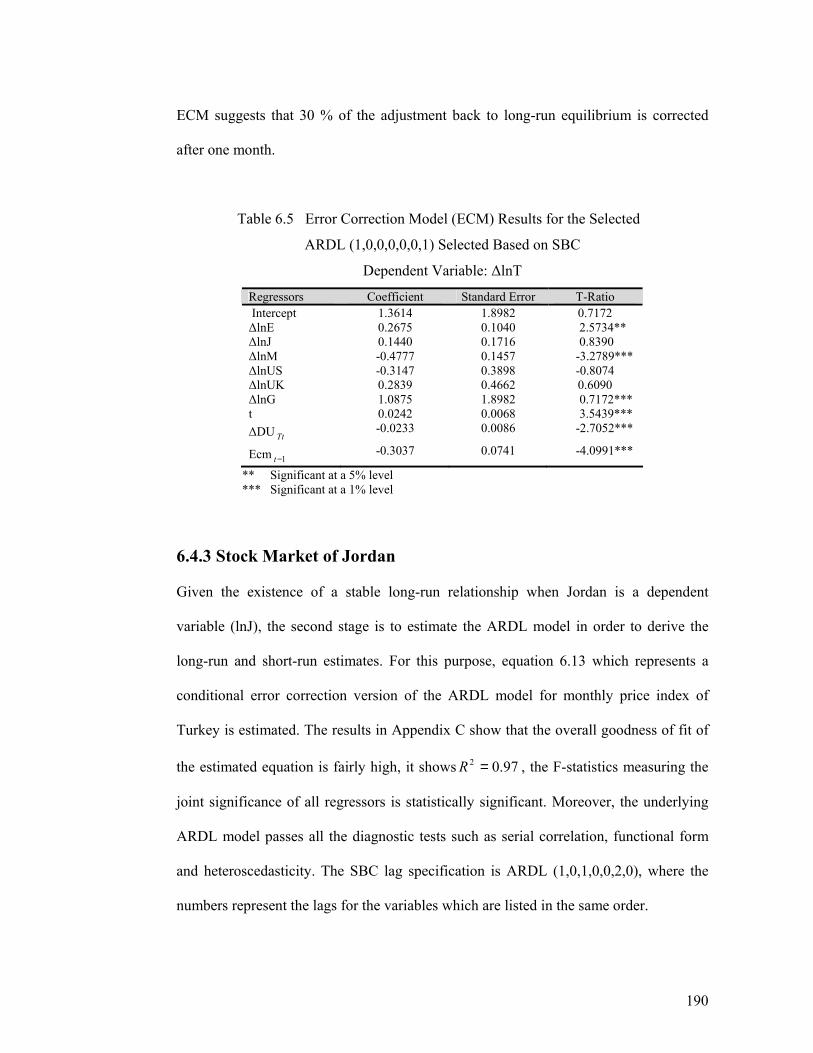
190
ECM suggests that 30 % of the adjustment back to long-run equilibrium is corrected
after one month.
Table 6.5 Error Correction Model (ECM) Results for the Selected
ARDL (1,0,0,0,0,0,1) Selected Based on SBC
Dependent Variable: ∆lnT
Regressors Coefficient Standard Error T-Ratio Intercept 1.3614 1.8982 0.7172 ∆lnE 0.2675 0.1040 2.5734** ∆lnJ 0.1440 0.1716 0.8390 ∆lnM -0.4777 0.1457 -3.2789*** ∆lnUS -0.3147 0.3898 -0.8074 ∆lnUK 0.2839 0.4662 0.6090 ∆lnG 1.0875 1.8982 0.7172*** t 0.0242 0.0068 3.5439*** ∆DU Tt -0.0233 0.0086 -2.7052***
Ecm 1−t -0.3037 0.0741 -4.0991***
** Significant at a 5% level *** Significant at a 1% level
6.4.3 Stock Market of Jordan Given the existence of a stable long-run relationship when Jordan is a dependent
variable (lnJ), the second stage is to estimate the ARDL model in order to derive the
long-run and short-run estimates. For this purpose, equation 6.13 which represents a
conditional error correction version of the ARDL model for monthly price index of
Turkey is estimated. The results in Appendix C show that the overall goodness of fit of
the estimated equation is fairly high, it shows 97.02 =R , the F-statistics measuring the
joint significance of all regressors is statistically significant. Moreover, the underlying
ARDL model passes all the diagnostic tests such as serial correlation, functional form
and heteroscedasticity. The SBC lag specification is ARDL (1,0,1,0,0,2,0), where the
numbers represent the lags for the variables which are listed in the same order.
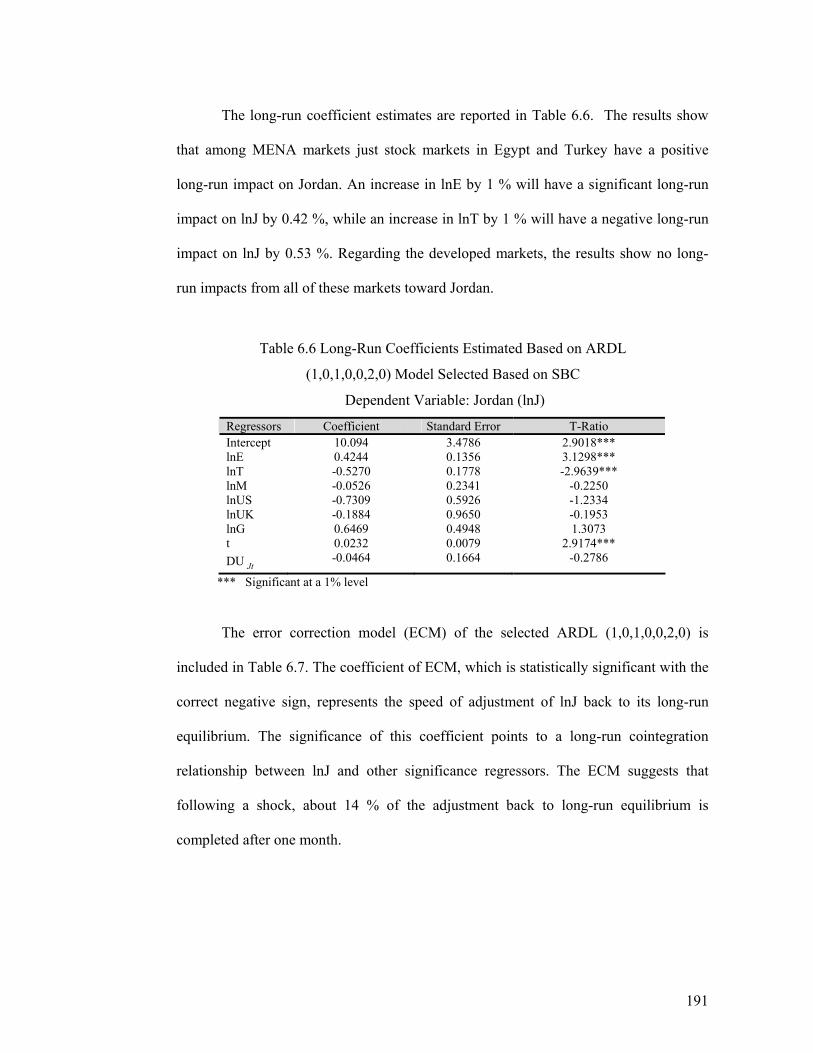
191
The long-run coefficient estimates are reported in Table 6.6. The results show
that among MENA markets just stock markets in Egypt and Turkey have a positive
long-run impact on Jordan. An increase in lnE by 1 % will have a significant long-run
impact on lnJ by 0.42 %, while an increase in lnT by 1 % will have a negative long-run
impact on lnJ by 0.53 %. Regarding the developed markets, the results show no long-
run impacts from all of these markets toward Jordan.
Table 6.6 Long-Run Coefficients Estimated Based on ARDL
(1,0,1,0,0,2,0) Model Selected Based on SBC
Dependent Variable: Jordan (lnJ)
Regressors Coefficient Standard Error T-Ratio Intercept 10.094 3.4786 2.9018*** lnE 0.4244 0.1356 3.1298*** lnT -0.5270 0.1778 -2.9639*** lnM -0.0526 0.2341 -0.2250 lnUS -0.7309 0.5926 -1.2334 lnUK -0.1884 0.9650 -0.1953 lnG 0.6469 0.4948 1.3073 t 0.0232 0.0079 2.9174*** DU Jt -0.0464 0.1664 -0.2786
*** Significant at a 1% level
The error correction model (ECM) of the selected ARDL (1,0,1,0,0,2,0) is
included in Table 6.7. The coefficient of ECM, which is statistically significant with the
correct negative sign, represents the speed of adjustment of lnJ back to its long-run
equilibrium. The significance of this coefficient points to a long-run cointegration
relationship between lnJ and other significance regressors. The ECM suggests that
following a shock, about 14 % of the adjustment back to long-run equilibrium is
completed after one month.
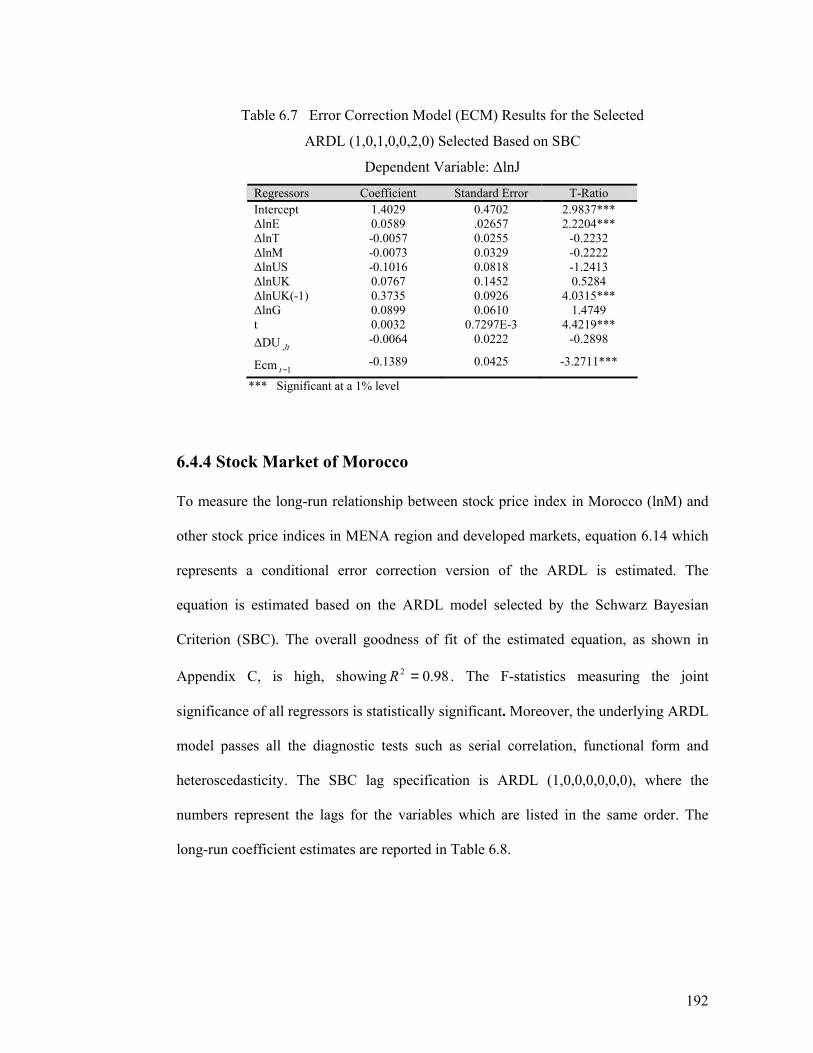
192
Table 6.7 Error Correction Model (ECM) Results for the Selected
ARDL (1,0,1,0,0,2,0) Selected Based on SBC
Dependent Variable: ∆lnJ
Regressors Coefficient Standard Error T-Ratio Intercept 1.4029 0.4702 2.9837*** ∆lnE 0.0589 .02657 2.2204*** ∆lnT -0.0057 0.0255 -0.2232 ∆lnM -0.0073 0.0329 -0.2222 ∆lnUS -0.1016 0.0818 -1.2413 ∆lnUK 0.0767 0.1452 0.5284 ∆lnUK(-1) 0.3735 0.0926 4.0315*** ∆lnG 0.0899 0.0610 1.4749 t 0.0032 0.7297E-3 4.4219*** ∆DU Jt -0.0064 0.0222 -0.2898
Ecm 1−t -0.1389 0.0425 -3.2711***
*** Significant at a 1% level
6.4.4 Stock Market of Morocco To measure the long-run relationship between stock price index in Morocco (lnM) and
other stock price indices in MENA region and developed markets, equation 6.14 which
represents a conditional error correction version of the ARDL is estimated. The
equation is estimated based on the ARDL model selected by the Schwarz Bayesian
Criterion (SBC). The overall goodness of fit of the estimated equation, as shown in
Appendix C, is high, showing 98.02 =R . The F-statistics measuring the joint
significance of all regressors is statistically significant. Moreover, the underlying ARDL
model passes all the diagnostic tests such as serial correlation, functional form and
heteroscedasticity. The SBC lag specification is ARDL (1,0,0,0,0,0,0), where the
numbers represent the lags for the variables which are listed in the same order. The
long-run coefficient estimates are reported in Table 6.8.
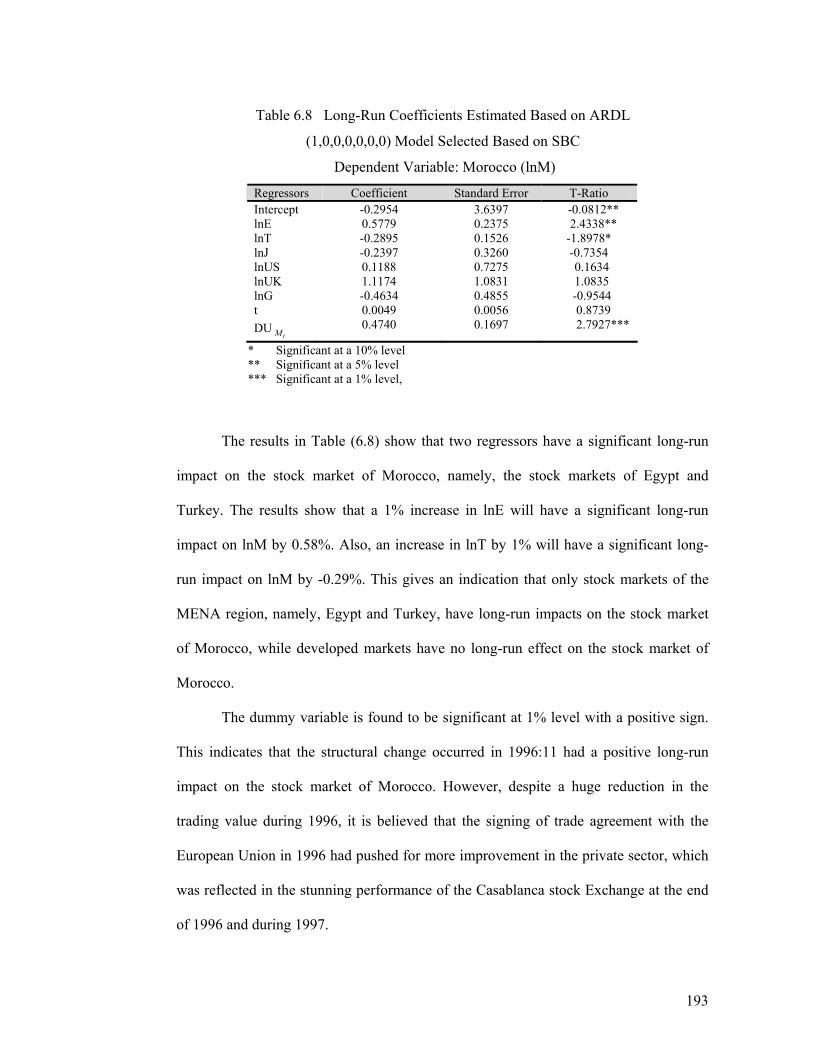
193
Table 6.8 Long-Run Coefficients Estimated Based on ARDL
(1,0,0,0,0,0,0) Model Selected Based on SBC
Dependent Variable: Morocco (lnM)
Regressors Coefficient Standard Error T-Ratio Intercept -0.2954 3.6397 -0.0812** lnE 0.5779 0.2375 2.4338** lnT -0.2895 0.1526 -1.8978* lnJ -0.2397 0.3260 -0.7354 lnUS 0.1188 0.7275 0.1634 lnUK 1.1174 1.0831 1.0835 lnG -0.4634 0.4855 -0.9544 t 0.0049 0.0056 0.8739 DU
tM 0.4740 0.1697 2.7927***
* Significant at a 10% level ** Significant at a 5% level *** Significant at a 1% level,
The results in Table (6.8) show that two regressors have a significant long-run
impact on the stock market of Morocco, namely, the stock markets of Egypt and
Turkey. The results show that a 1% increase in lnE will have a significant long-run
impact on lnM by 0.58%. Also, an increase in lnT by 1% will have a significant long-
run impact on lnM by -0.29%. This gives an indication that only stock markets of the
MENA region, namely, Egypt and Turkey, have long-run impacts on the stock market
of Morocco, while developed markets have no long-run effect on the stock market of
Morocco.
The dummy variable is found to be significant at 1% level with a positive sign.
This indicates that the structural change occurred in 1996:11 had a positive long-run
impact on the stock market of Morocco. However, despite a huge reduction in the
trading value during 1996, it is believed that the signing of trade agreement with the
European Union in 1996 had pushed for more improvement in the private sector, which
was reflected in the stunning performance of the Casablanca stock Exchange at the end
of 1996 and during 1997.
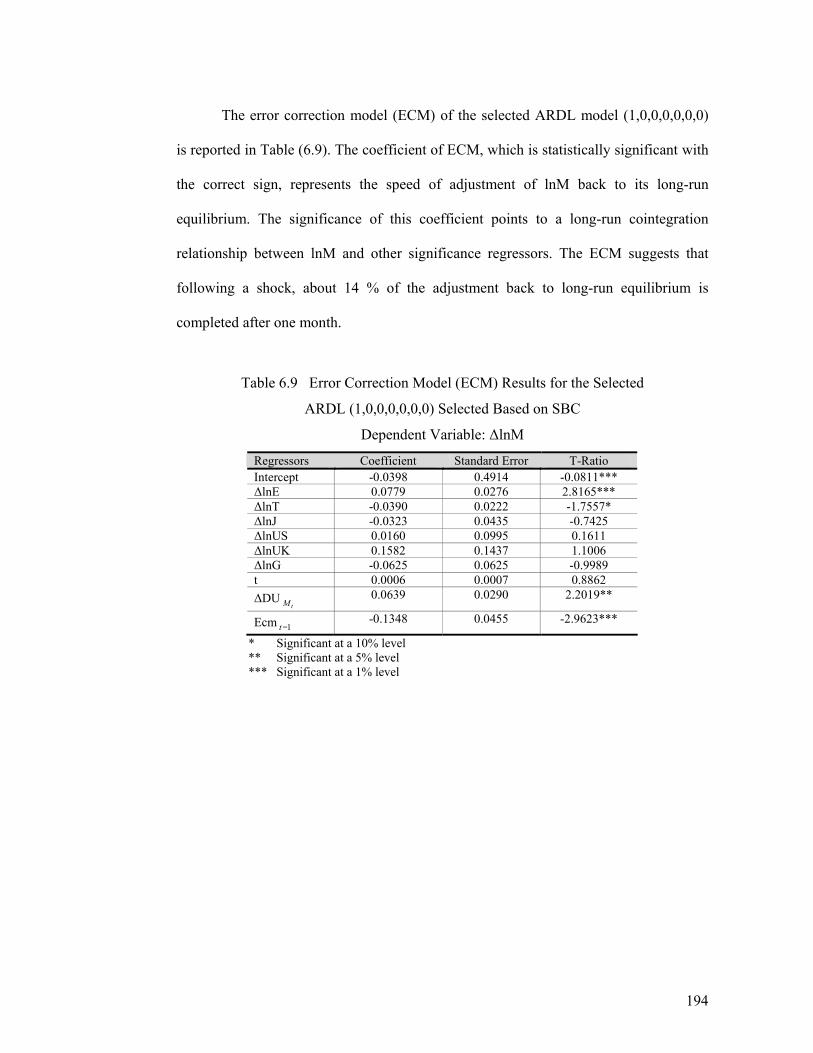
194
The error correction model (ECM) of the selected ARDL model (1,0,0,0,0,0,0)
is reported in Table (6.9). The coefficient of ECM, which is statistically significant with
the correct sign, represents the speed of adjustment of lnM back to its long-run
equilibrium. The significance of this coefficient points to a long-run cointegration
relationship between lnM and other significance regressors. The ECM suggests that
following a shock, about 14 % of the adjustment back to long-run equilibrium is
completed after one month.
Table 6.9 Error Correction Model (ECM) Results for the Selected
ARDL (1,0,0,0,0,0,0) Selected Based on SBC
Dependent Variable: ∆lnM
Regressors Coefficient Standard Error T-Ratio Intercept -0.0398 0.4914 -0.0811*** ∆lnE 0.0779 0.0276 2.8165*** ∆lnT -0.0390 0.0222 -1.7557* ∆lnJ -0.0323 0.0435 -0.7425 ∆lnUS 0.0160 0.0995 0.1611 ∆lnUK 0.1582 0.1437 1.1006 ∆lnG -0.0625 0.0625 -0.9989 t 0.0006 0.0007 0.8862 ∆DU
tM 0.0639 0.0290 2.2019**
Ecm 1−t -0.1348 0.0455 -2.9623***
* Significant at a 10% level ** Significant at a 5% level *** Significant at a 1% level
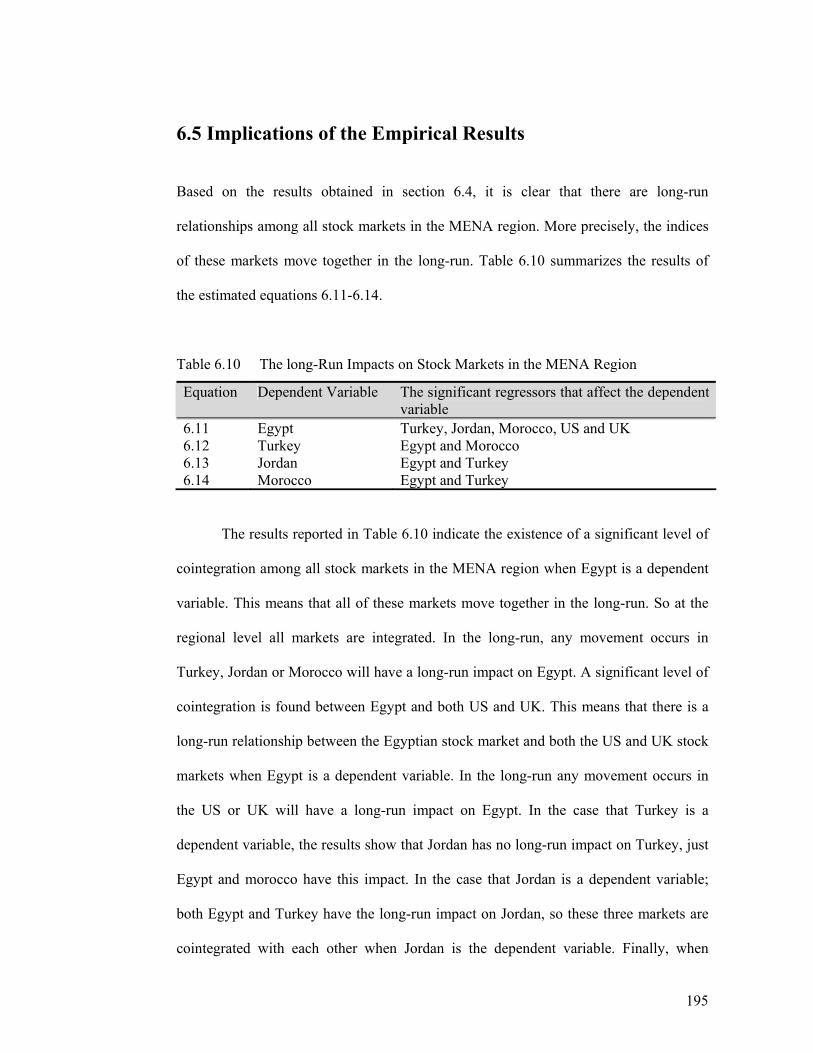
195
6.5 Implications of the Empirical Results Based on the results obtained in section 6.4, it is clear that there are long-run
relationships among all stock markets in the MENA region. More precisely, the indices
of these markets move together in the long-run. Table 6.10 summarizes the results of
the estimated equations 6.11-6.14.
Table 6.10 The long-Run Impacts on Stock Markets in the MENA Region
Equation Dependent Variable The significant regressors that affect the dependent variable
6.11 Egypt Turkey, Jordan, Morocco, US and UK 6.12 Turkey Egypt and Morocco 6.13 Jordan Egypt and Turkey 6.14 Morocco Egypt and Turkey
The results reported in Table 6.10 indicate the existence of a significant level of
cointegration among all stock markets in the MENA region when Egypt is a dependent
variable. This means that all of these markets move together in the long-run. So at the
regional level all markets are integrated. In the long-run, any movement occurs in
Turkey, Jordan or Morocco will have a long-run impact on Egypt. A significant level of
cointegration is found between Egypt and both US and UK. This means that there is a
long-run relationship between the Egyptian stock market and both the US and UK stock
markets when Egypt is a dependent variable. In the long-run any movement occurs in
the US or UK will have a long-run impact on Egypt. In the case that Turkey is a
dependent variable, the results show that Jordan has no long-run impact on Turkey, just
Egypt and morocco have this impact. In the case that Jordan is a dependent variable;
both Egypt and Turkey have the long-run impact on Jordan, so these three markets are
cointegrated with each other when Jordan is the dependent variable. Finally, when
196
Morocco is a dependent variable, long-run impacts have been found from the stock
markets of Egypt and Jordan toward the stock market of Morocco.
Based on the previous results, it is found that cointegration does exist among all
MENA stock markets in the case where the Egypt stock market is the dependent
variable. This means that all markets in the region are integrated with each other. In the
case where Turkey is a dependent variable, the results show that Jordan has no long-run
impact on Turkey whereas Egypt and Morocco do. However, in the case that Jordan is
the dependent variable; both Egypt and Turkey have long-run impacts on Jordan, so
these three markets are cointegrated with each other when Jordan is the dependent
variable. Finally, when Morocco is the dependent variable; long-run impacts flow from
the stock markets of Egypt and Jordan towards the stock market of Morocco. So, the
Egyptian stock market has an impact on all other MENA markets. Also, Turkey is
found to have a similar impact on all markets. This means that any movement in stock
price indices in these two markets (Egypt and Turkey) will be followed by similar
movements from other indices in the region and this indicates the existence of
integration among these markets.
This integration is essential as it could offer investment opportunities not
possible by each market separately. However, there is no long-run relationship between
MENA stock markets and developed markets represented by US, UK and Germany.
This means that the MENA stock markets are segmented from developed markets.
Egypt is the only exception; the study found that the stock market of Egypt has long
run-relationship with US and UK markets. It is believed that one of the reasons for the
integration between the stock market in Egypt and the stock market in the UK is that in
the year 2000, seven companies in telecommunication, construction and tourism sectors
listed their shares on the London Stock Exchange

197
(www.erf.org.eg/html/economic_00html/top_main.html). The reason for the integration
between the stock market in Egypt and the stock market in the US is that the Egyptian
economy is highly tied with the US economy.
According to Bekaert and Harvey (1995), segmentation is greatly influenced by
the economic and financial polices, and regulatory institutions in each country. Also it is
believed that differences in privatization methods between countries cause this
segmentation. Moreover, the low level of economic integration between these countries
play vital role in this segmentation. This study suggests that MENA countries should
adopt more sound economic and financial polices, such as the implementation of
liberalization and privatization programs in order to be more integrated with the
developed markets and the rest of the world.
The implication of finding that stock markets in the MENA region are
cointegrated with each other and just Egypt cointegrated with developed stock markets
will be analyzed at two levels; the regional level and the international level.
First, at the regional level, the results show that stock markets in the MENA
region are integrated with each other, which implies that these stock markets do share
long-run equilibrium relationship. This implies the existence of the law of one price
(LOOP) among them. This means that the potential of regional investors for obtaining
abnormal profits through portfolio diversification is limited in the long-run. The reason
for this is that as the MENA stock markets are cointegrated, abnormal profits will be
arbitraged away in the long-run. Moreover, in the absence of barriers or potential
barriers generating country risk and exchange rate premium, financial assets of similar
risk and liquidity are expected to achieve similar yields, irrespective of nationality or
location (see, Von Furstenberg & Jeon 1989 and Narayan et al. 2004). However, despite
no arbitrage opportunities in the long-run, investors can still achieve arbitrage profits
198
through portfolio diversification in the MENA stock markets in the short-run. This
depends on the speed of adjustment which is represented by the error correction term
(ECT). The coefficients of ECT’s for the MENA stock markets are as follows, For
Egypt it is (-0.26), for Turkey it is (-0.30), for Jordan it is (-0.14) and for Morocco is (-
0.14). These coefficients show that the speed of adjustment is slow which means the
short-term can last for a longer period, and there is a high possibility of achieving
arbitrage profits as the LOOP may not hold.
Second, at the international level, the results show that stock markets in Turkey,
Jordan and Morocco are not integrated with developed markets, represented by US, UK
and Germany. This means that there is no long-run impact from developed stock
markets towards these markets. However, a long-run relationship is found between
Egypt and both US and UK when Egypt is a dependent variable. Based on these results,
there are opportunities for international investors to obtain long-run gains through
international portfolio diversification in Turkey, Jordan and Morocco stock markets.
Also at the same time, investors from these three countries have the opportunities to
obtain long-run gains through investing in developed markets. The existence of long-
run relationships between Egypt and both US and UK implies that the potential for
investors from the Egyptian stock market to obtain abnormal profit through portfolio
diversification in US and UK is limited in the long-run. The reason for this is that the
abnormal profit will be arbitraged away in the long-run. However, there are
opportunities for achieving abnormal profit by investing in Germany as it is not
cointegrated with the MENA markets. With the short-run error correction model
(ECM), arbitrage opportunities and possible profits may also be achieved from
diversification as the LOOP may not hold in the short-run. In the case when Egypt is a
dependent variable, the coefficient of ECM is -0.26, which shows that the speed of
199
adjustment is not very fast (ie. it shows that following a shock, about 26% of the
adjustment back to the long-run equilibrium is completed after one month, which means
it takes around 4 months to complete the whole adjustment process). This indicates that
the short-term could last for a period of time, and there is a high possibility of achieving
arbitrage profits during this period as the LOOP may not hold.
The finding based on the previous section is that most stock markets in the
MENA region (except for Egypt) are not integrated with developed stock markets. This
situation gives the possibility of an increase in the portfolio equity flows to these stock
markets in the long-run. This increase based on the notion of achieving more profits
from international diversification as stocks in the MENA markets are not exposed to the
same risk factors as developed markets. However, statistics for portfolios equity flow in
table 6.11 show different story. The MENA region was the least region in the world to
receive portfolio equity flows from developed countries over the period (1995-2003).
Table 6.11 shows the net inward portfolio equity flows to developing countries during
the period 1995 to 2003.
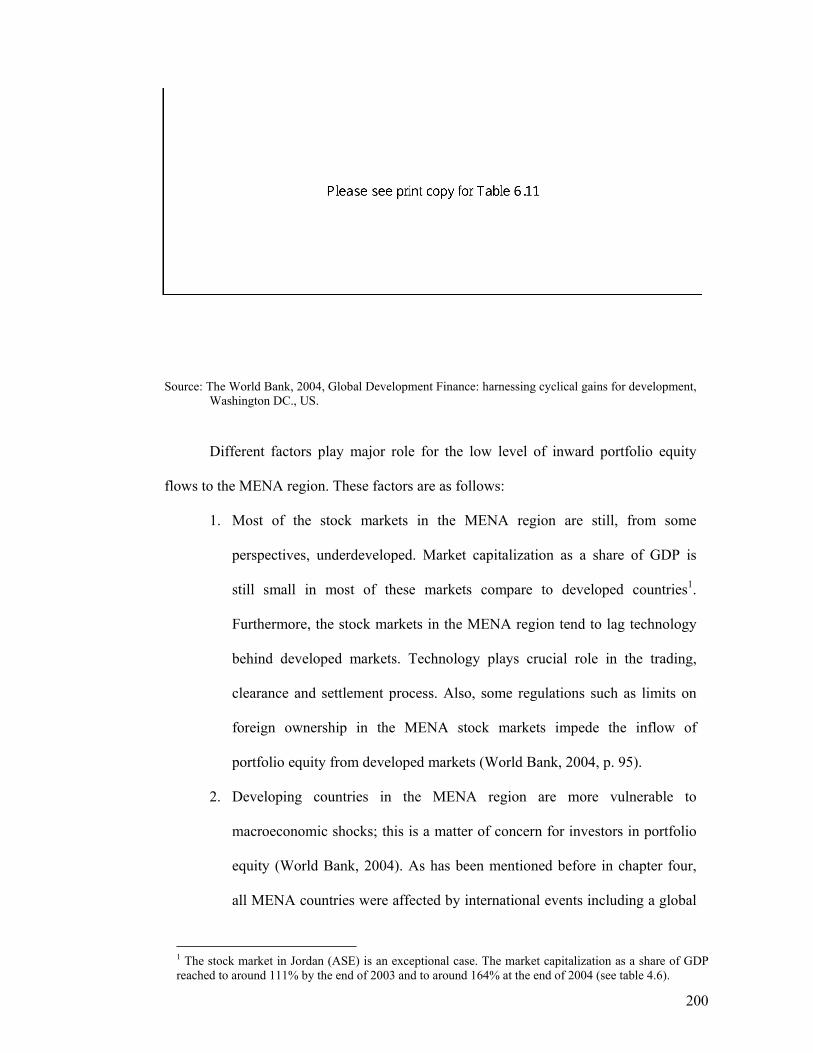
200
Source: The World Bank, 2004, Global Development Finance: harnessing cyclical gains for development, Washington DC., US.
Different factors play major role for the low level of inward portfolio equity
flows to the MENA region. These factors are as follows:
1. Most of the stock markets in the MENA region are still, from some
perspectives, underdeveloped. Market capitalization as a share of GDP is
still small in most of these markets compare to developed countries1.
Furthermore, the stock markets in the MENA region tend to lag technology
behind developed markets. Technology plays crucial role in the trading,
clearance and settlement process. Also, some regulations such as limits on
foreign ownership in the MENA stock markets impede the inflow of
portfolio equity from developed markets (World Bank, 2004, p. 95).
2. Developing countries in the MENA region are more vulnerable to
macroeconomic shocks; this is a matter of concern for investors in portfolio
equity (World Bank, 2004). As has been mentioned before in chapter four,
all MENA countries were affected by international events including a global
1 The stock market in Jordan (ASE) is an exceptional case. The market capitalization as a share of GDP reached to around 111% by the end of 2003 and to around 164% at the end of 2004 (see table 4.6).
201
downturn as a result of the Asian financial crises, the 11th of September
attacks, the war in Iraq, and sharp drop in oil prices in several occasions.
3. One of the main characteristics of the MENA region is the political
instability. The political and military conflicts in the region have affected the
economic environment for the last fifty years. These conflicts include the
Palestinian-Israeli ideological military conflict, the wars in Iraq in 1990 and
2003, and many national political conflicts in some of MENA countries. All
of these events caused political instability in the region, which had and still
negative effects on the economic environment in general, and on the equity
portfolio flows in particular.
4. Some emerging stock markets in different regions are more attractive than
the emerging stock markets in the MENA region. The main emerging stock
markets that attract most of the portfolio equity flows from developed
countries are China, India, Brazil, and some other markets in Latin America
and South Asia. These markets located in more stable region than MENA
region, and considered more developed than stock markets in MENA region.
All of these factors will increase the risk premium in the MENA markets. Based
on this, huge efforts should be carried on to improve the institutional reforms and
increase the degree of openness for foreign capital in the MENA stock markets.
Increasing the market capitalization, adopting new technology and increasing the
liberalization in the MENA stock markets, all of these policies are expected to attract
more equity portfolio to the region. Moreover, these markets need to develop structural
relations with major foreign and regional markets. As such, MENA stock markets have
the potential of offering distinctive risk-return characteristic to investors seeking
international diversification.
202
Moreover, economic policy makers should strengthen their national economies,
so they become less vulnerable to macroeconomic shock, as this is a matter of concerns
for portfolio managers. A stable economy in a stable political environment has a strong
ability to attract equity portfolio more than others. Another important issue that
economic policy makers should be aware of is the culture of their societies and how this
culture affects the economic environment there. On the other hand, how these societies
are perceived by the others. Investment decisions depend not just on economic factors
but also on political and social factors as well. The MENA region is one of the most
dynamic regions in the world from both economic and political perspective. Still to say
that integration by itself is an important goal for all emerging stock markets, even it
could reduce the international equity portfolio diversification to these markets in the
long-run.
Regarding the effect of the existence of cointegration among stock markets in
the MENA region on efficient market hypothesis (EMH), the contribution of this
current study is as follows. First, based on a significant number of previous studies,
such as Wallace (1992), Baffes (1994), Engle (1996) and Ahlegren & Antell (2002),
this study does not support Granger’s theory. This theory asserts that the existence of
cointegration between two stock prices implies the ability to predict each price’s
movement, which indicates market inefficiency. Secondly, what this study tries to bring
out is that in the case of the existence of cointegration between two or more stock
markets, this indicates that these markets are efficient in the long-run. The reason for
this is because the existence of cointegrated vector implies the law of one price (LOOP).
Note that it is actually the law of one vector of prices in that the prices do not have to be
the same, but the differences reflecting variations: including transaction costs and risk
premiums have to be constant in the long-run (Malkiel, 2003). If this is true, then there
203
are little or no arbitrage opportunities. Possible benefits can be achieved from the
diversification of the portfolio from one market in MENA region to another in the long-
run. Malkiel (2003) defines market efficiency as the lack of systematic arbitrage
opportunities which rules out opportunities of earning risk adjusted excess return. Then
the finding of cointegration with the LOOP interpretation implies there maybe no
general equivalence between cointegration and market inefficiency in the long-run.
However, the existence of the VECM may imply that the LOOP does not hold and the
market could be inefficient in the short-run.
Based on the previous argument, a result could be reached that as all stock
markets in the MENA region are cointegrated; this indicates that these markets are
efficient in the long-run. Nevertheless, as the LOOP may not hold in the short-run,
arbitrage opportunities or possible benefit can be achieved in these markets.
204
6.6 Granger Causality The results of the bound tests indicate the existence of cointegration among emerging
stock markets in the MENA region, i.e. there is a long-run equilibrium relationship
among the MENA stock markets. Also the results indicate the existence of cointegration
between the stock market of Egypt and developed markets represented by US and UK.
The following step is to construct a standard Granger causality tests. This test will be
augmented with a lagged error correction term when variables are cointegrated, and
then estimated within a Vector Error Correction Model (VECM). The conducting of this
test helps to explore the short and long-run dynamic relationships among the MENA
stock markets, and between these markets and developed markets. The estimated long-
run causal relationship among stock markets is based on the error correction model
(ECM).
Based on the theoretical background, if two variables, i.e. ty , tx are cointegrated
with each other, then the error correction term is required in testing Granger causality as
follows (see Granger et. al. 2000):
∑ ∑= =
−−−− +∆+∆+−+=∆k
i
k
ititiitittt xyxyy
1 11211110 )( εααφγα (6.15)
∑ ∑= =
−−−− +∆+∆+−+=∆k
i
k
ititiitittt xyxyx
1 12211120 )( εββφγβ (6.16)
where 1γ and 2γ represent the speed of adjustment , and the ( 11 −− − tt xy φ ) represents the
error correction term. The null hypothesis for equation 6.15 is that 0H :
0... 22221 === iααα and 01 =γ , in case of rejecting the null hypothesis, this implies
that tx does Granger cause ty . The null hypothesis for equation 6.16 is that: 0H :
205
0... 22221 === iβββ and 02 =γ , in case of rejecting the null hypothesis, this implies
that ty does Granger cause tx .
The standard causality test is based on the past changes in one variable that
explain current changes in another. However, if cointegration exists between two
variables such as ty and tx , i.e. they share a common trend in the long-run, then current
adjustments in one variable towards its long-run equilibrium are partially the result of
current changes in the other variable. This causality could be detected based on the
significant error correction term (Nell, 1999). According to (Granger, 1988, p. 199) if
these two variables are cointegrated, then there must be causation in at least one
direction between them that is not always detected by using the standard Granger
causality. Moreover, Granger (1988) asserts that neglecting the error correction term
(ECT) when testing for causality among cointegrated variables leads to serious biases
due to filtering out low-frequency (long-run) information.
The test for causality will be misspecified if relevant countries are excluded. It is
well known that the bias of incorrectly excluding a relevant explanatory variable is
greater than the efficiency cost of including an irrelevant explanatory variable. As the F-
statistics in table 6-1 show, the MENA and developed markets should be included in the
Granger-Causality test for Jordan and Turkey (at a 5% and 10% level of significance).
However, the F-statistics for Egypt and Morocco fall within the inconclusive region. As
mentioned, we need to include these variables to avoid potential serious
misspecification bias. The only cost in doing this is a loss of statistical efficiency, which
should not be large because of the relatively large sample size 115 observations1.
1 We could also use stock return variables instead of the share price indices although the Granger-causality results presented in table 6-12 show that the developed countries are important according to the share price indices.
206
There are other reasons for including developed stock markets in the analysis;
the study includes the US, the UK and the German stock markets. The US, the UK and
Germany are among the largest economies in the world. They have mature and well
functioning markets constituting a significant portion of capitalization in the global
market. All countries in the MENA region have strong economic relationships with
these three countries. This study explores whether MENA stock markets can offer
international investors from these developed countries unique risk and returns
characteristics to diversify international portfolios. In the last decade and as a result of
liberalization and privatization policies in the MENA region, portfolio equity continues
to flow to the region from those countries. In addition, more multinational corporations
such as banks, insurance companies and industrial companies have started their
operations in the region recently. For all of these reasons it is very important to include
them in the study.
The Granger Causality within VECM approach is applied for stock price indices
in MENA markets and developed markets. The results are presented in Table 6.12. For
the short-run causality, the Chi-square test of the explanatory variables indicates the
significance of the short-run causal effect, while the t-statistics on the coefficient of the
lagged ECT indicates the significance of the long-run causal effect. The optimal number
of lag is used based on two different criterions, namely Schwarz Bayesian Criterion
(SBC) and Akaike Information Criterion (AIC). The lag structure is sensitive to the
model selection criterion. As mentioned before, SBC is a parsimonious model that
selects the smallest possible lag length, while (AIC) selects the maximum relevant lag
length.
In the case of stock price index in Egypt is dependent variable, the results show
that the coefficient of the ECM term is statistically highly significant which indicates
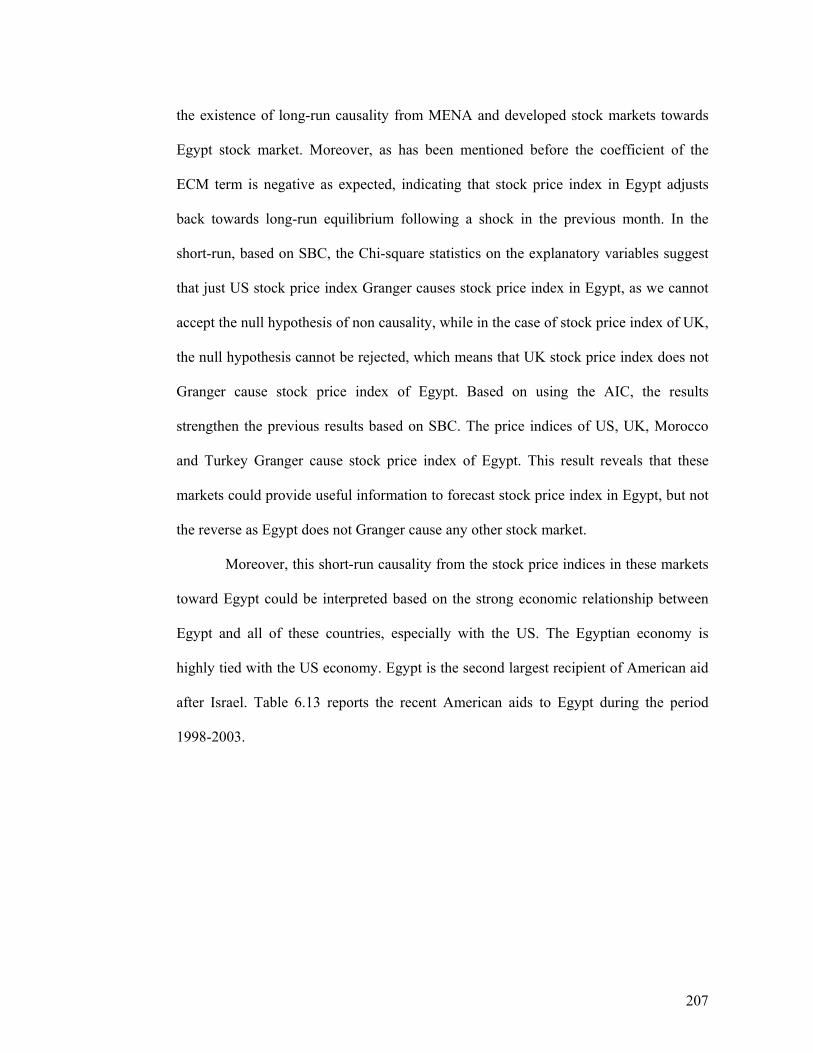
207
the existence of long-run causality from MENA and developed stock markets towards
Egypt stock market. Moreover, as has been mentioned before the coefficient of the
ECM term is negative as expected, indicating that stock price index in Egypt adjusts
back towards long-run equilibrium following a shock in the previous month. In the
short-run, based on SBC, the Chi-square statistics on the explanatory variables suggest
that just US stock price index Granger causes stock price index in Egypt, as we cannot
accept the null hypothesis of non causality, while in the case of stock price index of UK,
the null hypothesis cannot be rejected, which means that UK stock price index does not
Granger cause stock price index of Egypt. Based on using the AIC, the results
strengthen the previous results based on SBC. The price indices of US, UK, Morocco
and Turkey Granger cause stock price index of Egypt. This result reveals that these
markets could provide useful information to forecast stock price index in Egypt, but not
the reverse as Egypt does not Granger cause any other stock market.
Moreover, this short-run causality from the stock price indices in these markets
toward Egypt could be interpreted based on the strong economic relationship between
Egypt and all of these countries, especially with the US. The Egyptian economy is
highly tied with the US economy. Egypt is the second largest recipient of American aid
after Israel. Table 6.13 reports the recent American aids to Egypt during the period
1998-2003.
208
6.12 Granger Causality Results Based on Vector-Error Correction Model (VECM)
Short-run lagged differences (Chi-Square) ECT Dependent Variable
Criterion used
∆lnE ∆lnT ∆lnJ ∆lnM ∆lnUS ∆lnUK ∆lnG Coefficient t-statistics
SBC _ 2.958* (1)
0.448 (1)
-0.256 -4.532*** ∆lnE
AIC _ 3.429* (2)
8.178** (3)
10.492*** (3)
10.812*** (3)
-0.222 -3.323***
SBC _ 13.477*** (1)
-0.304 -4.099*** ∆lnT
AIC _ 3.308 * (2)
6.418 ** (1)
-0.313 -4.272***
SBC 0.0498 (1)
_ 17.391*** (2)
-0.139 -3.271*** ∆lnJ
AIC 7.273* (3)
_ 13.104 *** (2)
-0.171 -3.852***
SBC _ -0.135 -2.962*** ∆lnM
AIC _ 5.535 * (2)
-0.116 -2.545**
Notes: 1- The symbols ***, ** and * indicate significance at 1, 5 and 10% level, respectively. 2- The orders of lags are reported in the parentheses.
209
Table 6.13 Recent American Aids to Egypt $US million
Source: Congressional Research Service, 2003, http://www.fas.org/man/crs/IB93087.pdf
.
In the case when stock price index of Turkey is dependent variable, the results
show that the coefficient of the ECM is highly significant which indicates the existence
of long-run causality from MENA and developed markets towards Turkey stock market.
In the short run, and based on both SBC and AIC, Chi-square statistics on the
explanatory variables suggest that the stock price index in Germany Granger causes
stock price index in Turkey as the null hypothesis of non-causality cannot be accepted at
1% significant level based on SBC and at 5% significant level based on AIC. Also,
based on AIC, the results show that stock price index in US Granger cause the stock
price index in Turkey in the short-run. In related to the economic relationship between
Turkey and Germany the statistics show that Germany is the most important trading
partner to Turkey. The volume of bilateral trade in 2003 reached EUR 16 billion.
Moreover, the largest number of foreign companies investing in Turkey is German (See
www.auswaertiges-amt.de). The short-run Granger causality from US and Germany
towards Turkey indicates that these markets could provide useful information to
forecast stock price index in Turkey.
210
When stock price index in Jordan is dependent variable, the coefficient of the
error correction term shows a significant long-run causality at 1% level based on both
SBC and AIC. This long-run causality goes from MENA and developed stock markets
towards Jordan stock market. On the other hand, the Chi-square statistics on the
explanatory variables suggest that stock price indices in both UK and Turkey Granger
cause stock price index in Jordan. This reveals that both UK and Turkey stock markets
could provide some information to predict the stock price index in Jordan.
The stock market of Morocco is found to be the most exogenous among all
MENA markets despite one channel of short-run Granger causality from the German
towards the Moroccan market at 10% significant level based on AIC; this result could
be interpreted based on the strong economic relationship between Morocco and some
European economies, especially Germany as it considered one of the main economic
partners to Morocco. So, the German stock market could provide information to
forecast the stock price index in Morocco. Based on SBC, no short-run causality is
found towards Morocco. However, the coefficient of the ECT is found to be significant,
this indicates the existence of long-run causality from MENA and developed markets
towards the stock market in Morocco.
Finally, it is worth mentioning that as the coefficient on the lagged error
correction term for each price index in the MENA markets is significant with a negative
sign, this means that in the long-run the stock price index in each market in MENA
region bears the brunt of any disturbance in the long-run equilibrium relationship either
in other MENA stock markets or in developed markets.
211
6.7 Conclusion The main purpose of this chapter is to examine the stock markets integration in MENA
region, represented by Turkey, Egypt, Jordan, and Morocco. At the same time, it
examines the integration between these markets and some developed markets
represented by US, UK and Germany. Moreover, the chapter explores the short and
long-run dynamic relationship between these markets.
To achieve the previous objectives, the study utilizes the newly proposed
autoregressive distributed lag (ARDL) cointegration approach. This approach is more
preferable in estimating the cointegration among variables than other conventional
approaches for many reasons like being more robust for small sample sizes, and being
applied irrespective of whether the regressors are I(0) or I(1). The existence of
cointegration among stock prices indicates stock markets integration; this implies that
one of the markets will help predicting the other markets returns. Moreover, to test for
the short and long-run dynamic relationship, the study conducts the Granger-causality
test within a Vector Error Correction Model (VECM).
The results indicate the existence of integration among MENA stock markets,
especially when Egypt stock market is dependent variable. At the same time no
integration between MENA stock markets and the developed markets has been found,
except between Egypt market and these developed markets.
The results of conducting the Granger-causality test within a Vector Error
Correction Model show the existence of long-run causality from developed markets
towards all stock markets in MENA Region, and also long-run causality among MENA
stock markets themselves. The coefficient of the ECT is found to be strongly significant
for all markets. However, in the short-run, based on SBC and AIC, it is found that US,
UK, Turkey, and Morocco Granger-cause stock price index in Egypt. In the case of

212
Turkey, the results show that Germany and US Granger-cause stock price index in
Turkey in the short-run. For Jordan, the results show that there is a Granger-causality
from UK and Turkey towards Jordan. Finally, in the case of Morocco, it is found that
Germany Granger-cause stock price index in Morocco in the short-run.
213
Chapter Seven
Summary and Conclusions 7.1 Introduction This study empirically investigates stock market integration in the Middle East and
North Africa (MENA) region. The study focuses on four emerging stock markets in the
region, namely, Egypt, Turkey, Jordan and Morocco. The interrelationships between
these emerging markets and developed markets, represented by the US, UK and
Germany, are also investigated. Two main definitions for stock market integration are
commonly adopted in the literature. The first is related to the early theoretical models
(ie. the capital asset pricing models) of stock market integration. According to these
models, national markets are considered to be integrated if securities with the same risk
characteristics are priced the same, even if they are traded on different markets. In other
words, if two or more markets are integrated then the identical securities should be
priced identically within both markets. The existence of stock market integration
implies that stocks in all markets are exposed to the same risk factors and the risk
premia on each factor is the same in all markets.
The second definition is related to the recent literature of stock market
integration. Most recent studies have adopted an alternative view of stock market
integration. They rely on recent econometric techniques, such as cointegration, the
generalized autoregressive conditional heteroscedasticity (GARCH) model, Granger
causality and vector autoregressive (VAR) models, to measure stock market integration
among national stock markets. According to these studies, stock markets are considered
214
integrated if they share a long-run equilibrium relationship. In other words, the
existence of co-movements between the stock price indices indicates stock market
integration. This co-movement, which indicates the existence of cointegration between
two stock markets, implies that one of the markets will help predicting the other
market’s returns, since a valid error correcting representation will exist.
This chapter is divided into five sections. Section 2 presents a summary of the
chapters in the study including the main empirical findings. Section 3 analyses the
implication of the study. Section 4 outlines the specific contributions made by this study
and discusses the implications of the empirical findings for the MENA region. Finally,
section 5 presents some suggestions for future research.
7.2 Summary of the Study
This study started with an overview of the early theoretical models related to stock
market integration in chapter 2. The main aim of the chapter was to analyse the
literature related to stock market integration that used different versions of asset pricing
models, such as capital asset pricing model (CAPM). Also this chapter reviewed the
literature related to the Arbitrage Pricing theory (APT). According to the asset pricing
models, stock markets are considered to be integrated if securities with the same risk are
priced the same. So in the case of implementing CAPM, there will be a unitary price
risk, and the price of all assets will reflect the level of systematic risk they possess so
the assets are considered to be integrated. Also, the chapter reviewed another asset
pricing model that is the consumption-based asset pricing model. This model shows that
the simple relation between consumption and assets return captures the implication of
215
the complex dynamic international multi factor asset pricing model. The chapter also
reviewed the arbitrage pricing theory (APT) model, which unlike the CAPM, depends
on no arbitrage conditions. It assumes that stock prices can be influenced not only by
the market risk, but also by several sources of systematic risk in the economy. These
sources can be thought of as factors such as integration, aggregate output, industry
effects and interest rate. Moreover, beside the asset pricing models and the arbitrage
pricing theory, some studies used what is called a conditional regime-switching model.
This model allows for switching between segmentation and integration by attaching
probabilities to the respective asset pricing models. However, most of recent studies
rely on recent econometrics techniques, such as cointegration techniques, generalized
autoregressive conditional heteroscedasticity (GARCH) model, Granger-causality,
vector autoregressive (VAR) model and variance decomposition, to measure the stock
market integration among national stock markets. These approaches are reviewed and
analyzed extensively in chapter three.
Cointegration approaches become the most popular techniques to be used for
testing stock market integration. Chapter 3 reviewed a significant amount of literature
that used different cointegration approaches. The idea behind using cointegration
techniques is that if stock markets are integrated, it is expected for the indices in these
markets to display common trends. Many studies try to calculate the number of
common stochastic trends, but since these indices are nonstationary, then using
cointegration method becomes necessary. The existence of co-movements between the
securities prices indicates stock market integration. This co-movement implies that one
of the markets will help predicting the other market’s returns, since a valid error
correcting representation will exist. Also, they share at least one common stochastic
trend and they will tend to drift together over time. This chapter reviewed the most
216
popular cointegration approaches such as, Engel-Granger two-step method, Johansen’s
maximum likelihood procedure and finally the recently developed autoregressive
distributed lag (ARDL) approach. The studies, which are reviewed in this chapter, have
obtained different findings on financial integration among stock markets. This chapter
also reviewed some studies that investigated the effect of the Asian financial crisis on
stock market integration in different parts of the world. The relationship between the
existence of cointegration and stock market efficiency was analyzed. The chapter
covered the debate about this issue started by Granger in 1986. He asserted that the
existence of cointegration between two stock markets implies that these markets are not
efficient. This point of view has been criticized by several studies. These studies
indicate that market efficiency does not preclude cointegration, and because no
empirical evidences have confirmed that predictability from cointegration can lead to
arbitrage opportunities, so cointegration does not necessarily imply market inefficiency.
However, this study asserts that the existence of cointegration between stock markets
implies stock market efficiency. This is because existence of cointegration vector
implies the law of one price (LOOP) in the long-run. Therefore, little or no arbitrage
opportunities or possible benefit can be achieved from the diversification portfolio from
one market to another. However, with the short-run error correction model (ECM) there
could exist arbitrage opportunities and possible benefits from diversification, ie. the
LOOP may not hold in the short run.
The last part of the chapter reviewed most of the empirical studies that examined
the stock market integration in the MENA region. Most of these studies found that
cointegration exists among the MENA stock markets, which means that these markets
are integrated with each other. At the same time, some of these studies found that these
markets are not integrated with developed markets. However, these studies are criticized
217
for using conventional cointegration approaches, which are not appropriate for small
sample sizes, and for covering few numbers of markets.
Chapter 4 outlined the specific characteristics of the four main emerging stock
markets in the MENA region. The chapter started by giving a brief analysis of the
general economic features of these four countries. All of these countries are considered
as low and middle-income countries. Following the brief analysis regarding the
economic features in these countries, the stock market liberalization in these markets
was reviewed. MENA countries started to liberalize their stock markets during the late
eighties and mid nineties. The first country to liberalize its stock market was Morocco
in 1988; it allowed foreign investors to have complete access to the Casablanca Stock
Exchange. In 1989, Turkey also liberalized its stock market by removing all restrictions
for foreign investment. Egypt and Jordan liberalized their stock markets in 1992 and
1995, respectively. As a result of these liberalization and several privatization programs,
portfolio equity started to flow to the stock markets in the region. A summary of the net
flows to the stock markets during the period 1994-2002 was reported in the chapter.
The stock markets in the MENA region have achieved considerable
improvement in the last decade due to several factors such as the achievement of higher
economic growth, monetary stability, stock market reforms, privatization, financial
liberalization and institutional framework for investors. Regarding the development of
these stock markets in the region, an inclusive analysis of the main market indicators for
each stock market was presented. These indicators include market capitalization, trading
value, turnover ratio and the number of listed companies in each market. It was found
that the Istanbul Stock Exchange in Turkey is the region’s dominant stock market; the
market capitalization is the largest among all stock markets. Also, the turnover ratio in
Turkey, which is an index of the market liquidity, is considered to be the most active
218
among all stock markets. The highest level of market capitalization as a percentage of
the GDP was in Jordan. This high rate could reflect the importance of the stock market
in the national economy; it could also reflect the importance of the stock market in
Jordan from both regional and international perspective.
Chapter 5 tested the unit root hypothesis using both the conventional unit root
tests and the unit root tests in the presence of structural change at an unknown time of
the break. The chapter started with presenting a preliminary descriptive analysis of the
statistical characteristics of the stock price indices1. Based on the correlation coefficient
matrices, it is found that the correlation coefficients among the MENA markets either in
related to stock indices or stock returns are low. At the same time, correlation
coefficients among developed markets are extremely high. Also, it is found that Egypt
and Morocco have the highest correlation coefficient among MENA markets, while
Turkey has a high correlation coefficient with the developed markets.
The conventional Augmented Dickey-Fuller (ADF) and Phillips-Perron (PP)
unit root tests were then conducted. The results failed to reject the null hypothesis of a
unit root for all monthly stock price indices using both local currency and $US mesures.
This indicates that all indices are non-stationary. The same tests were applied to the first
differences of the indices expressed in both local currency and $US and the results from
both tests rejected the null hypothesis of non-stationarity across all indices. This means
that all indices become stationary if they are first differenced. However it is known that
when performing the conventional unit root tests for a time series where there are
structural breaks, these tests are biased towards the non-rejection of the unit root hull
hypothesis.
1 For an inclusive view, the study expressed all stock price indices in both local currency and $US.
219
The study then tested for a unit root in the presence of structural change at an
unknown time of the break. These tests were conducted by using the Innovational
Outlier (IO) models proposed by Perron (1997) and Perron and Vogelsang (1992).
These more appropriate tests reinforced the main findings drawn form the ADF and PP
unit root tests that all the variables are integrated of order one I(1). Rregarding the
endogenously determined time of the break for each stock market, the results showed
that they coincided with the real events which affected each stock price index. The time
of the breaks in the MENA stock markets were as follows: for Egypt it was in 2001:4,
for Turkey it was in 1999:7, for Jordan it was in 2001:12 and for Morocco it was in
1996:11.
Finally, the results of conducting unit root tests in the presence of structural
change indicated that all stock markets in the MENA region are characterized by a unit
root. This is consistence with the efficient market hypothesis as the random walk
hypothesis is associated with weak form of the efficient market hypothesis. This result
emphasises that the stock markets in the MENA region are efficient.
In the final chapter 6, the study used the newly proposed autoregressive
distributed lag (ARDL) test of cointegration. This approach has been recently developed
and introduced by Pesaran et al (2001) based on previous studies by Pesaran and others.
The ARDL approach has been recognized as a more preferred approach than other
cointegration approaches. Some of the reasons for preferring the ARDL procedure over
others are as follow: First, it is applicable irrespective of whether the underlying
regressors are purely )0(I , purely )1(I or mixed )0(I and )1(I process. Second, it is
more robust and performs well for small sample sizes – such as in this study - than other
cointegration approaches. Third, by using the ARDL approach one can estimate the
long-run and the short-run components of the model simultaneously.
220
The cointegration test results show that there are long-run equilibrium
relationships among all stock markets in the MENA region. This indicates that stock
markets in the MENA region move together in the long-run. So, at the regional level all
markets are integrated. At the same time no long-run equilibrium relationship was found
between MENA markets and developed markets. This means that MENA stock markets
are segmented from developed markets. However, Egypt was the exceptional case; the
study found that the stock market of Egypt has long-run equilibrium relationship with
the US and UK markets. The main reason for the integration between the stock market
in Egypt and the stock market in the UK is that in the year 2000, several companies in
the telecommunication, construction and tourism sectors listed their shares on the
London Stock Exchange. The reason for the integration between the stock market in
Egypt and the stock market in the US is that the Egyptian economy is highly tied with
the US economy. This strong economic relation is reflected in the Egyptian stock
market.
In comparison with the previous studies conducted over the stock markets in the
MENA region, this study is mostly consistent with Darrat (2000). Darrat found
cointegration among the MENA stock markets but no evidence of cointegration
between these markets and the US. The results of this study are consistent with Darrat’s
(2000) results, yet we used different sample and different techniques. Also, this study
contradicts Neaime (2002). In his study he found that MENA stock markets are
cointegrated with developed markets but no evidence of cointegration among
themselves. This inconsistency is possibly due to different sample periods covered in
his study. Also, it is possibly due to using three developed markets by this study, while
in Neaime’s study only two markets, the US and UK are considered. Finally the results
of this study are partly consistent with Maghyereh (2003). In his study, Maghyereh
221
found that the integration among the MENA markets is still weak. However, he did not
study the integration between MENA markets and developed markets.
In regards to stock markets efficiency, this study asserted that MENA stock
markets are efficient in the long-run. The reason for this is because the existence of
cointegration vector implies the law of one price (LOOP). However, with the short-run
error correction model (ECM) there could exist arbitrage opportunities and possible
benefits from diversification, ie. the LOOP may not hold in the short run.
Finally, the study conducted Granger-causality tests. This test was augmented
with a lagged error correction term when variables are cointegrated, and then estimated
within vector error correction model (VECM) for stock price indices in the MENA
markets and developed markets. The conducting of this test helps to explore the short
and long-run dynamic relationships among MENA stock markets, and between MENA
markets and developed markets. The optimal lag length used was based on two different
criterions, namely the Schwarz Bayesian Criterion (SBC) and the Akaike Information
Criterion (AIC). The reason for using these two criteria is because the lag structure is
sensitive to the model selection criterion. As mentioned before, the SBC is a
parsimonious model that tends to select the shorter lag length, while the AIC typically
selects longer lag lengths.
The results of Granger-causality test based on vector error correction model
(VECM) reveal the existence of long-run causal relationships among the MENA
markets. This means that these markets influence each other. Also, the results show that
developed markets influenced stock markets in the MENA region. In the short-run,
there is unidirectional Granger-causality running from stock prices in Turkey, Morocco,
The US and UK to Egypt. Also, there is unidirectional Granger-causality running from
Germany and the US towards Turkey. In addition, The UK and Turkey are found to
222
Granger-cause the stock prices in Jordan. Finally, there is a unidirectional Granger-
causality from Germany to Morocco.
7.3 Implications of the Study The empirical findings of this study indicate that the stock markets in the MENA region
are found to be integrated with each other (regionally), but not with the developed
markets (internationally). However, Egypt was the exceptional case as it is integrated
with the US and UK. These empirical findings have several important implications in
regards to portfolio diversification. These implications were analyzed at two levels; the
regional level and the international level.
First at the regional level, the results showed that stock markets in the MENA
region are integrated with each other. This implies the existence of the law of one price
(LOOP). This means that the potential of regional investors for obtaining abnormal
profits through portfolio diversification is limited in the long-run. The reason for this is
that as MENA stock markets are cointegrated, abnormal profits will be arbitraged away
in the long-run. However, despite no arbitrage opportunities in the long-run, investors
can still achieve arbitrage profits through portfolio diversification in the MENA stock
markets in the short-run. This depends on the speed of adjustment which is represented
by the error correction term . The coefficients of error correction term for the MENA
stock markets are as follows, for Egypt it is -0.26, for Turkey it is -0.30, for Jordan it is
-0.14 and for Morocco is -0.14. These coefficients show that the speeds of adjustment is
slow which means the short-term corrections can last for longer periods, and there is a
high possibility of achieving arbitrage profits as the LOOP may not hold.
223
Second, at the international level, the results showed that stock markets in
Turkey, Jordan and Morocco are not integrated with developed markets, represented by
the US, UK and Germany. This means that there is no significant long-run impact from
developed stock markets towards these markets. However, a long-run relationship is
found between Egypt and both the US and UK when Egypt is a dependent variable.
Based on these results, there are opportunities for international investors to obtain long-
run gains through international portfolio diversification in Turkey, Jordan and Morocco
stock markets. Also at the same time, investors from these three countries have the
opportunities to obtain long-run gains through investing in developed markets. The
existence of long-run relationships between Egypt and both US and UK implies that the
potential for investors from the Egyptian stock market to obtain abnormal profit through
portfolio diversification in US and UK is limited in the long-run. However, there are
opportunities for achieving abnormal profit by investing in Germany as it is not
cointegrated with the MENA markets. In the short-run, arbitrage opportunities and
possible profits may also be achieved from diversification as the LOOP may not hold.
However, despite these results, it is found that the MENA region is not attracting
more international portfolio investment. Different factors cause this low level of inward
portfolio equity flow to the region. One of the main factors is that most of these markets
are still underdeveloped compared with developed markets as the market capitalization
is still small in most these markets. Another factor is that most of countries in the
MENA region are more vulnerable to macroeconomic shocks and this is a matter of
concern for investors in portfolio equity. Moreover, the political instability in the region
plays a vital role in reducing the equity portfolio flow to the stock markets in the region.
Based on these results, efforts should be carried out to improve the institutional
reforms and increase the degree of openness for foreign capital in the MENA stock
224
markets. Increasing market capitalization, adopting new technology and increasing the
liberalization in the MENA stock markets are expected to attract more equity portfolio
to the region. Also, these markets need to develop structural relations with major
foreign and regional markets. Moreover, economic policy makers should strengthen
their national economies, so they become less vulnerable to macroeconomic shocks, as
this is a matter of concern for portfolio managers. Still to say that a stable economy in a
stable political environment has a strong ability to attract equity portfolio.
7.4 Contribution of the Study This study has made significant contributions to the analysis of stock market integration
in the MENA region. First, this study is believed to be the first study to address the
issue of structural change when testing for the unit root hypothesis in the MENA stock
markets. According to our knowledge, and after conducting an inclusive survey, no
study has addressed this issue before when examining stock market integration in the
MENA region. As has been mentioned before when performing the conventional unit
root tests, such as Dickey-Fuller and Phillips-Perron tests for a time series where there
are structural breaks, these tests are biased towards the non-rejection of the unit root
hypothesis in the presence of structural breaks. These tests lack power in the presence of
potential structural breaks in the series and they may fail to show whether a series is
first difference stationary. For conducting unit root test in the presence of structural
change at an unknown time of the break, the study used the Innovational Outlier models
proposed by Perron (1997) and Perron and Vogelsang (1992). The results of conducting
these models indicated that the endogenously determined times of the breaks for all
225
variables coincides with observed real events for each country, such as the Asian crisis,
fluctuations in oil prices and political conflicts in the MENA region.
Secondly, this study used larger sample of stock markets than previous studies.
Three developed markets have been included for the first time, beside four emerging
markets form the MENA region. Previous studies include either one developed market
or at most two. Also, the period of the study has been conducted over a longer period of
time than previous studies. Moreover, when presenting descriptive statistics, or
conducting the conventional unit root tests and the unit root test in the presence of
structural change test, all stock price indices were expressed in both local currency and
$US. This gives an inclusive view more than previous studies.
Thirdly, most previous studies have used conventional cointegration approaches
such as Engle-Granger (1987) and Johansen-Juselius (1990). These approaches
concentrate on cases in which the underlying variables are integrated of order one. Also,
they are valid for large sample size and not for small samples. However, this study has
overcome these difficulties by utilizing the newly proposed autoregressive distributed
lag (ARDL) approach. The ARDL approach is applicable irrespective of whether the
underlying regressors are )0(I , )1(I . Also, the ARDL approach is more robust and
performs well for small sample sizes, such as this study, than other cointegration
approaches. This study is believed to be the first to examine stock market integration in
the MENA region by using the ARDL approach.
Fourthly, this study contradicted Granger’s (1986) theory on the relationship
between the existence of cointegration and market efficiency. Granger (1986) asserted
that the existence of cointegration between two stock prices implies the ability to predict
each price’s movement, which indicates market inefficiency. Also, this study did not
fully agreed with other perspectives, such as those found in Wallace (1992), Baffes
226
(1994), Engle (1996), Ahlgren and Antell (2002), and Masih and Masih (2002) in which
they asserted that cointegration does not necessarily imply market inefficiency or
efficiency. What this study tried to bring out was that if cointegration exists between
two stock markets then these markets are efficient in the long-run because the existence
of cointegrated vector implies the law of one price (LOOP). Therefore, little or no
arbitrage opportunities or possible benefit can be achieved from the diversification
portfolio from one market to another. However, with the short-run error correction
model (ECM), there could exist arbitrage opportunities and possible benefits from
diversification, ie. the LOOP may not hold in the short run.
7.5 Suggestions for Future Research There are several avenues for future research that stem from this study. These could be
summarized as follows:
1. Although this study has used Perron’s (1997) model, which is one of the most
advanced techniques to test for a unit root in the presence of an unknown
structural break, other recent techniques allow for multiple structural breaks.
These techniques could be implemented in future studies when studying stock
markets in the MENA region. Moreover, a panel data unit root tests could be
implemented too by which we can test for common shocks affecting the MENA
stock markets.
2. The sample of the study could be extended to include more stock markets.
Several countries in the MENA region (such as the United Arab Emirates, Qatar,
Bahrain, Oman, Kuwait and Saudi Arabia) have established their stock markets
227
recently. These markets are playing increasing roles in their economies. Also,
the Israel stock market (as a developed market) could be included in a further
study to test whether it is integrated with other stock markets in the region or
not.
3. This study has used stock price indices to test for stock market integration.
However, it could be interesting to see whether different sectors in those
countries are integrated. For example, rather than concentrating on general
stock markets, one can study whether specific sectors in different markets are
integrated.
4. Future studies could be conducted to examine the stock market efficiency in the
region. This issue has been attracting a great deal of interest recently. These
studies could be conducted either on a group of stock markets or on an
additional market.
5. The liberalization of the stock market is another important topic to be
investigated. Future studies could examine the relationship between
liberalization, integration and the efficiency of stock markets.
228
Appendix (A)
Conventional Unit Root Tests
A.1 Stationary Time Series The using of time series data for empirical work requires that the underlying time series
is stationary. Stationary means that the fundamental form of the data generating process
remains the same over time. Many economic time series are nonstationary. The use of
standard inference procedures for the estimation of nonstationary series could lead to
spurious results. These spurious regressions usually exhibit a high 2R but low Durbin
Watson ( DW ) statistic. The rises of this spurious results is because if the time series
involved in the regression exhibit strong trend, then the high 2R , which observed, is due
to presence of the trend not to a true relationship. Any time series can be thought of as
being generated by a stochastic (random) process. According to Gujarati, (1995):
“A stochastic process is considered to be stationary if its mean and
variance are constant over time and the value of covariance between two
time periods depends only on the distance or lag between the two time
periods and not on the actual time at which the covariance is computed.”
The mean stationary means that the expected value of the process is constant over
time:
Let tY be a stochastic time series, then:
229
The Mean:
tYE t ∀= µ)( (1)
Also, variance stationary means that the variance is temporally stable:
The Variance:
tYEY Ytt ∀=−= 22)()var( σµ (2)
And the covariance stationary is similar:
The covariance:
[ ]))(( µµγ −−= +kttk YYE (3)
),cov( ktt YY += (4)
If 0=k , we obtain 0γ , which is the variance of )( 2σ=Y .
This form of stationary is called “weak stationary”. Another form of stationary is
called strict stationary and that is if the joint probability distribution of any set of
observations }{ tYYY ,..., 21 is the same as that for }{ ktkk YYY +++ ,..., 21 , for all t and k .
A.2 Unit Root Tests The unit root test is the most widely used test for stationary; it was first presented by
Fuller (1976), and Dickey and Fuller (1979). These tests are referred to as Dickey-Fuller
(DF) tests. A simple form of the DF test is based on the following model:
ttt uYY += −1ρ (5)

230
where tu is a white noise error term with zero mean, constant variance 2σ , and
nonautocorrelated. In the case that the coefficient of 1−tY ( ρ ) is equal to 1, then we have
unit root problem, in other words the stochastic variable tY has a unit root or what is
known as a random walk time series, which it is an example of a nonstationary time
series. Still to say that the test is named unit root because it is the root of a polynomial.
Equation (5) alternatively expressed as:
( ) ttt uYY +−=∆ −11ρ (6)
ttt uYY +=∆ −1β (7)
where 1−= ρβ , and 1−−=∆ ttt YYY
the null hypothesis for a unit root is 0=β (equivalently 1=ρ ) and it is tested against
the alternative of 0<β or stationary series.
Dickey fuller test can be applied not just for equation (7) but for more extended
formulas as follows:
ttt uYY ++=∆ −11 βα (8)
where tY is a random with drift and 1α is a constant.
the null hypothesis 0H : 0=β
tttt uYY +++=∆ −121 βαα (9)
where tY is a random walk with drift around a stochastic trend, t is the time or the trend
variable. Again the null hypothesis is 0H : 0=β
231
A.3 Augmented Dickey Fuller (ADF) Test In the last two equations both constant ( 1α ) and trend term ( t ) have been included
assuming that the error term is nonautocorrelated. In the case that the error term ( tu ) is
autocorrelated (not white noise), then to make the error term nonautocorrelated (serially
independent), Dickey and Fuller have augmented equation (9) by including the lagged
value of the dependent variable tY∆ , the result is known as Augmented Dickey Fuller
(ADF) test, it has the following form:
∑=
−− +∆+++=∆m
ititttt YYY
1121 εδβαα (10)
Equation (10) is the most extended form of Augmented Dickey Fuller (ADF) test;
it can be reduced to the following forms:
∑=
−− +∆++=∆m
itittt YYY
111 εδβα (11)
∑=
−− +∆+=∆m
itittt YYY
11 εδβ (12)
In all previous equations 10, 11 and 12, the null hypothesis is that 0=β , that is
there is unit root.
ADF and DF tests statistics have the same asymptotic distribution; therefore they
have the same null hypothesis and same critical values. However, two important things
should be considered, first not to include too few lags because this will leave
autocorrelation in the errors, and second not to include too many lags because that will
reduce the power of the test statistics. Couples of different ways have been suggested to
overcome this problem. Practically, one of the best options is to estimate models with a
232
range of values for ( m ), and then use one of the following tests: the Akaike Information
Criterion (AIC) or Bayes Information Criterion (BIC) to determine which the best option
is1.
The Akaike Information Criterion (AIC) takes the following formula:
NmmAIC m
2ˆln)( 2 += σ (13)
where m is the number of parameters in the model and N is the number of observations
in the regression.
The Bayes Information Criterion (BIC) takes the following formula:
NNmmBIC m
lnˆln)( 2 += σ (14)
A.4 Phillips-Perron Tests Phillips and Perron (1988) develop a more comprehensive theory of unit root non-
stationarity. They introduce a different method to overcome the problem that the error
term is serially correlated (not white noise), without including lagged difference error
term as the Augmented Dickey– uller (ADF) tests. The Phillips-Perron (PP) tests take the
following formula:
ttt uyy ++=∆ −1ρα (15)
Still as (ADF) tests, a constant and time trend can be included in the equation (15). This
equation is estimated by using OLS. In general (PP) tests give the same conclusions as 1 There are more than AIC and BIC tests, but these two have received substantial acceptance in recent applied econometrics.
233
(ADF) tests and suffer from most of the same important limitations (Brooks, 2002,
p.381).
However, in order to avoid spurious regression, the nonstationary time series
should be transformed to a stationary time series. One way2 for doing this is to
differentiate the nonstationary time series d times to achieve stationary and this series is
called integrated of order d , denoted )(~ dIxt . Still to say that if the time series is
already stationary then it is called )0(I (Granger, 1986).
2 The transformation process depends on whether the time series are difference stationary or trend stationary, for more details about the transforming process, see Gujarati (2003).
234
Appendix B
Cointegration and Causality Tests
B.1 Cointegration Cointegration is an economic tool for examining the long run equilibrium relationship
among a set of time series variables. According to Granger (1986): “the term
equilibrium in this definition describes the tendency of an economic system to move
towards a particular region of the possible outcome space, and does not imply
anything a bout the behavior of economic agents”, in the case there is two times series
tx and ty , and both of them are nonstationary, that they have stochastic trend, and
integrated of order 1. Now if the linear combination of these two time series is
stationary )0(I , then the two variables are considered cointegrated. So cointegration is
considered as a linear combination of nonstationary variables.
Consider the relationship between two times series ty and tx represented by:
ttt uxy ++= 10 ββ (1)
equation (1) can be written as:
ttt xyu 10 ββ −−= (2)
if the tu is found to be stationary )0(I , then the other side of the equation (the linear
combination tt xy 10 ββ −− ) must also be stationary. Depending on this, both
variables are considered cointegrated. This example can be extended to a more
general case by assuming tx to be an 1×n column vector of economic variables that
235
represents the transpose of the t th row of a nt × matrix of variables, X . As the vector
tx will be in long-run equilibrium when:
0...2211 =+++ ntntt xxx βββ (3)
any deviations from this relationship will represent equilibrium errors such that:
tt xe δ= (4)
where δ is an 1×n row vector of linear weights referred to as the cointegration
vector (Grieb, 1996, p. 59).
Engle and Granger (1987) adapted a formal definition for cointegration from
Granger (1981) and Granger and Weiss (1983) as follows:
“ The component of the vector tx are said to be cointegrated of the order
bd , , denoted ),(~ bdCIxt , if (i) all components of tx are )(dI ; (ii)
there exists a vector )0(≠α so that )(~ bdIxz tt −′=α , 0>b . The vector
α is called the cointegration vector”.
B.2 Error Correction Model (ECM) The main idea behind cointegration is that if two variables have a long-run
equilibrium relationship, then they are considered cointegrated. But, what is about the
short run? It has been widely accepted that shocks in the short-run disturb this
relationship causing disequilibrium. Error Correction Model (ECM) has been used to
describe the short run dynamics between these two variables. The core idea of the
Error Correction Model (ECM) is that “a proportion of the disequilibrium from one
period is corrected in the next period” (Granger, 1987, p. 254). So changes in one of
these variables are related to past changes in both variables and to past equilibrium

236
error. Now consider a system of two variables tx , ty and both of these variables are
)1(I , then tx∆ and ty∆ are )0(I , depending on that, a simple form of (ECM) can be
shown as follows:
txtxtxttt yaxayxx εδβα +∆+∆+−+=∆ −− 121111 )( (5)
tytytyttt yaxayxy εδβα +∆+∆+−+=∆ −− 121122 )( (6)
where txε and
tyε ~ ),0( 2σIN ,
)( tt yx δ− is the error correction term that measures past equilibrium error.
β represents the speed with which the model adjusted it self to its equilibrium level.
So, from economic point of view any deviation from long run equilibrium must be
corrected to keep the stability of the system as a whole.
B.3 Testing for Cointegration: Engle and Granger (1987)
Approach Engle and Granger (1987) suggest a set of seven test statistics for testing
cointegration, as follows:
1- Cointegration Regression Durbin Watson (CRDW) test. This test uses Durbin-
Watson critical value obtained from the cointegration regression. The null
hypothesis is that 0=DW which means that the residuals are not stationary
and the variables are not cointegrated.
2- Dickey-fuller (DF) test. This test depends on running a regression on the
residuals from a cointegration regression:
ttt eu εβ +=∆ −1 (7)
237
now this test is known as Engle-Granger (EG), since they have calculated the
critical significant values. So the rejection of the null hypothesis ( 0=β )
means that the residuals do not contain a unit root, which indicates that these
residuals are stationary and the variables are cointegrated.
3- Augmented Dickey-Fuller (ADF) test. This test is similar to (DF) test, that it
assumes the same null hypothesis as (DF), and follows the same asymptotic
distributions as (DF), the difference is that it contains a lagged value for the
dependent variable, which is in this case te∆ (Gujarati, 2003).
4- Restricted Vector Autoregression (RVAR) test. This test estimates whether the
error correction term is significant, conditional on the estimated residuals from
the cointegration regression. The test estimates the following regressions
equations:
ttt ey 111 εβ +=∆ − (8)
tttt yex 212 εδβ +∆+=∆ − (9)
The null hypothesis is that the coefficients of the error correction term
( 21 , ββ ) are jointly zero.
5- Augmented Restricted Vector Autoregression (ARVAR) test. It is similar to
(RVAR) except that it contains lagged values of the dependent variable.
6- Unrestricted Vector Autoregression (UVAR) test. This test estimates the
following regressions equations:
tttt xycy 112111 εββ +++=∆ −− (10)
ttttt yxycx 214132 εγββ +∆+++=∆ −− (11)
7- Augmented Unrestricted Vector Autoregression (AUVAR) test
238
B.4 A maximum Likelihood Approach for Testing
Cointegration
Engle and Granger (1987) suggested several test statistics for testing cointegration,
but their procedure suffers from several important defects (see, Cheung, (1998),
Sheng & Anthony (2000) and Enders (2004)). First, Engle and Granger use a system
of two variables, and in reality there could be more than one cointegration vector,
Enders, 2004, p. 347) states that the Engle–Granger method “has no systematic
procedure for the separate estimation of the multiple cointegration vectors”. Second,
they use two steps to run the cointegration regression, starting by estimating the
regression using the Ordinary Least Square (OLS) approach, and then by applying test
statistics on the residuals from the regression, one problem associated with this
procedure is that in the case of the existence of any measurement error, this error will
be shifted from one step to another. Another deficiency is that estimated cointegrating
relationship between two variables has different test results sometimes, depending on
which one of the variables is dependent and which one is independent. According to
Enders (2004) in the case of reversing the order of the variables, it possible to end up
with different results (i.e. in the first case the variables are cointegrated, and in the
second case they are not cointegrated).
Johansen (1988), Stock and Watson (1988) and Johansen and Juselius (JJ)
(1990) develop what is knows as a maximum likelihood approach for testing and
evaluation of multiple cointegrated vectors. This approach is preferred to the Engle
and Granger (1987) for the reasons mentioned before, and also because of some other
reasons; like it has better asymptotic properties than the latter and therefore yields
more robust estimates (Phillips and Ouliaris, 1990), in addition it identifies the space

239
spanned by cointegration vectors, which the pervious approach could not. Also it
assumes all variables to be endogenous and it explicitly tests for number of
cointegrating relationships. So, a maximum likelihood approach is considered to be a
multivariate generalization of Dickey- Fuller test.
The starting point of their approach is the following )(kVAR model:
tktkttt eyAyAyAy +++++= −−− ...2211µ (12)
where ty is an 1×n vector of stochastic nonstationary variables or )1(I , and µ is an
intercept vector.
Now, consider L−=∆ 1 , where L the lag operator is, equation (12) is rewritten as
follows:
tktktktt eyyyy +Π+∆Γ++∆Γ+=∆ −+−−− 1111 ...µ (13)
where
),...( 1 iAAI −−−−=Γ 1,...,1 −= ki
)...( 1 kAAI −−−−=Π
=I identity vector
Π is an nn × long run response matrix. This matrix summarized all the long run
relationships in ty . The number of cointegration vectors is determined by the rank r
of the matrix Π , which is equal to number of its characteristic root. Three possible
cases have to be considered:
1- If the matrix Π has full rank nr = , all the variables in ty are stationary.
2- If the matrix Π has zero rank 0=r , i.e. null matrix, then there are on
stationary long run relationships among variables in ty .
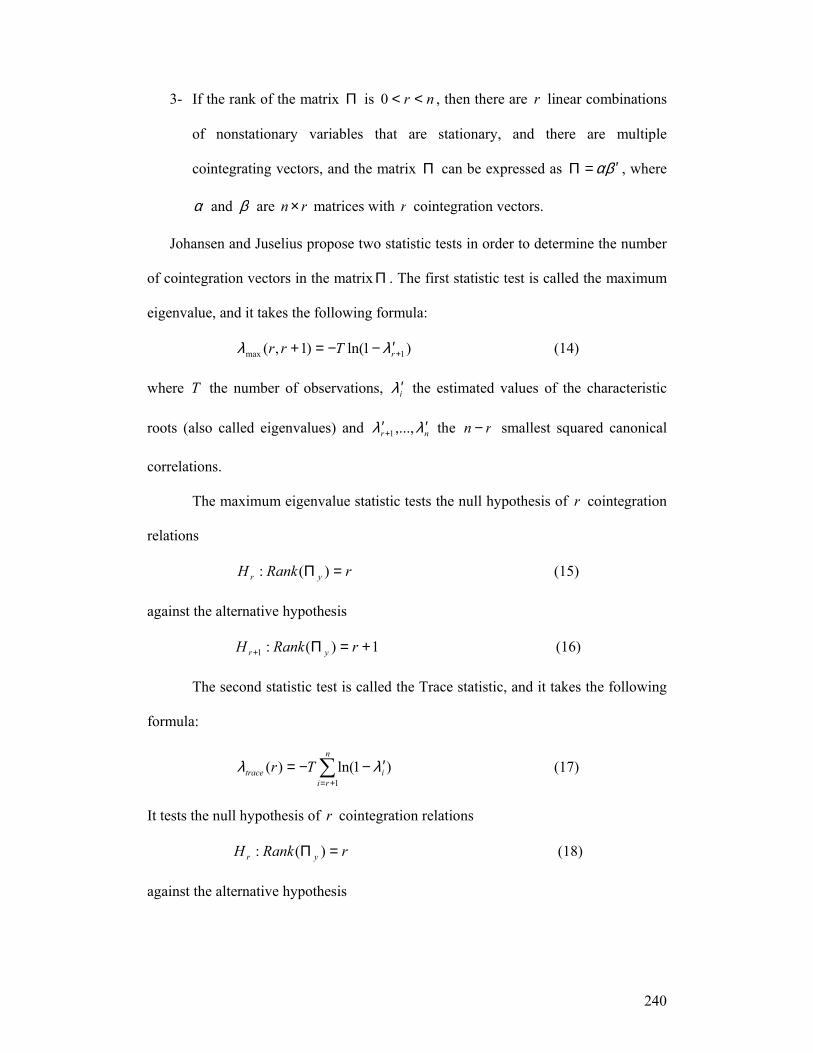
240
3- If the rank of the matrix Π is nr <<0 , then there are r linear combinations
of nonstationary variables that are stationary, and there are multiple
cointegrating vectors, and the matrix Π can be expressed as βα ′=Π , where
α and β are rn × matrices with r cointegration vectors.
Johansen and Juselius propose two statistic tests in order to determine the number
of cointegration vectors in the matrix Π . The first statistic test is called the maximum
eigenvalue, and it takes the following formula:
)1ln()1,( 1max +′−−=+ rTrr λλ (14)
where T the number of observations, iλ ′ the estimated values of the characteristic
roots (also called eigenvalues) and nr λλ ′′+ ,...,1 the rn − smallest squared canonical
correlations.
The maximum eigenvalue statistic tests the null hypothesis of r cointegration
relations
rRankH yr =Π )(: (15)
against the alternative hypothesis
1)(:1 +=Π+ rRankH yr (16)
The second statistic test is called the Trace statistic, and it takes the following
formula:
∑+=
′−−=n
riitrace Tr
1)1ln()( λλ (17)
It tests the null hypothesis of r cointegration relations
rRankH yr =Π )(: (18)
against the alternative hypothesis
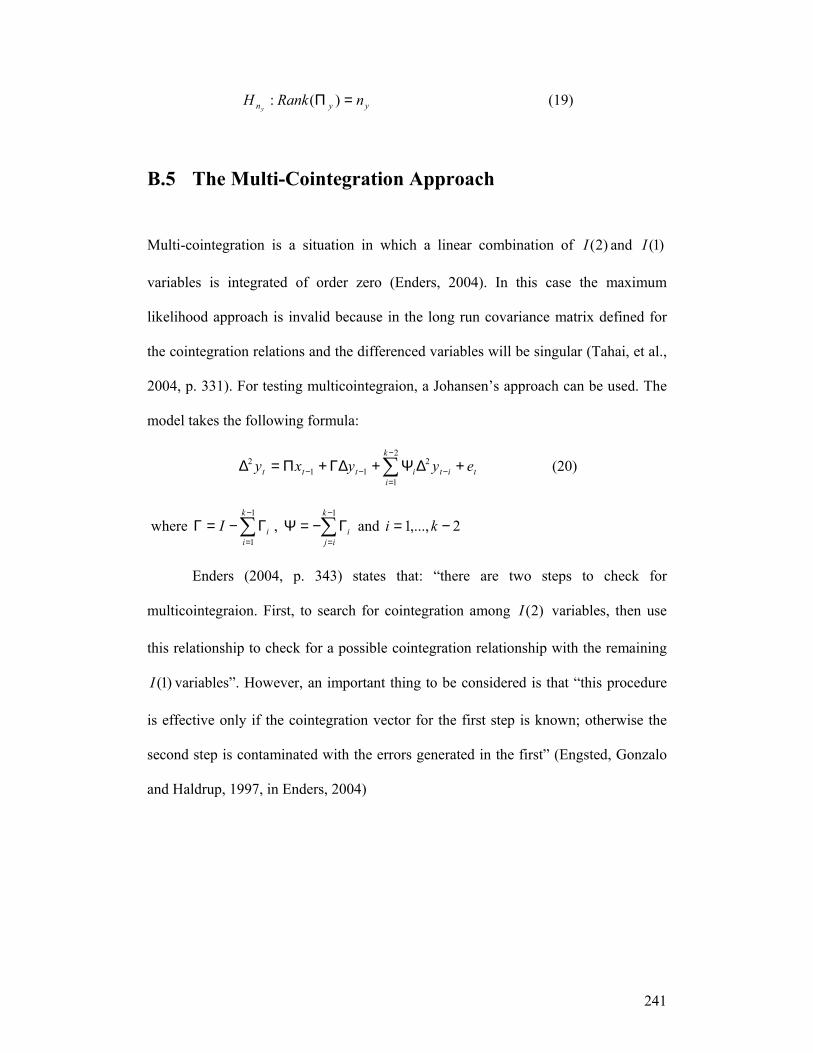
241
yyn nRankHy
=Π )(: (19)
B.5 The Multi-Cointegration Approach Multi-cointegration is a situation in which a linear combination of )2(I and )1(I
variables is integrated of order zero (Enders, 2004). In this case the maximum
likelihood approach is invalid because in the long run covariance matrix defined for
the cointegration relations and the differenced variables will be singular (Tahai, et al.,
2004, p. 331). For testing multicointegraion, a Johansen’s approach can be used. The
model takes the following formula:
∑−
=−−− +∆Ψ+Γ∆+Π=∆
2
1
211
2k
ititittt eyyxy (20)
where ∑−
=
Γ−=Γ1
1
k
iiI , ∑
−
=
Γ−=Ψ1k
iji and 2,...,1 −= ki
Enders (2004, p. 343) states that: “there are two steps to check for
multicointegraion. First, to search for cointegration among )2(I variables, then use
this relationship to check for a possible cointegration relationship with the remaining
)1(I variables”. However, an important thing to be considered is that “this procedure
is effective only if the cointegration vector for the first step is known; otherwise the
second step is contaminated with the errors generated in the first” (Engsted, Gonzalo
and Haldrup, 1997, in Enders, 2004)
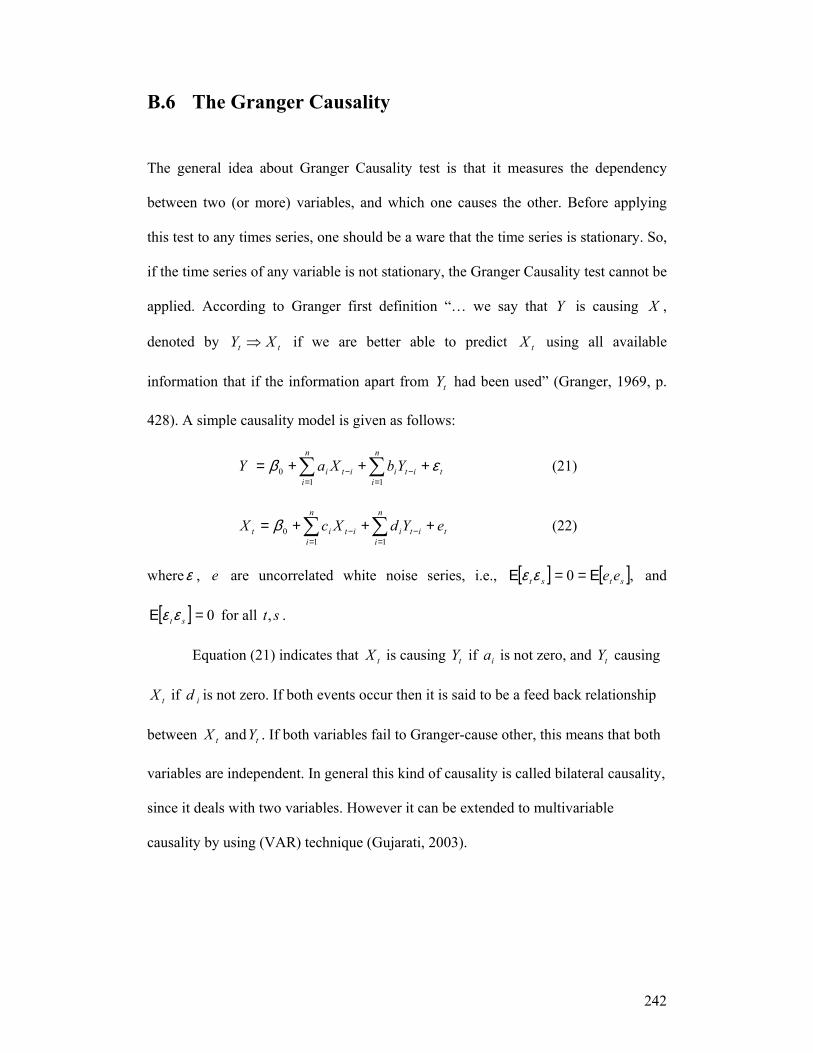
242
B.6 The Granger Causality The general idea about Granger Causality test is that it measures the dependency
between two (or more) variables, and which one causes the other. Before applying
this test to any times series, one should be a ware that the time series is stationary. So,
if the time series of any variable is not stationary, the Granger Causality test cannot be
applied. According to Granger first definition “… we say that Y is causing X ,
denoted by tt XY ⇒ if we are better able to predict tX using all available
information that if the information apart from tY had been used” (Granger, 1969, p.
428). A simple causality model is given as follows:
∑ ∑= =
−− +++=n
i
n
ititiiti YbXaY
1 10 εβ (21)
∑ ∑= =
−− +++=n
i
n
ititiitit eYdXcX
1 10β (22)
whereε , e are uncorrelated white noise series, i.e., [ ] [ ] ,0 stst eeΕ==Ε εε and
[ ] 0=Ε stεε for all st, .
Equation (21) indicates that tX is causing tY if ia is not zero, and tY causing
tX if id is not zero. If both events occur then it is said to be a feed back relationship
between tX and tY . If both variables fail to Granger-cause other, this means that both
variables are independent. In general this kind of causality is called bilateral causality,
since it deals with two variables. However it can be extended to multivariable
causality by using (VAR) technique (Gujarati, 2003).
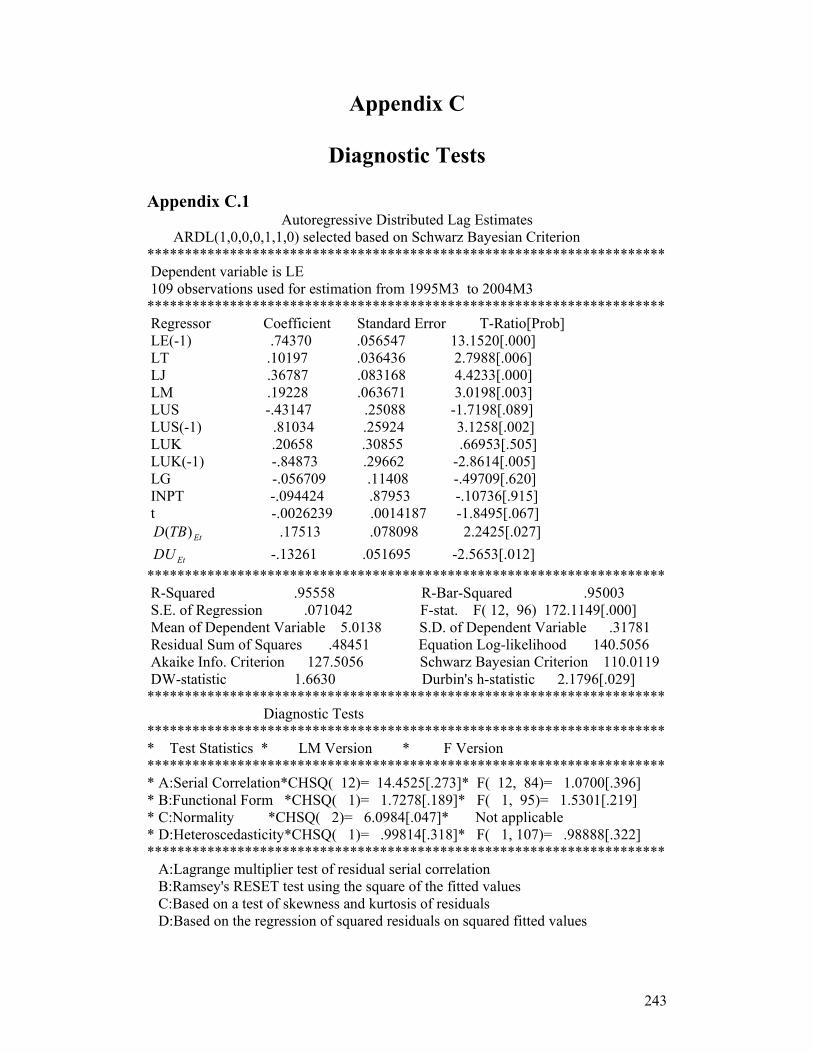
243
Appendix C
Diagnostic Tests
Appendix C.1 Autoregressive Distributed Lag Estimates
ARDL(1,0,0,0,1,1,0) selected based on Schwarz Bayesian Criterion ********************************************************************* Dependent variable is LE 109 observations used for estimation from 1995M3 to 2004M3 ********************************************************************* Regressor Coefficient Standard Error T-Ratio[Prob] LE(-1) .74370 .056547 13.1520[.000] LT .10197 .036436 2.7988[.006] LJ .36787 .083168 4.4233[.000] LM .19228 .063671 3.0198[.003] LUS -.43147 .25088 -1.7198[.089] LUS(-1) .81034 .25924 3.1258[.002] LUK .20658 .30855 .66953[.505] LUK(-1) -.84873 .29662 -2.8614[.005] LG -.056709 .11408 -.49709[.620] INPT -.094424 .87953 -.10736[.915] t -.0026239 .0014187 -1.8495[.067] EtTBD )( .17513 .078098 2.2425[.027] EtDU -.13261 .051695 -2.5653[.012] ********************************************************************* R-Squared .95558 R-Bar-Squared .95003 S.E. of Regression .071042 F-stat. F( 12, 96) 172.1149[.000] Mean of Dependent Variable 5.0138 S.D. of Dependent Variable .31781 Residual Sum of Squares .48451 Equation Log-likelihood 140.5056 Akaike Info. Criterion 127.5056 Schwarz Bayesian Criterion 110.0119 DW-statistic 1.6630 Durbin's h-statistic 2.1796[.029] ********************************************************************* Diagnostic Tests ********************************************************************* * Test Statistics * LM Version * F Version ********************************************************************* * A:Serial Correlation*CHSQ( 12)= 14.4525[.273]* F( 12, 84)= 1.0700[.396] * B:Functional Form *CHSQ( 1)= 1.7278[.189]* F( 1, 95)= 1.5301[.219] * C:Normality *CHSQ( 2)= 6.0984[.047]* Not applicable * D:Heteroscedasticity*CHSQ( 1)= .99814[.318]* F( 1, 107)= .98888[.322] ********************************************************************* A:Lagrange multiplier test of residual serial correlation B:Ramsey's RESET test using the square of the fitted values C:Based on a test of skewness and kurtosis of residuals D:Based on the regression of squared residuals on squared fitted values
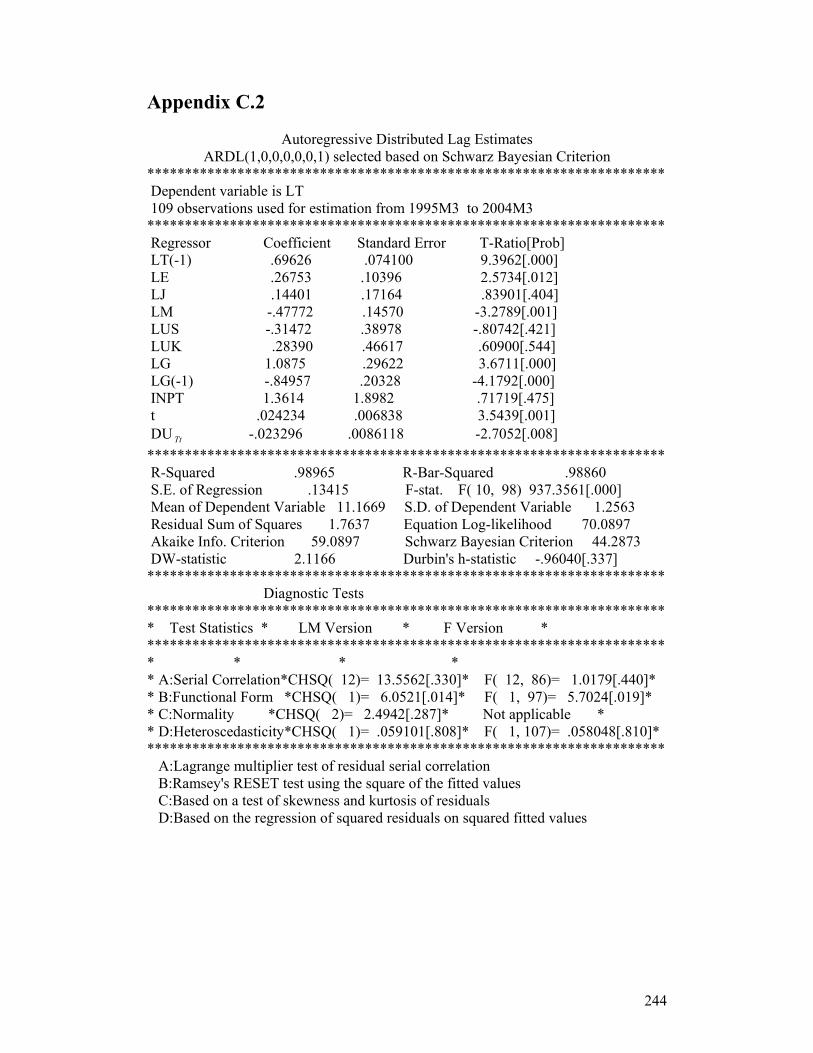
244
Appendix C.2
Autoregressive Distributed Lag Estimates ARDL(1,0,0,0,0,0,1) selected based on Schwarz Bayesian Criterion
********************************************************************* Dependent variable is LT 109 observations used for estimation from 1995M3 to 2004M3 ********************************************************************* Regressor Coefficient Standard Error T-Ratio[Prob] LT(-1) .69626 .074100 9.3962[.000] LE .26753 .10396 2.5734[.012] LJ .14401 .17164 .83901[.404] LM -.47772 .14570 -3.2789[.001] LUS -.31472 .38978 -.80742[.421] LUK .28390 .46617 .60900[.544] LG 1.0875 .29622 3.6711[.000] LG(-1) -.84957 .20328 -4.1792[.000] INPT 1.3614 1.8982 .71719[.475] t .024234 .006838 3.5439[.001] DU Tt -.023296 .0086118 -2.7052[.008] ********************************************************************* R-Squared .98965 R-Bar-Squared .98860 S.E. of Regression .13415 F-stat. F( 10, 98) 937.3561[.000] Mean of Dependent Variable 11.1669 S.D. of Dependent Variable 1.2563 Residual Sum of Squares 1.7637 Equation Log-likelihood 70.0897 Akaike Info. Criterion 59.0897 Schwarz Bayesian Criterion 44.2873 DW-statistic 2.1166 Durbin's h-statistic -.96040[.337] ********************************************************************* Diagnostic Tests ********************************************************************* * Test Statistics * LM Version * F Version * ********************************************************************* * * * * * A:Serial Correlation*CHSQ( 12)= 13.5562[.330]* F( 12, 86)= 1.0179[.440]* * B:Functional Form *CHSQ( 1)= 6.0521[.014]* F( 1, 97)= 5.7024[.019]* * C:Normality *CHSQ( 2)= 2.4942[.287]* Not applicable * * D:Heteroscedasticity*CHSQ( 1)= .059101[.808]* F( 1, 107)= .058048[.810]* ********************************************************************* A:Lagrange multiplier test of residual serial correlation B:Ramsey's RESET test using the square of the fitted values C:Based on a test of skewness and kurtosis of residuals D:Based on the regression of squared residuals on squared fitted values
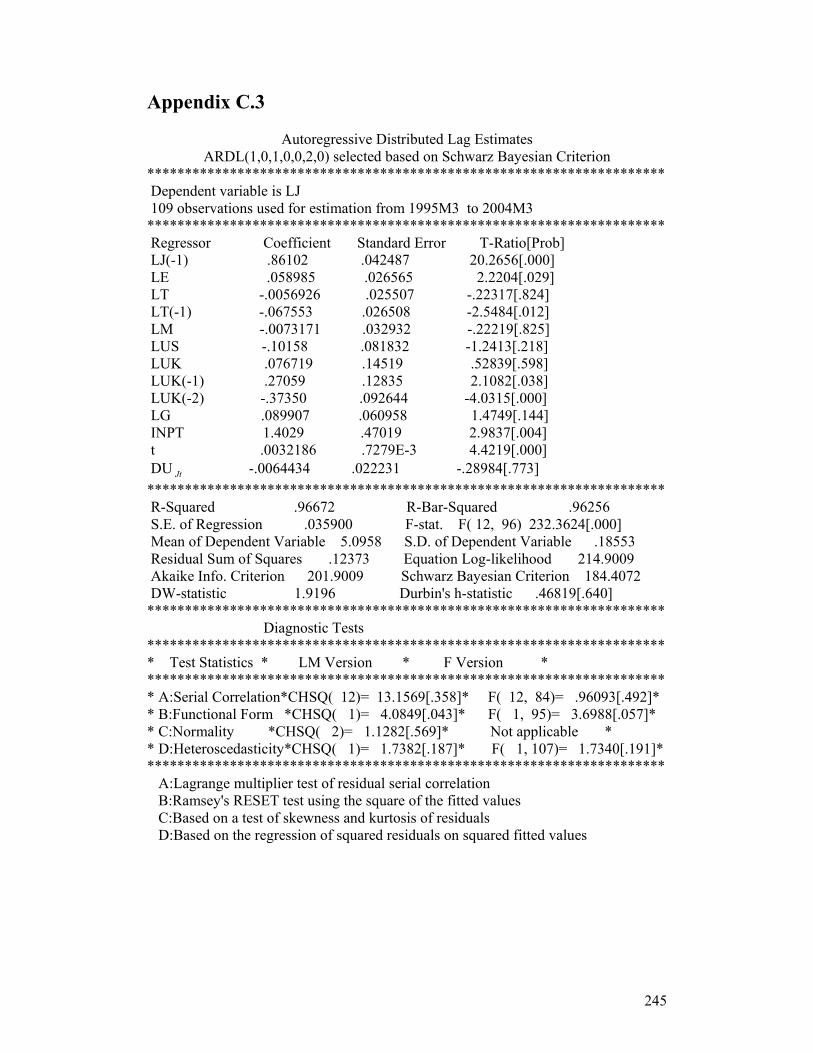
245
Appendix C.3
Autoregressive Distributed Lag Estimates ARDL(1,0,1,0,0,2,0) selected based on Schwarz Bayesian Criterion
********************************************************************* Dependent variable is LJ 109 observations used for estimation from 1995M3 to 2004M3 ********************************************************************* Regressor Coefficient Standard Error T-Ratio[Prob] LJ(-1) .86102 .042487 20.2656[.000] LE .058985 .026565 2.2204[.029] LT -.0056926 .025507 -.22317[.824] LT(-1) -.067553 .026508 -2.5484[.012] LM -.0073171 .032932 -.22219[.825] LUS -.10158 .081832 -1.2413[.218] LUK .076719 .14519 .52839[.598] LUK(-1) .27059 .12835 2.1082[.038] LUK(-2) -.37350 .092644 -4.0315[.000] LG .089907 .060958 1.4749[.144] INPT 1.4029 .47019 2.9837[.004] t .0032186 .7279E-3 4.4219[.000] DU Jt -.0064434 .022231 -.28984[.773] ********************************************************************* R-Squared .96672 R-Bar-Squared .96256 S.E. of Regression .035900 F-stat. F( 12, 96) 232.3624[.000] Mean of Dependent Variable 5.0958 S.D. of Dependent Variable .18553 Residual Sum of Squares .12373 Equation Log-likelihood 214.9009 Akaike Info. Criterion 201.9009 Schwarz Bayesian Criterion 184.4072 DW-statistic 1.9196 Durbin's h-statistic .46819[.640] ********************************************************************* Diagnostic Tests ********************************************************************* * Test Statistics * LM Version * F Version * ********************************************************************* * A:Serial Correlation*CHSQ( 12)= 13.1569[.358]* F( 12, 84)= .96093[.492]* * B:Functional Form *CHSQ( 1)= 4.0849[.043]* F( 1, 95)= 3.6988[.057]* * C:Normality *CHSQ( 2)= 1.1282[.569]* Not applicable * * D:Heteroscedasticity*CHSQ( 1)= 1.7382[.187]* F( 1, 107)= 1.7340[.191]* ********************************************************************* A:Lagrange multiplier test of residual serial correlation B:Ramsey's RESET test using the square of the fitted values C:Based on a test of skewness and kurtosis of residuals D:Based on the regression of squared residuals on squared fitted values
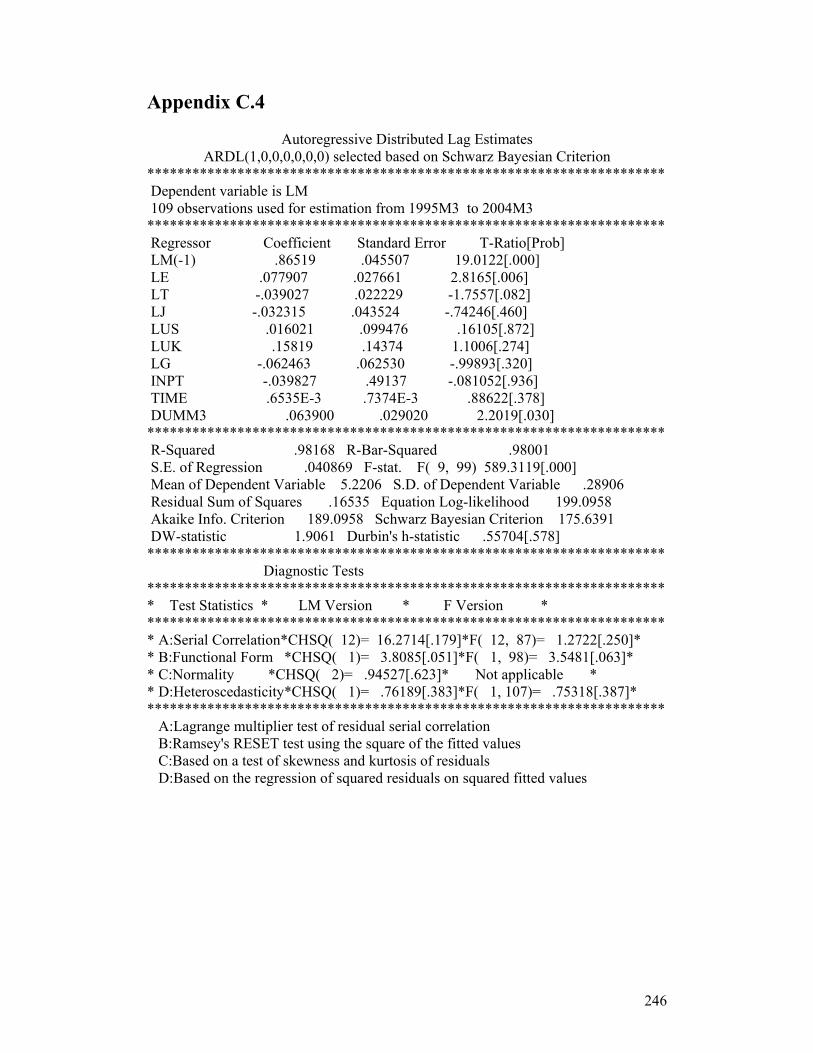
246
Appendix C.4
Autoregressive Distributed Lag Estimates ARDL(1,0,0,0,0,0,0) selected based on Schwarz Bayesian Criterion
********************************************************************* Dependent variable is LM 109 observations used for estimation from 1995M3 to 2004M3 ********************************************************************* Regressor Coefficient Standard Error T-Ratio[Prob] LM(-1) .86519 .045507 19.0122[.000] LE .077907 .027661 2.8165[.006] LT -.039027 .022229 -1.7557[.082] LJ -.032315 .043524 -.74246[.460] LUS .016021 .099476 .16105[.872] LUK .15819 .14374 1.1006[.274] LG -.062463 .062530 -.99893[.320] INPT -.039827 .49137 -.081052[.936] TIME .6535E-3 .7374E-3 .88622[.378] DUMM3 .063900 .029020 2.2019[.030] ********************************************************************* R-Squared .98168 R-Bar-Squared .98001 S.E. of Regression .040869 F-stat. F( 9, 99) 589.3119[.000] Mean of Dependent Variable 5.2206 S.D. of Dependent Variable .28906 Residual Sum of Squares .16535 Equation Log-likelihood 199.0958 Akaike Info. Criterion 189.0958 Schwarz Bayesian Criterion 175.6391 DW-statistic 1.9061 Durbin's h-statistic .55704[.578] ********************************************************************* Diagnostic Tests ********************************************************************* * Test Statistics * LM Version * F Version * ********************************************************************* * A:Serial Correlation*CHSQ( 12)= 16.2714[.179]*F( 12, 87)= 1.2722[.250]* * B:Functional Form *CHSQ( 1)= 3.8085[.051]*F( 1, 98)= 3.5481[.063]* * C:Normality *CHSQ( 2)= .94527[.623]* Not applicable * * D:Heteroscedasticity*CHSQ( 1)= .76189[.383]*F( 1, 107)= .75318[.387]* ********************************************************************* A:Lagrange multiplier test of residual serial correlation B:Ramsey's RESET test using the square of the fitted values C:Based on a test of skewness and kurtosis of residuals D:Based on the regression of squared residuals on squared fitted values
247
Bibliography Adler, Michael and Bernard Dumas, 1983, “International portfolio selection and
corporate finance: a synthesis”, Journal of finance, 46, pp. 925-984. Agarwal, R. N., 2000, “Financial integration and capital markets in developing
countries: A study of growth, volatility and efficiency in the Indian capital market”, Institute of Economic Growth, Delhi, [on-line], available at:
http://www.inomics.net/cgi/repec?handle=RePEc:ind:iegddp:21. Akdogan Haluk, 1995, The integration of international capital markets theory and
empirical evidence, Edward Elgar Publishing Limited, USA. Akdogan, Haluk, 1996, “A suggested approach to country selection in international
portfolio diversification”, Journal of Portfolio Management, 23, pp. 33-39. Akdogan, Haluk, 1997, “International security selection under segmentation: Theory
and application” Journal of Portfolio Management, 24, pp. 82-92. Allen, D., E., Macdonald, G., 1995, “The long-run gains from international equity
diversification: Australian evidence from cointegration tests”, Applied Financial Economics, 5, pp. 33-42.
Al-Refa’i, M., 1999, The impact of economic variables on the stock prices and
Trading volume in Amman Financial Market (1978-1997), a master thesis, Al- al-Bayt University, Jordan.
Amman Financial Market, 1976, Temporary Law No. 31 of the year 1976, Amman,
Jordan. Ammer, J. and Mei, J., 1996, “Measuring international economic linkages with stock
markets data”, Journal of Finance, 51, pp. 1743-1763. Arshanapalli, B. and J. Doukas, 1993, “International stock market linkages: Evidence
from the pre-and post- October 1987 period”, Journal of Banking and Finance, 17, pp. 193-208.
Ashlgren Nikals and Jan Antell, 2002, “Testing for cointegration between
international stock prices”, Applied Financial Economics, 12, pp. 851-861. Azab, I. Bassam, 2002, The Performance of the Egyptian Stock Market, a master
thesis, University of Birmingham, UK. Baffes, J., 1994, “Does comovement among exchange rates imply market
efficiency?”, Economic Letters, 44, pp. 273-280. Bahmani-Oskooee, Mohsen and Taggert J. Brooks, 1999, “Bilateral J-Curve between
U.S. and her trading partners”, Weltwirtschaftliches Archive, 135, pp.157-165.
248
Baillie, R. T. and Bollerslev, T., 1989, “Common stochastic trends in a system of exchange rates", Journal of Finance, 44, pp. 167-181.
Banerjee, A., R. L. Lumsdaine and J. H. Stock, 1992, “Recursive and sequential tests
of the unit-root and trend-break hypothesis: Theory and international evidence”, Journal of Business and Economic Statistics, 10, pp. 271-287.
Bannerjee, A. Dolado and R. Mestre, 1998, “Error-correction mechanism tests for
cointegration in single equation framework”, Journal of Time Series Analysis, 19, pp. 267-283.
Barari, Mahua, 2003, “Measuring Equity market integration using time-varying
integration score: The case of Latin America” Prepared for presentation at an international symposium on “International equity market integration” hosted by Institute for International Studies, Trinity College, Dublin, Ireland.
Beck, Thorston, Ross Leviene, and Norman Loayza, 2000, “Finance and the source of
growth”, Journal of Financial Economic, 58, pp. 261-300. Beenstock, M. and Chan, K. F., 1988, “Economic forces and the London stock
market”, Oxford Bulletin of Economics and Statistics, 50, pp. 27-39. Bekaert, Geert, and Robert Hordick, 1992, “Characterizing predictable components in
excess returns on equity and foreign exchange markets”, Journal of Finance, 47, pp. 467-509.
Bekaert, Geert and Harvey Campbell, 1995, “Time-varying world market
integration”, Journal of Finance, 50, pp. 403-444. Bekaert, Greet, and Harvey Campbell, 2003, “Emerging markets finance”, Journal of
Empirical Finance, 10, pp 3-55. Bekaert, Greet, Harvey Campbell R. and Lundblad Christian, 2001, “Emerging equity
markets and economic development”, Journal of Development Economics, 66, pp. 465-504.
Bekaert, Greet, Campbell R. Harvey and Lundblad Christian, 2003, “Equity market
liberalization in emerging markets”, Journal of Financial Research, 26, pp. 275-299.
Bekaert, Greet, Campbell R. Harvey and Lundblad Christian, 2002, “Does financial
liberalization spur growth?”, NBER Working Paper, No. 8245. Ben-David, D. and David H. Papell, 1997, “Slowdowns and meltdowns: postwar
growth evidence from 74 countries”, NBER Working Paper, 6266. Black, Fischer, 1972, “Capital market equilibrium with restricted borrowing”, Journal
of Business, 45, pp. 444-455.
249
Black Fischer, 1974, “International capital market equilibrium with investment barriers”, Journal of Financial Economics, 1, pp. 337-352.
Bhooca-com, A. and Stansell, S.R., 1990, “A study of international financial market
integration: An Examination of US, Hong Kong, and Singapore markets”, Journal of Business Finance and Accounting, 17, pp. 193-212.
Brooks, Chris, 2002, “Introductory econometrics for finance”, Cambridge University
Press, UK.
Buckberg Elaine, 1995, “Emerging stock markets and international asset pricing”, The
World Bank Economic Review, 9, pp. 51-74. Butler, Kirt C. and S. J. Malaikah, 1992, “Efficiency and inefficiency in thinly traded
stock markets: Kuwait and Saudi Arabia”, Journal of Banking and Finance, 16, pp. 197-210.
Campbell, John, Y. and Cochrane, John, H., 2000, “Explaining the poor performance
of consumption-based asset pricing models”, Journal of Finance, 55, pp. 2863-2878.
Campbell, J. Y. and Ammer, J., 1993, “what moves the stock and bond market? A
variance decomposition for long-term asset returns”, Journal of Finance, 48, pp. 3-37.
Campbell, J. Y., and Yasushi Hamao, 1992, “Predictable bond and stock returns in the
United States and Japan: A study of long-term capital market integration”, Journal of Finance, 47, pp. 43-70.
Carrieri Francesca, Errunza Vihang and Hogan Ked, 2002, “Characterizing world
market integration through time”, Mc Gill University, Working Paper, No 467. Central Bank of Jordan, 2003, Annual report 2003, Amman, Jordan. Central Bank of Republic of Turkey, 1999, Annual Report 1999. Ankara, Turkey. Central Bank of Republic of Turkey, 2002, Annual Report 2000. Ankara, Turkey Central Bank of Republic of Turkey, 2003, Annual Report 2003. Ankara, Turkey Chan, K. C. and P. K. Lai, 1993, “Unit root and cointegration tests of world stock
prices”, in International Financial Market Integration, edited by R. S. Stansell. Cambridge, MA: Blackwell.
Chan, Kam, G., Gup, Benton, E., Pan, Ming-Shiun, 1997, “International stock market
efficiency and integration: a study of eighteen nations”, Journal of Business Finance and Accounting, 24, pp. 803-813.
Chen, Nai-Fu, Roll, Richard, Ross, Stephen A., 1986, “Economic forces and the stock
market”, Journal of Business, 59, pp. 383-403.
250
Cheung, K. C. and Coutts, J. A., 2001, “A note on weak form market efficiency in
security prices: Evidence from the Hong Kong stock exchange”, Applied Economics Letters, 8, pp. 407-410.
Cheung, Lillian, 1998, “An integration and dynamic analysis of business bankruptcy
in Australia”, a PhD thesis, University of Wollongong, Australia.
Cho, D. Chinhyung Eun, Cheol S., and Senbet Lemma W., 1986, “International
arbitrage pricing theory: an empirical investigation”, Journal of Finance, 41, 313-329.
Choudhry, Taufiq, 1997, “Stochastic trends in stock prices: evidence from Latin
American markets”, Journal of Macroeconomics, 19, pp. 285-304. Christiano, L. J., 1992, “Searching for a break in GNP”, Journal of Business &
Economic Statistics, 10, pp. 273-250. Claessens, Stijn, Daniela Klingebiel, and Sergio L. Schmukler. 2004. Stock market
development and internationalization: Do economic fundamentals spur both similarly?, University of Amsterdam, CEPR Discussion paper, 3301.
Coleman, M., 1990, “Cointegration-based test of daily foreign exchange market
efficiency”, Economics Letters, 32, pp. 53-59. Congressional Research Service, 2003, Egypt-United States Relations, [on-line],
available at:
http://www.fas.org/man/crs/IB93087.pdf.
Gerrard, W. J. and L. G. Godfrey, 1998, “Diagnostic tests for single-equation error correction and autoregressive distributed lag models”, Manchester School, 66, pp. 222-237.
Corhay A., Tourani A. Rad, J. Urbain, 1993, “Common stochastic trends in European
stock markets”, Economic Letters, 42, pp. 385-390. Creane Susan, Rishi Goyal, A. Mushfiq Mobarak, and Randa Sab, 2004, “Financial
development and growth in the Middle East and North Africa”, IMF Working Paper, WP/04/201, Washington, DC.
Darabar, Salim and Partha Deb, 1997, “Co-movement in international equity
markets”, Journal of Financial Research, 20, pp. 305-322. Darrat, Ali F. and Omar M. Benkato, 2003, “Interdependence and volatility spillovers
under market liberalization: the case of Istanbul Stock Exchange”, Journal of Business Finance and Accounting, 30, pp. 1089-1114.
251
Darrat, Ali F., Elkhal Khaled and Hakim Sam R., 2000, “On the integration of emerging stock markets in the Middle East”, Journal of Economic Development, 25, pp. 119-129.
Demirguc-Kunt, A., and R. Levine, eds., 2001, Financial structure and economic
development, Cambridge, Mass.: MIT Press., US. Dezelan, S., 2000, “Efficiency of the Slovenian equity market”, Economic and
Business Review”, 2, pp. 61-83. Dickey, David A. and Wayne A. Fuller, 1979, “Distribution of the estimators for
Auto-regressive time series with a unit root” Journal of American Statistical Association, 74, PP. 427-431.
Dickinson, David G., 2000, “Stock market integration and macroeconomic
fundamentals: an empirical analysis, 1980-95”, Applied Financial Economics, 10, pp. 261-276.
Dumas, Bernard, and Bruno Solink, 1995, “The world price of foreign exchange rate
risk”, Journal of Finance, 50, pp. 445-479. Dwyer, G. P. Jr., and M. S. Wallace, 1992, “Cointegration and market efficiency”,
Journal of International Money and Finance, 11, pp. 318-327. Edison, H. and F. Warnock, 2003, “A simple measure of intensity of capital controls”,
Journal of Empirical Finance, 10, pp. 81-103. Enders, Walter, 2004, “Applied Econometrics times series”, second edition, John
Wiley &Sons. US. Engsted, Tom, Jesus Gonzalo and Neils Haldrup, 1997, “Testing for
multicointegraion”, Economic letters, 56, 259-266. Engle, Charles, 1996, “A note on cointegration and international capital market
efficiency”, Journal of International Money and Finance, 15, pp. 657-660. Engle, F. and C. W. J. Granger, 1987, “Co-integration and error correction
representation, estimation, and testing, Econometrica, 55, pp. 251-276.
Engle, Robert F., Granger C. W. J., 1987, “Co-integration and error correction:
representation, estimation and testing”, Econometrica, 55, pp. 251-276. El-Erian Mohamed A. and Manmohan S. Kumar, 1994, “Emerging equity markets in
Middle Eastern countries”, IMF Working Paper, WP/94/103, International Monetary Fund.
El-Erian Mohamed A. and Stanley Fischer, 1996, “Is MENA a Region? The scope for
regional integration”, IMF Working Paper, WP/96/30, International Monetary Fund.
252
Errunza, Vihang R. and Etienne Losq, 1985, “International asset pricing under mild
segmentation: Theory and test”, Journal of Finance, 40, pp. 105-124 Errunza, V., E. Losq and P. Padmanabhan 1992, “Test of integration, mild
segmentation and segmentation hypotheses”, Journal of Banking and Finance, 16, pp. 949-972.
Fama, Eugene, 1970, “Efficient capital markets: A review of theory and empirical
work”, Journal of Finance, 52, pp. 383-417. Fama, Eugene, 1998, “Market efficiency, long-term returns, and behavioral finance”,
Journal of Financial Economics, 49, pp. 283-306. Fama, Eugene and Kenneth French, 1988, “Permanent and temporary components of
stock prices”, Journal of Political Economy, 96, pp. 246-73. Ferson, Wayne E., and Campbell R. Harvey, 1994, “Source of risk and expected
returns in global equity markets”, Journal of Financial Economic, 25, pp. 775-803.
Ferson, Wayne E., and Campbell R. Harvey, 1997, “The fundamental determinants of
national equity market returns: A perspective of country risk in asset pricing”, Journal of banking and Finance, 18, pp. 775-803.
Fratzscher, Marcel, 2002, “Financial market integration in Europe: on the effect of
EMU on stock markets”, International Journal of Finance and Economic, 7, pp. 165-193.
Frino Alex, Tony Cusack and Kent Wilson, 2001, Introduction to corporate finance,
Pearson Education Australia, Australia. Fuller, Wayne A., 1976, Introduction to statistical time series, New York, Willy &
Sons, US.
Garrett, Ian, Spyrou, Spyros, 1997, “Common stochastic trends in emerging equity markets”, Middlesex University, Discussion Working Paper, No.38, UK.
Ghysels, Eric and Mouna Cherkaoui, 2003, “Emerging markets and trading costs:
lessons from Casablanca”, Journal of Empirical Finance, 10, pp. 169-198. Granger, C. W. J., 1969, “Investigating causal relations by econometric models and
cross- spectral methods” Econometrica, 37, 424-438. Granger, C. W. J., 1981, “Some properties of time series data and their use in
econometric model specification” Journal of Econometrics, 16, 1981, pp. 121-130.
Granger, C. W. J., 1986, “Developments in the study of cointegrated economic
variables”, Oxford Bulletin of Economics and Statistics, 48, pp. 213-228.

253
Granger, C. W. J., 1988, “Some recent development in the concept of causality”, Journal of Econometrics, 16, pp. 199-211.
Granger, C. W. J. and A.A. Weiss, 1983, “Time series Analysis of error correction
models”, in studies in econometrics: Time series and multivariate statistics, edited by S. Karlin, T. Amemiya, and L. A. Goodman, Academic Press, New York, pp. 255-278.
Granger, Clive W. J., Bwo-Nung Huang and Chin-Wei Yang, 2000, “A bivariate
causality between stock prices and exchange rate: evidence from recent Asian flu”, The Quarterly Review of Economics and Finance, 40, pp. 337-354.
Gregory, A. W. and B. E. Hansen, 1996a, “Residual-based tests for cointegration in
models with regime shifts, Journal of Econometrics, 70, pp. 1-26. Gregory, A. W. and B. E. Hansen, 1996b, “Tests for cointegration in models with
regime and trend shifts, Oxford Bulletin of Economics and Statistics, 58, pp. 555-560.
Groslambert, B. and Kassibrakis, S. 1999, “The alpha stable hypothesis: An
alternative to the distribution of emerging stock market returns”, Emerging Markets Quarterly, 1, pp. 85-95.
Gujarati, Damodar N., 1995, Basic econometrics, Third edition, The McGraw-Hill,
New York, US.
Gujarati, Damodar N., 2003, Basic econometrics, Fourth edition, The McGraw-Hill,
New York, US.
Gultekin, Mustafa N., Gultekin, Builent N., and Penati, Alessandro, 1989, “Capital
controls and international capital market segmentation: the evidence from the Japanese and American stock markets”, Journal of Finance, 44, pp. 849-869.
Hall, A. 1994, “Testing for a unit root in time series with pretest data based model
selection”, Journal of Business & Economic Statistics, 12, pp. 461-470. Harvey, Campbell, 1991, “The world price of covariance risk”, Journal of Finance,
46, pp. 111-157. Harvey, Campbell r., Bruno H. Solnik, and Guofu Zhou, 1994, “What determines
expected international asset returns?”, NBER working paper, No. 4660. Harvey David I, Stephen J. Leybourne and Paul Newbold, 2001, “Innovational outlier
unit root tests with as endogenously determined break in level”, Oxford Bulletin Economics and Statistics, 63, pp. 559-575.
Hawawini, Gabriel, 1994, “Equity price behavior: Some evidence from markets
around the world”, Journal of Banking and Finance, 18, pp. 603-620.
254
Hayter, George, 2001, “The development of Amman Stock Exchange”, Jordan Times News Paper, Tuesday, February 6.
Henry, Peter Blair, 2000a, “Do stock market liberalization cause investment booms?”,
Journal of Financial Economics, 58, pp. 301-334. Henry, Peter Blair, 2002b, “Stock market liberalization, economic reform, and
emerging market equity prices”, Journal of Finance, 55, pp. 529-564. Hong Kong and Shanghai Banking Corporation (HSBC), 2003, Egypt, ninth edition,
third quarter 2003, Hong Kong. http://www.ammanstockex.com. http://www.auswaertiges-amt.de. http://www.egyptianstocks.com. www.erf.org.eg/html/economic_00html/top_main.html. http://www.erf.org.eg/Indicators_02/Chap1.pdf. http://www.investorwords.com. http://www.investorwords.com/2969/market_capitalization.html. http://www.ise.org/about/majordev.htm http://www.msci.com. http://www.state.gov/r/pa/ei/bgn/5431.htm. http://www.stockriders.com/en/help/glossary.asp. http://www.traveldocs.com/ma/economy.htm. http://www.wikipedia.org http://www.worldbank.org/data. Hung, B. And Y. Cheung 1995, “Interdependence of Asian Emerging Equity
Markets”, Journal of Business Finance and Accounting, 22, pp. 281-288. Hwang, S. and Satchell, S. 1999, “Empirical identification of common factors in
emerging market returns”, Emerging Markets Quarterly, 3, pp. 7-26. International Monetary Fund, 2004, International Financial Statistics, Yearbook,
Washington DC, US.
255
Janakiramanan, Sundaram, Lamba, Asjeet, S., 1998, “An empirical examination of linkages between Pacific-Basin stock markets”, Journal of International Financial Markets Institutions and Money, 8, pp. 155-17.
Jbili, Abdelali, 2003, “Middle East and North Africa regional economic outlook,
economic performance, and challenges”, Newsletter of the Economic Research Forum, for the Arab Countries, Iran &Turkey, 10, pp. 10-11.
Johansen, Soren, 1988, “Statistical analysis of cointegration vectors”, Journal of
Economic Dynamic and Control, 12, pp. 231-254. Johansen, Soren, and Katarina Juselius, 1990 “Maximum likelihood estimation and
inference on cointegration-with application to the demand for money”, Oxford Bulletin of Economics and Statistics”, 52, pp. 169-210.
Jong Frank De and Roon Frans A. de, 2002, “Time-varying market integration and
expected returns in emerging markets”, [on-line], available at: http://www.tinbergen.nl/discussionpapers/01113.pdf. Jordan Securities Commission, 2000, second annual report, Amman, Jordan. Jorion, Philippe and Eduardo Schwartz, 1986, “Integration vs. segmentation in the
Canadian Stock Market” Journal of Finance, 41, pp. 603-616. Kanaan Taher H. and Marwan A. Kardoosh, 2002, the story of economic growth in
Jordan: 1950-2000”, [on-line], available at: http://www.gdnet.org/pdf2/gdn_library/global_research_projects/explaining_growth/J
ordan_final.pdf. Kasa, Kenneth, 1992, “Common stochastic trends in international stock markets”,
Journal of Monetary Economics, 29, pp. 95-124. Koop, G., M. H. Pesaran, and S. M. Potter, 1996, “Impulse response analysis in
nonlinear multivariate models”, Journal of Econometrics, 74, pp. 119-147. Korajczyk, Robert A. and Viallet Claude J., 1989, “An empirical investigation of
International Asset pricing”, The Review of Financial Studies, 2, pp. 553-585. Koutmos, G., 1996, “Modeling the dynamic interdependence of major European stock
markets”, Journal of Business Finance and Accounting, 23, pp. 975-988. Kremers, J. J. M., Neil R. Ericsson and Juan J. Dolado, 1992, “The power of
Cointegration tests”, Oxford Bulletin of Economics and Statistics, 54, pp. 325-343.
Laopodis, Nikiforos T., 2003, “Financial market liberalization and stock market
efficiency: The case of Greece”, Managerial Finance, 29, pp. 24-41. Lai, Kon S., 2004, “On structural shifts and stationarity of the ex ante real interest
rate”, International Review of Economics and Finance, 13, pp. 217-228.
256
Laurenceson, J. and Joseph C. H. Chai, 2003, Financial reform and economic
development in China, Edward Elgar pub, Northampton, MA, US. Lee, C.F., Chen, G.M. and Rui, O.M., 2001, “Stock returns and volatility on China’s
stock markets”, Journal of Financial Research, 24, pp. 523-543. Levine, R., 1997, “Stock markets, economic development, and capital control
liberalization”, Investment Company Institute Perspective, Occasional Papers, No. 3.
Levine, R., 2003, “More on finance and growth: More finance, more growth?”, pp.
31-46, [on-line], available at: http://research.stlouisfed.org/publications/review/03/07/Levine.pdf. Li, Zhen, 2003, “Equity market liberalization and economic performance”, Job
Market Paper, Princeton University. US. Lintner, John, 1965, “The valuation of risk assets and the selection of risky
investments in stocks portfolios and capital budgets”, Review of Economics and Statistics 47, pp. 13-37.
MacDonald, R. and M. P. Taylor, 1989, “Foreign exchange market efficiency and
cointegration: some evidence from the resent float”, Economics Letters, 29, pp. 63-68.
Maddala, G. S. and In-Moo Kim, 2003, Unit roots cointegration and structural
change, Cambridge University Press, Fifth edition, UK. Maghyereh, Aktham, 2003, “Equity markets integration in the Middle East region”,
Unpublished paper, Hashemite University, Jordan. Malkiel, Burton, G., 2003, “The Efficient Market Hypothesis and its critics”, Journal
of Economic Perspective, 17, pp. 59-82. Mankiw, N. Gregory, 1995, “The growth of nations”, Brooking Papers on Economic
Activity, 1, pp. 275-325. Marashdeh, Omar, 1994, “International financial market integration: An examination
of six stock markets”, Journal Pengurusan, 13, pp. 89-100. Marowitz, H., 1952, “Theory of portfolio selection”, Journal of Finance, 7, pp. 77-91. Masih, M. M. and Rumi Masih, 1997, “A comparative analysis of propagation of
stock market fluctuations in alternative models of dynamic causal linkages”, Applied Financial Economics, 7, pp. 59-74.
Masih, Rumi and A. Mansur M. Masih, 2001, “Long and short term dynamic causal
transmission amongst international stock markets”, Journal of International Money and Finance”, 20, pp. 563-587.
257
Masih, A. Mansur M. and Rumi Masih, 2002, “Propagative causal price transmission
among international stock markets: evidence from the pre- and post globalization period”, Global Finance Journal, 13, pp. 63-91.
Mills, Terence C., 1999, The Econometric modeling of financial time series,
Cambridge University Press, UK. Mishkin, Fredric S., Eakins Stanley G., 1998, Financial markets and institutions,
second edition, Addison-Wesley, US. Mittoo, Usha R., 1992, “Additional evidence on integration in the Canadian stock
market”, Journal of Finance, 47, pp. 2035-2055. Mosin, J., 1966, “Equilibrium in a capital asset market”, Econometrica, 34, pp. 768-
783. Naryan, P. and Russell Smith, 2004, “Is South Korea’s stock market efficient?”,
Applied Economic Letters, 11, pp. 707-710. Narayan, P., Russell Smith and Mohan Nandha, 2004, “Interdependence and dynamic
linkages between the emerging stock markets of South Asia”, Accounting and Finance, 44, pp. 419-439.
Narayan, P. and Seema Narayan, 2003, “Saving behavior in Fiji: An empirical
assessment using the ARDL approach to cointegration”, Monash University, Discussion papers, No. 02/03.
Neaime, Simon, 2002, “Liberalization and financial integration of MENA stock
markets”, a paper prepared at the ERF’s 9th annual conference on “Finance and Banking”, United Arab Emirates.
Nell, Kevin S., 1999, “The endogenous/exogenous nature of South Africa’s Money
supply under direct and indirect monetary control measures”, University of Kent, Department of Economics Working Paper, No. 9912.
Nelson, C. R., and Plosser, C. I. 1982, “Trends and random walks in macroeconomic
time series”, Journal of Monetary Economics, 10, pp. 139-162. Ng, S. and P. Perron, 1995, “Unit root in ARMA models with data dependent
methods for the selection of the truncation lag”, Journal of the American Statistical Association, 90, pp. 268-281.
Obben, James and Agus Eko Nugroho, 2003, “Determinants of the funding volatility
of Indonesian banks: A dynamic model”, [on-line], available at: http://econ.massey.ac.nz/publications/discuss/dp03.07.pdf. Oxelhein, Lars, 2001, “Routes to equity market integration- the interplay between
politician, investors and managers”, Journal of Multinational Financial Management, 11, pp. 183-211.
258
Palac-McMiken Evanor D., 1997, “An examination of ASEAN stock markets A
cointegration analysis”, ASEAN Economic Bulletin, 13, pp. 299-310. Park, JY., 1990, Testing for unit root by variable addition, In: advances in
econometrics: cointegration spurious regressions and unit roots, Fomby TB, Rhodes RF (eds). JAI Press: Greenwich, CT.
Pascual Antonio Garcia, 2003, “Assessing European stock markets cointegration”,
Economics Letters, 78, pp. 197-203. Perron, P., 1989, “The great crash, the oil price shock, and the unit root hypothesis”,
Econometrica, 57, pp. 1361-1401. Perron, P., 1994, Trend, unit root and structural change in macroeconomic time series,
In: Cointegration for the applied economist. B.B. Rao (ed.), MacMillan Press, Basingstoke, pp. 113-146.
Perron, p. 1997, “Further evidence on breaking trend functions in macroeconomic
variables”, Journal of Economics, 80, pp. 355-385. Perron, P. and T. J. Vogelsang, 1992, “Nonstationarity and level shifts with an
application to purchasing power parity”, Journal of Business and Economic Statistics, 10, pp. 301-320.
Pesaran, H. M. 1997, “The role of economic theory in modeling the long-run”,
Economic Journal, 107, pp. 178-191. Pesaran, H. M. and B. Pesaran 1997, Microfit 4.0, Oxford University Press, Oxford. Pesaran, H. M. and Y. Shin 1995, “Autoregressive distributed lag modeling approach
to cointegration analysis”, Department of Economics, University of Cambridge, DAE Working Paper Series, No. 9514.
Pesaran, H. M. and Y. Shin, 1998, “An Autoregressive distributed lag modeling
approach to cointegration analysis”, in: S. Storm, ed., Econometrics and Economic Theory in the 20th Century: The Ragnar Frisch Centennial Symposium, Cambridge University Press.
Pesaran, M. H., Y. Shin and R. Smith, 1996, “Testing for the existence of a long-run
relationship”, DAE Working Papers, No. 9622, Department of Applied Economics, University of Cambridge.UK.
Pesaran, M. H., Y. Shin and R. Smith, 2001, “Bounds testing approaches to the
analysis of level relationships”, Journal of Applied Econometrics, 16, pp. 289-326.
Phillips, P. C. B. and P. Perron, 1988, “Testing for a unit root in time series
regression”, Biometrika, 75, 335-346.
259
Phylaktis, K., 1999, “Capital market integration in the Pacific-Basin region: An impulse response analysis”, Journal of International Money and Finance, 18, pp. 267-287.
Piesse Jenifer and Bruce Hearn, 2002, “Equity market integration versus segmentation
in three dominant markets of the Southern Africa Customs Union: cointegration and causality tests”, Applied Economics, 14, pp. 1711-1722.
Priestley, R. 1996, “The Arbitrage Pricing Theory, Macroeconomic and Financial
Factors and the Expectation of Generating Process”, Journal of Banking and Finance, 20, pp. 869-890.
Ragunathan, Vanitha, 1997, “The effect of financial deregulation on integration: An
Australian perspective”, AAANZ conference, Hobart, Australia. Rangvid, Jesper, 2001, “Increasing convergence among European stock markets? A
recursive common stochastic trends analysis”, Economics Letters, 71, pp. 383-389.
Richards, A. J., 1995, “Comovements in national stock market returns: evidence of
predictability but not cointegration”, Journal of Monetary Economics, 36, pp. 631-654.
Ross, Stephen, 1976, “The arbitrage theory of capital asset pricing”, Journal of
Economic Theory, 13, 341-360. Rousseau, P. L. and Wachtel, P., 2000, “Equity markets and growth: cross-country
evidence on timing and outcomes 1980-1995”, Journal of Banking and Finance, 24, pp. 1933-1958.
Said, S. E. and D. A. Dickey, 1984, “Testing for unit root in autoregressive-moving
average models of unknown order”, Biometrika, 71, pp. 599-608. Saini, Azman, Azali, M. Habibullah M. S., Matthews, K. G., 2002, “Financial
integration and the ASEAN-5 equity markets”, Applied Economics, 34, pp. 2283-2289.
Saket, Bassam, 2000, “The Restructuring of Jordan’s capital market has improved the
investment inflows”, The Arab Bank Review, 2, pp. 49-51. Samuelson, Paul and William D. Nordhaus, 1989, Macroeconomics, edition Thirteen,
McGraw-Hill Book Company, US. Scharz, G., 1978, “Estimating the Dimensions of a model”, The Annals of Statistics, 6,
pp. 461-464. Sewell, S., S. Stansell, and I. Lee, 1996, “Using Chaos Measures to examine
international capital market integration”, Applied Financial Economics, 6, pp. 91-101.
260
Sharpe, William, 1964, Capital asset prices: “A theory of market equilibrium under conditions of risk”, Journal of Finance 19, pp. 763-781.
Sheng, Asiao-Ching and Anthony H. Tu, 2000, “A study of cointegration and
variance decomposition among national equity indices before and during the period of the Asian financial crisis”, Journal of Multinational Financial Management, 10, pp. 345-365.
Shiller, Robert J., 2003, “From efficient market theory to behavioral finance”, Journal
of Economic Perspective, 17, pp. 83-104. Shin, Y., 1994, “A residual-based test of the null of cointegration against the
alternative of no cointegration”, Econometric Theory, 10, pp. 91-115. Smith, G., Jefferis K. and Ryoo H.J., 2002, “African stock markets: multiple variance
ratio tests of random walks”, Applied Financial Economics, 12, pp. 475-484. Solink, Bruno, 1974, “An equilibrium model of the international capital market”,
Journal of Economic Theory, 8, pp. 500-524. Solink, Bruno, 1983, “International arbitrage pricing theory”, Journal of Finance, 38,
pp. 449-457. Standard & Poor’s, 2002, “Emerging Stock Markets Factbook”, New York. US. Standard & Poor’s, 2005, “Global Stock Markets Factbook”, New York. US. Stehle B., 1977, “An Empirical test of the alternative hypotheses of national and
international pricing of risky assets”, Journal of Finance, 32, pp. 493-502. Stock, James and Mark Watson, 1988, “Testing for common trends”, Journal of the
American Statistical Association, 83, 1097-1110. Studenmund, A. H., 2001, Using econometrics a practical guide, Fourth edition,
Addison Wesley Longman, Inc., US. Stulz, Rene M, 1981a, “A model of international assets pricing”, Journal of Financial
Economics, 9, pp. 383-406. Stulz, Rene M., 1981b, “On the effects of barriers to international investment”,
Journal of Finance, 36, pp. 923-934. Tahai A., Robert W. Rutledge and Karim E. Khondkar, 2004, “An examination of
financial integration for the group of seven (G7) industrialized countries using I (2) cointegration model”, Applied Financial Econometrics, 14, pp. 327-335.
Taskin, Fatma and Muradoglu, Gulnur, 2003, “Financial liberalization: from
segmented to integrated economics”, Journal of Economics and Business, 55, pp. 529-555.
261
Teng-Tsai Tu, 1998, “An entropic approach to equity market integration and consumption- based capital assets pricing model”, PhD dissertation, Iowa State University, US.
Tobin, James, 1958, “Liquidity preference as behavior towards risk”, The Review of
Economic Studies, 25, 65-86 Von Furstenberg, G. M. and B. N. Jeon, 1989, “International stock price movements:
links and messages”, Brookings Papers on Economic Activity, 1, pp. 125-179. Wang, Z., Yang, J., and Bessler, A., 2003, “Financial crisis and African stock market
integration”, Applied Economics Letters, 10, pp. 527-533. Wheatley, Simon, 1988, “Some tests of international equity integration”, Journal of
Financial Economics, 21, pp. 177-212. Wilson, Edger, 2004, “Notes on the consequences of unit root processes and tests for
stationarity”, presented in the econometric workshop held on the 1st of November 2004, Economic discipline, University of Wollongong. Australia.
Wilson, Patrick J., Ralf Zurbruegg and Richard Gerlach, 2002, “Structural breaks and
diversification: The impact of the 1997 Asian Financial Crisis on the integration of Asia-Pacific real state markets”, Working paper, School of Finance and Economics, University of Technology, Sydney, No. 121.
Wilson, Patrick J., Richard Gerlach and Ralf Zurbruegg, 2003, “Potential
diversification benefits in the presence of unknown structural breaks: An Australian case”, Australian Economic Papers, 42, pp. 442-453.
World Bank, 2003, Global development finance: Striving for stability in developing
finance, Washington, DC., US. World Bank, 2004, Global development finance: harnessing cyclical gains for
development, Washington DC., US. Worthington, Andrew C. and Helen Higgs, 2003, “Weak-form efficiency in European
emerging and developed stock markets”, School of Economics and Finance, Queensland University of Technology, Discussion Paper, No. 159.
Yang Jian, Kolar James W. and Min Insik, 2003, “Stock market integration and
financial crisis: the case of Asia”, Applied Financial Economics, 13, pp. 477-486.
Zivot E. and Donald W. K. Andrews, 1992, “Further Evidence on the great crash, the
oil-price shock, and the unit-root hypothesis”, Journal of Business & Economic Statistics, 10, pp. 251-270.


