Embed Size (px)
Citation preview


Financial MarketsOperations
Management

The Wiley Finance series contains books written specifically for finance and investment profes-sionals as well as sophisticated individual investors and their financial advisors. Book topicsrange from portfolio management to e-commerce, risk management, financial engineering,valuation and financial instrument analysis, as well as much more. For a list of available titles,visit our Web site at www.WileyFinance.com.
Founded in 1807, John Wiley & Sons is the oldest independent publishing company in theUnited States. With offices in North America, Europe, Australia and Asia, Wiley is globallycommitted to developing and marketing print and electronic products and services for ourcustomers’ professional and personal knowledge and understanding.
Financial MarketsOperations
Management
KEITH DICKINSON
This edition first published 2015© 2015 Keith Dickinson
Registered officeJohn Wiley & Sons Ltd, The Atrium, Southern Gate, Chichester, West Sussex, PO19 8SQ, UnitedKingdom
For details of our global editorial offices, for customer services and for information about how to applyfor permission to reuse the copyright material in this book please see our website at www.wiley.com.
The right of the author to be identified as the author of this work has been asserted in accordance withthe Copyright, Designs and Patents Act 1988
All rights reserved. No part of this publication may be reproduced, stored in a retrieval system, ortransmitted, in any form or by any means, electronic, mechanical, photocopying, recording orotherwise, except as permitted by the UK Copyright, Designs and Patents Act 1988, without the priorpermission of the publisher.
Wiley publishes in a variety of print and electronic formats and by print-on-demand. Some materialincluded with standard print versions of this book may not be included in e-books or inprint-on-demand. If this book refers to media such as a CD or DVD that is not included in the versionyou purchased, you may download this material at http://booksupport.wiley.com. For more informationabout Wiley products, visit www.wiley.com.
Designations used by companies to distinguish their products are often claimed as trademarks. Allbrand names and product names used in this book are trade names, service marks, trademarks orregistered trademarks of their respective owners. The publisher is not associated with any product orvendor mentioned in this book.
Limit of Liability/Disclaimer of Warranty: While the publisher and author have used their best effortsin preparing this book, they make no representations or warranties with the respect to the accuracy orcompleteness of the contents of this book and specifically disclaim any implied warranties ofmerchantability or fitness for a particular purpose. It is sold on the understanding that the publisher isnot engaged in rendering professional services and neither the publisher nor the author shall be liablefor damages arising herefrom. If professional advice or other expert assistance is required, the servicesof a competent professional should be sought.
Library of Congress Cataloging-in-Publication Data
Dickinson, Keith.Financial markets operations management / Keith Dickinson.
pages cmIncludes index.ISBN 978-1-118-84391-8 (cloth)
1. Investment advisors. 2. Financial services industry–Management. 3. Finance. I. Title.HG4621.D53 2015332.64068–dc23 2014039881
A catalogue record for this book is available from the British Library.
ISBN 978-1-118-84391-8 (hbk) ISBN 978-1-118-84390-1 (ebk)ISBN 978-1-118-84389-5 (ebk)
Cover Design: WileyCover Image Top: © iStock.com/Mani_CS2
Bottom: © agsandrew/Shutterstock
Set in 10/12pt, Times by Aptara Inc., New Delhi, IndiaPrinted in Great Britain by TJ International Ltd, Padstow, Cornwall, UK

To Nicole

Contents
Preface xix
Acknowledgements xxiii
PART ONE
CHAPTER 1Introduction to Operations 3
1.1 Introduction 31.2 Organisational Structure of an Investment Company 5
1.2.1 Front Office 51.2.2 Middle Office 61.2.3 Back Office/Operations 9
1.3 Operations’ Relationships 101.3.1 Clients – External 101.3.2 Clients – Internal 111.3.3 Counterparties 111.3.4 Suppliers 121.3.5 The Authorities 12
1.4 Other Business Functions 131.5 Summary 15
CHAPTER 2Financial Instruments 17
2.1 Introduction 172.2 Why Do We Issue Financial Instruments? 182.3 Money Market Instruments 19
2.3.1 Euro-Currency Deposits 192.3.2 Certificates of Deposit 232.3.3 Commercial Paper 232.3.4 Treasury Bills 25
2.4 Debt Instruments 262.4.1 A Bond Defined 262.4.2 Bond Issuance 27
vii
viii CONTENTS
2.4.3 Types and Features of Bonds 272.4.4 Other Key Characteristics of Bonds 282.4.5 Types of Bond 292.4.6 Form of Bonds and Interest Payment 302.4.7 Maturity and Redemption Provisions 312.4.8 Calculations 322.4.9 Accrued Interest 332.4.10 First Short Coupon 372.4.11 First Long Coupon 38
2.5 Equity Instruments 382.5.1 Equity Defined 382.5.2 Classes of Equity 412.5.3 Equity Issuance 432.5.4 Pricing and Calculations 442.5.5 Examples of Local Taxes 452.5.6 Disclosure 452.5.7 Summary of Cash Market Instruments 46
2.6 Derivative Instruments 472.6.1 Introduction 472.6.2 Definitions 482.6.3 Derivative Usage 49
2.7 Exchange-Traded Derivatives 522.7.1 Introduction 522.7.2 The Role of the Derivatives Exchanges 532.7.3 Major Derivatives Exchanges 532.7.4 Open Interest and Trading Volumes 562.7.5 Futures 582.7.6 Options 642.7.7 Summary of Exchange-Traded Derivatives 71
2.8 OTC Derivatives 712.8.1 Introduction 712.8.2 Forwards 722.8.3 Swaps 762.8.4 Summary of OTC Derivatives 80
2.9 Summary 812.9.1 Financial Products in General 812.9.2 Cash Markets 812.9.3 Derivatives Markets 81
CHAPTER 3Data Management 83
3.1 Introduction 833.2 Importance of Reference Data and Standardisation 84
3.2.1 Introduction 843.2.2 Basic Securities Transactions 84
3.3 Types of Reference Data 86
Contents ix
3.3.1 Required Reference Data 863.3.2 Data Requirements – Securities 873.3.3 Data Requirements – Counterparties and Customers 913.3.4 Data Requirements – Settlement Information 923.3.5 Sources of Reference Data 93
3.4 Data Management 943.4.1 What is Data Management? 943.4.2 Approaches to Data Management 943.4.3 Data Processing 95
3.5 Legal Entity Identification 953.5.1 Background to Legal Entity Identification 953.5.2 The “Legal Entity” 963.5.3 The Global Legal Entity Identifier System (GLEIS) 963.5.4 LEI Structure 97
3.6 Summary 99
CHAPTER 4Market Participation 101
4.1 Introduction 1014.2 Market Players 102
4.2.1 Retail Clients 1024.2.2 Institutional Clients 1034.2.3 Banks 1154.2.4 Sell-Side Intermediaries 1264.2.5 Market Regulators and Market Associations 129
4.3 Market Structure 1314.3.1 Introduction 1314.3.2 Regulated Markets 1314.3.3 Alternative Trading Venues 1354.3.4 Over-the-Counter Market 136
4.4 Summary 137
PART TWO
CHAPTER 5Clearing Houses and CCPs 141
5.1 Introduction 1415.2 Overview of Clearing and Settlement 1425.3 The Clearing House Model 1435.4 The Central Counterparty Model 145
5.4.1 Risk Management 1475.5 Features of CCPs and Clearing Houses 148
5.5.1 The Committee for Payment and Settlement Systems’ Statistics 1485.6 Summary 150
x CONTENTS
CHAPTER 6Securities Depositories (CSDs and ICSDs) 151
6.1 Introduction 1516.2 Historical Context 1516.3 Definitions 154
6.3.1 Domestic (Local/National) CSDs 1546.3.2 International CSDs 154
6.4 Central Securities Depositories 1546.4.1 Features of CSDs and ICSDs 1546.4.2 Functions of CSDs 1556.4.3 The Changing World of CSDs 1586.4.4 CSD Links and Interoperability 161
6.5 International Central Securities Depositories 1636.5.1 Background 1636.5.2 Features of the ICSDs 1646.5.3 Clearstream Banking Luxembourg (CBL) 1646.5.4 Euroclear Bank (EB) 165
6.6 Linkages – Exchanges, Clearing Systems and CSDs 1676.6.1 United States of America 1686.6.2 Europe 1696.6.3 Rest of the World 170
6.7 CSD Associations 1716.7.1 Introduction 1716.7.2 Americas’ Central Securities Depositories Association (ACSDA) 1716.7.3 Asia-Pacific CSD Group (ACG) 1716.7.4 Association of Eurasian Central Securities Depositories (AECSD) 1726.7.5 European Central Securities Depositories Association (ECSDA) 1726.7.6 Africa and Middle East Depositories Association (AMEDA) 172
6.8 Summary 173
CHAPTER 7Securities Clearing 175
7.1 Introduction 1757.2 Generic Clearing Cycle 176
7.2.1 Trade Capture 1767.2.2 Trade Enrichment and Validation 1777.2.3 Trade Reporting 1777.2.4 Confirmation and Affirmation 1787.2.5 Clearing Instructions 1787.2.6 Forecasting – Cash 1797.2.7 Forecasting – Securities 180
7.3 Trade Capture 1827.3.1 Dealer’s Blotter 1827.3.2 Trade Input 1827.3.3 Trade Output 183
7.4 Trade Enrichment and Validation 184
Contents xi
7.5 Regulatory Reporting 1867.5.1 Background 1867.5.2 Transaction Reporting 1867.5.3 Transaction-Reporting Mechanism 1877.5.4 Trade Repositories 188
7.6 Confirmation and Affirmation 1887.6.1 Confirmations 1897.6.2 Affirmation 190
7.7 Clearing Instructions 1947.7.1 Types of Instruction 1947.7.2 Instruction Validation 1967.7.3 Instruction Matching 196
7.8 Forecasting – Cash 1997.8.1 Introduction 1997.8.2 Timing Issues 1997.8.3 Cash Forecasting Methodology 2007.8.4 Funding Uncertainties 2017.8.5 Benefits of Predictive Forecasting 202
7.9 Forecasting – Securities 2037.9.1 Introduction 2037.9.2 Securities that are Available for Delivery 2047.9.3 Securities that are Not Available for Delivery 204
7.10 Summary 205
CHAPTER 8Settlement and Fails Management 207
8.1 Introduction 2078.2 The Different Types of Settlement 208
8.2.1 Gross Settlement 2098.2.2 Net Settlement 210
8.3 Delivery versus Payment 2118.3.1 Definition of DVP 2128.3.2 DVP Models 2138.3.3 Settlement Instructions for DVP 214
8.4 Free of Payment Settlement 2158.4.1 Settlement Instructions for Free of Payment 2158.4.2 Where Settlement Takes Place 2168.4.3 Settlement Conventions 216
8.5 Settlement Fails 2178.5.1 Overview of Settlement Failure 2178.5.2 Why Transactions Fail to Settle 218
8.6 The Move to Shorter Settlement Cycles 2288.6.1 Background 2288.6.2 Project Status 228
8.7 Summary 229
xii CONTENTS
CHAPTER 9Derivatives Clearing and Settlement 231
9.1 Introduction 2319.2 Regulatory Changes 232
9.2.1 Background 2329.2.2 Financial Stability Board (FSB) 2329.2.3 Reform Requirements 233
9.3 Exchange-Traded Derivatives Contracts 2349.3.1 Introduction 2349.3.2 Derivatives Exchange and Clearing System 2359.3.3 Give-Up Agreements 2359.3.4 Clearing Process 2369.3.5 Margin Calculations 2379.3.6 Initial Margin – Eligible Assets 239
9.4 Cleared OTC Derivatives Contracts 2409.4.1 Types of OTC Derivative that are Cleared Centrally 2419.4.2 Trading Platforms 2429.4.3 Trade Repositories 2449.4.4 Central Counterparties 244
9.5 Non-Cleared OTC Derivatives Contracts 2459.5.1 Documentation 2459.5.2 Non-Cleared OTCD Processing 2489.5.3 Trade Capture 2489.5.4 Confirmation 2499.5.5 Settlement 2509.5.6 Collateral 2519.5.7 Event Monitoring 2549.5.8 Reconciliation 254
9.6 Summary 255
PART THREE
CHAPTER 10Custody and the Custodians 259
10.1 Introduction 25910.2 Custody 260
10.2.1 What is Custody? 26010.2.2 Forms of Securities 26010.2.3 Ownership Transfer – Bearer Securities 26110.2.4 Ownership Transfer – Registered Securities 262
10.3 Holding Securities 26310.3.1 Register in the Custodian’s Name 26310.3.2 Nominee Account 26410.3.3 CSD Nominee 26610.3.4 Safekeeping Methods – Summary 267
Contents xiii
10.4 The Custodians 26710.4.1 Custody in a Local Market 26710.4.2 Custody in Global Markets 27110.4.3 Custody in the EuroMarkets 277
10.5 Target2Securities (T2S) 27910.5.1 Introduction 27910.5.2 Eurosystem 28010.5.3 How T2S Will Work 28110.5.4 Migration Plan 28210.5.5 Further Information 282
10.6 Summary 283
CHAPTER 11Corporate Actions 285
11.1 Introduction 28511.2 Types of Corporate Action Event 286
11.2.1 Voluntary or Mandatory Events 28611.2.2 Predictable or Announced Events 287
11.3 Participation in Corporate Actions 28711.3.1 Fund Manager 28711.3.2 Global Custodian 28711.3.3 Local/Sub-Custodian 28811.3.4 Local Central Securities Depository 28811.3.5 International Central Securities Depository 28811.3.6 Data Vendors 28811.3.7 Receiving/Paying Agent 288
11.4 Entitlements, Key Dates and Claims 28911.4.1 Entitlement 28911.4.2 Record Date 29011.4.3 Ex-Dividend Date 29011.4.4 Payment Date 29211.4.5 Claims 29211.4.6 Key Dates for Bonds 294
11.5 Corporate Action Event Processing 29411.5.1 Introduction 29411.5.2 Cash Dividend 29611.5.3 Optional Stock Dividend 29811.5.4 Fixed-Income Bond Coupon 30011.5.5 Floating-Rate Note (FRN) Coupon and Rate Reset 30211.5.6 Bond Redemption 30511.5.7 Bond Conversion 30711.5.8 Capitalisation (Bonus) Issue 30911.5.9 Rights Issue 31011.5.10 Other Examples of Event Types 314
xiv CONTENTS
11.6 Information Flows 31511.6.1 Introduction 31511.6.2 The Communication Problem 31511.6.3 Global Communication Chain 31611.6.4 Local Communication Chain 31811.6.5 International Central Securities Depository Chain 31911.6.6 Summary 320
11.7 Corporate Action Risks 32011.7.1 Introduction 32011.7.2 Data/Information Capture Risk 32111.7.3 Replacement Risk 32211.7.4 Decision-Making/Election Risk 32211.7.5 Reputational Risk 32211.7.6 Reconciliation Risk 323
11.8 Industry Initiatives 32311.8.1 Introduction 32311.8.2 The International Securities Services Association (ISSA) 32311.8.3 Giovannini Group 32411.8.4 European Central Securities Depositories Association (ECSDA) 325
11.9 Corporate Governance and Proxy Voting 32811.9.1 Introduction 32811.9.2 Relations with Shareholders 32811.9.3 Proxy Voting 32911.9.4 Relations with Preference Shareholders 33111.9.5 Relations with Bondholders 33111.9.6 Company in Bankruptcy or Administration 33111.9.7 Disclosure Reporting 332
11.10 Withholding Tax 33311.10.1 Introduction 33311.10.2 The Problem of Double Taxation 33511.10.3 Double Taxation Treaties 33511.10.4 Tax Reclaims 336
11.11 Impact on Other Departments 33711.11.1 Introduction 33711.11.2 Front Office 33711.11.3 Clients 33811.11.4 Settlements 33811.11.5 Securities Lending and Borrowing 33811.11.6 Reconciliations 33911.11.7 Pricing and Valuation 33911.11.8 Reference Data 340
11.12 Summary 340Appendix 11.1: Corporate Action Event Type Categories 340Appendix 11.2: Voluntary and Mandatory Events for Equities and Bonds 341
Contents xv
CHAPTER 12Securities Financing 343
12.1 Introduction 34312.2 Types of Securities Financing 344
12.2.1 Securities Lending and Borrowing 34412.2.2 Repurchase Agreements 34412.2.3 Sell/Buy-Backs 34512.2.4 Summary of Securities Financing Transactions 345
12.3 The Players and Their Motivations 34612.3.1 Introduction 34612.3.2 The Buy Side 34612.3.3 The Sell Side 34712.3.4 Borrowing to Cover Short Positions 34812.3.5 Borrowing Cash to Finance Inventory 34912.3.6 Temporary Transfer of Ownership 35012.3.7 Summary 352
12.4 Intermediaries 35212.4.1 The Relationship between Lender and Borrower 35212.4.2 Agent Intermediaries 35212.4.3 Principal Intermediaries 35312.4.4 Choices for the Lenders and Borrowers 353
12.5 Agreements and Code of Guidance 35412.5.1 Introduction 35412.5.2 Securities Lending Agreements 35412.5.3 Repurchase Agreements 35512.5.4 Code of Guidance 356
12.6 Securities Lending Lifecycle 35612.6.1 Phase 1: Loan Initiation 35712.6.2 Phase 2: Loan Maintenance 36112.6.3 Phase 3: Loan Closure 36712.6.4 Lending Fees 368
12.7 Repurchase Agreement Lifecycle 37012.7.1 Motivations 37012.7.2 Repurchase Agreement Types 37112.7.3 Sell/Buy-Backs 37412.7.4 Settlement 376
12.8 Collateral and Margin 37912.8.1 Terminology 37912.8.2 Types of Collateral 38012.8.3 Repurchase Agreements (and Sell/Buy-Backs) 38012.8.4 Securities Lending 38112.8.5 Delivery by Value (DBV) 38112.8.6 Repo Exposure, Haircuts and Margin 382
12.9 Default and Close-Out Provisions 38412.9.1 Introduction 384
xvi CONTENTS
12.9.2 Event of Default 38412.9.3 Consequences of an Event of Default 385
12.10 Central Counterparty (CCP) Services 38612.10.1 Introduction 38612.10.2 The Options Clearing Corporation (OCC) 38612.10.3 Eurex Clearing 38712.10.4 LCH.Clearnet 38712.10.5 Clearstream Banking Luxembourg (CBL) 38812.10.6 Euroclear Bank 388
12.11 Summary 389Appendix 12.1: Credit Ratings – Long Term 390Appendix 12.2: Delivery by Value (DBV) Class List 391Appendix 12.3: Technology Vendors 392
PART FOUR
CHAPTER 13Accounting for Securities 395
13.1 Introduction 39513.1.1 Accounting and Why We Need It 395
13.2 The Accounting Equation 39713.2.1 Key Financial Statements 397
13.3 The Accounting Lifecycle for Securities 40013.3.1 Introduction 40013.3.2 Trade Date 40113.3.3 Settlement Date 40213.3.4 Revaluation 403
13.4 Gains and Losses 40513.4.1 Introduction 40513.4.2 Fair Value (Mark-to-Market) 40513.4.3 Amortised Cost 40713.4.4 Calculation Conventions 410
13.5 The Accounting Lifecycle for Derivatives 41113.5.1 Introduction 41113.5.2 Exchange-Traded Derivatives 41213.5.3 OTC Derivatives 415
13.6 Summary 416Appendix 13.1: Closing Prices for Singapore Equities (SGX) 416
CHAPTER 14Reconciliation 417
14.1 Introduction 41714.2 Importance of Reconciliation 418
14.2.1 Internal vs. External Records 41814.2.2 Ownership vs. Location 419

Contents xvii
14.3 Types of Reconciliation 42114.3.1 Reconciliation Methods 42214.3.2 Reconciliations – Worked Examples 423
14.4 Automation of Reconciliations 42714.5 Summary 428
About the Author 429
Index 431

Preface
I have been involved in Operations for over forty years as a practitioner, an executive educationtrainer and university lecturer. In my practitioner days, there was very little by way of
reference books that addressed Operations; in addition, the Internet had yet to enter ourcollective consciousness. As a consequence, it was difficult for those working in Operationsto find any literature that dealt with their topic.
Today, we can research any topic we choose, including Operations, by accessing the Internet,clicking through websites managed by exchanges, depositories, custodians, regulators andvarious trade associations. In spite of this, and with one or two notable exceptions, there isa dearth of books that enable Operations professionals to navigate the settlement and post-settlement environment for securities and derivatives.
This book, Financial Markets Operations Management, fills that information gap.
The intended audience is fourfold. Firstly, the text may be used in a teaching context as a coursereader for staff already working in an operational environment. Secondly, as a reference guidefor students taking a financially focused first degree or Masters course. Thirdly, for staffworking in non-operational areas that are interested in what happens “after the trade has beenexecuted”. Finally, for those who are about to enter the financial world or who simply have apassing interest in the subject, this book is for those readers.
The text covers the trade lifecycle for securities and derivatives products from trade capture,pre-settlement and settlement through to the custody of assets and asset servicing. It is dividedinto four parts, as follows:
Part One: An understanding of operations in the context of financial instruments, datamanagement and the different types of organisation.
Part Two: The post-trade processing of financial instruments; trade capture, clearing andsettlement.
Part Three: The post-settlement environment of safekeeping, asset servicing and assetoptimisation.
Part Four: A consideration of two key controls – accounting for securities and assetreconciliation.
xix
xx PREFACE
Chapters are broken down as follows:
Chapter 1 looks at the organisational structure of a typical investment company and at theOperations Department in particular. We consider the internal and external relationshipsthat Operations manage.
Chapter 2 defines the main financial instruments, explains the operational features andshows the transaction calculations including accrued interest for bonds.
Chapter 3 considers the importance of data and its management.
Chapter 4 explains how the various intermediaries and market infrastructures enablelenders and borrowers to operate.
Chapter 5 starts the post-trade processing phase by looking at the clearing systems anddistinguishing between clearing houses and central counterparties.
Chapter 6 continues looking at the infrastructure and in particular the securities deposi-tories.
Chapter 7 follows the initial post-trade processes of clearing and the pre-settlementforecasting of cash and securities.
Chapter 8 describes the different types of settlement including “delivery versus payment”,the reasons why trades fail to settle and what actions can be taken to manage the fails.
Chapter 9 changes focus from securities to derivatives with a look at how exchange-tradedand over-the-counter derivative products are cleared.
Chapter 10 looks at the safekeeping of securities including the use of nominee names andthe relationships between the beneficial owner and the securities issuer, together with theintermediaries such as custodians and securities depositories.
Chapter 11 introduces the reader to what is considered to be the most risky area withinOperations – corporate actions. This chapter looks at the complexities, processing require-ments and information flows of this topic.
Chapter 12 describes the different forms of securities financing and includes user moti-vations and the lifecycle. Securities financing is not risk-free; this chapter addresses therisks and the ways in which these risks are mitigated.
Chapter 13 looks at the impact of securities transactions on the Profit & Loss Statementand Balance Sheet together with the transaction lifecycle from an accounting perspective.
Chapter 14 explains the importance of efficient and timely asset reconciliation and howit might be used as a predictive tool to prevent problems from occurring.
To cover the entire operational spectrum would require a text containing many hundreds, if notthousands, of pages. In order to overcome this problem I have concentrated on what I considerto be the main operational processes for securities and derivatives. Whilst I do not cover everytype of equity, bond and derivative, there is sufficient detail to enable the reader to understandwhat happens in the engine room of the financial markets, i.e. after the trade is executed.
Therefore, I have not included regulation other than by occasional reference. We are subjectedto regulation for a variety of reasons – for example, to maintain confidence in the financial

Preface xxi
system – and it is both complex and technical. Furthermore, in a global context, there aredifferent and sometimes conflicting regulations from country to country.
I have also excluded commodities for two reasons. Firstly because in the physical world,types of commodities behave in different ways – think of the processes that enable you topump petrol/gas into your car or electricity to light up your home. By contrast, commoditiesderivatives are cleared in similar ways to financial derivatives. Secondly, there is already anexcellent book written by a friend and colleague, Neil Schofield.1
Finally, this book does not cover funds administration. This relates to activities that supportthe running of a collective investment scheme (for example, a traditional mutual fund, hedgefund, pension fund, unit trust or similar variation).
In any event, there is more than enough material within the regulatory, commodities and fundsadministration world for an additional three books.
Students and instructors can find additional resources at www.wiley.com.
1Schofield, N. C. (2007) Commodity Derivatives: Markets and Applications. Published by Wiley Finance(ISBN 978-0-470-01910-8).

Acknowledgements
T hanks to John Evans, FMT, who suggested the idea of writing the book, and to ColinHill, Shelby Limited, who reviewed the first draft of the manuscript. At Wiley, I’d like
to acknowledge the work of Development Editor Meg Freeborn, Acquisitions Editor ThomasHyrkiel, Assistant Editor Jennie Kitchin, Senior Production Editor Tessa Allen and Copy-Editor Helen Heyes.
xxiii


PART
One

CHAPTER 1Introduction to Operations
1.1 INTRODUCTION
For every action there is a reaction. For every transaction, there has to be an appropriatesequence of processes such as a payment, a delivery of an asset, an exchange of information ora combination of these. We refer to this as an operational process. In this introductory chapter,we will see how an investment company’s Operations Department relates to other departmentswithin the company and other external organisations.
Firstly, we need to distinguish the operations of an organisational entity and the entity’spost-transactional operations.
What do the following types of business actually do?
Vineyard? Publisher? Hotel? Insurance company?
In simple terms, these businesses produce something (often referred to as outputs):
Vineyards produce wine; Publishers produce books, newspapers and computer software; Hotels produce satisfied customers; Insurance companies help customers reduce their financial risks.
These outputs are the results of the transformation of a variety of inputs, including some ofthe following (the list is not exhaustive):
Vineyard – grapes, yeast, water, sugar, etc. Publisher – authors, ideas, paper, digital resources, etc. Hotel – premises (rooms, dining areas), food, staff (front of house, catering, cleaning),
ambiance, etc. Insurance company – products, sales staff, research & development staff, distribution
channels, etc.
3
4 FINANCIAL MARKETS OPERATIONS MANAGEMENT
This is what businesses “do”; we know this as the business operations and the transformationof inputs into outputs are how each business operates.
Q&A
Quest ion
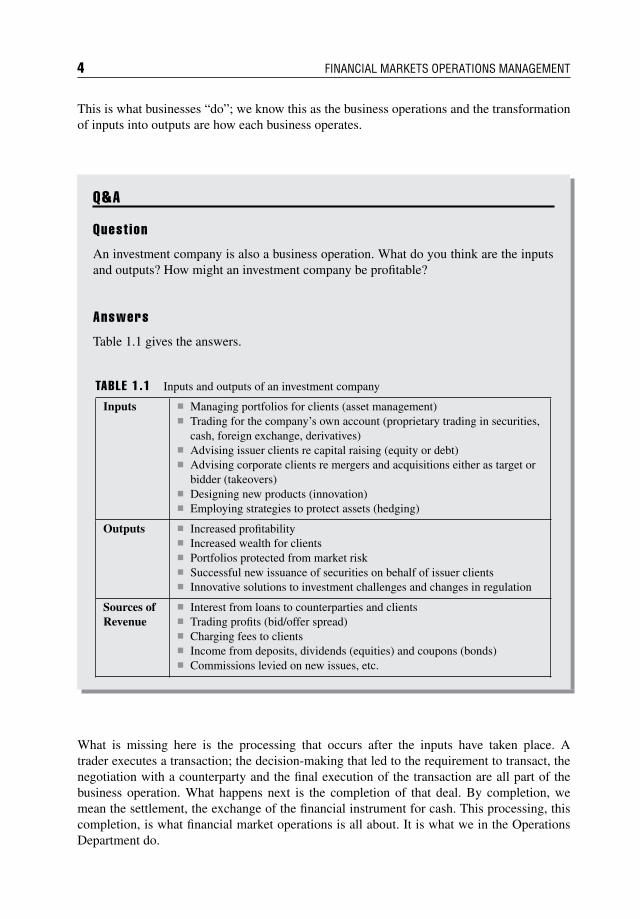
An investment company is also a business operation. What do you think are the inputsand outputs? How might an investment company be profitable?
Answers
Table 1.1 gives the answers.
TABLE 1.1 Inputs and outputs of an investment company
Inputs Managing portfolios for clients (asset management) Trading for the company’s own account (proprietary trading in securities,
cash, foreign exchange, derivatives) Advising issuer clients re capital raising (equity or debt) Advising corporate clients re mergers and acquisitions either as target or
bidder (takeovers) Designing new products (innovation) Employing strategies to protect assets (hedging)
Outputs Increased profitability Increased wealth for clients Portfolios protected from market risk Successful new issuance of securities on behalf of issuer clients Innovative solutions to investment challenges and changes in regulation
Sources ofRevenue
Interest from loans to counterparties and clients Trading profits (bid/offer spread) Charging fees to clients Income from deposits, dividends (equities) and coupons (bonds) Commissions levied on new issues, etc.
What is missing here is the processing that occurs after the inputs have taken place. Atrader executes a transaction; the decision-making that led to the requirement to transact, thenegotiation with a counterparty and the final execution of the transaction are all part of thebusiness operation. What happens next is the completion of that deal. By completion, wemean the settlement, the exchange of the financial instrument for cash. This processing, thiscompletion, is what financial market operations is all about. It is what we in the OperationsDepartment do.
Introduction to Operations 5
There is, therefore, a distinction between the operations of a business and Operations in thesense of processing most of the inputs. In this opening chapter you will learn:
How an investment company is typically structured; What the departments’ roles are; What relationships Operations have with internal departments and external entities; Other service functions within the business.
1.2 ORGANISATIONAL STRUCTURE OF AN INVESTMENT COMPANY
There is no right or wrong way to organise the structure of an investment company. It dependson the size of the company, the products in which it deals and the locations of its offices.
The biggest companies, for example the investment banks, will have several thousand stafflocated in offices based around the world. By contrast, the smallest, such as a hedge fund,might have less than 100 staff working from one office.
What is usually certain is that there will be one department that generates business for thecompany and one that ensures that the business is administered in an efficient, controlled,timely and risk-free manner. In many companies there will be a third department that supportsthese two.
We refer to these three departments or offices as follows:
Front Office – the business generator; Middle Office – the administrator; Back Office1 – the supporter.
1.2.1 Front Of f ice
The Front Office generates revenue and is responsible for the buying and selling of financialproducts.
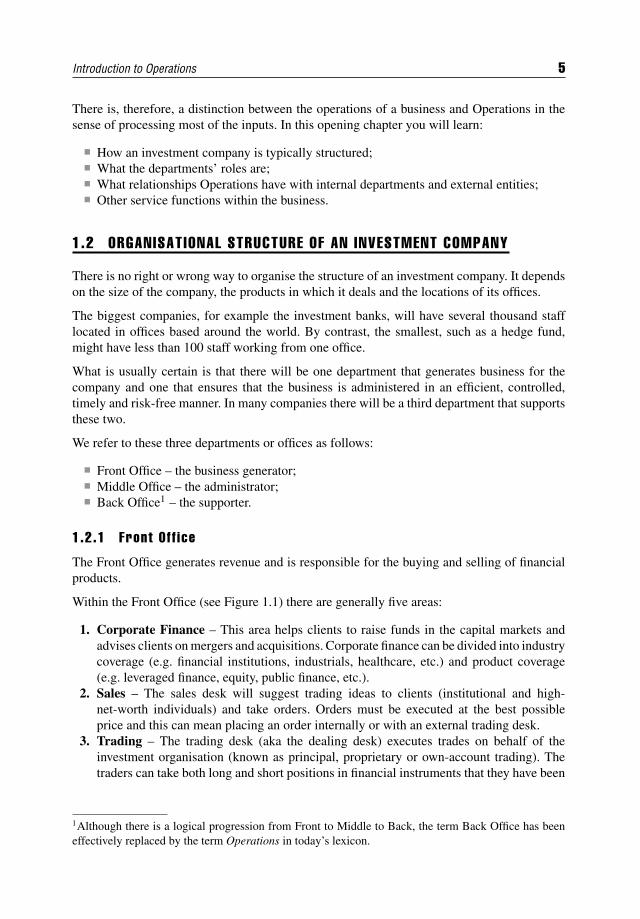
Within the Front Office (see Figure 1.1) there are generally five areas:
1. Corporate Finance – This area helps clients to raise funds in the capital markets andadvises clients on mergers and acquisitions. Corporate finance can be divided into industrycoverage (e.g. financial institutions, industrials, healthcare, etc.) and product coverage(e.g. leveraged finance, equity, public finance, etc.).
2. Sales – The sales desk will suggest trading ideas to clients (institutional and high-net-worth individuals) and take orders. Orders must be executed at the best possibleprice and this can mean placing an order internally or with an external trading desk.
3. Trading – The trading desk (aka the dealing desk) executes trades on behalf of theinvestment organisation (known as principal, proprietary or own-account trading). Thetraders can take both long and short positions in financial instruments that they have been
1Although there is a logical progression from Front to Middle to Back, the term Back Office has beeneffectively replaced by the term Operations in today’s lexicon.
6 FINANCIAL MARKETS OPERATIONS MANAGEMENT
authorised to trade in. This desk also executes trades on behalf of the sales desk, as notedabove.
4. Repo Desk – The repo desk supports the traders by helping to finance their positions.When the traders go long, they need to borrow cash. The repo traders borrow cashthrough repo. Conversely, when the traders go short, they need to borrow securities. Therepo traders borrow securities through reverse repo.
5. Research – Research is undertaken for a variety of reasons. For example, equity researchreview companies write reports about their prospects and make “buy”, “sell” or “hold”recommendations. Predominantly, research is a key service in terms of advice and strategy;it covers credit research and fixed-income research amongst others.
F IGURE 1.1 Investment organisation – structure
There are other, similar types of Front Office used by organisations, such as:
Stockbrokers – These act in an agency capacity on behalf of clients. They can offer“execution only” (without any advice) brokerage, non-discretionary services (provideadvice but can only trade subject to a client’s instructions) and fully discretionary services(the broker decides what to do based on the client’s overall investment objectives withoutseeking case-by-case instructions).
Market makers – These make their money by using their company’s capital to quote bidand offer (buy and sell) prices in pre-specified securities. Market makers are obliged tomake a two-way price in any and all market conditions.
Investment managers – These use their clients’ cash to make investment decisions inaccordance with the clients’ investment objectives. Having made the investment decisions,orders are placed with their brokers for execution in the market.
Broker/Dealers – These can act as both a dealer (trading for the organisation’s ownaccount) and as a broker (on behalf of clients).
Inter-dealer brokers – These are specialised intermediaries that execute transactionson behalf of sell-side institutions such as broker/dealers and market makers. The IDBsprovide anonymity so that the market is not aware of the sell-side institution’s positions.
In whatever capacity it is acting, the Front Office executes transactions either on a stockexchange or in the over-the-counter (OTC) markets.
1.2.2 Middle Of f ice
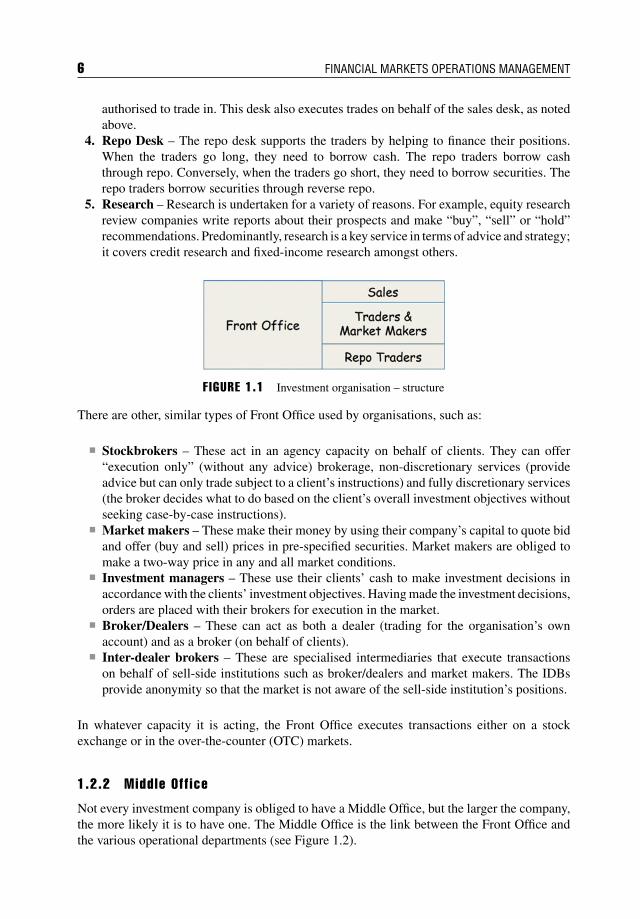
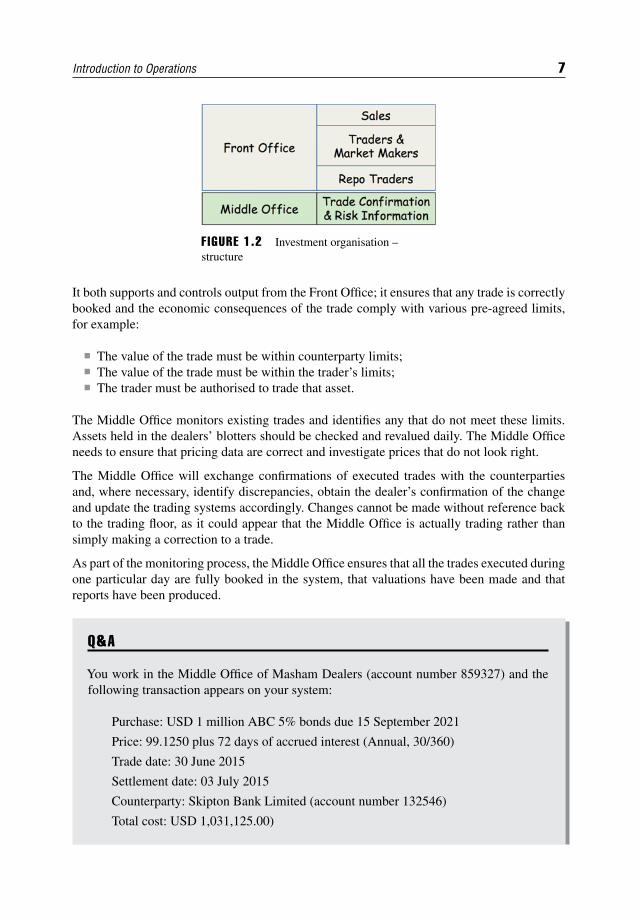
Not every investment company is obliged to have a Middle Office, but the larger the company,the more likely it is to have one. The Middle Office is the link between the Front Office andthe various operational departments (see Figure 1.2).
Introduction to Operations 7
FIGURE 1.2 Investment organisation –structure
It both supports and controls output from the Front Office; it ensures that any trade is correctlybooked and the economic consequences of the trade comply with various pre-agreed limits,for example:
The value of the trade must be within counterparty limits; The value of the trade must be within the trader’s limits; The trader must be authorised to trade that asset.
The Middle Office monitors existing trades and identifies any that do not meet these limits.Assets held in the dealers’ blotters should be checked and revalued daily. The Middle Officeneeds to ensure that pricing data are correct and investigate prices that do not look right.
The Middle Office will exchange confirmations of executed trades with the counterpartiesand, where necessary, identify discrepancies, obtain the dealer’s confirmation of the changeand update the trading systems accordingly. Changes cannot be made without reference backto the trading floor, as it could appear that the Middle Office is actually trading rather thansimply making a correction to a trade.
As part of the monitoring process, the Middle Office ensures that all the trades executed duringone particular day are fully booked in the system, that valuations have been made and thatreports have been produced.
Q&A
You work in the Middle Office of Masham Dealers (account number 859327) and thefollowing transaction appears on your system:
Purchase: USD 1 million ABC 5% bonds due 15 September 2021
Price: 99.1250 plus 72 days of accrued interest (Annual, 30/360)
Trade date: 30 June 2015
Settlement date: 03 July 2015
Counterparty: Skipton Bank Limited (account number 132546)
Total cost: USD 1,031,125.00)
8 FINANCIAL MARKETS OPERATIONS MANAGEMENT
A few moments later, the confirmation arrives from your counterparty:
Confirmation from: Skipton Bank International (account number 132654)
Sale: USD 1 million ABC 5% bonds due 15 September 2021
Price: 99.0625 plus 72 days of accrued interest (Annual, 30/360)
Trade date: 30 June 2015
Settlement date: 03 July 2015
Counterparty: Masham Dealers (account number: 859327)
Total cost: USD 1,030,625.00
Quest ion
What, if anything, is wrong with the confirmation, who is correct and what action wouldyou take?
Answer
There are two discrepancies:
1. Counterparty – you have Skipton Bank Limited and the incoming confirmation hascome from Skipton Bank International. Although both counterparties are from thesame banking group, they are different counterparties.
2. Price – You have 99.1250 and they have 99.0625.
There is no sure way of knowing what the correct situation should be:
Counterparty – You may have traded with both entities in the recent past, so eithermight be right.
Price – If the market was showing 99.140625 (bid) and 99.203125 (offer) at thetime the trade was executed, whose trade is more likely to be correct? If we arethe sell-side (and therefore Skipton the buy-side), our price looks more likely to becorrect. As the sell-side dealer, we would purchase at close to the bid (i.e. lower)price.
Our only course of action is to talk to the trader concerned and get him or her tocheck the details by contacting, if necessary, the counterparty dealer. Our dealer willhave to authorise any alteration to the contract. Then, and only then, can you make thecorrections in the system.
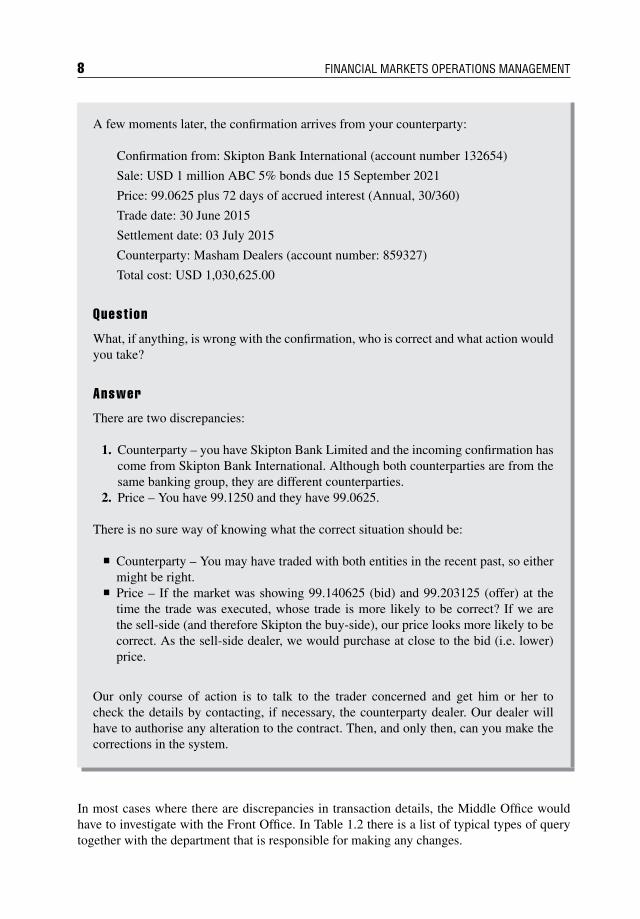
In most cases where there are discrepancies in transaction details, the Middle Office wouldhave to investigate with the Front Office. In Table 1.2 there is a list of typical types of querytogether with the department that is responsible for making any changes.
Introduction to Operations 9
TABLE 1.2 Primary responsibilities for resolving trade discrepancies
Settlement InstructionComponent
Trade Detail from whichSettlement InstructionComponent is Derived Primary Responsibility
Depot account no. Trading company Front Office and/or Operations
Nostro account no. Trading company Front Office and/or Operations
Trade reference N/A N/A
Deliver/Receive Purchase or Sale Front Office
Settlement basis DVP or RVP or FoP Front Office
Settlement date Settlement date Front Office
Quantity Quantity Front Office
Security reference Security Front Office
Settlement currency Settlement currency Front Office
Total net amount (Principal) Price Front Office
Total net amount (accruedinterest)
Accrued interest Operations
Counterparty’s depot account Counterparty (Cpty) Cpty = Front OfficeCpty account = Operations
Counterparty’s nostro account Counterparty (Cpty) Cpty = Front OfficeCpty account = Operations
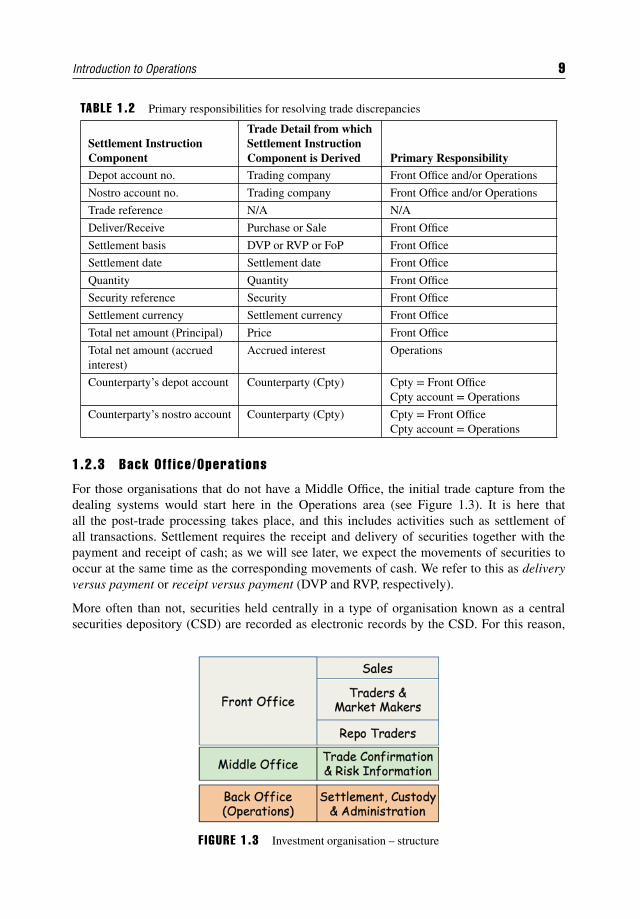
1.2.3 Back Off ice/Operat ions
For those organisations that do not have a Middle Office, the initial trade capture from thedealing systems would start here in the Operations area (see Figure 1.3). It is here thatall the post-trade processing takes place, and this includes activities such as settlement ofall transactions. Settlement requires the receipt and delivery of securities together with thepayment and receipt of cash; as we will see later, we expect the movements of securities tooccur at the same time as the corresponding movements of cash. We refer to this as deliveryversus payment or receipt versus payment (DVP and RVP, respectively).
More often than not, securities held centrally in a type of organisation known as a centralsecurities depository (CSD) are recorded as electronic records by the CSD. For this reason,
F IGURE 1.3 Investment organisation – structure
10 FINANCIAL MARKETS OPERATIONS MANAGEMENT
Operations will also have responsibility for ensuring that when transactions settle, the correctamount of securities is either credited (for purchase) or debited (for a sale) at the relevant CSD.
Operations may or may not be a direct participant within a CSD; if not, Operations will makeuse of an organisation such as a custodian bank that does have direct participation with theCSD. So we now have a custody or safekeeping responsibility in addition to settlements.
As we will see throughout this book, many of the operational responsibilities refer to theprocessing and final completion of transactions that have come out of the Front Office. Thereare other aspects to consider as well:
Monitoring and control – Operations must make sure that any payments and deliveriesare made with the appropriate level of authorisation. Authorisation can include a testedtelex, an authenticated email, an authenticated fax, a signed (and possibly countersigned)hardcopy instruction or a message delivered through a secure and automated electronicmessaging system such as SWIFT.
Reconciliation – This is a key control designed to ensure that the organisation can verifythat assets recorded in the books and records of the organisation agree with externalstatements received from counterparties, banks, custodians, etc.
Protection of revenues – Revenues are generated in the Front Office and there will becertain, known costs that each transaction will be subject to. Examples of these costs caninclude brokerage fees, transaction fees, custody charges, clearing fees and stamp duty.
These represent the cost of doing business; however, if there are processing errors, there isevery likelihood that there will be penalty costs associated with this. In a perfectly efficientenvironment where no mistakes are made, there should be no need for any penalty costs to beincurred. If, for example, a payment is made late, then it is quite possible for the interest chargeto be greater than the profit made on the underlying transaction. Operations staff membershave to pay great attention to detail in their attempts to avoid problems such as these.
1.3 OPERATIONS’ RELATIONSHIPS
The Operations Department does not and cannot operate in isolation. It has to maintainrelationships with many different types of organisation including:
Clients – external; Clients – internal; Counterparties; Suppliers; The authorities.
1.3.1 Cl ients – External
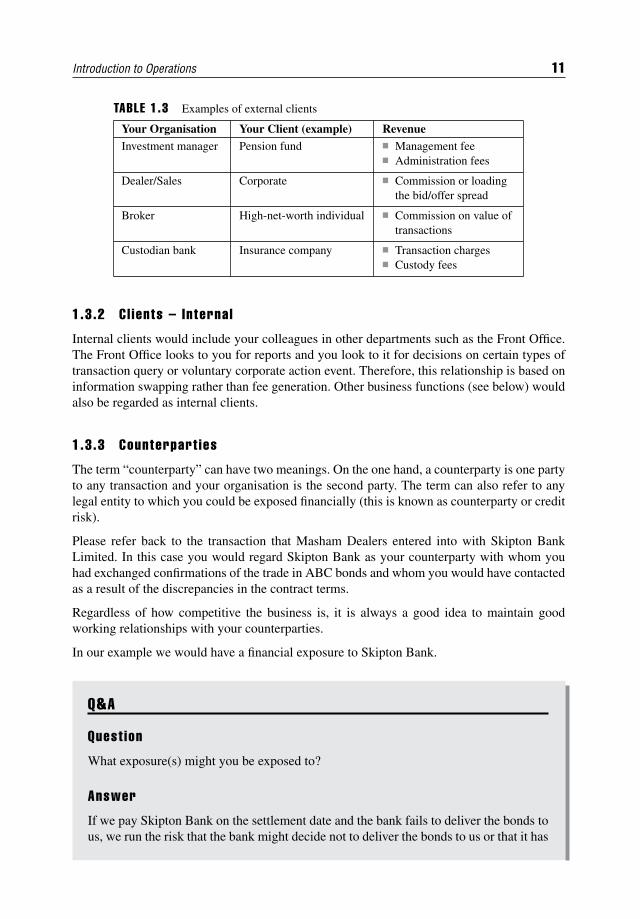
These are your fee-paying clients; you provide a service for which you are compensated.Table 1.3 lists some examples.
You could be in contact with your clients on a regular basis for a variety of reasons, such asresponding to their queries, taking instructions for an optional corporate action events andsending them securities and/or cash statements including evaluations and performance-relatedinformation.
Introduction to Operations 11
TABLE 1.3 Examples of external clients
Your Organisation Your Client (example) RevenueInvestment manager Pension fund Management fee
Administration fees
Dealer/Sales Corporate Commission or loadingthe bid/offer spread
Broker High-net-worth individual Commission on value oftransactions
Custodian bank Insurance company Transaction charges Custody fees
1.3.2 Cl ients – Internal
Internal clients would include your colleagues in other departments such as the Front Office.The Front Office looks to you for reports and you look to it for decisions on certain types oftransaction query or voluntary corporate action event. Therefore, this relationship is based oninformation swapping rather than fee generation. Other business functions (see below) wouldalso be regarded as internal clients.
1.3.3 Counterpart ies
The term “counterparty” can have two meanings. On the one hand, a counterparty is one partyto any transaction and your organisation is the second party. The term can also refer to anylegal entity to which you could be exposed financially (this is known as counterparty or creditrisk).
Please refer back to the transaction that Masham Dealers entered into with Skipton BankLimited. In this case you would regard Skipton Bank as your counterparty with whom youhad exchanged confirmations of the trade in ABC bonds and whom you would have contactedas a result of the discrepancies in the contract terms.
Regardless of how competitive the business is, it is always a good idea to maintain goodworking relationships with your counterparties.
In our example we would have a financial exposure to Skipton Bank.
Q&A
Quest ion
What exposure(s) might you be exposed to?
Answer
If we pay Skipton Bank on the settlement date and the bank fails to deliver the bonds tous, we run the risk that the bank might decide not to deliver the bonds to us or that it has
12 FINANCIAL MARKETS OPERATIONS MANAGEMENT
gone into default and is not able to. We call this counterparty risk, and it is a variationon the term credit risk.
If, however, we agree to receive the bonds “against payment” and the bank is unableor unwilling to deliver, then we retain the cash. This is a lower type of risk, settlementrisk, which might expose us to market risk if we subsequently have to go back into themarket and purchase the bonds at a higher price.
For this reason, our organisation would analyse any counterparty from a credit perspective andestablish some trading limits with the counterparty. So long as the value of all our transactionswith the same counterparty is within the limit, the organisation will be comfortable with this.These limits should be under constant review and if the creditworthiness of a counterpartydeteriorates, the trading limits should be reduced accordingly.
1.3.4 Suppl iers
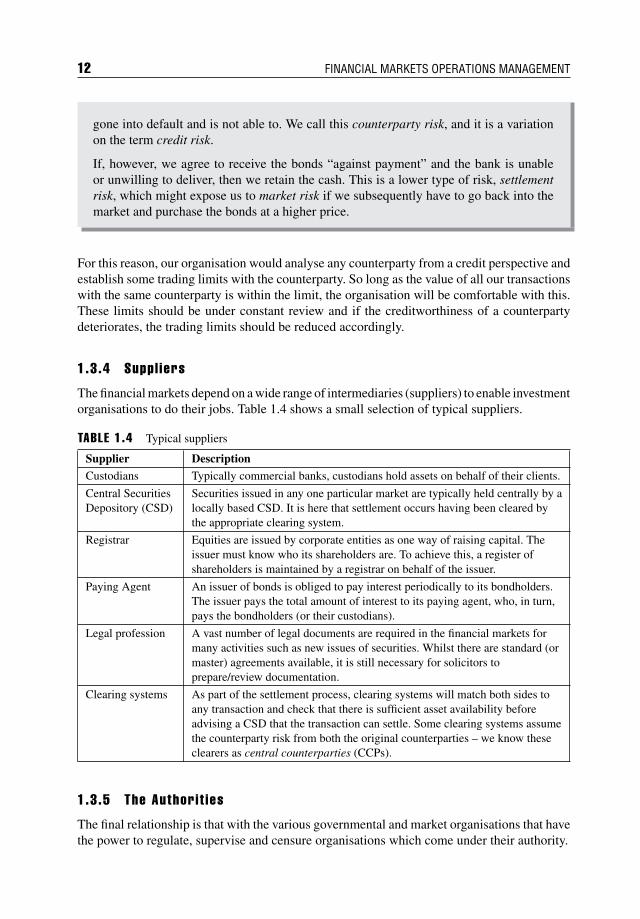
The financial markets depend on a wide range of intermediaries (suppliers) to enable investmentorganisations to do their jobs. Table 1.4 shows a small selection of typical suppliers.
TABLE 1.4 Typical suppliers
Supplier DescriptionCustodians Typically commercial banks, custodians hold assets on behalf of their clients.
Central SecuritiesDepository (CSD)
Securities issued in any one particular market are typically held centrally by alocally based CSD. It is here that settlement occurs having been cleared bythe appropriate clearing system.
Registrar Equities are issued by corporate entities as one way of raising capital. Theissuer must know who its shareholders are. To achieve this, a register ofshareholders is maintained by a registrar on behalf of the issuer.
Paying Agent An issuer of bonds is obliged to pay interest periodically to its bondholders.The issuer pays the total amount of interest to its paying agent, who, in turn,pays the bondholders (or their custodians).
Legal profession A vast number of legal documents are required in the financial markets formany activities such as new issues of securities. Whilst there are standard (ormaster) agreements available, it is still necessary for solicitors toprepare/review documentation.
Clearing systems As part of the settlement process, clearing systems will match both sides toany transaction and check that there is sufficient asset availability beforeadvising a CSD that the transaction can settle. Some clearing systems assumethe counterparty risk from both the original counterparties – we know theseclearers as central counterparties (CCPs).
1.3.5 The Authorit ies
The final relationship is that with the various governmental and market organisations that havethe power to regulate, supervise and censure organisations which come under their authority.
Introduction to Operations 13
The majority of markets require organisations to be authorised in order to participate in certainregulated activities and to be subjected to regular inspections. Failure to meet requirementsand breaches of the rules can expose organisations to financial penalties, public censure andeven a restriction in their business activities.
Organisations must submit reports to their regulators and comply with their rule books.
Financial organisations are businesses that are liable to pay corporation tax on profits made.There therefore needs to be a good working relationship with the tax authorities in the organ-isation’s country of incorporation.
Corporation tax is not the only tax to deal with; other taxes include:
Stamp duty, which might be payable in certain circumstances (typically on purchases ofsecurities based on a pre-specified percentage of the market value of the transaction).
Withholding tax (WHT) is often deducted from dividends paid to shareholders. Dependingon the shareholder’s tax status, it might be possible to reclaim some or all of this tax. Inwhich case, the Operations Department will have to submit reclaim documentation to theappropriate tax authorities.
Financial transaction tax (FTT), which is levied on certain types of transaction (stampduty is one such example). The European Commission has proposed the introduction ofan EU FTT that would impact transactions between financial institutions. The charge forequities and bond transactions would be 0.1% and derivatives contracts 0.01%. In 2011, itwas expected that this FTT would raise EUR 57 billion annually.2 The proposal, supportedby eleven EU Member States, has been approved by both the European Parliament andthe Council of the European Union. Details, however, have yet to be decided.
1.4 OTHER BUSINESS FUNCTIONS
There are other business functions that work outside of the direct Front Office/MiddleOffice/Back Office triangle but are nevertheless important elements in a well-run invest-ment organisation. Again, the exact management of these functions depends on the size of theorganisation and how it chooses to run its own business.
These functions include:
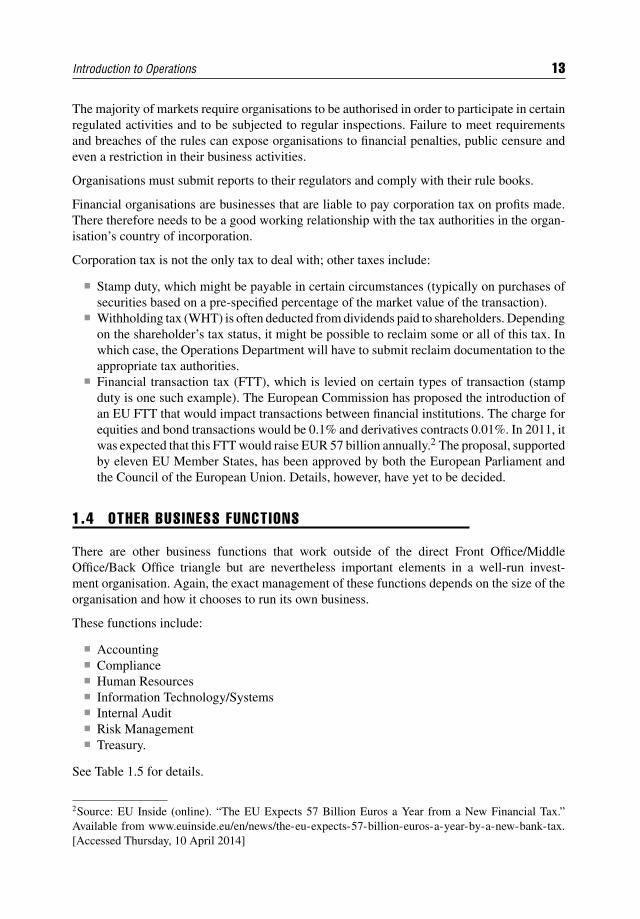
Accounting Compliance Human Resources Information Technology/Systems Internal Audit Risk Management Treasury.
See Table 1.5 for details.
2Source: EU Inside (online). “The EU Expects 57 Billion Euros a Year from a New Financial Tax.”Available from www.euinside.eu/en/news/the-eu-expects-57-billion-euros-a-year-by-a-new-bank-tax.[Accessed Thursday, 10 April 2014]
14 FINANCIAL MARKETS OPERATIONS MANAGEMENT
TABLE 1.5 Other business functions
Business Function Overview
Accounting Financial Accounting: Recording business transactions in the generalledger and preparing financial accounts (Profit & Loss, Balance Sheet, etc.).Reporting tends to be backward-looking (e.g. information for a previousperiod).
Management Accounting: Measures, analyses and reports information toenable managers to make decisions on future business objectives. Reportingtends to be forward-looking (e.g. budget for the next 12 months).
Compliance This function ensures that the organisation complies with appropriateregulations, laws, internal policies and contracts, identifies non-complianceand initiates corrective action.
Human Resources A key resource in any organisation, it is the management of staffrecruitment, learning and development, assessment and compensation.
InformationTechnology/Systems
The financial industry is concerned with the storage, retrieval, transmission,interpretation and security of information. Computers with databases,spreadsheets, telecommunications, etc. enable this to happen and havereplaced paper-based storage (ledgers) and manual processes.
High-speed networks have led to electronic and algorithmic trading that canexecute thousands of transactions in milliseconds.
The Internet has enabled instructions and information to be sent quicklyand securely, making many proprietary transmission systems redundant.
Internal Audit Provides independent assurance that an organisation’s risk management,governance and internal control processes are operating effectively. Internalaudit is independent from the business operations and reports to theorganisation’s board and senior management.
Risk Management Financial institutions are exposed to a number of risks, including:
Credit risk, Market risk, Liquidity risk, Business environment risk, and Operational risk.
The primary objective of the operational risk management function is tominimise the occurrence and impact of operational risk events, in particularavoiding extreme or catastrophic events, in order to support the organisationin achieving its strategic objectives.
Treasury A Treasury Department focuses on customer dealing business, servicing theorganisation’s banking book, supporting credit business by offering treasuryproducts, managing liquidity (daily cash flow) and conducting limitedtrading activities.

Introduction to Operations 15
1.5 SUMMARY
An Operations Department is the “engine room” of an investment organisation and the conduitalong which transactions that have been executed in the Front Office flow.
Operations have a processing role – ensuring that these transactions are completed (settled) inan accurate and timely manner.
Operations also have a supporting role – they help the Front Office by reducing costs andmaking sure that any profits are not reduced through late interest claims.
Operations have a safekeeping role – ensuring that assets are held in custody and are onlyreleased on properly authorised instructions.
Operations do not work alone – they provide information to other functions and requireresources such as staff (Human Resources) and cash (e.g. Treasury). To do this effectively,Operations maintain many different types of relationship, both internally (e.g. with the FrontOffice) and externally (e.g. with counterparties, clients, custodians, etc.).

CHAPTER 2Financial Instruments
2.1 INTRODUCTION
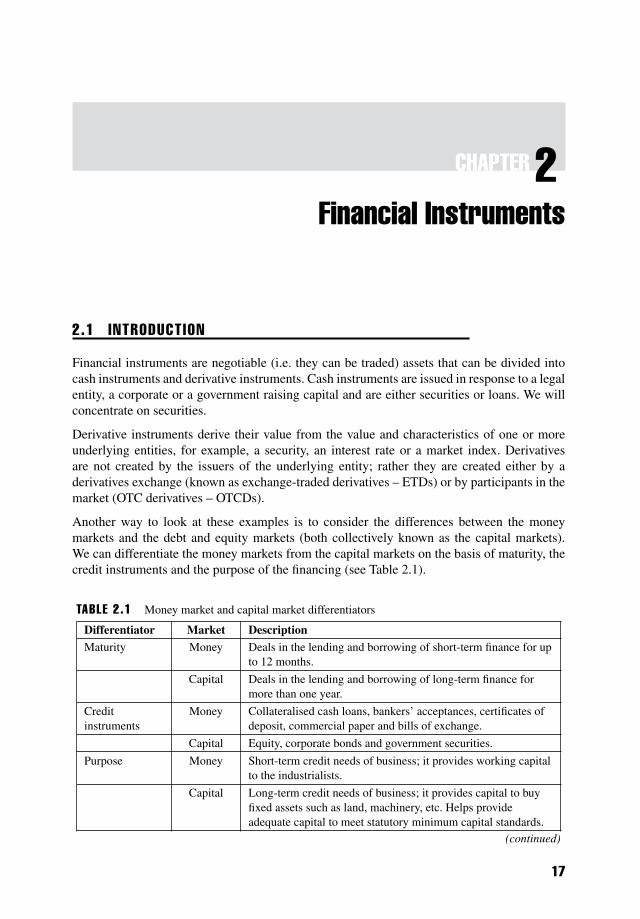
Financial instruments are negotiable (i.e. they can be traded) assets that can be divided intocash instruments and derivative instruments. Cash instruments are issued in response to a legalentity, a corporate or a government raising capital and are either securities or loans. We willconcentrate on securities.
Derivative instruments derive their value from the value and characteristics of one or moreunderlying entities, for example, a security, an interest rate or a market index. Derivativesare not created by the issuers of the underlying entity; rather they are created either by aderivatives exchange (known as exchange-traded derivatives – ETDs) or by participants in themarket (OTC derivatives – OTCDs).
Another way to look at these examples is to consider the differences between the moneymarkets and the debt and equity markets (both collectively known as the capital markets).We can differentiate the money markets from the capital markets on the basis of maturity, thecredit instruments and the purpose of the financing (see Table 2.1).
TABLE 2.1 Money market and capital market differentiators
Differentiator Market DescriptionMaturity Money Deals in the lending and borrowing of short-term finance for up
to 12 months.
Capital Deals in the lending and borrowing of long-term finance formore than one year.
Creditinstruments
Money Collateralised cash loans, bankers’ acceptances, certificates ofdeposit, commercial paper and bills of exchange.
Capital Equity, corporate bonds and government securities.
Purpose Money Short-term credit needs of business; it provides working capitalto the industrialists.
Capital Long-term credit needs of business; it provides capital to buyfixed assets such as land, machinery, etc. Helps provideadequate capital to meet statutory minimum capital standards.
(continued)
17
18 FINANCIAL MARKETS OPERATIONS MANAGEMENT
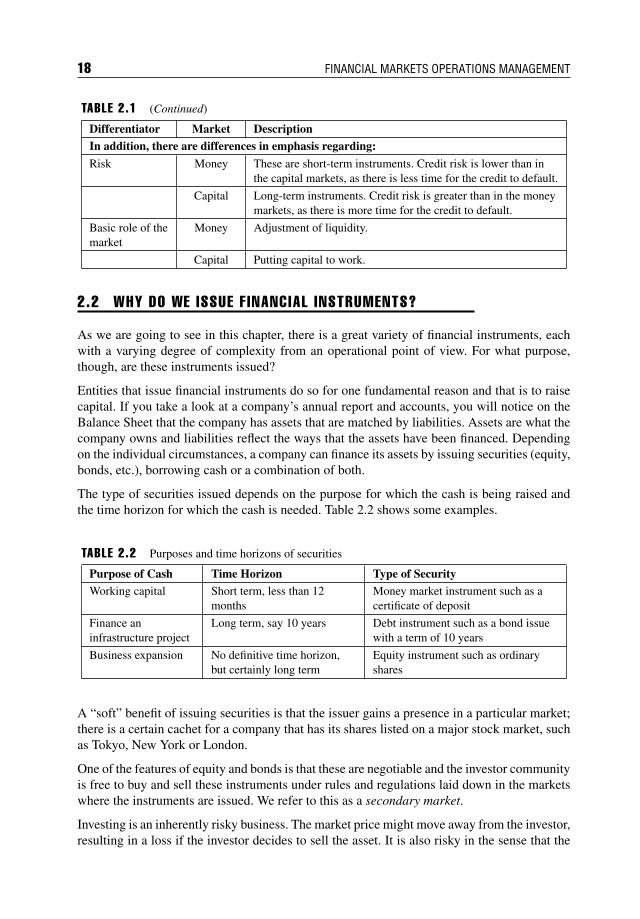
TABLE 2.1 (Continued)
Differentiator Market DescriptionIn addition, there are differences in emphasis regarding:
Risk Money These are short-term instruments. Credit risk is lower than inthe capital markets, as there is less time for the credit to default.
Capital Long-term instruments. Credit risk is greater than in the moneymarkets, as there is more time for the credit to default.
Basic role of themarket
Money Adjustment of liquidity.
Capital Putting capital to work.
2.2 WHY DO WE ISSUE F INANCIAL INSTRUMENTS?
As we are going to see in this chapter, there is a great variety of financial instruments, eachwith a varying degree of complexity from an operational point of view. For what purpose,though, are these instruments issued?
Entities that issue financial instruments do so for one fundamental reason and that is to raisecapital. If you take a look at a company’s annual report and accounts, you will notice on theBalance Sheet that the company has assets that are matched by liabilities. Assets are what thecompany owns and liabilities reflect the ways that the assets have been financed. Dependingon the individual circumstances, a company can finance its assets by issuing securities (equity,bonds, etc.), borrowing cash or a combination of both.
The type of securities issued depends on the purpose for which the cash is being raised andthe time horizon for which the cash is needed. Table 2.2 shows some examples.
TABLE 2.2 Purposes and time horizons of securities
Purpose of Cash Time Horizon Type of SecurityWorking capital Short term, less than 12
monthsMoney market instrument such as acertificate of deposit
Finance aninfrastructure project
Long term, say 10 years Debt instrument such as a bond issuewith a term of 10 years
Business expansion No definitive time horizon,but certainly long term
Equity instrument such as ordinaryshares
A “soft” benefit of issuing securities is that the issuer gains a presence in a particular market;there is a certain cachet for a company that has its shares listed on a major stock market, suchas Tokyo, New York or London.
One of the features of equity and bonds is that these are negotiable and the investor communityis free to buy and sell these instruments under rules and regulations laid down in the marketswhere the instruments are issued. We refer to this as a secondary market.
Investing is an inherently risky business. The market price might move away from the investor,resulting in a loss if the investor decides to sell the asset. It is also risky in the sense that the
Financial Instruments 19
issuer might default, leaving the investor with a worthless asset, and risky in the sense that thebenefits of ownership may either not be received or not be as high as expected.
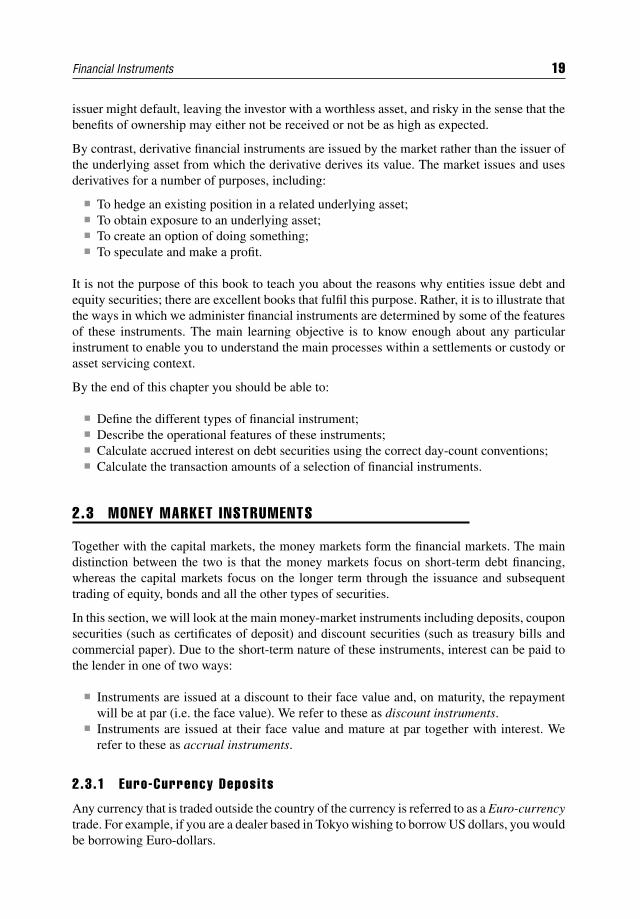
By contrast, derivative financial instruments are issued by the market rather than the issuer ofthe underlying asset from which the derivative derives its value. The market issues and usesderivatives for a number of purposes, including:
To hedge an existing position in a related underlying asset; To obtain exposure to an underlying asset; To create an option of doing something; To speculate and make a profit.
It is not the purpose of this book to teach you about the reasons why entities issue debt andequity securities; there are excellent books that fulfil this purpose. Rather, it is to illustrate thatthe ways in which we administer financial instruments are determined by some of the featuresof these instruments. The main learning objective is to know enough about any particularinstrument to enable you to understand the main processes within a settlements or custody orasset servicing context.
By the end of this chapter you should be able to:
Define the different types of financial instrument; Describe the operational features of these instruments; Calculate accrued interest on debt securities using the correct day-count conventions; Calculate the transaction amounts of a selection of financial instruments.
2.3 MONEY MARKET INSTRUMENTS
Together with the capital markets, the money markets form the financial markets. The maindistinction between the two is that the money markets focus on short-term debt financing,whereas the capital markets focus on the longer term through the issuance and subsequenttrading of equity, bonds and all the other types of securities.
In this section, we will look at the main money-market instruments including deposits, couponsecurities (such as certificates of deposit) and discount securities (such as treasury bills andcommercial paper). Due to the short-term nature of these instruments, interest can be paid tothe lender in one of two ways:
Instruments are issued at a discount to their face value and, on maturity, the repaymentwill be at par (i.e. the face value). We refer to these as discount instruments.
Instruments are issued at their face value and mature at par together with interest. Werefer to these as accrual instruments.
2.3.1 Euro-Currency Deposits
Any currency that is traded outside the country of the currency is referred to as a Euro-currencytrade. For example, if you are a dealer based in Tokyo wishing to borrow US dollars, you wouldbe borrowing Euro-dollars.
20 FINANCIAL MARKETS OPERATIONS MANAGEMENT
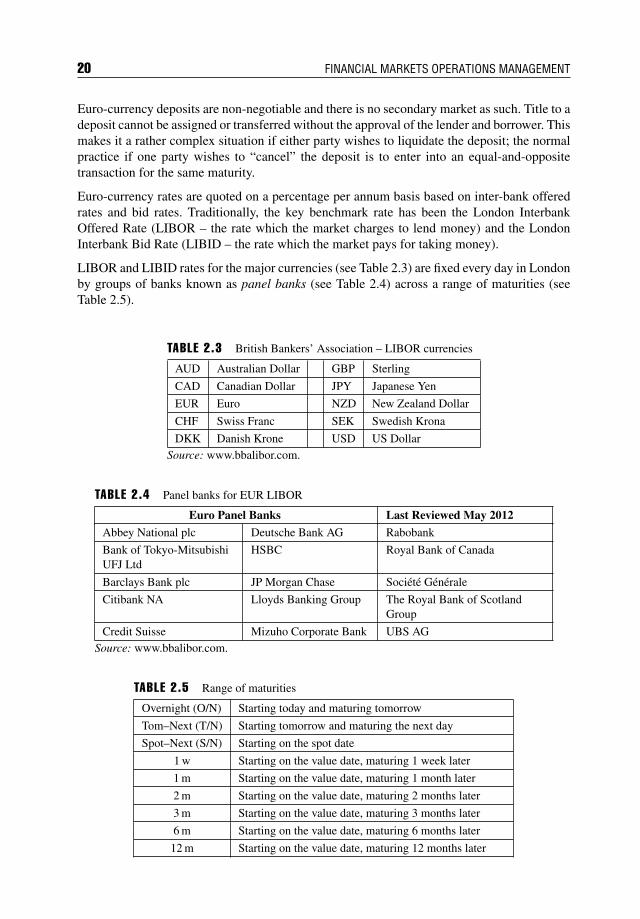
Euro-currency deposits are non-negotiable and there is no secondary market as such. Title to adeposit cannot be assigned or transferred without the approval of the lender and borrower. Thismakes it a rather complex situation if either party wishes to liquidate the deposit; the normalpractice if one party wishes to “cancel” the deposit is to enter into an equal-and-oppositetransaction for the same maturity.
Euro-currency rates are quoted on a percentage per annum basis based on inter-bank offeredrates and bid rates. Traditionally, the key benchmark rate has been the London InterbankOffered Rate (LIBOR – the rate which the market charges to lend money) and the LondonInterbank Bid Rate (LIBID – the rate which the market pays for taking money).
LIBOR and LIBID rates for the major currencies (see Table 2.3) are fixed every day in Londonby groups of banks known as panel banks (see Table 2.4) across a range of maturities (seeTable 2.5).
TABLE 2.3 British Bankers’ Association – LIBOR currencies
AUD Australian Dollar GBP Sterling
CAD Canadian Dollar JPY Japanese Yen
EUR Euro NZD New Zealand Dollar
CHF Swiss Franc SEK Swedish Krona
DKK Danish Krone USD US DollarSource: www.bbalibor.com.
TABLE 2.4 Panel banks for EUR LIBOR
Euro Panel Banks Last Reviewed May 2012
Abbey National plc Deutsche Bank AG Rabobank
Bank of Tokyo-MitsubishiUFJ Ltd
HSBC Royal Bank of Canada
Barclays Bank plc JP Morgan Chase Societe Generale
Citibank NA Lloyds Banking Group The Royal Bank of ScotlandGroup
Credit Suisse Mizuho Corporate Bank UBS AGSource: www.bbalibor.com.
TABLE 2.5 Range of maturities
Overnight (O/N) Starting today and maturing tomorrow
Tom–Next (T/N) Starting tomorrow and maturing the next day
Spot–Next (S/N) Starting on the spot date
1 w Starting on the value date, maturing 1 week later
1 m Starting on the value date, maturing 1 month later
2 m Starting on the value date, maturing 2 months later
3 m Starting on the value date, maturing 3 months later
6 m Starting on the value date, maturing 6 months later
12 m Starting on the value date, maturing 12 months later
Financial Instruments 21
Fix ing, Value and Maturity Dates When a deposit is transacted, there will be a differencebetween the dates on which the transaction is executed (the fixing date), the start date of thedeposit (the value date) and the finish date of the deposit (the maturity date).
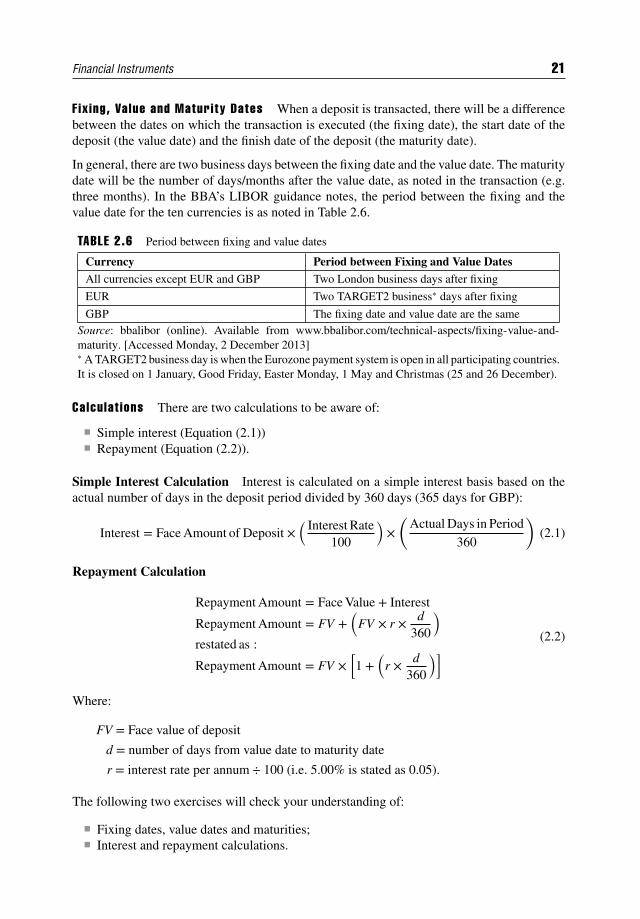
In general, there are two business days between the fixing date and the value date. The maturitydate will be the number of days/months after the value date, as noted in the transaction (e.g.three months). In the BBA’s LIBOR guidance notes, the period between the fixing and thevalue date for the ten currencies is as noted in Table 2.6.
TABLE 2.6 Period between fixing and value dates
Currency Period between Fixing and Value Dates
All currencies except EUR and GBP Two London business days after fixing
EUR Two TARGET2 business∗ days after fixing
GBP The fixing date and value date are the sameSource: bbalibor (online). Available from www.bbalibor.com/technical-aspects/fixing-value-and-maturity. [Accessed Monday, 2 December 2013]∗ A TARGET2 business day is when the Eurozone payment system is open in all participating countries.It is closed on 1 January, Good Friday, Easter Monday, 1 May and Christmas (25 and 26 December).
Calculat ions There are two calculations to be aware of:
Simple interest (Equation (2.1)) Repayment (Equation (2.2)).
Simple Interest Calculation Interest is calculated on a simple interest basis based on theactual number of days in the deposit period divided by 360 days (365 days for GBP):
Interest = Face Amount of Deposit ×( Interest Rate
100
)×(
Actual Days in Period
360
)(2.1)
Repayment Calculation
Repayment Amount = Face Value + Interest
Repayment Amount = FV +(
FV × r × d360
)restated as :
Repayment Amount = FV ×[1 +
(r × d
360
)] (2.2)
Where:
FV = Face value of deposit
d = number of days from value date to maturity date
r = interest rate per annum ÷ 100 (i.e. 5.00% is stated as 0.05).
The following two exercises will check your understanding of:
Fixing dates, value dates and maturities; Interest and repayment calculations.
22 FINANCIAL MARKETS OPERATIONS MANAGEMENT
Q&A
Quest ion
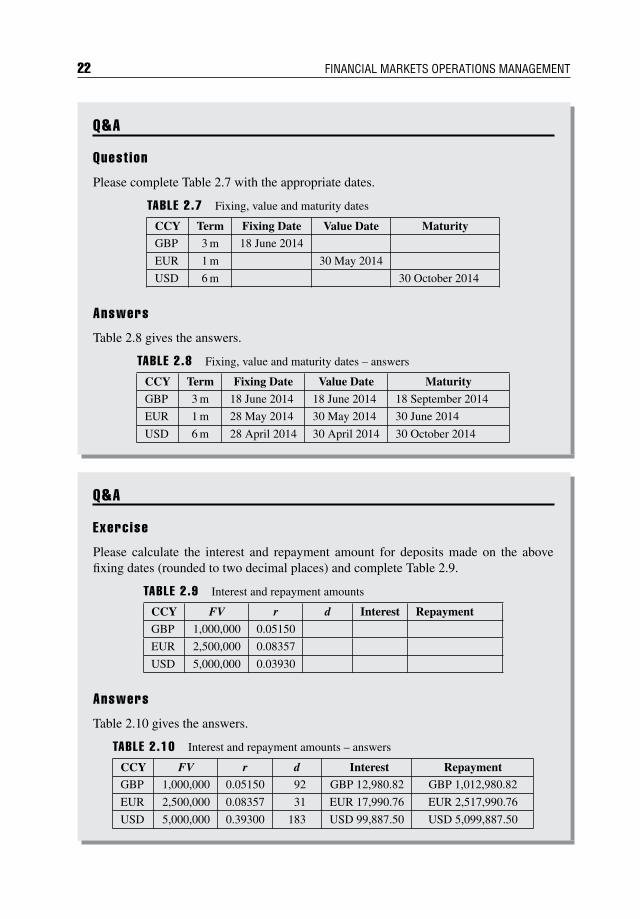
Please complete Table 2.7 with the appropriate dates.
TABLE 2.7 Fixing, value and maturity dates
CCY Term Fixing Date Value Date MaturityGBP 3 m 18 June 2014
EUR 1 m 30 May 2014
USD 6 m 30 October 2014
Answers
Table 2.8 gives the answers.
TABLE 2.8 Fixing, value and maturity dates – answers
CCY Term Fixing Date Value Date Maturity
GBP 3 m 18 June 2014 18 June 2014 18 September 2014
EUR 1 m 28 May 2014 30 May 2014 30 June 2014
USD 6 m 28 April 2014 30 April 2014 30 October 2014
Q&A
Exercise
Please calculate the interest and repayment amount for deposits made on the abovefixing dates (rounded to two decimal places) and complete Table 2.9.
TABLE 2.9 Interest and repayment amounts
CCY FV r d Interest Repayment
GBP 1,000,000 0.05150
EUR 2,500,000 0.08357
USD 5,000,000 0.03930
Answers
Table 2.10 gives the answers.
TABLE 2.10 Interest and repayment amounts – answers
CCY FV r d Interest RepaymentGBP 1,000,000 0.05150 92 GBP 12,980.82 GBP 1,012,980.82
EUR 2,500,000 0.08357 31 EUR 17,990.76 EUR 2,517,990.76
USD 5,000,000 0.39300 183 USD 99,887.50 USD 5,099,887.50
Financial Instruments 23
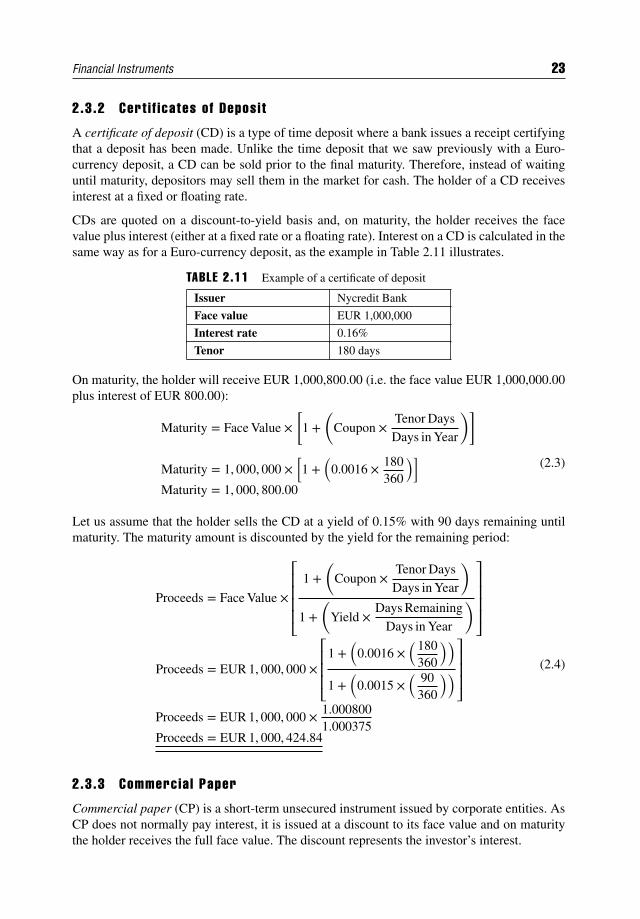
2.3.2 Cert i f icates of Deposit
A certificate of deposit (CD) is a type of time deposit where a bank issues a receipt certifyingthat a deposit has been made. Unlike the time deposit that we saw previously with a Euro-currency deposit, a CD can be sold prior to the final maturity. Therefore, instead of waitinguntil maturity, depositors may sell them in the market for cash. The holder of a CD receivesinterest at a fixed or floating rate.
CDs are quoted on a discount-to-yield basis and, on maturity, the holder receives the facevalue plus interest (either at a fixed rate or a floating rate). Interest on a CD is calculated in thesame way as for a Euro-currency deposit, as the example in Table 2.11 illustrates.
TABLE 2.11 Example of a certificate of deposit
Issuer Nycredit Bank
Face value EUR 1,000,000
Interest rate 0.16%
Tenor 180 days
On maturity, the holder will receive EUR 1,000,800.00 (i.e. the face value EUR 1,000,000.00plus interest of EUR 800.00):
Maturity = Face Value ×[
1 +(
Coupon ×Tenor Days
Days in Year
)]
Maturity = 1, 000, 000 ×[1 +
(0.0016 × 180
360
)]Maturity = 1, 000, 800.00
(2.3)
Let us assume that the holder sells the CD at a yield of 0.15% with 90 days remaining untilmaturity. The maturity amount is discounted by the yield for the remaining period:
Proceeds = Face Value ×
⎡⎢⎢⎢⎢⎣1 +
(Coupon ×
Tenor Days
Days in Year
)
1 +(
Yield ×Days Remaining
Days in Year
)⎤⎥⎥⎥⎥⎦
Proceeds = EUR 1, 000, 000 ×⎡⎢⎢⎢⎣
1 +(
0.0016 ×(180
360
))1 +
(0.0015 ×
( 90360
))⎤⎥⎥⎥⎦
Proceeds = EUR 1, 000, 000 × 1.0008001.000375
Proceeds = EUR 1, 000, 424.84
(2.4)
2.3.3 Commercia l Paper
Commercial paper (CP) is a short-term unsecured instrument issued by corporate entities. AsCP does not normally pay interest, it is issued at a discount to its face value and on maturitythe holder receives the full face value. The discount represents the investor’s interest.
24 FINANCIAL MARKETS OPERATIONS MANAGEMENT
Although CP is negotiable and can be sold in the secondary market, most CP is held tomaturity.
There are two major markets for CP:
1. The US dollar domestic market (US-CP), and2. The Euro commercial paper market (ECP).
US Dol lar Commercia l Paper The market price of US-CP is quoted as a discount rate. Thisis the rate of discount to face value at which the CP is being issued or sold. At a 7% per annumdiscount rate, US-CP with a one-year tenor would be issued at 93.00 (100% less 7%). At adiscount rate of 7% per annum, US-CP with a 180-day tenor would be issued at 96.50 (100minus 7.00 x 180/360).
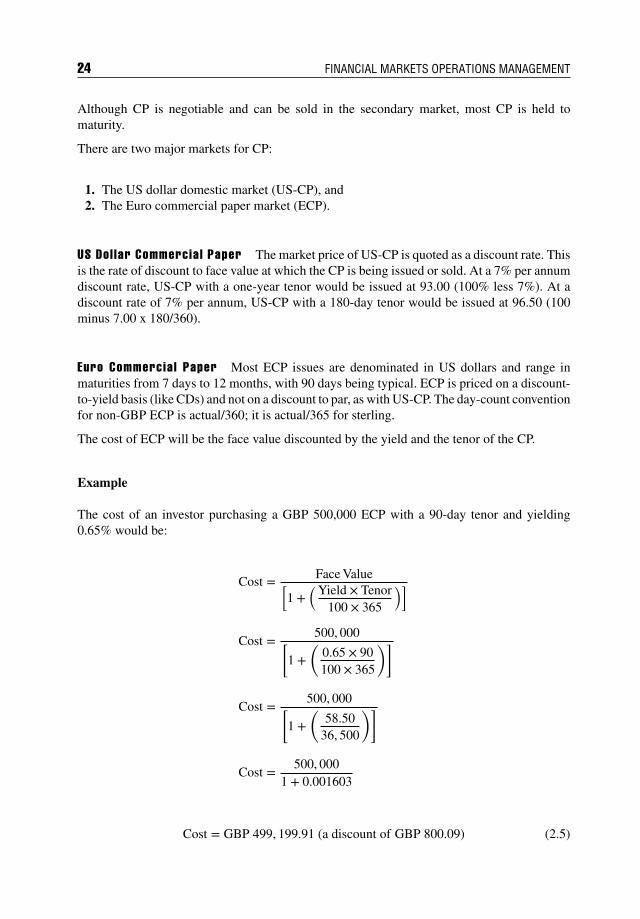
Euro Commercia l Paper Most ECP issues are denominated in US dollars and range inmaturities from 7 days to 12 months, with 90 days being typical. ECP is priced on a discount-to-yield basis (like CDs) and not on a discount to par, as with US-CP. The day-count conventionfor non-GBP ECP is actual/360; it is actual/365 for sterling.
The cost of ECP will be the face value discounted by the yield and the tenor of the CP.
Example
The cost of an investor purchasing a GBP 500,000 ECP with a 90-day tenor and yielding0.65% would be:
Cost = Face Value[1 +
(Yield × Tenor100 × 365
)]
Cost = 500, 000[1 +
(0.65 × 90100 × 365
)]
Cost = 500, 000[1 +
(58.50
36, 500
)]
Cost = 500, 0001 + 0.001603
Cost = GBP 499, 199.91 (a discount of GBP 800.09) (2.5)
Financial Instruments 25
2.3.4 Treasury Bi l ls
Treasury bills (T-bills) are issued and guaranteed by governments as part of their debt-financingactivities. T-bills are issued on a regular basis by auction with maturities out to 52 weeks andpriced at a discount from the face value.
T-bills are not interest-bearing, and the difference between the face value and the purchasecost represents the interest earned on the bill.
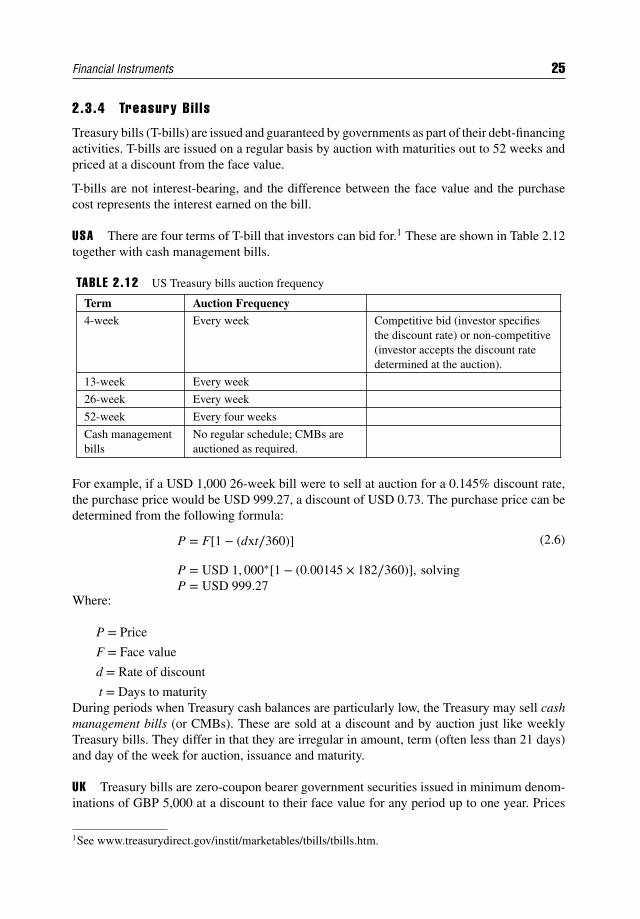
USA There are four terms of T-bill that investors can bid for.1 These are shown in Table 2.12together with cash management bills.
TABLE 2.12 US Treasury bills auction frequency
Term Auction Frequency
4-week Every week Competitive bid (investor specifiesthe discount rate) or non-competitive(investor accepts the discount ratedetermined at the auction).
13-week Every week
26-week Every week
52-week Every four weeks
Cash managementbills
No regular schedule; CMBs areauctioned as required.
For example, if a USD 1,000 26-week bill were to sell at auction for a 0.145% discount rate,the purchase price would be USD 999.27, a discount of USD 0.73. The purchase price can bedetermined from the following formula:
P = F[1 − (dxt∕360)]
P = USD 1, 000∗[1 − (0.00145 × 182∕360)], solvingP = USD 999.27
(2.6)
Where:
P = Price
F = Face value
d = Rate of discount
t = Days to maturityDuring periods when Treasury cash balances are particularly low, the Treasury may sell cashmanagement bills (or CMBs). These are sold at a discount and by auction just like weeklyTreasury bills. They differ in that they are irregular in amount, term (often less than 21 days)and day of the week for auction, issuance and maturity.
UK Treasury bills are zero-coupon bearer government securities issued in minimum denom-inations of GBP 5,000 at a discount to their face value for any period up to one year. Prices
1See www.treasurydirect.gov/instit/marketables/tbills/tbills.htm.
26 FINANCIAL MARKETS OPERATIONS MANAGEMENT
are based on a money market yield to maturity calculation priced around prevailing GeneralCollateral (GC) repo rates, adjusted by a spread reflecting recent Treasury bill tender resultsand, if applicable, any specific supply and demand factors.
Although they are usually issued for 3 months (91 days), they have occasionally been issuedfor 28 days, 63 days and 182 days.
They are issued:
By allotment to the highest bidder at a weekly (Friday) tender to a range of counterparties; In response to an invitation from the Debt Management Office2 to a range of
counterparties; At any time to government departments (non-marketable bills only).
The secondary market in Treasury bills has, in recent years, become illiquid and representativerates are no longer obtainable other than those for the most recently issued 91-day bills.
2.4 DEBT INSTRUMENTS
Now that we have seen the money market instruments and noted that the tenor of theseinstruments tends to be at the short end with a maximum tenor of typically 12 months, we willturn our attention to the capital markets by looking at the various debt instruments. The word“debt” simply means “loan” and loans can be subdivided into three types:
1. A bilateral loan is where, for example, a customer borrows cash from its bank.2. A syndicated loan is where a corporate customer borrows not from one bank but from a
group of banks.3. A securitised loan is represented by the issuance of a bond. This bond is divisible into
smaller portions of the total loan and can be bought and sold by other investors.
It is the third type of loan that we are interested in; we will not be covering bilateral orsyndicated loans in this book.
2.4.1 A Bond Def ined
A bond is a security that represents the indebtedness of the issuer of the bond (i.e. theborrower) to the holder of the bond (i.e. the investor). The issuer has an obligation to serviceits indebtedness by paying interest on a regular basis and repaying the debt when it falls due.
It should be noted that the holders of bonds do not have any voting interest in the issue unlessthe situation arises where the issuer is in a distress situation and is unable to service the debt.Bondholders are creditors to the issuer and rank senior to investors who own shares in theissuer.
2The UK Debt Management Office (DMO) is responsible for government wholesale sterling debtissuance.
Financial Instruments 27
2.4.2 Bond Issuance
Bonds can be issued by a variety of entities including:
Governments and government agencies; Sovereign states; Corporations; Supranational institutions; Public authorities.
Government bonds tend to be issued through an auction process. Depending on the market,either market makers only can bid for these bonds through a competitive process or marketmakers can bid competitively along with other investors who can bid non-competitively.
By contrast, other types of bonds can be issued through an underwriting process where asyndicate of banks and securities houses buys the issue of bonds and sells them to otherinvestors. A smaller group within the syndicate, known as book runners, will act as adviser tothe issuer and arranger of the bond with direct links to the syndicate and other investors.
With government bond issuance, under the auction process, potential investors will bid for thebonds and will either be successful or not. The difference from the other types of bonds, whichare syndicated, is that the book runners take the risk of the whole issue onto their books untilsuch time as they can sell the bonds to other investors.
We refer to this activity as bond issuance in the primary markets; once the bond has beenissued (and the issuer has received the cash) it automatically goes into the secondary marketsuntil such time as the bond is repaid. So the primary markets are for the new issuance of bondsand the secondary markets for the subsequent trading and investment activities.
2.4.3 Types and Features of Bonds
There are various ways to categorise bonds, including:
Domicile Interest rate Maturity.
Domic i le From the point of view of the issuer, bonds can be issued either in their domesticcurrency or in a foreign currency. We can classify these bonds into one of three types:
Domestic bonds: These are bonds issued in the country of the issuer, the currency of theissuer and using a syndicate of domestic banks and investors.
Foreign bonds: These are international bond issues underwritten by a syndicate of banksprimarily from one country, denominated in that country’s currency and sold principallyin that country. The issue, however, is domiciled outside of that country. For example, ifthe European Investment Bank wishes to raise US dollars in New York, the issue will becalled a foreign dollar bond. Foreign bonds are usually referred to in terms of some localcharacteristic, for example, a US-dollar-denominated bond issued by a non-US entity in
28 FINANCIAL MARKETS OPERATIONS MANAGEMENT
the US market is referred to as a Yankee bond. Other foreign bonds include Samurai(Japan), Bulldog (UK) and Matrioshka (Russia) to name but a few.
Eurobonds: Like foreign bonds, Eurobonds are international bond issues, but they differfrom other types of international bonds, in that they are underwritten by an internationalsyndicate of commercial and investment banks and they are sold principally in countriesother than the country of the currency in which they are denominated. For example, if theEuropean Investment Bank wishes to raise dollars outside of the USA, the issue will beunderwritten by the international syndicate of banks and will be sold on initial distributionin countries outside of the USA. From an investor’s point of view, the differences betweenEurobonds and foreign bonds are largely technical. The main differences relate to thecomposition of the underwriting syndicates and the selling features.
Interest Rate Also known as a coupon, this is the rate of interest that the issuer paysto the bondholder. The term “coupon” refers to the fact that when bonds are in paper form(certificated), the bondholder has to remove (or “clip”) a coupon from the bond certificate andpresent it to the appropriate paying agent in order to receive the interest. Depending on thetype of bond, coupons are usually paid on a semi-annual or annual basis.
When the bond is issued, the coupon rate can be set at a rate that will not change duringthe life of the bond. This is a fixed-interest bond. Conversely, there are bonds where thecoupon rate changes periodically. These are floating-rate bonds. The most common type is afloating-rate note (FRN), which usually pays coupons on a semi-annual basis but can also payquarterly.
Maturity This refers to the date on which the issuer is obliged to repay the principalamount. Bonds, which are long-term securities, typically have maturities greater than sevenyears. Traditionally, most bonds have a term in the 25- to 30-year period, but there are bondswhich have been issued with 50 years’ maturity and there are even some bonds issued with nomaturity at all. These are known as undated, perpetual or irredeemable bonds.
2.4.4 Other Key Characterist ics of Bonds Principal: This is the amount on which the issuer pays interest and repays the loan at the
end of the term. Repayment is usually the principal amount (at par). The term “principal”is synonymous with the terms nominal, par value and face amount; please note that theprincipal amount is not the same as the market value; we will look at this in more detaillater on.
Yield: The yield is the rate of return received from investing in a bond. There are twotypes of yield: current yield (running yield) – this is the annual interest payment divided by the current
market price of the bond; yield to maturity (redemption yield) – in addition to the current market price, this yield
also takes into account the amount and timing of all remaining coupon payments andthe length of time to maturity.
Market price: The market price of a bond is quoted in percentage terms and is calculatedby considering all future cash flows (i.e. coupon payments and maturity payment) and
Financial Instruments 29
converting them into a net present value (NPV). This NPV is the market price of the bond.Whilst the market price is, in fact, a percentage, it is quoted as a number to four decimalplaces.
For example, the UK Treasury 4.5% 2042 bond has a price of 115.4500 and a yield toredemption of 3.64%. You will notice that whilst this bond pays a coupon of 4.5% per annum,the yield is only 3.64%. This is because the price is above par (i.e. 115.4500) and has the effectof reducing the impact of the interest rate. We will look at this relationship between yield andprice in more detail in Section 2.4.8.
2.4.5 Types of Bond
There are many types of bond, but we will concentrate on some of the major types. Thedescriptions that you will see below are not mutually exclusive and any particular bond mighthave more than one type associated with it.
Fixed-rate bonds: The interest rate is set when the bonds are first issued and stays thesame throughout the life of the bond. (Please note that the term “coupon” is synonymouswith the term “interest”.)
Example
GE Capital 5.00% USD bond due January 2016. This bond will pay a coupon of 5% per annumfrom the time it was issued up until January 2016, when the bond will be repaid.
Floating-rate notes (FRNs): The interest rate varies periodically and is linked to areference rate of interest such as LIBOR or EURIBOR. Depending on the creditworthinessof the issuer, the bond might also have an additional margin, for example the coupon ratemight be fixed linked to six-month LIBOR plus 0.15%. In this particular case, the interestrate would be recalculated (re-fixed) every six months.
Example
ENEL USD FRN (6L+15) due 15 May 2024. With this FRN, on 15 May and 15 November(and every year until May 2024), the previous coupon is paid and the next coupon is fixed.If, for example, in May the six-month USD LIBOR rate is 0.3734%, then the coupon will be0.5234% per annum for the next six months (i.e. 0.3734% + 0.15%). In the November, thecoupon of 0.5234% p.a. will be paid, covering the six-month period, and the next coupon fromNovember to May will be fixed.
Zero-coupon bonds: These bonds do not carry any coupon and are issued at a substantialdiscount to par value. For example, if a zero-coupon bond is issued at a price of 80%, itwill be repaid at par (i.e. 100%). The gain of 20% is treated as interest rather than capitalfor tax purposes.
High-yield bonds: So-called because these bonds earn a higher yield due to the fact thatthey are rated below investment grade by the credit-rating agencies.
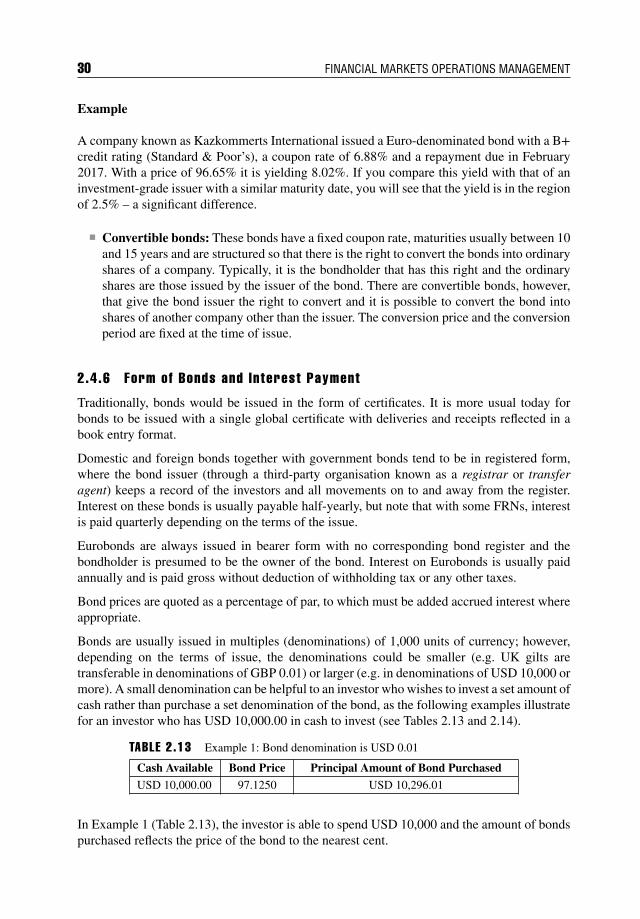
30 FINANCIAL MARKETS OPERATIONS MANAGEMENT
Example
A company known as Kazkommerts International issued a Euro-denominated bond with a B+credit rating (Standard & Poor’s), a coupon rate of 6.88% and a repayment due in February2017. With a price of 96.65% it is yielding 8.02%. If you compare this yield with that of aninvestment-grade issuer with a similar maturity date, you will see that the yield is in the regionof 2.5% – a significant difference.
Convertible bonds: These bonds have a fixed coupon rate, maturities usually between 10and 15 years and are structured so that there is the right to convert the bonds into ordinaryshares of a company. Typically, it is the bondholder that has this right and the ordinaryshares are those issued by the issuer of the bond. There are convertible bonds, however,that give the bond issuer the right to convert and it is possible to convert the bond intoshares of another company other than the issuer. The conversion price and the conversionperiod are fixed at the time of issue.
2.4.6 Form of Bonds and Interest Payment
Traditionally, bonds would be issued in the form of certificates. It is more usual today forbonds to be issued with a single global certificate with deliveries and receipts reflected in abook entry format.
Domestic and foreign bonds together with government bonds tend to be in registered form,where the bond issuer (through a third-party organisation known as a registrar or transferagent) keeps a record of the investors and all movements on to and away from the register.Interest on these bonds is usually payable half-yearly, but note that with some FRNs, interestis paid quarterly depending on the terms of the issue.
Eurobonds are always issued in bearer form with no corresponding bond register and thebondholder is presumed to be the owner of the bond. Interest on Eurobonds is usually paidannually and is paid gross without deduction of withholding tax or any other taxes.
Bond prices are quoted as a percentage of par, to which must be added accrued interest whereappropriate.
Bonds are usually issued in multiples (denominations) of 1,000 units of currency; however,depending on the terms of issue, the denominations could be smaller (e.g. UK gilts aretransferable in denominations of GBP 0.01) or larger (e.g. in denominations of USD 10,000 ormore). A small denomination can be helpful to an investor who wishes to invest a set amount ofcash rather than purchase a set denomination of the bond, as the following examples illustratefor an investor who has USD 10,000.00 in cash to invest (see Tables 2.13 and 2.14).
TABLE 2.13 Example 1: Bond denomination is USD 0.01
Cash Available Bond Price Principal Amount of Bond PurchasedUSD 10,000.00 97.1250 USD 10,296.01
In Example 1 (Table 2.13), the investor is able to spend USD 10,000 and the amount of bondspurchased reflects the price of the bond to the nearest cent.
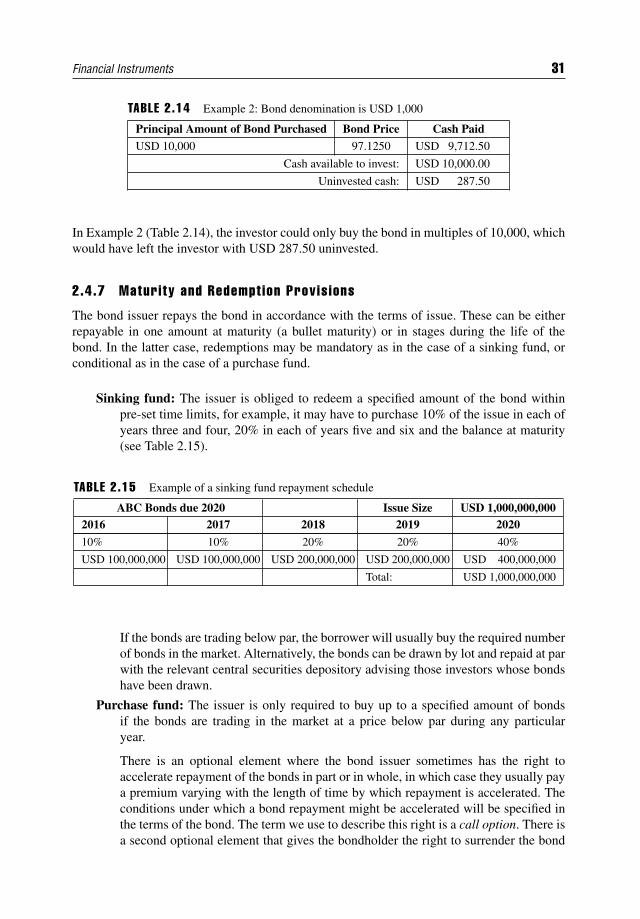
Financial Instruments 31
TABLE 2.14 Example 2: Bond denomination is USD 1,000
Principal Amount of Bond Purchased Bond Price Cash PaidUSD 10,000 97.1250 USD 9,712.50
Cash available to invest: USD 10,000.00
Uninvested cash: USD 287.50
In Example 2 (Table 2.14), the investor could only buy the bond in multiples of 10,000, whichwould have left the investor with USD 287.50 uninvested.
2.4.7 Maturity and Redempt ion Provis ions
The bond issuer repays the bond in accordance with the terms of issue. These can be eitherrepayable in one amount at maturity (a bullet maturity) or in stages during the life of thebond. In the latter case, redemptions may be mandatory as in the case of a sinking fund, orconditional as in the case of a purchase fund.
Sinking fund: The issuer is obliged to redeem a specified amount of the bond withinpre-set time limits, for example, it may have to purchase 10% of the issue in each ofyears three and four, 20% in each of years five and six and the balance at maturity(see Table 2.15).
TABLE 2.15 Example of a sinking fund repayment schedule
ABC Bonds due 2020 Issue Size USD 1,000,000,0002016 2017 2018 2019 2020
10% 10% 20% 20% 40%
USD 100,000,000 USD 100,000,000 USD 200,000,000 USD 200,000,000 USD 400,000,000
Total: USD 1,000,000,000
If the bonds are trading below par, the borrower will usually buy the required numberof bonds in the market. Alternatively, the bonds can be drawn by lot and repaid at parwith the relevant central securities depository advising those investors whose bondshave been drawn.
Purchase fund: The issuer is only required to buy up to a specified amount of bondsif the bonds are trading in the market at a price below par during any particularyear.
There is an optional element where the bond issuer sometimes has the right toaccelerate repayment of the bonds in part or in whole, in which case they usually paya premium varying with the length of time by which repayment is accelerated. Theconditions under which a bond repayment might be accelerated will be specified inthe terms of the bond. The term we use to describe this right is a call option. There isa second optional element that gives the bondholder the right to surrender the bond
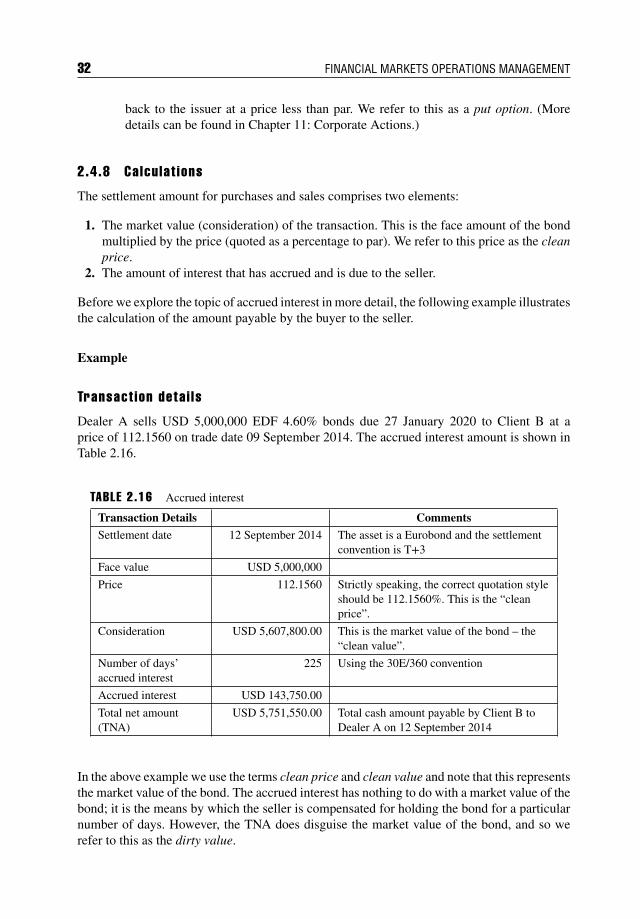
32 FINANCIAL MARKETS OPERATIONS MANAGEMENT
back to the issuer at a price less than par. We refer to this as a put option. (Moredetails can be found in Chapter 11: Corporate Actions.)
2.4.8 Calcu lat ions
The settlement amount for purchases and sales comprises two elements:
1. The market value (consideration) of the transaction. This is the face amount of the bondmultiplied by the price (quoted as a percentage to par). We refer to this price as the cleanprice.
2. The amount of interest that has accrued and is due to the seller.
Before we explore the topic of accrued interest in more detail, the following example illustratesthe calculation of the amount payable by the buyer to the seller.
Example
Transact ion deta i ls
Dealer A sells USD 5,000,000 EDF 4.60% bonds due 27 January 2020 to Client B at aprice of 112.1560 on trade date 09 September 2014. The accrued interest amount is shown inTable 2.16.
TABLE 2.16 Accrued interest
Transaction Details Comments
Settlement date 12 September 2014 The asset is a Eurobond and the settlementconvention is T+3
Face value USD 5,000,000
Price 112.1560 Strictly speaking, the correct quotation styleshould be 112.1560%. This is the “cleanprice”.
Consideration USD 5,607,800.00 This is the market value of the bond – the“clean value”.
Number of days’accrued interest
225 Using the 30E/360 convention
Accrued interest USD 143,750.00
Total net amount(TNA)
USD 5,751,550.00 Total cash amount payable by Client B toDealer A on 12 September 2014
In the above example we use the terms clean price and clean value and note that this representsthe market value of the bond. The accrued interest has nothing to do with a market value of thebond; it is the means by which the seller is compensated for holding the bond for a particularnumber of days. However, the TNA does disguise the market value of the bond, and so werefer to this as the dirty value.
Financial Instruments 33
Q&A
Quest ion
What do you think the dirty price of this bond is?
Answer
The dirty price is 115.0310 (divide the TNA USD 5,751,550.00 by the face value USD5,000,000 as a percentage).
Market convention is that bonds are traded using the clean price. It is the Settlements Depart-ment’s job to calculate the correct amount of accrued interest and to apply it to the transaction.
2.4.9 Accrued Interest
Issuers pay interest on their bonds in accordance with the terms of the issue and this can beannually (e.g. Eurobonds), semi-annually (e.g. government bonds) or, more rarely, quarterly(e.g. FRNs).
Take the example of the EDF bond traded above. Recall that we were talking about a Eurobond,which pays interest annually. We can tell on which date the interest is paid because it willcoincide with the day and month shown in the maturity date (i.e. annually every 27 January).Although we do not know when Dealer A originally purchased the bond, we make theassumption that Dealer A has held the bond since the last coupon was paid. For this particulartransaction, we can say that the last coupon payment date was 27 January 2014 (and the nextcoupon payment date will be 27 January 2015).
During the period from 27 January 2014 update until the above transaction was due to settle,Dealer A was entitled to benefit from the interest that was accruing on the bond. In the exampleabove, this amounted to 225 days.
Q&A
Quest ion
Do you agree with this figure? Please attempt the calculation making a note of how youarrived at your figure.
Answer
The correct answer for this particular type of bond is 225 days. This might appearcounter-intuitive if you are new to the concept of accrued interest. The difficulty is that
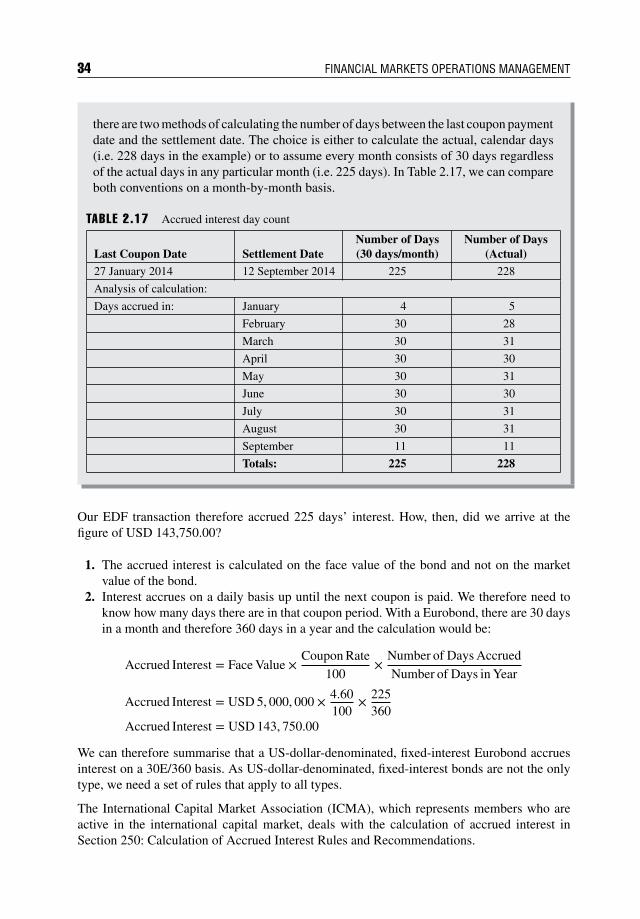
34 FINANCIAL MARKETS OPERATIONS MANAGEMENT
there are two methods of calculating the number of days between the last coupon paymentdate and the settlement date. The choice is either to calculate the actual, calendar days(i.e. 228 days in the example) or to assume every month consists of 30 days regardlessof the actual days in any particular month (i.e. 225 days). In Table 2.17, we can compareboth conventions on a month-by-month basis.
TABLE 2.17 Accrued interest day count
Last Coupon Date Settlement DateNumber of Days(30 days/month)
Number of Days(Actual)
27 January 2014 12 September 2014 225 228
Analysis of calculation:
Days accrued in: January 4 5
February 30 28
March 30 31
April 30 30
May 30 31
June 30 30
July 30 31
August 30 31
September 11 11
Totals: 225 228
Our EDF transaction therefore accrued 225 days’ interest. How, then, did we arrive at thefigure of USD 143,750.00?
1. The accrued interest is calculated on the face value of the bond and not on the marketvalue of the bond.
2. Interest accrues on a daily basis up until the next coupon is paid. We therefore need toknow how many days there are in that coupon period. With a Eurobond, there are 30 daysin a month and therefore 360 days in a year and the calculation would be:
Accrued Interest = Face Value ×Coupon Rate
100×
Number of Days Accrued
Number of Days in Year
Accrued Interest = USD 5, 000, 000 × 4.60100
× 225360
Accrued Interest = USD 143, 750.00
We can therefore summarise that a US-dollar-denominated, fixed-interest Eurobond accruesinterest on a 30E/360 basis. As US-dollar-denominated, fixed-interest bonds are not the onlytype, we need a set of rules that apply to all types.
The International Capital Market Association (ICMA), which represents members who areactive in the international capital market, deals with the calculation of accrued interest inSection 250: Calculation of Accrued Interest Rules and Recommendations.
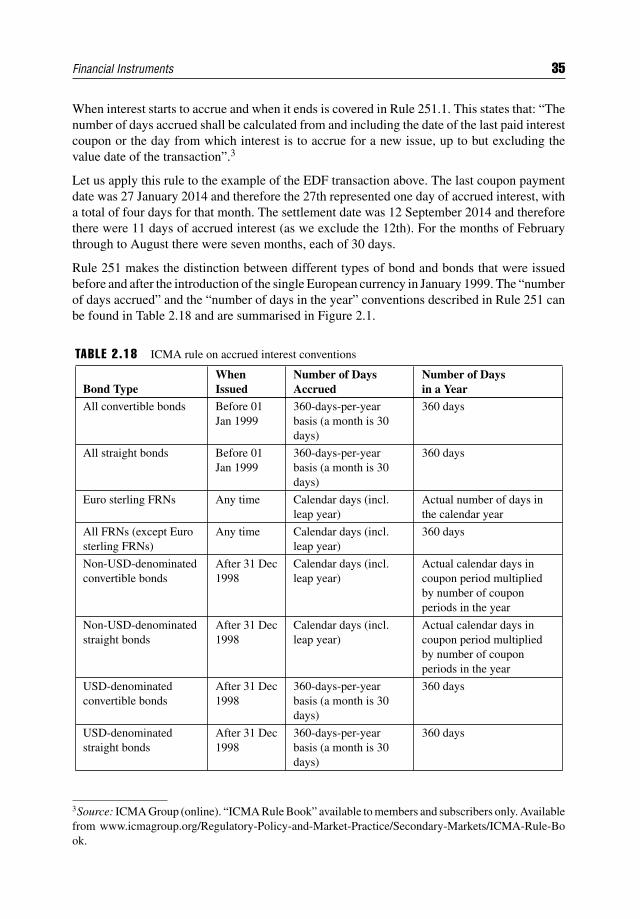
Financial Instruments 35
When interest starts to accrue and when it ends is covered in Rule 251.1. This states that: “Thenumber of days accrued shall be calculated from and including the date of the last paid interestcoupon or the day from which interest is to accrue for a new issue, up to but excluding thevalue date of the transaction”.3
Let us apply this rule to the example of the EDF transaction above. The last coupon paymentdate was 27 January 2014 and therefore the 27th represented one day of accrued interest, witha total of four days for that month. The settlement date was 12 September 2014 and thereforethere were 11 days of accrued interest (as we exclude the 12th). For the months of Februarythrough to August there were seven months, each of 30 days.
Rule 251 makes the distinction between different types of bond and bonds that were issuedbefore and after the introduction of the single European currency in January 1999. The “numberof days accrued” and the “number of days in the year” conventions described in Rule 251 canbe found in Table 2.18 and are summarised in Figure 2.1.
TABLE 2.18 ICMA rule on accrued interest conventions
Bond TypeWhenIssued
Number of DaysAccrued
Number of Daysin a Year
All convertible bonds Before 01Jan 1999
360-days-per-yearbasis (a month is 30days)
360 days
All straight bonds Before 01Jan 1999
360-days-per-yearbasis (a month is 30days)
360 days
Euro sterling FRNs Any time Calendar days (incl.leap year)
Actual number of days inthe calendar year
All FRNs (except Eurosterling FRNs)
Any time Calendar days (incl.leap year)
360 days
Non-USD-denominatedconvertible bonds
After 31 Dec1998
Calendar days (incl.leap year)
Actual calendar days incoupon period multipliedby number of couponperiods in the year
Non-USD-denominatedstraight bonds
After 31 Dec1998
Calendar days (incl.leap year)
Actual calendar days incoupon period multipliedby number of couponperiods in the year
USD-denominatedconvertible bonds
After 31 Dec1998
360-days-per-yearbasis (a month is 30days)
360 days
USD-denominatedstraight bonds
After 31 Dec1998
360-days-per-yearbasis (a month is 30days)
360 days
3Source: ICMA Group (online). “ICMA Rule Book” available to members and subscribers only. Availablefrom www.icmagroup.org/Regulatory-Policy-and-Market-Practice/Secondary-Markets/ICMA-Rule-Book.
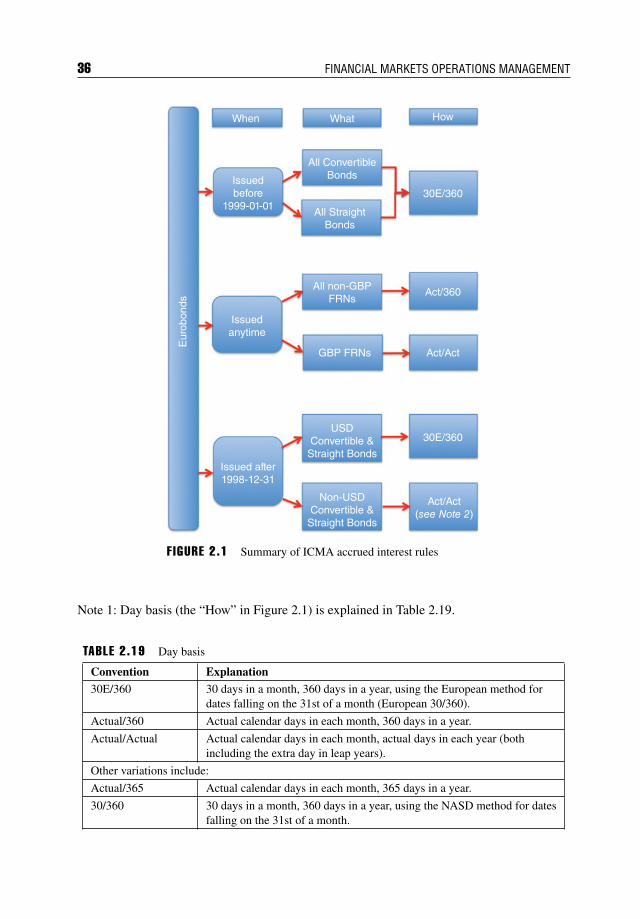
36 FINANCIAL MARKETS OPERATIONS MANAGEMENT
When
Issuedbefore
1999-01-01All Straight
Bonds
30E/360
All ConvertibleBonds
All non-GBPFRNs
Act/360
Act/ActGBP FRNs
Eur
obon
ds
USDConvertible &
Straight BondsIssued after1998-12-31
Non-USDConvertible &
Straight Bonds
30E/360
Act/Act(see Note 2)
Issuedanytime
What How
F IGURE 2.1 Summary of ICMA accrued interest rules
Note 1: Day basis (the “How” in Figure 2.1) is explained in Table 2.19.
TABLE 2.19 Day basis
Convention Explanation30E/360 30 days in a month, 360 days in a year, using the European method for
dates falling on the 31st of a month (European 30/360).
Actual/360 Actual calendar days in each month, 360 days in a year.
Actual/Actual Actual calendar days in each month, actual days in each year (bothincluding the extra day in leap years).
Other variations include:
Actual/365 Actual calendar days in each month, 365 days in a year.
30/360 30 days in a month, 360 days in a year, using the NASD method for datesfalling on the 31st of a month.
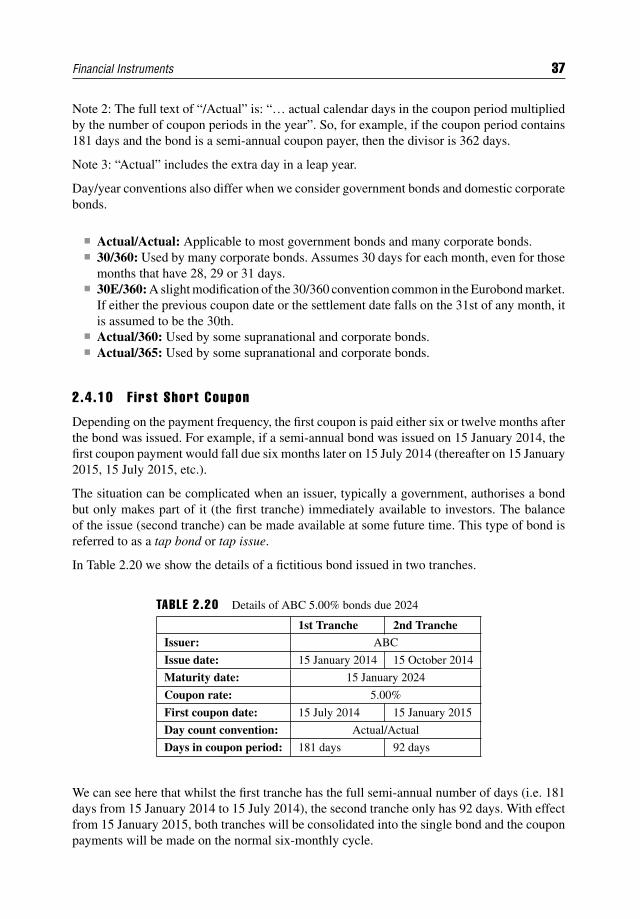
Financial Instruments 37
Note 2: The full text of “/Actual” is: “… actual calendar days in the coupon period multipliedby the number of coupon periods in the year”. So, for example, if the coupon period contains181 days and the bond is a semi-annual coupon payer, then the divisor is 362 days.
Note 3: “Actual” includes the extra day in a leap year.
Day/year conventions also differ when we consider government bonds and domestic corporatebonds.
Actual/Actual: Applicable to most government bonds and many corporate bonds. 30/360: Used by many corporate bonds. Assumes 30 days for each month, even for those
months that have 28, 29 or 31 days. 30E/360: A slight modification of the 30/360 convention common in the Eurobond market.
If either the previous coupon date or the settlement date falls on the 31st of any month, itis assumed to be the 30th.
Actual/360: Used by some supranational and corporate bonds. Actual/365: Used by some supranational and corporate bonds.
2.4.10 F irst Short Coupon
Depending on the payment frequency, the first coupon is paid either six or twelve months afterthe bond was issued. For example, if a semi-annual bond was issued on 15 January 2014, thefirst coupon payment would fall due six months later on 15 July 2014 (thereafter on 15 January2015, 15 July 2015, etc.).
The situation can be complicated when an issuer, typically a government, authorises a bondbut only makes part of it (the first tranche) immediately available to investors. The balanceof the issue (second tranche) can be made available at some future time. This type of bond isreferred to as a tap bond or tap issue.
In Table 2.20 we show the details of a fictitious bond issued in two tranches.
TABLE 2.20 Details of ABC 5.00% bonds due 2024
1st Tranche 2nd TrancheIssuer: ABC
Issue date: 15 January 2014 15 October 2014
Maturity date: 15 January 2024
Coupon rate: 5.00%
First coupon date: 15 July 2014 15 January 2015
Day count convention: Actual/Actual
Days in coupon period: 181 days 92 days
We can see here that whilst the first tranche has the full semi-annual number of days (i.e. 181days from 15 January 2014 to 15 July 2014), the second tranche only has 92 days. With effectfrom 15 January 2015, both tranches will be consolidated into the single bond and the couponpayments will be made on the normal six-monthly cycle.
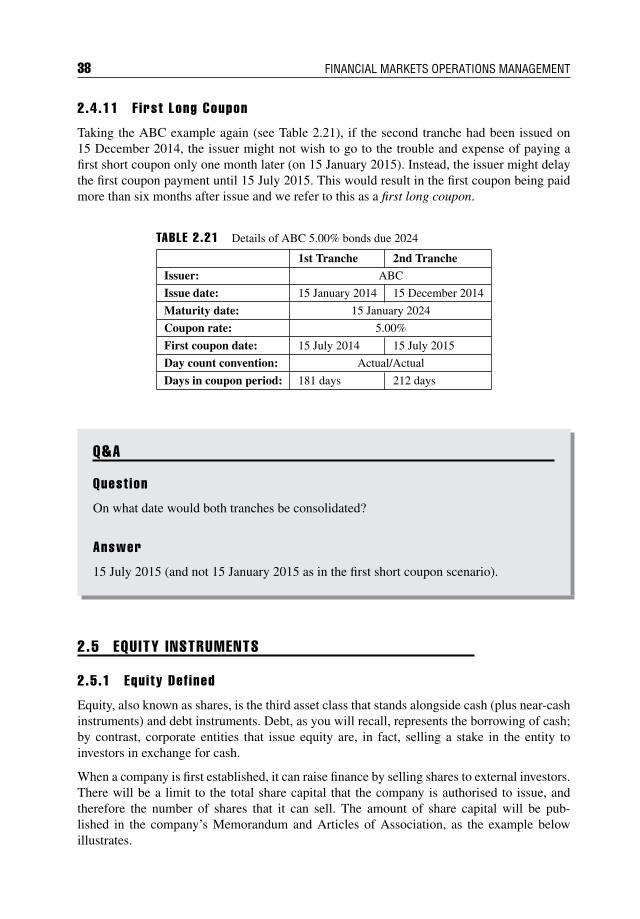
38 FINANCIAL MARKETS OPERATIONS MANAGEMENT
2.4.11 F irst Long Coupon
Taking the ABC example again (see Table 2.21), if the second tranche had been issued on15 December 2014, the issuer might not wish to go to the trouble and expense of paying afirst short coupon only one month later (on 15 January 2015). Instead, the issuer might delaythe first coupon payment until 15 July 2015. This would result in the first coupon being paidmore than six months after issue and we refer to this as a first long coupon.
TABLE 2.21 Details of ABC 5.00% bonds due 2024
1st Tranche 2nd Tranche
Issuer: ABC
Issue date: 15 January 2014 15 December 2014
Maturity date: 15 January 2024
Coupon rate: 5.00%
First coupon date: 15 July 2014 15 July 2015
Day count convention: Actual/Actual
Days in coupon period: 181 days 212 days
Q&A
Quest ion
On what date would both tranches be consolidated?
Answer
15 July 2015 (and not 15 January 2015 as in the first short coupon scenario).
2.5 EQUITY INSTRUMENTS
2.5.1 Equity Def ined
Equity, also known as shares, is the third asset class that stands alongside cash (plus near-cashinstruments) and debt instruments. Debt, as you will recall, represents the borrowing of cash;by contrast, corporate entities that issue equity are, in fact, selling a stake in the entity toinvestors in exchange for cash.
When a company is first established, it can raise finance by selling shares to external investors.There will be a limit to the total share capital that the company is authorised to issue, andtherefore the number of shares that it can sell. The amount of share capital will be pub-lished in the company’s Memorandum and Articles of Association, as the example belowillustrates.
Financial Instruments 39
ABC LIMITED SHARE CAPITAL
ABC Ltd has an authorised share capital of GBP 10 million.
The authorised share capital is subdivided into shares, each with a par value of 25p (i.e.40 million ordinary shares).
ABC Ltd is not obliged to issue all of the authorised share capital at once. It will issuesufficient shares to raise the expected amount of cash.
Q&A
Quest ion
Let us assume that the company’s advisers estimate that the company is worth GBP20 million. On that basis, how much would each of the 40 million shares be worth?
Answer
Each share would be worth 50p (GBP 20,000,000 ÷ 40,000,000 shares).
Q&A
Quest ion
If the company wishes to raise GBP 10 million in cash, it would not have to issue all theshares. How many shares would the company need to issue?
Answer
If each share is estimated to be worth 50p, then only 20 million shares need to be issued(20 million shares multiplied by 50p).
At the end of this share-issuing exercise, ABC Ltd would show the following position in itsfinancial reporting:
Authorised share capital GBP 10 million (40 million shares); Issued share capital GBP 5 million (20 million shares); Unissued share capital GBP 5 million (20 million shares).
We have used the term par value in this example. Par value represents the capital value of eachshare (as opposed to the market value). In the example above, ABC Ltd had decided that each
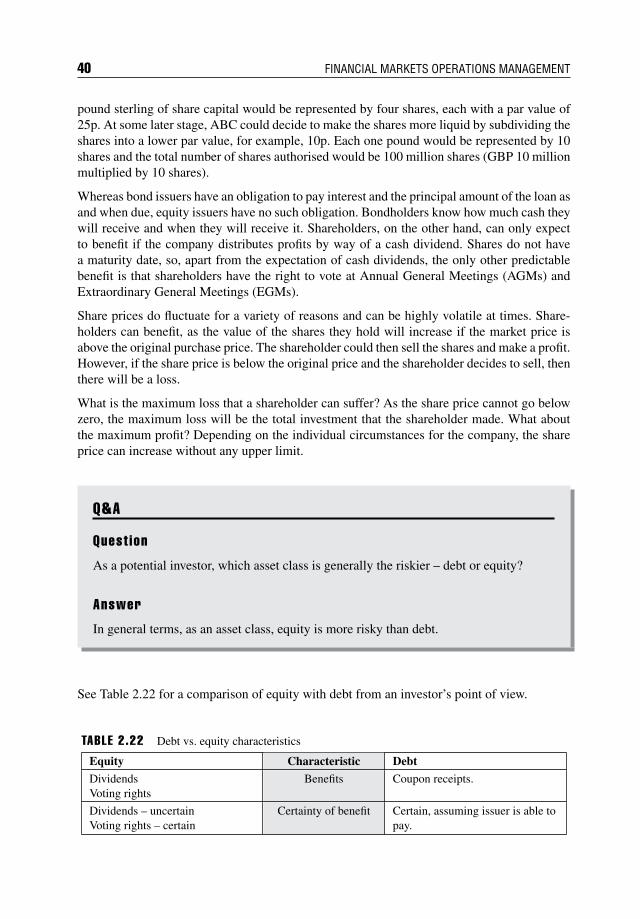
40 FINANCIAL MARKETS OPERATIONS MANAGEMENT
pound sterling of share capital would be represented by four shares, each with a par value of25p. At some later stage, ABC could decide to make the shares more liquid by subdividing theshares into a lower par value, for example, 10p. Each one pound would be represented by 10shares and the total number of shares authorised would be 100 million shares (GBP 10 millionmultiplied by 10 shares).
Whereas bond issuers have an obligation to pay interest and the principal amount of the loan asand when due, equity issuers have no such obligation. Bondholders know how much cash theywill receive and when they will receive it. Shareholders, on the other hand, can only expectto benefit if the company distributes profits by way of a cash dividend. Shares do not havea maturity date, so, apart from the expectation of cash dividends, the only other predictablebenefit is that shareholders have the right to vote at Annual General Meetings (AGMs) andExtraordinary General Meetings (EGMs).
Share prices do fluctuate for a variety of reasons and can be highly volatile at times. Share-holders can benefit, as the value of the shares they hold will increase if the market price isabove the original purchase price. The shareholder could then sell the shares and make a profit.However, if the share price is below the original price and the shareholder decides to sell, thenthere will be a loss.
What is the maximum loss that a shareholder can suffer? As the share price cannot go belowzero, the maximum loss will be the total investment that the shareholder made. What aboutthe maximum profit? Depending on the individual circumstances for the company, the shareprice can increase without any upper limit.
Q&A
Quest ion
As a potential investor, which asset class is generally the riskier – debt or equity?
Answer
In general terms, as an asset class, equity is more risky than debt.
See Table 2.22 for a comparison of equity with debt from an investor’s point of view.
TABLE 2.22 Debt vs. equity characteristics
Equity Characteristic Debt
DividendsVoting rights
Benefits Coupon receipts.
Dividends – uncertainVoting rights – certain
Certainty of benefit Certain, assuming issuer is able topay.
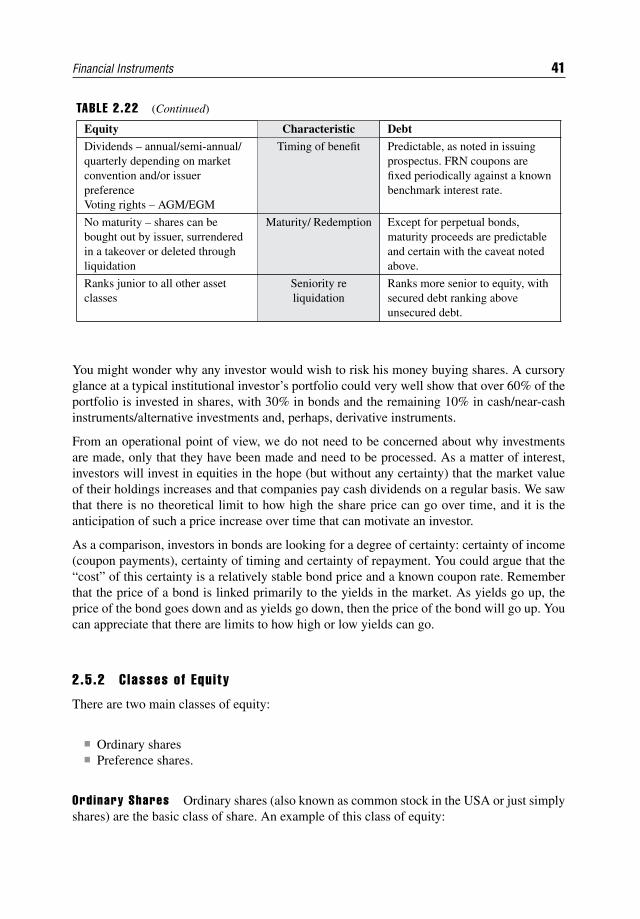
Financial Instruments 41
TABLE 2.22 (Continued)
Equity Characteristic Debt
Dividends – annual/semi-annual/quarterly depending on marketconvention and/or issuerpreferenceVoting rights – AGM/EGM
Timing of benefit Predictable, as noted in issuingprospectus. FRN coupons arefixed periodically against a knownbenchmark interest rate.
No maturity – shares can bebought out by issuer, surrenderedin a takeover or deleted throughliquidation
Maturity/ Redemption Except for perpetual bonds,maturity proceeds are predictableand certain with the caveat notedabove.
Ranks junior to all other assetclasses
Seniority reliquidation
Ranks more senior to equity, withsecured debt ranking aboveunsecured debt.
You might wonder why any investor would wish to risk his money buying shares. A cursoryglance at a typical institutional investor’s portfolio could very well show that over 60% of theportfolio is invested in shares, with 30% in bonds and the remaining 10% in cash/near-cashinstruments/alternative investments and, perhaps, derivative instruments.
From an operational point of view, we do not need to be concerned about why investmentsare made, only that they have been made and need to be processed. As a matter of interest,investors will invest in equities in the hope (but without any certainty) that the market valueof their holdings increases and that companies pay cash dividends on a regular basis. We sawthat there is no theoretical limit to how high the share price can go over time, and it is theanticipation of such a price increase over time that can motivate an investor.
As a comparison, investors in bonds are looking for a degree of certainty: certainty of income(coupon payments), certainty of timing and certainty of repayment. You could argue that the“cost” of this certainty is a relatively stable bond price and a known coupon rate. Rememberthat the price of a bond is linked primarily to the yields in the market. As yields go up, theprice of the bond goes down and as yields go down, then the price of the bond will go up. Youcan appreciate that there are limits to how high or low yields can go.
2.5.2 Classes of Equi ty
There are two main classes of equity:
Ordinary shares Preference shares.
Ordinary Shares Ordinary shares (also known as common stock in the USA or just simplyshares) are the basic class of share. An example of this class of equity:
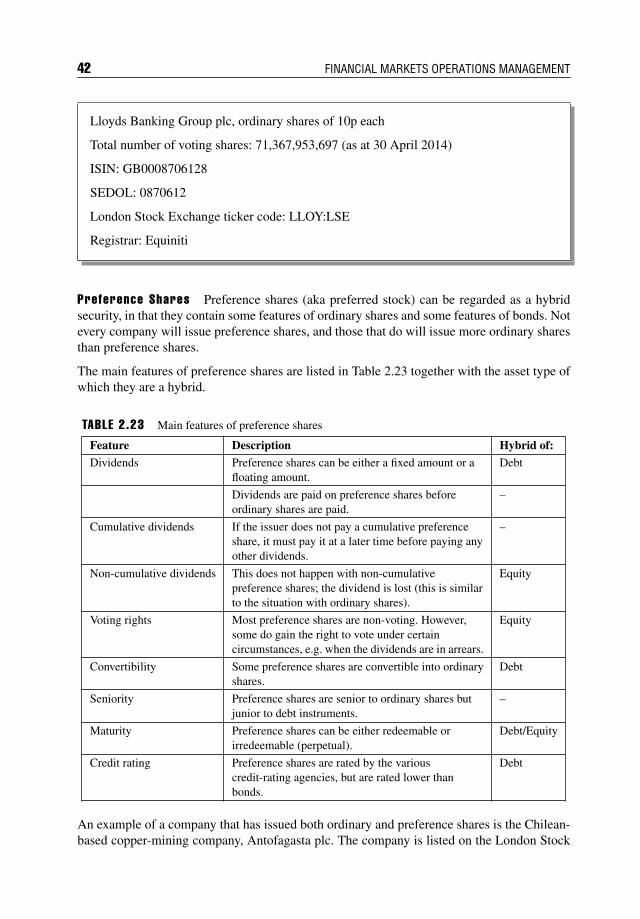
42 FINANCIAL MARKETS OPERATIONS MANAGEMENT
Lloyds Banking Group plc, ordinary shares of 10p each
Total number of voting shares: 71,367,953,697 (as at 30 April 2014)
ISIN: GB0008706128
SEDOL: 0870612
London Stock Exchange ticker code: LLOY:LSE
Registrar: Equiniti
Preference Shares Preference shares (aka preferred stock) can be regarded as a hybridsecurity, in that they contain some features of ordinary shares and some features of bonds. Notevery company will issue preference shares, and those that do will issue more ordinary sharesthan preference shares.
The main features of preference shares are listed in Table 2.23 together with the asset type ofwhich they are a hybrid.
TABLE 2.23 Main features of preference shares
Feature Description Hybrid of:
Dividends Preference shares can be either a fixed amount or afloating amount.
Debt
Dividends are paid on preference shares beforeordinary shares are paid.
–
Cumulative dividends If the issuer does not pay a cumulative preferenceshare, it must pay it at a later time before paying anyother dividends.
–
Non-cumulative dividends This does not happen with non-cumulativepreference shares; the dividend is lost (this is similarto the situation with ordinary shares).
Equity
Voting rights Most preference shares are non-voting. However,some do gain the right to vote under certaincircumstances, e.g. when the dividends are in arrears.
Equity
Convertibility Some preference shares are convertible into ordinaryshares.
Debt
Seniority Preference shares are senior to ordinary shares butjunior to debt instruments.
–
Maturity Preference shares can be either redeemable orirredeemable (perpetual).
Debt/Equity
Credit rating Preference shares are rated by the variouscredit-rating agencies, but are rated lower thanbonds.
Debt
An example of a company that has issued both ordinary and preference shares is the Chilean-based copper-mining company, Antofagasta plc. The company is listed on the London Stock
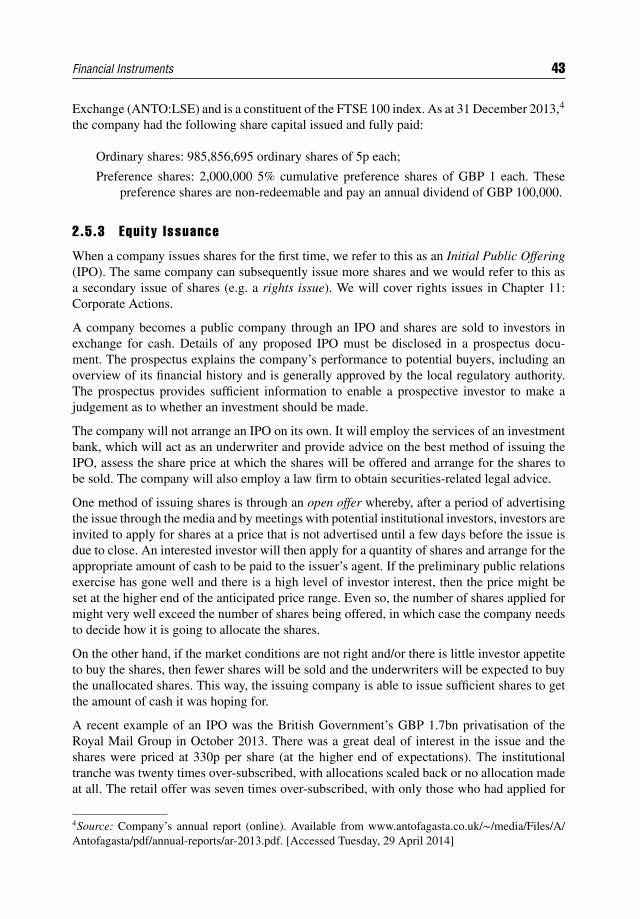
Financial Instruments 43
Exchange (ANTO:LSE) and is a constituent of the FTSE 100 index. As at 31 December 2013,4
the company had the following share capital issued and fully paid:
Ordinary shares: 985,856,695 ordinary shares of 5p each;
Preference shares: 2,000,000 5% cumulative preference shares of GBP 1 each. Thesepreference shares are non-redeemable and pay an annual dividend of GBP 100,000.
2.5.3 Equity Issuance
When a company issues shares for the first time, we refer to this as an Initial Public Offering(IPO). The same company can subsequently issue more shares and we would refer to this asa secondary issue of shares (e.g. a rights issue). We will cover rights issues in Chapter 11:Corporate Actions.
A company becomes a public company through an IPO and shares are sold to investors inexchange for cash. Details of any proposed IPO must be disclosed in a prospectus docu-ment. The prospectus explains the company’s performance to potential buyers, including anoverview of its financial history and is generally approved by the local regulatory authority.The prospectus provides sufficient information to enable a prospective investor to make ajudgement as to whether an investment should be made.
The company will not arrange an IPO on its own. It will employ the services of an investmentbank, which will act as an underwriter and provide advice on the best method of issuing theIPO, assess the share price at which the shares will be offered and arrange for the shares tobe sold. The company will also employ a law firm to obtain securities-related legal advice.
One method of issuing shares is through an open offer whereby, after a period of advertisingthe issue through the media and by meetings with potential institutional investors, investors areinvited to apply for shares at a price that is not advertised until a few days before the issue isdue to close. An interested investor will then apply for a quantity of shares and arrange for theappropriate amount of cash to be paid to the issuer’s agent. If the preliminary public relationsexercise has gone well and there is a high level of investor interest, then the price might beset at the higher end of the anticipated price range. Even so, the number of shares applied formight very well exceed the number of shares being offered, in which case the company needsto decide how it is going to allocate the shares.
On the other hand, if the market conditions are not right and/or there is little investor appetiteto buy the shares, then fewer shares will be sold and the underwriters will be expected to buythe unallocated shares. This way, the issuing company is able to issue sufficient shares to getthe amount of cash it was hoping for.
A recent example of an IPO was the British Government’s GBP 1.7bn privatisation of theRoyal Mail Group in October 2013. There was a great deal of interest in the issue and theshares were priced at 330p per share (at the higher end of expectations). The institutionaltranche was twenty times over-subscribed, with allocations scaled back or no allocation madeat all. The retail offer was seven times over-subscribed, with only those who had applied for
4Source: Company’s annual report (online). Available from www.antofagasta.co.uk/∼/media/Files/A/Antofagasta/pdf/annual-reports/ar-2013.pdf. [Accessed Tuesday, 29 April 2014]
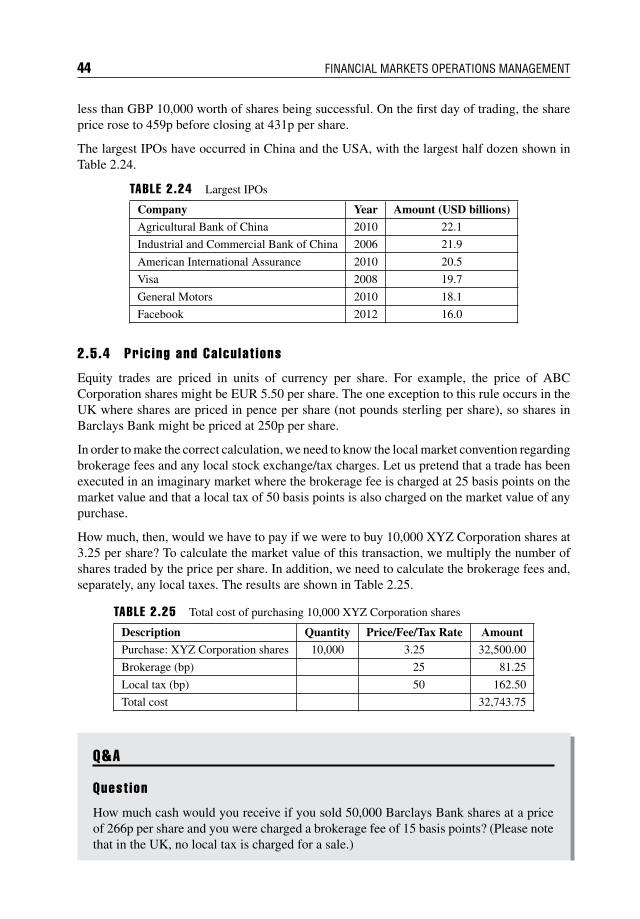
44 FINANCIAL MARKETS OPERATIONS MANAGEMENT
less than GBP 10,000 worth of shares being successful. On the first day of trading, the shareprice rose to 459p before closing at 431p per share.
The largest IPOs have occurred in China and the USA, with the largest half dozen shown inTable 2.24.
TABLE 2.24 Largest IPOs
Company Year Amount (USD billions)
Agricultural Bank of China 2010 22.1
Industrial and Commercial Bank of China 2006 21.9
American International Assurance 2010 20.5
Visa 2008 19.7
General Motors 2010 18.1
Facebook 2012 16.0
2.5.4 Pric ing and Calcu lat ions
Equity trades are priced in units of currency per share. For example, the price of ABCCorporation shares might be EUR 5.50 per share. The one exception to this rule occurs in theUK where shares are priced in pence per share (not pounds sterling per share), so shares inBarclays Bank might be priced at 250p per share.
In order to make the correct calculation, we need to know the local market convention regardingbrokerage fees and any local stock exchange/tax charges. Let us pretend that a trade has beenexecuted in an imaginary market where the brokerage fee is charged at 25 basis points on themarket value and that a local tax of 50 basis points is also charged on the market value of anypurchase.
How much, then, would we have to pay if we were to buy 10,000 XYZ Corporation shares at3.25 per share? To calculate the market value of this transaction, we multiply the number ofshares traded by the price per share. In addition, we need to calculate the brokerage fees and,separately, any local taxes. The results are shown in Table 2.25.
TABLE 2.25 Total cost of purchasing 10,000 XYZ Corporation shares
Description Quantity Price/Fee/Tax Rate Amount
Purchase: XYZ Corporation shares 10,000 3.25 32,500.00
Brokerage (bp) 25 81.25
Local tax (bp) 50 162.50
Total cost 32,743.75
Q&A
Quest ion
How much cash would you receive if you sold 50,000 Barclays Bank shares at a priceof 266p per share and you were charged a brokerage fee of 15 basis points? (Please notethat in the UK, no local tax is charged for a sale.)
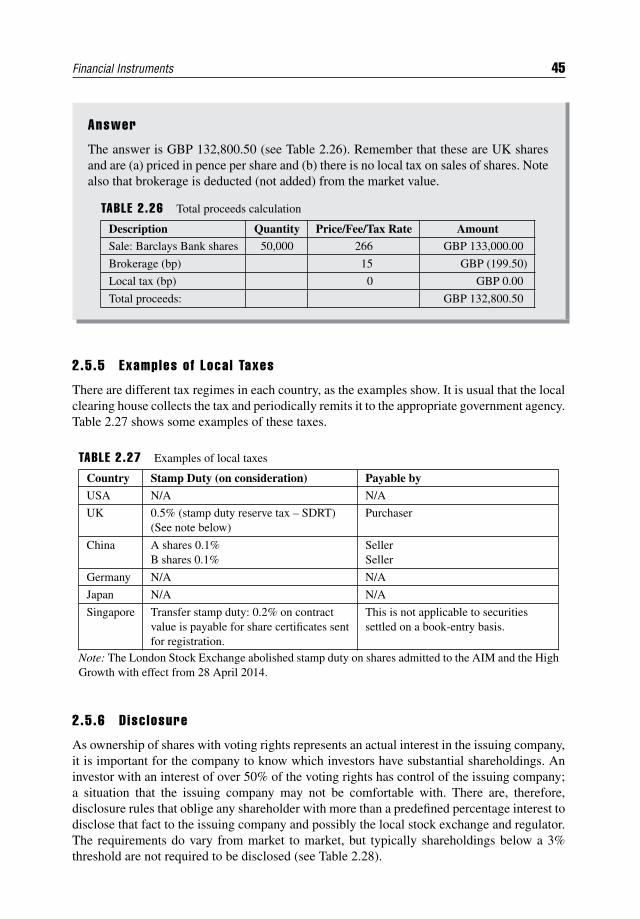
Financial Instruments 45
Answer
The answer is GBP 132,800.50 (see Table 2.26). Remember that these are UK sharesand are (a) priced in pence per share and (b) there is no local tax on sales of shares. Notealso that brokerage is deducted (not added) from the market value.
TABLE 2.26 Total proceeds calculation
Description Quantity Price/Fee/Tax Rate AmountSale: Barclays Bank shares 50,000 266 GBP 133,000.00
Brokerage (bp) 15 GBP (199.50)
Local tax (bp) 0 GBP 0.00
Total proceeds: GBP 132,800.50
2.5.5 Examples of Local Taxes
There are different tax regimes in each country, as the examples show. It is usual that the localclearing house collects the tax and periodically remits it to the appropriate government agency.Table 2.27 shows some examples of these taxes.
TABLE 2.27 Examples of local taxes
Country Stamp Duty (on consideration) Payable by
USA N/A N/A
UK 0.5% (stamp duty reserve tax – SDRT)(See note below)
Purchaser
China A shares 0.1%B shares 0.1%
SellerSeller
Germany N/A N/A
Japan N/A N/A
Singapore Transfer stamp duty: 0.2% on contractvalue is payable for share certificates sentfor registration.
This is not applicable to securitiessettled on a book-entry basis.
Note: The London Stock Exchange abolished stamp duty on shares admitted to the AIM and the HighGrowth with effect from 28 April 2014.
2.5.6 Disc losure
As ownership of shares with voting rights represents an actual interest in the issuing company,it is important for the company to know which investors have substantial shareholdings. Aninvestor with an interest of over 50% of the voting rights has control of the issuing company;a situation that the issuing company may not be comfortable with. There are, therefore,disclosure rules that oblige any shareholder with more than a predefined percentage interest todisclose that fact to the issuing company and possibly the local stock exchange and regulator.The requirements do vary from market to market, but typically shareholdings below a 3%threshold are not required to be disclosed (see Table 2.28).
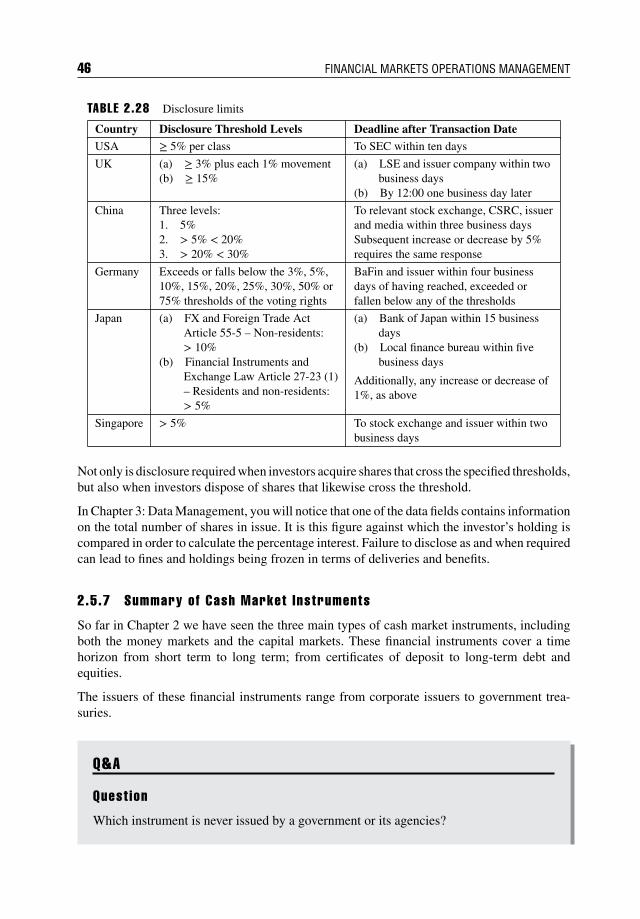
46 FINANCIAL MARKETS OPERATIONS MANAGEMENT
TABLE 2.28 Disclosure limits
Country Disclosure Threshold Levels Deadline after Transaction DateUSA ≥ 5% per class To SEC within ten days
UK (a) ≥ 3% plus each 1% movement(b) ≥ 15%
(a) LSE and issuer company within twobusiness days
(b) By 12:00 one business day later
China Three levels:1. 5%2. > 5% < 20%3. > 20% < 30%
To relevant stock exchange, CSRC, issuerand media within three business daysSubsequent increase or decrease by 5%requires the same response
Germany Exceeds or falls below the 3%, 5%,10%, 15%, 20%, 25%, 30%, 50% or75% thresholds of the voting rights
BaFin and issuer within four businessdays of having reached, exceeded orfallen below any of the thresholds
Japan (a) FX and Foreign Trade ActArticle 55-5 – Non-residents:> 10%
(b) Financial Instruments andExchange Law Article 27-23 (1)– Residents and non-residents:> 5%
(a) Bank of Japan within 15 businessdays
(b) Local finance bureau within fivebusiness days
Additionally, any increase or decrease of1%, as above
Singapore > 5% To stock exchange and issuer within twobusiness days
Not only is disclosure required when investors acquire shares that cross the specified thresholds,but also when investors dispose of shares that likewise cross the threshold.
In Chapter 3: Data Management, you will notice that one of the data fields contains informationon the total number of shares in issue. It is this figure against which the investor’s holding iscompared in order to calculate the percentage interest. Failure to disclose as and when requiredcan lead to fines and holdings being frozen in terms of deliveries and benefits.
2.5.7 Summary of Cash Market Instruments
So far in Chapter 2 we have seen the three main types of cash market instruments, includingboth the money markets and the capital markets. These financial instruments cover a timehorizon from short term to long term; from certificates of deposit to long-term debt andequities.
The issuers of these financial instruments range from corporate issuers to government trea-suries.
Q&A
Quest ion
Which instrument is never issued by a government or its agencies?
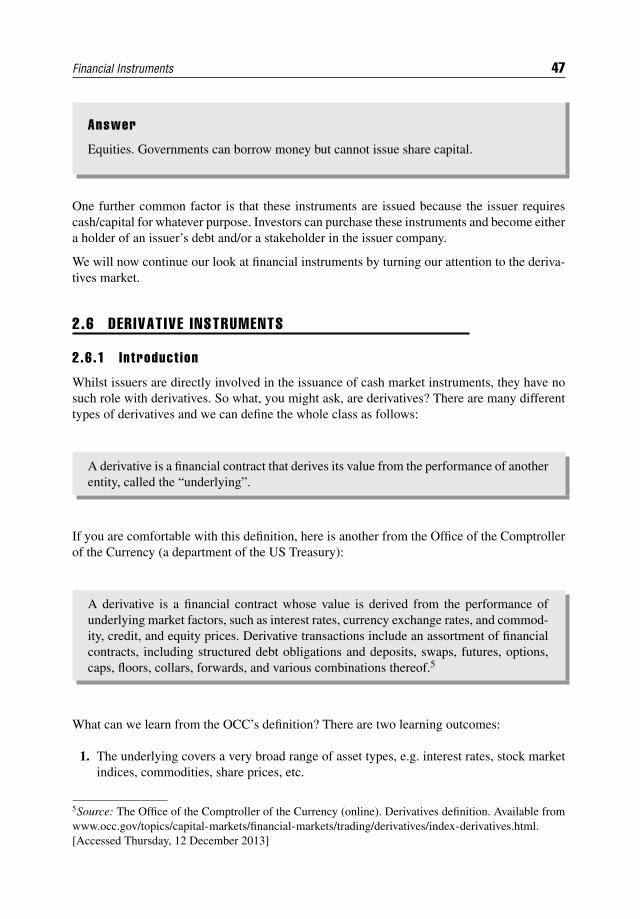
Financial Instruments 47
Answer
Equities. Governments can borrow money but cannot issue share capital.
One further common factor is that these instruments are issued because the issuer requirescash/capital for whatever purpose. Investors can purchase these instruments and become eithera holder of an issuer’s debt and/or a stakeholder in the issuer company.
We will now continue our look at financial instruments by turning our attention to the deriva-tives market.
2.6 DERIVATIVE INSTRUMENTS
2.6.1 Introduct ion
Whilst issuers are directly involved in the issuance of cash market instruments, they have nosuch role with derivatives. So what, you might ask, are derivatives? There are many differenttypes of derivatives and we can define the whole class as follows:
A derivative is a financial contract that derives its value from the performance of anotherentity, called the “underlying”.
If you are comfortable with this definition, here is another from the Office of the Comptrollerof the Currency (a department of the US Treasury):
A derivative is a financial contract whose value is derived from the performance ofunderlying market factors, such as interest rates, currency exchange rates, and commod-ity, credit, and equity prices. Derivative transactions include an assortment of financialcontracts, including structured debt obligations and deposits, swaps, futures, options,caps, floors, collars, forwards, and various combinations thereof.5
What can we learn from the OCC’s definition? There are two learning outcomes:
1. The underlying covers a very broad range of asset types, e.g. interest rates, stock marketindices, commodities, share prices, etc.
5Source: The Office of the Comptroller of the Currency (online). Derivatives definition. Available fromwww.occ.gov/topics/capital-markets/financial-markets/trading/derivatives/index-derivatives.html.[Accessed Thursday, 12 December 2013]
48 FINANCIAL MARKETS OPERATIONS MANAGEMENT
2. Derivative transactions fall into four types: Forwards Futures Options Swaps.
We can also differentiate derivatives in further ways. Firstly, there are types of derivativeproduct that are constructed by an exchange, traded on the exchange and cleared by a centralclearing system. We refer to these as exchange-traded derivatives.
Secondly, there are other types of derivative product that are constructed by financial entitiessuch as banks and traded away from an exchange between the buyer and the seller. We referto these as Over-The-Counter (OTC) derivatives.
Not only are OTC derivatives traded between buyer and seller, but all the post-trade activitiesalso take place between the buyer and the seller, i.e. no central clearing system is involved.This situation is changing, with many of the more straightforward OTC contracts being clearedcentrally and the more exotic OTC contracts yet to be decided.
It is not possible in this book to look at every single derivative product; we will, however, lookat one or two examples of ETDs and OTCs. It is sufficient for you to be able to define the fourmain types of derivatives and understand the prime reasons for using them.
2.6.2 Def in i t ions
We saw that there are four headline types of derivative product and each one can be defined asfollows:
1. Forwards: A forward contract is a legally binding obligation to buy or sell anagreed amount of an agreed asset at a certain future time for a certain price agreedtoday.
This derivative type is OTC.
2. Futures: A futures contract is a legally binding obligation to buy or sell a standardamount of a standard asset at a specific time in the future for a certain price that isagreed today.
This derivative type is ETD.
Notice how the definition of a future is similar to that of a forward. The key difference is thatthe terms of a futures contract are much more standardised with regards to the:
Standard quantity/amount; Standard (underlying) asset/commodity; Specific delivery date.
Financial Instruments 49
3. Options: A call option gives the buyer (the holder) the right to purchase an assetfor a specified price on or before a specified expiration date.
A put option gives the holder the right to sell an asset for a specified price on orbefore a specified expiration date.
This derivative type can be either ETD or OTC.
Call options and put options can also be sold; the seller is known as the writer of the contract.
4. Swaps: This is a derivative product in which two counterparties exchange certainbenefits of one party’s financial assets for those of the counterparty’s assets.
The cash flows are calculated on a notional principal amount and these cash flowsare known as the legs of a swap.
This derivative type is OTC.
2.6.3 Derivat ive Usage
Hedging: A broad range of market participants use derivatives to hedge or reduce theirexposure to future market conditions, for example, an airline will ask its bank todesign a combination of option contracts against rising jet fuel prices. If the fuel priceincreases to a predetermined amount, then the bank, in effect, refunds the differencebetween the cash price of the fuel and the strike price of the option contract. Wewill look at an example later in this chapter. As a further example, a fund managercan hedge a portfolio of bonds against a decrease in value by selling an appropriatenumber of futures contracts. If the portfolio does, in fact, decrease in value, thenthe fund manager will receive benefit from an increase in the value of the futurescontract. A perfect hedge would therefore be a decrease in the portfolio value of X,mirrored by an increase in the value of the futures contracts also of X.
Dealing: Both ETD and OTC contracts are traded by dealers who work for banks andsecurities houses. Their role is to trade on behalf of their employer companies and toadvise and trade on behalf of their clients. They will have expertise in a wide varietyof derivative products ranging from standard ETDs to complex combinations of OTCcontracts.
Speculation: It can be time-consuming and expensive to buy or sell the underlying assetssuch as equities and bonds. For a speculator it can be a lot more straightforward topurchase a derivative contract and benefit by selling it when the price increases. Itmay not be possible to sell the underlying asset “short”; by contrast, it is just as easyto sell the derivative short as it is to buy long. Furthermore, these transactions can beexecuted much more quickly and more cheaply.
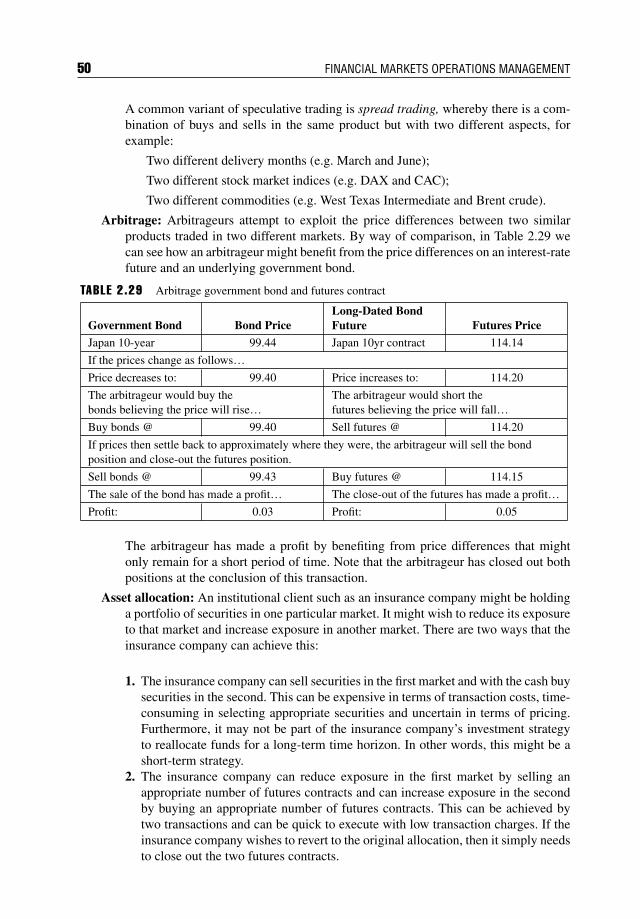
50 FINANCIAL MARKETS OPERATIONS MANAGEMENT
A common variant of speculative trading is spread trading, whereby there is a com-bination of buys and sells in the same product but with two different aspects, forexample:
Two different delivery months (e.g. March and June);
Two different stock market indices (e.g. DAX and CAC);
Two different commodities (e.g. West Texas Intermediate and Brent crude).
Arbitrage: Arbitrageurs attempt to exploit the price differences between two similarproducts traded in two different markets. By way of comparison, in Table 2.29 wecan see how an arbitrageur might benefit from the price differences on an interest-ratefuture and an underlying government bond.
TABLE 2.29 Arbitrage government bond and futures contract
Government Bond Bond PriceLong-Dated BondFuture Futures Price
Japan 10-year 99.44 Japan 10yr contract 114.14
If the prices change as follows…Price decreases to: 99.40 Price increases to: 114.20
The arbitrageur would buy thebonds believing the price will rise…
The arbitrageur would short thefutures believing the price will fall…
Buy bonds @ 99.40 Sell futures @ 114.20
If prices then settle back to approximately where they were, the arbitrageur will sell the bondposition and close-out the futures position.
Sell bonds @ 99.43 Buy futures @ 114.15
The sale of the bond has made a profit… The close-out of the futures has made a profit…Profit: 0.03 Profit: 0.05
The arbitrageur has made a profit by benefiting from price differences that mightonly remain for a short period of time. Note that the arbitrageur has closed out bothpositions at the conclusion of this transaction.
Asset allocation: An institutional client such as an insurance company might be holdinga portfolio of securities in one particular market. It might wish to reduce its exposureto that market and increase exposure in another market. There are two ways that theinsurance company can achieve this:
1. The insurance company can sell securities in the first market and with the cash buysecurities in the second. This can be expensive in terms of transaction costs, time-consuming in selecting appropriate securities and uncertain in terms of pricing.Furthermore, it may not be part of the insurance company’s investment strategyto reallocate funds for a long-term time horizon. In other words, this might be ashort-term strategy.
2. The insurance company can reduce exposure in the first market by selling anappropriate number of futures contracts and can increase exposure in the secondby buying an appropriate number of futures contracts. This can be achieved bytwo transactions and can be quick to execute with low transaction charges. If theinsurance company wishes to revert to the original allocation, then it simply needsto close out the two futures contracts.
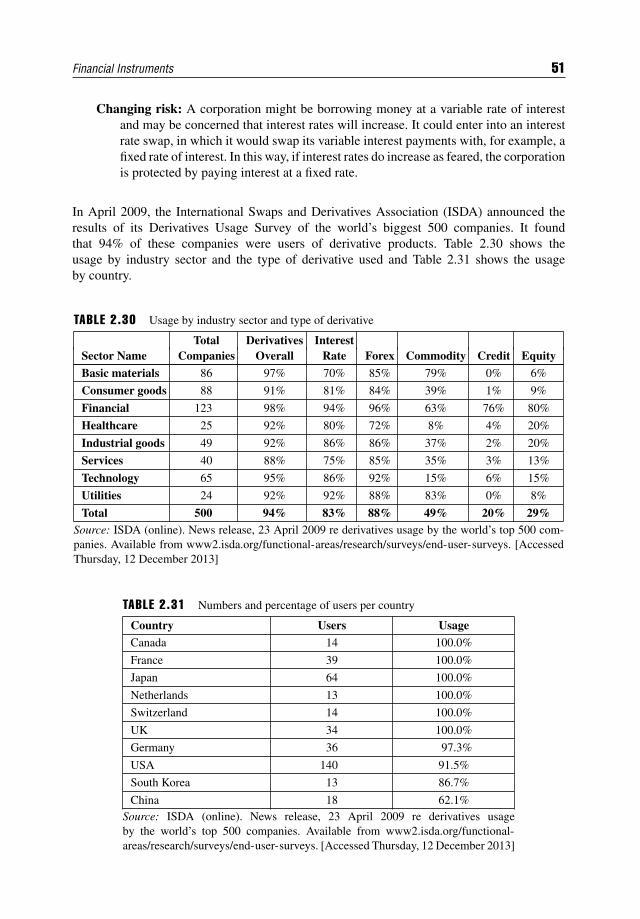
Financial Instruments 51
Changing risk: A corporation might be borrowing money at a variable rate of interestand may be concerned that interest rates will increase. It could enter into an interestrate swap, in which it would swap its variable interest payments with, for example, afixed rate of interest. In this way, if interest rates do increase as feared, the corporationis protected by paying interest at a fixed rate.
In April 2009, the International Swaps and Derivatives Association (ISDA) announced theresults of its Derivatives Usage Survey of the world’s biggest 500 companies. It foundthat 94% of these companies were users of derivative products. Table 2.30 shows theusage by industry sector and the type of derivative used and Table 2.31 shows the usageby country.
TABLE 2.30 Usage by industry sector and type of derivative
Total Derivatives InterestSector Name Companies Overall Rate Forex Commodity Credit Equity
Basic materials 86 97% 70% 85% 79% 0% 6%
Consumer goods 88 91% 81% 84% 39% 1% 9%
Financial 123 98% 94% 96% 63% 76% 80%
Healthcare 25 92% 80% 72% 8% 4% 20%
Industrial goods 49 92% 86% 86% 37% 2% 20%
Services 40 88% 75% 85% 35% 3% 13%
Technology 65 95% 86% 92% 15% 6% 15%
Utilities 24 92% 92% 88% 83% 0% 8%
Total 500 94% 83% 88% 49% 20% 29%Source: ISDA (online). News release, 23 April 2009 re derivatives usage by the world’s top 500 com-panies. Available from www2.isda.org/functional-areas/research/surveys/end-user-surveys. [AccessedThursday, 12 December 2013]
TABLE 2.31 Numbers and percentage of users per country
Country Users UsageCanada 14 100.0%
France 39 100.0%
Japan 64 100.0%
Netherlands 13 100.0%
Switzerland 14 100.0%
UK 34 100.0%
Germany 36 97.3%
USA 140 91.5%
South Korea 13 86.7%
China 18 62.1%Source: ISDA (online). News release, 23 April 2009 re derivatives usageby the world’s top 500 companies. Available from www2.isda.org/functional-areas/research/surveys/end-user-surveys. [Accessed Thursday, 12 December 2013]
52 FINANCIAL MARKETS OPERATIONS MANAGEMENT
These are the main uses and users of derivative products. From an operational point ofview, the reasons for using derivatives tend to be of secondary importance, however inter-esting these reasons might be. We are more concerned by what needs to happen once aderivatives transaction has taken place. The best way to approach this is to consider exchange-traded derivative transactions separately from OTC transactions, remembering that more andmore of the latter are being cleared centrally rather than bilaterally between the buyer andseller.
2.7 EXCHANGE-TRADED DERIVATIVES
2.7.1 Introduct ion
Before we look at exchange-traded derivatives (ETDs) in more detail, please refresh yourmemories regarding the definitions of two types of ETD, i.e. futures and options.
Q&A
Quest ion
What words or phrases in the definitions re-occur?
Answer
Here are the definitions that you saw above, with the key words or phrases highlightedin italic:
A futures contract is a legally binding obligation to buy or sell a standard amountof a standard asset at a specific time in the future for a certain price that is agreedtoday.
A call option gives the buyer (the “holder”) the right to purchase an asset for aspecified price on or before a specified expiration date.
A put option gives the holder the right to sell an asset for a specified price on orbefore a specified expiration date.
Let us examine the similarities and differences between futures and options.
1. A futures contract is an obligation to do something; an option is a right or choice to dosomething. We will see that, in many cases, the buyers and sellers of futures contracts donot wish to make or take delivery of the underlying asset. To remove their obligation, thebuyers and sellers must “close out” their obligations by selling (by the original buyer)and buying (by the original seller) the same quantity of contracts and, most importantly,informing the counterparty that these are closing transactions.
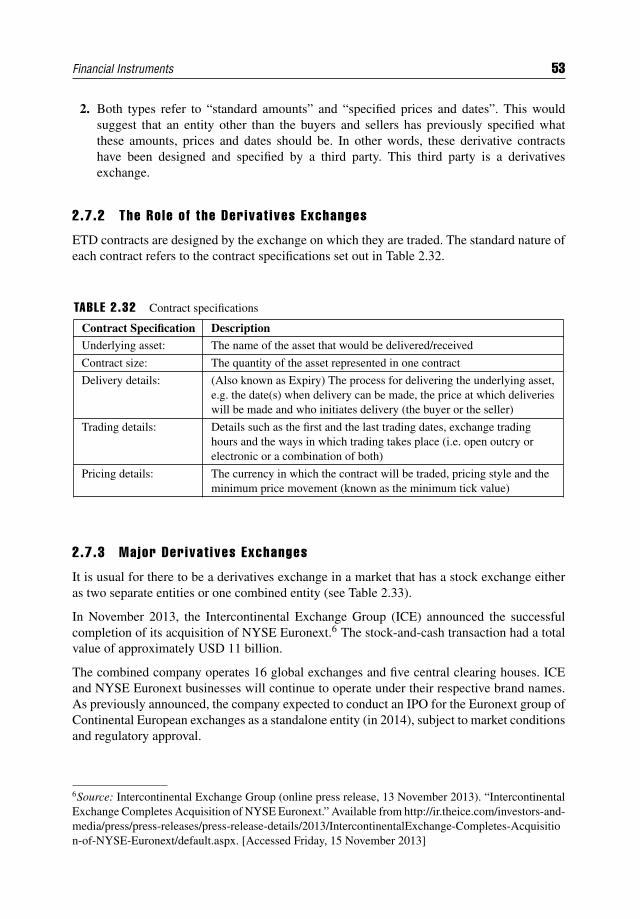
Financial Instruments 53
2. Both types refer to “standard amounts” and “specified prices and dates”. This wouldsuggest that an entity other than the buyers and sellers has previously specified whatthese amounts, prices and dates should be. In other words, these derivative contractshave been designed and specified by a third party. This third party is a derivativesexchange.
2.7.2 The Role of the Derivat ives Exchanges
ETD contracts are designed by the exchange on which they are traded. The standard nature ofeach contract refers to the contract specifications set out in Table 2.32.
TABLE 2.32 Contract specifications
Contract Specification DescriptionUnderlying asset: The name of the asset that would be delivered/received
Contract size: The quantity of the asset represented in one contract
Delivery details: (Also known as Expiry) The process for delivering the underlying asset,e.g. the date(s) when delivery can be made, the price at which deliverieswill be made and who initiates delivery (the buyer or the seller)
Trading details: Details such as the first and the last trading dates, exchange tradinghours and the ways in which trading takes place (i.e. open outcry orelectronic or a combination of both)
Pricing details: The currency in which the contract will be traded, pricing style and theminimum price movement (known as the minimum tick value)
2.7.3 Major Derivat ives Exchanges
It is usual for there to be a derivatives exchange in a market that has a stock exchange eitheras two separate entities or one combined entity (see Table 2.33).
In November 2013, the Intercontinental Exchange Group (ICE) announced the successfulcompletion of its acquisition of NYSE Euronext.6 The stock-and-cash transaction had a totalvalue of approximately USD 11 billion.
The combined company operates 16 global exchanges and five central clearing houses. ICEand NYSE Euronext businesses will continue to operate under their respective brand names.As previously announced, the company expected to conduct an IPO for the Euronext group ofContinental European exchanges as a standalone entity (in 2014), subject to market conditionsand regulatory approval.
6Source: Intercontinental Exchange Group (online press release, 13 November 2013). “IntercontinentalExchange Completes Acquisition of NYSE Euronext.” Available from http://ir.theice.com/investors-and-media/press/press-releases/press-release-details/2013/IntercontinentalExchange-Completes-Acquisition-of-NYSE-Euronext/default.aspx. [Accessed Friday, 15 November 2013]
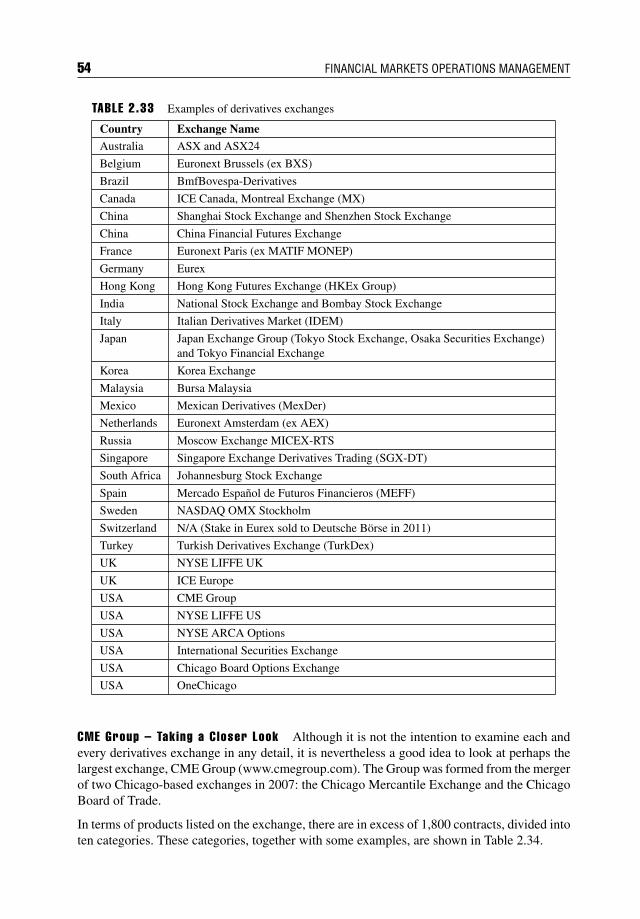
54 FINANCIAL MARKETS OPERATIONS MANAGEMENT
TABLE 2.33 Examples of derivatives exchanges
Country Exchange NameAustralia ASX and ASX24
Belgium Euronext Brussels (ex BXS)
Brazil BmfBovespa-Derivatives
Canada ICE Canada, Montreal Exchange (MX)
China Shanghai Stock Exchange and Shenzhen Stock Exchange
China China Financial Futures Exchange
France Euronext Paris (ex MATIF MONEP)
Germany Eurex
Hong Kong Hong Kong Futures Exchange (HKEx Group)
India National Stock Exchange and Bombay Stock Exchange
Italy Italian Derivatives Market (IDEM)
Japan Japan Exchange Group (Tokyo Stock Exchange, Osaka Securities Exchange)and Tokyo Financial Exchange
Korea Korea Exchange
Malaysia Bursa Malaysia
Mexico Mexican Derivatives (MexDer)
Netherlands Euronext Amsterdam (ex AEX)
Russia Moscow Exchange MICEX-RTS
Singapore Singapore Exchange Derivatives Trading (SGX-DT)
South Africa Johannesburg Stock Exchange
Spain Mercado Espanol de Futuros Financieros (MEFF)
Sweden NASDAQ OMX Stockholm
Switzerland N/A (Stake in Eurex sold to Deutsche Borse in 2011)
Turkey Turkish Derivatives Exchange (TurkDex)
UK NYSE LIFFE UK
UK ICE Europe
USA CME Group
USA NYSE LIFFE US
USA NYSE ARCA Options
USA International Securities Exchange
USA Chicago Board Options Exchange
USA OneChicago
CME Group – Taking a Closer Look Although it is not the intention to examine each andevery derivatives exchange in any detail, it is nevertheless a good idea to look at perhaps thelargest exchange, CME Group (www.cmegroup.com). The Group was formed from the mergerof two Chicago-based exchanges in 2007: the Chicago Mercantile Exchange and the ChicagoBoard of Trade.
In terms of products listed on the exchange, there are in excess of 1,800 contracts, divided intoten categories. These categories, together with some examples, are shown in Table 2.34.
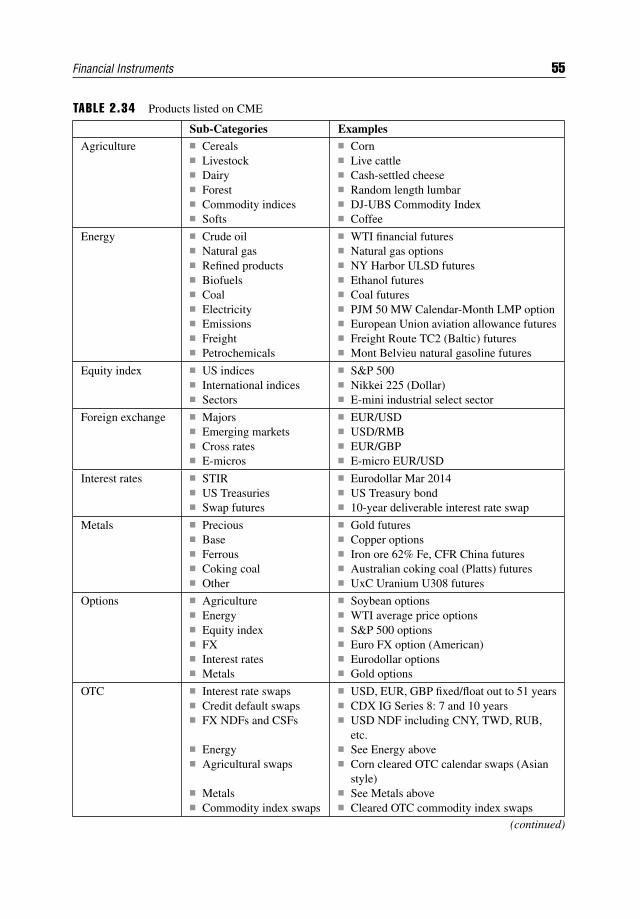
Financial Instruments 55
TABLE 2.34 Products listed on CME
Sub-Categories ExamplesAgriculture Cereals
Livestock Dairy Forest Commodity indices Softs
Corn Live cattle Cash-settled cheese Random length lumbar DJ-UBS Commodity Index Coffee
Energy Crude oil Natural gas Refined products Biofuels Coal Electricity Emissions Freight Petrochemicals
WTI financial futures Natural gas options NY Harbor ULSD futures Ethanol futures Coal futures PJM 50 MW Calendar-Month LMP option European Union aviation allowance futures Freight Route TC2 (Baltic) futures Mont Belvieu natural gasoline futures
Equity index US indices International indices Sectors
S&P 500 Nikkei 225 (Dollar) E-mini industrial select sector
Foreign exchange Majors Emerging markets Cross rates E-micros
EUR/USD USD/RMB EUR/GBP E-micro EUR/USD
Interest rates STIR US Treasuries Swap futures
Eurodollar Mar 2014 US Treasury bond 10-year deliverable interest rate swap
Metals Precious Base Ferrous Coking coal Other
Gold futures Copper options Iron ore 62% Fe, CFR China futures Australian coking coal (Platts) futures UxC Uranium U308 futures
Options Agriculture Energy Equity index FX Interest rates Metals
Soybean options WTI average price options S&P 500 options Euro FX option (American) Eurodollar options Gold options
OTC Interest rate swaps Credit default swaps FX NDFs and CSFs
Energy Agricultural swaps
Metals Commodity index swaps
USD, EUR, GBP fixed/float out to 51 years CDX IG Series 8: 7 and 10 years USD NDF including CNY, TWD, RUB,
etc. See Energy above Corn cleared OTC calendar swaps (Asian
style) See Metals above Cleared OTC commodity index swaps
(continued)
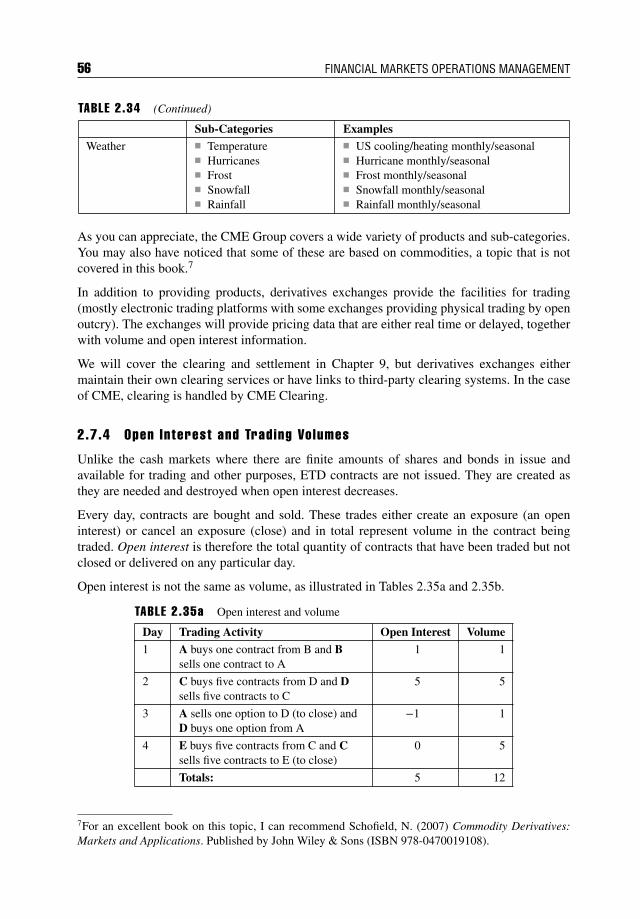
56 FINANCIAL MARKETS OPERATIONS MANAGEMENT
TABLE 2.34 (Continued)
Sub-Categories ExamplesWeather Temperature
Hurricanes Frost Snowfall Rainfall
US cooling/heating monthly/seasonal Hurricane monthly/seasonal Frost monthly/seasonal Snowfall monthly/seasonal Rainfall monthly/seasonal
As you can appreciate, the CME Group covers a wide variety of products and sub-categories.You may also have noticed that some of these are based on commodities, a topic that is notcovered in this book.7
In addition to providing products, derivatives exchanges provide the facilities for trading(mostly electronic trading platforms with some exchanges providing physical trading by openoutcry). The exchanges will provide pricing data that are either real time or delayed, togetherwith volume and open interest information.
We will cover the clearing and settlement in Chapter 9, but derivatives exchanges eithermaintain their own clearing services or have links to third-party clearing systems. In the caseof CME, clearing is handled by CME Clearing.
2.7.4 Open Interest and Trading Volumes
Unlike the cash markets where there are finite amounts of shares and bonds in issue andavailable for trading and other purposes, ETD contracts are not issued. They are created asthey are needed and destroyed when open interest decreases.
Every day, contracts are bought and sold. These trades either create an exposure (an openinterest) or cancel an exposure (close) and in total represent volume in the contract beingtraded. Open interest is therefore the total quantity of contracts that have been traded but notclosed or delivered on any particular day.
Open interest is not the same as volume, as illustrated in Tables 2.35a and 2.35b.
TABLE 2.35a Open interest and volume
Day Trading Activity Open Interest Volume
1 A buys one contract from B and Bsells one contract to A
1 1
2 C buys five contracts from D and Dsells five contracts to C
5 5
3 A sells one option to D (to close) andD buys one option from A
−1 1
4 E buys five contracts from C and Csells five contracts to E (to close)
0 5
Totals: 5 12
7For an excellent book on this topic, I can recommend Schofield, N. (2007) Commodity Derivatives:Markets and Applications. Published by John Wiley & Sons (ISBN 978-0470019108).
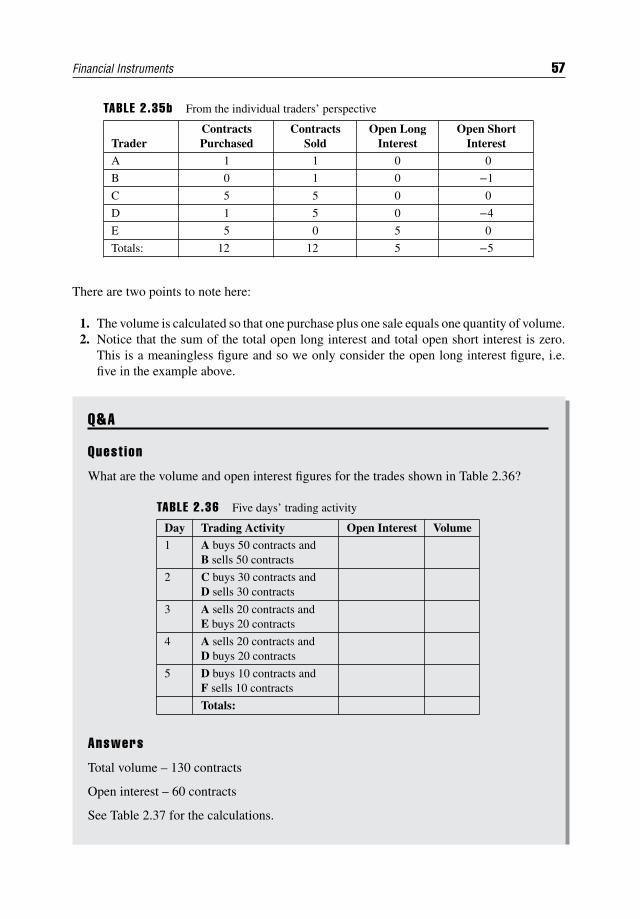
Financial Instruments 57
TABLE 2.35b From the individual traders’ perspective
TraderContractsPurchased
ContractsSold
Open LongInterest
Open ShortInterest
A 1 1 0 0
B 0 1 0 −1
C 5 5 0 0
D 1 5 0 −4
E 5 0 5 0
Totals: 12 12 5 −5
There are two points to note here:
1. The volume is calculated so that one purchase plus one sale equals one quantity of volume.2. Notice that the sum of the total open long interest and total open short interest is zero.
This is a meaningless figure and so we only consider the open long interest figure, i.e.five in the example above.
Q&A
Quest ion
What are the volume and open interest figures for the trades shown in Table 2.36?
TABLE 2.36 Five days’ trading activity
Day Trading Activity Open Interest Volume1 A buys 50 contracts and
B sells 50 contracts
2 C buys 30 contracts andD sells 30 contracts
3 A sells 20 contracts andE buys 20 contracts
4 A sells 20 contracts andD buys 20 contracts
5 D buys 10 contracts andF sells 10 contracts
Totals:
Answers
Total volume – 130 contracts
Open interest – 60 contracts
See Table 2.37 for the calculations.
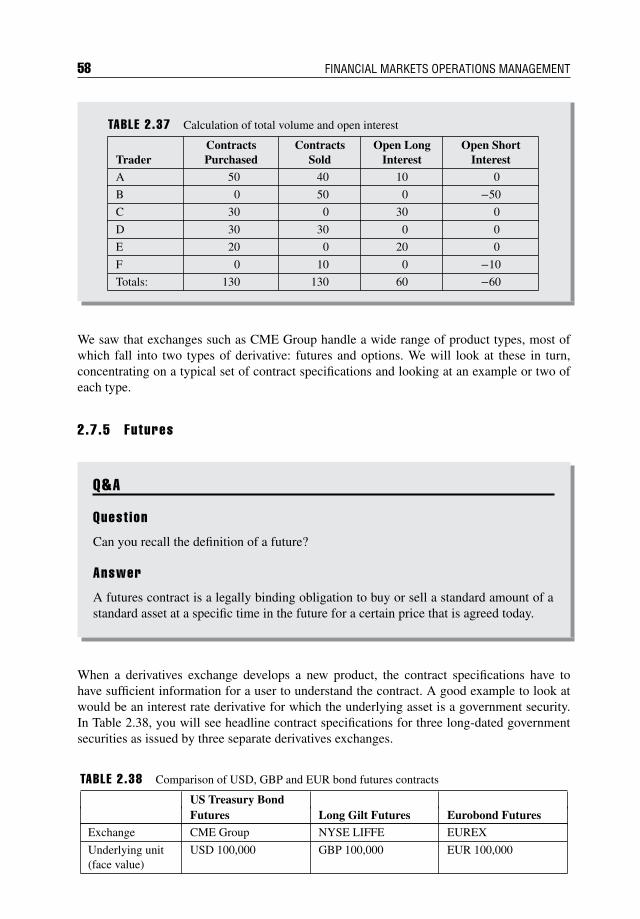
58 FINANCIAL MARKETS OPERATIONS MANAGEMENT
TABLE 2.37 Calculation of total volume and open interest
TraderContractsPurchased
ContractsSold
Open LongInterest
Open ShortInterest
A 50 40 10 0
B 0 50 0 −50
C 30 0 30 0
D 30 30 0 0
E 20 0 20 0
F 0 10 0 −10
Totals: 130 130 60 −60
We saw that exchanges such as CME Group handle a wide range of product types, most ofwhich fall into two types of derivative: futures and options. We will look at these in turn,concentrating on a typical set of contract specifications and looking at an example or two ofeach type.
2.7.5 Futures
Q&A
Quest ion
Can you recall the definition of a future?
Answer
A futures contract is a legally binding obligation to buy or sell a standard amount of astandard asset at a specific time in the future for a certain price that is agreed today.
When a derivatives exchange develops a new product, the contract specifications have tohave sufficient information for a user to understand the contract. A good example to look atwould be an interest rate derivative for which the underlying asset is a government security.In Table 2.38, you will see headline contract specifications for three long-dated governmentsecurities as issued by three separate derivatives exchanges.
TABLE 2.38 Comparison of USD, GBP and EUR bond futures contracts
US Treasury BondFutures Long Gilt Futures Eurobond Futures
Exchange CME Group NYSE LIFFE EUREX
Underlying unit(face value)
USD 100,000 GBP 100,000 EUR 100,000

Financial Instruments 59
TABLE 2.38 (Continued)
US Treasury BondFutures Long Gilt Futures Eurobond Futures
Deliverable grade(See Note)
US T-bond with anotional 6% couponwith a maturity from15 to 25 years
UK gilt with a notional4% coupon with amaturity from 8.75 to13 years
German bund with anotional 6% couponwith a maturity from8.5 to 10.5 years
Price quote Points and 1/32nd of apoint (e.g. 120−16 is120 16/32)
As a percentage of thepar value
As a percentage of thepar value
Tick size 1/32 of one point (USD31.25)
0.01 (GBP 10.00) 0.01 (EUR 10.00)
Contract months First three consecutive contracts (i.e. up to nine months)in the March, June, September and December cycle
Last trading day Closes at 12:01,seventh business daypreceding the lastbusiness day in thedelivery month
Closes at 11:00, twobusiness days prior tothe last business day inthe delivery month
Closes at 12:30 CET,two exchange daysprior to the lastbusiness day in thedelivery month
Last delivery day Last day in the deliverymonth
Any business day inthe delivery month (atseller’s choice)
Tenth calendar day inthe delivery month
Note: A delivery obligation arising out of a short position may only be fulfilled by the delivery of certaindebt securities issued by Germany, Italy, France or Switzerland. Each country’s bonds have slightlydifferent maturities.
By making a comparison of these three futures contracts you can see that there are bothsimilarities and differences between them. First of all, these are the similarities:
1. The deliverables are all long-dated government bonds.2. The face value of each underlying unit (contract) is 100,000.3. The price quote convention mirrors that of the underlying bond.4. The contract months follow the same March quarterly cycle.5. The tick size follows a similar pattern, although the USA convention is to quote in 1/32nd
whilst the other two countries quote in decimals.
Secondly, here are the differences:
1. The notional coupon rate is different for the long gilt future at 4%.2. In the delivery month, the CME and EUREX contracts are deliverable on one particular
day whereas the NYSE LIFFE contract is deliverable on any business day in the deliverymonth. There are also differences in terms of which day is the last day for the CME andEUREX contracts.
Del iverable Bonds Closer examination of the contract specifications will show that there isno one particular bond designated as being the deliverable bond. The implication is that thereis a choice of one or more bonds which meet the criteria to a certain extent.
In all probability there is no such bond that has a coupon rate as stated and with a maturity thatfits within the timeline. The exchange overcomes this problem by publishing a list of bondsthat would be suitable for any particular delivery month.
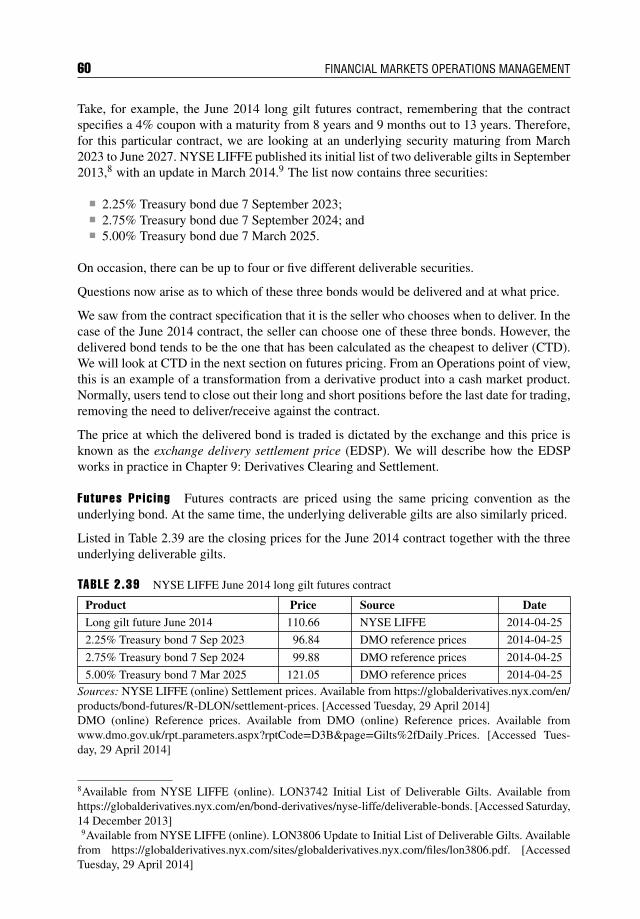
60 FINANCIAL MARKETS OPERATIONS MANAGEMENT
Take, for example, the June 2014 long gilt futures contract, remembering that the contractspecifies a 4% coupon with a maturity from 8 years and 9 months out to 13 years. Therefore,for this particular contract, we are looking at an underlying security maturing from March2023 to June 2027. NYSE LIFFE published its initial list of two deliverable gilts in September2013,8 with an update in March 2014.9 The list now contains three securities:
2.25% Treasury bond due 7 September 2023; 2.75% Treasury bond due 7 September 2024; and 5.00% Treasury bond due 7 March 2025.
On occasion, there can be up to four or five different deliverable securities.
Questions now arise as to which of these three bonds would be delivered and at what price.
We saw from the contract specification that it is the seller who chooses when to deliver. In thecase of the June 2014 contract, the seller can choose one of these three bonds. However, thedelivered bond tends to be the one that has been calculated as the cheapest to deliver (CTD).We will look at CTD in the next section on futures pricing. From an Operations point of view,this is an example of a transformation from a derivative product into a cash market product.Normally, users tend to close out their long and short positions before the last date for trading,removing the need to deliver/receive against the contract.
The price at which the delivered bond is traded is dictated by the exchange and this price isknown as the exchange delivery settlement price (EDSP). We will describe how the EDSPworks in practice in Chapter 9: Derivatives Clearing and Settlement.
Futures Pric ing Futures contracts are priced using the same pricing convention as theunderlying bond. At the same time, the underlying deliverable gilts are also similarly priced.
Listed in Table 2.39 are the closing prices for the June 2014 contract together with the threeunderlying deliverable gilts.
TABLE 2.39 NYSE LIFFE June 2014 long gilt futures contract
Product Price Source Date
Long gilt future June 2014 110.66 NYSE LIFFE 2014-04-25
2.25% Treasury bond 7 Sep 2023 96.84 DMO reference prices 2014-04-25
2.75% Treasury bond 7 Sep 2024 99.88 DMO reference prices 2014-04-25
5.00% Treasury bond 7 Mar 2025 121.05 DMO reference prices 2014-04-25Sources: NYSE LIFFE (online) Settlement prices. Available from https://globalderivatives.nyx.com/en/products/bond-futures/R-DLON/settlement-prices. [Accessed Tuesday, 29 April 2014]DMO (online) Reference prices. Available from DMO (online) Reference prices. Available fromwww.dmo.gov.uk/rpt parameters.aspx?rptCode=D3B&page=Gilts%2fDaily Prices. [Accessed Tues-day, 29 April 2014]
8Available from NYSE LIFFE (online). LON3742 Initial List of Deliverable Gilts. Available fromhttps://globalderivatives.nyx.com/en/bond-derivatives/nyse-liffe/deliverable-bonds. [Accessed Saturday,14 December 2013]9Available from NYSE LIFFE (online). LON3806 Update to Initial List of Deliverable Gilts. Available
from https://globalderivatives.nyx.com/sites/globalderivatives.nyx.com/files/lon3806.pdf. [AccessedTuesday, 29 April 2014]
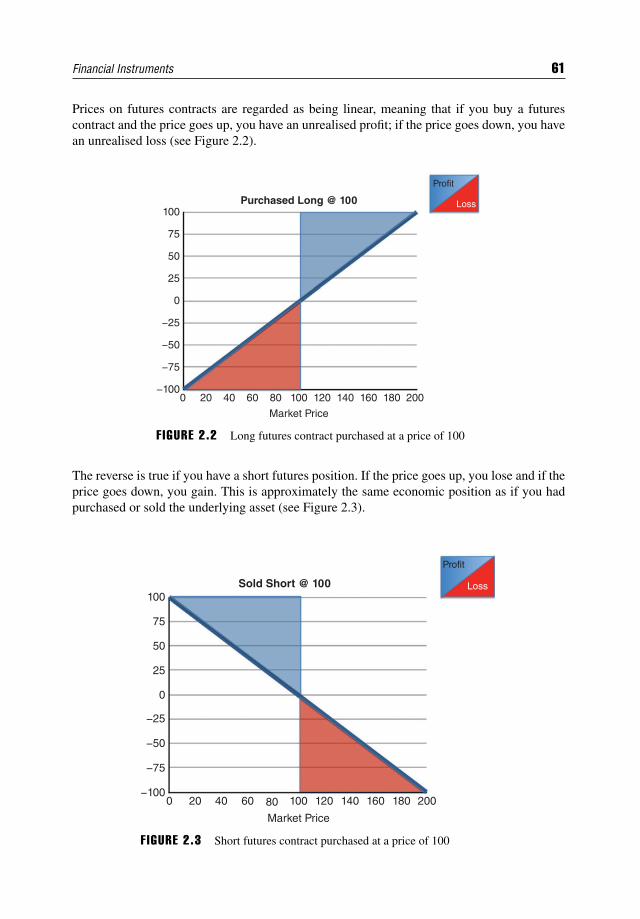
Financial Instruments 61
Prices on futures contracts are regarded as being linear, meaning that if you buy a futurescontract and the price goes up, you have an unrealised profit; if the price goes down, you havean unrealised loss (see Figure 2.2).
100Purchased Long @ 100
75
50
25
0
−25
−50
−75
−1000 20 40 60 80 100
Market Price
120 140 160 180 200
Profit
Loss
F IGURE 2.2 Long futures contract purchased at a price of 100
The reverse is true if you have a short futures position. If the price goes up, you lose and if theprice goes down, you gain. This is approximately the same economic position as if you hadpurchased or sold the underlying asset (see Figure 2.3).
100
75
50
25
0
Sold Short @ 100
−25
−50
−75
−1000 20 40 60 80 100
Market Price
120 140 160 180 200
Profit
Loss
F IGURE 2.3 Short futures contract purchased at a price of 100
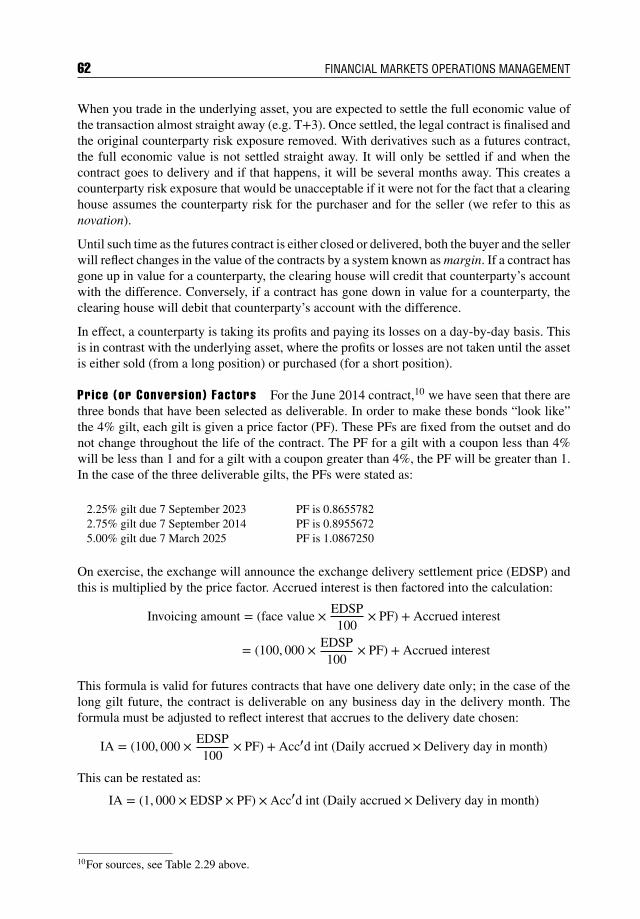
62 FINANCIAL MARKETS OPERATIONS MANAGEMENT
When you trade in the underlying asset, you are expected to settle the full economic value ofthe transaction almost straight away (e.g. T+3). Once settled, the legal contract is finalised andthe original counterparty risk exposure removed. With derivatives such as a futures contract,the full economic value is not settled straight away. It will only be settled if and when thecontract goes to delivery and if that happens, it will be several months away. This creates acounterparty risk exposure that would be unacceptable if it were not for the fact that a clearinghouse assumes the counterparty risk for the purchaser and for the seller (we refer to this asnovation).
Until such time as the futures contract is either closed or delivered, both the buyer and the sellerwill reflect changes in the value of the contracts by a system known as margin. If a contract hasgone up in value for a counterparty, the clearing house will credit that counterparty’s accountwith the difference. Conversely, if a contract has gone down in value for a counterparty, theclearing house will debit that counterparty’s account with the difference.
In effect, a counterparty is taking its profits and paying its losses on a day-by-day basis. Thisis in contrast with the underlying asset, where the profits or losses are not taken until the assetis either sold (from a long position) or purchased (for a short position).
Price (or Conversion) Factors For the June 2014 contract,10 we have seen that there arethree bonds that have been selected as deliverable. In order to make these bonds “look like”the 4% gilt, each gilt is given a price factor (PF). These PFs are fixed from the outset and donot change throughout the life of the contract. The PF for a gilt with a coupon less than 4%will be less than 1 and for a gilt with a coupon greater than 4%, the PF will be greater than 1.In the case of the three deliverable gilts, the PFs were stated as:
2.25% gilt due 7 September 2023 PF is 0.86557822.75% gilt due 7 September 2014 PF is 0.89556725.00% gilt due 7 March 2025 PF is 1.0867250
On exercise, the exchange will announce the exchange delivery settlement price (EDSP) andthis is multiplied by the price factor. Accrued interest is then factored into the calculation:
Invoicing amount = (face value × EDSP100
× PF) + Accrued interest
= (100, 000 × EDSP100
× PF) + Accrued interest
This formula is valid for futures contracts that have one delivery date only; in the case of thelong gilt future, the contract is deliverable on any business day in the delivery month. Theformula must be adjusted to reflect interest that accrues to the delivery date chosen:
IA = (100, 000 × EDSP100
× PF) + Acc′d int (Daily accrued × Delivery day in month)
This can be restated as:
IA = (1, 000 × EDSP × PF) × Acc′d int (Daily accrued × Delivery day in month)
10For sources, see Table 2.29 above.
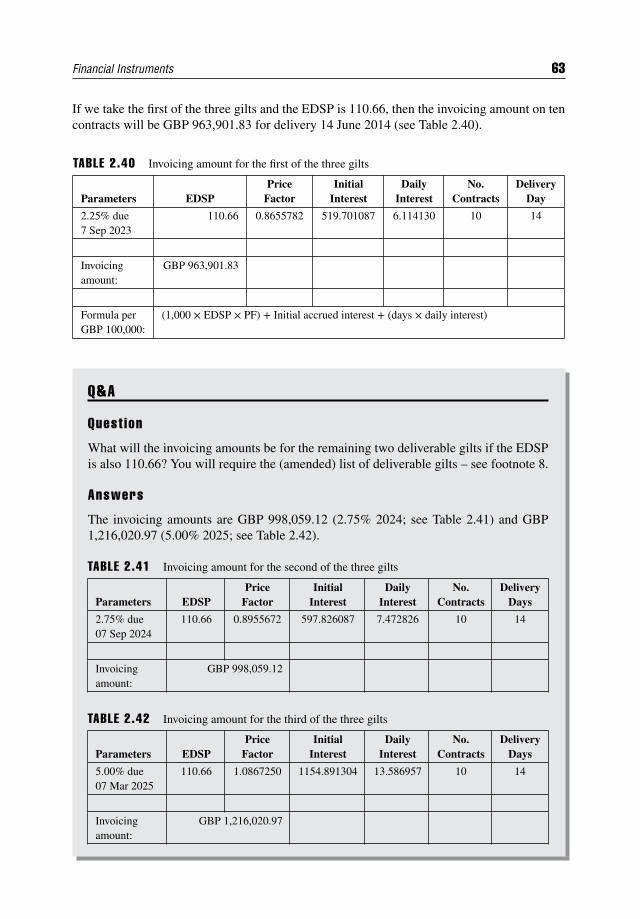
Financial Instruments 63
If we take the first of the three gilts and the EDSP is 110.66, then the invoicing amount on tencontracts will be GBP 963,901.83 for delivery 14 June 2014 (see Table 2.40).
TABLE 2.40 Invoicing amount for the first of the three gilts
Parameters EDSPPrice
FactorInitial
InterestDaily
InterestNo.
ContractsDelivery
Day
2.25% due7 Sep 2023
110.66 0.8655782 519.701087 6.114130 10 14
Invoicingamount:
GBP 963,901.83
Formula perGBP 100,000:
(1,000 × EDSP × PF) + Initial accrued interest + (days × daily interest)
Q&A
Quest ion
What will the invoicing amounts be for the remaining two deliverable gilts if the EDSPis also 110.66? You will require the (amended) list of deliverable gilts – see footnote 8.
Answers
The invoicing amounts are GBP 998,059.12 (2.75% 2024; see Table 2.41) and GBP1,216,020.97 (5.00% 2025; see Table 2.42).
TABLE 2.41 Invoicing amount for the second of the three gilts
Parameters EDSPPrice
FactorInitial
InterestDaily
InterestNo.
ContractsDelivery
Days
2.75% due07 Sep 2024
110.66 0.8955672 597.826087 7.472826 10 14
Invoicingamount:
GBP 998,059.12
TABLE 2.42 Invoicing amount for the third of the three gilts
Parameters EDSPPrice
FactorInitial
InterestDaily
InterestNo.
ContractsDelivery
Days
5.00% due07 Mar 2025
110.66 1.0867250 1154.891304 13.586957 10 14
Invoicingamount:
GBP 1,216,020.97
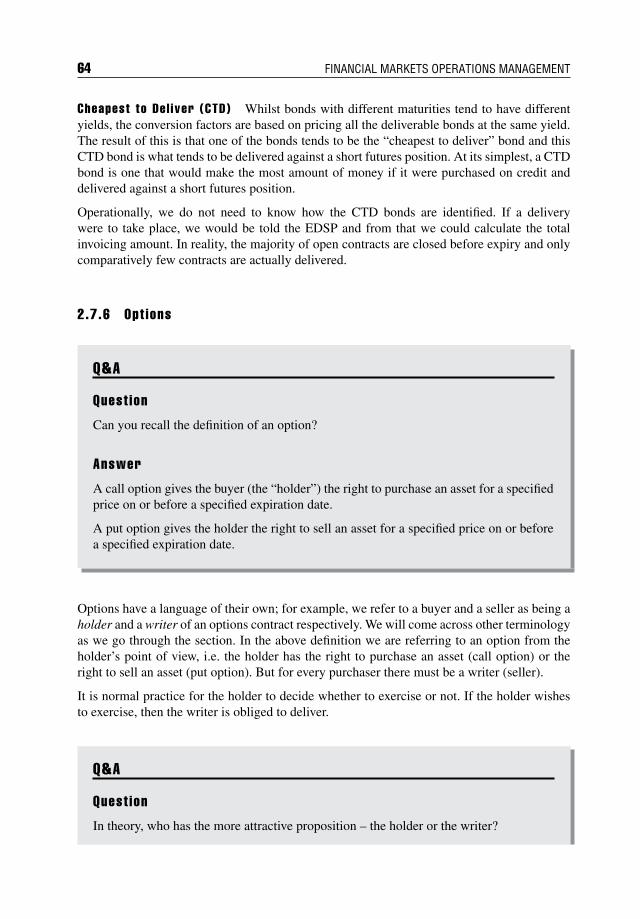
64 FINANCIAL MARKETS OPERATIONS MANAGEMENT
Cheapest to Del iver (CTD) Whilst bonds with different maturities tend to have differentyields, the conversion factors are based on pricing all the deliverable bonds at the same yield.The result of this is that one of the bonds tends to be the “cheapest to deliver” bond and thisCTD bond is what tends to be delivered against a short futures position. At its simplest, a CTDbond is one that would make the most amount of money if it were purchased on credit anddelivered against a short futures position.
Operationally, we do not need to know how the CTD bonds are identified. If a deliverywere to take place, we would be told the EDSP and from that we could calculate the totalinvoicing amount. In reality, the majority of open contracts are closed before expiry and onlycomparatively few contracts are actually delivered.
2.7.6 Opt ions
Q&A
Quest ion
Can you recall the definition of an option?
Answer
A call option gives the buyer (the “holder”) the right to purchase an asset for a specifiedprice on or before a specified expiration date.
A put option gives the holder the right to sell an asset for a specified price on or beforea specified expiration date.
Options have a language of their own; for example, we refer to a buyer and a seller as being aholder and a writer of an options contract respectively. We will come across other terminologyas we go through the section. In the above definition we are referring to an option from theholder’s point of view, i.e. the holder has the right to purchase an asset (call option) or theright to sell an asset (put option). But for every purchaser there must be a writer (seller).
It is normal practice for the holder to decide whether to exercise or not. If the holder wishesto exercise, then the writer is obliged to deliver.
Q&A
Quest ion
In theory, who has the more attractive proposition – the holder or the writer?
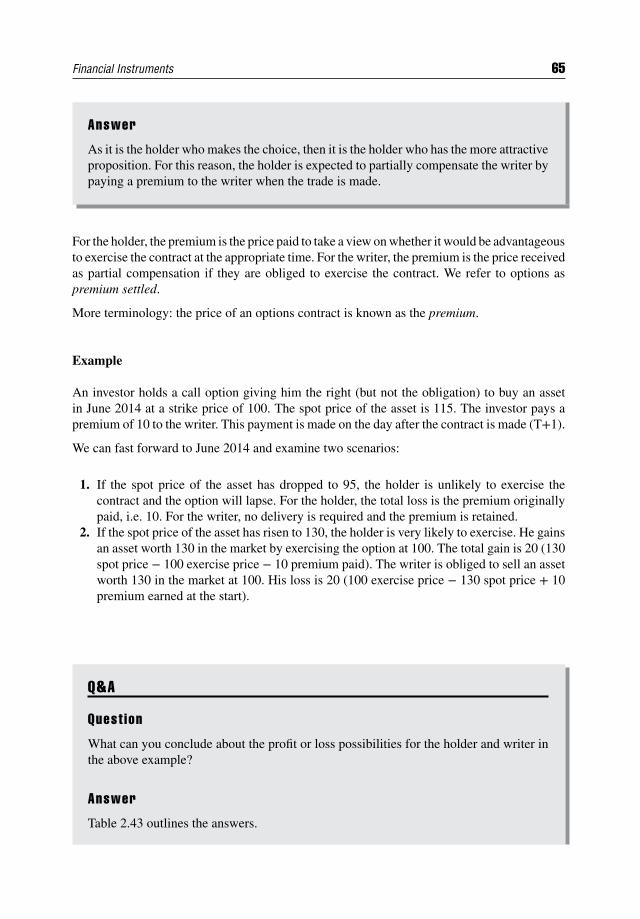
Financial Instruments 65
Answer
As it is the holder who makes the choice, then it is the holder who has the more attractiveproposition. For this reason, the holder is expected to partially compensate the writer bypaying a premium to the writer when the trade is made.
For the holder, the premium is the price paid to take a view on whether it would be advantageousto exercise the contract at the appropriate time. For the writer, the premium is the price receivedas partial compensation if they are obliged to exercise the contract. We refer to options aspremium settled.
More terminology: the price of an options contract is known as the premium.
Example
An investor holds a call option giving him the right (but not the obligation) to buy an assetin June 2014 at a strike price of 100. The spot price of the asset is 115. The investor pays apremium of 10 to the writer. This payment is made on the day after the contract is made (T+1).
We can fast forward to June 2014 and examine two scenarios:
1. If the spot price of the asset has dropped to 95, the holder is unlikely to exercise thecontract and the option will lapse. For the holder, the total loss is the premium originallypaid, i.e. 10. For the writer, no delivery is required and the premium is retained.
2. If the spot price of the asset has risen to 130, the holder is very likely to exercise. He gainsan asset worth 130 in the market by exercising the option at 100. The total gain is 20 (130spot price − 100 exercise price − 10 premium paid). The writer is obliged to sell an assetworth 130 in the market at 100. His loss is 20 (100 exercise price − 130 spot price + 10premium earned at the start).
Q&A
Quest ion
What can you conclude about the profit or loss possibilities for the holder and writer inthe above example?
Answer
Table 2.43 outlines the answers.
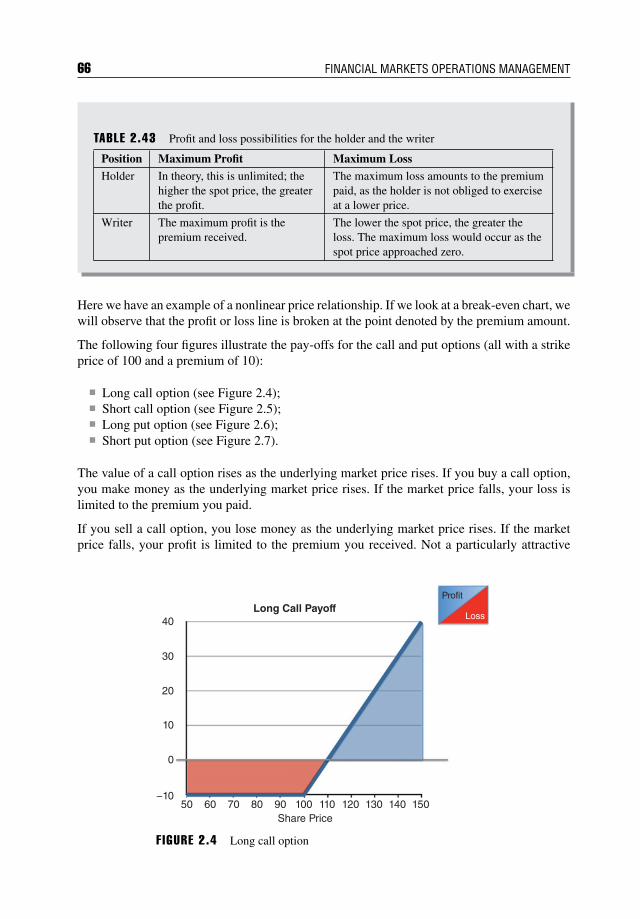
66 FINANCIAL MARKETS OPERATIONS MANAGEMENT
TABLE 2.43 Profit and loss possibilities for the holder and the writer
Position Maximum Profit Maximum Loss
Holder In theory, this is unlimited; thehigher the spot price, the greaterthe profit.
The maximum loss amounts to the premiumpaid, as the holder is not obliged to exerciseat a lower price.
Writer The maximum profit is thepremium received.
The lower the spot price, the greater theloss. The maximum loss would occur as thespot price approached zero.
Here we have an example of a nonlinear price relationship. If we look at a break-even chart, wewill observe that the profit or loss line is broken at the point denoted by the premium amount.
The following four figures illustrate the pay-offs for the call and put options (all with a strikeprice of 100 and a premium of 10):
Long call option (see Figure 2.4); Short call option (see Figure 2.5); Long put option (see Figure 2.6); Short put option (see Figure 2.7).
The value of a call option rises as the underlying market price rises. If you buy a call option,you make money as the underlying market price rises. If the market price falls, your loss islimited to the premium you paid.
If you sell a call option, you lose money as the underlying market price rises. If the marketprice falls, your profit is limited to the premium you received. Not a particularly attractive
40Long Call Payoff
Share Price50 60 70 80 90 100 110 120 130 140 150
30
20
10
0
−10
Profit
Loss
F IGURE 2.4 Long call option
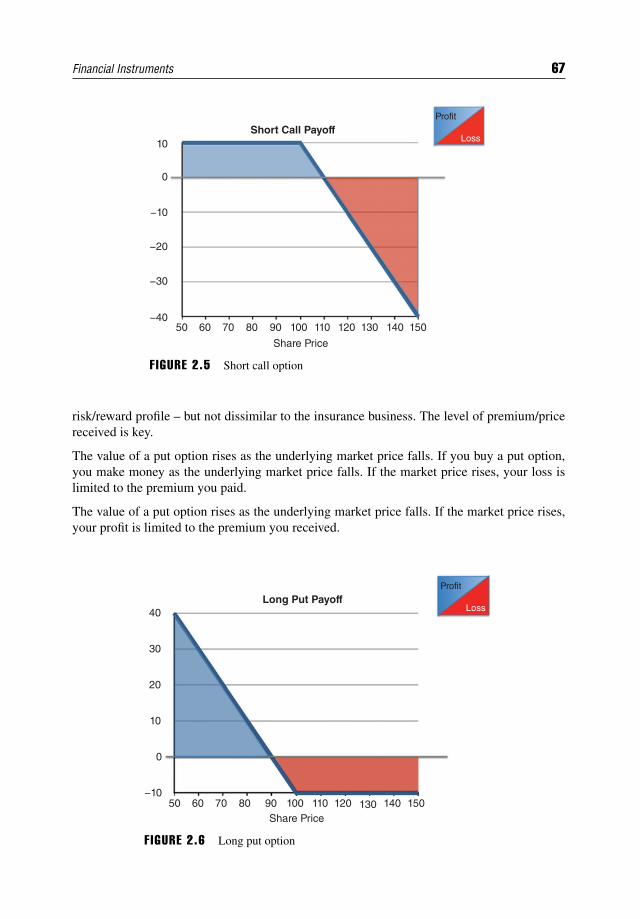
Financial Instruments 67
10
Share Price
0
−10
−20
−30
−4050 60 70 80 90 100 110 120 130 140 150
Short Call PayoffProfit
Loss
F IGURE 2.5 Short call option
risk/reward profile – but not dissimilar to the insurance business. The level of premium/pricereceived is key.
The value of a put option rises as the underlying market price falls. If you buy a put option,you make money as the underlying market price falls. If the market price rises, your loss islimited to the premium you paid.
The value of a put option rises as the underlying market price falls. If the market price rises,your profit is limited to the premium you received.
40
30
20
10
−10
0
Share Price50 60 70 80 90 100 110 120 130 140 150
Long Put PayoffProfit
Loss
F IGURE 2.6 Long put option
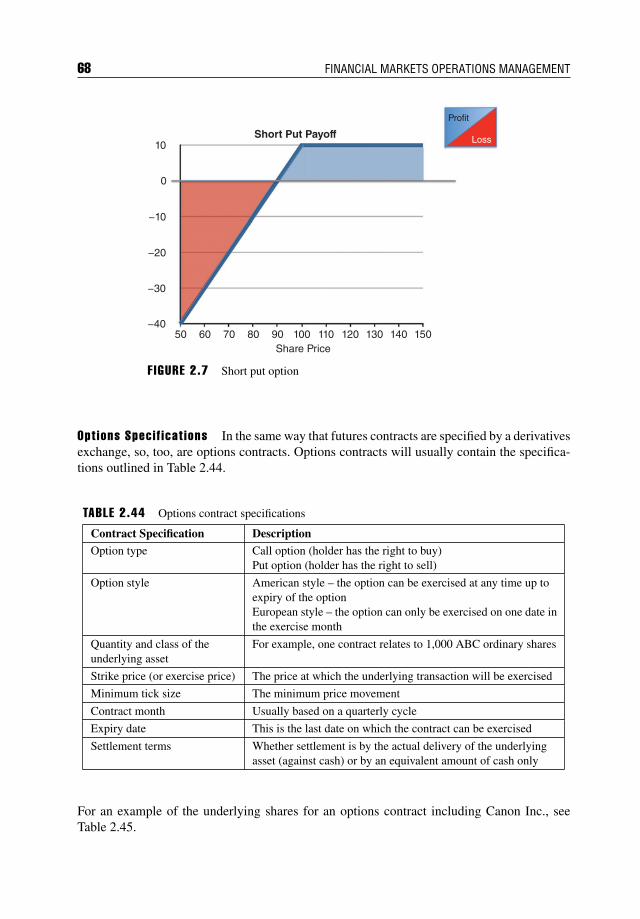
68 FINANCIAL MARKETS OPERATIONS MANAGEMENT
10
0
−10
−20
−30
−40
Share Price50 60 70 80 90 100 110 120 130 140 150
Short Put Payoff
Profit
Loss
F IGURE 2.7 Short put option
Opt ions Speci f icat ions In the same way that futures contracts are specified by a derivativesexchange, so, too, are options contracts. Options contracts will usually contain the specifica-tions outlined in Table 2.44.
TABLE 2.44 Options contract specifications
Contract Specification DescriptionOption type Call option (holder has the right to buy)
Put option (holder has the right to sell)
Option style American style – the option can be exercised at any time up toexpiry of the optionEuropean style – the option can only be exercised on one date inthe exercise month
Quantity and class of theunderlying asset
For example, one contract relates to 1,000 ABC ordinary shares
Strike price (or exercise price) The price at which the underlying transaction will be exercised
Minimum tick size The minimum price movement
Contract month Usually based on a quarterly cycle
Expiry date This is the last date on which the contract can be exercised
Settlement terms Whether settlement is by the actual delivery of the underlyingasset (against cash) or by an equivalent amount of cash only
For an example of the underlying shares for an options contract including Canon Inc., seeTable 2.45.
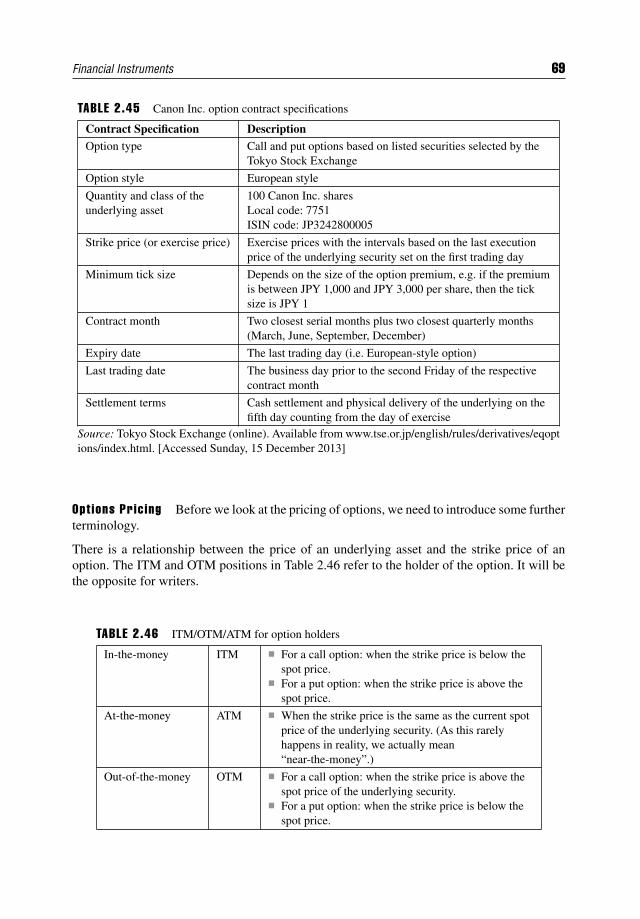
Financial Instruments 69
TABLE 2.45 Canon Inc. option contract specifications
Contract Specification DescriptionOption type Call and put options based on listed securities selected by the
Tokyo Stock Exchange
Option style European style
Quantity and class of theunderlying asset
100 Canon Inc. sharesLocal code: 7751ISIN code: JP3242800005
Strike price (or exercise price) Exercise prices with the intervals based on the last executionprice of the underlying security set on the first trading day
Minimum tick size Depends on the size of the option premium, e.g. if the premiumis between JPY 1,000 and JPY 3,000 per share, then the ticksize is JPY 1
Contract month Two closest serial months plus two closest quarterly months(March, June, September, December)
Expiry date The last trading day (i.e. European-style option)
Last trading date The business day prior to the second Friday of the respectivecontract month
Settlement terms Cash settlement and physical delivery of the underlying on thefifth day counting from the day of exercise
Source: Tokyo Stock Exchange (online). Available from www.tse.or.jp/english/rules/derivatives/eqoptions/index.html. [Accessed Sunday, 15 December 2013]
Opt ions Pric ing Before we look at the pricing of options, we need to introduce some furtherterminology.
There is a relationship between the price of an underlying asset and the strike price of anoption. The ITM and OTM positions in Table 2.46 refer to the holder of the option. It will bethe opposite for writers.
TABLE 2.46 ITM/OTM/ATM for option holders
In-the-money ITM For a call option: when the strike price is below thespot price.
For a put option: when the strike price is above thespot price.
At-the-money ATM When the strike price is the same as the current spotprice of the underlying security. (As this rarelyhappens in reality, we actually mean“near-the-money”.)
Out-of-the-money OTM For a call option: when the strike price is above thespot price of the underlying security.
For a put option: when the strike price is below thespot price.
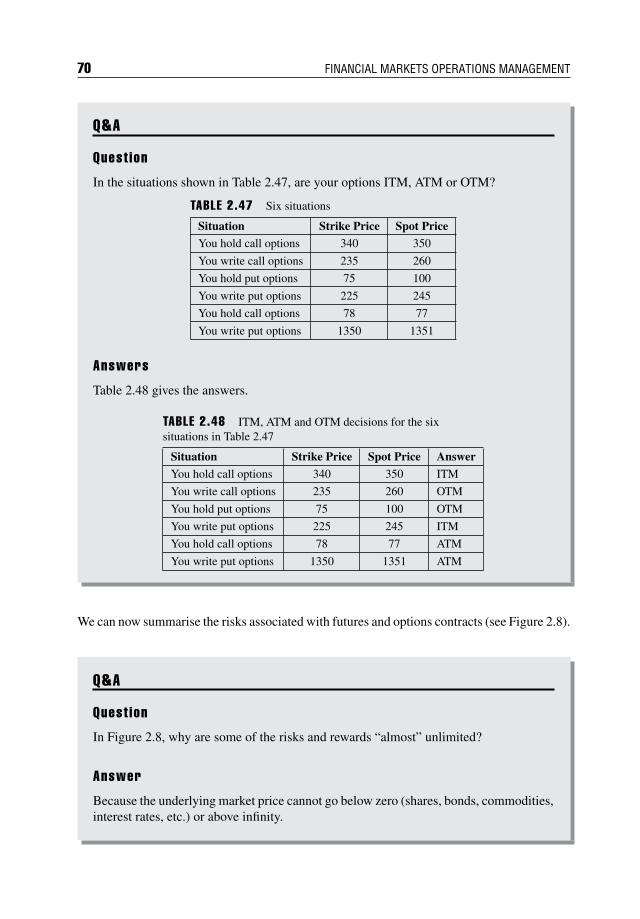
70 FINANCIAL MARKETS OPERATIONS MANAGEMENT
Q&A
Quest ion
In the situations shown in Table 2.47, are your options ITM, ATM or OTM?
TABLE 2.47 Six situations
Situation Strike Price Spot PriceYou hold call options 340 350
You write call options 235 260
You hold put options 75 100
You write put options 225 245
You hold call options 78 77
You write put options 1350 1351
Answers
Table 2.48 gives the answers.
TABLE 2.48 ITM, ATM and OTM decisions for the sixsituations in Table 2.47
Situation Strike Price Spot Price Answer
You hold call options 340 350 ITM
You write call options 235 260 OTM
You hold put options 75 100 OTM
You write put options 225 245 ITM
You hold call options 78 77 ATM
You write put options 1350 1351 ATM
We can now summarise the risks associated with futures and options contracts (see Figure 2.8).
Q&A
Quest ion
In Figure 2.8, why are some of the risks and rewards “almost” unlimited?
Answer
Because the underlying market price cannot go below zero (shares, bonds, commodities,interest rates, etc.) or above infinity.
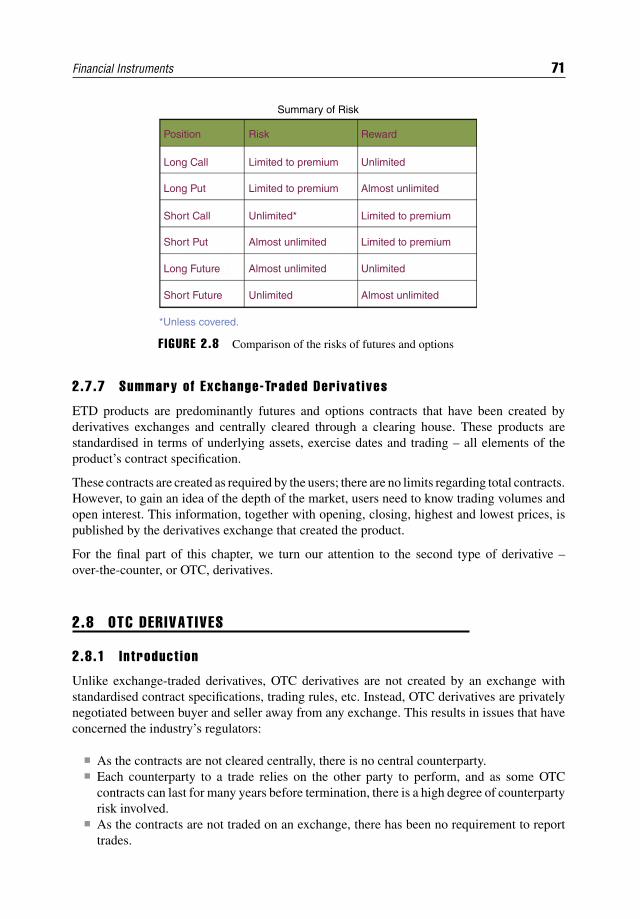
Financial Instruments 71
Summary of Risk
Position Risk Reward
Long Call Limited to premium Unlimited
Long Put Limited to premium Almost unlimited
Short Call Unlimited* Limited to premium
Short Put Almost unlimited Limited to premium
Long Future Almost unlimited Unlimited
Short Future Unlimited Almost unlimited
*Unless covered.
F IGURE 2.8 Comparison of the risks of futures and options
2.7.7 Summary of Exchange-Traded Derivat ives
ETD products are predominantly futures and options contracts that have been created byderivatives exchanges and centrally cleared through a clearing house. These products arestandardised in terms of underlying assets, exercise dates and trading – all elements of theproduct’s contract specification.
These contracts are created as required by the users; there are no limits regarding total contracts.However, to gain an idea of the depth of the market, users need to know trading volumes andopen interest. This information, together with opening, closing, highest and lowest prices, ispublished by the derivatives exchange that created the product.
For the final part of this chapter, we turn our attention to the second type of derivative –over-the-counter, or OTC, derivatives.
2.8 OTC DERIVATIVES
2.8.1 Introduct ion
Unlike exchange-traded derivatives, OTC derivatives are not created by an exchange withstandardised contract specifications, trading rules, etc. Instead, OTC derivatives are privatelynegotiated between buyer and seller away from any exchange. This results in issues that haveconcerned the industry’s regulators:
As the contracts are not cleared centrally, there is no central counterparty. Each counterparty to a trade relies on the other party to perform, and as some OTC
contracts can last for many years before termination, there is a high degree of counterpartyrisk involved.
As the contracts are not traded on an exchange, there has been no requirement to reporttrades.
72 FINANCIAL MARKETS OPERATIONS MANAGEMENT
OTC derivatives can be relatively straightforward in design and content; however, manyare highly complex in structure with risks that are correspondingly complex.
The specification of OTC derivatives is established at the time of the trade. Nevertheless,the more “vanilla” contracts do follow basic templates.
This situation is changing. Due to pressure from the regulators, OTC contracts are migratingto central clearing systems, trades are expected to be reported (whether centrally cleared ornot) and there is the possibility that trading itself might migrate to exchanges.
The big question concerns the more complex derivative structures (the exotic derivatives). Asthere is no central, exchange-published pricing, OTC derivatives can be very difficult to value.If the clearing houses do not understand the risks of the products and find it difficult to valuethem, they might decide not to clear them. Consequently, the usage of exotic derivatives coulddecrease or disappear altogether.
When we trade forward and swap products, we talk about a notional amount. With the exceptionof currency swaps, the notional amount is never exchanged – only the payments generated bythe notional amount are exchanged.
A good source of information regarding notional amounts outstanding and gross marketvalues of OTC derivatives can be found in the statistical annex of the Bank for InternationalSettlements’ “Quarterly Review”.11 In the BIS Quarterly Review for December 2013, Table19, “Amounts outstanding of over-the-counter (OTC) derivatives”, showed the amounts andvalues for the main risk categories given in Table 2.49.
Interest rate contracts have by far the greatest number of notional amounts outstanding andgross market values, at USD 561,299 billion and USD 15,155 billion respectively.
2.8.2 Forwards
Q&A
Quest ion
Can you recall the definition of a forward?
Answer
A forward contract is a legally binding obligation to buy or sell an agreed amount of anagreed asset at a certain future time for a certain price agreed today.
We will look at two examples of a forward contract:
1. A forward rate agreement (FRA);2. A currency forward.
11The BIS Quarterly Review is available at the Publications & Research area of the www.bis.org website.
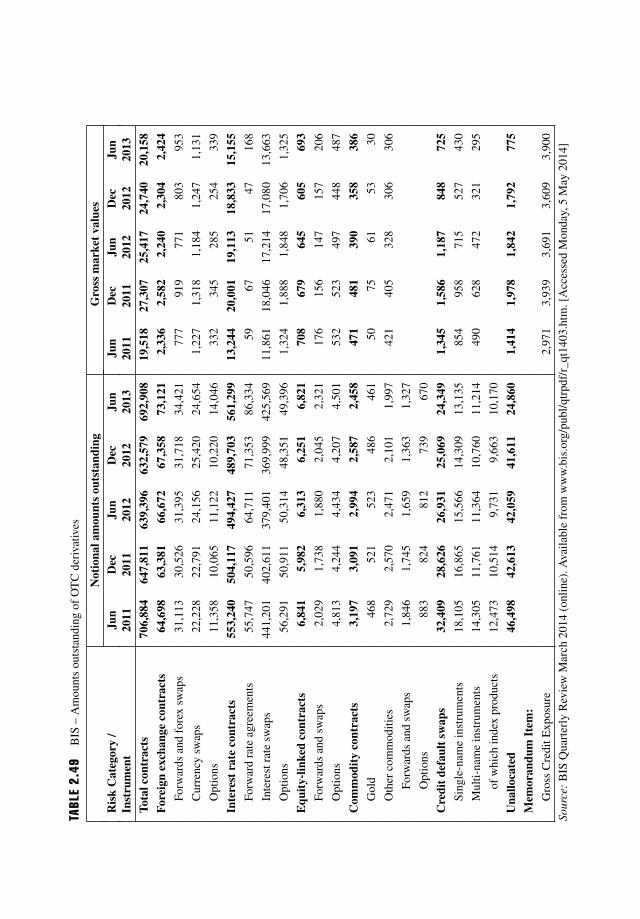
TABL
E2.
49B
IS–
Am
ount
sou
tsta
ndin
gof
OT
Cde
riva
tives
Not
iona
lam
ount
sou
tsta
ndin
gG
ross
mar
ket
valu
esR
isk
Cat
egor
y/
Jun
Dec
Jun
Dec
Jun
Jun
Dec
Jun
Dec
Jun
Inst
rum
ent
2011
2011
2012
2012
2013
2011
2011
2012
2012
2013
Tota
lcon
trac
ts70
6,88
464
7,81
163
9,39
663
2,57
969
2,90
819
,518
27,3
0725
,417
24,7
4020
,158
For
eign
exch
ange
cont
ract
s64
,698
63,3
8166
,672
67,3
5873
,121
2,33
62,
582
2,24
02,
304
2,42
4
Forw
ards
and
fore
xsw
aps
31,1
1330
,526
31,3
9531
,718
34,4
2177
791
977
180
395
3
Cur
renc
ysw
aps
22,2
2822
,791
24,1
5625
,420
24,6
541,
227
1,31
81,
184
1,24
71,
131
Opt
ions
11,3
5810
,065
11,1
2210
,220
14,0
4633
234
528
525
433
9
Inte
rest
rate
cont
ract
s55
3,24
050
4,11
749
4,42
748
9,70
356
1,29
913
,244
20,0
0119
,113
18,8
3315
,155
Forw
ard
rate
agre
emen
ts55
,747
50,5
9664
,711
71,3
5386
,334
5967
5147
168
Inte
rest
rate
swap
s44
1,20
140
2,61
137
9,40
136
9,99
942
5,56
911
,861
18,0
4617
,214
17,0
8013
,663
Opt
ions
56,2
9150
,911
50,3
1448
,351
49,3
961,
324
1,88
81,
848
1,70
61,
325
Equ
ity-
linke
dco
ntra
cts
6,84
15,
982
6,31
36,
251
6,82
170
867
964
560
569
3
Forw
ards
and
swap
s2,
029
1,73
81,
880
2,04
52,
321
176
156
147
157
206
Opt
ions
4,81
34,
244
4,43
44,
207
4,50
153
252
349
744
848
7
Com
mod
ity
cont
ract
s3,
197
3,09
12,
994
2,58
72,
458
471
481
390
358
386
Gol
d46
852
152
348
646
150
7561
5330
Oth
erco
mm
oditi
es2,
729
2,57
02,
471
2,10
11,
997
421
405
328
306
306
Forw
ards
and
swap
s1,
846
1,74
51,
659
1,36
31,
327
Opt
ions
883
824
812
739
670
Cre
dit
defa
ult
swap
s32
,409
28,6
2626
,931
25,0
6924
,349
1,34
51,
586
1,18
784
872
5
Sing
le-n
ame
inst
rum
ents
18,1
0516
,865
15,5
6614
,309
13,1
3585
495
871
552
743
0
Mul
ti-na
me
inst
rum
ents
14,3
0511
,761
11,3
6410
,760
11,2
1449
062
847
232
129
5
ofw
hich
inde
xpr
oduc
ts12
,473
10,5
149,
731
9,66
310
,170
Una
lloca
ted
46,4
9842
,613
42,0
5941
,611
24,8
601,
414
1,97
81,
842
1,79
277
5
Mem
oran
dum
Item
:
Gro
ssC
redi
tExp
osur
e2,
971
3,93
93,
691
3,60
93,
900
Sour
ce:
BIS
Qua
rter
lyR
evie
wM
arch
2014
(onl
ine)
.Ava
ilabl
efr
omw
ww
.bis
.org
/pub
l/qt
rpdf
/r_q
t140
3.ht
m.[
Acc
esse
dM
onda
y,5
May
2014
]
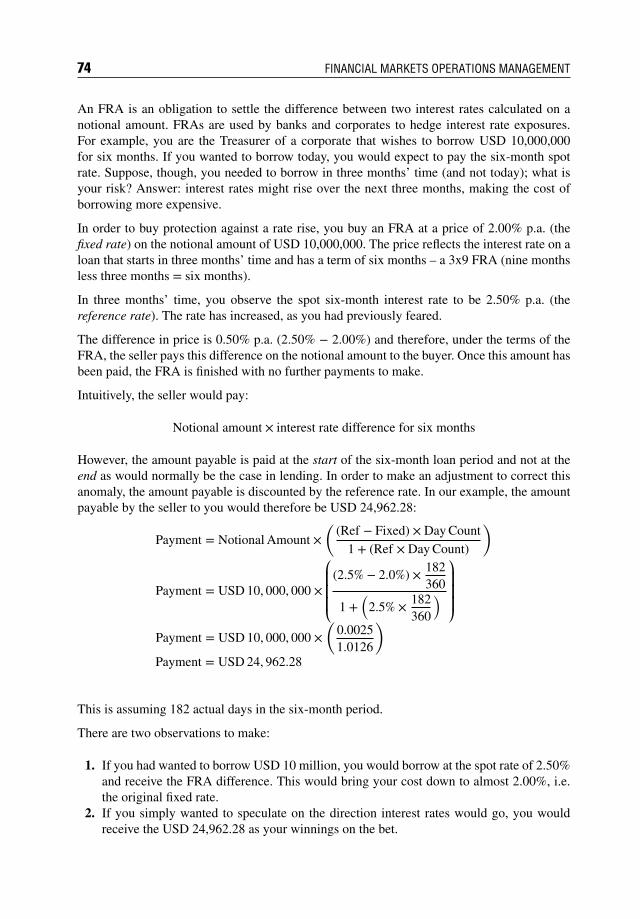
74 FINANCIAL MARKETS OPERATIONS MANAGEMENT
An FRA is an obligation to settle the difference between two interest rates calculated on anotional amount. FRAs are used by banks and corporates to hedge interest rate exposures.For example, you are the Treasurer of a corporate that wishes to borrow USD 10,000,000for six months. If you wanted to borrow today, you would expect to pay the six-month spotrate. Suppose, though, you needed to borrow in three months’ time (and not today); what isyour risk? Answer: interest rates might rise over the next three months, making the cost ofborrowing more expensive.
In order to buy protection against a rate rise, you buy an FRA at a price of 2.00% p.a. (thefixed rate) on the notional amount of USD 10,000,000. The price reflects the interest rate on aloan that starts in three months’ time and has a term of six months – a 3x9 FRA (nine monthsless three months = six months).
In three months’ time, you observe the spot six-month interest rate to be 2.50% p.a. (thereference rate). The rate has increased, as you had previously feared.
The difference in price is 0.50% p.a. (2.50% − 2.00%) and therefore, under the terms of theFRA, the seller pays this difference on the notional amount to the buyer. Once this amount hasbeen paid, the FRA is finished with no further payments to make.
Intuitively, the seller would pay:
Notional amount × interest rate difference for six months
However, the amount payable is paid at the start of the six-month loan period and not at theend as would normally be the case in lending. In order to make an adjustment to correct thisanomaly, the amount payable is discounted by the reference rate. In our example, the amountpayable by the seller to you would therefore be USD 24,962.28:
Payment = Notional Amount ×(
(Ref − Fixed) × Day Count1 + (Ref × Day Count)
)
Payment = USD 10, 000, 000 ×⎛⎜⎜⎜⎝
(2.5% − 2.0%) × 182360
1 +(
2.5% × 182360
)⎞⎟⎟⎟⎠
Payment = USD 10, 000, 000 ×(
0.00251.0126
)Payment = USD 24, 962.28
This is assuming 182 actual days in the six-month period.
There are two observations to make:
1. If you had wanted to borrow USD 10 million, you would borrow at the spot rate of 2.50%and receive the FRA difference. This would bring your cost down to almost 2.00%, i.e.the original fixed rate.
2. If you simply wanted to speculate on the direction interest rates would go, you wouldreceive the USD 24,962.28 as your winnings on the bet.
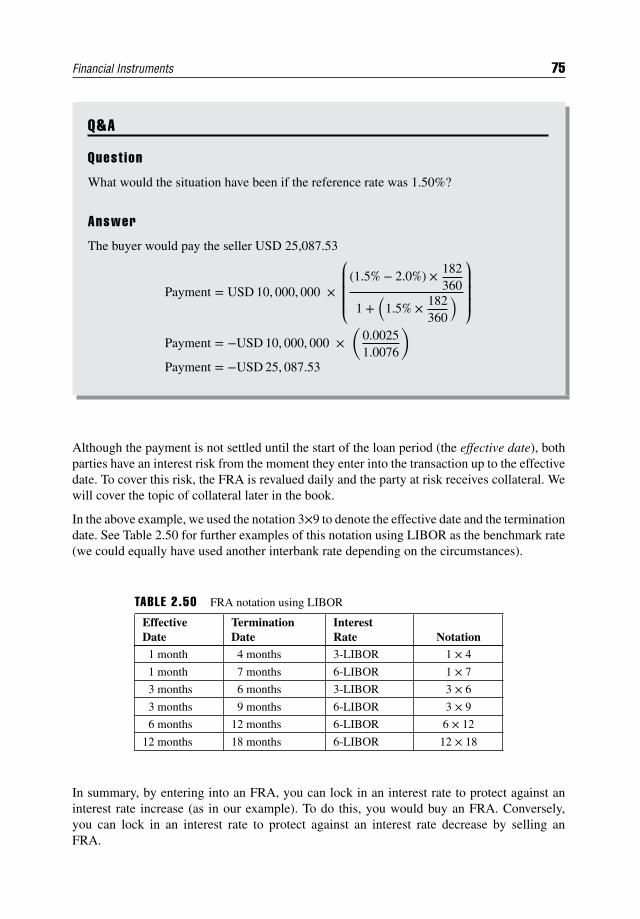
Financial Instruments 75
Q&A
Quest ion
What would the situation have been if the reference rate was 1.50%?
Answer
The buyer would pay the seller USD 25,087.53
Payment = USD 10, 000, 000 ×⎛⎜⎜⎜⎝
(1.5% − 2.0%) × 182360
1 +(
1.5% × 182360
)⎞⎟⎟⎟⎠
Payment = −USD 10, 000, 000 ×(
0.00251.0076
)Payment = −USD 25, 087.53
Although the payment is not settled until the start of the loan period (the effective date), bothparties have an interest risk from the moment they enter into the transaction up to the effectivedate. To cover this risk, the FRA is revalued daily and the party at risk receives collateral. Wewill cover the topic of collateral later in the book.
In the above example, we used the notation 3×9 to denote the effective date and the terminationdate. See Table 2.50 for further examples of this notation using LIBOR as the benchmark rate(we could equally have used another interbank rate depending on the circumstances).
TABLE 2.50 FRA notation using LIBOR
EffectiveDate
TerminationDate
InterestRate Notation
1 month 4 months 3-LIBOR 1 × 4
1 month 7 months 6-LIBOR 1 × 7
3 months 6 months 3-LIBOR 3 × 6
3 months 9 months 6-LIBOR 3 × 9
6 months 12 months 6-LIBOR 6 × 12
12 months 18 months 6-LIBOR 12 × 18
In summary, by entering into an FRA, you can lock in an interest rate to protect against aninterest rate increase (as in our example). To do this, you would buy an FRA. Conversely,you can lock in an interest rate to protect against an interest rate decrease by selling anFRA.
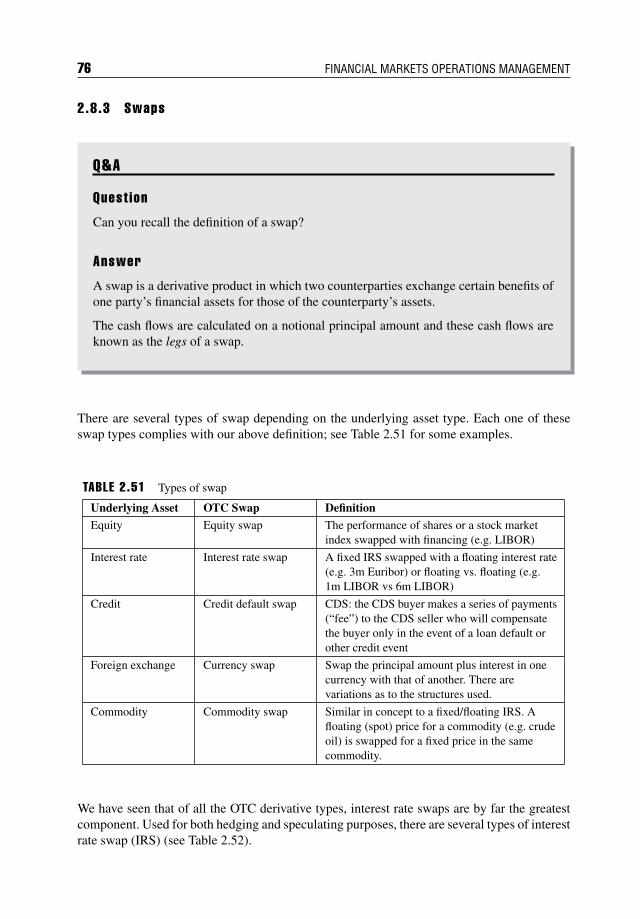
76 FINANCIAL MARKETS OPERATIONS MANAGEMENT
2.8.3 Swaps
Q&A
Quest ion
Can you recall the definition of a swap?
Answer
A swap is a derivative product in which two counterparties exchange certain benefits ofone party’s financial assets for those of the counterparty’s assets.
The cash flows are calculated on a notional principal amount and these cash flows areknown as the legs of a swap.
There are several types of swap depending on the underlying asset type. Each one of theseswap types complies with our above definition; see Table 2.51 for some examples.
TABLE 2.51 Types of swap
Underlying Asset OTC Swap Definition
Equity Equity swap The performance of shares or a stock marketindex swapped with financing (e.g. LIBOR)
Interest rate Interest rate swap A fixed IRS swapped with a floating interest rate(e.g. 3m Euribor) or floating vs. floating (e.g.1m LIBOR vs 6m LIBOR)
Credit Credit default swap CDS: the CDS buyer makes a series of payments(“fee”) to the CDS seller who will compensatethe buyer only in the event of a loan default orother credit event
Foreign exchange Currency swap Swap the principal amount plus interest in onecurrency with that of another. There arevariations as to the structures used.
Commodity Commodity swap Similar in concept to a fixed/floating IRS. Afloating (spot) price for a commodity (e.g. crudeoil) is swapped for a fixed price in the samecommodity.
We have seen that of all the OTC derivative types, interest rate swaps are by far the greatestcomponent. Used for both hedging and speculating purposes, there are several types of interestrate swap (IRS) (see Table 2.52).
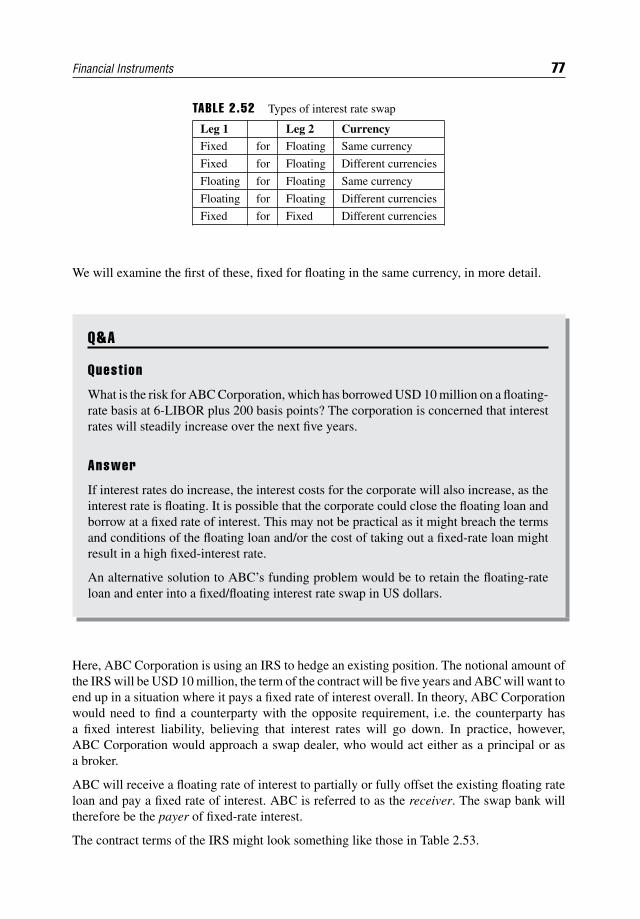
Financial Instruments 77
TABLE 2.52 Types of interest rate swap
Leg 1 Leg 2 CurrencyFixed for Floating Same currency
Fixed for Floating Different currencies
Floating for Floating Same currency
Floating for Floating Different currencies
Fixed for Fixed Different currencies
We will examine the first of these, fixed for floating in the same currency, in more detail.
Q&A
Quest ion
What is the risk for ABC Corporation, which has borrowed USD 10 million on a floating-rate basis at 6-LIBOR plus 200 basis points? The corporation is concerned that interestrates will steadily increase over the next five years.
Answer
If interest rates do increase, the interest costs for the corporate will also increase, as theinterest rate is floating. It is possible that the corporate could close the floating loan andborrow at a fixed rate of interest. This may not be practical as it might breach the termsand conditions of the floating loan and/or the cost of taking out a fixed-rate loan mightresult in a high fixed-interest rate.
An alternative solution to ABC’s funding problem would be to retain the floating-rateloan and enter into a fixed/floating interest rate swap in US dollars.
Here, ABC Corporation is using an IRS to hedge an existing position. The notional amount ofthe IRS will be USD 10 million, the term of the contract will be five years and ABC will want toend up in a situation where it pays a fixed rate of interest overall. In theory, ABC Corporationwould need to find a counterparty with the opposite requirement, i.e. the counterparty hasa fixed interest liability, believing that interest rates will go down. In practice, however,ABC Corporation would approach a swap dealer, who would act either as a principal or asa broker.
ABC will receive a floating rate of interest to partially or fully offset the existing floating rateloan and pay a fixed rate of interest. ABC is referred to as the receiver. The swap bank willtherefore be the payer of fixed-rate interest.
The contract terms of the IRS might look something like those in Table 2.53.
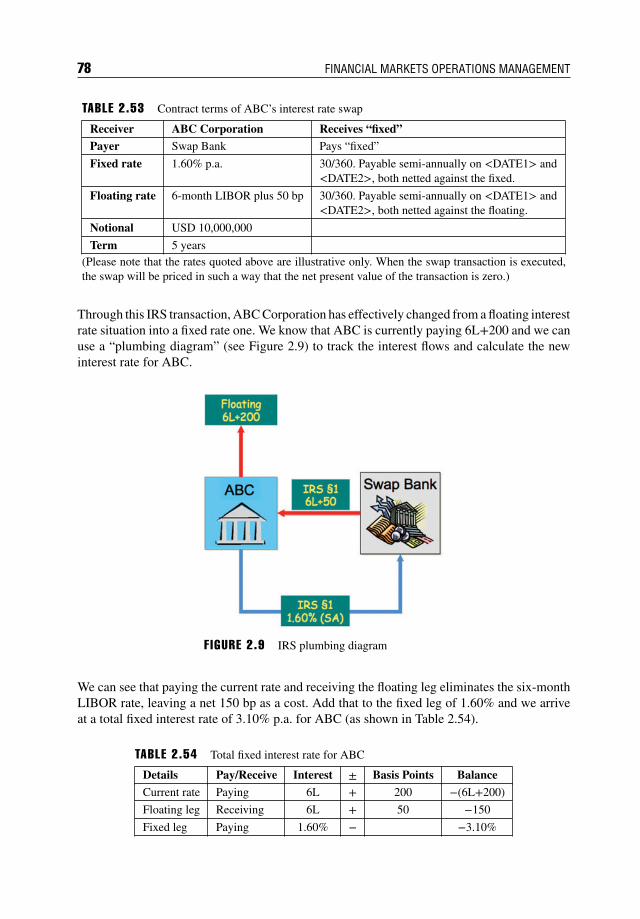
78 FINANCIAL MARKETS OPERATIONS MANAGEMENT
TABLE 2.53 Contract terms of ABC’s interest rate swap
Receiver ABC Corporation Receives “fixed”Payer Swap Bank Pays “fixed”
Fixed rate 1.60% p.a. 30/360. Payable semi-annually on <DATE1> and<DATE2>, both netted against the fixed.
Floating rate 6-month LIBOR plus 50 bp 30/360. Payable semi-annually on <DATE1> and<DATE2>, both netted against the floating.
Notional USD 10,000,000
Term 5 years(Please note that the rates quoted above are illustrative only. When the swap transaction is executed,the swap will be priced in such a way that the net present value of the transaction is zero.)
Through this IRS transaction, ABC Corporation has effectively changed from a floating interestrate situation into a fixed rate one. We know that ABC is currently paying 6L+200 and we canuse a “plumbing diagram” (see Figure 2.9) to track the interest flows and calculate the newinterest rate for ABC.
F IGURE 2.9 IRS plumbing diagram
We can see that paying the current rate and receiving the floating leg eliminates the six-monthLIBOR rate, leaving a net 150 bp as a cost. Add that to the fixed leg of 1.60% and we arriveat a total fixed interest rate of 3.10% p.a. for ABC (as shown in Table 2.54).
TABLE 2.54 Total fixed interest rate for ABC
Details Pay/Receive Interest ± Basis Points Balance
Current rate Paying 6L + 200 −(6L+200)
Floating leg Receiving 6L + 50 −150
Fixed leg Paying 1.60% − −3.10%
Financial Instruments 79
Let us assume that Swap Bank has a second counterparty/client, XYZ Inc., which has a loanand is paying 1.80% fixed. XYZ enters into an IRS transaction with Swap Bank on the termsshown in Table 2.55.
TABLE 2.55 Terms of XYZ’s interest rate swap
Receiver Swap Bank Receives “fixed”
Payer XYZ Inc Pays “fixed”
Fixed rate 1.58% p.a. 30/360. Payablesemi-annually on <DATE1>and <DATE2>, both nettedagainst the fixed.
Floating rate 6-monthLIBOR plus50 bp
30/360. Payablesemi-annually on <DATE1>and <DATE2>, both nettedagainst the floating.
Notional USD10,000,000
Term 5 years
Q&A
Exercise
Please calculate the following:
The total cost for XYZ Inc. The profit/loss for Swap Bank.
Answers
The cost to XYZ Inc will be 6L+72 (paying 1.80% and receiving 1.58% leaves a costof 22 basis points to which is added the floating rate of 6L plus 50 basis points) – seeTable 2.56.
TABLE 2.56 Cost to XYZ Inc
Details Pay/Receive Interest ± Basis Points Balance
Current rate Paying 1.80% −1.80%
Floating leg Receiving 1.58% 1.58%
Fixed leg Paying 6L + 50 6L+72
If we now combine both IRS transactions (see Figure 2.10), we can see how much SwapBank, in the role of agent, will make or lose.
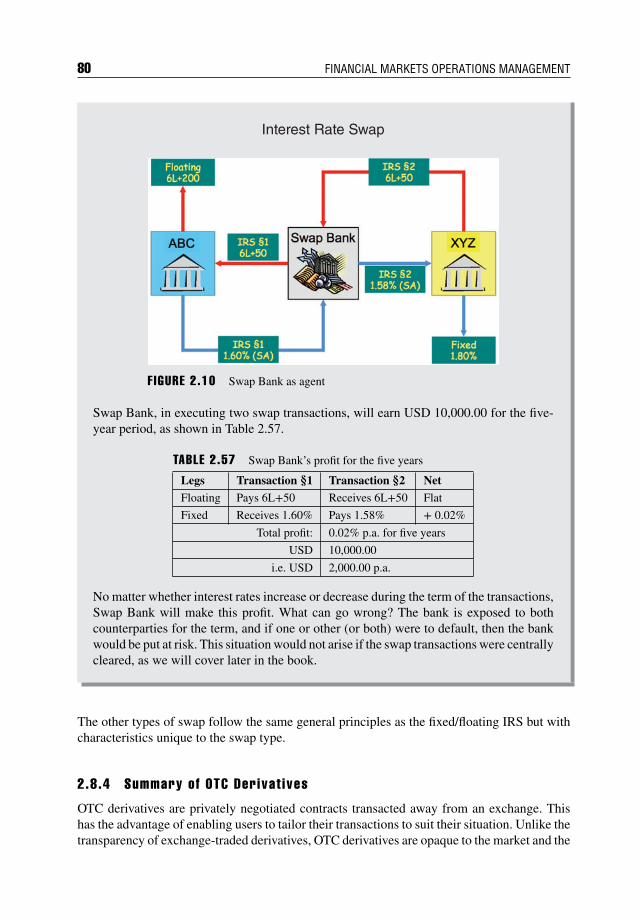
80 FINANCIAL MARKETS OPERATIONS MANAGEMENT
Interest Rate Swap
F IGURE 2.10 Swap Bank as agent
Swap Bank, in executing two swap transactions, will earn USD 10,000.00 for the five-year period, as shown in Table 2.57.
TABLE 2.57 Swap Bank’s profit for the five years
Legs Transaction §1 Transaction §2 Net
Floating Pays 6L+50 Receives 6L+50 Flat
Fixed Receives 1.60% Pays 1.58% + 0.02%
Total profit: 0.02% p.a. for five years
USD 10,000.00
i.e. USD 2,000.00 p.a.
No matter whether interest rates increase or decrease during the term of the transactions,Swap Bank will make this profit. What can go wrong? The bank is exposed to bothcounterparties for the term, and if one or other (or both) were to default, then the bankwould be put at risk. This situation would not arise if the swap transactions were centrallycleared, as we will cover later in the book.
The other types of swap follow the same general principles as the fixed/floating IRS but withcharacteristics unique to the swap type.
2.8.4 Summary of OTC Derivat ives
OTC derivatives are privately negotiated contracts transacted away from an exchange. Thishas the advantage of enabling users to tailor their transactions to suit their situation. Unlike thetransparency of exchange-traded derivatives, OTC derivatives are opaque to the market and the
Financial Instruments 81
regulators. This situation is changing with the move to centrally clear the more straightforward,vanilla-type contracts. Whether this will lead to the contracts being traded on an exchangeremains to be seen.
One disadvantage of OTC is that the terms and conditions of every transaction must be clearlystated in the transaction confirmation; even down to the granular level of specifying day-countconventions.
The ISDA Bookstore (www.isda.org/publications/pubguide.aspx) contains a wide range ofpublications that cover the ISDA Master Agreement, definitional booklets and confirmationsand regulatory documentation.
2.9 SUMMARY
2.9.1 F inancia l Products in General
Financial products can be issued for a particular purpose and subsequently traded.
2.9.2 Cash Markets
The cash markets are divided into short-term and long-term products and these are issuedby governments (and their various agencies), supranational organisations and corporations toenable them to satisfy their particular financial requirements.
We tend to refer to the issuance and trading of short-term products as the money markets andthese include:
Cash loans/deposits; Commercial paper; Certificates of deposit; Bankers’ acceptances; Treasury bills; Bills of exchange.
By contrast, we refer to the longer-term products as the securities markets and these include:
Equities (ordinary shares/common stock); Debt (corporate bonds, treasury bonds, supranational bonds); Hybrids (preference shares, convertible bonds, equity warrants).
Securities are traded for cash settlement, as payment is expected in full and within a few daysfollowing the trade date.
2.9.3 Derivat ives Markets
Derivatives are financial contracts that derive their value from underlying assets such asequities, bonds, interest rates, stock market indices, etc. Derivative contracts are not issued by
82 FINANCIAL MARKETS OPERATIONS MANAGEMENT
the issuers of the underlying assets; rather, they are issued either by an exchange (exchange-traded derivatives – ETDs) or privately between two counterparties (OTC derivatives).
There are four types of derivative contract:
1. Forwards (OTC);2. Futures (ETD);3. Options (ETD and OTC);4. Swaps (OTC).
This market is changing; OTC derivative contracts are becoming more transparent as they areincreasingly being reported to a trade repository and cleared through a central clearing housesystem. ETDs have always been traded on an exchange and cleared centrally.
Derivative contracts are either exercised (into the underlying assets or cash) or closed out priorto the last trading day. In the meantime, the financial risks associated with these products arecovered, depending on the product type, by a system of margin calls, premium payments andcollateral exchanges. The full economic value of the contract is not settled on the trade date.
CHAPTER 3Data Management
3.1 INTRODUCTION
In today’s financial world, the typical Operations Department has to capture and process vastamounts of data and information. In our personal lives we have to remember a multitude of loginIDs, passwords, PIN numbers, telephone numbers, addresses of family, friends, customers, etc.How do we remember any or all of these different types of information? We can either mem-orise them (open to forgetfulness) or write them down (open to losing the paperwork). Eitherway, we run the risk of not having the correct information at the moment when we actuallyrequire it.
We are probably able to correctly identify our personal telephone numbers, home address andour most frequently used PIN numbers; we might possibly think we can remember some ofour less frequently used information but have little chance of remembering occasionally usedinformation. What, then, can we do? The obvious solution would be to develop a databaseinto which we can enter a variety of different types of information that can be accessed easilywhen needed. Straight away you might be able to identify a problem with this approach –your database might be appropriate for your needs but inappropriate for everybody else’s!In one sense, this is what has happened in the industry: banks, securities houses, fundmanagement companies and all the other types of participant have developed their owndatabases focusing on their own requirements. What is needed, however, is a high degree ofstandardisation, where information can be generated from one source and be understood byall those individuals and institutions that require it.
By the end of this chapter, you will:
Appreciate the importance of data and the information that comes from them; Know the different types of data and how they impact on the Operations Department; Understand how data are managed; Have learnt about the new global standard for legal entity identification.
83
84 FINANCIAL MARKETS OPERATIONS MANAGEMENT
3.2 IMPORTANCE OF REFERENCE DATA AND STANDARDISATION
3.2.1 Introduct ion
In the early 1980s, the author was working in a Eurobond Settlements Department wheremanual ledgers were still being used to record Eurobond purchases and sales. He remembersthat:
“Euroclear, who held our Eurobonds, would publish a thick, hard-copy directoryevery six months containing basic details of every security that they were preparedto hold.
Every time a transaction ticket came down from the trading floor, the first thing wehad to do was to find the particular bond in the Euroclear directory. From this, wecould find the following information:
The correct name of the bond, including the coupon rate and full maturity date); The securities identification number (unique to Euroclear); The last coupon payment date.
This would enable us to calculate the accrued interest, arrange for a confirmationnote to be typed up and prepare the appropriate delivery/receipt instructions. Thesewould be transmitted to Euroclear’s proprietary system (known as Euclid) via anacoustic coupler (an interface device for coupling electrical signals by acousticalmeans) that was hooked up to a telephone handset.
In effect, we were using the directory as a manual version of a securities database.The main drawback was that this process took quite some time, especially as therewas only one directory book for the whole department! The situation improved whenthe department was computerised; however, the system that we purchased used theEuroclear securities identification system (as we had done previously in the manualenvironment). This gave us problems when we were communicating with Cedel (nowknown as Clearstream Banking Luxembourg). Cedel had its own directory and uniquenumbering system…”
3.2.2 Basic Securit ies Transact ions
Let us consider a basic securities transaction, thinking about the information that is providedby the Front Office and comparing that with the information we need to be able to settlethe transaction effectively. In today’s environment, the majority of transaction informationwill arrive in the Operations area in an automated and electronic fashion. To help with thevisualisation of the information, it is worth considering a transaction example using a hardcopy dealing ticket.
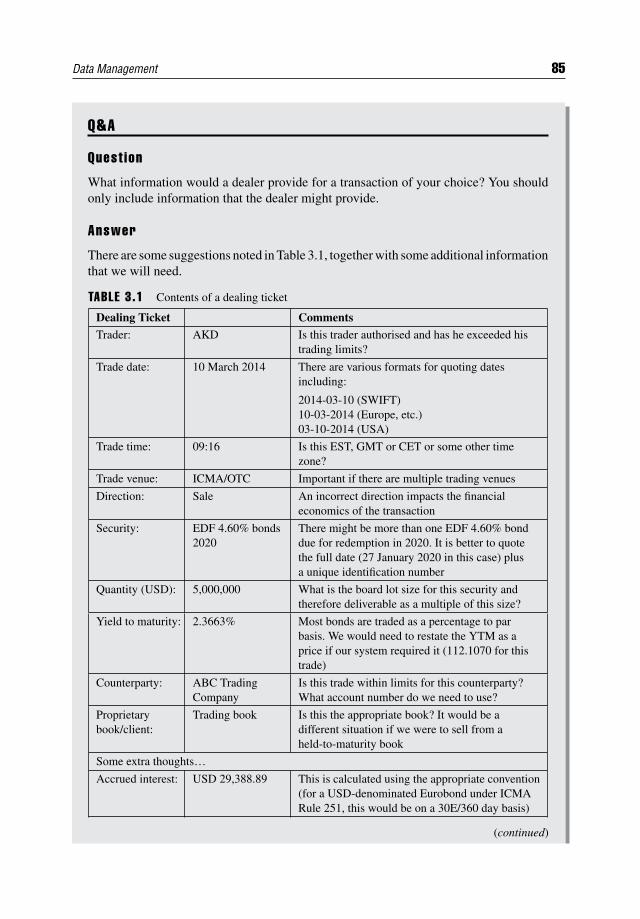
Data Management 85
Q&A
Quest ion
What information would a dealer provide for a transaction of your choice? You shouldonly include information that the dealer might provide.
Answer
There are some suggestions noted in Table 3.1, together with some additional informationthat we will need.
TABLE 3.1 Contents of a dealing ticket
Dealing Ticket CommentsTrader: AKD Is this trader authorised and has he exceeded his
trading limits?
Trade date: 10 March 2014 There are various formats for quoting datesincluding:
2014-03-10 (SWIFT)10-03-2014 (Europe, etc.)03-10-2014 (USA)
Trade time: 09:16 Is this EST, GMT or CET or some other timezone?
Trade venue: ICMA/OTC Important if there are multiple trading venues
Direction: Sale An incorrect direction impacts the financialeconomics of the transaction
Security: EDF 4.60% bonds2020
There might be more than one EDF 4.60% bonddue for redemption in 2020. It is better to quotethe full date (27 January 2020 in this case) plusa unique identification number
Quantity (USD): 5,000,000 What is the board lot size for this security andtherefore deliverable as a multiple of this size?
Yield to maturity: 2.3663% Most bonds are traded as a percentage to parbasis. We would need to restate the YTM as aprice if our system required it (112.1070 for thistrade)
Counterparty: ABC TradingCompany
Is this trade within limits for this counterparty?What account number do we need to use?
Proprietarybook/client:
Trading book Is this the appropriate book? It would be adifferent situation if we were to sell from aheld-to-maturity book
Some extra thoughts…Accrued interest: USD 29,388.89 This is calculated using the appropriate convention
(for a USD-denominated Eurobond under ICMARule 251, this would be on a 30E/360 day basis)
(continued)
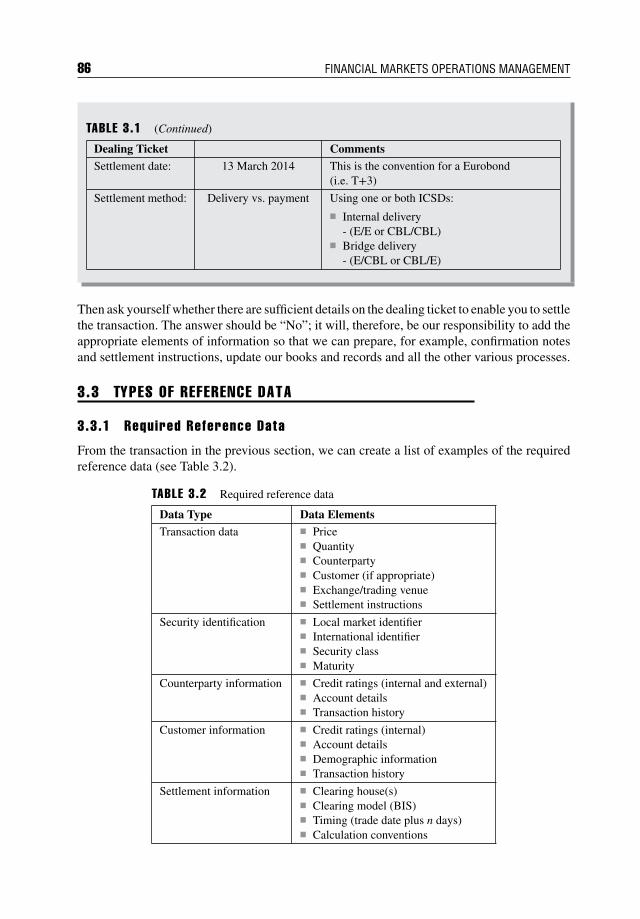
86 FINANCIAL MARKETS OPERATIONS MANAGEMENT
TABLE 3.1 (Continued)
Dealing Ticket CommentsSettlement date: 13 March 2014 This is the convention for a Eurobond
(i.e. T+3)
Settlement method: Delivery vs. payment Using one or both ICSDs:
Internal delivery- (E/E or CBL/CBL)
Bridge delivery- (E/CBL or CBL/E)
Then ask yourself whether there are sufficient details on the dealing ticket to enable you to settlethe transaction. The answer should be “No”; it will, therefore, be our responsibility to add theappropriate elements of information so that we can prepare, for example, confirmation notesand settlement instructions, update our books and records and all the other various processes.
3.3 TYPES OF REFERENCE DATA
3.3.1 Required Reference Data
From the transaction in the previous section, we can create a list of examples of the requiredreference data (see Table 3.2).
TABLE 3.2 Required reference data
Data Type Data ElementsTransaction data Price
Quantity Counterparty Customer (if appropriate) Exchange/trading venue Settlement instructions
Security identification Local market identifier International identifier Security class Maturity
Counterparty information Credit ratings (internal and external) Account details Transaction history
Customer information Credit ratings (internal) Account details Demographic information Transaction history
Settlement information Clearing house(s) Clearing model (BIS) Timing (trade date plus n days) Calculation conventions
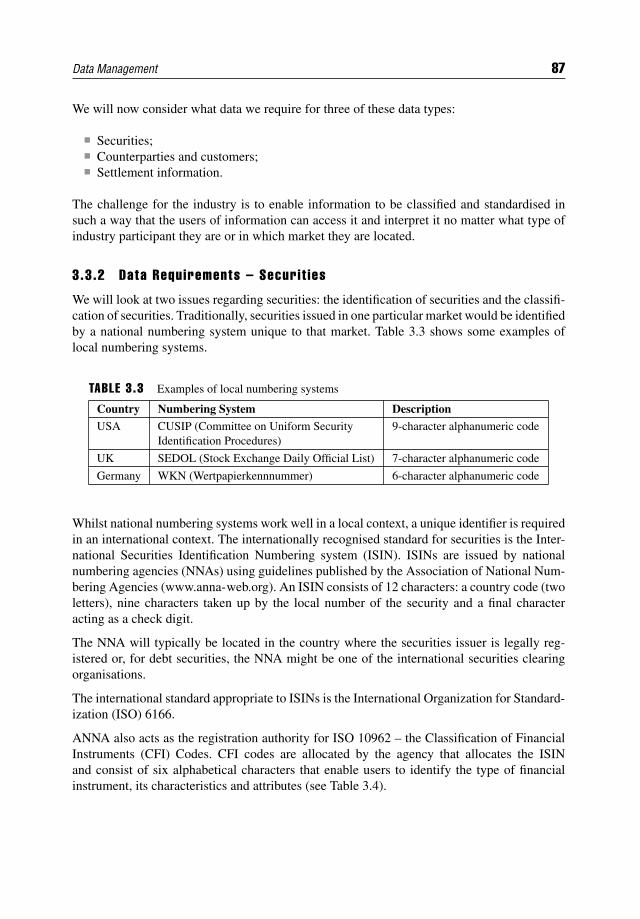
Data Management 87
We will now consider what data we require for three of these data types:
Securities; Counterparties and customers; Settlement information.
The challenge for the industry is to enable information to be classified and standardised insuch a way that the users of information can access it and interpret it no matter what type ofindustry participant they are or in which market they are located.
3.3.2 Data Requirements – Securit ies
We will look at two issues regarding securities: the identification of securities and the classifi-cation of securities. Traditionally, securities issued in one particular market would be identifiedby a national numbering system unique to that market. Table 3.3 shows some examples oflocal numbering systems.
TABLE 3.3 Examples of local numbering systems
Country Numbering System DescriptionUSA CUSIP (Committee on Uniform Security
Identification Procedures)9-character alphanumeric code
UK SEDOL (Stock Exchange Daily Official List) 7-character alphanumeric code
Germany WKN (Wertpapierkennnummer) 6-character alphanumeric code
Whilst national numbering systems work well in a local context, a unique identifier is requiredin an international context. The internationally recognised standard for securities is the Inter-national Securities Identification Numbering system (ISIN). ISINs are issued by nationalnumbering agencies (NNAs) using guidelines published by the Association of National Num-bering Agencies (www.anna-web.org). An ISIN consists of 12 characters: a country code (twoletters), nine characters taken up by the local number of the security and a final characteracting as a check digit.
The NNA will typically be located in the country where the securities issuer is legally reg-istered or, for debt securities, the NNA might be one of the international securities clearingorganisations.
The international standard appropriate to ISINs is the International Organization for Standard-ization (ISO) 6166.
ANNA also acts as the registration authority for ISO 10962 – the Classification of FinancialInstruments (CFI) Codes. CFI codes are allocated by the agency that allocates the ISINand consist of six alphabetical characters that enable users to identify the type of financialinstrument, its characteristics and attributes (see Table 3.4).
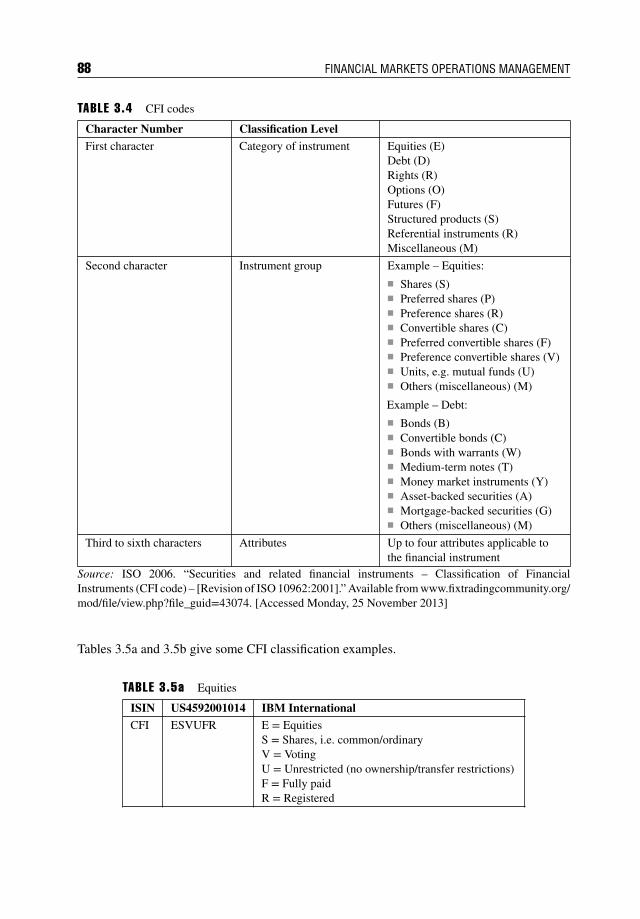
88 FINANCIAL MARKETS OPERATIONS MANAGEMENT
TABLE 3.4 CFI codes
Character Number Classification LevelFirst character Category of instrument Equities (E)
Debt (D)Rights (R)Options (O)Futures (F)Structured products (S)Referential instruments (R)Miscellaneous (M)
Second character Instrument group Example – Equities:
Shares (S) Preferred shares (P) Preference shares (R) Convertible shares (C) Preferred convertible shares (F) Preference convertible shares (V) Units, e.g. mutual funds (U) Others (miscellaneous) (M)
Example – Debt:
Bonds (B) Convertible bonds (C) Bonds with warrants (W) Medium-term notes (T) Money market instruments (Y) Asset-backed securities (A) Mortgage-backed securities (G) Others (miscellaneous) (M)
Third to sixth characters Attributes Up to four attributes applicable tothe financial instrument
Source: ISO 2006. “Securities and related financial instruments – Classification of FinancialInstruments (CFI code) – [Revision of ISO 10962:2001].” Available from www.fixtradingcommunity.org/mod/file/view.php?file_guid=43074. [Accessed Monday, 25 November 2013]
Tables 3.5a and 3.5b give some CFI classification examples.
TABLE 3.5a Equities
ISIN US4592001014 IBM InternationalCFI ESVUFR E = Equities
S = Shares, i.e. common/ordinaryV = VotingU = Unrestricted (no ownership/transfer restrictions)F = Fully paidR = Registered
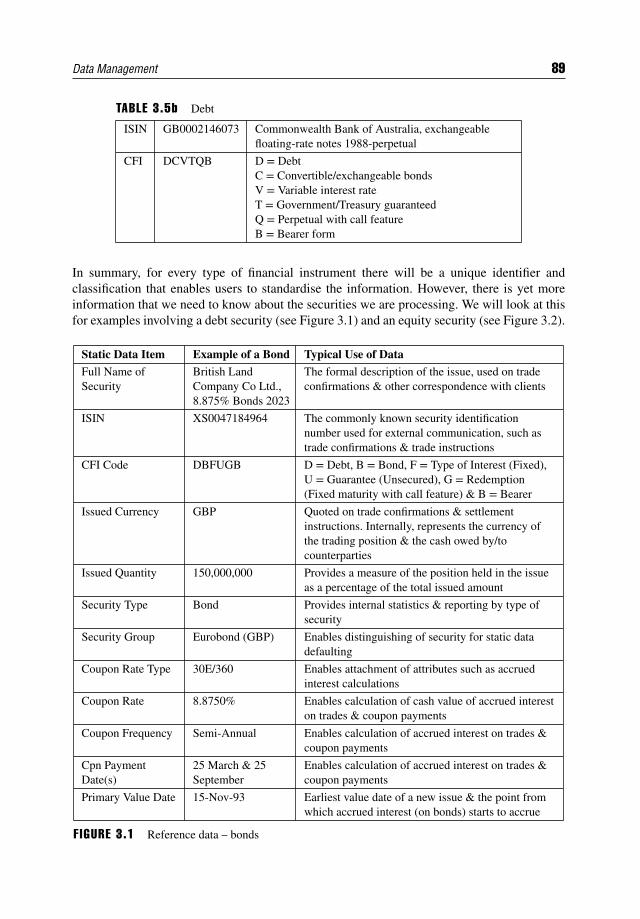
Data Management 89
TABLE 3.5b Debt
ISIN GB0002146073 Commonwealth Bank of Australia, exchangeablefloating-rate notes 1988-perpetual
CFI DCVTQB D = DebtC = Convertible/exchangeable bondsV = Variable interest rateT = Government/Treasury guaranteedQ = Perpetual with call featureB = Bearer form
In summary, for every type of financial instrument there will be a unique identifier andclassification that enables users to standardise the information. However, there is yet moreinformation that we need to know about the securities we are processing. We will look at thisfor examples involving a debt security (see Figure 3.1) and an equity security (see Figure 3.2).
Static Data Item Example of a Bond Typical Use of Data
Full Name ofSecurity
British LandCompany Co Ltd.,8.875% Bonds 2023
The formal description of the issue, used on tradeconfirmations & other correspondence with clients
ISIN XS0047184964 The commonly known security identificationnumber used for external communication, such astrade confirmations & trade instructions
CFI Code DBFUGB D = Debt, B = Bond, F = Type of Interest (Fixed),U = Guarantee (Unsecured), G = Redemption(Fixed maturity with call feature) & B = Bearer
Issued Currency GBP Quoted on trade confirmations & settlementinstructions. Internally, represents the currency ofthe trading position & the cash owed by/tocounterparties
Issued Quantity 150,000,000 Provides a measure of the position held in the issueas a percentage of the total issued amount
Security Type Bond Provides internal statistics & reporting by type ofsecurity
Security Group Eurobond (GBP) Enables distinguishing of security for static datadefaulting
Coupon Rate Type 30E/360 Enables attachment of attributes such as accruedinterest calculations
Coupon Rate 8.8750% Enables calculation of cash value of accrued intereston trades & coupon payments
Coupon Frequency Semi-Annual Enables calculation of accrued interest on trades &coupon payments
Cpn PaymentDate(s)
25 March & 25September
Enables calculation of accrued interest on trades &coupon payments
Primary Value Date 15-Nov-93 Earliest value date of a new issue & the point fromwhich accrued interest (on bonds) starts to accrue
F IGURE 3.1 Reference data – bonds
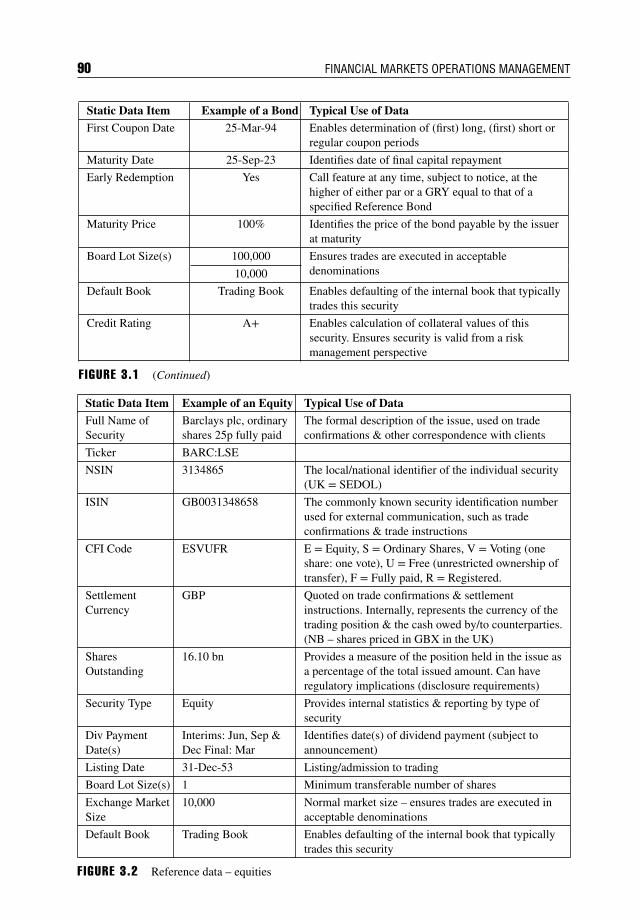
90 FINANCIAL MARKETS OPERATIONS MANAGEMENT
Static Data Item Example of a Bond Typical Use of Data
First Coupon Date 25-Mar-94 Enables determination of (first) long, (first) short orregular coupon periods
Maturity Date 25-Sep-23 Identifies date of final capital repayment
Early Redemption Yes Call feature at any time, subject to notice, at thehigher of either par or a GRY equal to that of aspecified Reference Bond
Maturity Price 100% Identifies the price of the bond payable by the issuerat maturity
Board Lot Size(s) 100,000 Ensures trades are executed in acceptabledenominations10,000
Default Book Trading Book Enables defaulting of the internal book that typicallytrades this security
Credit Rating A+ Enables calculation of collateral values of thissecurity. Ensures security is valid from a riskmanagement perspective
F IGURE 3.1 (Continued)
Static Data Item Example of an Equity Typical Use of Data
Full Name ofSecurity
Barclays plc, ordinaryshares 25p fully paid
The formal description of the issue, used on tradeconfirmations & other correspondence with clients
Ticker BARC:LSE
NSIN 3134865 The local/national identifier of the individual security(UK = SEDOL)
ISIN GB0031348658 The commonly known security identification numberused for external communication, such as tradeconfirmations & trade instructions
CFI Code ESVUFR E = Equity, S = Ordinary Shares, V = Voting (oneshare: one vote), U = Free (unrestricted ownership oftransfer), F = Fully paid, R = Registered.
SettlementCurrency
GBP Quoted on trade confirmations & settlementinstructions. Internally, represents the currency of thetrading position & the cash owed by/to counterparties.(NB – shares priced in GBX in the UK)
SharesOutstanding
16.10 bn Provides a measure of the position held in the issue asa percentage of the total issued amount. Can haveregulatory implications (disclosure requirements)
Security Type Equity Provides internal statistics & reporting by type ofsecurity
Div PaymentDate(s)
Interims: Jun, Sep &Dec Final: Mar
Identifies date(s) of dividend payment (subject toannouncement)
Listing Date 31-Dec-53 Listing/admission to trading
Board Lot Size(s) 1 Minimum transferable number of shares
Exchange MarketSize
10,000 Normal market size – ensures trades are executed inacceptable denominations
Default Book Trading Book Enables defaulting of the internal book that typicallytrades this security
F IGURE 3.2 Reference data – equities
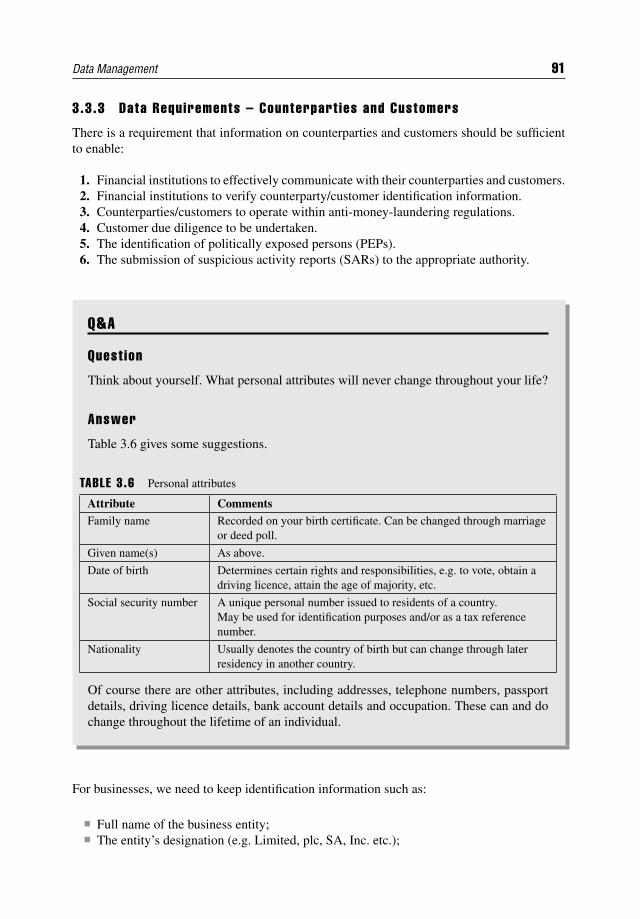
Data Management 91
3.3.3 Data Requirements – Counterpart ies and Customers
There is a requirement that information on counterparties and customers should be sufficientto enable:
1. Financial institutions to effectively communicate with their counterparties and customers.2. Financial institutions to verify counterparty/customer identification information.3. Counterparties/customers to operate within anti-money-laundering regulations.4. Customer due diligence to be undertaken.5. The identification of politically exposed persons (PEPs).6. The submission of suspicious activity reports (SARs) to the appropriate authority.
Q&A
Quest ion
Think about yourself. What personal attributes will never change throughout your life?
Answer
Table 3.6 gives some suggestions.
TABLE 3.6 Personal attributes
Attribute CommentsFamily name Recorded on your birth certificate. Can be changed through marriage
or deed poll.
Given name(s) As above.
Date of birth Determines certain rights and responsibilities, e.g. to vote, obtain adriving licence, attain the age of majority, etc.
Social security number A unique personal number issued to residents of a country.May be used for identification purposes and/or as a tax referencenumber.
Nationality Usually denotes the country of birth but can change through laterresidency in another country.
Of course there are other attributes, including addresses, telephone numbers, passportdetails, driving licence details, bank account details and occupation. These can and dochange throughout the lifetime of an individual.
For businesses, we need to keep identification information such as:
Full name of the business entity; The entity’s designation (e.g. Limited, plc, SA, Inc. etc.);
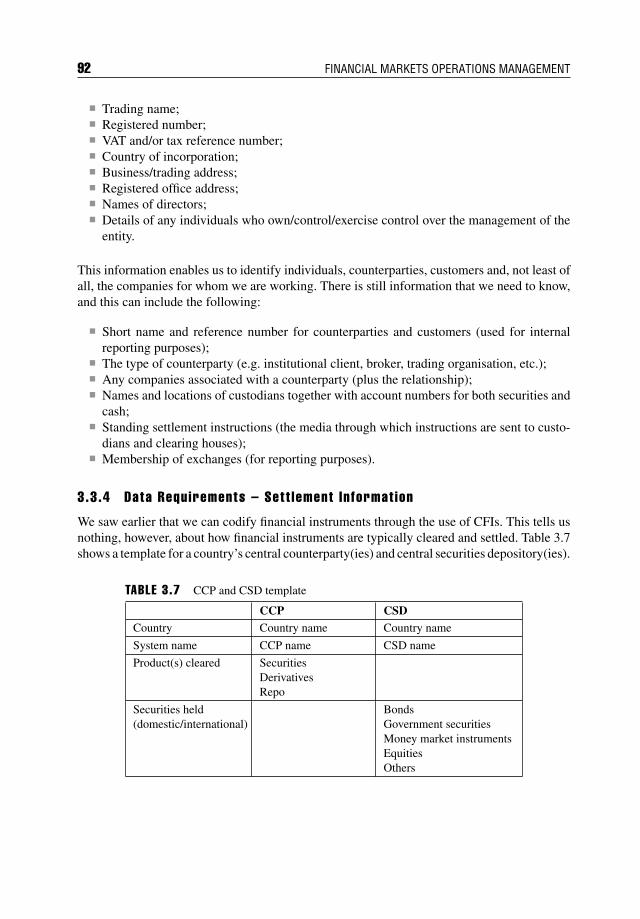
92 FINANCIAL MARKETS OPERATIONS MANAGEMENT
Trading name; Registered number; VAT and/or tax reference number; Country of incorporation; Business/trading address; Registered office address; Names of directors; Details of any individuals who own/control/exercise control over the management of the
entity.
This information enables us to identify individuals, counterparties, customers and, not least ofall, the companies for whom we are working. There is still information that we need to know,and this can include the following:
Short name and reference number for counterparties and customers (used for internalreporting purposes);
The type of counterparty (e.g. institutional client, broker, trading organisation, etc.); Any companies associated with a counterparty (plus the relationship); Names and locations of custodians together with account numbers for both securities and
cash; Standing settlement instructions (the media through which instructions are sent to custo-
dians and clearing houses); Membership of exchanges (for reporting purposes).
3.3.4 Data Requirements – Sett lement Informat ion
We saw earlier that we can codify financial instruments through the use of CFIs. This tells usnothing, however, about how financial instruments are typically cleared and settled. Table 3.7shows a template for a country’s central counterparty(ies) and central securities depository(ies).
TABLE 3.7 CCP and CSD template
CCP CSDCountry Country name Country name
System name CCP name CSD name
Product(s) cleared SecuritiesDerivativesRepo
Securities held(domestic/international)
BondsGovernment securitiesMoney market instrumentsEquitiesOthers
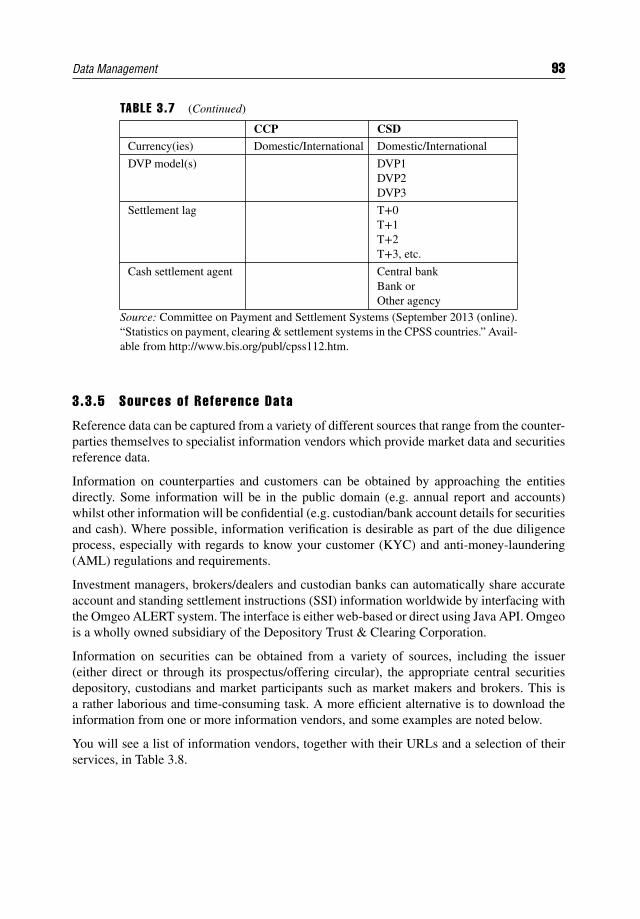
Data Management 93
TABLE 3.7 (Continued)
CCP CSDCurrency(ies) Domestic/International Domestic/International
DVP model(s) DVP1DVP2DVP3
Settlement lag T+0T+1T+2T+3, etc.
Cash settlement agent Central bankBank orOther agency
Source: Committee on Payment and Settlement Systems (September 2013 (online).“Statistics on payment, clearing & settlement systems in the CPSS countries.” Avail-able from http://www.bis.org/publ/cpss112.htm.
3.3.5 Sources of Reference Data
Reference data can be captured from a variety of different sources that range from the counter-parties themselves to specialist information vendors which provide market data and securitiesreference data.
Information on counterparties and customers can be obtained by approaching the entitiesdirectly. Some information will be in the public domain (e.g. annual report and accounts)whilst other information will be confidential (e.g. custodian/bank account details for securitiesand cash). Where possible, information verification is desirable as part of the due diligenceprocess, especially with regards to know your customer (KYC) and anti-money-laundering(AML) regulations and requirements.
Investment managers, brokers/dealers and custodian banks can automatically share accurateaccount and standing settlement instructions (SSI) information worldwide by interfacing withthe Omgeo ALERT system. The interface is either web-based or direct using Java API. Omgeois a wholly owned subsidiary of the Depository Trust & Clearing Corporation.
Information on securities can be obtained from a variety of sources, including the issuer(either direct or through its prospectus/offering circular), the appropriate central securitiesdepository, custodians and market participants such as market makers and brokers. This isa rather laborious and time-consuming task. A more efficient alternative is to download theinformation from one or more information vendors, and some examples are noted below.
You will see a list of information vendors, together with their URLs and a selection of theirservices, in Table 3.8.
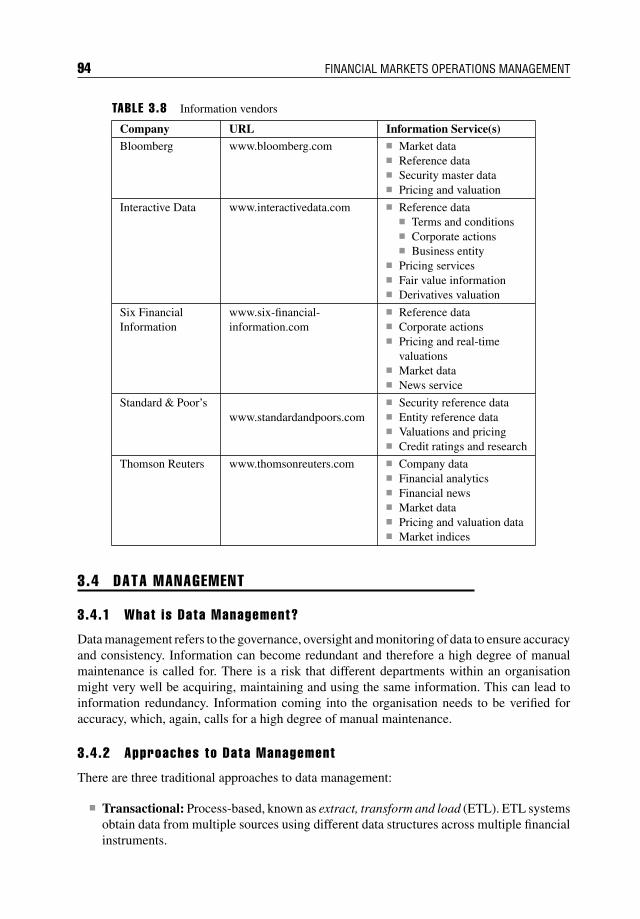
94 FINANCIAL MARKETS OPERATIONS MANAGEMENT
TABLE 3.8 Information vendors
Company URL Information Service(s)Bloomberg www.bloomberg.com Market data
Reference data Security master data Pricing and valuation
Interactive Data www.interactivedata.com Reference data Terms and conditions Corporate actions Business entity
Pricing services Fair value information Derivatives valuation
Six FinancialInformation
www.six-financial-information.com
Reference data Corporate actions Pricing and real-time
valuations Market data News service
Standard & Poor’swww.standardandpoors.com
Security reference data Entity reference data Valuations and pricing Credit ratings and research
Thomson Reuters www.thomsonreuters.com Company data Financial analytics Financial news Market data Pricing and valuation data Market indices
3.4 DATA MANAGEMENT
3.4.1 What is Data Management?
Data management refers to the governance, oversight and monitoring of data to ensure accuracyand consistency. Information can become redundant and therefore a high degree of manualmaintenance is called for. There is a risk that different departments within an organisationmight very well be acquiring, maintaining and using the same information. This can lead toinformation redundancy. Information coming into the organisation needs to be verified foraccuracy, which, again, calls for a high degree of manual maintenance.
3.4.2 Approaches to Data Management
There are three traditional approaches to data management:
Transactional: Process-based, known as extract, transform and load (ETL). ETL systemsobtain data from multiple sources using different data structures across multiple financialinstruments.
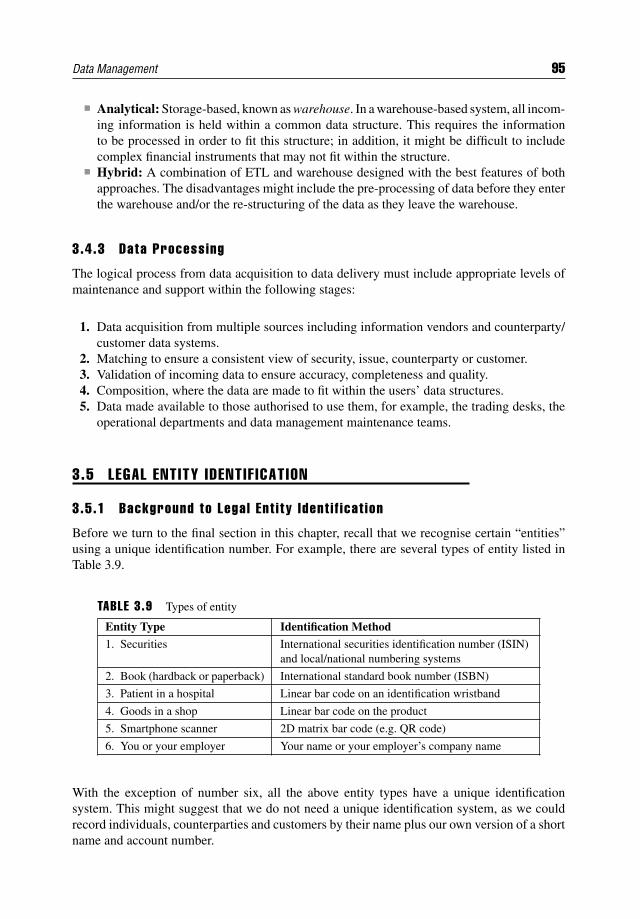
Data Management 95
Analytical: Storage-based, known as warehouse. In a warehouse-based system, all incom-ing information is held within a common data structure. This requires the informationto be processed in order to fit this structure; in addition, it might be difficult to includecomplex financial instruments that may not fit within the structure.
Hybrid: A combination of ETL and warehouse designed with the best features of bothapproaches. The disadvantages might include the pre-processing of data before they enterthe warehouse and/or the re-structuring of the data as they leave the warehouse.
3.4.3 Data Processing
The logical process from data acquisition to data delivery must include appropriate levels ofmaintenance and support within the following stages:
1. Data acquisition from multiple sources including information vendors and counterparty/customer data systems.
2. Matching to ensure a consistent view of security, issue, counterparty or customer.3. Validation of incoming data to ensure accuracy, completeness and quality.4. Composition, where the data are made to fit within the users’ data structures.5. Data made available to those authorised to use them, for example, the trading desks, the
operational departments and data management maintenance teams.
3.5 LEGAL ENTITY IDENTIF ICATION
3.5.1 Background to Legal Ent i ty Ident i f icat ion
Before we turn to the final section in this chapter, recall that we recognise certain “entities”using a unique identification number. For example, there are several types of entity listed inTable 3.9.
TABLE 3.9 Types of entity
Entity Type Identification Method
1. Securities International securities identification number (ISIN)and local/national numbering systems
2. Book (hardback or paperback) International standard book number (ISBN)
3. Patient in a hospital Linear bar code on an identification wristband
4. Goods in a shop Linear bar code on the product
5. Smartphone scanner 2D matrix bar code (e.g. QR code)
6. You or your employer Your name or your employer’s company name
With the exception of number six, all the above entity types have a unique identificationsystem. This might suggest that we do not need a unique identification system, as we couldrecord individuals, counterparties and customers by their name plus our own version of a shortname and account number.
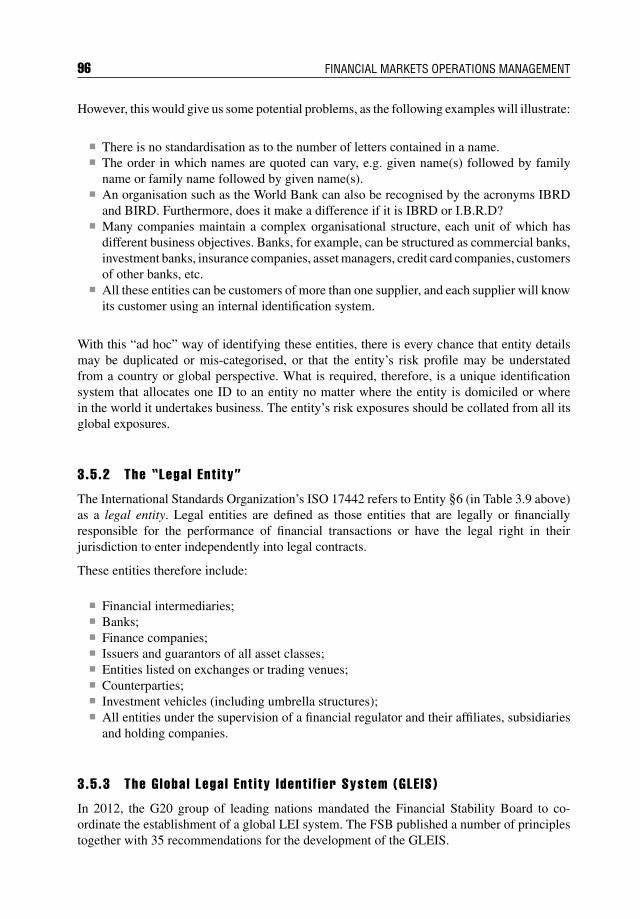
96 FINANCIAL MARKETS OPERATIONS MANAGEMENT
However, this would give us some potential problems, as the following examples will illustrate:
There is no standardisation as to the number of letters contained in a name. The order in which names are quoted can vary, e.g. given name(s) followed by family
name or family name followed by given name(s). An organisation such as the World Bank can also be recognised by the acronyms IBRD
and BIRD. Furthermore, does it make a difference if it is IBRD or I.B.R.D? Many companies maintain a complex organisational structure, each unit of which has
different business objectives. Banks, for example, can be structured as commercial banks,investment banks, insurance companies, asset managers, credit card companies, customersof other banks, etc.
All these entities can be customers of more than one supplier, and each supplier will knowits customer using an internal identification system.
With this “ad hoc” way of identifying these entities, there is every chance that entity detailsmay be duplicated or mis-categorised, or that the entity’s risk profile may be understatedfrom a country or global perspective. What is required, therefore, is a unique identificationsystem that allocates one ID to an entity no matter where the entity is domiciled or wherein the world it undertakes business. The entity’s risk exposures should be collated from all itsglobal exposures.
3.5.2 The “Legal Ent i ty”
The International Standards Organization’s ISO 17442 refers to Entity §6 (in Table 3.9 above)as a legal entity. Legal entities are defined as those entities that are legally or financiallyresponsible for the performance of financial transactions or have the legal right in theirjurisdiction to enter independently into legal contracts.
These entities therefore include:
Financial intermediaries; Banks; Finance companies; Issuers and guarantors of all asset classes; Entities listed on exchanges or trading venues; Counterparties; Investment vehicles (including umbrella structures); All entities under the supervision of a financial regulator and their affiliates, subsidiaries
and holding companies.
3.5.3 The Global Legal Ent i ty Ident i f ier System (GLE IS)
In 2012, the G20 group of leading nations mandated the Financial Stability Board to co-ordinate the establishment of a global LEI system. The FSB published a number of principlestogether with 35 recommendations for the development of the GLEIS.
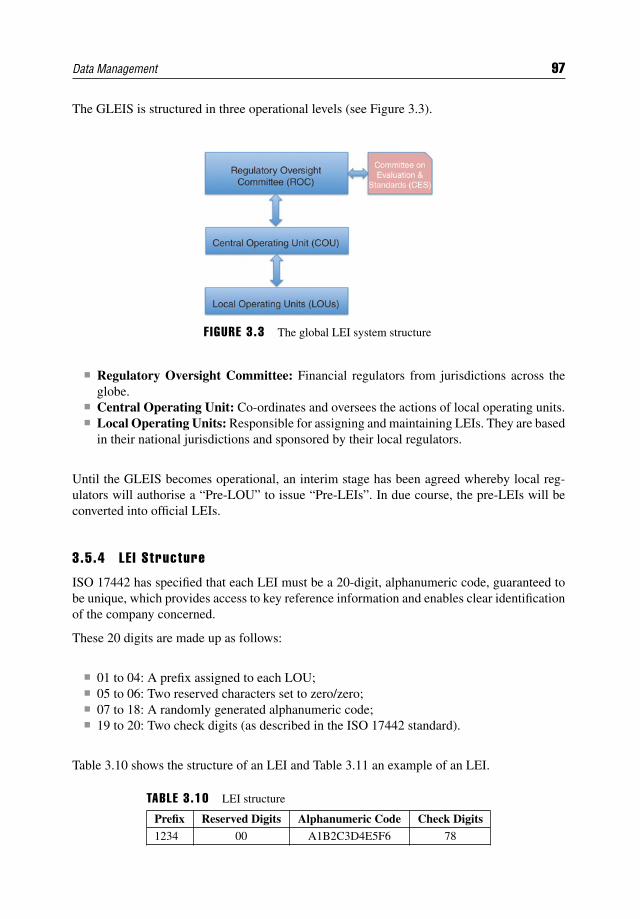
Data Management 97
The GLEIS is structured in three operational levels (see Figure 3.3).
F IGURE 3.3 The global LEI system structure
Regulatory Oversight Committee: Financial regulators from jurisdictions across theglobe.
Central Operating Unit: Co-ordinates and oversees the actions of local operating units. Local Operating Units: Responsible for assigning and maintaining LEIs. They are based
in their national jurisdictions and sponsored by their local regulators.
Until the GLEIS becomes operational, an interim stage has been agreed whereby local reg-ulators will authorise a “Pre-LOU” to issue “Pre-LEIs”. In due course, the pre-LEIs will beconverted into official LEIs.
3.5.4 LE I Structure
ISO 17442 has specified that each LEI must be a 20-digit, alphanumeric code, guaranteed tobe unique, which provides access to key reference information and enables clear identificationof the company concerned.
These 20 digits are made up as follows:
01 to 04: A prefix assigned to each LOU; 05 to 06: Two reserved characters set to zero/zero; 07 to 18: A randomly generated alphanumeric code; 19 to 20: Two check digits (as described in the ISO 17442 standard).
Table 3.10 shows the structure of an LEI and Table 3.11 an example of an LEI.
TABLE 3.10 LEI structure
Prefix Reserved Digits Alphanumeric Code Check Digits1234 00 A1B2C3D4E5F6 78
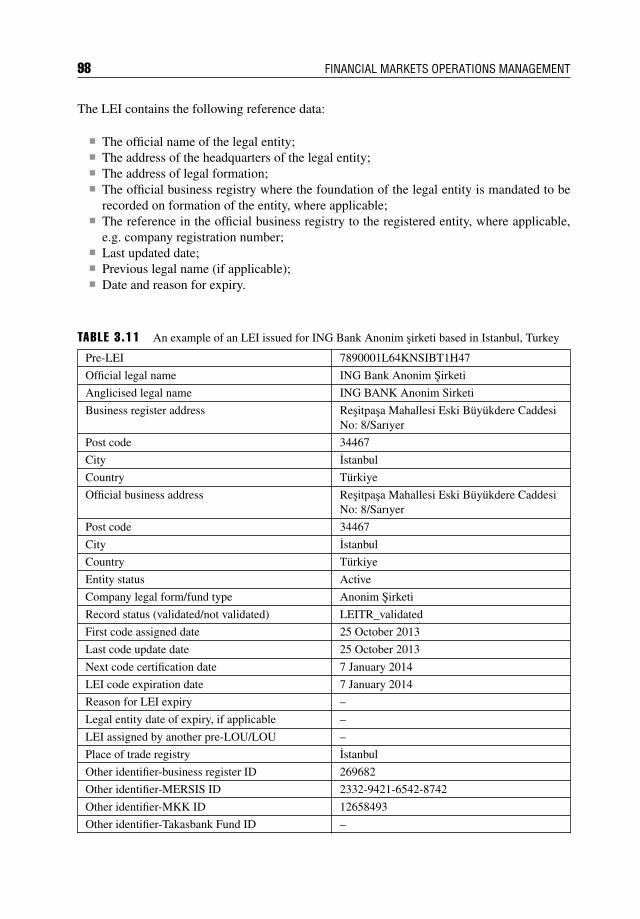
98 FINANCIAL MARKETS OPERATIONS MANAGEMENT
The LEI contains the following reference data:
The official name of the legal entity; The address of the headquarters of the legal entity; The address of legal formation; The official business registry where the foundation of the legal entity is mandated to be
recorded on formation of the entity, where applicable; The reference in the official business registry to the registered entity, where applicable,
e.g. company registration number; Last updated date; Previous legal name (if applicable); Date and reason for expiry.
TABLE 3.11 An example of an LEI issued for ING Bank Anonim sirketi based in Istanbul, Turkey
Pre-LEI 7890001L64KNSIBT1H47
Official legal name ING Bank Anonim Sirketi
Anglicised legal name ING BANK Anonim Sirketi
Business register address Resitpasa Mahallesi Eski Buyukdere CaddesiNo: 8/Sarıyer
Post code 34467
City Istanbul
Country Turkiye
Official business address Resitpasa Mahallesi Eski Buyukdere CaddesiNo: 8/Sarıyer
Post code 34467
City Istanbul
Country Turkiye
Entity status Active
Company legal form/fund type Anonim Sirketi
Record status (validated/not validated) LEITR_validated
First code assigned date 25 October 2013
Last code update date 25 October 2013
Next code certification date 7 January 2014
LEI code expiration date 7 January 2014
Reason for LEI expiry –
Legal entity date of expiry, if applicable –
LEI assigned by another pre-LOU/LOU –
Place of trade registry Istanbul
Other identifier-business register ID 269682
Other identifier-MERSIS ID 2332-9421-6542-8742
Other identifier-MKK ID 12658493
Other identifier-Takasbank Fund ID –
Data Management 99
TABLE 3.11 (Continued)
NACE sector code 64.19.01
Parent company ING Bank NV/Amsterdam
LEI of the parent company 3TK20IVIUJ8J3ZU0QE75
Legal entity website www.ingbank.com.trSource: Takasbank (online) “Turkey Legal Entity LEI List EN”. Available from www.takasbank.com.tr/en/Pages/Numaralandirma.aspx. [Accessed Friday, 29 November 2013]
3.6 SUMMARY
We have seen that any financial transaction involves the collection and distribution of infor-mation which encompasses financial instruments and counterparties/customers. Today, thefinancial industry is truly global, and it is important that any information is in a standardisedformat so that it can be readily recognisable by our processing systems in a straight-throughprocessing environment.
Information on financial instruments, counterparties and customers can be obtained from avariety of sources, ranging from direct access or indirect access to one of the informationvendor companies.
We have also seen that financial instruments have, by and large, been standardised using theISIN and local numbering systems together with the classification codes (CFI codes). However,the standardisation of counterparties and customers (the so-called legal entities) has only beenaddressed in recent years. The LEI initiative set up by the G20 countries and the FSB is nowin progress, with the allocation of pre-LEIs by some LOUs (e.g. the UK and Turkey).

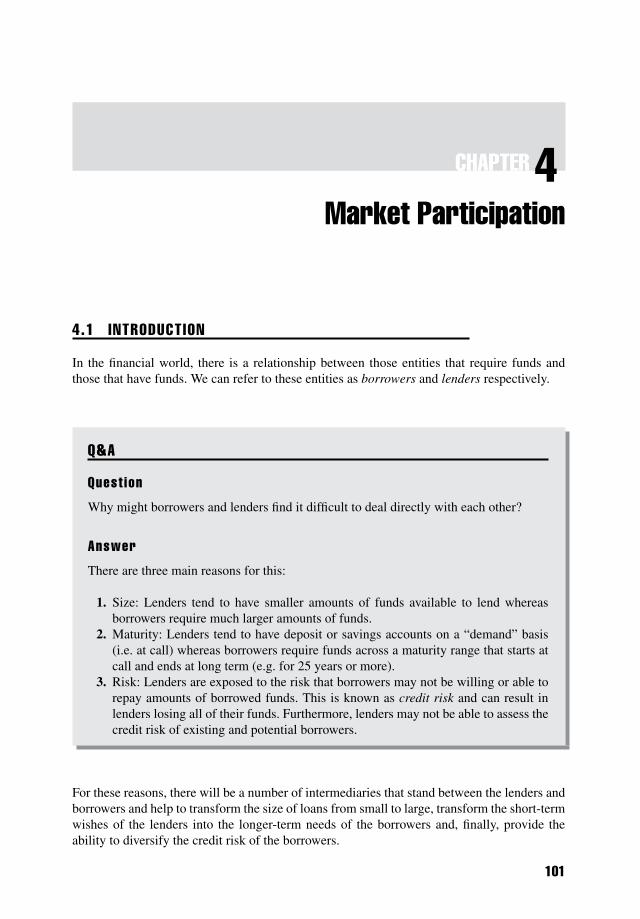
CHAPTER 4Market Participation
4.1 INTRODUCTION
In the financial world, there is a relationship between those entities that require funds andthose that have funds. We can refer to these entities as borrowers and lenders respectively.
Q&A
Quest ion
Why might borrowers and lenders find it difficult to deal directly with each other?
Answer
There are three main reasons for this:
1. Size: Lenders tend to have smaller amounts of funds available to lend whereasborrowers require much larger amounts of funds.
2. Maturity: Lenders tend to have deposit or savings accounts on a “demand” basis(i.e. at call) whereas borrowers require funds across a maturity range that starts atcall and ends at long term (e.g. for 25 years or more).
3. Risk: Lenders are exposed to the risk that borrowers may not be willing or able torepay amounts of borrowed funds. This is known as credit risk and can result inlenders losing all of their funds. Furthermore, lenders may not be able to assess thecredit risk of existing and potential borrowers.
For these reasons, there will be a number of intermediaries that stand between the lenders andborrowers and help to transform the size of loans from small to large, transform the short-termwishes of the lenders into the longer-term needs of the borrowers and, finally, provide theability to diversify the credit risk of the borrowers.
101
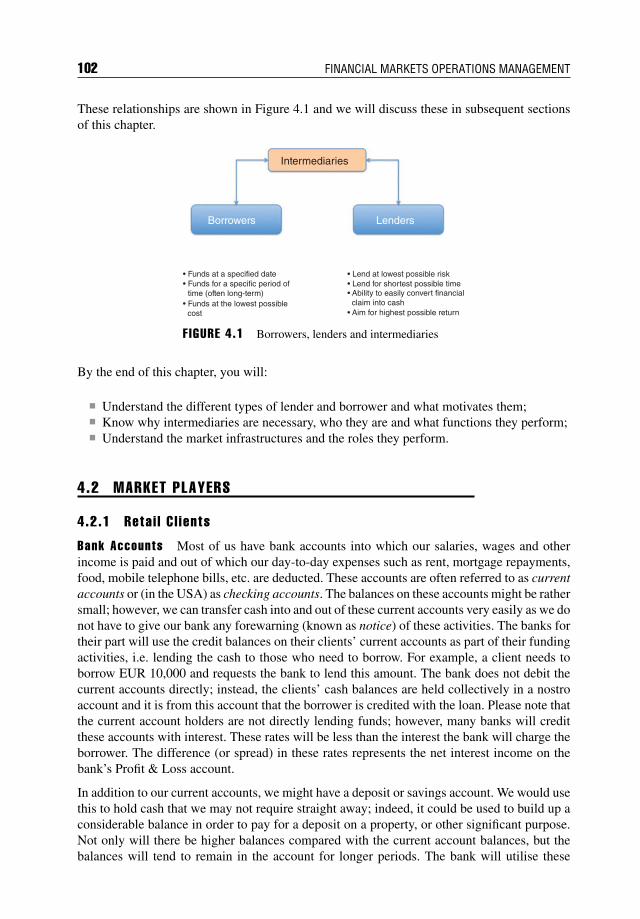
102 FINANCIAL MARKETS OPERATIONS MANAGEMENT
These relationships are shown in Figure 4.1 and we will discuss these in subsequent sectionsof this chapter.
Intermediaries
• Funds at a specified date • Lend at lowest possible risk• Lend for shortest possible time• Ability to easily convert financial claim into cash• Aim for highest possible return
• Funds for a specific period of time (often long-term)• Funds at the lowest possible cost
LendersBorrowers
F IGURE 4.1 Borrowers, lenders and intermediaries
By the end of this chapter, you will:
Understand the different types of lender and borrower and what motivates them; Know why intermediaries are necessary, who they are and what functions they perform; Understand the market infrastructures and the roles they perform.
4.2 MARKET PLAYERS
4.2.1 Reta i l C l ients
Bank Accounts Most of us have bank accounts into which our salaries, wages and otherincome is paid and out of which our day-to-day expenses such as rent, mortgage repayments,food, mobile telephone bills, etc. are deducted. These accounts are often referred to as currentaccounts or (in the USA) as checking accounts. The balances on these accounts might be rathersmall; however, we can transfer cash into and out of these current accounts very easily as we donot have to give our bank any forewarning (known as notice) of these activities. The banks fortheir part will use the credit balances on their clients’ current accounts as part of their fundingactivities, i.e. lending the cash to those who need to borrow. For example, a client needs toborrow EUR 10,000 and requests the bank to lend this amount. The bank does not debit thecurrent accounts directly; instead, the clients’ cash balances are held collectively in a nostroaccount and it is from this account that the borrower is credited with the loan. Please note thatthe current account holders are not directly lending funds; however, many banks will creditthese accounts with interest. These rates will be less than the interest the bank will charge theborrower. The difference (or spread) in these rates represents the net interest income on thebank’s Profit & Loss account.
In addition to our current accounts, we might have a deposit or savings account. We would usethis to hold cash that we may not require straight away; indeed, it could be used to build up aconsiderable balance in order to pay for a deposit on a property, or other significant purpose.Not only will there be higher balances compared with the current account balances, but thebalances will tend to remain in the account for longer periods. The bank will utilise these
Market Participation 103
balances as well in the knowledge that the deposit account holder will not require the cashstraight away (unlike the current account holder).
Direct Investment How else might a retail client use his funds? If, for example, the clienthas more cash than he needs for his day-to-day expenses, he might decide to purchase someinvestments. He might do this using a broker, either directly or online. The client now becomesan investor. His motivation might include benefiting from:
Income from the investment (dividends or interest); Capital growth (the price of the investment increasing).
It is arguable that the direct investor requires access to a comparatively large amount of cashin order to diversify his investments; perhaps in the order of many tens of thousands of unitsof cash. Potential investors are often advised never to invest any cash that (a) is required forother, more immediate purposes and (b) that the investor cannot afford to lose. What can aninvestor do if he does not have sufficient cash to invest directly in shares and bonds, etc.?There is an alternative – indirect investment.
Ind irect Investment There is a wide range of investment products that are known ascollective investments. Examples include mutual funds, unit trusts, investment trusts, exchangetrade funds, open-ended funds, etc.
What these collective investments all have in common is that financial entities (e.g. investmentmanagers) invest their clients’ cash in one or more collective investment funds. The cash isused to buy appropriate securities that are held within the fund and, in exchange, the fundmanager gives shares/units in the fund to the clients. In this way, one particular client with asmall amount of cash can benefit from the investment expertise of the fund manager and holdshares within a fund that is diversified in terms of underlying products and markets.
As we will see later, the risks associated with these three fundamental types of cash usagediffer from a comparatively low level of risk (bank accounts) to a comparatively high level ofrisk (e.g. equities/shares).
4.2.2 Inst i tut ional C l ients
Collectively, institutional investors are organisations that invest large pools of money on behalfof their clients into various classes of investment such as securities, property, commodities andso-called “alternative investments”. The institutional investors invest the money into “funds”that contain a broad, diverse range of assets tailored to meet predefined investment objectives.The idea behind asset diversification is that it helps to reduce the risk that the fund will sufferif a constituent investment defaults; the more diversified the fund, the lower the risk.
An example of an undiversified fund would be a fund that contains only one asset. If thatasset lost, say, 50% of its value, then the fund would also lose 50% of its value. However, adiversified fund of, say, 25 assets including the one that loses 50% of its value, would onlylose a fraction of its value. (Investment risk is an interesting topic and includes “hedging” aswell as “fund diversification”.)
104 FINANCIAL MARKETS OPERATIONS MANAGEMENT
Investment Managers Investment management companies employ investment managerswho invest and divest their clients’ assets. This can be discretionary (where the managerdecides what action to take without reference to the client) or non-discretionary (where themanager suggests a course of action for approval by the client prior to taking action). In eithersituation, the investment manager will have assessed each client’s individual investment needsand risk profile.
It is the investment manager’s role to manage clients’ assets in such a way that the clients’investment objectives are met. To do this, the manager will allocate assets across a range ofasset classes, commonly divided into:
Cash/money market instruments Equities Bonds Property Commodities.
In addition, there are two broad investment management styles:
Active management: Active management (also called active investing) refers to a port-folio management strategy where the manager makes specific investments with thegoal of outperforming an investment benchmark index. There are various strategiesthat the active manager can use; however, the essential idea is to exploit marketinefficiencies (purchase undervalued assets and/or sell overvalued assets).
Passive management: By contrast, the passive manager creates a fund which only investsin the assets that constitute a particular stock market index. This way, the passivemanager mimics the performance of the chosen index.
Whilst passive managers have traditionally used equity indices (of which there are many tochoose from), there are indices that cover bonds, commodities and hedge funds.
Hedge Funds Hedge fund managers employ an alternative investment style to the moretraditional investment managers that we discussed above. The first hedge fund was establishedin 1949 by a Mr Alfred W. Jones, who designed the classic “long–short” strategy. Jones wouldtake a long position in an asset and hedge the risk of the long position by taking a short positionin another asset. For example, you could buy shares long in Company “A” (running the riskthat the share price goes down) and sell shares short in Company “B” (running the risk thatthe share price goes up).
Example
In terms of price movements, there will be a “best outcome” and a “worst outcome”, as follows:
Best outcome (Variation 1): Company “A” price goes up (making a profit) and Company “B”price goes down (making a profit).
Worst outcome (Variation 2): Company “A” price goes down (making a loss) and Company“B” price goes up (making a loss).
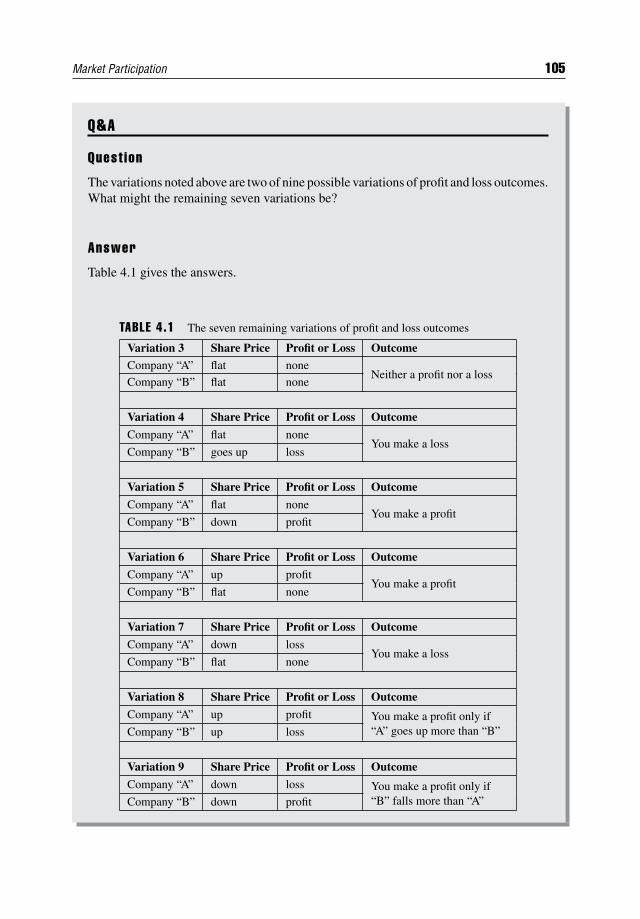
Market Participation 105
Q&A
Quest ion
The variations noted above are two of nine possible variations of profit and loss outcomes.What might the remaining seven variations be?
Answer
Table 4.1 gives the answers.
TABLE 4.1 The seven remaining variations of profit and loss outcomes
Variation 3 Share Price Profit or Loss Outcome
Company “A” flat noneNeither a profit nor a loss
Company “B” flat none
Variation 4 Share Price Profit or Loss Outcome
Company “A” flat noneYou make a loss
Company “B” goes up loss
Variation 5 Share Price Profit or Loss Outcome
Company “A” flat noneYou make a profit
Company “B” down profit
Variation 6 Share Price Profit or Loss Outcome
Company “A” up profitYou make a profit
Company “B” flat none
Variation 7 Share Price Profit or Loss Outcome
Company “A” down lossYou make a loss
Company “B” flat none
Variation 8 Share Price Profit or Loss Outcome
Company “A” up profit You make a profit only if“A” goes up more than “B”Company “B” up loss
Variation 9 Share Price Profit or Loss Outcome
Company “A” down loss You make a profit only if“B” falls more than “A”Company “B” down profit
106 FINANCIAL MARKETS OPERATIONS MANAGEMENT
Hedge fund managers can either adopt a single investment strategy approach (such as thelong–short described above) or a multi-strategy approach. Whilst there are many variations,the main strategies are:
Global macro: Managers take large positions in securities in anticipation of globalmacroeconomic events. To do this, managers might have to borrow sizeable amountsof cash (leverage).
Directional: Managers select investments based on market movements, trends or incon-sistencies across markets.
Event-driven: Managers aim to take advantage of pricing inconsistencies due to corporateaction events such as distressed securities, mergers, acquisitions, etc.
Relative value: Managers aim to take advantage of the discrepancies between relatedsecurities.
Hedge fund managers can make substantial profits through using these investment styles;however, the reverse is also true – they can make substantial losses. The risk is that if the lossesare too great, the fund might fail. For this reason, hedge funds are not generally available toretail investors.
The hedge fund industry manages over USD 2.9 trillion of assets (AUM) as at the 1Q 2014;1
the ten largest hedge fund managers are shown in Table 4.2.
TABLE 4.2 Ten largest hedge fund managers by AUM
Rank Hedge Fund AUM USD bns
1 Bridgewater Associates (Westport, Connecticut) 77.6
2 Man Group (London) 64.5
3 JP Morgan Asset Management (New York) 46.6
4 Brevan Howard Asset Management (London) 32.6
5 Och-Ziff Capital Management Group (NewYork) 28.5
6 Paulson & Co. (New York) 28.0
7 BlackRock Advisors (New York) 27.7
8 Winton Capital Management (London) 27.0
9 Highbridge Capital Management (New York) 26.1
10 BlueCrest Capital Management (London) 25.0
Pension Funds A pension fund is designed to provide retirement income to individualswho have reached retirement age. There are different classifications including open, closed,public and private pension funds. You do not need to understand these classifications for thismodule, but you should be aware of some of the investment challenges experienced by thefunds themselves.
1Source: eVestment (online). “Hedge Fund Asset Flows” dated 17 April 2014. Available fromwww.evestment.com/docs/default-source/resources/monthly-hedge-fund-research/evestment-global-hedge-fund-asset-flows-report---march-2014.pdf?sfvrsn=2. [Accessed Wednesday, 30 April 2014]
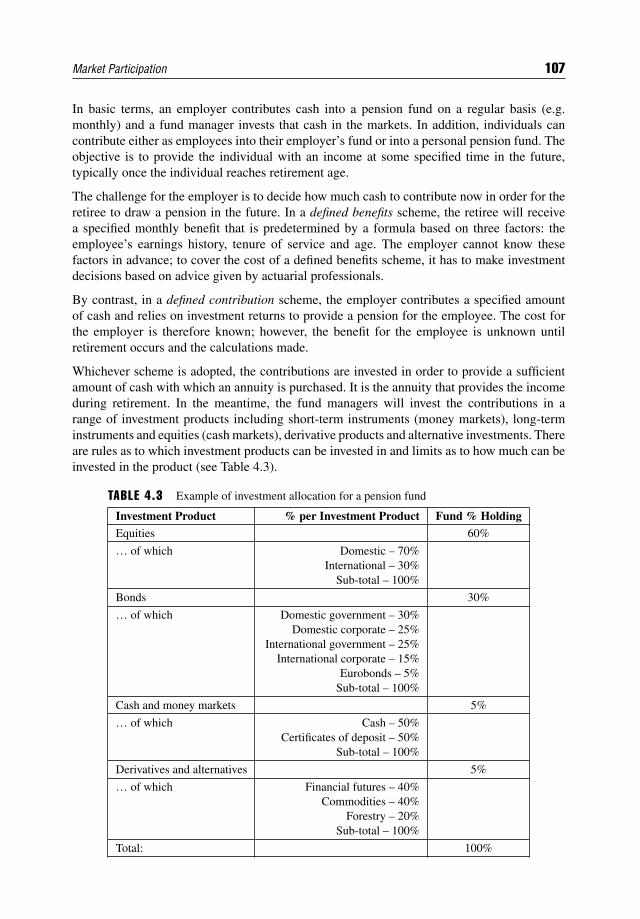
Market Participation 107
In basic terms, an employer contributes cash into a pension fund on a regular basis (e.g.monthly) and a fund manager invests that cash in the markets. In addition, individuals cancontribute either as employees into their employer’s fund or into a personal pension fund. Theobjective is to provide the individual with an income at some specified time in the future,typically once the individual reaches retirement age.
The challenge for the employer is to decide how much cash to contribute now in order for theretiree to draw a pension in the future. In a defined benefits scheme, the retiree will receivea specified monthly benefit that is predetermined by a formula based on three factors: theemployee’s earnings history, tenure of service and age. The employer cannot know thesefactors in advance; to cover the cost of a defined benefits scheme, it has to make investmentdecisions based on advice given by actuarial professionals.
By contrast, in a defined contribution scheme, the employer contributes a specified amountof cash and relies on investment returns to provide a pension for the employee. The cost forthe employer is therefore known; however, the benefit for the employee is unknown untilretirement occurs and the calculations made.
Whichever scheme is adopted, the contributions are invested in order to provide a sufficientamount of cash with which an annuity is purchased. It is the annuity that provides the incomeduring retirement. In the meantime, the fund managers will invest the contributions in arange of investment products including short-term instruments (money markets), long-terminstruments and equities (cash markets), derivative products and alternative investments. Thereare rules as to which investment products can be invested in and limits as to how much can beinvested in the product (see Table 4.3).
TABLE 4.3 Example of investment allocation for a pension fund
Investment Product % per Investment Product Fund % HoldingEquities 60%
… of which Domestic – 70%International – 30%
Sub-total – 100%
Bonds 30%
… of which Domestic government – 30%Domestic corporate – 25%
International government – 25%International corporate – 15%
Eurobonds – 5%Sub-total – 100%
Cash and money markets 5%
… of which Cash – 50%Certificates of deposit – 50%
Sub-total – 100%
Derivatives and alternatives 5%
… of which Financial futures – 40%Commodities – 40%
Forestry – 20%Sub-total – 100%
Total: 100%
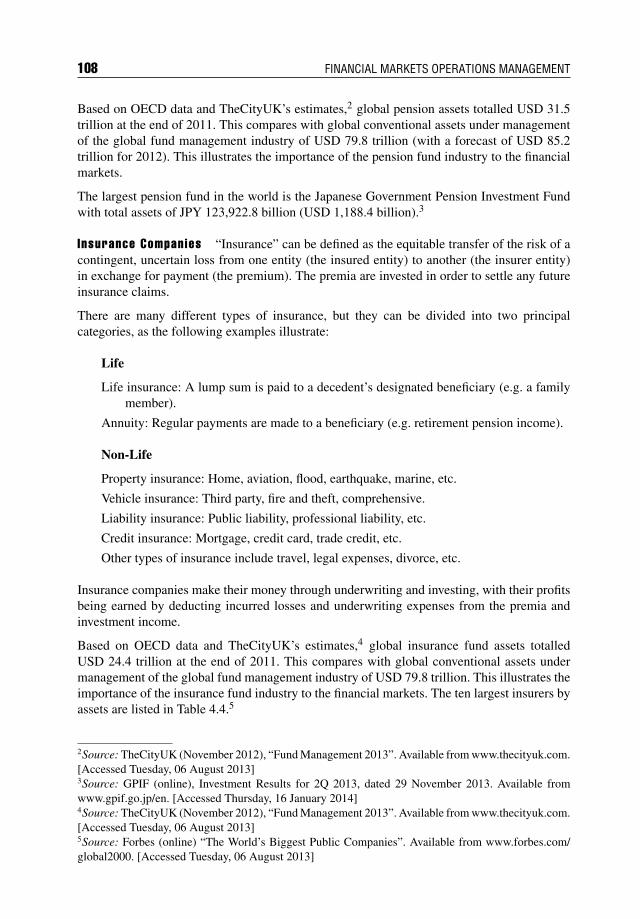
108 FINANCIAL MARKETS OPERATIONS MANAGEMENT
Based on OECD data and TheCityUK’s estimates,2 global pension assets totalled USD 31.5trillion at the end of 2011. This compares with global conventional assets under managementof the global fund management industry of USD 79.8 trillion (with a forecast of USD 85.2trillion for 2012). This illustrates the importance of the pension fund industry to the financialmarkets.
The largest pension fund in the world is the Japanese Government Pension Investment Fundwith total assets of JPY 123,922.8 billion (USD 1,188.4 billion).3
Insurance Companies “Insurance” can be defined as the equitable transfer of the risk of acontingent, uncertain loss from one entity (the insured entity) to another (the insurer entity)in exchange for payment (the premium). The premia are invested in order to settle any futureinsurance claims.
There are many different types of insurance, but they can be divided into two principalcategories, as the following examples illustrate:
Life
Life insurance: A lump sum is paid to a decedent’s designated beneficiary (e.g. a familymember).
Annuity: Regular payments are made to a beneficiary (e.g. retirement pension income).
Non-Life
Property insurance: Home, aviation, flood, earthquake, marine, etc.
Vehicle insurance: Third party, fire and theft, comprehensive.
Liability insurance: Public liability, professional liability, etc.
Credit insurance: Mortgage, credit card, trade credit, etc.
Other types of insurance include travel, legal expenses, divorce, etc.
Insurance companies make their money through underwriting and investing, with their profitsbeing earned by deducting incurred losses and underwriting expenses from the premia andinvestment income.
Based on OECD data and TheCityUK’s estimates,4 global insurance fund assets totalledUSD 24.4 trillion at the end of 2011. This compares with global conventional assets undermanagement of the global fund management industry of USD 79.8 trillion. This illustrates theimportance of the insurance fund industry to the financial markets. The ten largest insurers byassets are listed in Table 4.4.5
2Source: TheCityUK (November 2012), “Fund Management 2013”. Available from www.thecityuk.com.[Accessed Tuesday, 06 August 2013]3Source: GPIF (online), Investment Results for 2Q 2013, dated 29 November 2013. Available fromwww.gpif.go.jp/en. [Accessed Thursday, 16 January 2014]4Source: TheCityUK (November 2012), “Fund Management 2013”. Available from www.thecityuk.com.[Accessed Tuesday, 06 August 2013]5Source: Forbes (online) “The World’s Biggest Public Companies”. Available from www.forbes.com/global2000. [Accessed Tuesday, 06 August 2013]
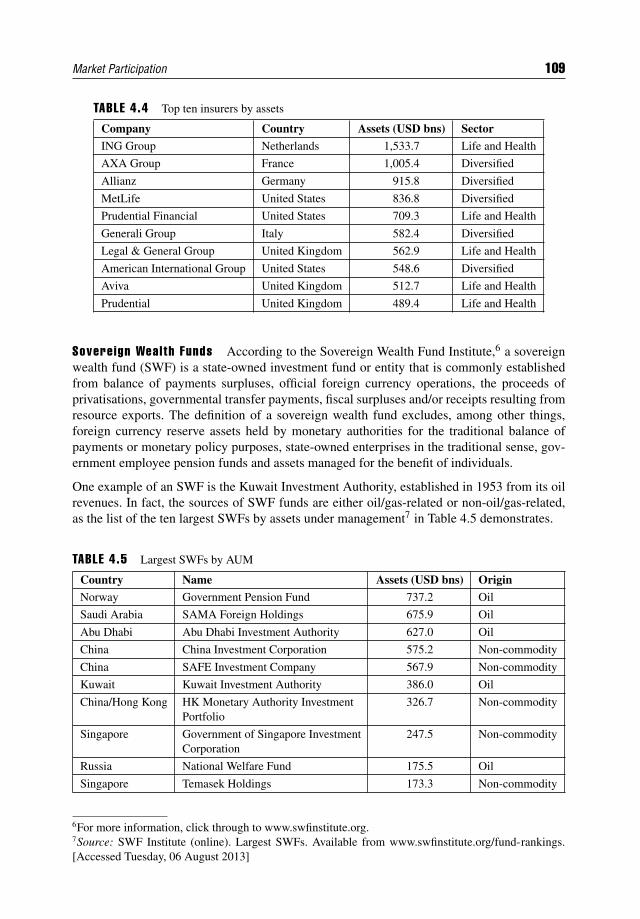
Market Participation 109
TABLE 4.4 Top ten insurers by assets
Company Country Assets (USD bns) Sector
ING Group Netherlands 1,533.7 Life and Health
AXA Group France 1,005.4 Diversified
Allianz Germany 915.8 Diversified
MetLife United States 836.8 Diversified
Prudential Financial United States 709.3 Life and Health
Generali Group Italy 582.4 Diversified
Legal & General Group United Kingdom 562.9 Life and Health
American International Group United States 548.6 Diversified
Aviva United Kingdom 512.7 Life and Health
Prudential United Kingdom 489.4 Life and Health
Sovereign Wealth Funds According to the Sovereign Wealth Fund Institute,6 a sovereignwealth fund (SWF) is a state-owned investment fund or entity that is commonly establishedfrom balance of payments surpluses, official foreign currency operations, the proceeds ofprivatisations, governmental transfer payments, fiscal surpluses and/or receipts resulting fromresource exports. The definition of a sovereign wealth fund excludes, among other things,foreign currency reserve assets held by monetary authorities for the traditional balance ofpayments or monetary policy purposes, state-owned enterprises in the traditional sense, gov-ernment employee pension funds and assets managed for the benefit of individuals.
One example of an SWF is the Kuwait Investment Authority, established in 1953 from its oilrevenues. In fact, the sources of SWF funds are either oil/gas-related or non-oil/gas-related,as the list of the ten largest SWFs by assets under management7 in Table 4.5 demonstrates.
TABLE 4.5 Largest SWFs by AUM
Country Name Assets (USD bns) Origin
Norway Government Pension Fund 737.2 Oil
Saudi Arabia SAMA Foreign Holdings 675.9 Oil
Abu Dhabi Abu Dhabi Investment Authority 627.0 Oil
China China Investment Corporation 575.2 Non-commodity
China SAFE Investment Company 567.9 Non-commodity
Kuwait Kuwait Investment Authority 386.0 Oil
China/Hong Kong HK Monetary Authority InvestmentPortfolio
326.7 Non-commodity
Singapore Government of Singapore InvestmentCorporation
247.5 Non-commodity
Russia National Welfare Fund 175.5 Oil
Singapore Temasek Holdings 173.3 Non-commodity
6For more information, click through to www.swfinstitute.org.7Source: SWF Institute (online). Largest SWFs. Available from www.swfinstitute.org/fund-rankings.[Accessed Tuesday, 06 August 2013]
110 FINANCIAL MARKETS OPERATIONS MANAGEMENT
Based on OECD data and TheCityUK’s estimates,8 global SWFs totalled USD 4.8 trillionat the end of 2011. This compares with global conventional assets under management of theglobal fund management industry of USD 79.8 trillion. This illustrates the importance of theSWF fund industry to the financial markets.
Private Wealth Management A group of economists at the United Nations’ InternationalLabour Organization9 has calculated that the world’s average salary is just under purchasingpower parity USD 18,000 per annum.10 Allowing for various data limitations and missingdata from some countries, the report shows that the average salary is low. By the time thesalary earner has paid the usual monthly bills, there is not much cash left in the householdbudget to save or invest. Therefore, the main investment vehicle available to most people isthe collective investment route of mutual funds.
There are, however, a substantial number of wealthy individuals who own large amountsof assets of one form or another. Based on the annual CapGemini/RBC Wealth ManagementReport for 2013,11 there were some 12.0 million people described as “high-net-worth individu-als” (HNWIs) with a total investable wealth of USD 46.2 trillion. OECD data and TheCityUKestimate12 that global conventional assets and alternative assets under management of theglobal fund management industry were USD 120.0 trillion. This illustrates the importance ofthe private wealth industry to the financial markets.
An HNWI is someone defined as having investable assets13 worth USD 1 million or more,and “Ultra-HNWIs” are people with investable assets in excess of USD 30 million.
The Wealth Management Report authors surveyed some 4,400 individuals across 21 majorwealth markets and found that the source of their respondents’ wealth included:
Salary and bonuses; Investments; Real estate (excluding primary residence); Business ownership; Stock options; Inheritance; Proceeds from selling off a business.
Salary, bonuses, business ownership and investments made up more than two-thirds of thesource of wealth for respondents.
8Source: TheCityUK (November 2012), “Fund Management 2013”. Available from www.thecityuk.com.[Accessed Tuesday, 06 August 2013]9Source: BBC News (online). “Where are you on the global pay scale?” dated 29 March 2012. Availablefrom www.bbc.co.uk/news/magazine-17512040?oo=0. [Accessed Wednesday, 14 August 2013]10The purchasing power parity (PPP) dollars concept is explained in the BBC’s report. One PPP dollaris equal to USD 1 spent in the USA.11Source: CapGemini/RBC Wealth Management (online) “World’s Wealth Report 2013”. Available fromwww.capgemini.com/sites/default/files/resource/pdf/wwr_2013_0.pdf. [Accessed Tuesday, 13 August2013]12Source: TheCityUK (November 2012), “Fund Management 2013”, Available from www.thecityuk.com. [Accessed Tuesday, 06 August 2013]13Investable wealth does not include the value of personal assets and property such as primary residences,collectables, consumables and consumer durables.
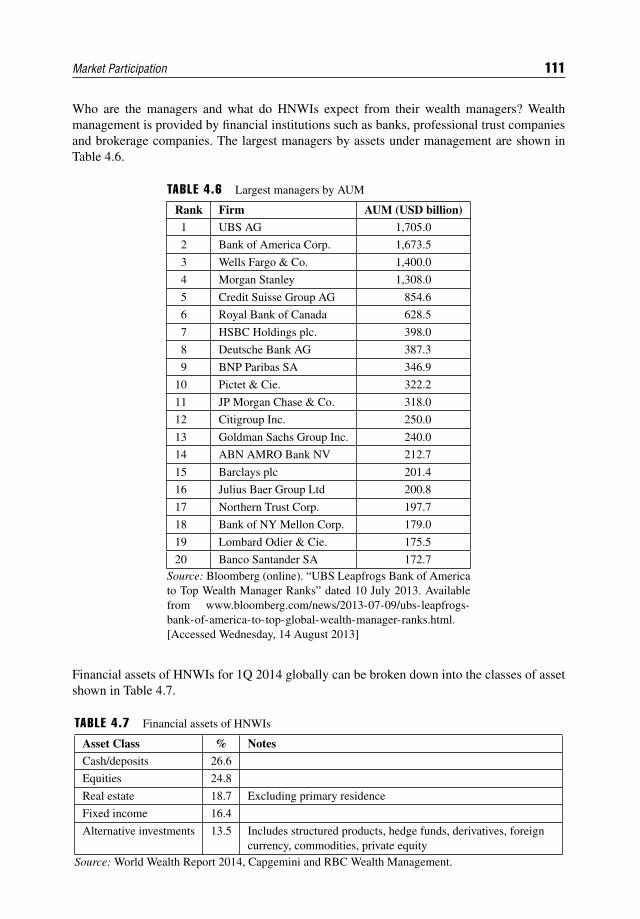
Market Participation 111
Who are the managers and what do HNWIs expect from their wealth managers? Wealthmanagement is provided by financial institutions such as banks, professional trust companiesand brokerage companies. The largest managers by assets under management are shown inTable 4.6.
TABLE 4.6 Largest managers by AUM
Rank Firm AUM (USD billion)
1 UBS AG 1,705.0
2 Bank of America Corp. 1,673.5
3 Wells Fargo & Co. 1,400.0
4 Morgan Stanley 1,308.0
5 Credit Suisse Group AG 854.6
6 Royal Bank of Canada 628.5
7 HSBC Holdings plc. 398.0
8 Deutsche Bank AG 387.3
9 BNP Paribas SA 346.9
10 Pictet & Cie. 322.2
11 JP Morgan Chase & Co. 318.0
12 Citigroup Inc. 250.0
13 Goldman Sachs Group Inc. 240.0
14 ABN AMRO Bank NV 212.7
15 Barclays plc 201.4
16 Julius Baer Group Ltd 200.8
17 Northern Trust Corp. 197.7
18 Bank of NY Mellon Corp. 179.0
19 Lombard Odier & Cie. 175.5
20 Banco Santander SA 172.7Source: Bloomberg (online). “UBS Leapfrogs Bank of Americato Top Wealth Manager Ranks” dated 10 July 2013. Availablefrom www.bloomberg.com/news/2013-07-09/ubs-leapfrogs-bank-of-america-to-top-global-wealth-manager-ranks.html.[Accessed Wednesday, 14 August 2013]
Financial assets of HNWIs for 1Q 2014 globally can be broken down into the classes of assetshown in Table 4.7.
TABLE 4.7 Financial assets of HNWIs
Asset Class % Notes
Cash/deposits 26.6
Equities 24.8
Real estate 18.7 Excluding primary residence
Fixed income 16.4
Alternative investments 13.5 Includes structured products, hedge funds, derivatives, foreigncurrency, commodities, private equity
Source: World Wealth Report 2014, Capgemini and RBC Wealth Management.
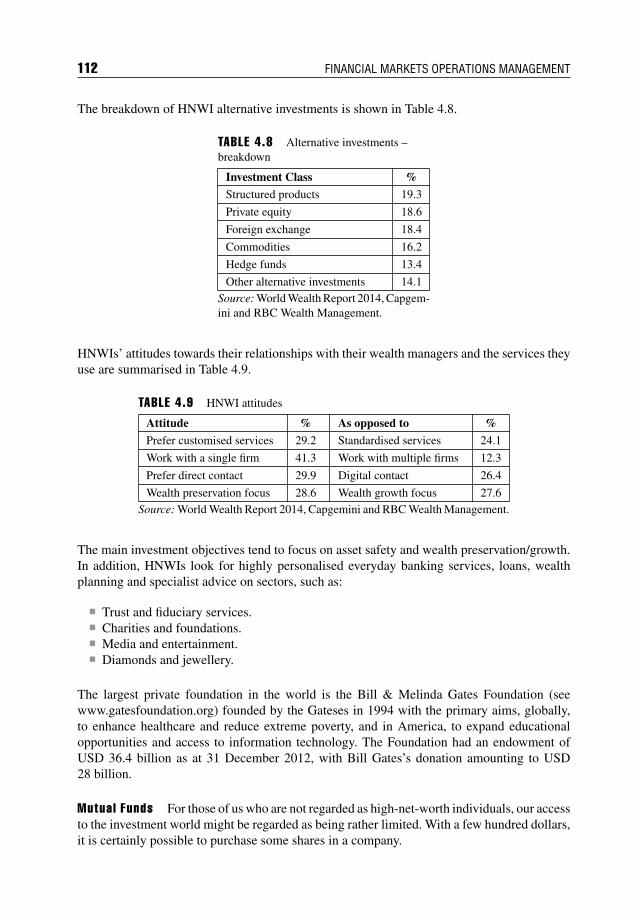
112 FINANCIAL MARKETS OPERATIONS MANAGEMENT
The breakdown of HNWI alternative investments is shown in Table 4.8.
TABLE 4.8 Alternative investments –breakdown
Investment Class %
Structured products 19.3
Private equity 18.6
Foreign exchange 18.4
Commodities 16.2
Hedge funds 13.4
Other alternative investments 14.1Source: World Wealth Report 2014, Capgem-ini and RBC Wealth Management.
HNWIs’ attitudes towards their relationships with their wealth managers and the services theyuse are summarised in Table 4.9.
TABLE 4.9 HNWI attitudes
Attitude % As opposed to %
Prefer customised services 29.2 Standardised services 24.1
Work with a single firm 41.3 Work with multiple firms 12.3
Prefer direct contact 29.9 Digital contact 26.4
Wealth preservation focus 28.6 Wealth growth focus 27.6Source: World Wealth Report 2014, Capgemini and RBC Wealth Management.
The main investment objectives tend to focus on asset safety and wealth preservation/growth.In addition, HNWIs look for highly personalised everyday banking services, loans, wealthplanning and specialist advice on sectors, such as:
Trust and fiduciary services. Charities and foundations. Media and entertainment. Diamonds and jewellery.
The largest private foundation in the world is the Bill & Melinda Gates Foundation (seewww.gatesfoundation.org) founded by the Gateses in 1994 with the primary aims, globally,to enhance healthcare and reduce extreme poverty, and in America, to expand educationalopportunities and access to information technology. The Foundation had an endowment ofUSD 36.4 billion as at 31 December 2012, with Bill Gates’s donation amounting to USD28 billion.
Mutual Funds For those of us who are not regarded as high-net-worth individuals, our accessto the investment world might be regarded as being rather limited. With a few hundred dollars,it is certainly possible to purchase some shares in a company.
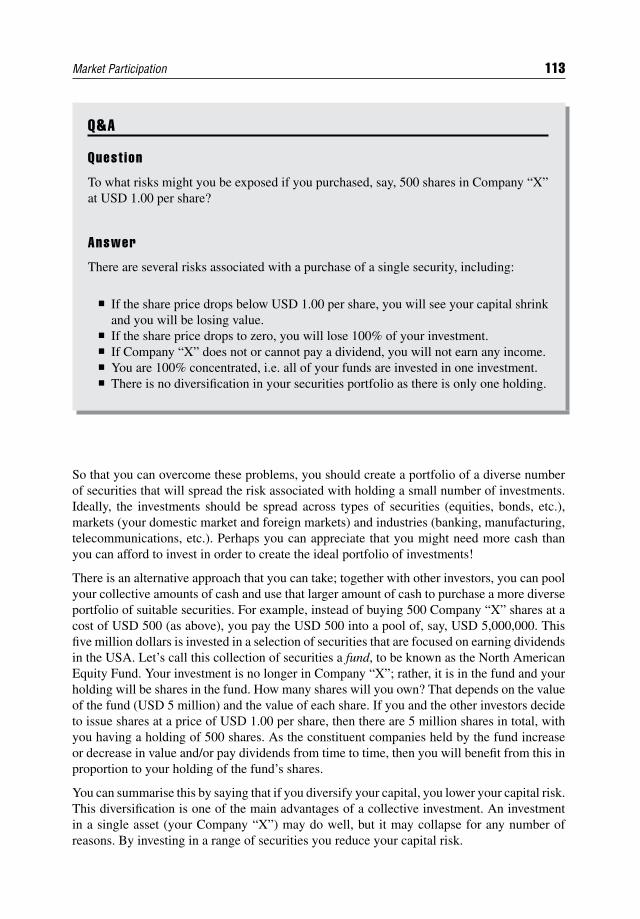
Market Participation 113
Q&A
Quest ion
To what risks might you be exposed if you purchased, say, 500 shares in Company “X”at USD 1.00 per share?
Answer
There are several risks associated with a purchase of a single security, including:
If the share price drops below USD 1.00 per share, you will see your capital shrinkand you will be losing value.
If the share price drops to zero, you will lose 100% of your investment. If Company “X” does not or cannot pay a dividend, you will not earn any income. You are 100% concentrated, i.e. all of your funds are invested in one investment. There is no diversification in your securities portfolio as there is only one holding.
So that you can overcome these problems, you should create a portfolio of a diverse numberof securities that will spread the risk associated with holding a small number of investments.Ideally, the investments should be spread across types of securities (equities, bonds, etc.),markets (your domestic market and foreign markets) and industries (banking, manufacturing,telecommunications, etc.). Perhaps you can appreciate that you might need more cash thanyou can afford to invest in order to create the ideal portfolio of investments!
There is an alternative approach that you can take; together with other investors, you can poolyour collective amounts of cash and use that larger amount of cash to purchase a more diverseportfolio of suitable securities. For example, instead of buying 500 Company “X” shares at acost of USD 500 (as above), you pay the USD 500 into a pool of, say, USD 5,000,000. Thisfive million dollars is invested in a selection of securities that are focused on earning dividendsin the USA. Let’s call this collection of securities a fund, to be known as the North AmericanEquity Fund. Your investment is no longer in Company “X”; rather, it is in the fund and yourholding will be shares in the fund. How many shares will you own? That depends on the valueof the fund (USD 5 million) and the value of each share. If you and the other investors decideto issue shares at a price of USD 1.00 per share, then there are 5 million shares in total, withyou having a holding of 500 shares. As the constituent companies held by the fund increaseor decrease in value and/or pay dividends from time to time, then you will benefit from this inproportion to your holding of the fund’s shares.
You can summarise this by saying that if you diversify your capital, you lower your capital risk.This diversification is one of the main advantages of a collective investment. An investmentin a single asset (your Company “X”) may do well, but it may collapse for any number ofreasons. By investing in a range of securities you reduce your capital risk.
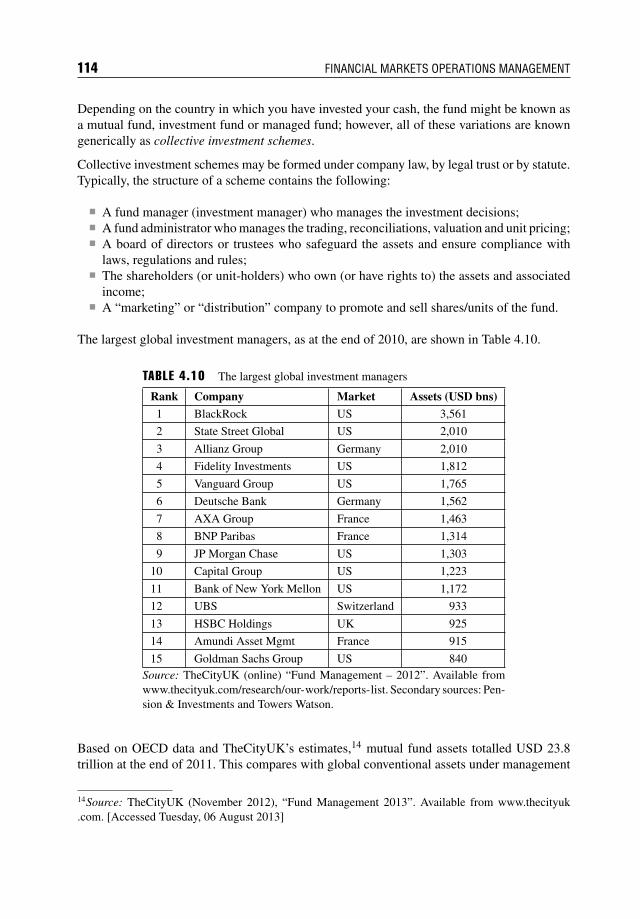
114 FINANCIAL MARKETS OPERATIONS MANAGEMENT
Depending on the country in which you have invested your cash, the fund might be known asa mutual fund, investment fund or managed fund; however, all of these variations are knowngenerically as collective investment schemes.
Collective investment schemes may be formed under company law, by legal trust or by statute.Typically, the structure of a scheme contains the following:
A fund manager (investment manager) who manages the investment decisions; A fund administrator who manages the trading, reconciliations, valuation and unit pricing; A board of directors or trustees who safeguard the assets and ensure compliance with
laws, regulations and rules; The shareholders (or unit-holders) who own (or have rights to) the assets and associated
income; A “marketing” or “distribution” company to promote and sell shares/units of the fund.
The largest global investment managers, as at the end of 2010, are shown in Table 4.10.
TABLE 4.10 The largest global investment managers
Rank Company Market Assets (USD bns)
1 BlackRock US 3,561
2 State Street Global US 2,010
3 Allianz Group Germany 2,010
4 Fidelity Investments US 1,812
5 Vanguard Group US 1,765
6 Deutsche Bank Germany 1,562
7 AXA Group France 1,463
8 BNP Paribas France 1,314
9 JP Morgan Chase US 1,303
10 Capital Group US 1,223
11 Bank of New York Mellon US 1,172
12 UBS Switzerland 933
13 HSBC Holdings UK 925
14 Amundi Asset Mgmt France 915
15 Goldman Sachs Group US 840Source: TheCityUK (online) “Fund Management – 2012”. Available fromwww.thecityuk.com/research/our-work/reports-list. Secondary sources: Pen-sion & Investments and Towers Watson.
Based on OECD data and TheCityUK’s estimates,14 mutual fund assets totalled USD 23.8trillion at the end of 2011. This compares with global conventional assets under management
14Source: TheCityUK (November 2012), “Fund Management 2013”. Available from www.thecityuk.com. [Accessed Tuesday, 06 August 2013]
Market Participation 115
of the global fund management industry of USD 79.8 trillion and illustrates the importance ofthe mutual fund industry to the financial markets.
4.2.3 Banks
At the start of this chapter, we discussed the relationship between the lender and borrower. Inaddition to this, we added the term intermediary – see Figure 4.1. The question then is: “Whois the intermediary?”
The purpose of this section is to define what a bank is and to describe some of the mainservices offered by the banking industry.
Banks The simple answer to the question raised above is that it is a bank which acts as theintermediary. Banks do this by accepting deposits and using them for lending activities, eitherdirectly by lending to borrowers or indirectly through the capital markets. A bank, therefore,connects clients with excess capital with clients with a capital deficit.
From a borrower’s perspective, there is a barrier to “direct financing”, mainly through (a) thedifficulty and expense of matching the complex needs of individual borrowers and lenders and(b) the incompatibility of the financial needs of lenders and borrowers. Without exploring thedetails, we can summarise the needs of lenders and borrowers as follows.
Lenders Lenders want to lend their assets for short periods of time and for the highestpossible return. They wish to:
Minimise credit risk (e.g. borrower default) and market risk (e.g. assets dropping in value); Minimise the cost of lending and maximise the returns on lending; Hold assets that are more easily converted into cash (liquid).
Borrowers In contrast, borrowers demand liabilities that are cheap and for longer periods.They wish to:
Obtain funds at a particular, specified time in order to meet their borrowing requirements; Obtain funds for a specific period of time (either short term for working capital require-
ments or long term for capital equipment, etc.); Obtain funds at the lowest possible cost.
You can appreciate that there are conflicting points of view between lenders and borrowers;hence the need for an intermediary (i.e. the banks) that can transform small-scale, low-riskand liquid deposits into large-scale, riskier and more illiquid loans.
What do the banks offer the clients by way of products and services? As we will see later, thebanks tend to classify their clients in terms of size, as shown in Table 4.11.
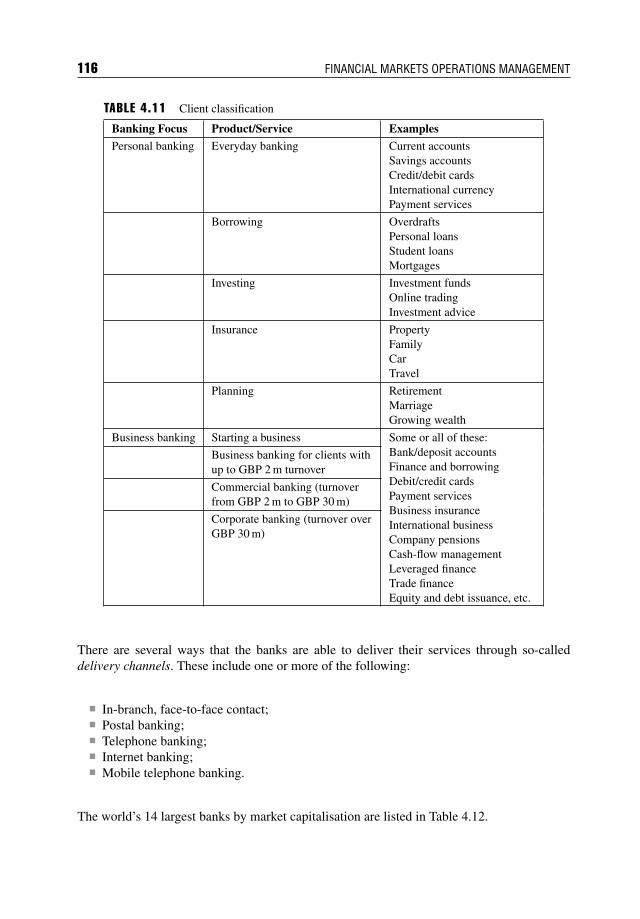
116 FINANCIAL MARKETS OPERATIONS MANAGEMENT
TABLE 4.11 Client classification
Banking Focus Product/Service Examples
Personal banking Everyday banking Current accountsSavings accountsCredit/debit cardsInternational currencyPayment services
Borrowing OverdraftsPersonal loansStudent loansMortgages
Investing Investment fundsOnline tradingInvestment advice
Insurance PropertyFamilyCarTravel
Planning RetirementMarriageGrowing wealth
Business banking Starting a business Some or all of these:Bank/deposit accountsFinance and borrowingDebit/credit cardsPayment servicesBusiness insuranceInternational businessCompany pensionsCash-flow managementLeveraged financeTrade financeEquity and debt issuance, etc.
Business banking for clients withup to GBP 2 m turnover
Commercial banking (turnoverfrom GBP 2 m to GBP 30 m)
Corporate banking (turnover overGBP 30 m)
There are several ways that the banks are able to deliver their services through so-calleddelivery channels. These include one or more of the following:
In-branch, face-to-face contact; Postal banking; Telephone banking; Internet banking; Mobile telephone banking.
The world’s 14 largest banks by market capitalisation are listed in Table 4.12.
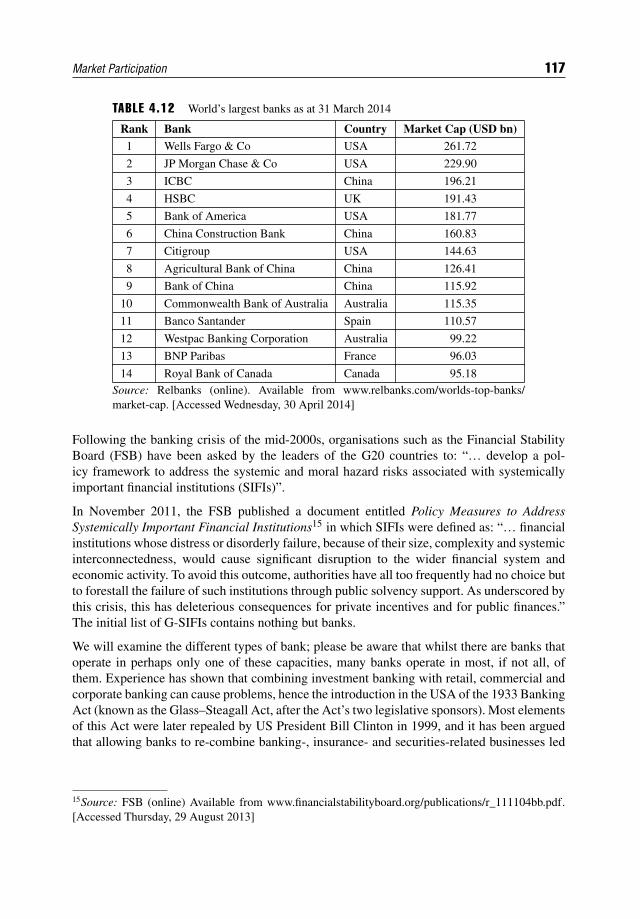
Market Participation 117
TABLE 4.12 World’s largest banks as at 31 March 2014
Rank Bank Country Market Cap (USD bn)1 Wells Fargo & Co USA 261.72
2 JP Morgan Chase & Co USA 229.90
3 ICBC China 196.21
4 HSBC UK 191.43
5 Bank of America USA 181.77
6 China Construction Bank China 160.83
7 Citigroup USA 144.63
8 Agricultural Bank of China China 126.41
9 Bank of China China 115.92
10 Commonwealth Bank of Australia Australia 115.35
11 Banco Santander Spain 110.57
12 Westpac Banking Corporation Australia 99.22
13 BNP Paribas France 96.03
14 Royal Bank of Canada Canada 95.18Source: Relbanks (online). Available from www.relbanks.com/worlds-top-banks/market-cap. [Accessed Wednesday, 30 April 2014]
Following the banking crisis of the mid-2000s, organisations such as the Financial StabilityBoard (FSB) have been asked by the leaders of the G20 countries to: “… develop a pol-icy framework to address the systemic and moral hazard risks associated with systemicallyimportant financial institutions (SIFIs)”.
In November 2011, the FSB published a document entitled Policy Measures to AddressSystemically Important Financial Institutions15 in which SIFIs were defined as: “… financialinstitutions whose distress or disorderly failure, because of their size, complexity and systemicinterconnectedness, would cause significant disruption to the wider financial system andeconomic activity. To avoid this outcome, authorities have all too frequently had no choice butto forestall the failure of such institutions through public solvency support. As underscored bythis crisis, this has deleterious consequences for private incentives and for public finances.”The initial list of G-SIFIs contains nothing but banks.
We will examine the different types of bank; please be aware that whilst there are banks thatoperate in perhaps only one of these capacities, many banks operate in most, if not all, ofthem. Experience has shown that combining investment banking with retail, commercial andcorporate banking can cause problems, hence the introduction in the USA of the 1933 BankingAct (known as the Glass–Steagall Act, after the Act’s two legislative sponsors). Most elementsof this Act were later repealed by US President Bill Clinton in 1999, and it has been arguedthat allowing banks to re-combine banking-, insurance- and securities-related businesses led
15Source: FSB (online) Available from www.financialstabilityboard.org/publications/r_111104bb.pdf.[Accessed Thursday, 29 August 2013]
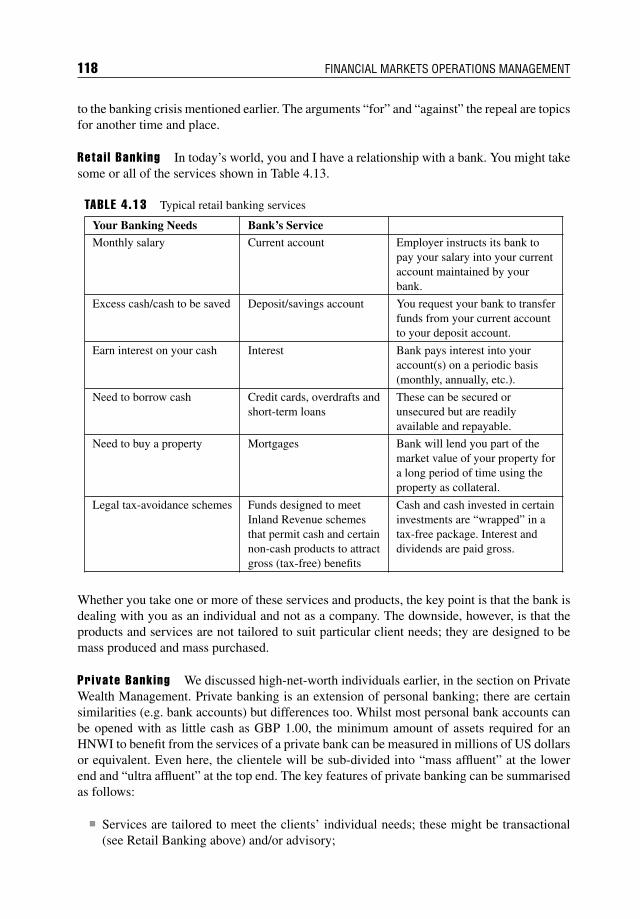
118 FINANCIAL MARKETS OPERATIONS MANAGEMENT
to the banking crisis mentioned earlier. The arguments “for” and “against” the repeal are topicsfor another time and place.
Reta i l Banking In today’s world, you and I have a relationship with a bank. You might takesome or all of the services shown in Table 4.13.
TABLE 4.13 Typical retail banking services
Your Banking Needs Bank’s ServiceMonthly salary Current account Employer instructs its bank to
pay your salary into your currentaccount maintained by yourbank.
Excess cash/cash to be saved Deposit/savings account You request your bank to transferfunds from your current accountto your deposit account.
Earn interest on your cash Interest Bank pays interest into youraccount(s) on a periodic basis(monthly, annually, etc.).
Need to borrow cash Credit cards, overdrafts andshort-term loans
These can be secured orunsecured but are readilyavailable and repayable.
Need to buy a property Mortgages Bank will lend you part of themarket value of your property fora long period of time using theproperty as collateral.
Legal tax-avoidance schemes Funds designed to meetInland Revenue schemesthat permit cash and certainnon-cash products to attractgross (tax-free) benefits
Cash and cash invested in certaininvestments are “wrapped” in atax-free package. Interest anddividends are paid gross.
Whether you take one or more of these services and products, the key point is that the bank isdealing with you as an individual and not as a company. The downside, however, is that theproducts and services are not tailored to suit particular client needs; they are designed to bemass produced and mass purchased.
Private Banking We discussed high-net-worth individuals earlier, in the section on PrivateWealth Management. Private banking is an extension of personal banking; there are certainsimilarities (e.g. bank accounts) but differences too. Whilst most personal bank accounts canbe opened with as little cash as GBP 1.00, the minimum amount of assets required for anHNWI to benefit from the services of a private bank can be measured in millions of US dollarsor equivalent. Even here, the clientele will be sub-divided into “mass affluent” at the lowerend and “ultra affluent” at the top end. The key features of private banking can be summarisedas follows:
Services are tailored to meet the clients’ individual needs; these might be transactional(see Retail Banking above) and/or advisory;
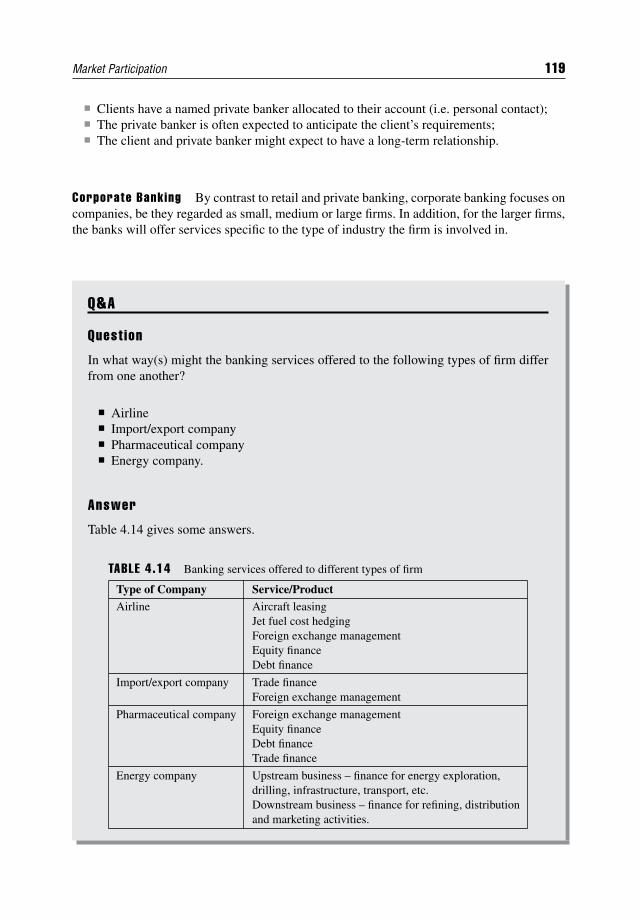
Market Participation 119
Clients have a named private banker allocated to their account (i.e. personal contact); The private banker is often expected to anticipate the client’s requirements; The client and private banker might expect to have a long-term relationship.
Corporate Banking By contrast to retail and private banking, corporate banking focuses oncompanies, be they regarded as small, medium or large firms. In addition, for the larger firms,the banks will offer services specific to the type of industry the firm is involved in.
Q&A
Quest ion
In what way(s) might the banking services offered to the following types of firm differfrom one another?
Airline Import/export company Pharmaceutical company Energy company.
Answer
Table 4.14 gives some answers.
TABLE 4.14 Banking services offered to different types of firm
Type of Company Service/ProductAirline Aircraft leasing
Jet fuel cost hedgingForeign exchange managementEquity financeDebt finance
Import/export company Trade financeForeign exchange management
Pharmaceutical company Foreign exchange managementEquity financeDebt financeTrade finance
Energy company Upstream business – finance for energy exploration,drilling, infrastructure, transport, etc.Downstream business – finance for refining, distributionand marketing activities.
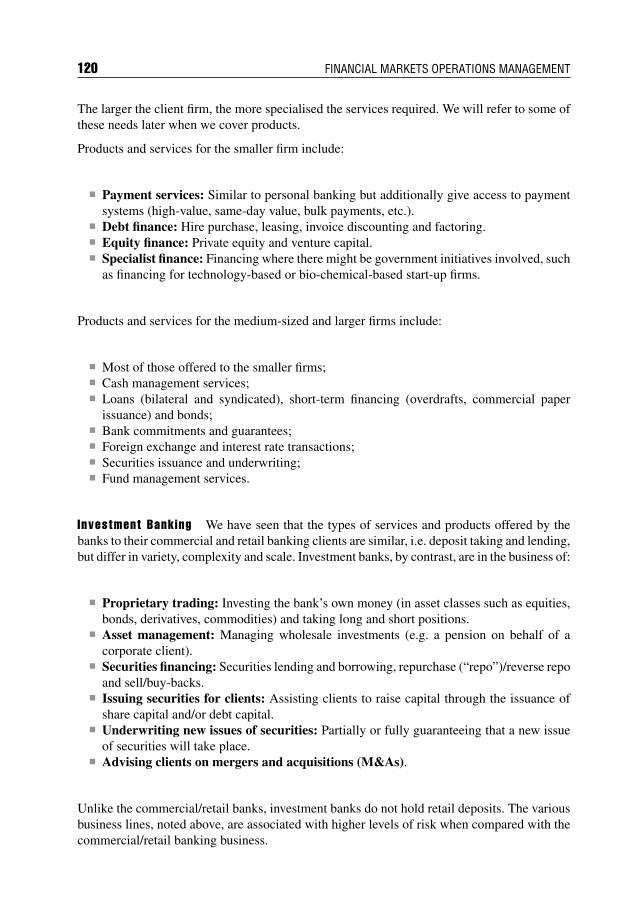
120 FINANCIAL MARKETS OPERATIONS MANAGEMENT
The larger the client firm, the more specialised the services required. We will refer to some ofthese needs later when we cover products.
Products and services for the smaller firm include:
Payment services: Similar to personal banking but additionally give access to paymentsystems (high-value, same-day value, bulk payments, etc.).
Debt finance: Hire purchase, leasing, invoice discounting and factoring. Equity finance: Private equity and venture capital. Specialist finance: Financing where there might be government initiatives involved, such
as financing for technology-based or bio-chemical-based start-up firms.
Products and services for the medium-sized and larger firms include:
Most of those offered to the smaller firms; Cash management services; Loans (bilateral and syndicated), short-term financing (overdrafts, commercial paper
issuance) and bonds; Bank commitments and guarantees; Foreign exchange and interest rate transactions; Securities issuance and underwriting; Fund management services.
Investment Banking We have seen that the types of services and products offered by thebanks to their commercial and retail banking clients are similar, i.e. deposit taking and lending,but differ in variety, complexity and scale. Investment banks, by contrast, are in the business of:
Proprietary trading: Investing the bank’s own money (in asset classes such as equities,bonds, derivatives, commodities) and taking long and short positions.
Asset management: Managing wholesale investments (e.g. a pension on behalf of acorporate client).
Securities financing: Securities lending and borrowing, repurchase (“repo”)/reverse repoand sell/buy-backs.
Issuing securities for clients: Assisting clients to raise capital through the issuance ofshare capital and/or debt capital.
Underwriting new issues of securities: Partially or fully guaranteeing that a new issueof securities will take place.
Advising clients on mergers and acquisitions (M&As).
Unlike the commercial/retail banks, investment banks do not hold retail deposits. The variousbusiness lines, noted above, are associated with higher levels of risk when compared with thecommercial/retail banking business.
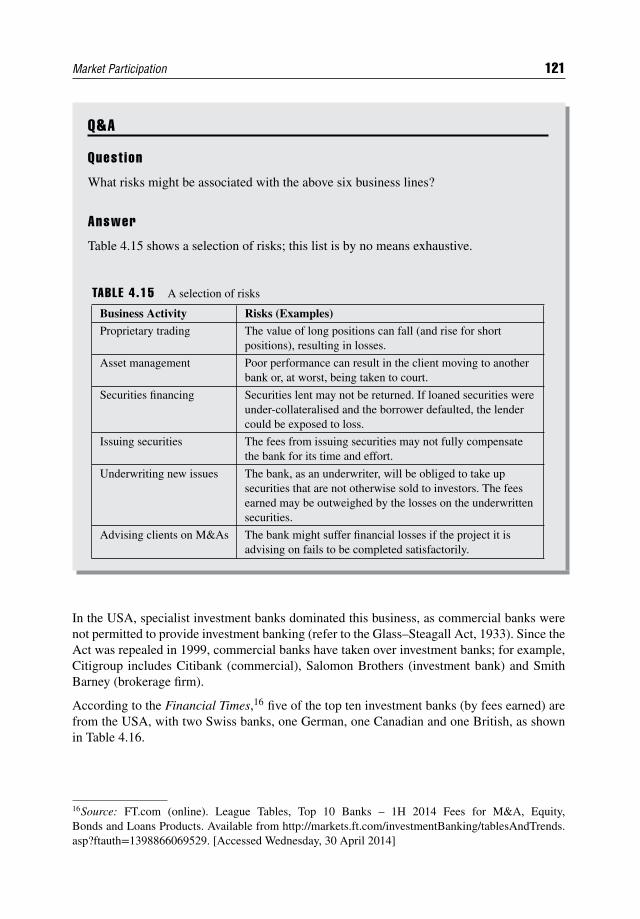
Market Participation 121
Q&A
Quest ion
What risks might be associated with the above six business lines?
Answer
Table 4.15 shows a selection of risks; this list is by no means exhaustive.
TABLE 4.15 A selection of risks
Business Activity Risks (Examples)
Proprietary trading The value of long positions can fall (and rise for shortpositions), resulting in losses.
Asset management Poor performance can result in the client moving to anotherbank or, at worst, being taken to court.
Securities financing Securities lent may not be returned. If loaned securities wereunder-collateralised and the borrower defaulted, the lendercould be exposed to loss.
Issuing securities The fees from issuing securities may not fully compensatethe bank for its time and effort.
Underwriting new issues The bank, as an underwriter, will be obliged to take upsecurities that are not otherwise sold to investors. The feesearned may be outweighed by the losses on the underwrittensecurities.
Advising clients on M&As The bank might suffer financial losses if the project it isadvising on fails to be completed satisfactorily.
In the USA, specialist investment banks dominated this business, as commercial banks werenot permitted to provide investment banking (refer to the Glass–Steagall Act, 1933). Since theAct was repealed in 1999, commercial banks have taken over investment banks; for example,Citigroup includes Citibank (commercial), Salomon Brothers (investment bank) and SmithBarney (brokerage firm).
According to the Financial Times,16 five of the top ten investment banks (by fees earned) arefrom the USA, with two Swiss banks, one German, one Canadian and one British, as shownin Table 4.16.
16Source: FT.com (online). League Tables, Top 10 Banks – 1H 2014 Fees for M&A, Equity,Bonds and Loans Products. Available from http://markets.ft.com/investmentBanking/tablesAndTrends.asp?ftauth=1398866069529. [Accessed Wednesday, 30 April 2014]
122 FINANCIAL MARKETS OPERATIONS MANAGEMENT
TABLE 4.16 Top ten investment banks
% of Fees Earned by Product in 1Q 2014
Bank Fees (USDm) M&A Equity Bonds Loans
JP Morgan 1,369.47 25 22 30 22
Goldman Sachs 1,319.09 40 25 23 12
Bank of America Merrill Lynch 1,159.28 22 19 31 28
Morgan Stanley 1,058.50 28 33 28 11
Deutsche Bank 904.00 18 23 33 25
Citi 873.24 18 25 37 19
Credit Suisse 862.55 26 24 29 20
Barclays 817.76 28 19 33 20
UBS 488.96 24 28 29 19
RBC Capital Markets 449.26 27 24 27 22
Total: 9,302.11Source: FT.com (online). League Tables, Top 10 Banks – 1H 2014 Fees for M&A, Equity, Bondsand Loans Products. Available from http://markets.ft.com/investmentBanking/tablesAndTrends.asp?ftauth=1398866069529. [Accessed Wednesday, 30 April 2014]
These ten banks can be regarded as “full-service” investment banks; in addition there arefinancial service conglomerates that combine commercial banking, investment banking and,sometimes, insurance (e.g. Daiwa Securities, Credit Agricole, Rabobank and Standard Char-tered Bank), and independent investment banks (e.g. Cantor Fitzgerald, Cowen Group, Investecand Piper Jaffray).
Notable casualties from the 2008 banking crisis were investment banks such as:
Bear Stearns – collapsed in 2008, assets acquired by JP Morgan Chase; HBOS – acquired by Lloyds TSB in 2009; Lehman Brothers – bankrupt in 2008, assets sold to Barclays Capital and Nomura
Holdings; Merrill Lynch – acquired by Bank of America in 2008.
Central Banks A central bank (also referred to as a reserve bank, monetary authority orbank of <country> in some countries) is an institution that manages the currency, moneysupply and interest rates of the country in which it is located. Since 1999 in Europe, theEuropean Central Bank has operated in addition to the various country-specific central banks.
The main functions of a central bank usually focus on the following:
Controlling the issue of notes and coins; Controlling the money supply; Controlling non-bank financial institutions that supply credit; Overseeing the financial sector to prevent crises; Acting as lender of last resort to the banking sector; Acting as the government’s banker; Acting as the government’s agent in dealing with its gold and foreign exchange matters; Holding the government’s gold and foreign exchange reserves.
Market Participation 123
Of these functions, the most important is undertaking monetary control operations, which canbe sub-divided into the following three tools:
Open market operations: The money supply is increased by the central bank buying gov-ernment securities (and/or using reverse repo agreements) and decreased by sellingsecurities (and/or using repo agreements).
Discount window: The central bank can influence the amount of cash borrowed by thebanks by changing its discount rate. The higher the rate, the less cash the banks willusually decide to borrow; the lower the rate, the greater amount of cash borrowed.
Reserve requirements: Banks are required to hold minimum levels of reserve. The greaterthe required reserves, the less lending the banks can engage in; the lower the reserverequirement, the more lending the banks can undertake.
Cooperation amongst the central banks has been centred on the Bank for International Settle-ments (BIS), an institution established in 1930 and, according to its website: “… the world’soldest international financial institution…”. Its mission is to: “… serve central banks in theirpursuit of monetary and financial stability, to foster international cooperation in those areasand to act as a bank for central banks”.17
A list of websites for central banks and monetary authorities can be found at www.bis.org/cbanks.htm.
Quasi -Sovereigns and Supranat ional Agencies In this section, we will look at a groupof institutions that are neither banks nor corporations. These institutions are closely linked togovernments in one way or another but are not regarded as being governments. Predominantlynet borrowers, they can also be investors. Finally, they can be implicitly or explicitly guaranteedby their government and, for this reason, often attract a top-level credit rating.
The institutions fall into three categories:
Municipalities; Government agencies; Supranational agencies.
Municipalities Municipalities (local government, local authorities) generate revenuethrough local taxation and by funding themselves in several ways:
Borrowing through central government; Borrowing from the banks; Raising capital in the bond markets by issuing bonds (known as municipal bonds or
“munis”).
If a municipality issues a bond to pay for general purposes, these are referred to as generalsecurities and serviced out of general taxation. If the municipality wishes to fund a specific
17Source: BIS (online). “About BIS.” Available from www.bis.org/about/index.htm?l=2. [Accessed Sat-urday, 31 August 2013]
124 FINANCIAL MARKETS OPERATIONS MANAGEMENT
project, the bonds are known as revenue securities. Here, it is expected that the project willgenerate sufficient cash to service the debt, for example, financing the construction of a tollmotorway by issuing a bond and paying the interest and final redemption through the tollslevied on the motorway users.
Municipalities manage their cash and any excess liquidity in the money markets. They alsouse interest rate derivatives such as swaps to manage their risk. They do not tend to invest inthe equity markets.
Q&A
Quest ion
If corporate issuers can default and go bankrupt, can municipalities? What do you think?
Answer
If you think the answer is “no”, then you would either expect the central government tosupport the issuer or the bond to be insured by one of several primary bond insurers.
If you think the answer is “yes”, then you should be aware that a small percentage ofissuers have defaulted. A recent example is the city of Detroit in the USA, once the“capital” of the car-making industry but now considered bankrupt, with the state ofMichigan having taken over administrative control of the city.18
Municipals do tend to pay out higher recovery levels, anything from the full 100% offace value to as little as 40%.
Government Agencies Governments establish agencies typically for a particular purpose,for example an infrastructural project such as the high-speed rail link, known as High Speed2 (HS2) between London and the north of England. The project is being developed by HighSpeed Two Limited, a company limited by guarantee established by the UK Government andthe projected cost is estimated to be GBP 42.6 bn, with the Institute of Economic Affairsforecasting the cost to rise to over GBP 80 bn.19
18The Michigan state governor, Rick Snyder, declared a financial emergency in March 2013, stating thatthe city had a USD 327 million budget deficit with more than USD 14 billion in long-term debt on itsbooks. On 14 June 2013, Detroit defaulted on USD 2.5 billion of debt by withholding USD 39.7 millionin interest payments. On 18 July 2013, Detroit became the largest US city to file for bankruptcy.19Source: Daily Telegraph article 17 August 2013, by Robert Watts (online). “High Speed rail schemecost to double to £80 bn, economists warn.” Available from www.telegraph.co.uk/news/uknews/10249815/High-speed-rail-scheme-cost-to-double-to-80bn-economists-warn.html. [Accessed Thursday,05 September 2013]
Market Participation 125
In fact, the first Eurobond was issued in 1963 by an Italian agency, the Autostrade Concessionie Contruzioni. Bonds issued by these agencies are implicitly or explicitly guaranteed by thegovernment.
Perhaps the most well-known agencies are the US mortgage agencies: the Federal NationalMortgage Association, the Government National Mortgage Association and the Federal HomeLoan Housing Corporation. All three are known in the markets by their colloquial acronyms:Fannie Mae (FNMA), Ginnie Mae (GNMA) and Freddie Mac (FHLHC). The basic details ofthese three agencies are shown in Table 4.17.
TABLE 4.17 US mortgage agencies
Agency Purpose Comments
FNMA Its purpose is to buy mortgagesfrom mortgage lenders. This isfunded by borrowing in thecapital markets.
Privately owned, government-sponsoredagency. Bailed out by the US Government in2008 and placed into governmentconservatorship.
GNMA Its purpose is to enablemortgages for affordable housingand it was an innovator in themortgage-backed securitymarket.
A government-guaranteed agency.
FHLHC Same business model as FNMA. Was also placed into governmentconservatorship in 2008.
Supranational Agencies These are agencies owned by more than one government, which,like the other types of agency we have looked at, borrow in the capital markets to raisecapital for developing projects either in a specific region or globally. The shareholders of theseagencies are countries rather than corporate/retail investors and, as such, are regarded as publicbodies. These agencies provide their support to the relevant projects either by lending moneyor making grants.
The supranational agencies are prolific borrowers in the bond markets and significant investors,using the money markets and FX markets to manage their reserves. The major agencies arelisted below, and ownership and purpose details are shown in Table 4.18.
The World Bank; The European Investment Bank (EIB); The European Bank for Reconstruction and Development (EBRD); Inter-American Development Bank (IADB); Asian Development Bank (AsDB); African Development Bank (AfDB).
The World Bank tends to borrow in many currencies, using derivatives to turn them intoUS dollars, in contrast to the EBRD, which prefers to borrow in the local currencies of the
126 FINANCIAL MARKETS OPERATIONS MANAGEMENT
TABLE 4.18 Supranational agencies
Agency Ownership Purpose
World Bank/InternationalBank for Reconstruction andDevelopment (IBRD)
Any country member of theInternational Monetary Fund,with shareholdings based ontheir economic status.
Supports projects in poor andmedium-income countries.
World Bank/InternationalDevelopment Agency (IDA)
Supports the poorestcountries.
EIB Owned by the EU countries. Supports projects mainly inthe European region andother areas (to a lesserextent).
EBRD Owned by 61 countries, mainlyEuropean but also non-Europeanplus the EU and the EIB.
Provides loans and tradefinance especially in centraland eastern Europe.
IADB Owned by 48 countries includingthe USA (30%), 26 borrowingLatin American and Caribbeancountries (50%) and 20% by 21non-borrowing countries, such asGermany and Japan.
Provides loans, grants andguarantees for Latin Americaand the Caribbean countries.
AsDB As with the IADB, membershipcomes from a group ofinternational and local countries.
Provides loans, grants andguarantees for Asiancountries.
AfDB As with the IADB, membershipcomes from a group ofinternational and local countries.
Provides loans, grants andguarantees for Africancountries.
countries in which the projects are taking place. By far the biggest borrower is now the EIB(previously it was the World Bank).
4.2.4 Sel l -S ide Intermediaries
In market terminology, we use the term sell side to refer to those firms that either sell to theinvestor side of the industry (known as the buy side) and/or trade on their own behalf. Thissection defines the different sell-side intermediaries and briefly describes their roles in themarket.
Brokers It is generally not possible for the buy side to access the markets directly. Instead,buy-side investors will make use of brokers for this purpose. Also known as stockbrokers,these agents provide a number of services to their clients, including:
Advising clients on which investments to make; Executing transactions based on their clients’ instructions (non-discretionary); Executing transactions on behalf of their clients (discretionary).
Brokers do not invest their own firm’s capital; their prime role is to act on behalf of theirclients. Brokers make their money by charging brokerage fees based on the market value ofthe transaction. The fee structure will reflect the level of service offered to their clients.
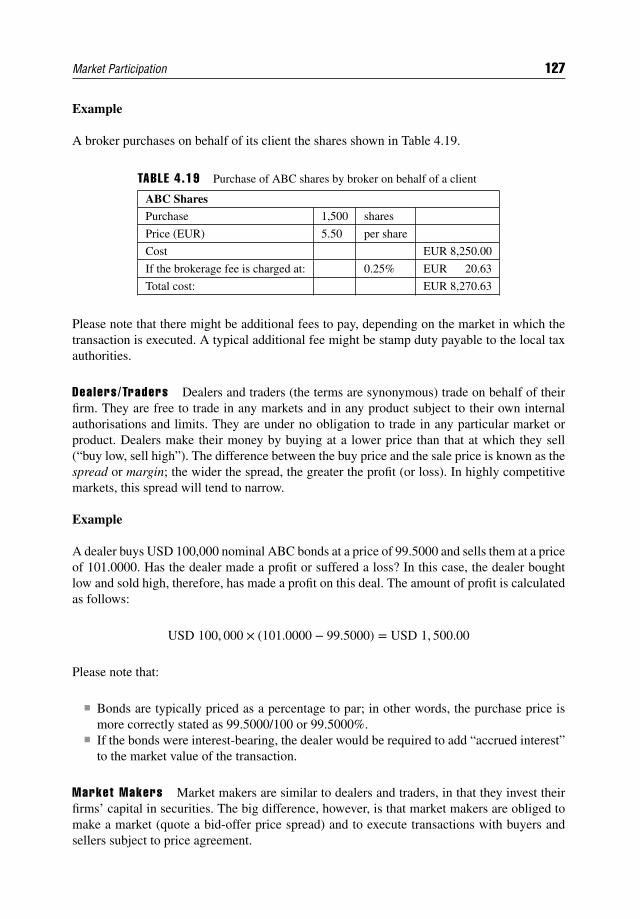
Market Participation 127
Example
A broker purchases on behalf of its client the shares shown in Table 4.19.
TABLE 4.19 Purchase of ABC shares by broker on behalf of a client
ABC SharesPurchase 1,500 shares
Price (EUR) 5.50 per share
Cost EUR 8,250.00
If the brokerage fee is charged at: 0.25% EUR 20.63
Total cost: EUR 8,270.63
Please note that there might be additional fees to pay, depending on the market in which thetransaction is executed. A typical additional fee might be stamp duty payable to the local taxauthorities.
Dealers/Traders Dealers and traders (the terms are synonymous) trade on behalf of theirfirm. They are free to trade in any markets and in any product subject to their own internalauthorisations and limits. They are under no obligation to trade in any particular market orproduct. Dealers make their money by buying at a lower price than that at which they sell(“buy low, sell high”). The difference between the buy price and the sale price is known as thespread or margin; the wider the spread, the greater the profit (or loss). In highly competitivemarkets, this spread will tend to narrow.
Example
A dealer buys USD 100,000 nominal ABC bonds at a price of 99.5000 and sells them at a priceof 101.0000. Has the dealer made a profit or suffered a loss? In this case, the dealer boughtlow and sold high, therefore, has made a profit on this deal. The amount of profit is calculatedas follows:
USD 100, 000 × (101.0000 − 99.5000) = USD 1, 500.00
Please note that:
Bonds are typically priced as a percentage to par; in other words, the purchase price ismore correctly stated as 99.5000/100 or 99.5000%.
If the bonds were interest-bearing, the dealer would be required to add “accrued interest”to the market value of the transaction.
Market Makers Market makers are similar to dealers and traders, in that they invest theirfirms’ capital in securities. The big difference, however, is that market makers are obliged tomake a market (quote a bid-offer price spread) and to execute transactions with buyers andsellers subject to price agreement.
128 FINANCIAL MARKETS OPERATIONS MANAGEMENT
This obligation to make a two-way price in securities in which they make markets can becomequite onerous; for example, if share prices are going down, investors might wish to sell theirsecurities. For the market makers, this means that they are buying shares and seeing the shareprice continuing to go down. In addition, they have to pay for the shares and that will requiresome form of financing. By contrast, if the market is going up, investors might wish to buyand the market maker will be obliged to sell. If they do not hold the securities, then deliverybecomes impossible; in this case, the market maker needs access to securities borrowingfacilities in order to complete the delivery.
For the very large issuing companies, several competing market makers will make prices inthe securities; this makes it very competitive and helps to narrow the bid-offer spread. Marketmakers will adjust their prices to keep in step with the market and to persuade or dissuadeinvestors seeking to execute a trade with them.
Broker/Dealers So far we have seen brokers acting on behalf of clients (but not for theirown account) and dealers who trade for their own account. There are firms which act in bothcapacities, as a broker and separately as a dealer. This can lead to a conflict of interest.
Example
A client approaches a firm in a broker capacity and wishes to buy some securities. As thebroker does not hold any inventory, he is obliged to go to a dealer to obtain the securities. Ifthe broker goes to his own dealer, there is a danger that the dealer might go into the marketsand buy the securities for his own account, known as “front running”. That might lead to anincrease in the market price and if the broker then purchases the securities from his dealer, thepurchase will be executed at a higher price in this case. To avoid the risk of a broker gettingan unfair price from his dealer, the broker is obliged to seek the best price in the market. Thiscould mean that in order to get the best price, the broker might have to purchase the securitiesfrom another dealer, perhaps a competitor.
In any event it is expected that there is a clear separation between the broker side of thebusiness and the dealer side. We can refer to this “separation” as a Chinese Wall.
Inter-Dealer Brokers We have seen that it is quite possible to have several competingmarket makers for any one particular security. If one of these market makers were to attemptto cover a short position (because somebody wanted to buy from a market maker that hadinsufficient securities) and was unable to borrow the securities, then the only option wouldbe to go into the market and buy the securities from another market maker. This wouldmake it obvious what the former market maker’s situation was and the latter market makerwould certainly seek to benefit from this by quoting a high price. To avoid such a situation,the market maker would wish to remain anonymous to its competitors but still obtain thesecurities needed. What they require is an intermediary that can act as a broker to the marketmakers, and this intermediary is known as an inter-dealer broker (IDB). Trading through anIDB enables the market maker to fill its position without the rest of the market knowing who isdoing this.
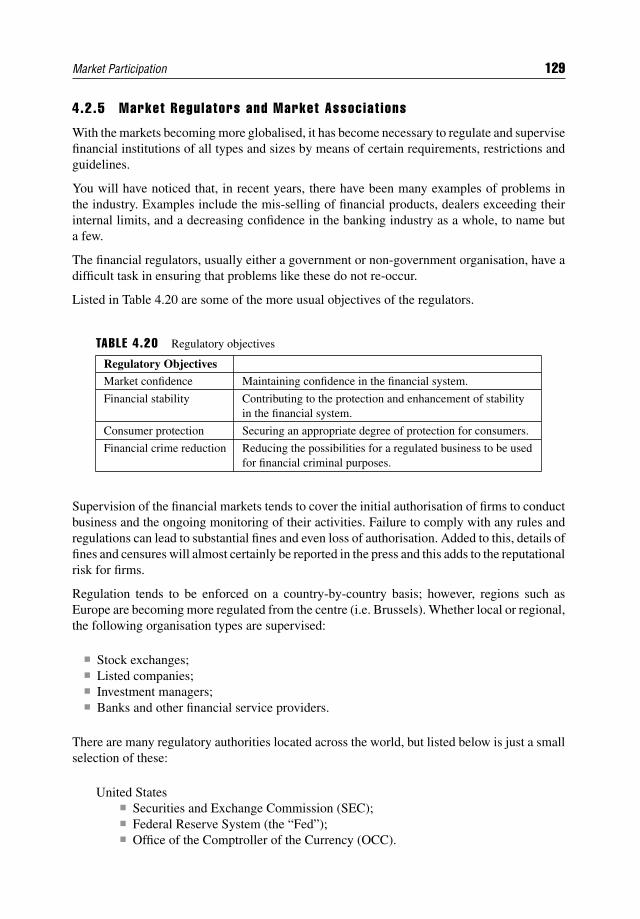
Market Participation 129
4.2.5 Market Regulators and Market Associat ions
With the markets becoming more globalised, it has become necessary to regulate and supervisefinancial institutions of all types and sizes by means of certain requirements, restrictions andguidelines.
You will have noticed that, in recent years, there have been many examples of problems inthe industry. Examples include the mis-selling of financial products, dealers exceeding theirinternal limits, and a decreasing confidence in the banking industry as a whole, to name buta few.
The financial regulators, usually either a government or non-government organisation, have adifficult task in ensuring that problems like these do not re-occur.
Listed in Table 4.20 are some of the more usual objectives of the regulators.
TABLE 4.20 Regulatory objectives
Regulatory ObjectivesMarket confidence Maintaining confidence in the financial system.
Financial stability Contributing to the protection and enhancement of stabilityin the financial system.
Consumer protection Securing an appropriate degree of protection for consumers.
Financial crime reduction Reducing the possibilities for a regulated business to be usedfor financial criminal purposes.
Supervision of the financial markets tends to cover the initial authorisation of firms to conductbusiness and the ongoing monitoring of their activities. Failure to comply with any rules andregulations can lead to substantial fines and even loss of authorisation. Added to this, details offines and censures will almost certainly be reported in the press and this adds to the reputationalrisk for firms.
Regulation tends to be enforced on a country-by-country basis; however, regions such asEurope are becoming more regulated from the centre (i.e. Brussels). Whether local or regional,the following organisation types are supervised:
Stock exchanges; Listed companies; Investment managers; Banks and other financial service providers.
There are many regulatory authorities located across the world, but listed below is just a smallselection of these:
United States Securities and Exchange Commission (SEC); Federal Reserve System (the “Fed”); Office of the Comptroller of the Currency (OCC).
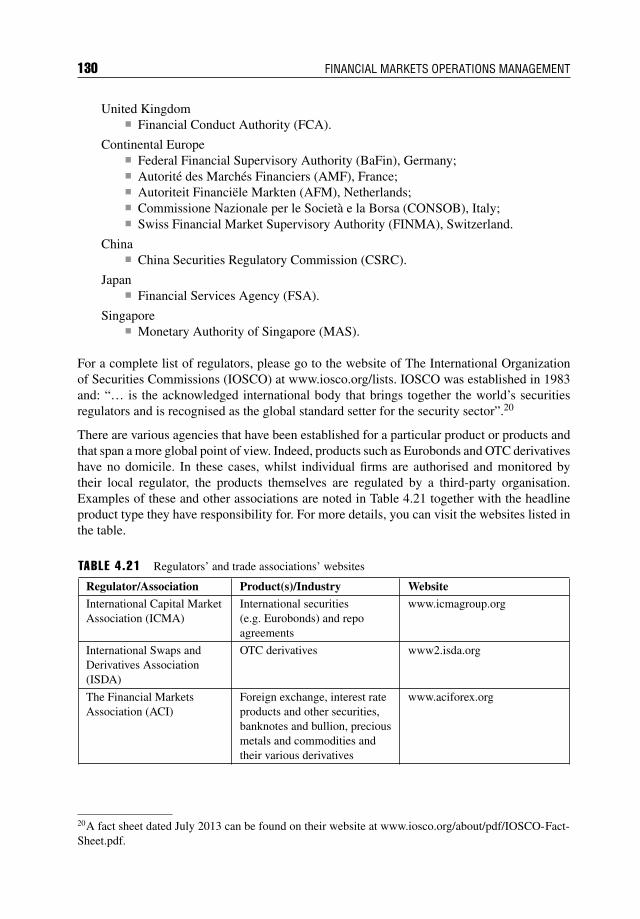
130 FINANCIAL MARKETS OPERATIONS MANAGEMENT
United Kingdom Financial Conduct Authority (FCA).
Continental Europe Federal Financial Supervisory Authority (BaFin), Germany; Autorite des Marches Financiers (AMF), France; Autoriteit Financiele Markten (AFM), Netherlands; Commissione Nazionale per le Societa e la Borsa (CONSOB), Italy; Swiss Financial Market Supervisory Authority (FINMA), Switzerland.
China China Securities Regulatory Commission (CSRC).
Japan Financial Services Agency (FSA).
Singapore Monetary Authority of Singapore (MAS).
For a complete list of regulators, please go to the website of The International Organizationof Securities Commissions (IOSCO) at www.iosco.org/lists. IOSCO was established in 1983and: “… is the acknowledged international body that brings together the world’s securitiesregulators and is recognised as the global standard setter for the security sector”.20
There are various agencies that have been established for a particular product or products andthat span a more global point of view. Indeed, products such as Eurobonds and OTC derivativeshave no domicile. In these cases, whilst individual firms are authorised and monitored bytheir local regulator, the products themselves are regulated by a third-party organisation.Examples of these and other associations are noted in Table 4.21 together with the headlineproduct type they have responsibility for. For more details, you can visit the websites listed inthe table.
TABLE 4.21 Regulators’ and trade associations’ websites
Regulator/Association Product(s)/Industry Website
International Capital MarketAssociation (ICMA)
International securities(e.g. Eurobonds) and repoagreements
www.icmagroup.org
International Swaps andDerivatives Association(ISDA)
OTC derivatives www2.isda.org
The Financial MarketsAssociation (ACI)
Foreign exchange, interest rateproducts and other securities,banknotes and bullion, preciousmetals and commodities andtheir various derivatives
www.aciforex.org
20A fact sheet dated July 2013 can be found on their website at www.iosco.org/about/pdf/IOSCO-Fact-Sheet.pdf.
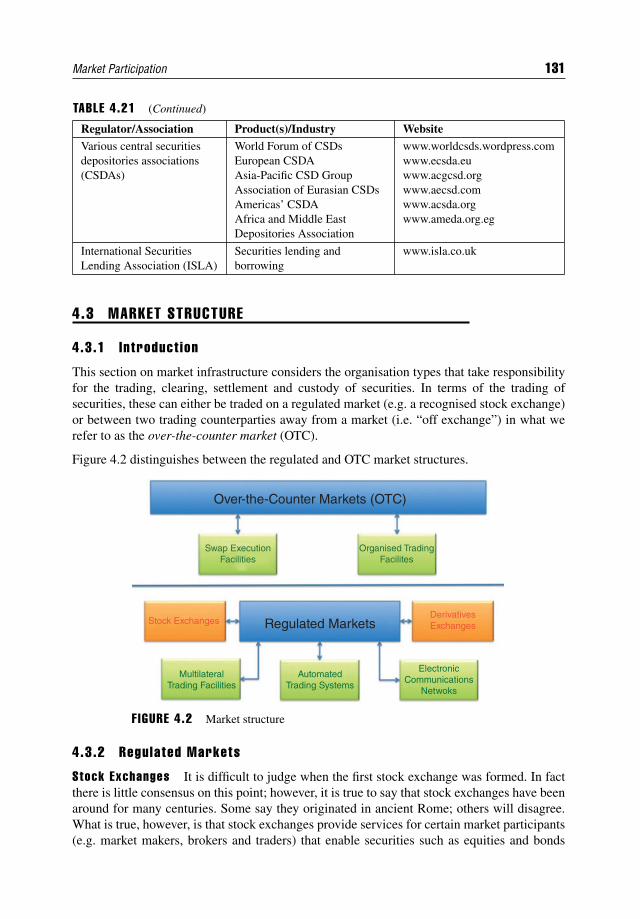
Market Participation 131
TABLE 4.21 (Continued)
Regulator/Association Product(s)/Industry WebsiteVarious central securitiesdepositories associations(CSDAs)
World Forum of CSDsEuropean CSDAAsia-Pacific CSD GroupAssociation of Eurasian CSDsAmericas’ CSDAAfrica and Middle EastDepositories Association
www.worldcsds.wordpress.comwww.ecsda.euwww.acgcsd.orgwww.aecsd.comwww.acsda.orgwww.ameda.org.eg
International SecuritiesLending Association (ISLA)
Securities lending andborrowing
www.isla.co.uk
4.3 MARKET STRUCTURE
4.3.1 Introduct ion
This section on market infrastructure considers the organisation types that take responsibilityfor the trading, clearing, settlement and custody of securities. In terms of the trading ofsecurities, these can either be traded on a regulated market (e.g. a recognised stock exchange)or between two trading counterparties away from a market (i.e. “off exchange”) in what werefer to as the over-the-counter market (OTC).
Figure 4.2 distinguishes between the regulated and OTC market structures.
Over-the-Counter Markets (OTC)
Swap ExecutionFacilities
Stock Exchanges
MultilateralTrading Facilities
Regulated Markets
Organised TradingFacilites
DerivativesExchanges
AutomatedTrading Systems
ElectronicCommunications
Netwoks
F IGURE 4.2 Market structure
4.3.2 Regulated Markets
Stock Exchanges It is difficult to judge when the first stock exchange was formed. In factthere is little consensus on this point; however, it is true to say that stock exchanges have beenaround for many centuries. Some say they originated in ancient Rome; others will disagree.What is true, however, is that stock exchanges provide services for certain market participants(e.g. market makers, brokers and traders) that enable securities such as equities and bonds
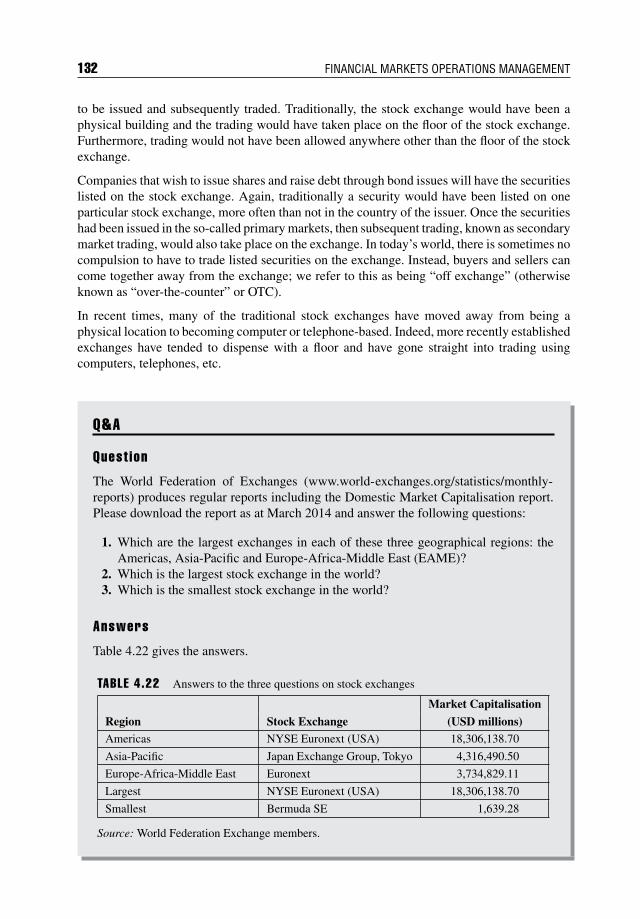
132 FINANCIAL MARKETS OPERATIONS MANAGEMENT
to be issued and subsequently traded. Traditionally, the stock exchange would have been aphysical building and the trading would have taken place on the floor of the stock exchange.Furthermore, trading would not have been allowed anywhere other than the floor of the stockexchange.
Companies that wish to issue shares and raise debt through bond issues will have the securitieslisted on the stock exchange. Again, traditionally a security would have been listed on oneparticular stock exchange, more often than not in the country of the issuer. Once the securitieshad been issued in the so-called primary markets, then subsequent trading, known as secondarymarket trading, would also take place on the exchange. In today’s world, there is sometimes nocompulsion to have to trade listed securities on the exchange. Instead, buyers and sellers cancome together away from the exchange; we refer to this as being “off exchange” (otherwiseknown as “over-the-counter” or OTC).
In recent times, many of the traditional stock exchanges have moved away from being aphysical location to becoming computer or telephone-based. Indeed, more recently establishedexchanges have tended to dispense with a floor and have gone straight into trading usingcomputers, telephones, etc.
Q&A
Quest ion
The World Federation of Exchanges (www.world-exchanges.org/statistics/monthly-reports) produces regular reports including the Domestic Market Capitalisation report.Please download the report as at March 2014 and answer the following questions:
1. Which are the largest exchanges in each of these three geographical regions: theAmericas, Asia-Pacific and Europe-Africa-Middle East (EAME)?
2. Which is the largest stock exchange in the world?3. Which is the smallest stock exchange in the world?
Answers
Table 4.22 gives the answers.
TABLE 4.22 Answers to the three questions on stock exchanges
Market Capitalisation
Region Stock Exchange (USD millions)Americas NYSE Euronext (USA) 18,306,138.70
Asia-Pacific Japan Exchange Group, Tokyo 4,316,490.50
Europe-Africa-Middle East Euronext 3,734,829.11
Largest NYSE Euronext (USA) 18,306,138.70
Smallest Bermuda SE 1,639.28
Source: World Federation Exchange members.
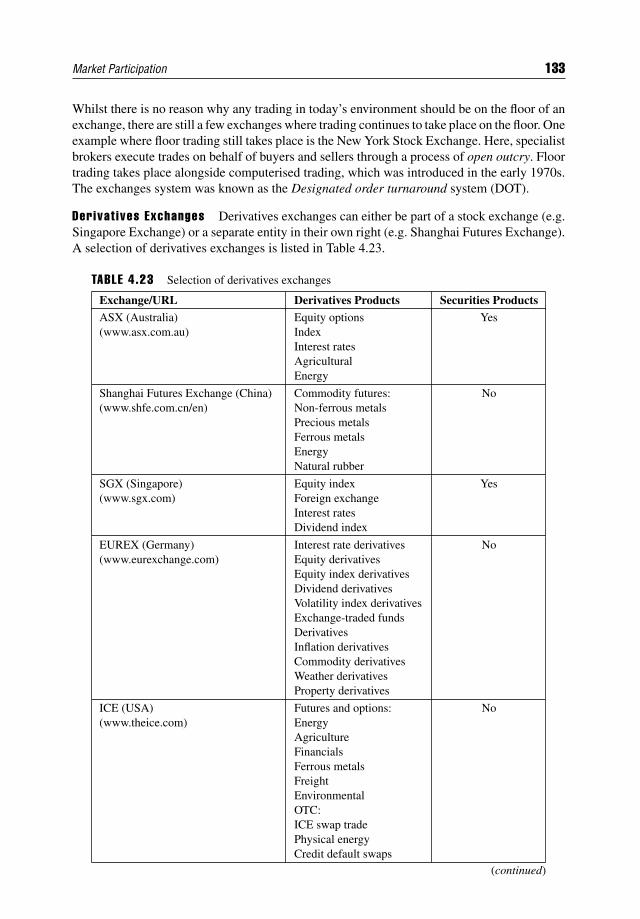
Market Participation 133
Whilst there is no reason why any trading in today’s environment should be on the floor of anexchange, there are still a few exchanges where trading continues to take place on the floor. Oneexample where floor trading still takes place is the New York Stock Exchange. Here, specialistbrokers execute trades on behalf of buyers and sellers through a process of open outcry. Floortrading takes place alongside computerised trading, which was introduced in the early 1970s.The exchanges system was known as the Designated order turnaround system (DOT).
Derivat ives Exchanges Derivatives exchanges can either be part of a stock exchange (e.g.Singapore Exchange) or a separate entity in their own right (e.g. Shanghai Futures Exchange).A selection of derivatives exchanges is listed in Table 4.23.
TABLE 4.23 Selection of derivatives exchanges
Exchange/URL Derivatives Products Securities ProductsASX (Australia)(www.asx.com.au)
Equity optionsIndexInterest ratesAgriculturalEnergy
Yes
Shanghai Futures Exchange (China)(www.shfe.com.cn/en)
Commodity futures:Non-ferrous metalsPrecious metalsFerrous metalsEnergyNatural rubber
No
SGX (Singapore)(www.sgx.com)
Equity indexForeign exchangeInterest ratesDividend index
Yes
EUREX (Germany)(www.eurexchange.com)
Interest rate derivativesEquity derivativesEquity index derivativesDividend derivativesVolatility index derivativesExchange-traded fundsDerivativesInflation derivativesCommodity derivativesWeather derivativesProperty derivatives
No
ICE (USA)(www.theice.com)
Futures and options:EnergyAgricultureFinancialsFerrous metalsFreightEnvironmentalOTC:ICE swap tradePhysical energyCredit default swaps
No
(continued)
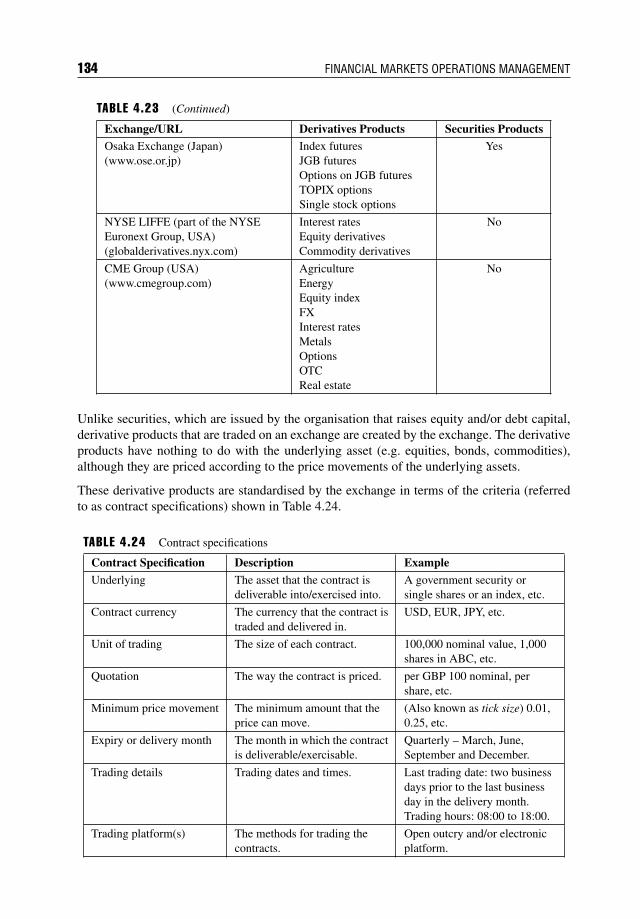
134 FINANCIAL MARKETS OPERATIONS MANAGEMENT
TABLE 4.23 (Continued)
Exchange/URL Derivatives Products Securities ProductsOsaka Exchange (Japan)(www.ose.or.jp)
Index futuresJGB futuresOptions on JGB futuresTOPIX optionsSingle stock options
Yes
NYSE LIFFE (part of the NYSEEuronext Group, USA)(globalderivatives.nyx.com)
Interest ratesEquity derivativesCommodity derivatives
No
CME Group (USA)(www.cmegroup.com)
AgricultureEnergyEquity indexFXInterest ratesMetalsOptionsOTCReal estate
No
Unlike securities, which are issued by the organisation that raises equity and/or debt capital,derivative products that are traded on an exchange are created by the exchange. The derivativeproducts have nothing to do with the underlying asset (e.g. equities, bonds, commodities),although they are priced according to the price movements of the underlying assets.
These derivative products are standardised by the exchange in terms of the criteria (referredto as contract specifications) shown in Table 4.24.
TABLE 4.24 Contract specifications
Contract Specification Description Example
Underlying The asset that the contract isdeliverable into/exercised into.
A government security orsingle shares or an index, etc.
Contract currency The currency that the contract istraded and delivered in.
USD, EUR, JPY, etc.
Unit of trading The size of each contract. 100,000 nominal value, 1,000shares in ABC, etc.
Quotation The way the contract is priced. per GBP 100 nominal, pershare, etc.
Minimum price movement The minimum amount that theprice can move.
(Also known as tick size) 0.01,0.25, etc.
Expiry or delivery month The month in which the contractis deliverable/exercisable.
Quarterly – March, June,September and December.
Trading details Trading dates and times. Last trading date: two businessdays prior to the last businessday in the delivery month.Trading hours: 08:00 to 18:00.
Trading platform(s) The methods for trading thecontracts.
Open outcry and/or electronicplatform.
Market Participation 135
4.3.3 Alternat ive Trading Venues
There are several non-exchange trading venues that compete with the traditional stockexchange model.
Mult i lateral Trading Faci l i t ies (MTFs) MTFs provide similar trading services, rules andmarket surveillance to the regulated markets. However, MTFs do not have a listing processand cannot change the regulatory status of a security.
Under new European rules (MiFID II), investment firms will have to be authorised as an MTFif they wish to operate internal matching or crossing systems in order to execute client orders.
MTFs are also obliged to make prices on existing orders available on market data feeds (pre-trade transparency) and publish trades in real time (post-trade transparency). Furthermore,there must be a consistent application of pricing and charges to all Facility members, a systemrulebook and the means by which to apply for membership of the Facility.
In 2011, two pan-European MTFs, BATS Europe and Chi-X Europe, merged to form BATSChi-X Europe. The merged entity became a Recognised Investment Exchange in 2013. Accord-ing to its press release dated 4 December 2013, BATS Chi-X Europe had 23% overall marketshare in Europe.21
Alternat ive Trading Systems (ATSs) An ATS is the US equivalent of an MTF in Europe.They are similar in concept to MTFs, in that they provide a marketplace for buyers and sellersto trade in securities. There are, however, some differences between an ATS and an MTF, forexample:
They do not perform self-regulation; They do not necessarily provide public information on prices; They do not set rules governing the conduct of ATS subscribers.
In the USA, ATSs are regulated as broker/dealers and are regulated differently than traditionalstock exchanges.
According to a paper prepared by the SEC’s Division of Economic and Risk Analysis(DERA),22 there are 35 broker/dealers operating 44 ATSs, and trading on the systems com-prises 10–15% of US equity trading volume. Lists of current ATS operators (including ECNs –see below) can be found on the SEC website at www.sec.gov/foia/docs/atslist.htm.
E lectronic Communicat ion Networks (ECNs) An ECN is a type of ATS that enablestraders and institutional investors to deal directly amongst themselves without the need to gothrough an exchange/OTC market maker.
21Source: BATS Global Markets (online) “BATS GLOBAL MARKETS IN NOVEMBER”.Available from http://cdn.batstrading.com/resources/press_releases/BATS_November2013_FINAL.pdf.[Accessed Wednesday, 22 January 2014]22Tuttle, Laura – October 2013 (online) “Alternative Trading Systems: Description of ATS Tradingin National Market System Stocks”. Available from www.sec.gov/marketstructure/research/ats_data_paper_october_2013.pdf. [Accessed Wednesday, 22 January 2014]
136 FINANCIAL MARKETS OPERATIONS MANAGEMENT
ECNs include Instinet (Institutional Network), which was established in 1969 and enables USinstitutions to trade directly with each other. The system was opened to broker/dealers andNASDAQ market makers in 1983.
4.3.4 Over-the-Counter Market
By contrast to the stock exchange trading system, the over-the-counter (OTC) market is anoff-exchange system where trading is carried out directly between the buyer and the seller.There is no stock exchange involvement with this. As with exchange trading, OTC tradingoccurs with financial instruments such as derivatives and Eurobonds.
OTC Derivat ives In the OTC derivatives market, transactions in financial instruments suchas interest rate swaps are tailored by the counterparties themselves rather than a derivativesexchange. Whilst this leads to innovation and bespoke products, there is a high degree ofopacity due to the fact that there is no centralisation of the products; in other words, the onlycounterparties who know about the product, and the transaction, will be the buyer and theseller. This can lead to a variety of risks, including, for example, counterparty risk. In recentyears, the global regulators have been concerned with this risk (and other types of risk as well)and have taken steps to introduce what is known as centralised clearing into the system. Wewill come across central counterparties (CCPs) in Chapter 5: Clearing Houses and CCPs.
A second major reform is the formation of new platforms for trading OTC derivatives electron-ically. In the USA, these new platforms are known as swap execution facilities (SEFs), and anSEF is defined as “… a facility, trading system or platform in which multiple participants havethe ability to execute or trade swaps by accepting bids and offers made by other participantsthat are open to multiple participants in the facility or system, through any means of interstatecommerce”.23
In Europe, the EU has proposed a similar approach by means of the establishment of organisedtrading facilities (OTFs) defined as “… any system or facility, which is not a regulated marketor MTF, operated by an investment firm or a market operator, in which multiple third-partybuying and selling interests in financial instruments are able to interact in the system”.24
Whilst there are some key differences in these definitions, the overall objective is to moveOTC derivative instruments and trading onto an exchange-type environment (i.e. an SEF or anOTF) with increased transparency and regulatory oversight. Differences include:
OTFs are designed to trade equities, commodities and other derivatives rather than justswaps (as under SEFs).
The OTF model includes the ability to use execution models that include voice brokerageas well as electronic trading.
23Source: Futures & Options World (11 November 2011) (online). “From OTC to OTF: SEFs, OTFs andthe new world of trading.” Available from www.fow.com/Article/2934329/From-OTC-to-OTF-SEFs-OTFs-and-the-new-world-of-trading.html. [Accessed Wednesday, 22 January 2014]24See footnote 22.
Market Participation 137
Eurobonds The Eurobond market is a variation on the OTC theme. Whilst many Eurobondissues are listed in Luxembourg and London, none are domiciled in any country. This meansthat as there are no domestic exchanges on which to trade, trading takes place “off exchange”.The Eurobond industry is regulated by the International Capital Market Association as aSelf-Regulated Organisation and its Rule Book covers the trading and settlements of thisproduct type.
4.4 SUMMARY
In this chapter we have seen how the buy-side and sell-side institutions participate in themarkets. We examined how investors can access the markets and the intermediaries who assistin this. There are different types of investor, from private investors (retail) to institutionalinvestors such as pension funds and insurance companies that can either invest their ownassets or appoint fund managers to do this for them on a discretionary basis.
Banks play a vital intermediary role whether on a commercial, investment, private or centralbanking basis.
The financial markets should be regulated in order to provide investors with a transparent andfair means to invest. We therefore have domestic regulators that consider local requirementsand regional regulators for a broader geographical/political region such as Europe.
There are trade associations that focus on specific markets (e.g. the FSA in Japan), prod-ucts (e.g. the ISDA for derivatives) and intermediaries (e.g. the various central securitiesdepositories associations).
Finally, we looked at regulated and OTC markets where the transactions are executed. Wehave seen that the traditional Stock Exchanges (where securities are listed, derivatives cre-ated and both are traded) are being challenged by alternative platforms such as MultilateralTrading Facilities, Alternative Trading Systems and Electronic Communications Networks.Furthermore, additional platforms are being introduced as a result of regulatory changes in theUSA and Europe (i.e. Organised Trading Facilities and Swap Execution Facilities) in order totransition OTC derivatives onto more transparent, regulated platforms.


PART
Two

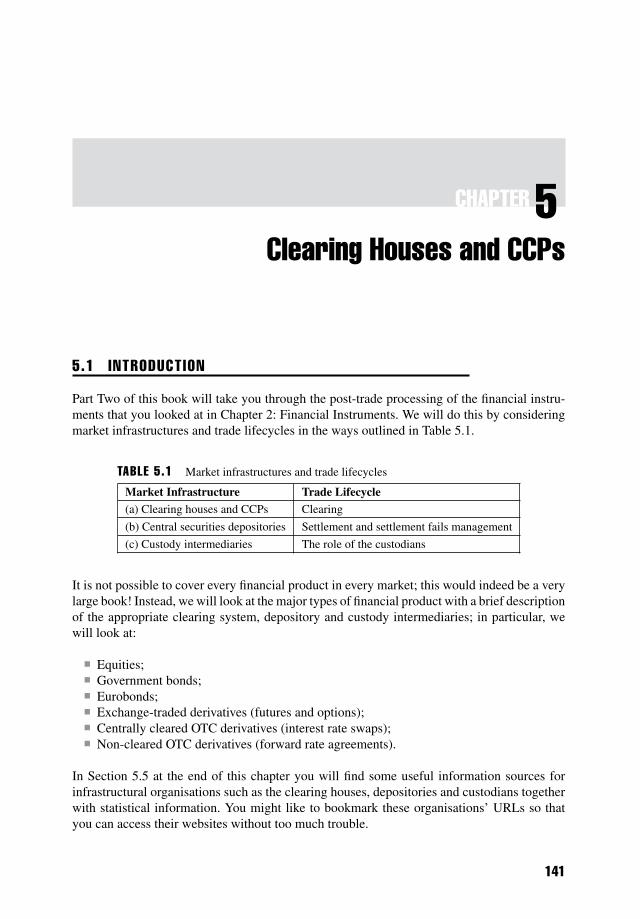
CHAPTER 5Clearing Houses and CCPs
5.1 INTRODUCTION
Part Two of this book will take you through the post-trade processing of the financial instru-ments that you looked at in Chapter 2: Financial Instruments. We will do this by consideringmarket infrastructures and trade lifecycles in the ways outlined in Table 5.1.
TABLE 5.1 Market infrastructures and trade lifecycles
Market Infrastructure Trade Lifecycle(a) Clearing houses and CCPs Clearing
(b) Central securities depositories Settlement and settlement fails management
(c) Custody intermediaries The role of the custodians
It is not possible to cover every financial product in every market; this would indeed be a verylarge book! Instead, we will look at the major types of financial product with a brief descriptionof the appropriate clearing system, depository and custody intermediaries; in particular, wewill look at:
Equities; Government bonds; Eurobonds; Exchange-traded derivatives (futures and options); Centrally cleared OTC derivatives (interest rate swaps); Non-cleared OTC derivatives (forward rate agreements).
In Section 5.5 at the end of this chapter you will find some useful information sources forinfrastructural organisations such as the clearing houses, depositories and custodians togetherwith statistical information. You might like to bookmark these organisations’ URLs so thatyou can access their websites without too much trouble.
141
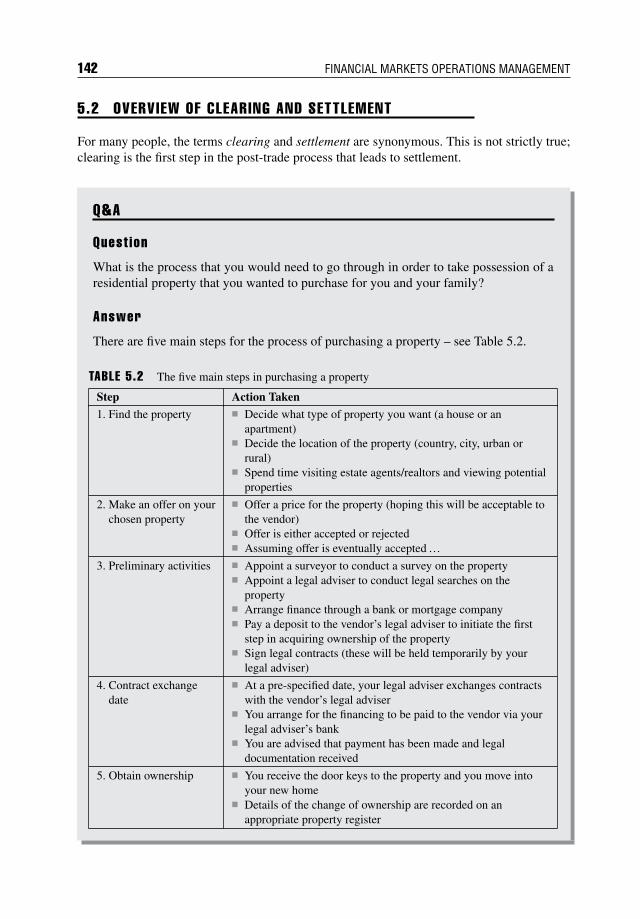
142 FINANCIAL MARKETS OPERATIONS MANAGEMENT
5.2 OVERVIEW OF CLEARING AND SETTLEMENT
For many people, the terms clearing and settlement are synonymous. This is not strictly true;clearing is the first step in the post-trade process that leads to settlement.
Q&A
Quest ion
What is the process that you would need to go through in order to take possession of aresidential property that you wanted to purchase for you and your family?
Answer
There are five main steps for the process of purchasing a property – see Table 5.2.
TABLE 5.2 The five main steps in purchasing a property
Step Action Taken
1. Find the property Decide what type of property you want (a house or anapartment)
Decide the location of the property (country, city, urban orrural)
Spend time visiting estate agents/realtors and viewing potentialproperties
2. Make an offer on yourchosen property
Offer a price for the property (hoping this will be acceptable tothe vendor)
Offer is either accepted or rejected Assuming offer is eventually accepted…
3. Preliminary activities Appoint a surveyor to conduct a survey on the property Appoint a legal adviser to conduct legal searches on the
property Arrange finance through a bank or mortgage company Pay a deposit to the vendor’s legal adviser to initiate the first
step in acquiring ownership of the property Sign legal contracts (these will be held temporarily by your
legal adviser)
4. Contract exchangedate
At a pre-specified date, your legal adviser exchanges contractswith the vendor’s legal adviser
You arrange for the financing to be paid to the vendor via yourlegal adviser’s bank
You are advised that payment has been made and legaldocumentation received
5. Obtain ownership You receive the door keys to the property and you move intoyour new home
Details of the change of ownership are recorded on anappropriate property register

Clearing Houses and CCPs 143
If only buying a new property was this straightforward! It does, however, make a good analogyto our world of equities, bonds and derivatives, as shown in Table 5.3.
TABLE 5.3 Property and securities analogy
Step Analogy1. Find the property Price discovery (Front Office)
2. Make an offer on your chosen property Transaction execution (Front Office)
3. Preliminary activities Clearing (Operations)
4. Contract exchange date Settlement (Operations)
5. Obtain ownership Registration of a change of legal and beneficialownership (Safekeeping)
Let us define what we mean by the terms clearing and settlement, according to the Committeeon Payment and Settlement Systems (CPSS):1
Clearing/clearance is defined as: “The process of transmitting, reconciling and, in somecases, confirming payment orders or security transfer instructions prior to settlement,possibly including the netting of instructions and the establishment of final positions forsettlement. Sometimes the term is used (imprecisely) to include settlement.”
Settlement is defined as: “The completion of a transaction, wherein the seller transfers …securities or financial instruments to the buyer and the buyer transfers money to the seller.A settlement may be final or provisional.”
In Chapters 7 to 9, we will explore clearing and settlement both in terms of structure and howthese two overall processes work.
5.3 THE CLEARING HOUSE MODEL
The CPSS defines a clearing house as:
“A central location or central processing mechanism through which financial institutionsagree to exchange payment instructions or other financial obligations. The institutionssettle for items exchanged at a designated time based on the rules and procedures of theclearing house. In some cases, the clearing house may assume significant counterparty,financial or risk management responsibilities for the clearing system.”
1Source: CPSS Glossary (online). “A glossary of terms used in payments and settlement systems.”Available from www.bis.org/publ/cpss00b.pdf. [Accessed Friday, 24 January 2014]
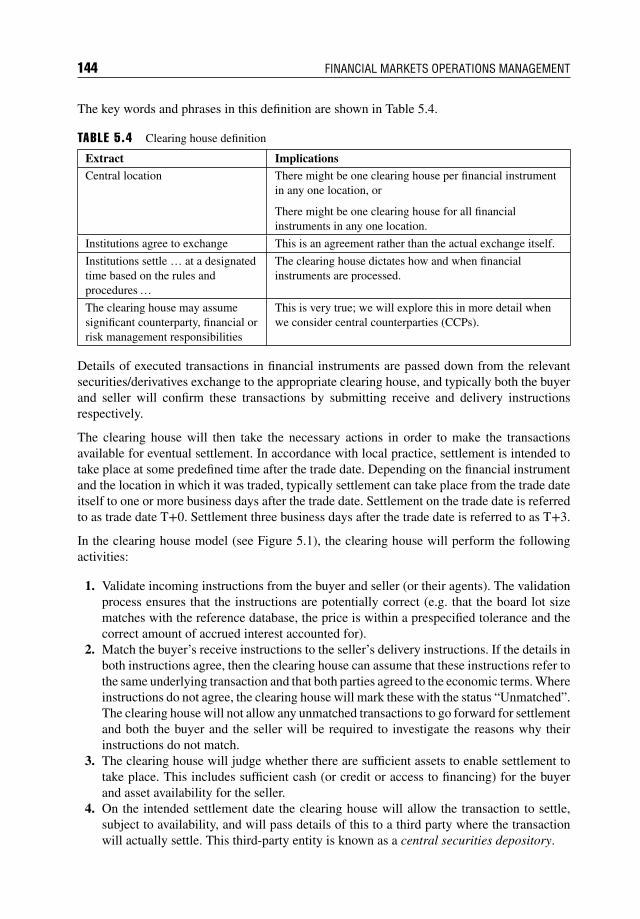
144 FINANCIAL MARKETS OPERATIONS MANAGEMENT
The key words and phrases in this definition are shown in Table 5.4.
TABLE 5.4 Clearing house definition
Extract ImplicationsCentral location There might be one clearing house per financial instrument
in any one location, or
There might be one clearing house for all financialinstruments in any one location.
Institutions agree to exchange This is an agreement rather than the actual exchange itself.
Institutions settle … at a designatedtime based on the rules andprocedures…
The clearing house dictates how and when financialinstruments are processed.
The clearing house may assumesignificant counterparty, financial orrisk management responsibilities
This is very true; we will explore this in more detail whenwe consider central counterparties (CCPs).
Details of executed transactions in financial instruments are passed down from the relevantsecurities/derivatives exchange to the appropriate clearing house, and typically both the buyerand seller will confirm these transactions by submitting receive and delivery instructionsrespectively.
The clearing house will then take the necessary actions in order to make the transactionsavailable for eventual settlement. In accordance with local practice, settlement is intended totake place at some predefined time after the trade date. Depending on the financial instrumentand the location in which it was traded, typically settlement can take place from the trade dateitself to one or more business days after the trade date. Settlement on the trade date is referredto as trade date T+0. Settlement three business days after the trade date is referred to as T+3.
In the clearing house model (see Figure 5.1), the clearing house will perform the followingactivities:
1. Validate incoming instructions from the buyer and seller (or their agents). The validationprocess ensures that the instructions are potentially correct (e.g. that the board lot sizematches with the reference database, the price is within a prespecified tolerance and thecorrect amount of accrued interest accounted for).
2. Match the buyer’s receive instructions to the seller’s delivery instructions. If the details inboth instructions agree, then the clearing house can assume that these instructions refer tothe same underlying transaction and that both parties agreed to the economic terms. Whereinstructions do not agree, the clearing house will mark these with the status “Unmatched”.The clearing house will not allow any unmatched transactions to go forward for settlementand both the buyer and the seller will be required to investigate the reasons why theirinstructions do not match.
3. The clearing house will judge whether there are sufficient assets to enable settlement totake place. This includes sufficient cash (or credit or access to financing) for the buyerand asset availability for the seller.
4. On the intended settlement date the clearing house will allow the transaction to settle,subject to availability, and will pass details of this to a third party where the transactionwill actually settle. This third-party entity is known as a central securities depository.
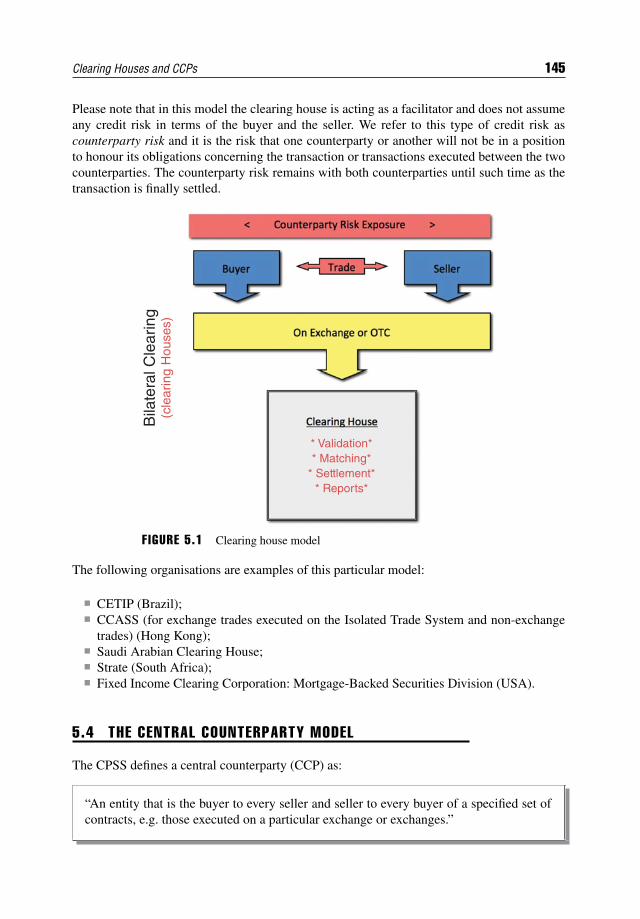
Clearing Houses and CCPs 145
Please note that in this model the clearing house is acting as a facilitator and does not assumeany credit risk in terms of the buyer and the seller. We refer to this type of credit risk ascounterparty risk and it is the risk that one counterparty or another will not be in a positionto honour its obligations concerning the transaction or transactions executed between the twocounterparties. The counterparty risk remains with both counterparties until such time as thetransaction is finally settled.
* Validation** Matching*
Bila
tera
l Cle
arin
g(c
lear
ing
Hou
ses)
* Settlement** Reports*
F IGURE 5.1 Clearing house model
The following organisations are examples of this particular model:
CETIP (Brazil); CCASS (for exchange trades executed on the Isolated Trade System and non-exchange
trades) (Hong Kong); Saudi Arabian Clearing House; Strate (South Africa); Fixed Income Clearing Corporation: Mortgage-Backed Securities Division (USA).
5.4 THE CENTRAL COUNTERPARTY MODEL
The CPSS defines a central counterparty (CCP) as:
“An entity that is the buyer to every seller and seller to every buyer of a specified set ofcontracts, e.g. those executed on a particular exchange or exchanges.”
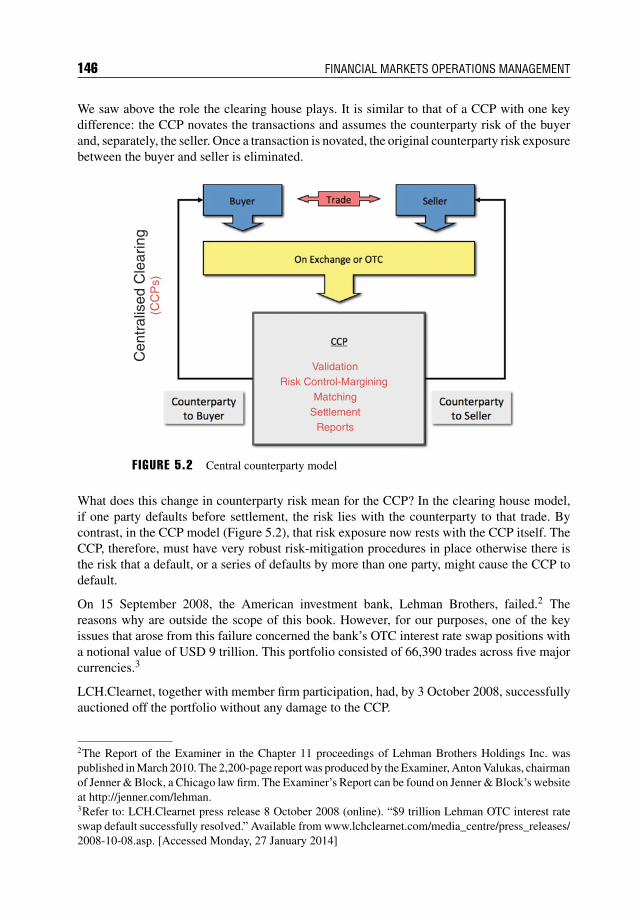
146 FINANCIAL MARKETS OPERATIONS MANAGEMENT
We saw above the role the clearing house plays. It is similar to that of a CCP with one keydifference: the CCP novates the transactions and assumes the counterparty risk of the buyerand, separately, the seller. Once a transaction is novated, the original counterparty risk exposurebetween the buyer and seller is eliminated.
ValidationRisk Control-Margining
Cen
tral
ised
Cle
arin
g(C
CP
s)
Matching
Reports Settlement
F IGURE 5.2 Central counterparty model
What does this change in counterparty risk mean for the CCP? In the clearing house model,if one party defaults before settlement, the risk lies with the counterparty to that trade. Bycontrast, in the CCP model (Figure 5.2), that risk exposure now rests with the CCP itself. TheCCP, therefore, must have very robust risk-mitigation procedures in place otherwise there isthe risk that a default, or a series of defaults by more than one party, might cause the CCP todefault.
On 15 September 2008, the American investment bank, Lehman Brothers, failed.2 Thereasons why are outside the scope of this book. However, for our purposes, one of the keyissues that arose from this failure concerned the bank’s OTC interest rate swap positions witha notional value of USD 9 trillion. This portfolio consisted of 66,390 trades across five majorcurrencies.3
LCH.Clearnet, together with member firm participation, had, by 3 October 2008, successfullyauctioned off the portfolio without any damage to the CCP.
2The Report of the Examiner in the Chapter 11 proceedings of Lehman Brothers Holdings Inc. waspublished in March 2010. The 2,200-page report was produced by the Examiner, Anton Valukas, chairmanof Jenner & Block, a Chicago law firm. The Examiner’s Report can be found on Jenner & Block’s websiteat http://jenner.com/lehman.3Refer to: LCH.Clearnet press release 8 October 2008 (online). “$9 trillion Lehman OTC interest rateswap default successfully resolved.” Available from www.lchclearnet.com/media_centre/press_releases/2008-10-08.asp. [Accessed Monday, 27 January 2014]
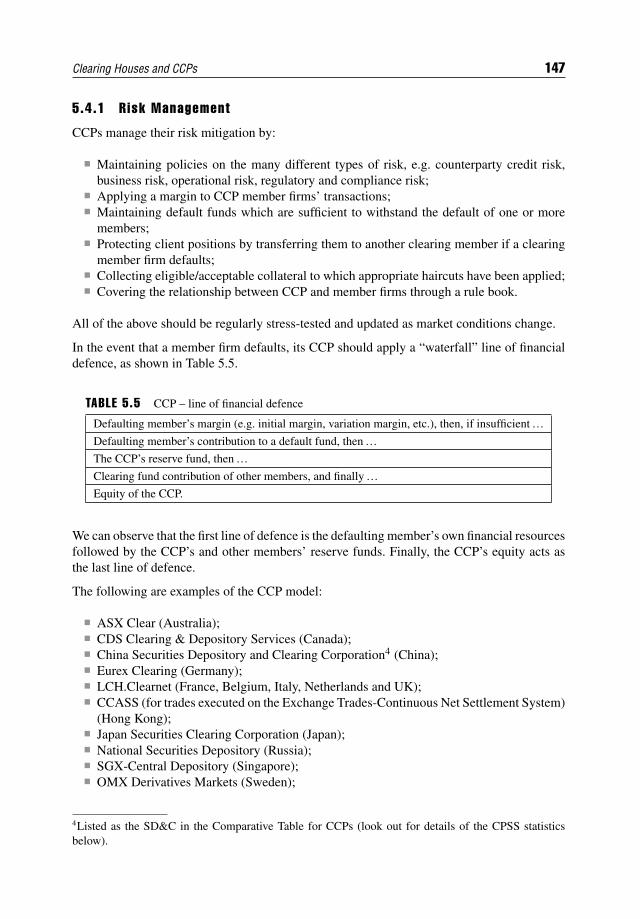
Clearing Houses and CCPs 147
5.4.1 Risk Management
CCPs manage their risk mitigation by:
Maintaining policies on the many different types of risk, e.g. counterparty credit risk,business risk, operational risk, regulatory and compliance risk;
Applying a margin to CCP member firms’ transactions; Maintaining default funds which are sufficient to withstand the default of one or more
members; Protecting client positions by transferring them to another clearing member if a clearing
member firm defaults; Collecting eligible/acceptable collateral to which appropriate haircuts have been applied; Covering the relationship between CCP and member firms through a rule book.
All of the above should be regularly stress-tested and updated as market conditions change.
In the event that a member firm defaults, its CCP should apply a “waterfall” line of financialdefence, as shown in Table 5.5.
TABLE 5.5 CCP – line of financial defence
Defaulting member’s margin (e.g. initial margin, variation margin, etc.), then, if insufficient…Defaulting member’s contribution to a default fund, then…The CCP’s reserve fund, then…Clearing fund contribution of other members, and finally…Equity of the CCP.
We can observe that the first line of defence is the defaulting member’s own financial resourcesfollowed by the CCP’s and other members’ reserve funds. Finally, the CCP’s equity acts asthe last line of defence.
The following are examples of the CCP model:
ASX Clear (Australia); CDS Clearing & Depository Services (Canada); China Securities Depository and Clearing Corporation4 (China); Eurex Clearing (Germany); LCH.Clearnet (France, Belgium, Italy, Netherlands and UK); CCASS (for trades executed on the Exchange Trades-Continuous Net Settlement System)
(Hong Kong); Japan Securities Clearing Corporation (Japan); National Securities Depository (Russia); SGX-Central Depository (Singapore); OMX Derivatives Markets (Sweden);
4Listed as the SD&C in the Comparative Table for CCPs (look out for details of the CPSS statisticsbelow).
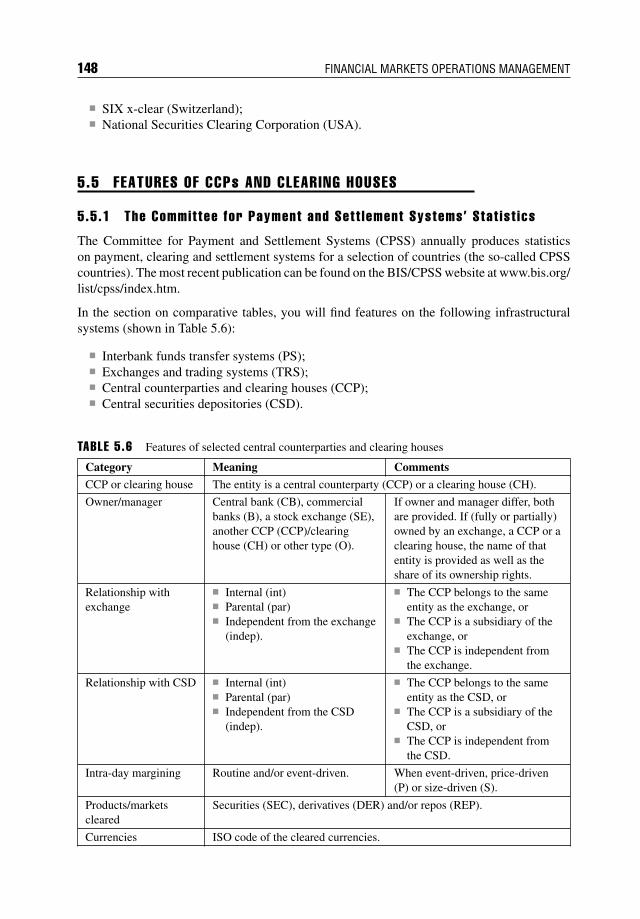
148 FINANCIAL MARKETS OPERATIONS MANAGEMENT
SIX x-clear (Switzerland); National Securities Clearing Corporation (USA).
5.5 FEATURES OF CCPs AND CLEARING HOUSES
5.5.1 The Committee for Payment and Sett lement Systems’ Stat ist ics
The Committee for Payment and Settlement Systems (CPSS) annually produces statisticson payment, clearing and settlement systems for a selection of countries (the so-called CPSScountries). The most recent publication can be found on the BIS/CPSS website at www.bis.org/list/cpss/index.htm.
In the section on comparative tables, you will find features on the following infrastructuralsystems (shown in Table 5.6):
Interbank funds transfer systems (PS); Exchanges and trading systems (TRS); Central counterparties and clearing houses (CCP); Central securities depositories (CSD).
TABLE 5.6 Features of selected central counterparties and clearing houses
Category Meaning Comments
CCP or clearing house The entity is a central counterparty (CCP) or a clearing house (CH).
Owner/manager Central bank (CB), commercialbanks (B), a stock exchange (SE),another CCP (CCP)/clearinghouse (CH) or other type (O).
If owner and manager differ, bothare provided. If (fully or partially)owned by an exchange, a CCP or aclearing house, the name of thatentity is provided as well as theshare of its ownership rights.
Relationship withexchange
Internal (int) Parental (par) Independent from the exchange
(indep).
The CCP belongs to the sameentity as the exchange, or
The CCP is a subsidiary of theexchange, or
The CCP is independent fromthe exchange.
Relationship with CSD Internal (int) Parental (par) Independent from the CSD
(indep).
The CCP belongs to the sameentity as the CSD, or
The CCP is a subsidiary of theCSD, or
The CCP is independent fromthe CSD.
Intra-day margining Routine and/or event-driven. When event-driven, price-driven(P) or size-driven (S).
Products/marketscleared
Securities (SEC), derivatives (DER) and/or repos (REP).
Currencies ISO code of the cleared currencies.
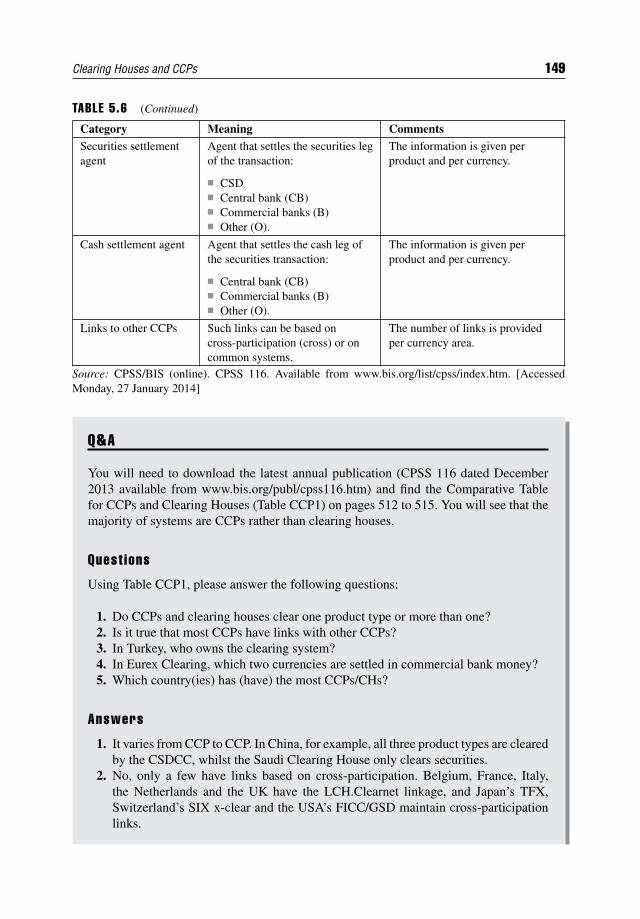
Clearing Houses and CCPs 149
TABLE 5.6 (Continued)
Category Meaning CommentsSecurities settlementagent
Agent that settles the securities legof the transaction:
CSD Central bank (CB) Commercial banks (B) Other (O).
The information is given perproduct and per currency.
Cash settlement agent Agent that settles the cash leg ofthe securities transaction:
Central bank (CB) Commercial banks (B) Other (O).
The information is given perproduct and per currency.
Links to other CCPs Such links can be based oncross-participation (cross) or oncommon systems.
The number of links is providedper currency area.
Source: CPSS/BIS (online). CPSS 116. Available from www.bis.org/list/cpss/index.htm. [AccessedMonday, 27 January 2014]
Q&A
You will need to download the latest annual publication (CPSS 116 dated December2013 available from www.bis.org/publ/cpss116.htm) and find the Comparative Tablefor CCPs and Clearing Houses (Table CCP1) on pages 512 to 515. You will see that themajority of systems are CCPs rather than clearing houses.
Quest ions
Using Table CCP1, please answer the following questions:
1. Do CCPs and clearing houses clear one product type or more than one?2. Is it true that most CCPs have links with other CCPs?3. In Turkey, who owns the clearing system?4. In Eurex Clearing, which two currencies are settled in commercial bank money?5. Which country(ies) has (have) the most CCPs/CHs?
Answers
1. It varies from CCP to CCP. In China, for example, all three product types are clearedby the CSDCC, whilst the Saudi Clearing House only clears securities.
2. No, only a few have links based on cross-participation. Belgium, France, Italy,the Netherlands and the UK have the LCH.Clearnet linkage, and Japan’s TFX,Switzerland’s SIX x-clear and the USA’s FICC/GSD maintain cross-participationlinks.
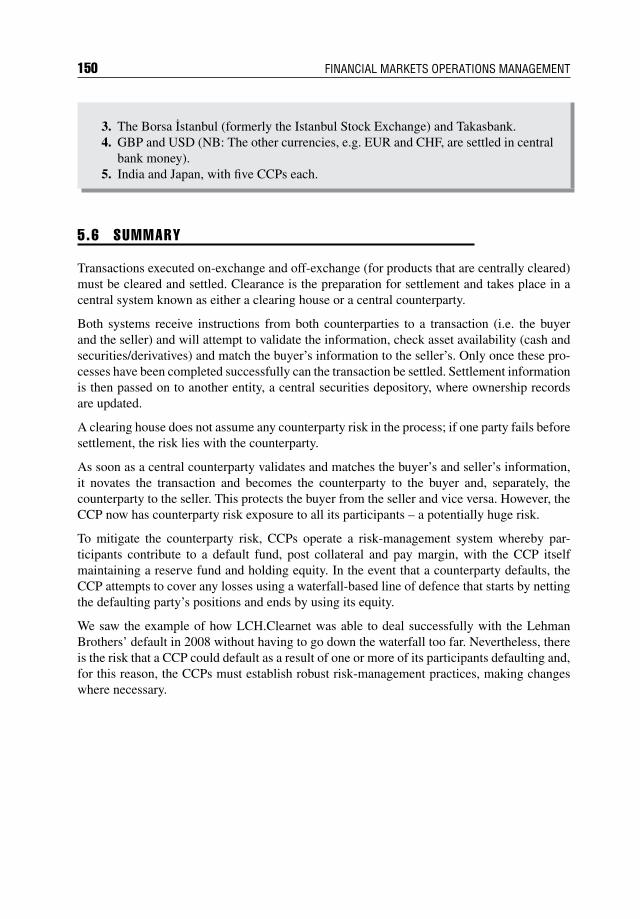
150 FINANCIAL MARKETS OPERATIONS MANAGEMENT
3. The Borsa Istanbul (formerly the Istanbul Stock Exchange) and Takasbank.4. GBP and USD (NB: The other currencies, e.g. EUR and CHF, are settled in central
bank money).5. India and Japan, with five CCPs each.
5.6 SUMMARY
Transactions executed on-exchange and off-exchange (for products that are centrally cleared)must be cleared and settled. Clearance is the preparation for settlement and takes place in acentral system known as either a clearing house or a central counterparty.
Both systems receive instructions from both counterparties to a transaction (i.e. the buyerand the seller) and will attempt to validate the information, check asset availability (cash andsecurities/derivatives) and match the buyer’s information to the seller’s. Only once these pro-cesses have been completed successfully can the transaction be settled. Settlement informationis then passed on to another entity, a central securities depository, where ownership recordsare updated.
A clearing house does not assume any counterparty risk in the process; if one party fails beforesettlement, the risk lies with the counterparty.
As soon as a central counterparty validates and matches the buyer’s and seller’s information,it novates the transaction and becomes the counterparty to the buyer and, separately, thecounterparty to the seller. This protects the buyer from the seller and vice versa. However, theCCP now has counterparty risk exposure to all its participants – a potentially huge risk.
To mitigate the counterparty risk, CCPs operate a risk-management system whereby par-ticipants contribute to a default fund, post collateral and pay margin, with the CCP itselfmaintaining a reserve fund and holding equity. In the event that a counterparty defaults, theCCP attempts to cover any losses using a waterfall-based line of defence that starts by nettingthe defaulting party’s positions and ends by using its equity.
We saw the example of how LCH.Clearnet was able to deal successfully with the LehmanBrothers’ default in 2008 without having to go down the waterfall too far. Nevertheless, thereis the risk that a CCP could default as a result of one or more of its participants defaulting and,for this reason, the CCPs must establish robust risk-management practices, making changeswhere necessary.
CHAPTER 6Securities Depositories
(CSDs and ICSDs)
6.1 INTRODUCTION
We have seen in previous chapters the roles of the exchanges and trading platforms togetherwith the clearing houses and central counterparties. We have also seen the relationshipsbetween both types of infrastructure in terms of management and ownership.
The asset types that are traded and cleared include bonds, equities, exchange-traded derivativesand centrally cleared OTC derivatives.
We are now at the stage where a third type of infrastructure plays an active role: the local (ornational) and international central securities depository (CSD). As with the clearing housesand CCPs, CSDs can share certain characteristics with other CSDs but can also differ.
Please note that CSDs play no part in derivatives other than when contracts with securities asthe underlying assets are exercised.
This chapter will help you to:
Understand the purpose of the CSDs and ICSDs; Take a detailed look at a selection of these depositories; Appreciate the bilateral links between CSDs and ICSDs as well as mergers and
acquisitions; Consider the different types of customer of the depositories and the services offered to
them.
6.2 HISTORICAL CONTEXT
Until the late 20th century, securities were represented in certificated form, i.e. investors wouldhold physical share and bond certificates. These certificates could be held in one of severalways:
1. By the investor.2. By a legal representative of the investor (e.g. a solicitor).
151
152 FINANCIAL MARKETS OPERATIONS MANAGEMENT
3. By the investor’s stockbroker.4. By the investor’s bank (and deposited in the bank’s vault or in a safety deposit box).
Securities could either be in registered form or in bearer form. For registered securities, theinvestor’s name would be recorded on the issuer’s register and noted on the certificate. Forbearer securities, the investor’s name would not be recorded on either the certificate or theissuer’s register.
Q&A
Quest ion
What do you think are the problems associated with physical certificates?
Answer
Physical certificates present a number of problems, including:
Physical documentation: Paper is bulky and expensive to store. A private investor’sportfolio might consist of several hundred certificates; an institutional investor mighthave several thousand.
Loss/theft: Certificates can be lost in transit from seller to buyer. Whilst registeredsecurities can be replaced (for a small fee), bearer securities cannot. Imagine youlost a bank note, i.e. cash. Would you be able to get a replacement? No!
Physical damage: In November 2012, New York was hit by superstorm Sandy.The Depository Trust & Clearing Corporation’s underground vaults were floodedand 1.3 million securities certificates were ruined by a tidal surge.∗ The DTCCwas quoted as saying that it was: “… engaged in discussions with transfer agents toestablish procedures for issuing replacement certificates from its computer records”.
Delivery delays: The process of withdrawing certificates from a vault (safe custody)for delivery to the Market can take several days. Furthermore, registered securitieswould also require a transfer deed to effect good delivery (bearer securities requireno such additional documentation).
*Refer to Finextra (online 15 November 2012). “DTCC starts sorting through Sandy-floodedsecurities vault.” Available from www.finextra.com/News/FullStory.aspx?newsitemid=24284.[Accessed Friday, 16 November 2012]
We can perhaps conclude that the safekeeping of securities was decentralised, with the physicalcertificates held either by the investor or by the investor’s agent. It wasn’t until the late 1960sand early 1970s that this situation changed.
In addition to the form of securities, there were other factors to be considered. For example:
Clients, stockbrokers and banks communicated with each other by telephone, mail or telex.Furthermore, instructions to make payments and deliveries were sent by authenticated/tested telex and, on occasion, by authenticated telephone calls.
Securities Depositories (CSDs and ICSDs) 153
Investment in overseas markets tended to be confined to the major markets (e.g. NewYork, Tokyo and the various European financial centres).
Securities settlement was a manual process by which stockbrokers’ messengers woulddeliver parcels of certificates to their purchasing counterparties and collect certificatesfrom their selling counterparties, both in exchange for cheques by way of payment.
As more markets opened and investment activity (both domestically and cross-border)increased, this situation was not sustainable and something had to be done to enable securitiesto be held securely and for settlements to become more efficient.
Evidence of this could be found in the new Eurobond market that had been established inthe early 1960s. Whilst new issuance and secondary market trading occurred in the UnitedKingdom and continental Europe, the physical bonds were held in New York. Indeed, themajority of deliveries and payments were made there too. By 1967, things had become sobad that deliveries were being delayed by months, resulting in a large number of settlementfails. One trading house based in London had settlement fails that amounted to three times itscapital. This situation had the potential to destroy the market.
As a consequence of this paper logjam,
“… three enduring institutions emerged. Between them, they provided a frameworkin which the business could survive and progress. In the Association of Interna-tional Bond Dealers (AIBD), the market forged a mechanism for self-regulation andcollective expression. In Euroclear, and later Cedel, it developed mechanisms thatspanned primary and secondary markets, combined depository, clearing and settle-ment operations in one, and worked hand-in-hand with the banking system to providesettlement-related liquidity.”1
You will notice that these two organisations were clearing mechanisms as well as depositoriesfor the one particular type of security that had no domicile (i.e. a Eurobond).
Euroclear and Cedel (now known as Clearstream Banking Luxembourg) were not the onlyorganisations that were established to handle the depository business. Depositories beganto spring up in markets that would handle either a single asset type (e.g. equities only) ora range of asset types (e.g. equities, bonds and money market instruments). The key featurewas that the security types that these new depositories were looking after were domestic innature.
Examples of countries where depositories were being established around this time includedthe following:
Canada – 1970; USA – 1973; Japan – 1984; Singapore – 1987.
1Source: Shearlock, P. and Ellington, W. (1994) “The Eurobond Diaries.” Published privately by EuroclearClearance System Societe Cooperative. pp. 33–36.
154 FINANCIAL MARKETS OPERATIONS MANAGEMENT
Plus:
Euroclear – 1968; Cedel – 1970.
Today we refer to the domestic depositories as central securities depositories (CSDs) and thetwo Eurobond depositories as international central securities depositories (ICSDs).
6.3 DEF IN IT IONS
6.3.1 Domest ic (Local /Nat ional ) CSDs
A CSD is either the physical entity or the system that facilitates the settlement and safekeepingof securities and ensures the reconciliation of participant accounts. Securities can be kept safein immobilised or dematerialised form.
Settlement generally occurs in book-entry form.
6.3.2 Internat ional CSDs
An ICSD is a depository that settles trades in international and various domestic securities,usually through direct and indirect links with agents in the domestic markets. The best-knownICSDs are Euroclear Bank and Clearstream Banking Luxembourg. The Eurobond marketdeveloped partly in response to operational and regulatory inefficiencies in domestic bondmarkets.
There is some terminology contained within the definitions that requires some explanation:
Securities in immobilised form: The physical certificates are represented by electronicrecords against which purchases are credited and sales debited. The physical certificatesare not used for settlement purposes (i.e. they are immobilised).
Securities in dematerialised form: The physical certificates are represented by electronicrecords (as with immobilisation above) and subsequently destroyed.
Book-entry settlement: This is the settlement and movement of securities and/or cashby electronic debits and credits rather than the physical movement from seller to buyer(or payer to payee).
6.4 CENTRAL SECURIT IES DEPOSITORIES
6.4.1 Features of CSDs and ICSDs
The main features of these organisations can be found in Table 6.1.
A selection of CSDs together with the features highlighted in Table 6.1 can be found on pages524 to 527 in CPSS 116 (you downloaded this previously).
A full list of CSDs can be found on the websites of the five regional associations; we look atthese later in this chapter.
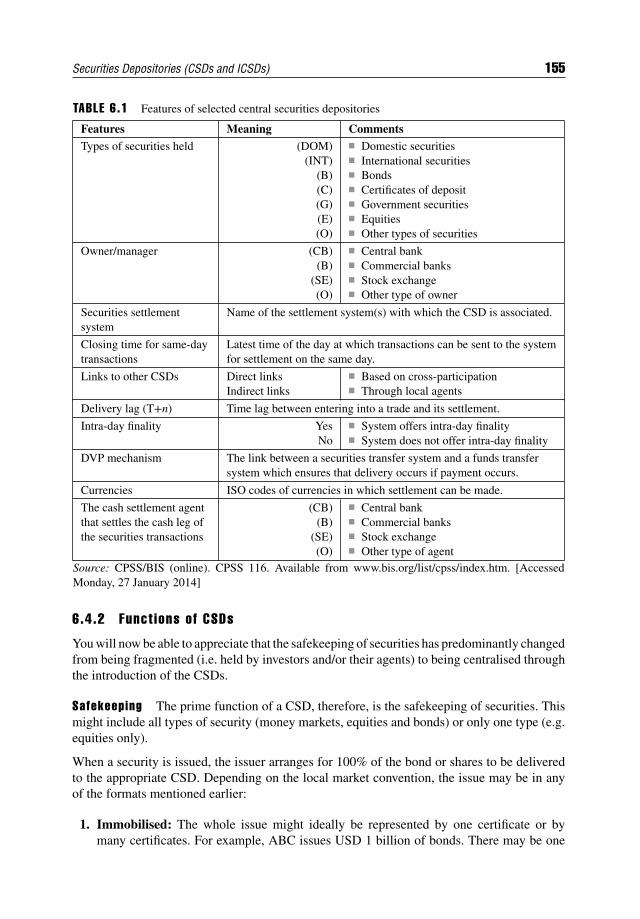
Securities Depositories (CSDs and ICSDs) 155
TABLE 6.1 Features of selected central securities depositories
Features Meaning CommentsTypes of securities held (DOM)
(INT)(B)(C)(G)(E)(O)
Domestic securities International securities Bonds Certificates of deposit Government securities Equities Other types of securities
Owner/manager (CB)(B)
(SE)(O)
Central bank Commercial banks Stock exchange Other type of owner
Securities settlementsystem
Name of the settlement system(s) with which the CSD is associated.
Closing time for same-daytransactions
Latest time of the day at which transactions can be sent to the systemfor settlement on the same day.
Links to other CSDs Direct linksIndirect links
Based on cross-participation Through local agents
Delivery lag (T+n) Time lag between entering into a trade and its settlement.
Intra-day finality YesNo
System offers intra-day finality System does not offer intra-day finality
DVP mechanism The link between a securities transfer system and a funds transfersystem which ensures that delivery occurs if payment occurs.
Currencies ISO codes of currencies in which settlement can be made.
The cash settlement agentthat settles the cash leg ofthe securities transactions
(CB)(B)
(SE)(O)
Central bank Commercial banks Stock exchange Other type of agent
Source: CPSS/BIS (online). CPSS 116. Available from www.bis.org/list/cpss/index.htm. [AccessedMonday, 27 January 2014]
6.4.2 Funct ions of CSDs
You will now be able to appreciate that the safekeeping of securities has predominantly changedfrom being fragmented (i.e. held by investors and/or their agents) to being centralised throughthe introduction of the CSDs.
Safekeeping The prime function of a CSD, therefore, is the safekeeping of securities. Thismight include all types of security (money markets, equities and bonds) or only one type (e.g.equities only).
When a security is issued, the issuer arranges for 100% of the bond or shares to be deliveredto the appropriate CSD. Depending on the local market convention, the issue may be in anyof the formats mentioned earlier:
1. Immobilised: The whole issue might ideally be represented by one certificate or bymany certificates. For example, ABC issues USD 1 billion of bonds. There may be one
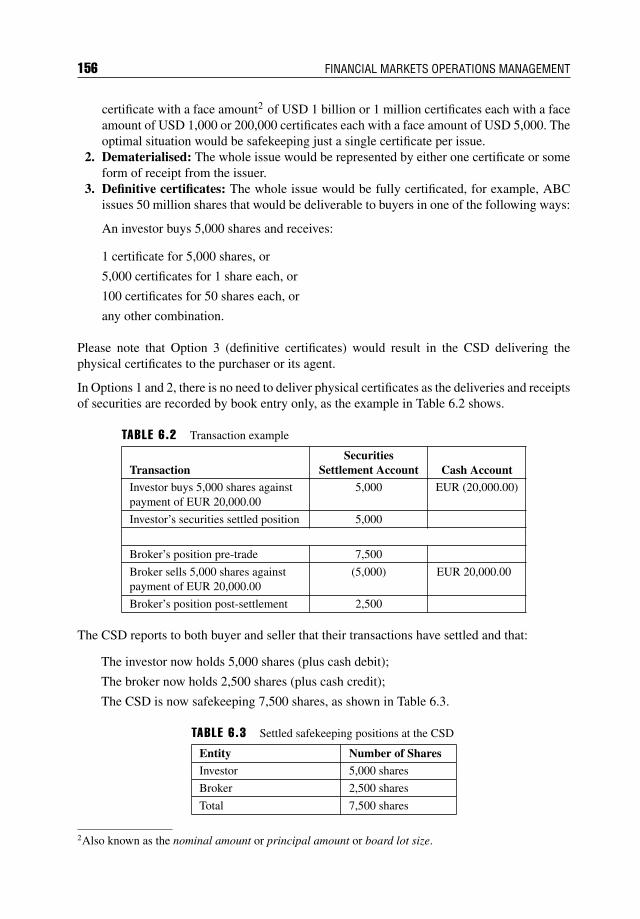
156 FINANCIAL MARKETS OPERATIONS MANAGEMENT
certificate with a face amount2 of USD 1 billion or 1 million certificates each with a faceamount of USD 1,000 or 200,000 certificates each with a face amount of USD 5,000. Theoptimal situation would be safekeeping just a single certificate per issue.
2. Dematerialised: The whole issue would be represented by either one certificate or someform of receipt from the issuer.
3. Definitive certificates: The whole issue would be fully certificated, for example, ABCissues 50 million shares that would be deliverable to buyers in one of the following ways:
An investor buys 5,000 shares and receives:
1 certificate for 5,000 shares, or
5,000 certificates for 1 share each, or
100 certificates for 50 shares each, or
any other combination.
Please note that Option 3 (definitive certificates) would result in the CSD delivering thephysical certificates to the purchaser or its agent.
In Options 1 and 2, there is no need to deliver physical certificates as the deliveries and receiptsof securities are recorded by book entry only, as the example in Table 6.2 shows.
TABLE 6.2 Transaction example
TransactionSecurities
Settlement Account Cash AccountInvestor buys 5,000 shares againstpayment of EUR 20,000.00
5,000 EUR (20,000.00)
Investor’s securities settled position 5,000
Broker’s position pre-trade 7,500
Broker sells 5,000 shares againstpayment of EUR 20,000.00
(5,000) EUR 20,000.00
Broker’s position post-settlement 2,500
The CSD reports to both buyer and seller that their transactions have settled and that:
The investor now holds 5,000 shares (plus cash debit);
The broker now holds 2,500 shares (plus cash credit);
The CSD is now safekeeping 7,500 shares, as shown in Table 6.3.
TABLE 6.3 Settled safekeeping positions at the CSD
Entity Number of Shares
Investor 5,000 shares
Broker 2,500 shares
Total 7,500 shares
2Also known as the nominal amount or principal amount or board lot size.
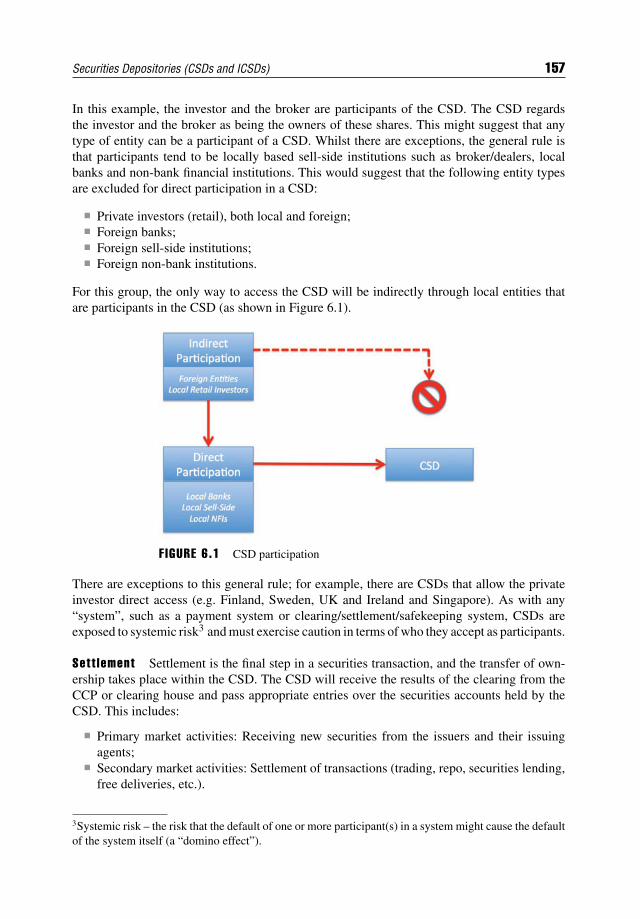
Securities Depositories (CSDs and ICSDs) 157
In this example, the investor and the broker are participants of the CSD. The CSD regardsthe investor and the broker as being the owners of these shares. This might suggest that anytype of entity can be a participant of a CSD. Whilst there are exceptions, the general rule isthat participants tend to be locally based sell-side institutions such as broker/dealers, localbanks and non-bank financial institutions. This would suggest that the following entity typesare excluded for direct participation in a CSD:
Private investors (retail), both local and foreign; Foreign banks; Foreign sell-side institutions; Foreign non-bank institutions.
For this group, the only way to access the CSD will be indirectly through local entities thatare participants in the CSD (as shown in Figure 6.1).
F IGURE 6.1 CSD participation
There are exceptions to this general rule; for example, there are CSDs that allow the privateinvestor direct access (e.g. Finland, Sweden, UK and Ireland and Singapore). As with any“system”, such as a payment system or clearing/settlement/safekeeping system, CSDs areexposed to systemic risk3 and must exercise caution in terms of who they accept as participants.
Sett lement Settlement is the final step in a securities transaction, and the transfer of own-ership takes place within the CSD. The CSD will receive the results of the clearing from theCCP or clearing house and pass appropriate entries over the securities accounts held by theCSD. This includes:
Primary market activities: Receiving new securities from the issuers and their issuingagents;
Secondary market activities: Settlement of transactions (trading, repo, securities lending,free deliveries, etc.).
3Systemic risk – the risk that the default of one or more participant(s) in a system might cause the defaultof the system itself (a “domino effect”).
158 FINANCIAL MARKETS OPERATIONS MANAGEMENT
Income Col lect ion Dividends and interest payments (coupons) are paid by the issuers’paying agents, who, in turn, pay the CSDs. The CSDs then credit their participants with theincome.
Corporate Act ions Again, the issuing and paying agents are involved on behalf of theissuers. We cover corporate actions plus proxy voting in Chapter 11.
These services can be regarded as being “core” or “basic”. They are essential in the over-all safekeeping and administration of the securities. However, CSDs might offer additionalservices.
Securit ies F inancing This includes securities lending, repo and sell/buy-backs.
Col lateral Management Participants (and their clients) can use their securities to financetheir daily activities by pledging securities as collateral. The CSD manages the benefits (incomeand corporate actions) and provides assurance to lenders that they have control over the pledgedsecurities.
Data and Repository Services CSDs hold vast amounts of data which can be used todeliver other services, for example, the USA’s Depository Trust & Clearing Corporation(DTCC) also provides:
The DTCC General Collateral Finance Repo benchmark index which tracks the averagedaily interest rate paid for repo contracts;
Reference data services that help to standardise legal entity identifiers; A global trade repository service which acts as a single transaction-reporting interface
between the participants that execute derivatives transactions and the regulators that needaccess to the positions information.
More information can be found on the DTCC website: www.dtcc.com/data-and-repository-services.aspx.
6.4.3 The Changing World of CSDs
In 1989 following its landmark study on clearance and settlement problems, the Group ofThirty (G30) published nine recommendations4 that resulted in numerous industry reformsacross the globe. In particular, Recommendation 3 made reference to CSDs:
4The Group of Thirty, established in 1978, is a private, nonprofit, international body composed of verysenior representatives of the private and public sectors and academia. It aims to deepen understandingof international economic and financial issues, to explore the international repercussions of decisionstaken in the public and private sectors and to examine the choices available to market practitioners andpolicymakers. (Quote from G30 website www.group30.org/about.htm) [Accessed Monday, 3 February2014]
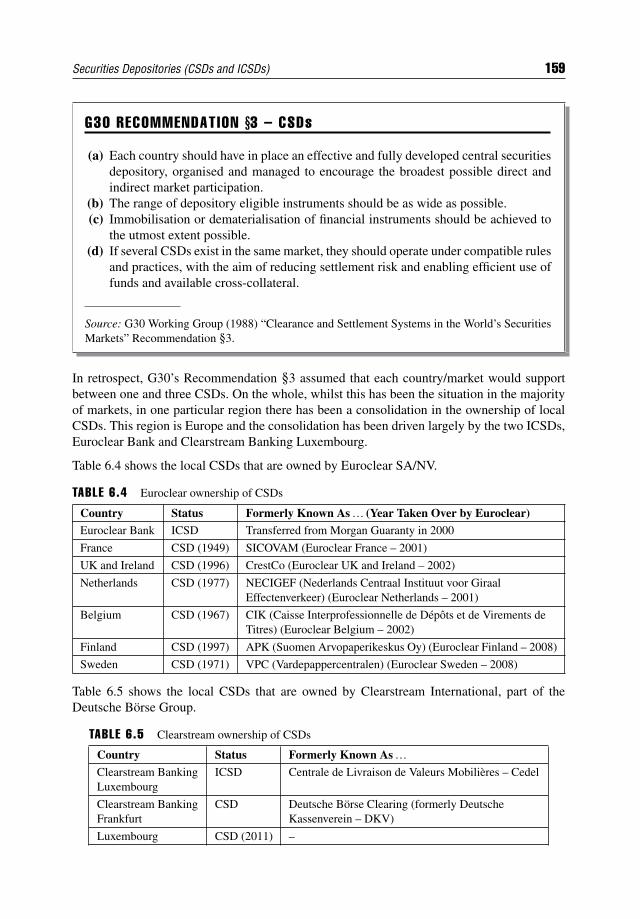
Securities Depositories (CSDs and ICSDs) 159
G30 RECOMMENDATION §3 – CSDs
(a) Each country should have in place an effective and fully developed central securitiesdepository, organised and managed to encourage the broadest possible direct andindirect market participation.
(b) The range of depository eligible instruments should be as wide as possible.(c) Immobilisation or dematerialisation of financial instruments should be achieved to
the utmost extent possible.(d) If several CSDs exist in the same market, they should operate under compatible rules
and practices, with the aim of reducing settlement risk and enabling efficient use offunds and available cross-collateral.
Source: G30 Working Group (1988) “Clearance and Settlement Systems in the World’s SecuritiesMarkets” Recommendation §3.
In retrospect, G30’s Recommendation §3 assumed that each country/market would supportbetween one and three CSDs. On the whole, whilst this has been the situation in the majorityof markets, in one particular region there has been a consolidation in the ownership of localCSDs. This region is Europe and the consolidation has been driven largely by the two ICSDs,Euroclear Bank and Clearstream Banking Luxembourg.
Table 6.4 shows the local CSDs that are owned by Euroclear SA/NV.
TABLE 6.4 Euroclear ownership of CSDs
Country Status Formerly Known As… (Year Taken Over by Euroclear)Euroclear Bank ICSD Transferred from Morgan Guaranty in 2000
France CSD (1949) SICOVAM (Euroclear France – 2001)
UK and Ireland CSD (1996) CrestCo (Euroclear UK and Ireland – 2002)
Netherlands CSD (1977) NECIGEF (Nederlands Centraal Instituut voor GiraalEffectenverkeer) (Euroclear Netherlands – 2001)
Belgium CSD (1967) CIK (Caisse Interprofessionnelle de Depots et de Virements deTitres) (Euroclear Belgium – 2002)
Finland CSD (1997) APK (Suomen Arvopaperikeskus Oy) (Euroclear Finland – 2008)
Sweden CSD (1971) VPC (Vardepappercentralen) (Euroclear Sweden – 2008)
Table 6.5 shows the local CSDs that are owned by Clearstream International, part of theDeutsche Borse Group.
TABLE 6.5 Clearstream ownership of CSDs
Country Status Formerly Known As…Clearstream BankingLuxembourg
ICSD Centrale de Livraison de Valeurs Mobilieres – Cedel
Clearstream BankingFrankfurt
CSD Deutsche Borse Clearing (formerly DeutscheKassenverein – DKV)
Luxembourg CSD (2011) –
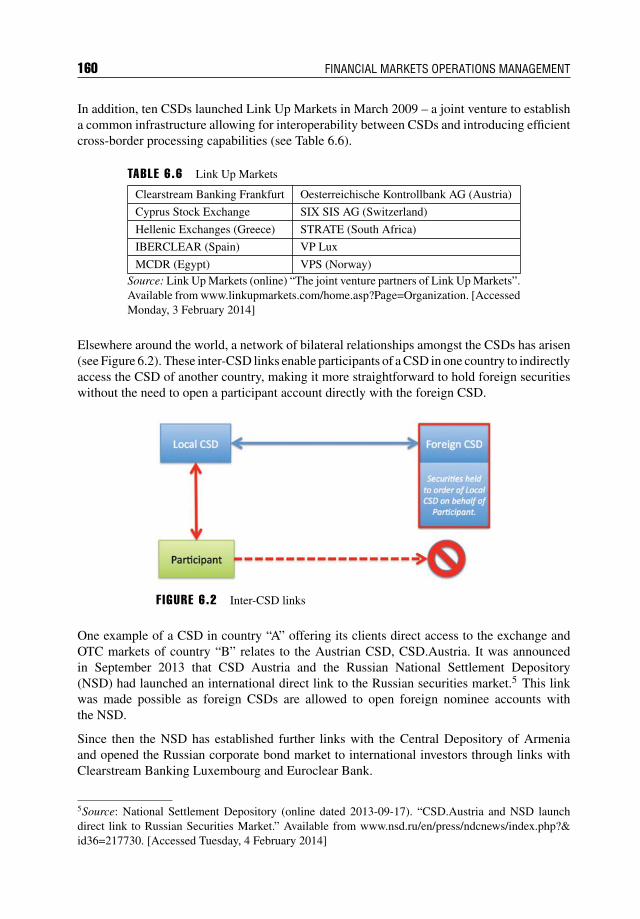
160 FINANCIAL MARKETS OPERATIONS MANAGEMENT
In addition, ten CSDs launched Link Up Markets in March 2009 – a joint venture to establisha common infrastructure allowing for interoperability between CSDs and introducing efficientcross-border processing capabilities (see Table 6.6).
TABLE 6.6 Link Up Markets
Clearstream Banking Frankfurt Oesterreichische Kontrollbank AG (Austria)
Cyprus Stock Exchange SIX SIS AG (Switzerland)
Hellenic Exchanges (Greece) STRATE (South Africa)
IBERCLEAR (Spain) VP Lux
MCDR (Egypt) VPS (Norway)Source: Link Up Markets (online) “The joint venture partners of Link Up Markets”.Available from www.linkupmarkets.com/home.asp?Page=Organization. [AccessedMonday, 3 February 2014]
Elsewhere around the world, a network of bilateral relationships amongst the CSDs has arisen(see Figure 6.2). These inter-CSD links enable participants of a CSD in one country to indirectlyaccess the CSD of another country, making it more straightforward to hold foreign securitieswithout the need to open a participant account directly with the foreign CSD.
F IGURE 6.2 Inter-CSD links
One example of a CSD in country “A” offering its clients direct access to the exchange andOTC markets of country “B” relates to the Austrian CSD, CSD.Austria. It was announcedin September 2013 that CSD Austria and the Russian National Settlement Depository(NSD) had launched an international direct link to the Russian securities market.5 This linkwas made possible as foreign CSDs are allowed to open foreign nominee accounts withthe NSD.
Since then the NSD has established further links with the Central Depository of Armeniaand opened the Russian corporate bond market to international investors through links withClearstream Banking Luxembourg and Euroclear Bank.
5Source: National Settlement Depository (online dated 2013-09-17). “CSD.Austria and NSD launchdirect link to Russian Securities Market.” Available from www.nsd.ru/en/press/ndcnews/index.php?&id36=217730. [Accessed Tuesday, 4 February 2014]
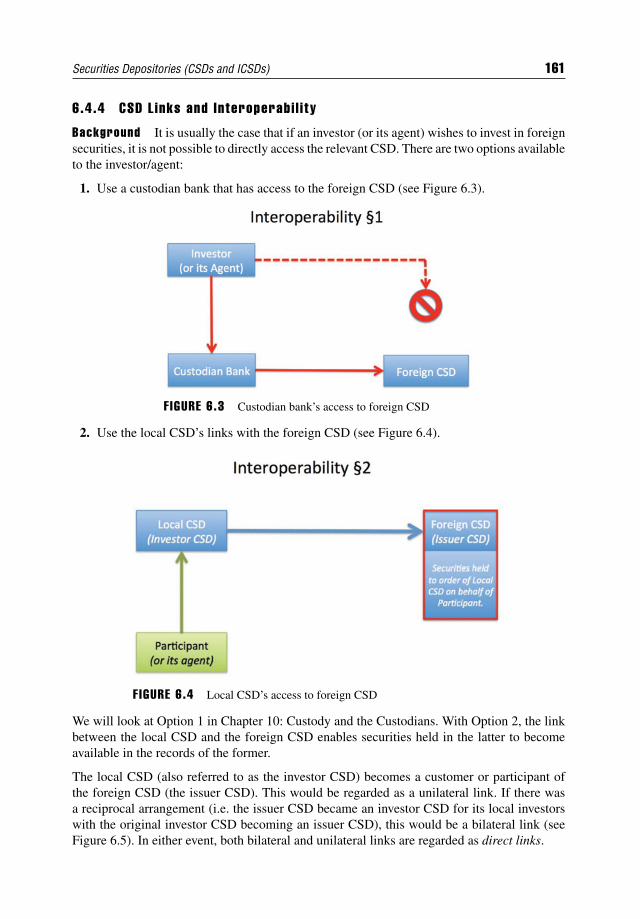
Securities Depositories (CSDs and ICSDs) 161
6.4.4 CSD Links and Interoperabi l i ty
Background It is usually the case that if an investor (or its agent) wishes to invest in foreignsecurities, it is not possible to directly access the relevant CSD. There are two options availableto the investor/agent:
1. Use a custodian bank that has access to the foreign CSD (see Figure 6.3).
F IGURE 6.3 Custodian bank’s access to foreign CSD
2. Use the local CSD’s links with the foreign CSD (see Figure 6.4).
F IGURE 6.4 Local CSD’s access to foreign CSD
We will look at Option 1 in Chapter 10: Custody and the Custodians. With Option 2, the linkbetween the local CSD and the foreign CSD enables securities held in the latter to becomeavailable in the records of the former.
The local CSD (also referred to as the investor CSD) becomes a customer or participant ofthe foreign CSD (the issuer CSD). This would be regarded as a unilateral link. If there wasa reciprocal arrangement (i.e. the issuer CSD became an investor CSD for its local investorswith the original investor CSD becoming an issuer CSD), this would be a bilateral link (seeFigure 6.5). In either event, both bilateral and unilateral links are regarded as direct links.
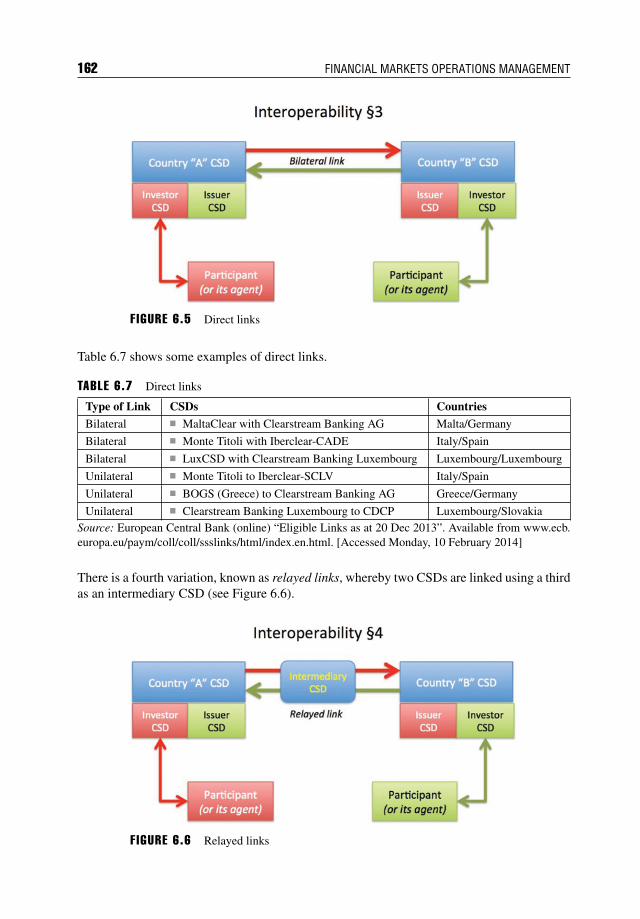
162 FINANCIAL MARKETS OPERATIONS MANAGEMENT
F IGURE 6.5 Direct links
Table 6.7 shows some examples of direct links.
TABLE 6.7 Direct links
Type of Link CSDs Countries
Bilateral MaltaClear with Clearstream Banking AG Malta/Germany
Bilateral Monte Titoli with Iberclear-CADE Italy/Spain
Bilateral LuxCSD with Clearstream Banking Luxembourg Luxembourg/Luxembourg
Unilateral Monte Titoli to Iberclear-SCLV Italy/Spain
Unilateral BOGS (Greece) to Clearstream Banking AG Greece/Germany
Unilateral Clearstream Banking Luxembourg to CDCP Luxembourg/SlovakiaSource: European Central Bank (online) “Eligible Links as at 20 Dec 2013”. Available from www.ecb.europa.eu/paym/coll/coll/ssslinks/html/index.en.html. [Accessed Monday, 10 February 2014]
There is a fourth variation, known as relayed links, whereby two CSDs are linked using a thirdas an intermediary CSD (see Figure 6.6).
F IGURE 6.6 Relayed links
Securities Depositories (CSDs and ICSDs) 163
Examples of relayed links include the following:6
Germany: Clearstream Banking AG via Clearstream Banking Luxembourg to MonteTitoli (Italy);
France: Euroclear France via Euroclear Bank (Belgium) to Clearstream Banking AG(Germany);
Luxembourg: LuxCSD via Clearstream Banking Luxembourg to KDD (Slovenia).
These links would allow securities to be delivered on a free of payment (FoP) and/or adelivery/receive against payment (DVP/RVP) basis.
Euroclear Bank and Clearstream Banking Luxembourg, the two international CSDs, areregarded as fully interoperable with their use of the bridge (see the next section).
6.5 INTERNATIONAL CENTRAL SECURIT IES DEPOSITORIES
6.5.1 Background
In Section 6.2 of this chapter, we gave a brief overview of the events that led to the creation ofthe two international central securities depositories (ICSDs). The formation of Euroclear andCedel occurred against the background of the issuance of physical Eurobond certificates andthe problems associated with the delivery of the certificates to the various European centreswhere the underwriters, dealers and investors were located.
Morgan Guaranty’s Brussels office was used to host the issuers’ closing ceremonies thatincluded the handing over of the new bonds to the lead underwriter. It was decided to launcha system whereby the physical certificates were replaced by a book-entry system and wherereceipts and deliveries against payment could occur once participants had opened securitiesaccounts and cash accounts with the system. That system became Euroclear and it was foundedin December 1968.
Whilst bond closings took place in Brussels, most Eurobonds were listed in Luxembourg. Lux-embourg was also experiencing operational logjams in New York. Luxembourg-based banks,both local and foreign, decided to investigate the establishment of a rival system to Euroclear.By September 1970, the Centrale de Livraison de Valeurs Mobilieres, better known as Cedel,was launched by 71 banks from 11 countries with the motto: “By the market, for the market”.
So we can see that in a very short period of time, one particular product type with no nationaldomicile, the Eurobond, could be held and processed out of two systems, both based incontinental Europe. The history of these two organisations makes for interesting reading andtheir fierce competitiveness over the years has been good for the industry across a wide rangeof areas, including:
Communication; New products; Services (both core and value-added).
6ibid.
164 FINANCIAL MARKETS OPERATIONS MANAGEMENT
6.5.2 Features of the ICSDs
The ICSDs are similar to the basic concept of a CSD but differ in one important respect:Euroclear and Clearstream are banks and this enables them to offer credit and certain otherbanking activities related to security settlement.
It can be argued that the ICSDs are as much a part of the post-trade market infrastructure asthe CSDs except that the ICSDs are commercial in nature; in other words, they not only lookafter their customers but also their shareholders.
Whilst both ICSDs are similar to a clearing house and CSD combination, it should be notedthat the ICSDs do not act as central counterparties. Their services cover the entire spectrumfrom new issuance to redemption.
6.5.3 Clearstream Banking Luxembourg (CBL)
Asset Classes CBL settles a wide range of securities including:
International debt securities, including global bonds and Eurobonds (straight, floating-rate, convertible etc.);
Foreign bonds; Money market instruments, including short- and medium-term notes, commercial paper
and certificates of deposit; Domestic bonds (government and corporate); Equities; Depository receipts; Investment funds; Warrants; Asset-backed securities and other collateralised debt securities.
New Issuance CBL offers a full range of services from advice to primary distribution usingits Global Issuer Hub:
Advisory services: Supporting lead managers, lawyers, issuers and their agents; Securities admission: Eligibility checks and compliance checks prior to admission to
the Global Issuer Hub; Code allocation: CBL is the numbering agent for international ISIN codes; Electronic document transfer: This enables the securities to be delivered electronically,
rather than physically; Primary market distribution: Supports issuers and their agents in distributing the secu-
rities to investors.
Sett lement CBL has three types of settlement:
1. Internal settlement for transactions between two CBL participants.2. External settlement for transactions with non-ICSD participants.3. Bridge settlement for transactions between CBL and Euroclear participants.
Transactions can be settled on either a DVP/RVP or free of payment (FoP) basis.
Securities Depositories (CSDs and ICSDs) 165
Asset Servic ing CBL processes income and corporate actions activities together withreports that include income pre-advices, corporate action notifications and market claims.
Global Securit ies F inancing CBL provides a full range of securities financing servicesthrough its Global Liquidity Hub, including:
Triparty collateral management and general collateral (GC) pooling; Automated securities lending and borrowing for fails management and strategic
lending.
Investment Funds Services CBL’s Vestima Funds Hub provides the link between investor,fund distributor, transfer agent and trading platform. The Vestima Funds Hub enables:
Order routing to funds (or their agents) or to trading platforms; Post-trade settlement by DVP in commercial bank money; Collateral using investment funds as an eligible asset class in the triparty repo service; Value-added services including funds reference data and real-time reporting.
Inter-CSD Linkages We have seen in the previous section that there are direct links betweenthe ICSDs and a selection of local CSDs. These links can either be unilateral or bilateral innature.
Connect iv i ty Participants can input instructions, access information, manage corporateaction activities, send queries and handle exceptions using one or more connectivity prod-ucts offered under the CreationConnect service. The three products are:
CreationOnline: Via the Internet or a virtual private network (VPN); CreationDirect: By file transfer using the Internet, the Clearstream VPN, Lima or
SWIFTNet FileAct; Creation via the SWIFT network: Link through SWIFTNet FIN.
In September 2013, CBL launched ClearstreamXact, an Internet-based system that initiallyoffers participants access to CBL’s collateral management service. (Settlement and assetmanagement are planned additional services.)
6.5.4 Euroclear Bank (EB)
Asset Classes EB processes a wide range of securities including:
International bonds, including foreign bonds, global bonds and Eurobonds; Domestic debt; Convertible bonds; Warrants; Equities; Depository receipts; Investment funds.
166 FINANCIAL MARKETS OPERATIONS MANAGEMENT
New Issuance EB helps issuers, lead managers and issuing agents by:
Helping to identify new issue structures; Allocating identification codes to new securities (EB is a numbering agency); Providing DVP issuance of the securities; Providing relevant administrative services.
Sett lement EB, as with CBL above, has three types of settlement:
1. Internal settlement for transactions between two Euroclear participants.2. External settlement for transactions with non-ICSD participants.3. Bridge settlement for transactions between EB and CBL participants.
Transactions can be settled on either a DVP/RVP or free of payment (FoP) basis.
Custody Services These services include:
Corporate action notifications; Real-time processing and reporting; Income and redemption processing; Withholding tax assistance; Proxy voting market claims management.
Asset Opt imisat ion This includes collateral management and securities lending and bor-rowing.
Money Transfer Money transfer facilities include:
Book transfers: Internal payments between participants within the EB system; Wire transfers: External payments made by participants outside the EB system; Pre-advices: Incoming payments for EB participants from outside the EB system; Foreign exchange services.
Credit Faci l i t ies EB provides credit facilities to enable participants to manage their oper-ations, especially settlements, borrowing and money transfer. Credit facilities are provided ona secured basis.
Investment Funds Services EB’s investment fund platform is FundSettlement Interna-tional, which provides a single access point for fund management companies, fund distributorsand transfer agents. Users have access to:
Order validation; Funds settlement; Corporate actions processing; Real-time reporting; Client support.
Securities Depositories (CSDs and ICSDs) 167
Inter-CSD Linkages We have seen in the previous section that there are direct links betweenthe ICSDs and a selection of local CSDs. These links can either be unilateral or bilateral innature.
Connect iv i ty Participants can access Euroclear through the following Internet Protocol-based networks:
Radianz Infonet SWIFTNet The Internet.
Applications are either screen-based or computer-to-computer – see Table 6.8.
TABLE 6.8 Screen-based or computer-to-computer connectivity
Screen-Based Computer-to-ComputerEUCLID PC – settlement instruction/validation plus reporting EUCLID server
FundSettle – access to FundSettle International service EUCLID file transfer
Triweb and Biweb – collateral management reporting FundSettle file transfer
SWIFT
Instructions can also be submitted by tested telex, post and, exceptionally, fax (with telephonecall-back).
6.6 L INKAGES – EXCHANGES, CLEARING SYSTEMS AND CSDs
We have now examined the three main elements to the infrastructure of the industry:
Stock exchanges; Clearing systems; and Central securities depositories.
We can add two more elements – the international CSDs and cash payment. The two ICSDsare banks and payment occurs through “commercial bank money”. The national CSDs arelinked to their national central banks and payment here is said to be in “central bank money”.
Let us compare the linkages from three points of view:
1. The USA.2. The European region.3. The rest of the world, including the Asia-Pacific, Africa/Middle East and the Americas
regions.
This comparison will illustrate that the USA is centralised, Europe is fragmented and Asia-Pacific is domestically focused. We will see in the next section that several CSD associationshave been formed in order to introduce regional cooperation if not actual consolidation.
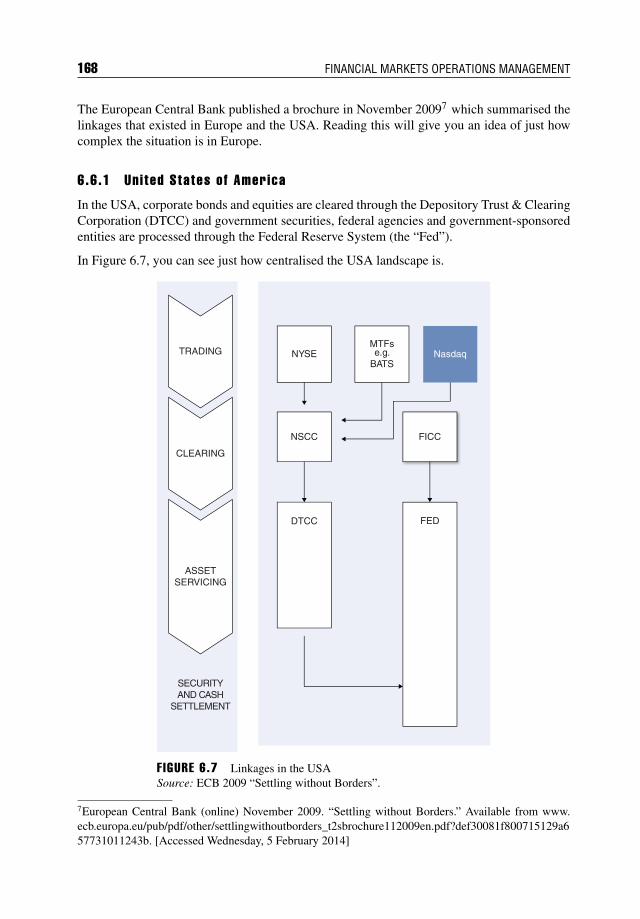
168 FINANCIAL MARKETS OPERATIONS MANAGEMENT
The European Central Bank published a brochure in November 20097 which summarised thelinkages that existed in Europe and the USA. Reading this will give you an idea of just howcomplex the situation is in Europe.
6.6.1 United States of America
In the USA, corporate bonds and equities are cleared through the Depository Trust & ClearingCorporation (DTCC) and government securities, federal agencies and government-sponsoredentities are processed through the Federal Reserve System (the “Fed”).
In Figure 6.7, you can see just how centralised the USA landscape is.
NYSETRADING
CLEARING
ASSETSERVICING
SECURITYAND CASH
SETTLEMENT
NSCC
DTCC FED
FICC
NasdaqMTFse.g.
BATS
F IGURE 6.7 Linkages in the USASource: ECB 2009 “Settling without Borders”.
7European Central Bank (online) November 2009. “Settling without Borders.” Available from www.ecb.europa.eu/pub/pdf/other/settlingwithoutborders_t2sbrochure112009en.pdf?def30081f800715129a657731011243b. [Accessed Wednesday, 5 February 2014]
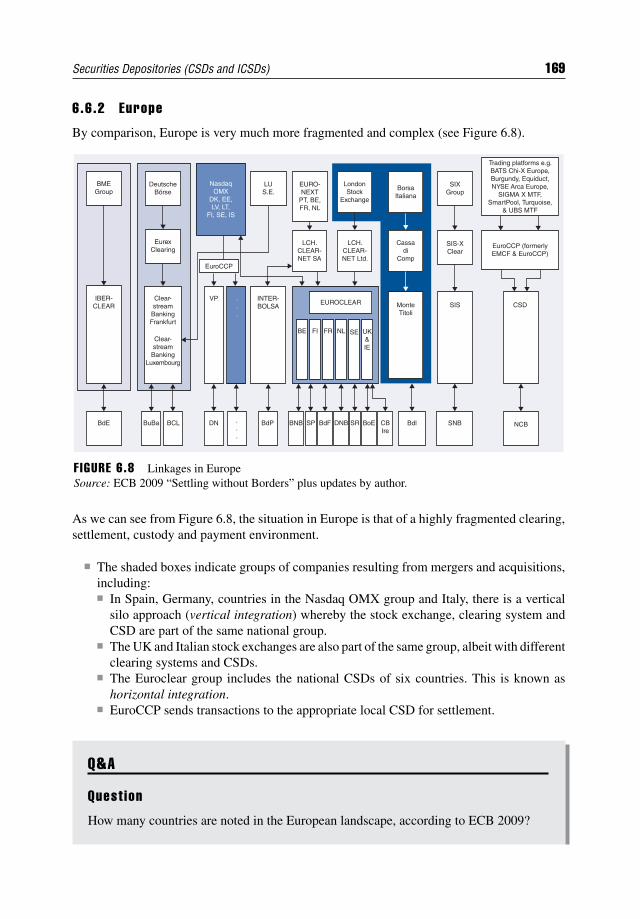
Securities Depositories (CSDs and ICSDs) 169
6.6.2 Europe
By comparison, Europe is very much more fragmented and complex (see Figure 6.8).
BMEGroup
DeutscheBörse
EurexClearing
NasdaqOMX
DK, EE,LV, LT,
FI, SE, IS
EuroCCP
BorsaItaliana
SIXGroup
SIS-XClear
SISMonteTitoli
CSD
NCBSNBBdlBoE
BE
EUROCLEAR
FI FR NL SE UK&IE
BNB BdFBdPDN
VP
LCH.CLEAR-NET SA
LCH.CLEAR-NET Ltd.
INTER-BOLSA
BCLBdE BuBa ...
.
.
.
SRSP DNB CBIre
EuroCCP (formerlyEMCF & EuroCCP)
Trading platforms e.g.BATS Chi-X Europe,Burgundy, Equiduct,NYSE Arca Europe,
SIGMA X MTF,SmartPool, Turquoise,
& UBS MTF
LUS.E.
Cassadi
Comp
LondonStock
Exchange
EURO-NEXT
PT, BE,FR, NL
IBER-CLEAR
Clear-stream
BankingLuxembourg
Clear-stream
BankingFrankfurt
F IGURE 6.8 Linkages in EuropeSource: ECB 2009 “Settling without Borders” plus updates by author.
As we can see from Figure 6.8, the situation in Europe is that of a highly fragmented clearing,settlement, custody and payment environment.
The shaded boxes indicate groups of companies resulting from mergers and acquisitions,including: In Spain, Germany, countries in the Nasdaq OMX group and Italy, there is a vertical
silo approach (vertical integration) whereby the stock exchange, clearing system andCSD are part of the same national group.
The UK and Italian stock exchanges are also part of the same group, albeit with differentclearing systems and CSDs.
The Euroclear group includes the national CSDs of six countries. This is known ashorizontal integration.
EuroCCP sends transactions to the appropriate local CSD for settlement.
Q&A
Quest ion
How many countries are noted in the European landscape, according to ECB 2009?
170 FINANCIAL MARKETS OPERATIONS MANAGEMENT
Answer
Seventeen countries (i.e. 17 stock exchanges) plus eight trading platforms.
6.6.3 Rest of the World
Outside of Europe, the landscape is closer to the USA “model”, with each country supportingan exchange, clearing system, CSD and payment system.
Q&A
Quest ion
Choose one country∗ from outside the USA and Europe. What are the systems’names and links using the ECB template (see the left-hand side of Figure 6.7 for theheadings)? Consider only corporate securities (i.e. equities and bonds) and governmentsecurities.
Answer
We have chosen Australia as an example – see Table 6.9.
TABLE 6.9Australia
Region/Country Corporate Securities Government Securities
Trading Australian Stock Exchange (ASX) ASX
Clearing ASX Clear ASX Clear
Asset servicing Austraclear for fixed incomesecurities
ASX Settlement (via CHESS) forequities
Austraclear
Cash settlement Reserve Bank of Australia’s RITS(RTGS) system
Reserve Bank of Australia’s RITS(RTGS) system
*Suggestion: For information, go to the members’ section of the World Federation of Exchanges’website at www.world-exchanges.org/member-exchanges/key-information.
Securities Depositories (CSDs and ICSDs) 171
6.7 CSD ASSOCIATIONS
6.7.1 Introduct ion
There are five CSD associations based regionally:
1. Americas’ Central Securities Depositories Association (ACSDA).2. Asia-Pacific CSD Group (ACG).3. Association of Eurasian Central Securities Depositories (AECSD).4. European Central Securities Depositories Association (ECSDA).5. Africa and Middle East Depositories Association (AMEDA).
In 2011 the five associations formed the World Forum of CSDs to enhance communicationbetween the associations.
6.7.2 Americas’ Central Securit ies Depositor ies Associat ion (ACSDA)
This is a non-profit organization comprised of Central Securities Depositories andClearing Houses of the Americas, headquartered in Lima, Peru. Its by-laws wereestablished at the first General Assembly held in the city of Lima, Peru on August10, 1999.
ACSDA’s main purpose is to be a forum for the exchange of information and expe-riences among its members in a spirit of mutual cooperation and to promote bestpractice recommendations in services such as securities depository, clearance, settle-ment, and risk management. ACSDA’s goal is also to support local markets in theirefforts to adopt securities market regulations, while considering their specific circum-stances and to serve as a channel for dialogue with other organizations worldwide.
Source: www.acsda.org
There are 18 member CSDs including Strate (South Africa)!
6.7.3 Asia-Paci f ic CSD Group (ACG)
The Asia-Pacific Central Securities Depository Group (ACG) was formed in Novem-ber 1997 as an informal international organization with the objective to facilitate theexchange of information and to promote mutual assistance among member securitiesdepositories and clearing organizations in the Asia-Pacific region.
Source: www.acgcsd.org/acg_01.aspx
There are 32 member CSDs from 22 countries.
172 FINANCIAL MARKETS OPERATIONS MANAGEMENT
6.7.4 Associat ion of Eurasian Central Securit ies Depositor ies (AECSD)
The Association, founded in 2004 with the aim being: “… the formation of a common‘depository environment’, including harmonization of the regulatory and legal frame-work, development of an optimal recordkeeping system for the securities market andthe organization of effective interaction among the member organizations to ensureefficient cross-border securities transfers. Moreover, the question of standardizationof depository technologies, development of the electronic document exchange andadoption of international messaging standards for depository transactions are high onthe agenda.”
Source: www.acde.ru/about_eng.php
The founding membership consisted of 11 entities from 10 countries.
6.7.5 European Central Securit ies Depositor ies Associat ion (ECSDA)
ECSDA’s objective is to offer solutions and provide advice at international level ontechnical, economic, financial and regulatory matters to reduce risk and increase effi-ciency in custody, pre-settlement and settlement arrangements for securities andrelated payments across Europe for the benefit of issuers, investors and marketparticipants.
Source: www.ecsda.eu
There are 41 member national and international CSDs from 37 countries. Russia and Ukraineare also represented on the AECSD.
6.7.6 Afr ica and Middle East Depositor ies Associat ion (AMEDA)
Established in 2005, AMEDA’s main purpose is to be: “… a forum for the exchange ofinformation and experiences among its members in a spirit of mutual cooperation andto promote best practice recommendations in services such as securities depository,clearance, settlement, and risk management.
Its goal is also to support local markets in their efforts to adopt securities marketregulations, while considering their specific circumstances and to serve as a dialoguechannel with other organizations worldwide.”
Source: www.ameda.org.eg/what_about.aspx
There are 25 member CSDs from 24 countries.
Securities Depositories (CSDs and ICSDs) 173
Q&A
Quest ion
What is unusual about South Africa, Russia and the Ukraine?
Answer
All three countries are members of two CSD associations:
South Africa – This country is a member of AMEDA and ACSDA. Russia – This country is a member of AECSD and ECSDA. Ukraine – This country is a member of AECSD and ECSDA.
6.8 SUMMARY
The safekeeping of securities has evolved from being fragmented to being centralised. Frag-mented safekeeping includes situations where securities are held in one of the followingways:
By the investor; By the investor’s agent (e.g. bank, legal representative); By the investor’s bank/custodian.
Centralised safekeeping is where the issuer deposits the entire issue with a central securitiesdepository (CSD). The securities are either in physical form or book-entry form. Securitiesthat were originally issued in physical form can be processed through book entries acrossparticipants’ securities accounts.
CSDs provide services that range from basic safekeeping and settlement to asset optimisationand securities financing. Whilst CSDs are local, i.e. they handle securities issued in their localmarkets, they can link to other CSDs.
The two international CSDs, Euroclear Bank and Clearstream Banking Luxembourg, wereoriginally established to handle Eurobonds – securities that have no domicile. The servicesoffered range from new issuance to settlement and safekeeping, money transfer, securitiesoptimisation, income collection and bond redemptions, i.e. from the start of a bond to thefinish. The ICSDs are now able to handle a wide range of asset types due to their links withseveral local CSDs.
Post-trade processing is generally centralised in most regions (e.g. USA) except for Europewhere it is very fragmented.
There are five regional CSD associations covering the Americas, Asia-Pacific, Africa and theMiddle East, Eurasia and Europe. These associations look after the interests of their CSDmembers.

CHAPTER 7Securities Clearing
7.1 INTRODUCTION
In Chapter 5: Clearing Houses and CCPs, we defined clearing as: “The process of transmitting,reconciling and, in some cases, confirming payment orders or security transfer instructionsprior to settlement, possibly including the netting of instructions and the establishment of finalpositions for settlement. Sometimes the term is used (imprecisely) to include settlement.”
Clearing, therefore, is the post-trade preparation for settlement, i.e. the completion of the trade.This preparatory phase should be completed shortly after the trade has been executed; howlong afterwards depends on the market convention and type of asset.
By the end of this chapter, you will be able to:
Follow the stages within the clearing cycle; Differentiate between securities and derivatives clearing; Forecast cash requirements and securities availability.
We have seen that a clearing house differs from a central counterparty (CCP) in one funda-mental way.
Q&A
Quest ion
What is the difference between a clearing house and a CCP?
Answer
A CCP novates the buyer’s and seller’s transactions and becomes the counterparty tothe buyer and, separately, the seller. By contrast, a clearing house is not exposed to thecounterparty risk.
175
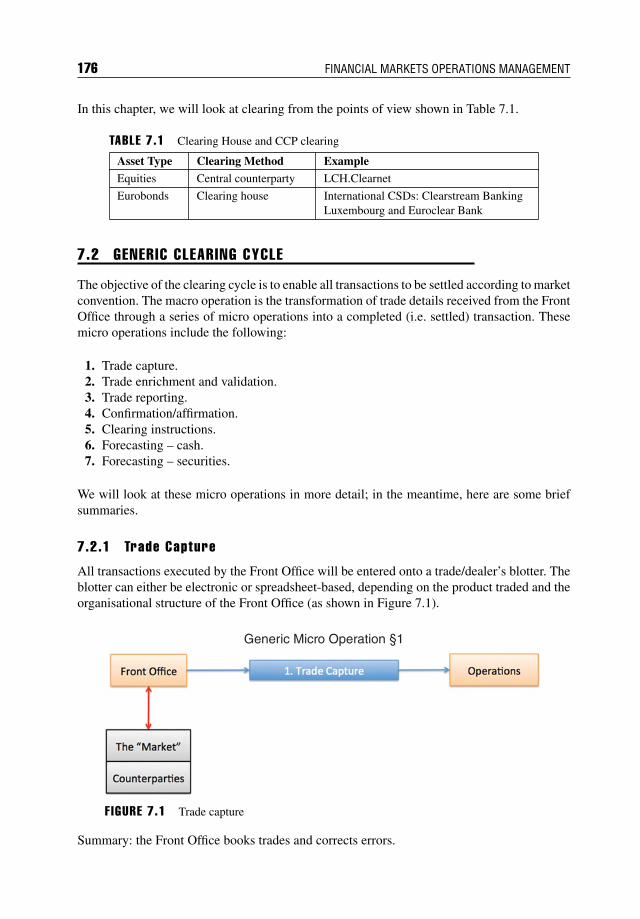
176 FINANCIAL MARKETS OPERATIONS MANAGEMENT
In this chapter, we will look at clearing from the points of view shown in Table 7.1.
TABLE 7.1 Clearing House and CCP clearing
Asset Type Clearing Method Example
Equities Central counterparty LCH.Clearnet
Eurobonds Clearing house International CSDs: Clearstream BankingLuxembourg and Euroclear Bank
7.2 GENERIC CLEARING CYCLE
The objective of the clearing cycle is to enable all transactions to be settled according to marketconvention. The macro operation is the transformation of trade details received from the FrontOffice through a series of micro operations into a completed (i.e. settled) transaction. Thesemicro operations include the following:
1. Trade capture.2. Trade enrichment and validation.3. Trade reporting.4. Confirmation/affirmation.5. Clearing instructions.6. Forecasting – cash.7. Forecasting – securities.
We will look at these micro operations in more detail; in the meantime, here are some briefsummaries.
7.2.1 Trade Capture
All transactions executed by the Front Office will be entered onto a trade/dealer’s blotter. Theblotter can either be electronic or spreadsheet-based, depending on the product traded and theorganisational structure of the Front Office (as shown in Figure 7.1).
Generic Micro Operation §1
F IGURE 7.1 Trade capture
Summary: the Front Office books trades and corrects errors.
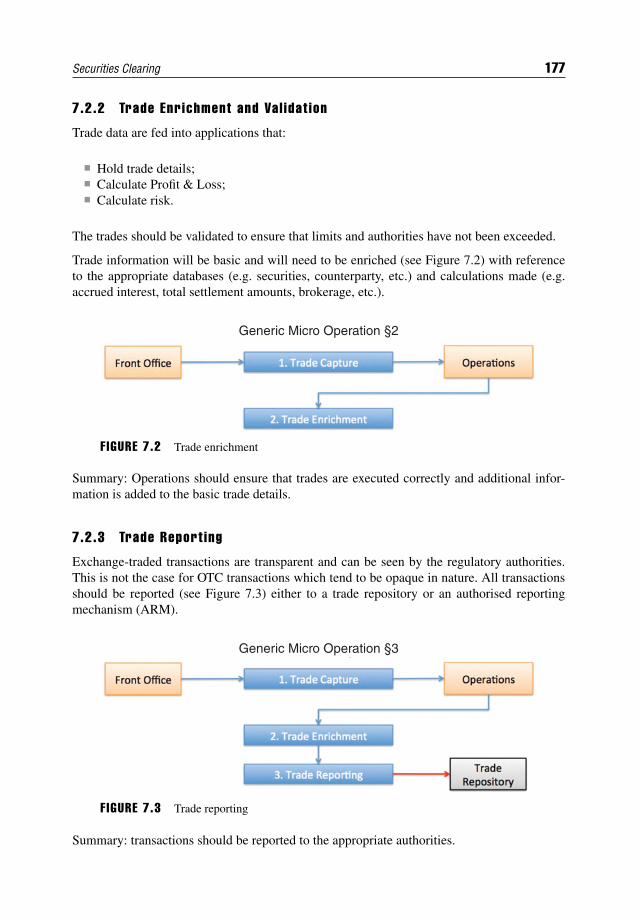
Securities Clearing 177
7.2.2 Trade Enrichment and Val idat ion
Trade data are fed into applications that:
Hold trade details; Calculate Profit & Loss; Calculate risk.
The trades should be validated to ensure that limits and authorities have not been exceeded.
Trade information will be basic and will need to be enriched (see Figure 7.2) with referenceto the appropriate databases (e.g. securities, counterparty, etc.) and calculations made (e.g.accrued interest, total settlement amounts, brokerage, etc.).
Generic Micro Operation §2
F IGURE 7.2 Trade enrichment
Summary: Operations should ensure that trades are executed correctly and additional infor-mation is added to the basic trade details.
7.2.3 Trade Report ing
Exchange-traded transactions are transparent and can be seen by the regulatory authorities.This is not the case for OTC transactions which tend to be opaque in nature. All transactionsshould be reported (see Figure 7.3) either to a trade repository or an authorised reportingmechanism (ARM).
Generic Micro Operation §3
F IGURE 7.3 Trade reporting
Summary: transactions should be reported to the appropriate authorities.
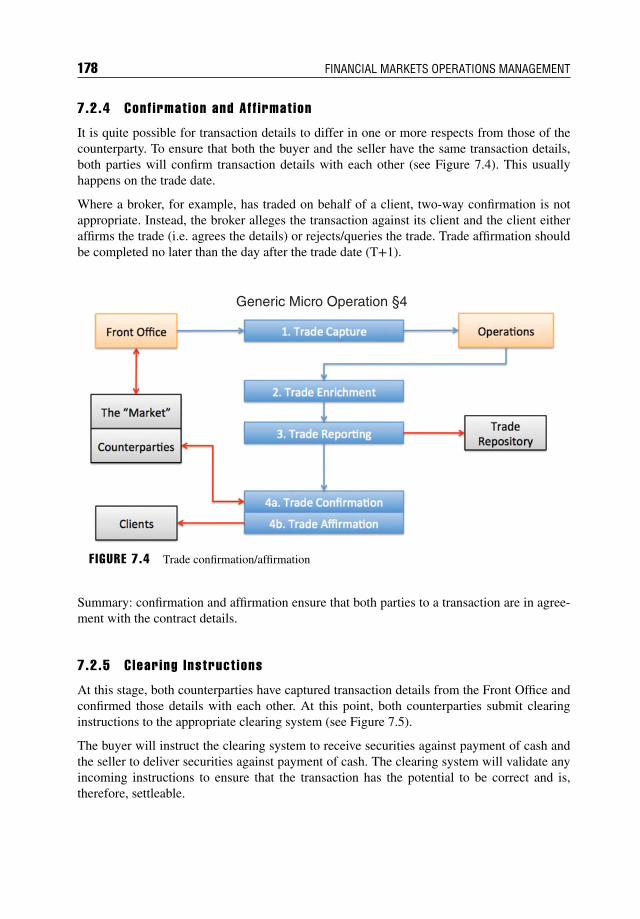
178 FINANCIAL MARKETS OPERATIONS MANAGEMENT
7.2.4 Conf irmat ion and Aff irmat ion
It is quite possible for transaction details to differ in one or more respects from those of thecounterparty. To ensure that both the buyer and the seller have the same transaction details,both parties will confirm transaction details with each other (see Figure 7.4). This usuallyhappens on the trade date.
Where a broker, for example, has traded on behalf of a client, two-way confirmation is notappropriate. Instead, the broker alleges the transaction against its client and the client eitheraffirms the trade (i.e. agrees the details) or rejects/queries the trade. Trade affirmation shouldbe completed no later than the day after the trade date (T+1).
Generic Micro Operation §4
F IGURE 7.4 Trade confirmation/affirmation
Summary: confirmation and affirmation ensure that both parties to a transaction are in agree-ment with the contract details.
7.2.5 Clearing Instruct ions
At this stage, both counterparties have captured transaction details from the Front Office andconfirmed those details with each other. At this point, both counterparties submit clearinginstructions to the appropriate clearing system (see Figure 7.5).
The buyer will instruct the clearing system to receive securities against payment of cash andthe seller to deliver securities against payment of cash. The clearing system will validate anyincoming instructions to ensure that the transaction has the potential to be correct and is,therefore, settleable.
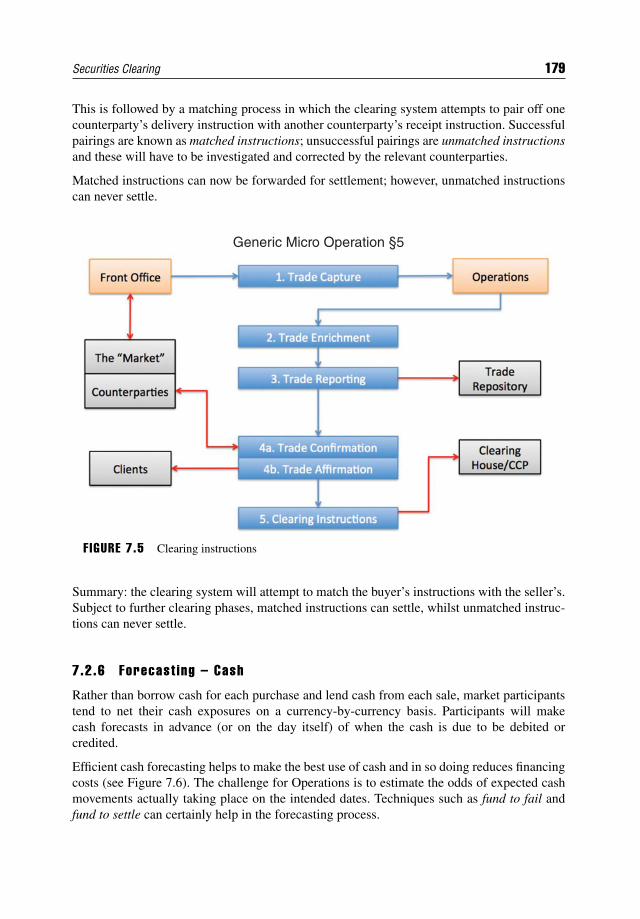
Securities Clearing 179
This is followed by a matching process in which the clearing system attempts to pair off onecounterparty’s delivery instruction with another counterparty’s receipt instruction. Successfulpairings are known as matched instructions; unsuccessful pairings are unmatched instructionsand these will have to be investigated and corrected by the relevant counterparties.
Matched instructions can now be forwarded for settlement; however, unmatched instructionscan never settle.
Generic Micro Operation §5
F IGURE 7.5 Clearing instructions
Summary: the clearing system will attempt to match the buyer’s instructions with the seller’s.Subject to further clearing phases, matched instructions can settle, whilst unmatched instruc-tions can never settle.
7.2.6 Forecast ing – Cash
Rather than borrow cash for each purchase and lend cash from each sale, market participantstend to net their cash exposures on a currency-by-currency basis. Participants will makecash forecasts in advance (or on the day itself) of when the cash is due to be debited orcredited.
Efficient cash forecasting helps to make the best use of cash and in so doing reduces financingcosts (see Figure 7.6). The challenge for Operations is to estimate the odds of expected cashmovements actually taking place on the intended dates. Techniques such as fund to fail andfund to settle can certainly help in the forecasting process.
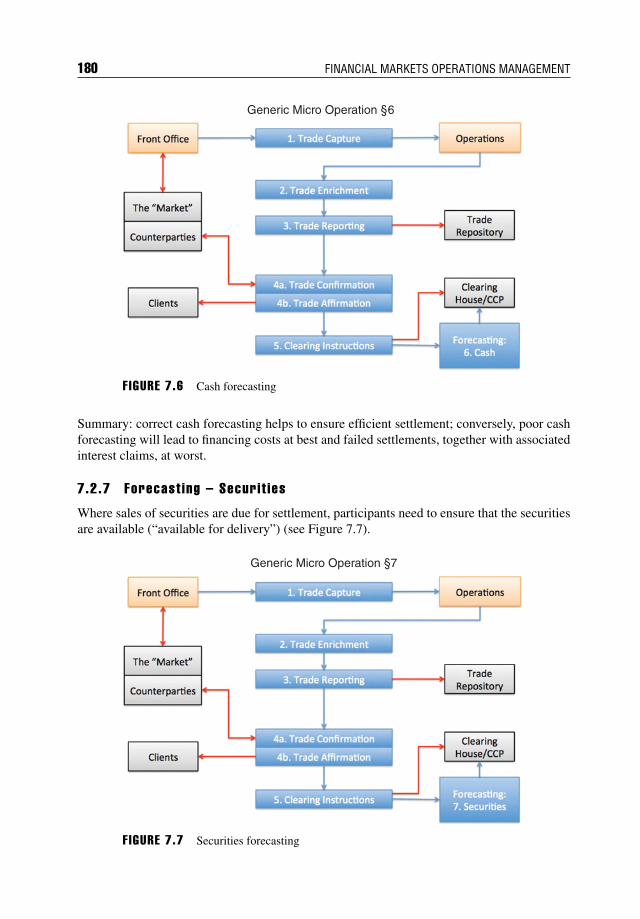
180 FINANCIAL MARKETS OPERATIONS MANAGEMENT
Generic Micro Operation §6
F IGURE 7.6 Cash forecasting
Summary: correct cash forecasting helps to ensure efficient settlement; conversely, poor cashforecasting will lead to financing costs at best and failed settlements, together with associatedinterest claims, at worst.
7.2.7 Forecast ing – Securit ies
Where sales of securities are due for settlement, participants need to ensure that the securitiesare available (“available for delivery”) (see Figure 7.7).
Generic Micro Operation §7
F IGURE 7.7 Securities forecasting
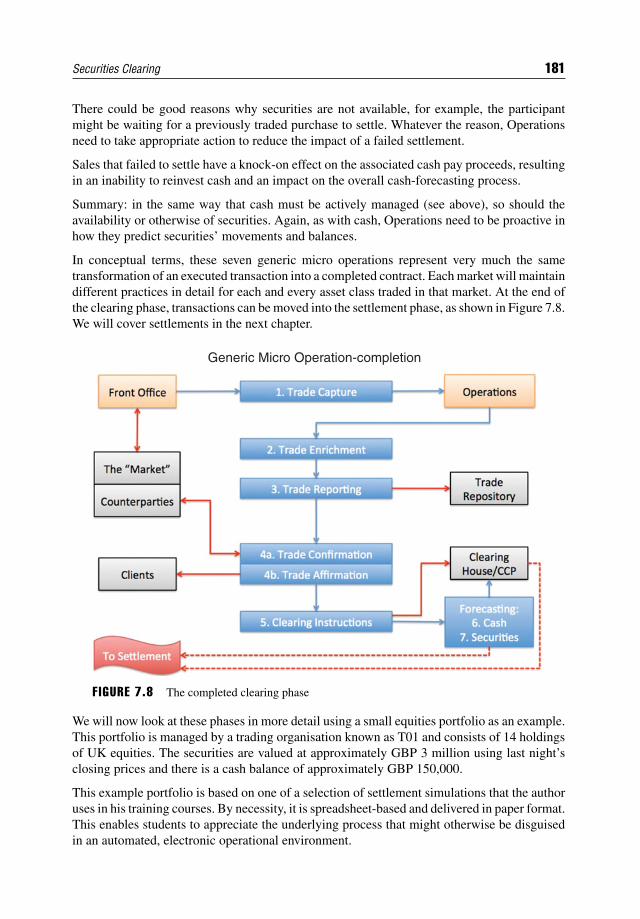
Securities Clearing 181
There could be good reasons why securities are not available, for example, the participantmight be waiting for a previously traded purchase to settle. Whatever the reason, Operationsneed to take appropriate action to reduce the impact of a failed settlement.
Sales that failed to settle have a knock-on effect on the associated cash pay proceeds, resultingin an inability to reinvest cash and an impact on the overall cash-forecasting process.
Summary: in the same way that cash must be actively managed (see above), so should theavailability or otherwise of securities. Again, as with cash, Operations need to be proactive inhow they predict securities’ movements and balances.
In conceptual terms, these seven generic micro operations represent very much the sametransformation of an executed transaction into a completed contract. Each market will maintaindifferent practices in detail for each and every asset class traded in that market. At the end ofthe clearing phase, transactions can be moved into the settlement phase, as shown in Figure 7.8.We will cover settlements in the next chapter.
Generic Micro Operation-completion
F IGURE 7.8 The completed clearing phase
We will now look at these phases in more detail using a small equities portfolio as an example.This portfolio is managed by a trading organisation known as T01 and consists of 14 holdingsof UK equities. The securities are valued at approximately GBP 3 million using last night’sclosing prices and there is a cash balance of approximately GBP 150,000.
This example portfolio is based on one of a selection of settlement simulations that the authoruses in his training courses. By necessity, it is spreadsheet-based and delivered in paper format.This enables students to appreciate the underlying process that might otherwise be disguisedin an automated, electronic operational environment.
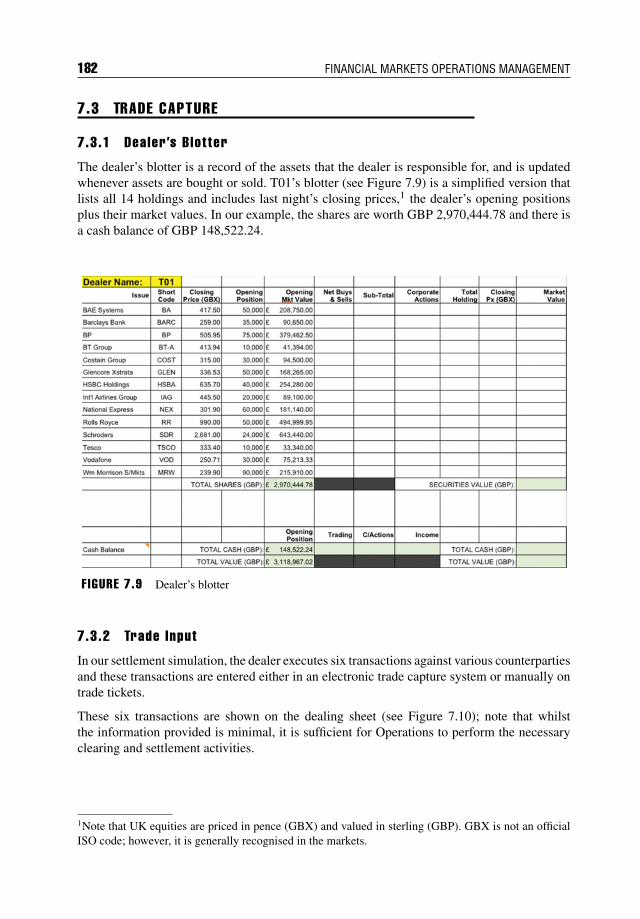
182 FINANCIAL MARKETS OPERATIONS MANAGEMENT
7.3 TRADE CAPTURE
7.3.1 Dealer ’s Blotter
The dealer’s blotter is a record of the assets that the dealer is responsible for, and is updatedwhenever assets are bought or sold. T01’s blotter (see Figure 7.9) is a simplified version thatlists all 14 holdings and includes last night’s closing prices,1 the dealer’s opening positionsplus their market values. In our example, the shares are worth GBP 2,970,444.78 and there isa cash balance of GBP 148,522.24.
F IGURE 7.9 Dealer’s blotter
7.3.2 Trade Input
In our settlement simulation, the dealer executes six transactions against various counterpartiesand these transactions are entered either in an electronic trade capture system or manually ontrade tickets.
These six transactions are shown on the dealing sheet (see Figure 7.10); note that whilstthe information provided is minimal, it is sufficient for Operations to perform the necessaryclearing and settlement activities.
1Note that UK equities are priced in pence (GBX) and valued in sterling (GBP). GBX is not an officialISO code; however, it is generally recognised in the markets.
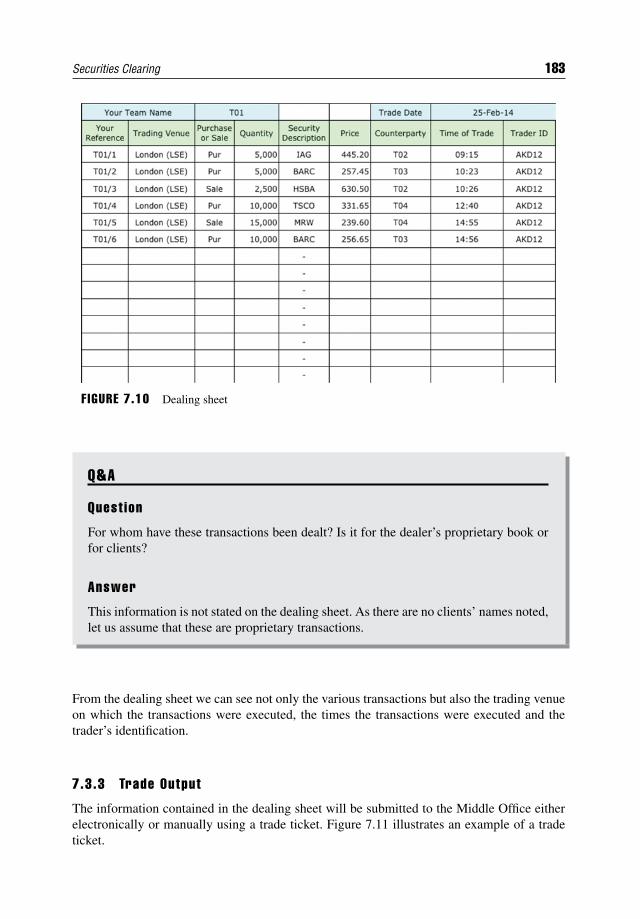
Securities Clearing 183
FIGURE 7.10 Dealing sheet
Q&A
Quest ion
For whom have these transactions been dealt? Is it for the dealer’s proprietary book orfor clients?
Answer
This information is not stated on the dealing sheet. As there are no clients’ names noted,let us assume that these are proprietary transactions.
From the dealing sheet we can see not only the various transactions but also the trading venueon which the transactions were executed, the times the transactions were executed and thetrader’s identification.
7.3.3 Trade Output
The information contained in the dealing sheet will be submitted to the Middle Office eitherelectronically or manually using a trade ticket. Figure 7.11 illustrates an example of a tradeticket.
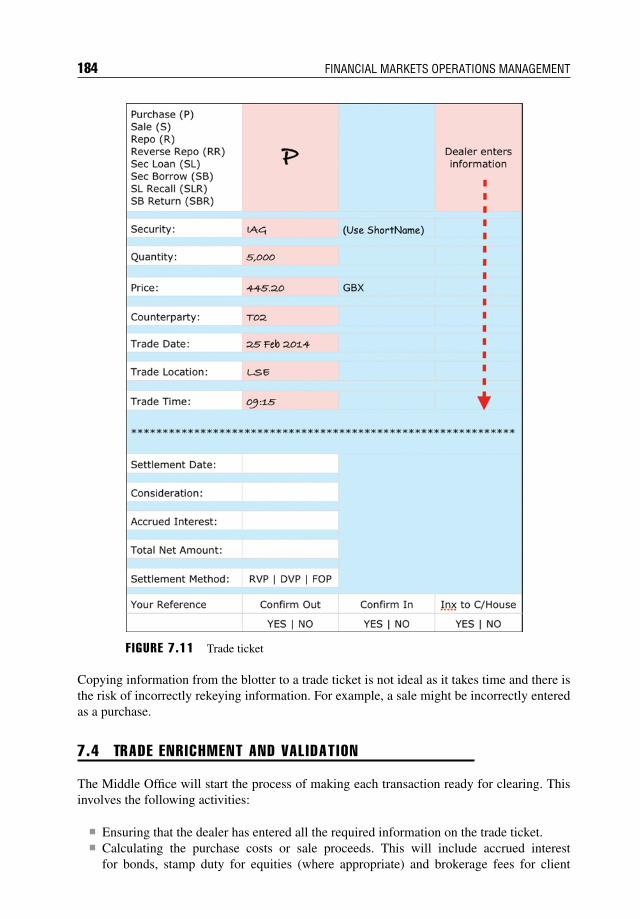
184 FINANCIAL MARKETS OPERATIONS MANAGEMENT
F IGURE 7.11 Trade ticket
Copying information from the blotter to a trade ticket is not ideal as it takes time and there isthe risk of incorrectly rekeying information. For example, a sale might be incorrectly enteredas a purchase.
7.4 TRADE ENRICHMENT AND VALIDATION
The Middle Office will start the process of making each transaction ready for clearing. Thisinvolves the following activities:
Ensuring that the dealer has entered all the required information on the trade ticket. Calculating the purchase costs or sale proceeds. This will include accrued interest
for bonds, stamp duty for equities (where appropriate) and brokerage fees for client
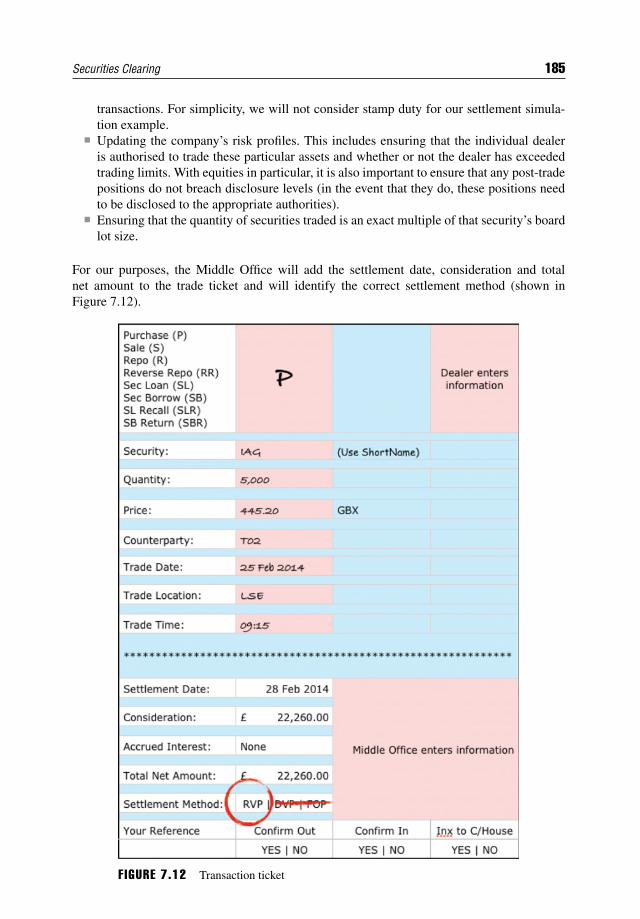
Securities Clearing 185
transactions. For simplicity, we will not consider stamp duty for our settlement simula-tion example.
Updating the company’s risk profiles. This includes ensuring that the individual dealeris authorised to trade these particular assets and whether or not the dealer has exceededtrading limits. With equities in particular, it is also important to ensure that any post-tradepositions do not breach disclosure levels (in the event that they do, these positions needto be disclosed to the appropriate authorities).
Ensuring that the quantity of securities traded is an exact multiple of that security’s boardlot size.
For our purposes, the Middle Office will add the settlement date, consideration and totalnet amount to the trade ticket and will identify the correct settlement method (shown inFigure 7.12).
F IGURE 7.12 Transaction ticket
186 FINANCIAL MARKETS OPERATIONS MANAGEMENT
We can see that we now have almost the full details of this particular transaction, as follows:
The settlement date for this particular asset type is T+3, making it 28 February 2014. The consideration is the quantity of shares multiplied by the price (remembering that,
as these are UK equities, they have been priced in pence and should be converted intopounds sterling).
There is no accrued interest and we are disregarding stamp duty in our example. As this transaction is a purchase, the regular settlement method will be receive versus
payment (RVP).
There are two pieces of information missing at this stage: the account numbers of bothtrading counterparties and the name of the clearing system. In an automated environment, thisinformation would be picked up from the appropriate databases, as shown in Table 7.2.
TABLE 7.2 Counterparties and clearing system
Database CommentsCompany T01 T01 is a clearing member of the clearing house and will have an associated
participant account number/code.
Counterparty T02 is a clearing member of the clearing house and will have an associatedparticipant account number/code.
Asset type UK equities traded on the London Stock Exchange clear through a specifiedclearing system.
Clearing system LCH.Clearnet.
By contrast, in a manual environment, Middle Office or Settlements staff would add theseextra details to the trade ticket, confirmation and clearing house instructions.
7.5 REGULATORY REPORTING
7.5.1 Background
As part of a regulatory authority’s obligations to maintain confidence in the financial mar-kets and reduce financial crime, regulated firms have to send reports of their transactionsto the regulator at the earliest possible opportunity (i.e. by close of business on T+1). Thishelps the regulator detect and investigate suspected incidents of market abuse and/or marketmanipulation.
7.5.2 Transact ion Report ing
Reportable Transact ions Regulated firms must report all purchases and sales of financialinstruments whether acting as principal or agent. There are transaction types that are notreportable:
1. Securities financing transactions (e.g. securities lending/borrowing).2. The exercise of options and covered warrants.3. Primary market transactions in equities and bonds (including depository receipts on these).
Securities Clearing 187
Reportable Instruments Regulated firms have to report transactions that have beenexecuted:
(a) In any financial instrument (e.g. equities, bonds, derivatives, etc.) that has been admittedto trading on a regulated market;2 or
(b) In any OTC derivative where the underlying asset is either an equity or debt-relatedfinancial instrument, as noted in (1) above.
There are exceptions; the following need not be reported:
(c) Transactions in any OTC derivative where the underlying asset is either a multiple equityor multiple debt-related financial instrument (e.g. a stock index);
(d) Transactions in commodity, interest rate and foreign-exchange OTC/listed derivatives(e.g. a commodity futures contract).
Content of a Transact ion Report A transaction report contains information regarding anindividual transaction executed on a financial market and contains 21 separate fields, including:
The financial instrument identifiers; The firm that executed the transaction; The counterparty to the transaction; The buy/sell identifier; The price; The quantity, etc.
The regulators regard transaction reporting as being so important in their role of ensuring thatthe markets function well that they will heavily fine firms which either mis-report transactionsor fail to report them altogether.
7.5.3 Transact ion-Report ing Mechanism
Transactions can be reported to the regulator by firms using systems known as approvedreporting mechanisms (ARMs). Table 7.3 lists ARMs approved by the UK’s Financial ConductAuthority.
TABLE 7.3 List of approved ARMs
ARM System ISIN OTC AIICredit Suisse Securities (Europe) Limited DARE Yes Yes Yes
Euroclear UK and Ireland CREST Yes No No
Xtrakter TRAX Yes Yes Yes
London Stock Exchange UniVista Yes Yes Yes
Getco Europe Ltd GETCO Yes Yes Yes
Abide Financial Ltd TransacPort Yes Yes YesAII – Alternative Instrument Identifier
2A list of regulated markets covered by MiFID in Europe can be found in the Regulated Markets section ofthe ESMA database (http://mifiddatabase.esma.europa.eu/Index.aspx?sectionlinks_id=4&language=0&pageName=Home).
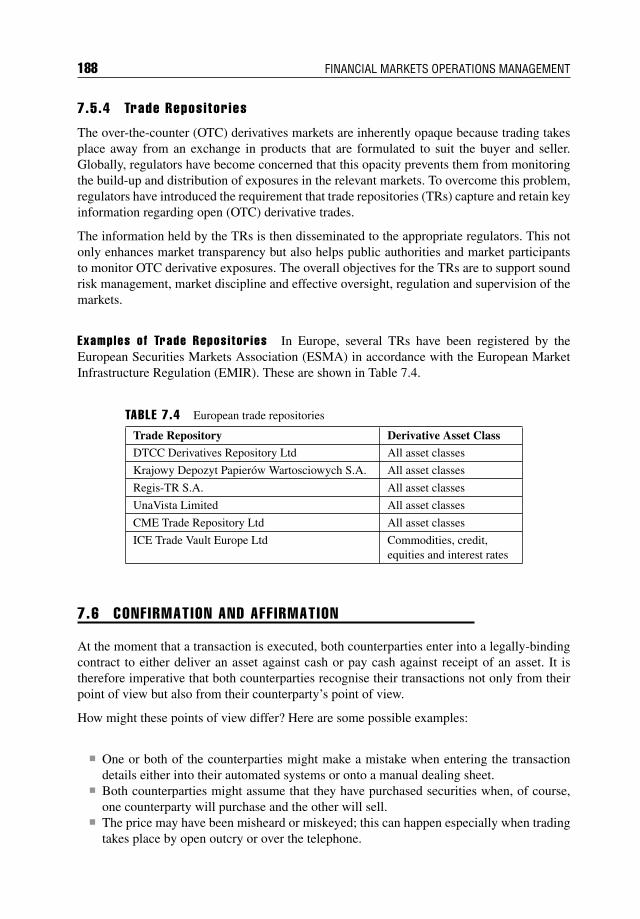
188 FINANCIAL MARKETS OPERATIONS MANAGEMENT
7.5.4 Trade Repositor ies
The over-the-counter (OTC) derivatives markets are inherently opaque because trading takesplace away from an exchange in products that are formulated to suit the buyer and seller.Globally, regulators have become concerned that this opacity prevents them from monitoringthe build-up and distribution of exposures in the relevant markets. To overcome this problem,regulators have introduced the requirement that trade repositories (TRs) capture and retain keyinformation regarding open (OTC) derivative trades.
The information held by the TRs is then disseminated to the appropriate regulators. This notonly enhances market transparency but also helps public authorities and market participantsto monitor OTC derivative exposures. The overall objectives for the TRs are to support soundrisk management, market discipline and effective oversight, regulation and supervision of themarkets.
Examples of Trade Repositor ies In Europe, several TRs have been registered by theEuropean Securities Markets Association (ESMA) in accordance with the European MarketInfrastructure Regulation (EMIR). These are shown in Table 7.4.
TABLE 7.4 European trade repositories
Trade Repository Derivative Asset Class
DTCC Derivatives Repository Ltd All asset classes
Krajowy Depozyt Papierow Wartosciowych S.A. All asset classes
Regis-TR S.A. All asset classes
UnaVista Limited All asset classes
CME Trade Repository Ltd All asset classes
ICE Trade Vault Europe Ltd Commodities, credit,equities and interest rates
7.6 CONFIRMATION AND AFF IRMATION
At the moment that a transaction is executed, both counterparties enter into a legally-bindingcontract to either deliver an asset against cash or pay cash against receipt of an asset. It istherefore imperative that both counterparties recognise their transactions not only from theirpoint of view but also from their counterparty’s point of view.
How might these points of view differ? Here are some possible examples:
One or both of the counterparties might make a mistake when entering the transactiondetails either into their automated systems or onto a manual dealing sheet.
Both counterparties might assume that they have purchased securities when, of course,one counterparty will purchase and the other will sell.
The price may have been misheard or miskeyed; this can happen especially when tradingtakes place by open outcry or over the telephone.
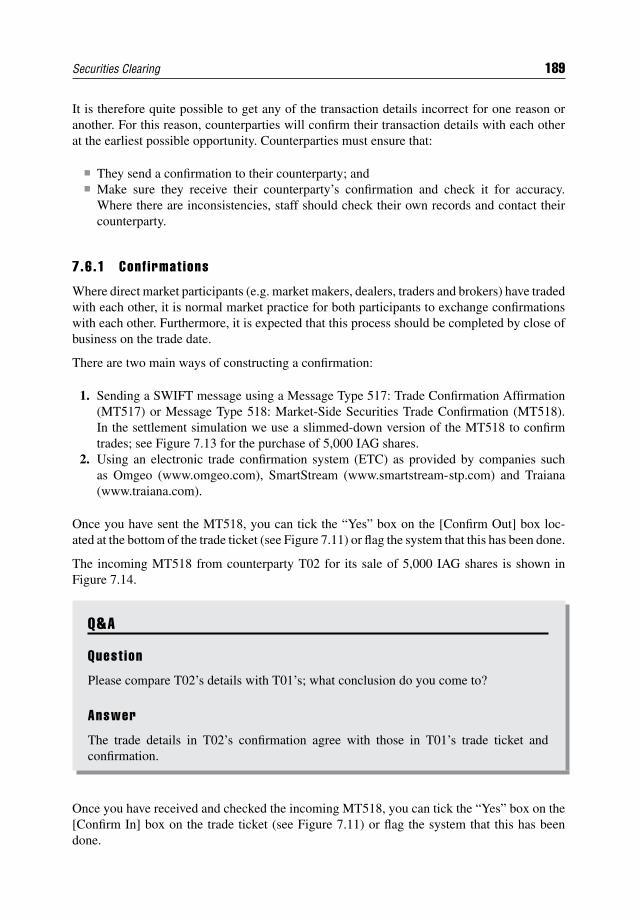
Securities Clearing 189
It is therefore quite possible to get any of the transaction details incorrect for one reason oranother. For this reason, counterparties will confirm their transaction details with each otherat the earliest possible opportunity. Counterparties must ensure that:
They send a confirmation to their counterparty; and Make sure they receive their counterparty’s confirmation and check it for accuracy.
Where there are inconsistencies, staff should check their own records and contact theircounterparty.
7.6.1 Conf irmat ions
Where direct market participants (e.g. market makers, dealers, traders and brokers) have tradedwith each other, it is normal market practice for both participants to exchange confirmationswith each other. Furthermore, it is expected that this process should be completed by close ofbusiness on the trade date.
There are two main ways of constructing a confirmation:
1. Sending a SWIFT message using a Message Type 517: Trade Confirmation Affirmation(MT517) or Message Type 518: Market-Side Securities Trade Confirmation (MT518).In the settlement simulation we use a slimmed-down version of the MT518 to confirmtrades; see Figure 7.13 for the purchase of 5,000 IAG shares.
2. Using an electronic trade confirmation system (ETC) as provided by companies suchas Omgeo (www.omgeo.com), SmartStream (www.smartstream-stp.com) and Traiana(www.traiana.com).
Once you have sent the MT518, you can tick the “Yes” box on the [Confirm Out] box loc-ated at the bottom of the trade ticket (see Figure 7.11) or flag the system that this has been done.
The incoming MT518 from counterparty T02 for its sale of 5,000 IAG shares is shown inFigure 7.14.
Q&A
Quest ion
Please compare T02’s details with T01’s; what conclusion do you come to?
Answer
The trade details in T02’s confirmation agree with those in T01’s trade ticket andconfirmation.
Once you have received and checked the incoming MT518, you can tick the “Yes” box on the[Confirm In] box on the trade ticket (see Figure 7.11) or flag the system that this has beendone.
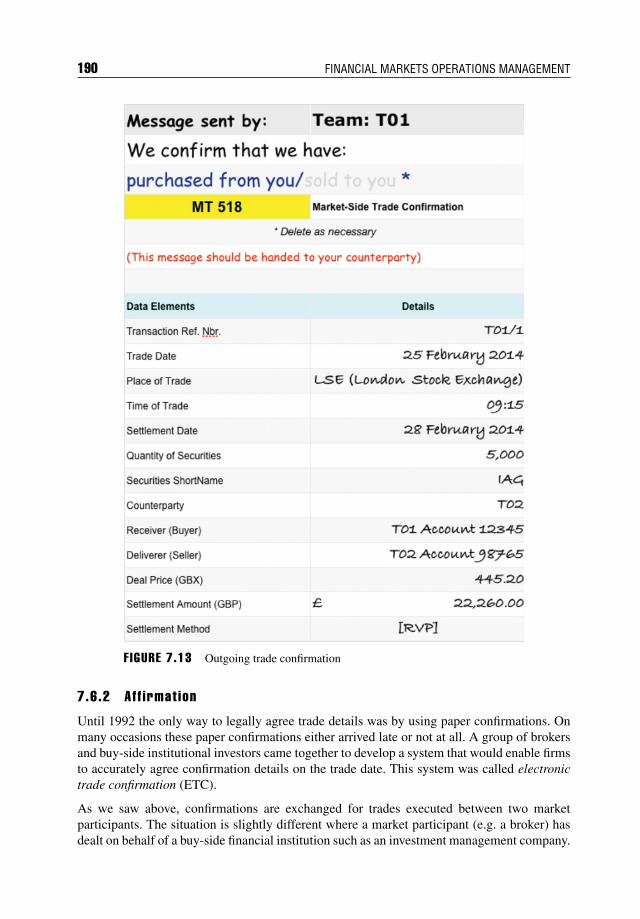
190 FINANCIAL MARKETS OPERATIONS MANAGEMENT
F IGURE 7.13 Outgoing trade confirmation
7.6.2 Af f irmat ion
Until 1992 the only way to legally agree trade details was by using paper confirmations. Onmany occasions these paper confirmations either arrived late or not at all. A group of brokersand buy-side institutional investors came together to develop a system that would enable firmsto accurately agree confirmation details on the trade date. This system was called electronictrade confirmation (ETC).
As we saw above, confirmations are exchanged for trades executed between two marketparticipants. The situation is slightly different where a market participant (e.g. a broker) hasdealt on behalf of a buy-side financial institution such as an investment management company.
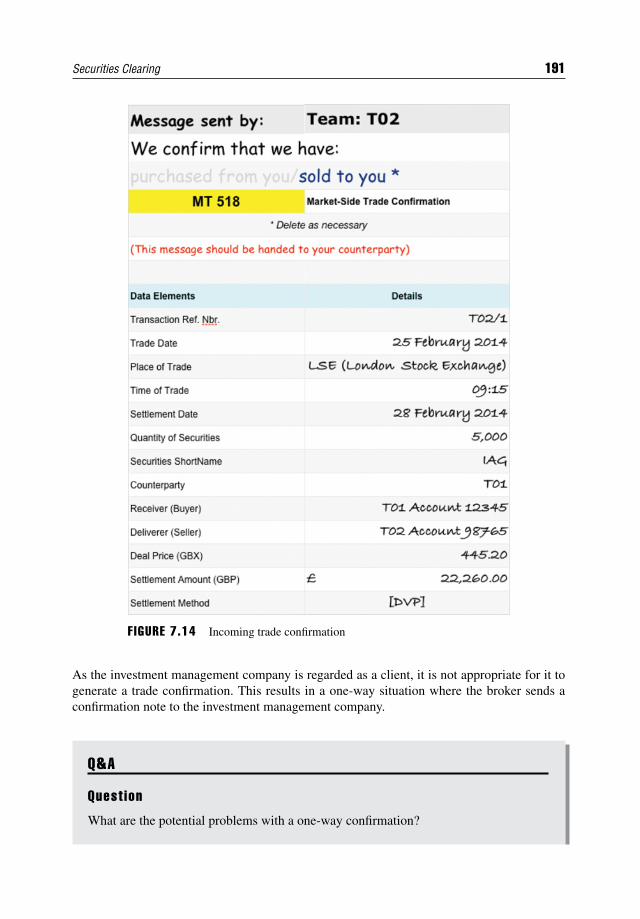
Securities Clearing 191
FIGURE 7.14 Incoming trade confirmation
As the investment management company is regarded as a client, it is not appropriate for it togenerate a trade confirmation. This results in a one-way situation where the broker sends aconfirmation note to the investment management company.
Q&A
Quest ion
What are the potential problems with a one-way confirmation?
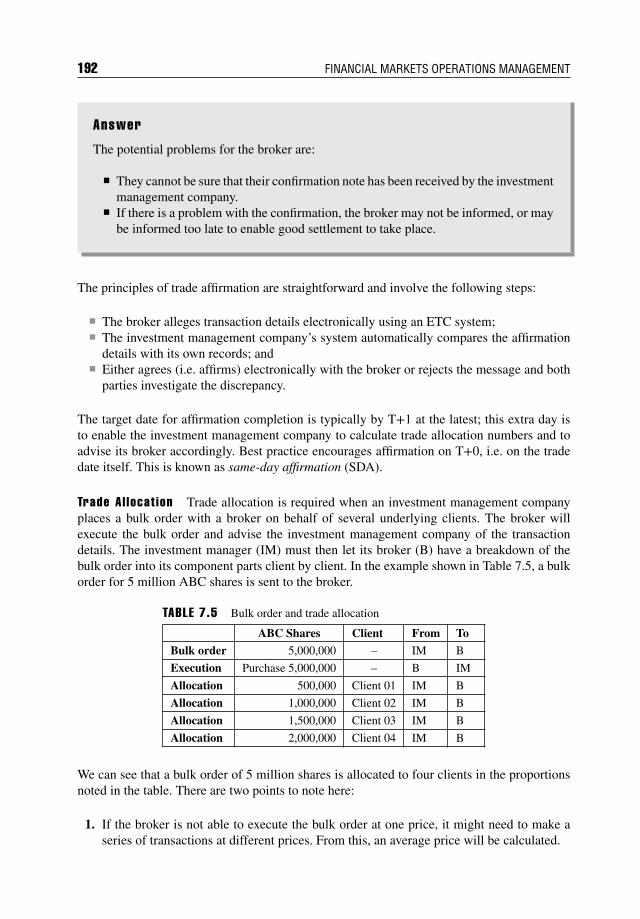
192 FINANCIAL MARKETS OPERATIONS MANAGEMENT
Answer
The potential problems for the broker are:
They cannot be sure that their confirmation note has been received by the investmentmanagement company.
If there is a problem with the confirmation, the broker may not be informed, or maybe informed too late to enable good settlement to take place.
The principles of trade affirmation are straightforward and involve the following steps:
The broker alleges transaction details electronically using an ETC system; The investment management company’s system automatically compares the affirmation
details with its own records; and Either agrees (i.e. affirms) electronically with the broker or rejects the message and both
parties investigate the discrepancy.
The target date for affirmation completion is typically by T+1 at the latest; this extra day isto enable the investment management company to calculate trade allocation numbers and toadvise its broker accordingly. Best practice encourages affirmation on T+0, i.e. on the tradedate itself. This is known as same-day affirmation (SDA).
Trade Al locat ion Trade allocation is required when an investment management companyplaces a bulk order with a broker on behalf of several underlying clients. The broker willexecute the bulk order and advise the investment management company of the transactiondetails. The investment manager (IM) must then let its broker (B) have a breakdown of thebulk order into its component parts client by client. In the example shown in Table 7.5, a bulkorder for 5 million ABC shares is sent to the broker.
TABLE 7.5 Bulk order and trade allocation
ABC Shares Client From To
Bulk order 5,000,000 – IM B
Execution Purchase 5,000,000 – B IM
Allocation 500,000 Client 01 IM B
Allocation 1,000,000 Client 02 IM B
Allocation 1,500,000 Client 03 IM B
Allocation 2,000,000 Client 04 IM B
We can see that a bulk order of 5 million shares is allocated to four clients in the proportionsnoted in the table. There are two points to note here:
1. If the broker is not able to execute the bulk order at one price, it might need to make aseries of transactions at different prices. From this, an average price will be calculated.
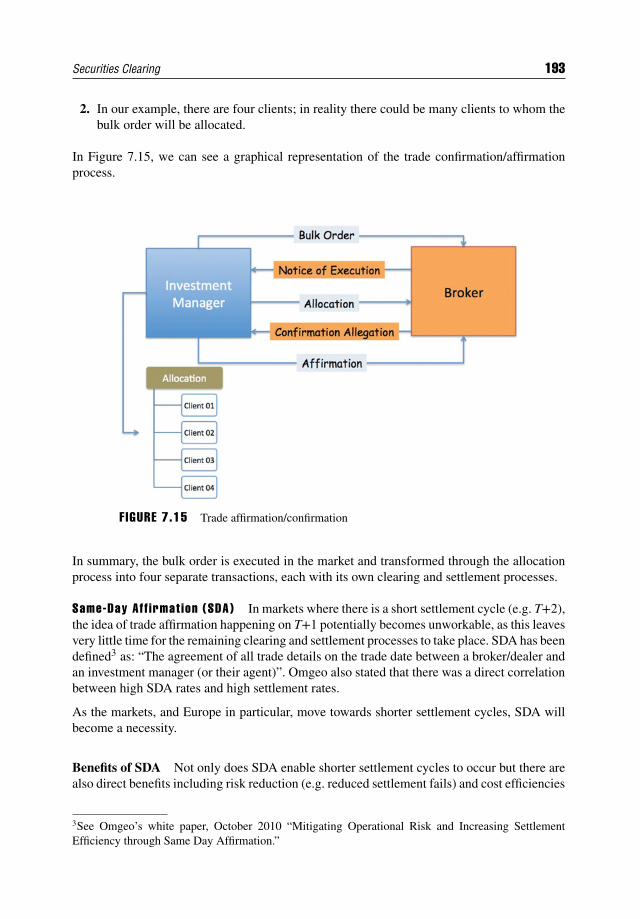
Securities Clearing 193
2. In our example, there are four clients; in reality there could be many clients to whom thebulk order will be allocated.
In Figure 7.15, we can see a graphical representation of the trade confirmation/affirmationprocess.
F IGURE 7.15 Trade affirmation/confirmation
In summary, the bulk order is executed in the market and transformed through the allocationprocess into four separate transactions, each with its own clearing and settlement processes.
Same-Day Aff irmat ion (SDA) In markets where there is a short settlement cycle (e.g. T+2),the idea of trade affirmation happening on T+1 potentially becomes unworkable, as this leavesvery little time for the remaining clearing and settlement processes to take place. SDA has beendefined3 as: “The agreement of all trade details on the trade date between a broker/dealer andan investment manager (or their agent)”. Omgeo also stated that there was a direct correlationbetween high SDA rates and high settlement rates.
As the markets, and Europe in particular, move towards shorter settlement cycles, SDA willbecome a necessity.
Benefits of SDA Not only does SDA enable shorter settlement cycles to occur but there arealso direct benefits including risk reduction (e.g. reduced settlement fails) and cost efficiencies
3See Omgeo’s white paper, October 2010 “Mitigating Operational Risk and Increasing SettlementEfficiency through Same Day Affirmation.”
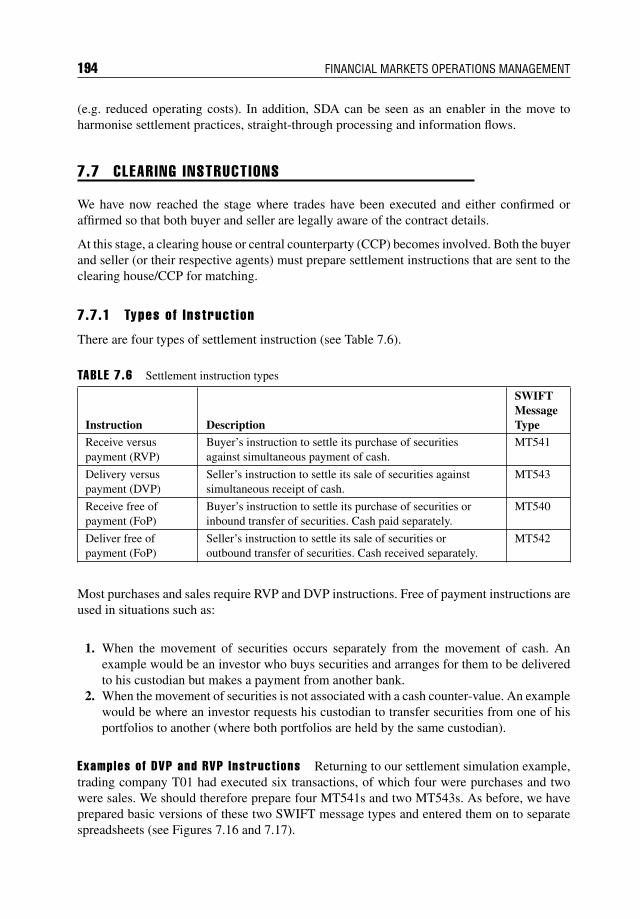
194 FINANCIAL MARKETS OPERATIONS MANAGEMENT
(e.g. reduced operating costs). In addition, SDA can be seen as an enabler in the move toharmonise settlement practices, straight-through processing and information flows.
7.7 CLEARING INSTRUCTIONS
We have now reached the stage where trades have been executed and either confirmed oraffirmed so that both buyer and seller are legally aware of the contract details.
At this stage, a clearing house or central counterparty (CCP) becomes involved. Both the buyerand seller (or their respective agents) must prepare settlement instructions that are sent to theclearing house/CCP for matching.
7.7.1 Types of Instruct ion
There are four types of settlement instruction (see Table 7.6).
TABLE 7.6 Settlement instruction types
Instruction Description
SWIFTMessageType
Receive versuspayment (RVP)
Buyer’s instruction to settle its purchase of securitiesagainst simultaneous payment of cash.
MT541
Delivery versuspayment (DVP)
Seller’s instruction to settle its sale of securities againstsimultaneous receipt of cash.
MT543
Receive free ofpayment (FoP)
Buyer’s instruction to settle its purchase of securities orinbound transfer of securities. Cash paid separately.
MT540
Deliver free ofpayment (FoP)
Seller’s instruction to settle its sale of securities oroutbound transfer of securities. Cash received separately.
MT542
Most purchases and sales require RVP and DVP instructions. Free of payment instructions areused in situations such as:
1. When the movement of securities occurs separately from the movement of cash. Anexample would be an investor who buys securities and arranges for them to be deliveredto his custodian but makes a payment from another bank.
2. When the movement of securities is not associated with a cash counter-value. An examplewould be where an investor requests his custodian to transfer securities from one of hisportfolios to another (where both portfolios are held by the same custodian).
Examples of DVP and RVP Instruct ions Returning to our settlement simulation example,trading company T01 had executed six transactions, of which four were purchases and twowere sales. We should therefore prepare four MT541s and two MT543s. As before, we haveprepared basic versions of these two SWIFT message types and entered them on to separatespreadsheets (see Figures 7.16 and 7.17).
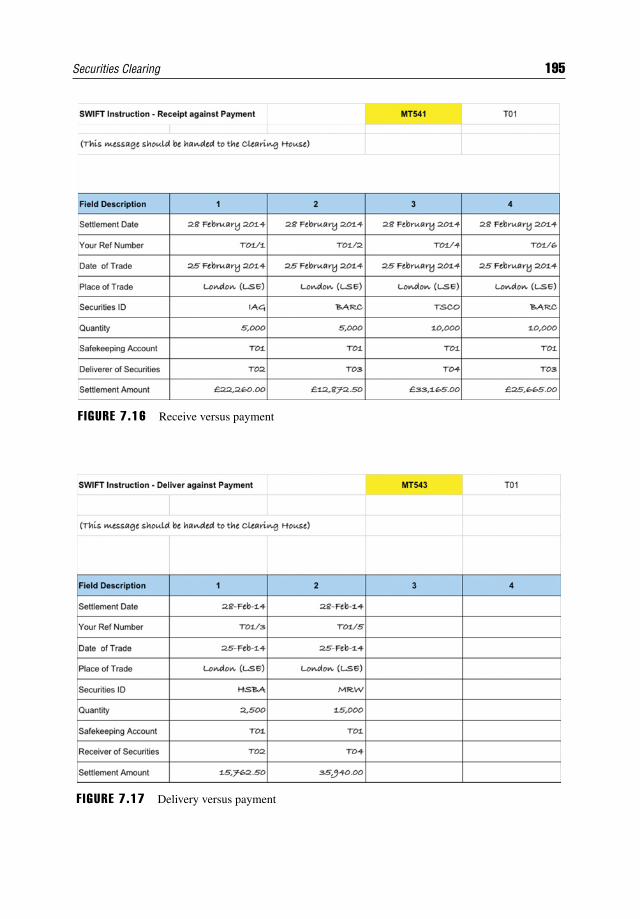
Securities Clearing 195
FIGURE 7.16 Receive versus payment
F IGURE 7.17 Delivery versus payment
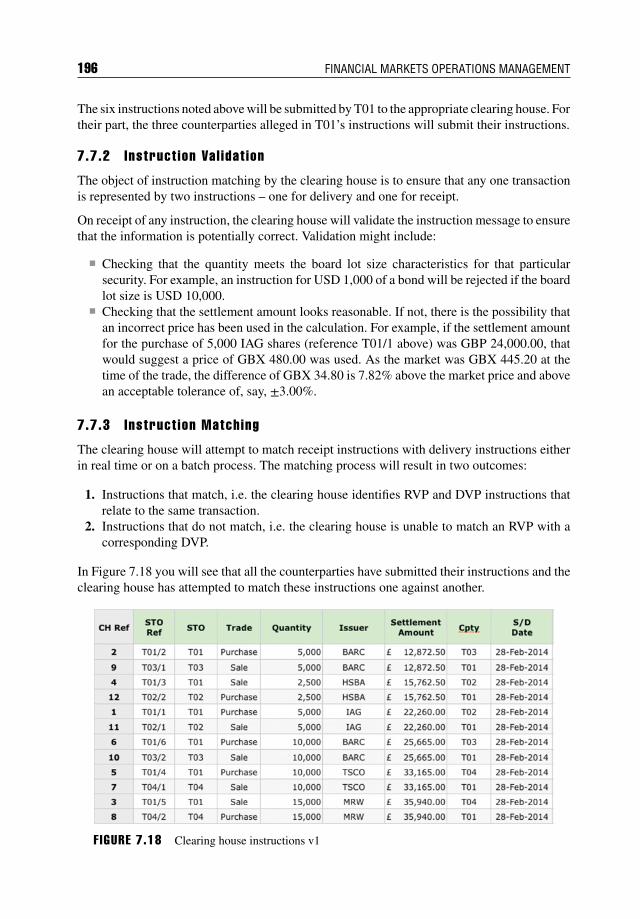
196 FINANCIAL MARKETS OPERATIONS MANAGEMENT
The six instructions noted above will be submitted by T01 to the appropriate clearing house. Fortheir part, the three counterparties alleged in T01’s instructions will submit their instructions.
7.7.2 Instruct ion Val idat ion
The object of instruction matching by the clearing house is to ensure that any one transactionis represented by two instructions – one for delivery and one for receipt.
On receipt of any instruction, the clearing house will validate the instruction message to ensurethat the information is potentially correct. Validation might include:
Checking that the quantity meets the board lot size characteristics for that particularsecurity. For example, an instruction for USD 1,000 of a bond will be rejected if the boardlot size is USD 10,000.
Checking that the settlement amount looks reasonable. If not, there is the possibility thatan incorrect price has been used in the calculation. For example, if the settlement amountfor the purchase of 5,000 IAG shares (reference T01/1 above) was GBP 24,000.00, thatwould suggest a price of GBX 480.00 was used. As the market was GBX 445.20 at thetime of the trade, the difference of GBX 34.80 is 7.82% above the market price and abovean acceptable tolerance of, say, ±3.00%.
7.7.3 Instruct ion Matching
The clearing house will attempt to match receipt instructions with delivery instructions eitherin real time or on a batch process. The matching process will result in two outcomes:
1. Instructions that match, i.e. the clearing house identifies RVP and DVP instructions thatrelate to the same transaction.
2. Instructions that do not match, i.e. the clearing house is unable to match an RVP with acorresponding DVP.
In Figure 7.18 you will see that all the counterparties have submitted their instructions and theclearing house has attempted to match these instructions one against another.
F IGURE 7.18 Clearing house instructions v1
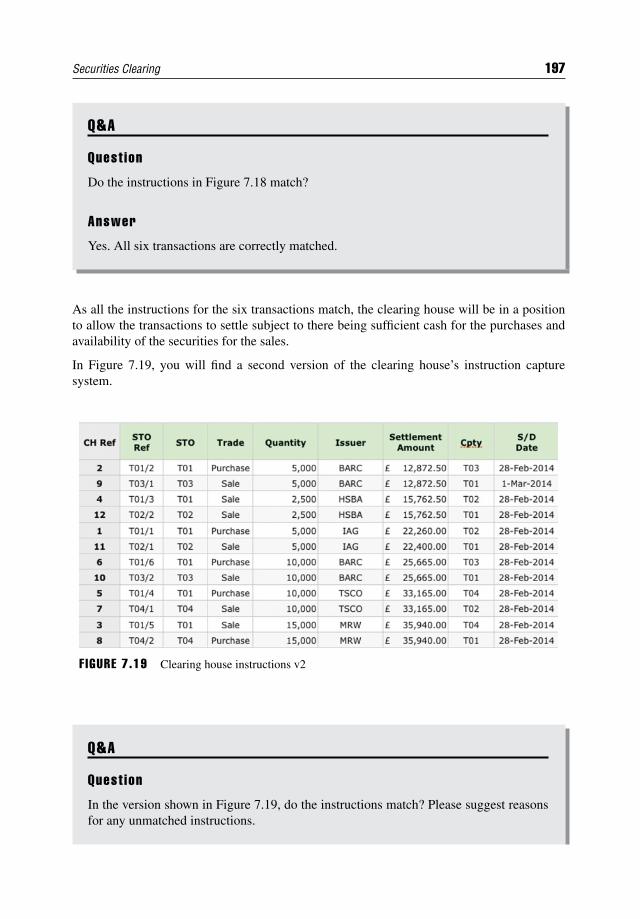
Securities Clearing 197
Q&A
Quest ion
Do the instructions in Figure 7.18 match?
Answer
Yes. All six transactions are correctly matched.
As all the instructions for the six transactions match, the clearing house will be in a positionto allow the transactions to settle subject to there being sufficient cash for the purchases andavailability of the securities for the sales.
In Figure 7.19, you will find a second version of the clearing house’s instruction capturesystem.
F IGURE 7.19 Clearing house instructions v2
Q&A
Quest ion
In the version shown in Figure 7.19, do the instructions match? Please suggest reasonsfor any unmatched instructions.
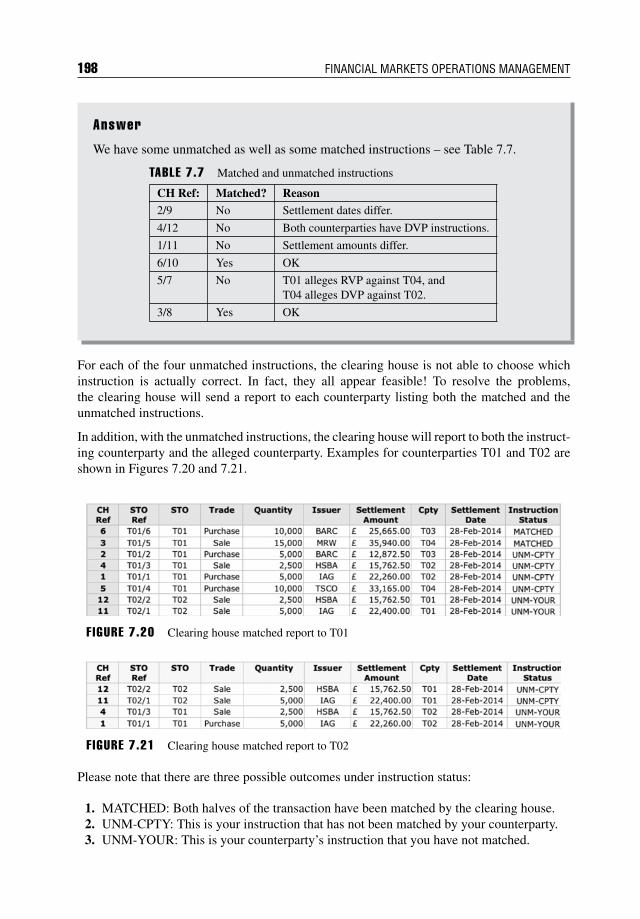
198 FINANCIAL MARKETS OPERATIONS MANAGEMENT
Answer
We have some unmatched as well as some matched instructions – see Table 7.7.
TABLE 7.7 Matched and unmatched instructions
CH Ref: Matched? Reason2/9 No Settlement dates differ.
4/12 No Both counterparties have DVP instructions.
1/11 No Settlement amounts differ.
6/10 Yes OK
5/7 No T01 alleges RVP against T04, andT04 alleges DVP against T02.
3/8 Yes OK
For each of the four unmatched instructions, the clearing house is not able to choose whichinstruction is actually correct. In fact, they all appear feasible! To resolve the problems,the clearing house will send a report to each counterparty listing both the matched and theunmatched instructions.
In addition, with the unmatched instructions, the clearing house will report to both the instruct-ing counterparty and the alleged counterparty. Examples for counterparties T01 and T02 areshown in Figures 7.20 and 7.21.
F IGURE 7.20 Clearing house matched report to T01
F IGURE 7.21 Clearing house matched report to T02
Please note that there are three possible outcomes under instruction status:
1. MATCHED: Both halves of the transaction have been matched by the clearing house.2. UNM-CPTY: This is your instruction that has not been matched by your counterparty.3. UNM-YOUR: This is your counterparty’s instruction that you have not matched.
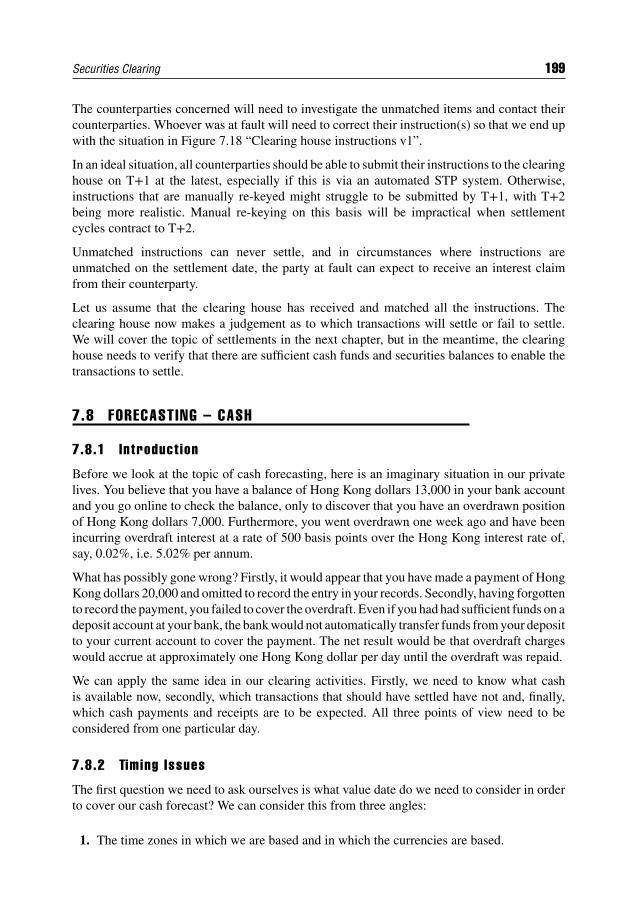
Securities Clearing 199
The counterparties concerned will need to investigate the unmatched items and contact theircounterparties. Whoever was at fault will need to correct their instruction(s) so that we end upwith the situation in Figure 7.18 “Clearing house instructions v1”.
In an ideal situation, all counterparties should be able to submit their instructions to the clearinghouse on T+1 at the latest, especially if this is via an automated STP system. Otherwise,instructions that are manually re-keyed might struggle to be submitted by T+1, with T+2being more realistic. Manual re-keying on this basis will be impractical when settlementcycles contract to T+2.
Unmatched instructions can never settle, and in circumstances where instructions areunmatched on the settlement date, the party at fault can expect to receive an interest claimfrom their counterparty.
Let us assume that the clearing house has received and matched all the instructions. Theclearing house now makes a judgement as to which transactions will settle or fail to settle.We will cover the topic of settlements in the next chapter, but in the meantime, the clearinghouse needs to verify that there are sufficient cash funds and securities balances to enable thetransactions to settle.
7.8 FORECASTING – CASH
7.8.1 Introduct ion
Before we look at the topic of cash forecasting, here is an imaginary situation in our privatelives. You believe that you have a balance of Hong Kong dollars 13,000 in your bank accountand you go online to check the balance, only to discover that you have an overdrawn positionof Hong Kong dollars 7,000. Furthermore, you went overdrawn one week ago and have beenincurring overdraft interest at a rate of 500 basis points over the Hong Kong interest rate of,say, 0.02%, i.e. 5.02% per annum.
What has possibly gone wrong? Firstly, it would appear that you have made a payment of HongKong dollars 20,000 and omitted to record the entry in your records. Secondly, having forgottento record the payment, you failed to cover the overdraft. Even if you had had sufficient funds on adeposit account at your bank, the bank would not automatically transfer funds from your depositto your current account to cover the payment. The net result would be that overdraft chargeswould accrue at approximately one Hong Kong dollar per day until the overdraft was repaid.
We can apply the same idea in our clearing activities. Firstly, we need to know what cashis available now, secondly, which transactions that should have settled have not and, finally,which cash payments and receipts are to be expected. All three points of view need to beconsidered from one particular day.
7.8.2 Timing Issues
The first question we need to ask ourselves is what value date do we need to consider in orderto cover our cash forecast? We can consider this from three angles:
1. The time zones in which we are based and in which the currencies are based.
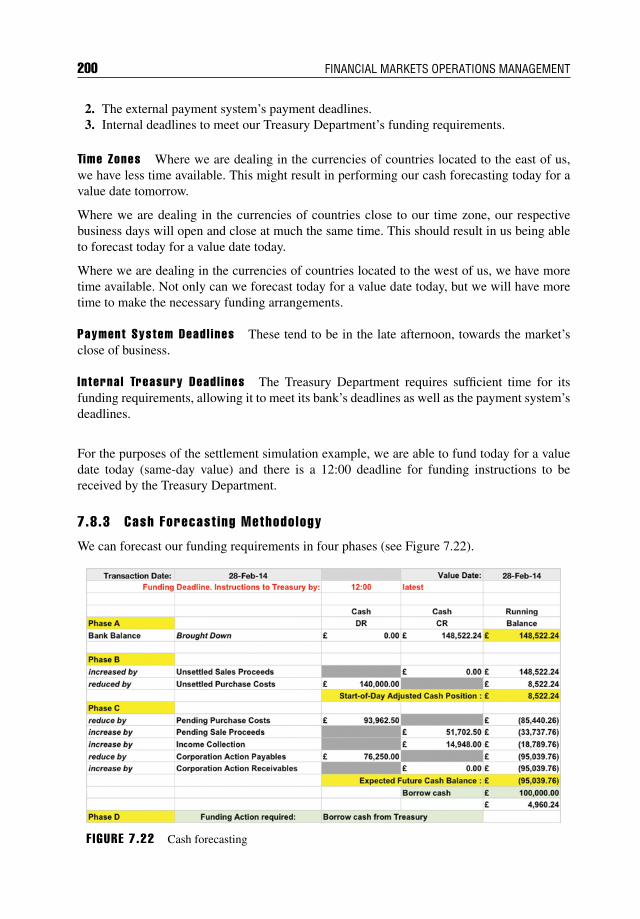
200 FINANCIAL MARKETS OPERATIONS MANAGEMENT
2. The external payment system’s payment deadlines.3. Internal deadlines to meet our Treasury Department’s funding requirements.
Time Zones Where we are dealing in the currencies of countries located to the east of us,we have less time available. This might result in performing our cash forecasting today for avalue date tomorrow.
Where we are dealing in the currencies of countries close to our time zone, our respectivebusiness days will open and close at much the same time. This should result in us being ableto forecast today for a value date today.
Where we are dealing in the currencies of countries located to the west of us, we have moretime available. Not only can we forecast today for a value date today, but we will have moretime to make the necessary funding arrangements.
Payment System Deadl ines These tend to be in the late afternoon, towards the market’sclose of business.
Internal Treasury Deadl ines The Treasury Department requires sufficient time for itsfunding requirements, allowing it to meet its bank’s deadlines as well as the payment system’sdeadlines.
For the purposes of the settlement simulation example, we are able to fund today for a valuedate today (same-day value) and there is a 12:00 deadline for funding instructions to bereceived by the Treasury Department.
7.8.3 Cash Forecast ing Methodology
We can forecast our funding requirements in four phases (see Figure 7.22).
F IGURE 7.22 Cash forecasting
Securities Clearing 201
Phase A: Bank Balance We have a balance on the bank account of GBP 148,522.24 andthis agrees with the dealer’s blotter. A cash reconciliation shows that there are payments and/orreceipts that were expected but not debited/credited.
Phase B: Unsett led I tems One or more purchases that should have settled have failed. Thecash total amounts to GBP 140,000.00. We therefore need to reduce the balance in Phase Aby this amount to leave us with a start-of-day adjusted position of GBP 8,522.24.
Phase C: Pending I tems These are the items that are due to be settled on the value date(i.e. 28 February 2014 – the intended settlement date for the six transactions executed on the25 February). We have also included other types of transaction such as income collectionand corporate actions receivable/payable. In reality, you consider all items that fall due on thevalue date.
The total of Phases B and C amounts to an expected future cash balance of GBP (95,039.76).In other words, if all the items were cleared, your account would be overdrawn and incurringinterest charges. Furthermore, if your credit limit were GBP 50,000.00, then some of thepayments might be blocked and not clear.
Phase D: Act ion Required You have an expected cash shortfall of GBP 95,039.76 and youcan cover this by borrowing from your Treasury Department. You could borrow the exactamount, but it might be preferable to borrow a “round amount” of, say, GBP 100,000.00. Asyour deadline for this transaction is 12:00, it would be a good idea to start preparing yourfunding requirements as early as possible.
7.8.4 Funding Uncerta int ies
You have now completed your cash funding for value date 28 February 2014. You are surethat Phases A and B are correct, but how certain can you be that the items in Phase C willactually settle as expected?
Q&A
Quest ion
What would be the impact if the sale(s) failed to settle?
Answer
With the non-receipt of GBP 51,702.50, your expected future cash balance would be adebit of GBP 146,742.26. As you have only borrowed GBP 100,000.00, you will stillbe approximately GBP 47,000 overdrawn.
202 FINANCIAL MARKETS OPERATIONS MANAGEMENT
The challenge is, wherever possible, to predict which items are unlikely to settle. For yourpurchases, you will have no forewarning that they are about to settle. However, for your sales,you are in control of your inventory and should know in advance what securities are availablefor delivery.
This challenge can be overcome by adopting one of two approaches:
1. Fund to settle.2. Fund to fail.
“Fund-to-Sett le” Approach This approach is subject to the following caveats:
1. That your sales will settle. This requires a high degree of confidence that you havesufficient inventory.
2. That your purchases might settle. As you cannot be sure, it is prudent to ensure that thereis sufficient cash available.
3. Where you know that payment has to be made on the value date, for example a corporateaction payable.
In conclusion, this is an optimistic approach.
“Fund-to-Fa i l” Approach This approach is subject to the following caveats:
1. That your sales will not (or probably will not) settle and that you will fund the proceedsonly on receipt.
2. That your purchases will not (or probably will not) settle and that you will fund the costsonly on the date payment is to be made. This particular approach may not leave youenough time to fund the position.
3. Where you suspect that payment will not be made to you on the value date, for example,a late dividend or coupon payment.
In conclusion, this is more of a pessimistic approach.
The reality is that the funding officer has to weigh up the chances that an item may or maynot settle as expected. Reference to internal records of historic settlement activity and, whereavailable, market information can help the funding officer be more accurate in anticipatingcash-funding requirements.
7.8.5 Benef i ts of Predict ive Forecast ing
The main object of predictive forecasting is to make sure that there is sufficient cash to coverall activities. Performed well, the cost of funding can be reduced; indeed, it is quite possibleto make a positive return, especially when interest rates are reasonably high. Errors in cashforecasting can be expensive and will add to the overall cost of providing an operational serviceto the Front Office. At worst, there is a reputational risk should counterparties become awareof funding issues in your organisation.

Securities Clearing 203
7.9 FORECASTING – SECURIT IES
7.9.1 Introduct ion
Q&A
Quest ions
Here are some questions regarding the selling of securities for you to think about:
1. Can you sell securities that you have previously purchased?2. Can you sell securities that you have previously purchased but not yet received?3. Can you deliver securities that you have purchased but not yet received?4. Can you sell securities you do not own?5. Can you deliver securities that you do not hold in custody?
Answers
Here are some answers:
1. Yes. You are free to sell any security that you legally own.2. Yes. In most markets, you can sell securities even though a previous purchase has
not settled. However, in some markets and with some retail investors, the brokermight insist that it receives the securities from the client before executing a sale.
3. No. Even though you are the legal owner, you are unable to deliver as you do nothave the securities “available for delivery”. In this case, you can only deliver oncethe purchase has settled.
4. It depends on the situation. For market participants (e.g. market makers), the answeris “yes”, as they sell in response to market situations. This often requires the marketmakers to sell securities they do not own, i.e. they sell “short”. On the other hand,institutional investors (except hedge funds) and retail investors are not permitted tosell short.
5. No. If your securities are not held in custody, they are not “available for delivery”.
These questions are posed to make the distinction between securities that you legally own(or not) and the availability of securities for delivery. Forecasting for securities is similar inconcept to cash forecasting (e.g. we are looking at one particular date – the settlement date).The main difference is that we are focusing on our sales rather than our total trading activities.
The situation is different regarding derivatives contracts. Market participants and investors canbuy “long” and sell “short”. Unlike securities, derivatives contracts cannot be delivered andreceived in the same way that equities, bonds, etc. are delivered. In fact, the only delivery wehave to worry about is when contracts are exercised into the underlying asset.

204 FINANCIAL MARKETS OPERATIONS MANAGEMENT
7.9.2 Securit ies that are Avai lab le for Del ivery
Please refer back to the settlement simulation and in particular to the following documents:
Dealer’s blotter (see Figure 7.9): This lists the securities that have been previously pur-chased.
Dealing sheet (see Figure 7.10): There are six transactions, two of which are sales.
Are you able to deliver the 2,500 HSBA shares and 15,000 MRW shares? According to thedealer’s blotter, there are sufficient securities (40,000 HSBA shares and 90,000 MRW shares);however, are they available for delivery (AFD)?
You reconcile both positions with the results shown in Table 7.8 and Table 7.9.
TABLE 7.8 Reconciliation of HSBA shares
HSBA Shares
Ownership Balance Balance Location
Trading book 40,000 −40,000 Custodian
Totals: 40,000 −40,000
TABLE 7.9 Reconciliation of MRW shares
MRW Shares
Ownership Balance Balance LocationTrading book 90,000 −90,000 Custodian
Totals: 90,000 −90,000
Both positions reconcile and, as the shares are located at the custodian, they are availablefor delivery. You can now be confident that if your delivery instructions are matched at theclearing house, you will settle both sales and receive the cash proceeds.
7.9.3 Securit ies that are Not Avai lab le for Del ivery
We can change the scenario by altering the location of both holdings. The reconciliations nowlook like those shown in Table 7.10 and Table 7.11.
TABLE 7.10 Reconciliation of HSBA shares – secondversion
HSBA Shares
Ownership Balance Balance Location
Trading book 40,000 −25,000 Custodian
−15,000 Counterparty 01
Totals: 40,000 −40,000
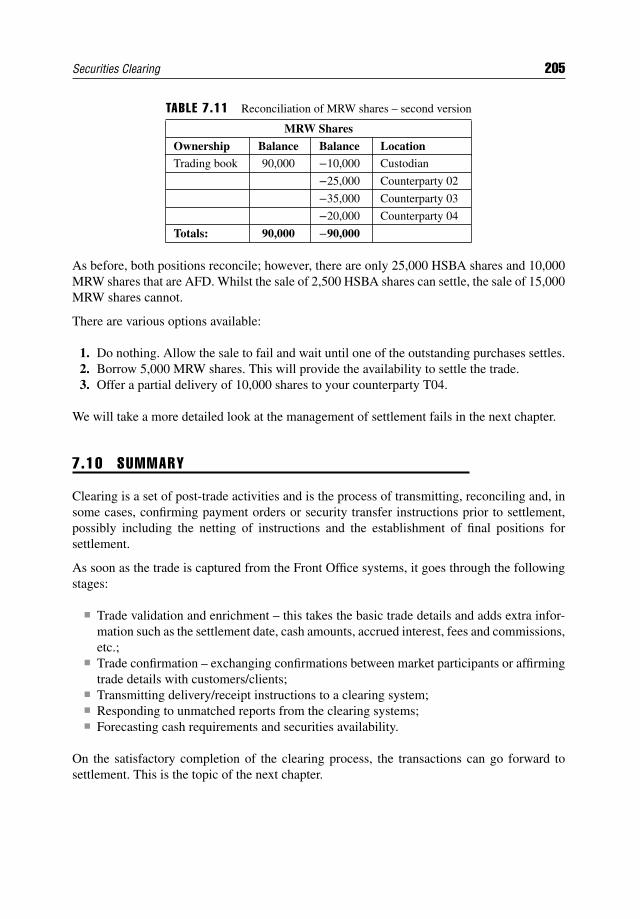
Securities Clearing 205
TABLE 7.11 Reconciliation of MRW shares – second version
MRW Shares
Ownership Balance Balance LocationTrading book 90,000 −10,000 Custodian
−25,000 Counterparty 02
−35,000 Counterparty 03
−20,000 Counterparty 04
Totals: 90,000 −90,000
As before, both positions reconcile; however, there are only 25,000 HSBA shares and 10,000MRW shares that are AFD. Whilst the sale of 2,500 HSBA shares can settle, the sale of 15,000MRW shares cannot.
There are various options available:
1. Do nothing. Allow the sale to fail and wait until one of the outstanding purchases settles.2. Borrow 5,000 MRW shares. This will provide the availability to settle the trade.3. Offer a partial delivery of 10,000 shares to your counterparty T04.
We will take a more detailed look at the management of settlement fails in the next chapter.
7.10 SUMMARY
Clearing is a set of post-trade activities and is the process of transmitting, reconciling and, insome cases, confirming payment orders or security transfer instructions prior to settlement,possibly including the netting of instructions and the establishment of final positions forsettlement.
As soon as the trade is captured from the Front Office systems, it goes through the followingstages:
Trade validation and enrichment – this takes the basic trade details and adds extra infor-mation such as the settlement date, cash amounts, accrued interest, fees and commissions,etc.;
Trade confirmation – exchanging confirmations between market participants or affirmingtrade details with customers/clients;
Transmitting delivery/receipt instructions to a clearing system; Responding to unmatched reports from the clearing systems; Forecasting cash requirements and securities availability.
On the satisfactory completion of the clearing process, the transactions can go forward tosettlement. This is the topic of the next chapter.

CHAPTER 8Settlement and Fails Management
8.1 INTRODUCTION
In the previous chapter we followed a typical transaction from the Front Office through toclearing. In this chapter we will cover the final phase in the transaction lifecycle, in which theliabilities of both the buyer and the seller are completed. We refer to this as settlement.
The term “settlement” can be defined as:
“The completion of a transaction, wherein the seller transfers delivery versus payment(DVP) securities or financial instruments to the buyer and the buyer transfers money tothe seller.”1
This definition is valid for securities and other cash market financial instruments, but whatabout derivatives? “Open” derivatives contracts can be open for months, if not years, andthe concept of settlement is only truly valid when derivatives contracts are exercised, i.e. ininstances where the underlying asset is delivered or received. You will recall from the previouschapter that open derivatives contracts are either margined (for open exchange-traded andcleared OTC derivatives transactions) or collateralised (for non-cleared OTC derivatives).
In this chapter you will learn about the following topics:
The different types of settlement; The concept of delivery versus payment and the three BIS DVP models; The locations in which settlement takes place; The reasons why transactions fail to settle; The ways in which settlement fails are managed.
1Source: BIS/Committee on Payment and Settlement Systems (March 2003) (online). “A glossaryof terms used in payments and settlement systems”. Available from www.bis.org/publ/cpss00b.pdf.[Accessed Monday, 10 March 2014]
207
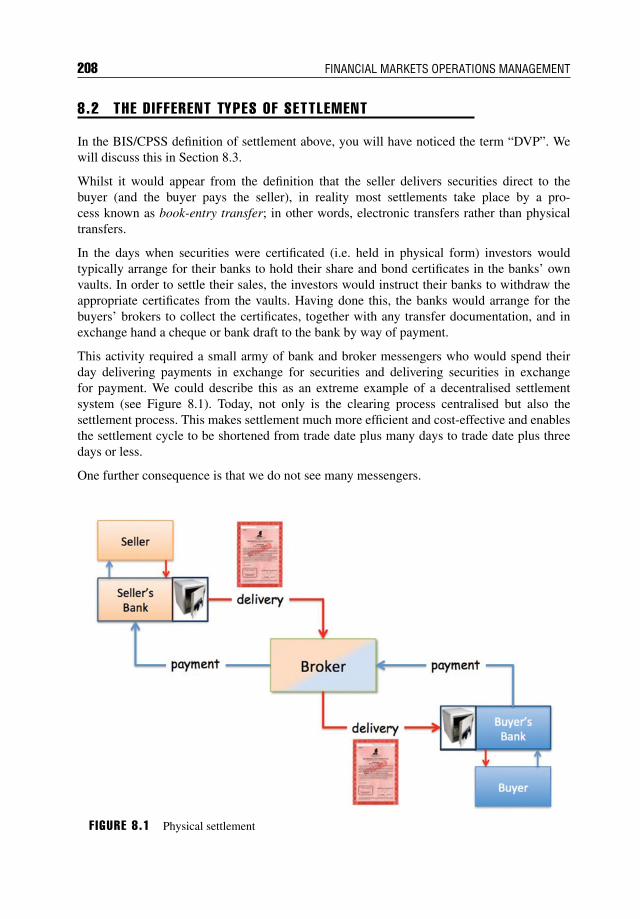
208 FINANCIAL MARKETS OPERATIONS MANAGEMENT
8.2 THE DIFFERENT TYPES OF SETTLEMENT
In the BIS/CPSS definition of settlement above, you will have noticed the term “DVP”. Wewill discuss this in Section 8.3.
Whilst it would appear from the definition that the seller delivers securities direct to thebuyer (and the buyer pays the seller), in reality most settlements take place by a pro-cess known as book-entry transfer; in other words, electronic transfers rather than physicaltransfers.
In the days when securities were certificated (i.e. held in physical form) investors wouldtypically arrange for their banks to hold their share and bond certificates in the banks’ ownvaults. In order to settle their sales, the investors would instruct their banks to withdraw theappropriate certificates from the vaults. Having done this, the banks would arrange for thebuyers’ brokers to collect the certificates, together with any transfer documentation, and inexchange hand a cheque or bank draft to the bank by way of payment.
This activity required a small army of bank and broker messengers who would spend theirday delivering payments in exchange for securities and delivering securities in exchangefor payment. We could describe this as an extreme example of a decentralised settlementsystem (see Figure 8.1). Today, not only is the clearing process centralised but also thesettlement process. This makes settlement much more efficient and cost-effective and enablesthe settlement cycle to be shortened from trade date plus many days to trade date plus threedays or less.
One further consequence is that we do not see many messengers.
F IGURE 8.1 Physical settlement
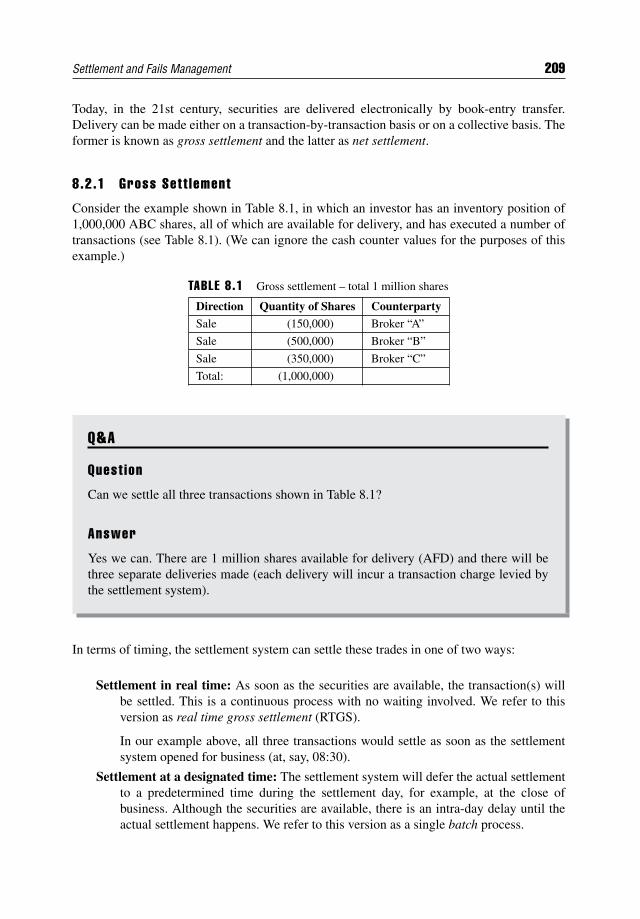
Settlement and Fails Management 209
Today, in the 21st century, securities are delivered electronically by book-entry transfer.Delivery can be made either on a transaction-by-transaction basis or on a collective basis. Theformer is known as gross settlement and the latter as net settlement.
8.2.1 Gross Sett lement
Consider the example shown in Table 8.1, in which an investor has an inventory position of1,000,000 ABC shares, all of which are available for delivery, and has executed a number oftransactions (see Table 8.1). (We can ignore the cash counter values for the purposes of thisexample.)
TABLE 8.1 Gross settlement – total 1 million shares
Direction Quantity of Shares Counterparty
Sale (150,000) Broker “A”
Sale (500,000) Broker “B”
Sale (350,000) Broker “C”
Total: (1,000,000)
Q&A
Quest ion
Can we settle all three transactions shown in Table 8.1?
Answer
Yes we can. There are 1 million shares available for delivery (AFD) and there will bethree separate deliveries made (each delivery will incur a transaction charge levied bythe settlement system).
In terms of timing, the settlement system can settle these trades in one of two ways:
Settlement in real time: As soon as the securities are available, the transaction(s) willbe settled. This is a continuous process with no waiting involved. We refer to thisversion as real time gross settlement (RTGS).
In our example above, all three transactions would settle as soon as the settlementsystem opened for business (at, say, 08:30).
Settlement at a designated time: The settlement system will defer the actual settlementto a predetermined time during the settlement day, for example, at the close ofbusiness. Although the securities are available, there is an intra-day delay until theactual settlement happens. We refer to this version as a single batch process.
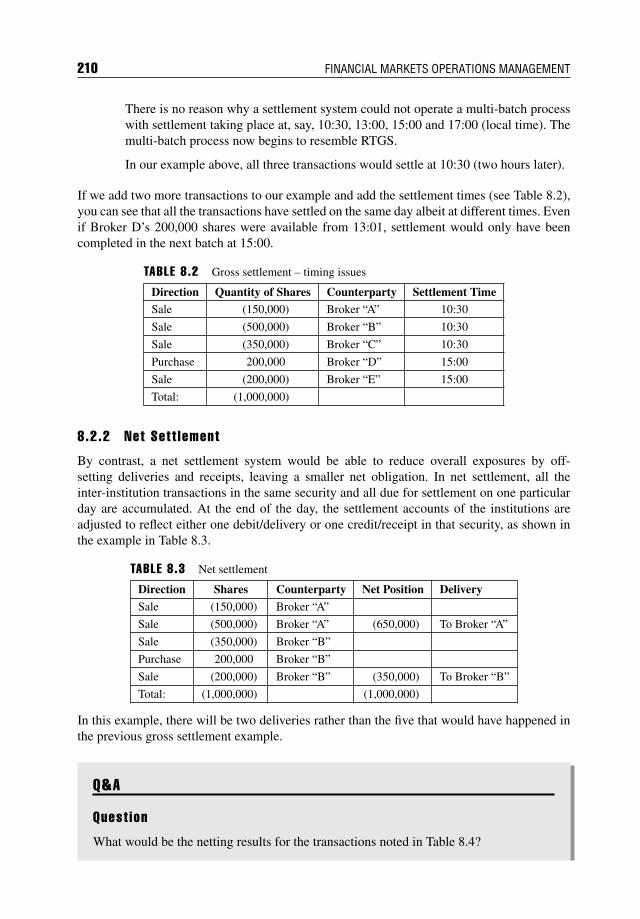
210 FINANCIAL MARKETS OPERATIONS MANAGEMENT
There is no reason why a settlement system could not operate a multi-batch processwith settlement taking place at, say, 10:30, 13:00, 15:00 and 17:00 (local time). Themulti-batch process now begins to resemble RTGS.
In our example above, all three transactions would settle at 10:30 (two hours later).
If we add two more transactions to our example and add the settlement times (see Table 8.2),you can see that all the transactions have settled on the same day albeit at different times. Evenif Broker D’s 200,000 shares were available from 13:01, settlement would only have beencompleted in the next batch at 15:00.
TABLE 8.2 Gross settlement – timing issues
Direction Quantity of Shares Counterparty Settlement TimeSale (150,000) Broker “A” 10:30
Sale (500,000) Broker “B” 10:30
Sale (350,000) Broker “C” 10:30
Purchase 200,000 Broker “D” 15:00
Sale (200,000) Broker “E” 15:00
Total: (1,000,000)
8.2.2 Net Sett lement
By contrast, a net settlement system would be able to reduce overall exposures by off-setting deliveries and receipts, leaving a smaller net obligation. In net settlement, all theinter-institution transactions in the same security and all due for settlement on one particularday are accumulated. At the end of the day, the settlement accounts of the institutions areadjusted to reflect either one debit/delivery or one credit/receipt in that security, as shown inthe example in Table 8.3.
TABLE 8.3 Net settlement
Direction Shares Counterparty Net Position Delivery
Sale (150,000) Broker “A”
Sale (500,000) Broker “A” (650,000) To Broker “A”
Sale (350,000) Broker “B”
Purchase 200,000 Broker “B”
Sale (200,000) Broker “B” (350,000) To Broker “B”
Total: (1,000,000) (1,000,000)
In this example, there will be two deliveries rather than the five that would have happened inthe previous gross settlement example.
Q&A
Quest ion
What would be the netting results for the transactions noted in Table 8.4?
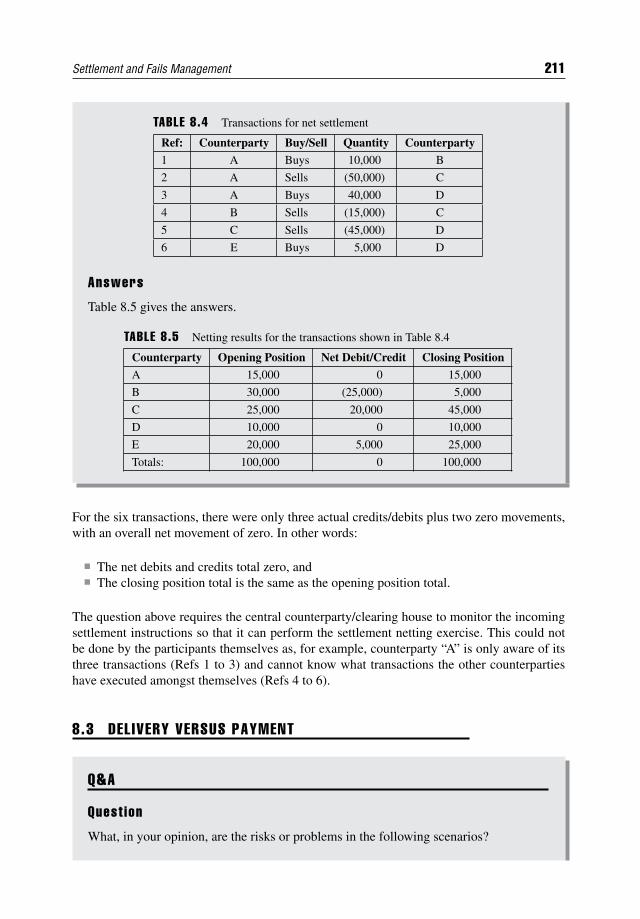
Settlement and Fails Management 211
TABLE 8.4 Transactions for net settlement
Ref: Counterparty Buy/Sell Quantity Counterparty
1 A Buys 10,000 B
2 A Sells (50,000) C
3 A Buys 40,000 D
4 B Sells (15,000) C
5 C Sells (45,000) D
6 E Buys 5,000 D
Answers
Table 8.5 gives the answers.
TABLE 8.5 Netting results for the transactions shown in Table 8.4
Counterparty Opening Position Net Debit/Credit Closing Position
A 15,000 0 15,000
B 30,000 (25,000) 5,000
C 25,000 20,000 45,000
D 10,000 0 10,000
E 20,000 5,000 25,000
Totals: 100,000 0 100,000
For the six transactions, there were only three actual credits/debits plus two zero movements,with an overall net movement of zero. In other words:
The net debits and credits total zero, and The closing position total is the same as the opening position total.
The question above requires the central counterparty/clearing house to monitor the incomingsettlement instructions so that it can perform the settlement netting exercise. This could notbe done by the participants themselves as, for example, counterparty “A” is only aware of itsthree transactions (Refs 1 to 3) and cannot know what transactions the other counterpartieshave executed amongst themselves (Refs 4 to 6).
8.3 DEL IVERY VERSUS PAYMENT
Q&A
Quest ion
What, in your opinion, are the risks or problems in the following scenarios?
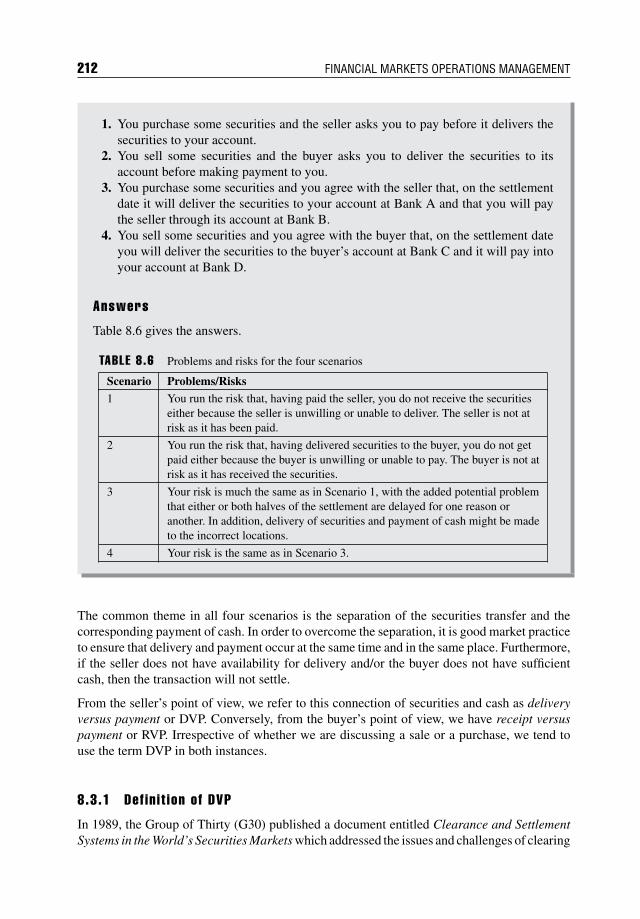
212 FINANCIAL MARKETS OPERATIONS MANAGEMENT
1. You purchase some securities and the seller asks you to pay before it delivers thesecurities to your account.
2. You sell some securities and the buyer asks you to deliver the securities to itsaccount before making payment to you.
3. You purchase some securities and you agree with the seller that, on the settlementdate it will deliver the securities to your account at Bank A and that you will paythe seller through its account at Bank B.
4. You sell some securities and you agree with the buyer that, on the settlement dateyou will deliver the securities to the buyer’s account at Bank C and it will pay intoyour account at Bank D.
Answers
Table 8.6 gives the answers.
TABLE 8.6 Problems and risks for the four scenarios
Scenario Problems/Risks
1 You run the risk that, having paid the seller, you do not receive the securitieseither because the seller is unwilling or unable to deliver. The seller is not atrisk as it has been paid.
2 You run the risk that, having delivered securities to the buyer, you do not getpaid either because the buyer is unwilling or unable to pay. The buyer is not atrisk as it has received the securities.
3 Your risk is much the same as in Scenario 1, with the added potential problemthat either or both halves of the settlement are delayed for one reason oranother. In addition, delivery of securities and payment of cash might be madeto the incorrect locations.
4 Your risk is the same as in Scenario 3.
The common theme in all four scenarios is the separation of the securities transfer and thecorresponding payment of cash. In order to overcome the separation, it is good market practiceto ensure that delivery and payment occur at the same time and in the same place. Furthermore,if the seller does not have availability for delivery and/or the buyer does not have sufficientcash, then the transaction will not settle.
From the seller’s point of view, we refer to this connection of securities and cash as deliveryversus payment or DVP. Conversely, from the buyer’s point of view, we have receipt versuspayment or RVP. Irrespective of whether we are discussing a sale or a purchase, we tend touse the term DVP in both instances.
8.3.1 Def in i t ion of DVP
In 1989, the Group of Thirty (G30) published a document entitled Clearance and SettlementSystems in the World’s Securities Markets which addressed the issues and challenges of clearing
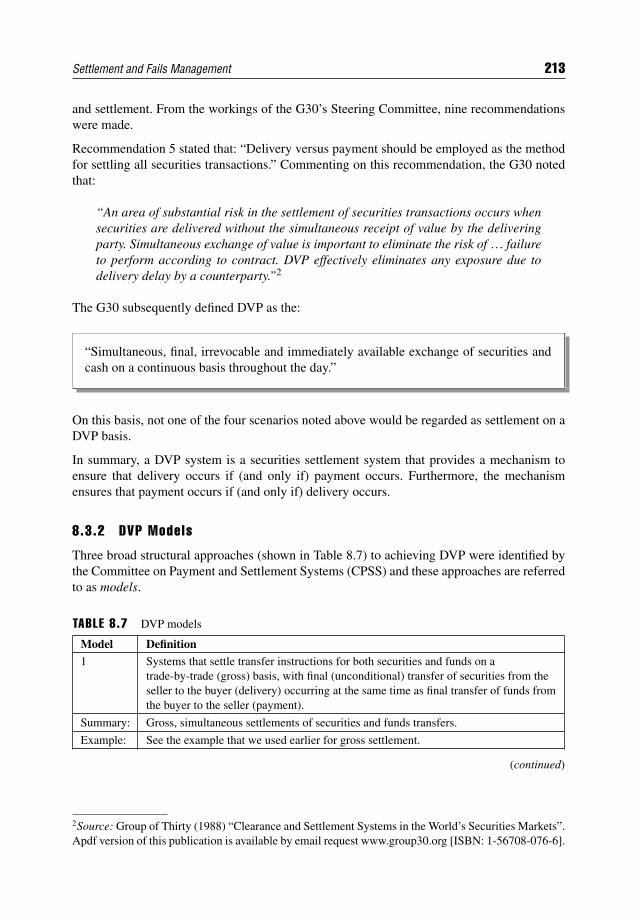
Settlement and Fails Management 213
and settlement. From the workings of the G30’s Steering Committee, nine recommendationswere made.
Recommendation 5 stated that: “Delivery versus payment should be employed as the methodfor settling all securities transactions.” Commenting on this recommendation, the G30 notedthat:
“An area of substantial risk in the settlement of securities transactions occurs whensecurities are delivered without the simultaneous receipt of value by the deliveringparty. Simultaneous exchange of value is important to eliminate the risk of … failureto perform according to contract. DVP effectively eliminates any exposure due todelivery delay by a counterparty.”2
The G30 subsequently defined DVP as the:
“Simultaneous, final, irrevocable and immediately available exchange of securities andcash on a continuous basis throughout the day.”
On this basis, not one of the four scenarios noted above would be regarded as settlement on aDVP basis.
In summary, a DVP system is a securities settlement system that provides a mechanism toensure that delivery occurs if (and only if) payment occurs. Furthermore, the mechanismensures that payment occurs if (and only if) delivery occurs.
8.3.2 DVP Models
Three broad structural approaches (shown in Table 8.7) to achieving DVP were identified bythe Committee on Payment and Settlement Systems (CPSS) and these approaches are referredto as models.
TABLE 8.7 DVP models
Model Definition1 Systems that settle transfer instructions for both securities and funds on a
trade-by-trade (gross) basis, with final (unconditional) transfer of securities from theseller to the buyer (delivery) occurring at the same time as final transfer of funds fromthe buyer to the seller (payment).
Summary: Gross, simultaneous settlements of securities and funds transfers.
Example: See the example that we used earlier for gross settlement.
(continued)
2Source: Group of Thirty (1988) “Clearance and Settlement Systems in the World’s Securities Markets”.Apdf version of this publication is available by email request www.group30.org [ISBN: 1-56708-076-6].
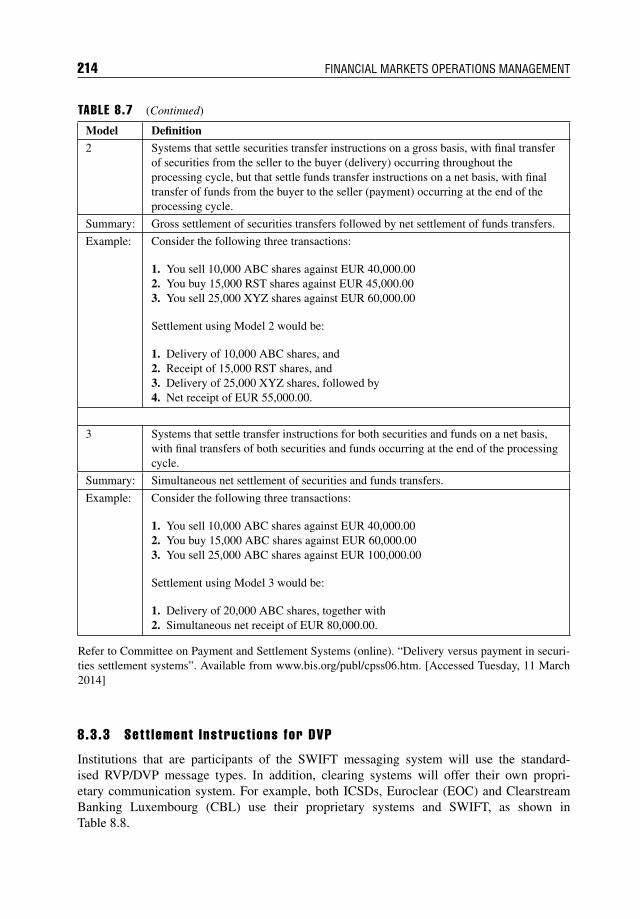
214 FINANCIAL MARKETS OPERATIONS MANAGEMENT
TABLE 8.7 (Continued)
Model Definition
2 Systems that settle securities transfer instructions on a gross basis, with final transferof securities from the seller to the buyer (delivery) occurring throughout theprocessing cycle, but that settle funds transfer instructions on a net basis, with finaltransfer of funds from the buyer to the seller (payment) occurring at the end of theprocessing cycle.
Summary: Gross settlement of securities transfers followed by net settlement of funds transfers.
Example: Consider the following three transactions:
1. You sell 10,000 ABC shares against EUR 40,000.002. You buy 15,000 RST shares against EUR 45,000.003. You sell 25,000 XYZ shares against EUR 60,000.00
Settlement using Model 2 would be:
1. Delivery of 10,000 ABC shares, and2. Receipt of 15,000 RST shares, and3. Delivery of 25,000 XYZ shares, followed by4. Net receipt of EUR 55,000.00.
3 Systems that settle transfer instructions for both securities and funds on a net basis,with final transfers of both securities and funds occurring at the end of the processingcycle.
Summary: Simultaneous net settlement of securities and funds transfers.
Example: Consider the following three transactions:
1. You sell 10,000 ABC shares against EUR 40,000.002. You buy 15,000 ABC shares against EUR 60,000.003. You sell 25,000 ABC shares against EUR 100,000.00
Settlement using Model 3 would be:
1. Delivery of 20,000 ABC shares, together with2. Simultaneous net receipt of EUR 80,000.00.
Refer to Committee on Payment and Settlement Systems (online). “Delivery versus payment in securi-ties settlement systems”. Available from www.bis.org/publ/cpss06.htm. [Accessed Tuesday, 11 March2014]
8.3.3 Sett lement Instruct ions for DVP
Institutions that are participants of the SWIFT messaging system will use the standard-ised RVP/DVP message types. In addition, clearing systems will offer their own propri-etary communication system. For example, both ICSDs, Euroclear (EOC) and ClearstreamBanking Luxembourg (CBL) use their proprietary systems and SWIFT, as shown inTable 8.8.
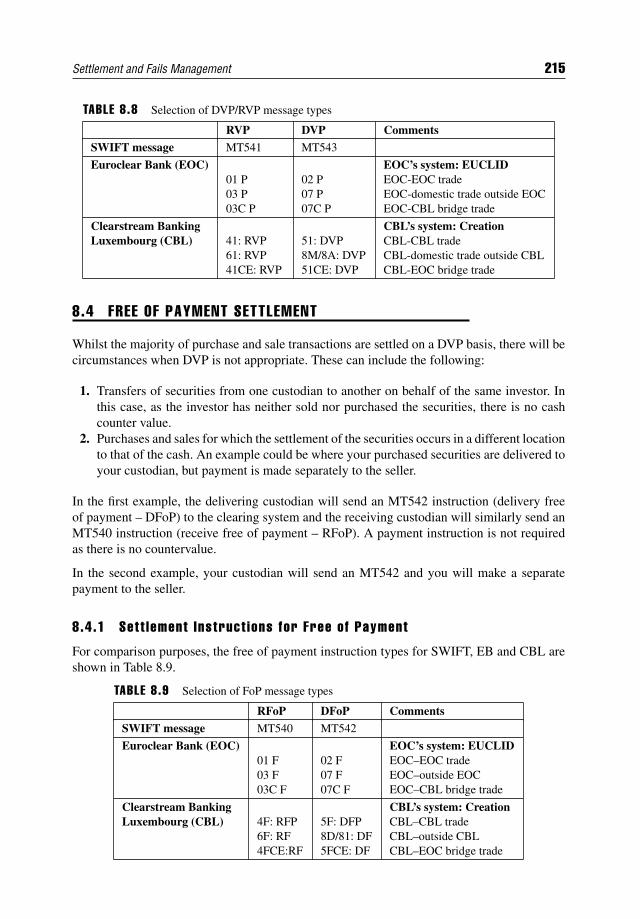
Settlement and Fails Management 215
TABLE 8.8 Selection of DVP/RVP message types
RVP DVP Comments
SWIFT message MT541 MT543
Euroclear Bank (EOC)01 P03 P03C P
02 P07 P07C P
EOC’s system: EUCLIDEOC-EOC tradeEOC-domestic trade outside EOCEOC-CBL bridge trade
Clearstream BankingLuxembourg (CBL) 41: RVP
61: RVP41CE: RVP
51: DVP8M/8A: DVP51CE: DVP
CBL’s system: CreationCBL-CBL tradeCBL-domestic trade outside CBLCBL-EOC bridge trade
8.4 FREE OF PAYMENT SETTLEMENT
Whilst the majority of purchase and sale transactions are settled on a DVP basis, there will becircumstances when DVP is not appropriate. These can include the following:
1. Transfers of securities from one custodian to another on behalf of the same investor. Inthis case, as the investor has neither sold nor purchased the securities, there is no cashcounter value.
2. Purchases and sales for which the settlement of the securities occurs in a different locationto that of the cash. An example could be where your purchased securities are delivered toyour custodian, but payment is made separately to the seller.
In the first example, the delivering custodian will send an MT542 instruction (delivery freeof payment – DFoP) to the clearing system and the receiving custodian will similarly send anMT540 instruction (receive free of payment – RFoP). A payment instruction is not requiredas there is no countervalue.
In the second example, your custodian will send an MT542 and you will make a separatepayment to the seller.
8.4.1 Sett lement Instruct ions for Free of Payment
For comparison purposes, the free of payment instruction types for SWIFT, EB and CBL areshown in Table 8.9.
TABLE 8.9 Selection of FoP message types
RFoP DFoP Comments
SWIFT message MT540 MT542
Euroclear Bank (EOC)01 F03 F03C F
02 F07 F07C F
EOC’s system: EUCLIDEOC–EOC tradeEOC–outside EOCEOC–CBL bridge trade
Clearstream BankingLuxembourg (CBL) 4F: RFP
6F: RF4FCE:RF
5F: DFP8D/81: DF5FCE: DF
CBL’s system: CreationCBL–CBL tradeCBL–outside CBLCBL–EOC bridge trade
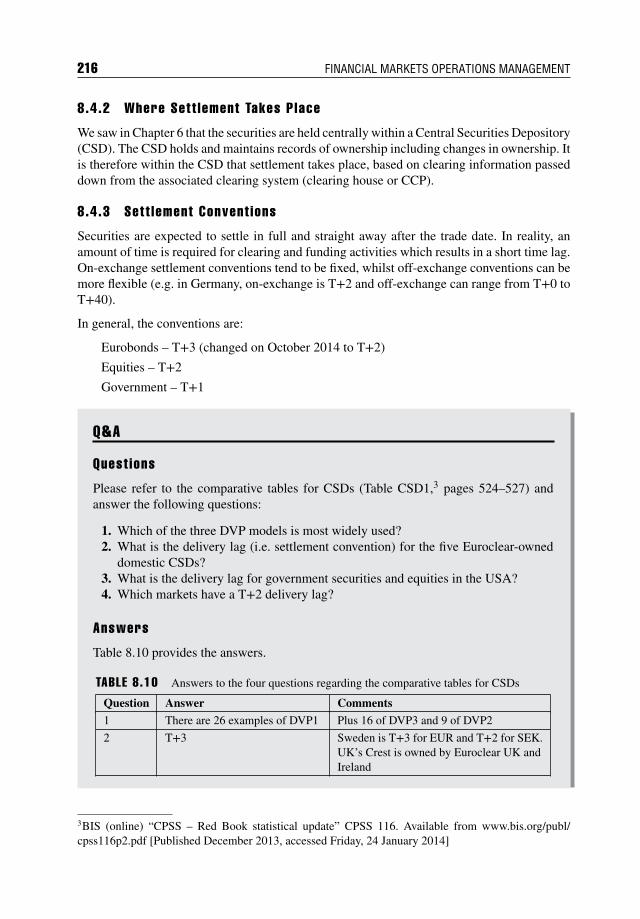
216 FINANCIAL MARKETS OPERATIONS MANAGEMENT
8.4.2 Where Sett lement Takes Place
We saw in Chapter 6 that the securities are held centrally within a Central Securities Depository(CSD). The CSD holds and maintains records of ownership including changes in ownership. Itis therefore within the CSD that settlement takes place, based on clearing information passeddown from the associated clearing system (clearing house or CCP).
8.4.3 Sett lement Convent ions
Securities are expected to settle in full and straight away after the trade date. In reality, anamount of time is required for clearing and funding activities which results in a short time lag.On-exchange settlement conventions tend to be fixed, whilst off-exchange conventions can bemore flexible (e.g. in Germany, on-exchange is T+2 and off-exchange can range from T+0 toT+40).
In general, the conventions are:
Eurobonds – T+3 (changed on October 2014 to T+2)
Equities – T+2
Government – T+1
Q&A
Quest ions
Please refer to the comparative tables for CSDs (Table CSD1,3 pages 524–527) andanswer the following questions:
1. Which of the three DVP models is most widely used?2. What is the delivery lag (i.e. settlement convention) for the five Euroclear-owned
domestic CSDs?3. What is the delivery lag for government securities and equities in the USA?4. Which markets have a T+2 delivery lag?
Answers
Table 8.10 provides the answers.
TABLE 8.10 Answers to the four questions regarding the comparative tables for CSDs
Question Answer Comments
1 There are 26 examples of DVP1 Plus 16 of DVP3 and 9 of DVP2
2 T+3 Sweden is T+3 for EUR and T+2 for SEK.UK’s Crest is owned by Euroclear UK andIreland
3BIS (online) “CPSS – Red Book statistical update” CPSS 116. Available from www.bis.org/publ/cpss116p2.pdf [Published December 2013, accessed Friday, 24 January 2014]

Settlement and Fails Management 217
TABLE 8.10 (Continued)
Question Answer Comments
3 Government securities (NBES) T+1Equities (DTC) T+3
Both can also settle on T+0
4 BelgiumCanadaGermanyHong KongIndiaJapanKoreaSaudi ArabiaSwedenTurkey
(NBB)(CDS)(CBF)(CCASS and CMU)(NSDL and CDSL)(JASDEC – DVP3 model)(KSD for equities traded on-exchange)(For bonds)(SEK)(Takasbank and MKK)
8.5 SETTLEMENT FAILS
8.5.1 Overview of Sett lement Fa i lure
Logically, there is no reason why transactions should fail, especially in an era when securitiesare generally:
Fungible; Deeply liquid; Held centrally within a CSD/ICSD environment; Easily and electronically transferable.
However, in the pre-settlement, clearing phase of a transaction, any unmatched transactionswill not and cannot settle. In addition, taking the four bullet points in turn, there can beexceptions, such as:
It is possible to hold bearer securities in non-fungible form. This can slow the deliveryprocess as specific certificates need to be identified before delivery can occur.
Many markets insist on minimum amounts of issued securities to be made available. Thishelps to reduce the risk of illiquidity on any one issue of securities. A problem ariseswhen securities are sold to investors who either are unable or unwilling to make theirpositions available for securities lending purposes. This reduces the liquidity.
Centrally-held securities have been a long-held objective for the market; however, it ispossible in some markets for securities to be held outside the CSD/ICSD infrastructure(e.g. physical certificates held by investors themselves).
We will discuss how securities are held in Chapter 10 and we will see that some securitiesstill require re-registration of ownership either before settlement can occur or at sometime shortly afterwards.
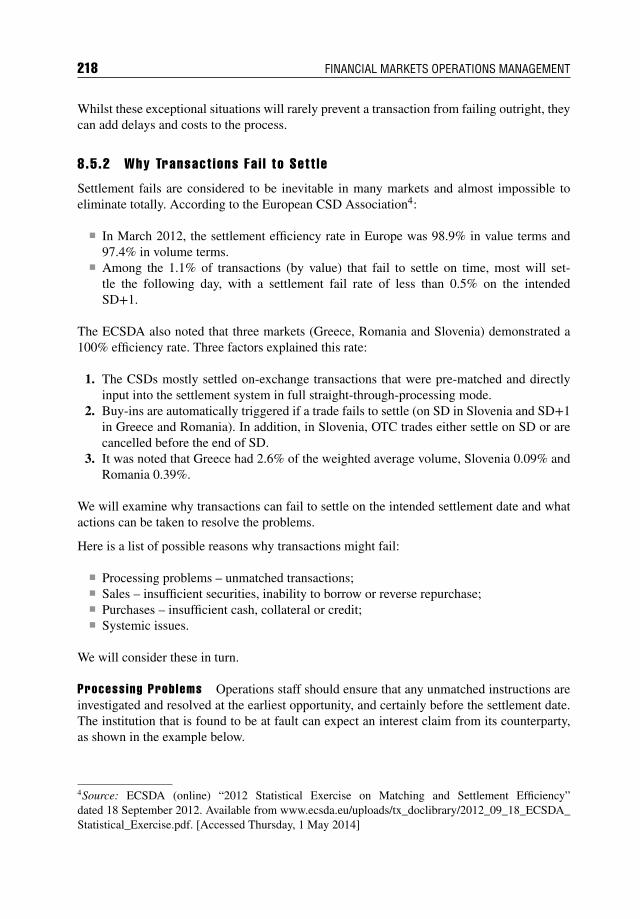
218 FINANCIAL MARKETS OPERATIONS MANAGEMENT
Whilst these exceptional situations will rarely prevent a transaction from failing outright, theycan add delays and costs to the process.
8.5.2 Why Transact ions Fai l to Sett le
Settlement fails are considered to be inevitable in many markets and almost impossible toeliminate totally. According to the European CSD Association4:
In March 2012, the settlement efficiency rate in Europe was 98.9% in value terms and97.4% in volume terms.
Among the 1.1% of transactions (by value) that fail to settle on time, most will set-tle the following day, with a settlement fail rate of less than 0.5% on the intendedSD+1.
The ECSDA also noted that three markets (Greece, Romania and Slovenia) demonstrated a100% efficiency rate. Three factors explained this rate:
1. The CSDs mostly settled on-exchange transactions that were pre-matched and directlyinput into the settlement system in full straight-through-processing mode.
2. Buy-ins are automatically triggered if a trade fails to settle (on SD in Slovenia and SD+1in Greece and Romania). In addition, in Slovenia, OTC trades either settle on SD or arecancelled before the end of SD.
3. It was noted that Greece had 2.6% of the weighted average volume, Slovenia 0.09% andRomania 0.39%.
We will examine why transactions can fail to settle on the intended settlement date and whatactions can be taken to resolve the problems.
Here is a list of possible reasons why transactions might fail:
Processing problems – unmatched transactions; Sales – insufficient securities, inability to borrow or reverse repurchase; Purchases – insufficient cash, collateral or credit; Systemic issues.
We will consider these in turn.
Processing Problems Operations staff should ensure that any unmatched instructions areinvestigated and resolved at the earliest opportunity, and certainly before the settlement date.The institution that is found to be at fault can expect an interest claim from its counterparty,as shown in the example below.
4Source: ECSDA (online) “2012 Statistical Exercise on Matching and Settlement Efficiency”dated 18 September 2012. Available from www.ecsda.eu/uploads/tx_doclibrary/2012_09_18_ECSDA_Statistical_Exercise.pdf. [Accessed Thursday, 1 May 2014]
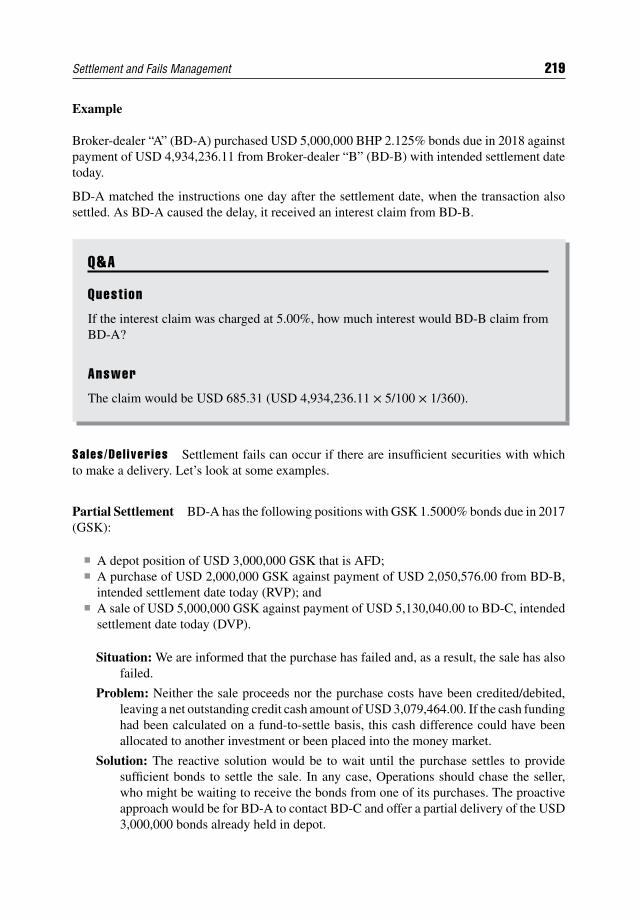
Settlement and Fails Management 219
Example
Broker-dealer “A” (BD-A) purchased USD 5,000,000 BHP 2.125% bonds due in 2018 againstpayment of USD 4,934,236.11 from Broker-dealer “B” (BD-B) with intended settlement datetoday.
BD-A matched the instructions one day after the settlement date, when the transaction alsosettled. As BD-A caused the delay, it received an interest claim from BD-B.
Q&A
Quest ion
If the interest claim was charged at 5.00%, how much interest would BD-B claim fromBD-A?
Answer
The claim would be USD 685.31 (USD 4,934,236.11 × 5/100 × 1/360).
Sales/Del iveries Settlement fails can occur if there are insufficient securities with whichto make a delivery. Let’s look at some examples.
Partial Settlement BD-A has the following positions with GSK 1.5000% bonds due in 2017(GSK):
A depot position of USD 3,000,000 GSK that is AFD; A purchase of USD 2,000,000 GSK against payment of USD 2,050,576.00 from BD-B,
intended settlement date today (RVP); and A sale of USD 5,000,000 GSK against payment of USD 5,130,040.00 to BD-C, intended
settlement date today (DVP).
Situation: We are informed that the purchase has failed and, as a result, the sale has alsofailed.
Problem: Neither the sale proceeds nor the purchase costs have been credited/debited,leaving a net outstanding credit cash amount of USD 3,079,464.00. If the cash fundinghad been calculated on a fund-to-settle basis, this cash difference could have beenallocated to another investment or been placed into the money market.
Solution: The reactive solution would be to wait until the purchase settles to providesufficient bonds to settle the sale. In any case, Operations should chase the seller,who might be waiting to receive the bonds from one of its purchases. The proactiveapproach would be for BD-A to contact BD-C and offer a partial delivery of the USD3,000,000 bonds already held in depot.
220 FINANCIAL MARKETS OPERATIONS MANAGEMENT
BD-C is under no obligation to agree to this, but might do so if they require thebonds for another delivery and/or wish to maintain a good working relationship withBD-A.
Actions required: Assuming BD-C agrees to accept a partial delivery, the followingactions should take place: Both counterparties cancel the original instructions for USD 5,000,000 GSK. Both counterparties agree with the new amounts and then input instructions for
new, re-shaped instructions: USD 3,000,000 GSK vs USD 3,078,024.00 cash, and USD 2,000,000 GSK vs USD 2,052,016.00 cash.
Both sets of re-shaped instructions will be matched. The USD 3,000,000 shape will settle, leaving the balance of USD 2,000,000
outstanding. There should be a full audit trail which tracks the re-shaping of the original
USD 5,000,000 transaction into the two re-shapes (this helps the accounts andreconciliation functions to identify the new cash debit and credit amounts to betracked).
It is quite possible for there to be more than one partial delivery, in which case the samere-shaping exercise must be completed. For example, BD-B might offer, say, USD 1,000,000of the balance of USD 2,000,000 GSK to BD-A.
If BD-C does not agree to a partial delivery, BD-A might be able to borrow or “reverse repo”USD 2,000,000 GSK, for a fee, and fully settle the sale of USD 5,000,000 GSK bonds. Wecover the topic of securities lending and borrowing and repo/reverse repo in Chapter 12:Securities Financing.
Bilateral Netting BD-A has the following positions with EDF 4.6000% Bonds due 2020(EDF):
A zero depot position of EDF; A purchase of USD 5,000,000 EDF against payment of USD 5,605,350.00 from BD-B,
intended settlement date today (RVP); and A sale of USD 5,000,000 EDF against payment of USD 5,615,350.00 to BD-B, intended
settlement date today (DVP).
Situation: We are informed that the purchase has failed and, as a result, the sale has alsofailed.
Problem: Neither the sale proceeds nor the purchase costs have been credited/debited,leaving a net outstanding credit cash amount of USD 10,000.00. This situation is notas serious as in the example regarding partial settlement above.
Solution: The reactive solution would be to wait until the purchase settles to providesufficient bonds to settle the sale. In any case, Operations should chase the seller,who might be waiting to receive the bonds from one of its purchases. The proactiveapproach would be for BD-A and BD-B to agree to net out the bond positions andcash amounts.
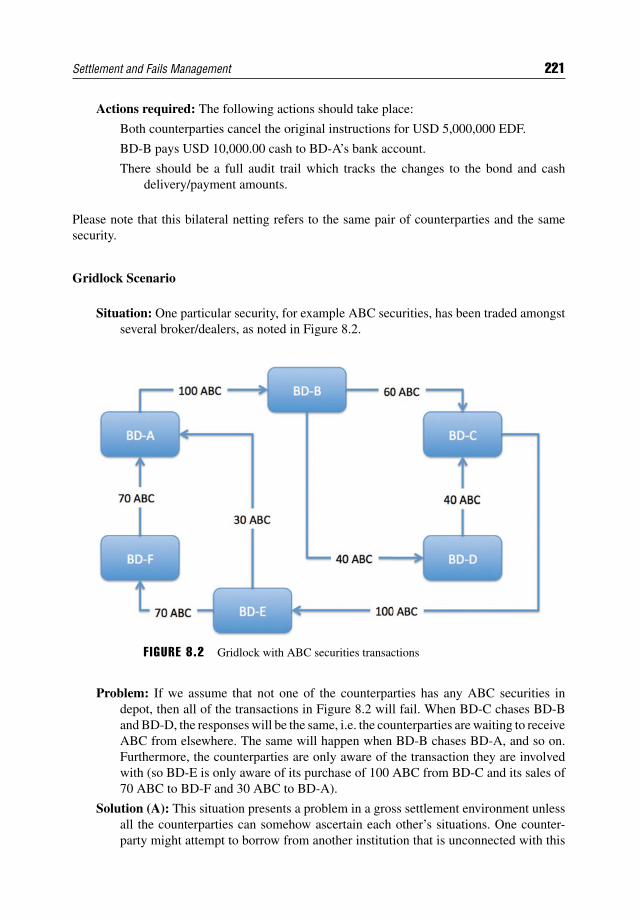
Settlement and Fails Management 221
Actions required: The following actions should take place:
Both counterparties cancel the original instructions for USD 5,000,000 EDF.
BD-B pays USD 10,000.00 cash to BD-A’s bank account.
There should be a full audit trail which tracks the changes to the bond and cashdelivery/payment amounts.
Please note that this bilateral netting refers to the same pair of counterparties and the samesecurity.
Gridlock Scenario
Situation: One particular security, for example ABC securities, has been traded amongstseveral broker/dealers, as noted in Figure 8.2.
F IGURE 8.2 Gridlock with ABC securities transactions
Problem: If we assume that not one of the counterparties has any ABC securities indepot, then all of the transactions in Figure 8.2 will fail. When BD-C chases BD-Band BD-D, the responses will be the same, i.e. the counterparties are waiting to receiveABC from elsewhere. The same will happen when BD-B chases BD-A, and so on.Furthermore, the counterparties are only aware of the transaction they are involvedwith (so BD-E is only aware of its purchase of 100 ABC from BD-C and its sales of70 ABC to BD-F and 30 ABC to BD-A).
Solution (A): This situation presents a problem in a gross settlement environment unlessall the counterparties can somehow ascertain each other’s situations. One counter-party might attempt to borrow from another institution that is unconnected with this
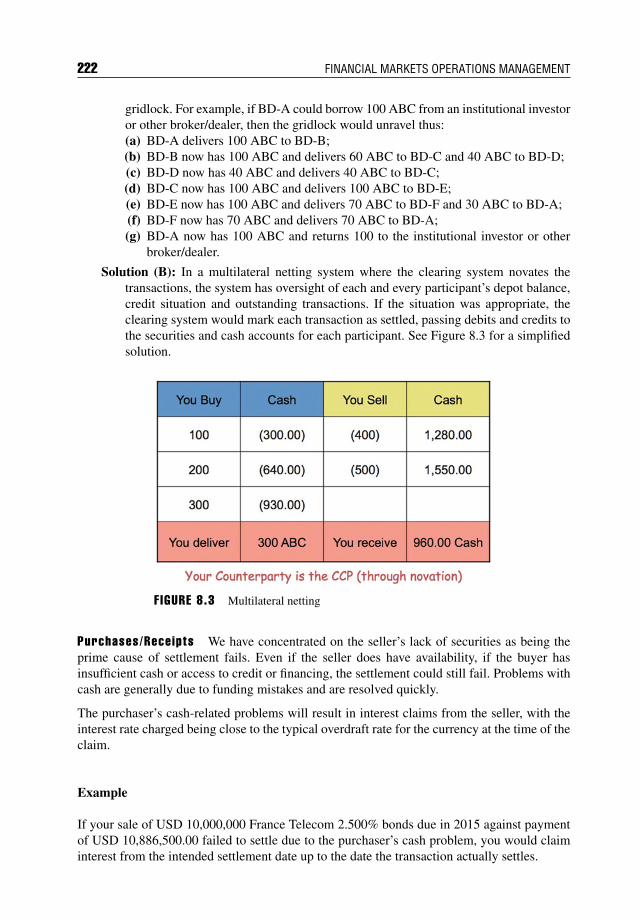
222 FINANCIAL MARKETS OPERATIONS MANAGEMENT
gridlock. For example, if BD-A could borrow 100 ABC from an institutional investoror other broker/dealer, then the gridlock would unravel thus:(a) BD-A delivers 100 ABC to BD-B;(b) BD-B now has 100 ABC and delivers 60 ABC to BD-C and 40 ABC to BD-D;(c) BD-D now has 40 ABC and delivers 40 ABC to BD-C;(d) BD-C now has 100 ABC and delivers 100 ABC to BD-E;(e) BD-E now has 100 ABC and delivers 70 ABC to BD-F and 30 ABC to BD-A;(f) BD-F now has 70 ABC and delivers 70 ABC to BD-A;(g) BD-A now has 100 ABC and returns 100 to the institutional investor or other
broker/dealer.
Solution (B): In a multilateral netting system where the clearing system novates thetransactions, the system has oversight of each and every participant’s depot balance,credit situation and outstanding transactions. If the situation was appropriate, theclearing system would mark each transaction as settled, passing debits and credits tothe securities and cash accounts for each participant. See Figure 8.3 for a simplifiedsolution.
F IGURE 8.3 Multilateral netting
Purchases/Receipts We have concentrated on the seller’s lack of securities as being theprime cause of settlement fails. Even if the seller does have availability, if the buyer hasinsufficient cash or access to credit or financing, the settlement could still fail. Problems withcash are generally due to funding mistakes and are resolved quickly.
The purchaser’s cash-related problems will result in interest claims from the seller, with theinterest rate charged being close to the typical overdraft rate for the currency at the time of theclaim.
Example
If your sale of USD 10,000,000 France Telecom 2.500% bonds due in 2015 against paymentof USD 10,886,500.00 failed to settle due to the purchaser’s cash problem, you would claiminterest from the intended settlement date up to the date the transaction actually settles.
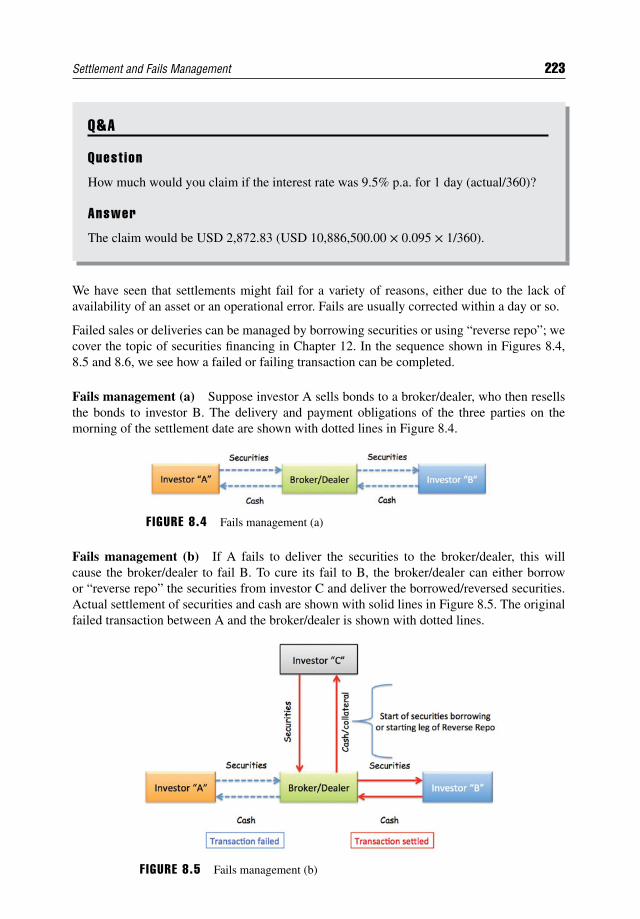
Settlement and Fails Management 223
Q&A
Quest ion
How much would you claim if the interest rate was 9.5% p.a. for 1 day (actual/360)?
Answer
The claim would be USD 2,872.83 (USD 10,886,500.00 × 0.095 × 1/360).
We have seen that settlements might fail for a variety of reasons, either due to the lack ofavailability of an asset or an operational error. Fails are usually corrected within a day or so.
Failed sales or deliveries can be managed by borrowing securities or using “reverse repo”; wecover the topic of securities financing in Chapter 12. In the sequence shown in Figures 8.4,8.5 and 8.6, we see how a failed or failing transaction can be completed.
Fails management (a) Suppose investor A sells bonds to a broker/dealer, who then resellsthe bonds to investor B. The delivery and payment obligations of the three parties on themorning of the settlement date are shown with dotted lines in Figure 8.4.
F IGURE 8.4 Fails management (a)
Fails management (b) If A fails to deliver the securities to the broker/dealer, this willcause the broker/dealer to fail B. To cure its fail to B, the broker/dealer can either borrowor “reverse repo” the securities from investor C and deliver the borrowed/reversed securities.Actual settlement of securities and cash are shown with solid lines in Figure 8.5. The originalfailed transaction between A and the broker/dealer is shown with dotted lines.
F IGURE 8.5 Fails management (b)
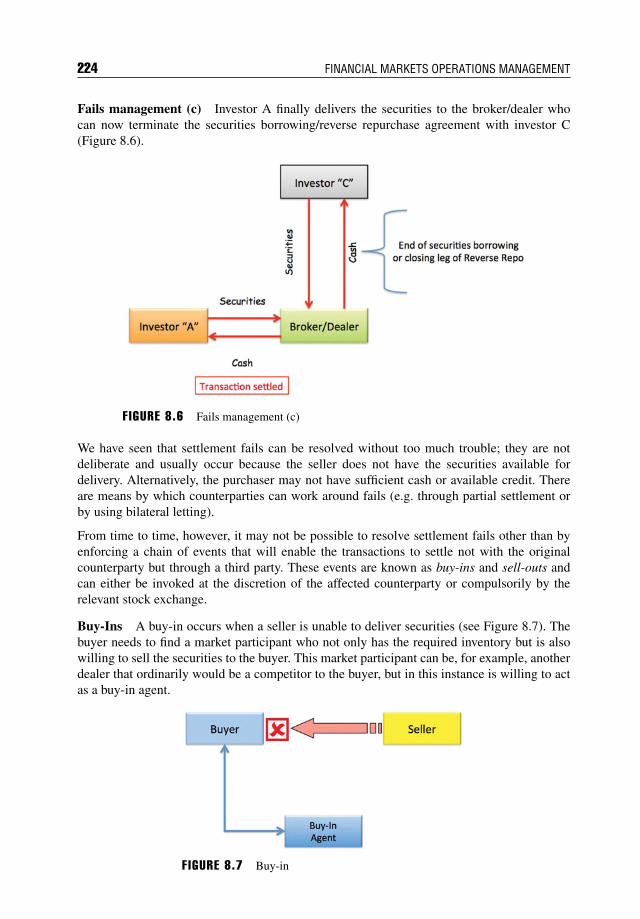
224 FINANCIAL MARKETS OPERATIONS MANAGEMENT
Fails management (c) Investor A finally delivers the securities to the broker/dealer whocan now terminate the securities borrowing/reverse repurchase agreement with investor C(Figure 8.6).
F IGURE 8.6 Fails management (c)
We have seen that settlement fails can be resolved without too much trouble; they are notdeliberate and usually occur because the seller does not have the securities available fordelivery. Alternatively, the purchaser may not have sufficient cash or available credit. Thereare means by which counterparties can work around fails (e.g. through partial settlement orby using bilateral letting).
From time to time, however, it may not be possible to resolve settlement fails other than byenforcing a chain of events that will enable the transactions to settle not with the originalcounterparty but through a third party. These events are known as buy-ins and sell-outs andcan either be invoked at the discretion of the affected counterparty or compulsorily by therelevant stock exchange.
Buy-Ins A buy-in occurs when a seller is unable to deliver securities (see Figure 8.7). Thebuyer needs to find a market participant who not only has the required inventory but is alsowilling to sell the securities to the buyer. This market participant can be, for example, anotherdealer that ordinarily would be a competitor to the buyer, but in this instance is willing to actas a buy-in agent.
F IGURE 8.7 Buy-in
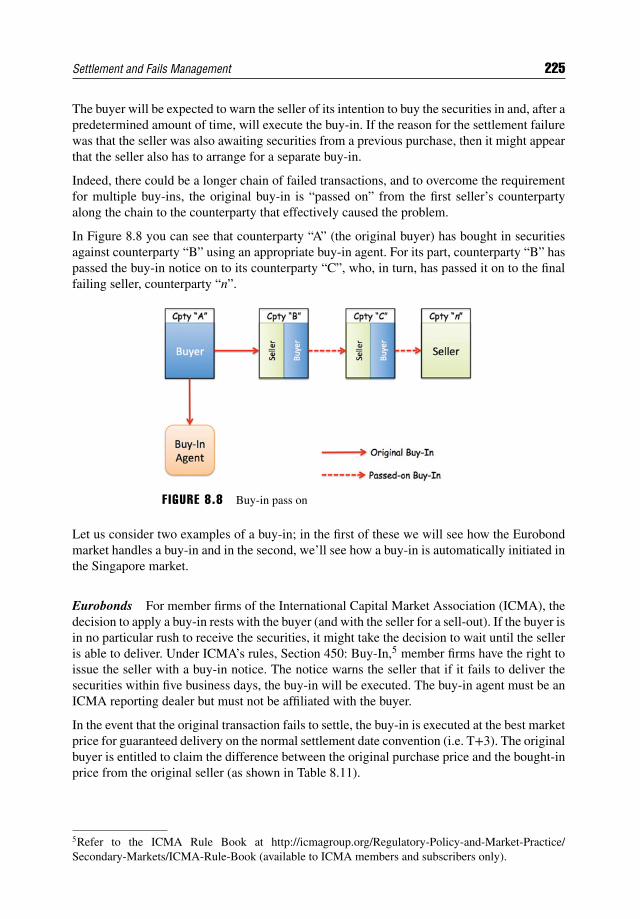
Settlement and Fails Management 225
The buyer will be expected to warn the seller of its intention to buy the securities in and, after apredetermined amount of time, will execute the buy-in. If the reason for the settlement failurewas that the seller was also awaiting securities from a previous purchase, then it might appearthat the seller also has to arrange for a separate buy-in.
Indeed, there could be a longer chain of failed transactions, and to overcome the requirementfor multiple buy-ins, the original buy-in is “passed on” from the first seller’s counterpartyalong the chain to the counterparty that effectively caused the problem.
In Figure 8.8 you can see that counterparty “A” (the original buyer) has bought in securitiesagainst counterparty “B” using an appropriate buy-in agent. For its part, counterparty “B” haspassed the buy-in notice on to its counterparty “C”, who, in turn, has passed it on to the finalfailing seller, counterparty “n”.
F IGURE 8.8 Buy-in pass on
Let us consider two examples of a buy-in; in the first of these we will see how the Eurobondmarket handles a buy-in and in the second, we’ll see how a buy-in is automatically initiated inthe Singapore market.
Eurobonds For member firms of the International Capital Market Association (ICMA), thedecision to apply a buy-in rests with the buyer (and with the seller for a sell-out). If the buyer isin no particular rush to receive the securities, it might take the decision to wait until the selleris able to deliver. Under ICMA’s rules, Section 450: Buy-In,5 member firms have the right toissue the seller with a buy-in notice. The notice warns the seller that if it fails to deliver thesecurities within five business days, the buy-in will be executed. The buy-in agent must be anICMA reporting dealer but must not be affiliated with the buyer.
In the event that the original transaction fails to settle, the buy-in is executed at the best marketprice for guaranteed delivery on the normal settlement date convention (i.e. T+3). The originalbuyer is entitled to claim the difference between the original purchase price and the bought-inprice from the original seller (as shown in Table 8.11).
5Refer to the ICMA Rule Book at http://icmagroup.org/Regulatory-Policy-and-Market-Practice/Secondary-Markets/ICMA-Rule-Book (available to ICMA members and subscribers only).
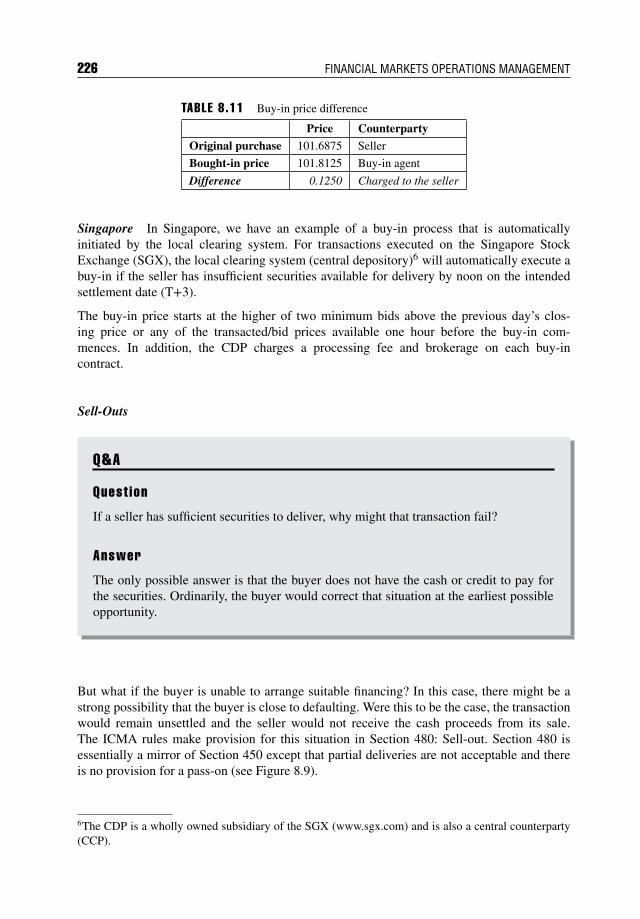
226 FINANCIAL MARKETS OPERATIONS MANAGEMENT
TABLE 8.11 Buy-in price difference
Price Counterparty
Original purchase 101.6875 Seller
Bought-in price 101.8125 Buy-in agent
Difference 0.1250 Charged to the seller
Singapore In Singapore, we have an example of a buy-in process that is automaticallyinitiated by the local clearing system. For transactions executed on the Singapore StockExchange (SGX), the local clearing system (central depository)6 will automatically execute abuy-in if the seller has insufficient securities available for delivery by noon on the intendedsettlement date (T+3).
The buy-in price starts at the higher of two minimum bids above the previous day’s clos-ing price or any of the transacted/bid prices available one hour before the buy-in com-mences. In addition, the CDP charges a processing fee and brokerage on each buy-incontract.
Sell-Outs
Q&A
Quest ion
If a seller has sufficient securities to deliver, why might that transaction fail?
Answer
The only possible answer is that the buyer does not have the cash or credit to pay forthe securities. Ordinarily, the buyer would correct that situation at the earliest possibleopportunity.
But what if the buyer is unable to arrange suitable financing? In this case, there might be astrong possibility that the buyer is close to defaulting. Were this to be the case, the transactionwould remain unsettled and the seller would not receive the cash proceeds from its sale.The ICMA rules make provision for this situation in Section 480: Sell-out. Section 480 isessentially a mirror of Section 450 except that partial deliveries are not acceptable and thereis no provision for a pass-on (see Figure 8.9).
6The CDP is a wholly owned subsidiary of the SGX (www.sgx.com) and is also a central counterparty(CCP).
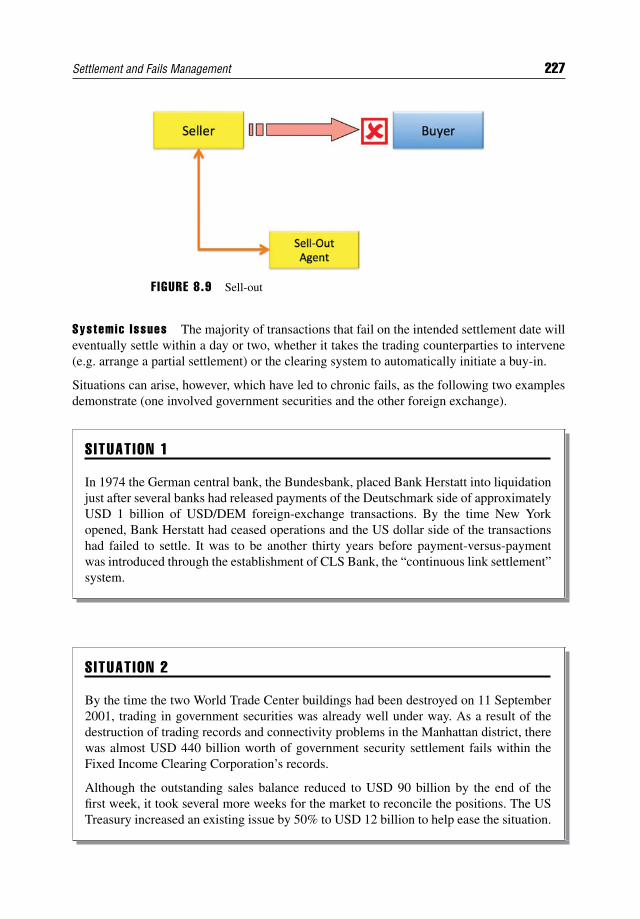
Settlement and Fails Management 227
FIGURE 8.9 Sell-out
Systemic Issues The majority of transactions that fail on the intended settlement date willeventually settle within a day or two, whether it takes the trading counterparties to intervene(e.g. arrange a partial settlement) or the clearing system to automatically initiate a buy-in.
Situations can arise, however, which have led to chronic fails, as the following two examplesdemonstrate (one involved government securities and the other foreign exchange).
SITUATION 1
In 1974 the German central bank, the Bundesbank, placed Bank Herstatt into liquidationjust after several banks had released payments of the Deutschmark side of approximatelyUSD 1 billion of USD/DEM foreign-exchange transactions. By the time New Yorkopened, Bank Herstatt had ceased operations and the US dollar side of the transactionshad failed to settle. It was to be another thirty years before payment-versus-paymentwas introduced through the establishment of CLS Bank, the “continuous link settlement”system.
SITUATION 2
By the time the two World Trade Center buildings had been destroyed on 11 September2001, trading in government securities was already well under way. As a result of thedestruction of trading records and connectivity problems in the Manhattan district, therewas almost USD 440 billion worth of government security settlement fails within theFixed Income Clearing Corporation’s records.
Although the outstanding sales balance reduced to USD 90 billion by the end of thefirst week, it took several more weeks for the market to reconcile the positions. The USTreasury increased an existing issue by 50% to USD 12 billion to help ease the situation.
228 FINANCIAL MARKETS OPERATIONS MANAGEMENT
8.6 THE MOVE TO SHORTER SETTLEMENT CYCLES
8.6.1 Background
We saw that settlement efficiency is mostly very high, especially in Europe according tothe ECSDA research noted above. This, together with the removal of physical certificatesand the settlement of most asset classes by book-entry transfer, begs the question as towhy we need several days to process transactions when, in theory, it should be possibleto settle any transaction on the trade date. This “trade date settlement” idea has one bigadvantage: counterparty risk exposure is reduced from several days (e.g. T+3) to intra-dayand consequently the need for margin/collateral to be posted for the duration of the open tradestatus is reduced. Systemic risk is also reduced, with fewer open trades waiting for SD in apending queue.
There are some challenges, however:
The institutional client part of the industry may not be willing or able to replace legacysystems with state-of-the art, fully automated STP systems that can cope with shorterprocessing cycles.
As we will see in Chapter 10: Custody and the Custodians, there are long, time-consumingcommunication chains from the client to the foreign CSD.
Although not announced as such, the “compromise” option is to reduce the settlement cycleacross the globe to T+2. This provides sufficient time for processing (with the timing andcommunication issues noted above) and reduces the counterparty risk exposure to a moreacceptable level.
8.6.2 Project Status
Europe The European Commission announced its intention to introduce T+2 settlement inall 27 Member States with effect from 1 January 2015. Germany already operates under T+2,with other markets typically under T+3. Government securities tend to be under T+0 or T+1.
Asia Like Europe, the settlement is fragmented. Unlike Europe, there is no regulatory driverfor harmonisation; nevertheless, there is a reasonable degree of harmonisation with marketssuch as India, Hong Kong, Korea and Taiwan already operating under T+2 and other marketssuch as Australia, China, Singapore and Japan under T+3. As other regions and marketsmigrate to T+2, it is probable that T+3 markets will follow.
USA In 1995, the USA shortened its settlement cycle from T+5 to T+3, with plans for afurther move to T+1 shelved in the early 2000s. In April 2014, the DTCC announced that itwould support a move to T+2 with a three-year implementation timescale.
Canada Currently on a T+3 cycle, Canada has no immediate plans other than to observewhat the USA does.
Settlement and Fails Management 229
Internat ional Securit ies The international bond business is OTC and, as such, does notdirectly come under the European Commission’s requirements to move to T+2. One of thekey provisions of the new regulations is the requirement: “… that the intended settlement datefor transactions in transferable securities which are executed on regulated markets, MTFs orOTFs shall be (T+2). But this does not apply to transactions which are negotiated privatelybut executed on trading venues, nor to transactions which are executed bilaterally but reportedto a trading venue.”7
To overcome the potential dual settlement date convention, ICMA’s John Serocold stated that:“The emerging conclusion is that ICMA’s Secondary Market Rules and Recommendationsshould be amended to provide for T+2 settlement in the absence of agreement to the contrary.”8
This moved occurred on 6 October 2014.
8.7 SUMMARY
In this chapter we have seen that settlement is the completion of any transaction. There aretwo types of settlement:
Gross settlement, where individual transactions settle on a one-by-one basis. Whilst thismeans that transactions settle in the shape and size that they were executed, it does allowsettlement to occur in real time.
Net settlement, where a clearing system will net out deliveries and receipts, debits andcredits across its clearing members’ securities and cash accounts. In order for this tohappen, the clearing system has to accumulate the deliveries and receipts over a periodof time before netting can take place. This netting might only occur once in a day orseveral times throughout the day. The more frequently netting can occur, the more similarit becomes to real-time settlement.
One of the operational risks that can occur is settlement risk, where one half of the transactionsettles (e.g. securities are delivered) and the other half of the transaction fails (e.g. payment isnot made). To mitigate this risk, it is normal market practice for settlement to take place on adelivery versus payment (DVP) basis.
There are three so-called DVP models, as defined by the Bank for International Settlements’Committee on Payment and Settlement Systems:
Model 1: Gross, simultaneous settlements of securities and funds transfers. Model 2: Gross settlement of securities transfers followed by net settlement of funds
transfers. Model 3: Simultaneous net settlement of securities and funds transfers.
7Source: ICMA Quarterly Report §33 (2Q 2014) (online). Available from “Previous versions” tab atwww.icmagroup.org/Regulatory-Policy-and-Market-Practice/Regulatory-Policy-Newsletter. [AccessedWednesday, 9 April 2014]8ibid.
230 FINANCIAL MARKETS OPERATIONS MANAGEMENT
Although DVP is the preferred method of settlement, there are occasions when this may notbe appropriate (e.g. an investor is transferring his assets from one custodian to another withoutthere being any change of beneficial owner). In this situation, the transfer will be made withoutany counter value, i.e. on a free-of-payment basis. FoP deliveries require greater operationaloversight than DVP, because if the free deliveries are made to the wrong recipient, there is therisk that the deliverer may not get the assets back.
With securities it is expected that settlement is made in full shortly after the trade is executed.As a certain amount of time is required for the clearance and funding processing to take place,it is appropriate that the intended settlement date should be between one and three days afterthe trade date. In general terms, government securities tend to settle on T+1, Eurobonds onT+3 and equities around the T+2 to T+3 timespan.
Most transactions do settle on the intended settlement date, although for liquidity-relatedreasons some do fail to settle on time. Participants can either wait or make arrangements tomanage the settlement fails through one or more of the following techniques:
Partial settlement; Bilateral netting; Multilateral netting through a securities settlement system; Invoking buy-ins or sell-outs, as appropriate.
Fails can occur on rare occasions through systemic problems and these can require interven-tion from a central authority (e.g. a government issuing a new tranche of securities) or theintroduction of a new centralised system (e.g. the foundation of CLS Bank in the foreignexchange industry).
Finally, the move to universal T+2 settlement is gaining momentum, especially in Europe,with the USA and Canada some way behind and the rest of the world somewhere in between.
CHAPTER 9Derivatives Clearing and Settlement
9.1 INTRODUCTION
We described some of the derivative products in Chapter 2: Financial Instruments and notedthat these products can be subdivided into two types:
Exchange-traded derivatives (ETDs) Over-the-counter derivatives (OTCDs).
This distinction guides us in terms of the post-transaction processing. Until recently, ETDtransactions were cleared through a central counterparty (CCP) and OTCD transactions wereprocessed between the trading counterparties. Today, it is expected that OTCD transactionsare also cleared centrally; a change that has come about through regulatory pressure.
Central counterparties (CCPs) support trade and position management across a wide rangeof asset types including securities and derivatives. The concepts for derivatives clearing aresimilar to those for securities; however, there are some significant differences, including:
After securities transactions have been cleared, settlement occurs in the appropriate cen-tral securities depository. There is no such concept of a CSD for derivatives. Clearedderivatives positions are managed by the CCP and non-cleared positions by the twocounterparties involved.
Securities are settled in full shortly after trade execution. This means that the counterpartyrisk between buyer and seller (in a clearing house context) is extinguished on settlementand, likewise, between buyer and CCP together with seller and CCP.
Derivatives contracts remain open until they are either closed out or are exercised.This results in a credit exposure for the duration of the open status of the contract.This risk is mitigated in part by the use of margin (cleared derivatives) and collateral(non-cleared).
231
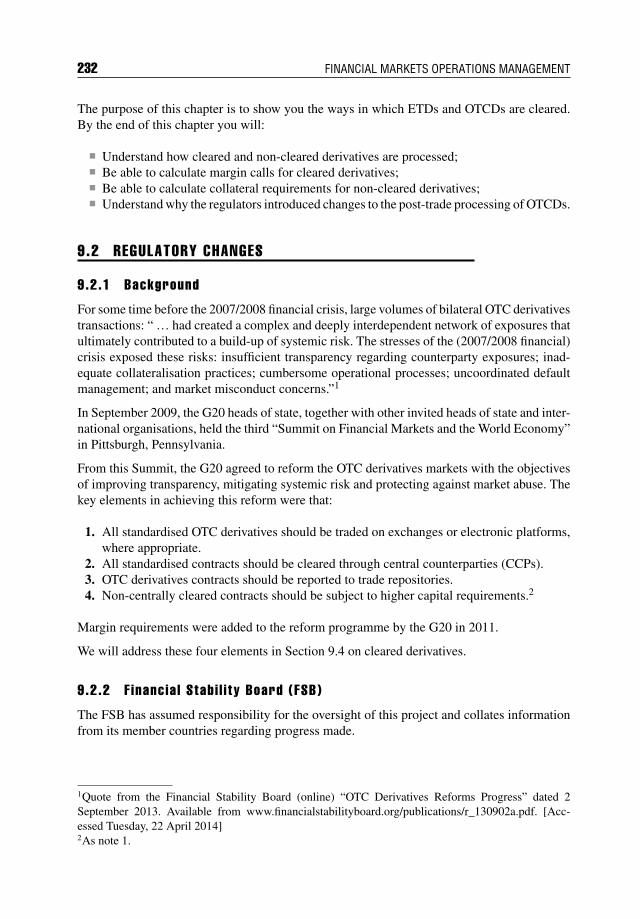
232 FINANCIAL MARKETS OPERATIONS MANAGEMENT
The purpose of this chapter is to show you the ways in which ETDs and OTCDs are cleared.By the end of this chapter you will:
Understand how cleared and non-cleared derivatives are processed; Be able to calculate margin calls for cleared derivatives; Be able to calculate collateral requirements for non-cleared derivatives; Understand why the regulators introduced changes to the post-trade processing of OTCDs.
9.2 REGULATORY CHANGES
9.2.1 Background
For some time before the 2007/2008 financial crisis, large volumes of bilateral OTC derivativestransactions: “ … had created a complex and deeply interdependent network of exposures thatultimately contributed to a build-up of systemic risk. The stresses of the (2007/2008 financial)crisis exposed these risks: insufficient transparency regarding counterparty exposures; inad-equate collateralisation practices; cumbersome operational processes; uncoordinated defaultmanagement; and market misconduct concerns.”1
In September 2009, the G20 heads of state, together with other invited heads of state and inter-national organisations, held the third “Summit on Financial Markets and the World Economy”in Pittsburgh, Pennsylvania.
From this Summit, the G20 agreed to reform the OTC derivatives markets with the objectivesof improving transparency, mitigating systemic risk and protecting against market abuse. Thekey elements in achieving this reform were that:
1. All standardised OTC derivatives should be traded on exchanges or electronic platforms,where appropriate.
2. All standardised contracts should be cleared through central counterparties (CCPs).3. OTC derivatives contracts should be reported to trade repositories.4. Non-centrally cleared contracts should be subject to higher capital requirements.2
Margin requirements were added to the reform programme by the G20 in 2011.
We will address these four elements in Section 9.4 on cleared derivatives.
9.2.2 F inancia l Stabi l i ty Board (FSB)
The FSB has assumed responsibility for the oversight of this project and collates informationfrom its member countries regarding progress made.
1Quote from the Financial Stability Board (online) “OTC Derivatives Reforms Progress” dated 2September 2013. Available from www.financialstabilityboard.org/publications/r_130902a.pdf. [Acc-essed Tuesday, 22 April 2014]2As note 1.
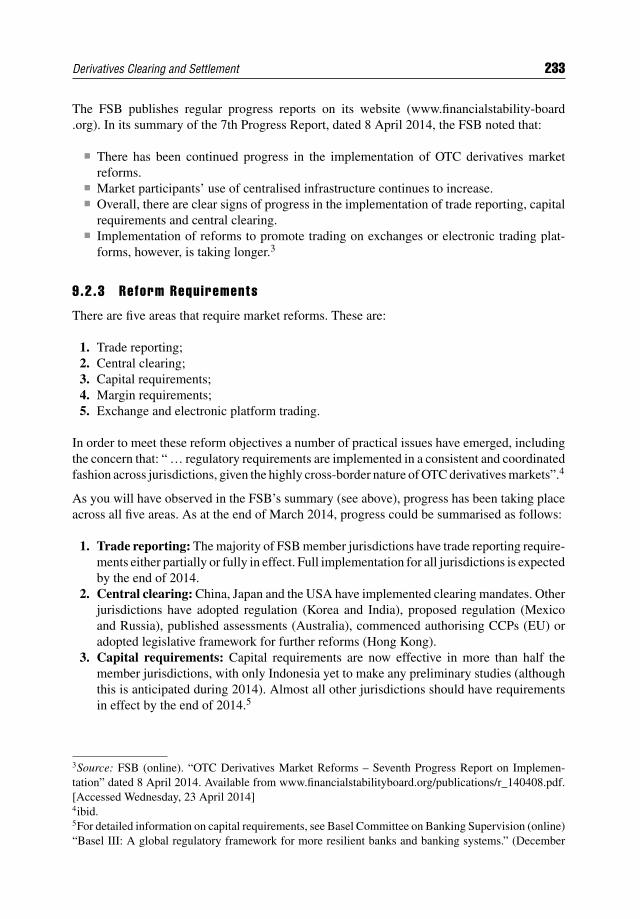
Derivatives Clearing and Settlement 233
The FSB publishes regular progress reports on its website (www.financialstability-board.org). In its summary of the 7th Progress Report, dated 8 April 2014, the FSB noted that:
There has been continued progress in the implementation of OTC derivatives marketreforms.
Market participants’ use of centralised infrastructure continues to increase. Overall, there are clear signs of progress in the implementation of trade reporting, capital
requirements and central clearing. Implementation of reforms to promote trading on exchanges or electronic trading plat-
forms, however, is taking longer.3
9.2.3 Reform Requirements
There are five areas that require market reforms. These are:
1. Trade reporting;2. Central clearing;3. Capital requirements;4. Margin requirements;5. Exchange and electronic platform trading.
In order to meet these reform objectives a number of practical issues have emerged, includingthe concern that: “ … regulatory requirements are implemented in a consistent and coordinatedfashion across jurisdictions, given the highly cross-border nature of OTC derivatives markets”.4
As you will have observed in the FSB’s summary (see above), progress has been taking placeacross all five areas. As at the end of March 2014, progress could be summarised as follows:
1. Trade reporting: The majority of FSB member jurisdictions have trade reporting require-ments either partially or fully in effect. Full implementation for all jurisdictions is expectedby the end of 2014.
2. Central clearing: China, Japan and the USA have implemented clearing mandates. Otherjurisdictions have adopted regulation (Korea and India), proposed regulation (Mexicoand Russia), published assessments (Australia), commenced authorising CCPs (EU) oradopted legislative framework for further reforms (Hong Kong).
3. Capital requirements: Capital requirements are now effective in more than half themember jurisdictions, with only Indonesia yet to make any preliminary studies (althoughthis is anticipated during 2014). Almost all other jurisdictions should have requirementsin effect by the end of 2014.5
3Source: FSB (online). “OTC Derivatives Market Reforms – Seventh Progress Report on Implemen-tation” dated 8 April 2014. Available from www.financialstabilityboard.org/publications/r_140408.pdf.[Accessed Wednesday, 23 April 2014]4ibid.5For detailed information on capital requirements, see Basel Committee on Banking Supervision (online)“Basel III: A global regulatory framework for more resilient banks and banking systems.” (December
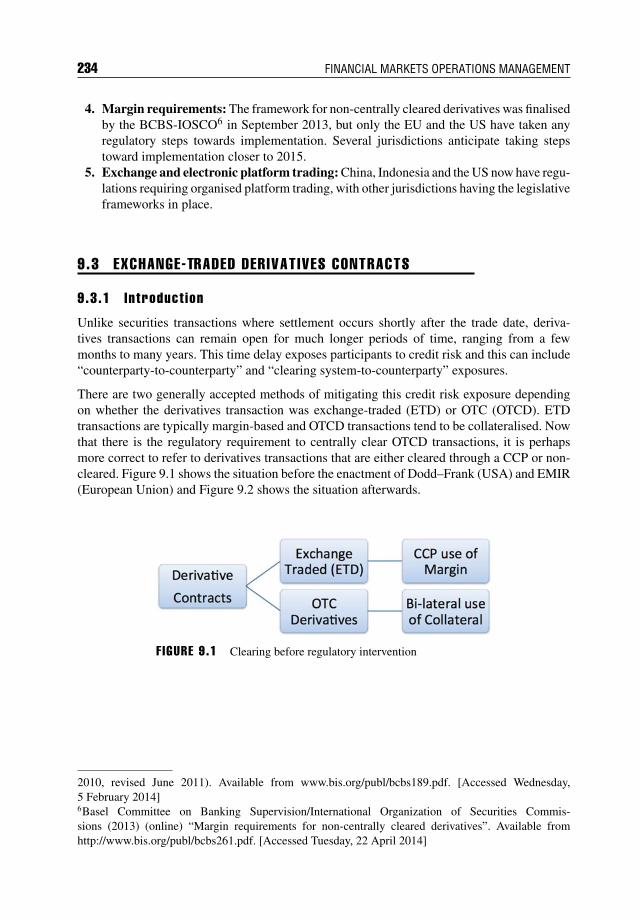
234 FINANCIAL MARKETS OPERATIONS MANAGEMENT
4. Margin requirements: The framework for non-centrally cleared derivatives was finalisedby the BCBS-IOSCO6 in September 2013, but only the EU and the US have taken anyregulatory steps towards implementation. Several jurisdictions anticipate taking stepstoward implementation closer to 2015.
5. Exchange and electronic platform trading: China, Indonesia and the US now have regu-lations requiring organised platform trading, with other jurisdictions having the legislativeframeworks in place.
9.3 EXCHANGE-TRADED DERIVATIVES CONTRACTS
9.3.1 Introduct ion
Unlike securities transactions where settlement occurs shortly after the trade date, deriva-tives transactions can remain open for much longer periods of time, ranging from a fewmonths to many years. This time delay exposes participants to credit risk and this can include“counterparty-to-counterparty” and “clearing system-to-counterparty” exposures.
There are two generally accepted methods of mitigating this credit risk exposure dependingon whether the derivatives transaction was exchange-traded (ETD) or OTC (OTCD). ETDtransactions are typically margin-based and OTCD transactions tend to be collateralised. Nowthat there is the regulatory requirement to centrally clear OTCD transactions, it is perhapsmore correct to refer to derivatives transactions that are either cleared through a CCP or non-cleared. Figure 9.1 shows the situation before the enactment of Dodd–Frank (USA) and EMIR(European Union) and Figure 9.2 shows the situation afterwards.
F IGURE 9.1 Clearing before regulatory intervention
2010, revised June 2011). Available from www.bis.org/publ/bcbs189.pdf. [Accessed Wednesday,5 February 2014]6Basel Committee on Banking Supervision/International Organization of Securities Commis-sions (2013) (online) “Margin requirements for non-centrally cleared derivatives”. Available fromhttp://www.bis.org/publ/bcbs261.pdf. [Accessed Tuesday, 22 April 2014]
Derivatives Clearing and Settlement 235
FIGURE 9.2 Clearing after regulatory intervention
Please note that some standardised OTCDs such as some interest rate swap products have beencentrally cleared for a number of years.
9.3.2 Derivat ives Exchange and Clearing System
For exchange-traded contracts such as futures and options, the derivatives exchange and theclearing system may be either part of the same organisational structure or separate organisa-tions. In either event, there will be good links between the exchange and the clearing system.
Members of an exchange may also be members of the clearing system. If not, they must havea non-clearing agreement with a clearing member. Figure 9.3 shows the relationships betweenthe exchange, the clearing system and their respective members.
F IGURE 9.3 Exchange-traded derivatives
Members of an exchange can also be members of a clearing system and they submit tradedetails to the clearing system for clearance. If they only clear transactions for their ownbusiness, they are known as clearing members (or individual clearing members). If they alsoclear the business of non-clearing members (see below), they are known as general clearingmembers (GCMs).
9.3.3 Give-Up Agreements
Certain exchange members may choose not to be either CMs or GCMs. These organisationsare known as non-clearing members (NCMs) and will either clear through a GCM or “give-up”the trade to a CM or GCM.
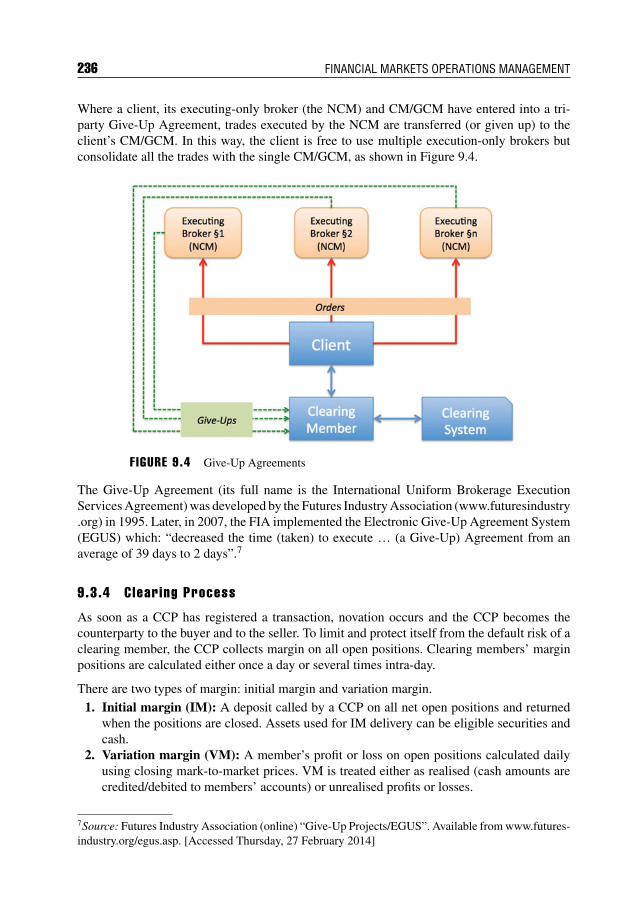
236 FINANCIAL MARKETS OPERATIONS MANAGEMENT
Where a client, its executing-only broker (the NCM) and CM/GCM have entered into a tri-party Give-Up Agreement, trades executed by the NCM are transferred (or given up) to theclient’s CM/GCM. In this way, the client is free to use multiple execution-only brokers butconsolidate all the trades with the single CM/GCM, as shown in Figure 9.4.
F IGURE 9.4 Give-Up Agreements
The Give-Up Agreement (its full name is the International Uniform Brokerage ExecutionServices Agreement) was developed by the Futures Industry Association (www.futuresindustry.org) in 1995. Later, in 2007, the FIA implemented the Electronic Give-Up Agreement System(EGUS) which: “decreased the time (taken) to execute … (a Give-Up) Agreement from anaverage of 39 days to 2 days”.7
9.3.4 Clearing Process
As soon as a CCP has registered a transaction, novation occurs and the CCP becomes thecounterparty to the buyer and to the seller. To limit and protect itself from the default risk of aclearing member, the CCP collects margin on all open positions. Clearing members’ marginpositions are calculated either once a day or several times intra-day.
There are two types of margin: initial margin and variation margin.
1. Initial margin (IM): A deposit called by a CCP on all net open positions and returnedwhen the positions are closed. Assets used for IM delivery can be eligible securities andcash.
2. Variation margin (VM): A member’s profit or loss on open positions calculated dailyusing closing mark-to-market prices. VM is treated either as realised (cash amounts arecredited/debited to members’ accounts) or unrealised profits or losses.
7Source: Futures Industry Association (online) “Give-Up Projects/EGUS”. Available from www.futures-industry.org/egus.asp. [Accessed Thursday, 27 February 2014]
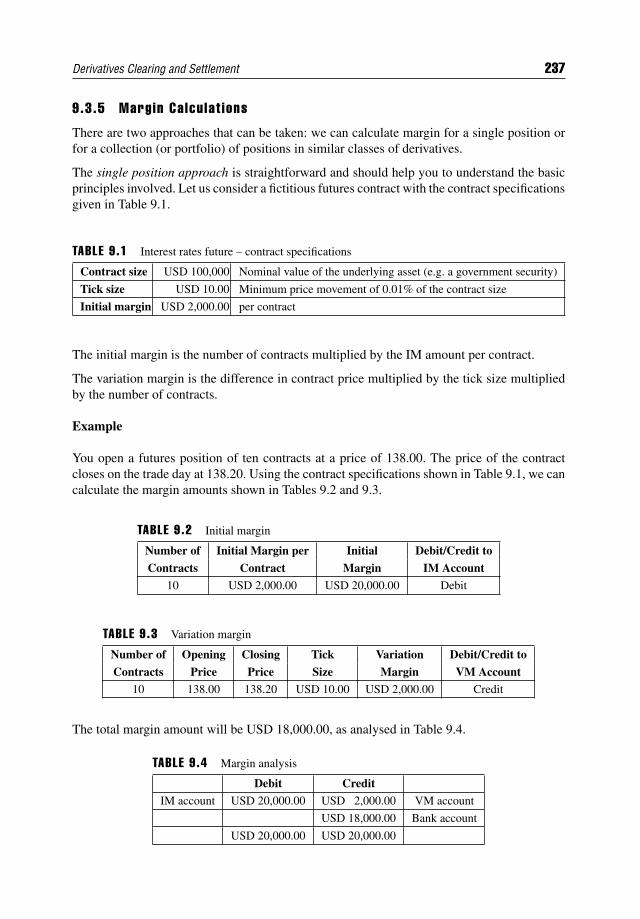
Derivatives Clearing and Settlement 237
9.3.5 Margin Calcu lat ions
There are two approaches that can be taken: we can calculate margin for a single position orfor a collection (or portfolio) of positions in similar classes of derivatives.
The single position approach is straightforward and should help you to understand the basicprinciples involved. Let us consider a fictitious futures contract with the contract specificationsgiven in Table 9.1.
TABLE 9.1 Interest rates future – contract specifications
Contract size USD 100,000 Nominal value of the underlying asset (e.g. a government security)
Tick size USD 10.00 Minimum price movement of 0.01% of the contract size
Initial margin USD 2,000.00 per contract
The initial margin is the number of contracts multiplied by the IM amount per contract.
The variation margin is the difference in contract price multiplied by the tick size multipliedby the number of contracts.
Example
You open a futures position of ten contracts at a price of 138.00. The price of the contractcloses on the trade day at 138.20. Using the contract specifications shown in Table 9.1, we cancalculate the margin amounts shown in Tables 9.2 and 9.3.
TABLE 9.2 Initial margin
Number of Initial Margin per Initial Debit/Credit to
Contracts Contract Margin IM Account
10 USD 2,000.00 USD 20,000.00 Debit
TABLE 9.3 Variation margin
Number of Opening Closing Tick Variation Debit/Credit to
Contracts Price Price Size Margin VM Account
10 138.00 138.20 USD 10.00 USD 2,000.00 Credit
The total margin amount will be USD 18,000.00, as analysed in Table 9.4.
TABLE 9.4 Margin analysis
Debit Credit
IM account USD 20,000.00 USD 2,000.00 VM account
USD 18,000.00 Bank account
USD 20,000.00 USD 20,000.00
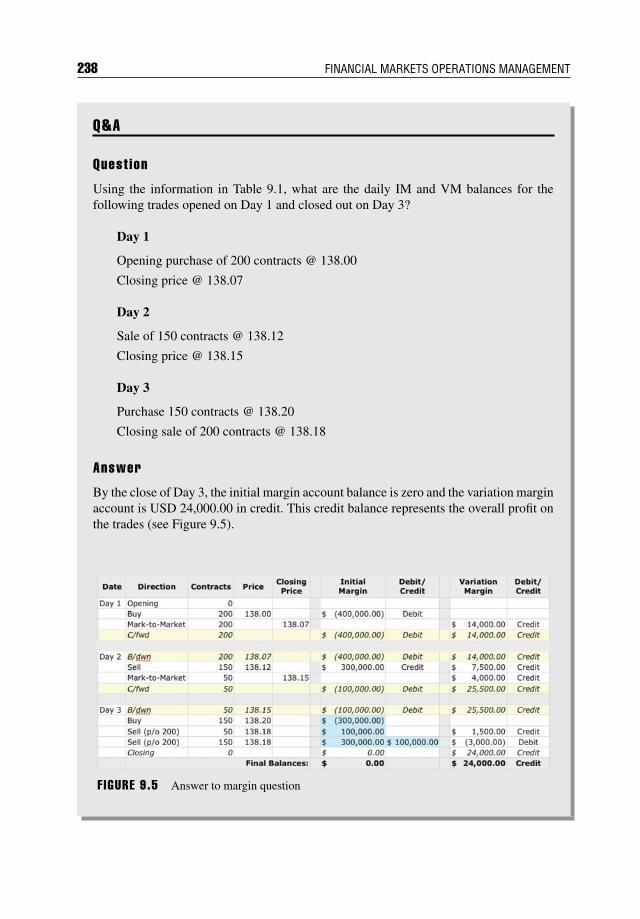
238 FINANCIAL MARKETS OPERATIONS MANAGEMENT
Q&A
Quest ion
Using the information in Table 9.1, what are the daily IM and VM balances for thefollowing trades opened on Day 1 and closed out on Day 3?
Day 1
Opening purchase of 200 contracts @ 138.00
Closing price @ 138.07
Day 2
Sale of 150 contracts @ 138.12
Closing price @ 138.15
Day 3
Purchase 150 contracts @ 138.20
Closing sale of 200 contracts @ 138.18
Answer
By the close of Day 3, the initial margin account balance is zero and the variation marginaccount is USD 24,000.00 in credit. This credit balance represents the overall profit onthe trades (see Figure 9.5).
F IGURE 9.5 Answer to margin question
Derivatives Clearing and Settlement 239
Here is an explanation of what happened throughout the three days:
Day 1: The IM calculation is 200 contracts × USD 2,000.00 = USD 400,000.00.The position was opened at 138.00 and, at the close of business, revalued at 138.07. If thetick size is 0.01, there has been a gain of 7 ticks and the VM calculation is 200 contracts ×7 × USD 10.00 = USD 14,000.00.
Day 2: 150 contracts have been sold at 138.12. The profit is 5 ticks (138.12 − 138.07),amounting to USD 7,500.00, and USD 300,000.00 of the IM are credited (150 con-tracts × USD 2,000.00). Finally, the close of business price is 138.15, resulting in aprofit of 8 ticks and a VM credit amounting to USD 4,000.00 (50 contracts × 8 ticks ×USD 10.00).
Day 3: 150 contracts are purchased at 138.20 and the total position of 200 contractsthen closed out at 138.18. Overall, on the IM account there will be a net credit of USD100,000.00 8 resulting in a final balance of zero. To calculate the VM on the closing tradeof 200 contracts, you should compare the prices as follows:(a) 50 (part of sale of 200) @ 138.18 against the brought-down balance of 50 @ 138.15
(profit of 3 ticks).(b) 150 (balance of sale of 200) @ 138.18 against the purchase of 150 @ 138.20 (loss of
2 ticks).
The portfolio position approach considers the overall risk to a portfolio of derivative and/orsecurities and calculates a “worst case” loss that the portfolio might experience under differ-ent market conditions. These market conditions are altered by inputting changes to futuresprices and, for options, implied volatility shift. The system used for this is the Standard Port-folio Analysis of Risk (SPAN) system, developed by the Chicago Mercantile Exchange9 in1988.
SPAN is widely used by many exchanges around the world, including Tokyo, London andSingapore.
9.3.6 In i t ia l Margin – El ig ib le Assets
CCPs will accept suitable assets with an appropriate haircut to cover initial margin calls.The Chicago Mercantile Exchange’s clearing system (CME Clearing) will accept a vari-ety of assets, known as Acceptable Performance Bond Collateral, including those shown inTable 9.5.
8Refer to the last three entries in the Initial Margin column and the last entry in the Debit/Credit columnof Figure 9.5.9Regarding terminology, the CME refers to “performance bond” for initial margin and “settlementvariation” for variation margin.
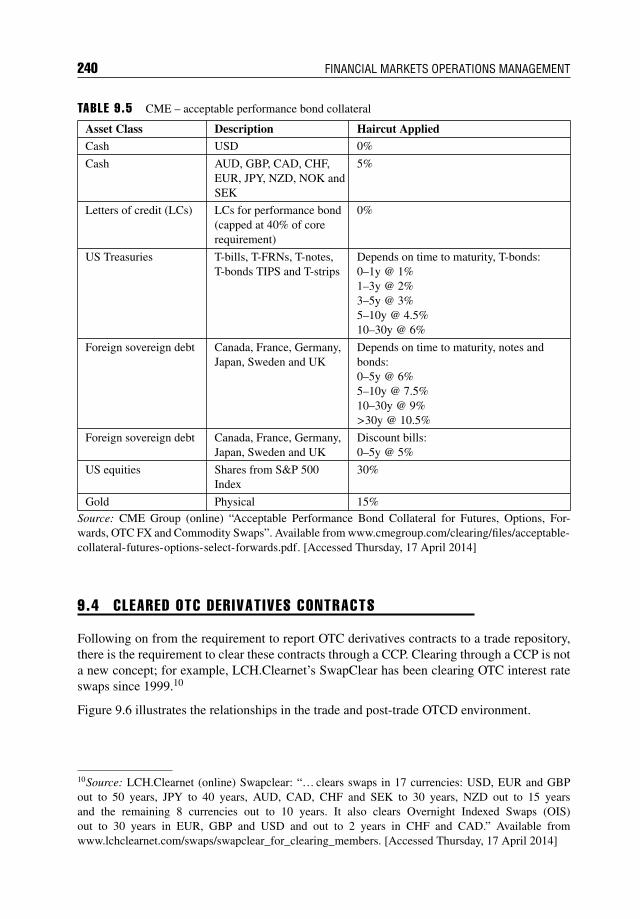
240 FINANCIAL MARKETS OPERATIONS MANAGEMENT
TABLE 9.5 CME – acceptable performance bond collateral
Asset Class Description Haircut AppliedCash USD 0%
Cash AUD, GBP, CAD, CHF,EUR, JPY, NZD, NOK andSEK
5%
Letters of credit (LCs) LCs for performance bond(capped at 40% of corerequirement)
0%
US Treasuries T-bills, T-FRNs, T-notes,T-bonds TIPS and T-strips
Depends on time to maturity, T-bonds:0–1y @ 1%1–3y @ 2%3–5y @ 3%5–10y @ 4.5%10–30y @ 6%
Foreign sovereign debt Canada, France, Germany,Japan, Sweden and UK
Depends on time to maturity, notes andbonds:0–5y @ 6%5–10y @ 7.5%10–30y @ 9%>30y @ 10.5%
Foreign sovereign debt Canada, France, Germany,Japan, Sweden and UK
Discount bills:0–5y @ 5%
US equities Shares from S&P 500Index
30%
Gold Physical 15%Source: CME Group (online) “Acceptable Performance Bond Collateral for Futures, Options, For-wards, OTC FX and Commodity Swaps”. Available from www.cmegroup.com/clearing/files/acceptable-collateral-futures-options-select-forwards.pdf. [Accessed Thursday, 17 April 2014]
9.4 CLEARED OTC DERIVATIVES CONTRACTS
Following on from the requirement to report OTC derivatives contracts to a trade repository,there is the requirement to clear these contracts through a CCP. Clearing through a CCP is nota new concept; for example, LCH.Clearnet’s SwapClear has been clearing OTC interest rateswaps since 1999.10
Figure 9.6 illustrates the relationships in the trade and post-trade OTCD environment.
10Source: LCH.Clearnet (online) Swapclear: “… clears swaps in 17 currencies: USD, EUR and GBPout to 50 years, JPY to 40 years, AUD, CAD, CHF and SEK to 30 years, NZD out to 15 yearsand the remaining 8 currencies out to 10 years. It also clears Overnight Indexed Swaps (OIS)out to 30 years in EUR, GBP and USD and out to 2 years in CHF and CAD.” Available fromwww.lchclearnet.com/swaps/swapclear_for_clearing_members. [Accessed Thursday, 17 April 2014]
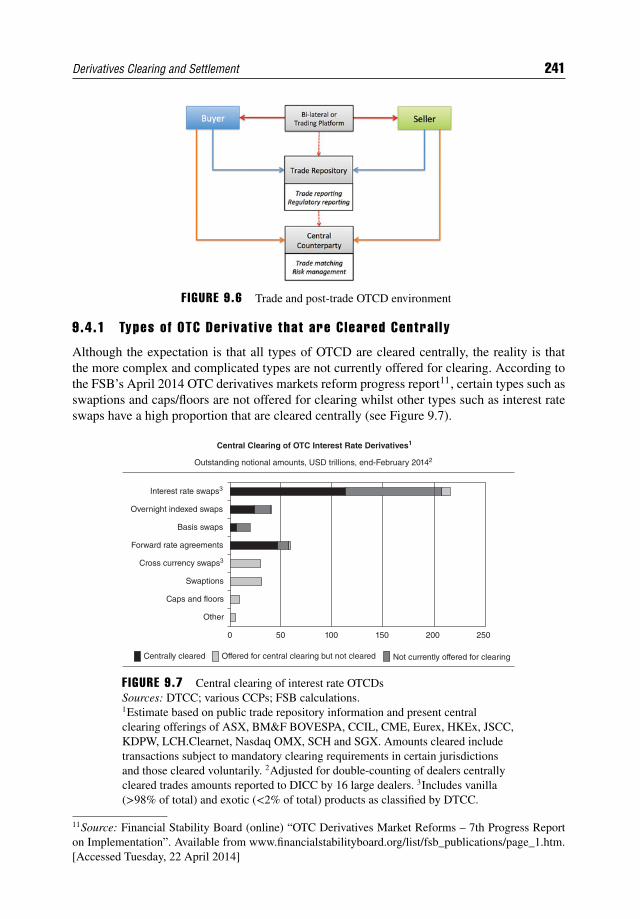
Derivatives Clearing and Settlement 241
FIGURE 9.6 Trade and post-trade OTCD environment
9.4.1 Types of OTC Derivat ive that are Cleared Central ly
Although the expectation is that all types of OTCD are cleared centrally, the reality is thatthe more complex and complicated types are not currently offered for clearing. According tothe FSB’s April 2014 OTC derivatives markets reform progress report11, certain types such asswaptions and caps/floors are not offered for clearing whilst other types such as interest rateswaps have a high proportion that are cleared centrally (see Figure 9.7).
0
Other
Centrally cleared Offered for central clearing but not cleared Not currently offered for clearing
Caps and floors
Swaptions
Cross currency swaps3
Forward rate agreements
Basis swaps
Overnight indexed swaps
Interest rate swaps3
Outstanding notional amounts, USD trillions, end-February 20142
Central Clearing of OTC Interest Rate Derivatives1
50 100 150 200 250
F IGURE 9.7 Central clearing of interest rate OTCDsSources: DTCC; various CCPs; FSB calculations.1Estimate based on public trade repository information and present centralclearing offerings of ASX, BM&F BOVESPA, CCIL, CME, Eurex, HKEx, JSCC,KDPW, LCH.Clearnet, Nasdaq OMX, SCH and SGX. Amounts cleared includetransactions subject to mandatory clearing requirements in certain jurisdictionsand those cleared voluntarily. 2Adjusted for double-counting of dealers centrallycleared trades amounts reported to DICC by 16 large dealers. 3Includes vanilla(>98% of total) and exotic (<2% of total) products as classified by DTCC.
11Source: Financial Stability Board (online) “OTC Derivatives Market Reforms – 7th Progress Reporton Implementation”. Available from www.financialstabilityboard.org/list/fsb_publications/page_1.htm.[Accessed Tuesday, 22 April 2014]
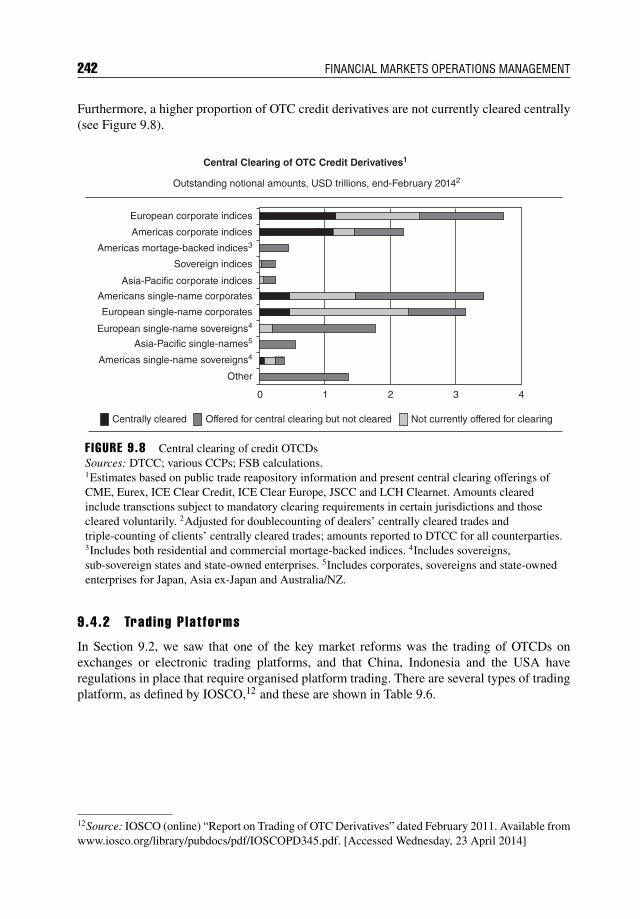
242 FINANCIAL MARKETS OPERATIONS MANAGEMENT
Furthermore, a higher proportion of OTC credit derivatives are not currently cleared centrally(see Figure 9.8).
0 1 2 3 4
Other
Centrally cleared Offered for central clearing but not cleared Not currently offered for clearing
Americas single-name sovereigns4
European single-name sovereigns4
Asia-Pacific single-names5
European single-name corporates
Americans single-name corporates
Asia-Pacific corporate indices
Sovereign indices
Americas mortage-backed indices3
Americas corporate indices
European corporate indices
Outstanding notional amounts, USD trillions, end-February 20142
Central Clearing of OTC Credit Derivatives1
F IGURE 9.8 Central clearing of credit OTCDsSources: DTCC; various CCPs; FSB calculations.1Estimates based on public trade reapository information and present central clearing offerings ofCME, Eurex, ICE Clear Credit, ICE Clear Europe, JSCC and LCH Clearnet. Amounts clearedinclude transctions subject to mandatory clearing requirements in certain jurisdictions and thosecleared voluntarily. 2Adjusted for doublecounting of dealers’ centrally cleared trades andtriple-counting of clients’ centrally cleared trades; amounts reported to DTCC for all counterparties.3Includes both residential and commercial mortage-backed indices. 4Includes sovereigns,sub-sovereign states and state-owned enterprises. 5Includes corporates, sovereigns and state-ownedenterprises for Japan, Asia ex-Japan and Australia/NZ.
9.4.2 Trading Plat forms
In Section 9.2, we saw that one of the key market reforms was the trading of OTCDs onexchanges or electronic trading platforms, and that China, Indonesia and the USA haveregulations in place that require organised platform trading. There are several types of tradingplatform, as defined by IOSCO,12 and these are shown in Table 9.6.
12Source: IOSCO (online) “Report on Trading of OTC Derivatives” dated February 2011. Available fromwww.iosco.org/library/pubdocs/pdf/IOSCOPD345.pdf. [Accessed Wednesday, 23 April 2014]
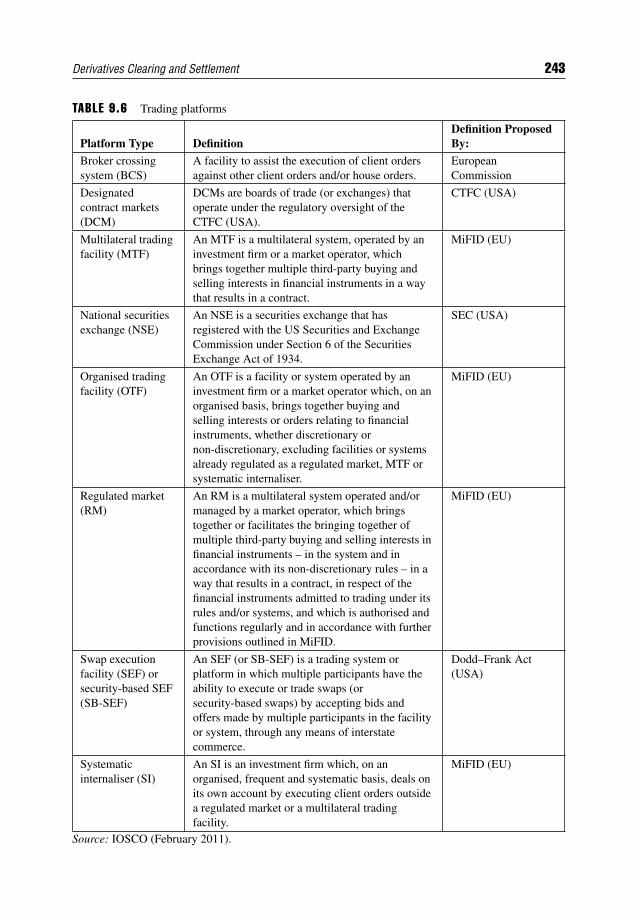
Derivatives Clearing and Settlement 243
TABLE 9.6 Trading platforms
Platform Type DefinitionDefinition ProposedBy:
Broker crossingsystem (BCS)
A facility to assist the execution of client ordersagainst other client orders and/or house orders.
EuropeanCommission
Designatedcontract markets(DCM)
DCMs are boards of trade (or exchanges) thatoperate under the regulatory oversight of theCTFC (USA).
CTFC (USA)
Multilateral tradingfacility (MTF)
An MTF is a multilateral system, operated by aninvestment firm or a market operator, whichbrings together multiple third-party buying andselling interests in financial instruments in a waythat results in a contract.
MiFID (EU)
National securitiesexchange (NSE)
An NSE is a securities exchange that hasregistered with the US Securities and ExchangeCommission under Section 6 of the SecuritiesExchange Act of 1934.
SEC (USA)
Organised tradingfacility (OTF)
An OTF is a facility or system operated by aninvestment firm or a market operator which, on anorganised basis, brings together buying andselling interests or orders relating to financialinstruments, whether discretionary ornon-discretionary, excluding facilities or systemsalready regulated as a regulated market, MTF orsystematic internaliser.
MiFID (EU)
Regulated market(RM)
An RM is a multilateral system operated and/ormanaged by a market operator, which bringstogether or facilitates the bringing together ofmultiple third-party buying and selling interests infinancial instruments – in the system and inaccordance with its non-discretionary rules – in away that results in a contract, in respect of thefinancial instruments admitted to trading under itsrules and/or systems, and which is authorised andfunctions regularly and in accordance with furtherprovisions outlined in MiFID.
MiFID (EU)
Swap executionfacility (SEF) orsecurity-based SEF(SB-SEF)
An SEF (or SB-SEF) is a trading system orplatform in which multiple participants have theability to execute or trade swaps (orsecurity-based swaps) by accepting bids andoffers made by multiple participants in the facilityor system, through any means of interstatecommerce.
Dodd–Frank Act(USA)
Systematicinternaliser (SI)
An SI is an investment firm which, on anorganised, frequent and systematic basis, deals onits own account by executing client orders outsidea regulated market or a multilateral tradingfacility.
MiFID (EU)
Source: IOSCO (February 2011).
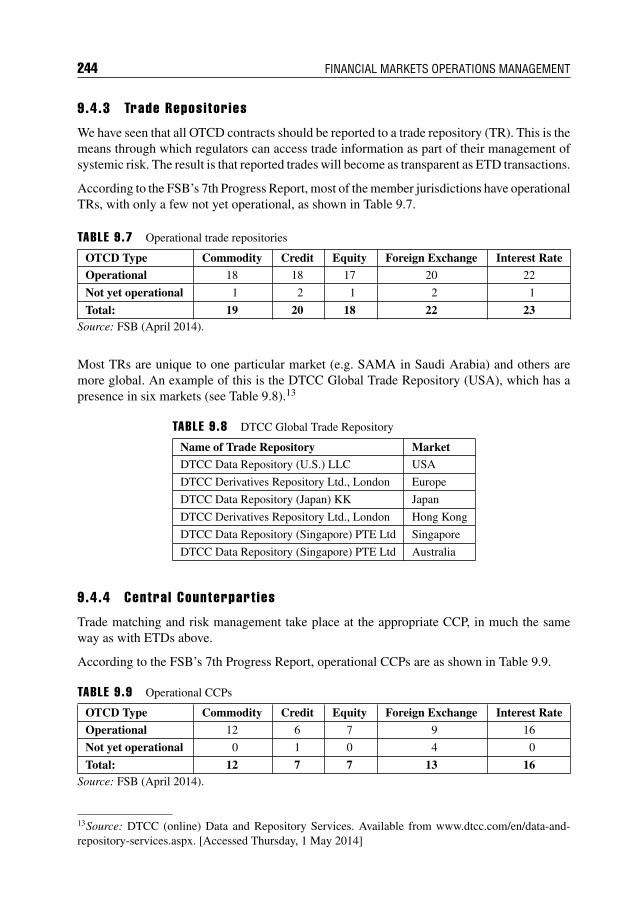
244 FINANCIAL MARKETS OPERATIONS MANAGEMENT
9.4.3 Trade Repositor ies
We have seen that all OTCD contracts should be reported to a trade repository (TR). This is themeans through which regulators can access trade information as part of their management ofsystemic risk. The result is that reported trades will become as transparent as ETD transactions.
According to the FSB’s 7th Progress Report, most of the member jurisdictions have operationalTRs, with only a few not yet operational, as shown in Table 9.7.
TABLE 9.7 Operational trade repositories
OTCD Type Commodity Credit Equity Foreign Exchange Interest RateOperational 18 18 17 20 22
Not yet operational 1 2 1 2 1
Total: 19 20 18 22 23Source: FSB (April 2014).
Most TRs are unique to one particular market (e.g. SAMA in Saudi Arabia) and others aremore global. An example of this is the DTCC Global Trade Repository (USA), which has apresence in six markets (see Table 9.8).13
TABLE 9.8 DTCC Global Trade Repository
Name of Trade Repository MarketDTCC Data Repository (U.S.) LLC USA
DTCC Derivatives Repository Ltd., London Europe
DTCC Data Repository (Japan) KK Japan
DTCC Derivatives Repository Ltd., London Hong Kong
DTCC Data Repository (Singapore) PTE Ltd Singapore
DTCC Data Repository (Singapore) PTE Ltd Australia
9.4.4 Central Counterpart ies
Trade matching and risk management take place at the appropriate CCP, in much the sameway as with ETDs above.
According to the FSB’s 7th Progress Report, operational CCPs are as shown in Table 9.9.
TABLE 9.9 Operational CCPs
OTCD Type Commodity Credit Equity Foreign Exchange Interest Rate
Operational 12 6 7 9 16
Not yet operational 0 1 0 4 0
Total: 12 7 7 13 16Source: FSB (April 2014).
13Source: DTCC (online) Data and Repository Services. Available from www.dtcc.com/en/data-and-repository-services.aspx. [Accessed Thursday, 1 May 2014]
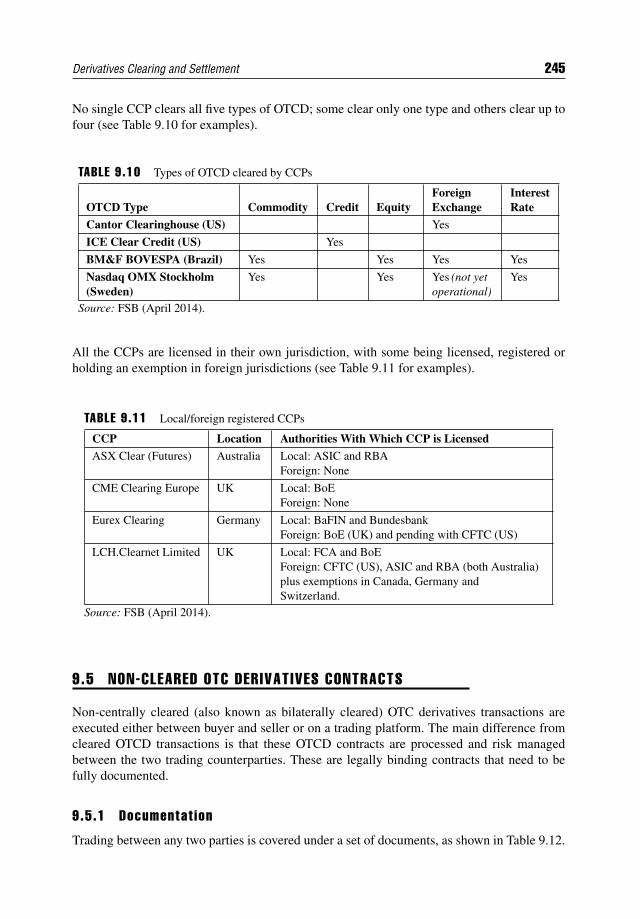
Derivatives Clearing and Settlement 245
No single CCP clears all five types of OTCD; some clear only one type and others clear up tofour (see Table 9.10 for examples).
TABLE 9.10 Types of OTCD cleared by CCPs
OTCD Type Commodity Credit EquityForeignExchange
InterestRate
Cantor Clearinghouse (US) Yes
ICE Clear Credit (US) Yes
BM&F BOVESPA (Brazil) Yes Yes Yes Yes
Nasdaq OMX Stockholm(Sweden)
Yes Yes Yes (not yetoperational)
Yes
Source: FSB (April 2014).
All the CCPs are licensed in their own jurisdiction, with some being licensed, registered orholding an exemption in foreign jurisdictions (see Table 9.11 for examples).
TABLE 9.11 Local/foreign registered CCPs
CCP Location Authorities With Which CCP is Licensed
ASX Clear (Futures) Australia Local: ASIC and RBAForeign: None
CME Clearing Europe UK Local: BoEForeign: None
Eurex Clearing Germany Local: BaFIN and BundesbankForeign: BoE (UK) and pending with CFTC (US)
LCH.Clearnet Limited UK Local: FCA and BoEForeign: CFTC (US), ASIC and RBA (both Australia)plus exemptions in Canada, Germany andSwitzerland.
Source: FSB (April 2014).
9.5 NON-CLEARED OTC DERIVATIVES CONTRACTS
Non-centrally cleared (also known as bilaterally cleared) OTC derivatives transactions areexecuted either between buyer and seller or on a trading platform. The main difference fromcleared OTCD transactions is that these OTCD contracts are processed and risk managedbetween the two trading counterparties. These are legally binding contracts that need to befully documented.
9.5.1 Documentat ion
Trading between any two parties is covered under a set of documents, as shown in Table 9.12.
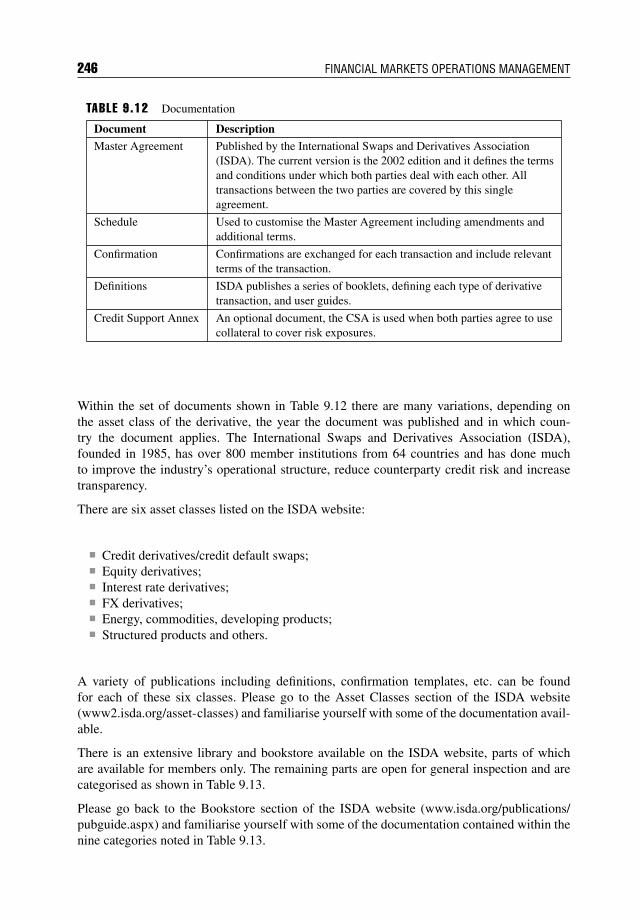
246 FINANCIAL MARKETS OPERATIONS MANAGEMENT
TABLE 9.12 Documentation
Document DescriptionMaster Agreement Published by the International Swaps and Derivatives Association
(ISDA). The current version is the 2002 edition and it defines the termsand conditions under which both parties deal with each other. Alltransactions between the two parties are covered by this singleagreement.
Schedule Used to customise the Master Agreement including amendments andadditional terms.
Confirmation Confirmations are exchanged for each transaction and include relevantterms of the transaction.
Definitions ISDA publishes a series of booklets, defining each type of derivativetransaction, and user guides.
Credit Support Annex An optional document, the CSA is used when both parties agree to usecollateral to cover risk exposures.
Within the set of documents shown in Table 9.12 there are many variations, depending onthe asset class of the derivative, the year the document was published and in which coun-try the document applies. The International Swaps and Derivatives Association (ISDA),founded in 1985, has over 800 member institutions from 64 countries and has done muchto improve the industry’s operational structure, reduce counterparty credit risk and increasetransparency.
There are six asset classes listed on the ISDA website:
Credit derivatives/credit default swaps; Equity derivatives; Interest rate derivatives; FX derivatives; Energy, commodities, developing products; Structured products and others.
A variety of publications including definitions, confirmation templates, etc. can be foundfor each of these six classes. Please go to the Asset Classes section of the ISDA website(www2.isda.org/asset-classes) and familiarise yourself with some of the documentation avail-able.
There is an extensive library and bookstore available on the ISDA website, parts of whichare available for members only. The remaining parts are open for general inspection and arecategorised as shown in Table 9.13.
Please go back to the Bookstore section of the ISDA website (www.isda.org/publications/pubguide.aspx) and familiarise yourself with some of the documentation contained within thenine categories noted in Table 9.13.
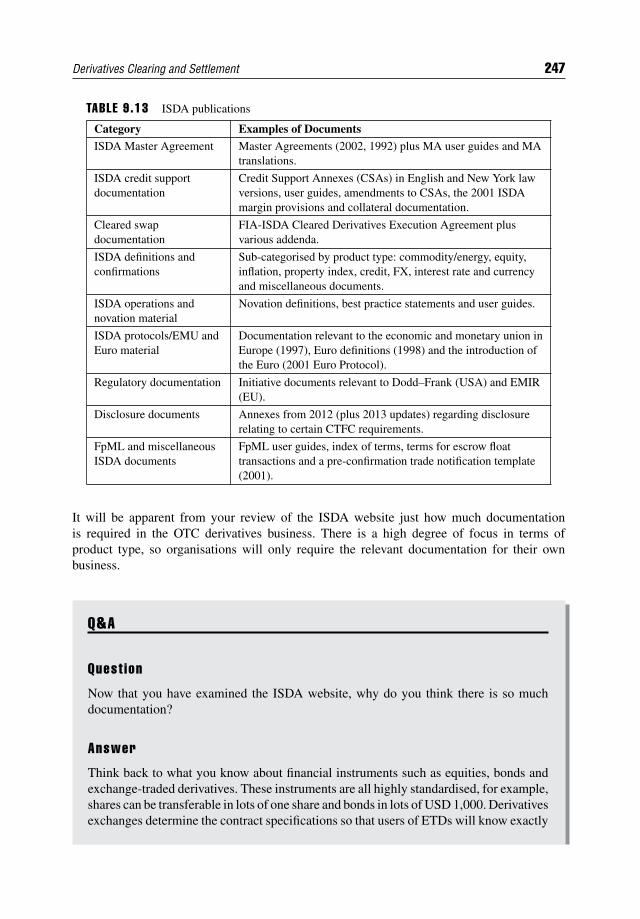
Derivatives Clearing and Settlement 247
TABLE 9.13 ISDA publications
Category Examples of DocumentsISDA Master Agreement Master Agreements (2002, 1992) plus MA user guides and MA
translations.
ISDA credit supportdocumentation
Credit Support Annexes (CSAs) in English and New York lawversions, user guides, amendments to CSAs, the 2001 ISDAmargin provisions and collateral documentation.
Cleared swapdocumentation
FIA-ISDA Cleared Derivatives Execution Agreement plusvarious addenda.
ISDA definitions andconfirmations
Sub-categorised by product type: commodity/energy, equity,inflation, property index, credit, FX, interest rate and currencyand miscellaneous documents.
ISDA operations andnovation material
Novation definitions, best practice statements and user guides.
ISDA protocols/EMU andEuro material
Documentation relevant to the economic and monetary union inEurope (1997), Euro definitions (1998) and the introduction ofthe Euro (2001 Euro Protocol).
Regulatory documentation Initiative documents relevant to Dodd–Frank (USA) and EMIR(EU).
Disclosure documents Annexes from 2012 (plus 2013 updates) regarding disclosurerelating to certain CTFC requirements.
FpML and miscellaneousISDA documents
FpML user guides, index of terms, terms for escrow floattransactions and a pre-confirmation trade notification template(2001).
It will be apparent from your review of the ISDA website just how much documentationis required in the OTC derivatives business. There is a high degree of focus in terms ofproduct type, so organisations will only require the relevant documentation for their ownbusiness.
Q&A
Quest ion
Now that you have examined the ISDA website, why do you think there is so muchdocumentation?
Answer
Think back to what you know about financial instruments such as equities, bonds andexchange-traded derivatives. These instruments are all highly standardised, for example,shares can be transferable in lots of one share and bonds in lots of USD 1,000. Derivativesexchanges determine the contract specifications so that users of ETDs will know exactly
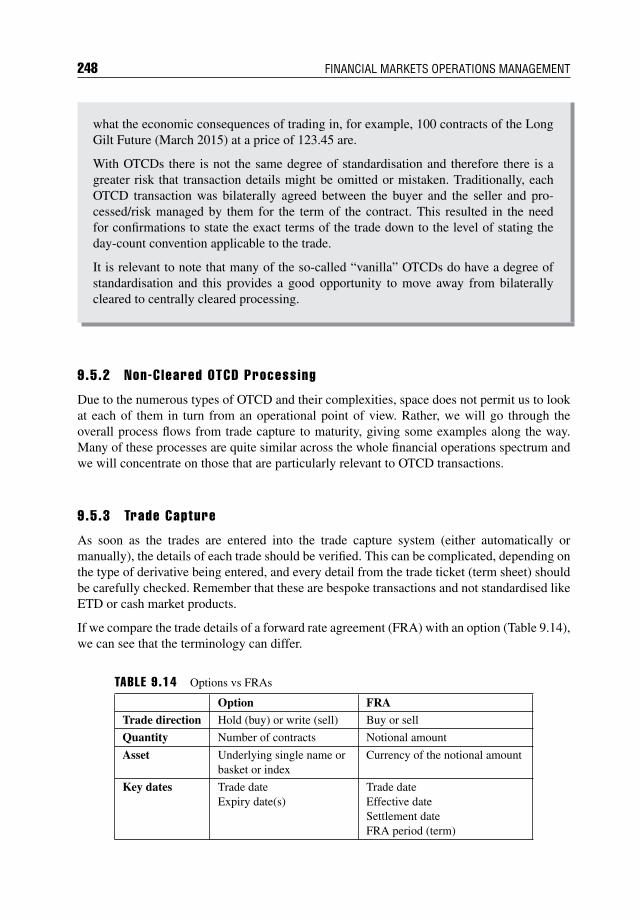
248 FINANCIAL MARKETS OPERATIONS MANAGEMENT
what the economic consequences of trading in, for example, 100 contracts of the LongGilt Future (March 2015) at a price of 123.45 are.
With OTCDs there is not the same degree of standardisation and therefore there is agreater risk that transaction details might be omitted or mistaken. Traditionally, eachOTCD transaction was bilaterally agreed between the buyer and the seller and pro-cessed/risk managed by them for the term of the contract. This resulted in the needfor confirmations to state the exact terms of the trade down to the level of stating theday-count convention applicable to the trade.
It is relevant to note that many of the so-called “vanilla” OTCDs do have a degree ofstandardisation and this provides a good opportunity to move away from bilaterallycleared to centrally cleared processing.
9.5.2 Non-Cleared OTCD Processing
Due to the numerous types of OTCD and their complexities, space does not permit us to lookat each of them in turn from an operational point of view. Rather, we will go through theoverall process flows from trade capture to maturity, giving some examples along the way.Many of these processes are quite similar across the whole financial operations spectrum andwe will concentrate on those that are particularly relevant to OTCD transactions.
9.5.3 Trade Capture
As soon as the trades are entered into the trade capture system (either automatically ormanually), the details of each trade should be verified. This can be complicated, depending onthe type of derivative being entered, and every detail from the trade ticket (term sheet) shouldbe carefully checked. Remember that these are bespoke transactions and not standardised likeETD or cash market products.
If we compare the trade details of a forward rate agreement (FRA) with an option (Table 9.14),we can see that the terminology can differ.
TABLE 9.14 Options vs FRAs
Option FRA
Trade direction Hold (buy) or write (sell) Buy or sell
Quantity Number of contracts Notional amount
Asset Underlying single name orbasket or index
Currency of the notional amount
Key dates Trade dateExpiry date(s)
Trade dateEffective dateSettlement dateFRA period (term)
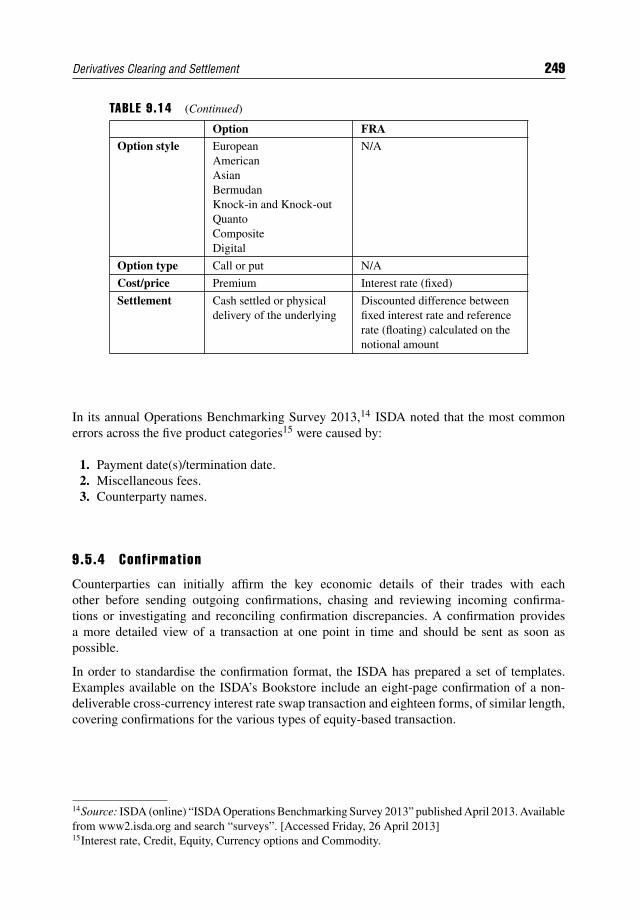
Derivatives Clearing and Settlement 249
TABLE 9.14 (Continued)
Option FRAOption style European
AmericanAsianBermudanKnock-in and Knock-outQuantoCompositeDigital
N/A
Option type Call or put N/A
Cost/price Premium Interest rate (fixed)
Settlement Cash settled or physicaldelivery of the underlying
Discounted difference betweenfixed interest rate and referencerate (floating) calculated on thenotional amount
In its annual Operations Benchmarking Survey 2013,14 ISDA noted that the most commonerrors across the five product categories15 were caused by:
1. Payment date(s)/termination date.2. Miscellaneous fees.3. Counterparty names.
9.5.4 Conf irmat ion
Counterparties can initially affirm the key economic details of their trades with eachother before sending outgoing confirmations, chasing and reviewing incoming confirma-tions or investigating and reconciling confirmation discrepancies. A confirmation providesa more detailed view of a transaction at one point in time and should be sent as soon aspossible.
In order to standardise the confirmation format, the ISDA has prepared a set of templates.Examples available on the ISDA’s Bookstore include an eight-page confirmation of a non-deliverable cross-currency interest rate swap transaction and eighteen forms, of similar length,covering confirmations for the various types of equity-based transaction.
14Source: ISDA (online) “ISDA Operations Benchmarking Survey 2013” published April 2013. Availablefrom www2.isda.org and search “surveys”. [Accessed Friday, 26 April 2013]15Interest rate, Credit, Equity, Currency options and Commodity.
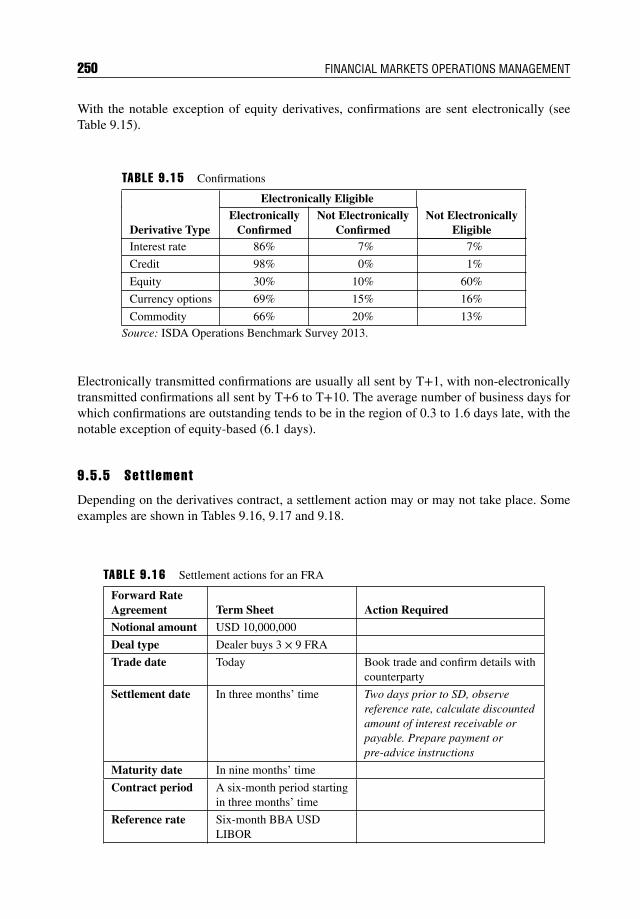
250 FINANCIAL MARKETS OPERATIONS MANAGEMENT
With the notable exception of equity derivatives, confirmations are sent electronically (seeTable 9.15).
TABLE 9.15 Confirmations
Electronically Eligible
Derivative TypeElectronically
ConfirmedNot Electronically
ConfirmedNot Electronically
EligibleInterest rate 86% 7% 7%
Credit 98% 0% 1%
Equity 30% 10% 60%
Currency options 69% 15% 16%
Commodity 66% 20% 13%Source: ISDA Operations Benchmark Survey 2013.
Electronically transmitted confirmations are usually all sent by T+1, with non-electronicallytransmitted confirmations all sent by T+6 to T+10. The average number of business days forwhich confirmations are outstanding tends to be in the region of 0.3 to 1.6 days late, with thenotable exception of equity-based (6.1 days).
9.5.5 Sett lement
Depending on the derivatives contract, a settlement action may or may not take place. Someexamples are shown in Tables 9.16, 9.17 and 9.18.
TABLE 9.16 Settlement actions for an FRA
Forward RateAgreement Term Sheet Action Required
Notional amount USD 10,000,000
Deal type Dealer buys 3 × 9 FRA
Trade date Today Book trade and confirm details withcounterparty
Settlement date In three months’ time Two days prior to SD, observereference rate, calculate discountedamount of interest receivable orpayable. Prepare payment orpre-advice instructions
Maturity date In nine months’ time
Contract period A six-month period startingin three months’ time
Reference rate Six-month BBA USDLIBOR
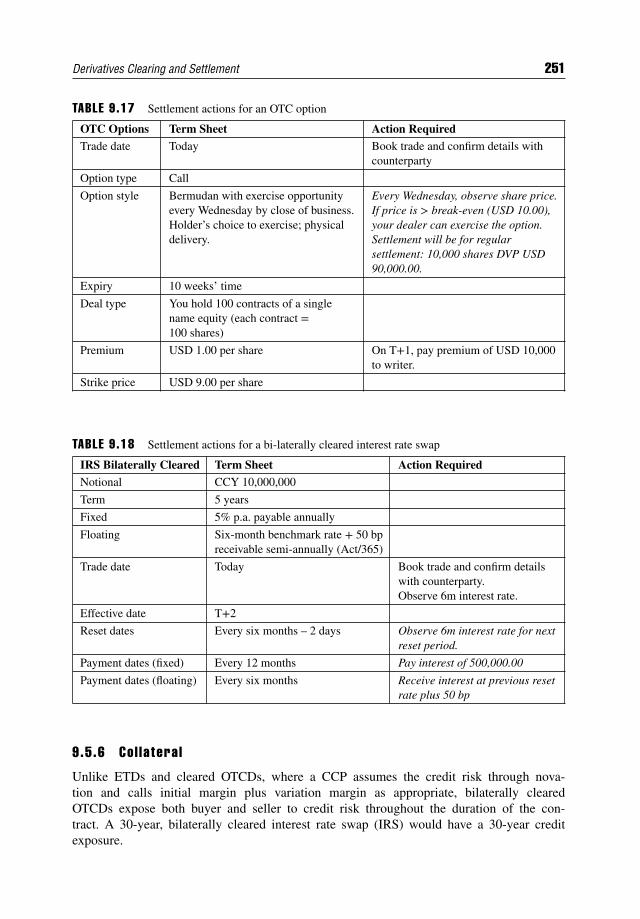
Derivatives Clearing and Settlement 251
TABLE 9.17 Settlement actions for an OTC option
OTC Options Term Sheet Action RequiredTrade date Today Book trade and confirm details with
counterparty
Option type Call
Option style Bermudan with exercise opportunityevery Wednesday by close of business.Holder’s choice to exercise; physicaldelivery.
Every Wednesday, observe share price.If price is > break-even (USD 10.00),your dealer can exercise the option.Settlement will be for regularsettlement: 10,000 shares DVP USD90,000.00.
Expiry 10 weeks’ time
Deal type You hold 100 contracts of a singlename equity (each contract =100 shares)
Premium USD 1.00 per share On T+1, pay premium of USD 10,000to writer.
Strike price USD 9.00 per share
TABLE 9.18 Settlement actions for a bi-laterally cleared interest rate swap
IRS Bilaterally Cleared Term Sheet Action RequiredNotional CCY 10,000,000
Term 5 years
Fixed 5% p.a. payable annually
Floating Six-month benchmark rate + 50 bpreceivable semi-annually (Act/365)
Trade date Today Book trade and confirm detailswith counterparty.Observe 6m interest rate.
Effective date T+2
Reset dates Every six months – 2 days Observe 6m interest rate for nextreset period.
Payment dates (fixed) Every 12 months Pay interest of 500,000.00
Payment dates (floating) Every six months Receive interest at previous resetrate plus 50 bp
9.5.6 Col lateral
Unlike ETDs and cleared OTCDs, where a CCP assumes the credit risk through nova-tion and calls initial margin plus variation margin as appropriate, bilaterally clearedOTCDs expose both buyer and seller to credit risk throughout the duration of the con-tract. A 30-year, bilaterally cleared interest rate swap (IRS) would have a 30-year creditexposure.
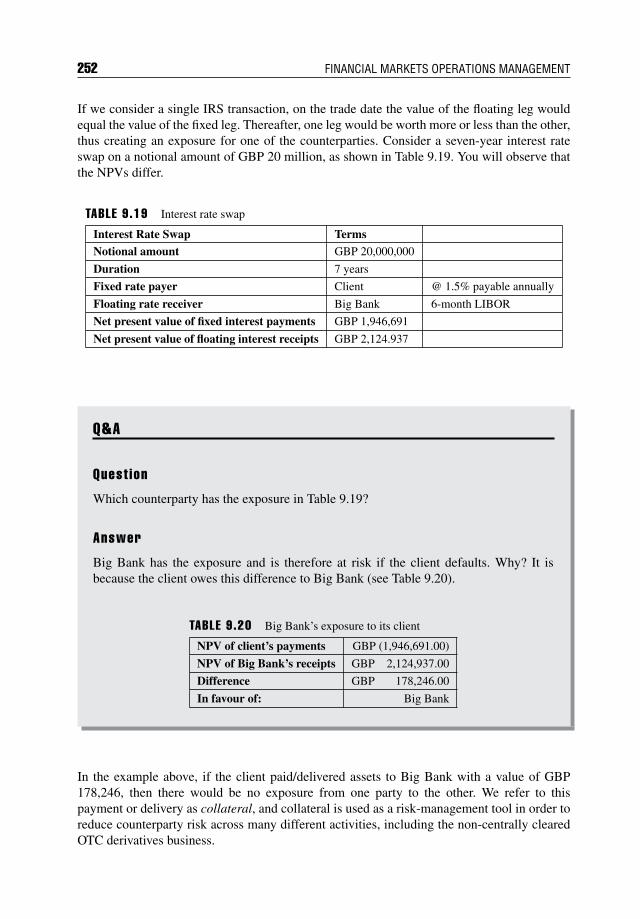
252 FINANCIAL MARKETS OPERATIONS MANAGEMENT
If we consider a single IRS transaction, on the trade date the value of the floating leg wouldequal the value of the fixed leg. Thereafter, one leg would be worth more or less than the other,thus creating an exposure for one of the counterparties. Consider a seven-year interest rateswap on a notional amount of GBP 20 million, as shown in Table 9.19. You will observe thatthe NPVs differ.
TABLE 9.19 Interest rate swap
Interest Rate Swap TermsNotional amount GBP 20,000,000
Duration 7 years
Fixed rate payer Client @ 1.5% payable annually
Floating rate receiver Big Bank 6-month LIBOR
Net present value of fixed interest payments GBP 1,946,691
Net present value of floating interest receipts GBP 2,124.937
Q&A
Quest ion
Which counterparty has the exposure in Table 9.19?
Answer
Big Bank has the exposure and is therefore at risk if the client defaults. Why? It isbecause the client owes this difference to Big Bank (see Table 9.20).
TABLE 9.20 Big Bank’s exposure to its client
NPV of client’s payments GBP (1,946,691.00)
NPV of Big Bank’s receipts GBP 2,124,937.00
Difference GBP 178,246.00
In favour of: Big Bank
In the example above, if the client paid/delivered assets to Big Bank with a value of GBP178,246, then there would be no exposure from one party to the other. We refer to thispayment or delivery as collateral, and collateral is used as a risk-management tool in order toreduce counterparty risk across many different activities, including the non-centrally clearedOTC derivatives business.
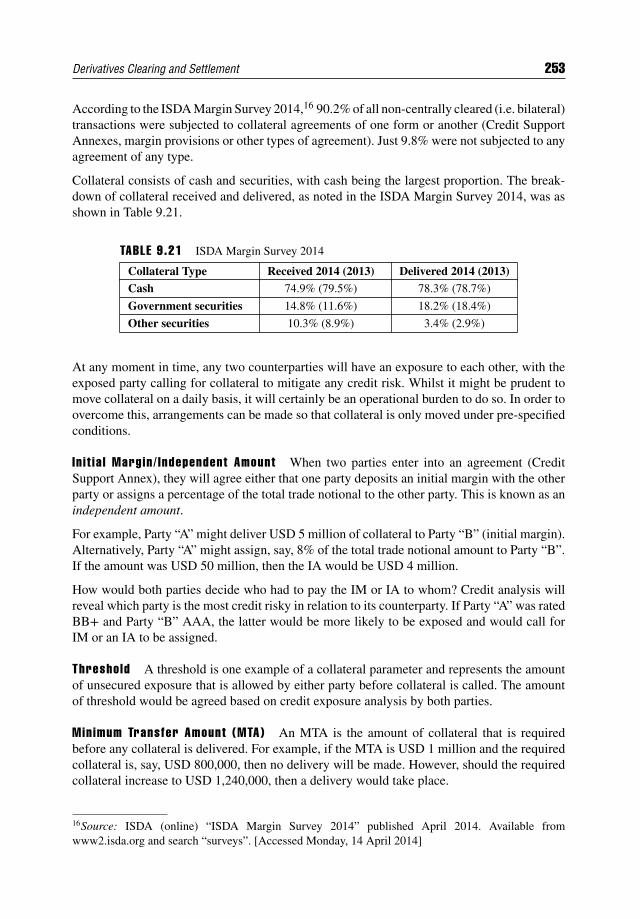
Derivatives Clearing and Settlement 253
According to the ISDA Margin Survey 2014,16 90.2% of all non-centrally cleared (i.e. bilateral)transactions were subjected to collateral agreements of one form or another (Credit SupportAnnexes, margin provisions or other types of agreement). Just 9.8% were not subjected to anyagreement of any type.
Collateral consists of cash and securities, with cash being the largest proportion. The break-down of collateral received and delivered, as noted in the ISDA Margin Survey 2014, was asshown in Table 9.21.
TABLE 9.21 ISDA Margin Survey 2014
Collateral Type Received 2014 (2013) Delivered 2014 (2013)Cash 74.9% (79.5%) 78.3% (78.7%)
Government securities 14.8% (11.6%) 18.2% (18.4%)
Other securities 10.3% (8.9%) 3.4% (2.9%)
At any moment in time, any two counterparties will have an exposure to each other, with theexposed party calling for collateral to mitigate any credit risk. Whilst it might be prudent tomove collateral on a daily basis, it will certainly be an operational burden to do so. In order toovercome this, arrangements can be made so that collateral is only moved under pre-specifiedconditions.
In i t ia l Margin/ Independent Amount When two parties enter into an agreement (CreditSupport Annex), they will agree either that one party deposits an initial margin with the otherparty or assigns a percentage of the total trade notional to the other party. This is known as anindependent amount.
For example, Party “A” might deliver USD 5 million of collateral to Party “B” (initial margin).Alternatively, Party “A” might assign, say, 8% of the total trade notional amount to Party “B”.If the amount was USD 50 million, then the IA would be USD 4 million.
How would both parties decide who had to pay the IM or IA to whom? Credit analysis willreveal which party is the most credit risky in relation to its counterparty. If Party “A” was ratedBB+ and Party “B” AAA, the latter would be more likely to be exposed and would call forIM or an IA to be assigned.
Threshold A threshold is one example of a collateral parameter and represents the amountof unsecured exposure that is allowed by either party before collateral is called. The amountof threshold would be agreed based on credit exposure analysis by both parties.
Minimum Transfer Amount (MTA) An MTA is the amount of collateral that is requiredbefore any collateral is delivered. For example, if the MTA is USD 1 million and the requiredcollateral is, say, USD 800,000, then no delivery will be made. However, should the requiredcollateral increase to USD 1,240,000, then a delivery would take place.
16Source: ISDA (online) “ISDA Margin Survey 2014” published April 2014. Available fromwww2.isda.org and search “surveys”. [Accessed Monday, 14 April 2014]
254 FINANCIAL MARKETS OPERATIONS MANAGEMENT
Rounding Convent ion To avoid making payments for odd amounts, both parties can agreeto round amounts up or down to, say, the nearest USD 100,000. If we take the example in theMinimum Transfer Amount section above, the required collateral delivery of USD 1,240,000would be rounded down to USD 1,200,000.
In September 2013, the Basel Committee on Banking Supervision (BCBS) and the Board ofthe International Organization of Securities Commissioner (IOSCO) jointly published a policyframework that established minimum standards for margin requirements for non-centrallycleared OTCDs.
The requirement to exchange initial margin with a threshold of up to EUR 50 million willcommence from 1 December 2015 and the requirement to exchange variation margin willbecome effective on the same date.
9.5.7 Event Monitor ing
If you refer back to Tables 9.16, 9.17 and 9.18 in Section 9.5.5, you will have noticed thatsome of the items listed in the “Action Required” column were in italic typeface. This wasto denote that these actions should occur once or several times throughout the term of thetransaction. Operations staff must be constantly aware of the possibility that external eventscan and do have an impact on open transactions. These include:
Interest rate resets on interest rate swaps; Corporate action events on underlying assets such as equities and bonds; Exercise events on futures and options (exercise might be optional or automatic); Foreign exchange rates; Public holidays and non-business days (a working day in one market might be a non-
working day in another); Trigger events, such as bankruptcy, that might result in an obligation with predefined
characteristics being delivered against a credit default swap contract.
9.5.8 Reconci l iat ion
Reconciliation covers two areas:
1. Cash (nostro) reconciliation: We cover this topic in Chapter 14.2. Portfolio reconciliation: Matching all trades (and resolving reconciliation breaks)
between two separate counterparties.
Portfo l io Reconci l iat ion Organisations are expected to reconcile their portfolios of bilat-eral OTCD transactions with each of their counterparties. The objective is to make sure that theportfolio contents of both counterparties agree as of any particular date. Furthermore, portfolioreconciliation helps to ensure that collateral disputes do not occur and, if they do, to allow thecollateral function to investigate.
Due to the non-standardised nature of OTCD transaction details, both counterparties need toestablish reconciliation procedures to ensure that they have a consistent set of information on
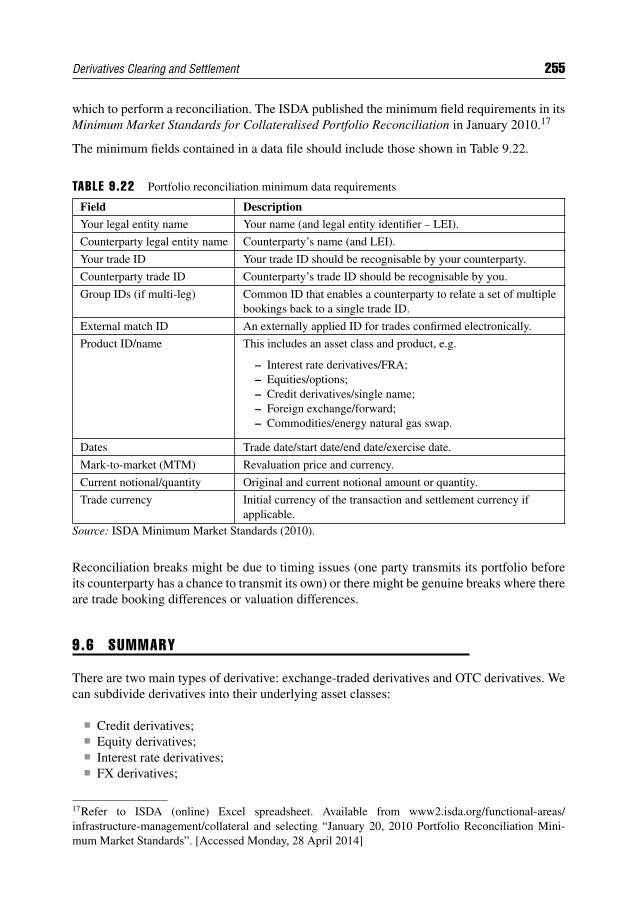
Derivatives Clearing and Settlement 255
which to perform a reconciliation. The ISDA published the minimum field requirements in itsMinimum Market Standards for Collateralised Portfolio Reconciliation in January 2010.17
The minimum fields contained in a data file should include those shown in Table 9.22.
TABLE 9.22 Portfolio reconciliation minimum data requirements
Field Description
Your legal entity name Your name (and legal entity identifier – LEI).
Counterparty legal entity name Counterparty’s name (and LEI).
Your trade ID Your trade ID should be recognisable by your counterparty.
Counterparty trade ID Counterparty’s trade ID should be recognisable by you.
Group IDs (if multi-leg) Common ID that enables a counterparty to relate a set of multiplebookings back to a single trade ID.
External match ID An externally applied ID for trades confirmed electronically.
Product ID/name This includes an asset class and product, e.g.
– Interest rate derivatives/FRA;– Equities/options;– Credit derivatives/single name;– Foreign exchange/forward;– Commodities/energy natural gas swap.
Dates Trade date/start date/end date/exercise date.
Mark-to-market (MTM) Revaluation price and currency.
Current notional/quantity Original and current notional amount or quantity.
Trade currency Initial currency of the transaction and settlement currency ifapplicable.
Source: ISDA Minimum Market Standards (2010).
Reconciliation breaks might be due to timing issues (one party transmits its portfolio beforeits counterparty has a chance to transmit its own) or there might be genuine breaks where thereare trade booking differences or valuation differences.
9.6 SUMMARY
There are two main types of derivative: exchange-traded derivatives and OTC derivatives. Wecan subdivide derivatives into their underlying asset classes:
Credit derivatives; Equity derivatives; Interest rate derivatives; FX derivatives;
17Refer to ISDA (online) Excel spreadsheet. Available from www2.isda.org/functional-areas/infrastructure-management/collateral and selecting “January 20, 2010 Portfolio Reconciliation Mini-mum Market Standards”. [Accessed Monday, 28 April 2014]
256 FINANCIAL MARKETS OPERATIONS MANAGEMENT
Energy, commodities and developing products; Structured products and others.
ETD products are transparent to the industry, highly standardised and designed by the appropri-ate exchange. ETD transactions are dealt on-exchange and cleared through a central counter-party (CCP) which novates each transaction. This novation replaces the original counterpartyrisk exposures with bilateral exposures between the CCP and each counterparty. In order tomanage this risk, CCPs charge their clearing members initial and variation margin (in additionto other financial buffers).
By contrast, OTCD products were tailored to suit the counterparties, traditionally opaque, com-plex and often complicated. Transactions were executed off-exchange by bilateral agreementsbetween buyer and seller. Transactions were processed/managed by the two counterparties toany transaction and may or may not have been collateralised.
OTCDs were therefore regarded by the regulators as being highly risky, especially as transac-tions were not usually reported to the regulators. This situation has been changing over recentyears and especially after the 2007 global financial crisis and the collapse of several marketparticipants, most notably Lehman Brothers. We now have a situation where the OTCD ischanging:
Transactions should be dealt on a trading platform (bilateral negotiation still occurs). Thisis making the OTCD look like an ETD.
All transactions must be reported to a trade repository which holds the “golden copy” ofeach transaction.
All OTCD transactions should be cleared centrally. This works well for the more standard-ised type of OTCD – types that the CCPs are comfortable handling. The more complex,complicated OTCDs are still processed by the counterparties concerned. This is makingthe OTCD look like an ETD.
OTCD transactions that are non-centrally cleared (i.e. bilaterally cleared) are mostly col-lateralised, with cash and government securities being the predominant class of collateral.
Counterparties are expected to reconcile their portfolios with each other on a regularbasis.
The changes in the OTC derivatives business are very much “work in progress” and reg-ular progress reports are published by the Financial Stability Board on its website (www.financialstabilityboard.org/list/fsb_publications/index.htm). The latest progress report § 7 waspublished on 8 April 2014.

PART
Three

CHAPTER 10Custody and the Custodians
10.1 INTRODUCTION
Part Three of the book will take you through the post-settlement environment of safekeeping,asset servicing and asset optimisation.
We have seen in previous chapters that securities are generally no longer certificated; previ-ously certificated securities tend to be either dematerialised or immobilised and newly issuedsecurities might be represented by a single (global) certificate. This move has certainly helpedto ensure that clearing and settlement are straightforward, as sales and purchases are repre-sented by debits and credits across a securities account. We have also noticed that clearingsystems, whether in the form of a clearing house or a central counterparty, play an importantrole. This leaves us with the question of how the securities are held in a safe and secureenvironment.
In much the same way that clearing and settlement take place centrally, so does the safekeeping(or custody) of securities. Securities issued in one particular domestic market will be held bythe relevant local central securities depository. In this chapter we will therefore look at therelationship between the investor (i.e. the beneficial owner), the CSD and the intermediariesthat sit between the investor and the CSD.
By the end of this chapter you will:
Be able to define “custody”; Understand the forms in which securities are issued and the impact on their
safekeeping; Know what a nominee is and how it can be used by the custodians; Appreciate the relationships between the beneficial owner, a local custodian, a global
custodian and the CSD/ICSD; Understand the relationship between beneficial owner and custodian together with the
products and services that are available.
259
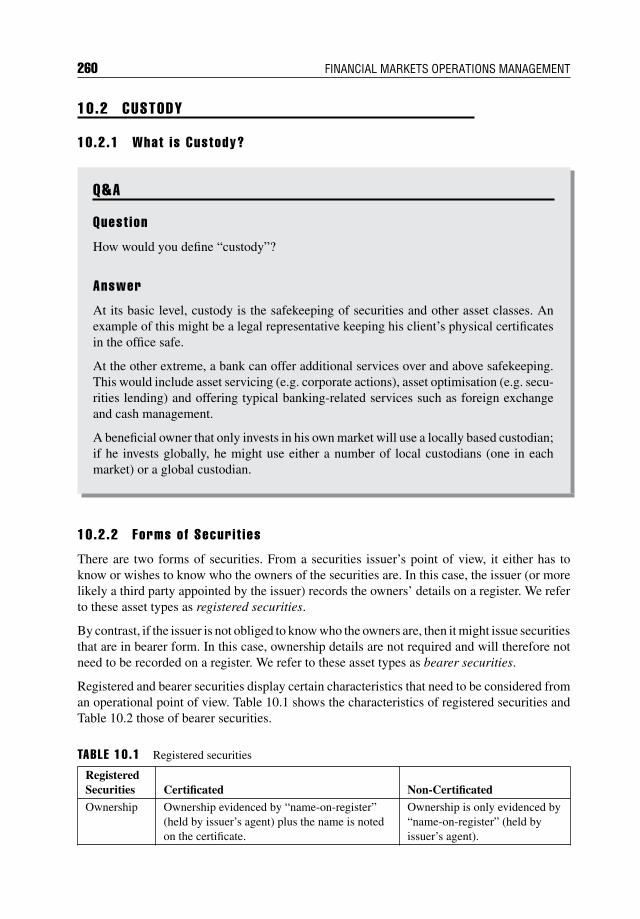
260 FINANCIAL MARKETS OPERATIONS MANAGEMENT
10.2 CUSTODY
10.2.1 What is Custody?
Q&A
Quest ion
How would you define “custody”?
Answer
At its basic level, custody is the safekeeping of securities and other asset classes. Anexample of this might be a legal representative keeping his client’s physical certificatesin the office safe.
At the other extreme, a bank can offer additional services over and above safekeeping.This would include asset servicing (e.g. corporate actions), asset optimisation (e.g. secu-rities lending) and offering typical banking-related services such as foreign exchangeand cash management.
A beneficial owner that only invests in his own market will use a locally based custodian;if he invests globally, he might use either a number of local custodians (one in eachmarket) or a global custodian.
10.2.2 Forms of Securit ies
There are two forms of securities. From a securities issuer’s point of view, it either has toknow or wishes to know who the owners of the securities are. In this case, the issuer (or morelikely a third party appointed by the issuer) records the owners’ details on a register. We referto these asset types as registered securities.
By contrast, if the issuer is not obliged to know who the owners are, then it might issue securitiesthat are in bearer form. In this case, ownership details are not required and will therefore notneed to be recorded on a register. We refer to these asset types as bearer securities.
Registered and bearer securities display certain characteristics that need to be considered froman operational point of view. Table 10.1 shows the characteristics of registered securities andTable 10.2 those of bearer securities.
TABLE 10.1 Registered securities
RegisteredSecurities Certificated Non-Certificated
Ownership Ownership evidenced by “name-on-register”(held by issuer’s agent) plus the name is notedon the certificate.
Ownership is only evidenced by“name-on-register” (held byissuer’s agent).
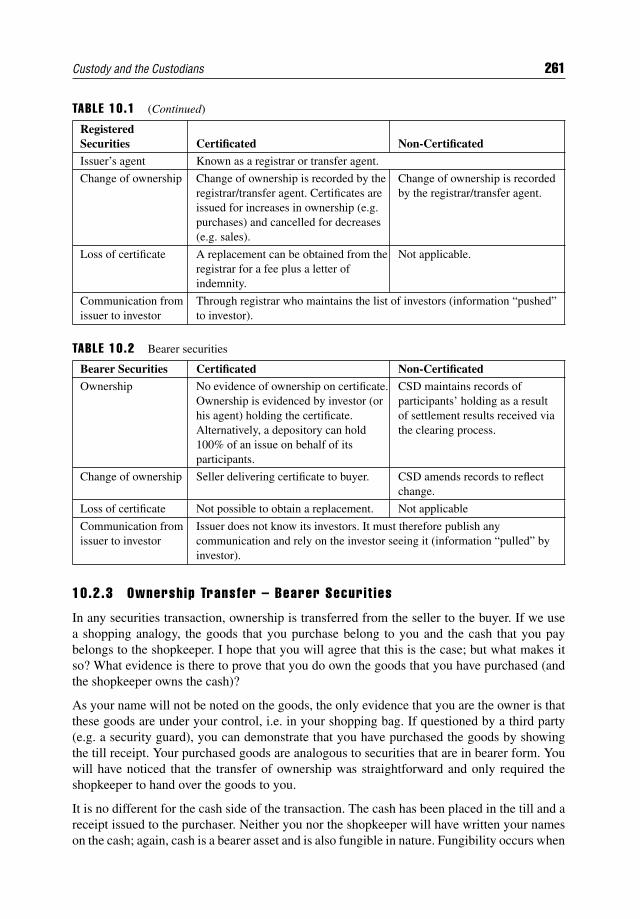
Custody and the Custodians 261
TABLE 10.1 (Continued)
RegisteredSecurities Certificated Non-Certificated
Issuer’s agent Known as a registrar or transfer agent.
Change of ownership Change of ownership is recorded by theregistrar/transfer agent. Certificates areissued for increases in ownership (e.g.purchases) and cancelled for decreases(e.g. sales).
Change of ownership is recordedby the registrar/transfer agent.
Loss of certificate A replacement can be obtained from theregistrar for a fee plus a letter ofindemnity.
Not applicable.
Communication fromissuer to investor
Through registrar who maintains the list of investors (information “pushed”to investor).
TABLE 10.2 Bearer securities
Bearer Securities Certificated Non-Certificated
Ownership No evidence of ownership on certificate.Ownership is evidenced by investor (orhis agent) holding the certificate.Alternatively, a depository can hold100% of an issue on behalf of itsparticipants.
CSD maintains records ofparticipants’ holding as a resultof settlement results received viathe clearing process.
Change of ownership Seller delivering certificate to buyer. CSD amends records to reflectchange.
Loss of certificate Not possible to obtain a replacement. Not applicable
Communication fromissuer to investor
Issuer does not know its investors. It must therefore publish anycommunication and rely on the investor seeing it (information “pulled” byinvestor).
10.2.3 Ownership Transfer – Bearer Securit ies
In any securities transaction, ownership is transferred from the seller to the buyer. If we usea shopping analogy, the goods that you purchase belong to you and the cash that you paybelongs to the shopkeeper. I hope that you will agree that this is the case; but what makes itso? What evidence is there to prove that you do own the goods that you have purchased (andthe shopkeeper owns the cash)?
As your name will not be noted on the goods, the only evidence that you are the owner is thatthese goods are under your control, i.e. in your shopping bag. If questioned by a third party(e.g. a security guard), you can demonstrate that you have purchased the goods by showingthe till receipt. Your purchased goods are analogous to securities that are in bearer form. Youwill have noticed that the transfer of ownership was straightforward and only required theshopkeeper to hand over the goods to you.
It is no different for the cash side of the transaction. The cash has been placed in the till and areceipt issued to the purchaser. Neither you nor the shopkeeper will have written your nameson the cash; again, cash is a bearer asset and is also fungible in nature. Fungibility occurs when
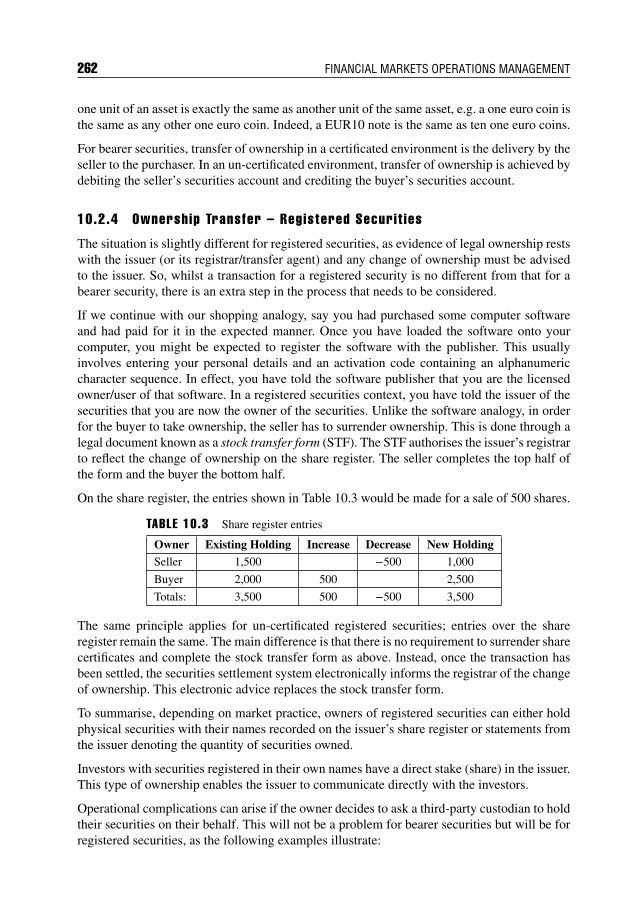
262 FINANCIAL MARKETS OPERATIONS MANAGEMENT
one unit of an asset is exactly the same as another unit of the same asset, e.g. a one euro coin isthe same as any other one euro coin. Indeed, a EUR10 note is the same as ten one euro coins.
For bearer securities, transfer of ownership in a certificated environment is the delivery by theseller to the purchaser. In an un-certificated environment, transfer of ownership is achieved bydebiting the seller’s securities account and crediting the buyer’s securities account.
10.2.4 Ownership Transfer – Registered Securit ies
The situation is slightly different for registered securities, as evidence of legal ownership restswith the issuer (or its registrar/transfer agent) and any change of ownership must be advisedto the issuer. So, whilst a transaction for a registered security is no different from that for abearer security, there is an extra step in the process that needs to be considered.
If we continue with our shopping analogy, say you had purchased some computer softwareand had paid for it in the expected manner. Once you have loaded the software onto yourcomputer, you might be expected to register the software with the publisher. This usuallyinvolves entering your personal details and an activation code containing an alphanumericcharacter sequence. In effect, you have told the software publisher that you are the licensedowner/user of that software. In a registered securities context, you have told the issuer of thesecurities that you are now the owner of the securities. Unlike the software analogy, in orderfor the buyer to take ownership, the seller has to surrender ownership. This is done through alegal document known as a stock transfer form (STF). The STF authorises the issuer’s registrarto reflect the change of ownership on the share register. The seller completes the top half ofthe form and the buyer the bottom half.
On the share register, the entries shown in Table 10.3 would be made for a sale of 500 shares.
TABLE 10.3 Share register entries
Owner Existing Holding Increase Decrease New HoldingSeller 1,500 −500 1,000
Buyer 2,000 500 2,500
Totals: 3,500 500 −500 3,500
The same principle applies for un-certificated registered securities; entries over the shareregister remain the same. The main difference is that there is no requirement to surrender sharecertificates and complete the stock transfer form as above. Instead, once the transaction hasbeen settled, the securities settlement system electronically informs the registrar of the changeof ownership. This electronic advice replaces the stock transfer form.
To summarise, depending on market practice, owners of registered securities can either holdphysical securities with their names recorded on the issuer’s share register or statements fromthe issuer denoting the quantity of securities owned.
Investors with securities registered in their own names have a direct stake (share) in the issuer.This type of ownership enables the issuer to communicate directly with the investors.
Operational complications can arise if the owner decides to ask a third-party custodian to holdtheir securities on their behalf. This will not be a problem for bearer securities but will be forregistered securities, as the following examples illustrate:
Custody and the Custodians 263
The owner wishes to sell some or all of his holding. The owner will request his brokerto execute the sale and request his custodian either to deliver the physical securities orelectronically transfer the securities to the broker. If the securities are in physical form,this will require a stock transfer form to be completed by the owner and delivered to hiscustodian. This can take time and might lead to a delay in the settlement process.
The issuer sends a communication to the owner and requires a response. This communi-cation will be sent to the owner at the address recorded on the register. The custodian willnot be aware of this and may not be in a position to help the owner if a problem arises.
If the owner has a problem (e.g. a dividend has not been received), he has to contact theissuer. His custodian may not be able to investigate on his behalf, as the issuer would onlyrecognise the owner and not the custodian.
From these three examples you might correctly assume that the custodian will have operationalissues when holding securities for owners that are registered in the owners’ own names. Thereare alternative ways that owners can hold their securities:
1. Re-register the securities in the name of the custodian.2. Re-register the securities in the name of a nominee managed by the custodian.
We will look at these in turn below.
10.3 HOLDING SECURIT IES
10.3.1 Register in the Custodian ’s Name
If the owner decides to re-register his securities in the name of his custodian, legally he issurrendering ownership to that custodian. Now the issuer communicates directly with thecustodian and no longer with the original owner. From an operational point of view, thischange would enable the custodian to settle and administer the securities. It only requiresa single instruction/communication with the owner rather than potentially several which theabove examples might require.
The biggest risk for the owner, however, is that the custodian is now the legal owner of thesecurities and if the custodian were to default, it might be difficult or impossible to demonstratethat the custodian’s customer was, in fact, the legal owner.
What is required is the separation of legal ownership from beneficial ownership. Where theowner’s name is on the shareholder register, both types of ownership are combined. Theobjective is to enable the owner to retain beneficial ownership and the custodian to obtain legalownership. This is where the concept of a nominee account comes in.
Having stocks recorded in the investor’s own name at the central securities depository isuncommon, but not impossible, in most countries. There are some exceptions, such as inSingapore, where most local brokerage accounts require investors to have their own accountat the central depository (CDP), or in the UK, where the process of having a personal accountat CREST is straightforward, if rarely done by most investors.
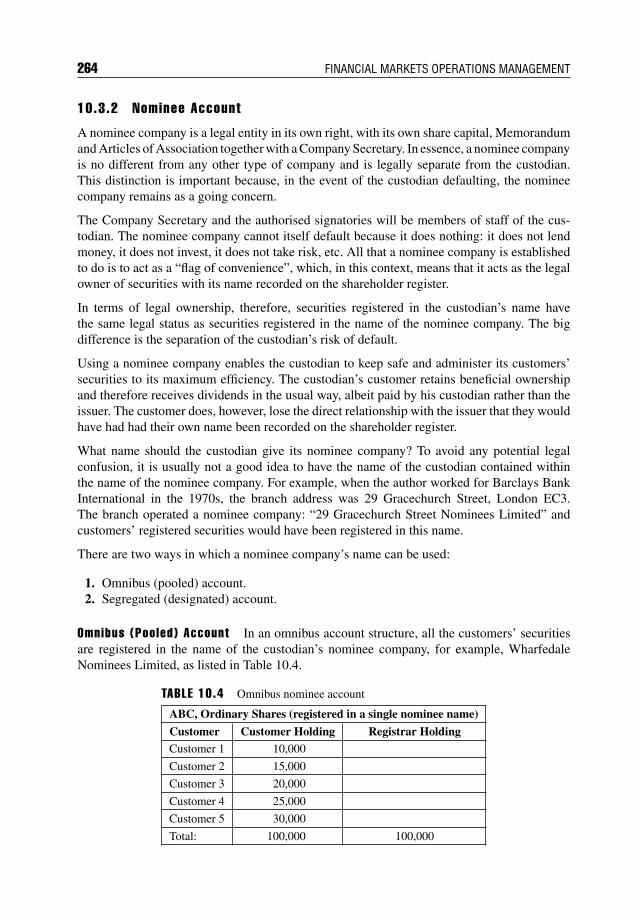
264 FINANCIAL MARKETS OPERATIONS MANAGEMENT
10.3.2 Nominee Account
A nominee company is a legal entity in its own right, with its own share capital, Memorandumand Articles of Association together with a Company Secretary. In essence, a nominee companyis no different from any other type of company and is legally separate from the custodian.This distinction is important because, in the event of the custodian defaulting, the nomineecompany remains as a going concern.
The Company Secretary and the authorised signatories will be members of staff of the cus-todian. The nominee company cannot itself default because it does nothing: it does not lendmoney, it does not invest, it does not take risk, etc. All that a nominee company is establishedto do is to act as a “flag of convenience”, which, in this context, means that it acts as the legalowner of securities with its name recorded on the shareholder register.
In terms of legal ownership, therefore, securities registered in the custodian’s name havethe same legal status as securities registered in the name of the nominee company. The bigdifference is the separation of the custodian’s risk of default.
Using a nominee company enables the custodian to keep safe and administer its customers’securities to its maximum efficiency. The custodian’s customer retains beneficial ownershipand therefore receives dividends in the usual way, albeit paid by his custodian rather than theissuer. The customer does, however, lose the direct relationship with the issuer that they wouldhave had had their own name been recorded on the shareholder register.
What name should the custodian give its nominee company? To avoid any potential legalconfusion, it is usually not a good idea to have the name of the custodian contained withinthe name of the nominee company. For example, when the author worked for Barclays BankInternational in the 1970s, the branch address was 29 Gracechurch Street, London EC3.The branch operated a nominee company: “29 Gracechurch Street Nominees Limited” andcustomers’ registered securities would have been registered in this name.
There are two ways in which a nominee company’s name can be used:
1. Omnibus (pooled) account.2. Segregated (designated) account.
Omnibus (Pooled) Account In an omnibus account structure, all the customers’ securitiesare registered in the name of the custodian’s nominee company, for example, WharfedaleNominees Limited, as listed in Table 10.4.
TABLE 10.4 Omnibus nominee account
ABC, Ordinary Shares (registered in a single nominee name)
Customer Customer Holding Registrar HoldingCustomer 1 10,000
Customer 2 15,000
Customer 3 20,000
Customer 4 25,000
Customer 5 30,000
Total: 100,000 100,000
Custody and the Custodians 265
The following points should be noted:
All five customers beneficially own a total of 100,000 shares, with each customer’s sharescommingled within the omnibus account.
The registrar has 100,000 shares recorded on its shareholder register, with the legal ownerbeing the nominee company.
If a dividend is paid by ABC of GBP 1 per share, the issuer’s paying agent will pay thenominee company GBP 100,000 and the nominee company will apportion that singledividend payment across each of the customers’ cash accounts in proportion to theirholdings.
If, for example, Customer 4 sells its holding of 25,000 shares, there will be sufficientshares in the account from which to make a delivery.
Q&A
Quest ion
As a custodian, what action would you take if (a) Customer 3 purchased 30,000 ABCshares and sold 100,000 ABC shares, and if (b) on the settlement date the purchase didnot settle?
Answer
It would be technically possible to make a delivery of 100,000 ABC shares, as thereare 100,000 shares recorded on the shareholder register. However, only 20,000 sharesin this account are held to the order of Customer 3 and therefore the custodian’s choicesare either to wait until the purchase settles or to offer a partial delivery (20,000 shares)to the buyer.
It would therefore be wrong to deliver the 100,000 shares, as you do not have theauthority from the other customers to deliver their shares. If the custodian did deliverthe 100,000 shares and any one of the other customers decided to sell, then you certainlywould not be able to make the delivery on behalf of the other customers on the intendedsettlement date.
The only exception to this would be if all the customers had agreed in writing to maketheir securities available for securities lending and borrowing purposes. In this case, thecustodian would make the full delivery of 100,000 shares and pay a lending fee to thecustomers who have collectively loaned 80,000 shares.
Segregated (Designated) Account As an alternative to the omnibus account structure,customers can request that their securities are held separately from other customers. In thiscase, the securities will be registered in several nominee names; the name of the nomineecompany remains the same, but a designation is added to that name. In this case, there
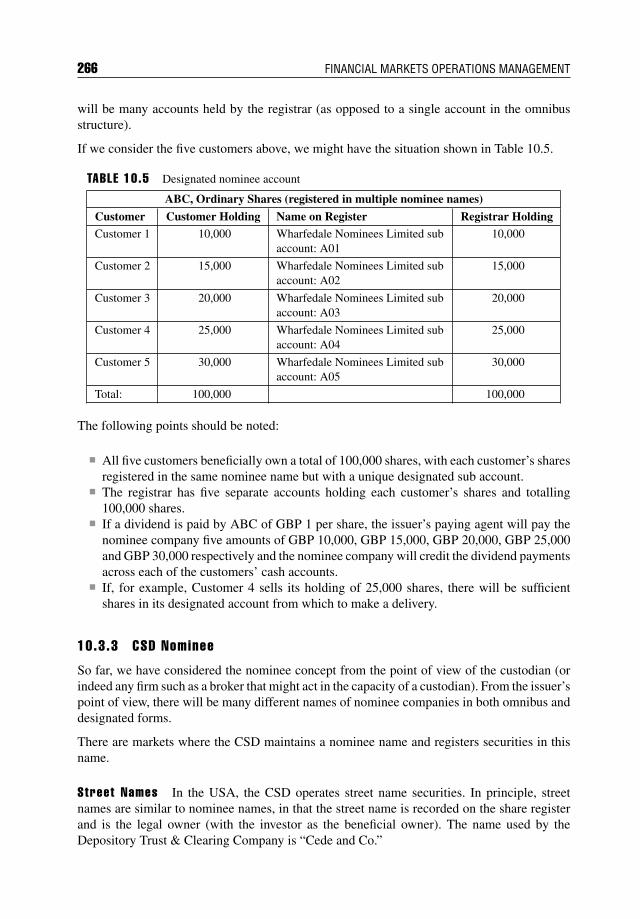
266 FINANCIAL MARKETS OPERATIONS MANAGEMENT
will be many accounts held by the registrar (as opposed to a single account in the omnibusstructure).
If we consider the five customers above, we might have the situation shown in Table 10.5.
TABLE 10.5 Designated nominee account
ABC, Ordinary Shares (registered in multiple nominee names)
Customer Customer Holding Name on Register Registrar HoldingCustomer 1 10,000 Wharfedale Nominees Limited sub
account: A0110,000
Customer 2 15,000 Wharfedale Nominees Limited subaccount: A02
15,000
Customer 3 20,000 Wharfedale Nominees Limited subaccount: A03
20,000
Customer 4 25,000 Wharfedale Nominees Limited subaccount: A04
25,000
Customer 5 30,000 Wharfedale Nominees Limited subaccount: A05
30,000
Total: 100,000 100,000
The following points should be noted:
All five customers beneficially own a total of 100,000 shares, with each customer’s sharesregistered in the same nominee name but with a unique designated sub account.
The registrar has five separate accounts holding each customer’s shares and totalling100,000 shares.
If a dividend is paid by ABC of GBP 1 per share, the issuer’s paying agent will pay thenominee company five amounts of GBP 10,000, GBP 15,000, GBP 20,000, GBP 25,000and GBP 30,000 respectively and the nominee company will credit the dividend paymentsacross each of the customers’ cash accounts.
If, for example, Customer 4 sells its holding of 25,000 shares, there will be sufficientshares in its designated account from which to make a delivery.
10.3.3 CSD Nominee
So far, we have considered the nominee concept from the point of view of the custodian (orindeed any firm such as a broker that might act in the capacity of a custodian). From the issuer’spoint of view, there will be many different names of nominee companies in both omnibus anddesignated forms.
There are markets where the CSD maintains a nominee name and registers securities in thisname.
Street Names In the USA, the CSD operates street name securities. In principle, streetnames are similar to nominee names, in that the street name is recorded on the share registerand is the legal owner (with the investor as the beneficial owner). The name used by theDepository Trust & Clearing Company is “Cede and Co.”
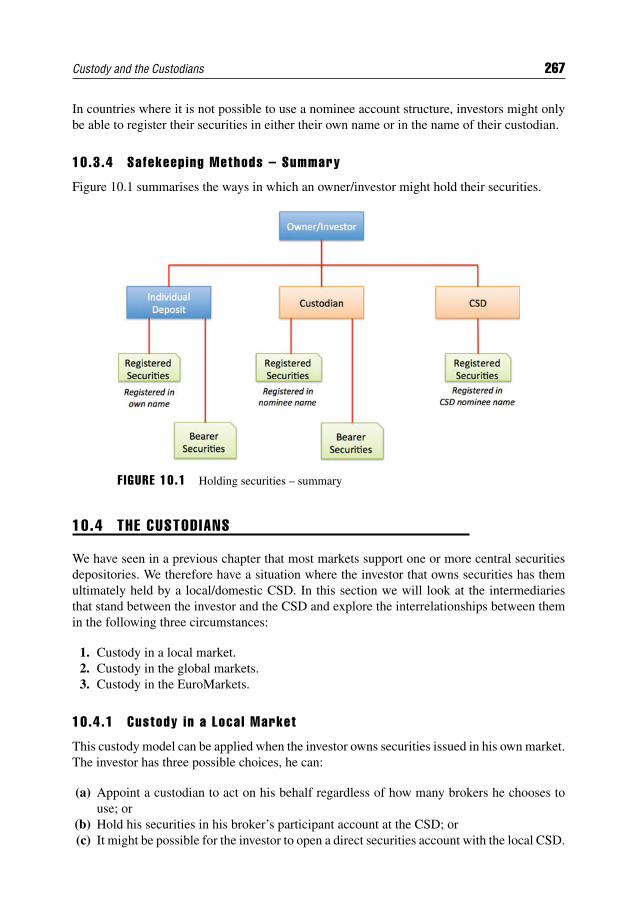
Custody and the Custodians 267
In countries where it is not possible to use a nominee account structure, investors might onlybe able to register their securities in either their own name or in the name of their custodian.
10.3.4 Safekeeping Methods – Summary
Figure 10.1 summarises the ways in which an owner/investor might hold their securities.
F IGURE 10.1 Holding securities – summary
10.4 THE CUSTODIANS
We have seen in a previous chapter that most markets support one or more central securitiesdepositories. We therefore have a situation where the investor that owns securities has themultimately held by a local/domestic CSD. In this section we will look at the intermediariesthat stand between the investor and the CSD and explore the interrelationships between themin the following three circumstances:
1. Custody in a local market.2. Custody in the global markets.3. Custody in the EuroMarkets.
10.4.1 Custody in a Local Market
This custody model can be applied when the investor owns securities issued in his own market.The investor has three possible choices, he can:
(a) Appoint a custodian to act on his behalf regardless of how many brokers he chooses touse; or
(b) Hold his securities in his broker’s participant account at the CSD; or(c) It might be possible for the investor to open a direct securities account with the local CSD.
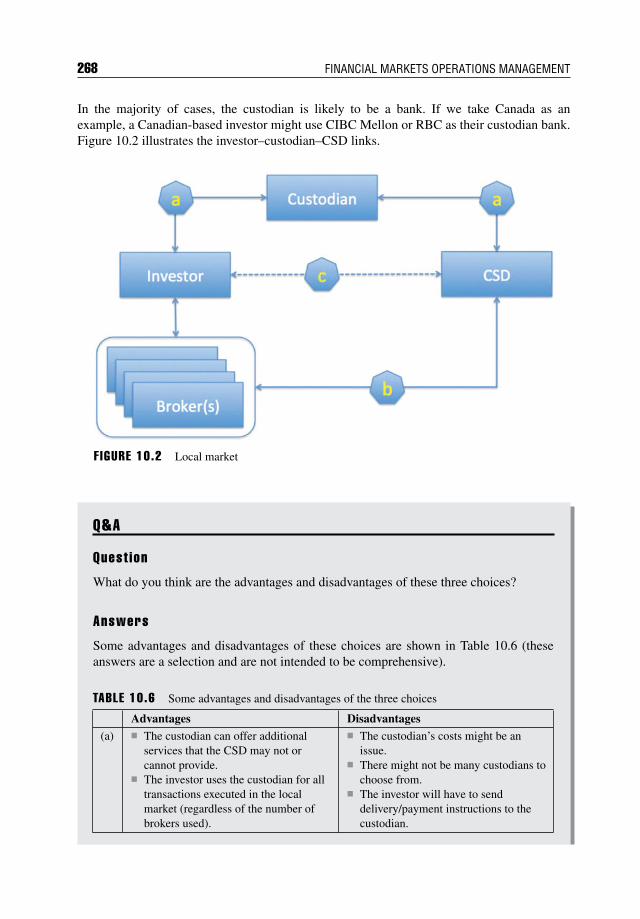
268 FINANCIAL MARKETS OPERATIONS MANAGEMENT
In the majority of cases, the custodian is likely to be a bank. If we take Canada as anexample, a Canadian-based investor might use CIBC Mellon or RBC as their custodian bank.Figure 10.2 illustrates the investor–custodian–CSD links.
F IGURE 10.2 Local market
Q&A
Quest ion
What do you think are the advantages and disadvantages of these three choices?
Answers
Some advantages and disadvantages of these choices are shown in Table 10.6 (theseanswers are a selection and are not intended to be comprehensive).
TABLE 10.6 Some advantages and disadvantages of the three choices
Advantages Disadvantages
(a) The custodian can offer additionalservices that the CSD may not orcannot provide.
The investor uses the custodian for alltransactions executed in the localmarket (regardless of the number ofbrokers used).
The custodian’s costs might be anissue.
There might not be many custodians tochoose from.
The investor will have to senddelivery/payment instructions to thecustodian.
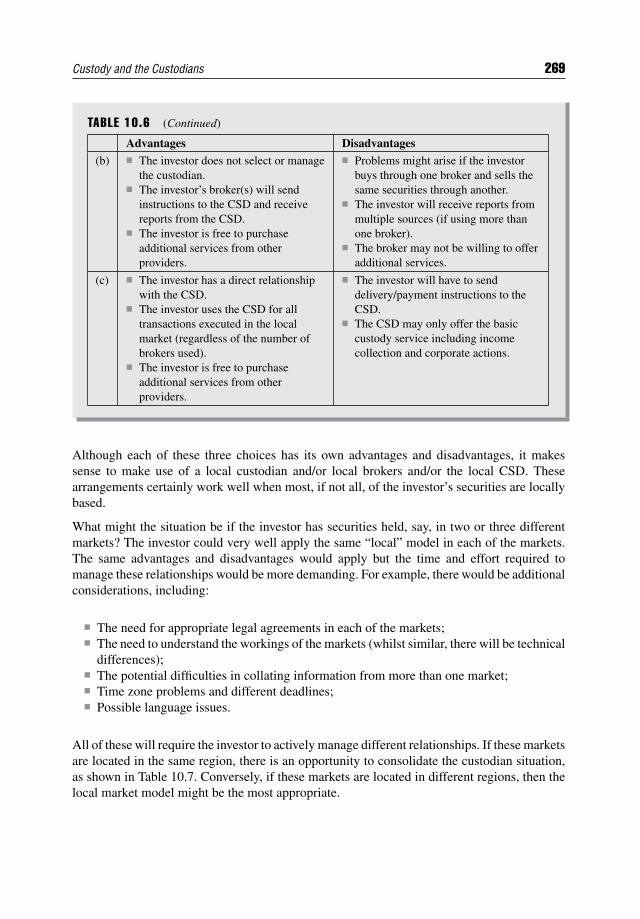
Custody and the Custodians 269
TABLE 10.6 (Continued)
Advantages Disadvantages
(b) The investor does not select or managethe custodian.
The investor’s broker(s) will sendinstructions to the CSD and receivereports from the CSD.
The investor is free to purchaseadditional services from otherproviders.
Problems might arise if the investorbuys through one broker and sells thesame securities through another.
The investor will receive reports frommultiple sources (if using more thanone broker).
The broker may not be willing to offeradditional services.
(c) The investor has a direct relationshipwith the CSD.
The investor uses the CSD for alltransactions executed in the localmarket (regardless of the number ofbrokers used).
The investor is free to purchaseadditional services from otherproviders.
The investor will have to senddelivery/payment instructions to theCSD.
The CSD may only offer the basiccustody service including incomecollection and corporate actions.
Although each of these three choices has its own advantages and disadvantages, it makessense to make use of a local custodian and/or local brokers and/or the local CSD. Thesearrangements certainly work well when most, if not all, of the investor’s securities are locallybased.
What might the situation be if the investor has securities held, say, in two or three differentmarkets? The investor could very well apply the same “local” model in each of the markets.The same advantages and disadvantages would apply but the time and effort required tomanage these relationships would be more demanding. For example, there would be additionalconsiderations, including:
The need for appropriate legal agreements in each of the markets; The need to understand the workings of the markets (whilst similar, there will be technical
differences); The potential difficulties in collating information from more than one market; Time zone problems and different deadlines; Possible language issues.
All of these will require the investor to actively manage different relationships. If these marketsare located in the same region, there is an opportunity to consolidate the custodian situation,as shown in Table 10.7. Conversely, if these markets are located in different regions, then thelocal market model might be the most appropriate.
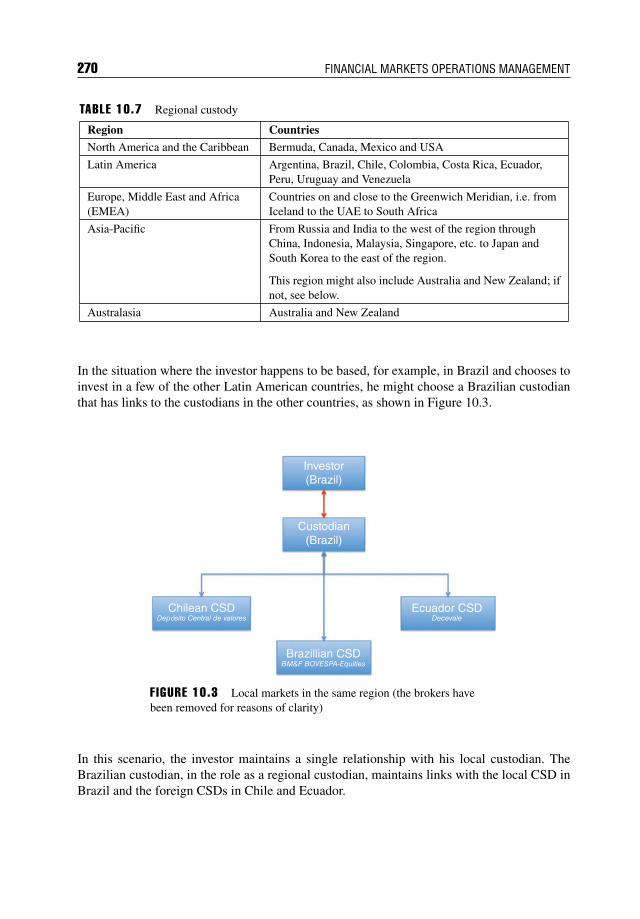
270 FINANCIAL MARKETS OPERATIONS MANAGEMENT
TABLE 10.7 Regional custody
Region Countries
North America and the Caribbean Bermuda, Canada, Mexico and USA
Latin America Argentina, Brazil, Chile, Colombia, Costa Rica, Ecuador,Peru, Uruguay and Venezuela
Europe, Middle East and Africa(EMEA)
Countries on and close to the Greenwich Meridian, i.e. fromIceland to the UAE to South Africa
Asia-Pacific From Russia and India to the west of the region throughChina, Indonesia, Malaysia, Singapore, etc. to Japan andSouth Korea to the east of the region.
This region might also include Australia and New Zealand; ifnot, see below.
Australasia Australia and New Zealand
In the situation where the investor happens to be based, for example, in Brazil and chooses toinvest in a few of the other Latin American countries, he might choose a Brazilian custodianthat has links to the custodians in the other countries, as shown in Figure 10.3.
Investor(Brazil)
Custodian(Brazil)
Chilean CSDDepósito Central de valores
Brazillian CSDBM&F BOVESPA-Equities
Ecuador CSDDecevale
F IGURE 10.3 Local markets in the same region (the brokers havebeen removed for reasons of clarity)
In this scenario, the investor maintains a single relationship with his local custodian. TheBrazilian custodian, in the role as a regional custodian, maintains links with the local CSD inBrazil and the foreign CSDs in Chile and Ecuador.
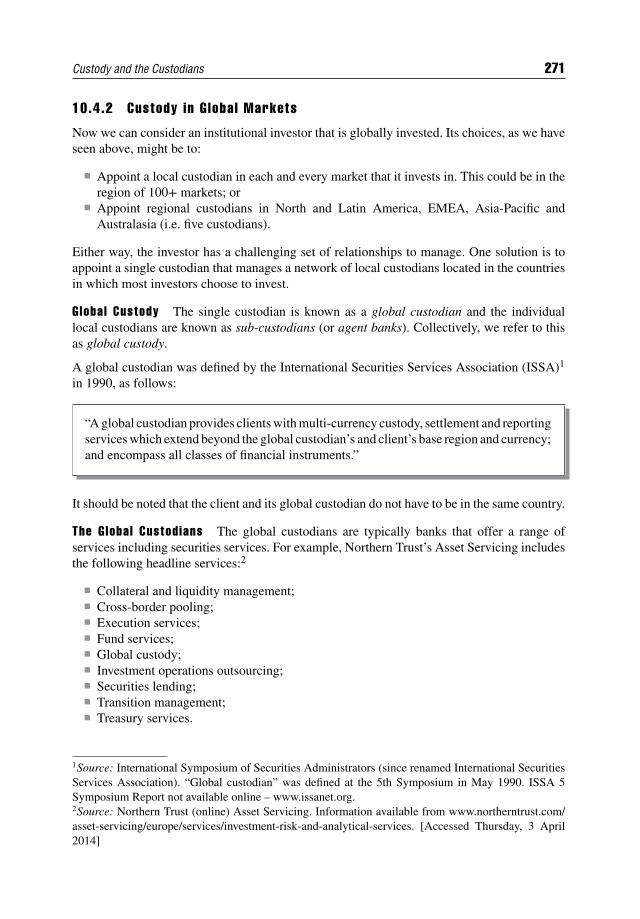
Custody and the Custodians 271
10.4.2 Custody in Global Markets
Now we can consider an institutional investor that is globally invested. Its choices, as we haveseen above, might be to:
Appoint a local custodian in each and every market that it invests in. This could be in theregion of 100+ markets; or
Appoint regional custodians in North and Latin America, EMEA, Asia-Pacific andAustralasia (i.e. five custodians).
Either way, the investor has a challenging set of relationships to manage. One solution is toappoint a single custodian that manages a network of local custodians located in the countriesin which most investors choose to invest.
Global Custody The single custodian is known as a global custodian and the individuallocal custodians are known as sub-custodians (or agent banks). Collectively, we refer to thisas global custody.
A global custodian was defined by the International Securities Services Association (ISSA)1
in 1990, as follows:
“A global custodian provides clients with multi-currency custody, settlement and reportingservices which extend beyond the global custodian’s and client’s base region and currency;and encompass all classes of financial instruments.”
It should be noted that the client and its global custodian do not have to be in the same country.
The Global Custodians The global custodians are typically banks that offer a range ofservices including securities services. For example, Northern Trust’s Asset Servicing includesthe following headline services:2
Collateral and liquidity management; Cross-border pooling; Execution services; Fund services; Global custody; Investment operations outsourcing; Securities lending; Transition management; Treasury services.
1Source: International Symposium of Securities Administrators (since renamed International SecuritiesServices Association). “Global custodian” was defined at the 5th Symposium in May 1990. ISSA 5Symposium Report not available online – www.issanet.org.2Source: Northern Trust (online) Asset Servicing. Information available from www.northerntrust.com/asset-servicing/europe/services/investment-risk-and-analytical-services. [Accessed Thursday, 3 April2014]
272 FINANCIAL MARKETS OPERATIONS MANAGEMENT
Gauging the size of the business is difficult, but it is estimated that the key figure, assets undercustody (AUC), exceeds USD 140 trillion, with the top ten global custodians holding around80% of this. The top five global custodians are shown in Table 10.8.
TABLE 10.8 Assets under custody
Rank Provider AUC (USD Billions)
1 BNY Mellon 27,900
2 J.P. Morgan 21,000
3 State Street 20,996
4 Citi 14,500
5 BNP Paribas 8,986
Source: © 2014 globalcustody.net. Reproducedwith consent. Extract from: www.globalcustody.net as at Wednesday, 16 July 2014.
Global Custody Structure As you will observe in Figure 10.4, the client has one relation-ship to manage; this is with the global custodian. For the global custodian, in addition to itsclients, it has to manage its network of sub-custodians, each of which represents the entrypoint into the relevant market (e.g. clearing systems and CSDs).
F IGURE 10.4 Global custody structure: sub-custodian network
The network consists of banks that operate in a particular market and whose clients are theglobal custodians. Please note that the same banks can act as local custodians, as explainedabove.
Custody and the Custodians 273
An example of a sub-custodian network is that of HSBC Securities Services3 in Table 10.9.
TABLE 10.9 HSBC Securities Services acting as a local custodian
Region Countries
Asia-Pacific (in 16 countries) Australia, Bangladesh, China (Shanghai and Shenzhen), HongKong SAR, India, Indonesia, Japan, Malaysia, New Zealand,Philippines, Singapore, Sri Lanka, South Korea, Taiwan, Thailandand Vietnam.
Europe (in 7 countries) Cyprus, Germany, Greece, Kazakhstan, Malta, Turkey and UnitedKingdom.
Americas (in 4 countries) Argentina, Bermuda, Brazil and Mexico.
Middle East and North Africa(in 11 countries)
Bahrain, Egypt, Jordan, Kuwait, Lebanon, Mauritius, Oman,Palestine, Qatar, Saudi Arabia and United Arab Emirates.
In addition to HSBC Securities Services, other banks that act as sub-custodians in multiplelocations include:
Citi BNP Paribas Deutsche Bank Standard Chartered Bank.
The Cl ients The main types of institutional investor that purchase global custody servicestend to be:
Investment managers (including sovereign wealth funds and hedge funds), who use exter-nal custodians to handle their client business across the globe.
Institutional investors (e.g. pension funds, insurance companies and charities): Pension funds can be self-invested but are more likely to use investment managers.
Using a global custodian can ensure that information is consolidated by the custodianon behalf of the pension fund.
Insurance companies use external custodians to handle their client business across theglobe.
Institutional funds (e.g. mutual funds, sicavs, hedge funds, private equity funds, etc.),which use external custodians to handle their business across the globe.
Custodian banks looking to appoint sub-custodian agents in those markets where theglobal custodian does not have suitable branches. It is therefore likely that some globalcustodians will choose to use competitor banks as sub-custodians.
3Source: HSBC Securities Services (online) “Sub-Custody & Clearing – Markets”. Availablefrom www.hsbcnet.com/gbm/products-services/securities-services/sub-custody-clearing/markets#null.[Accessed Thursday, 3 April 2014]
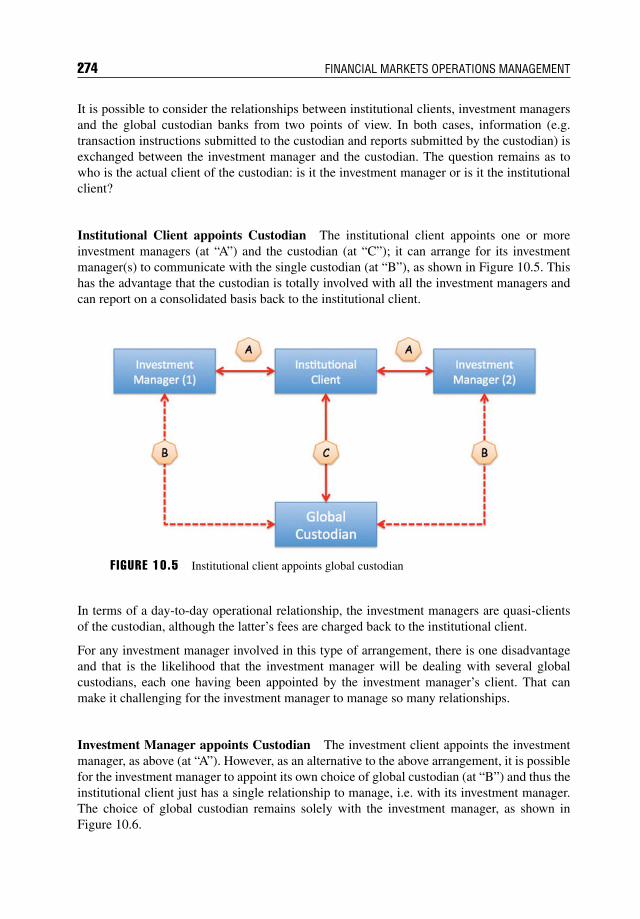
274 FINANCIAL MARKETS OPERATIONS MANAGEMENT
It is possible to consider the relationships between institutional clients, investment managersand the global custodian banks from two points of view. In both cases, information (e.g.transaction instructions submitted to the custodian and reports submitted by the custodian) isexchanged between the investment manager and the custodian. The question remains as towho is the actual client of the custodian: is it the investment manager or is it the institutionalclient?
Institutional Client appoints Custodian The institutional client appoints one or moreinvestment managers (at “A”) and the custodian (at “C”); it can arrange for its investmentmanager(s) to communicate with the single custodian (at “B”), as shown in Figure 10.5. Thishas the advantage that the custodian is totally involved with all the investment managers andcan report on a consolidated basis back to the institutional client.
F IGURE 10.5 Institutional client appoints global custodian
In terms of a day-to-day operational relationship, the investment managers are quasi-clientsof the custodian, although the latter’s fees are charged back to the institutional client.
For any investment manager involved in this type of arrangement, there is one disadvantageand that is the likelihood that the investment manager will be dealing with several globalcustodians, each one having been appointed by the investment manager’s client. That canmake it challenging for the investment manager to manage so many relationships.
Investment Manager appoints Custodian The investment client appoints the investmentmanager, as above (at “A”). However, as an alternative to the above arrangement, it is possiblefor the investment manager to appoint its own choice of global custodian (at “B”) and thus theinstitutional client just has a single relationship to manage, i.e. with its investment manager.The choice of global custodian remains solely with the investment manager, as shown inFigure 10.6.
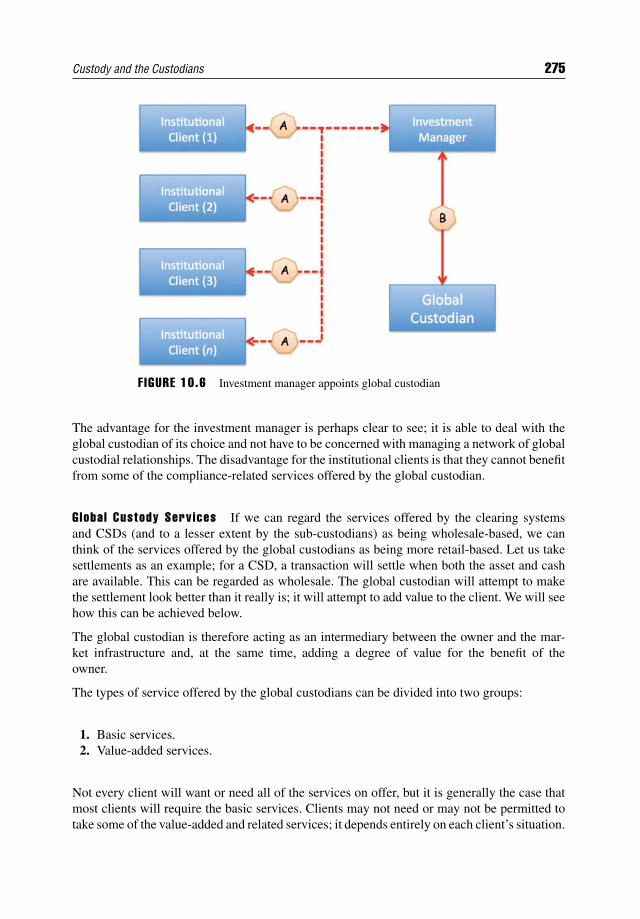
Custody and the Custodians 275
FIGURE 10.6 Investment manager appoints global custodian
The advantage for the investment manager is perhaps clear to see; it is able to deal with theglobal custodian of its choice and not have to be concerned with managing a network of globalcustodial relationships. The disadvantage for the institutional clients is that they cannot benefitfrom some of the compliance-related services offered by the global custodian.
Global Custody Services If we can regard the services offered by the clearing systemsand CSDs (and to a lesser extent by the sub-custodians) as being wholesale-based, we canthink of the services offered by the global custodians as being more retail-based. Let us takesettlements as an example; for a CSD, a transaction will settle when both the asset and cashare available. This can be regarded as wholesale. The global custodian will attempt to makethe settlement look better than it really is; it will attempt to add value to the client. We will seehow this can be achieved below.
The global custodian is therefore acting as an intermediary between the owner and the mar-ket infrastructure and, at the same time, adding a degree of value for the benefit of theowner.
The types of service offered by the global custodians can be divided into two groups:
1. Basic services.2. Value-added services.
Not every client will want or need all of the services on offer, but it is generally the case thatmost clients will require the basic services. Clients may not need or may not be permitted totake some of the value-added and related services; it depends entirely on each client’s situation.
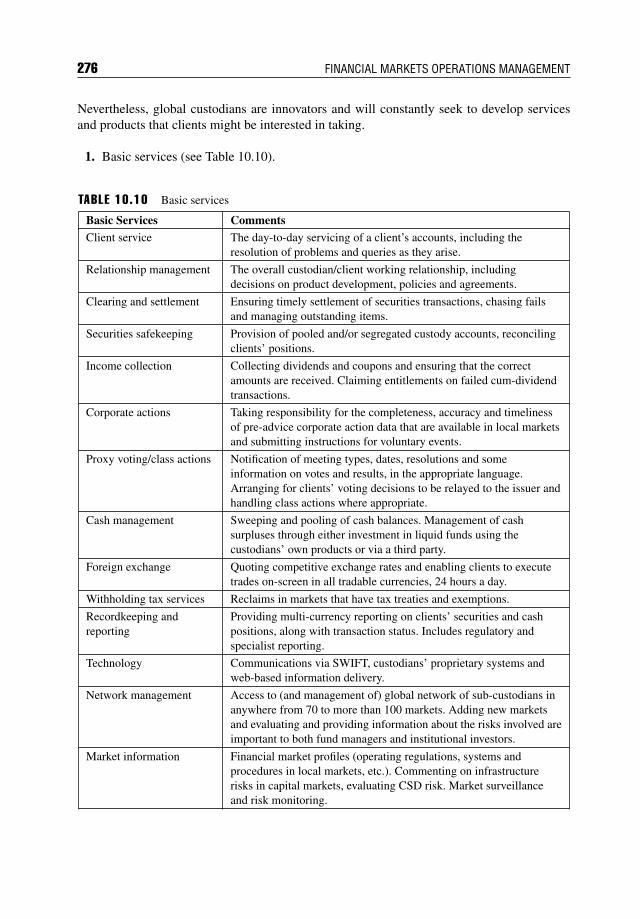
276 FINANCIAL MARKETS OPERATIONS MANAGEMENT
Nevertheless, global custodians are innovators and will constantly seek to develop servicesand products that clients might be interested in taking.
1. Basic services (see Table 10.10).
TABLE 10.10 Basic services
Basic Services CommentsClient service The day-to-day servicing of a client’s accounts, including the
resolution of problems and queries as they arise.
Relationship management The overall custodian/client working relationship, includingdecisions on product development, policies and agreements.
Clearing and settlement Ensuring timely settlement of securities transactions, chasing failsand managing outstanding items.
Securities safekeeping Provision of pooled and/or segregated custody accounts, reconcilingclients’ positions.
Income collection Collecting dividends and coupons and ensuring that the correctamounts are received. Claiming entitlements on failed cum-dividendtransactions.
Corporate actions Taking responsibility for the completeness, accuracy and timelinessof pre-advice corporate action data that are available in local marketsand submitting instructions for voluntary events.
Proxy voting/class actions Notification of meeting types, dates, resolutions and someinformation on votes and results, in the appropriate language.Arranging for clients’ voting decisions to be relayed to the issuer andhandling class actions where appropriate.
Cash management Sweeping and pooling of cash balances. Management of cashsurpluses through either investment in liquid funds using thecustodians’ own products or via a third party.
Foreign exchange Quoting competitive exchange rates and enabling clients to executetrades on-screen in all tradable currencies, 24 hours a day.
Withholding tax services Reclaims in markets that have tax treaties and exemptions.
Recordkeeping andreporting
Providing multi-currency reporting on clients’ securities and cashpositions, along with transaction status. Includes regulatory andspecialist reporting.
Technology Communications via SWIFT, custodians’ proprietary systems andweb-based information delivery.
Network management Access to (and management of) global network of sub-custodians inanywhere from 70 to more than 100 markets. Adding new marketsand evaluating and providing information about the risks involved areimportant to both fund managers and institutional investors.
Market information Financial market profiles (operating regulations, systems andprocedures in local markets, etc.). Commenting on infrastructurerisks in capital markets, evaluating CSD risk. Market surveillanceand risk monitoring.
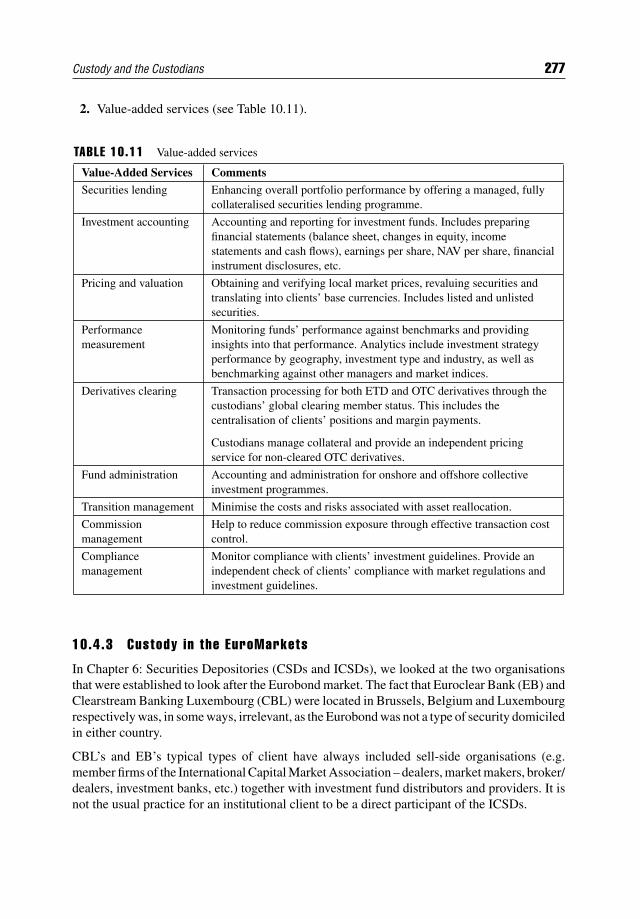
Custody and the Custodians 277
2. Value-added services (see Table 10.11).
TABLE 10.11 Value-added services
Value-Added Services Comments
Securities lending Enhancing overall portfolio performance by offering a managed, fullycollateralised securities lending programme.
Investment accounting Accounting and reporting for investment funds. Includes preparingfinancial statements (balance sheet, changes in equity, incomestatements and cash flows), earnings per share, NAV per share, financialinstrument disclosures, etc.
Pricing and valuation Obtaining and verifying local market prices, revaluing securities andtranslating into clients’ base currencies. Includes listed and unlistedsecurities.
Performancemeasurement
Monitoring funds’ performance against benchmarks and providinginsights into that performance. Analytics include investment strategyperformance by geography, investment type and industry, as well asbenchmarking against other managers and market indices.
Derivatives clearing Transaction processing for both ETD and OTC derivatives through thecustodians’ global clearing member status. This includes thecentralisation of clients’ positions and margin payments.
Custodians manage collateral and provide an independent pricingservice for non-cleared OTC derivatives.
Fund administration Accounting and administration for onshore and offshore collectiveinvestment programmes.
Transition management Minimise the costs and risks associated with asset reallocation.
Commissionmanagement
Help to reduce commission exposure through effective transaction costcontrol.
Compliancemanagement
Monitor compliance with clients’ investment guidelines. Provide anindependent check of clients’ compliance with market regulations andinvestment guidelines.
10.4.3 Custody in the EuroMarkets
In Chapter 6: Securities Depositories (CSDs and ICSDs), we looked at the two organisationsthat were established to look after the Eurobond market. The fact that Euroclear Bank (EB) andClearstream Banking Luxembourg (CBL) were located in Brussels, Belgium and Luxembourgrespectively was, in some ways, irrelevant, as the Eurobond was not a type of security domiciledin either country.
CBL’s and EB’s typical types of client have always included sell-side organisations (e.g.member firms of the International Capital Market Association – dealers, market makers, broker/dealers, investment banks, etc.) together with investment fund distributors and providers. It isnot the usual practice for an institutional client to be a direct participant of the ICSDs.
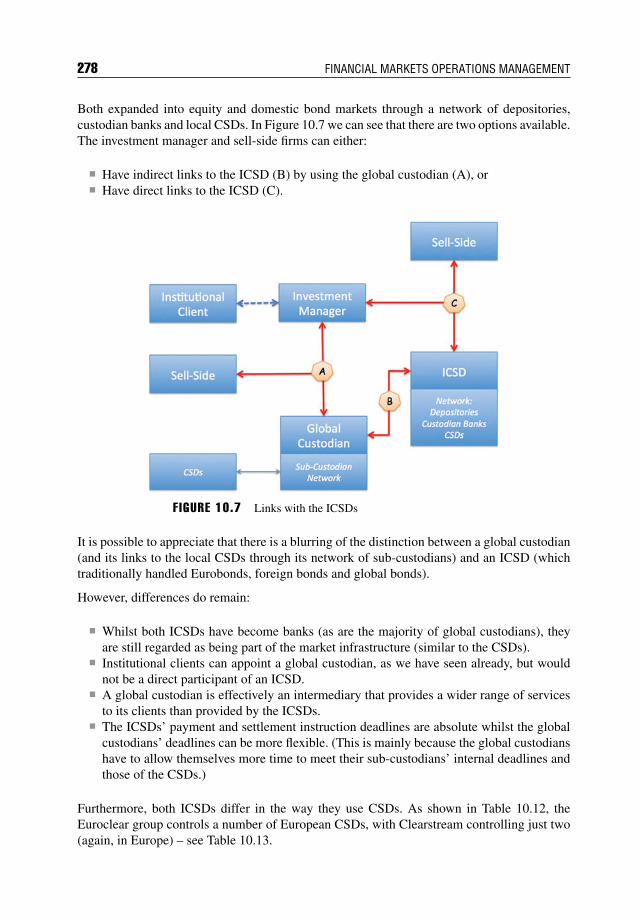
278 FINANCIAL MARKETS OPERATIONS MANAGEMENT
Both expanded into equity and domestic bond markets through a network of depositories,custodian banks and local CSDs. In Figure 10.7 we can see that there are two options available.The investment manager and sell-side firms can either:
Have indirect links to the ICSD (B) by using the global custodian (A), or Have direct links to the ICSD (C).
F IGURE 10.7 Links with the ICSDs
It is possible to appreciate that there is a blurring of the distinction between a global custodian(and its links to the local CSDs through its network of sub-custodians) and an ICSD (whichtraditionally handled Eurobonds, foreign bonds and global bonds).
However, differences do remain:
Whilst both ICSDs have become banks (as are the majority of global custodians), theyare still regarded as being part of the market infrastructure (similar to the CSDs).
Institutional clients can appoint a global custodian, as we have seen already, but wouldnot be a direct participant of an ICSD.
A global custodian is effectively an intermediary that provides a wider range of servicesto its clients than provided by the ICSDs.
The ICSDs’ payment and settlement instruction deadlines are absolute whilst the globalcustodians’ deadlines can be more flexible. (This is mainly because the global custodianshave to allow themselves more time to meet their sub-custodians’ internal deadlines andthose of the CSDs.)
Furthermore, both ICSDs differ in the way they use CSDs. As shown in Table 10.12, theEuroclear group controls a number of European CSDs, with Clearstream controlling just two(again, in Europe) – see Table 10.13.
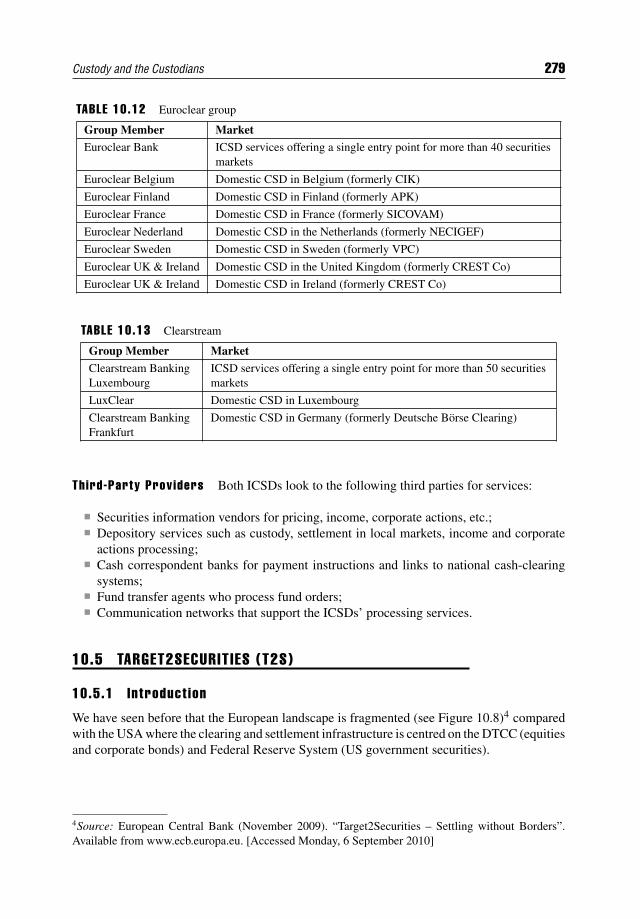
Custody and the Custodians 279
TABLE 10.12 Euroclear group
Group Member Market
Euroclear Bank ICSD services offering a single entry point for more than 40 securitiesmarkets
Euroclear Belgium Domestic CSD in Belgium (formerly CIK)
Euroclear Finland Domestic CSD in Finland (formerly APK)
Euroclear France Domestic CSD in France (formerly SICOVAM)
Euroclear Nederland Domestic CSD in the Netherlands (formerly NECIGEF)
Euroclear Sweden Domestic CSD in Sweden (formerly VPC)
Euroclear UK & Ireland Domestic CSD in the United Kingdom (formerly CREST Co)
Euroclear UK & Ireland Domestic CSD in Ireland (formerly CREST Co)
TABLE 10.13 Clearstream
Group Member Market
Clearstream BankingLuxembourg
ICSD services offering a single entry point for more than 50 securitiesmarkets
LuxClear Domestic CSD in Luxembourg
Clearstream BankingFrankfurt
Domestic CSD in Germany (formerly Deutsche Borse Clearing)
Third-Party Providers Both ICSDs look to the following third parties for services:
Securities information vendors for pricing, income, corporate actions, etc.; Depository services such as custody, settlement in local markets, income and corporate
actions processing; Cash correspondent banks for payment instructions and links to national cash-clearing
systems; Fund transfer agents who process fund orders; Communication networks that support the ICSDs’ processing services.
10.5 TARGET2SECURIT IES (T2S)
10.5.1 Introduct ion
We have seen before that the European landscape is fragmented (see Figure 10.8)4 comparedwith the USA where the clearing and settlement infrastructure is centred on the DTCC (equitiesand corporate bonds) and Federal Reserve System (US government securities).
4Source: European Central Bank (November 2009). “Target2Securities – Settling without Borders”.Available from www.ecb.europa.eu. [Accessed Monday, 6 September 2010]
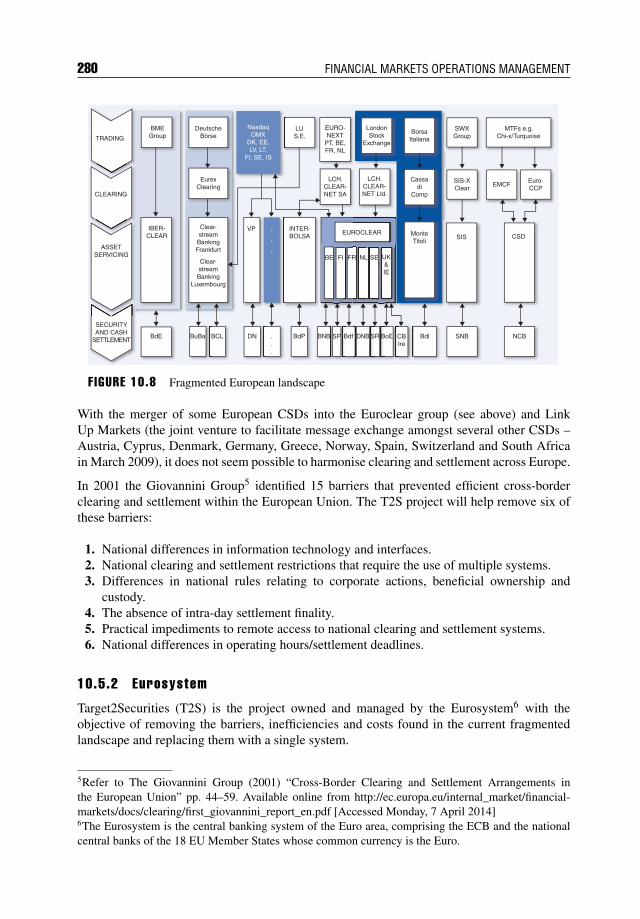
280 FINANCIAL MARKETS OPERATIONS MANAGEMENT
SWXGroup
SIS-XClear
EMCF
MTFs e.g.Chi-x/Turquoise
Euro-CCP
CSD
NCBSNBBdlBoESRDNBBNB BdfBdPDN ...
BCLBuBaBdE
SECURITYAND CASH
SETTLEMENT
ASSETSERVICING
CLEARING
TRADING
BMEGroup
DeutscheBörse
EurexClearing
IBER-CLEAR
VP ...
INTER-BOLSA
LCH.CLEAR-NET SA
LCH.CLEAR-NET Ltd.
Cassadi
Comp
MonteTitoli
EUROCLEAR
EURO-NEXT
PT, BE,FR, NL
LUS.E.
NasdaqOMX
DK, EE,LV, LT,
FI, SE, IS
LondonStock
Exchange
BorsaItaliana
Clear-stream
BankingFrankfurt
Clear-stream
BankingLuxembourg
SP CBIre
SIS
UK&IE
SENLFRFIBE
F IGURE 10.8 Fragmented European landscape
With the merger of some European CSDs into the Euroclear group (see above) and LinkUp Markets (the joint venture to facilitate message exchange amongst several other CSDs –Austria, Cyprus, Denmark, Germany, Greece, Norway, Spain, Switzerland and South Africain March 2009), it does not seem possible to harmonise clearing and settlement across Europe.
In 2001 the Giovannini Group5 identified 15 barriers that prevented efficient cross-borderclearing and settlement within the European Union. The T2S project will help remove six ofthese barriers:
1. National differences in information technology and interfaces.2. National clearing and settlement restrictions that require the use of multiple systems.3. Differences in national rules relating to corporate actions, beneficial ownership and
custody.4. The absence of intra-day settlement finality.5. Practical impediments to remote access to national clearing and settlement systems.6. National differences in operating hours/settlement deadlines.
10.5.2 Eurosystem
Target2Securities (T2S) is the project owned and managed by the Eurosystem6 with theobjective of removing the barriers, inefficiencies and costs found in the current fragmentedlandscape and replacing them with a single system.
5Refer to The Giovannini Group (2001) “Cross-Border Clearing and Settlement Arrangements inthe European Union” pp. 44–59. Available online from http://ec.europa.eu/internal_market/financial-markets/docs/clearing/first_giovannini_report_en.pdf [Accessed Monday, 7 April 2014]6The Eurosystem is the central banking system of the Euro area, comprising the ECB and the nationalcentral banks of the 18 EU Member States whose common currency is the Euro.
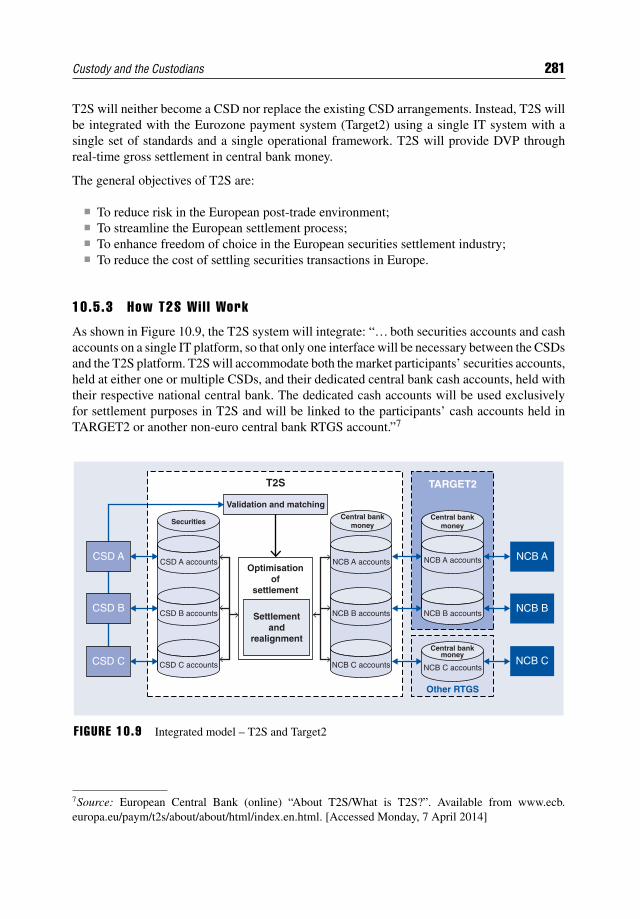
Custody and the Custodians 281
T2S will neither become a CSD nor replace the existing CSD arrangements. Instead, T2S willbe integrated with the Eurozone payment system (Target2) using a single IT system with asingle set of standards and a single operational framework. T2S will provide DVP throughreal-time gross settlement in central bank money.
The general objectives of T2S are:
To reduce risk in the European post-trade environment; To streamline the European settlement process; To enhance freedom of choice in the European securities settlement industry; To reduce the cost of settling securities transactions in Europe.
10.5.3 How T2S Wi l l Work
As shown in Figure 10.9, the T2S system will integrate: “… both securities accounts and cashaccounts on a single IT platform, so that only one interface will be necessary between the CSDsand the T2S platform. T2S will accommodate both the market participants’ securities accounts,held at either one or multiple CSDs, and their dedicated central bank cash accounts, held withtheir respective national central bank. The dedicated cash accounts will be used exclusivelyfor settlement purposes in T2S and will be linked to the participants’ cash accounts held inTARGET2 or another non-euro central bank RTGS account.”7
CSD A
Securities
Validation and matching
T2S
Central bankmoney
Central bankmoney
CSD A accounts NCB A accountsOptimisation
ofsettlement
Settlementand
realignment
CSD B accounts NCB B accounts
CSD C accounts NCB C accounts
NCB A accounts
TARGET2
NCB B accounts
NCB C accounts
Other RTGS
NCB A
NCB B
NCB C
CSD B
CSD CCentral bank
money
F IGURE 10.9 Integrated model – T2S and Target2
7Source: European Central Bank (online) “About T2S/What is T2S?”. Available from www.ecb.europa.eu/paym/t2s/about/about/html/index.en.html. [Accessed Monday, 7 April 2014]
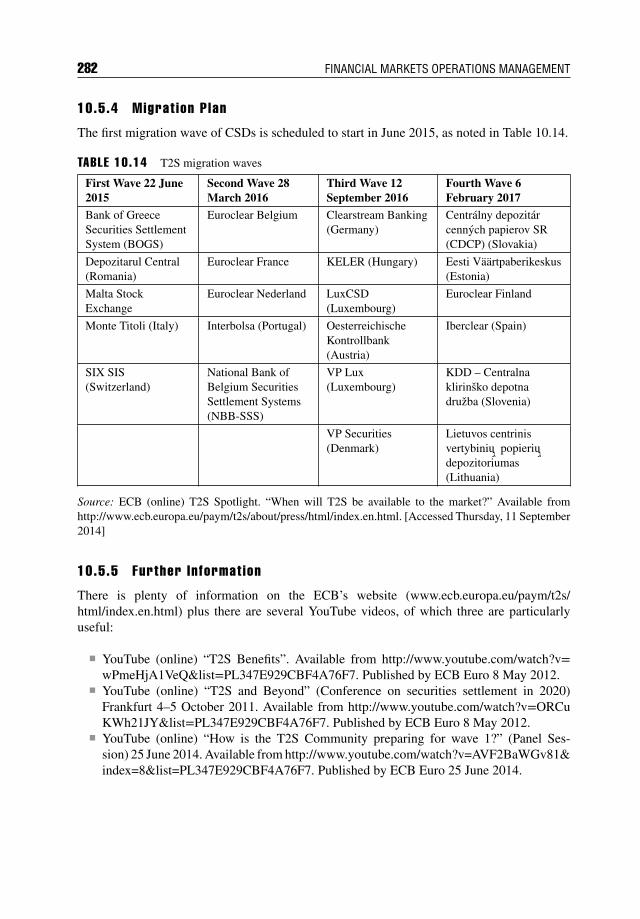
282 FINANCIAL MARKETS OPERATIONS MANAGEMENT
10.5.4 Migrat ion Plan
The first migration wave of CSDs is scheduled to start in June 2015, as noted in Table 10.14.
TABLE 10.14 T2S migration waves
First Wave 22 June2015
Second Wave 28March 2016
Third Wave 12September 2016
Fourth Wave 6February 2017
Bank of GreeceSecurities SettlementSystem (BOGS)
Euroclear Belgium Clearstream Banking(Germany)
Centralny depozitarcennych papierov SR(CDCP) (Slovakia)
Depozitarul Central(Romania)
Euroclear France KELER (Hungary) Eesti Vaartpaberikeskus(Estonia)
Malta StockExchange
Euroclear Nederland LuxCSD(Luxembourg)
Euroclear Finland
Monte Titoli (Italy) Interbolsa (Portugal) OesterreichischeKontrollbank(Austria)
Iberclear (Spain)
SIX SIS(Switzerland)
National Bank ofBelgium SecuritiesSettlement Systems(NBB-SSS)
VP Lux(Luxembourg)
KDD – Centralnaklirinsko depotnadruzba (Slovenia)
VP Securities(Denmark)
Lietuvos centrinisvertybini
ℷu popieri
ℷu
depozitoriumas(Lithuania)
Source: ECB (online) T2S Spotlight. “When will T2S be available to the market?” Available fromhttp://www.ecb.europa.eu/paym/t2s/about/press/html/index.en.html. [Accessed Thursday, 11 September2014]
10.5.5 Further Informat ion
There is plenty of information on the ECB’s website (www.ecb.europa.eu/paym/t2s/html/index.en.html) plus there are several YouTube videos, of which three are particularlyuseful:
YouTube (online) “T2S Benefits”. Available from http://www.youtube.com/watch?v=wPmeHjA1VeQ&list=PL347E929CBF4A76F7. Published by ECB Euro 8 May 2012.
YouTube (online) “T2S and Beyond” (Conference on securities settlement in 2020)Frankfurt 4–5 October 2011. Available from http://www.youtube.com/watch?v=ORCuKWh21JY&list=PL347E929CBF4A76F7. Published by ECB Euro 8 May 2012.
YouTube (online) “How is the T2S Community preparing for wave 1?” (Panel Ses-sion) 25 June 2014. Available from http://www.youtube.com/watch?v=AVF2BaWGv81&index=8&list=PL347E929CBF4A76F7. Published by ECB Euro 25 June 2014.
Custody and the Custodians 283
10.6 SUMMARY
In this chapter we have looked at custody in terms of the forms of securities (registered andbearer) and what that means in terms of the safekeeping of securities.
We saw that ownership of registered securities is reflected on the issuer’s register, which ismaintained by a registrar or transfer agent. Securities can be registered in the name of one ofthe following entities:
The actual beneficial owner; The custodian bank; A nominee name.
Remember that whoever’s name is in the register is the legal owner; using a nominee or acustodian bank transfers legal ownership to that entity. The investor, as the beneficial owner,must trust the nominee/custodian bank to pass the benefits of ownership on to the investor asand when received from the issuer.
We then considered the three ways in which securities can be held in custody:
1. Custody in a local market – suitable for those investors that tend to invest in their localmarkets and perhaps a few cross-border markets as well.
2. Custody in the global markets – for globally invested institutions that might choose to usea single global custodian to handle their assets.
3. Custody in the Euro markets – for institutions that are focused on the international bondmarkets.
Not only do the global custodians have access to many markets through their network ofsub-custodians, but they also offer a wide range of services. These include the basic services,such as settlement, safekeeping and reporting, and value-added services, such as investmentaccounting, derivatives clearing and securities lending.
In the Euro markets, the two international central securities depositories (Clearstream BankingLuxembourg and Euroclear Bank) have serviced their participants’ requirements for newissuance, settlement, safekeeping and credit-related (securities and cash financing) services.Both ICSDs have expanded their services to include equities through their links to local CSDsand investment funds.
Finally, we explained how the Eurozone is harmonising the fragmented settlement situation inEurope by developing T2S. T2S is an integrated model that will enable participants to settletrades in central bank money on a DVP basis across the participating CSDs and the Target2payment system.

CHAPTER 11Corporate Actions
11.1 INTRODUCTION
A corporate action is an event usually initiated by the issuer of the securities (mainly equitiesbut also, to a lesser extent, bonds) and sometimes by a third party. A corporate action can resulteither in a financial impact on the shareholders or bondholders or on the capital structure ofthe issuer itself.
There are many different types of corporate action event; the exact number is difficult tocalculate. Nevertheless, corporate actions can be grouped into nine event-type categories withnumerous sub-types. You will find a list of these categories in Appendix 11.1 at the end of thischapter.
The key relationship has always been between the issuer and the investor. This was certainlytrue in the days when investors owning registered securities (typically equities) would havetheir names recorded on the issuer’s shareholder register. In today’s world, and especiallywhere investors own international securities, this one-on-one relationship is less frequent, asthere are a number of intermediaries acting on behalf of both issuer and investor. We willidentify these intermediaries and examine their roles and responsibilities in this chapter.
Each and every type of corporate action event requires one or more actions to be taken. Forthe purposes of this book, we will concentrate on only a few of the more usual types of event.Depending on the type of event, the actions required can and do differ in detail; however, wecan summarise the actions that are required into the following types:
1. Information from issuer;2. Communication to investor;3. Decision to be made/no decision required by investor;4. Conclusion with results debited or credited to the investor’s account.
These four actions apply in the vast majority of events.
In November 2001, the Giovannini Group published a report entitled Cross-Border Clear-ing and Settlement Arrangements in the European Union in which a number of barriers to
285
286 FINANCIAL MARKETS OPERATIONS MANAGEMENT
efficient cross-border clearing and settlement were noted.1 In particular, corporate actions werediscussed in Barrier 3: “Differences in national rules relating to corporate actions, beneficialownership and custody” (see below).
GIOVANNINI BARRIER 3
National differences in the rules governing corporate actions… can be a barrier to effi-cient cross-border clearing and settlement. As corporate actions often require a responsefrom the securities owner, national differences in how they are managed may requirespecialised local knowledge and/or the lodgement of physical documents locally, andso inhibit the centralisation of securities settlement and custody. Particular difficultiesin respect of corporate actions arise from the inconsistent treatment of compensationand cash accruals and from the differing practices used to apply the effects of corpo-rate actions to open transactions, e.g. different countries apply different treatments tothe payment of a dividend on a security involved in an open transaction. Efforts toimprove consistency in the rules governing corporate actions are essential if the integra-tion of EU equity markets is to proceed. More specifically, implementation (as plannedthrough ECSDA) of ISO 15022 message standards for communication between CSDson corporate actions would help to speed up information dissemination across systems.
The Giovannini Group (November 2001), “Cross-Border Clearing and Settlement Arrangementsin the European Union” (report updated in 2003)
By the end of this chapter you will:
Understand the complexities of corporate action events; Understand the event processing and information flows; Know the operational risks involved; Appreciate the changes within the industry; Understand the impact of corporate actions on other departments.
11.2 TYPES OF CORPORATE ACTION EVENT
We can consider corporate action events from two perspectives: those that are voluntary ormandatory and those that are predictable or unpredictable (announced).
11.2.1 Voluntary or Mandatory Events
Corporate action events can either be voluntary or mandatory. From the shareholder’s pointof view, a voluntary event is where the shareholder has the option to participate in the event.
1The Giovannini Group (October 2001) (online) “Cross-Border Clearing and Settlement Arrangem-ents in the European Union”. Available from http://ec.europa.eu/internal_market/financial-markets/docs/clearing/first_giovannini_report_en.pdf. [Accessed Tuesday, 26 February 2002]
Corporate Actions 287
By contrast, a mandatory event is where the shareholder has no option but to participate in theevent. Please note that a voluntary event for the issuer could very well be a mandatory eventfor the investor.
11.2.2 Predictable or Announced Events
A predictable event is one where the security has one or more events that will be known fromthe time that security is first issued. An announced event is one where, in most circumstances,the issuer decides to take action in some form or another.
All events will be a combination of both of the above perspectives; so, for example, a redemp-tion on a state bond will be mandatory and predictable. A bonus issue, on the other hand,will be mandatory and announced. For corporate actions staff, the most risky combinationwill usually be announced and voluntary, mainly because someone, either the investor or itsintermediary, has to make a decision as to what action to take. A decision that is either missedor submitted late will not be executed by the issuer’s agent.
In Appendix 11.2, you will find a list of voluntary and mandatory events for both equities andbonds.
11.3 PARTIC IPATION IN CORPORATE ACTIONS
The two key participants in any corporate action event are the issuer and the investor (or theinvestor’s agent, such as a fund manager). As we have seen above, it is unlikely, althoughnot impossible, that the issuer will communicate directly with the investor. Instead, the issuercommunicates via a chain of intermediaries. These intermediaries include the following:
Fund manager; Global custodian; Local/sub-custodian; Local central securities depository; International central securities depository; Data vendors; Receiving/paying agent.
11.3.1 Fund Manager
Fund managers act on behalf of their clients as regards corporate action events as well asmanaging their assets. It is the fund manager, rather than the client, who decides what actionto take where the event is voluntary in nature (e.g. where an issuer announces a rights issue).
11.3.2 Global Custodian
Whether the global custodian’s client is the institutional investor or the fund manager, its roleis to act as an information taker (from the sub-custodian) and information giver (to the fundmanager) plus decision taker (from the fund manager) and decision giver (to the sub-custodian).The global custodian has the responsibility of ensuring that the results of any corporate action
288 FINANCIAL MARKETS OPERATIONS MANAGEMENT
event (whether voluntary or mandatory) are correctly actioned and recorded. The globalcustodian is very dependent on its sub-custodian for much of the information/decisions/resultsflows and, as a control, will verify any corporate actions information that has been published.
11.3.3 Local /Sub-Custodian
Typically, a local bank can act in both capacities depending on the type of client. The rolesand responsibilities mirror those of the global custodian (i.e. information/decisions/resultsflows), with the difference being that the custodian is located in the market where the issuer’ssecurities are listed. This makes the local/sub-custodian much closer to the market than theglobal custodian would be.
11.3.4 Local Central Securit ies Depository
It is usual for the local CSD to hold the entire issue of any eligible security on behalf of thebeneficial owner. (Remember that there will be a local sub-custodian/global custodian chain ora local custodian as intermediary between the CSD and beneficial owner.) The issuer’s agentwill communicate with the CSD.
11.3.5 Internat ional Central Securit ies Depository
The ICSDs, Euroclear Bank (EB) and Clearstream Banking Luxembourg (CBL), hold theirparticipants’ securities in one of three ways, depending on the type of security:
1. Each ICSD will have appointed a specialised depository that holds securities for one orother of the ICSDs. There are, therefore, two SDs in this case.
2. Both ICSDs jointly appoint a common depository that holds the entire issue to the orderof EB and CBL. The CD therefore has only two clients for each issue held.
3. Each ICSD has a participant custody account with some, but not all, local CSDs.
11.3.6 Data Vendors
Data vendors will also be recipients of information broadcast by the issuers. In addition tocorporate actions information, the data vendors provide pricing information and informationon companies and securities.
Examples of data vendors include Bloomberg, Markit, Morningstar, SIX Financial Informa-tion, Sungard and Thomson Reuters. You can find more details on the Software and InformationIndustry Association’s Financial Information Services Division at www.siia.net.
11.3.7 Receiv ing/Paying Agent
Typically a bank, a receiving/paying agent is appointed by an issuer to make periodic cashpayments (dividends, coupons and bond redemption proceeds) to the issuer’s investors andreceive payments for relevant corporate action events such as rights issues.
Depending on the exact types of relationships, the chains of communication can best bedescribed in the manner shown in Figure 11.1.
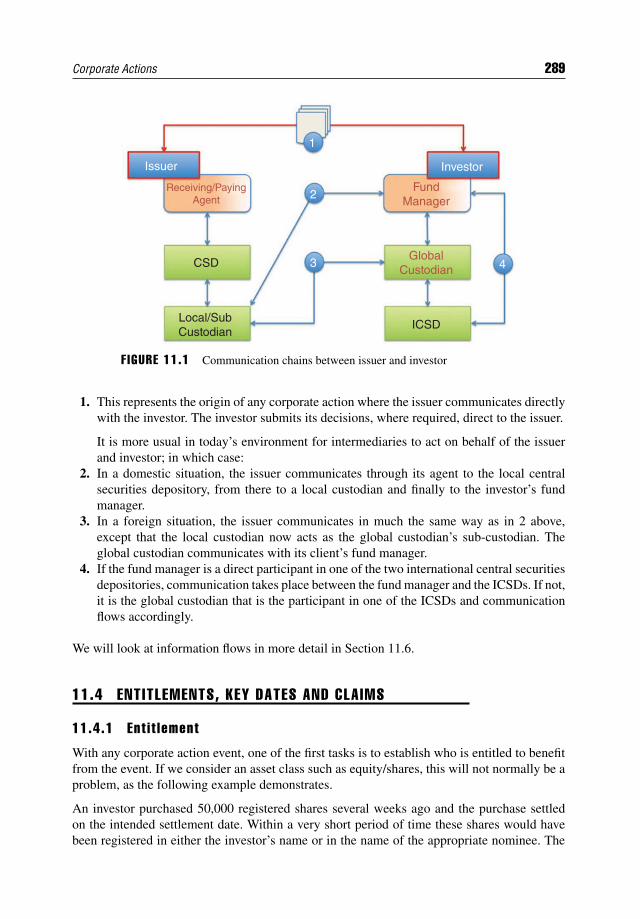
Corporate Actions 289
Local/SubCustodian
CSD
Receiving/PayingAgent
Issuer
1
2
3 4
Investor
FundManager
GlobalCustodian
ICSD
F IGURE 11.1 Communication chains between issuer and investor
1. This represents the origin of any corporate action where the issuer communicates directlywith the investor. The investor submits its decisions, where required, direct to the issuer.
It is more usual in today’s environment for intermediaries to act on behalf of the issuerand investor; in which case:
2. In a domestic situation, the issuer communicates through its agent to the local centralsecurities depository, from there to a local custodian and finally to the investor’s fundmanager.
3. In a foreign situation, the issuer communicates in much the same way as in 2 above,except that the local custodian now acts as the global custodian’s sub-custodian. Theglobal custodian communicates with its client’s fund manager.
4. If the fund manager is a direct participant in one of the two international central securitiesdepositories, communication takes place between the fund manager and the ICSDs. If not,it is the global custodian that is the participant in one of the ICSDs and communicationflows accordingly.
We will look at information flows in more detail in Section 11.6.
11.4 ENTITLEMENTS, KEY DATES AND CLAIMS
11.4.1 Ent i t lement
With any corporate action event, one of the first tasks is to establish who is entitled to benefitfrom the event. If we consider an asset class such as equity/shares, this will not normally be aproblem, as the following example demonstrates.
An investor purchased 50,000 registered shares several weeks ago and the purchase settledon the intended settlement date. Within a very short period of time these shares would havebeen registered in either the investor’s name or in the name of the appropriate nominee. The
290 FINANCIAL MARKETS OPERATIONS MANAGEMENT
issuer will know that this investor’s name will be on its shareholder register. Today, the issuerannounces a corporate action event, for example, a cash dividend.
Who, then, is entitled to receive this cash dividend? It will be the investor for the followingtwo reasons:
1. When the investor made the original purchase, it was implied in the contract that thepurchase was made cum-dividend (“cum” is from the Latin “with”). On the assumptionthat the investor was still the owner of the shares, then he would be fully entitled to thedividend on the 50,000 shares.
2. Once the 50,000 shares were registered in the investor’s name (i.e. noted on the shareholderregister) then the investor was the legal owner of the shares and thus entitled to receivethe cash dividend.
A complication arises, however, in the situation where the investor makes a purchase and, forwhatever reason, the shares are not on the shareholder register in time. The issuer will paythe dividend to whoever’s name is on the shareholder register; in this case, the purchaser willnot receive the dividend even though the purchase was made cum-dividend. Who, then, willreceive this dividend? As the dividend is paid to whoever’s name is on the register, the dividendwill actually be paid to the seller of the shares rather than the purchaser (the investor).
11.4.2 Record Date
For this reason there needs to be a mechanism by which the correct entity is not only entitledto receive the benefit but receives the benefit in actuality. This is how it works. The shareholderregister is a dynamic document, in that buyers and sellers are continuously having their namesadded to and removed from the register. As the issuer can only pay a dividend to thosenamed on the register, you can perhaps appreciate that on a very busy register it becomes verydifficult to identify the true beneficiaries. For this reason, the issuer will close the register onone particular date. This date is known as the record date (also known as the books close date).Once the register has been closed, the dividend is paid to the name(s) on the register at thattime. As before, this will correctly identify the beneficiaries.
11.4.3 Ex-D iv idend Date
But we still have a problem. An investor may have purchased shares only a few days before therecord date. In this situation it is unlikely that the transaction would even have settled, let alonehave the purchaser’s name added to the register. To overcome this problem, the local stockexchange will declare an ex-dividend date that occurs shortly before the record date (“ex”from the Latin “without”). How many days before depends on the local settlement convention.It is usually one day less than the number of days between the trade date and the intendedsettlement date. If the settlement convention is T+3, then the number of days between theex-dividend date and the record date is two.
We can look at this another way – the investor needs to purchase shares just before therecord date to be sure of qualifying for the dividend payment. In the above example of a T+3settlement cycle, three days are needed before the shareholder’s name goes on the register (i.e.the day before the ex-dividend date).
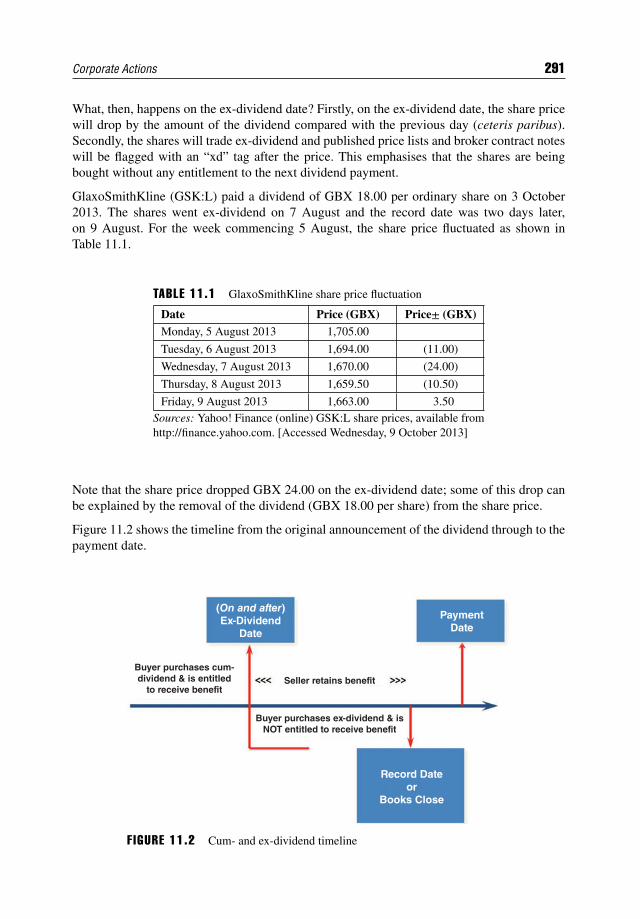
Corporate Actions 291
What, then, happens on the ex-dividend date? Firstly, on the ex-dividend date, the share pricewill drop by the amount of the dividend compared with the previous day (ceteris paribus).Secondly, the shares will trade ex-dividend and published price lists and broker contract noteswill be flagged with an “xd” tag after the price. This emphasises that the shares are beingbought without any entitlement to the next dividend payment.
GlaxoSmithKline (GSK:L) paid a dividend of GBX 18.00 per ordinary share on 3 October2013. The shares went ex-dividend on 7 August and the record date was two days later,on 9 August. For the week commencing 5 August, the share price fluctuated as shown inTable 11.1.
TABLE 11.1 GlaxoSmithKline share price fluctuation
Date Price (GBX) Price± (GBX)Monday, 5 August 2013 1,705.00
Tuesday, 6 August 2013 1,694.00 (11.00)
Wednesday, 7 August 2013 1,670.00 (24.00)
Thursday, 8 August 2013 1,659.50 (10.50)
Friday, 9 August 2013 1,663.00 3.50Sources: Yahoo! Finance (online) GSK:L share prices, available fromhttp://finance.yahoo.com. [Accessed Wednesday, 9 October 2013]
Note that the share price dropped GBX 24.00 on the ex-dividend date; some of this drop canbe explained by the removal of the dividend (GBX 18.00 per share) from the share price.
Figure 11.2 shows the timeline from the original announcement of the dividend through to thepayment date.
Record Dateor
Books Close
Buyer purchases cum-dividend & is entitled
to receive benefitSeller retains benefit
Buyer purchases ex-dividend & isNOT entitled to receive benefit
PaymentDate
(On and after)Ex-Dividend
Date
F IGURE 11.2 Cum- and ex-dividend timeline
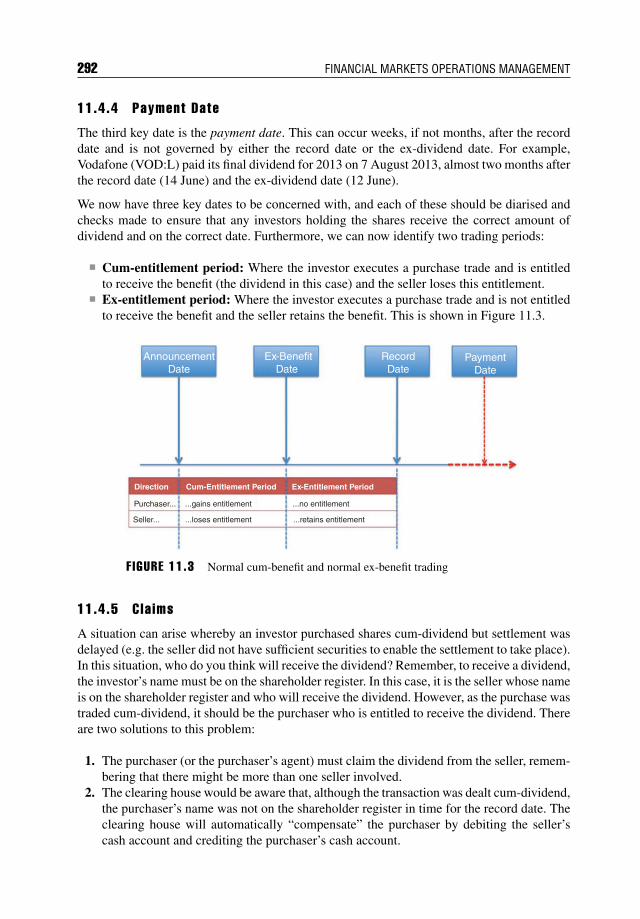
292 FINANCIAL MARKETS OPERATIONS MANAGEMENT
11.4.4 Payment Date
The third key date is the payment date. This can occur weeks, if not months, after the recorddate and is not governed by either the record date or the ex-dividend date. For example,Vodafone (VOD:L) paid its final dividend for 2013 on 7 August 2013, almost two months afterthe record date (14 June) and the ex-dividend date (12 June).
We now have three key dates to be concerned with, and each of these should be diarised andchecks made to ensure that any investors holding the shares receive the correct amount ofdividend and on the correct date. Furthermore, we can now identify two trading periods:
Cum-entitlement period: Where the investor executes a purchase trade and is entitledto receive the benefit (the dividend in this case) and the seller loses this entitlement.
Ex-entitlement period: Where the investor executes a purchase trade and is not entitledto receive the benefit and the seller retains the benefit. This is shown in Figure 11.3.
AnnouncementDate
Direction
Purchaser... ...gains entitlement ...no entitlement
...retains entitlement...loses entitlementSeller...
Cum-Entitlement Period Ex-Entitlement Period
Ex-BenefitDate
RecordDate
PaymentDate
F IGURE 11.3 Normal cum-benefit and normal ex-benefit trading
11.4.5 Cla ims
A situation can arise whereby an investor purchased shares cum-dividend but settlement wasdelayed (e.g. the seller did not have sufficient securities to enable the settlement to take place).In this situation, who do you think will receive the dividend? Remember, to receive a dividend,the investor’s name must be on the shareholder register. In this case, it is the seller whose nameis on the shareholder register and who will receive the dividend. However, as the purchase wastraded cum-dividend, it should be the purchaser who is entitled to receive the dividend. Thereare two solutions to this problem:
1. The purchaser (or the purchaser’s agent) must claim the dividend from the seller, remem-bering that there might be more than one seller involved.
2. The clearing house would be aware that, although the transaction was dealt cum-dividend,the purchaser’s name was not on the shareholder register in time for the record date. Theclearing house will automatically “compensate” the purchaser by debiting the seller’scash account and crediting the purchaser’s cash account.
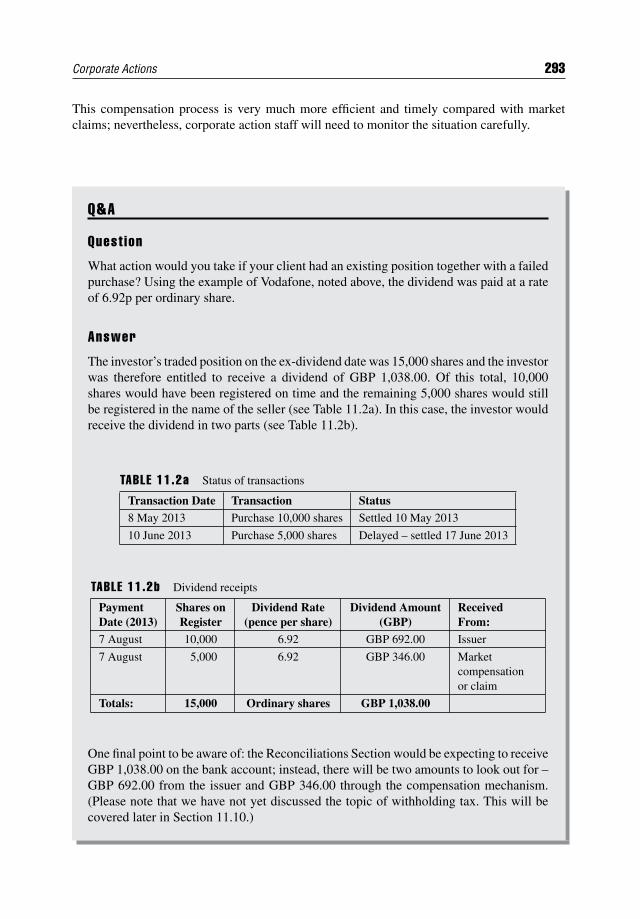
Corporate Actions 293
This compensation process is very much more efficient and timely compared with marketclaims; nevertheless, corporate action staff will need to monitor the situation carefully.
Q&A
Quest ion
What action would you take if your client had an existing position together with a failedpurchase? Using the example of Vodafone, noted above, the dividend was paid at a rateof 6.92p per ordinary share.
Answer
The investor’s traded position on the ex-dividend date was 15,000 shares and the investorwas therefore entitled to receive a dividend of GBP 1,038.00. Of this total, 10,000shares would have been registered on time and the remaining 5,000 shares would stillbe registered in the name of the seller (see Table 11.2a). In this case, the investor wouldreceive the dividend in two parts (see Table 11.2b).
TABLE 11.2a Status of transactions
Transaction Date Transaction Status8 May 2013 Purchase 10,000 shares Settled 10 May 2013
10 June 2013 Purchase 5,000 shares Delayed – settled 17 June 2013
TABLE 11.2b Dividend receipts
PaymentDate (2013)
Shares onRegister
Dividend Rate(pence per share)
Dividend Amount(GBP)
ReceivedFrom:
7 August 10,000 6.92 GBP 692.00 Issuer
7 August 5,000 6.92 GBP 346.00 Marketcompensationor claim
Totals: 15,000 Ordinary shares GBP 1,038.00
One final point to be aware of: the Reconciliations Section would be expecting to receiveGBP 1,038.00 on the bank account; instead, there will be two amounts to look out for –GBP 692.00 from the issuer and GBP 346.00 through the compensation mechanism.(Please note that we have not yet discussed the topic of withholding tax. This will becovered later in Section 11.10.)
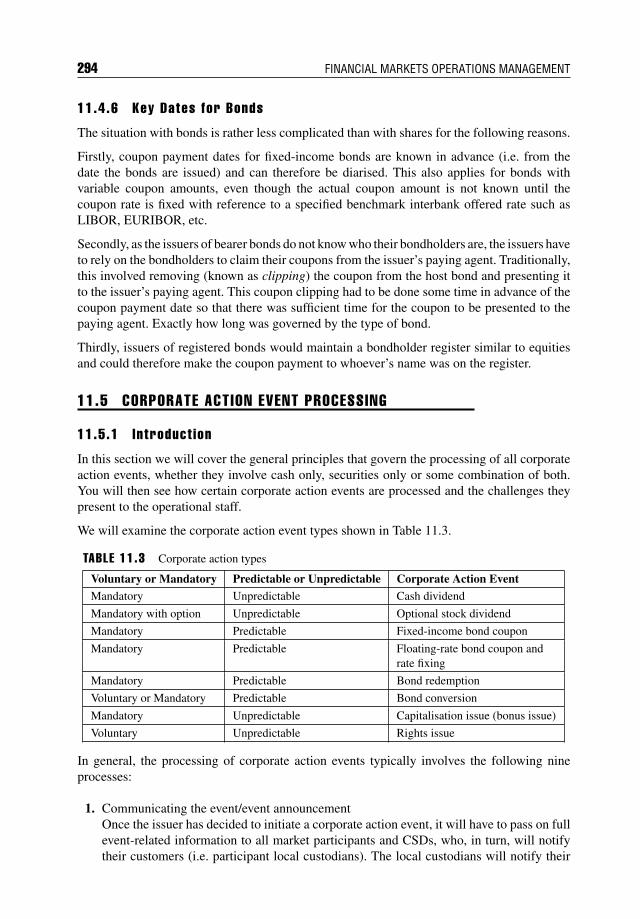
294 FINANCIAL MARKETS OPERATIONS MANAGEMENT
11.4.6 Key Dates for Bonds
The situation with bonds is rather less complicated than with shares for the following reasons.
Firstly, coupon payment dates for fixed-income bonds are known in advance (i.e. from thedate the bonds are issued) and can therefore be diarised. This also applies for bonds withvariable coupon amounts, even though the actual coupon amount is not known until thecoupon rate is fixed with reference to a specified benchmark interbank offered rate such asLIBOR, EURIBOR, etc.
Secondly, as the issuers of bearer bonds do not know who their bondholders are, the issuers haveto rely on the bondholders to claim their coupons from the issuer’s paying agent. Traditionally,this involved removing (known as clipping) the coupon from the host bond and presenting itto the issuer’s paying agent. This coupon clipping had to be done some time in advance of thecoupon payment date so that there was sufficient time for the coupon to be presented to thepaying agent. Exactly how long was governed by the type of bond.
Thirdly, issuers of registered bonds would maintain a bondholder register similar to equitiesand could therefore make the coupon payment to whoever’s name was on the register.
11.5 CORPORATE ACTION EVENT PROCESSING
11.5.1 Introduct ion
In this section we will cover the general principles that govern the processing of all corporateaction events, whether they involve cash only, securities only or some combination of both.You will then see how certain corporate action events are processed and the challenges theypresent to the operational staff.
We will examine the corporate action event types shown in Table 11.3.
TABLE 11.3 Corporate action types
Voluntary or Mandatory Predictable or Unpredictable Corporate Action EventMandatory Unpredictable Cash dividend
Mandatory with option Unpredictable Optional stock dividend
Mandatory Predictable Fixed-income bond coupon
Mandatory Predictable Floating-rate bond coupon andrate fixing
Mandatory Predictable Bond redemption
Voluntary or Mandatory Predictable Bond conversion
Mandatory Unpredictable Capitalisation issue (bonus issue)
Voluntary Unpredictable Rights issue
In general, the processing of corporate action events typically involves the following nineprocesses:
1. Communicating the event/event announcementOnce the issuer has decided to initiate a corporate action event, it will have to pass on fullevent-related information to all market participants and CSDs, who, in turn, will notifytheir customers (i.e. participant local custodians). The local custodians will notify their

Corporate Actions 295
customers (i.e. the global custodians), who will notify their customers/fund managers,etc. Every organisation must be able to gather the information and verify its accuracy. Itis important that the underlying beneficial owners are notified as quickly and accuratelyas possible.
2. Reconciliation – ante eventPositions should be reconciled to ensure that the correct entitlements are either receivedin full or claimed where necessary.
3. Event creationHaving notified their clients about the upcoming event, the custodians will create an“event” in their in-house systems. All relevant dates like deadlines, pay dates, ex datesand record dates need to be correctly diarised to ensure that important actions are taken atthe right moment and are not forgotten. If necessary, the information published by the agentshould be translated before it can be sent to the customers. Any unclear information willneed to be investigated by contacting the information provider and/or the issuer’s agent.
4. Claims processingPositions that are entitled to benefit from an event but have been delayed (e.g. failedsettlement) should be identified and claims processed.
5. Instructions processingVoluntary/optional events are operationally the most risky. The issuer’s agent will havea timetable for decisions and appropriate actions. Failure to meet these deadlines willusually result in the customer missing the opportunity to participate in the event.
In order to meet the issuer’s deadline, every participant in the communication chain willneed to allow time to pass the information on and receive any instructions. It may be thecase that the beneficial owner has to make a decision several days ahead of the issuer’sdeadline.
6. Entitlement calculationOnce information has been received and verified by the custodians, they must first calculatethe securities amounts and/or cash that the beneficial owners are entitled to. Secondly, thecustodians must advise their customers of the full terms of any event, what the optionsare and what results can be expected.
7. Payment/deliveryOnce the lead agent releases the results of the event (cash, securities or both) the custodiansshould update their internal books and records under advice to their customers.
8. Reconciliation – post eventEvery event needs to be reconciled after completion to ensure that every aspect of theevent has been processed correctly.
9. ReportingReporting on the progress of the event takes place throughout the event.
Whilst every corporate action event is different, the above processes can act as a template forprocessing corporate actions. We will now look at a number of different events to see what hap-pens, to understand the operational risks and the types of controls that will mitigate these risks.
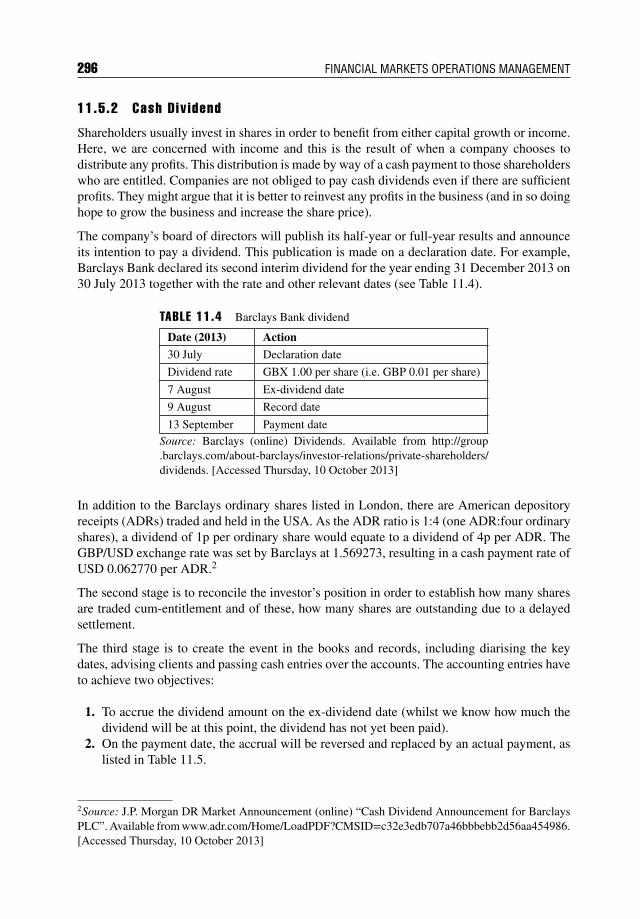
296 FINANCIAL MARKETS OPERATIONS MANAGEMENT
11.5.2 Cash Div idend
Shareholders usually invest in shares in order to benefit from either capital growth or income.Here, we are concerned with income and this is the result of when a company chooses todistribute any profits. This distribution is made by way of a cash payment to those shareholderswho are entitled. Companies are not obliged to pay cash dividends even if there are sufficientprofits. They might argue that it is better to reinvest any profits in the business (and in so doinghope to grow the business and increase the share price).
The company’s board of directors will publish its half-year or full-year results and announceits intention to pay a dividend. This publication is made on a declaration date. For example,Barclays Bank declared its second interim dividend for the year ending 31 December 2013 on30 July 2013 together with the rate and other relevant dates (see Table 11.4).
TABLE 11.4 Barclays Bank dividend
Date (2013) Action
30 July Declaration date
Dividend rate GBX 1.00 per share (i.e. GBP 0.01 per share)
7 August Ex-dividend date
9 August Record date
13 September Payment dateSource: Barclays (online) Dividends. Available from http://group.barclays.com/about-barclays/investor-relations/private-shareholders/dividends. [Accessed Thursday, 10 October 2013]
In addition to the Barclays ordinary shares listed in London, there are American depositoryreceipts (ADRs) traded and held in the USA. As the ADR ratio is 1:4 (one ADR:four ordinaryshares), a dividend of 1p per ordinary share would equate to a dividend of 4p per ADR. TheGBP/USD exchange rate was set by Barclays at 1.569273, resulting in a cash payment rate ofUSD 0.062770 per ADR.2
The second stage is to reconcile the investor’s position in order to establish how many sharesare traded cum-entitlement and of these, how many shares are outstanding due to a delayedsettlement.
The third stage is to create the event in the books and records, including diarising the keydates, advising clients and passing cash entries over the accounts. The accounting entries haveto achieve two objectives:
1. To accrue the dividend amount on the ex-dividend date (whilst we know how much thedividend will be at this point, the dividend has not yet been paid).
2. On the payment date, the accrual will be reversed and replaced by an actual payment, aslisted in Table 11.5.
2Source: J.P. Morgan DR Market Announcement (online) “Cash Dividend Announcement for BarclaysPLC”. Available from www.adr.com/Home/LoadPDF?CMSID=c32e3edb707a46bbbebb2d56aa454986.[Accessed Thursday, 10 October 2013]
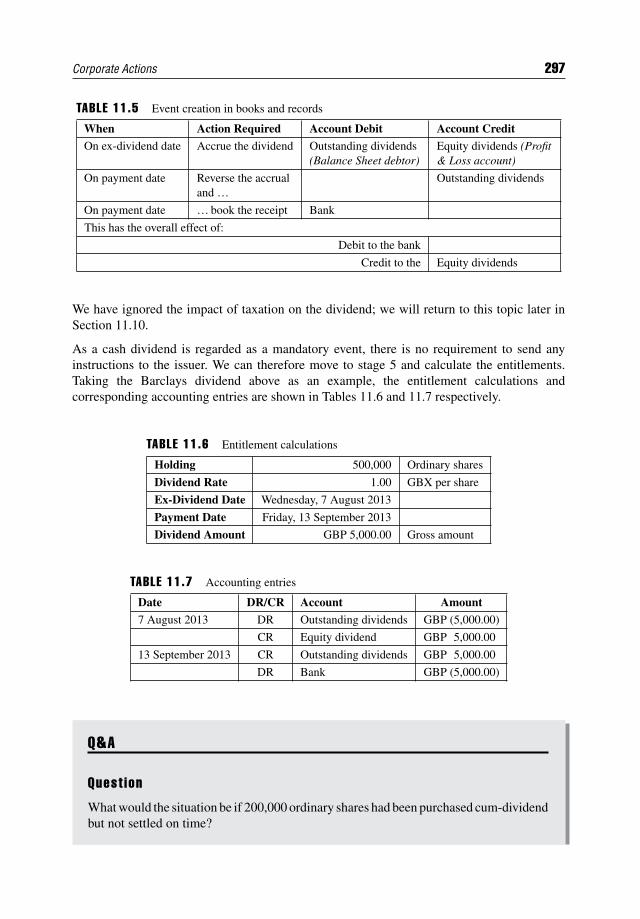
Corporate Actions 297
TABLE 11.5 Event creation in books and records
When Action Required Account Debit Account Credit
On ex-dividend date Accrue the dividend Outstanding dividends(Balance Sheet debtor)
Equity dividends (Profit& Loss account)
On payment date Reverse the accrualand …
Outstanding dividends
On payment date … book the receipt Bank
This has the overall effect of:
Debit to the bank
Credit to the Equity dividends
We have ignored the impact of taxation on the dividend; we will return to this topic later inSection 11.10.
As a cash dividend is regarded as a mandatory event, there is no requirement to send anyinstructions to the issuer. We can therefore move to stage 5 and calculate the entitlements.Taking the Barclays dividend above as an example, the entitlement calculations andcorresponding accounting entries are shown in Tables 11.6 and 11.7 respectively.
TABLE 11.6 Entitlement calculations
Holding 500,000 Ordinary shares
Dividend Rate 1.00 GBX per share
Ex-Dividend Date Wednesday, 7 August 2013
Payment Date Friday, 13 September 2013
Dividend Amount GBP 5,000.00 Gross amount
TABLE 11.7 Accounting entries
Date DR/CR Account Amount
7 August 2013 DR Outstanding dividends GBP (5,000.00)
CR Equity dividend GBP 5,000.00
13 September 2013 CR Outstanding dividends GBP 5,000.00
DR Bank GBP (5,000.00)
Q&A
Quest ion
What would the situation be if 200,000 ordinary shares had been purchased cum-dividendbut not settled on time?
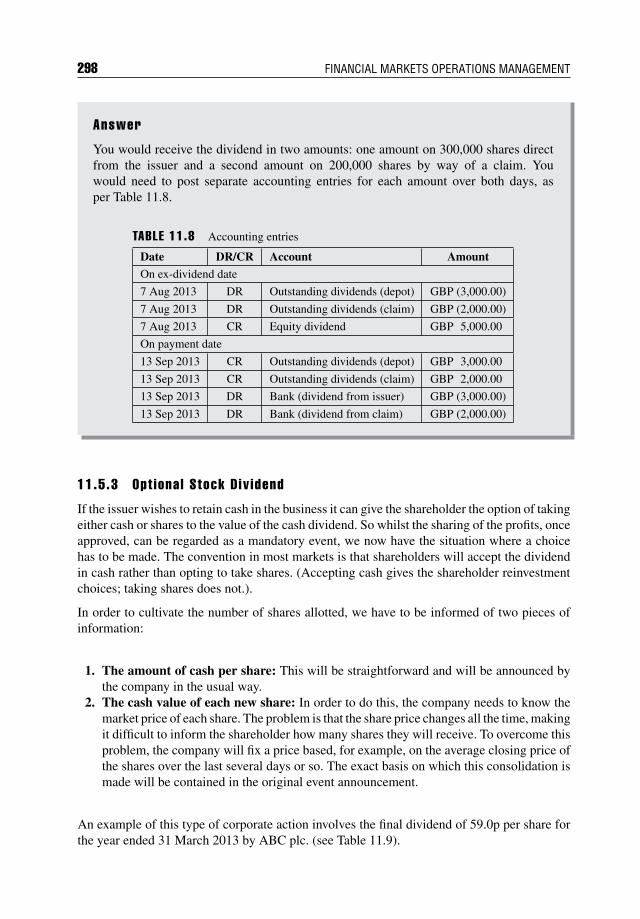
298 FINANCIAL MARKETS OPERATIONS MANAGEMENT
Answer
You would receive the dividend in two amounts: one amount on 300,000 shares directfrom the issuer and a second amount on 200,000 shares by way of a claim. Youwould need to post separate accounting entries for each amount over both days, asper Table 11.8.
TABLE 11.8 Accounting entries
Date DR/CR Account Amount
On ex-dividend date
7 Aug 2013 DR Outstanding dividends (depot) GBP (3,000.00)
7 Aug 2013 DR Outstanding dividends (claim) GBP (2,000.00)
7 Aug 2013 CR Equity dividend GBP 5,000.00
On payment date
13 Sep 2013 CR Outstanding dividends (depot) GBP 3,000.00
13 Sep 2013 CR Outstanding dividends (claim) GBP 2,000.00
13 Sep 2013 DR Bank (dividend from issuer) GBP (3,000.00)
13 Sep 2013 DR Bank (dividend from claim) GBP (2,000.00)
11.5.3 Opt ional Stock Div idend
If the issuer wishes to retain cash in the business it can give the shareholder the option of takingeither cash or shares to the value of the cash dividend. So whilst the sharing of the profits, onceapproved, can be regarded as a mandatory event, we now have the situation where a choicehas to be made. The convention in most markets is that shareholders will accept the dividendin cash rather than opting to take shares. (Accepting cash gives the shareholder reinvestmentchoices; taking shares does not.).
In order to cultivate the number of shares allotted, we have to be informed of two pieces ofinformation:
1. The amount of cash per share: This will be straightforward and will be announced bythe company in the usual way.
2. The cash value of each new share: In order to do this, the company needs to know themarket price of each share. The problem is that the share price changes all the time, makingit difficult to inform the shareholder how many shares they will receive. To overcome thisproblem, the company will fix a price based, for example, on the average closing price ofthe shares over the last several days or so. The exact basis on which this consolidation ismade will be contained in the original event announcement.
An example of this type of corporate action involves the final dividend of 59.0p per share forthe year ended 31 March 2013 by ABC plc. (see Table 11.9).
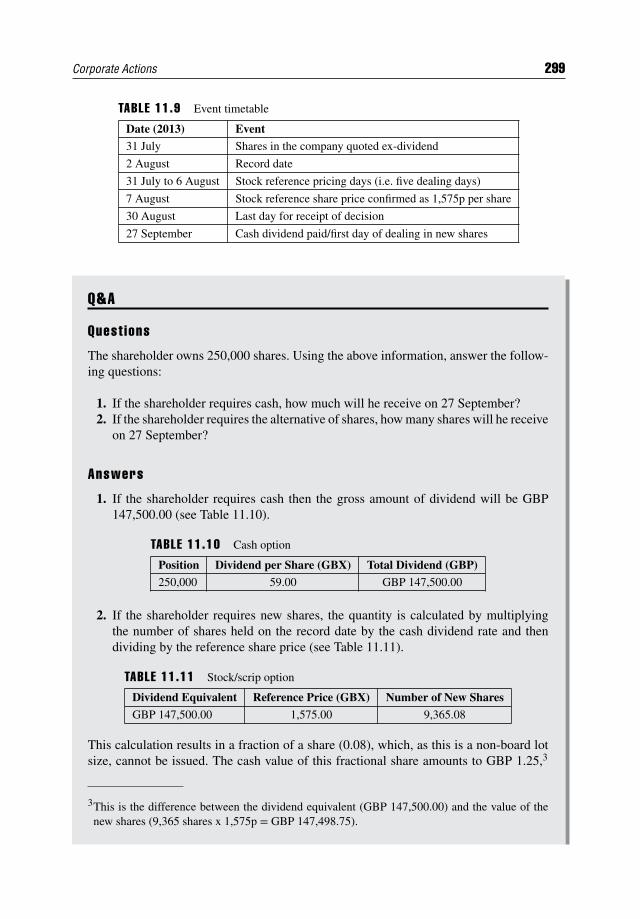
Corporate Actions 299
TABLE 11.9 Event timetable
Date (2013) Event31 July Shares in the company quoted ex-dividend
2 August Record date
31 July to 6 August Stock reference pricing days (i.e. five dealing days)
7 August Stock reference share price confirmed as 1,575p per share
30 August Last day for receipt of decision
27 September Cash dividend paid/first day of dealing in new shares
Q&A
Quest ions
The shareholder owns 250,000 shares. Using the above information, answer the follow-ing questions:
1. If the shareholder requires cash, how much will he receive on 27 September?2. If the shareholder requires the alternative of shares, how many shares will he receive
on 27 September?
Answers
1. If the shareholder requires cash then the gross amount of dividend will be GBP147,500.00 (see Table 11.10).
TABLE 11.10 Cash option
Position Dividend per Share (GBX) Total Dividend (GBP)250,000 59.00 GBP 147,500.00
2. If the shareholder requires new shares, the quantity is calculated by multiplyingthe number of shares held on the record date by the cash dividend rate and thendividing by the reference share price (see Table 11.11).
TABLE 11.11 Stock/scrip option
Dividend Equivalent Reference Price (GBX) Number of New Shares
GBP 147,500.00 1,575.00 9,365.08
This calculation results in a fraction of a share (0.08), which, as this is a non-board lotsize, cannot be issued. The cash value of this fractional share amounts to GBP 1.25,3
3This is the difference between the dividend equivalent (GBP 147,500.00) and the value of thenew shares (9,365 shares x 1,575p = GBP 147,498.75).
300 FINANCIAL MARKETS OPERATIONS MANAGEMENT
and this is held over until the next dividend payment and used together with the nextdividend to buy more shares. An alternative description would be that the shareholderhas the option to receive one new share for every 26.6949 existing shares (i.e. 250,000/9,365.08).
As you will have noticed, there is a decision that needs to be made in terms of whether totake shares or receive cash. In most cases, the default option is to take cash; in other words, ifthe shareholder wishes to take cash then he need take no action. If, however, he requires newshares, then he must make this decision within the deadline specified by the company.
11.5.4 F ixed- Income Bond Coupon
Bond issuers have an obligation to service their debts on a predefined basis. In the case of afixed-income bond, the amount of coupon and the payment date of the coupons are known inadvance. As a consequence, there is no need for the bond issuer to make an announcementof this event. Depending on whether the bonds are in bearer form or in registered form, thebondholder will either have to claim the coupon (bonds in bearer form) or will automaticallybe paid by the issuer (bonds in registered form).
Bonds in Bearer Form Traditionally, the custodian bank that held the bond certificateson behalf of the bondholder (the investor) would separate the appropriate coupon (known ascoupon clipping) from the host bond and present it to the bond issuer’s paying agent. Thepaying agent would pay the amount of coupon noted on the coupon itself to the custodian (andthe custodian would credit the funds to the investor’s cash account).
Interest on bonds accrues on a daily basis and the corresponding accounting entries are postedto match. On the coupon payment date, the accrued interest account is debited and the bondinterest account credited with the full amount.
Most bonds today are held centrally by a central securities depository and this makes thecollection of coupon payments much more efficient. However, in situations where the bondsare held by the investor (or his custodian), it is possible to present the coupons to the payingagent after the coupon payment date. In this situation, the paying agent will pay the couponbut will not pay any interest on the coupon itself; in other words, there is a funding implicationthrough the late presentation of the coupon to the paying agent. There is a time limit forpresenting coupons and this is usually in terms of a number of years; time enough for eventhe most inefficient custodian or forgetful investor to claim the dividend. This time limit isreferred to as a prescription period.
Depending on the market convention for any particular bond, coupons are paid annually, semi-annually or quarterly. Therefore, the first coupon will be paid twelve months, six months orthree months after the date on which the bond was issued. There are occasionally exceptionswhen the first coupon is paid either before or after the expected first coupon date. We refer tothese as either a first short coupon or a first long coupon. Whether short or long, once the firstcoupon has been paid, the normal payment frequency follows.
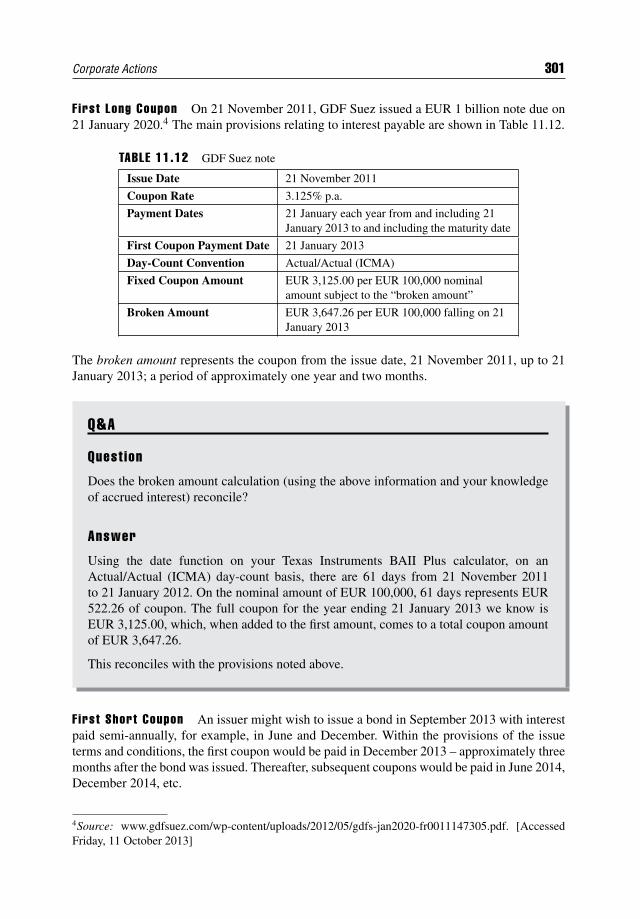
Corporate Actions 301
First Long Coupon On 21 November 2011, GDF Suez issued a EUR 1 billion note due on21 January 2020.4 The main provisions relating to interest payable are shown in Table 11.12.
TABLE 11.12 GDF Suez note
Issue Date 21 November 2011
Coupon Rate 3.125% p.a.
Payment Dates 21 January each year from and including 21January 2013 to and including the maturity date
First Coupon Payment Date 21 January 2013
Day-Count Convention Actual/Actual (ICMA)
Fixed Coupon Amount EUR 3,125.00 per EUR 100,000 nominalamount subject to the “broken amount”
Broken Amount EUR 3,647.26 per EUR 100,000 falling on 21January 2013
The broken amount represents the coupon from the issue date, 21 November 2011, up to 21January 2013; a period of approximately one year and two months.
Q&A
Quest ion
Does the broken amount calculation (using the above information and your knowledgeof accrued interest) reconcile?
Answer
Using the date function on your Texas Instruments BAII Plus calculator, on anActual/Actual (ICMA) day-count basis, there are 61 days from 21 November 2011to 21 January 2012. On the nominal amount of EUR 100,000, 61 days represents EUR522.26 of coupon. The full coupon for the year ending 21 January 2013 we know isEUR 3,125.00, which, when added to the first amount, comes to a total coupon amountof EUR 3,647.26.
This reconciles with the provisions noted above.
F irst Short Coupon An issuer might wish to issue a bond in September 2013 with interestpaid semi-annually, for example, in June and December. Within the provisions of the issueterms and conditions, the first coupon would be paid in December 2013 – approximately threemonths after the bond was issued. Thereafter, subsequent coupons would be paid in June 2014,December 2014, etc.
4Source: www.gdfsuez.com/wp-content/uploads/2012/05/gdfs-jan2020-fr0011147305.pdf. [AccessedFriday, 11 October 2013]
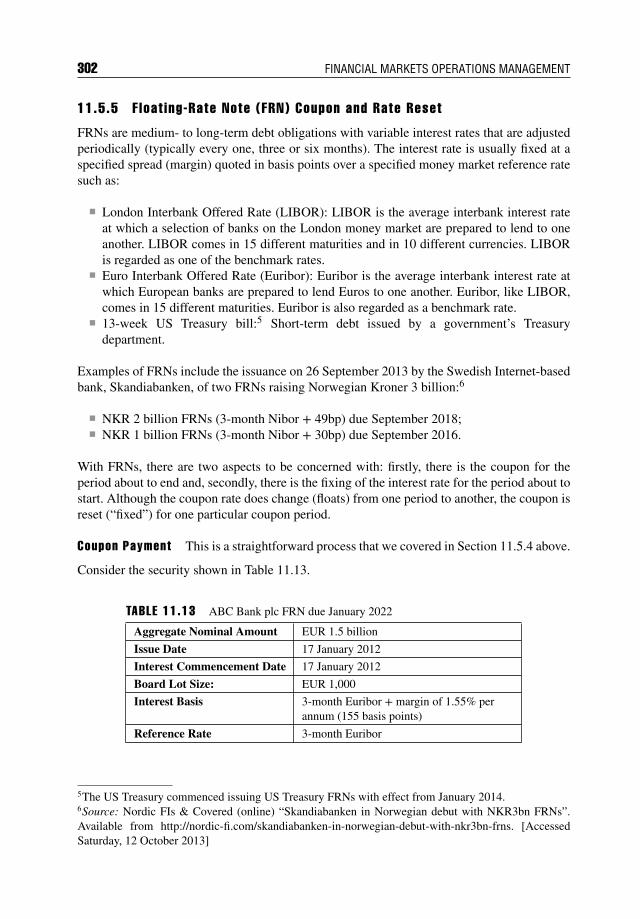
302 FINANCIAL MARKETS OPERATIONS MANAGEMENT
11.5.5 F loat ing-Rate Note (FRN) Coupon and Rate Reset
FRNs are medium- to long-term debt obligations with variable interest rates that are adjustedperiodically (typically every one, three or six months). The interest rate is usually fixed at aspecified spread (margin) quoted in basis points over a specified money market reference ratesuch as:
London Interbank Offered Rate (LIBOR): LIBOR is the average interbank interest rateat which a selection of banks on the London money market are prepared to lend to oneanother. LIBOR comes in 15 different maturities and in 10 different currencies. LIBORis regarded as one of the benchmark rates.
Euro Interbank Offered Rate (Euribor): Euribor is the average interbank interest rate atwhich European banks are prepared to lend Euros to one another. Euribor, like LIBOR,comes in 15 different maturities. Euribor is also regarded as a benchmark rate.
13-week US Treasury bill:5 Short-term debt issued by a government’s Treasurydepartment.
Examples of FRNs include the issuance on 26 September 2013 by the Swedish Internet-basedbank, Skandiabanken, of two FRNs raising Norwegian Kroner 3 billion:6
NKR 2 billion FRNs (3-month Nibor + 49bp) due September 2018; NKR 1 billion FRNs (3-month Nibor + 30bp) due September 2016.
With FRNs, there are two aspects to be concerned with: firstly, there is the coupon for theperiod about to end and, secondly, there is the fixing of the interest rate for the period about tostart. Although the coupon rate does change (floats) from one period to another, the coupon isreset (“fixed”) for one particular coupon period.
Coupon Payment This is a straightforward process that we covered in Section 11.5.4 above.
Consider the security shown in Table 11.13.
TABLE 11.13 ABC Bank plc FRN due January 2022
Aggregate Nominal Amount EUR 1.5 billion
Issue Date 17 January 2012
Interest Commencement Date 17 January 2012
Board Lot Size: EUR 1,000
Interest Basis 3-month Euribor + margin of 1.55% perannum (155 basis points)
Reference Rate 3-month Euribor
5The US Treasury commenced issuing US Treasury FRNs with effect from January 2014.6Source: Nordic FIs & Covered (online) “Skandiabanken in Norwegian debut with NKR3bn FRNs”.Available from http://nordic-fi.com/skandiabanken-in-norwegian-debut-with-nkr3bn-frns. [AccessedSaturday, 12 October 2013]
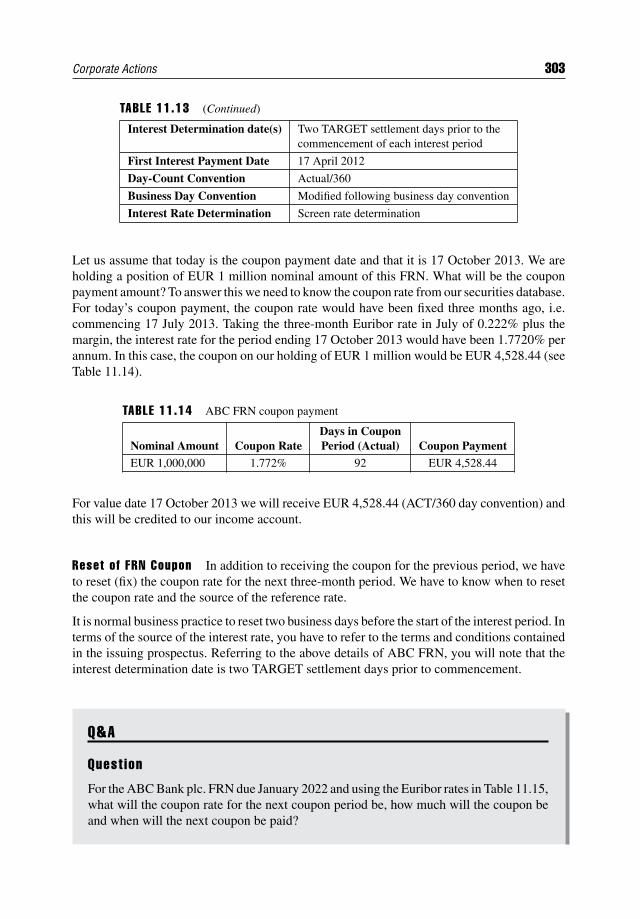
Corporate Actions 303
TABLE 11.13 (Continued)
Interest Determination date(s) Two TARGET settlement days prior to thecommencement of each interest period
First Interest Payment Date 17 April 2012
Day-Count Convention Actual/360
Business Day Convention Modified following business day convention
Interest Rate Determination Screen rate determination
Let us assume that today is the coupon payment date and that it is 17 October 2013. We areholding a position of EUR 1 million nominal amount of this FRN. What will be the couponpayment amount? To answer this we need to know the coupon rate from our securities database.For today’s coupon payment, the coupon rate would have been fixed three months ago, i.e.commencing 17 July 2013. Taking the three-month Euribor rate in July of 0.222% plus themargin, the interest rate for the period ending 17 October 2013 would have been 1.7720% perannum. In this case, the coupon on our holding of EUR 1 million would be EUR 4,528.44 (seeTable 11.14).
TABLE 11.14 ABC FRN coupon payment
Nominal Amount Coupon RateDays in CouponPeriod (Actual) Coupon Payment
EUR 1,000,000 1.772% 92 EUR 4,528.44
For value date 17 October 2013 we will receive EUR 4,528.44 (ACT/360 day convention) andthis will be credited to our income account.
Reset of FRN Coupon In addition to receiving the coupon for the previous period, we haveto reset (fix) the coupon rate for the next three-month period. We have to know when to resetthe coupon rate and the source of the reference rate.
It is normal business practice to reset two business days before the start of the interest period. Interms of the source of the interest rate, you have to refer to the terms and conditions containedin the issuing prospectus. Referring to the above details of ABC FRN, you will note that theinterest determination date is two TARGET settlement days prior to commencement.
Q&A
Quest ion
For the ABC Bank plc. FRN due January 2022 and using the Euribor rates in Table 11.15,what will the coupon rate for the next coupon period be, how much will the coupon beand when will the next coupon be paid?
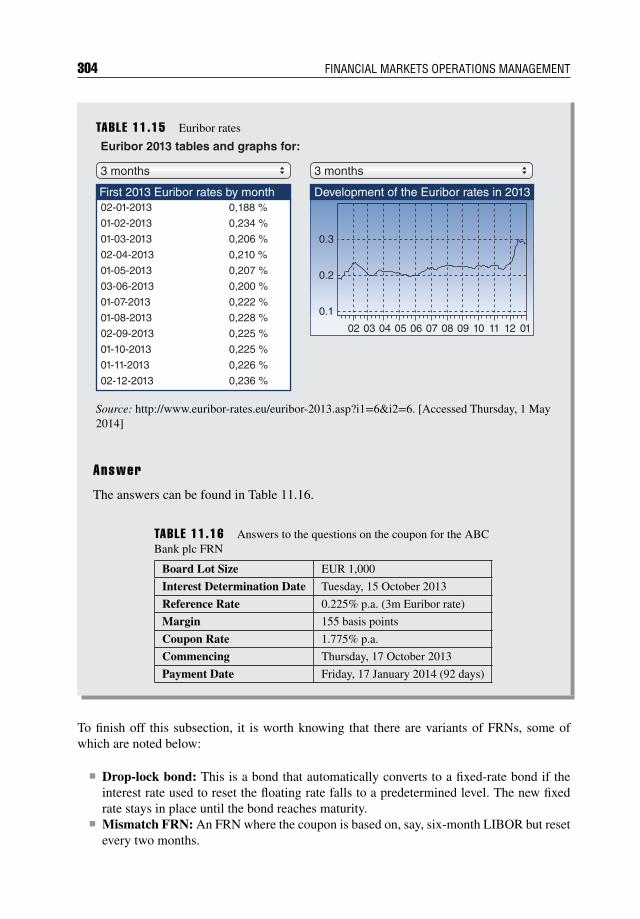
304 FINANCIAL MARKETS OPERATIONS MANAGEMENT
TABLE 11.15 Euribor rates
02-01-2013First 2013 Euribor rates by month Development of the Euribor rates in 2013
3 months
Euribor 2013 tables and graphs for:
01-02-2013
01-03-2013
02-04-2013
01-05-2013
03-06-2013
01-07-2013
01-08-2013
02-09-2013
01-10-2013
01-11-2013
02-12-2013
0,188 %
0,234 %
0,206 %
0,210 %
0,207 %
0.3
0.2
0.1
02 03 04 05 06 07 08 09 10 11 12 01
0,200 %
0,222 %
0,228 %
0,225 %
0,225 %
0,226 %
0,236 %
3 months
Source: http://www.euribor-rates.eu/euribor-2013.asp?i1=6&i2=6. [Accessed Thursday, 1 May2014]
Answer
The answers can be found in Table 11.16.
TABLE 11.16 Answers to the questions on the coupon for the ABCBank plc FRN
Board Lot Size EUR 1,000
Interest Determination Date Tuesday, 15 October 2013
Reference Rate 0.225% p.a. (3m Euribor rate)
Margin 155 basis points
Coupon Rate 1.775% p.a.
Commencing Thursday, 17 October 2013
Payment Date Friday, 17 January 2014 (92 days)
To finish off this subsection, it is worth knowing that there are variants of FRNs, some ofwhich are noted below:
Drop-lock bond: This is a bond that automatically converts to a fixed-rate bond if theinterest rate used to reset the floating rate falls to a predetermined level. The new fixedrate stays in place until the bond reaches maturity.
Mismatch FRN: An FRN where the coupon is based on, say, six-month LIBOR but resetevery two months.
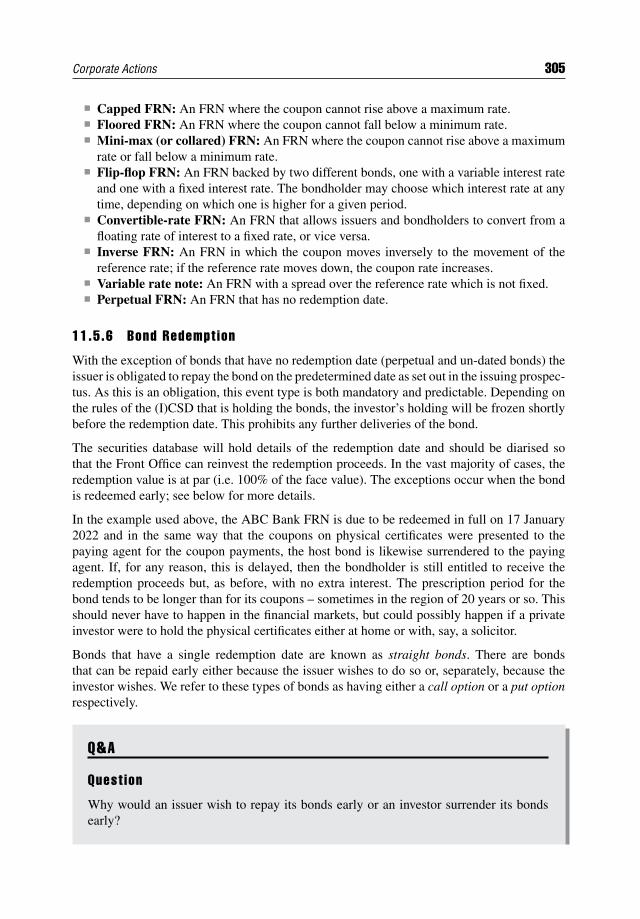
Corporate Actions 305
Capped FRN: An FRN where the coupon cannot rise above a maximum rate. Floored FRN: An FRN where the coupon cannot fall below a minimum rate. Mini-max (or collared) FRN: An FRN where the coupon cannot rise above a maximum
rate or fall below a minimum rate. Flip-flop FRN: An FRN backed by two different bonds, one with a variable interest rate
and one with a fixed interest rate. The bondholder may choose which interest rate at anytime, depending on which one is higher for a given period.
Convertible-rate FRN: An FRN that allows issuers and bondholders to convert from afloating rate of interest to a fixed rate, or vice versa.
Inverse FRN: An FRN in which the coupon moves inversely to the movement of thereference rate; if the reference rate moves down, the coupon rate increases.
Variable rate note: An FRN with a spread over the reference rate which is not fixed. Perpetual FRN: An FRN that has no redemption date.
11.5.6 Bond Redempt ion
With the exception of bonds that have no redemption date (perpetual and un-dated bonds) theissuer is obligated to repay the bond on the predetermined date as set out in the issuing prospec-tus. As this is an obligation, this event type is both mandatory and predictable. Depending onthe rules of the (I)CSD that is holding the bonds, the investor’s holding will be frozen shortlybefore the redemption date. This prohibits any further deliveries of the bond.
The securities database will hold details of the redemption date and should be diarised sothat the Front Office can reinvest the redemption proceeds. In the vast majority of cases, theredemption value is at par (i.e. 100% of the face value). The exceptions occur when the bondis redeemed early; see below for more details.
In the example used above, the ABC Bank FRN is due to be redeemed in full on 17 January2022 and in the same way that the coupons on physical certificates were presented to thepaying agent for the coupon payments, the host bond is likewise surrendered to the payingagent. If, for any reason, this is delayed, then the bondholder is still entitled to receive theredemption proceeds but, as before, with no extra interest. The prescription period for thebond tends to be longer than for its coupons – sometimes in the region of 20 years or so. Thisshould never have to happen in the financial markets, but could possibly happen if a privateinvestor were to hold the physical certificates either at home or with, say, a solicitor.
Bonds that have a single redemption date are known as straight bonds. There are bondsthat can be repaid early either because the issuer wishes to do so or, separately, because theinvestor wishes. We refer to these types of bonds as having either a call option or a put optionrespectively.
Q&A
Quest ion
Why would an issuer wish to repay its bonds early or an investor surrender its bondsearly?
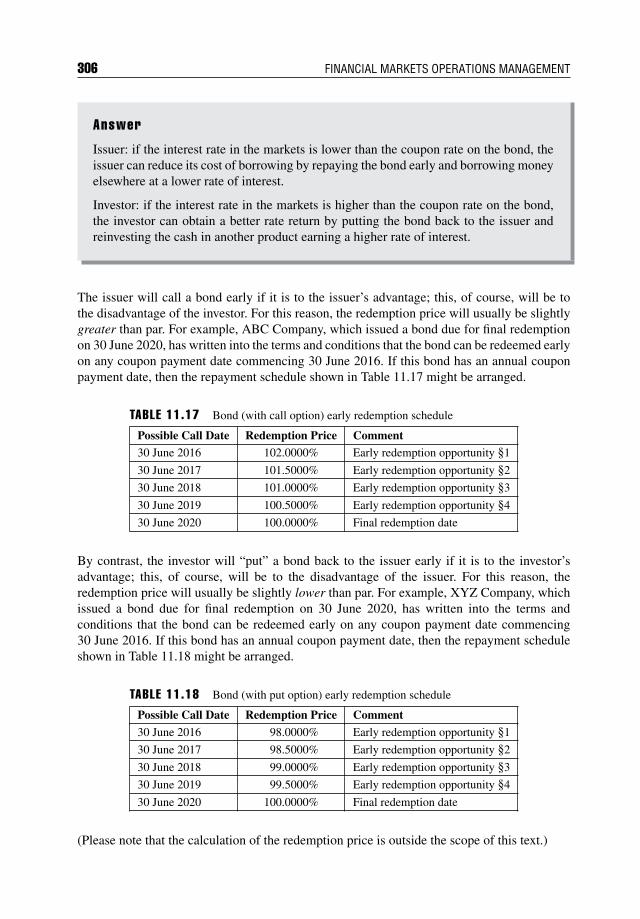
306 FINANCIAL MARKETS OPERATIONS MANAGEMENT
Answer
Issuer: if the interest rate in the markets is lower than the coupon rate on the bond, theissuer can reduce its cost of borrowing by repaying the bond early and borrowing moneyelsewhere at a lower rate of interest.
Investor: if the interest rate in the markets is higher than the coupon rate on the bond,the investor can obtain a better rate return by putting the bond back to the issuer andreinvesting the cash in another product earning a higher rate of interest.
The issuer will call a bond early if it is to the issuer’s advantage; this, of course, will be tothe disadvantage of the investor. For this reason, the redemption price will usually be slightlygreater than par. For example, ABC Company, which issued a bond due for final redemptionon 30 June 2020, has written into the terms and conditions that the bond can be redeemed earlyon any coupon payment date commencing 30 June 2016. If this bond has an annual couponpayment date, then the repayment schedule shown in Table 11.17 might be arranged.
TABLE 11.17 Bond (with call option) early redemption schedule
Possible Call Date Redemption Price Comment30 June 2016 102.0000% Early redemption opportunity §1
30 June 2017 101.5000% Early redemption opportunity §2
30 June 2018 101.0000% Early redemption opportunity §3
30 June 2019 100.5000% Early redemption opportunity §4
30 June 2020 100.0000% Final redemption date
By contrast, the investor will “put” a bond back to the issuer early if it is to the investor’sadvantage; this, of course, will be to the disadvantage of the issuer. For this reason, theredemption price will usually be slightly lower than par. For example, XYZ Company, whichissued a bond due for final redemption on 30 June 2020, has written into the terms andconditions that the bond can be redeemed early on any coupon payment date commencing30 June 2016. If this bond has an annual coupon payment date, then the repayment scheduleshown in Table 11.18 might be arranged.
TABLE 11.18 Bond (with put option) early redemption schedule
Possible Call Date Redemption Price Comment
30 June 2016 98.0000% Early redemption opportunity §1
30 June 2017 98.5000% Early redemption opportunity §2
30 June 2018 99.0000% Early redemption opportunity §3
30 June 2019 99.5000% Early redemption opportunity §4
30 June 2020 100.0000% Final redemption date
(Please note that the calculation of the redemption price is outside the scope of this text.)
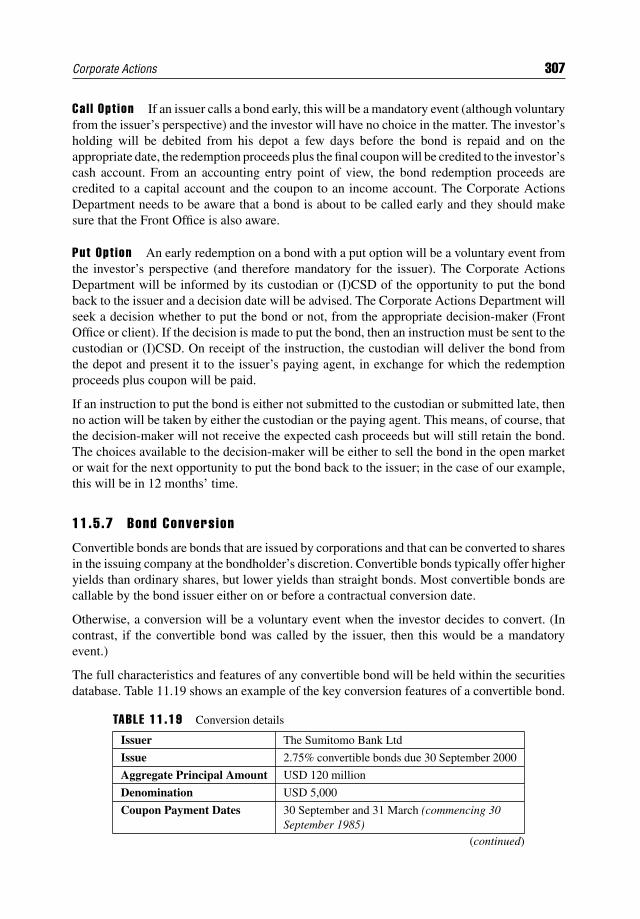
Corporate Actions 307
Cal l Opt ion If an issuer calls a bond early, this will be a mandatory event (although voluntaryfrom the issuer’s perspective) and the investor will have no choice in the matter. The investor’sholding will be debited from his depot a few days before the bond is repaid and on theappropriate date, the redemption proceeds plus the final coupon will be credited to the investor’scash account. From an accounting entry point of view, the bond redemption proceeds arecredited to a capital account and the coupon to an income account. The Corporate ActionsDepartment needs to be aware that a bond is about to be called early and they should makesure that the Front Office is also aware.
Put Opt ion An early redemption on a bond with a put option will be a voluntary event fromthe investor’s perspective (and therefore mandatory for the issuer). The Corporate ActionsDepartment will be informed by its custodian or (I)CSD of the opportunity to put the bondback to the issuer and a decision date will be advised. The Corporate Actions Department willseek a decision whether to put the bond or not, from the appropriate decision-maker (FrontOffice or client). If the decision is made to put the bond, then an instruction must be sent to thecustodian or (I)CSD. On receipt of the instruction, the custodian will deliver the bond fromthe depot and present it to the issuer’s paying agent, in exchange for which the redemptionproceeds plus coupon will be paid.
If an instruction to put the bond is either not submitted to the custodian or submitted late, thenno action will be taken by either the custodian or the paying agent. This means, of course, thatthe decision-maker will not receive the expected cash proceeds but will still retain the bond.The choices available to the decision-maker will be either to sell the bond in the open marketor wait for the next opportunity to put the bond back to the issuer; in the case of our example,this will be in 12 months’ time.
11.5.7 Bond Conversion
Convertible bonds are bonds that are issued by corporations and that can be converted to sharesin the issuing company at the bondholder’s discretion. Convertible bonds typically offer higheryields than ordinary shares, but lower yields than straight bonds. Most convertible bonds arecallable by the bond issuer either on or before a contractual conversion date.
Otherwise, a conversion will be a voluntary event when the investor decides to convert. (Incontrast, if the convertible bond was called by the issuer, then this would be a mandatoryevent.)
The full characteristics and features of any convertible bond will be held within the securitiesdatabase. Table 11.19 shows an example of the key conversion features of a convertible bond.
TABLE 11.19 Conversion details
Issuer The Sumitomo Bank Ltd
Issue 2.75% convertible bonds due 30 September 2000
Aggregate Principal Amount USD 120 million
Denomination USD 5,000
Coupon Payment Dates 30 September and 31 March (commencing 30September 1985)
(continued)
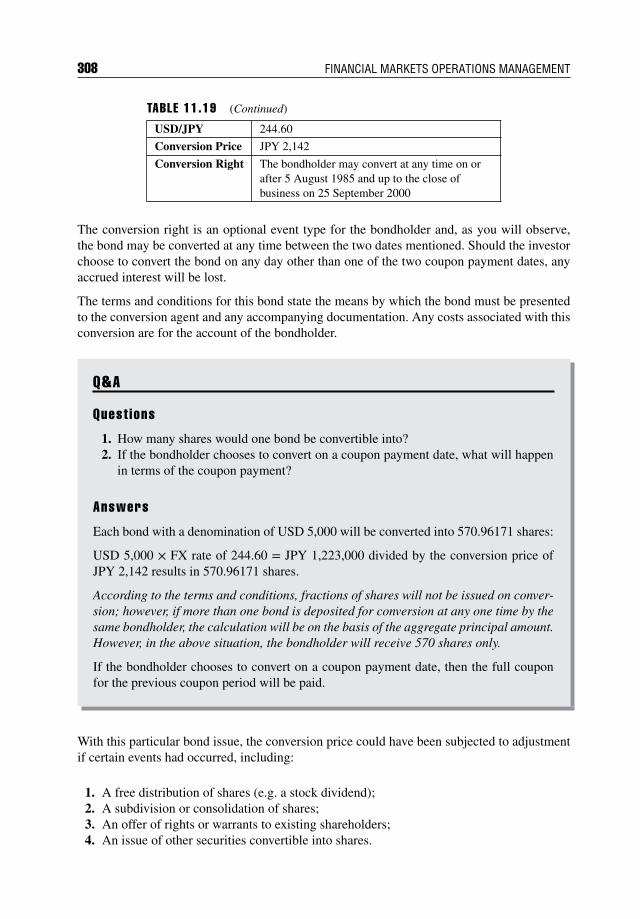
308 FINANCIAL MARKETS OPERATIONS MANAGEMENT
TABLE 11.19 (Continued)
USD/JPY 244.60
Conversion Price JPY 2,142
Conversion Right The bondholder may convert at any time on orafter 5 August 1985 and up to the close ofbusiness on 25 September 2000
The conversion right is an optional event type for the bondholder and, as you will observe,the bond may be converted at any time between the two dates mentioned. Should the investorchoose to convert the bond on any day other than one of the two coupon payment dates, anyaccrued interest will be lost.
The terms and conditions for this bond state the means by which the bond must be presentedto the conversion agent and any accompanying documentation. Any costs associated with thisconversion are for the account of the bondholder.
Q&A
Quest ions
1. How many shares would one bond be convertible into?2. If the bondholder chooses to convert on a coupon payment date, what will happen
in terms of the coupon payment?
Answers
Each bond with a denomination of USD 5,000 will be converted into 570.96171 shares:
USD 5,000 × FX rate of 244.60 = JPY 1,223,000 divided by the conversion price ofJPY 2,142 results in 570.96171 shares.
According to the terms and conditions, fractions of shares will not be issued on conver-sion; however, if more than one bond is deposited for conversion at any one time by thesame bondholder, the calculation will be on the basis of the aggregate principal amount.However, in the above situation, the bondholder will receive 570 shares only.
If the bondholder chooses to convert on a coupon payment date, then the full couponfor the previous coupon period will be paid.
With this particular bond issue, the conversion price could have been subjected to adjustmentif certain events had occurred, including:
1. A free distribution of shares (e.g. a stock dividend);2. A subdivision or consolidation of shares;3. An offer of rights or warrants to existing shareholders;4. An issue of other securities convertible into shares.
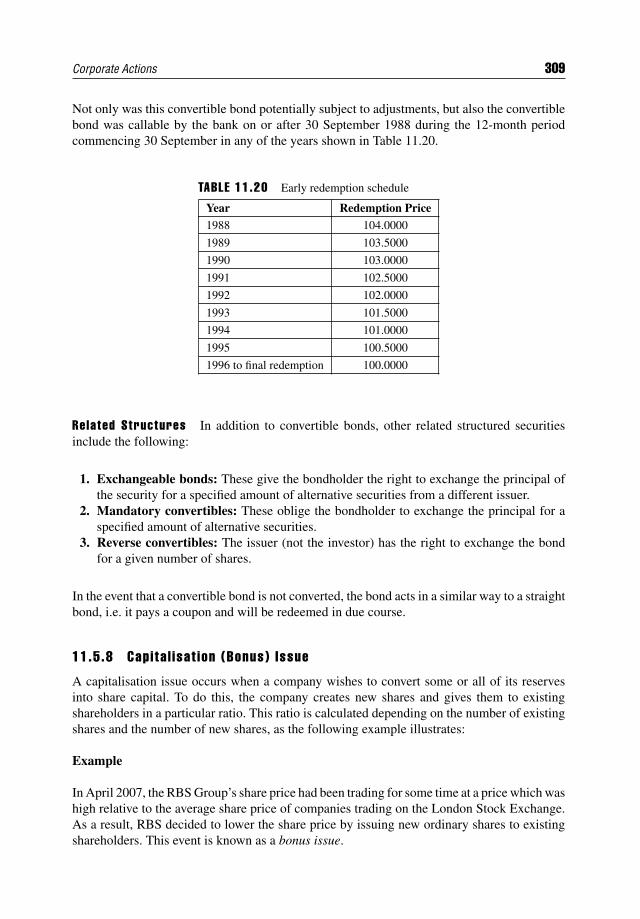
Corporate Actions 309
Not only was this convertible bond potentially subject to adjustments, but also the convertiblebond was callable by the bank on or after 30 September 1988 during the 12-month periodcommencing 30 September in any of the years shown in Table 11.20.
TABLE 11.20 Early redemption schedule
Year Redemption Price1988 104.0000
1989 103.5000
1990 103.0000
1991 102.5000
1992 102.0000
1993 101.5000
1994 101.0000
1995 100.5000
1996 to final redemption 100.0000
Related Structures In addition to convertible bonds, other related structured securitiesinclude the following:
1. Exchangeable bonds: These give the bondholder the right to exchange the principal ofthe security for a specified amount of alternative securities from a different issuer.
2. Mandatory convertibles: These oblige the bondholder to exchange the principal for aspecified amount of alternative securities.
3. Reverse convertibles: The issuer (not the investor) has the right to exchange the bondfor a given number of shares.
In the event that a convertible bond is not converted, the bond acts in a similar way to a straightbond, i.e. it pays a coupon and will be redeemed in due course.
11.5.8 Capita l isat ion (Bonus) Issue
A capitalisation issue occurs when a company wishes to convert some or all of its reservesinto share capital. To do this, the company creates new shares and gives them to existingshareholders in a particular ratio. This ratio is calculated depending on the number of existingshares and the number of new shares, as the following example illustrates:
Example
In April 2007, the RBS Group’s share price had been trading for some time at a price which washigh relative to the average share price of companies trading on the London Stock Exchange.As a result, RBS decided to lower the share price by issuing new ordinary shares to existingshareholders. This event is known as a bonus issue.
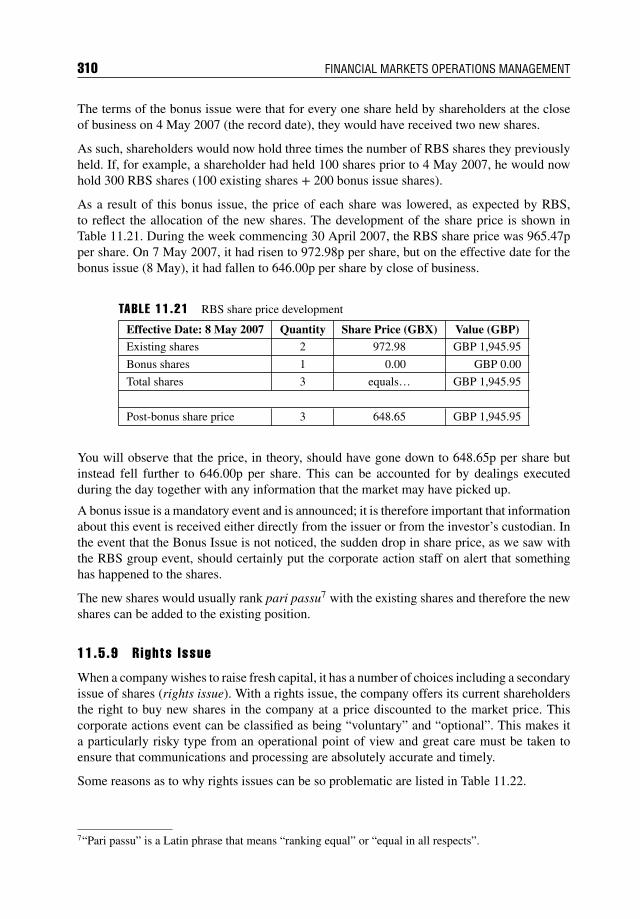
310 FINANCIAL MARKETS OPERATIONS MANAGEMENT
The terms of the bonus issue were that for every one share held by shareholders at the closeof business on 4 May 2007 (the record date), they would have received two new shares.
As such, shareholders would now hold three times the number of RBS shares they previouslyheld. If, for example, a shareholder had held 100 shares prior to 4 May 2007, he would nowhold 300 RBS shares (100 existing shares + 200 bonus issue shares).
As a result of this bonus issue, the price of each share was lowered, as expected by RBS,to reflect the allocation of the new shares. The development of the share price is shown inTable 11.21. During the week commencing 30 April 2007, the RBS share price was 965.47pper share. On 7 May 2007, it had risen to 972.98p per share, but on the effective date for thebonus issue (8 May), it had fallen to 646.00p per share by close of business.
TABLE 11.21 RBS share price development
Effective Date: 8 May 2007 Quantity Share Price (GBX) Value (GBP)Existing shares 2 972.98 GBP 1,945.95
Bonus shares 1 0.00 GBP 0.00
Total shares 3 equals… GBP 1,945.95
Post-bonus share price 3 648.65 GBP 1,945.95
You will observe that the price, in theory, should have gone down to 648.65p per share butinstead fell further to 646.00p per share. This can be accounted for by dealings executedduring the day together with any information that the market may have picked up.
A bonus issue is a mandatory event and is announced; it is therefore important that informationabout this event is received either directly from the issuer or from the investor’s custodian. Inthe event that the Bonus Issue is not noticed, the sudden drop in share price, as we saw withthe RBS group event, should certainly put the corporate action staff on alert that somethinghas happened to the shares.
The new shares would usually rank pari passu7 with the existing shares and therefore the newshares can be added to the existing position.
11.5.9 Rights Issue
When a company wishes to raise fresh capital, it has a number of choices including a secondaryissue of shares (rights issue). With a rights issue, the company offers its current shareholdersthe right to buy new shares in the company at a price discounted to the market price. Thiscorporate actions event can be classified as being “voluntary” and “optional”. This makes ita particularly risky type from an operational point of view and great care must be taken toensure that communications and processing are absolutely accurate and timely.
Some reasons as to why rights issues can be so problematic are listed in Table 11.22.
7“Pari passu” is a Latin phrase that means “ranking equal” or “equal in all respects”.
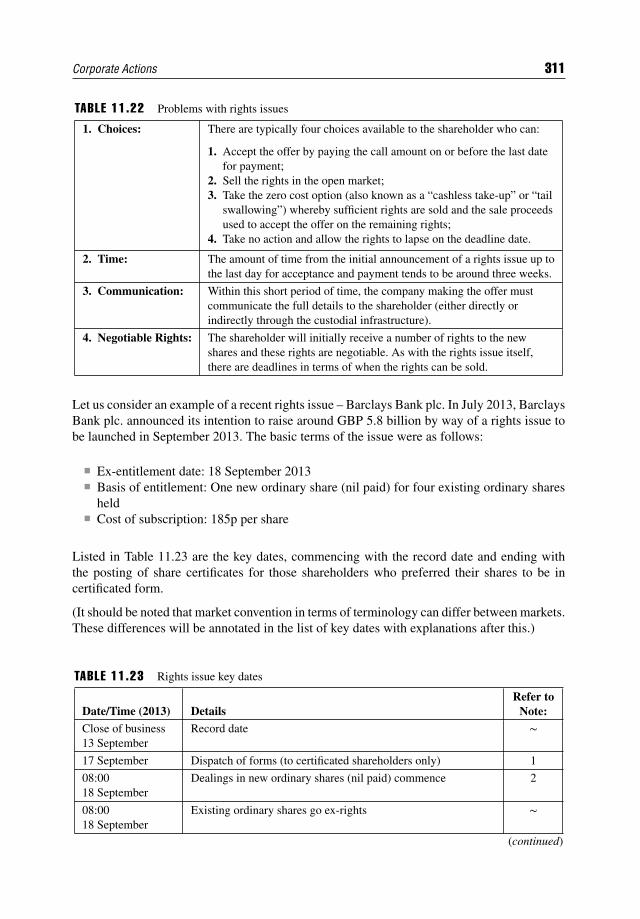
Corporate Actions 311
TABLE 11.22 Problems with rights issues
1. Choices: There are typically four choices available to the shareholder who can:
1. Accept the offer by paying the call amount on or before the last datefor payment;
2. Sell the rights in the open market;3. Take the zero cost option (also known as a “cashless take-up” or “tail
swallowing”) whereby sufficient rights are sold and the sale proceedsused to accept the offer on the remaining rights;
4. Take no action and allow the rights to lapse on the deadline date.
2. Time: The amount of time from the initial announcement of a rights issue up tothe last day for acceptance and payment tends to be around three weeks.
3. Communication: Within this short period of time, the company making the offer mustcommunicate the full details to the shareholder (either directly orindirectly through the custodial infrastructure).
4. Negotiable Rights: The shareholder will initially receive a number of rights to the newshares and these rights are negotiable. As with the rights issue itself,there are deadlines in terms of when the rights can be sold.
Let us consider an example of a recent rights issue – Barclays Bank plc. In July 2013, BarclaysBank plc. announced its intention to raise around GBP 5.8 billion by way of a rights issue tobe launched in September 2013. The basic terms of the issue were as follows:
Ex-entitlement date: 18 September 2013 Basis of entitlement: One new ordinary share (nil paid) for four existing ordinary shares
held Cost of subscription: 185p per share
Listed in Table 11.23 are the key dates, commencing with the record date and ending withthe posting of share certificates for those shareholders who preferred their shares to be incertificated form.
(It should be noted that market convention in terms of terminology can differ between markets.These differences will be annotated in the list of key dates with explanations after this.)
TABLE 11.23 Rights issue key dates
Date/Time (2013) DetailsRefer to
Note:
Close of business13 September
Record date ∼
17 September Dispatch of forms (to certificated shareholders only) 1
08:0018 September
Dealings in new ordinary shares (nil paid) commence 2
08:0018 September
Existing ordinary shares go ex-rights ∼
(continued)
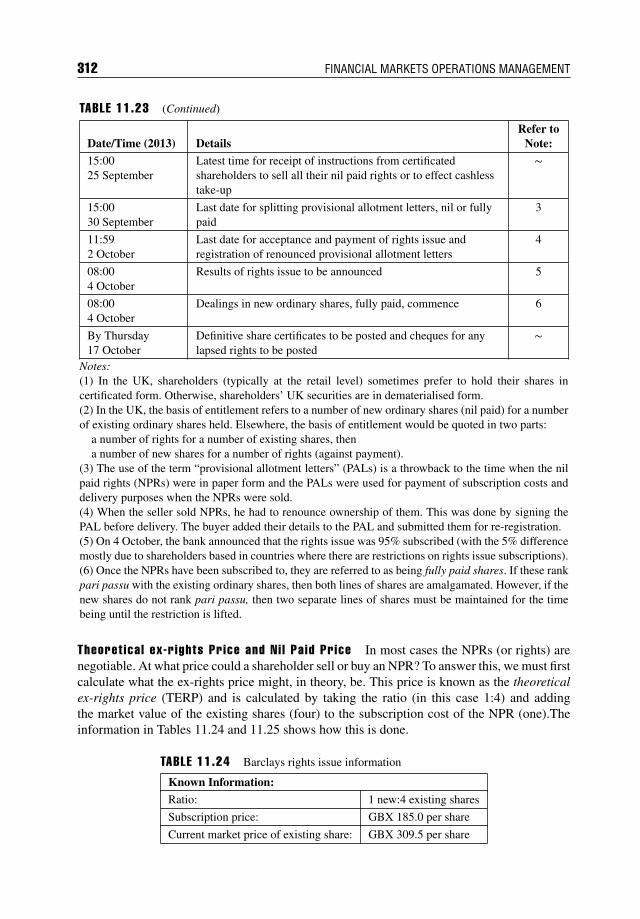
312 FINANCIAL MARKETS OPERATIONS MANAGEMENT
TABLE 11.23 (Continued)
Date/Time (2013) DetailsRefer to
Note:
15:0025 September
Latest time for receipt of instructions from certificatedshareholders to sell all their nil paid rights or to effect cashlesstake-up
∼
15:0030 September
Last date for splitting provisional allotment letters, nil or fullypaid
3
11:592 October
Last date for acceptance and payment of rights issue andregistration of renounced provisional allotment letters
4
08:004 October
Results of rights issue to be announced 5
08:004 October
Dealings in new ordinary shares, fully paid, commence 6
By Thursday17 October
Definitive share certificates to be posted and cheques for anylapsed rights to be posted
∼
Notes:(1) In the UK, shareholders (typically at the retail level) sometimes prefer to hold their shares incertificated form. Otherwise, shareholders’ UK securities are in dematerialised form.(2) In the UK, the basis of entitlement refers to a number of new ordinary shares (nil paid) for a numberof existing ordinary shares held. Elsewhere, the basis of entitlement would be quoted in two parts:
a number of rights for a number of existing shares, thena number of new shares for a number of rights (against payment).
(3) The use of the term “provisional allotment letters” (PALs) is a throwback to the time when the nilpaid rights (NPRs) were in paper form and the PALs were used for payment of subscription costs anddelivery purposes when the NPRs were sold.(4) When the seller sold NPRs, he had to renounce ownership of them. This was done by signing thePAL before delivery. The buyer added their details to the PAL and submitted them for re-registration.(5) On 4 October, the bank announced that the rights issue was 95% subscribed (with the 5% differencemostly due to shareholders based in countries where there are restrictions on rights issue subscriptions).(6) Once the NPRs have been subscribed to, they are referred to as being fully paid shares. If these rankpari passu with the existing ordinary shares, then both lines of shares are amalgamated. However, if thenew shares do not rank pari passu, then two separate lines of shares must be maintained for the timebeing until the restriction is lifted.
Theoret ica l ex-r ights Price and Ni l Pa id Price In most cases the NPRs (or rights) arenegotiable. At what price could a shareholder sell or buy an NPR? To answer this, we must firstcalculate what the ex-rights price might, in theory, be. This price is known as the theoreticalex-rights price (TERP) and is calculated by taking the ratio (in this case 1:4) and addingthe market value of the existing shares (four) to the subscription cost of the NPR (one).Theinformation in Tables 11.24 and 11.25 shows how this is done.
TABLE 11.24 Barclays rights issue information
Known Information:
Ratio: 1 new:4 existing shares
Subscription price: GBX 185.0 per share
Current market price of existing share: GBX 309.5 per share
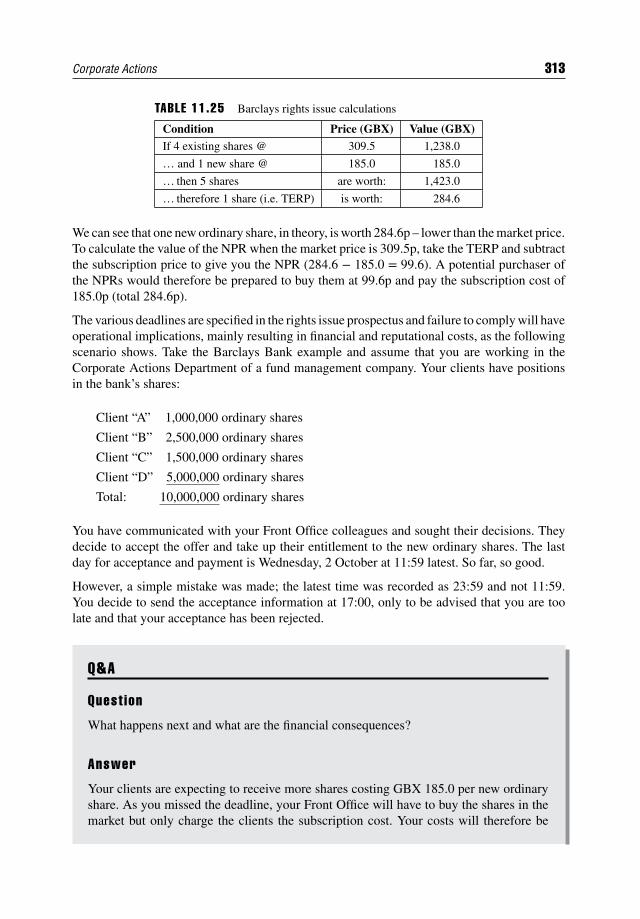
Corporate Actions 313
TABLE 11.25 Barclays rights issue calculations
Condition Price (GBX) Value (GBX)If 4 existing shares @ 309.5 1,238.0
… and 1 new share @ 185.0 185.0
… then 5 shares are worth: 1,423.0
… therefore 1 share (i.e. TERP) is worth: 284.6
We can see that one new ordinary share, in theory, is worth 284.6p – lower than the market price.To calculate the value of the NPR when the market price is 309.5p, take the TERP and subtractthe subscription price to give you the NPR (284.6 − 185.0 = 99.6). A potential purchaser ofthe NPRs would therefore be prepared to buy them at 99.6p and pay the subscription cost of185.0p (total 284.6p).
The various deadlines are specified in the rights issue prospectus and failure to comply will haveoperational implications, mainly resulting in financial and reputational costs, as the followingscenario shows. Take the Barclays Bank example and assume that you are working in theCorporate Actions Department of a fund management company. Your clients have positionsin the bank’s shares:
Client “A” 1,000,000 ordinary shares
Client “B” 2,500,000 ordinary shares
Client “C” 1,500,000 ordinary shares
Client “D” 5,000,000 ordinary shares
Total: 10,000,000 ordinary shares
You have communicated with your Front Office colleagues and sought their decisions. Theydecide to accept the offer and take up their entitlement to the new ordinary shares. The lastday for acceptance and payment is Wednesday, 2 October at 11:59 latest. So far, so good.
However, a simple mistake was made; the latest time was recorded as 23:59 and not 11:59.You decide to send the acceptance information at 17:00, only to be advised that you are toolate and that your acceptance has been rejected.
Q&A
Quest ion
What happens next and what are the financial consequences?
Answer
Your clients are expecting to receive more shares costing GBX 185.0 per new ordinaryshare. As you missed the deadline, your Front Office will have to buy the shares in themarket but only charge the clients the subscription cost. Your costs will therefore be
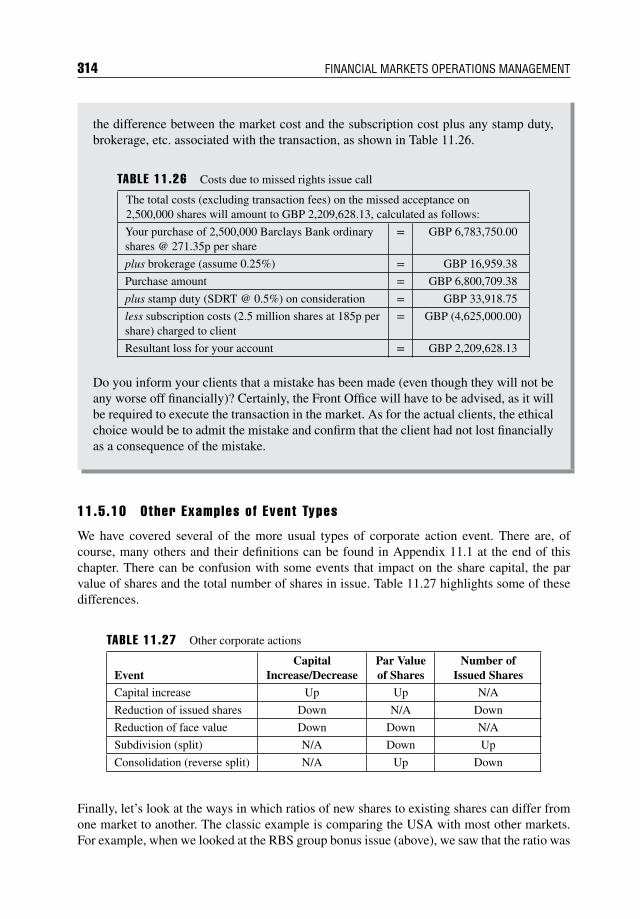
314 FINANCIAL MARKETS OPERATIONS MANAGEMENT
the difference between the market cost and the subscription cost plus any stamp duty,brokerage, etc. associated with the transaction, as shown in Table 11.26.
TABLE 11.26 Costs due to missed rights issue call
The total costs (excluding transaction fees) on the missed acceptance on2,500,000 shares will amount to GBP 2,209,628.13, calculated as follows:
Your purchase of 2,500,000 Barclays Bank ordinaryshares @ 271.35p per share
= GBP 6,783,750.00
plus brokerage (assume 0.25%) = GBP 16,959.38
Purchase amount = GBP 6,800,709.38
plus stamp duty (SDRT @ 0.5%) on consideration = GBP 33,918.75
less subscription costs (2.5 million shares at 185p pershare) charged to client
= GBP (4,625,000.00)
Resultant loss for your account = GBP 2,209,628.13
Do you inform your clients that a mistake has been made (even though they will not beany worse off financially)? Certainly, the Front Office will have to be advised, as it willbe required to execute the transaction in the market. As for the actual clients, the ethicalchoice would be to admit the mistake and confirm that the client had not lost financiallyas a consequence of the mistake.
11.5.10 Other Examples of Event Types
We have covered several of the more usual types of corporate action event. There are, ofcourse, many others and their definitions can be found in Appendix 11.1 at the end of thischapter. There can be confusion with some events that impact on the share capital, the parvalue of shares and the total number of shares in issue. Table 11.27 highlights some of thesedifferences.
TABLE 11.27 Other corporate actions
EventCapital
Increase/DecreasePar Valueof Shares
Number ofIssued Shares
Capital increase Up Up N/A
Reduction of issued shares Down N/A Down
Reduction of face value Down Down N/A
Subdivision (split) N/A Down Up
Consolidation (reverse split) N/A Up Down
Finally, let’s look at the ways in which ratios of new shares to existing shares can differ fromone market to another. The classic example is comparing the USA with most other markets.For example, when we looked at the RBS group bonus issue (above), we saw that the ratio was
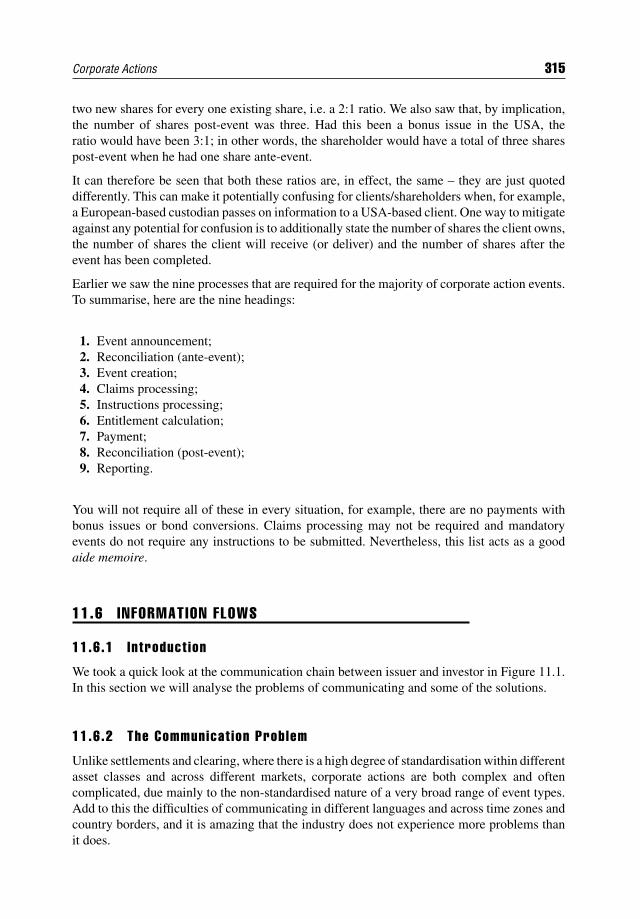
Corporate Actions 315
two new shares for every one existing share, i.e. a 2:1 ratio. We also saw that, by implication,the number of shares post-event was three. Had this been a bonus issue in the USA, theratio would have been 3:1; in other words, the shareholder would have a total of three sharespost-event when he had one share ante-event.
It can therefore be seen that both these ratios are, in effect, the same – they are just quoteddifferently. This can make it potentially confusing for clients/shareholders when, for example,a European-based custodian passes on information to a USA-based client. One way to mitigateagainst any potential for confusion is to additionally state the number of shares the client owns,the number of shares the client will receive (or deliver) and the number of shares after theevent has been completed.
Earlier we saw the nine processes that are required for the majority of corporate action events.To summarise, here are the nine headings:
1. Event announcement;2. Reconciliation (ante-event);3. Event creation;4. Claims processing;5. Instructions processing;6. Entitlement calculation;7. Payment;8. Reconciliation (post-event);9. Reporting.
You will not require all of these in every situation, for example, there are no payments withbonus issues or bond conversions. Claims processing may not be required and mandatoryevents do not require any instructions to be submitted. Nevertheless, this list acts as a goodaide memoire.
11.6 INFORMATION FLOWS
11.6.1 Introduct ion
We took a quick look at the communication chain between issuer and investor in Figure 11.1.In this section we will analyse the problems of communicating and some of the solutions.
11.6.2 The Communicat ion Problem
Unlike settlements and clearing, where there is a high degree of standardisation within differentasset classes and across different markets, corporate actions are both complex and oftencomplicated, due mainly to the non-standardised nature of a very broad range of event types.Add to this the difficulties of communicating in different languages and across time zones andcountry borders, and it is amazing that the industry does not experience more problems thanit does.
316 FINANCIAL MARKETS OPERATIONS MANAGEMENT
The problem of complexity is not something that the industry has a great deal of influenceover, as it is the issuer’s choice as to what it wants to do and how it wishes to tailor the eventsin order to suit its own particular situation.
We have seen that unless there is a direct communication link between issuer and investor, therehas to be a group of intermediaries between them. We will now examine the approaches takenin communicating information from issuer to investor and from investor back to the issuer.The following Figures will help you to understand the different approaches that we need toconsider depending on what types of organisation are contained in the communication chain.
Q&A
Quest ion
What do you think the communication links are between each of the main types ofintermediary where there is a global custodian involved?
Answer
Some of the communication risks together with their causes and mitigations are shownin Table 11.28.
TABLE 11.28 Communication risks
Risk Type Causes and MitigationData/information capture risk Data standards, timeliness and accuracy
of the information.
Replacement risk Financial costs associated with makingmistakes.
Decision-making/election risk Either making the wrong decision orfailing to make any decision on time
Reputational risk Making mistakes can harm anorganisation’s reputation in the market.
Reconciliation risk Poor reconciliation can lead to missedopportunities to participate in a corporateaction event.
There are more detailed explanations in the chapter.
11.6.3 Global Communicat ion Chain
The various items of information transmitted from issuer to investor are highlighted in blue inFigure 11.4 and the corresponding decisions in the opposite direction are highlighted in red.
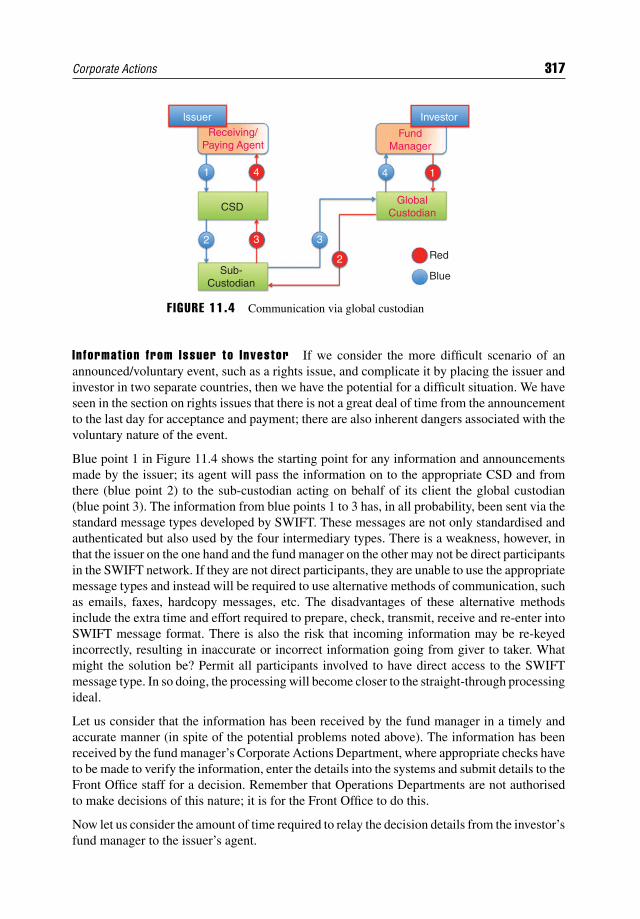
Corporate Actions 317
lssuer
CSD
Sub-Custodian
GlobalCustodian
FundManager
Investor
1 4
2 3 3
2 Red
Blue
4 1
Receiving/Paying Agent
F IGURE 11.4 Communication via global custodian
In format ion from Issuer to Investor If we consider the more difficult scenario of anannounced/voluntary event, such as a rights issue, and complicate it by placing the issuer andinvestor in two separate countries, then we have the potential for a difficult situation. We haveseen in the section on rights issues that there is not a great deal of time from the announcementto the last day for acceptance and payment; there are also inherent dangers associated with thevoluntary nature of the event.
Blue point 1 in Figure 11.4 shows the starting point for any information and announcementsmade by the issuer; its agent will pass the information on to the appropriate CSD and fromthere (blue point 2) to the sub-custodian acting on behalf of its client the global custodian(blue point 3). The information from blue points 1 to 3 has, in all probability, been sent via thestandard message types developed by SWIFT. These messages are not only standardised andauthenticated but also used by the four intermediary types. There is a weakness, however, inthat the issuer on the one hand and the fund manager on the other may not be direct participantsin the SWIFT network. If they are not direct participants, they are unable to use the appropriatemessage types and instead will be required to use alternative methods of communication, suchas emails, faxes, hardcopy messages, etc. The disadvantages of these alternative methodsinclude the extra time and effort required to prepare, check, transmit, receive and re-enter intoSWIFT message format. There is also the risk that incoming information may be re-keyedincorrectly, resulting in inaccurate or incorrect information going from giver to taker. Whatmight the solution be? Permit all participants involved to have direct access to the SWIFTmessage type. In so doing, the processing will become closer to the straight-through processingideal.
Let us consider that the information has been received by the fund manager in a timely andaccurate manner (in spite of the potential problems noted above). The information has beenreceived by the fund manager’s Corporate Actions Department, where appropriate checks haveto be made to verify the information, enter the details into the systems and submit details to theFront Office staff for a decision. Remember that Operations Departments are not authorisedto make decisions of this nature; it is for the Front Office to do this.
Now let us consider the amount of time required to relay the decision details from the investor’sfund manager to the issuer’s agent.
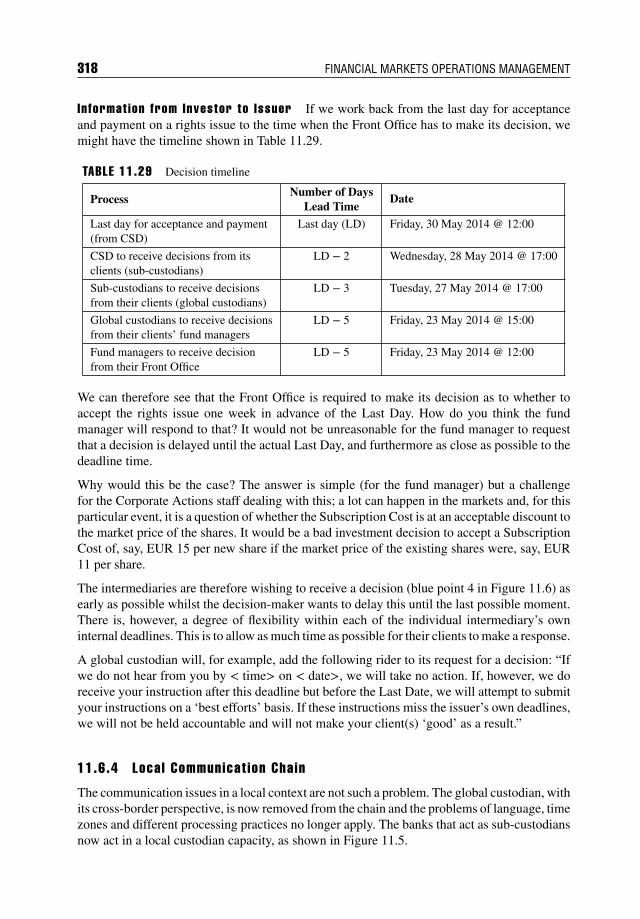
318 FINANCIAL MARKETS OPERATIONS MANAGEMENT
In format ion from Investor to Issuer If we work back from the last day for acceptanceand payment on a rights issue to the time when the Front Office has to make its decision, wemight have the timeline shown in Table 11.29.
TABLE 11.29 Decision timeline
ProcessNumber of Days
Lead TimeDate
Last day for acceptance and payment(from CSD)
Last day (LD) Friday, 30 May 2014 @ 12:00
CSD to receive decisions from itsclients (sub-custodians)
LD − 2 Wednesday, 28 May 2014 @ 17:00
Sub-custodians to receive decisionsfrom their clients (global custodians)
LD − 3 Tuesday, 27 May 2014 @ 17:00
Global custodians to receive decisionsfrom their clients’ fund managers
LD − 5 Friday, 23 May 2014 @ 15:00
Fund managers to receive decisionfrom their Front Office
LD − 5 Friday, 23 May 2014 @ 12:00
We can therefore see that the Front Office is required to make its decision as to whether toaccept the rights issue one week in advance of the Last Day. How do you think the fundmanager will respond to that? It would not be unreasonable for the fund manager to requestthat a decision is delayed until the actual Last Day, and furthermore as close as possible to thedeadline time.
Why would this be the case? The answer is simple (for the fund manager) but a challengefor the Corporate Actions staff dealing with this; a lot can happen in the markets and, for thisparticular event, it is a question of whether the Subscription Cost is at an acceptable discount tothe market price of the shares. It would be a bad investment decision to accept a SubscriptionCost of, say, EUR 15 per new share if the market price of the existing shares were, say, EUR11 per share.
The intermediaries are therefore wishing to receive a decision (blue point 4 in Figure 11.6) asearly as possible whilst the decision-maker wants to delay this until the last possible moment.There is, however, a degree of flexibility within each of the individual intermediary’s owninternal deadlines. This is to allow as much time as possible for their clients to make a response.
A global custodian will, for example, add the following rider to its request for a decision: “Ifwe do not hear from you by < time> on < date>, we will take no action. If, however, we doreceive your instruction after this deadline but before the Last Date, we will attempt to submityour instructions on a ‘best efforts’ basis. If these instructions miss the issuer’s own deadlines,we will not be held accountable and will not make your client(s) ‘good’ as a result.”
11.6.4 Local Communicat ion Chain
The communication issues in a local context are not such a problem. The global custodian, withits cross-border perspective, is now removed from the chain and the problems of language, timezones and different processing practices no longer apply. The banks that act as sub-custodiansnow act in a local custodian capacity, as shown in Figure 11.5.
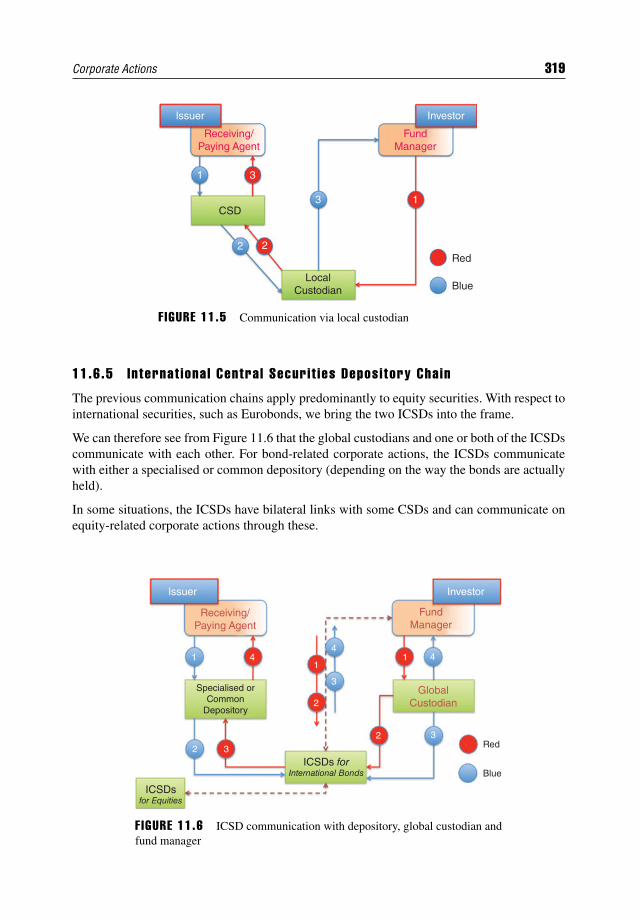
Corporate Actions 319
LocalCustodian
Red
Blue
CSD
lssuer
Receiving/Paying Agent
Investor
FundManager
1 3
2 2
3 1
F IGURE 11.5 Communication via local custodian
11.6.5 Internat ional Central Securit ies Depository Chain
The previous communication chains apply predominantly to equity securities. With respect tointernational securities, such as Eurobonds, we bring the two ICSDs into the frame.
We can therefore see from Figure 11.6 that the global custodians and one or both of the ICSDscommunicate with each other. For bond-related corporate actions, the ICSDs communicatewith either a specialised or common depository (depending on the way the bonds are actuallyheld).
In some situations, the ICSDs have bilateral links with some CSDs and can communicate onequity-related corporate actions through these.
lssuer Investor
FundManager
GlobalCustodian
ICSDs forInternational Bonds
ICSDsfor Equities
Receiving/Paying Agent
1 4
3
2
2Red
Blue
11
44
3
3
2
Specialised orCommon
Depository
F IGURE 11.6 ICSD communication with depository, global custodian andfund manager
320 FINANCIAL MARKETS OPERATIONS MANAGEMENT
11.6.6 Summary
We have seen that it is rarely practical for issuer and investor to communicate directly witheach other. The use of intermediaries is therefore required and, depending on the types ofintermediary, there are going to be communication difficulties.
The longer the communication chain, the more time is required to make sure that the investoris informed of any corporate action details as quickly and as accurately as possible. The sameis required once the investor has made a decision on an optional event, so that the investor canbenefit from any choices that are available.
Having a standardised communication system, such as the message types provided by SWIFT,certainly eases many of the communication difficulties, as does the inclusion of investors andissuers on the SWIFT network.
11.7 CORPORATE ACTION RISKS
11.7.1 Introduct ion
A few years ago, Exchange Data International posted the following quotation on its website:
“In most Financial Institutions the current process for handling corporate actions ispredominantly paper-based, difficult to manage, open to discrepancy, both time andlabour intensive and does not form part of the Client Management process.”
This quotation is no longer on the website, but the challenges noted do still exist, even in anera where much of the operation processing is reasonably standardised and automated.
We will consider the risks brought about by a “… predominantly paper-based, difficult tomanage, open to discrepancy, both time and labour intensive…” array of processes.
The main sources of risk within corporate actions can be summarised as follows:
Data/information risk; Replacement risk; Decision-making/election risk; Reputational risk; Reconciliation risk.
Q&A
Quest ion
From what you have learnt about corporate actions, what might cause some of the aboverisks and how might you mitigate against their impact?
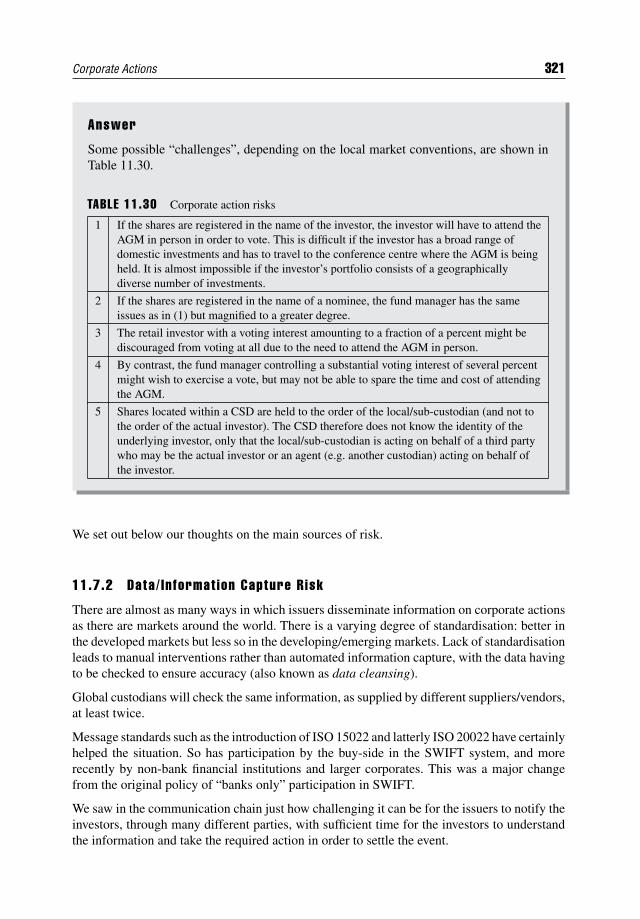
Corporate Actions 321
Answer
Some possible “challenges”, depending on the local market conventions, are shown inTable 11.30.
TABLE 11.30 Corporate action risks
1 If the shares are registered in the name of the investor, the investor will have to attend theAGM in person in order to vote. This is difficult if the investor has a broad range ofdomestic investments and has to travel to the conference centre where the AGM is beingheld. It is almost impossible if the investor’s portfolio consists of a geographicallydiverse number of investments.
2 If the shares are registered in the name of a nominee, the fund manager has the sameissues as in (1) but magnified to a greater degree.
3 The retail investor with a voting interest amounting to a fraction of a percent might bediscouraged from voting at all due to the need to attend the AGM in person.
4 By contrast, the fund manager controlling a substantial voting interest of several percentmight wish to exercise a vote, but may not be able to spare the time and cost of attendingthe AGM.
5 Shares located within a CSD are held to the order of the local/sub-custodian (and not tothe order of the actual investor). The CSD therefore does not know the identity of theunderlying investor, only that the local/sub-custodian is acting on behalf of a third partywho may be the actual investor or an agent (e.g. another custodian) acting on behalf ofthe investor.
We set out below our thoughts on the main sources of risk.
11.7.2 Data/ Informat ion Capture Risk
There are almost as many ways in which issuers disseminate information on corporate actionsas there are markets around the world. There is a varying degree of standardisation: better inthe developed markets but less so in the developing/emerging markets. Lack of standardisationleads to manual interventions rather than automated information capture, with the data havingto be checked to ensure accuracy (also known as data cleansing).
Global custodians will check the same information, as supplied by different suppliers/vendors,at least twice.
Message standards such as the introduction of ISO 15022 and latterly ISO 20022 have certainlyhelped the situation. So has participation by the buy-side in the SWIFT system, and morerecently by non-bank financial institutions and larger corporates. This was a major changefrom the original policy of “banks only” participation in SWIFT.
We saw in the communication chain just how challenging it can be for the issuers to notify theinvestors, through many different parties, with sufficient time for the investors to understandthe information and take the required action in order to settle the event.
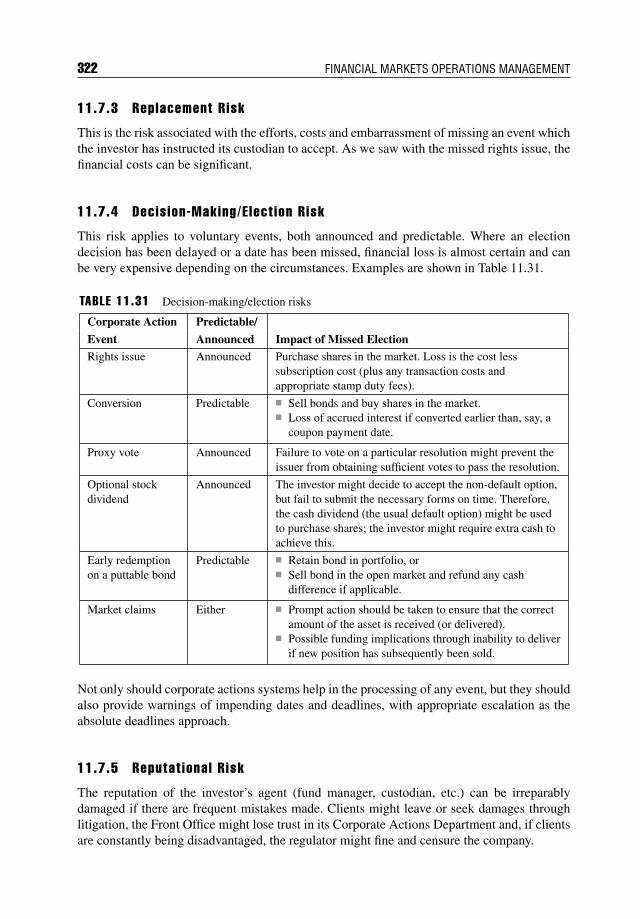
322 FINANCIAL MARKETS OPERATIONS MANAGEMENT
11.7.3 Replacement Risk
This is the risk associated with the efforts, costs and embarrassment of missing an event whichthe investor has instructed its custodian to accept. As we saw with the missed rights issue, thefinancial costs can be significant.
11.7.4 Decis ion-Making/E lect ion Risk
This risk applies to voluntary events, both announced and predictable. Where an electiondecision has been delayed or a date has been missed, financial loss is almost certain and canbe very expensive depending on the circumstances. Examples are shown in Table 11.31.
TABLE 11.31 Decision-making/election risks
Corporate Action Predictable/
Event Announced Impact of Missed ElectionRights issue Announced Purchase shares in the market. Loss is the cost less
subscription cost (plus any transaction costs andappropriate stamp duty fees).
Conversion Predictable Sell bonds and buy shares in the market. Loss of accrued interest if converted earlier than, say, a
coupon payment date.
Proxy vote Announced Failure to vote on a particular resolution might prevent theissuer from obtaining sufficient votes to pass the resolution.
Optional stockdividend
Announced The investor might decide to accept the non-default option,but fail to submit the necessary forms on time. Therefore,the cash dividend (the usual default option) might be usedto purchase shares; the investor might require extra cash toachieve this.
Early redemptionon a puttable bond
Predictable Retain bond in portfolio, or Sell bond in the open market and refund any cash
difference if applicable.
Market claims Either Prompt action should be taken to ensure that the correctamount of the asset is received (or delivered).
Possible funding implications through inability to deliverif new position has subsequently been sold.
Not only should corporate actions systems help in the processing of any event, but they shouldalso provide warnings of impending dates and deadlines, with appropriate escalation as theabsolute deadlines approach.
11.7.5 Reputat ional R isk
The reputation of the investor’s agent (fund manager, custodian, etc.) can be irreparablydamaged if there are frequent mistakes made. Clients might leave or seek damages throughlitigation, the Front Office might lose trust in its Corporate Actions Department and, if clientsare constantly being disadvantaged, the regulator might fine and censure the company.
Corporate Actions 323
11.7.6 Reconci l iat ion Risk
Positions that are subjected to a corporate action event of any type should be reconciled at thestart of the event and at the close of the event. Some events that take a considerable amount oftime (e.g. class actions and takeovers) should be reconciled on a regular basis with referenceto the Front Office or investor. This ensures that the correct amounts of shares or bonds areidentified, market claims initiated/responded to and received/delivered as required.
11.8 INDUSTRY INIT IATIVES
11.8.1 Introduct ion
In spite of the risks and complexities associated with corporate actions activities, industryinitiatives to improve corporate actions do not appear to have kept up with, say, clearing andsettlements. The move to T+2 settlement is just one example of the drive to standardise thispart of the operational function across markets.
As long ago as 1990, work by the International Securities Services Association (ISSA) iden-tified some weaknesses in this area and since then, various associations and working groupshave attempted to introduce changes to the ways in which corporate actions activities areprocessed.
Furthermore, in 1990, KPMG Peat Marwick McLintock8 made several observations on thesubject, including: “Problems (with decision-making/elections) normally arise when the cus-todian receives late notice of clients’ intentions.” and: “Failure to action instructions quicklywill, in most cases, result in financial loss, interest claims and poor client relations.”
You will see in this section which entities have been involved, what they have recommendedand what still needs to be addressed.
11.8.2 The Internat ional Securit ies Services Associat ion ( ISSA)
ISSA was founded in 1979 in response to the need for an organisation that could:“…disseminate information in the rapidly changing securities markets…”.9 In 1990, itagreed a number of recommendations during its biennial Symposium §5 (ISSA 5), includingrecommendation 5:
“Standard messages should be used and time frames should be developed for variouscorporate actions. Distinctions should be made between the corporate actions requiringtimely reaction by the client versus those which involve a simple notification and noresponse.
8KPMG Peat Marwick McLintock (1990) “Global Custody: Solutions for the ever-changing world”.Published by Euromoney Publications plc. ISBN 1 85564 042 2 (pp. 53–55).9Source: ISSA (online) “About ISSA/History”. Available from http://issanet.org/e/2/hist.html.
[Accessed Tuesday, 22 October 2013]
324 FINANCIAL MARKETS OPERATIONS MANAGEMENT
The information must be provided electronically as well as in hard copy. A central body,either public or private and accessible to domestic and international bodies must bedesignated as the official carrier of the data in each market.”
By the time ISSA 6 was held (in 1992), many of the then current practices and shortcomingshad been identified and a proposal was made for the standardisation of “Types of CorporateActions”.10 For example, in choosing between a “capitalisation issue” and a “bonus issue”,ISSA remarked that: “The designation ‘bonus issue’ is somewhat misleading, since a conver-sion of reserves into capital stock takes place, i.e. the shareholder does not receive shares as a‘bonus”’.
In addition, terms of reference for a new Working Group for Corporate Actions (and ProxyVoting) were drafted. By May 2010, the Working Group had finalised its Global CorporateActions Principles as its: “…contribution to align current industry efforts to achieve a moreefficient global corporate actions processing environment”.
The Working Group, by now under the chairmanship of Citibank’s John Kirkpatrick, publisheda Progress Update Report in September 2013. In Section 2, the report highlighted the progressmade since the previous update in 2012. In summary, three areas were described:
1. Efforts were largely unsuccessful in trying to persuade the issuer community to promotethe Principles, as it did not regard them as being its problem.
2. As a result, the Working Group decided to approach CSDs and stock exchanges and per-suade them to become the primary agencies for centralising corporate actions informationin their individual markets. The CSDs have been surveyed on this matter.
3. Significant progress has been made in the paperless automation of corporate action pro-cesses once the data have been digitised. The industry take-up of the ISO 20022 standardhas helped by enabling higher automation rates.
If corporate actions are of particular interest to you, the following files are available from theISSA website (http://issanet.org):
Global Corporate Actions Principles – Report (May 2010); Annexes to the May 2010 Report; Global Principles for Corporate Actions and Proxy Voting: Progress Update Report
(September 2013).
11.8.3 Giovannin i Group
Dr Alberto Giovannini, CEO of Unifortune SGR Spa, was asked by the European Commissionto: “…address the most basic pillar of the infrastructure that supports financial markets: the
10Source: ISSA (1992) “Report on Cross-Border Proxy Voting and Corporate Actions – Appendix 4”(pp. 21–23). Report is no longer available on the ISSA website.
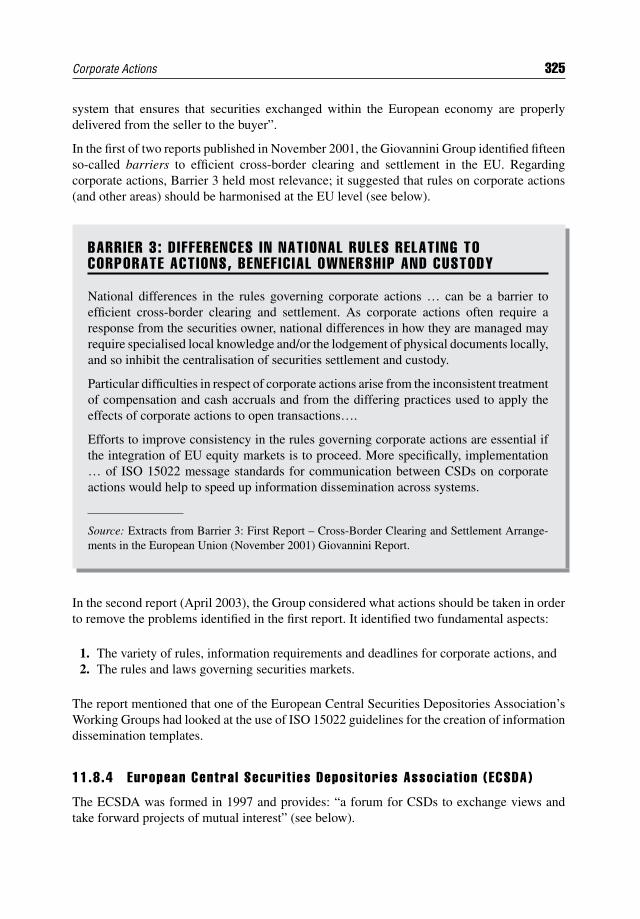
Corporate Actions 325
system that ensures that securities exchanged within the European economy are properlydelivered from the seller to the buyer”.
In the first of two reports published in November 2001, the Giovannini Group identified fifteenso-called barriers to efficient cross-border clearing and settlement in the EU. Regardingcorporate actions, Barrier 3 held most relevance; it suggested that rules on corporate actions(and other areas) should be harmonised at the EU level (see below).
BARRIER 3: D IFFERENCES IN NATIONAL RULES RELATING TOCORPORATE ACTIONS, BENEF IC IAL OWNERSHIP AND CUSTODY
National differences in the rules governing corporate actions … can be a barrier toefficient cross-border clearing and settlement. As corporate actions often require aresponse from the securities owner, national differences in how they are managed mayrequire specialised local knowledge and/or the lodgement of physical documents locally,and so inhibit the centralisation of securities settlement and custody.
Particular difficulties in respect of corporate actions arise from the inconsistent treatmentof compensation and cash accruals and from the differing practices used to apply theeffects of corporate actions to open transactions….
Efforts to improve consistency in the rules governing corporate actions are essential ifthe integration of EU equity markets is to proceed. More specifically, implementation… of ISO 15022 message standards for communication between CSDs on corporateactions would help to speed up information dissemination across systems.
Source: Extracts from Barrier 3: First Report – Cross-Border Clearing and Settlement Arrange-ments in the European Union (November 2001) Giovannini Report.
In the second report (April 2003), the Group considered what actions should be taken in orderto remove the problems identified in the first report. It identified two fundamental aspects:
1. The variety of rules, information requirements and deadlines for corporate actions, and2. The rules and laws governing securities markets.
The report mentioned that one of the European Central Securities Depositories Association’sWorking Groups had looked at the use of ISO 15022 guidelines for the creation of informationdissemination templates.
11.8.4 European Central Securit ies Depositor ies Associat ion (ECSDA)
The ECSDA was formed in 1997 and provides: “a forum for CSDs to exchange views andtake forward projects of mutual interest” (see below).

326 FINANCIAL MARKETS OPERATIONS MANAGEMENT
ECSDA represents 41 national and international central securities depositories (CSDs)across 37 European countries. The association provides a forum for European CSDsto exchange views and take forward projects of mutual interest. It aims to promote aconstructive dialogue between the CSD community, European public authorities and allother stakeholders looking to achieve an optimal regulatory framework for clearing andsettlement.
Source: ECSDA (online) “A Forum for European CSDs”. Available from www.ecsda.eu/about.html. [Accessed Wednesday, 23 October 2013]
Working as part of the so-called Broad Stakeholder Group (BSG),11 in February 2013 theECSDA published its 5th Implementation Progress Report/2012 Activity Report on the dis-mantling of Giovannini Barrier 3.12
The BSG made a commitment to: “…steer, monitor and coordinate private sector actionstowards a comprehensive and timely application of the Market Standards for Corporate ActionsProcessing…”.13
The full text of the Standards can be found on the European Banking Federation’s website.14
This is a very detailed document, but the subject matter covers the following areas:
The information flow throughout the chain of relevant parties; Key dates and their sequence; The operational processing of corporate actions.
And looks at:
Information from issuer to issuer (I)CSD; Information from the issuer (I)CSD to its participants; Information flow from (I)CSD participants to end investors; Key dates; and Processing
11The BSG consists of the European issuers, the European Central Securities Depositories Association(ECSDA), the European Banking Federation (EBF), the European Association of Cooperative Banks(EACB), the European Savings Banks Group (ESBG), the Association for Financial Markets in Europe(AFME), the Federation of European Stock Exchanges (FESE) and the European Association of ClearingHouses (EACH). Euroshareholders has an observer status.12Source: ECSDA (online) “Dismantling Giovannini Barrier 3: The Market Standards for CorporateActions Processing and General Meetings – 5th Implementation Progress Report and 2012 ActivityReport” (February 2013). Available from www.ecsda.eu/uploads/tx_doclibrary/2013_02_28_5th_BSG_Report.pdf. [Accessed Wednesday, 23 October 2013]13ibid.14Source: EBF (online) “European Industry Standards/Key Documents”. Available from www.ebf-fbe.eu/index.php?page=market_standards. [Accessed Wednesday, 23 October 2013]
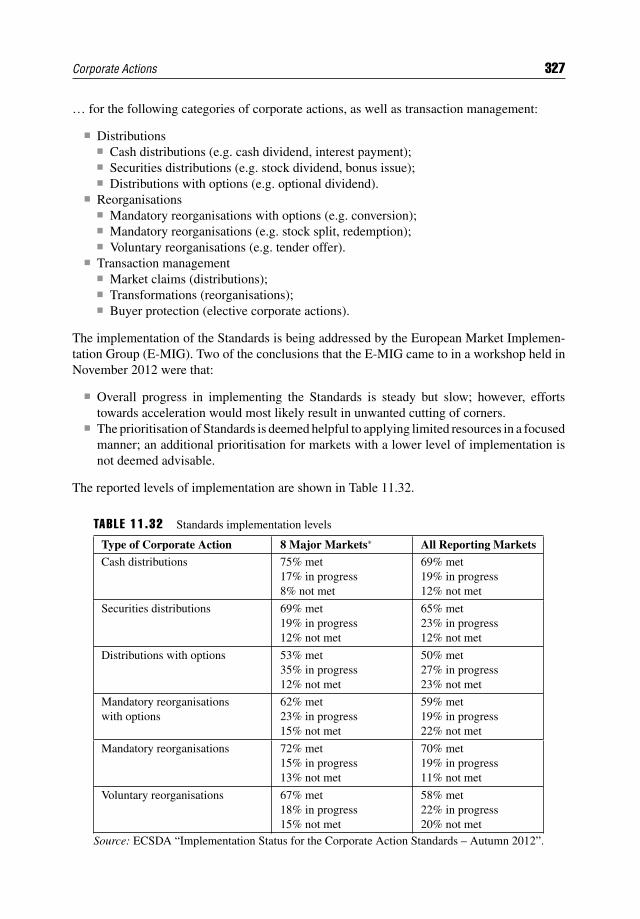
Corporate Actions 327
… for the following categories of corporate actions, as well as transaction management:
Distributions Cash distributions (e.g. cash dividend, interest payment); Securities distributions (e.g. stock dividend, bonus issue); Distributions with options (e.g. optional dividend).
Reorganisations Mandatory reorganisations with options (e.g. conversion); Mandatory reorganisations (e.g. stock split, redemption); Voluntary reorganisations (e.g. tender offer).
Transaction management Market claims (distributions); Transformations (reorganisations); Buyer protection (elective corporate actions).
The implementation of the Standards is being addressed by the European Market Implemen-tation Group (E-MIG). Two of the conclusions that the E-MIG came to in a workshop held inNovember 2012 were that:
Overall progress in implementing the Standards is steady but slow; however, effortstowards acceleration would most likely result in unwanted cutting of corners.
The prioritisation of Standards is deemed helpful to applying limited resources in a focusedmanner; an additional prioritisation for markets with a lower level of implementation isnot deemed advisable.
The reported levels of implementation are shown in Table 11.32.
TABLE 11.32 Standards implementation levels
Type of Corporate Action 8 Major Markets∗ All Reporting MarketsCash distributions 75% met
17% in progress8% not met
69% met19% in progress12% not met
Securities distributions 69% met19% in progress12% not met
65% met23% in progress12% not met
Distributions with options 53% met35% in progress12% not met
50% met27% in progress23% not met
Mandatory reorganisationswith options
62% met23% in progress15% not met
59% met19% in progress22% not met
Mandatory reorganisations 72% met15% in progress13% not met
70% met19% in progress11% not met
Voluntary reorganisations 67% met18% in progress15% not met
58% met22% in progress20% not met
Source: ECSDA “Implementation Status for the Corporate Action Standards – Autumn 2012”.
328 FINANCIAL MARKETS OPERATIONS MANAGEMENT
11.9 CORPORATE GOVERNANCE AND PROXY VOTING
11.9.1 Introduct ion
The ways in which corporate entities are governed and controlled are known collectively ascorporate governance. In particular, corporate governance refers to the ways in which corpo-rations interact with their internal stakeholders (e.g. boards of directors, senior managers andemployees) and external stakeholders (e.g. shareholders, bondholders, suppliers, customers,governmental agencies, etc.).
For the purposes of this book, we are only concerned with the relationship between thecorporation and its shareholders and bondholders.
[The European Corporate Governance Institute has some useful information on its website(www.ecgi.org) including the full texts of Corporate Governance Codes for the United Nationsand the many countries from which the membership is drawn.]
11.9.2 Relat ions with Shareholders
It is the responsibility of the corporation’s board of directors to maintain a dialogue with itsshareholders based on the mutual understanding of its objectives. This includes discussionswith major shareholders on the corporation’s governance and strategy and listening to itsshareholders’ views.
Corporations use the AGM to communicate with shareholders and to request them to vote onresolutions on issues such as:
Electing directors; Appointing auditors; Approving by-laws and by-law changes; Fundamental changes, for example:
Amending the company’s name, or Amending the articles regarding such matters as the location of the registered office,
restrictions on share transfers, restrictions on activities and changes involving suchmatters as amalgamation, dissolution and continuance;
Selling all, or substantially all, of the company’s assets.
You should be aware that shareholders are not involved in the day-to-day management of thecompany; this is the responsibility of the company’s directors and managers.
Typically, shareholders with ordinary shares/common stock receive one vote per share. Othervariations include:
Each Class B ordinary share/common stock is entitled to ten votes; Each non-voting ordinary share/common stock does not carry a vote.
These proposed changes are summarised in the information circular sent to shareholders priorto the AGM. The share register is closed at least ten days before the AGM to enable thecompany secretary to prepare a list of shareholders and the number of shares held by each.
Corporate Actions 329
However, this means that, in theory, the shareholder must attend the AGM in order to exercisehis/her vote.
Q&A
Quest ion
What are some of the operational challenges for a shareholder who wishes to vote?
Answer
Challenges include:
1. If the shares are registered in the name of the investor, the investor will have toattend the AGM in person in order to vote. This is difficult if the investor has a broadrange of domestic investments and has to travel to the conference centre where theAGM is being held. It is almost impossible if the investor’s portfolio consists of ageographically diverse number of investments.
2. If the shares are registered in the name of a nominee, the fund manager has thesame issues as in (1) but magnified to a greater degree.
3. A retail investor with a voting interest amounting to a fraction of a percent might bediscouraged from voting at all due to the requirement to attend the AGM in person.
Since the early 1990s and especially since the Cadbury Report was published in the UK during1992,15 there has been a growing move to encourage investors of all sizes (the owners of thecompany) to pay more attention to corporate governance in the companies in which they haveinvested. Consequently, there has been an increasing need to vote one way or the other on theresolutions presented at the AGM.
With the challenges noted above, there had to be alternative solutions to enable voting to takeplace. Three solutions have been introduced:
Electronic voting (i.e. there is no requirement to attend an AGM in person); A reduction in the costs involved; Allowing a third party to vote on behalf of the investor (i.e. proxy voting).
11.9.3 Proxy Vot ing
So, proxy voting occurs when a shareholder appoints a third party to vote on his/her behalf,usually in the absence of the shareholder. Depending on the local conventions, the investor
15The Committee on the Financial Aspects of Corporate Governance, chaired by Adrian Cadbury, andGee & Co Ltd (1 December 1992) “Financial Aspects of Corporate Governance”. Available fromwww.ecgi.org/codes/documents/cadbury.pdf.
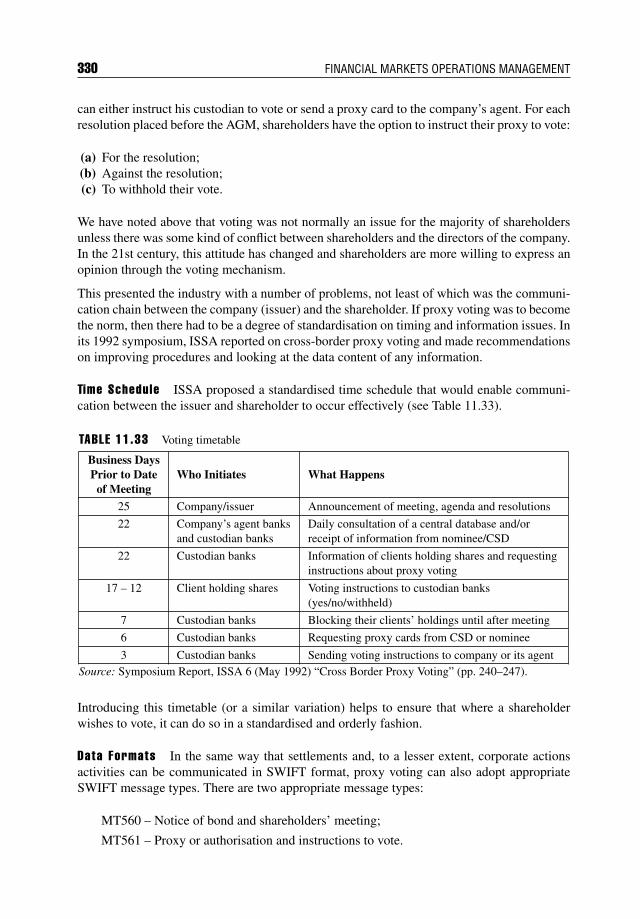
330 FINANCIAL MARKETS OPERATIONS MANAGEMENT
can either instruct his custodian to vote or send a proxy card to the company’s agent. For eachresolution placed before the AGM, shareholders have the option to instruct their proxy to vote:
(a) For the resolution;(b) Against the resolution;(c) To withhold their vote.
We have noted above that voting was not normally an issue for the majority of shareholdersunless there was some kind of conflict between shareholders and the directors of the company.In the 21st century, this attitude has changed and shareholders are more willing to express anopinion through the voting mechanism.
This presented the industry with a number of problems, not least of which was the communi-cation chain between the company (issuer) and the shareholder. If proxy voting was to becomethe norm, then there had to be a degree of standardisation on timing and information issues. Inits 1992 symposium, ISSA reported on cross-border proxy voting and made recommendationson improving procedures and looking at the data content of any information.
Time Schedule ISSA proposed a standardised time schedule that would enable communi-cation between the issuer and shareholder to occur effectively (see Table 11.33).
TABLE 11.33 Voting timetable
Business DaysPrior to Date
of MeetingWho Initiates What Happens
25 Company/issuer Announcement of meeting, agenda and resolutions
22 Company’s agent banksand custodian banks
Daily consultation of a central database and/orreceipt of information from nominee/CSD
22 Custodian banks Information of clients holding shares and requestinginstructions about proxy voting
17 – 12 Client holding shares Voting instructions to custodian banks(yes/no/withheld)
7 Custodian banks Blocking their clients’ holdings until after meeting
6 Custodian banks Requesting proxy cards from CSD or nominee
3 Custodian banks Sending voting instructions to company or its agentSource: Symposium Report, ISSA 6 (May 1992) “Cross Border Proxy Voting” (pp. 240–247).
Introducing this timetable (or a similar variation) helps to ensure that where a shareholderwishes to vote, it can do so in a standardised and orderly fashion.
Data Formats In the same way that settlements and, to a lesser extent, corporate actionsactivities can be communicated in SWIFT format, proxy voting can also adopt appropriateSWIFT message types. There are two appropriate message types:
MT560 – Notice of bond and shareholders’ meeting;
MT561 – Proxy or authorisation and instructions to vote.
Corporate Actions 331
Proxy voting basically contains three groups of information (A–C) and flows in three steps(1–3):
Group A: Basic information that includes the company’s name and location, time andplace of meeting, identification of securities and items on the agenda.
Group B: Account reference that includes the quantity of securities involved, the accountholder’s reference and any information from custodian to beneficial owner.
Group C: Voting instructions.
The above information is communicated in the following steps:
1. The company invites all interested parties to the meeting (containing Group Ainformation).
2. Custodians (local/sub/global) inform the beneficial owners (Groups A and B information).3. Beneficial owners wishing to use a proxy to vote must authorise a third party to act as
proxy (Groups A, B and C information). (Otherwise, the beneficial owner deals directwith the company.)
11.9.4 Relat ions with Preference Shareholders
Preference shares (preferred stock) are a class of shares that contain one or more features thatordinary shares (common stock) do not. These features can include:
Dividends: Most preference shares have a fixed dividend amount; either quoted as apercentage or as an amount per share. The company must pay the preference shareholdersbefore the ordinary shareholders.
Liquidation: Preference shareholders rank senior to the ordinary shareholders but juniorto the remaining creditors.
Convertibility: The investor has the right to exchange preference shares for ordinaryshares if the preference shares have a conversion feature.
Voting rights: Normally, preference shareholders do not have the right to vote. Undercertain circumstances, however, shareholders may gain the right to vote should dividendsnot be paid.
11.9.5 Relat ions with Bondholders
Bondholders are creditors of the company and do not have the right to vote. By contrast,shareholders legally own a share in the issuing company. In the normal course of events, thecompany has a fiduciary obligation to its shareholders but not to its bondholders.
11.9.6 Company in Bankruptcy or Admin istrat ion
These relationships can change in the event that the company gets into financial trouble prior togoing into administration or filing for bankruptcy. In this case, a committee is appointed to lookafter the bondholders’ interests. Should a company become bankrupt or go into administration,then the company’s creditors are repaid, subject to sufficient assets being liquidated. In the
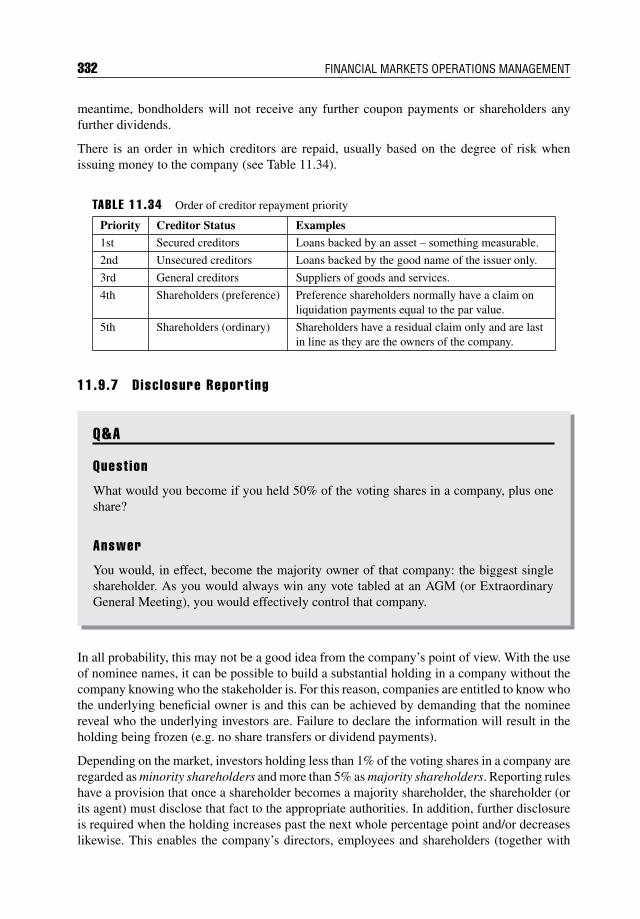
332 FINANCIAL MARKETS OPERATIONS MANAGEMENT
meantime, bondholders will not receive any further coupon payments or shareholders anyfurther dividends.
There is an order in which creditors are repaid, usually based on the degree of risk whenissuing money to the company (see Table 11.34).
TABLE 11.34 Order of creditor repayment priority
Priority Creditor Status Examples
1st Secured creditors Loans backed by an asset – something measurable.
2nd Unsecured creditors Loans backed by the good name of the issuer only.
3rd General creditors Suppliers of goods and services.
4th Shareholders (preference) Preference shareholders normally have a claim onliquidation payments equal to the par value.
5th Shareholders (ordinary) Shareholders have a residual claim only and are lastin line as they are the owners of the company.
11.9.7 Disc losure Report ing
Q&A
Quest ion
What would you become if you held 50% of the voting shares in a company, plus oneshare?
Answer
You would, in effect, become the majority owner of that company: the biggest singleshareholder. As you would always win any vote tabled at an AGM (or ExtraordinaryGeneral Meeting), you would effectively control that company.
In all probability, this may not be a good idea from the company’s point of view. With the useof nominee names, it can be possible to build a substantial holding in a company without thecompany knowing who the stakeholder is. For this reason, companies are entitled to know whothe underlying beneficial owner is and this can be achieved by demanding that the nomineereveal who the underlying investors are. Failure to declare the information will result in theholding being frozen (e.g. no share transfers or dividend payments).
Depending on the market, investors holding less than 1% of the voting shares in a company areregarded as minority shareholders and more than 5% as majority shareholders. Reporting ruleshave a provision that once a shareholder becomes a majority shareholder, the shareholder (orits agent) must disclose that fact to the appropriate authorities. In addition, further disclosureis required when the holding increases past the next whole percentage point and/or decreaseslikewise. This enables the company’s directors, employees and shareholders (together with
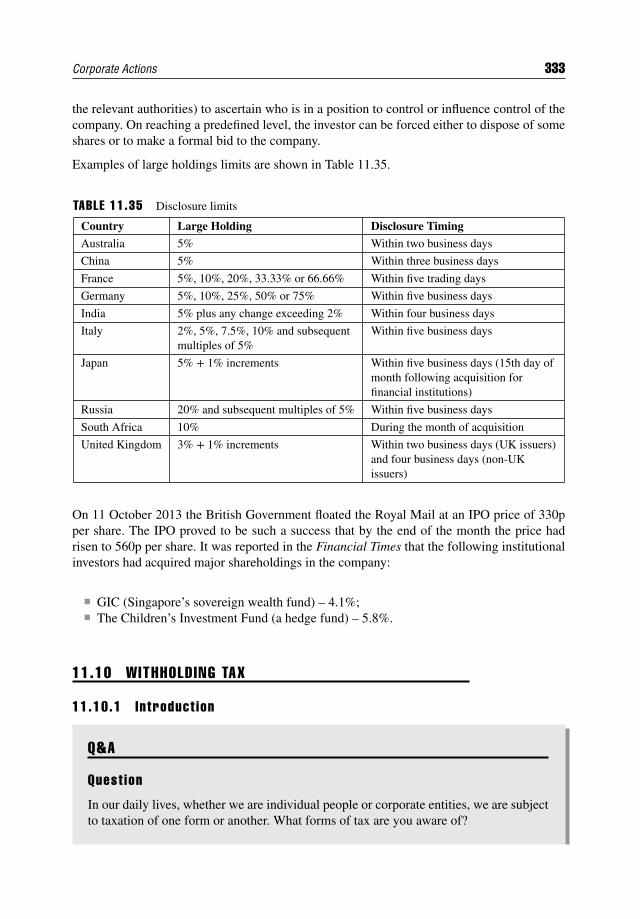
Corporate Actions 333
the relevant authorities) to ascertain who is in a position to control or influence control of thecompany. On reaching a predefined level, the investor can be forced either to dispose of someshares or to make a formal bid to the company.
Examples of large holdings limits are shown in Table 11.35.
TABLE 11.35 Disclosure limits
Country Large Holding Disclosure Timing
Australia 5% Within two business days
China 5% Within three business days
France 5%, 10%, 20%, 33.33% or 66.66% Within five trading days
Germany 5%, 10%, 25%, 50% or 75% Within five business days
India 5% plus any change exceeding 2% Within four business days
Italy 2%, 5%, 7.5%, 10% and subsequentmultiples of 5%
Within five business days
Japan 5% + 1% increments Within five business days (15th day ofmonth following acquisition forfinancial institutions)
Russia 20% and subsequent multiples of 5% Within five business days
South Africa 10% During the month of acquisition
United Kingdom 3% + 1% increments Within two business days (UK issuers)and four business days (non-UKissuers)
On 11 October 2013 the British Government floated the Royal Mail at an IPO price of 330pper share. The IPO proved to be such a success that by the end of the month the price hadrisen to 560p per share. It was reported in the Financial Times that the following institutionalinvestors had acquired major shareholdings in the company:
GIC (Singapore’s sovereign wealth fund) – 4.1%; The Children’s Investment Fund (a hedge fund) – 5.8%.
11.10 WITHHOLDING TAX
11.10.1 Introduct ion
Q&A
Quest ion
In our daily lives, whether we are individual people or corporate entities, we are subjectto taxation of one form or another. What forms of tax are you aware of?
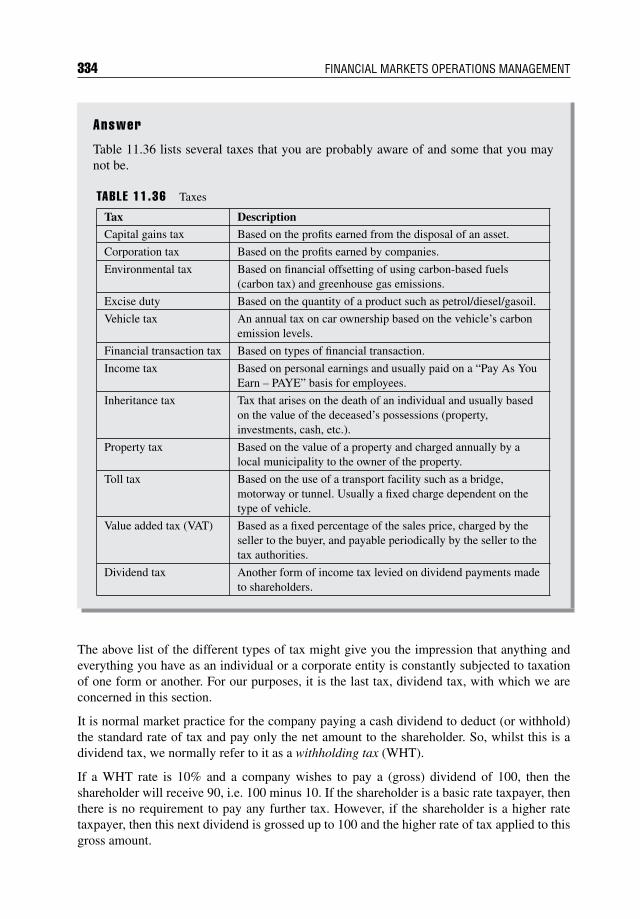
334 FINANCIAL MARKETS OPERATIONS MANAGEMENT
Answer
Table 11.36 lists several taxes that you are probably aware of and some that you maynot be.
TABLE 11.36 Taxes
Tax Description
Capital gains tax Based on the profits earned from the disposal of an asset.
Corporation tax Based on the profits earned by companies.
Environmental tax Based on financial offsetting of using carbon-based fuels(carbon tax) and greenhouse gas emissions.
Excise duty Based on the quantity of a product such as petrol/diesel/gasoil.
Vehicle tax An annual tax on car ownership based on the vehicle’s carbonemission levels.
Financial transaction tax Based on types of financial transaction.
Income tax Based on personal earnings and usually paid on a “Pay As YouEarn – PAYE” basis for employees.
Inheritance tax Tax that arises on the death of an individual and usually basedon the value of the deceased’s possessions (property,investments, cash, etc.).
Property tax Based on the value of a property and charged annually by alocal municipality to the owner of the property.
Toll tax Based on the use of a transport facility such as a bridge,motorway or tunnel. Usually a fixed charge dependent on thetype of vehicle.
Value added tax (VAT) Based as a fixed percentage of the sales price, charged by theseller to the buyer, and payable periodically by the seller to thetax authorities.
Dividend tax Another form of income tax levied on dividend payments madeto shareholders.
The above list of the different types of tax might give you the impression that anything andeverything you have as an individual or a corporate entity is constantly subjected to taxationof one form or another. For our purposes, it is the last tax, dividend tax, with which we areconcerned in this section.
It is normal market practice for the company paying a cash dividend to deduct (or withhold)the standard rate of tax and pay only the net amount to the shareholder. So, whilst this is adividend tax, we normally refer to it as a withholding tax (WHT).
If a WHT rate is 10% and a company wishes to pay a (gross) dividend of 100, then theshareholder will receive 90, i.e. 100 minus 10. If the shareholder is a basic rate taxpayer, thenthere is no requirement to pay any further tax. However, if the shareholder is a higher ratetaxpayer, then this next dividend is grossed up to 100 and the higher rate of tax applied to thisgross amount.
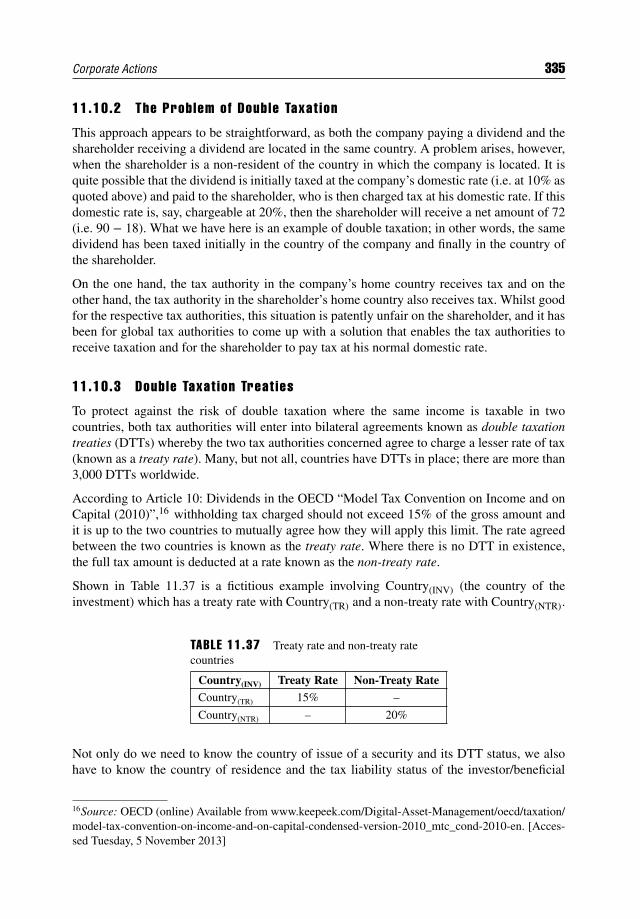
Corporate Actions 335
11.10.2 The Problem of Double Taxat ion
This approach appears to be straightforward, as both the company paying a dividend and theshareholder receiving a dividend are located in the same country. A problem arises, however,when the shareholder is a non-resident of the country in which the company is located. It isquite possible that the dividend is initially taxed at the company’s domestic rate (i.e. at 10% asquoted above) and paid to the shareholder, who is then charged tax at his domestic rate. If thisdomestic rate is, say, chargeable at 20%, then the shareholder will receive a net amount of 72(i.e. 90 − 18). What we have here is an example of double taxation; in other words, the samedividend has been taxed initially in the country of the company and finally in the country ofthe shareholder.
On the one hand, the tax authority in the company’s home country receives tax and on theother hand, the tax authority in the shareholder’s home country also receives tax. Whilst goodfor the respective tax authorities, this situation is patently unfair on the shareholder, and it hasbeen for global tax authorities to come up with a solution that enables the tax authorities toreceive taxation and for the shareholder to pay tax at his normal domestic rate.
11.10.3 Double Taxat ion Treat ies
To protect against the risk of double taxation where the same income is taxable in twocountries, both tax authorities will enter into bilateral agreements known as double taxationtreaties (DTTs) whereby the two tax authorities concerned agree to charge a lesser rate of tax(known as a treaty rate). Many, but not all, countries have DTTs in place; there are more than3,000 DTTs worldwide.
According to Article 10: Dividends in the OECD “Model Tax Convention on Income and onCapital (2010)”,16 withholding tax charged should not exceed 15% of the gross amount andit is up to the two countries to mutually agree how they will apply this limit. The rate agreedbetween the two countries is known as the treaty rate. Where there is no DTT in existence,the full tax amount is deducted at a rate known as the non-treaty rate.
Shown in Table 11.37 is a fictitious example involving Country(INV) (the country of theinvestment) which has a treaty rate with Country(TR) and a non-treaty rate with Country(NTR).
TABLE 11.37 Treaty rate and non-treaty ratecountries
Country(INV) Treaty Rate Non-Treaty RateCountry(TR) 15% –
Country(NTR) – 20%
Not only do we need to know the country of issue of a security and its DTT status, we alsohave to know the country of residence and the tax liability status of the investor/beneficial
16Source: OECD (online) Available from www.keepeek.com/Digital-Asset-Management/oecd/taxation/model-tax-convention-on-income-and-on-capital-condensed-version-2010_mtc_cond-2010-en. [Acces-sed Tuesday, 5 November 2013]
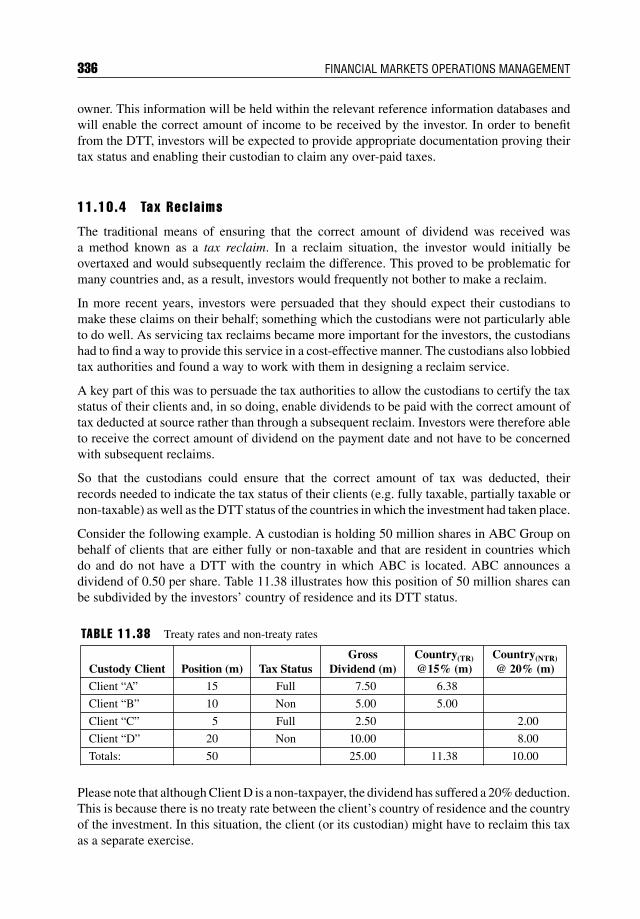
336 FINANCIAL MARKETS OPERATIONS MANAGEMENT
owner. This information will be held within the relevant reference information databases andwill enable the correct amount of income to be received by the investor. In order to benefitfrom the DTT, investors will be expected to provide appropriate documentation proving theirtax status and enabling their custodian to claim any over-paid taxes.
11.10.4 Tax Recla ims
The traditional means of ensuring that the correct amount of dividend was received wasa method known as a tax reclaim. In a reclaim situation, the investor would initially beovertaxed and would subsequently reclaim the difference. This proved to be problematic formany countries and, as a result, investors would frequently not bother to make a reclaim.
In more recent years, investors were persuaded that they should expect their custodians tomake these claims on their behalf; something which the custodians were not particularly ableto do well. As servicing tax reclaims became more important for the investors, the custodianshad to find a way to provide this service in a cost-effective manner. The custodians also lobbiedtax authorities and found a way to work with them in designing a reclaim service.
A key part of this was to persuade the tax authorities to allow the custodians to certify the taxstatus of their clients and, in so doing, enable dividends to be paid with the correct amount oftax deducted at source rather than through a subsequent reclaim. Investors were therefore ableto receive the correct amount of dividend on the payment date and not have to be concernedwith subsequent reclaims.
So that the custodians could ensure that the correct amount of tax was deducted, theirrecords needed to indicate the tax status of their clients (e.g. fully taxable, partially taxable ornon-taxable) as well as the DTT status of the countries in which the investment had taken place.
Consider the following example. A custodian is holding 50 million shares in ABC Group onbehalf of clients that are either fully or non-taxable and that are resident in countries whichdo and do not have a DTT with the country in which ABC is located. ABC announces adividend of 0.50 per share. Table 11.38 illustrates how this position of 50 million shares canbe subdivided by the investors’ country of residence and its DTT status.
TABLE 11.38 Treaty rates and non-treaty rates
Custody Client Position (m) Tax StatusGross
Dividend (m)Country(TR)
@15% (m)Country(NTR)
@ 20% (m)
Client “A” 15 Full 7.50 6.38
Client “B” 10 Non 5.00 5.00
Client “C” 5 Full 2.50 2.00
Client “D” 20 Non 10.00 8.00
Totals: 50 25.00 11.38 10.00
Please note that although Client D is a non-taxpayer, the dividend has suffered a 20% deduction.This is because there is no treaty rate between the client’s country of residence and the countryof the investment. In this situation, the client (or its custodian) might have to reclaim this taxas a separate exercise.
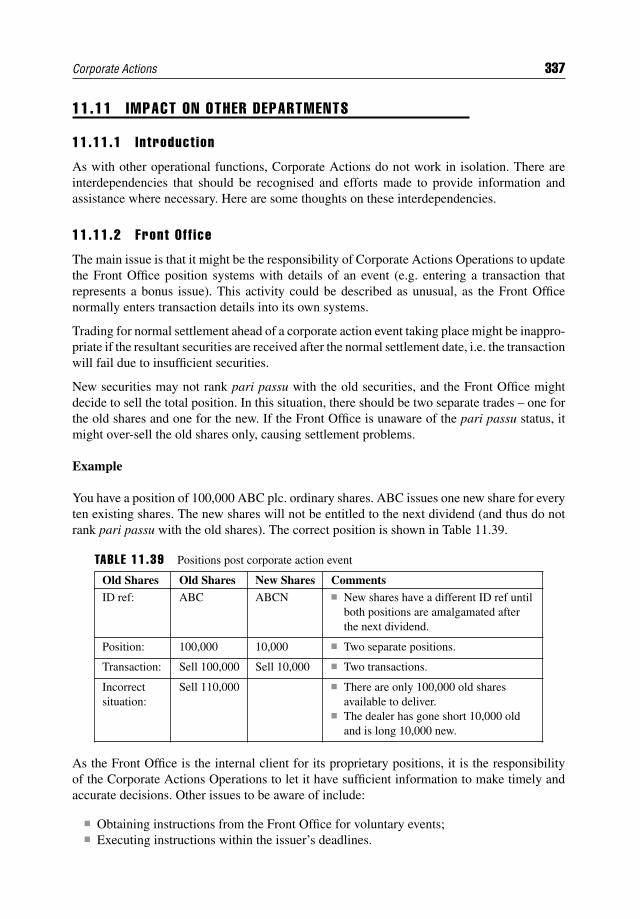
Corporate Actions 337
11.11 IMPACT ON OTHER DEPARTMENTS
11.11.1 Introduct ion
As with other operational functions, Corporate Actions do not work in isolation. There areinterdependencies that should be recognised and efforts made to provide information andassistance where necessary. Here are some thoughts on these interdependencies.
11.11.2 Front Of f ice
The main issue is that it might be the responsibility of Corporate Actions Operations to updatethe Front Office position systems with details of an event (e.g. entering a transaction thatrepresents a bonus issue). This activity could be described as unusual, as the Front Officenormally enters transaction details into its own systems.
Trading for normal settlement ahead of a corporate action event taking place might be inappro-priate if the resultant securities are received after the normal settlement date, i.e. the transactionwill fail due to insufficient securities.
New securities may not rank pari passu with the old securities, and the Front Office mightdecide to sell the total position. In this situation, there should be two separate trades – one forthe old shares and one for the new. If the Front Office is unaware of the pari passu status, itmight over-sell the old shares only, causing settlement problems.
Example
You have a position of 100,000 ABC plc. ordinary shares. ABC issues one new share for everyten existing shares. The new shares will not be entitled to the next dividend (and thus do notrank pari passu with the old shares). The correct position is shown in Table 11.39.
TABLE 11.39 Positions post corporate action event
Old Shares Old Shares New Shares CommentsID ref: ABC ABCN New shares have a different ID ref until
both positions are amalgamated afterthe next dividend.
Position: 100,000 10,000 Two separate positions.
Transaction: Sell 100,000 Sell 10,000 Two transactions.
Incorrectsituation:
Sell 110,000 There are only 100,000 old sharesavailable to deliver.
The dealer has gone short 10,000 oldand is long 10,000 new.
As the Front Office is the internal client for its proprietary positions, it is the responsibilityof the Corporate Actions Operations to let it have sufficient information to make timely andaccurate decisions. Other issues to be aware of include:
Obtaining instructions from the Front Office for voluntary events; Executing instructions within the issuer’s deadlines.
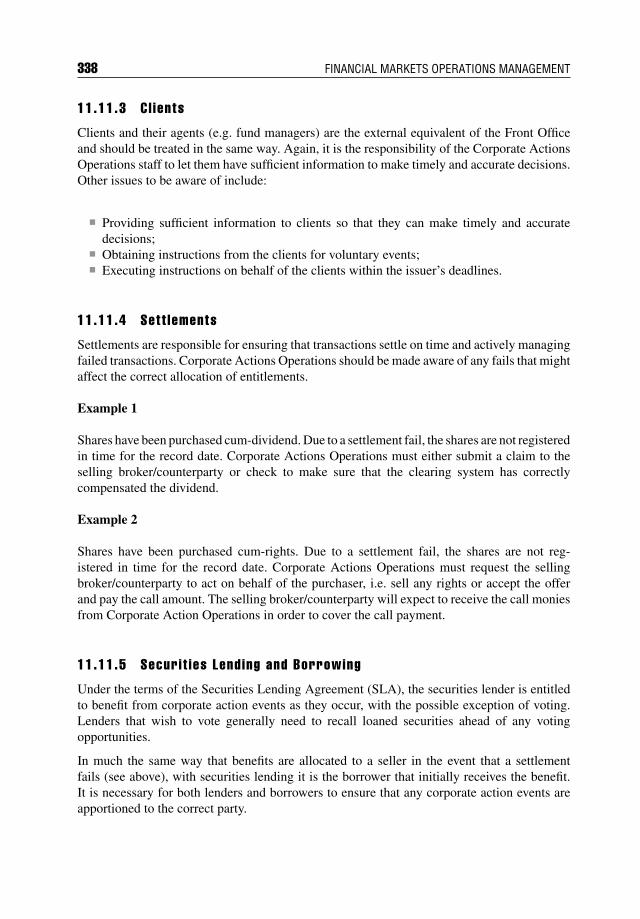
338 FINANCIAL MARKETS OPERATIONS MANAGEMENT
11.11.3 Cl ients
Clients and their agents (e.g. fund managers) are the external equivalent of the Front Officeand should be treated in the same way. Again, it is the responsibility of the Corporate ActionsOperations staff to let them have sufficient information to make timely and accurate decisions.Other issues to be aware of include:
Providing sufficient information to clients so that they can make timely and accuratedecisions;
Obtaining instructions from the clients for voluntary events; Executing instructions on behalf of the clients within the issuer’s deadlines.
11.11.4 Sett lements
Settlements are responsible for ensuring that transactions settle on time and actively managingfailed transactions. Corporate Actions Operations should be made aware of any fails that mightaffect the correct allocation of entitlements.
Example 1
Shares have been purchased cum-dividend. Due to a settlement fail, the shares are not registeredin time for the record date. Corporate Actions Operations must either submit a claim to theselling broker/counterparty or check to make sure that the clearing system has correctlycompensated the dividend.
Example 2
Shares have been purchased cum-rights. Due to a settlement fail, the shares are not reg-istered in time for the record date. Corporate Actions Operations must request the sellingbroker/counterparty to act on behalf of the purchaser, i.e. sell any rights or accept the offerand pay the call amount. The selling broker/counterparty will expect to receive the call moniesfrom Corporate Action Operations in order to cover the call payment.
11.11.5 Securit ies Lending and Borrowing
Under the terms of the Securities Lending Agreement (SLA), the securities lender is entitledto benefit from corporate action events as they occur, with the possible exception of voting.Lenders that wish to vote generally need to recall loaned securities ahead of any votingopportunities.
In much the same way that benefits are allocated to a seller in the event that a settlementfails (see above), with securities lending it is the borrower that initially receives the benefit.It is necessary for both lenders and borrowers to ensure that any corporate action events areapportioned to the correct party.
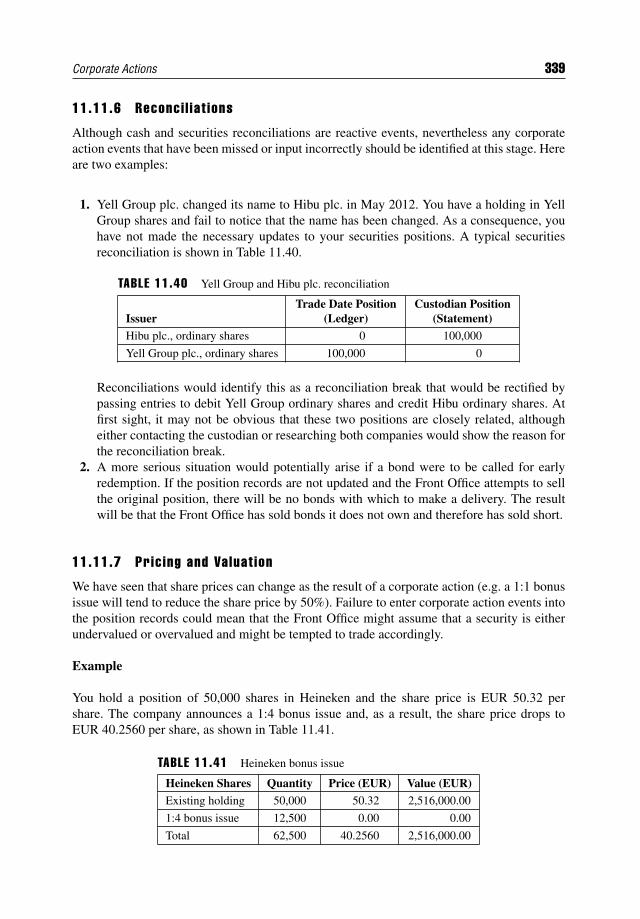
Corporate Actions 339
11.11.6 Reconci l iat ions
Although cash and securities reconciliations are reactive events, nevertheless any corporateaction events that have been missed or input incorrectly should be identified at this stage. Hereare two examples:
1. Yell Group plc. changed its name to Hibu plc. in May 2012. You have a holding in YellGroup shares and fail to notice that the name has been changed. As a consequence, youhave not made the necessary updates to your securities positions. A typical securitiesreconciliation is shown in Table 11.40.
TABLE 11.40 Yell Group and Hibu plc. reconciliation
IssuerTrade Date Position
(Ledger)Custodian Position
(Statement)
Hibu plc., ordinary shares 0 100,000
Yell Group plc., ordinary shares 100,000 0
Reconciliations would identify this as a reconciliation break that would be rectified bypassing entries to debit Yell Group ordinary shares and credit Hibu ordinary shares. Atfirst sight, it may not be obvious that these two positions are closely related, althougheither contacting the custodian or researching both companies would show the reason forthe reconciliation break.
2. A more serious situation would potentially arise if a bond were to be called for earlyredemption. If the position records are not updated and the Front Office attempts to sellthe original position, there will be no bonds with which to make a delivery. The resultwill be that the Front Office has sold bonds it does not own and therefore has sold short.
11.11.7 Pric ing and Valuat ion
We have seen that share prices can change as the result of a corporate action (e.g. a 1:1 bonusissue will tend to reduce the share price by 50%). Failure to enter corporate action events intothe position records could mean that the Front Office might assume that a security is eitherundervalued or overvalued and might be tempted to trade accordingly.
Example
You hold a position of 50,000 shares in Heineken and the share price is EUR 50.32 pershare. The company announces a 1:4 bonus issue and, as a result, the share price drops toEUR 40.2560 per share, as shown in Table 11.41.
TABLE 11.41 Heineken bonus issue
Heineken Shares Quantity Price (EUR) Value (EUR)
Existing holding 50,000 50.32 2,516,000.00
1:4 bonus issue 12,500 0.00 0.00
Total 62,500 40.2560 2,516,000.00
340 FINANCIAL MARKETS OPERATIONS MANAGEMENT
Had the bonus shares not been entered into the system, you would have shown a position ofonly 50,000 shares, priced at EUR 40.2560 per share and valued at only EUR 2,012,800.00(i.e. an apparent loss of EUR 503,200.00).
11.11.8 Reference Data
The information held in the securities database must be accurate and up to date, otherwisepotential opportunities for predictable/voluntary and certain mandatory events might well bemissed.
Example
You are holding a position of USD 5 million Swire Pacific 1.25% bonds due in April 2018.According to your database, this is a straight bond with a single redemption date; however,this is incorrect and in fact the bond has a put option. If interest rates were at a level wherebyyou or your client would wish to put the bond back to the issuer, then your database would notbe in a position to advise you of the terms of any potential early redemption (e.g. dates andprices).
11.12 SUMMARY
A corporate action is any situation or event that is initiated by the issuing company and whichhas an impact on the issuer itself and/or the issuer’s shareholders or bondholders.
Corporate actions can be either benefits (e.g. a cash dividend paid to shareholders) or “situa-tions” that impact the issuer’s balance sheet (e.g. a capitalisation issue).
Some types of corporate action are known as mandatory events. These occur without anybeneficial owner choice (e.g. a stock split). Other types are optional or voluntary, where thebeneficial owner has a choice to make (e.g. a rights issue).
There is a large number of corporate action types, ranging in complexity from reasonablystraightforward (e.g. a share consolidation) to complicated and time-consuming (e.g. a hostile,contested takeover bid).
All corporate actions are time-sensitive and care must be taken especially when handlingoptional events, as failure to execute a required action by a specified date can result insubstantial financial losses.
APPENDIX 11.1: CORPORATE ACTION EVENT TYPE CATEGORIES
Corporate actions can be grouped into nine key event-type categories with numerous sub-types:
1. Capital changes: Bonus issue, consolidation, enfranchisement, distribution, forwardstock split, par value change, recapitalisation, redenomination, renominalisation, reversestock split, rights offering, unit split, spin off, scheme of arrangement.
Corporate Actions 341
2. Dividends: Cash dividend, disbursement, dividend waived, return of capital, scrip divi-dend, stock dividend, dividend reinvestment plan.
3. Earnings: Actual earnings, forecasted earnings, adjusted earnings.4. Payments: Cash payment, interest payment, payment waived, return of debt, scrip
payment.5. Mergers: Merger, merger election, offer to buy, takeover, demerger.6. Redemptions: Call, escrow to maturity, fixed redemption, full call, partial call, partial
pre-refunded, pre-refunded, repayment, sinking fund redemption.7. Repurchases: Buy-back, consent, consent tender, conversion, exchange, exercise, odd lot
tender, partial put/retainment option, put mandatory, put optional, relinquishment option,retainment option, tender offer.
8. Shareholder meetings: Shareholder meeting, Annual General Meeting, ExtraordinaryGeneral Meeting.
9. Information announcements: Bankruptcy, default, information, liquidation, namechange, new offer, poison pill.
APPENDIX 11.2: VOLUNTARY AND MANDATORY EVENTS FOR EQUIT IESAND BONDS
Here you will find a list of voluntary and mandatory events for both equities and bonds. Thislist is an extract from the Securities Market Practice Group’s “SMPG CA Global MarketPractice – Part 2 for Standards Release 2014” released 12 February 2014.
The EIG+ tab contains the following information:
1. Corporate action event name;2. A definition plus any comments made by the SMPG;3. Short name code for the event (CAEV);4. Mandatory/voluntary/choice indicator code (CAMV);5. Other technical information.
The SMPG Corporate Actions Global Market Practice Part 1 document, together with thePart 2 spreadsheet, is updated fairly often. It is, therefore, a good idea to visit the websitefrequently.
The full list is available to guest visitors and can be obtained from http://smpg.webexone.com.
Click through to Documents>Public Documents>2. Corporate Actions>A. Final GlobalDocuments>2. CA Global Market Practice – Part 2 – SR2014 V1.1.xlsm (last updated 1 August2014).

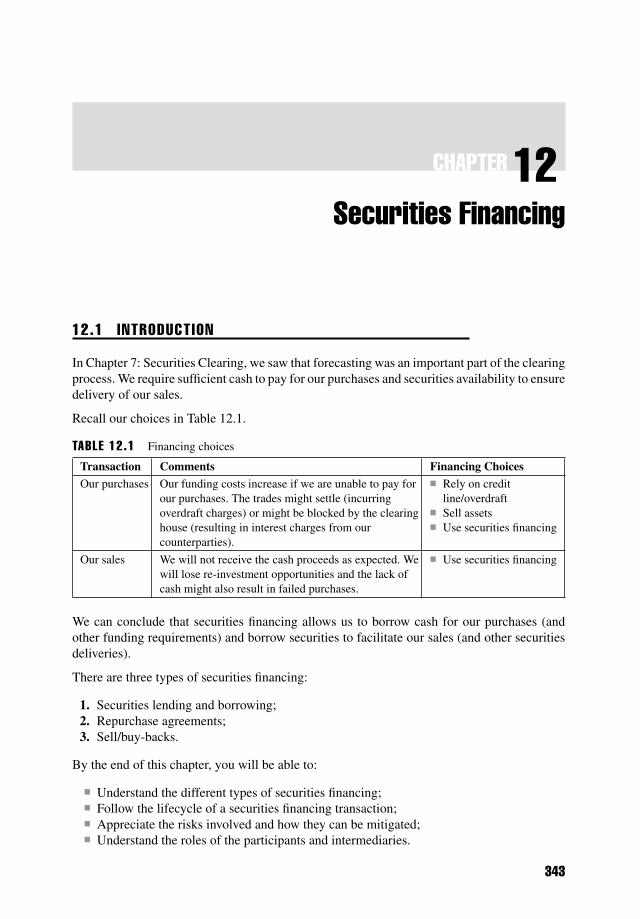
CHAPTER 12Securities Financing
12.1 INTRODUCTION
In Chapter 7: Securities Clearing, we saw that forecasting was an important part of the clearingprocess. We require sufficient cash to pay for our purchases and securities availability to ensuredelivery of our sales.
Recall our choices in Table 12.1.
TABLE 12.1 Financing choices
Transaction Comments Financing Choices
Our purchases Our funding costs increase if we are unable to pay forour purchases. The trades might settle (incurringoverdraft charges) or might be blocked by the clearinghouse (resulting in interest charges from ourcounterparties).
Rely on creditline/overdraft
Sell assets Use securities financing
Our sales We will not receive the cash proceeds as expected. Wewill lose re-investment opportunities and the lack ofcash might also result in failed purchases.
Use securities financing
We can conclude that securities financing allows us to borrow cash for our purchases (andother funding requirements) and borrow securities to facilitate our sales (and other securitiesdeliveries).
There are three types of securities financing:
1. Securities lending and borrowing;2. Repurchase agreements;3. Sell/buy-backs.
By the end of this chapter, you will be able to:
Understand the different types of securities financing; Follow the lifecycle of a securities financing transaction; Appreciate the risks involved and how they can be mitigated; Understand the roles of the participants and intermediaries.
343
344 FINANCIAL MARKETS OPERATIONS MANAGEMENT
12.2 TYPES OF SECURIT IES F INANCING
Securities financing is the temporary lending of assets to a borrower in exchange for a fee.Asset types include:
Cash Securities
Equities Bonds
We will see that cash is lent and borrowed predominantly through repurchase agreements and,to a much lesser extent, sell/buy-backs and securities through securities lending and borrowing.
12.2.1 Securit ies Lending and Borrowing
Securities lending and borrowing (“securities lending”) involves a transfer of securities (suchas shares or bonds) from a “lender” to a third party (the “borrower”), who provides the lenderwith collateral in the form of shares, bonds or cash.1
Legally, a securities loan is the transfer of title against an irrevocable undertaking to returnequivalent securities. This means that registered securities such as shares will be transferredout of the lender’s name into that of the borrower and registered back in the lender’s namewhen they are returned.
When we look at the motivations for securities lending, we will see that the borrower willsell, lend-on or otherwise dispose of the securities. In order to do this, the borrower must havelegal ownership of the securities. The lender therefore surrenders legal ownership, implying adisposal rather than a temporary loan of the securities.
A securities lending agreement will bridge the gap between the legal and economic nuancesof this business. For securities lending, the Global Master Securities Lending Agreement(GMSLA), published by the International Securities Lending Association (ISLA), is used.
12.2.2 Repurchase Agreements
A repurchase agreement (repo) is the sale of securities together with an agreement for theseller to buy back the securities at a later date. The primary purpose of a repo is to enable theseller to borrow cash using the securities as collateral.
If the above definition of a repo is stated from the seller’s point of view, what is the buyer’s?
For the buyer, there is an agreement to purchase securities together with an agreement to sellthem back to the seller. The primary purpose is to enable the buyer to lend cash, taking thesecurities as collateral. We refer to this agreement as a reverse repo.
In any particular transaction, there will be a repo (seller) and a reverse repo (buyer).
1Source: ISLA (online) “Securities Lending – A Guide for Policymakers”. Available from www.isla.co.uk/images/PDF/Publications/sl_aGuide_for_Policy_makers.pdf. [Accessed Saturday, 28 December2013]
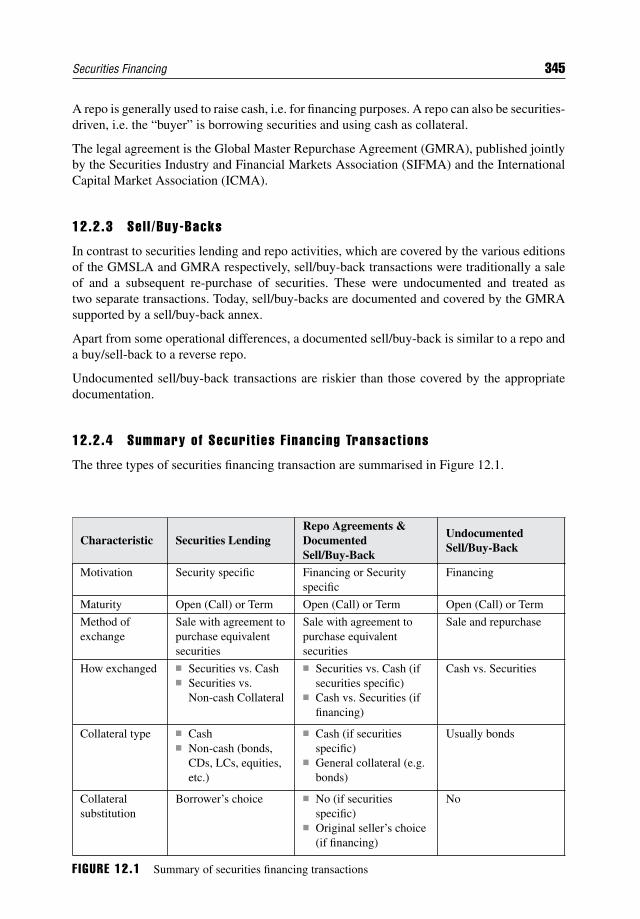
Securities Financing 345
A repo is generally used to raise cash, i.e. for financing purposes. A repo can also be securities-driven, i.e. the “buyer” is borrowing securities and using cash as collateral.
The legal agreement is the Global Master Repurchase Agreement (GMRA), published jointlyby the Securities Industry and Financial Markets Association (SIFMA) and the InternationalCapital Market Association (ICMA).
12.2.3 Sel l /Buy-Backs
In contrast to securities lending and repo activities, which are covered by the various editionsof the GMSLA and GMRA respectively, sell/buy-back transactions were traditionally a saleof and a subsequent re-purchase of securities. These were undocumented and treated astwo separate transactions. Today, sell/buy-backs are documented and covered by the GMRAsupported by a sell/buy-back annex.
Apart from some operational differences, a documented sell/buy-back is similar to a repo anda buy/sell-back to a reverse repo.
Undocumented sell/buy-back transactions are riskier than those covered by the appropriatedocumentation.
12.2.4 Summary of Securit ies F inancing Transact ions
The three types of securities financing transaction are summarised in Figure 12.1.
Characteristic Securities LendingRepo Agreements &DocumentedSell/Buy-Back
UndocumentedSell/Buy-Back
Motivation Security specific Financing or Securityspecific
Financing
Maturity Open (Call) or Term Open (Call) or Term Open (Call) or Term
Method ofexchange
Sale with agreement topurchase equivalentsecurities
Sale with agreement topurchase equivalentsecurities
Sale and repurchase
How exchanged Securities vs. Cash Securities vs.
Non-cash Collateral
Securities vs. Cash (ifsecurities specific)
Cash vs. Securities (iffinancing)
Cash vs. Securities
Collateral type Cash Non-cash (bonds,
CDs, LCs, equities,etc.)
Cash (if securitiesspecific)
General collateral (e.g.bonds)
Usually bonds
Collateralsubstitution
Borrower’s choice No (if securitiesspecific)
Original seller’s choice(if financing)
No
F IGURE 12.1 Summary of securities financing transactions
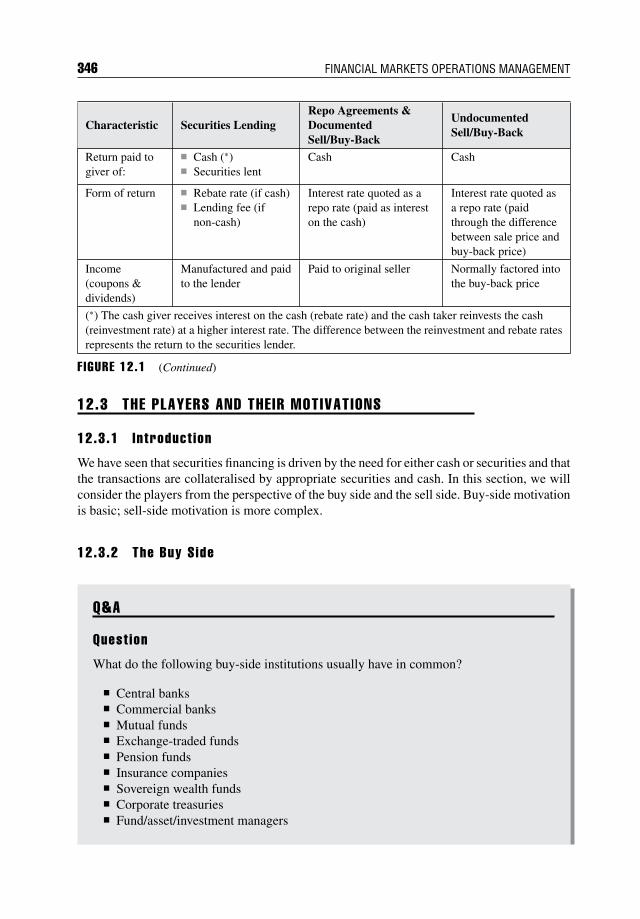
346 FINANCIAL MARKETS OPERATIONS MANAGEMENT
Characteristic Securities LendingRepo Agreements &DocumentedSell/Buy-Back
UndocumentedSell/Buy-Back
Return paid togiver of:
Cash (∗) Securities lent
Cash Cash
Form of return Rebate rate (if cash) Lending fee (if
non-cash)
Interest rate quoted as arepo rate (paid as intereston the cash)
Interest rate quoted asa repo rate (paidthrough the differencebetween sale price andbuy-back price)
Income(coupons ÷nds)
Manufactured and paidto the lender
Paid to original seller Normally factored intothe buy-back price
(∗) The cash giver receives interest on the cash (rebate rate) and the cash taker reinvests the cash(reinvestment rate) at a higher interest rate. The difference between the reinvestment and rebate ratesrepresents the return to the securities lender.
F IGURE 12.1 (Continued)
12.3 THE PLAYERS AND THEIR MOTIVATIONS
12.3.1 Introduct ion
We have seen that securities financing is driven by the need for either cash or securities and thatthe transactions are collateralised by appropriate securities and cash. In this section, we willconsider the players from the perspective of the buy side and the sell side. Buy-side motivationis basic; sell-side motivation is more complex.
12.3.2 The Buy Side
Q&A
Quest ion
What do the following buy-side institutions usually have in common?
Central banks Commercial banks Mutual funds Exchange-traded funds Pension funds Insurance companies Sovereign wealth funds Corporate treasuries Fund/asset/investment managers
Securities Financing 347
Answer
These institutions usually have one or more of the following characteristics in common:
1. They are cash-rich;2. They beneficially own deep pools of securities;3. They manage cash and securities assets on behalf of clients;4. They tend to be risk averse;5. They tend to hold their assets for medium/long-term periods of time.
These characteristics can be attractive to potential borrowers requiring access to cash and/orsecurities.
There is only one reason why any of the above buy-side institutions would want to lend itssecurities and cash: to earn a return. This return can be explicit in terms of earning fees orinterest on cash balances or implied in terms of reduced custody fees incurred by the institution.It is also true that securities lending and securities-specific repo and sell/buy-back transactionsincrease securities liquidity in the market.
12.3.3 The Sel l S ide
There are several reasons why any institution might require access to securities and cash.These include:
To cover a short position (securities); To finance an inventory position (cash); To benefit from a temporary transfer of ownership (securities).
Q&A
Quest ion
What types of institutions might wish to benefit from one or more of these three reasons?
Answer
The following institutional types might wish to utilise securities borrowing:
Market-makers Hedge funds Broker/dealers Central banks (they facilitate central bank operations using the repo market)
348 FINANCIAL MARKETS OPERATIONS MANAGEMENT
Reasons include:
Covering short positions in securities; Funding long positions in securities; Preventing settlement fails; Reducing funding costs; Reducing risk through the use of collateral; Ensuring liquidity in the secondary markets; Hedging derivatives activities; Preventing/containing market “squeezes” that can lead to settlement problems and
disorderly markets; Permitting shorter settlement cycles to occur; Allowing more efficient use of capital.
Let us take a look at some examples of the reasons for borrowing securities and cash.
12.3.4 Borrowing to Cover Short Posit ions
Sett lement Fa i ls Management You purchase USD 5,000,000 of a bond from one coun-terparty and sell USD 4,000,000 of the same bond to another counterparty, both for the samesettlement date. On the settlement date the purchase fails; this leaves you short of bonds forthe sale, which results in a second settlement fail. By borrowing USD 4,000,000 of the bondyou will be able to settle the sale. This situation gives you two benefits:
1. As you have not had to pay for the purchase, you have “use of funds”;2 and2. You have the sale proceeds which you can make use of.
On settlement of the purchase, you will be able to repay the loan of USD 4 million of thebond. The funding benefit of your positive cash flow should outweigh the cost of borrowingthe bonds.
We covered the subject of fails management in more detail in Chapter 8.
Short Sel l ing You are a dealer and you take the view that shares in a company are aboutto go down in price. You do not have a position in the shares. In order to benefit, you sell theshares now and plan to buy them back at some unspecified future time when, hopefully, theprice has gone down. As you have executed a sale, you have an obligation to deliver sharesthat you do not have. In order to settle your sale, you will need to borrow the shares until suchtime as you buy them back.
2The term “use of funds” means that, in theory, you can reinvest this cash until it is required to cover thepurchase settlement. In practice, however, you would leave the cash idle in the settlement account.
Securities Financing 349
Market Making As a market maker, you have the obligation to make a two-way price underany market conditions. If the market comes to you with more “buy orders” than “sell orders”,you might be going short of securities to deliver. In this case, you will need to borrow somefrom securities and return them when your inventory goes long.
Arbitrage Trading An arbitrage strategy involves going long in one security and short inanother, often related, security. The short position will need to be covered by borrowing thesecurities.
An example would be a convertible bond arbitrage where the arbitrageur buys a convertiblebond and sells the equivalent number of underlying shares. For this strategy to work, thearbitrageur will need to borrow the shares until such time as the arbitrage is closed (i.e. buythe shares, sell the convertible bond and repay the loan of shares).
Derivat ives Act iv i t ies A derivatives trader writes call options on a single stock in theexpectation that he will not be called upon to exercise and deliver the underlying shares.
Q&A
Quest ion
Under what circumstances would the trader have to deliver the underlying shares andwhat are the main risks and benefits?
Answer
A writer of a call option hopes that the underlying share price does not increasebeyond the break-even price. He is therefore vulnerable if the share price increasesand can expect to be exercised against.
To cover the possibility of an exercise, the dealer should either have the underlyingshares or, if not, then he/she should borrow them to cover a “naked” position.
If the option is European style, then there is just the one date on which exercise cantake place; for an American-style option, exercise can take place at any time andthis could require the trader to borrow the underlying shares from the moment hewrote them.
The benefit for the writer is the premium received when the contract is executed.
12.3.5 Borrowing Cash to F inance Inventory
When a dealer buys one or more securities, it can finance the purchase costs using repo orsell/buy-back transactions. The dealer can either repo the purchased securities straight back tothe original selling counterparty or repo other securities using the cash to finance the originaltransactions.
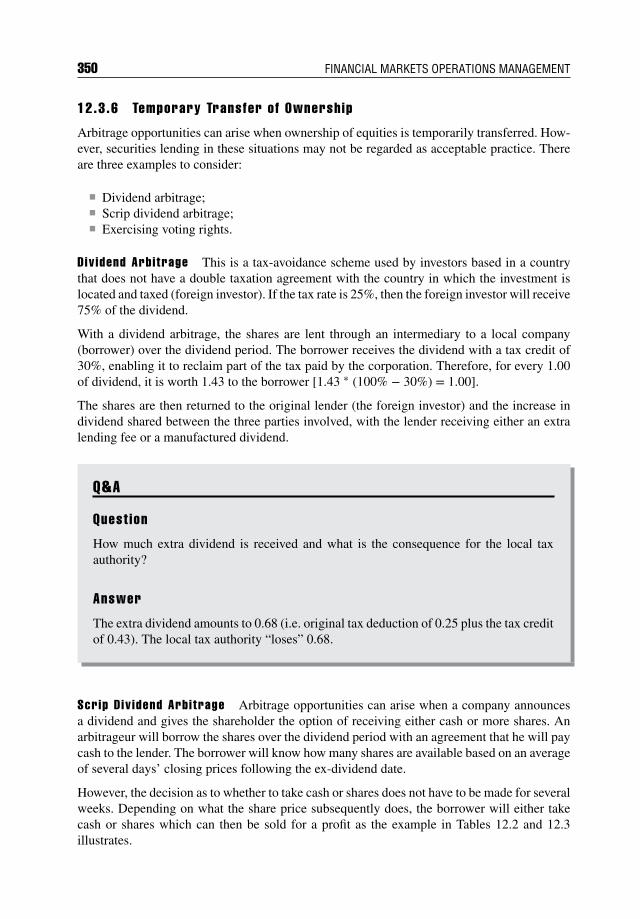
350 FINANCIAL MARKETS OPERATIONS MANAGEMENT
12.3.6 Temporary Transfer of Ownership
Arbitrage opportunities can arise when ownership of equities is temporarily transferred. How-ever, securities lending in these situations may not be regarded as acceptable practice. Thereare three examples to consider:
Dividend arbitrage; Scrip dividend arbitrage; Exercising voting rights.
Div idend Arbitrage This is a tax-avoidance scheme used by investors based in a countrythat does not have a double taxation agreement with the country in which the investment islocated and taxed (foreign investor). If the tax rate is 25%, then the foreign investor will receive75% of the dividend.
With a dividend arbitrage, the shares are lent through an intermediary to a local company(borrower) over the dividend period. The borrower receives the dividend with a tax credit of30%, enabling it to reclaim part of the tax paid by the corporation. Therefore, for every 1.00of dividend, it is worth 1.43 to the borrower [1.43 ∗ (100% − 30%) = 1.00].
The shares are then returned to the original lender (the foreign investor) and the increase individend shared between the three parties involved, with the lender receiving either an extralending fee or a manufactured dividend.
Q&A
Quest ion
How much extra dividend is received and what is the consequence for the local taxauthority?
Answer
The extra dividend amounts to 0.68 (i.e. original tax deduction of 0.25 plus the tax creditof 0.43). The local tax authority “loses” 0.68.
Scrip Div idend Arbitrage Arbitrage opportunities can arise when a company announcesa dividend and gives the shareholder the option of receiving either cash or more shares. Anarbitrageur will borrow the shares over the dividend period with an agreement that he will paycash to the lender. The borrower will know how many shares are available based on an averageof several days’ closing prices following the ex-dividend date.
However, the decision as to whether to take cash or shares does not have to be made for severalweeks. Depending on what the share price subsequently does, the borrower will either takecash or shares which can then be sold for a profit as the example in Tables 12.2 and 12.3illustrates.
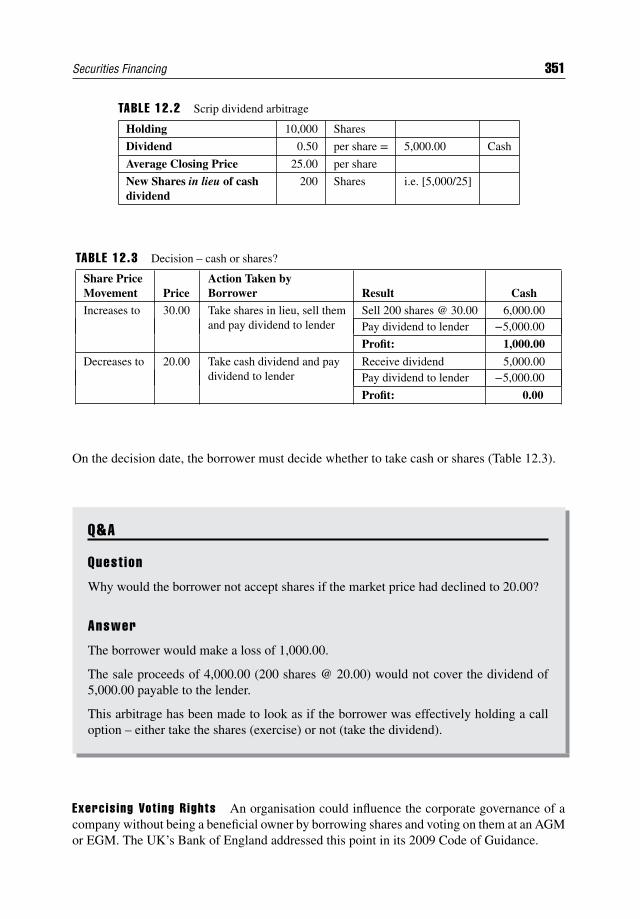
Securities Financing 351
TABLE 12.2 Scrip dividend arbitrage
Holding 10,000 Shares
Dividend 0.50 per share = 5,000.00 Cash
Average Closing Price 25.00 per share
New Shares in lieu of cashdividend
200 Shares i.e. [5,000/25]
TABLE 12.3 Decision – cash or shares?
Share PriceMovement Price
Action Taken byBorrower Result Cash
Increases to 30.00 Take shares in lieu, sell themand pay dividend to lender
Sell 200 shares @ 30.00 6,000.00Pay dividend to lender −5,000.00
Profit: 1,000.00
Decreases to 20.00 Take cash dividend and paydividend to lender
Receive dividend 5,000.00Pay dividend to lender −5,000.00
Profit: 0.00
On the decision date, the borrower must decide whether to take cash or shares (Table 12.3).
Q&A
Quest ion
Why would the borrower not accept shares if the market price had declined to 20.00?
Answer
The borrower would make a loss of 1,000.00.
The sale proceeds of 4,000.00 (200 shares @ 20.00) would not cover the dividend of5,000.00 payable to the lender.
This arbitrage has been made to look as if the borrower was effectively holding a calloption – either take the shares (exercise) or not (take the dividend).
Exercis ing Vot ing Rights An organisation could influence the corporate governance of acompany without being a beneficial owner by borrowing shares and voting on them at an AGMor EGM. The UK’s Bank of England addressed this point in its 2009 Code of Guidance.
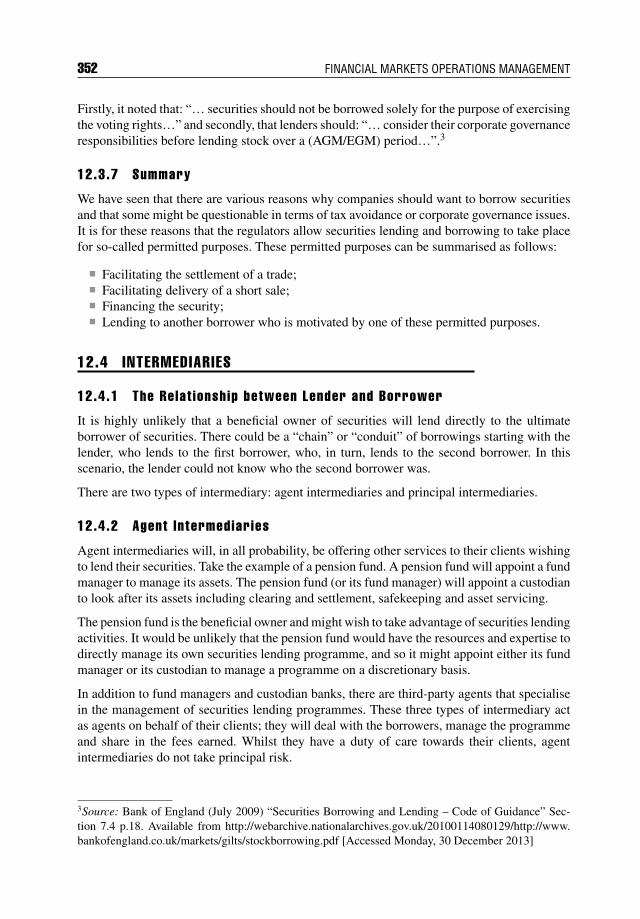
352 FINANCIAL MARKETS OPERATIONS MANAGEMENT
Firstly, it noted that: “… securities should not be borrowed solely for the purpose of exercisingthe voting rights…” and secondly, that lenders should: “… consider their corporate governanceresponsibilities before lending stock over a (AGM/EGM) period…”.3
12.3.7 Summary
We have seen that there are various reasons why companies should want to borrow securitiesand that some might be questionable in terms of tax avoidance or corporate governance issues.It is for these reasons that the regulators allow securities lending and borrowing to take placefor so-called permitted purposes. These permitted purposes can be summarised as follows:
Facilitating the settlement of a trade; Facilitating delivery of a short sale; Financing the security; Lending to another borrower who is motivated by one of these permitted purposes.
12.4 INTERMEDIARIES
12.4.1 The Relat ionship between Lender and Borrower
It is highly unlikely that a beneficial owner of securities will lend directly to the ultimateborrower of securities. There could be a “chain” or “conduit” of borrowings starting with thelender, who lends to the first borrower, who, in turn, lends to the second borrower. In thisscenario, the lender could not know who the second borrower was.
There are two types of intermediary: agent intermediaries and principal intermediaries.
12.4.2 Agent Intermediaries
Agent intermediaries will, in all probability, be offering other services to their clients wishingto lend their securities. Take the example of a pension fund. A pension fund will appoint a fundmanager to manage its assets. The pension fund (or its fund manager) will appoint a custodianto look after its assets including clearing and settlement, safekeeping and asset servicing.
The pension fund is the beneficial owner and might wish to take advantage of securities lendingactivities. It would be unlikely that the pension fund would have the resources and expertise todirectly manage its own securities lending programme, and so it might appoint either its fundmanager or its custodian to manage a programme on a discretionary basis.
In addition to fund managers and custodian banks, there are third-party agents that specialisein the management of securities lending programmes. These three types of intermediary actas agents on behalf of their clients; they will deal with the borrowers, manage the programmeand share in the fees earned. Whilst they have a duty of care towards their clients, agentintermediaries do not take principal risk.
3Source: Bank of England (July 2009) “Securities Borrowing and Lending – Code of Guidance” Sec-tion 7.4 p.18. Available from http://webarchive.nationalarchives.gov.uk/20100114080129/http://www.bankofengland.co.uk/markets/gilts/stockborrowing.pdf [Accessed Monday, 30 December 2013]
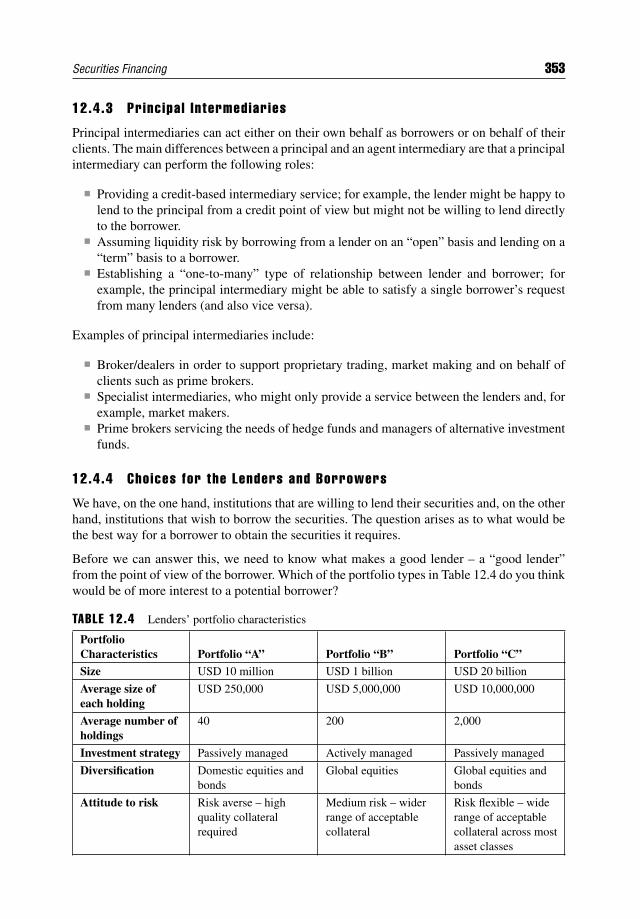
Securities Financing 353
12.4.3 Princ ipa l Intermediaries
Principal intermediaries can act either on their own behalf as borrowers or on behalf of theirclients. The main differences between a principal and an agent intermediary are that a principalintermediary can perform the following roles:
Providing a credit-based intermediary service; for example, the lender might be happy tolend to the principal from a credit point of view but might not be willing to lend directlyto the borrower.
Assuming liquidity risk by borrowing from a lender on an “open” basis and lending on a“term” basis to a borrower.
Establishing a “one-to-many” type of relationship between lender and borrower; forexample, the principal intermediary might be able to satisfy a single borrower’s requestfrom many lenders (and also vice versa).
Examples of principal intermediaries include:
Broker/dealers in order to support proprietary trading, market making and on behalf ofclients such as prime brokers.
Specialist intermediaries, who might only provide a service between the lenders and, forexample, market makers.
Prime brokers servicing the needs of hedge funds and managers of alternative investmentfunds.
12.4.4 Choices for the Lenders and Borrowers
We have, on the one hand, institutions that are willing to lend their securities and, on the otherhand, institutions that wish to borrow the securities. The question arises as to what would bethe best way for a borrower to obtain the securities it requires.
Before we can answer this, we need to know what makes a good lender – a “good lender”from the point of view of the borrower. Which of the portfolio types in Table 12.4 do you thinkwould be of more interest to a potential borrower?
TABLE 12.4 Lenders’ portfolio characteristics
PortfolioCharacteristics Portfolio “A” Portfolio “B” Portfolio “C”Size USD 10 million USD 1 billion USD 20 billion
Average size ofeach holding
USD 250,000 USD 5,000,000 USD 10,000,000
Average number ofholdings
40 200 2,000
Investment strategy Passively managed Actively managed Passively managed
Diversification Domestic equities andbonds
Global equities Global equities andbonds
Attitude to risk Risk averse – highquality collateralrequired
Medium risk – widerrange of acceptablecollateral
Risk flexible – widerange of acceptablecollateral across mostasset classes
354 FINANCIAL MARKETS OPERATIONS MANAGEMENT
A potential borrower might be attracted to all three portfolios as they could contain many of thesecurities it requires. However, the borrower should consider the following possible hurdles:
Portfolio “A”: This portfolio is somewhat limited in terms of geographical reach (domes-tic securities), has relatively few holdings, each with an average size of USD 250,000 andis somewhat cautious in terms of risk (will only accept high quality collateral). On thepositive side, this is a passively managed portfolio, suggesting that the holdings do notchange frequently.
Portfolio “B”: This is a larger portfolio than “A” with a greater number of holdings and asomewhat more flexible approach to collateral requirements. The portfolio is reasonablydiversified albeit in one asset class only. A possible disadvantage is that the portfolio isactively managed, suggesting that any securities that the borrower takes could be recalledat any moment.
Portfolio “C”: This portfolio would appear to be the more attractive proposition. It has alarge number of holdings, each of a good size, it is passively managed and well diversified.In addition to this, the portfolio has a flexible approach to collateral.
Taking these factors into account and with all things being equal, you might expect mostborrowers would want to approach Portfolio “C” in the first instance. It might well be the casethat the other two portfolios might only ever be approached occasionally, if at all.
If Portfolios “A” and “B” wish to lend securities, their only choice might be to use an agentintermediary such as their custodian and participate in its managed lending programme ona pooled basis. On the other hand, Portfolio “C” might be attractive enough that principalintermediaries would wish to deal directly with that portfolio.
12.5 AGREEMENTS AND CODE OF GUIDANCE
12.5.1 Introduct ion
You will recall that the definitions of securities financing imply from a legal standpoint thatthe lender is, in fact, disposing of its securities and the borrower is acquiring them. One of thepurposes of a legal agreement is to turn the disposal/re-acquisition concept into an economi-cally temporary and short-term collateralised lending transaction. For this to occur, securitiesfinancing is supported using legally accepted agreements. These agreements were traditionallynegotiated bilaterally between lender and borrower/agent. Over time, these agreements havebecome globally standardised.
Copies of these agreements can be found on the appropriate website and are free to download.Please note that there might be two or more versions of an agreement as these are updatedperiodically.
12.5.2 Securit ies Lending Agreements
The master agreements for the securities lending business can be found on the InternationalSecurities Lending Association’s website at www.isla.co.uk/index.php/master-agreementswhere you will find the documents shown in Table 12.5.
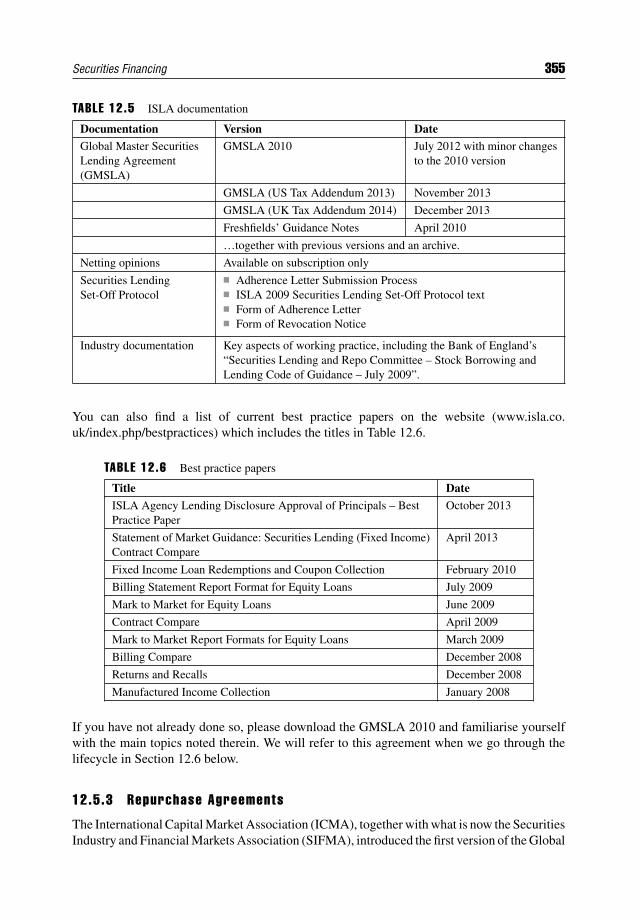
Securities Financing 355
TABLE 12.5 ISLA documentation
Documentation Version DateGlobal Master SecuritiesLending Agreement(GMSLA)
GMSLA 2010 July 2012 with minor changesto the 2010 version
GMSLA (US Tax Addendum 2013) November 2013
GMSLA (UK Tax Addendum 2014) December 2013
Freshfields’ Guidance Notes April 2010
…together with previous versions and an archive.
Netting opinions Available on subscription only
Securities LendingSet-Off Protocol
Adherence Letter Submission Process ISLA 2009 Securities Lending Set-Off Protocol text Form of Adherence Letter Form of Revocation Notice
Industry documentation Key aspects of working practice, including the Bank of England’s“Securities Lending and Repo Committee – Stock Borrowing andLending Code of Guidance – July 2009”.
You can also find a list of current best practice papers on the website (www.isla.co.uk/index.php/bestpractices) which includes the titles in Table 12.6.
TABLE 12.6 Best practice papers
Title Date
ISLA Agency Lending Disclosure Approval of Principals – BestPractice Paper
October 2013
Statement of Market Guidance: Securities Lending (Fixed Income)Contract Compare
April 2013
Fixed Income Loan Redemptions and Coupon Collection February 2010
Billing Statement Report Format for Equity Loans July 2009
Mark to Market for Equity Loans June 2009
Contract Compare April 2009
Mark to Market Report Formats for Equity Loans March 2009
Billing Compare December 2008
Returns and Recalls December 2008
Manufactured Income Collection January 2008
If you have not already done so, please download the GMSLA 2010 and familiarise yourselfwith the main topics noted therein. We will refer to this agreement when we go through thelifecycle in Section 12.6 below.
12.5.3 Repurchase Agreements
The International Capital Market Association (ICMA), together with what is now the SecuritiesIndustry and Financial Markets Association (SIFMA), introduced the first version of the Global
356 FINANCIAL MARKETS OPERATIONS MANAGEMENT
Master Repurchase Agreement (GMRA) in 1992. The agreement has been updated three times,with the current version being the GMRA 2011.
Three versions (1995, 2000 and 2011) are available on the ICMA website (www.icmagroup.org/Regulatory-Policy-and-Market-Practice/short-term-markets/Repo-Markets/global-master-repurchase-agreement-gmra/#list). For the 2011 version, you can also find the followingdocuments:
Revised version of the GMRA Protocol; GMRA 2011 black-lined to show changes from GMRA 2000; Guidance Notes to the GMRA 2011; Buy/Sell-Back Annex to the GMRA 2011; Bills Annex to the GMRA 2011; Agency Annex to the GMRA 2011; Equities Annex to the GMRA 2011; Russian Annex to the GMRA 2011; Russian Translation of the GMRA 2011.
In order to cover the validity of the GMRA and the enforceability of the netting provisionscontained within the agreement, ICMA has obtained legal opinions covering 62 countries(plus a supplement for Switzerland). These are referred to as the 2013 GMRA Legal Opinionsand they consist of a Core Opinion of the GMRA and various SLAs plus specific appendicescovering each of the agreements.
12.5.4 Code of Guidance
The Bank of England’s Securities Lending and Repo Committee published the SecuritiesBorrowing and Lending Code of Guidance in 2009 and the Gilt Repo Code of Guidance in2008. These are currently under review4 and are available on request.5 The 2009 Code ofGuidance can also be found on the ISLA website (www.isla.co.uk/index.php/master-agreements/industrydoc).
12.6 SECURIT IES LENDING LIFECYCLE
In this section we will look at the lifecycle of a securities loan. There are three phases that wewill look at in more detail:
Phase 1: Loan initiation;
Phase 2: Loan maintenance;
Phase 3: Loan closure.
Securities lending is another example of a collateralised activity; you will recall that wepreviously looked at collateral for non-centrally cleared derivatives in Chapter 9.
4Refer to Bank of England (online) “Codes of Guidance”. Available from www.bankofengland.co.uk/markets/Pages/gilts/slrc.aspx. [Accessed Friday, 9 May 2014]5Available on request: The Secretary to the Securities Lending and Repo Committee, Bank of England(HO-1), Threadneedle Street, London EC2R 8AH.
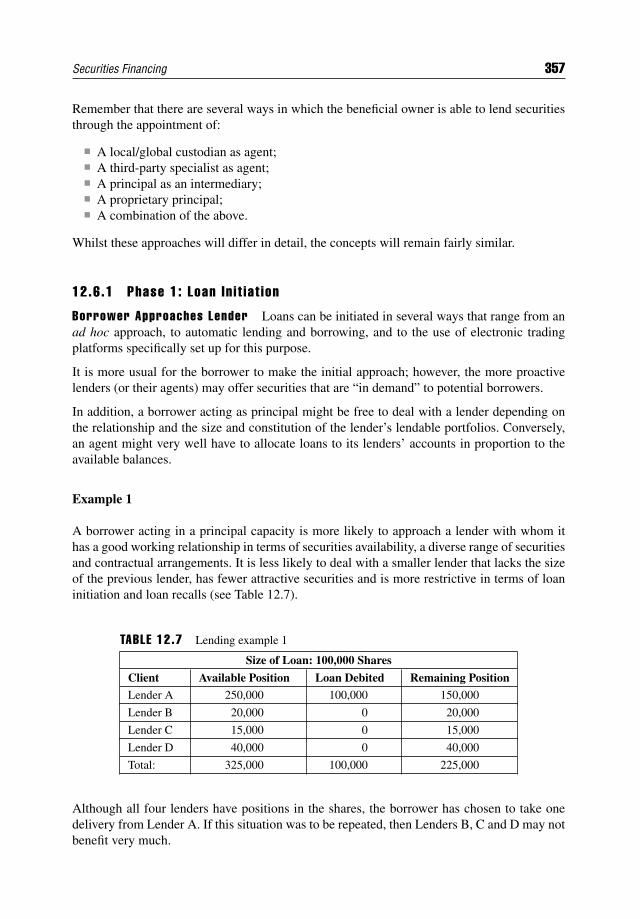
Securities Financing 357
Remember that there are several ways in which the beneficial owner is able to lend securitiesthrough the appointment of:
A local/global custodian as agent; A third-party specialist as agent; A principal as an intermediary; A proprietary principal; A combination of the above.
Whilst these approaches will differ in detail, the concepts will remain fairly similar.
12.6.1 Phase 1: Loan In i t iat ion
Borrower Approaches Lender Loans can be initiated in several ways that range from anad hoc approach, to automatic lending and borrowing, and to the use of electronic tradingplatforms specifically set up for this purpose.
It is more usual for the borrower to make the initial approach; however, the more proactivelenders (or their agents) may offer securities that are “in demand” to potential borrowers.
In addition, a borrower acting as principal might be free to deal with a lender depending onthe relationship and the size and constitution of the lender’s lendable portfolios. Conversely,an agent might very well have to allocate loans to its lenders’ accounts in proportion to theavailable balances.
Example 1
A borrower acting in a principal capacity is more likely to approach a lender with whom ithas a good working relationship in terms of securities availability, a diverse range of securitiesand contractual arrangements. It is less likely to deal with a smaller lender that lacks the sizeof the previous lender, has fewer attractive securities and is more restrictive in terms of loaninitiation and loan recalls (see Table 12.7).
TABLE 12.7 Lending example 1
Size of Loan: 100,000 Shares
Client Available Position Loan Debited Remaining PositionLender A 250,000 100,000 150,000
Lender B 20,000 0 20,000
Lender C 15,000 0 15,000
Lender D 40,000 0 40,000
Total: 325,000 100,000 225,000
Although all four lenders have positions in the shares, the borrower has chosen to take onedelivery from Lender A. If this situation was to be repeated, then Lenders B, C and D may notbenefit very much.
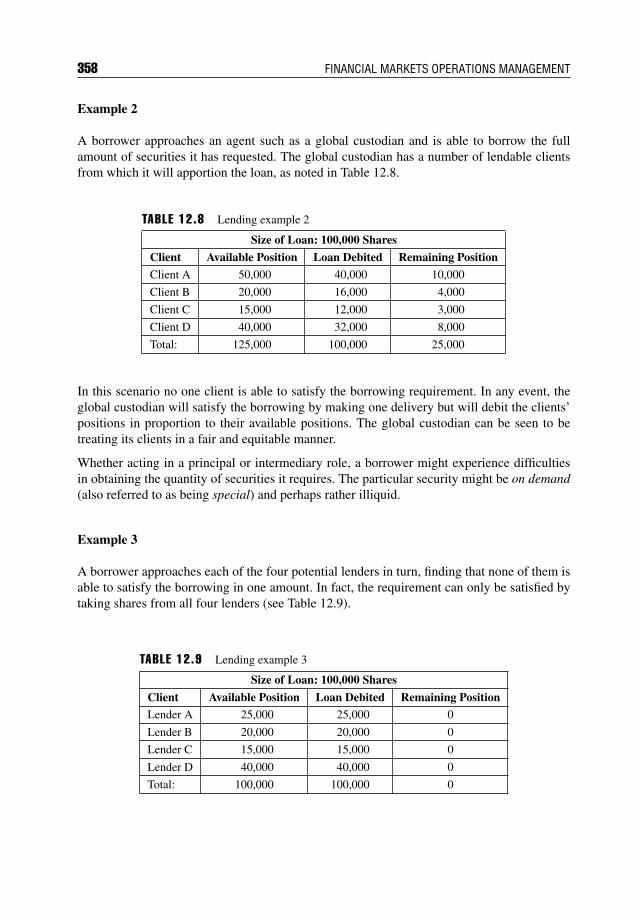
358 FINANCIAL MARKETS OPERATIONS MANAGEMENT
Example 2
A borrower approaches an agent such as a global custodian and is able to borrow the fullamount of securities it has requested. The global custodian has a number of lendable clientsfrom which it will apportion the loan, as noted in Table 12.8.
TABLE 12.8 Lending example 2
Size of Loan: 100,000 Shares
Client Available Position Loan Debited Remaining Position
Client A 50,000 40,000 10,000
Client B 20,000 16,000 4,000
Client C 15,000 12,000 3,000
Client D 40,000 32,000 8,000
Total: 125,000 100,000 25,000
In this scenario no one client is able to satisfy the borrowing requirement. In any event, theglobal custodian will satisfy the borrowing by making one delivery but will debit the clients’positions in proportion to their available positions. The global custodian can be seen to betreating its clients in a fair and equitable manner.
Whether acting in a principal or intermediary role, a borrower might experience difficultiesin obtaining the quantity of securities it requires. The particular security might be on demand(also referred to as being special) and perhaps rather illiquid.
Example 3
A borrower approaches each of the four potential lenders in turn, finding that none of them isable to satisfy the borrowing in one amount. In fact, the requirement can only be satisfied bytaking shares from all four lenders (see Table 12.9).
TABLE 12.9 Lending example 3
Size of Loan: 100,000 Shares
Client Available Position Loan Debited Remaining PositionLender A 25,000 25,000 0
Lender B 20,000 20,000 0
Lender C 15,000 15,000 0
Lender D 40,000 40,000 0
Total: 100,000 100,000 0
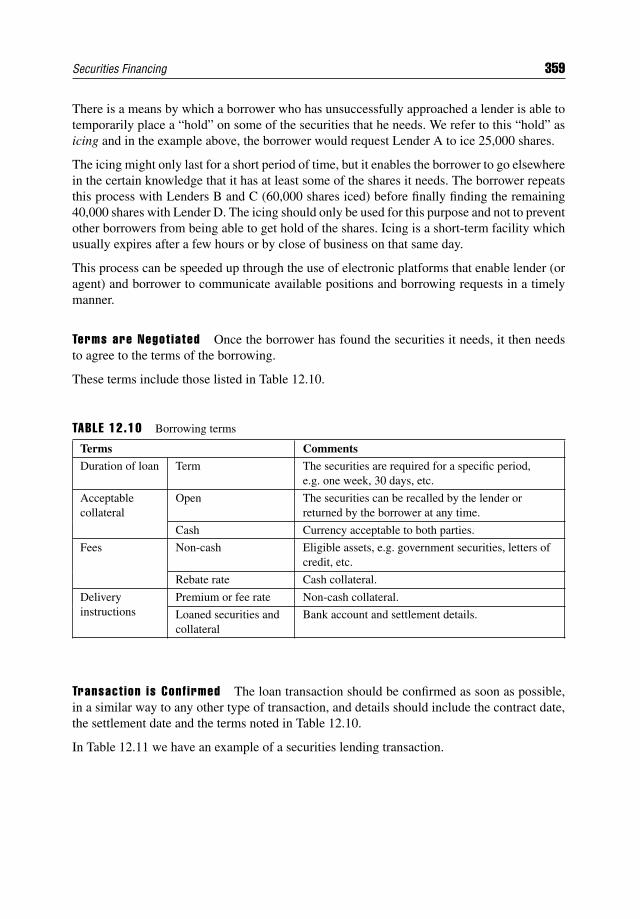
Securities Financing 359
There is a means by which a borrower who has unsuccessfully approached a lender is able totemporarily place a “hold” on some of the securities that he needs. We refer to this “hold” asicing and in the example above, the borrower would request Lender A to ice 25,000 shares.
The icing might only last for a short period of time, but it enables the borrower to go elsewherein the certain knowledge that it has at least some of the shares it needs. The borrower repeatsthis process with Lenders B and C (60,000 shares iced) before finally finding the remaining40,000 shares with Lender D. The icing should only be used for this purpose and not to preventother borrowers from being able to get hold of the shares. Icing is a short-term facility whichusually expires after a few hours or by close of business on that same day.
This process can be speeded up through the use of electronic platforms that enable lender (oragent) and borrower to communicate available positions and borrowing requests in a timelymanner.
Terms are Negot iated Once the borrower has found the securities it needs, it then needsto agree to the terms of the borrowing.
These terms include those listed in Table 12.10.
TABLE 12.10 Borrowing terms
Terms Comments
Duration of loan Term The securities are required for a specific period,e.g. one week, 30 days, etc.
Acceptablecollateral
Open The securities can be recalled by the lender orreturned by the borrower at any time.
Cash Currency acceptable to both parties.
Fees Non-cash Eligible assets, e.g. government securities, letters ofcredit, etc.
Rebate rate Cash collateral.
Deliveryinstructions
Premium or fee rate Non-cash collateral.
Loaned securities andcollateral
Bank account and settlement details.
Transact ion is Conf irmed The loan transaction should be confirmed as soon as possible,in a similar way to any other type of transaction, and details should include the contract date,the settlement date and the terms noted in Table 12.10.
In Table 12.11 we have an example of a securities lending transaction.
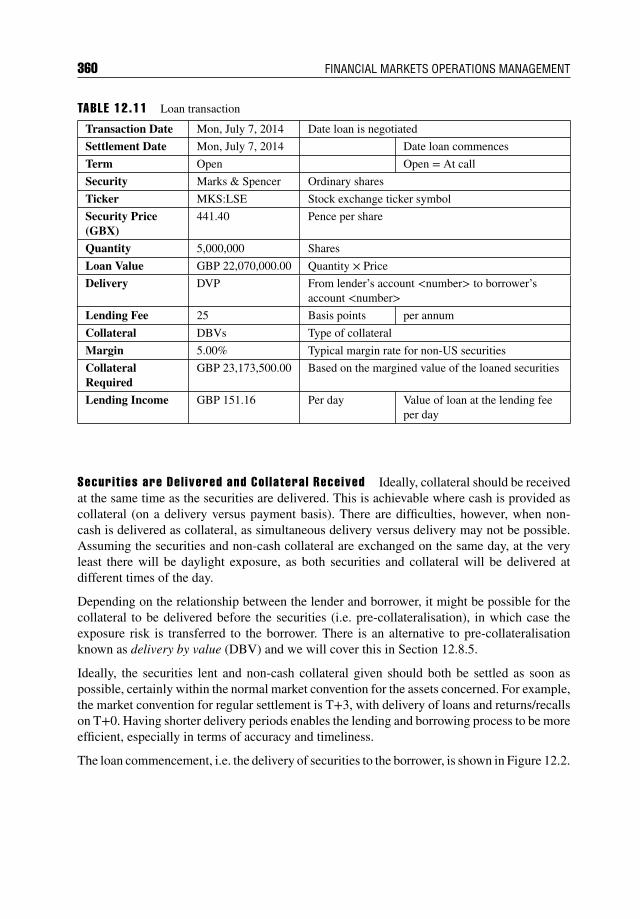
360 FINANCIAL MARKETS OPERATIONS MANAGEMENT
TABLE 12.11 Loan transaction
Transaction Date Mon, July 7, 2014 Date loan is negotiated
Settlement Date Mon, July 7, 2014 Date loan commences
Term Open Open = At call
Security Marks & Spencer Ordinary shares
Ticker MKS:LSE Stock exchange ticker symbol
Security Price(GBX)
441.40 Pence per share
Quantity 5,000,000 Shares
Loan Value GBP 22,070,000.00 Quantity × Price
Delivery DVP From lender’s account <number> to borrower’saccount <number>
Lending Fee 25 Basis points per annum
Collateral DBVs Type of collateral
Margin 5.00% Typical margin rate for non-US securities
CollateralRequired
GBP 23,173,500.00 Based on the margined value of the loaned securities
Lending Income GBP 151.16 Per day Value of loan at the lending feeper day
Securit ies are Del ivered and Col lateral Received Ideally, collateral should be receivedat the same time as the securities are delivered. This is achievable where cash is provided ascollateral (on a delivery versus payment basis). There are difficulties, however, when non-cash is delivered as collateral, as simultaneous delivery versus delivery may not be possible.Assuming the securities and non-cash collateral are exchanged on the same day, at the veryleast there will be daylight exposure, as both securities and collateral will be delivered atdifferent times of the day.
Depending on the relationship between the lender and borrower, it might be possible for thecollateral to be delivered before the securities (i.e. pre-collateralisation), in which case theexposure risk is transferred to the borrower. There is an alternative to pre-collateralisationknown as delivery by value (DBV) and we will cover this in Section 12.8.5.
Ideally, the securities lent and non-cash collateral given should both be settled as soon aspossible, certainly within the normal market convention for the assets concerned. For example,the market convention for regular settlement is T+3, with delivery of loans and returns/recallson T+0. Having shorter delivery periods enables the lending and borrowing process to be moreefficient, especially in terms of accuracy and timeliness.
The loan commencement, i.e. the delivery of securities to the borrower, is shown in Figure 12.2.
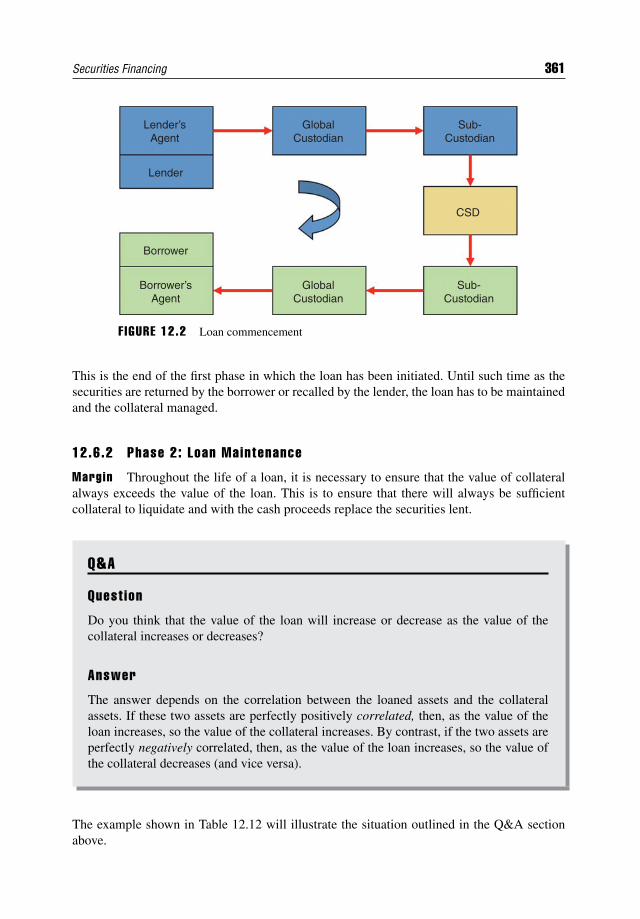
Securities Financing 361
Lender’sAgent
Lender
Borrower
Borrower’sAgent
GlobalCustodian
Sub-Custodian
CSD
Sub-Custodian
GlobalCustodian
F IGURE 12.2 Loan commencement
This is the end of the first phase in which the loan has been initiated. Until such time as thesecurities are returned by the borrower or recalled by the lender, the loan has to be maintainedand the collateral managed.
12.6.2 Phase 2: Loan Maintenance
Margin Throughout the life of a loan, it is necessary to ensure that the value of collateralalways exceeds the value of the loan. This is to ensure that there will always be sufficientcollateral to liquidate and with the cash proceeds replace the securities lent.
Q&A
Quest ion
Do you think that the value of the loan will increase or decrease as the value of thecollateral increases or decreases?
Answer
The answer depends on the correlation between the loaned assets and the collateralassets. If these two assets are perfectly positively correlated, then, as the value of theloan increases, so the value of the collateral increases. By contrast, if the two assets areperfectly negatively correlated, then, as the value of the loan increases, so the value ofthe collateral decreases (and vice versa).
The example shown in Table 12.12 will illustrate the situation outlined in the Q&A sectionabove.
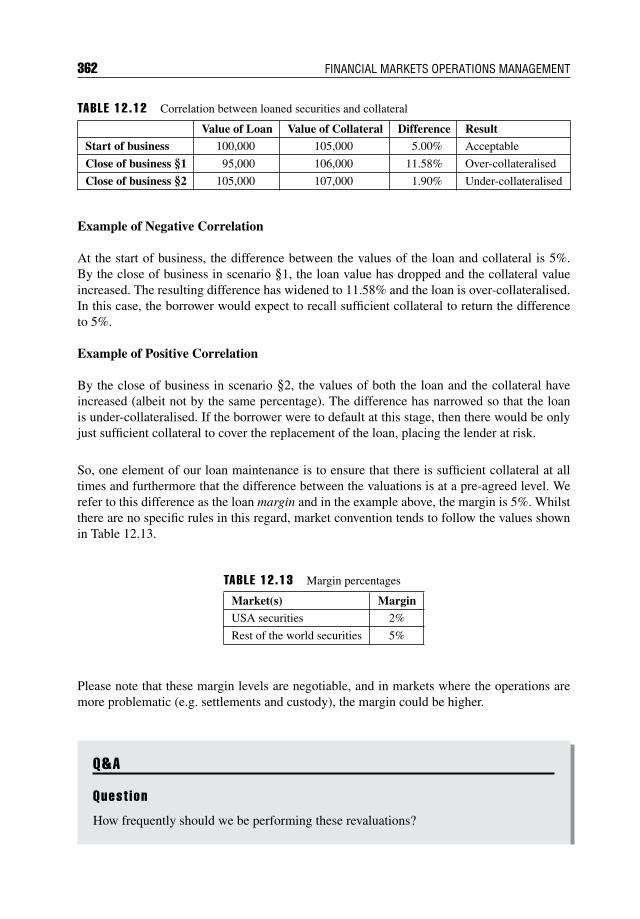
362 FINANCIAL MARKETS OPERATIONS MANAGEMENT
TABLE 12.12 Correlation between loaned securities and collateral
Value of Loan Value of Collateral Difference ResultStart of business 100,000 105,000 5.00% Acceptable
Close of business §1 95,000 106,000 11.58% Over-collateralised
Close of business §2 105,000 107,000 1.90% Under-collateralised
Example of Negative Correlation
At the start of business, the difference between the values of the loan and collateral is 5%.By the close of business in scenario §1, the loan value has dropped and the collateral valueincreased. The resulting difference has widened to 11.58% and the loan is over-collateralised.In this case, the borrower would expect to recall sufficient collateral to return the differenceto 5%.
Example of Positive Correlation
By the close of business in scenario §2, the values of both the loan and the collateral haveincreased (albeit not by the same percentage). The difference has narrowed so that the loanis under-collateralised. If the borrower were to default at this stage, then there would be onlyjust sufficient collateral to cover the replacement of the loan, placing the lender at risk.
So, one element of our loan maintenance is to ensure that there is sufficient collateral at alltimes and furthermore that the difference between the valuations is at a pre-agreed level. Werefer to this difference as the loan margin and in the example above, the margin is 5%. Whilstthere are no specific rules in this regard, market convention tends to follow the values shownin Table 12.13.
TABLE 12.13 Margin percentages
Market(s) MarginUSA securities 2%
Rest of the world securities 5%
Please note that these margin levels are negotiable, and in markets where the operations aremore problematic (e.g. settlements and custody), the margin could be higher.
Q&A
Quest ion
How frequently should we be performing these revaluations?
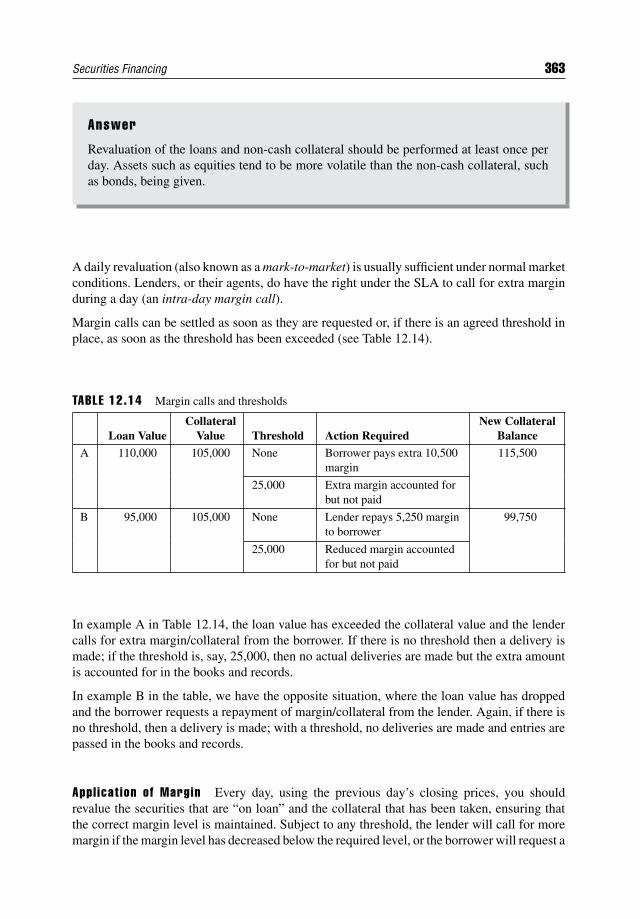
Securities Financing 363
Answer
Revaluation of the loans and non-cash collateral should be performed at least once perday. Assets such as equities tend to be more volatile than the non-cash collateral, suchas bonds, being given.
A daily revaluation (also known as a mark-to-market) is usually sufficient under normal marketconditions. Lenders, or their agents, do have the right under the SLA to call for extra marginduring a day (an intra-day margin call).
Margin calls can be settled as soon as they are requested or, if there is an agreed threshold inplace, as soon as the threshold has been exceeded (see Table 12.14).
TABLE 12.14 Margin calls and thresholds
Loan ValueCollateral
Value Threshold Action RequiredNew Collateral
Balance
A 110,000 105,000 None Borrower pays extra 10,500margin
115,500
25,000 Extra margin accounted forbut not paid
B 95,000 105,000 None Lender repays 5,250 marginto borrower
99,750
25,000 Reduced margin accountedfor but not paid
In example A in Table 12.14, the loan value has exceeded the collateral value and the lendercalls for extra margin/collateral from the borrower. If there is no threshold then a delivery ismade; if the threshold is, say, 25,000, then no actual deliveries are made but the extra amountis accounted for in the books and records.
In example B in the table, we have the opposite situation, where the loan value has droppedand the borrower requests a repayment of margin/collateral from the lender. Again, if there isno threshold, then a delivery is made; with a threshold, no deliveries are made and entries arepassed in the books and records.
Appl icat ion of Margin Every day, using the previous day’s closing prices, you shouldrevalue the securities that are “on loan” and the collateral that has been taken, ensuring thatthe correct margin level is maintained. Subject to any threshold, the lender will call for moremargin if the margin level has decreased below the required level, or the borrower will request a
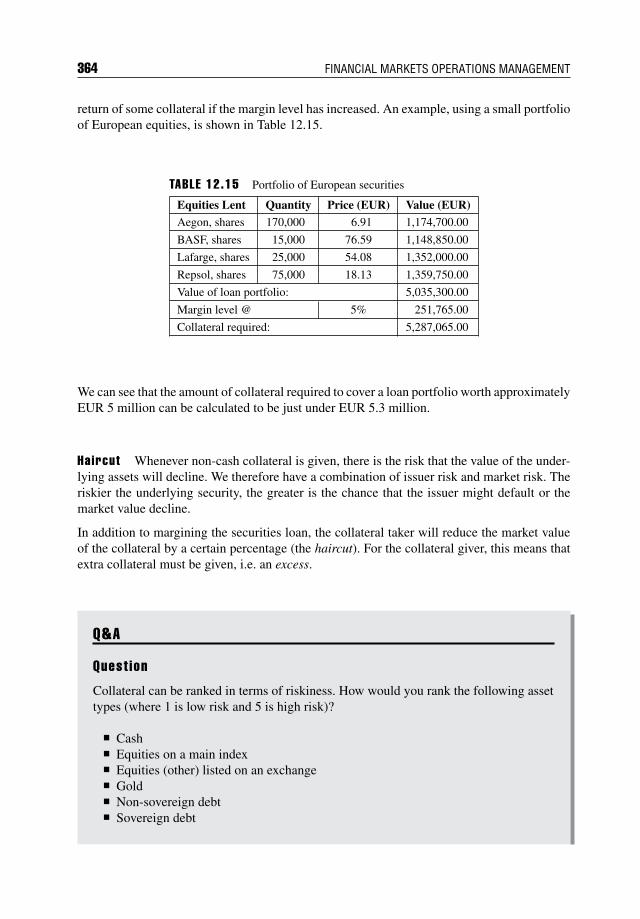
364 FINANCIAL MARKETS OPERATIONS MANAGEMENT
return of some collateral if the margin level has increased. An example, using a small portfolioof European equities, is shown in Table 12.15.
TABLE 12.15 Portfolio of European securities
Equities Lent Quantity Price (EUR) Value (EUR)Aegon, shares 170,000 6.91 1,174,700.00
BASF, shares 15,000 76.59 1,148,850.00
Lafarge, shares 25,000 54.08 1,352,000.00
Repsol, shares 75,000 18.13 1,359,750.00
Value of loan portfolio: 5,035,300.00
Margin level @ 5% 251,765.00
Collateral required: 5,287,065.00
We can see that the amount of collateral required to cover a loan portfolio worth approximatelyEUR 5 million can be calculated to be just under EUR 5.3 million.
Haircut Whenever non-cash collateral is given, there is the risk that the value of the under-lying assets will decline. We therefore have a combination of issuer risk and market risk. Theriskier the underlying security, the greater is the chance that the issuer might default or themarket value decline.
In addition to margining the securities loan, the collateral taker will reduce the market valueof the collateral by a certain percentage (the haircut). For the collateral giver, this means thatextra collateral must be given, i.e. an excess.
Q&A
Quest ion
Collateral can be ranked in terms of riskiness. How would you rank the following assettypes (where 1 is low risk and 5 is high risk)?
Cash Equities on a main index Equities (other) listed on an exchange Gold Non-sovereign debt Sovereign debt
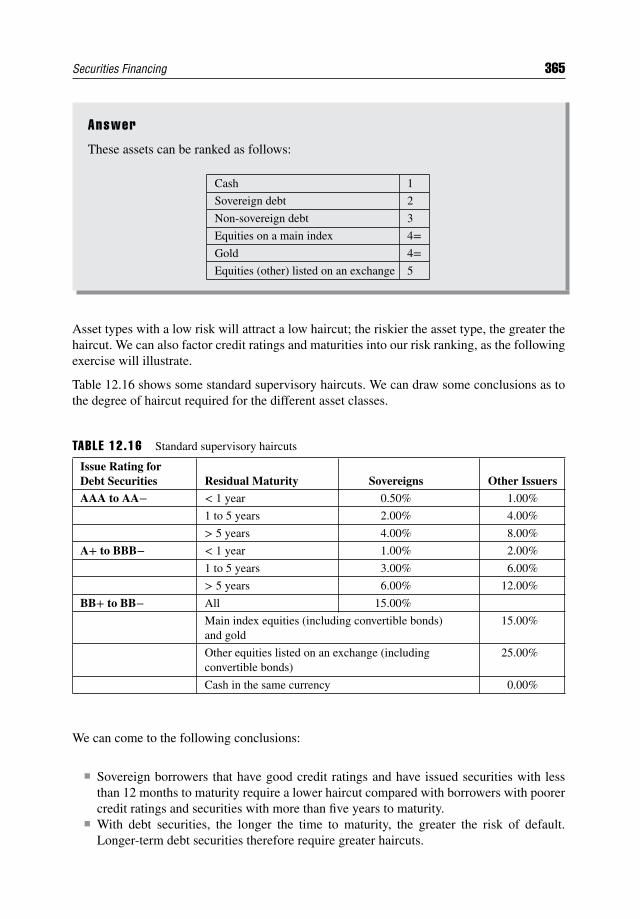
Securities Financing 365
Answer
These assets can be ranked as follows:
Cash 1
Sovereign debt 2
Non-sovereign debt 3
Equities on a main index 4=Gold 4=Equities (other) listed on an exchange 5
Asset types with a low risk will attract a low haircut; the riskier the asset type, the greater thehaircut. We can also factor credit ratings and maturities into our risk ranking, as the followingexercise will illustrate.
Table 12.16 shows some standard supervisory haircuts. We can draw some conclusions as tothe degree of haircut required for the different asset classes.
TABLE 12.16 Standard supervisory haircuts
Issue Rating forDebt Securities Residual Maturity Sovereigns Other Issuers
AAA to AA− < 1 year 0.50% 1.00%
1 to 5 years 2.00% 4.00%
> 5 years 4.00% 8.00%
A+ to BBB− < 1 year 1.00% 2.00%
1 to 5 years 3.00% 6.00%
> 5 years 6.00% 12.00%
BB+ to BB− All 15.00%
Main index equities (including convertible bonds)and gold
15.00%
Other equities listed on an exchange (includingconvertible bonds)
25.00%
Cash in the same currency 0.00%
We can come to the following conclusions:
Sovereign borrowers that have good credit ratings and have issued securities with lessthan 12 months to maturity require a lower haircut compared with borrowers with poorercredit ratings and securities with more than five years to maturity.
With debt securities, the longer the time to maturity, the greater the risk of default.Longer-term debt securities therefore require greater haircuts.
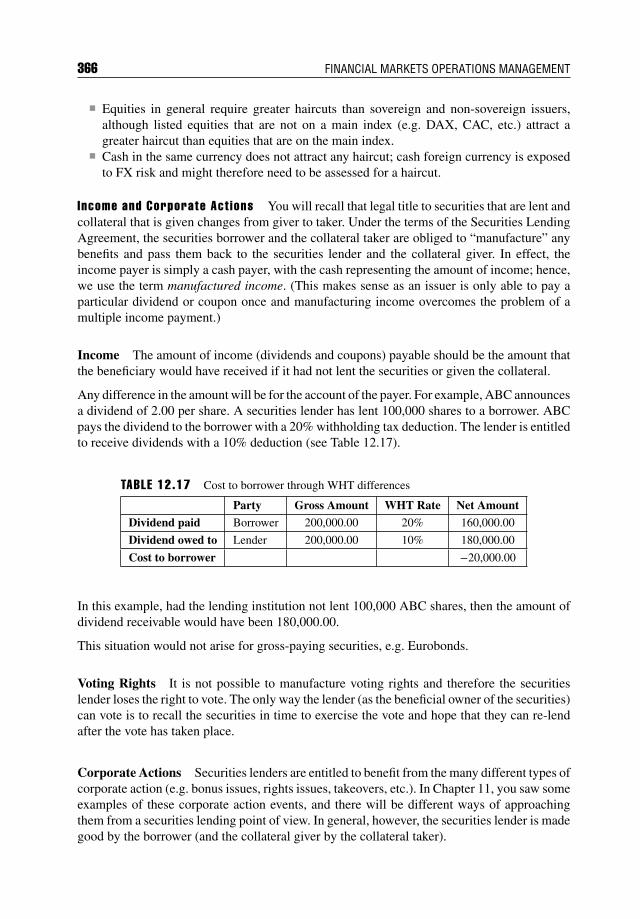
366 FINANCIAL MARKETS OPERATIONS MANAGEMENT
Equities in general require greater haircuts than sovereign and non-sovereign issuers,although listed equities that are not on a main index (e.g. DAX, CAC, etc.) attract agreater haircut than equities that are on the main index.
Cash in the same currency does not attract any haircut; cash foreign currency is exposedto FX risk and might therefore need to be assessed for a haircut.
Income and Corporate Act ions You will recall that legal title to securities that are lent andcollateral that is given changes from giver to taker. Under the terms of the Securities LendingAgreement, the securities borrower and the collateral taker are obliged to “manufacture” anybenefits and pass them back to the securities lender and the collateral giver. In effect, theincome payer is simply a cash payer, with the cash representing the amount of income; hence,we use the term manufactured income. (This makes sense as an issuer is only able to pay aparticular dividend or coupon once and manufacturing income overcomes the problem of amultiple income payment.)
Income The amount of income (dividends and coupons) payable should be the amount thatthe beneficiary would have received if it had not lent the securities or given the collateral.
Any difference in the amount will be for the account of the payer. For example, ABC announcesa dividend of 2.00 per share. A securities lender has lent 100,000 shares to a borrower. ABCpays the dividend to the borrower with a 20% withholding tax deduction. The lender is entitledto receive dividends with a 10% deduction (see Table 12.17).
TABLE 12.17 Cost to borrower through WHT differences
Party Gross Amount WHT Rate Net Amount
Dividend paid Borrower 200,000.00 20% 160,000.00
Dividend owed to Lender 200,000.00 10% 180,000.00
Cost to borrower −20,000.00
In this example, had the lending institution not lent 100,000 ABC shares, then the amount ofdividend receivable would have been 180,000.00.
This situation would not arise for gross-paying securities, e.g. Eurobonds.
Voting Rights It is not possible to manufacture voting rights and therefore the securitieslender loses the right to vote. The only way the lender (as the beneficial owner of the securities)can vote is to recall the securities in time to exercise the vote and hope that they can re-lendafter the vote has taken place.
Corporate Actions Securities lenders are entitled to benefit from the many different types ofcorporate action (e.g. bonus issues, rights issues, takeovers, etc.). In Chapter 11, you saw someexamples of these corporate action events, and there will be different ways of approachingthem from a securities lending point of view. In general, however, the securities lender is madegood by the borrower (and the collateral giver by the collateral taker).
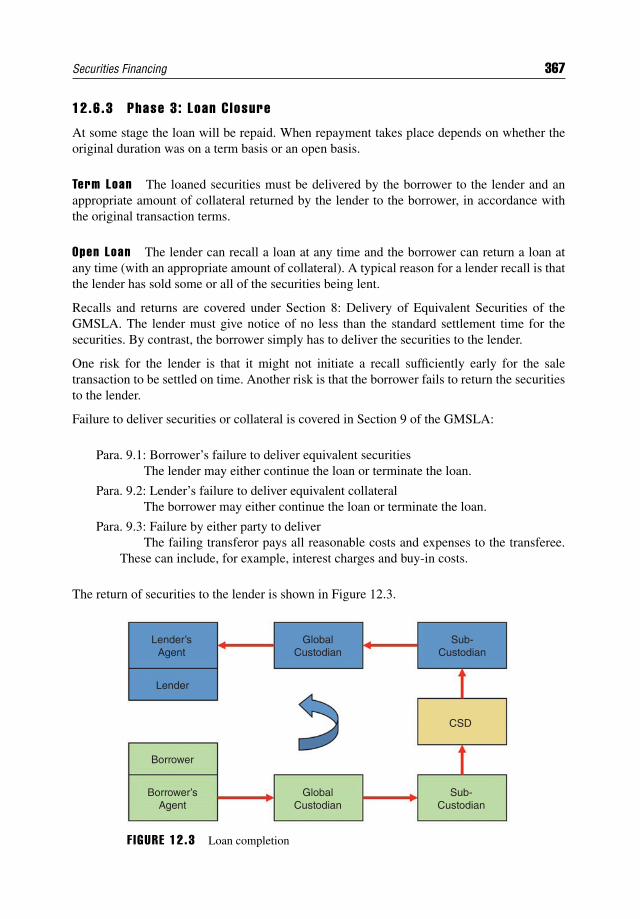
Securities Financing 367
12.6.3 Phase 3: Loan Closure
At some stage the loan will be repaid. When repayment takes place depends on whether theoriginal duration was on a term basis or an open basis.
Term Loan The loaned securities must be delivered by the borrower to the lender and anappropriate amount of collateral returned by the lender to the borrower, in accordance withthe original transaction terms.
Open Loan The lender can recall a loan at any time and the borrower can return a loan atany time (with an appropriate amount of collateral). A typical reason for a lender recall is thatthe lender has sold some or all of the securities being lent.
Recalls and returns are covered under Section 8: Delivery of Equivalent Securities of theGMSLA. The lender must give notice of no less than the standard settlement time for thesecurities. By contrast, the borrower simply has to deliver the securities to the lender.
One risk for the lender is that it might not initiate a recall sufficiently early for the saletransaction to be settled on time. Another risk is that the borrower fails to return the securitiesto the lender.
Failure to deliver securities or collateral is covered in Section 9 of the GMSLA:
Para. 9.1: Borrower’s failure to deliver equivalent securitiesThe lender may either continue the loan or terminate the loan.
Para. 9.2: Lender’s failure to deliver equivalent collateralThe borrower may either continue the loan or terminate the loan.
Para. 9.3: Failure by either party to deliverThe failing transferor pays all reasonable costs and expenses to the transferee.
These can include, for example, interest charges and buy-in costs.
The return of securities to the lender is shown in Figure 12.3.
Lender’sAgent
Lender
Borrower
Borrower’sAgent
GlobalCustodian
Sub-Custodian
CSD
Sub-Custodian
GlobalCustodian
F IGURE 12.3 Loan completion
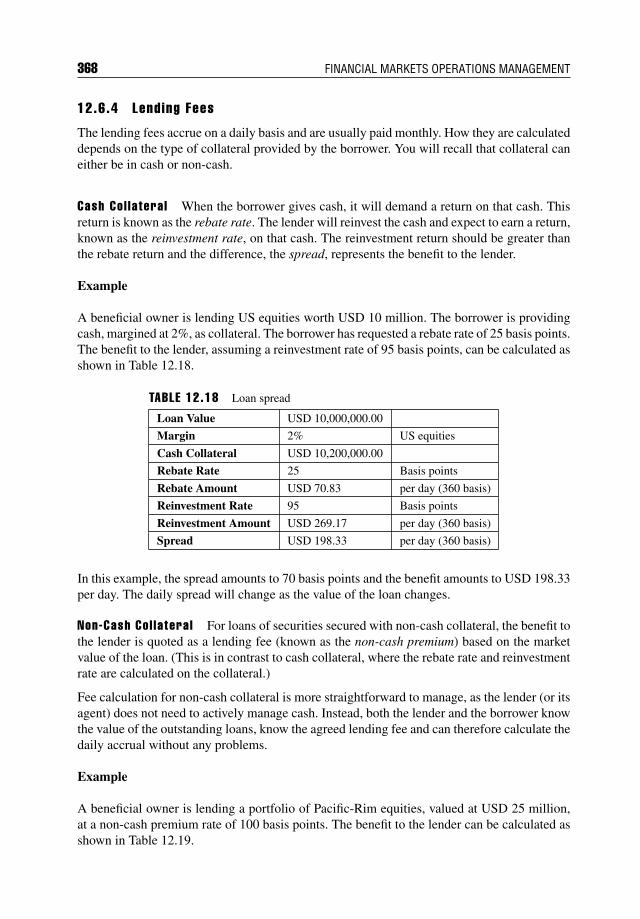
368 FINANCIAL MARKETS OPERATIONS MANAGEMENT
12.6.4 Lending Fees
The lending fees accrue on a daily basis and are usually paid monthly. How they are calculateddepends on the type of collateral provided by the borrower. You will recall that collateral caneither be in cash or non-cash.
Cash Col lateral When the borrower gives cash, it will demand a return on that cash. Thisreturn is known as the rebate rate. The lender will reinvest the cash and expect to earn a return,known as the reinvestment rate, on that cash. The reinvestment return should be greater thanthe rebate return and the difference, the spread, represents the benefit to the lender.
Example
A beneficial owner is lending US equities worth USD 10 million. The borrower is providingcash, margined at 2%, as collateral. The borrower has requested a rebate rate of 25 basis points.The benefit to the lender, assuming a reinvestment rate of 95 basis points, can be calculated asshown in Table 12.18.
TABLE 12.18 Loan spread
Loan Value USD 10,000,000.00
Margin 2% US equities
Cash Collateral USD 10,200,000.00
Rebate Rate 25 Basis points
Rebate Amount USD 70.83 per day (360 basis)
Reinvestment Rate 95 Basis points
Reinvestment Amount USD 269.17 per day (360 basis)
Spread USD 198.33 per day (360 basis)
In this example, the spread amounts to 70 basis points and the benefit amounts to USD 198.33per day. The daily spread will change as the value of the loan changes.
Non-Cash Col lateral For loans of securities secured with non-cash collateral, the benefit tothe lender is quoted as a lending fee (known as the non-cash premium) based on the marketvalue of the loan. (This is in contrast to cash collateral, where the rebate rate and reinvestmentrate are calculated on the collateral.)
Fee calculation for non-cash collateral is more straightforward to manage, as the lender (or itsagent) does not need to actively manage cash. Instead, both the lender and the borrower knowthe value of the outstanding loans, know the agreed lending fee and can therefore calculate thedaily accrual without any problems.
Example
A beneficial owner is lending a portfolio of Pacific-Rim equities, valued at USD 25 million,at a non-cash premium rate of 100 basis points. The benefit to the lender can be calculated asshown in Table 12.19.
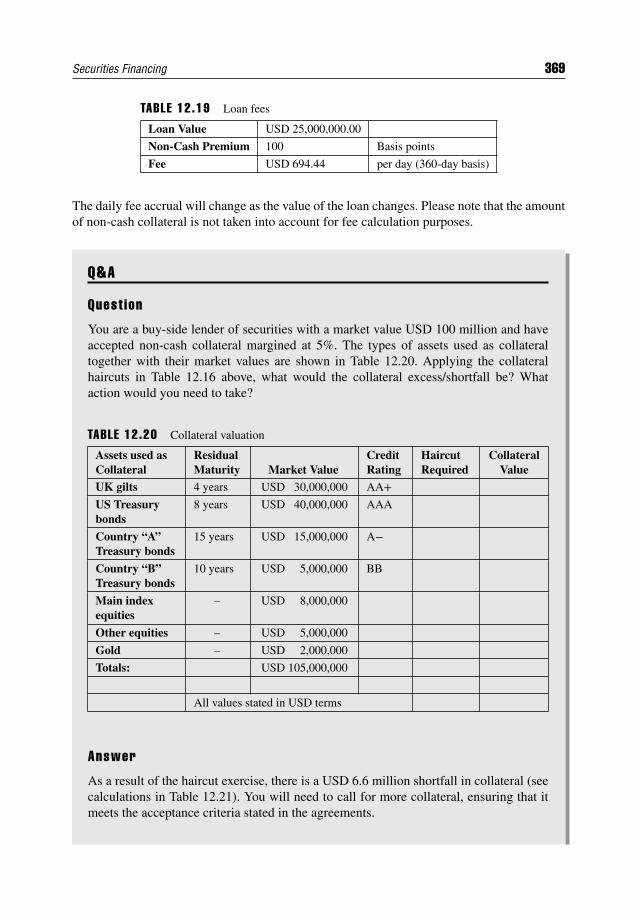
Securities Financing 369
TABLE 12.19 Loan fees
Loan Value USD 25,000,000.00
Non-Cash Premium 100 Basis points
Fee USD 694.44 per day (360-day basis)
The daily fee accrual will change as the value of the loan changes. Please note that the amountof non-cash collateral is not taken into account for fee calculation purposes.
Q&A
Quest ion
You are a buy-side lender of securities with a market value USD 100 million and haveaccepted non-cash collateral margined at 5%. The types of assets used as collateraltogether with their market values are shown in Table 12.20. Applying the collateralhaircuts in Table 12.16 above, what would the collateral excess/shortfall be? Whataction would you need to take?
TABLE 12.20 Collateral valuation
Assets used asCollateral
ResidualMaturity Market Value
CreditRating
HaircutRequired
CollateralValue
UK gilts 4 years USD 30,000,000 AA+US Treasurybonds
8 years USD 40,000,000 AAA
Country “A”Treasury bonds
15 years USD 15,000,000 A−
Country “B”Treasury bonds
10 years USD 5,000,000 BB
Main indexequities
– USD 8,000,000
Other equities – USD 5,000,000
Gold – USD 2,000,000
Totals: USD 105,000,000
All values stated in USD terms
Answer
As a result of the haircut exercise, there is a USD 6.6 million shortfall in collateral (seecalculations in Table 12.21). You will need to call for more collateral, ensuring that itmeets the acceptance criteria stated in the agreements.
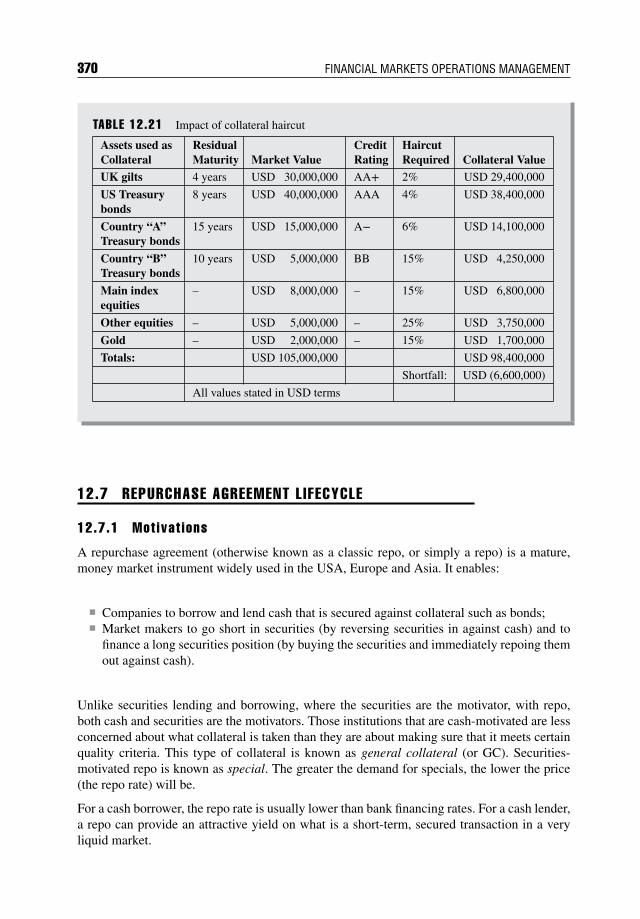
370 FINANCIAL MARKETS OPERATIONS MANAGEMENT
TABLE 12.21 Impact of collateral haircut
Assets used asCollateral
ResidualMaturity Market Value
CreditRating
HaircutRequired Collateral Value
UK gilts 4 years USD 30,000,000 AA+ 2% USD 29,400,000
US Treasurybonds
8 years USD 40,000,000 AAA 4% USD 38,400,000
Country “A”Treasury bonds
15 years USD 15,000,000 A− 6% USD 14,100,000
Country “B”Treasury bonds
10 years USD 5,000,000 BB 15% USD 4,250,000
Main indexequities
– USD 8,000,000 – 15% USD 6,800,000
Other equities – USD 5,000,000 – 25% USD 3,750,000
Gold – USD 2,000,000 – 15% USD 1,700,000
Totals: USD 105,000,000 USD 98,400,000
Shortfall: USD (6,600,000)
All values stated in USD terms
12.7 REPURCHASE AGREEMENT LIFECYCLE
12.7.1 Mot ivat ions
A repurchase agreement (otherwise known as a classic repo, or simply a repo) is a mature,money market instrument widely used in the USA, Europe and Asia. It enables:
Companies to borrow and lend cash that is secured against collateral such as bonds; Market makers to go short in securities (by reversing securities in against cash) and to
finance a long securities position (by buying the securities and immediately repoing themout against cash).
Unlike securities lending and borrowing, where the securities are the motivator, with repo,both cash and securities are the motivators. Those institutions that are cash-motivated are lessconcerned about what collateral is taken than they are about making sure that it meets certainquality criteria. This type of collateral is known as general collateral (or GC). Securities-motivated repo is known as special. The greater the demand for specials, the lower the price(the repo rate) will be.
For a cash borrower, the repo rate is usually lower than bank financing rates. For a cash lender,a repo can provide an attractive yield on what is a short-term, secured transaction in a veryliquid market.
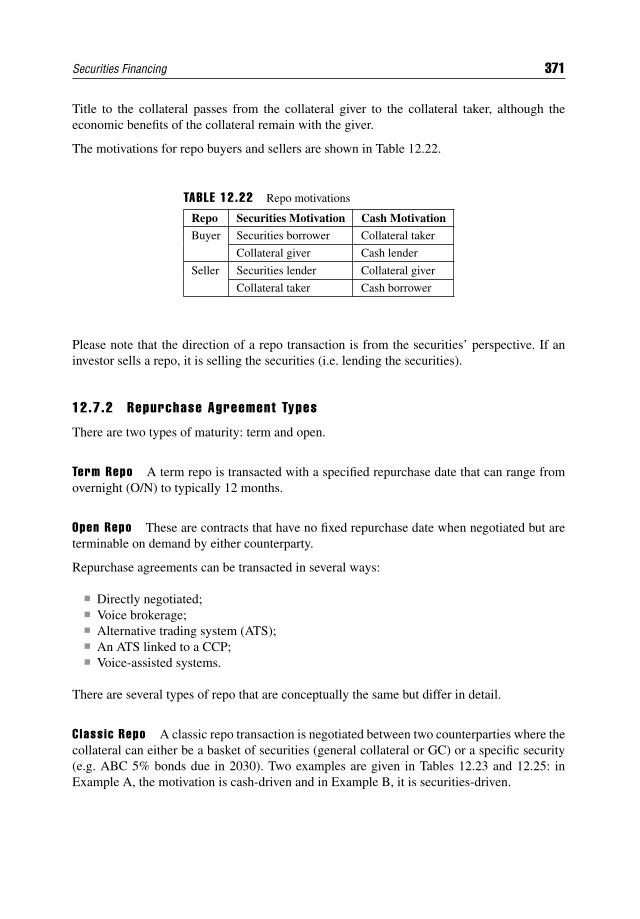
Securities Financing 371
Title to the collateral passes from the collateral giver to the collateral taker, although theeconomic benefits of the collateral remain with the giver.
The motivations for repo buyers and sellers are shown in Table 12.22.
TABLE 12.22 Repo motivations
Repo Securities Motivation Cash Motivation
Buyer Securities borrower Collateral taker
Collateral giver Cash lender
Seller Securities lender Collateral giver
Collateral taker Cash borrower
Please note that the direction of a repo transaction is from the securities’ perspective. If aninvestor sells a repo, it is selling the securities (i.e. lending the securities).
12.7.2 Repurchase Agreement Types
There are two types of maturity: term and open.
Term Repo A term repo is transacted with a specified repurchase date that can range fromovernight (O/N) to typically 12 months.
Open Repo These are contracts that have no fixed repurchase date when negotiated but areterminable on demand by either counterparty.
Repurchase agreements can be transacted in several ways:
Directly negotiated; Voice brokerage; Alternative trading system (ATS); An ATS linked to a CCP; Voice-assisted systems.
There are several types of repo that are conceptually the same but differ in detail.
Classic Repo A classic repo transaction is negotiated between two counterparties where thecollateral can either be a basket of securities (general collateral or GC) or a specific security(e.g. ABC 5% bonds due in 2030). Two examples are given in Tables 12.23 and 12.25: inExample A, the motivation is cash-driven and in Example B, it is securities-driven.
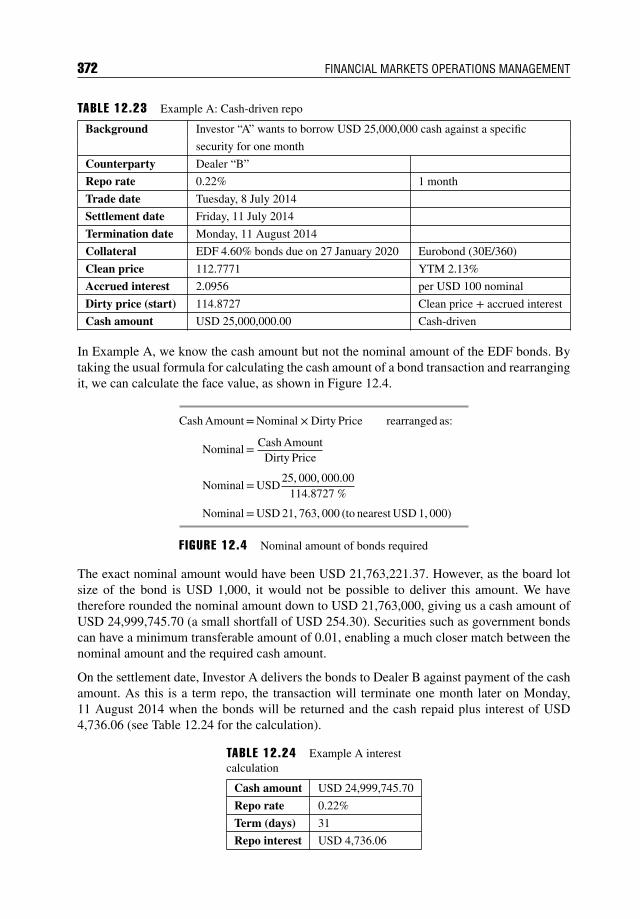
372 FINANCIAL MARKETS OPERATIONS MANAGEMENT
TABLE 12.23 Example A: Cash-driven repo
Background Investor “A” wants to borrow USD 25,000,000 cash against a specific
security for one month
Counterparty Dealer “B”
Repo rate 0.22% 1 month
Trade date Tuesday, 8 July 2014
Settlement date Friday, 11 July 2014
Termination date Monday, 11 August 2014
Collateral EDF 4.60% bonds due on 27 January 2020 Eurobond (30E/360)
Clean price 112.7771 YTM 2.13%
Accrued interest 2.0956 per USD 100 nominal
Dirty price (start) 114.8727 Clean price + accrued interest
Cash amount USD 25,000,000.00 Cash-driven
In Example A, we know the cash amount but not the nominal amount of the EDF bonds. Bytaking the usual formula for calculating the cash amount of a bond transaction and rearrangingit, we can calculate the face value, as shown in Figure 12.4.
Cash Amount=Nominal × Dirty Price rearranged as:
Nominal= Cash AmountDirty Price
Nominal=USD25, 000, 000.00
114.8727 %Nominal=USD 21, 763, 000 (to nearest USD 1, 000)
F IGURE 12.4 Nominal amount of bonds required
The exact nominal amount would have been USD 21,763,221.37. However, as the board lotsize of the bond is USD 1,000, it would not be possible to deliver this amount. We havetherefore rounded the nominal amount down to USD 21,763,000, giving us a cash amount ofUSD 24,999,745.70 (a small shortfall of USD 254.30). Securities such as government bondscan have a minimum transferable amount of 0.01, enabling a much closer match between thenominal amount and the required cash amount.
On the settlement date, Investor A delivers the bonds to Dealer B against payment of the cashamount. As this is a term repo, the transaction will terminate one month later on Monday,11 August 2014 when the bonds will be returned and the cash repaid plus interest of USD4,736.06 (see Table 12.24 for the calculation).
TABLE 12.24 Example A interestcalculation
Cash amount USD 24,999,745.70
Repo rate 0.22%
Term (days) 31
Repo interest USD 4,736.06
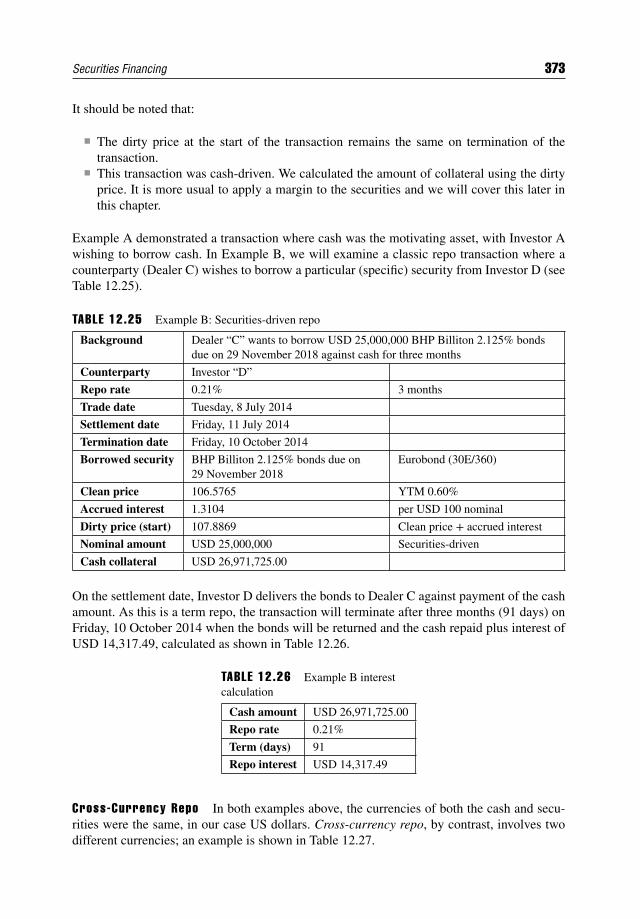
Securities Financing 373
It should be noted that:
The dirty price at the start of the transaction remains the same on termination of thetransaction.
This transaction was cash-driven. We calculated the amount of collateral using the dirtyprice. It is more usual to apply a margin to the securities and we will cover this later inthis chapter.
Example A demonstrated a transaction where cash was the motivating asset, with Investor Awishing to borrow cash. In Example B, we will examine a classic repo transaction where acounterparty (Dealer C) wishes to borrow a particular (specific) security from Investor D (seeTable 12.25).
TABLE 12.25 Example B: Securities-driven repo
Background Dealer “C” wants to borrow USD 25,000,000 BHP Billiton 2.125% bondsdue on 29 November 2018 against cash for three months
Counterparty Investor “D”
Repo rate 0.21% 3 months
Trade date Tuesday, 8 July 2014
Settlement date Friday, 11 July 2014
Termination date Friday, 10 October 2014
Borrowed security BHP Billiton 2.125% bonds due on29 November 2018
Eurobond (30E/360)
Clean price 106.5765 YTM 0.60%
Accrued interest 1.3104 per USD 100 nominal
Dirty price (start) 107.8869 Clean price + accrued interest
Nominal amount USD 25,000,000 Securities-driven
Cash collateral USD 26,971,725.00
On the settlement date, Investor D delivers the bonds to Dealer C against payment of the cashamount. As this is a term repo, the transaction will terminate after three months (91 days) onFriday, 10 October 2014 when the bonds will be returned and the cash repaid plus interest ofUSD 14,317.49, calculated as shown in Table 12.26.
TABLE 12.26 Example B interestcalculation
Cash amount USD 26,971,725.00
Repo rate 0.21%
Term (days) 91
Repo interest USD 14,317.49
Cross-Currency Repo In both examples above, the currencies of both the cash and secu-rities were the same, in our case US dollars. Cross-currency repo, by contrast, involves twodifferent currencies; an example is shown in Table 12.27.
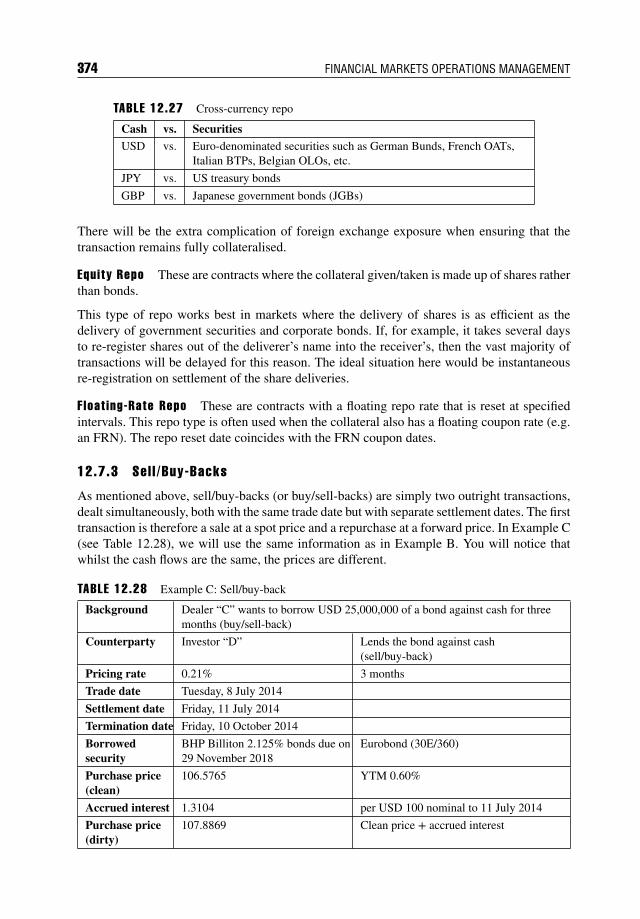
374 FINANCIAL MARKETS OPERATIONS MANAGEMENT
TABLE 12.27 Cross-currency repo
Cash vs. SecuritiesUSD vs. Euro-denominated securities such as German Bunds, French OATs,
Italian BTPs, Belgian OLOs, etc.
JPY vs. US treasury bonds
GBP vs. Japanese government bonds (JGBs)
There will be the extra complication of foreign exchange exposure when ensuring that thetransaction remains fully collateralised.
Equi ty Repo These are contracts where the collateral given/taken is made up of shares ratherthan bonds.
This type of repo works best in markets where the delivery of shares is as efficient as thedelivery of government securities and corporate bonds. If, for example, it takes several daysto re-register shares out of the deliverer’s name into the receiver’s, then the vast majority oftransactions will be delayed for this reason. The ideal situation here would be instantaneousre-registration on settlement of the share deliveries.
F loat ing-Rate Repo These are contracts with a floating repo rate that is reset at specifiedintervals. This repo type is often used when the collateral also has a floating coupon rate (e.g.an FRN). The repo reset date coincides with the FRN coupon dates.
12.7.3 Sel l /Buy-Backs
As mentioned above, sell/buy-backs (or buy/sell-backs) are simply two outright transactions,dealt simultaneously, both with the same trade date but with separate settlement dates. The firsttransaction is therefore a sale at a spot price and a repurchase at a forward price. In Example C(see Table 12.28), we will use the same information as in Example B. You will notice thatwhilst the cash flows are the same, the prices are different.
TABLE 12.28 Example C: Sell/buy-back
Background Dealer “C” wants to borrow USD 25,000,000 of a bond against cash for threemonths (buy/sell-back)
Counterparty Investor “D” Lends the bond against cash(sell/buy-back)
Pricing rate 0.21% 3 months
Trade date Tuesday, 8 July 2014
Settlement date Friday, 11 July 2014
Termination date Friday, 10 October 2014
Borrowedsecurity
BHP Billiton 2.125% bonds due on29 November 2018
Eurobond (30E/360)
Purchase price(clean)
106.5765 YTM 0.60%
Accrued interest 1.3104 per USD 100 nominal to 11 July 2014
Purchase price(dirty)
107.8869 Clean price + accrued interest
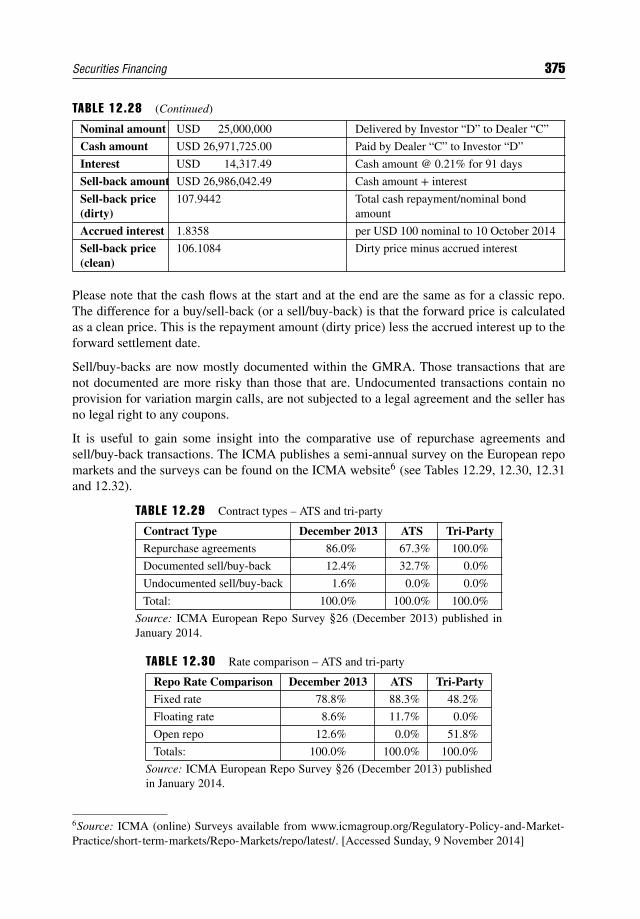
Securities Financing 375
TABLE 12.28 (Continued)
Nominal amount USD 25,000,000 Delivered by Investor “D” to Dealer “C”
Cash amount USD 26,971,725.00 Paid by Dealer “C” to Investor “D”
Interest USD 14,317.49 Cash amount @ 0.21% for 91 days
Sell-back amount USD 26,986,042.49 Cash amount + interest
Sell-back price(dirty)
107.9442 Total cash repayment/nominal bondamount
Accrued interest 1.8358 per USD 100 nominal to 10 October 2014
Sell-back price(clean)
106.1084 Dirty price minus accrued interest
Please note that the cash flows at the start and at the end are the same as for a classic repo.The difference for a buy/sell-back (or a sell/buy-back) is that the forward price is calculatedas a clean price. This is the repayment amount (dirty price) less the accrued interest up to theforward settlement date.
Sell/buy-backs are now mostly documented within the GMRA. Those transactions that arenot documented are more risky than those that are. Undocumented transactions contain noprovision for variation margin calls, are not subjected to a legal agreement and the seller hasno legal right to any coupons.
It is useful to gain some insight into the comparative use of repurchase agreements andsell/buy-back transactions. The ICMA publishes a semi-annual survey on the European repomarkets and the surveys can be found on the ICMA website6 (see Tables 12.29, 12.30, 12.31and 12.32).
TABLE 12.29 Contract types – ATS and tri-party
Contract Type December 2013 ATS Tri-Party
Repurchase agreements 86.0% 67.3% 100.0%
Documented sell/buy-back 12.4% 32.7% 0.0%
Undocumented sell/buy-back 1.6% 0.0% 0.0%
Total: 100.0% 100.0% 100.0%
Source: ICMA European Repo Survey §26 (December 2013) published inJanuary 2014.
TABLE 12.30 Rate comparison – ATS and tri-party
Repo Rate Comparison December 2013 ATS Tri-Party
Fixed rate 78.8% 88.3% 48.2%
Floating rate 8.6% 11.7% 0.0%
Open repo 12.6% 0.0% 51.8%
Totals: 100.0% 100.0% 100.0%
Source: ICMA European Repo Survey §26 (December 2013) publishedin January 2014.
6Source: ICMA (online) Surveys available from www.icmagroup.org/Regulatory-Policy-and-Market-Practice/short-term-markets/Repo-Markets/repo/latest/. [Accessed Sunday, 9 November 2014]
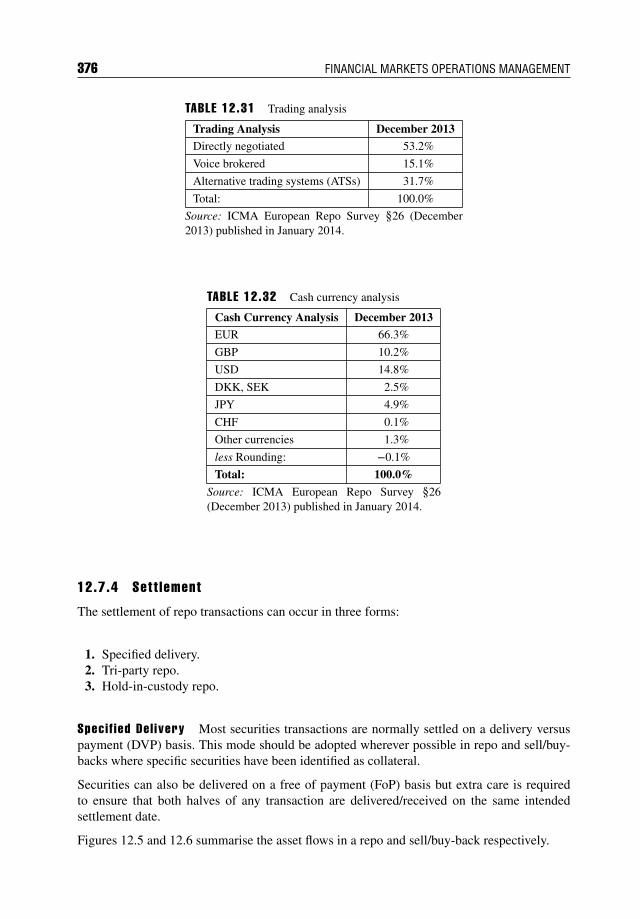
376 FINANCIAL MARKETS OPERATIONS MANAGEMENT
TABLE 12.31 Trading analysis
Trading Analysis December 2013Directly negotiated 53.2%
Voice brokered 15.1%
Alternative trading systems (ATSs) 31.7%
Total: 100.0%
Source: ICMA European Repo Survey §26 (December2013) published in January 2014.
TABLE 12.32 Cash currency analysis
Cash Currency Analysis December 2013EUR 66.3%
GBP 10.2%
USD 14.8%
DKK, SEK 2.5%
JPY 4.9%
CHF 0.1%
Other currencies 1.3%
less Rounding: −0.1%
Total: 100.0%
Source: ICMA European Repo Survey §26(December 2013) published in January 2014.
12.7.4 Sett lement
The settlement of repo transactions can occur in three forms:
1. Specified delivery.2. Tri-party repo.3. Hold-in-custody repo.
Speci f ied Del ivery Most securities transactions are normally settled on a delivery versuspayment (DVP) basis. This mode should be adopted wherever possible in repo and sell/buy-backs where specific securities have been identified as collateral.
Securities can also be delivered on a free of payment (FoP) basis but extra care is requiredto ensure that both halves of any transaction are delivered/received on the same intendedsettlement date.
Figures 12.5 and 12.6 summarise the asset flows in a repo and sell/buy-back respectively.
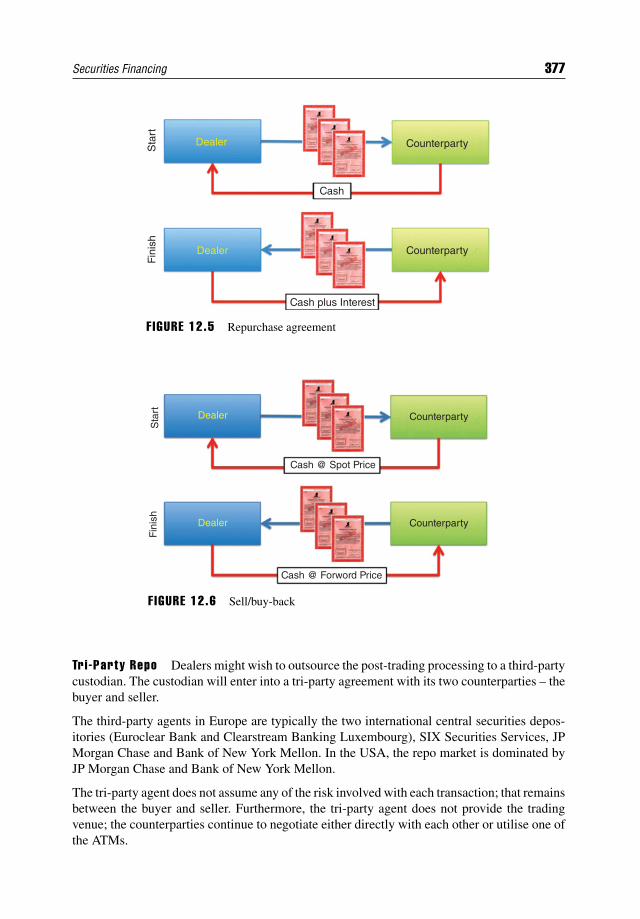
Securities Financing 377
Dealer
Dealer
Fin
ish
Sta
rt
Cash plus Interest
Counterparty
Counterparty
Cash
F IGURE 12.5 Repurchase agreement
Dealer
Dealer
Fin
ish
Sta
rt
Cash @ Forword Price
Counterparty
Counterparty
Cash @ Spot Price
F IGURE 12.6 Sell/buy-back
Tri -Party Repo Dealers might wish to outsource the post-trading processing to a third-partycustodian. The custodian will enter into a tri-party agreement with its two counterparties – thebuyer and seller.
The third-party agents in Europe are typically the two international central securities depos-itories (Euroclear Bank and Clearstream Banking Luxembourg), SIX Securities Services, JPMorgan Chase and Bank of New York Mellon. In the USA, the repo market is dominated byJP Morgan Chase and Bank of New York Mellon.
The tri-party agent does not assume any of the risk involved with each transaction; that remainsbetween the buyer and seller. Furthermore, the tri-party agent does not provide the tradingvenue; the counterparties continue to negotiate either directly with each other or utilise one ofthe ATMs.
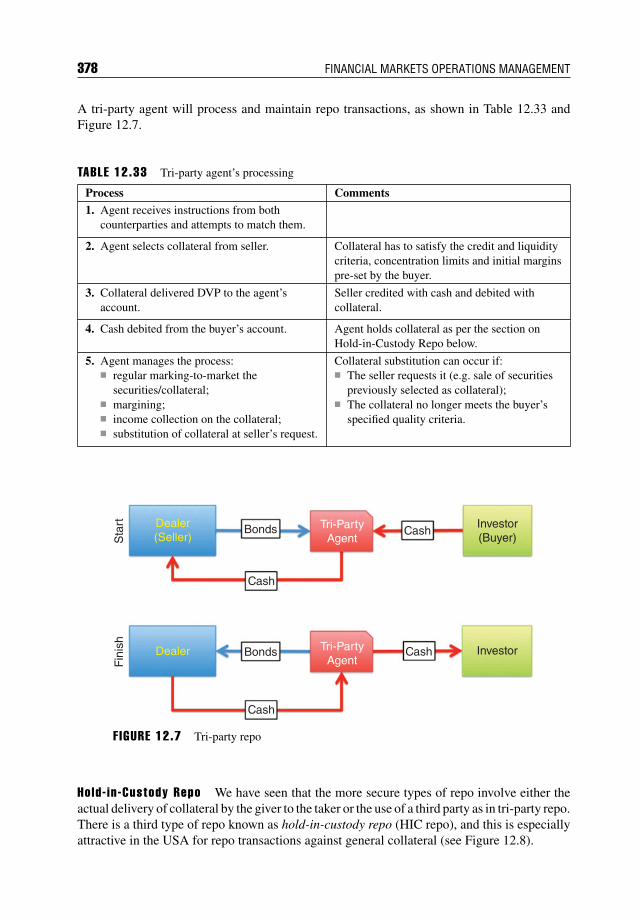
378 FINANCIAL MARKETS OPERATIONS MANAGEMENT
A tri-party agent will process and maintain repo transactions, as shown in Table 12.33 andFigure 12.7.
TABLE 12.33 Tri-party agent’s processing
Process Comments1. Agent receives instructions from both
counterparties and attempts to match them.
2. Agent selects collateral from seller. Collateral has to satisfy the credit and liquiditycriteria, concentration limits and initial marginspre-set by the buyer.
3. Collateral delivered DVP to the agent’saccount.
Seller credited with cash and debited withcollateral.
4. Cash debited from the buyer’s account. Agent holds collateral as per the section onHold-in-Custody Repo below.
5. Agent manages the process: regular marking-to-market the
securities/collateral; margining; income collection on the collateral; substitution of collateral at seller’s request.
Collateral substitution can occur if: The seller requests it (e.g. sale of securities
previously selected as collateral); The collateral no longer meets the buyer’s
specified quality criteria.
Dealer(Seller)
Dealer
Fin
ish
Sta
rt
Cash
Cash
Cash
CashBonds
Bonds
Investor
Investor(Buyer)
Tri-PartyAgent
Tri-PartyAgent
F IGURE 12.7 Tri-party repo
Hold- in -Custody Repo We have seen that the more secure types of repo involve either theactual delivery of collateral by the giver to the taker or the use of a third party as in tri-party repo.There is a third type of repo known as hold-in-custody repo (HIC repo), and this is especiallyattractive in the USA for repo transactions against general collateral (see Figure 12.8).
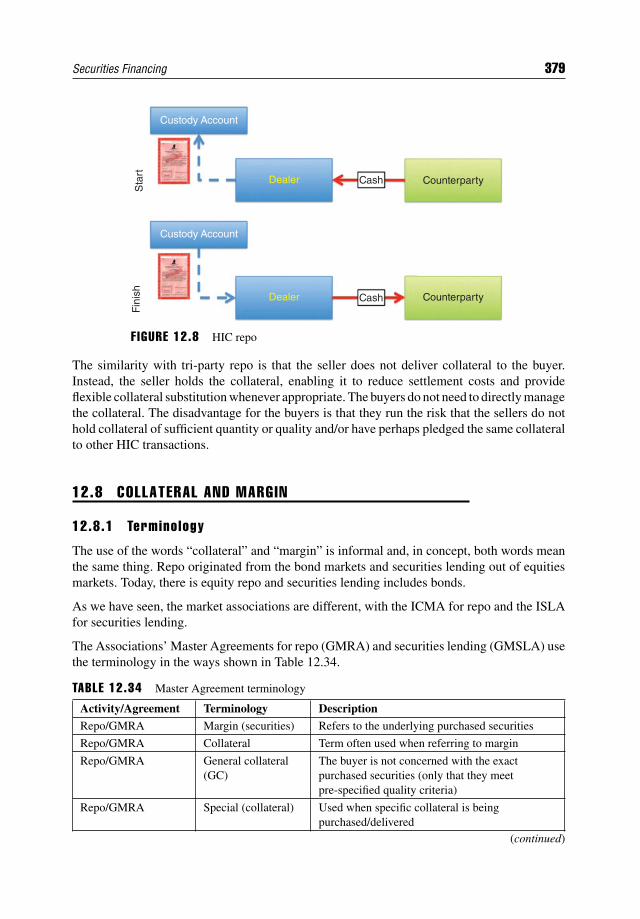
Securities Financing 379
Dealer
Dealer
Fin
ish
Sta
rt
Counterparty
Counterparty
Custody Account
Custody Account
Cash
Cash
F IGURE 12.8 HIC repo
The similarity with tri-party repo is that the seller does not deliver collateral to the buyer.Instead, the seller holds the collateral, enabling it to reduce settlement costs and provideflexible collateral substitution whenever appropriate. The buyers do not need to directly managethe collateral. The disadvantage for the buyers is that they run the risk that the sellers do nothold collateral of sufficient quantity or quality and/or have perhaps pledged the same collateralto other HIC transactions.
12.8 COLLATERAL AND MARGIN
12.8.1 Terminology
The use of the words “collateral” and “margin” is informal and, in concept, both words meanthe same thing. Repo originated from the bond markets and securities lending out of equitiesmarkets. Today, there is equity repo and securities lending includes bonds.
As we have seen, the market associations are different, with the ICMA for repo and the ISLAfor securities lending.
The Associations’ Master Agreements for repo (GMRA) and securities lending (GMSLA) usethe terminology in the ways shown in Table 12.34.
TABLE 12.34 Master Agreement terminology
Activity/Agreement Terminology Description
Repo/GMRA Margin (securities) Refers to the underlying purchased securities
Repo/GMRA Collateral Term often used when referring to margin
Repo/GMRA General collateral(GC)
The buyer is not concerned with the exactpurchased securities (only that they meetpre-specified quality criteria)
Repo/GMRA Special (collateral) Used when specific collateral is beingpurchased/delivered
(continued)
380 FINANCIAL MARKETS OPERATIONS MANAGEMENT
TABLE 12.34 (Continued)
Activity/Agreement Terminology DescriptionSecuritieslending/GMSLA
Collateral Refers to assets that the borrower provides to thelender in order to collateralise the loan
Securitieslending/GMSLA
Margin Difference between the value of the collateral andthe value of the loan (e.g. by 5%)
Repo and securitieslending
Haircut This is a discount to the market value of thesecurities and acts as a risk cushion. For example,if a 3% haircut is applied to a security worth USD100, the collateral value is USD 97.
Whilst there are differences between the GMRA (2011) and the GMSLA (2010), many ofthe core provisions are similar from a contractual perspective (e.g. with default events andclose-out netting provisions).
12.8.2 Types of Col lateral
The ideal type of collateral should have no credit exposure and should be highly liquid. Pricediscovery for this collateral should be certain, it should be easy to sell and quick to obtain thecash proceeds.
Q&A
Quest ion
With these characteristics, what type of asset would match this ideal?
Answer
The ideal type of collateral would be a highly liquid, AAA-rated7 government security,traded on an exchange and settled on a T+0 basis. Cash also makes an attractivealternative.
12.8.3 Repurchase Agreements (and Sel l /Buy-Backs)
The most commonly used types of collateral are securities issued by creditworthy centralgovernments, government-guaranteed agency debt and bonds issued by the supranationalinstitutions (e.g. the World Bank). In securities-driven repo, cash is the collateral.
7Refer to Appendix 12.1 for the ratings issued by the credit rating agencies together with their meanings.
Securities Financing 381
Other types of collateral can include the following:
Delivery by value (DBV) (see below for more details); Corporate bonds (typically senior unsecured debt); Covered bonds (e.g. German pfandbrief); Equities (especially shares that are major index constituents, e.g. S&P 500); Convertible bonds; Money market securities (e.g. treasury bills, certificates of deposit and commercial paper); Bank loans (these should be transferable); Asset-backed securities (ABS); Structured securities such as collateralised debt obligations (CDOs), collateralised loan
obligations (CLOs), credit-linked notes (CLNs), etc.; Residential and commercial mortgage-backed securities (RMBS and CMBS); Gold.
Remember that collateral in the context of repo is divided into general collateral and specials.
12.8.4 Securit ies Lending
Eligible collateral that is acceptable includes many of the types listed above:
Cash; Government securities; Corporate bonds; Convertible bonds; Equities (especially constituents of major indices); Letters of credit; Money market instruments (e.g. certificates of deposit); Warrants; Delivery by value (DBV).
Remember that collateral in the context of securities lending is divided into cash collateral andnon-cash collateral.
12.8.5 Del ivery by Value (DBV)
We noted above that one particular type of eligible collateral for all three versions of securitiesfinancing was delivery by value. DBV was designed as an alternative form of collateral tocash; in other words, in the form of non-cash collateral.
Without DBV, the collateral giver would have to select securities from its securities portfolioand have them delivered to the collateral taker. This involves submitting delivery instructionsto the appropriate clearing house. With DBV, however, the collateral giver instructs its clearinghouse to assemble a package of securities up to a specified value and quality. The DBV packageis then delivered by the clearing house to the collateral taker.
In terms of the quality of the securities contained within the DBV package, there are 29securities categories with a wide range of credit quality and geographical breadth. Someexamples are shown in Table 12.35.
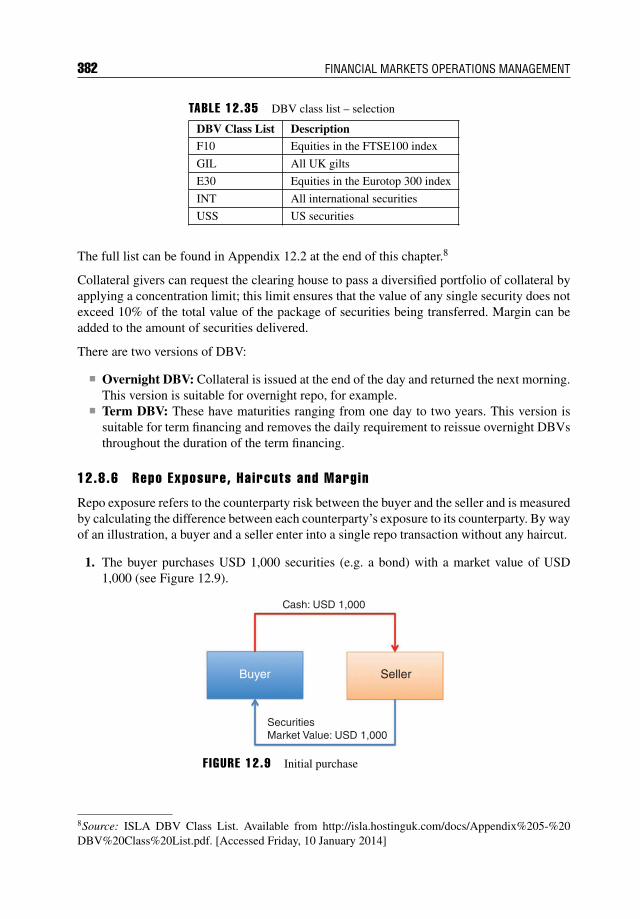
382 FINANCIAL MARKETS OPERATIONS MANAGEMENT
TABLE 12.35 DBV class list – selection
DBV Class List DescriptionF10 Equities in the FTSE100 index
GIL All UK gilts
E30 Equities in the Eurotop 300 index
INT All international securities
USS US securities
The full list can be found in Appendix 12.2 at the end of this chapter.8
Collateral givers can request the clearing house to pass a diversified portfolio of collateral byapplying a concentration limit; this limit ensures that the value of any single security does notexceed 10% of the total value of the package of securities being transferred. Margin can beadded to the amount of securities delivered.
There are two versions of DBV:
Overnight DBV: Collateral is issued at the end of the day and returned the next morning.This version is suitable for overnight repo, for example.
Term DBV: These have maturities ranging from one day to two years. This version issuitable for term financing and removes the daily requirement to reissue overnight DBVsthroughout the duration of the term financing.
12.8.6 Repo Exposure, Haircuts and Margin
Repo exposure refers to the counterparty risk between the buyer and the seller and is measuredby calculating the difference between each counterparty’s exposure to its counterparty. By wayof an illustration, a buyer and a seller enter into a single repo transaction without any haircut.
1. The buyer purchases USD 1,000 securities (e.g. a bond) with a market value of USD1,000 (see Figure 12.9).
SellerBuyer
SecuritiesMarket Value: USD 1,000
Cash: USD 1,000
F IGURE 12.9 Initial purchase
8Source: ISLA DBV Class List. Available from http://isla.hostinguk.com/docs/Appendix%205-%20DBV%20Class%20List.pdf. [Accessed Friday, 10 January 2014]
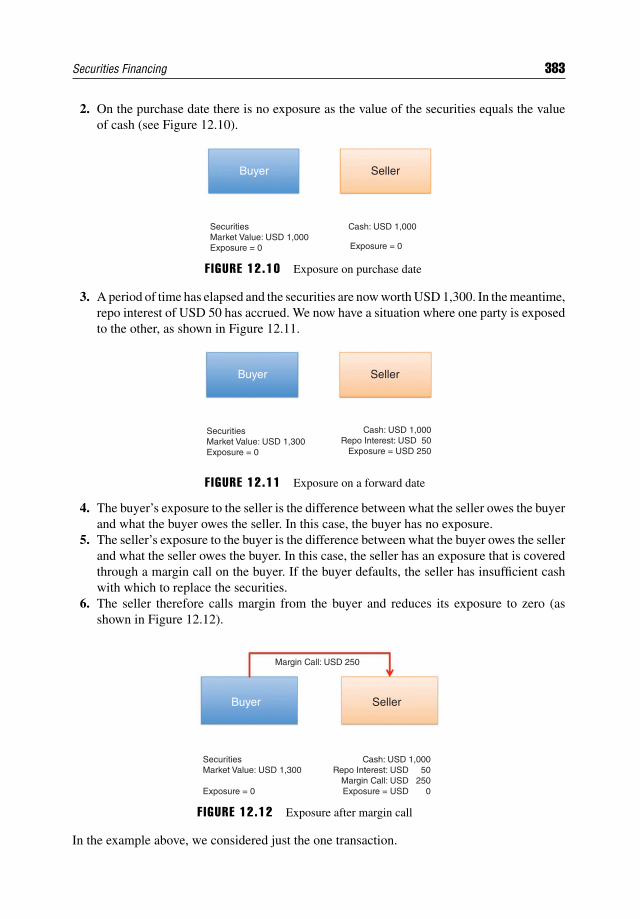
Securities Financing 383
2. On the purchase date there is no exposure as the value of the securities equals the valueof cash (see Figure 12.10).
Buyer Seller
SecuritiesMarket Value: USD 1,000Exposure = 0
Cash: USD 1,000
Exposure = 0
F IGURE 12.10 Exposure on purchase date
3. A period of time has elapsed and the securities are now worth USD 1,300. In the meantime,repo interest of USD 50 has accrued. We now have a situation where one party is exposedto the other, as shown in Figure 12.11.
Buyer Seller
SecuritiesMarket Value: USD 1,300Exposure = 0
Cash: USD 1,000Repo Interest: USD 50
Exposure = USD 250
F IGURE 12.11 Exposure on a forward date
4. The buyer’s exposure to the seller is the difference between what the seller owes the buyerand what the buyer owes the seller. In this case, the buyer has no exposure.
5. The seller’s exposure to the buyer is the difference between what the buyer owes the sellerand what the seller owes the buyer. In this case, the seller has an exposure that is coveredthrough a margin call on the buyer. If the buyer defaults, the seller has insufficient cashwith which to replace the securities.
6. The seller therefore calls margin from the buyer and reduces its exposure to zero (asshown in Figure 12.12).
Buyer Seller
SecuritiesMarket Value: USD 1,300
Exposure = 0
Margin Call: USD 250
Cash: USD 1,000Repo Interest: USD 50
Margin Call: USD 250Exposure = USD 0
F IGURE 12.12 Exposure after margin call
In the example above, we considered just the one transaction.
384 FINANCIAL MARKETS OPERATIONS MANAGEMENT
Q&A
Quest ion
If you had entered into a number of transactions (both purchases and sales) with anothercounterparty, would you make these exposure calculations for each and every transac-tion?
Answer
In theory, there is no reason why not; indeed, you could make separate margin pay-ments/receipts for each transaction as well. This would certainly result in a large numberof payments! A more efficient way would be to look at your net exposure to each ofyour various counterparties.
In order to calculate your net exposure you would need to take into account the following:
All cash paid to or by the counterparty plus any accrued interest on that cash, plus The value of all securities transferred to or by the counterparty, and Any coupons that have been paid by the issuer but have not yet been repaid by or to the
counterparty (i.e. manufactured coupons due).
12.9 DEFAULT AND CLOSE-OUT PROVIS IONS
12.9.1 Introduct ion
We have seen in this chapter that securities financing consists of collateralised lending transac-tions of one form or another. Collateralisation is one of the tools used to mitigate counterpartyrisk (i.e. the risk that one or other of the counterparties defaults). The use of master agreements,haircuts and margin also helps in this process.
The master agreements for repo and securities lending contain provisions for unwindingtransactions should a default occur. First, though, we need to know what event(s) could causea default.
12.9.2 Event of Defaul t
Both agreements contain similar descriptions of what constitutes an event of default. You willfind a summary of the events in each agreement’s Section 10.
2010 GMSLA (as Amended in July 2012)
Please refer to Section 10: Events of Default (pp. 18–19) and Section 11: Consequences of anEvent of Default (pp. 19–23).
Securities Financing 385
The following situations constitute an event of default:
Failure to pay or repay cash collateral or deliver non-cash collateral; Failure to comply with manufactured dividend obligations; Failure to deliver equivalent securities or equivalent collateral; Act of insolvency of lender or borrower; Incorrect or untrue warranties; Admission of inability/unwillingness to perform obligations under the agreement; Regulatory involvement where a material part of the assets is transferred pursuant to
legislation; Declaration of default or expulsion from a securities exchange, failure to meet financial
resource requirements; Failure to remedy within 30 days any failure to perform other obligations under the
agreement.
2011 GMRA
Please refer to Section 10 (a): Events of Default (pp. 17–18).
The following situations constitute an event of default:
Failure to pay the purchase price or the repurchase price on the applicable date; Failure to deliver purchased securities on the purchase date or equivalent securities on the
repurchase date within the normal settlement period; Failure to pay any sum when due; Failure to make a margin transfer on time; Failure to pay income payments when due; Act of insolvency of buyer or seller; Incorrect or untrue representations made by buyer or seller; Admission of inability/unwillingness to perform obligations under the agreement; Declaration of default or expulsion from a securities exchange, failure to meet financial
resource requirements; Failure to remedy within 30 days any failure to perform other obligations under the
agreement.
12.9.3 Consequences of an Event of Defaul t
There are similarities in the way in which the obligations between buyer/seller (GMRA) andlender/borrower (GMSLA) are treated. Of the two parties involved, one will be the defaultingparty and the other the non-defaulting party. The first step will be the delivery of a defaultnotice by the non-defaulting party to the defaulting party.
Should an event of default occur, both parties’ payment and delivery obligations to each otherare replaced by a single obligation of one party to pay a cash sum to the other. It is thenon-defaulting party that determines the amount of cash payable by determining the marketvalue (referred to as the default market value) of deliverable and receivable securities togetherwith cash collateral and any other cash.
This reduction of all the obligations into one single obligation is a key element of the agreement,as this netting should ensure that that the non-defaulting party receives or pays the correct
386 FINANCIAL MARKETS OPERATIONS MANAGEMENT
amount. Netting also helps to prevent the defaulting party from utilising some of the collateralto offset other obligations.
You can refer to the actual agreements for more details:
2010 GMSLA (as amended July 2012) – Paragraph 11: Consequences of an Event ofDefault (pp. 19–23).
2011 GMRA – Paragraph 10 (b) to (g) and (j) to (n) (pp. 18–24).
12.10 CENTRAL COUNTERPARTY (CCP) SERVICES
12.10.1 Introduct ion
We looked at clearing houses and CCPs in Chapter 5 and noted their key role in the post-tradeenvironment. Not all of these provide specialist services for securities financing, although thissituation is changing.
Except for transactions that are executed using the alternative trading systems (ATS), securitiesfinancing has been an OTC product with bilateral negotiation. The post-transaction process-ing was predominantly managed in-house using internal systems and/or external, third-partysolutions.9
The clearing houses and CCPs would be involved at the delivery and payment stages; infact, the clearing houses may not necessarily have been aware of the purpose of deliveryand payment. This situation has changed and continues to evolve, with regulatory demandsfor OTC transactions to be cleared centrally. This results in the clearing houses and CCPsbecoming involved much sooner after a transaction.
In this final section we will take a look at three CCPs and the two international CSDs thatoperate in this business:
The Options Clearing Corporation (CCP) – www.theocc.com Eurex Clearing (CCP) – www.eurexclearing.com LCH.Clearnet (CCP) – www.lchclearnet.com Clearstream Banking Luxembourg (ICSD) – www.clearstream.com Euroclear Bank (ICSD) – www.euroclear.com
12.10.2 The Opt ions Clearing Corporat ion (OCC)
The OCC manages two programmes in which it acts as a CCP on behalf of its clearingmembers:
1. Stock Loan/Hedge Programme: This programme allows lenders and borrowers to nego-tiate bilaterally and send their instructions to the OCC, where they are processed throughDTC’s systems. Settlement takes place at the DTC with the OCC managing the mark-to-market processing, margin requirements and reporting. DTC handles any corporateactions.
9Refer to Appendix 12.3 for a list of vendors and their website URLs.
Securities Financing 387
2. Market Loan Programme: Similar to the StockLoan/Hedge Programme above, thisprogramme differs insofar as the OCC is acting as a clearer for transactions executed onAQS, an automated marketplace for securities lending and borrowing. Loans executed onAQS are processed through the OCC acting as a CCP.
12.10.3 Eurex Clearing
Eurex Clearing offers CCP services for both securities lending and repo transactions.
Lending CCP service: Participants can execute transactions either bilaterally on elec-tronic trading platforms such as SL-X (www.sl-x.com) and Pirum (www.pirum.com).Clearing services for loans in equities, fixed-income securities and ETFs in theEuropean markets are covered. Cash collateral (USD and EUR) and non-cash collat-eral are accepted. Non-cash collateral includes the following securities types: Bonds issued by the major central governments (e.g. USA, Japan and Luxembourg,
etc.); Bonds issued by the supranationals (e.g. EBRD, IBRD, EIB, etc.); Bonds issued by the European Central Bank and Swiss National Bank; Repo-eligible corporate bonds (AAA to BBB); Equities listed in the major indices from Europe, Asia-Pacific and North America (e.g.
CAC40 – France, S&P ASX20 – Australia and S&P TSX60 – Canada); Selected ETFs. (NB: Structured bonds are excluded.)
Euro repo market: Participants can trade anonymously in both general collateral andspecials segments with Eurex Clearing acting as a CCP. There are some 5,000 EUR-denominated fixed-income securities (divided into 21 different baskets) available for repotrading in both segments. The available securities consist of: European government bonds; Jumbo-Pfandbriefe and Pfandbriefe; KfW/Laender bonds; European covered bonds; Agency bonds; European corporate bonds.
GC pooling market: This market operates an open order book that provides participantswishing to obtain secured USD and EUR funding with anonymous trading. Eurex Clearingwill process the transactions and enable participants to re-use collateral for further moneymarket transactions. Participants can select collateral from standardised baskets of fixedincome and equities that are tradable in USD and EUR.
12.10.4 LCH.Clearnet
LCH.Clearnet clears repo trades through its RepoClear service. It accepts classic fixed-raterepos with first leg settlement on T+0 or with a forward start with a term of up to 12 months.RepoClear clears transactions in the following government bond markets:
Austria Belgium
388 FINANCIAL MARKETS OPERATIONS MANAGEMENT
Finland Germany Ireland Portugal Slovakia Slovenia Spain United Kingdom German Jumbo-Pfandbriefe Supranationals, agency and sovereign bonds.
RepoClear can accept transactions executed directly, by voice broker and screen tradingsystems (ATSs) with LCH.Clearnet assuming the counterparty risk through novation.
For transactions that are delivery settled, RepoClear nets all deliveries due for next-daysettlement, resulting in one delivery of securities against a single payment. Settlement nettingmight result in multiple deliveries depending on cross-border settlement requirements or limitson the maximum delivery size.
Where no actual bond delivery takes place, the cash amounts from both ATS-and bilaterally-traded transactions are netted out per currency and paid through the protected payments system(PPS).
12.10.5 Clearstream Banking Luxembourg (CBL)
CBL manages two automated securities lending services for participants and manages all theadministrative activities:
Automated Securities Lending and Borrowing (ASL): CBL automatically identifiesASL lenders’ available positions and attempts to cover ASL borrowers’ failed trades. CBLacts as a lending agent, collateral agent and guarantor so that the lenders and borrowersare unknown to each other. As soon as the borrowers’ failed trades have settled, CBLreturns the bonds to the lender. If the lenders subsequently sell their loaned bonds, CBLrecalls them.CBL also provides a case-by-case variation of ASL allowing participants to managetheir own strategies (e.g. a participant might choose to delay borrowing to cover a failedtransaction).Collateral is pledged to CBL as guarantor and its quality and quantity monitored by CBLon a daily basis.
Securities Lending Services (ASLplus): If ASL is a short-term fails prevention toolfor the participants’ Operations departments, ASLplus is geared to borrowers wishing toconsider longer-term opportunities and lenders wishing to maximise the returns on theirportfolios. CBL acts as principal borrower, typically lending to proprietary desks, repodesks and other intermediaries (i.e. the Front Office).
12.10.6 Euroclear Bank
Euroclear enables its participants to manage their settlement fails by automatically borrowingsufficient bonds from lenders in order to settle the transactions. Acting as agent, Euroclear
Securities Financing 389
identifies the borrowing requirements, administers the asset servicing and manages recalls asthey are needed.
Participants can tailor their participation in the lending programme by excluding certain assetclasses or individual securities (e.g. lending only USD-denominated Eurobonds, excludingbonds issued by a particular issuer). The provision and revaluation of collateral is also managedby Euroclear.
12.11 SUMMARY
Securities financing is a powerful tool that allows us to perform a variety of activities:
Manage our settlement fails; Optimise our long securities positions; Borrow and lend cash on a secured basis; Implement trading strategies that require us to borrow securities.
Securities lending, repurchase agreements and sell/buy-backs are the three types of securitiesfinancing. Securities lending is primarily driven by the need to borrow securities using eithercash or non-cash collateral as security.
Repo and sell/buy-back are driven by the need to either borrow cash (using margined securitiesas collateral) or lend specific securities (specials) using cash as collateral.
By contrast, reverse repo and buy/sell-back are driven by the need to either lend cash or borrowspecific securities.
There can be some confusion in terminology, for example, on “margin”, “haircuts”, etc. Margingenerally refers to the difference between the value of the loan and the collateral that securesit. So, if the loan is worth USD 100.00, the collateral should be worth, say, USD 105.00 andthis “gap” should always be 5% in this example.
A haircut considers the collateral value of an asset rather than its market value. So, a bondwith a market value of USD 1,000.00 might have a 2% haircut; its collateral value will belower, i.e. USD 980.00.
Traditionally, securities financing was an OTC product with transactions dealt off-exchange,deliveries made by each counterparty and each responsible for monitoring the transactions(income, mark-to-market, corporate actions, etc.) and calling or returning collateral as needed.Today, we see CCPs playing an active role as quasi-exchange and clearer/administrator and theICSDs offering automated, automatic lending and borrowing services, with the ICSDs actingin the middle as agent between the lenders and borrowers.
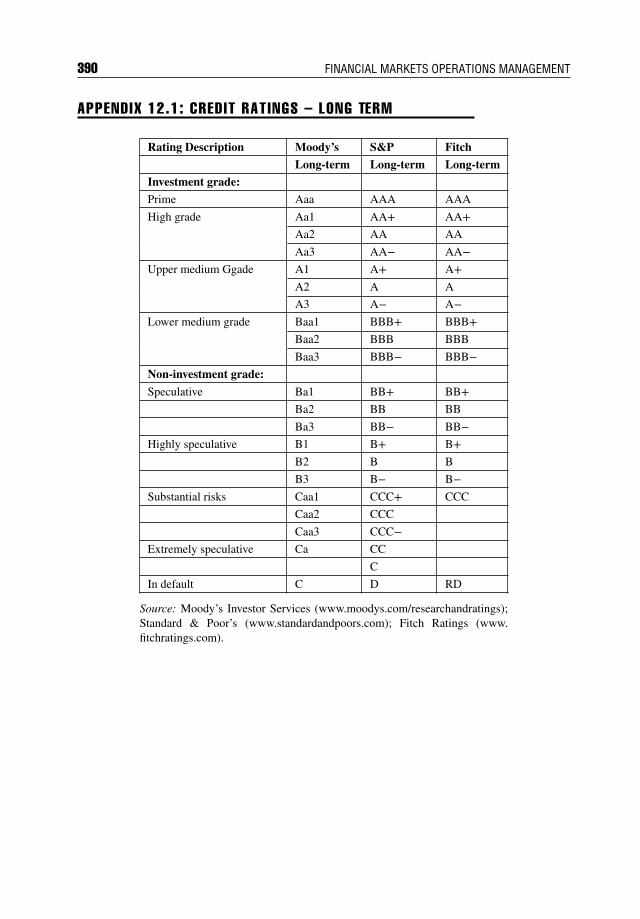
390 FINANCIAL MARKETS OPERATIONS MANAGEMENT
APPENDIX 12.1: CREDIT RATINGS – LONG TERM
Rating Description Moody’s S&P Fitch
Long-term Long-term Long-term
Investment grade:
Prime Aaa AAA AAA
High grade Aa1 AA+ AA+Aa2 AA AA
Aa3 AA− AA−Upper medium Ggade A1 A+ A+
A2 A A
A3 A− A−Lower medium grade Baa1 BBB+ BBB+
Baa2 BBB BBB
Baa3 BBB− BBB−Non-investment grade:
Speculative Ba1 BB+ BB+Ba2 BB BB
Ba3 BB− BB−Highly speculative B1 B+ B+
B2 B B
B3 B− B−Substantial risks Caa1 CCC+ CCC
Caa2 CCC
Caa3 CCC−Extremely speculative Ca CC
C
In default C D RD
Source: Moody’s Investor Services (www.moodys.com/researchandratings);Standard & Poor’s (www.standardandpoors.com); Fitch Ratings (www.fitchratings.com).
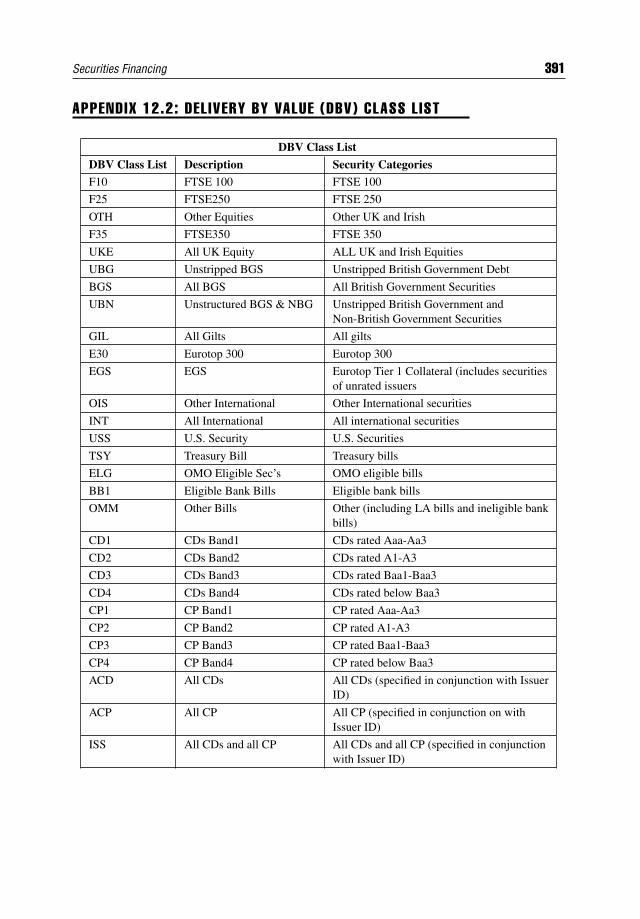
Securities Financing 391
APPENDIX 12.2: DEL IVERY BY VALUE (DBV) CLASS LIST
DBV Class List
DBV Class List Description Security Categories
F10 FTSE 100 FTSE 100
F25 FTSE250 FTSE 250
OTH Other Equities Other UK and Irish
F35 FTSE350 FTSE 350
UKE All UK Equity ALL UK and Irish Equities
UBG Unstripped BGS Unstripped British Government Debt
BGS All BGS All British Government Securities
UBN Unstructured BGS & NBG Unstripped British Government andNon-British Government Securities
GIL All Gilts All gilts
E30 Eurotop 300 Eurotop 300
EGS EGS Eurotop Tier 1 Collateral (includes securitiesof unrated issuers
OIS Other International Other International securities
INT All International All international securities
USS U.S. Security U.S. Securities
TSY Treasury Bill Treasury bills
ELG OMO Eligible Sec’s OMO eligible bills
BB1 Eligible Bank Bills Eligible bank bills
OMM Other Bills Other (including LA bills and ineligible bankbills)
CD1 CDs Band1 CDs rated Aaa-Aa3
CD2 CDs Band2 CDs rated A1-A3
CD3 CDs Band3 CDs rated Baa1-Baa3
CD4 CDs Band4 CDs rated below Baa3
CP1 CP Band1 CP rated Aaa-Aa3
CP2 CP Band2 CP rated A1-A3
CP3 CP Band3 CP rated Baa1-Baa3
CP4 CP Band4 CP rated below Baa3
ACD All CDs All CDs (specified in conjunction with IssuerID)
ACP All CP All CP (specified in conjunction on withIssuer ID)
ISS All CDs and all CP All CDs and all CP (specified in conjunctionwith Issuer ID)
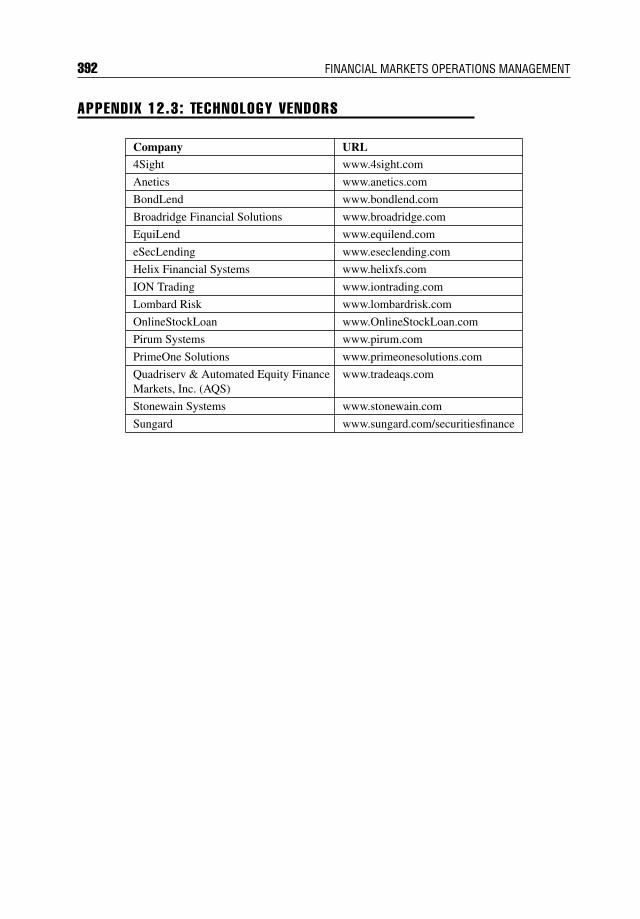
392 FINANCIAL MARKETS OPERATIONS MANAGEMENT
APPENDIX 12.3: TECHNOLOGY VENDORS
Company URL4Sight www.4sight.com
Anetics www.anetics.com
BondLend www.bondlend.com
Broadridge Financial Solutions www.broadridge.com
EquiLend www.equilend.com
eSecLending www.eseclending.com
Helix Financial Systems www.helixfs.com
ION Trading www.iontrading.com
Lombard Risk www.lombardrisk.com
OnlineStockLoan www.OnlineStockLoan.com
Pirum Systems www.pirum.com
PrimeOne Solutions www.primeonesolutions.com
Quadriserv & Automated Equity FinanceMarkets, Inc. (AQS)
www.tradeaqs.com
Stonewain Systems www.stonewain.com
Sungard www.sungard.com/securitiesfinance

PART
Four

CHAPTER 13Accounting for Securities
13.1 INTRODUCTION
Part IV of the book will take you through two elements of monitoring and control: accountingand reconciliation.
13.1.1 Account ing and Why We Need It
Let me ask you a very simple question: how much are you worth? Make a list of the sort ofthings that you own and estimate what these are worth. This will be your net worth.
Of course there will be no definitive answer to this question, as every person is unique andevery person’s net worth will differ. But why do you need to know how much you are worth?Perhaps the most obvious answer would be that you are interested in knowing. However, youare not the only person who either needs to know or has to know your worth.
For example, your government has an interest as your salary will be taxed; whilst this incometax is typically deducted at source, the government, through its revenue agency, will be keento ensure that you have paid sufficient tax.
Another example would include an application to borrow money from your bank; it needs to beassured that you have the ability to service that loan. To do this, it might require documentaryevidence of your salary and other assets that you might own. The list goes on!
To summarise the above, there are certain entities that need to know certain information aboutour wealth.
Q&A
Quest ion
Consider a corporate entity, such as the organisation which employs you. How much isthe organisation worth, who needs to know and why?
395
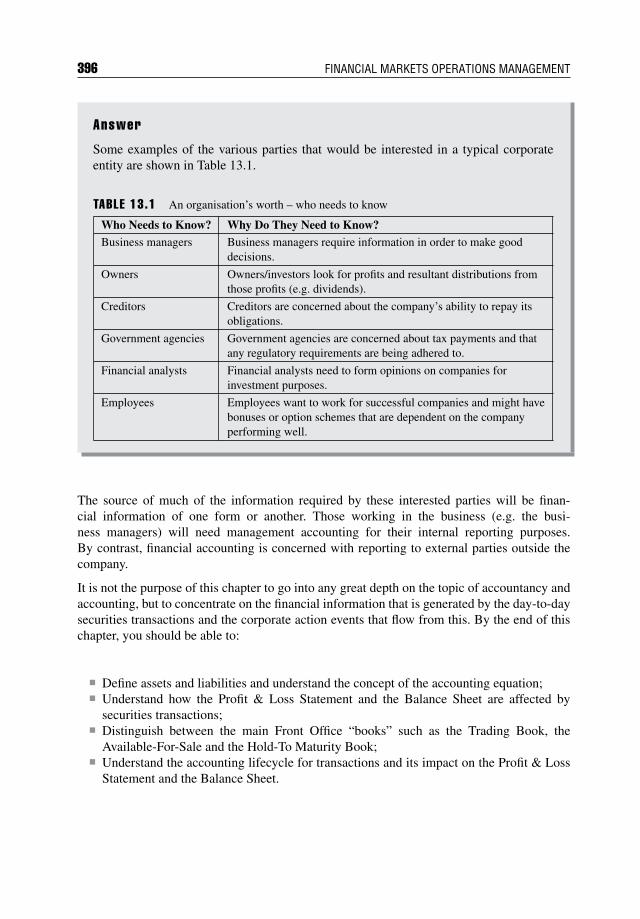
396 FINANCIAL MARKETS OPERATIONS MANAGEMENT
Answer
Some examples of the various parties that would be interested in a typical corporateentity are shown in Table 13.1.
TABLE 13.1 An organisation’s worth – who needs to know
Who Needs to Know? Why Do They Need to Know?Business managers Business managers require information in order to make good
decisions.
Owners Owners/investors look for profits and resultant distributions fromthose profits (e.g. dividends).
Creditors Creditors are concerned about the company’s ability to repay itsobligations.
Government agencies Government agencies are concerned about tax payments and thatany regulatory requirements are being adhered to.
Financial analysts Financial analysts need to form opinions on companies forinvestment purposes.
Employees Employees want to work for successful companies and might havebonuses or option schemes that are dependent on the companyperforming well.
The source of much of the information required by these interested parties will be finan-cial information of one form or another. Those working in the business (e.g. the busi-ness managers) will need management accounting for their internal reporting purposes.By contrast, financial accounting is concerned with reporting to external parties outside thecompany.
It is not the purpose of this chapter to go into any great depth on the topic of accountancy andaccounting, but to concentrate on the financial information that is generated by the day-to-daysecurities transactions and the corporate action events that flow from this. By the end of thischapter, you should be able to:
Define assets and liabilities and understand the concept of the accounting equation; Understand how the Profit & Loss Statement and the Balance Sheet are affected by
securities transactions; Distinguish between the main Front Office “books” such as the Trading Book, the
Available-For-Sale and the Hold-To Maturity Book; Understand the accounting lifecycle for transactions and its impact on the Profit & Loss
Statement and the Balance Sheet.
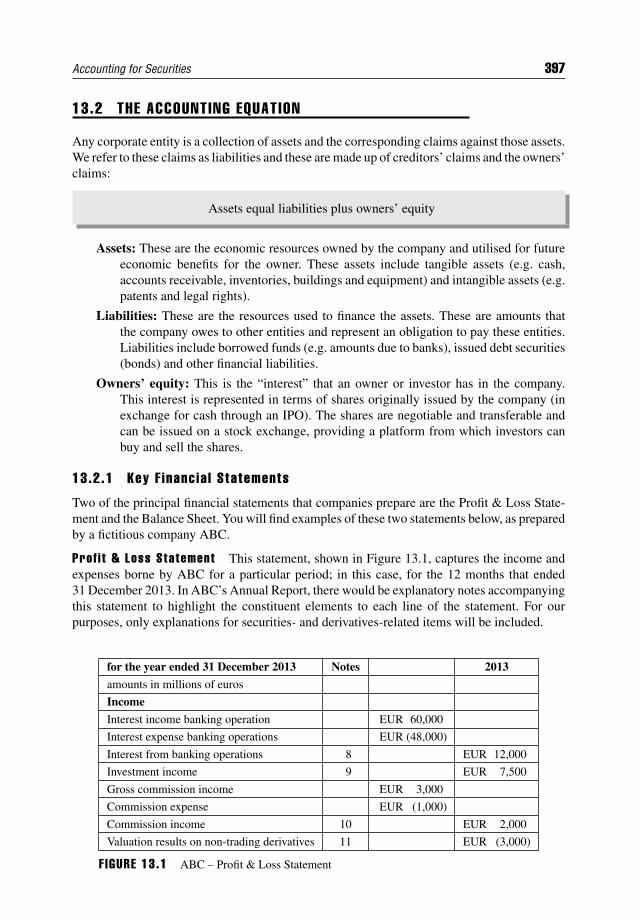
Accounting for Securities 397
13.2 THE ACCOUNTING EQUATION
Any corporate entity is a collection of assets and the corresponding claims against those assets.We refer to these claims as liabilities and these are made up of creditors’ claims and the owners’claims:
Assets equal liabilities plus owners’ equity
Assets: These are the economic resources owned by the company and utilised for futureeconomic benefits for the owner. These assets include tangible assets (e.g. cash,accounts receivable, inventories, buildings and equipment) and intangible assets (e.g.patents and legal rights).
Liabilities: These are the resources used to finance the assets. These are amounts thatthe company owes to other entities and represent an obligation to pay these entities.Liabilities include borrowed funds (e.g. amounts due to banks), issued debt securities(bonds) and other financial liabilities.
Owners’ equity: This is the “interest” that an owner or investor has in the company.This interest is represented in terms of shares originally issued by the company (inexchange for cash through an IPO). The shares are negotiable and transferable andcan be issued on a stock exchange, providing a platform from which investors canbuy and sell the shares.
13.2.1 Key F inancia l Statements
Two of the principal financial statements that companies prepare are the Profit & Loss State-ment and the Balance Sheet. You will find examples of these two statements below, as preparedby a fictitious company ABC.
Prof i t & Loss Statement This statement, shown in Figure 13.1, captures the income andexpenses borne by ABC for a particular period; in this case, for the 12 months that ended31 December 2013. In ABC’s Annual Report, there would be explanatory notes accompanyingthis statement to highlight the constituent elements to each line of the statement. For ourpurposes, only explanations for securities- and derivatives-related items will be included.
for the year ended 31 December 2013 Notes 2013
amounts in millions of euros
Income
Interest income banking operation EUR 60,000
Interest expense banking operations EUR (48,000)
Interest from banking operations 8 EUR 12,000
Investment income 9 EUR 7,500
Gross commission income EUR 3,000
Commission expense EUR (1,000)
Commission income 10 EUR 2,000
Valuation results on non-trading derivatives 11 EUR (3,000)
F IGURE 13.1 ABC – Profit & Loss Statement
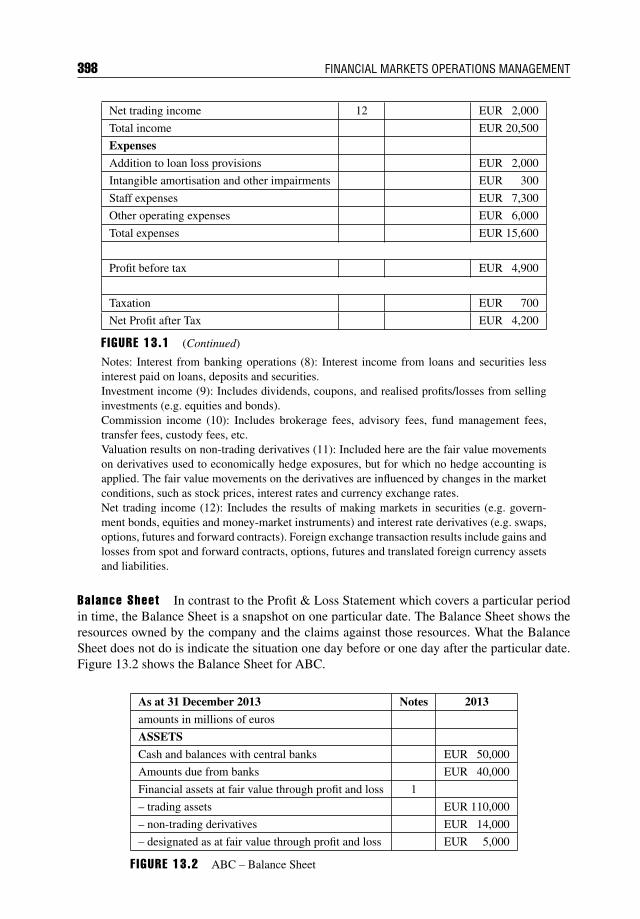
398 FINANCIAL MARKETS OPERATIONS MANAGEMENT
Net trading income 12 EUR 2,000
Total income EUR 20,500
Expenses
Addition to loan loss provisions EUR 2,000
Intangible amortisation and other impairments EUR 300
Staff expenses EUR 7,300
Other operating expenses EUR 6,000
Total expenses EUR 15,600
Profit before tax EUR 4,900
Taxation EUR 700
Net Profit after Tax EUR 4,200
F IGURE 13.1 (Continued)
Notes: Interest from banking operations (8): Interest income from loans and securities lessinterest paid on loans, deposits and securities.Investment income (9): Includes dividends, coupons, and realised profits/losses from sellinginvestments (e.g. equities and bonds).Commission income (10): Includes brokerage fees, advisory fees, fund management fees,transfer fees, custody fees, etc.Valuation results on non-trading derivatives (11): Included here are the fair value movementson derivatives used to economically hedge exposures, but for which no hedge accounting isapplied. The fair value movements on the derivatives are influenced by changes in the marketconditions, such as stock prices, interest rates and currency exchange rates.Net trading income (12): Includes the results of making markets in securities (e.g. govern-ment bonds, equities and money-market instruments) and interest rate derivatives (e.g. swaps,options, futures and forward contracts). Foreign exchange transaction results include gains andlosses from spot and forward contracts, options, futures and translated foreign currency assetsand liabilities.
Balance Sheet In contrast to the Profit & Loss Statement which covers a particular periodin time, the Balance Sheet is a snapshot on one particular date. The Balance Sheet shows theresources owned by the company and the claims against those resources. What the BalanceSheet does not do is indicate the situation one day before or one day after the particular date.Figure 13.2 shows the Balance Sheet for ABC.
As at 31 December 2013 Notes 2013
amounts in millions of euros
ASSETS
Cash and balances with central banks EUR 50,000
Amounts due from banks EUR 40,000
Financial assets at fair value through profit and loss 1
– trading assets EUR 110,000
– non-trading derivatives EUR 14,000
– designated as at fair value through profit and loss EUR 5,000
F IGURE 13.2 ABC – Balance Sheet
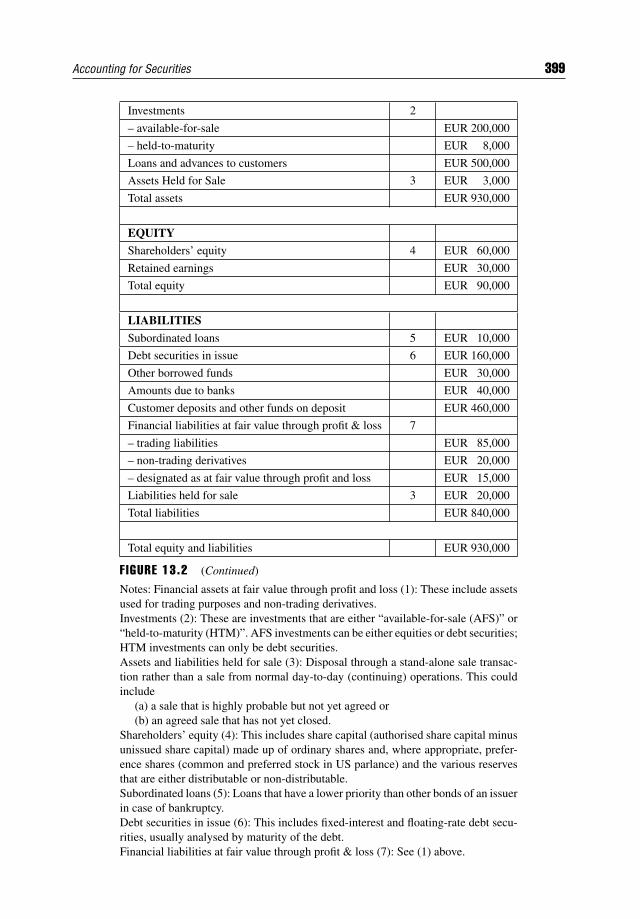
Accounting for Securities 399
Investments 2
– available-for-sale EUR 200,000
– held-to-maturity EUR 8,000
Loans and advances to customers EUR 500,000
Assets Held for Sale 3 EUR 3,000
Total assets EUR 930,000
EQUITY
Shareholders’ equity 4 EUR 60,000
Retained earnings EUR 30,000
Total equity EUR 90,000
LIABILITIES
Subordinated loans 5 EUR 10,000
Debt securities in issue 6 EUR 160,000
Other borrowed funds EUR 30,000
Amounts due to banks EUR 40,000
Customer deposits and other funds on deposit EUR 460,000
Financial liabilities at fair value through profit & loss 7
– trading liabilities EUR 85,000
– non-trading derivatives EUR 20,000
– designated as at fair value through profit and loss EUR 15,000
Liabilities held for sale 3 EUR 20,000
Total liabilities EUR 840,000
Total equity and liabilities EUR 930,000
F IGURE 13.2 (Continued)
Notes: Financial assets at fair value through profit and loss (1): These include assetsused for trading purposes and non-trading derivatives.Investments (2): These are investments that are either “available-for-sale (AFS)” or“held-to-maturity (HTM)”. AFS investments can be either equities or debt securities;HTM investments can only be debt securities.Assets and liabilities held for sale (3): Disposal through a stand-alone sale transac-tion rather than a sale from normal day-to-day (continuing) operations. This couldinclude
(a) a sale that is highly probable but not yet agreed or(b) an agreed sale that has not yet closed.
Shareholders’ equity (4): This includes share capital (authorised share capital minusunissued share capital) made up of ordinary shares and, where appropriate, prefer-ence shares (common and preferred stock in US parlance) and the various reservesthat are either distributable or non-distributable.Subordinated loans (5): Loans that have a lower priority than other bonds of an issuerin case of bankruptcy.Debt securities in issue (6): This includes fixed-interest and floating-rate debt secu-rities, usually analysed by maturity of the debt.Financial liabilities at fair value through profit & loss (7): See (1) above.
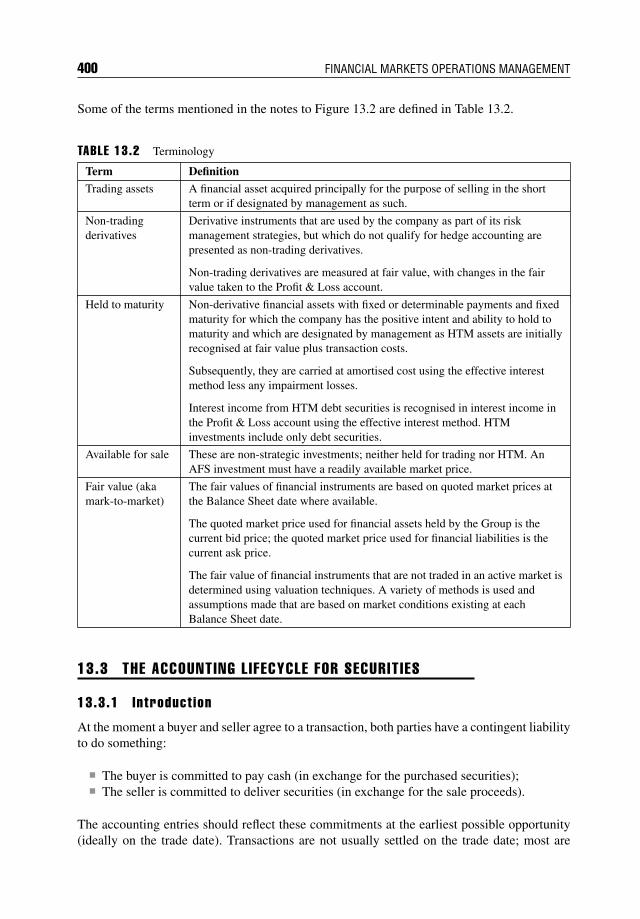
400 FINANCIAL MARKETS OPERATIONS MANAGEMENT
Some of the terms mentioned in the notes to Figure 13.2 are defined in Table 13.2.
TABLE 13.2 Terminology
Term Definition
Trading assets A financial asset acquired principally for the purpose of selling in the shortterm or if designated by management as such.
Non-tradingderivatives
Derivative instruments that are used by the company as part of its riskmanagement strategies, but which do not qualify for hedge accounting arepresented as non-trading derivatives.
Non-trading derivatives are measured at fair value, with changes in the fairvalue taken to the Profit & Loss account.
Held to maturity Non-derivative financial assets with fixed or determinable payments and fixedmaturity for which the company has the positive intent and ability to hold tomaturity and which are designated by management as HTM assets are initiallyrecognised at fair value plus transaction costs.
Subsequently, they are carried at amortised cost using the effective interestmethod less any impairment losses.
Interest income from HTM debt securities is recognised in interest income inthe Profit & Loss account using the effective interest method. HTMinvestments include only debt securities.
Available for sale These are non-strategic investments; neither held for trading nor HTM. AnAFS investment must have a readily available market price.
Fair value (akamark-to-market)
The fair values of financial instruments are based on quoted market prices atthe Balance Sheet date where available.
The quoted market price used for financial assets held by the Group is thecurrent bid price; the quoted market price used for financial liabilities is thecurrent ask price.
The fair value of financial instruments that are not traded in an active market isdetermined using valuation techniques. A variety of methods is used andassumptions made that are based on market conditions existing at eachBalance Sheet date.
13.3 THE ACCOUNTING LIFECYCLE FOR SECURIT IES
13.3.1 Introduct ion
At the moment a buyer and seller agree to a transaction, both parties have a contingent liabilityto do something:
The buyer is committed to pay cash (in exchange for the purchased securities); The seller is committed to deliver securities (in exchange for the sale proceeds).
The accounting entries should reflect these commitments at the earliest possible opportunity(ideally on the trade date). Transactions are not usually settled on the trade date; most are
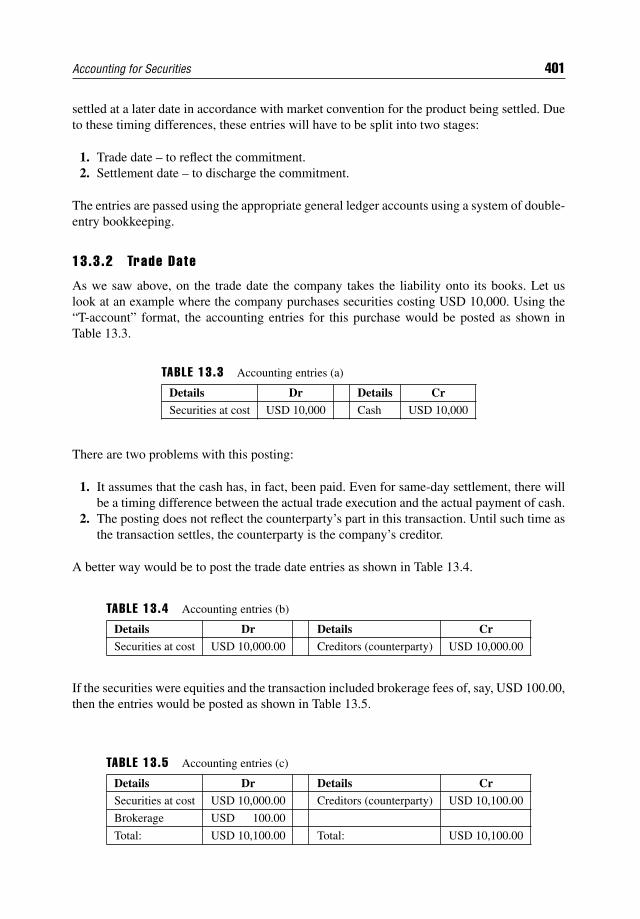
Accounting for Securities 401
settled at a later date in accordance with market convention for the product being settled. Dueto these timing differences, these entries will have to be split into two stages:
1. Trade date – to reflect the commitment.2. Settlement date – to discharge the commitment.
The entries are passed using the appropriate general ledger accounts using a system of double-entry bookkeeping.
13.3.2 Trade Date
As we saw above, on the trade date the company takes the liability onto its books. Let uslook at an example where the company purchases securities costing USD 10,000. Using the“T-account” format, the accounting entries for this purchase would be posted as shown inTable 13.3.
TABLE 13.3 Accounting entries (a)
Details Dr Details Cr
Securities at cost USD 10,000 Cash USD 10,000
There are two problems with this posting:
1. It assumes that the cash has, in fact, been paid. Even for same-day settlement, there willbe a timing difference between the actual trade execution and the actual payment of cash.
2. The posting does not reflect the counterparty’s part in this transaction. Until such time asthe transaction settles, the counterparty is the company’s creditor.
A better way would be to post the trade date entries as shown in Table 13.4.
TABLE 13.4 Accounting entries (b)
Details Dr Details Cr
Securities at cost USD 10,000.00 Creditors (counterparty) USD 10,000.00
If the securities were equities and the transaction included brokerage fees of, say, USD 100.00,then the entries would be posted as shown in Table 13.5.
TABLE 13.5 Accounting entries (c)
Details Dr Details Cr
Securities at cost USD 10,000.00 Creditors (counterparty) USD 10,100.00
Brokerage USD 100.00
Total: USD 10,100.00 Total: USD 10,100.00
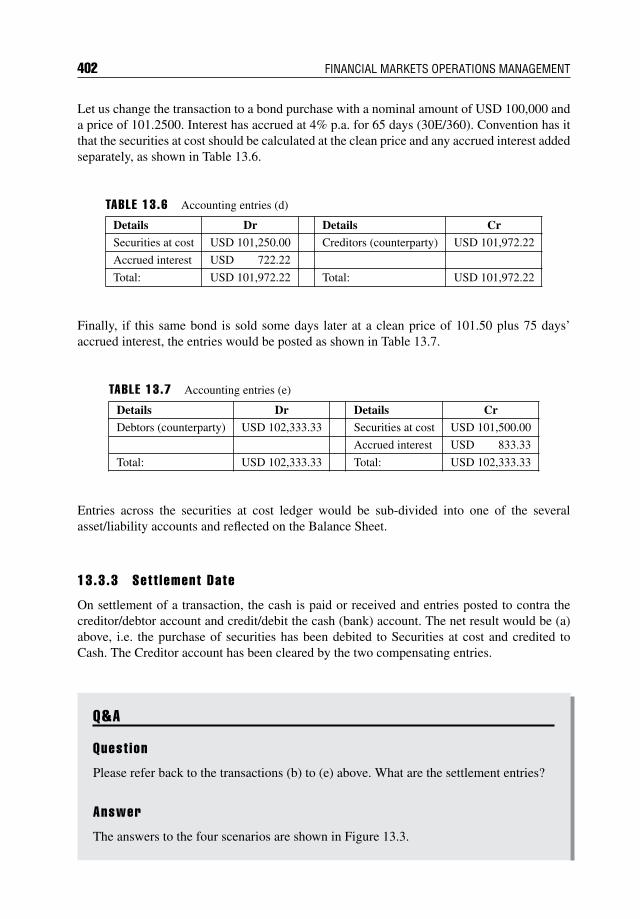
402 FINANCIAL MARKETS OPERATIONS MANAGEMENT
Let us change the transaction to a bond purchase with a nominal amount of USD 100,000 anda price of 101.2500. Interest has accrued at 4% p.a. for 65 days (30E/360). Convention has itthat the securities at cost should be calculated at the clean price and any accrued interest addedseparately, as shown in Table 13.6.
TABLE 13.6 Accounting entries (d)
Details Dr Details Cr
Securities at cost USD 101,250.00 Creditors (counterparty) USD 101,972.22
Accrued interest USD 722.22
Total: USD 101,972.22 Total: USD 101,972.22
Finally, if this same bond is sold some days later at a clean price of 101.50 plus 75 days’accrued interest, the entries would be posted as shown in Table 13.7.
TABLE 13.7 Accounting entries (e)
Details Dr Details Cr
Debtors (counterparty) USD 102,333.33 Securities at cost USD 101,500.00
Accrued interest USD 833.33
Total: USD 102,333.33 Total: USD 102,333.33
Entries across the securities at cost ledger would be sub-divided into one of the severalasset/liability accounts and reflected on the Balance Sheet.
13.3.3 Sett lement Date
On settlement of a transaction, the cash is paid or received and entries posted to contra thecreditor/debtor account and credit/debit the cash (bank) account. The net result would be (a)above, i.e. the purchase of securities has been debited to Securities at cost and credited toCash. The Creditor account has been cleared by the two compensating entries.
Q&A
Quest ion
Please refer back to the transactions (b) to (e) above. What are the settlement entries?
Answer
The answers to the four scenarios are shown in Figure 13.3.
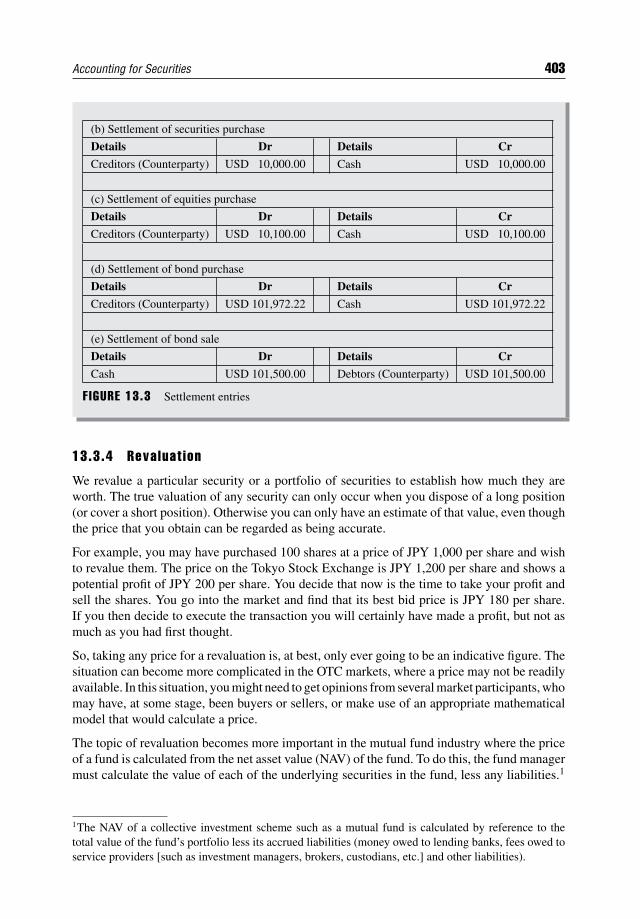
Accounting for Securities 403
(b) Settlement of securities purchase
Details Dr Details Cr
Creditors (Counterparty) USD 10,000.00 Cash USD 10,000.00
(c) Settlement of equities purchase
Details Dr Details Cr
Creditors (Counterparty) USD 10,100.00 Cash USD 10,100.00
(d) Settlement of bond purchase
Details Dr Details Cr
Creditors (Counterparty) USD 101,972.22 Cash USD 101,972.22
(e) Settlement of bond sale
Details Dr Details Cr
Cash USD 101,500.00 Debtors (Counterparty) USD 101,500.00
F IGURE 13.3 Settlement entries
13.3.4 Revaluat ion
We revalue a particular security or a portfolio of securities to establish how much they areworth. The true valuation of any security can only occur when you dispose of a long position(or cover a short position). Otherwise you can only have an estimate of that value, even thoughthe price that you obtain can be regarded as being accurate.
For example, you may have purchased 100 shares at a price of JPY 1,000 per share and wishto revalue them. The price on the Tokyo Stock Exchange is JPY 1,200 per share and shows apotential profit of JPY 200 per share. You decide that now is the time to take your profit andsell the shares. You go into the market and find that its best bid price is JPY 180 per share.If you then decide to execute the transaction you will certainly have made a profit, but not asmuch as you had first thought.
So, taking any price for a revaluation is, at best, only ever going to be an indicative figure. Thesituation can become more complicated in the OTC markets, where a price may not be readilyavailable. In this situation, you might need to get opinions from several market participants, whomay have, at some stage, been buyers or sellers, or make use of an appropriate mathematicalmodel that would calculate a price.
The topic of revaluation becomes more important in the mutual fund industry where the priceof a fund is calculated from the net asset value (NAV) of the fund. To do this, the fund managermust calculate the value of each of the underlying securities in the fund, less any liabilities.1
1The NAV of a collective investment scheme such as a mutual fund is calculated by reference to thetotal value of the fund’s portfolio less its accrued liabilities (money owed to lending banks, fees owed toservice providers [such as investment managers, brokers, custodians, etc.] and other liabilities).
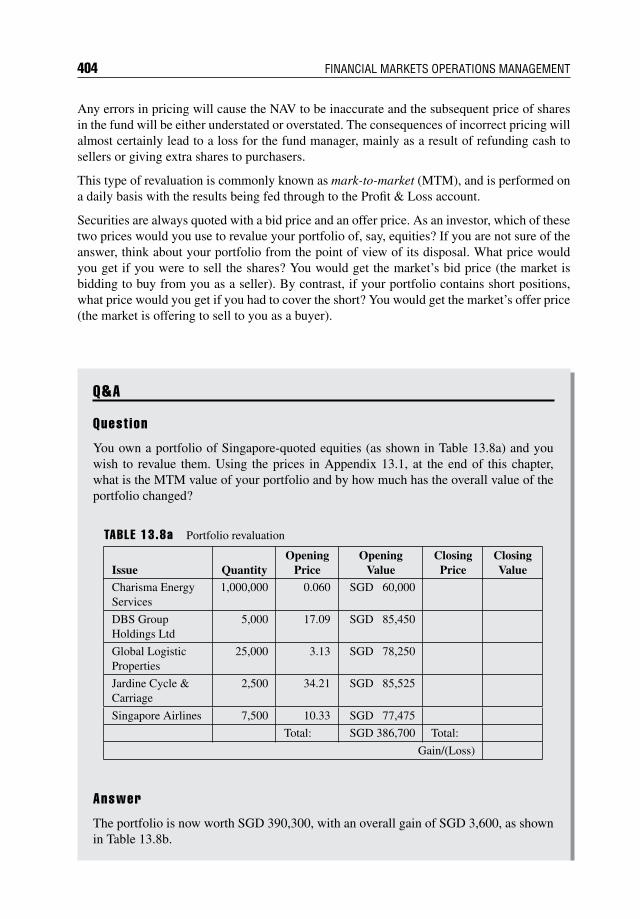
404 FINANCIAL MARKETS OPERATIONS MANAGEMENT
Any errors in pricing will cause the NAV to be inaccurate and the subsequent price of sharesin the fund will be either understated or overstated. The consequences of incorrect pricing willalmost certainly lead to a loss for the fund manager, mainly as a result of refunding cash tosellers or giving extra shares to purchasers.
This type of revaluation is commonly known as mark-to-market (MTM), and is performed ona daily basis with the results being fed through to the Profit & Loss account.
Securities are always quoted with a bid price and an offer price. As an investor, which of thesetwo prices would you use to revalue your portfolio of, say, equities? If you are not sure of theanswer, think about your portfolio from the point of view of its disposal. What price wouldyou get if you were to sell the shares? You would get the market’s bid price (the market isbidding to buy from you as a seller). By contrast, if your portfolio contains short positions,what price would you get if you had to cover the short? You would get the market’s offer price(the market is offering to sell to you as a buyer).
Q&A
Quest ion
You own a portfolio of Singapore-quoted equities (as shown in Table 13.8a) and youwish to revalue them. Using the prices in Appendix 13.1, at the end of this chapter,what is the MTM value of your portfolio and by how much has the overall value of theportfolio changed?
TABLE 13.8a Portfolio revaluation
Issue QuantityOpening
PriceOpening
ValueClosing
PriceClosingValue
Charisma EnergyServices
1,000,000 0.060 SGD 60,000
DBS GroupHoldings Ltd
5,000 17.09 SGD 85,450
Global LogisticProperties
25,000 3.13 SGD 78,250
Jardine Cycle &Carriage
2,500 34.21 SGD 85,525
Singapore Airlines 7,500 10.33 SGD 77,475
Total: SGD 386,700 Total:
Gain/(Loss)
Answer
The portfolio is now worth SGD 390,300, with an overall gain of SGD 3,600, as shownin Table 13.8b.
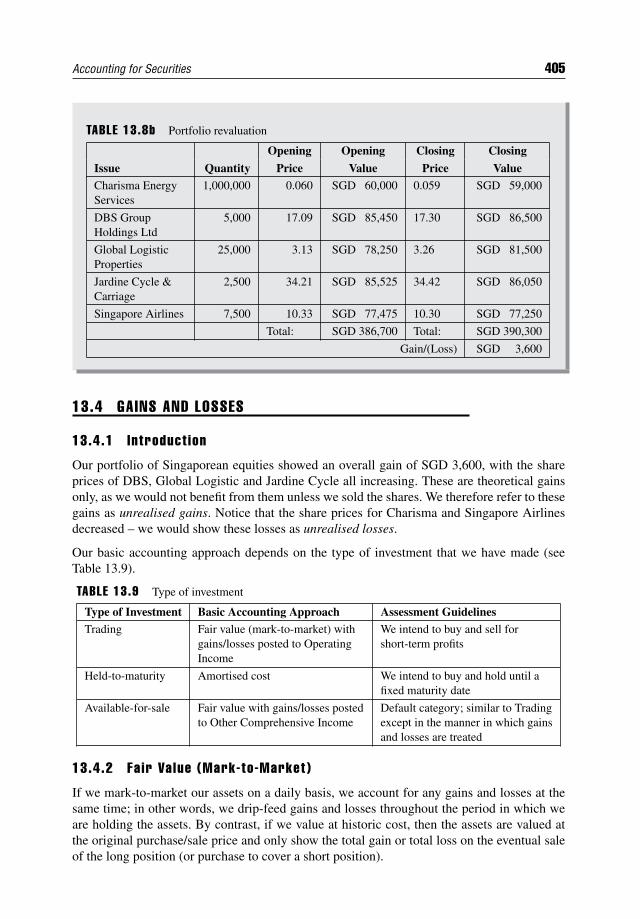
Accounting for Securities 405
TABLE 13.8b Portfolio revaluation
Opening Opening Closing Closing
Issue Quantity Price Value Price ValueCharisma EnergyServices
1,000,000 0.060 SGD 60,000 0.059 SGD 59,000
DBS GroupHoldings Ltd
5,000 17.09 SGD 85,450 17.30 SGD 86,500
Global LogisticProperties
25,000 3.13 SGD 78,250 3.26 SGD 81,500
Jardine Cycle &Carriage
2,500 34.21 SGD 85,525 34.42 SGD 86,050
Singapore Airlines 7,500 10.33 SGD 77,475 10.30 SGD 77,250
Total: SGD 386,700 Total: SGD 390,300
Gain/(Loss) SGD 3,600
13.4 GAINS AND LOSSES
13.4.1 Introduct ion
Our portfolio of Singaporean equities showed an overall gain of SGD 3,600, with the shareprices of DBS, Global Logistic and Jardine Cycle all increasing. These are theoretical gainsonly, as we would not benefit from them unless we sold the shares. We therefore refer to thesegains as unrealised gains. Notice that the share prices for Charisma and Singapore Airlinesdecreased – we would show these losses as unrealised losses.
Our basic accounting approach depends on the type of investment that we have made (seeTable 13.9).
TABLE 13.9 Type of investment
Type of Investment Basic Accounting Approach Assessment GuidelinesTrading Fair value (mark-to-market) with
gains/losses posted to OperatingIncome
We intend to buy and sell forshort-term profits
Held-to-maturity Amortised cost We intend to buy and hold until afixed maturity date
Available-for-sale Fair value with gains/losses postedto Other Comprehensive Income
Default category; similar to Tradingexcept in the manner in which gainsand losses are treated
13.4.2 Fair Value (Mark-to-Market)
If we mark-to-market our assets on a daily basis, we account for any gains and losses at thesame time; in other words, we drip-feed gains and losses throughout the period in which weare holding the assets. By contrast, if we value at historic cost, then the assets are valued atthe original purchase/sale price and only show the total gain or total loss on the eventual saleof the long position (or purchase to cover a short position).
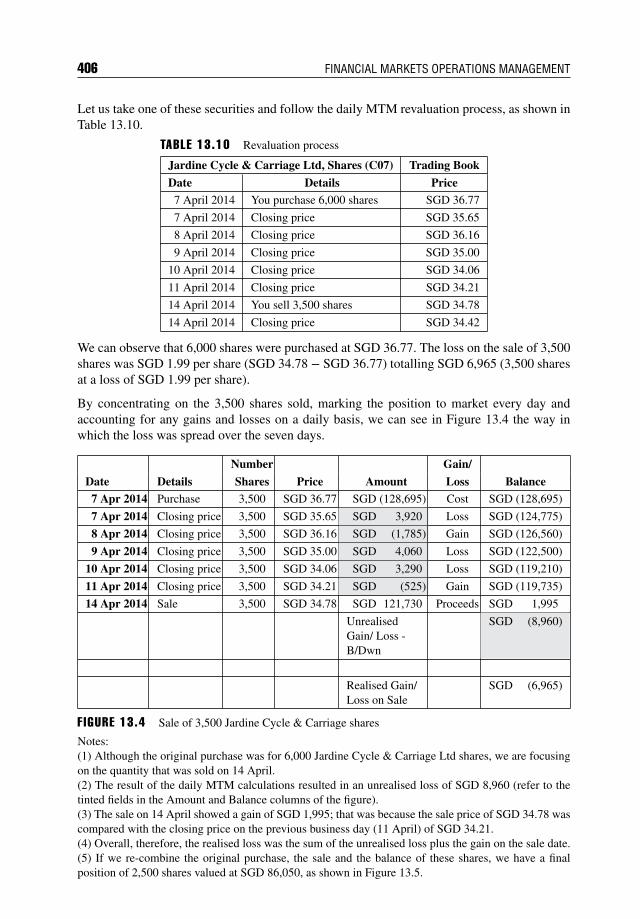
406 FINANCIAL MARKETS OPERATIONS MANAGEMENT
Let us take one of these securities and follow the daily MTM revaluation process, as shown inTable 13.10.
TABLE 13.10 Revaluation process
Jardine Cycle & Carriage Ltd, Shares (C07) Trading Book
Date Details Price7 April 2014 You purchase 6,000 shares SGD 36.77
7 April 2014 Closing price SGD 35.65
8 April 2014 Closing price SGD 36.16
9 April 2014 Closing price SGD 35.00
10 April 2014 Closing price SGD 34.06
11 April 2014 Closing price SGD 34.21
14 April 2014 You sell 3,500 shares SGD 34.78
14 April 2014 Closing price SGD 34.42
We can observe that 6,000 shares were purchased at SGD 36.77. The loss on the sale of 3,500shares was SGD 1.99 per share (SGD 34.78 − SGD 36.77) totalling SGD 6,965 (3,500 sharesat a loss of SGD 1.99 per share).
By concentrating on the 3,500 shares sold, marking the position to market every day andaccounting for any gains and losses on a daily basis, we can see in Figure 13.4 the way inwhich the loss was spread over the seven days.
Number Gain/
Date Details Shares Price Amount Loss Balance7 Apr 2014 Purchase 3,500 SGD 36.77 SGD (128,695) Cost SGD (128,695)
7 Apr 2014 Closing price 3,500 SGD 35.65 SGD 3,920 Loss SGD (124,775)
8 Apr 2014 Closing price 3,500 SGD 36.16 SGD (1,785) Gain SGD (126,560)
9 Apr 2014 Closing price 3,500 SGD 35.00 SGD 4,060 Loss SGD (122,500)
10 Apr 2014 Closing price 3,500 SGD 34.06 SGD 3,290 Loss SGD (119,210)
11 Apr 2014 Closing price 3,500 SGD 34.21 SGD (525) Gain SGD (119,735)
14 Apr 2014 Sale 3,500 SGD 34.78 SGD 121,730 Proceeds SGD 1,995
UnrealisedGain/ Loss -B/Dwn
SGD (8,960)
Realised Gain/Loss on Sale
SGD (6,965)
F IGURE 13.4 Sale of 3,500 Jardine Cycle & Carriage shares
Notes:(1) Although the original purchase was for 6,000 Jardine Cycle & Carriage Ltd shares, we are focusingon the quantity that was sold on 14 April.(2) The result of the daily MTM calculations resulted in an unrealised loss of SGD 8,960 (refer to thetinted fields in the Amount and Balance columns of the figure).(3) The sale on 14 April showed a gain of SGD 1,995; that was because the sale price of SGD 34.78 wascompared with the closing price on the previous business day (11 April) of SGD 34.21.(4) Overall, therefore, the realised loss was the sum of the unrealised loss plus the gain on the sale date.(5) If we re-combine the original purchase, the sale and the balance of these shares, we have a finalposition of 2,500 shares valued at SGD 86,050, as shown in Figure 13.5.
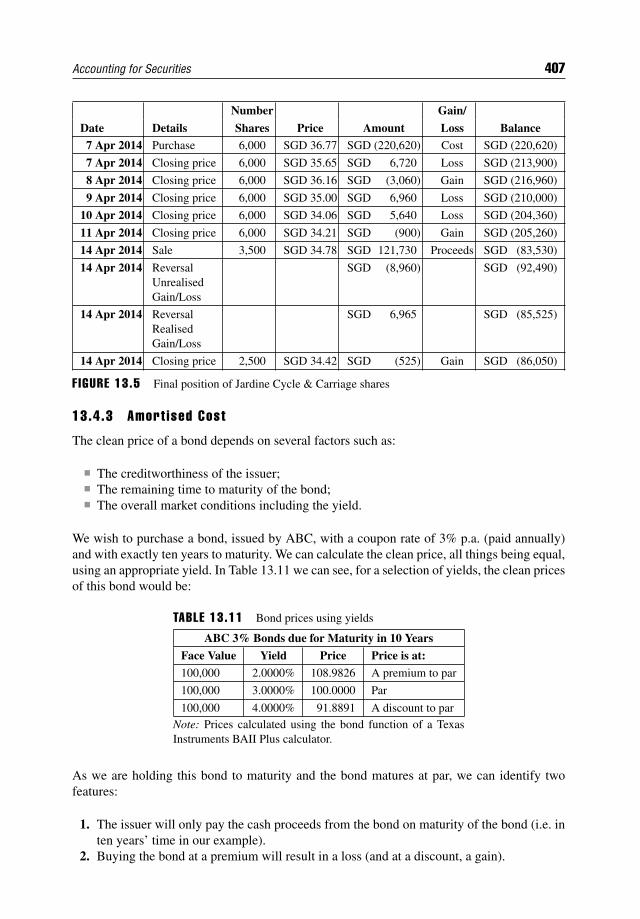
Accounting for Securities 407
Number Gain/
Date Details Shares Price Amount Loss Balance7 Apr 2014 Purchase 6,000 SGD 36.77 SGD (220,620) Cost SGD (220,620)
7 Apr 2014 Closing price 6,000 SGD 35.65 SGD 6,720 Loss SGD (213,900)
8 Apr 2014 Closing price 6,000 SGD 36.16 SGD (3,060) Gain SGD (216,960)
9 Apr 2014 Closing price 6,000 SGD 35.00 SGD 6,960 Loss SGD (210,000)
10 Apr 2014 Closing price 6,000 SGD 34.06 SGD 5,640 Loss SGD (204,360)
11 Apr 2014 Closing price 6,000 SGD 34.21 SGD (900) Gain SGD (205,260)
14 Apr 2014 Sale 3,500 SGD 34.78 SGD 121,730 Proceeds SGD (83,530)
14 Apr 2014 ReversalUnrealisedGain/Loss
SGD (8,960) SGD (92,490)
14 Apr 2014 ReversalRealisedGain/Loss
SGD 6,965 SGD (85,525)
14 Apr 2014 Closing price 2,500 SGD 34.42 SGD (525) Gain SGD (86,050)
F IGURE 13.5 Final position of Jardine Cycle & Carriage shares
13.4.3 Amort ised Cost
The clean price of a bond depends on several factors such as:
The creditworthiness of the issuer; The remaining time to maturity of the bond; The overall market conditions including the yield.
We wish to purchase a bond, issued by ABC, with a coupon rate of 3% p.a. (paid annually)and with exactly ten years to maturity. We can calculate the clean price, all things being equal,using an appropriate yield. In Table 13.11 we can see, for a selection of yields, the clean pricesof this bond would be:
TABLE 13.11 Bond prices using yields
ABC 3% Bonds due for Maturity in 10 Years
Face Value Yield Price Price is at:
100,000 2.0000% 108.9826 A premium to par
100,000 3.0000% 100.0000 Par
100,000 4.0000% 91.8891 A discount to parNote: Prices calculated using the bond function of a TexasInstruments BAII Plus calculator.
As we are holding this bond to maturity and the bond matures at par, we can identify twofeatures:
1. The issuer will only pay the cash proceeds from the bond on maturity of the bond (i.e. inten years’ time in our example).
2. Buying the bond at a premium will result in a loss (and at a discount, a gain).
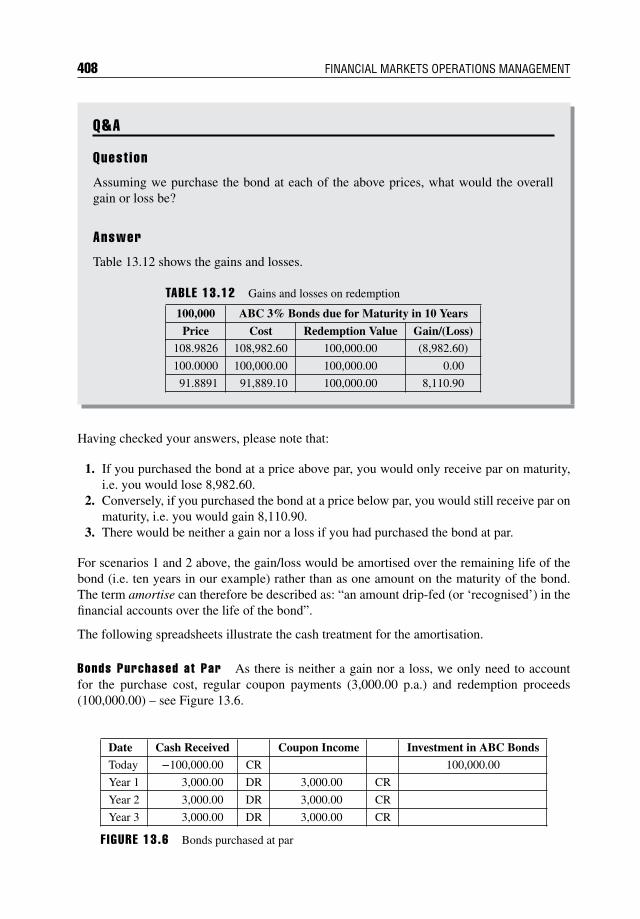
408 FINANCIAL MARKETS OPERATIONS MANAGEMENT
Q&A
Quest ion
Assuming we purchase the bond at each of the above prices, what would the overallgain or loss be?
Answer
Table 13.12 shows the gains and losses.
TABLE 13.12 Gains and losses on redemption
100,000 ABC 3% Bonds due for Maturity in 10 Years
Price Cost Redemption Value Gain/(Loss)108.9826 108,982.60 100,000.00 (8,982.60)
100.0000 100,000.00 100,000.00 0.00
91.8891 91,889.10 100,000.00 8,110.90
Having checked your answers, please note that:
1. If you purchased the bond at a price above par, you would only receive par on maturity,i.e. you would lose 8,982.60.
2. Conversely, if you purchased the bond at a price below par, you would still receive par onmaturity, i.e. you would gain 8,110.90.
3. There would be neither a gain nor a loss if you had purchased the bond at par.
For scenarios 1 and 2 above, the gain/loss would be amortised over the remaining life of thebond (i.e. ten years in our example) rather than as one amount on the maturity of the bond.The term amortise can therefore be described as: “an amount drip-fed (or ‘recognised’) in thefinancial accounts over the life of the bond”.
The following spreadsheets illustrate the cash treatment for the amortisation.
Bonds Purchased at Par As there is neither a gain nor a loss, we only need to accountfor the purchase cost, regular coupon payments (3,000.00 p.a.) and redemption proceeds(100,000.00) – see Figure 13.6.
Date Cash Received Coupon Income Investment in ABC Bonds
Today −100,000.00 CR 100,000.00
Year 1 3,000.00 DR 3,000.00 CR
Year 2 3,000.00 DR 3,000.00 CR
Year 3 3,000.00 DR 3,000.00 CR
F IGURE 13.6 Bonds purchased at par
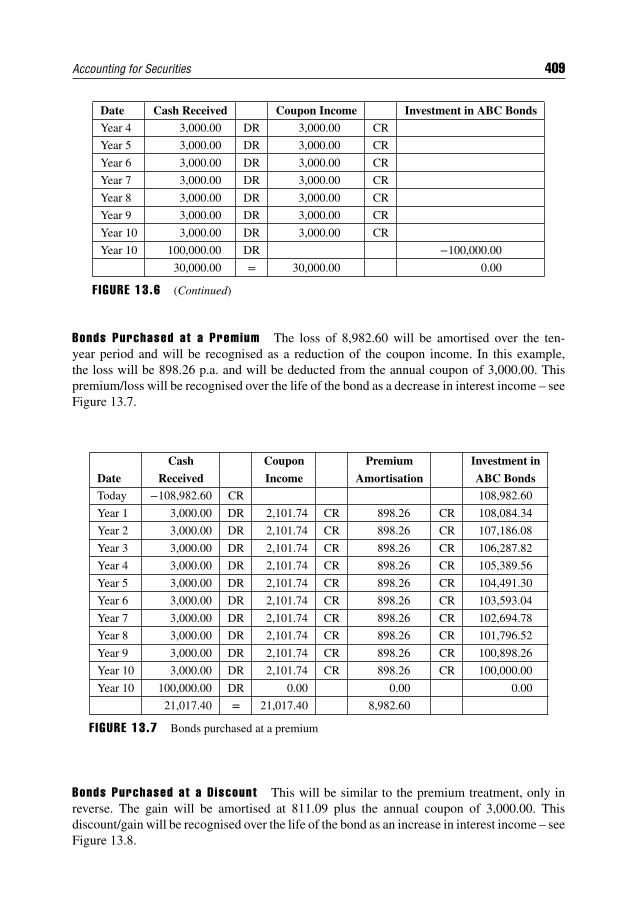
Accounting for Securities 409
Date Cash Received Coupon Income Investment in ABC Bonds
Year 4 3,000.00 DR 3,000.00 CR
Year 5 3,000.00 DR 3,000.00 CR
Year 6 3,000.00 DR 3,000.00 CR
Year 7 3,000.00 DR 3,000.00 CR
Year 8 3,000.00 DR 3,000.00 CR
Year 9 3,000.00 DR 3,000.00 CR
Year 10 3,000.00 DR 3,000.00 CR
Year 10 100,000.00 DR −100,000.00
30,000.00 = 30,000.00 0.00
F IGURE 13.6 (Continued)
Bonds Purchased at a Premium The loss of 8,982.60 will be amortised over the ten-year period and will be recognised as a reduction of the coupon income. In this example,the loss will be 898.26 p.a. and will be deducted from the annual coupon of 3,000.00. Thispremium/loss will be recognised over the life of the bond as a decrease in interest income – seeFigure 13.7.
Cash Coupon Premium Investment in
Date Received Income Amortisation ABC BondsToday −108,982.60 CR 108,982.60
Year 1 3,000.00 DR 2,101.74 CR 898.26 CR 108,084.34
Year 2 3,000.00 DR 2,101.74 CR 898.26 CR 107,186.08
Year 3 3,000.00 DR 2,101.74 CR 898.26 CR 106,287.82
Year 4 3,000.00 DR 2,101.74 CR 898.26 CR 105,389.56
Year 5 3,000.00 DR 2,101.74 CR 898.26 CR 104,491.30
Year 6 3,000.00 DR 2,101.74 CR 898.26 CR 103,593.04
Year 7 3,000.00 DR 2,101.74 CR 898.26 CR 102,694.78
Year 8 3,000.00 DR 2,101.74 CR 898.26 CR 101,796.52
Year 9 3,000.00 DR 2,101.74 CR 898.26 CR 100,898.26
Year 10 3,000.00 DR 2,101.74 CR 898.26 CR 100,000.00
Year 10 100,000.00 DR 0.00 0.00 0.00
21,017.40 = 21,017.40 8,982.60
F IGURE 13.7 Bonds purchased at a premium
Bonds Purchased at a Discount This will be similar to the premium treatment, only inreverse. The gain will be amortised at 811.09 plus the annual coupon of 3,000.00. Thisdiscount/gain will be recognised over the life of the bond as an increase in interest income – seeFigure 13.8.
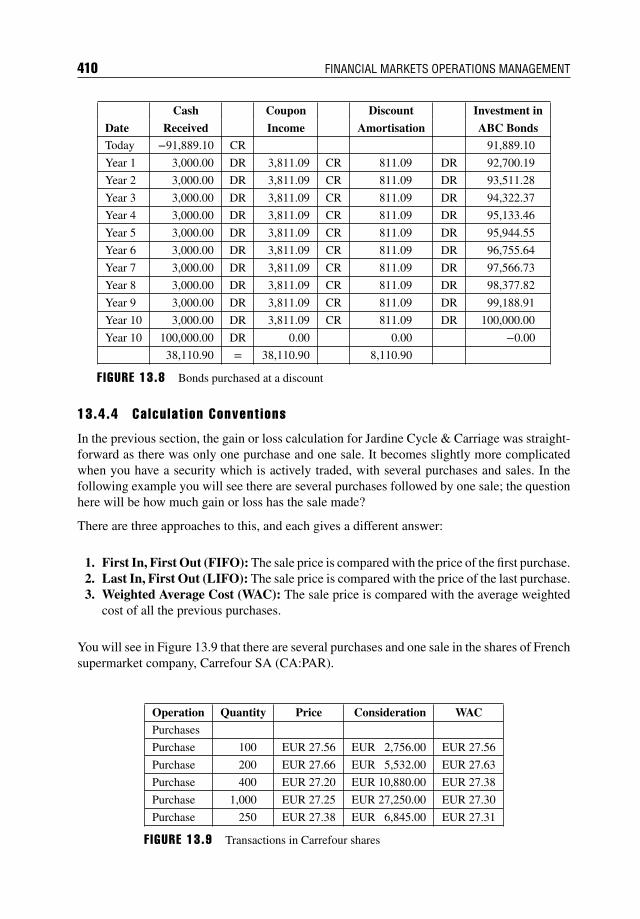
410 FINANCIAL MARKETS OPERATIONS MANAGEMENT
Cash Coupon Discount Investment in
Date Received Income Amortisation ABC BondsToday −91,889.10 CR 91,889.10
Year 1 3,000.00 DR 3,811.09 CR 811.09 DR 92,700.19
Year 2 3,000.00 DR 3,811.09 CR 811.09 DR 93,511.28
Year 3 3,000.00 DR 3,811.09 CR 811.09 DR 94,322.37
Year 4 3,000.00 DR 3,811.09 CR 811.09 DR 95,133.46
Year 5 3,000.00 DR 3,811.09 CR 811.09 DR 95,944.55
Year 6 3,000.00 DR 3,811.09 CR 811.09 DR 96,755.64
Year 7 3,000.00 DR 3,811.09 CR 811.09 DR 97,566.73
Year 8 3,000.00 DR 3,811.09 CR 811.09 DR 98,377.82
Year 9 3,000.00 DR 3,811.09 CR 811.09 DR 99,188.91
Year 10 3,000.00 DR 3,811.09 CR 811.09 DR 100,000.00
Year 10 100,000.00 DR 0.00 0.00 −0.00
38,110.90 = 38,110.90 8,110.90
F IGURE 13.8 Bonds purchased at a discount
13.4.4 Calcu lat ion Convent ions
In the previous section, the gain or loss calculation for Jardine Cycle & Carriage was straight-forward as there was only one purchase and one sale. It becomes slightly more complicatedwhen you have a security which is actively traded, with several purchases and sales. In thefollowing example you will see there are several purchases followed by one sale; the questionhere will be how much gain or loss has the sale made?
There are three approaches to this, and each gives a different answer:
1. First In, First Out (FIFO): The sale price is compared with the price of the first purchase.2. Last In, First Out (LIFO): The sale price is compared with the price of the last purchase.3. Weighted Average Cost (WAC): The sale price is compared with the average weighted
cost of all the previous purchases.
You will see in Figure 13.9 that there are several purchases and one sale in the shares of Frenchsupermarket company, Carrefour SA (CA:PAR).
Operation Quantity Price Consideration WAC
Purchases
Purchase 100 EUR 27.56 EUR 2,756.00 EUR 27.56
Purchase 200 EUR 27.66 EUR 5,532.00 EUR 27.63
Purchase 400 EUR 27.20 EUR 10,880.00 EUR 27.38
Purchase 1,000 EUR 27.25 EUR 27,250.00 EUR 27.30
Purchase 250 EUR 27.38 EUR 6,845.00 EUR 27.31
F IGURE 13.9 Transactions in Carrefour shares
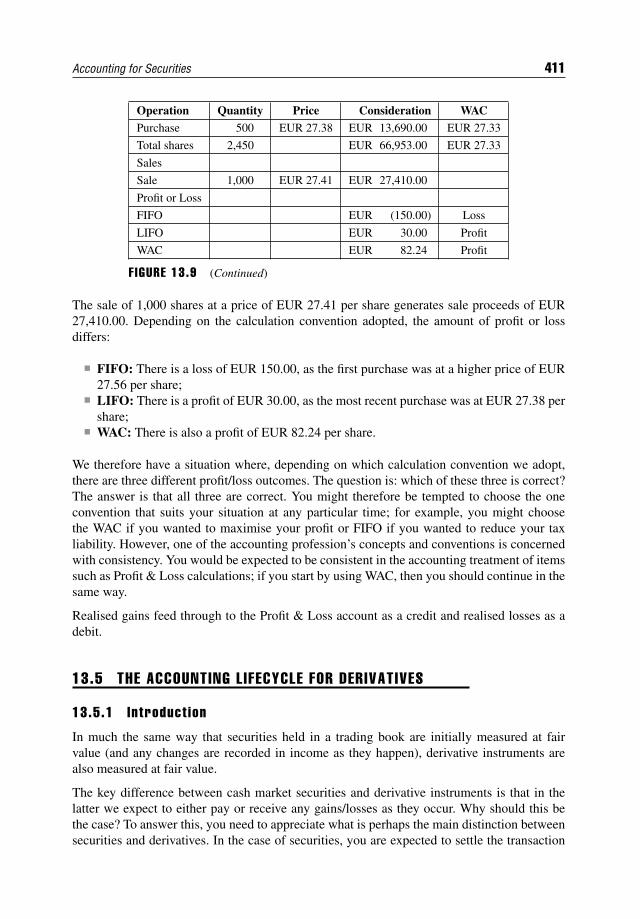
Accounting for Securities 411
Operation Quantity Price Consideration WAC
Purchase 500 EUR 27.38 EUR 13,690.00 EUR 27.33
Total shares 2,450 EUR 66,953.00 EUR 27.33
Sales
Sale 1,000 EUR 27.41 EUR 27,410.00
Profit or Loss
FIFO EUR (150.00) Loss
LIFO EUR 30.00 Profit
WAC EUR 82.24 Profit
F IGURE 13.9 (Continued)
The sale of 1,000 shares at a price of EUR 27.41 per share generates sale proceeds of EUR27,410.00. Depending on the calculation convention adopted, the amount of profit or lossdiffers:
FIFO: There is a loss of EUR 150.00, as the first purchase was at a higher price of EUR27.56 per share;
LIFO: There is a profit of EUR 30.00, as the most recent purchase was at EUR 27.38 pershare;
WAC: There is also a profit of EUR 82.24 per share.
We therefore have a situation where, depending on which calculation convention we adopt,there are three different profit/loss outcomes. The question is: which of these three is correct?The answer is that all three are correct. You might therefore be tempted to choose the oneconvention that suits your situation at any particular time; for example, you might choosethe WAC if you wanted to maximise your profit or FIFO if you wanted to reduce your taxliability. However, one of the accounting profession’s concepts and conventions is concernedwith consistency. You would be expected to be consistent in the accounting treatment of itemssuch as Profit & Loss calculations; if you start by using WAC, then you should continue in thesame way.
Realised gains feed through to the Profit & Loss account as a credit and realised losses as adebit.
13.5 THE ACCOUNTING LIFECYCLE FOR DERIVATIVES
13.5.1 Introduct ion
In much the same way that securities held in a trading book are initially measured at fairvalue (and any changes are recorded in income as they happen), derivative instruments arealso measured at fair value.
The key difference between cash market securities and derivative instruments is that in thelatter we expect to either pay or receive any gains/losses as they occur. Why should this bethe case? To answer this, you need to appreciate what is perhaps the main distinction betweensecurities and derivatives. In the case of securities, you are expected to settle the transaction
412 FINANCIAL MARKETS OPERATIONS MANAGEMENT
both in full and within a short period after the original trade date; settling the transactioneliminates the original counterparty risk between buyer and seller.
With derivatives, however, you may (or may not) be expected to pay the full economic cashvalue of the underlying derivative asset until some future date. The amount of time could beseveral weeks or months or years after the trade date and this exposes one counterparty tothe risk of default of the other counterparty. By paying or receiving the change in the dailymark-to-market valuation, both counterparties reduce their economic exposures to each otheron an overnight basis rather than intra-period.
We will take a look at how exchange-traded derivatives (ETDs) and OTC derivatives are treatedin the next two sections. Please be aware that the situation on the OTC side is fundamentallychanging due to pressure from industry regulators. We will look at this later in the section.
13.5.2 Exchange-Traded Derivat ives
You will recall from a previous chapter that once an ETD transaction has been executed, bothtrading counterparties register their trades with a clearing house. Once the clearing house hasmatched the buyer’s and seller’s information, it becomes the counterparty to the buyer andseparately the counterparty to the seller (novation). This means that should either the buyeror the seller default, it becomes the clearing house’s responsibility to manage the subsequentun-winding of the position. Clearly, this puts the clearing house in a potentially risky situation,especially in a crisis situation where several counterparties are defaulting. For this reason, theclearing house has to have a robust risk-management system, and part of the risk mitigationis to request margin from counterparties that clear through the clearing house. Margin can bepaid either in cash or in eligible non-cash assets such as high-grade treasury bonds, corporatebonds and money-market instruments.
The term margin therefore refers to the changes in fair value, payable or receivable by acounterparty to/from the clearing house. For any ETD product it is the clearing house thatspecifies how much margin is payable and what the deadlines are for its payment.
There are two variants of margin: initial margin and variation margin.
In i t ia l Margin This represents a returnable deposit by the clearing member to the clearinghouse and is an amount based on the risk profile of the contract. The purpose of initial marginis to allow the clearing house to hold sufficient funds on behalf of each clearing member tooffset any losses incurred between the last payment of margin and the close out of the clearingmember’s positions should the clearing member default. Initial margin is usually calculatedby taking the worst probable loss that the position could sustain over a fixed amount of time,and can be paid in either cash or non-cash collateral. Initial margin is a Balance Sheet item.
Traditionally, each and every open contract would have been margined as a separate exercise.Today, most clearing houses have adopted the process of collating similar derivative contractsinto a “portfolio”, stress testing the portfolio and calculating one amount of margin. Theoriginal framework, known as Standard Portfolio Analysis of Risk (SPAN), was developed bythe Chicago Mercantile Exchange and subsequently licensed to a number of other internationalclearing houses. This one-stop-shop approach provides for a more accurate netting of risk anda more efficient use of collateral.
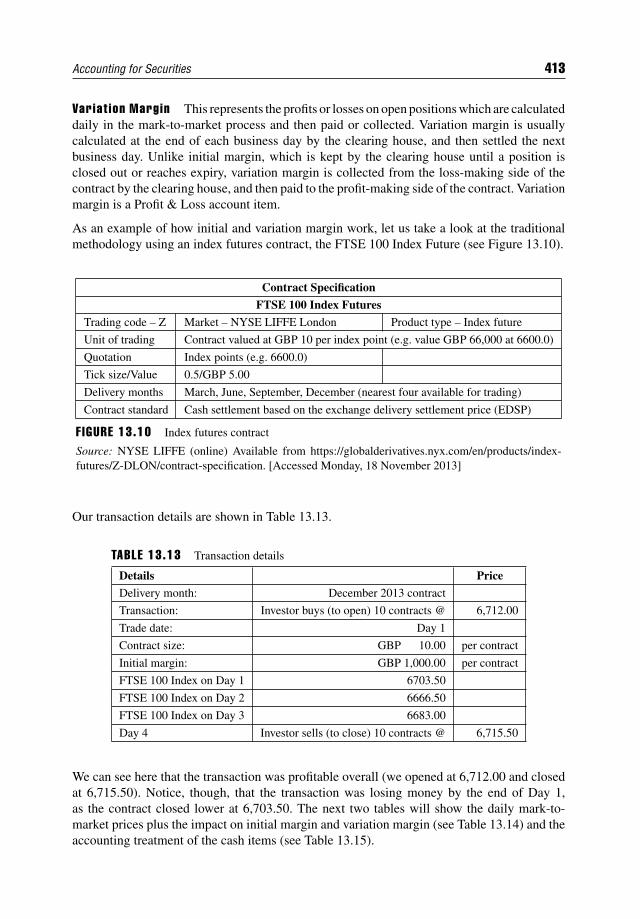
Accounting for Securities 413
Variat ion Margin This represents the profits or losses on open positions which are calculateddaily in the mark-to-market process and then paid or collected. Variation margin is usuallycalculated at the end of each business day by the clearing house, and then settled the nextbusiness day. Unlike initial margin, which is kept by the clearing house until a position isclosed out or reaches expiry, variation margin is collected from the loss-making side of thecontract by the clearing house, and then paid to the profit-making side of the contract. Variationmargin is a Profit & Loss account item.
As an example of how initial and variation margin work, let us take a look at the traditionalmethodology using an index futures contract, the FTSE 100 Index Future (see Figure 13.10).
Contract Specification
FTSE 100 Index Futures
Trading code – Z Market – NYSE LIFFE London Product type – Index future
Unit of trading Contract valued at GBP 10 per index point (e.g. value GBP 66,000 at 6600.0)
Quotation Index points (e.g. 6600.0)
Tick size/Value 0.5/GBP 5.00
Delivery months March, June, September, December (nearest four available for trading)
Contract standard Cash settlement based on the exchange delivery settlement price (EDSP)
F IGURE 13.10 Index futures contract
Source: NYSE LIFFE (online) Available from https://globalderivatives.nyx.com/en/products/index-futures/Z-DLON/contract-specification. [Accessed Monday, 18 November 2013]
Our transaction details are shown in Table 13.13.
TABLE 13.13 Transaction details
Details Price
Delivery month: December 2013 contract
Transaction: Investor buys (to open) 10 contracts @ 6,712.00
Trade date: Day 1
Contract size: GBP 10.00 per contract
Initial margin: GBP 1,000.00 per contract
FTSE 100 Index on Day 1 6703.50
FTSE 100 Index on Day 2 6666.50
FTSE 100 Index on Day 3 6683.00
Day 4 Investor sells (to close) 10 contracts @ 6,715.50
We can see here that the transaction was profitable overall (we opened at 6,712.00 and closedat 6,715.50). Notice, though, that the transaction was losing money by the end of Day 1,as the contract closed lower at 6,703.50. The next two tables will show the daily mark-to-market prices plus the impact on initial margin and variation margin (see Table 13.14) and theaccounting treatment of the cash items (see Table 13.15).
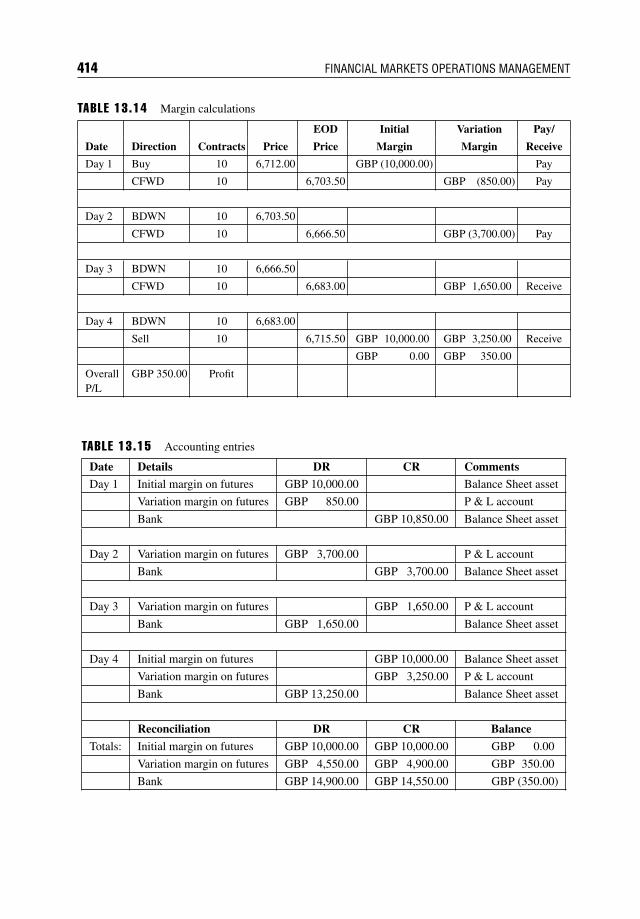
414 FINANCIAL MARKETS OPERATIONS MANAGEMENT
TABLE 13.14 Margin calculations
EOD Initial Variation Pay/
Date Direction Contracts Price Price Margin Margin Receive
Day 1 Buy 10 6,712.00 GBP (10,000.00) Pay
CFWD 10 6,703.50 GBP (850.00) Pay
Day 2 BDWN 10 6,703.50
CFWD 10 6,666.50 GBP (3,700.00) Pay
Day 3 BDWN 10 6,666.50
CFWD 10 6,683.00 GBP 1,650.00 Receive
Day 4 BDWN 10 6,683.00
Sell 10 6,715.50 GBP 10,000.00 GBP 3,250.00 Receive
GBP 0.00 GBP 350.00
OverallP/L
GBP 350.00 Profit
TABLE 13.15 Accounting entries
Date Details DR CR Comments
Day 1 Initial margin on futures GBP 10,000.00 Balance Sheet asset
Variation margin on futures GBP 850.00 P & L account
Bank GBP 10,850.00 Balance Sheet asset
Day 2 Variation margin on futures GBP 3,700.00 P & L account
Bank GBP 3,700.00 Balance Sheet asset
Day 3 Variation margin on futures GBP 1,650.00 P & L account
Bank GBP 1,650.00 Balance Sheet asset
Day 4 Initial margin on futures GBP 10,000.00 Balance Sheet asset
Variation margin on futures GBP 3,250.00 P & L account
Bank GBP 13,250.00 Balance Sheet asset
Reconciliation DR CR Balance
Totals: Initial margin on futures GBP 10,000.00 GBP 10,000.00 GBP 0.00
Variation margin on futures GBP 4,550.00 GBP 4,900.00 GBP 350.00
Bank GBP 14,900.00 GBP 14,550.00 GBP (350.00)
Accounting for Securities 415
13.5.3 OTC Derivat ives
In the centrally cleared world of ETD transactions, margin is one element in the clearing house’srisk mitigation. With the notable exception of SwapClear (launched in 1999 by LCH.Clearnet),OTC derivative contracts are not generally cleared centrally. It is the responsibility of the buyerand the seller to make suitable arrangements to mitigate the counterparty risk exposures.
It is usual to revalue an OTC contract on a daily basis (in much the same way as in the centrallycleared environment), and an amount of collateral representing the value of the contract willbe delivered by the counterparty with the exposure to the counterparty with the risk. This isvery much a bilateral activity, but formalised under agreements produced by the InternationalSwaps and Derivatives Association (ISDA). The main agreement types2 include the following:
ISDA Master Agreement; ISDA Credit Support Documentation; ISDA Definitions; Regulatory documentation.
According to the ISDA’s 2014 Margin Survey (published in April 2014), 91% of all clearedand non-cleared OTC derivatives trades were subject to collateral agreements, of which 87%were ISDA agreements.3
In order to be able to calculate the correct amount of collateral, it is necessary to value thecontracts. This would be straightforward if prices were available centrally, for example, throughan exchange or a clearing house. However, due to the bilateral nature of OTC derivativestrading, there is no central pricing facility. Instead, market participants have to use a rangeof pricing systems and models in order to establish a fair price. It is quite possible for thecounterparties to the same trade to have different revaluation prices.
It is intended that by 2014 all non-cleared OTC derivative contracts will be cleared through aclearing house. For their part, clearing houses will, theoretically, become comfortable clearingOTC derivative contracts on condition that they (a) understand the contracts and (b) are ableto revalue them. Hence, SwapClear clears a range of vanilla interest rate swaps.4 SwapClearrevalues clearing member positions daily using zero-coupon yield curves which are publishedand made available to the members. This is one of the key features of the service and ensuresthe independence of the valuation process.
2Available from www.isda.org/publications/pubguide.aspx. Documents are either for ISDA membersonly or non-members to purchase/download for free.3Source ISDA (online) ISDA 2014 Margin Survey. Available from www2.isda.org/search?headerSearch=1&keyword=surveys. [Accessed Monday, 14 April 2014]4SwapClear initially cleared plain vanilla interest rate swaps in four major currencies. Today it clearsswaps in 17 currencies: USD, EUR and GBP out to 50 years, JPY to 40 years, AUD, CAD, CHF andSEK to 30 years, NZD out to 15 years and the remaining eight currencies out to 10 years. It also clearsovernight index swaps out to 30 years in EUR, GBP and USD and out to 2 years in CHF and CAD. Source:LCH.Clearnet (online) Available from www.lchclearnet.com/swaps/swapclear_for_clearing_members.[Accessed Tuesday, 19 November 2013]
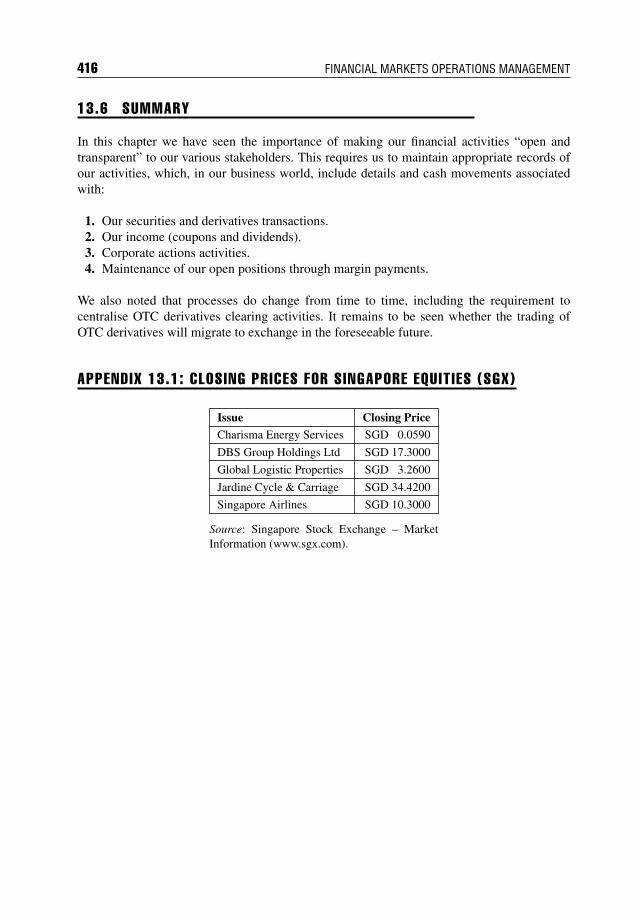
416 FINANCIAL MARKETS OPERATIONS MANAGEMENT
13.6 SUMMARY
In this chapter we have seen the importance of making our financial activities “open andtransparent” to our various stakeholders. This requires us to maintain appropriate records ofour activities, which, in our business world, include details and cash movements associatedwith:
1. Our securities and derivatives transactions.2. Our income (coupons and dividends).3. Corporate actions activities.4. Maintenance of our open positions through margin payments.
We also noted that processes do change from time to time, including the requirement tocentralise OTC derivatives clearing activities. It remains to be seen whether the trading ofOTC derivatives will migrate to exchange in the foreseeable future.
APPENDIX 13.1: CLOSING PRICES FOR SINGAPORE EQUIT IES (SGX)
Issue Closing PriceCharisma Energy Services SGD 0.0590
DBS Group Holdings Ltd SGD 17.3000
Global Logistic Properties SGD 3.2600
Jardine Cycle & Carriage SGD 34.4200
Singapore Airlines SGD 10.3000
Source: Singapore Stock Exchange – MarketInformation (www.sgx.com).
CHAPTER 14Reconciliation
14.1 INTRODUCTION
Irrespective of what part of the company you are involved with, you will always need to knowwhat your positions are, whether they are securities-related or cash-related. A problem ariseswhen the position that you think you have either does not exist or indicates a different amountto what you actually have. In other words, you need to be sure that the position you think youhave does actually exist. In this chapter you will see why you need to know this and how wecan achieve it.
After reading this chapter you will:
Understand the importance of maintaining an efficient reconciliation system; Be able to compare the different types of reconciliation and evaluate their strengths and
weaknesses; Be able to perform a reconciliation and assess the effectiveness of the operational unit
responsible; Be able to describe the regulatory requirements; Be able to take a manual reconciliation process and design an automated system.
As an example of a potential problem, your records show that you have USD 1,000.00 in yourbank account. You receive a bank statement showing a credit balance of USD 1,000.00. Youthen make a payment of USD 900.00 on the assumption that you have sufficient funds in youraccount.
Thinking that you have a credit balance of USD 1,000.00, you are surprised when you receivea subsequent statement stating that you are several hundred US dollars overdrawn. In additionto being overdrawn, you will be liable for overdraft interest. Why are you overdrawn? Whathas gone wrong on your bank account?
This is where a reconciliation would have been helpful. A thorough investigation would haveshown, for example, that you had recently issued a cheque for USD 350.00 but failed to book itinto your records. Had you done so, your records would have shown a balance of USD 650.00(not USD 1,000.00), and it would have been clear that making the payment of USD 900.00would have taken your account into debit (i.e. overdrawn).
417
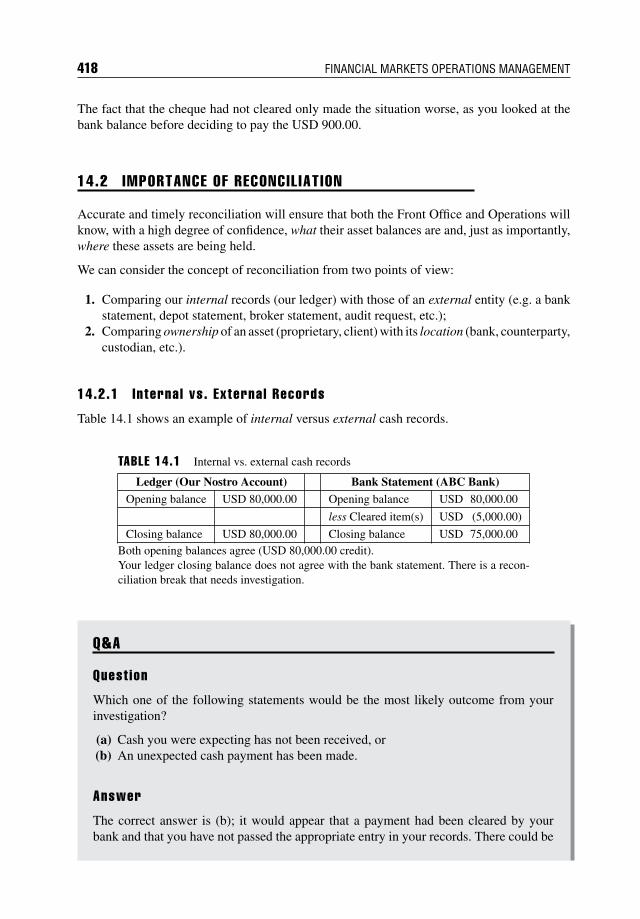
418 FINANCIAL MARKETS OPERATIONS MANAGEMENT
The fact that the cheque had not cleared only made the situation worse, as you looked at thebank balance before deciding to pay the USD 900.00.
14.2 IMPORTANCE OF RECONCIL IAT ION
Accurate and timely reconciliation will ensure that both the Front Office and Operations willknow, with a high degree of confidence, what their asset balances are and, just as importantly,where these assets are being held.
We can consider the concept of reconciliation from two points of view:
1. Comparing our internal records (our ledger) with those of an external entity (e.g. a bankstatement, depot statement, broker statement, audit request, etc.);
2. Comparing ownership of an asset (proprietary, client) with its location (bank, counterparty,custodian, etc.).
14.2.1 Internal vs. External Records
Table 14.1 shows an example of internal versus external cash records.
TABLE 14.1 Internal vs. external cash records
Ledger (Our Nostro Account) Bank Statement (ABC Bank)Opening balance USD 80,000.00 Opening balance USD 80,000.00
less Cleared item(s) USD (5,000.00)
Closing balance USD 80,000.00 Closing balance USD 75,000.00Both opening balances agree (USD 80,000.00 credit).Your ledger closing balance does not agree with the bank statement. There is a recon-ciliation break that needs investigation.
Q&A
Quest ion
Which one of the following statements would be the most likely outcome from yourinvestigation?
(a) Cash you were expecting has not been received, or(b) An unexpected cash payment has been made.
Answer
The correct answer is (b); it would appear that a payment had been cleared by yourbank and that you have not passed the appropriate entry in your records. There could be
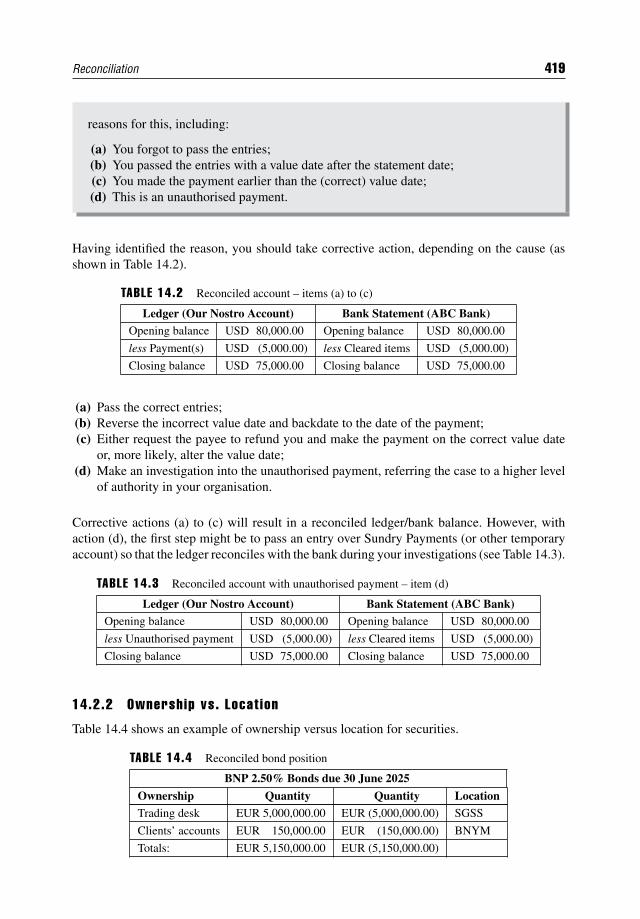
Reconciliation 419
reasons for this, including:
(a) You forgot to pass the entries;(b) You passed the entries with a value date after the statement date;(c) You made the payment earlier than the (correct) value date;(d) This is an unauthorised payment.
Having identified the reason, you should take corrective action, depending on the cause (asshown in Table 14.2).
TABLE 14.2 Reconciled account – items (a) to (c)
Ledger (Our Nostro Account) Bank Statement (ABC Bank)Opening balance USD 80,000.00 Opening balance USD 80,000.00
less Payment(s) USD (5,000.00) less Cleared items USD (5,000.00)
Closing balance USD 75,000.00 Closing balance USD 75,000.00
(a) Pass the correct entries;(b) Reverse the incorrect value date and backdate to the date of the payment;(c) Either request the payee to refund you and make the payment on the correct value date
or, more likely, alter the value date;(d) Make an investigation into the unauthorised payment, referring the case to a higher level
of authority in your organisation.
Corrective actions (a) to (c) will result in a reconciled ledger/bank balance. However, withaction (d), the first step might be to pass an entry over Sundry Payments (or other temporaryaccount) so that the ledger reconciles with the bank during your investigations (see Table 14.3).
TABLE 14.3 Reconciled account with unauthorised payment – item (d)
Ledger (Our Nostro Account) Bank Statement (ABC Bank)Opening balance USD 80,000.00 Opening balance USD 80,000.00
less Unauthorised payment USD (5,000.00) less Cleared items USD (5,000.00)
Closing balance USD 75,000.00 Closing balance USD 75,000.00
14.2.2 Ownership vs. Locat ion
Table 14.4 shows an example of ownership versus location for securities.
TABLE 14.4 Reconciled bond position
BNP 2.50% Bonds due 30 June 2025
Ownership Quantity Quantity LocationTrading desk EUR 5,000,000.00 EUR (5,000,000.00) SGSS
Clients’ accounts EUR 150,000.00 EUR (150,000.00) BNYM
Totals: EUR 5,150,000.00 EUR (5,150,000.00)
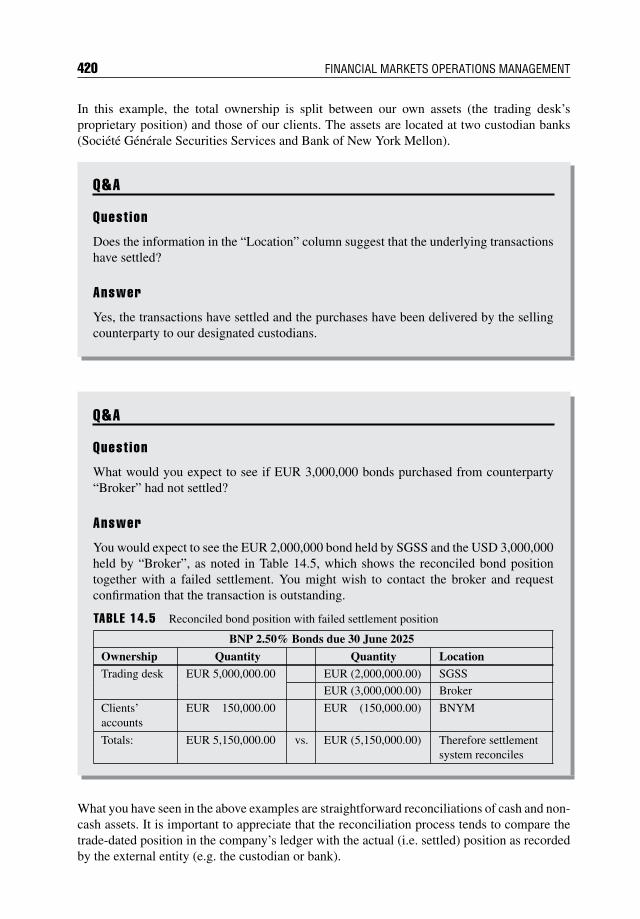
420 FINANCIAL MARKETS OPERATIONS MANAGEMENT
In this example, the total ownership is split between our own assets (the trading desk’sproprietary position) and those of our clients. The assets are located at two custodian banks(Societe Generale Securities Services and Bank of New York Mellon).
Q&A
Quest ion
Does the information in the “Location” column suggest that the underlying transactionshave settled?
Answer
Yes, the transactions have settled and the purchases have been delivered by the sellingcounterparty to our designated custodians.
Q&A
Quest ion
What would you expect to see if EUR 3,000,000 bonds purchased from counterparty“Broker” had not settled?
Answer
You would expect to see the EUR 2,000,000 bond held by SGSS and the USD 3,000,000held by “Broker”, as noted in Table 14.5, which shows the reconciled bond positiontogether with a failed settlement. You might wish to contact the broker and requestconfirmation that the transaction is outstanding.
TABLE 14.5 Reconciled bond position with failed settlement position
BNP 2.50% Bonds due 30 June 2025
Ownership Quantity Quantity LocationTrading desk EUR 5,000,000.00 EUR (2,000,000.00) SGSS
EUR (3,000,000.00) Broker
Clients’accounts
EUR 150,000.00 EUR (150,000.00) BNYM
Totals: EUR 5,150,000.00 vs. EUR (5,150,000.00) Therefore settlementsystem reconciles
What you have seen in the above examples are straightforward reconciliations of cash and non-cash assets. It is important to appreciate that the reconciliation process tends to compare thetrade-dated position in the company’s ledger with the actual (i.e. settled) position as recordedby the external entity (e.g. the custodian or bank).
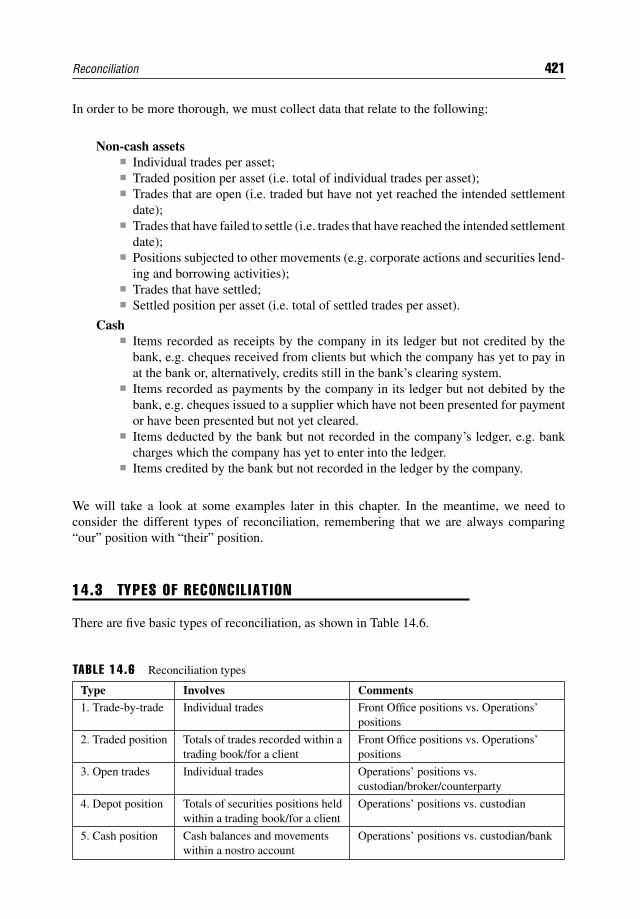
Reconciliation 421
In order to be more thorough, we must collect data that relate to the following:
Non-cash assets Individual trades per asset; Traded position per asset (i.e. total of individual trades per asset); Trades that are open (i.e. traded but have not yet reached the intended settlement
date); Trades that have failed to settle (i.e. trades that have reached the intended settlement
date); Positions subjected to other movements (e.g. corporate actions and securities lend-
ing and borrowing activities); Trades that have settled; Settled position per asset (i.e. total of settled trades per asset).
Cash Items recorded as receipts by the company in its ledger but not credited by the
bank, e.g. cheques received from clients but which the company has yet to pay inat the bank or, alternatively, credits still in the bank’s clearing system.
Items recorded as payments by the company in its ledger but not debited by thebank, e.g. cheques issued to a supplier which have not been presented for paymentor have been presented but not yet cleared.
Items deducted by the bank but not recorded in the company’s ledger, e.g. bankcharges which the company has yet to enter into the ledger.
Items credited by the bank but not recorded in the ledger by the company.
We will take a look at some examples later in this chapter. In the meantime, we need toconsider the different types of reconciliation, remembering that we are always comparing“our” position with “their” position.
14.3 TYPES OF RECONCIL IAT ION
There are five basic types of reconciliation, as shown in Table 14.6.
TABLE 14.6 Reconciliation types
Type Involves Comments1. Trade-by-trade Individual trades Front Office positions vs. Operations’
positions
2. Traded position Totals of trades recorded within atrading book/for a client
Front Office positions vs. Operations’positions
3. Open trades Individual trades Operations’ positions vs.custodian/broker/counterparty
4. Depot position Totals of securities positions heldwithin a trading book/for a client
Operations’ positions vs. custodian
5. Cash position Cash balances and movementswithin a nostro account
Operations’ positions vs. custodian/bank
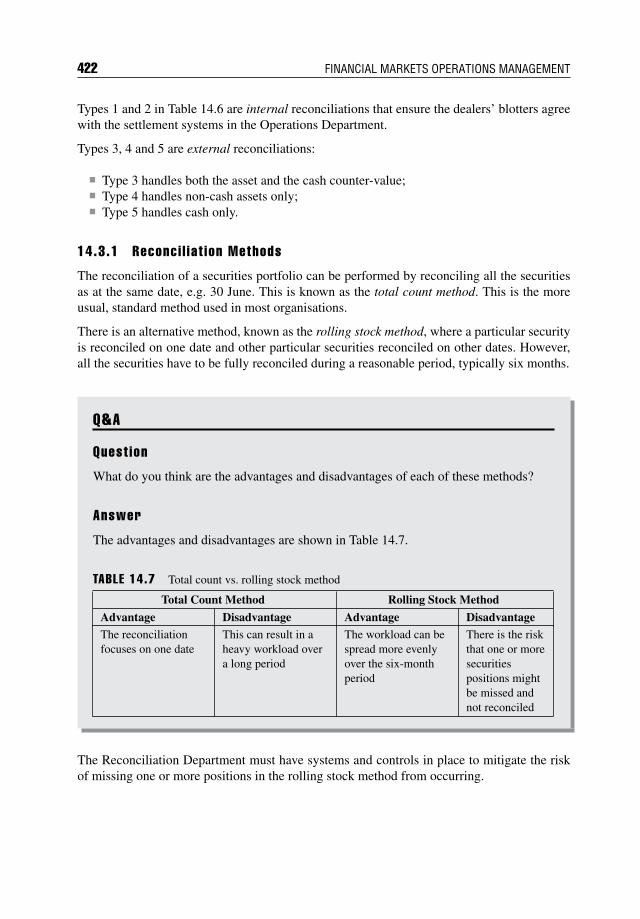
422 FINANCIAL MARKETS OPERATIONS MANAGEMENT
Types 1 and 2 in Table 14.6 are internal reconciliations that ensure the dealers’ blotters agreewith the settlement systems in the Operations Department.
Types 3, 4 and 5 are external reconciliations:
Type 3 handles both the asset and the cash counter-value; Type 4 handles non-cash assets only; Type 5 handles cash only.
14.3.1 Reconci l iat ion Methods
The reconciliation of a securities portfolio can be performed by reconciling all the securitiesas at the same date, e.g. 30 June. This is known as the total count method. This is the moreusual, standard method used in most organisations.
There is an alternative method, known as the rolling stock method, where a particular securityis reconciled on one date and other particular securities reconciled on other dates. However,all the securities have to be fully reconciled during a reasonable period, typically six months.
Q&A
Quest ion
What do you think are the advantages and disadvantages of each of these methods?
Answer
The advantages and disadvantages are shown in Table 14.7.
TABLE 14.7 Total count vs. rolling stock method
Total Count Method Rolling Stock Method
Advantage Disadvantage Advantage DisadvantageThe reconciliationfocuses on one date
This can result in aheavy workload overa long period
The workload can bespread more evenlyover the six-monthperiod
There is the riskthat one or moresecuritiespositions mightbe missed andnot reconciled
The Reconciliation Department must have systems and controls in place to mitigate the riskof missing one or more positions in the rolling stock method from occurring.
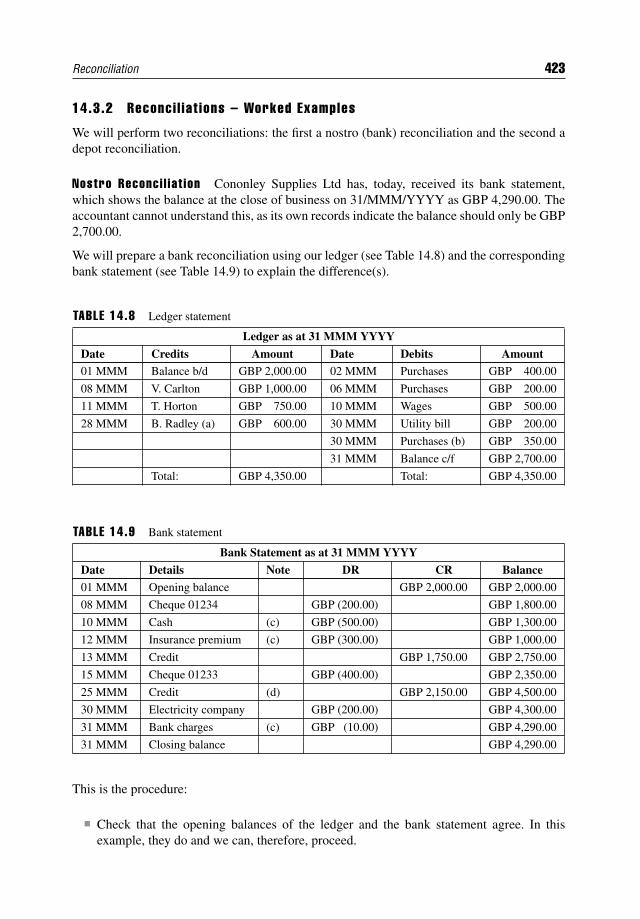
Reconciliation 423
14.3.2 Reconci l iat ions – Worked Examples
We will perform two reconciliations: the first a nostro (bank) reconciliation and the second adepot reconciliation.
Nostro Reconci l iat ion Cononley Supplies Ltd has, today, received its bank statement,which shows the balance at the close of business on 31/MMM/YYYY as GBP 4,290.00. Theaccountant cannot understand this, as its own records indicate the balance should only be GBP2,700.00.
We will prepare a bank reconciliation using our ledger (see Table 14.8) and the correspondingbank statement (see Table 14.9) to explain the difference(s).
TABLE 14.8 Ledger statement
Ledger as at 31 MMM YYYY
Date Credits Amount Date Debits Amount01 MMM Balance b/d GBP 2,000.00 02 MMM Purchases GBP 400.00
08 MMM V. Carlton GBP 1,000.00 06 MMM Purchases GBP 200.00
11 MMM T. Horton GBP 750.00 10 MMM Wages GBP 500.00
28 MMM B. Radley (a) GBP 600.00 30 MMM Utility bill GBP 200.00
30 MMM Purchases (b) GBP 350.00
31 MMM Balance c/f GBP 2,700.00
Total: GBP 4,350.00 Total: GBP 4,350.00
TABLE 14.9 Bank statement
Bank Statement as at 31 MMM YYYY
Date Details Note DR CR Balance
01 MMM Opening balance GBP 2,000.00 GBP 2,000.00
08 MMM Cheque 01234 GBP (200.00) GBP 1,800.00
10 MMM Cash (c) GBP (500.00) GBP 1,300.00
12 MMM Insurance premium (c) GBP (300.00) GBP 1,000.00
13 MMM Credit GBP 1,750.00 GBP 2,750.00
15 MMM Cheque 01233 GBP (400.00) GBP 2,350.00
25 MMM Credit (d) GBP 2,150.00 GBP 4,500.00
30 MMM Electricity company GBP (200.00) GBP 4,300.00
31 MMM Bank charges (c) GBP (10.00) GBP 4,290.00
31 MMM Closing balance GBP 4,290.00
This is the procedure:
Check that the opening balances of the ledger and the bank statement agree. In thisexample, they do and we can, therefore, proceed.
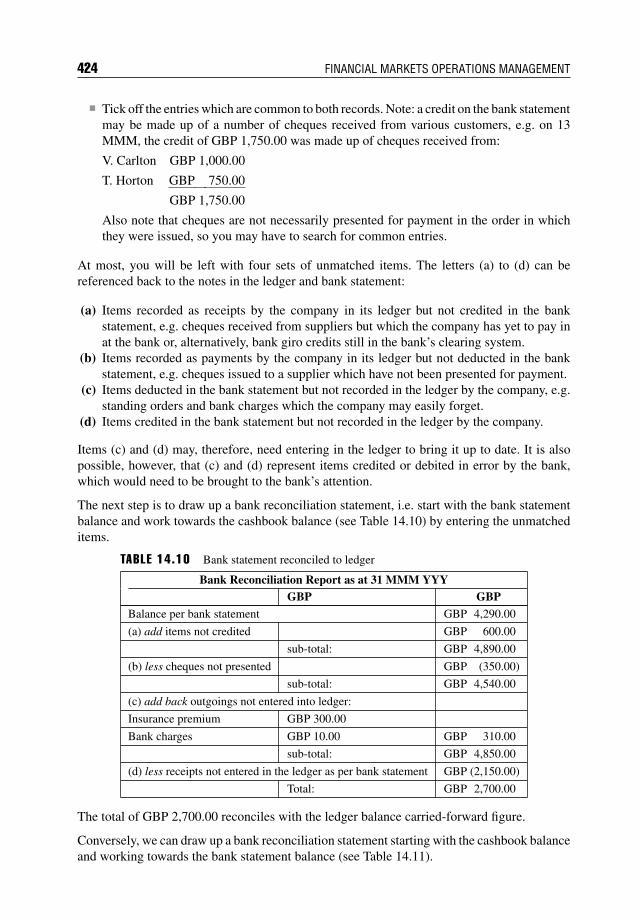
424 FINANCIAL MARKETS OPERATIONS MANAGEMENT
Tick off the entries which are common to both records. Note: a credit on the bank statementmay be made up of a number of cheques received from various customers, e.g. on 13MMM, the credit of GBP 1,750.00 was made up of cheques received from:
V. Carlton GBP 1,000.00
T. Horton GBP 750.00
GBP 1,750.00
Also note that cheques are not necessarily presented for payment in the order in whichthey were issued, so you may have to search for common entries.
At most, you will be left with four sets of unmatched items. The letters (a) to (d) can bereferenced back to the notes in the ledger and bank statement:
(a) Items recorded as receipts by the company in its ledger but not credited in the bankstatement, e.g. cheques received from suppliers but which the company has yet to pay inat the bank or, alternatively, bank giro credits still in the bank’s clearing system.
(b) Items recorded as payments by the company in its ledger but not deducted in the bankstatement, e.g. cheques issued to a supplier which have not been presented for payment.
(c) Items deducted in the bank statement but not recorded in the ledger by the company, e.g.standing orders and bank charges which the company may easily forget.
(d) Items credited in the bank statement but not recorded in the ledger by the company.
Items (c) and (d) may, therefore, need entering in the ledger to bring it up to date. It is alsopossible, however, that (c) and (d) represent items credited or debited in error by the bank,which would need to be brought to the bank’s attention.
The next step is to draw up a bank reconciliation statement, i.e. start with the bank statementbalance and work towards the cashbook balance (see Table 14.10) by entering the unmatcheditems.
TABLE 14.10 Bank statement reconciled to ledger
Bank Reconciliation Report as at 31 MMM YYYGBP GBP
Balance per bank statement GBP 4,290.00
(a) add items not credited GBP 600.00
sub-total: GBP 4,890.00
(b) less cheques not presented GBP (350.00)
sub-total: GBP 4,540.00
(c) add back outgoings not entered into ledger:
Insurance premium GBP 300.00
Bank charges GBP 10.00 GBP 310.00
sub-total: GBP 4,850.00
(d) less receipts not entered in the ledger as per bank statement GBP (2,150.00)
Total: GBP 2,700.00
The total of GBP 2,700.00 reconciles with the ledger balance carried-forward figure.
Conversely, we can draw up a bank reconciliation statement starting with the cashbook balanceand working towards the bank statement balance (see Table 14.11).
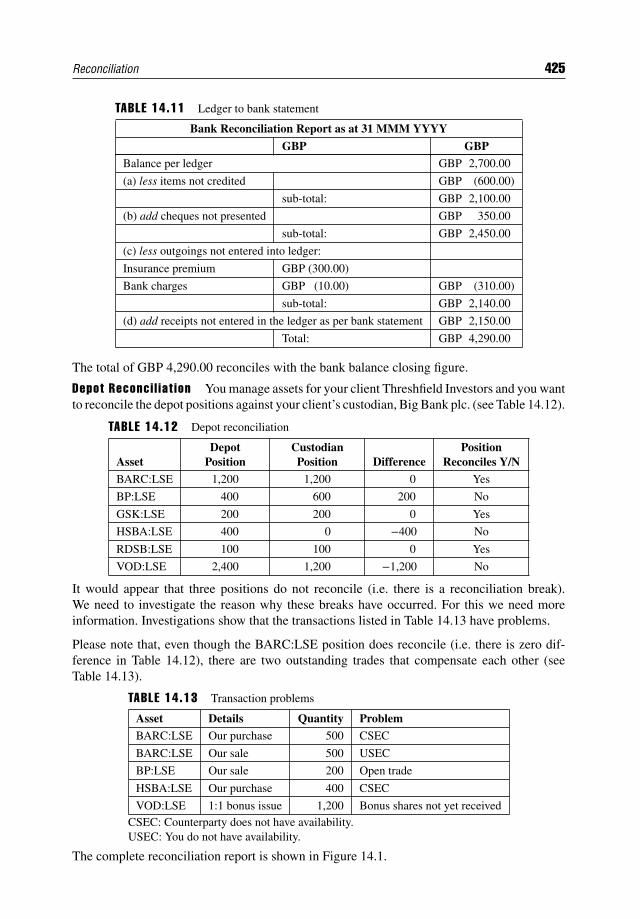
Reconciliation 425
TABLE 14.11 Ledger to bank statement
Bank Reconciliation Report as at 31 MMM YYYY
GBP GBPBalance per ledger GBP 2,700.00
(a) less items not credited GBP (600.00)
sub-total: GBP 2,100.00
(b) add cheques not presented GBP 350.00
sub-total: GBP 2,450.00
(c) less outgoings not entered into ledger:
Insurance premium GBP (300.00)
Bank charges GBP (10.00) GBP (310.00)
sub-total: GBP 2,140.00
(d) add receipts not entered in the ledger as per bank statement GBP 2,150.00
Total: GBP 4,290.00
The total of GBP 4,290.00 reconciles with the bank balance closing figure.
Depot Reconci l iat ion You manage assets for your client Threshfield Investors and you wantto reconcile the depot positions against your client’s custodian, Big Bank plc. (see Table 14.12).
TABLE 14.12 Depot reconciliation
AssetDepot
PositionCustodianPosition Difference
PositionReconciles Y/N
BARC:LSE 1,200 1,200 0 Yes
BP:LSE 400 600 200 No
GSK:LSE 200 200 0 Yes
HSBA:LSE 400 0 −400 No
RDSB:LSE 100 100 0 Yes
VOD:LSE 2,400 1,200 −1,200 No
It would appear that three positions do not reconcile (i.e. there is a reconciliation break).We need to investigate the reason why these breaks have occurred. For this we need moreinformation. Investigations show that the transactions listed in Table 14.13 have problems.
Please note that, even though the BARC:LSE position does reconcile (i.e. there is zero dif-ference in Table 14.12), there are two outstanding trades that compensate each other (seeTable 14.13).
TABLE 14.13 Transaction problems
Asset Details Quantity ProblemBARC:LSE Our purchase 500 CSEC
BARC:LSE Our sale 500 USEC
BP:LSE Our sale 200 Open trade
HSBA:LSE Our purchase 400 CSEC
VOD:LSE 1:1 bonus issue 1,200 Bonus shares not yet receivedCSEC: Counterparty does not have availability.USEC: You do not have availability.
The complete reconciliation report is shown in Figure 14.1.

Ope
ning
Secu
ritie
sB
alan
ces
&R
econ
cilia
tion
Dat
e:D
DM
MM
YY
YY
Shor
tC
ode
Dep
otB
alan
ceC
usto
dian
Bal
ance
Dif
fere
nce
Tra
deF
ails
Pen
ding
C/A
ctio
nsSt
ock
Len
ding
Oth
erP
endi
ngD
iffe
renc
eR
easo
n(s)
for
Dif
fere
nce
BA
RC
:LSE
1,20
01,
200
0+
500
−50
00
00
0Pu
rcha
se50
0sh
ares
S/D
yest
erda
y:re
ason
CSE
C.
Sale
500
shar
esS/
Dye
ster
day;
reas
onU
SEC
BP.
:LSE
400
600
200
(200
)0
00
0O
pen
trad
efo
rS/
Dto
mor
row
GSK
:LSE
200
200
00
00
00
HSB
A:L
SE40
00
(400
)40
00
00
0T
rade
faile
d:re
ason
CSE
C
RD
SB:L
SE10
010
00
00
00
0
VO
D:L
SE2,
400
1,20
0(1
,200
)0
1,20
00
00
Bon
ussh
ares
notr
ecei
ved
FIGU
RE14
.1Se
curi
ties
Rec
onci
liatio
nR
epor
t
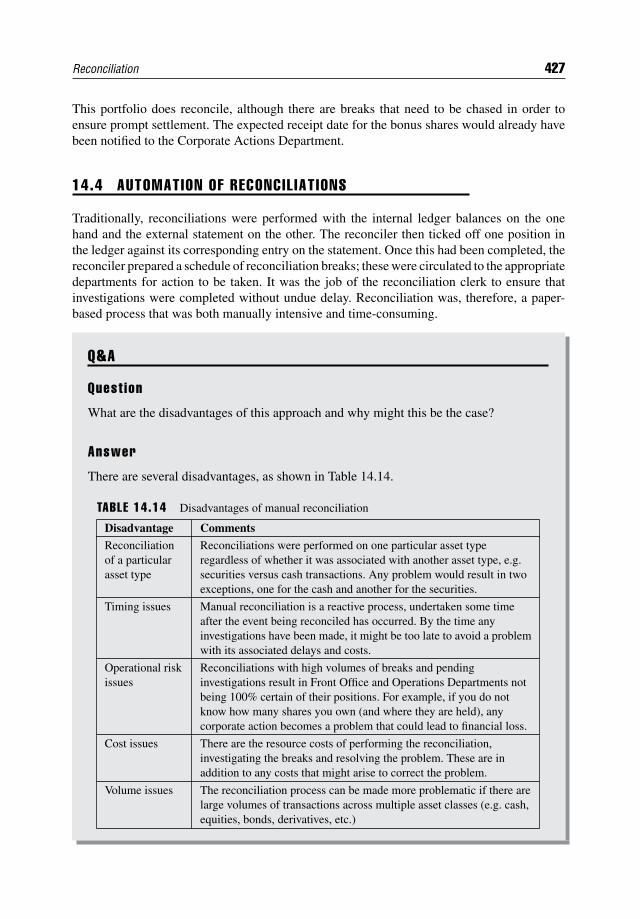
Reconciliation 427
This portfolio does reconcile, although there are breaks that need to be chased in order toensure prompt settlement. The expected receipt date for the bonus shares would already havebeen notified to the Corporate Actions Department.
14.4 AUTOMATION OF RECONCIL IAT IONS
Traditionally, reconciliations were performed with the internal ledger balances on the onehand and the external statement on the other. The reconciler then ticked off one position inthe ledger against its corresponding entry on the statement. Once this had been completed, thereconciler prepared a schedule of reconciliation breaks; these were circulated to the appropriatedepartments for action to be taken. It was the job of the reconciliation clerk to ensure thatinvestigations were completed without undue delay. Reconciliation was, therefore, a paper-based process that was both manually intensive and time-consuming.
Q&A
Quest ion
What are the disadvantages of this approach and why might this be the case?
Answer
There are several disadvantages, as shown in Table 14.14.
TABLE 14.14 Disadvantages of manual reconciliation
Disadvantage Comments
Reconciliationof a particularasset type
Reconciliations were performed on one particular asset typeregardless of whether it was associated with another asset type, e.g.securities versus cash transactions. Any problem would result in twoexceptions, one for the cash and another for the securities.
Timing issues Manual reconciliation is a reactive process, undertaken some timeafter the event being reconciled has occurred. By the time anyinvestigations have been made, it might be too late to avoid a problemwith its associated delays and costs.
Operational riskissues
Reconciliations with high volumes of breaks and pendinginvestigations result in Front Office and Operations Departments notbeing 100% certain of their positions. For example, if you do notknow how many shares you own (and where they are held), anycorporate action becomes a problem that could lead to financial loss.
Cost issues There are the resource costs of performing the reconciliation,investigating the breaks and resolving the problem. These are inaddition to any costs that might arise to correct the problem.
Volume issues The reconciliation process can be made more problematic if there arelarge volumes of transactions across multiple asset classes (e.g. cash,equities, bonds, derivatives, etc.)
428 FINANCIAL MARKETS OPERATIONS MANAGEMENT
Today, we rely on automation to make the initial comparison of ledger vs. statement and toprepare the reconciliation break report. It is at this stage that human intervention takes place.
Reconciliation software is designed to track any transaction throughout its lifecycle, fromconfirmation through settlement to custody and asset servicing and beyond. This means thatat any point in the lifecycle, a reconciliation “match” can be automatically made in real timeand with automated exception processing, investigation and follow-ups. This helps to reduceoperational costs and operational risk. Ideally, the reconciliation software should form partof an overall system that automates, tracks and controls financial transactions and internalprocesses within the firm and beyond (e.g. between a fund manager and its global custodian).
14.5 SUMMARY
Reconciliation of all asset classes is important so that “what you think you have” is actually“what you know you have” and the “assets are located in the right place”. Not only does acompleted reconciliation give you this confidence, but it also ensures that you are complyingwith regulatory rules.
In a reconciliation, we compare two sets of records. These can be our internal records (theledger positions) and external records (bank statements, custody balances, counterparty state-ments, etc.). We could also compare internal records, e.g. our dealing records (blotter) withour settlement records; in other words, Front Office vs. Back Office.
Operations reconciliation staff perform reconciliations from a settlement date perspective, asthey are concerned with what has (or should have) happened. This contrasts with the FrontOffice, which considers its activities from a trade date perspective. This results in Operationsstaff having to be aware of assets which have been traded but not yet settled (open trades) orthose which have failed to settle.
About the Author
K eith Dickinson is Director of The Settlement & Management Research Consultancy Limitedand Principal of Financial Markets Training Limited. After 20 years working in Operations
in the City of London, Keith runs training courses for investment firms around the world and,more recently, teaches within academia.
For seven years, Keith was a Visiting Fellow at the University of Reading/ICMA Centreand a Programme Director at the ICMA Executive Education/ICMA Centre. Currently, he is aSenior Teaching Fellow at the International Business School Suzhou/Xi’an Jiaotong-LiverpoolUniversity, Suzhou.
Keith has written three workbooks published by the Securities Institute, London (now knownas the Chartered Institute for Securities & Investment) as part of its Investment AdministrationQualification (IAQ) and International Capital Markets Qualification (ICMQ):
IAQ Global Custody (1994/2001); IAQ Bond Settlements (1995); ICMQ Module 4 Settlement & Custody of Securities (1995).
429

Index
accountingcorporate actions 297–298for derivatives 411–415equation 397–400investment companies 14lifecycle 400–405, 411–415need for 395–396reconciliation 419for securities 395–416
accrual instruments 19accrued interest, bonds 33–37ACG (Asia-Pacific CSD Group) 171ACSDA (America’s Central Securities
Depositories Association) 171action required
cash forecasting 201FRAs 250interest rate swaps 251OTC options 251settlement failure 220see also corporate actions
active management 104administration, companies in 331–332ADR (American depository receipts) 296AECSD (Association of Eurasian Central
Securities Depositories) 172AFD (available for delivery) securities
204–205affirmation of trade 178, 188–194Africa and Middle East Depositories
Association (AMEDA) 172AFS (available-for-sale) investments 399agent banks see sub-custodiansagent intermediaries 352AGMs (Annual General Meetings) 328–329agricultural products 55–56
allocation of trade 192–193alternative investments breakdown 112alternative trading systems (ATSs) 135, 375alternative trading venues 135–136AMEDA (Africa and Middle East
Depositories Association) 172American depository receipts (ADR) 296America’s Central Securities Depositories
Association (ACSDA) 171AML (anti-money-laundering) requirements
93amortised cost, securities accounting
407–410analytical approach, data management 95announced events, corporate actions 287,
294–295Annual General Meetings (AGMs) 328–329annuity insurance 108anti-money-laundering (AML) requirements
93approved reporting mechanisms (ARMs) 187arbitrage, derivatives usage 50arbitrage trading 349ARMs (approved reporting mechanisms)
187Asia, settlement cycles 228Asia-Pacific CSD Group (ACG) 171ASL (Automated Securities Lending and
Borrowing) 388ASLplus (Securities Lending Services) 388assets
accounting equation 397–400accounting lifecycle 400–405allocation for derivatives usage 50classes 164, 165HNWIs 110–112
431
432 INDEX
assets (Continued)initial margin 239–240insurance companies 108–109management 120optimisation 166ownership vs. location 419–421servicing, CBL 165
assets under custody (AUC) 272Association of Eurasian Central Securities
Depositories (AECSD) 172at-the-money (ATM) options 69ATSs (alternative trading systems) 135,
375AUC (assets under custody) 272audit function, investment companies 14authorities/operations relationships 12–13Automated Securities Lending and
Borrowing (ASL) 388automation, reconciliation 427–428available for delivery (AFD) securities
204–205available-for-sale (AFS) investments
399–400
back office 9–10Balance Sheets 398–400bank accounts, retail clients 102–103bank balance, cash forecasting 201bank reconciliation see nostro reconciliationbank statements 423–424bankruptcy of company 331–332banks/banking 115–126
custody 268, 271, 273, 352foreign CSDs 161world’s largest banks 117
Barclays Bank 296, 312–313barriers, Giovannini Group 286, 324–325batch process settlement 209–210BCS (broker crossing system) 243bearer bonds 300bearer securities 152, 261–262beneficial ownership 263, 325best practice, securities financing 355bid price, securities 404bilateral loans 26bilateral netting 220–221bondholder relationships 331
bondsaccounting lifecycle 402accrued interest 33–37calculations 32–33collateral 239–240conversion 307–309corporate actions 341definition 26deliverable bonds 59–60drop-lock bonds 304equity and 40–41features 27–28first short/long coupon 37–38fixed-income bond coupons 300–301form of 30–31futures contracts 59–60interest payment 30–31issuance 27key characteristics 28–29key dates for 294maturity 31–32nominal amount required 372prices using yields 407purchased at a discount 409–410purchased at par 408–409purchased at a premium 409reconciled position 419redemption 31–32, 305–307, 309reference data 93types 27–30usage 50see also Eurobonds
bonus issue 309–310book-entry settlement 154, 208books, event creation in 296–297books close date see record dateborrowers/borrowing 101–102
approaching lender 357–359banks 115–118cash to finance inventory 349choices for 353–354costs through WHT 366haircut 364–366lender relationship 352securities 338, 343short positions cover 348–349terms 359
Index 433
broker crossing system (BCS) 243brokers 6, 126–127, 243business banking 116business functions 13–14
see also organisational structurebuy-ins 224–227buy side 126, 346–347
see also sell/buy-backsbuyers, securities accounting 400
calculation conventions, securities 410–411call options 49, 66–67, 307Canada, settlement cycles 228capital changes, corporate actions 340capital gains tax 334capital market 17–18capital requirements, derivatives 233capitalisation issue 309–310capped FRNs 305cash
accounting lifecycle 402–403bearer securities 261–262forecasting 179–180, 199–202haircut 364–366scrip dividend arbitrage 350
cash asset reconciliation 421cash collateral, securities financing 368cash currency analysis 376cash-driven repos 372cash dividends 296–298cash instruments 17, 46–47, 81cash per share amount 298cash position reconciliation 421–422cash-related positions 417cash reconciliation 254, 417
see also nostro reconciliationcash value, shares 298CBL see Clearstream Banking LuxembourgCCPs see central counterpartiesCDs (certificates of deposit) 23CDS (credit default swaps) 76Cedel see Clearstream Banking Luxembourgcentral banks 122–123central clearing 233, 241–242central counterparties (CCPs)
clearing house differentiation 175definition 145
derivatives 231, 244–245features 148–150instructions 194model 145–148securities financing 386–389
central operating unit, GLEIS 97central securities depositories (CSDs) 9–10,
148–149, 151–174associations 171–173changing world of 158–160communication 319corporate actions participation 288definitions 154Euro Market custody 277–279features 154–155functions 155–158industry initiatives 325–327interoperability 161–163linkages 161–163, 167–170local markets 267–270nominee 266–267participation 157settlement at 216settlement failure 218T2S 281–282
certificates, securities 156, 259certificates of deposit (CDs) 23CFI (Classification of Financial Instruments)
codes 87–88cheapest to deliver (CTD) futures 64cheques 423–424China, regulatory authorities 130Chinese Wall 128claims, corporate actions 292–293, 295classic repos 371–373Classification of Financial Instruments (CFI)
codes 87–88clean price
bonds 32repos 372, 373securities 402, 407
clean value, bonds 32clearing
CSD linkages 167–170definition 143, 175derivatives 231–256instructions 178–179, 194–199
434 INDEX
clearing (Continued)OTCDs 240–245overview 142–143process 236securities 175–205, 386–387
clearing housesCCP differentiation 175definition 143–144derivatives 412–413features 148–150instructions 194, 196–199model 143–145
clearing members (CMs) 235Clearstream Banking Luxembourg (CBL)
153, 159, 164–165, 277, 279, 388clients
classification, banks 116corporate actions impact 338custody 273–275operations relationships 10–11
clipping coupons 294, 300close-out provisions, securities 384–386closing prices, equity 416CME group 54–56CMs (clearing members) 235code of guidance, securities financing
354–356collared FRNs 305collateral
CME 240management 158OTCDs 251–252receipt of 361–361securities financing 368–369, 379–384types 380value, loaned securities 362
collective investment schemes 114commercial paper (CP) 23–24Committee for Payment and Settlement
Systems’ Statistics (CPSS) 148–149commodity swaps 76communication chains, issuer/investor 289,
317–318communication problems, corporate actions
315–316compensation process, corporate actions
292–293
compliance function, investment companies14
computer-to-computer-based applications167
confirmation of tradenon-cleared OTCDs 248securities clearing 178, 188–194
confirmation of transaction, securitiesfinancing 359–360
connectivityCBL 165EB 167
contract specificationsETDs 52–53MTFs 134options 68–69
control function, back office 10conversion factors, futures 62–63convertibility, preference shareholders 331convertible bonds 30, 307–309convertible-rate FRNs 305corporate actions 285–341
CSDs 158event processing 294–315event types 286–287, 314–315, 340–341income 366industry initiatives 323–327information flows 315–320participation in 287–289risks 320–323types 294
corporate banking 119–120corporate finance, front office 5corporate governance 328–333corporation tax 13, 331corrective actions, reconciliation 419costs
amortised 407–410to borrower, WHT 366
counterpartiesaccounting lifecycle 412clearing instructions 198data requirements 91–92operations relationships 11–12securities clearing 186
counterparty risk, clearing house model 145country usage, ETDs 51
Index 435
coupons 37–38fixed-income bond coupons 300–301floating-rate notes 302–305key dates for 294payment 302–303see also interest rate bonds
CP (commercial paper) 23–24CPSS (Committee for Payment and
Settlement Systems’ Statistics)148–149
credit default swaps (CDS) 76credit facilities, EB 168credit OTCDs 242credit ratings, securities financing 390creditor repayment priority order 332cross-currency repos 373–374CSDs see central securities depositoriesCTD (cheapest to deliver) futures 64cum-dividend timeline 291cum-entitlement period, corporate actions
292currency forwards 72currency swaps 76custodian banking 161, 268, 271, 273, 352custodians 267–279
communication 316–319corporate actions participation 287–288holding securities 263registered securities 262–263
custody 259–283definition 260EB services 166HIC repos 378–379national rules 325see also safekeeping
customer data requirements 91–92
data capture risk 321data formats, proxy voting 330–331data management 83–99
approaches to 94–95defining 94standardisation 84–86
data processing 95data services, CSDs 158data vendors 288databases 83, 340
day-basis accrued interest 36–37DBV see delivery by valueDCMs (designated contract markets) 243dealers 6, 127dealer’s blotter 182dealing in derivatives 49dealing sheet 183dealing tickets 85–86debt finance, corporate banking 120debt instruments 26–38, 42, 89debt security haircuts 364–366decision-making risk 322decision timeline, corporate actions 318default provisions, securities financing
384–386defined benefits pension scheme 107defined contribution pension scheme 107definitive certificates, CSDs 156deliverable bonds 59–60delivery
channels, banks 116corporate actions 295repos 374securities 204–205, 360–361settlement failure 219–222
delivery by value (DBV) 360, 381–382, 391delivery versus payment (DVP) 211–215
clearing 194–196definition 212–213message type selection 215models 213–214repos 376settlement instructions 214–215
dematerialised-form securities 154, 156depositories see securities depositoriesDepository Trust & Clearing Corporation
(DTCC) 158, 168depot reconciliation 421, 425–427derivative exchanges 133–134
examples 54major exchanges 53–56role of 53
derivatives 17, 47–52accounting lifecycle for 411–415clearing 231–256definition 47–49exchange/clearing system 235
436 INDEX
derivatives (Continued)forecasting 203industry sector usage 51markets 81–82non-trading 400regulatory changes 232–234securities distinction 411–412securities financing 349settlement 207, 231–256usage 49–52see also exchange-traded derivatives;
over-the-counter derivativesdesignated account, holding securities
265–266designated contract markets (DCMs)
243direct investment, retail clients 103direct links, CSDs 162directional managers 106dirty price, repos 372dirty value, bonds 32–33disclosure
cash market instruments 46–47equity instruments 46–47reporting 332–333
discount, bonds purchased at 409–410discount instruments 19discount window, central banks 123dividend arbitrage 350–351dividend tax 334dividends, corporate actions 290–291,
296–300, 331, 341documentation
non-cleared OTCDs 245–248securities financing 355
domestic bonds 27domestic CSDs 154
see also local CSDsdomicile bonds 27–28double taxation treaties (DTTs) 335–336drop-lock bonds 304DTCC (Depository Trust & Clearing
Corporation) 158, 168DTTs (double taxation treaties) 335–336DVP see delivery versus payment
earnings, corporate actions 341EB see Euroclear Bank
ECNs (electronic communication networks)135–136
ECP (euro commercial paper) 24ECSDA see European Central Securities
Depositories AssociationEDSP (exchange delivery settlement price)
60, 62–63effective date, FRAs 75election risk 322electronic communication networks (ECNs)
135–136electronic platform trading, derivatives
234electronic trade confirmation (ETC) 190eligible assets, initial margin 239–240energy products 55enrichment of trade 177, 184–186entitlement, corporate actions 289–290, 292,
295, 297, 311environmental tax 334equities
accounting equation 397CCP 147classes 41–43closing prices 416corporate actions 285, 341data management 90debt vs. 40–41definition 38finance, corporate banking 119–120haircuts 364–366issuance 43–44reference data 90securities clearing 184–185see also shares
equity index product listings 55equity instruments 38–47equity repos 374equity swaps 76ETC (electronic trade confirmation) 190ETDs see exchange-traded derivativesETL (extract, transform and load) systems 94Eurex clearing 387Euribor (Euro Interbank Offered Rate) 304euro commercial paper (ECP) 24euro-currency deposits 19–22Euro Interbank Offered Rate (Euribor) 304Euro Markets, custody in 277–279
Index 437
Eurobonds 28, 137, 153–154, 225–226Euroclear Bank (EB) 153–154, 159,
165–167, 279, 282, 388–389Europe
CSD linkages 169–170regulatory authorities 130securities portfolios 364settlement cycles 228trade repositories 188
European Central Securities DepositoriesAssociation (ECSDA) 172, 218,325–327
Eurosystem, T2S 280–281event creation 295, 297
see also corporate actionsevent-driven managers 106event monitoring, OTCDs 254ex-dividend date, corporate actions 290–291ex-entitlement date, rights issue 311ex-entitlement period, corporate actions 292ex-rights price, corporate actions 312–314exchange/clearing system, derivatives 235exchange delivery settlement price (EDSP)
62–63exchange platform trading, derivatives 234exchange-traded derivatives (ETDs) 48–49,
52–71, 231, 234–240accounting lifecycle 412–414summary 71, 81–82
exchangeable bonds 309exchanges see derivative exchanges; stock
exchangesexcise duty 334external clients, operations relationships
10–11external reconciliation 422external records 418–419extract, transform and load (ETL) systems 94
fails management 207–230types 208–211delivery vs. payment 211–215free of payment settlement 215–217settlement failure 217–227shorter settlement cycles 228–229
fair value 398–399, 405–407see also mark-to-market
FIFO (First In, First Out) approach 410
financial accounting 396financial assets, HNWIs 110–112financial instruments 17–82
calculations 21, 32–33, 44–45issuance reasons 18–19reportable 187summary 81–82
Financial Stability Board (FSB) 232–233Financial Standards Board (FSB), banks
117financial statements 397–400financial transaction tax (FTT) 13, 334financing securities 158, 165, 343–392
agreements 354–356code of guidance 354–356intermediaries 352–354players/motivations 346–352summary 389transactions 345–346types 344–346
First In, First Out (FIFO) approach 410first long coupon 38, 301first short coupon 37, 301fixed-income bond coupons 300–301fixed rate
bonds 29FRAs 74IRS 76
fixing dates, money market instruments21–22
flip-flop FRNs 305floating IRS 78floating-rate notes (FRNs) 29, 302–305floating-rate repos 374floored FRNs 305FoP (free of payment) settlement 215–217forecasting
cash 179–180, 199–202securities 180–181, 203–205
foreign bonds 27–28foreign CCPs 245foreign CSDs 161foreign exchange 55, 76forward rate agreements (FRAs) 74–75,
248–249forwards 48, 72–75FRAs see forward rate agreementsfree of payment (FoP) settlement 215–217
438 INDEX
FRNs see floating-rate notesfront office 5–6, 337FSB see Financial Stability Board; Financial
Standards BoardFTT see financial transaction taxfully paid shares 312fund managers 287, 352fund-to-fail approach 179, 202fund-to-settle approach 179, 202funding uncertainties 201–202fungibility, bearer securities 261–262futures 48, 50, 58–64
accounting lifecycle 413options comparison 52–53pricing 60–62risks 70–71single position approach 237
gains, securities accounting 405–411GC pooling market 387general clearing members (GCMs) 235general securities 123generic clearing cycle, securities 176–181gilts 63Giovannini Group 286, 324–325give-up agreements 235–236GLEIS (Global Legal Entity Identifier
System) 96–97global communication chain, issuer/investor
316–318global custody/custodians 271–277
communication 316–318corporate actions participation 287–288services 275–277structure 272–273
global investment managers 114Global Legal Entity Identifier System
(GLEIS) 96–97global macroeconomic events 106global markets, custody in 271–277Global Master Repurchase Agreement
(GMRA) 345, 356, 385Global Master Securities Lending
Agreement (GMSLA) 344–345,384–385
global securities financing, CBL 165global trade repositories, OTCDs 244
GMRA see Global Master RepurchaseAgreement
GMSLA see Global Master SecuritiesLending Agreement
governance see corporate governancegovernment agencies, banking 124–125government bonds 27, 50gridlock scenario, settlement failure 221–222gross settlement 209–210
haircutsrepos 382–384securities financing 364–366
hedge funds 104–106hedge programme, OCC 386hedging derivatives 49held-to-maturity (HTM) investments 399Hibu plc. 339HIC (hold-in-custody) repos 378–379high-net-worth individuals (HNWIs)
110–112high-yield bonds 29–30HNWIs (high-net-worth individuals)
110–112hold-in-custody (HIC) repos 378–379holders, options 64–65holding securities 263–267horizontal integration, CSD linkages 169HSBA shares 204HSBC as local custodian 273HTM see held-to-maturity investmentshuman resources 14hybrid approaches, data management 95
IA (independent amount) 253icing, securities financing 359ICMA see International Capital Market
AssociationICSDs see international central securities
depositoriesIM see initial marginimmobilised-form securities 155–156in-the-money (ITM) options 69income, corporate actions 366income collection, CSDs 158income tax 334incoming trade confirmations 191
Index 439
independent amount (IA) 253indirect investment, retail clients 103individual clearing members see clearing
membersindustry initiatives, corporate actions
323–327industry sector derivatives usage 51information announcements, corporate
actions 341information capture risk 321information flow, corporate actions 315–320information technology, investment
companies 14information vendors 94inheritance tax 334initial margin (IM)
derivatives clearing 236–240ETDs 412independent amount 253
Initial Public Offering (IPO) 43–44input of trade, securities clearing 182–183institutional clients 103–115institutional funds 273institutional investors 273instructions for clearing 178–179, 194–199
matching 196–199types 194validation 196
instructions for settlement, free of payment215
insurance companies 108–109, 273integrated model, T2S 281inter-CSD linkages
CBL 165EB 167
inter-dealer brokers 6, 128interest
bonds 33–37calculations 21, 372–373ETDs 56–58payment, bonds 30–31
interest rate bonds 28see also coupons
interest rate products listing 55interest rate reset, FRNs 302–305interest rate swaps (IRS) 76–80, 251–252interest rates, repos 375–376
intermediaries 101–102, 115corporate actions 285decision timeline 318securities financing 352–354sell-side 126–128
internal audit 14internal clients, operations relationships 11internal reconciliation 422internal records 418–419internal treasury deadlines, cash forecasting
200International Capital Market Association
(ICMA) 34–36, 225–226, 345, 355–356international central securities depositories
(ICSDs) 151–173communication 319corporate actions participation 288definitions 154Euro Market custody 278features 154–155, 164
international securities, settlement cycles229
International Securities IdentificationNumbering (ISIN) 87
International Securities Lending Association(ISLA) 344, 355
International Securities Services Association(ISSA) 323–324
International Swaps and DerivativesAssociation (ISDA) 246–247, 253, 415
interoperability, CSDs 161–163intra-day margin calls 363inventories, borrowing cash to finance 349inverse FRNs 305investment allocation, pension funds 107investment banking 120–122investment companies’ organisational
structure 5–10investment funds services 165, 166investment managers 104
custody clients 274–275front office 6global 114
investment types, accounting 405investors
information from issuers 317information to issuers 318
440 INDEX
investors (Continued)issuer communication chains 289,
316–319issuer relationships 285
invoicing amounts, gilts 63IPO (Initial Public Offering) 43–44IRS (interest rate swaps) 76–80,
251–252ISDA (International Swaps and Derivatives
Association) 246–247, 253, 415ISIN (International Securities Identification
Numbering) 87ISLA (International Securities Lending
Association) 344, 355ISSA (International Securities Services
Association) 323–324issuers
information to investors 317information from investors 318investor communication chains 289,
316–319investor relationships 285
ITM (in-the-money) options 69
Japan, regulatory authorities 130
know your customer (KYC) requirements93
Last In, First Out (LIFO) approach 410LCH.Clearnet 386ledgers, reconciliation 423–425legal entity
definitions 96identification 95–99
Legal Entity Identification (LEI) systems96–99
legal ownership, securities 263LEI (Legal Entity Identification) systems
96–99lenders 101–102
banks 115borrower relationship 352borrowers approaching 357–359choices for 353–354see also loans
lendingfees 368–370securities 338, 344, 354–355, 368–370,
381, 388see also loans
liabilities 397LIBID (London Interbank Bid Rate) 20LIBOR (London Interbank Offered Rate) 20,
75, 302life insurance 108lifecycle
accounting for derivatives 411–415accounting for securities 400–405reconciliation 428repos 370–379securities lending 356–370
LIFO (Last In, First Out) approach 410Link Up Markets venture 160liquidation 331loans
closure 367commencement 361initiation 357–361maintenance 361–366see also debt instruments; lenders; lending
local CCPs 245local communication chain 318–319local CSDs 288
see also domestic CSDslocal custodians 273, 288, 318–319local markets, custody in 267–270local operating unit, GLEIS 97local taxes, equity instruments 45location vs. ownership, reconciliation 418,
419–421London Interbank Bid Rate (LIBID) 20London Interbank Offered Rate (LIBOR) 20,
75, 302long coupons 38, 301long futures contracts 61long put options 67long-term credit ratings, securities 390losses, securities accounting 405–411
M&As (mergers and acquisitions) 120macro operations 176
Index 441
macroeconomic events 106majority shareholders, disclosure reporting
332management accounting 396mandatory convertibles 309mandatory events, corporate actions
286–287, 340manufactured income 366margin
derivatives 234, 236–240ETDs 412–414loan maintenance 361–363OCTD 415repos 382–384securities financing 379–384
Margin Survey, ISDA 253mark-to-market (MTM) 363, 404
see also fair valuemarket associations 129–131market infrastructures, trade lifecycles 141market loan programme, OCC 387market makers/making 6, 127–128, 347market participation 101–137market players 102–131market price, bonds 28–29market regulators 129–131market structure 131–137Master Agreement terminology, securities
379–380matched instructions, securities clearing 179,
196–199maturity
bonds 28, 31–32money market instruments 19–22
mergers, corporate actions 341mergers and acquisitions (M&As) 120metal products 55micro operations 176–184middle office, investment companies 6–9migration plan, T2S 282mini-max FRNs 305minimum transfer amount (MTA), OTCDs
253minority shareholders, disclosure reporting
332mismatch FRNs 304
modelsCCPs 145–148clearing house 143–145DVP 213–214T2S 281
money marketcapital market differentiators 17–18instruments 19–26
money transfer, EB 166monitoring
back office 10OTCDs 254
mortgage agencies, USA 125MRW shares 204–205MTA (minimum transfer amount), OTCDs
253MTFs see multilateral trading facilitiesMTM see mark-to-marketmultilateral netting 222multilateral trading facilities (MTFs) 135,
243municipalities, banking 123–124mutual funds 112–115, 403
national CSDs see domestic CSDsnational numbering agencies (NNAs),
securities 87national rules, corporate actions 325national securities exchange (NSE) 243National Settlement Depository (NSD),
Russia 160NAV (net asset value) 403–404NCMs (non-clearing members) 235–236negative correlation, securities financing 361negotiating terms, securities financing 359net asset value (NAV) 403–404net settlement 209, 210–211new issuance
CBL 164EB 166
nil paid rights (NPR) 312–313NNAs (national numbering agencies) 87nominal amount required, bonds 372nominee account, holding securities 264–266non-cash assets, reconciliation 421non-cash collateral 368–370
442 INDEX
non-cleared OTCDs 245–255non-clearing members (NCMs) 235–236non-life insurance 108non-trading derivatives 400non-treaty rate countries 335–336nostro reconciliation 423–425
see also cash reconciliationnovation 62NPR (nil paid rights) 312–313NSD (National Settlement Depository),
Russia 160NSE (national securities exchange) 243numbering systems, data management 87NYSE LIFFE futures contracts 60
OCC (options clearing corporation) 386–387offer price, securities 404omnibus account, holding securities 264–265on demand securities 358open derivatives contracts 207open interest, ETDs 56–58open loans 367open market operations, central banks 123open repos 371open trade reconciliation 421operational CCPs 244operations office see back officeoperations relationships 10–13optional stock dividends 298–300options 49, 64–71
actions required 251bond redemption 305–307CME listing 55FRAs vs. 248–249futures comparison 52–53pricing 69–71risks 70–71specifications 68–69
options clearing corporation (OCC) 386–387ordinary shares 41–42organisational structure, investment
companies 5–10organised trading facilities (OTFs) 136, 243OTC market see over-the-counter marketOTCDs see over-the-counter derivativesOTFs see organised trading facilitiesout-of-the-money (OTM) options 69
outgoing trade confirmations 190output of trade, securities clearing 183–184over-the-counter derivatives (OTCDs) 48,
71–81, 136–137, 231, 234–235accounting lifecycle 415amounts outstanding 73clearing 240–245CME listing 55non-cleared 245–255summary 80–81trade repositories 188
over-the-counter (OTC) market 131,136–137, 403
overnight DBV 382owners’ equity, accounting equation 397ownership rules 325ownership transfer, securities 261–263,
350–352ownership vs. location, reconciliation 418,
419–421
PALs (provisional allotment letters) 312pari passu shares 310partial settlement 219–220passive management 104payers, IRS 77–78paying agents 288–289payment
corporate actions 292, 295, 341corporate banking services 119–120coupons 302–303reconciled account 419statistics, CPSS 148–150system deadlines, cash forecasting 200
payment date 292pending items, cash forecasting 201pension funds 106–108, 273, 352perpetual FRNs 305personal banking 116
see also private bankingPFs (price factors), futures 62–63physical settlement type 208platform trading, derivatives 234pooled account, holding securities 264–265pooling market, securities 387portfolio position approach, derivatives
clearing 239
Index 443
portfolioschoice 353–354ETDs 412European securities 364reconciliation 254–255revaluation 403–405
positions, reconciliation 417, 419, 421, 425positive correlation, securities 361predictable events, corporate actions 287predictive forecasting 202
see also forecastingpreference shareholder relationships 331preference shares 42–43premium
bonds purchased at 409options 65
premium-settled options 65prescription period, fixed-income bond
coupons 300price factors (PFs), futures 62–63pricing
bonds using yields 407corporate actions impact 339–340equity 43–45, 415futures 60–62options 69–71rights issue 312–314securities 403
principal amount, bonds 28principal intermediaries, securities financing
353private banking 118–119
see also personal bankingprivate wealth management 110–112processing non-cleared OTCDs 248processing problems, settlement failure
218–219profit and loss, options 65–66Profit and Loss Statement 397–398, 411project status, shorter-cycle settlement
228–229property analogy, clearing houses 143property tax 334proprietary trading, investment banking
120provisional allotment letters (PALs) 312proxy voting 329–331
purchase funds 31–32purchases
settlement 215settlement failure 222–224
put options 49, 66–68, 306–307
quasi-sovereigns 123–126
real time gross settlement (RTGS) 209rebate rate, securities 368receipts, settlement failure 222–224receive versus payment (RVP) 194–196,
212, 214–215receivers, IRS 77–78receiving agents, corporate actions 288–289reclaiming tax 336reconciliation 417–428
automation 427–428back office 10corporate actions 295, 323, 339importance 418–421methods 422OTCDs 254–255shares 204–205types 421–427worked examples 423–427
reconciliation risk 323record date, corporate actions 290records, event creation in 296–297redemption
bonds 31–32, 305–307, 309corporate actions 341
reference databonds 89–90corporate actions impact 340equity 93–94importance 84–86sources 93–94types 86–94
reference rate, FRAs 74reform requirements, derivatives 233–234regional custody 269–270registered CCPs 245registered securities 152, 260–261, 262–263regulated markets (RMs) 131–134, 243regulators, market regulators 129–131regulatory changes, derivatives 232–234
444 INDEX
regulatory oversight committee, GLEIS96–97
regulatory reporting, securities 186–188reinvestment rate, securities 368relative value, managers 106relayed links, CSDs 162–163repayment calculation, money market
instruments 21replacement risk, corporate actions 322repo desk 6
see also repurchase agreementsreportable instruments, securities 187reportable transactions, securities 186reporting
corporate actions 295, 332–333derivatives 233securities clearing 177, 186–188
repository services 158see also trade repositories
repurchase agreements (repos) 6, 344–345,355–356
collateral/margin 380–381definition 344–345Euro market 387exposure 382–384lifecycle 370–379motivations 370–371types 371–374
repurchases, corporate actions 341reputational risk 322required reference data 86–87research, front office 6reserve requirements, central banks 123retail banking 118retail clients 102–103revaluation of securities 403–405revenue securities 123–124revenues protection, back office 10reverse convertibles 309reverse repos 223, 344rights issue 310–314risk management 14, 147–148risk profiles, securities 185risks
clearing house model 145communication problems 316corporate actions 320–323
derivatives usage 51futures 70–71options 70–71
RMs see regulated marketsrounding convention, OTCDs 254routes to market, securities 352–354RTGS (real time gross settlement) 209Russian National Settlement Depository 160RVP see receive versus payment
safekeepingsecurities 152, 155–157, 173summary of methods 267see also custody
salesfront office 5registered securities 262–263securities financing 348settlement 215settlement failure 219–222see also sell…
same-day affirmation (SDA) 192SB-SEF (security-based SEF) 243screen-based applications, EB 167scrip dividend arbitrage 350–351scrip options 299SDA (same-day affirmation) 193–194securities
accounting for 395–416available for delivery 204borrowing 338, 344CCP support 231clearing 143, 175–205corporate actions 323–324custody 260–261data requirements 87–90, 95delivery 360–361dematerialised form 154, 156derivatives distinction 411–412financing 120, 158, 165, 343–392forecasting 179–181, 203–205forms of 260–261holding securities 263–267immobilised form 154issuance 120lending 338, 344, 353–354, 368–370, 381,
388
Index 445
municipalities 123–124not available for delivery 204–205purposes/time horizons 18revaluation 403–405reverse repos 223settlement cycles 228–229settlement types 208–209T2S 279–282transactions 84–86transfers 213–214see also bonds; equity
securities depositories 151–173historical context 151–154settlement at 216settlement failure 218see also central securities depositories
securities-driven repos 373Securities Lending Services (ASLplus) 388securities-related positions 417securitised loans 26security-based SEF (SB-SEF) 243SEFs see swap execution facilitiessegregated account, holding securities
265–266sell/buy-backs 345, 374–376, 380–381sell-outs 224, 226–227sell-side
Euro Market custody 277–278intermediaries 126–128securities financing 347–348see also sales
sellers, securities accounting 400services offered, global custody 275–277settlement
at a designated time 209–210clearing house model 144–145conventions 216–217corporate actions impact 338definition 142, 207derivatives 231–256failure 217–227, 348information, data requirements 92–93instruction types 194location 216management 207–230overview 142–143in real time 209
repos 376–379securities 153, 157, 164, 166, 175, 194shorter cycles 228–229statistics 148–150types 208–211
settlement date, securities 401, 402–403settlement failure management 348share register entries 262shareholders
disclosure reporting 332–333meetings 341relationships 328–329, 331
sharesclasses 41–43optional stock dividends 298–300reconciliation 204–205rights issue 312–313scrip dividend arbitrage 350–351value of 403–405see also equity
short call options 67short coupons 37, 299–301short futures contracts 61short positions, borrowing to cover 348–349short put options 68short selling, securities 348shorter-cycle settlement 228–229SI (systematic internaliser) 243SIFIs (systemically important financial
institutions) 117simple interest calculation 21Singapore
buy-ins 226equity closing prices 416regulatory authorities 130
single position approach, derivatives 237sinking funds 31software for reconciliation 428sovereign borrowers, haircuts 365sovereign wealth funds (SWFs) 109–110SPAN see Standard Portfolio Analysis of
Riskspecial securities see on demand securitiesspecialist finance, corporate banking 120speculation, derivatives usage 49–50SSI (standing settlement instructions) 93stamp duty 13
446 INDEX
Standard Portfolio Analysis of Risk (SPAN)239, 412
standardisation, data management 84–86standards implementation, corporate
governance 327standing settlement instructions (SSI) 93statements see bank statements; financial
statementsSTF (stock transfer form) 262stock dividends 298–300stock exchanges 131–133, 167–170stock loans, OCC 386stock options 300stock transfer form (STF) 262stockbrokers 6stocks recorded in investor’s name 263straight bonds 305street name securities 266–267sub-custodians 271, 272–273, 288subscription costs, rights issue 311supervisory haircuts 365suppliers/operations relationships 12supranational agencies 125–126swap execution facilities (SEFs) 136, 243SwapClear 415swaps 49, 76–80
see also interest rate swapsSWFs (sovereign wealth funds) 109–110SWIFT message format 317syndicated loans 26systematic internaliser (SI) 243systemic issues, settlement failure 227systemically important financial institutions
(SIFIs) 117
T2S (Target2Securities) models 279–282“T-account” format 401T-bills (treasury bills) 25–26Target2Securities (T2S) models 279–282tax reclaims 336taxation
accounting need 395corporate actions 333–336equity instruments 45investment companies 13see also withholding tax
technology vendors 392temporary ownership transfer, securities
350–352term DBV 381term loans 367term repos 371theoretical ex-rights price (TERP) 312–314third-party agents, securities financing 352third-party custody providers 279threshold, OTCDs 253time schedule, proxy voting 330time zones, cash forecasting 200timing issues
cash forecasting 199–200settlement 209–210
toll tax 334trade affirmation, securities 178, 190–194trade allocation, securities 192–193trade association websites 130–131trade-by-trade reconciliation 421trade capture
non-cleared OTCDs 248–249securities clearing 176, 182–184
trade confirmationnon-cleared OTCDs 249–250securities clearing 178, 189–190
trade date, securities 400, 401–402trade discrepancies’ resolution 9trade enrichment, securities 177, 184–186trade input, securities 182–183trade lifecycles, market infrastructures 141trade output, securities 183–184trade reporting 177, 233trade repositories 188, 244trade tickets 184, 185trade validation, securities 177, 184–186traded position reconciliation 421traders 127trading
analysis of repos 376front office 5–6platforms for OTCDs 242–243venue alternatives 135–136volumes of ETDs 56–58
trading assets, definition 400transaction tickets 185
Index 447
transactional approach, data management94
transactionsclearing instructions 197CSDs 156data management 84–86depot reconciliation 425ETDs 413reporting 186–187securities financing 343, 345–346,
359–361settlement failure 217–227
transfers, securities 212, 261–263, 350–352treasury bills (T-bills) 25–26treasury deadlines, cash forecasting 200treasury function, investment companies 14treaty rate countries 335–336tri-party contracts, repos 375, 377–378
UK see United Kingdomunauthorised payment, reconciled account
419uncertainties, funding 201–202underwriting securities 120United Kingdom (UK)
regulatory authorities 130treasury bills 25–26
United States of America (USA)CSD linkages 168dollar commercial paper 24DTCC 158, 168investment banking 121mortgage agencies 125regulatory authorities 129settlement cycles 228street name securities 266–267treasury bills 25
unmatched instructions, securities clearing179, 197–199
unrealised gains 405unrealised losses 405
unsettled items, cash forecasting 201USA see United States of America
validation of instructions, clearing 196validation of trade, securities 177, 184–186value
bonds 32securities revaluation 403–405shares 405–407
value-added services, global custody 277value added tax (VAT) 334value dates, money market instruments
20–22variable rate note 305variation margin (VM) 236, 413–414VAT (value added tax) 334vehicle tax 334vertical integration, CSD linkages 169VM see variation marginvoluntary events, corporate actions 286–287,
341voting rights
corporate actions 366exercising 351–352preference shareholders 331see also proxy voting
WAC (Weighted Average Cost) approach410–411
weather products 56websites, regulators/trade associations
130–131Weighted Average Cost (WAC) approach
410–411withholding tax (WHT) 13, 334, 366writers, options 64–65
Yell Group plc. 339yield, bonds 28, 407
zero-coupon bonds 29

WILEY END USER LICENSEAGREEMENT
Go to www.wiley.com/go/eula to access Wiley’s ebookEULA.


