Embed Size (px)
Citation preview
i
Mekelle University
The School of Graduate Studies
Faculty of Dry land Agriculture and Natural Resources
Financial Performance of Cooperatives in Enderta Woreda,
Tigray Region, Ethiopia
By: Tsegay Berhane
A thesis
Submitted in Partial Fulfillment of the Requirements for the
Master of Science Degree
In
Cooperative Marketing
Advisor: Kelemework Tafere (Dr.)
March, 2008
Declaration
This is to certify that this thesis entitled “Financial Performance of Cooperatives in Enderta
Woreda, Tigray Region, Ethiopia” submitted in partial fulfillment of the requirements for the
award of the degree of M.SC., in Cooperative Marketing to the School of Graduate Studies,
Mekelle University, through the Department of Cooperative Marketing, done by Mr.Tsegay
Berhane Reda, Id.No. FDA/GR024/98 is authentic work carried out by him under my guidance.
The matter embodied in this project work has not been submitted earlier for award of any degree
or diploma to the best of my knowledge and belief.
Name of student __________________________Signature_________ Date ______________
Name of the supervisor _____________________ Signature__________Date _____________
ii
Table of contents pages
Chapter One..................................................................................................................................... 1
1. Introduction ................................................................................................................................. 1
1.1Background and Justification of the Study............................................................................. 1
1.2 Statement of the Problem ...................................................................................................... 6
1.3 Purpose of the Study.............................................................................................................. 7
1.4 Hypothesis of the Study......................................................................................................... 7
1.5 Objectives of the Study ......................................................................................................... 8
1.6 Scope of the Study................................................................................................................. 8
1.7 Limitation of the Study.......................................................................................................... 8
1.8 Chapterization of the Study ................................................................................................... 9
1.9 Definition of Terms ............................................................................................................... 9
Chapter Two .................................................................................................................................. 11
2. Literature Review ...................................................................................................................... 11
2.1 Definition, Values and Principles of Cooperatives ............................................................. 11
2.2 Concept of Financial Analysis............................................................................................. 14
2.3 Financial Statements and Ratio Analysis for Cooperatives................................................. 16
2.3.1 Basic Formulas of Ratio Analysis ................................................................................ 16
2.3.2 Financial Statement Analysis ....................................................................................... 17
2.3.3 Common-Size Statements............................................................................................. 18
2.3.4 Ratio Analysis .............................................................................................................. 19
2.3.5 Standard Financial Ratios............................................................................................. 20
iii
2.4 Empirical Studies................................................................................................................. 24
Chapter Three ................................................................................................................................ 29
3. Materials and Methods .............................................................................................................. 29
3.1 Area of the Study................................................................................................................. 29
3.2 Methodology and Data Collection....................................................................................... 30
3.3 Sampling Technique and Samples....................................................................................... 31
3.4 Techniques of Data Analysis and Interpretation ................................................................. 33
Chapter Four .................................................................................................................................. 34
4. Results and Discussions ............................................................................................................ 34
4.1 Development of Enderta Woreda Selected Cooperatives ................................................... 34
4.1.1 Introduction .................................................................................................................. 34
4.1.2 Origin of the Cooperative in the Woreda. .................................................................... 36
4.1.3. Objectives of the Enderta Woreda Cooperatives......................................................... 38
4.1.4. Organizational Structure of the Cooperatives in the Woreda...................................... 39
4.1.5. Management of the Cooperatives in the Woreda ........................................................ 43
4.1.6. Capital Structures of Cooperatives in the Enderta Woreda......................................... 46
4.1.7 Human Resource Management of Enderta Cooperatives............................................. 49
4.1.8. Training and Development of Enderta Woreda Cooperatives..................................... 51
4.2 Measurement of Enderta Woreda Cooperative Financial Performance .............................. 52
4.2.1 Introduction of Ratio Analysis ..................................................................................... 52
4.2.2. An Evaluation of Financial Performance of Cooperatives in the Woreda .................. 53
4.3. Perception of Members on the Role of Cooperatives......................................................... 91
iv
Chapter Five .................................................................................................................................. 94
5. Conclusions and Recommendations.......................................................................................... 94
5.1 Introduction ......................................................................................................................... 94
5.2 Conclusions ......................................................................................................................... 94
5.3 Recommendations ............................................................................................................... 99
References ............................................................................................................................... 102
Appendices .............................................................................................................................. 104
v
Abstract
A cooperative society is an economic entity organized by people who having common interest,
through pooling reasonable capital they have, so that they would be able to share the results with
their fellow members and where members’ democratic participation is highly expressed. The
development movement of cooperatives in Ethiopia shows different ups and downs. This was
mainly due to different socio – economic policies followed by the Country under different
Governments.
Finance is the driving power that rotates the wheels of business. Financial management has a
profound impact on business efficiency of an enterprise. In a cooperative enterprise a sound
financial planning and proper management is the most vital requirement for success of a business
enterprise.
The general objective of this study is to measure the financial performance of cooperatives in the
Enderta Woreda and to recommend appropriate and reliable monitoring in management practice.
The numbers of cooperatives in the Enderta Woreda that obtain legal personality were totally 56
Primary Cooperatives and 1 Multipurpose Cooperative Union and their status had increased from
time to time. In analyzing the financial performance of the cooperatives in the Woreda, ratio
analysis and focus group discussion were used. On the basis of the results of the ratio analysis,
the researcher has found that the financial performance of the cooperatives was not highly
encouraging. The liquidity ratio in the three years period was fluctuating and most of the time
was below the norm. The gross profit margin of the cooperatives showed positive amount at
fluctuating rate. The focus group discussion showed that the perception of the cooperative
members on their role was positive .From the discussion and analysis, the main reasons for the
poor financial performance of the cooperatives in the Woreda were inefficient management skill,
vi
significant part of the total capital employed was in the form of borrowed capital, non-availability
of adequate quantity and quality of raw materials at reasonable prices and at the right time,
competition from outside the cooperative sector, lack of manpower with relevant expertise and
professional qualification, lack of clear accounting system for all the cooperatives, and that
financial statements of all the cooperatives were not prepared at the end of the fiscal year. Based
on these findings the following recommendations are forwarded:
• The cooperatives shall issue additional shares to increase self- financing.
• The cooperatives shall launch market surveys and adjust production to correspond market
needs by diversifying their products.
• A new recruitment policy shall be formulated by the government.
• The cooperatives shall develop a policy of profitability.
Finally, since cooperatives play an important role in furthering the process of economic
development in developing countries like Ethiopia, researchers shall make further research
undertakings.
vii

Acknowledgements I would like to express my deepest appreciation and gratitude to my advisor, Dr Kelemework
Tafere, for his having being extremely kind and generous in advising me to write this thesis and
helping me to keep abreast of the latest information in the field of my special area of study from
the beginning of the research up to its completion. I am particularly indebted to him for the pains
he took in going thoroughly through every line I wrote and also for his valuable suggestions and
constructive remarks he made.
I take this opportunity to express my sincere gratitude’s to all my instructors especially Dr
Verakumaraan, Assistant Professor, Head Department of Cooperatives, Dr.G.B.Pillai, Professor,
Department of Cooperatives and Dr.R.Dayanandan,Associate Professor, Department of Natural
Resources, for their support and encouragement in various ways at different stages of my work
and also for approving my research work.
I also express my gratitude to Dr.Solomon Afework, Research and Quality Assurance Head and
Dean of Sheba University College, for looking through every line of my paper and for his
constructive comments.
My thanks are also due to the officials of the Enderta Woreda Cooperative Office, Tigray Region
Cooperative Promotion Office, especially to the auditors and accountants for their generous co
operations through out the course of this research work.
It is my privilege and duty to place on records the facilities and services of the libraries which I
have consulted, namely Mekelle University, Nile College and Sheba University College.
Last but not least, thanks to all my family, especially my father Melake Tsehay Berhane Reda
and my mother Zewditu Tesfuhunegn and also to all my friends who have supported me in
various ways to complete this research study.
viii
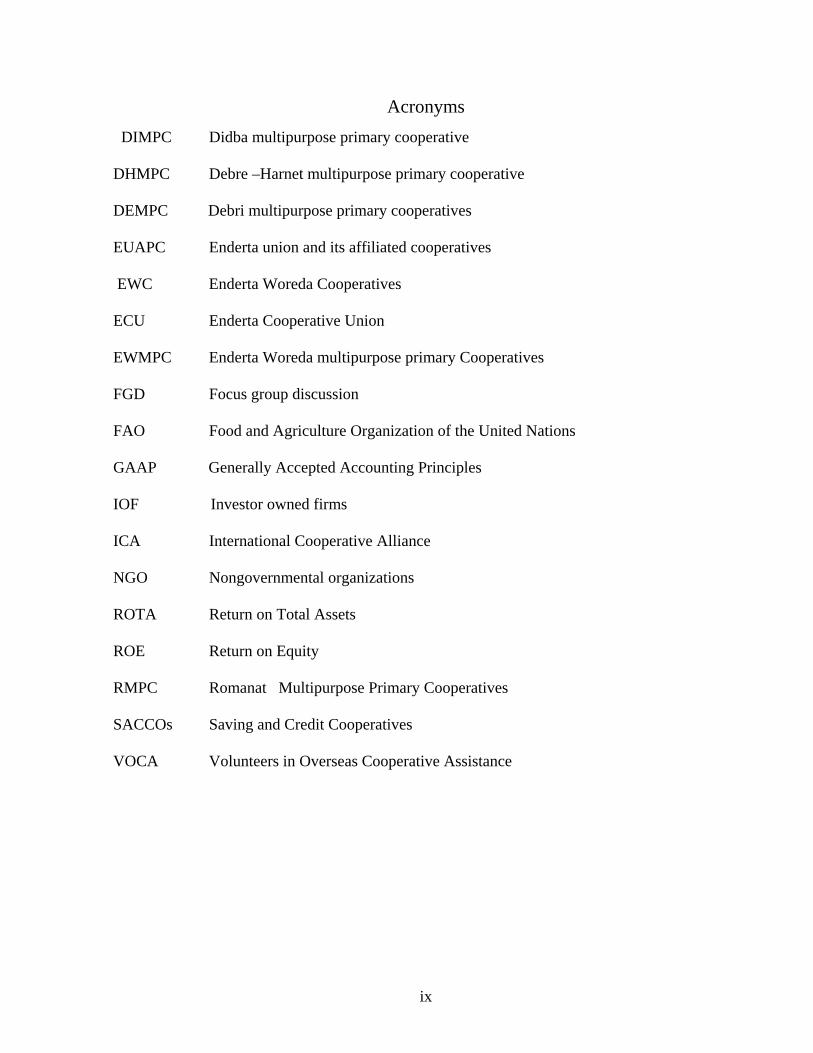
Acronyms DIMPC Didba multipurpose primary cooperative
DHMPC Debre –Harnet multipurpose primary cooperative
DEMPC Debri multipurpose primary cooperatives
EUAPC Enderta union and its affiliated cooperatives
EWC Enderta Woreda Cooperatives
ECU Enderta Cooperative Union
EWMPC Enderta Woreda multipurpose primary Cooperatives
FGD Focus group discussion
FAO Food and Agriculture Organization of the United Nations
GAAP Generally Accepted Accounting Principles
IOF Investor owned firms
ICA International Cooperative Alliance
NGO Nongovernmental organizations
ROTA Return on Total Assets
ROE Return on Equity
RMPC Romanat Multipurpose Primary Cooperatives
SACCOs Saving and Credit Cooperatives
VOCA Volunteers in Overseas Cooperative Assistance
ix
List of Table Pages
Table 4.1 Enderta Woreda Cooperative Status............................................................................. 35
Table 4.2 EUAPC Current Ratios ................................................................................................. 54
Table 4.3 SACCOs Current Ratio ................................................................................................... 55
Table 4. 4 EUAPC Quick Ratios.................................................................................................. 56
Table 4. 5 SACCOs Quick Ratio .................................................................................................... 57
Table 4. 6 EUAPC Total Liabilities to Patron’s Equity Ratio. .................................................... 59
Table 4. 7 SACCOs Total Liabilities to Patrons’ Equity Ratio ...................................................... 60
Table 4. 8 EUAPC Owner’s Equity to Total Assets Ratio........................................................... 61
Table 4. 9 SACCOs Owner’s Equity to Total Assets Ratio. .......................................................... 62
Table 4. 10 EUAPC Fixed Assets to Patrons’ Equity .................................................................. 63
Table 4. 11 EUAPC Inventory Turnover Ratio............................................................................ 65
Table 4. 12 EUAPC Fixed Asset Turnover Ratio ........................................................................ 67
Table 4. 13 EUAPC Total Asset Turnover Ratio ......................................................................... 69
Table 4. 14 EUAPC Gross Profit Margins Ratio ......................................................................... 71
Table 4. 15 EUAPC Net Profit Margin Ratio............................................................................... 73
Table 4.16 EUAPC Return on Total Assets Ratio ....................................................................... 74
Table 4. 17 SACCOs Return on Total Assets Ratio ....................................................................... 75
Table 4. 18 EUAPC Return on Equity Ratio................................................................................ 76
Table 4. 19 SACCOs Return on Equity Ratio ................................................................................ 77
Table 4. 20 ECU Common-Size Income Statement ..................................................................... 78
Table 4. 21 DEMPC Common -Size Income Statement. ............................................................ 79
Table 4. 22 RMPC Common -Size Income Statement................................................................. 80
x
Table 4. 23 DIMPC Common-Size Income Statement ................................................................ 81
Table 4. 24 DHMPC Common -Size Income Statement.............................................................. 82
Table 4. 25 Deremeyti SACCO Common- Size Income Statement............................................. 83
Table 4. 26 Hayki-Hilet SACCO Common- Size Income Statement ......................................... 83
Table 4. 27 Myawlia SACCO Common- Size Income Statement ............................................... 84
Table 4. 28 ECU Trend Analysis ................................................................................................. 84
Table 4. 29 DEMPC Trend Analysis............................................................................................ 85
Table 4. 30 RMPC Trend Analysis ............................................................................................. 86
Table 4.31 DIMPC Trend Analysis.............................................................................................. 87
Table 4. 32 DHMPC Trend Analysis ........................................................................................... 87
Table 4. 33 Deremeyti SACCO Trend Analysis ......................................................................... 88
Table4.34 Hayki-Hilet SACCO Trend Analysis ......................................................................... 88
Table 4.35 Myawlia SACCO Trend Analysis .............................................................................. 89
TTaabbllee 44..3366 PPeerrcceeppttiioonn ooff MMeemmbbeerrss oonn tthhee rroollee ooff CCooooppeerraattiivveess-- FFGGDD SSuummmmaarryy ..............................92
xi
List of Figures Page Figure 3.1 Enderta Woreda in Tigray Region............................................................................30
Figure 4.1 Organizational structure of SACCO.........................................................................40
Figure 4.2 Organizational structure of Enderta Cooperative Union (ECU)...........................…41 Figure 4.3 Organizational structure of EWMPC-Romanat.......................................... ……….42
xii
Chapter One
1. Introduction
1.1 Background and Justification of the Study
Cooperation is an important tool of living, since it enables individuals to achieve heights which
can not be reached in isolation. This has been proved by Rochadle Pioneers (1844) through their
friendly association. They proved it as an economic vision amidst the industrial revolution (war
basses 1947).As their concept spread across the world, philanthropists and associationists began
to experiment it in other fields of economy. For example Friedrich Wilhelm Raiffeisen (1818 –
1888) successfully tried it on rural credit in Germany, Schulte Delitzsch (1809 – 1883) on urban
credit in Germany.
The pioneer of cooperative movements in various countries used cooperation as a form of
organization for organizing weaker sections like workers, consumers, farmers, artisans, etc., for
liberating them from the exploitation by stronger groups, like traders and money lenders.
In general, cooperative is an economic entity organized by people having common interest
through pooling reasonable capital they have, so that they can be able to share the results and
where members’ democratic participation is highly expressed.
There are different types of cooperatives depending up on the need of members and the character
of the activities accomplished. Generally the objective of any cooperative can be:
• maximization of members’ income.
• to improve the market condition for the improvement of member’s income.
• to bring extended economic management.
• provision of improved social services.
1
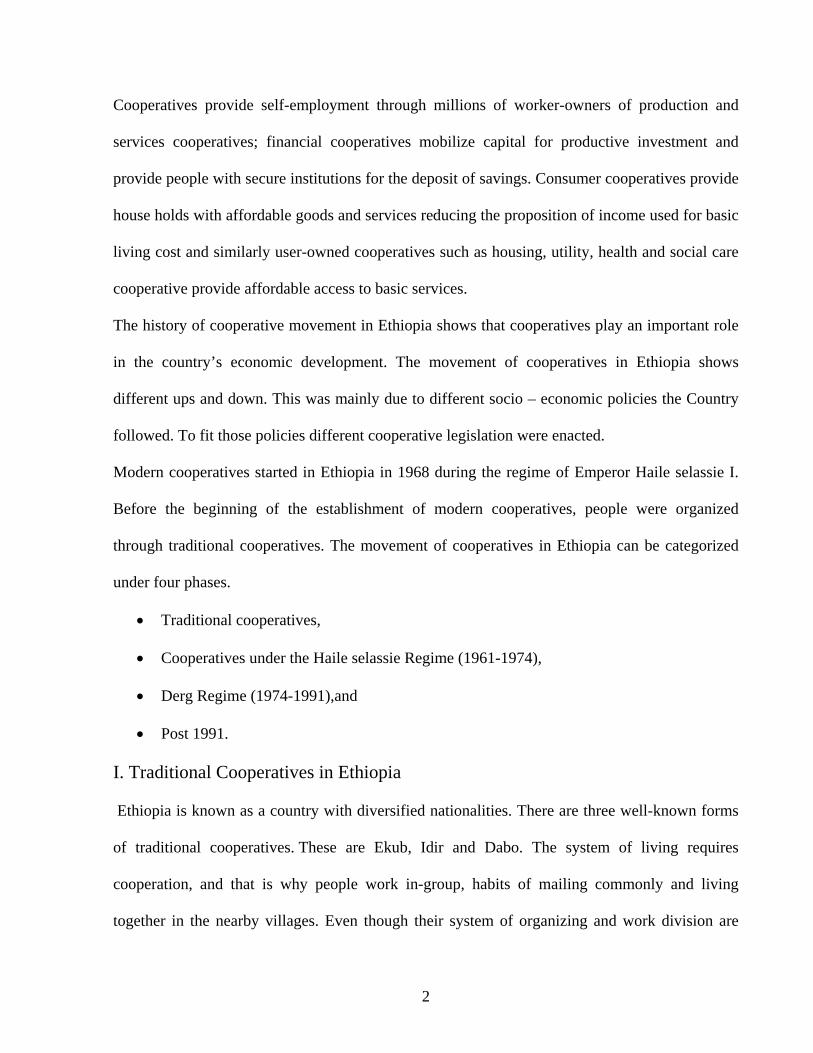
Cooperatives provide self-employment through millions of worker-owners of production and
services cooperatives; financial cooperatives mobilize capital for productive investment and
provide people with secure institutions for the deposit of savings. Consumer cooperatives provide
house holds with affordable goods and services reducing the proposition of income used for basic
living cost and similarly user-owned cooperatives such as housing, utility, health and social care
cooperative provide affordable access to basic services.
The history of cooperative movement in Ethiopia shows that cooperatives play an important role
in the country’s economic development. The movement of cooperatives in Ethiopia shows
different ups and down. This was mainly due to different socio – economic policies the Country
followed. To fit those policies different cooperative legislation were enacted.
Modern cooperatives started in Ethiopia in 1968 during the regime of Emperor Haile selassie I.
Before the beginning of the establishment of modern cooperatives, people were organized
through traditional cooperatives. The movement of cooperatives in Ethiopia can be categorized
under four phases.
• Traditional cooperatives,
• Cooperatives under the Haile selassie Regime (1961-1974),
• Derg Regime (1974-1991),and
• Post 1991.
I. Traditional Cooperatives in Ethiopia
Ethiopia is known as a country with diversified nationalities. There are three well-known forms
of traditional cooperatives. These are Ekub, Idir and Dabo. The system of living requires
cooperation, and that is why people work in-group, habits of mailing commonly and living
together in the nearby villages. Even though their system of organizing and work division are
2
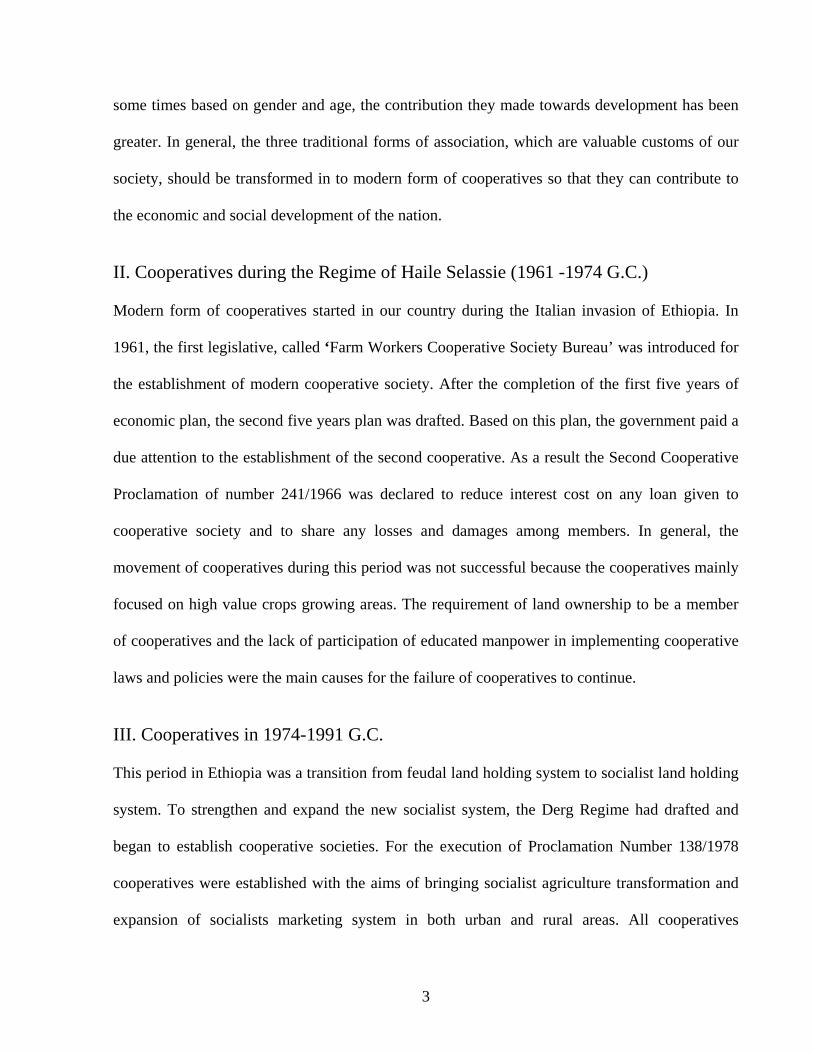
some times based on gender and age, the contribution they made towards development has been
greater. In general, the three traditional forms of association, which are valuable customs of our
society, should be transformed in to modern form of cooperatives so that they can contribute to
the economic and social development of the nation.
II. Cooperatives during the Regime of Haile Selassie (1961 -1974 G.C.)
Modern form of cooperatives started in our country during the Italian invasion of Ethiopia. In
1961, the first legislative, called ‘Farm Workers Cooperative Society Bureau’ was introduced for
the establishment of modern cooperative society. After the completion of the first five years of
economic plan, the second five years plan was drafted. Based on this plan, the government paid a
due attention to the establishment of the second cooperative. As a result the Second Cooperative
Proclamation of number 241/1966 was declared to reduce interest cost on any loan given to
cooperative society and to share any losses and damages among members. In general, the
movement of cooperatives during this period was not successful because the cooperatives mainly
focused on high value crops growing areas. The requirement of land ownership to be a member
of cooperatives and the lack of participation of educated manpower in implementing cooperative
laws and policies were the main causes for the failure of cooperatives to continue.
III. Cooperatives in 1974-1991 G.C.
This period in Ethiopia was a transition from feudal land holding system to socialist land holding
system. To strengthen and expand the new socialist system, the Derg Regime had drafted and
began to establish cooperative societies. For the execution of Proclamation Number 138/1978
cooperatives were established with the aims of bringing socialist agriculture transformation and
expansion of socialists marketing system in both urban and rural areas. All cooperatives
3
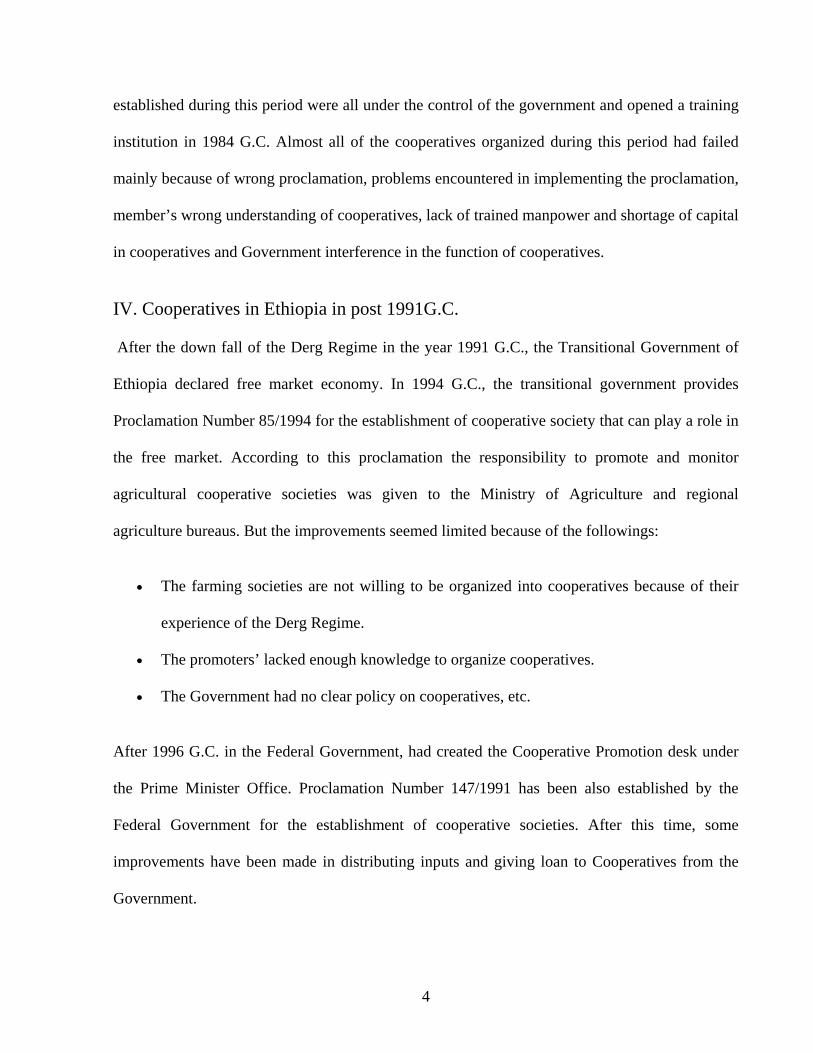
established during this period were all under the control of the government and opened a training
institution in 1984 G.C. Almost all of the cooperatives organized during this period had failed
mainly because of wrong proclamation, problems encountered in implementing the proclamation,
member’s wrong understanding of cooperatives, lack of trained manpower and shortage of capital
in cooperatives and Government interference in the function of cooperatives.
IV. Cooperatives in Ethiopia in post 1991G.C.
After the down fall of the Derg Regime in the year 1991 G.C., the Transitional Government of
Ethiopia declared free market economy. In 1994 G.C., the transitional government provides
Proclamation Number 85/1994 for the establishment of cooperative society that can play a role in
the free market. According to this proclamation the responsibility to promote and monitor
agricultural cooperative societies was given to the Ministry of Agriculture and regional
agriculture bureaus. But the improvements seemed limited because of the followings:
• The farming societies are not willing to be organized into cooperatives because of their
experience of the Derg Regime.
• The promoters’ lacked enough knowledge to organize cooperatives.
• The Government had no clear policy on cooperatives, etc.
After 1996 G.C. in the Federal Government, had created the Cooperative Promotion desk under
the Prime Minister Office. Proclamation Number 147/1991 has been also established by the
Federal Government for the establishment of cooperative societies. After this time, some
improvements have been made in distributing inputs and giving loan to Cooperatives from the
Government.
4
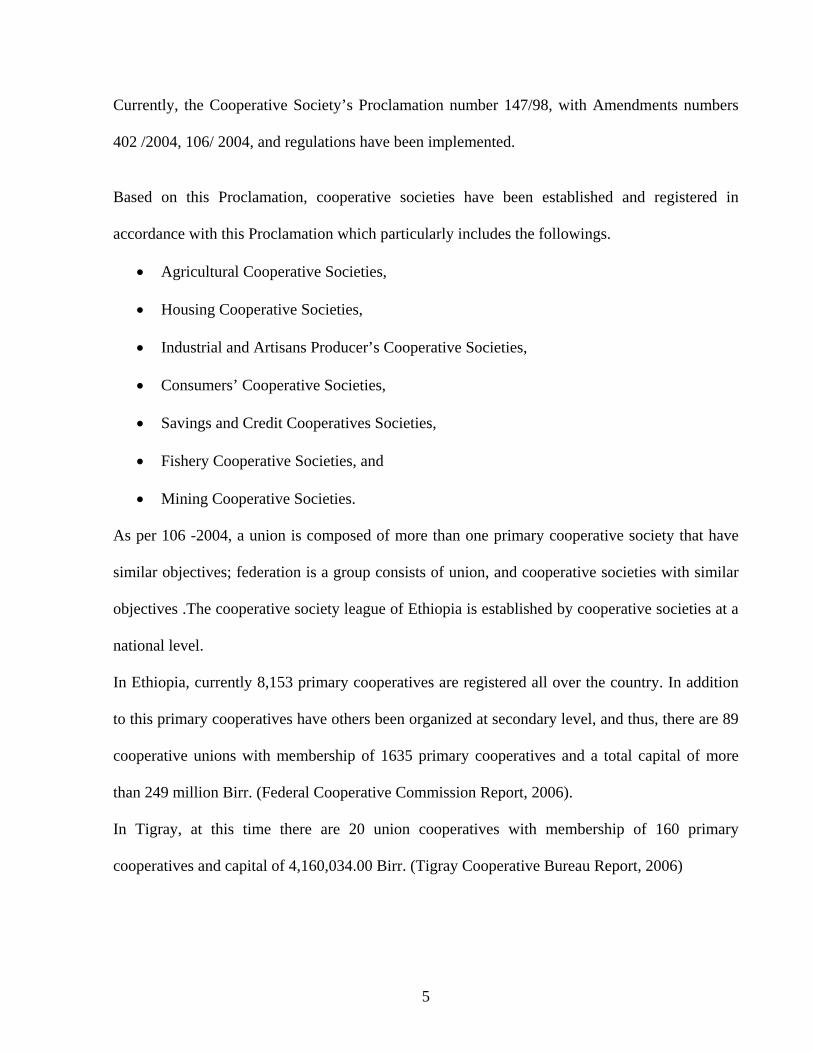
Currently, the Cooperative Society’s Proclamation number 147/98, with Amendments numbers
402 /2004, 106/ 2004, and regulations have been implemented.
Based on this Proclamation, cooperative societies have been established and registered in
accordance with this Proclamation which particularly includes the followings.
• Agricultural Cooperative Societies,
• Housing Cooperative Societies,
• Industrial and Artisans Producer’s Cooperative Societies,
• Consumers’ Cooperative Societies,
• Savings and Credit Cooperatives Societies,
• Fishery Cooperative Societies, and
• Mining Cooperative Societies.
As per 106 -2004, a union is composed of more than one primary cooperative society that have
similar objectives; federation is a group consists of union, and cooperative societies with similar
objectives .The cooperative society league of Ethiopia is established by cooperative societies at a
national level.
In Ethiopia, currently 8,153 primary cooperatives are registered all over the country. In addition
to this primary cooperatives have others been organized at secondary level, and thus, there are 89
cooperative unions with membership of 1635 primary cooperatives and a total capital of more
than 249 million Birr. (Federal Cooperative Commission Report, 2006).
In Tigray, at this time there are 20 union cooperatives with membership of 160 primary
cooperatives and capital of 4,160,034.00 Birr. (Tigray Cooperative Bureau Report, 2006)
5
In Enderta Woreda, currently there are 56 primary cooperatives with membership of 18,746 and
total capital of 2,905,863.99.At the same time in the Woreda there is only one multipurpose
cooperative union with membership of 12 multipurpose primary cooperatives and a total capital
of 2,255,104.00 Birr (Enderta Woreda Cooperative Office Report, 2006)
Finance function is the managerial activity which is concerned with the planning and controlling
of the firm’s financial resources. The basic objectives of financial management are the
maintenance of liquid assets and maximization of profitability of the firm. Sound financial
management helps in monitoring the effective deployment of funds in various resources of the
organization.
In Tigray cooperatives play a key role in the betterment of the poor people. The present study
will highlight the financial performance of Cooperatives in the Enderta Woreda
1.2 Statement of the Problem
Finance is the drive power that rotates the wheels of the business. Financial management has a
profound impact on the business efficiency of any enterprise. In a cooperative enterprise sound
financial planning and management is the most vital requirement for successful management. A
study of business failure in cooperatives would reveal that majority of such failures resulted from
the lack of proper financial management. Too often the ineffective function of cooperatives is due
to bad debts, excessive overdue or unwise investment, corruption, and unskilled manpower. The
financial management in cooperatives, though in many respects similar to the private or public
sector corporations, has their own distinctive features. The principles, the practice, the legal basis
performance criteria and financial bases of cooperatives are not the same as private companies or
public enterprises. An understanding of the distinctive features of financial management in
cooperatives is a prerequisite for their efficiency.
6
The success of any organization depends on many factors, including proper planning, effective
execution of activities, suitable evaluation process and adoption of appropriate control measures.
Most of the cooperative societies in Ethiopia are administered by people, who are either
incompetent or influenced by other dominant people. As a result, the financial performance of
cooperatives societies are affected and facing many problems. At present there is no systematic
measurement of the functions or activities of the cooperatives in the Enderta Woreda.
1.3 Purpose of the Study
The main objective of the Ethiopian Government is to bring sustainable economic development
of cooperatives. The important resource to achieve the development of the cooperatives is the
financial strength so, the study is significant because it has tried to assess the measurement of
financial performance of cooperatives and thereby achieve valuable results. It is also believed
that the study would come up with basic conclusions & valuable suggestions so that the members
of the cooperatives, decision makers, employees, and government officials will be the
beneficiaries of the study. Besides, it is assumed that the study would come up with basic
findings about measurement of financial performance of cooperatives.
1.4 Hypothesis of the Study
There is an increase of financial performance of cooperatives .That is:
• As the current asset of the cooperatives is lower in relation to current liabilities, the
liquidity of the cooperatives affects adversely.
• As the financing of cooperatives is greater by the owners than the creditors, there is
possibility of obtaining debt financing.
• As the profitability of the cooperatives increases the operating efficiency and ability to
ensure adequate return to members increase.
7
1.5 Objectives of the study
1. General objective
The general objective of the study was to measure the financial performance of the cooperatives
in the Woreda and to recommend appropriate and reliable monitoring and management practice.
2. Specific objectives
To accomplish this general objective, the study has the following sub-objectives.
• To study the general working of the cooperatives in the Woreda.
• To analyze the financial performance of the cooperatives.
• To assess the perception of members towards the role of cooperatives.
• To offer suitable suggestions for improving the financial performance of the cooperatives.
1.6 Scope of the Study
The study was emphasized at measuring the financial performance of the cooperatives in the
Woreda. It has also delimitation in the fact that it does not involve in the other Woredas of
cooperatives. The study becomes relevant as the cooperative sector in Ethiopia particularly in
Tigray has not been succeeded.
1.7 Limitation of the Study
The study was limited to the measurement of Enderta Woreda cooperative financial performance.
Further more the study covers only three years of data; because of the recent nature of the history
of Cooperatives in Ethiopia in general and particularly in Tigray.
The other major limitations were:
• The kebeles and cooperatives are found wide spread in the Woreda which makes it very
difficult to collect data.
8
• It was also difficult to make focus group discussion because the season was not
convenient to gather the members to have discussion.
• Problem of translating Tigrigna financial reports to English.
1.8 Chapterization of the Study
The thesis is organized in five chapters.
The first chapter, introduction covers the background and justification of the study, statement of
the problem, purpose of the study, hypothesis of the study , objectives of the study, scope of the
study, limitation of the study, organization of the study and definition of terms. The second
chapter, literature review, covers definition, concepts, and empirical studies. The third chapter,
materials and methods includes area of the study, methodology & data collection, sampling
technique and samples, techniques of analysis and interpretation. The fourth chapter, discussion
and analysis is concerned with the Development of Enderta Woreda cooperatives including their
establishment and origin, organizational structure, management, capital structure, human resource
management, training and development, measurement of Enderta Woreda Cooperatives financial
performance using different parameters and also the perception of members on the role of the
cooperatives. And lastly the fifth Chapter, conclusion and recommendation cover the summary of
the main findings of the study & the possible suggestions or recommendations to be made.
1.9 Definition of Terms
• Bylaw: Cooperatives document which contains articles approved by members.
• Chapterization: The organization of the paper.
• Cooperators: Those people who work or act together in order to bring about a result.
• Cooperative legislation: Act of government which controls cooperatives.
9
• Cooperative Promotion Office: Government office engaged in promoting cooperative
societies.
• Control committee: A body elected and empowered by the general assembly with the
responsibility to follow up whether the management is carrying out its responsibility
properly.
• Dividend: Distribution of a part of profit to members based on their economic and
business participation.
• Fiscal year: means co-operative year (from Hamle 1upto sene 30).
• Financial performance :Balance sheet and income statement analysis
• General assembly: means a meeting of members of the primary cooperative society or
representatives of societies above primary level.
• Member: means any physical person or society established under this Proclamation who
is registered after fulfilling his/her membership obligations.
• Management Committee: means a body of elected and empowered by the general
assembly with the responsibility to manage the activities of the society.
• Primary cooperatives: Lower level cooperatives established by a group of individuals.
• Principle: Basic truth; guidelines; general law of cause and effect.
• Rochdale pioneers: The people living in town, who are first in adopting the new concept
of modern cooperative.
• Society: Cooperative society.
• Union: Composed of more than one primary cooperative society that has similar objectives.
• Values: Quality of being useful or desirable.
• Woreda: District, boundary for administration.
10
Chapter Two
2. Literature Review
2.1 Definition, Values and Principles of Cooperatives
1. Definition.
Like other terms cooperatives have different definitions and interpretations by different scholars.
But the internationally accepted definition of cooperatives made by the International cooperative
Alliance (ICA) is “a co-operative is an autonomous association of persons united voluntarily to
meet their common economic, social and cultural needs and aspirations through a jointly owned
and democratically controlled enterprise."
2. Values
Based on the ICA statement on the cooperative identity, 1995, cooperatives are based on the
values of self-help, self-responsibility, equality, equity and solidarity. In the tradition of their
founders, co-operative members believe in the ethical values of honesty, openness, social
responsibility and caring for others.
3. Principles
The cooperative organizations embedded on the foundations of a set of basic principles. The
principles are fundamental to cooperatives action .They are the settled rules of action and are
identified as the coordinates that go to make a cooperative society and as such are indispensable.
They were evolved out of experiments and practices, and represent the cooperative’s philosophy,
evolved by Rochadale Pioneers, improved and embellished by movement and are recognized by
the ICA congress.
11
4. Principles of financing
Cooperatives are involved in give and take by the members. If a cooperative is to provide
services at cost and if members expect to benefit from its operations, then it is apparent that
members must also assume the responsibility of financing their undertaking. Plans for financing
must be consistent with the principles of cooperation as well as with legislation and
administrative rulings. Cooperative principles of financing include the followings:
1. Member-patrons control the cooperative rather than member-investors. Control is not linked
with investment as in a standard corporation. Voting in a local or primary cooperative under
Wisconsin Law is on a one man one vote basis and not according to how many shares of stock a
member owns as is done in Standard Corporation. The purpose of the cooperative is to provide
services at cost rather than to maximize returns on the capital invested in it. Control is therefore,
separate from investment.
2. The use of capital should be rewarded with small dividends when earned. This may not only
induce members to invest in their cooperative but likewise to leave their money in the
organization after they no longer need the cooperative’s services. “Limited returns on equity
capital “is a commonly accepted principle of cooperatives.
3. Cooperatives need adequate capital to function efficiently and to continue. They need reserves
for depreciation, obsolescence, and unpredictable contingencies. Not only it is important to home
and services requiring continued financial top credit ratings with banks and lending agencies.
4. Business should generate new capital. This means that gross margins (the difference between
the selling price and the buying price) should be wide enough to cover all expenses and also
12
provides for net margins (net earnings or savings). These net margins plus additional earnings
from dividends, interest, and refunds, constitute the source out of which dividends on stock
allocated reserves, employee bonuses, provision for an educational fund, and refunds are made.
Since the cooperative needs to generate capital for its future use only part of the refunds will be
paid in cash and the deferred refunds will provide the needed capital.
5. Cooperative securities (shares) are compensated for only at their par value and not on the basis
of their book value. This reduces speculation since their redemption value is constant. For
example, if the par value of a share of common stock is $35, then the holder will be paid $35 for
it when it is bought backed by the cooperative, even though the book value (the appraised value
of all assets divided by the total number of shares outstanding) might be $40 or $33. Only at
dissolution, merger, or bankruptcy is the book value of the shares very significant.
6. Cooperatives should have the first option to purchase shares of stock to be sold by members.
Generally, such purchase option is stated on the face of the stock certificate.
7. Ways and means of returning capital to members who stop to be patrons should be planned. A
practical and fair stock redemption program should be instituted, possibly through the
establishment of a redemption fund, so that patrons, who no longer have any need for the
cooperative to get their money back, can do so without a long waiting period or difficulty in
finding a buyer for the stock.
13
2.2 Concept of Financial Analysis
Management should be particularly interested in knowing financial strengths of firm to make
their best use and to be able to spot out financial weakness of the firm to take suitable corrective
actions.
Financial analysis is the process of identifying the financial strength and weakness of the firm by
properly establishing relationships between the items of the balance sheet and income statement.
Financial analysis can be undertaken by management of the firm or by parties outside the firm,
viz owners, creditors, investors and others. The nature of analysis will differ depending on the
purpose of the analyst.
Ratio analysis is a powerful tool of financial analysis. In financial analysis, a ratio is used as a
benchmark for evaluating the financial position and performance of a firm. The absolute
accounting figures reported in the financial statements do not provide a meaningful
understanding of the performance and the financial position of a firm. An accounting figure
conveys meaning when it is related to some other relevant information. Ratios help to summarize
large quantities of financial data and to make qualitative judgment about the firm’s financial
performance.
The ratio analysis involves comparison for a useful interpretation of the financial statements. A
single ratio in itself does not indicate favorable condition. It should be compared with some
standard. Standards of comparison may consist of:
• Past ratios: - ratios calculated from the past financial statements of the firm.
• Competitors ratios: - ratios of some selected firms, especially the most progressive and
successful competitors at the same point in time.
• Industry ratios:- ratios of the industry to which the firm belongs, &
14
• Projected ratios: - ratios developed using the projected or proforma- financial statements
of the same firm.
Management is interested in evaluating every aspect of the firm’s performance. The four
important ratios are: liquidity ratios measure the firm’s ability to meet current obligations;
leverage ratios show the proportions of debt and equity in financing the firm’s assets; activity
ratios reflect the firm’s efficiency in utilizing its assets and profitability ratios measures over all
performance & effectiveness of the firm.
Measuring financial performance involves examination of various financial statements to assess
the performance of a business based on its profitability, solvency, liquidity, risk, efficiency, and
growth status. The primary aim is to analyze the business’ past and present performance in order
to identify strengths and weaknesses and to formulate feasible plans for the future (Barry et al.,
2000: 91). Indicators of financial performance over time may also be gained from financial ratios.
Most financial ratios are computed from information presented in the income statement and
balance sheet. It is important to note that assets in the balance sheet are usually valued at
historical cost whereas they should be assessed at current market value to compute meaningful
ratios. This is especially important where land represents the largest underlying asset of the
business and in times of significant inflation. Ratios have the advantage of comparison with the
acceptable levels (norms) that have already been developed and provide important indications of
the financial health of enterprises and their relative performance. Financial ratios should be
calculated over successive years to accurately observe trends in liquidity, solvency and
profitability.
15
2.3 Financial Statements and Ratio Analysis for Cooperatives
2.3.1 Basic Formulas of Ratio Analysis
Net working capital: The difference between total current assets and total current liabilities. It
indicates the extent to which short-term debt is exceeded by short term assets.
Formula: Current Assets - Current Liabilities
Current ratio: This relationship indicates whether the business is able to pay current debts using
only current assets. It is also called the working capital ratio. Higher ratios indicate a greater
ability to pay debts. However, too high ratio may indicate poor asset management.
Formula: Total Current Assets / Total Current Liabilities
Quick Ratio: Popularly called the acid test ratio, indicates the extent to which a company could
pay current debt without relying on future sales. Quick assets are highly liquid, immediately
convertible to cash. In addition to accounts receivable, they include marketable securities.
Formula: Cash + Accounts Receivable (+ any other quick assets)/ Current Liabilities
Debt to Equity: This ratio compares the amount invested in the business by creditors with that
invested by members. The higher the ratio, the higher the creditors' claims on the assets, possibly
indicating the cooperative in extending its debt beyond its ability to repay. However, an
extremely low ratio may indicate that the cooperative is managing its assets too conservatively.
Formula: Total Debt (or Liabilities) / Total Equity (or Net Worth)
Return on Member Equity: A measurement of the cooperative's rate of return on member
investment. Always given as a percentage, it shows the interest rate net profits yield on member
equity.
Formula: Net Savings X 100 / Member Equity
Long-Term Debt to Working Capital: indicates creditor contribution to liquid assets.
16
Formula: Long-term Debt / Net Working Capital
To know our present position two considerations are important: liquidity and solvency. Three
methods can be used to interpret a balance sheet: trend analysis:
• over several years ,
• year-to-year comparison, and
• month-to-month comparison industry analysis - compare the business to others that are
similar compare to lender, regulatory requirements or standards
2.3.2 Financial statement analysis
The amount of information contained in a cooperative’s financial statements is voluminous,
spanning the cooperative’s internal operations, its relationship with the outside world, and its
relationship with its member or patrons. To be useful, this information must be organized into an
understandable, coherent, and sufficiently limited set of data. Financial statement analysis can be
beneficial in this respect because it highlights a firm’s strengths and weaknesses.
Data from a cooperative’s financial statement would reveal the company’s financial condition.
Examining common-size statements, cash flows, and financial ratios can provide management,
members, and creditors a glimpse of the cooperative’s strengths and weaknesses. The value of a
particular ratio compared with a target range of values indicates the firm’s financial health, and
also identifies potential problem are. Analysis can also indicate areas of mismanagement and
potential danger. As with all analytical methods, common-size statements, cash flow data, and
financial ratios must be used in the light of other relevant facts. Also, the analyst must remember
that financial statements area “snapshot” of a firm at a particular point in the past. In a highly
17
seasonal industry, conclusions drawn through ratio analysis might depend greatly on the period
being analyzed. Historical comparison adds to any analysis.
2.3.3 Common-size statements
When analyzing financial statements, it is helpful to determine the proportion that a single
account item represents of a group or subgroup total. This works especially well for comparing
various sizes of cooperatives. In a balance sheet, a total asset is expressed as 100 percent. Each
item in a common-size balance sheet is expressed as a percentage of the total assets. Similarly in
the income statement, total net sales are set at 100 percent and all other items are expressed as a
percentage of net sales.
The analysis of common-size financial statements may best be described as structural. In the
analysis of the balance sheet, the structural analysis focuses on several important aspects. What is
the capital structure of the cooperative? (E.g., how much of the cooperative’s assets is financed
by current liabilities, long-term liabilities, and member equity?) And what is the distribution of
the cooperative’s assets (current, fixed, and other)? Put it in another way, what is the mix of
assets the cooperative uses to conduct operations?
Common-sizing can also be used within sub-groups on the financial statements. For example, it
may be of interest to know both the percentage of cash to current assets as well as the percentage
of cash to total assets. Knowing both provides a better understanding of the cooperative’s
liquidity.
In the case of the income statement, common-size analysis is a very useful tool, perhaps more
important than the analysis of the common-size balance sheet. The income statement lends itself
to this form of analysis. Each item in it is related to a central quantity, that is, sales. With some
exceptions, such as some administration and overhead, the level of each revenue and expense is
18
directly related to the level of sales. Thus, it is instructive to know what proportion of the sales
dollar is absorbed by the various costs and expenses incurred by the cooperative.
The use of common-size financial statements for comparing cooperative financial performance
over time is valuable in focusing on changing proportions of components within a group of
assets, liabilities, revenues, expenses, and other financial categories. However, one must be
careful in interpreting changes. For example, the percentage of accounts receivable to total assets
could show an increasing trend. Yet, the actual dollar value of accounts receivable might be the
same and the increase in the percentage is caused by a decline in total assets, e.g., because of
lower fixed assets or a write-off of investments. Because a proportion can change either in the
absolute amount of the item or in the total of the group of which it is a part, the interpretation of a
common-size statement comparison requires an examination of the actual figures and the basis on
which they are computed (David S. Cheswick 2000)
2.3.4 Ratio Analysis
Ratios are the most widely used tools for financial analysis. Yet, their function is often
misunderstood, and, consequently, their significance may easily be overrated.
A ratio expresses the mathematical relationship between two quantities. The ratio of 200 to 100 is
expressed as 2:1 or 2. While the computation of a ratio involves a simple arithmetical operation,
its interpretation is far more complex.
The ratio must express relevant relationship. For example, there is a clear, direct, and
understandable relationship between the sales price of an item and its cost. On the other hand,
there is no real relationship between salaries and investments in other cooperatives.
Ratios are analytical tools that provide clues to help identify symptoms of underlying conditions.
Analysts, depending on their needs, may differ in the ratios they find useful when examining a
19
cooperative’s financial position. Short-term creditors are primarily interested in the cooperative’s
current performance and its holdings of liquid assets that can provide a ready source of cash to
meet current cash requirements. These assets include cash, marketable securities, accounts
receivable, inventory, and other assets which can be sold for cash or can become cash through the
normal course of a business cycle. Long-term creditors and member/owners, on the other hand,
are concerned with both the long-term and short-term outlook. Management will also find ratios
useful in measuring its own performance.
As a final note of caution, the analysis of ratios is useful only when all influencing factors are
interpreted skillfully and intelligently. This is, by far, the most difficult aspect of ratio analysis.
2.3.5 Standard Financial Ratios
Four categories of ratios are typically used in analyzing financial position:
1. Liquidity ratios
Liquidity ratios measure the ability to fulfill short-term commitments with liquid assets. Such
ratios are of particular interest to the cooperative’s short-term creditors. These ratios compare
assets that can be converted to cash quickly to fund maturing short-term obligations. The current
ratio and the quick ratio are the two most commonly used measures of liquidity. For most
cooperatives, these two ratios provide a good indication of liquidity. However, these ratios do not
address the quality of liquid assets.
2. Leverage ratios
Leverage ratios measure the extent of the firm’s “total debt” burden. They reflect the
cooperative’s ability to meet both short- and long-term debt obligations. The ratios are computed
either by comparing earnings from the income statement to interest payments or by relating the
debt and equity items from the balance sheet. Creditors value these ratios because they measure
20
the capacity of the cooperative’s revenues to support interest and other fixed charges, and
indicate if the capital base is sufficient to pay off the debt in the event of liquidation.
In terms of debt load, the more predictable the returns of the firm, the more debt will be
acceptable, because the firm will be less likely to be surprised by circumstances that prevent
fulfilling debt obligations. For example, utilities (i.e., rural electric cooperatives) have historically
relatively stable incomes, but are also among the industries with the heaviest debt structure. By
contrast, fruit and vegetable cooperatives are in a cyclical business, where income is greatly
influenced by weather conditions, and they normally carry a far lower proportion of debt in their
capital structure.
3. Activity ratios
This shows the intensity with which the firm uses assets in generating sales. These ratios indicate
whether the firm’s investment in current and long-term assets is too large, too small, or just right.
If too large, funds may be tied up in assets that could be used more productively. If too small, the
firm may be providing poor service to customers or inefficiently producing products.
There are two basic approaches to the computation of activity ratios. The first looks at the
average performance of the firm over the year. The second uses year-end balances in the
calculations.
The first method is preferred if asset balances fluctuate significantly during the year. For
example, inventory levels for most fruit and vegetable cooperatives vary significantly, depending
on the time of the season. If the fiscal year ends before the harvest, when inventories are low,
calculations using year-end balances will be biased and the resulting ratios will be of little value
for comparing between different cooperatives. The second method is the most commonly used
approach because in practice, data limitations often force outside analysts to use year-end data.
21
4. Profitability ratios
Profitability ratios measure the success of the firm in earning a net return on its operations. Profit
is an important objective of a cooperative, so poor performance indicates a basic failure that, if
not corrected, would probably result in the firm’s going out of business. Cooperatives must
operate profitably, although their definition of profitable might differ from an IOF’s. Hence,
appropriate profitability ratios pose the biggest challenge for analyzing cooperatives.
Patronage refund policies have a dramatic effect on cooperative profitability ratio analysis. Some
cooperatives return patronage at the end of the operating year shows significant profits on the
closing statements. Other cooperatives have different operational policies and may show little
end-of-the-year profits. Lending institutions not familiar with these businesses may shy away
from cooperatives with low reported net income. This will be especially true for pooling
cooperatives that generally report a minimum amount of income at year-end.
Common ratios used to analyze the four areas of financial performance can be found in most
basic financial textbooks and were developed to analyze a wide variety of businesses. Most of
these ratios are applicable to the cooperative form of business, while others should be viewed
with some reservation.
• Interdependence of Ratios
Ratios must be evaluated together, not independently. A firm may have low liquidity ratios, but
more than adequate leverage, interest coverage, and profitability ratios. This firm would be in a
good position to obtain additional long-term funds, and in the process, pay down short-term debt
or purchase liquid assets. This firm would improve its liquidity ratios while maintaining adequate
levels of the remaining performance measures.
• Trends over time
22
Historical information can be very beneficial when analyzing financial performance.
When analysis reveals certain weaknesses in a cooperative’s financial health, the initial
management reaction may be to take immediate action to correct the situation. However, if
historical trend analysis indicates the situation is improving, the best remedy may be to monitor
performance for continued improvement, in other words, don’t overreact.
Historical trends are important for other reasons as well. During the life of the firm, pricing,
credit policy, production methodology, and other areas under managerial control can change.
Each change has an effect on the firm’s performance. Ratios analyzing of these changes provide
feedback to management. A thorough analysis of the performance ratios regarding managerial
policies in effect, at each period of time, may guide future policy decisions.
Another reason to look at historical performance of a cooperative is to avoid the difficulties
encountered when comparing two similar cooperatives. Although comparisons should be between
like firms, but generally, no two firms are exactly alike. While two farm supply cooperatives may
be of similar size, one may sell mostly bulk feed with lower margins, while the other sells more
agronomy products, which typically carry higher margins. Also, boards may vary in their
philosophy on the ideal capital structure. One cooperative may be debt-free but the other
cooperative board might feel that returns from leveraging the cooperative outweigh the risk of
acquiring the debt.
There are some inherent problems associated with some common ratios used in cooperative
financial analysis. Some problems are intrinsic with the ratios themselves and some are with the
cooperative structure. For instance, the current ratio is used to analyze liquidity. It provides a
good benchmark for determining whether a cooperative has liquid assets to cover current
payments. However, interpreting these ratios beyond the conclusion that it represents current
23
resources over current obligations at a given point in time requires a more in-depth look at the
trends of the individual parts that make up the ratio. A current ratio doesn’t show the quality of
the liquid assets which can greatly affect the “true” liquidity.
Profitability ratios can also be misleading. As mentioned earlier, cooperatives are generally not
profit motivated. They are more concerned toward serving member-owners. Therefore, low profit
ratios can be misleading to the analyst, especially with some pooling cooperatives.
2.4 Empirical Studies
Based on the study of analysis of financial statements: local farm supply marketing cooperatives,
(Beverly L. Rotan 2001) the impact on ratio analysis shows the followings:
1. Liquidity ratios-current ratio (current assets/current liabilities) was fairly steady at around 1.5
between 1990 and 1999. The quick ratio (current assets-inventory/current liabilities) mimicked
the current ratio’s trend;
2. Leverage ratios-debt ratio was at a high of 0.47 in 1996. After 1996, the ratio started to decline,
with the sharpest downturn in 1997;
3. Activity ratios-total-asset-turnover ratio fell from 2.13 in 1998 to 1.92 in 1999 because total
sales decreased 6 percent while assets increased only 5 percent with much of the increase in
inventories; and finally
4. Profitability ratios-return on total assets ratio fell from 7.88 in 1998 to 6.53 in 1999 because
total assets increased while net income decreased (13 percent).
Dr.Jeff Dorsey and Dr.Tesfaye Assefa (2005) on their study on the evaluation of agricultural
cooperatives in Ethiopia, there has been rapid growth in the financial strength of the saving and
credit cooperatives and achieved a total equity of nearly birr 680,000. The strongest equity
position appears to be in Tigray where the debt to equity ratio was 1.43 compared to 2.65 in
24
oromia 3.30 in Amhara and 3.65 in the Southern Region. It was a working principle that leverage
should not exceed 3.5 in the saving and credit cooperatives.
P.suresh Babu (2005) in his study on financial performance of the cooperative bank has analyzed
the financial performance of the bank with the help of ratio analysis. He identified 49 different
ratios. Based on his study of ratio analysis, the financial performance of the study unit was not
encouraging and the liquidity position of the bank is not enough to meet its obligation
David S.Chesnick (2000), on his study of financial management and ratio analysis for
cooperative enterprise, identified some ratio that help analyze the cooperative’s financial
performance and cash flow analysis to develop its own performance measurements.
According to a study of performance of cooperatives and investor owned firms in the dairy
industry by Claudia parliament (1989) using standards financial ratio analysis, the performance of
dairy cooperatives was found to be significantly better than the performance of dairy investor
owned firms in terms of leverage, coverage and efficiency ratios and not worse in terms of
profitability over the period of 1976-1987. Even with out allowing for benefits that are unique to
members of cooperatives and for potential public good aspects, the cooperative appear to meet or
exceed generally accepted business standards, at least in the dairy industry.
According to a study of Member-funds and cooperative performance by Rajesh A.grawal, K. V.
Raju, K Prathap. Reddy, R Srinivasan and M S Sriram (2002), the research examines the role of
member-funds in multi-purpose cooperatives in the state of Andhra Pradesh, India. The central
thesis is that member-funds, both in terms of quantity and quality, can enhance the control
members exert on the cooperative. The involvement of members through their capital stake could
be at various levels – by the provision of permanent capital, long-term capital and short-term
capital. They expect that each of these will have differing effects on control and on the culture
25
and systems of the cooperative. Such an effect on control is expected to directly drive cooperative
performance, and indirectly enhance cooperative performance through greater usage of the
cooperative by the members. Enhanced cooperative performance in turn would satisfy members,
and the loop will hopefully be completed; satisfied members would place more funds with the
cooperative.
Lionel Williamson (1987), on his study of the farmer’s Cooperative yard stick: Financial ratios
useful to Agricultural Cooperatives, sound financial planning and management are two key
elements to the successful operation of cooperatives. Sound financing relates to the need for both
equity and borrowed capital for operations and growth. It also involves the analysis of financial
data to develop financial controls. Cooperative management should find financial ratios to be an
important tool in performing this management function.
Deepak Shah (2007), on his study of Financial Health of Credit Cooperatives in Maharashtra of
India: A Case of Sangli and Buldana District Central Cooperative Bank. An analysis
encompassing two case studies conducted in forward and backward regions of Maharashtra
(India) has shown deterioration in the financial health of central level credit cooperatives (Sangli
District Central Cooperative Bank (SDCCB)) in forward region and gross inefficiency in their
functioning (Buldana District Central Cooperative Bank (BDCCB)) in the backward region of the
state, due mainly to their mounting overdues’. Because of substantially high NPAs, the fixed
expenses of these institutions have been adversely affected, which in turn have grossly affected
the break-even levels of loan advances and deposits of these credit institutions, so much so that
there has been huge gap between the break-even levels of loan advances and deposits and the
actual loan advances and deposits. In the case of BDCCB, the deficit between actual and the
break-even levels are so high (about 60 per cent) that it will be well-nigh impossible for it to
26
overcome this situation. High transaction costs, poor repayment performance, are the root causes
of the moribund state of rural credit delivery through these cooperatives. Further, it is to be noted
that the estimated trend over the past two decades in Maharashtra shows a slower growth.
According to the study of comparative financial performance of agricultural cooperatives and
investor-owned firms by Shermain D. Hardesty and Vikas D. Salgia, the validity of claims that
cooperatives are destroying value by comparing the financial performance of agricultural
cooperatives with investor-owned firms in four sectors-dairy, farm supply, fruit and vegetable,
and grain. Traditional financial ratios measuring profitability, liquidity, and leverage and asset
efficiency were analyzed for 1991 through 2002. Overall, the financial performances of
agricultural cooperatives and their investor-owned counterparts were comparable. Consistent
with theoretical expectations, cooperatives demonstrated lower rates of asset efficiency, except in
the dairy sector. Cooperatives in all four sectors were less leveraged, while results regarding the
relative profitability and liquidity of cooperatives were not conclusive.
Gilberto M.Lianto (1994), on his study on the Financial Structure and Performance of Philippine
Credit Cooperatives, The study provides so far the best picture of the credit cooperatives’
financial structure and performance, given the time and financial constraints of the survey. Based
on several criteria such as capital adequacy and protection, asset quality, rate of return and costs,
liquidity and solvency, it can be generally concluded that those grassroots and member- owned
financial institutions called the credit cooperatives were able to mobilize huge financial resources
and to provide credit and saving services to large mass base at a standard comparable to that of
formal financial institutions. Under the most demanding and adverse internal and external
environment, they have sustained their financial services to their members and managed to grow.
They are viable financial intermediaries in the countryside whose development must be strongly
27
supported. Given the proper supervisory and regulatory environment and efficient policies and
practices, the credit cooperatives could in time grow into financially stable and competitive
financial institutions. They have the potential to provide self- sustaining financial services to
small borrowers especially if capital is adequate and the members’ share capital and deposits are
sufficiently protected. The credit cooperatives demonstrated their potential for increasing
membership mobilizing financial resources and providing financial services to small savers and
borrowers on a sustained basis. In fact in the period 1990- 1992, 16 of the sample 104 credit
cooperatives “graduated” into becoming 4 large credit cooperatives and 12 medium credit
cooperatives with more members and bigger financial resources.
Conclusion:
From all the previous studies the financial performances of different cooperatives were
sometimes good, fluctuating, and bad. There fore the main focus of this study is to check the
financial performance of the cooperatives in the Enderta Woreda
28
Chapter Three
3. Materials and Methods
3.1 Area of the Study
The study area is located in the Tigray Region Southern Zone of Enderta Woreda. Enderta is one
of the 36 rural woredas in Tigray Region.
Located in the Debubawi zone in the eastern edge of the Ethiopian High Lands, Enderta is
bordered on the south by Hintalo Wajirat, on the west by Samre, on the northwest and north by
Misraqawi (Eastern) Zone, and on the east by the Afar Region. The city of Mekele is an enclave
within the Woreda of Enderta. Towns in Enderta Woreda include Aynalem and Kuha. The
historic village of Chalacot is also located in this woreda.
Based on statistical data published by the Central Agency in 2005, this woreda has an estimated
total population of 144,784, of whom 73,887 were males and 70,897 were females; 21,527 or
14.87 percent of its population are urban dwellers, which is less than the zone average of 29.1
percent with an estimated area of 1,339.93 square kilometers. Enderta has an estimated
population density of 108.10 per square kilometer, which is less than the zone average of 133.18.
The Ethiopian Mapping Agency (1981) differentiated five traditional climatic zones in Ethiopia.
According to this classification the study area is within the “Weinadega”.
The rational for the selection of this Woreda is because of:
• There was no research made regarding financial performance of the cooperatives in this
woreda.
• This woreda is at less distance from the researcher to avoid finance constraint.
• This Woreda is one of the Woredas of Tigray where Cooperatives are operating
29
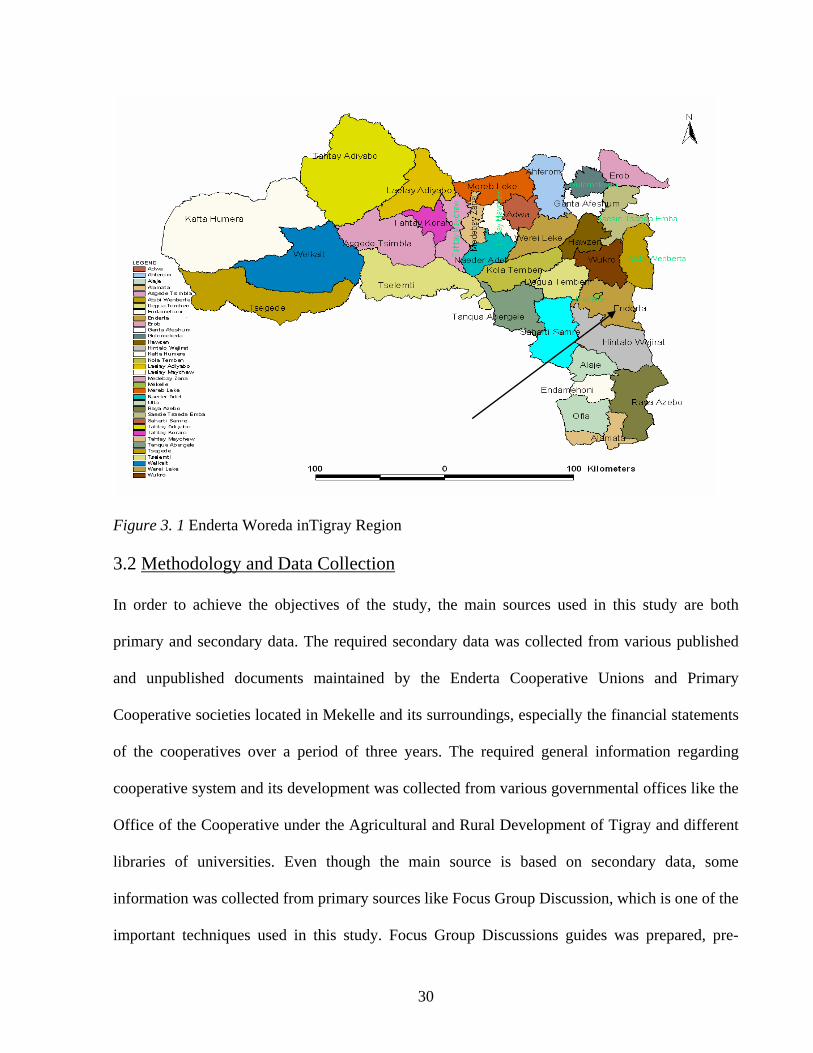
Figure 3. 1 Enderta Woreda inTigray Region 3.2 Methodology and Data Collection
In order to achieve the objectives of the study, the main sources used in this study are both
primary and secondary data. The required secondary data was collected from various published
and unpublished documents maintained by the Enderta Cooperative Unions and Primary
Cooperative societies located in Mekelle and its surroundings, especially the financial statements
of the cooperatives over a period of three years. The required general information regarding
cooperative system and its development was collected from various governmental offices like the
Office of the Cooperative under the Agricultural and Rural Development of Tigray and different
libraries of universities. Even though the main source is based on secondary data, some
information was collected from primary sources like Focus Group Discussion, which is one of the
important techniques used in this study. Focus Group Discussions guides was prepared, pre-
30
tested and finalized. Focus Group Discussion in general contained hints with three broader
headings, namely, introduction, warm-up session and issue for focused discussions. To assess the
perception of members towards the role of the cooperatives the focus group discussion was used.
The number of focus group discussions was made up of seven, four in EUAPC and three in the
SACCOs. The number of members in all the focus group discussions, who participated were fifty
six each cooperative having eight members. At the same time observation was employed.
The primary data such as questionnaire and interviews are not conducted in this research because
the financial performance of the cooperatives is mostly measured from the historical financial
statements and the secondary data is more relevant for this study
3.3 Sampling Technique and Samples
The sampling technique that is used for the study was multistage sampling. There are seventeen
(17) Kebeles in the Enderta Woreda, out of these four kebeles were selected randomly in addition
to only one union. The randomly selected Kebeles were:
1. Debri –This kebele consisted of the following cooperatives:
• Debri- Multipurpose Cooperative Society,
• Deremeyti-Saving and Credit Cooperative Society,
• Tesfu-Irrigation Cooperative Society, and
• Kisanet- Milk Cooperative Society
2. Mahbere Genet-It included the following cooperatives.
• Romanat-Multipurpose Cooperative Society,
• Mayawlia-Saving and Credit Cooperative Society,
• Lem Mesanu-Irrigation Cooperative Society,
• Beleshutsa-Mining Cooperative Society,
31
• Selam- Mining Cooperative Society,
• Tsige- Mining Cooperative Society, and
• Zelealem-Milk cooperative society.
3. Didba- It consisted of the following cooperatives.
• Didba-Multipurpose Cooperatives Society
• Hayki-Hilet-Saving and Credit Cooperative Society
• Hizati Wedicheber-Irrigation Cooperative Society,and
• Werale- Milk cooperative society.
4. Shibta-It consisted of the following cooperatives
• Debre-Harnet-Multipurpose Cooperative Society,
• Senay –Construction Cooperative Society,
• FreTsaari-Irrigation Cooperative Society,and
• Freweyni-Milk cooperative society.
From the four kebeles based on judgmental sampling all cooperatives with their life more than
three years were selected. The researcher has chosen this sampling for the following reasons:
• It is more economical and less time consuming,
• This method ensures proper representation of a cross section of various strata, and
• This method is very useful, especially when some of the units are very important and their
inclusion in the study is necessary.
Therefore, the target samples include:
• one cooperative union,
• four multipurpose cooperatives, and
• three saving and credit cooperatives.
32
3.4 Techniques of Data Analysis and Interpretation
In order to study the financial performance of Enderta Woreda cooperative union and primary
cooperative societies, the researcher has used statistical tools like ratio analysis to compare the
relationship between two variables over a period of three years and to compare with similar
cooperatives, identify the important financial ratios and simple percentages and tables of different
descriptive statistics. Inferences from the focus Group Discussion were used to supplement the
conclusions drawn from quantitative analysis and assess the perception of members on the role of
the cooperatives.
Variables
Independent variables: some of the independent variables that were used in this study were
current assets, current liabilities, income, equity, long term liabilities, sales; fixed assets, gross
profit, total liabilities, total assets, cost of goods sold, operating expenses, etc...
Dependent Variables: The dependent variables that were measured in this study were
profitability, liquidity, leverage, and activity ratios.
33
Chapter Four
4. Results and Discussions
4.1 Development of Enderta Woreda selected Cooperatives
4.1.1 Introduction
The cooperative is made up of persons who jointly own cooperative business enterprise. In
characterizing the cooperative group, one major element has been the existence of one or more
common objectives, goals and interest. The objective is mostly economical in nature. However, at
the same time, many other non-economic objectives were included.
The economic motives for joining the cooperatives are those which have a direct effect on the
economic life of members. The members join the cooperatives because the promises to be the
most effective instrument towards gaining increased income. The joining of cooperatives is an
attempt to reap relatively higher economic advantage. This can come about by the way of
cooperatively providing goods and services which are regarded as important or either not
available or available but beyond the reach of the members or the members enjoy them but at
very high cost.
The cooperation can thus help satisfy this motive of increased income either in the form of
reducing the cost of member’s business enterprise or increased revenue.
The sociological motives that influence persons towards joining cooperative can often not be
determined in direct monetary terms. The urge to join may result from individual feelings of
isolation and loneliness and the search for security may also be a motive for joining a
cooperative. The cooperatives, in the woreda where the study was undertaken were established as
a result of economic and sociological motives. From the focus group discussion members of the
34
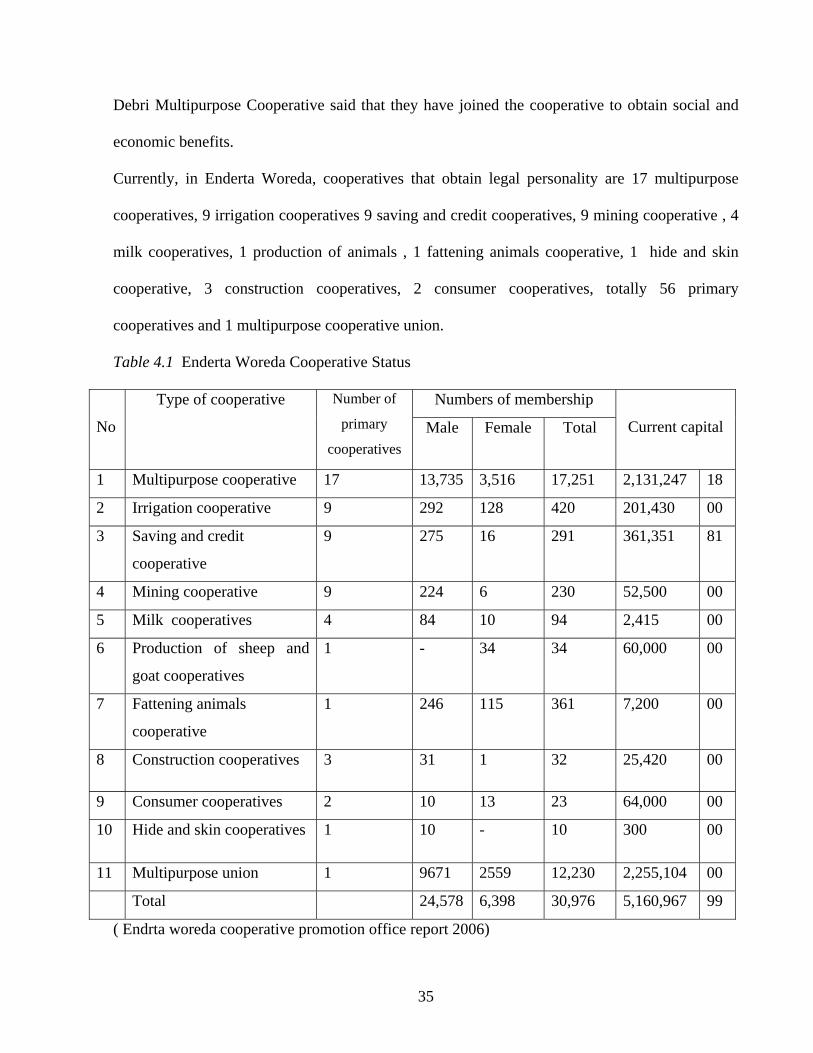
Debri Multipurpose Cooperative said that they have joined the cooperative to obtain social and
economic benefits.
Currently, in Enderta Woreda, cooperatives that obtain legal personality are 17 multipurpose
cooperatives, 9 irrigation cooperatives 9 saving and credit cooperatives, 9 mining cooperative , 4
milk cooperatives, 1 production of animals , 1 fattening animals cooperative, 1 hide and skin
cooperative, 3 construction cooperatives, 2 consumer cooperatives, totally 56 primary
cooperatives and 1 multipurpose cooperative union.
Table 4.1 Enderta Woreda Cooperative Status
Numbers of membership
No
Type of cooperative Number of
primary
cooperatives Male Female Total
Current capital
1 Multipurpose cooperative 17 13,735 3,516 17,251 2,131,247 18
2 Irrigation cooperative 9 292 128 420 201,430 00
3 Saving and credit
cooperative
9 275 16 291 361,351 81
4 Mining cooperative 9 224 6 230 52,500 00
5 Milk cooperatives 4 84 10 94 2,415 00
6 Production of sheep and
goat cooperatives
1 - 34 34 60,000 00
7 Fattening animals
cooperative
1 246 115 361 7,200 00
8 Construction cooperatives 3 31 1 32 25,420 00
9 Consumer cooperatives 2 10 13 23 64,000 00
10 Hide and skin cooperatives 1 10 - 10 300 00
11 Multipurpose union 1 9671 2559 12,230 2,255,104 00
Total 24,578 6,398 30,976 5,160,967 99
( Endrta woreda cooperative promotion office report 2006)
35
From the reports of the woreda
• Irrigated land by the irrigation cooperatives consisted of 52 hectare.
• The members of the cooperative union were 12 primary multipurpose cooperatives.
• From the woreda house holds 75.58 percent were members of the cooperatives in the
woreda.
• The number of employees in all the cooperatives of the woreda, 79.
• Infrastructures constructed by the cooperatives consisted of 21 offices, 17 shops and13
stores.
In this study, four kebels of the woreda were taken from the four Kebles, cooperatives that have a
duration of three years life or more were selected. Therefore, the cooperatives included in this
study were 4 multipurpose and 3 saving and credit cooperatives and one union.
4.1.2 Origin of the Cooperative in the Woreda.
A) Multipurpose cooperatives
From Debri kebele, the Debri Multipurpose Cooperative Society was registered in August, 2000
and started its operation on that month. The initial authorized share capital was Birr 17,780.00,
made up of 889 shares of Birr 20.00. The membership in the year 2005/06 increased to 835 men
and 202 women and their capital increased to Birr 256,432. From Mahbere- Genet kebele,
Romanat Multipurpose Cooperative Society was registered in June, 2002 with an initial capital
of Birr 23,480.00 made up of 1,174 shares of Birr 20.00. The membership in the year 2005/06
reached 1185 and their capital increased to Birr 23,700.00. From Didba Kebele, Didba
Multipurpose Cooperative Society was registered in June, 2003 with an initial capital of Birr
16,780.00, with 839 shares of Birr 20.00. In 2005/06 the membership increased to 1168
consisting of total male and female and its capital raised to Birr 23, 360.00. From Shibta Kebele,
36
Debre-Harnet Multipurpose Cooperative Society was registered and obtained legal personality in
July, 2002 with an initial capital of Birr 36,270.00 made up of 1,209 shares of Birr 30.00. The
membership increased to 1431 male and female and the capital also increased to Birr 42,930.00
in the year 2005/06.
B) Saving and credit cooperative (SACCOs):- is a free association of people with common bond
who save and lend money to another at low interest rates for productive and visionary purposes.
From Debri Kebele, Deremeyti Saving and Credit Cooperatives was registered in October, 2003
with an initial capital of Birr 96.00 made up of 32 shares of Birr 3.00. Currently the number of
the members increased to 42 while the capital increased to Birr 5,326.00
From Mahbere- Genet Kebele Mayawlia Saving and Credit Cooperative was registered and
started its operation on October, 2003 with an initial capital of Birr 90 with 30 shares of members
at Birr 3.00. In 2005/06 the membership increased to 38 and the capital of this cooperative
increased to Birr 5, 2 44.00.
From Didba Kebele Hayki Hilet Saving and Credit Cooperative was registered and operated in
April, 2003 with an initial capital of Birr 126.00 made up of 42 Shares of Birr 3.00. According to
the statistical information of the cooperative, currently the membership is raised to 60 and their
capital to Birr 2,616.00.
C) Enderta Cooperative Union (ECU)
Enderta Cooperative Union which is located in Mekelle 06 Kebele was registered and started its
operation in August, 2003 with members of 12 multipurpose cooperative societies and with an
initial capital of Birr 420,000.00.
37
4.1.3. Objectives of the Enderta Woreda Cooperatives
There are different types of cooperatives depending on the need of its members. Generally the
objective of any cooperative can be:
• to form a capital base,
• to bring together various efforts,
• to obtain a fair or efficient price ,
• to reduce costs through economies of size and coordination ,
• to provide markets, supplies, and services that are missing,
• to pool risk,
• to capture profits, and
• to benefit from increased market power.
Specifically the multipurpose cooperatives of the Woreda from the focus group discussions and
the by-laws of the cooperatives had the following objectives.
• Improving the standard of living of the farmers, better business performance and
improved methods of production by reducing cost of credit, reducing cost of goods and
services for production and consumption, minimizing and reducing the impacts of risks
and uncertainties, spreading knowledge of practical technical improvements,
• To arrange the supply of farm requirements including improved seeds, fertilizers,
equipments, etc.,
• To provide essential household needs.
The saving and credit cooperatives (SACCOs) had also the following main objectives.
• To promote saving so as to increase the supply of funds.
• To draw in sources outside the society.
38
• To promote the effective use of loans and to reduce the risk in granting loans by careful
and continuous supervision.
• In consequence to reduce risk to lenders and to credit cooperatives by adequate security.
• By low cost of management keep the cost of credit as low as possible ,and
• To endeavor to make societies as credit- worthy that they can obtain sufficient funds to
finance other cooperative undertakings.
The Enderta Cooperative Union had the following objectives.
• To increase the productivity of members by purchasing new technology with lowest price
and creating sustainable market.
• To use the agricultural resources by processing the products.
• To create for its members a system which is favorable to the environment.
• To increase the capacity of its members and nonmembers by giving different training
services.
• To give training to members of the union and management bodies and employees to
increase their capacity.
4.1.4. Organizational structure of the cooperatives in the Woreda
An organization consists of people, policies, rules and regulations, system and procedures,
relationships and the like. An effective organization will perform its functions efficiently. A
cooperative can offer to the farmer the opportunity of access to credit and required production
enhancing inputs at affordable prices with reliable availability. The farmer can also reap benefits,
from improved post- harvest handing, value added processing and marketing. Cooperatives
currently, possess organizational structure necessary to realize their full potential and enjoy the
purchasing and marketing advantage through multi cooperative unions.
39
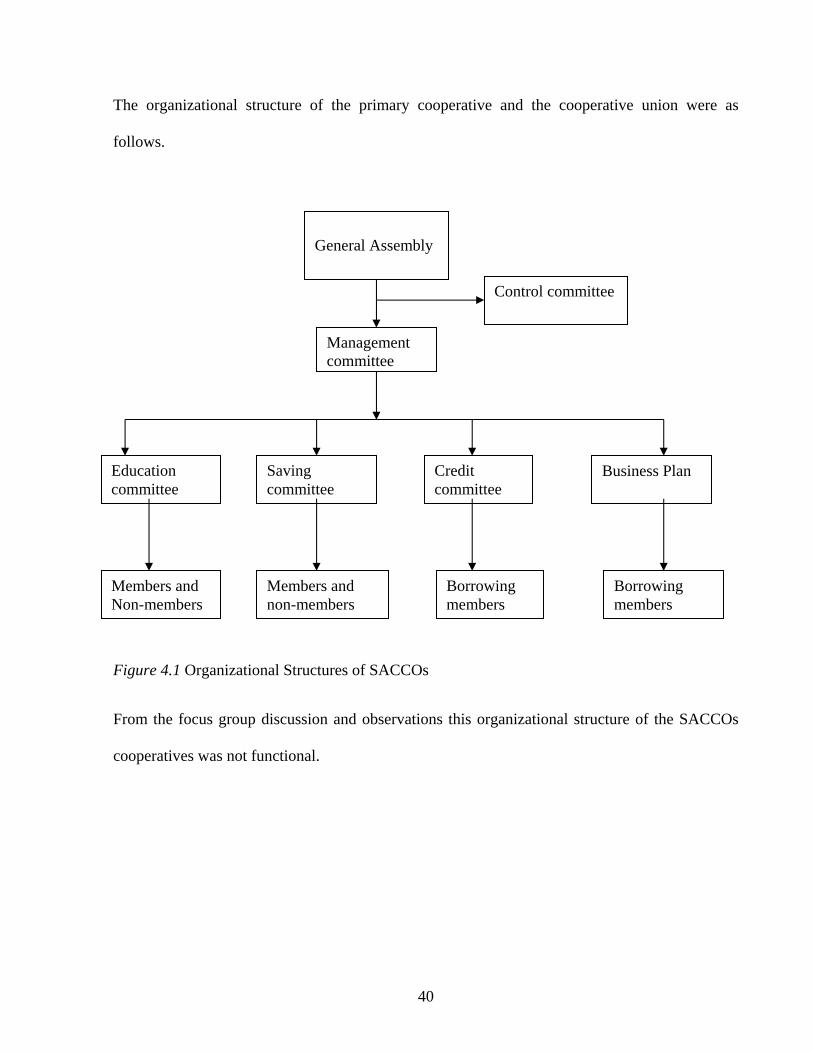
The organizational structure of the primary cooperative and the cooperative union were as
follows.
Education committee
Saving committee
Credit committee
Business Plan
Members and Non-members
Members and non-members
Borrowing members
Borrowing members
Control committee
Management committee
General Assembly
Figure 4.1 Organizational Structures of SACCOs
From the focus group discussion and observations this organizational structure of the SACCOs
cooperatives was not functional.
40
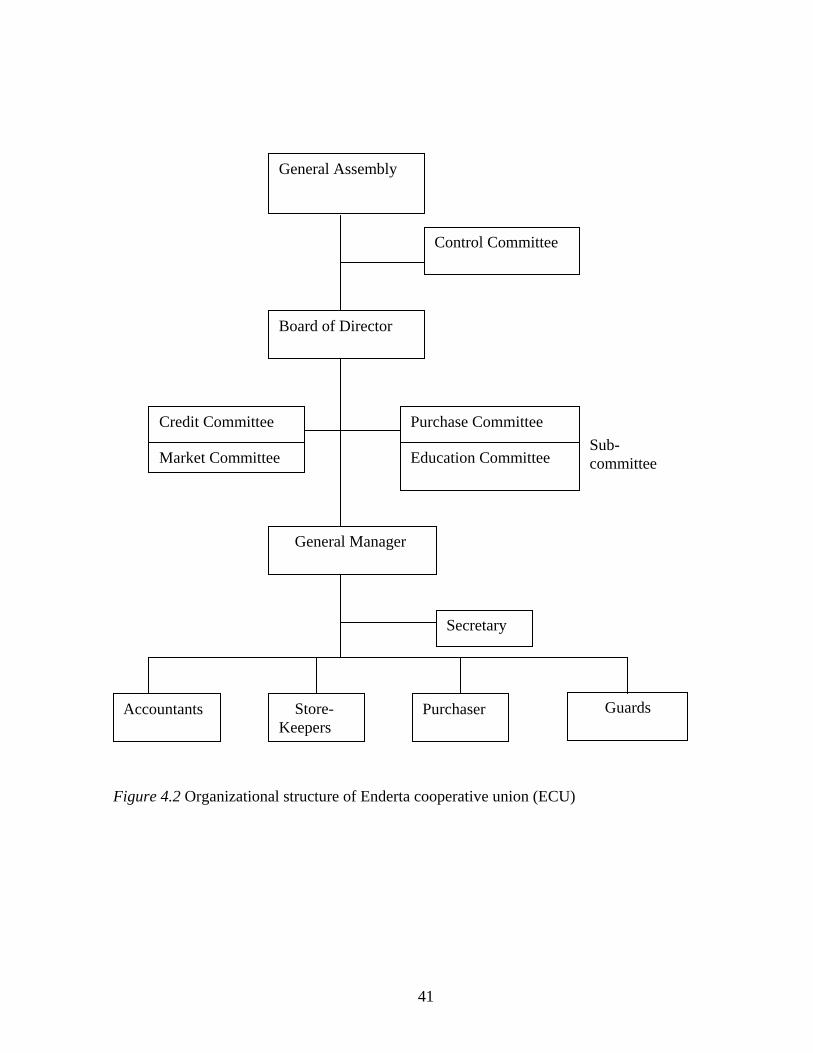
Control Committee
Board of Director
Credit Committee Purchase Committee
Accountants Store-Keepers
Purchaser Guards
Secretary
General Manager
Education Committee Market Committee
General Assembly
Sub- committee
Figure 4.2 Organizational structure of Enderta cooperative union (ECU)41
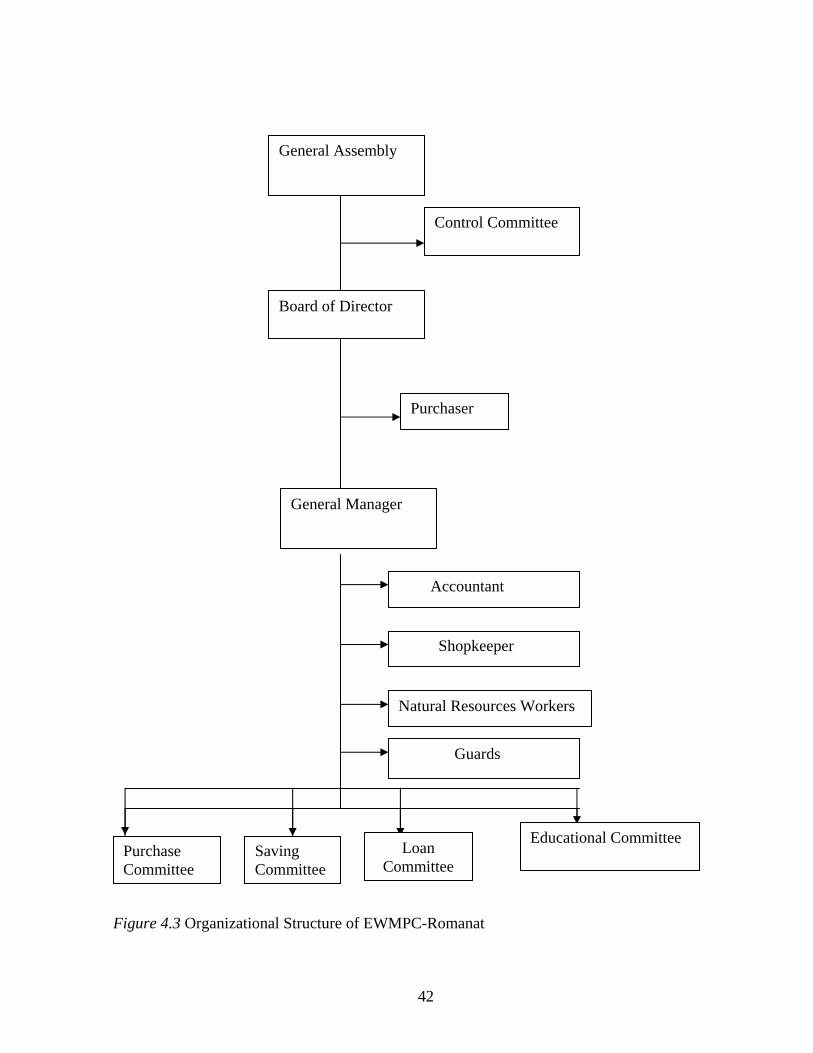
General Manager
Purchaser
Board of Director
Control Committee
General Assembly
Accountant
Purchase Committee
Saving Committee
Loan Committee
Educational Committee
Natural Resources Workers
Guards
Shopkeeper
Figure 4.3 Organizational Structure of EWMPC-Romanat42
4.1.5. Management of the Cooperatives in the Woreda
Cooperative management is the process of pursuing cooperative objectives utilizing the resources
available to the organization including people, capital and facilities. Organizational resources that
need proper management can be categorized under:
• human resources,
• financial resources,
• physical resources, and
• information resources.
Whether a cooperative is a success or failure often depends on whether there is management of
all aspects of the organization. Cooperatives should employ knowledgeable personnel in order to
meet the challenge of stiff competition in the market. In order to attract competent staff,
cooperatives should offer attractive terms and condition of employment. Regular training courses
should be mounted to improve managerial talents of the board members and employees to enable
them carry out their responsibilities efficiently.
According to the Ethiopian Proclamation Number of 147 /1998 article 20 the supreme organ of
any society shall be the general assembly and the powers and duties of the general assembly from
the by-laws and focus group discussion are as follows.
• Pass decisions after evaluating the general activities of the society.
• Approve and amend the by –laws and internal regulations of the society.
• Elect and dismiss the members of the management committee, control committee and when
necessary the members of other sub-committees.
• Determine the amount of shares of the society.
• Decide on how the annual net profit of the society is distributed.
43
• Give decision on the audit report.
• Hear work reports and give proper decision.
• Decide that a society either be amalgamated with another society or be divided in pursuance
of this Proclamation.
• Approve the annual work plan and budget.
• Decide any issue submitted by the management committee and other committees.
All the powers and duties of the general assembly were not applied even though these were listed
on the by-laws. This was because of lack of capacity, skill or knowledge as they have explained
in the focus group discussion.
Management committee
Every society shall have a management committee which is accountable to the general assembly
and whose members and manner of election to be determined in the by- laws of the society.
The powers and duties of the management committee are:
• Maintain the minutes of a meeting in writing.
• Maintain the documents and books of accounts of the society.
• Prepare the annual work programme and budget of the society, implements them upon
approval.
• Call the general assembly in accordance with the by- laws of the society.
• Execute such other decisions given by the general assembly.
• Submit reports to the general assembly on the activities of the society.
Control committee
Every society shall have a control committee which is accountable to the general assembly and
the numbers of which shall be specified by the by –laws of the society.
44
The powers and duties of the control committee are:
• Following up that the management committee is carrying out its responsibilities properly.
• Following up that the funds and property of the society is properly utilized
• Controls that the various activities of the society are carried out pursuant to the by-laws and
internal regulations of the society.
• Performing other duties given by the general assembly.
Responsibility of a credit committee
The management committee is elected by the general assembly for the purpose of over seeing the
day to day operations of the SACCOs. The credit committee is accountable to the management
committees for the following specific tasks.
1. To enforce and recommend changes to the SACCOs lending policy.
2. To recommend with appropriate documentation to management committee loan
opportunities after receiving and carefully reviewing members’ loan applications and
accompanying documents.
3. To monitor borrowers’ loan outstanding and promptly reports any arrears or potential arrears
to the management committee and to make monthly loan portfolio reports to the management
committee in a standard format.
Saving committee
The saving committee is elected by the general assembly for the purpose of overseeing the saving
operations of the SACCOs. The saving committee is responsible to the management committee
for the following specific tasks.
1. To train and provided information to committee members in order that they clearly
understand their roles.
45
2. To train and educate members of the SACCOs, during the monthly education day
3. To promote information to the community in order to encourage new members to join, and
4. Make monthly status reports to the management committee in a standard format.
In general the management of the primary cooperatives found in the woreda consists of five
board members, three control committee members, three credit committee members and some
times in some cooperatives, other committees exist like education and saving committee
members.
4.1.6. Capital Structures of Cooperatives in the Enderta Woreda
A capital structure is one of the basic decisions in financial management. The capital structure of
a cooperative firm, qualitatively, differs from that of a company. The capital structure of a
cooperative organization is designed as to serve the main objective of serving its members at
lower cost.
There were four main sources of financing activities of the cooperative:
• share capital ,
• reserve fund,
• borrowing, and
• grants.
1) Share capital – the initial capital of a society is the amount of share sold to individual
members. Membership to cooperative is obtained by a purchase of at least one share of stock.
According the Ethiopian Cooperative Proclamation Number 147/1998 article 16, no member
shall hold more than 10% of the total paid up capital of such society. This was to ensure that no
one member, by having a predominating influence in the society, shall indirectly try to control the
46
society. How ever, no one member of any cooperative shall have more than one vote regardless
of the number of shares he/ she owned.
The advantages of having members’ share capital.
• Funds were committed to the society and can not be withdrawn unless the member resigns.
• The share capital of a cooperative is regarded by the potential lenders as evidence of
members’ commitment.
• Share capital receives limited rate of interest, if any.
The disadvantages of members’ share capital are:
• Cooperative share capital is frequently insufficient to finance a society’s long-term capital
requirements.
• It is unlikely to be available to finance expansion of activities and to attract new membership.
In general, member share capital is used when cooperative access to debt at appropriate
maturities is severely limited. The measure that could be taken to increase new capital is to
decide to sell additional shares to members to help final expended operations.
2) Reserve funds- This consists of portions of annual surpluses that were not allocated to the
members but retained by the cooperative after a financial year. It is unique source of finance in
cooperatives. According to the Ethiopian Cooperative Proclamation Number 147/1998, with
amendments of 106 /2004, any cooperative society shall deduct 30% of the net profit and allocate
for reserve fund. The amount allocated for the reserve fund shall not exceed 30% of the capital of
the society, and it shall be deposited in the saving account of the society.
The advantages of reserve funds are:
• No interest is payable on reserve fund and therefore no explicit cost is involved in this
sources of capital.
47
• The reserve fund serves as a cover protecting members from losses.
• It can be used with out the society’s calling on members to buy additional shares from the
society.
• The reserve will not reduce even with the downward reduction of membership in the society
because members have no claim on the reserve fund upon withdrawal from membership.
The disadvantage of reserve funds are:
• Accumulates slowly only as the society prospers.
• Can only be increased at the expense of the dividend, which may disappoint members.
• Can not be called upon when needed, but grows only with the society’s growth and
success.
3) Borrowing: - Reserves and share capital are almost always insufficient to finance a society’s
operations and expansion. Due to this fact that most members of multipurpose cooperatives are
generally poor and the fact that members are mainly farmers or producers with seasonal incomes,
borrowing is necessary to finance their activities. This borrowed capital has to be repaid with
interest at a fixed date in the future.
The sources of borrowed funds are members, government’s financial institutions.
A) Borrowing from members: It is an attractive form of financing cooperative activities. This
could be through collecting deposits from members where interest will be paid and retaining a
portion of dividend.
A cooperative usually prefers obtaining loan from the members for several reasons.
• The interest rate involved, if any were likely to be lower than those of any other sources.
• Being a kind of loan within the family there is usually no need or demand for collateral
securities.
48
• Such loans represent increased interest and participation in the cooperative.
B) Borrowed capital from bank: - Banks usually have much more funds at their disposal than
other sources, and, thus, can be important for large borrowings. They usually have technical
experts who can be helpful with relevant financial advices. Loan is given to cooperatives by
making the collateral agreement with the government and this is extended on negotiations to
carry out a certain project. The loan is given for a specified period on a separate loan account for
a specific purpose and has to be paid back with interest at a fixed period of time.
4) Grants- New cooperative enterprises in less developed countries commonly receive
government or foreign donor grants. The justification for grant is to provide start up capital which
might be difficult to raise from members and impossible to obtain from financial institutions.
Technical assistance is usually provided along with grants from foreign donors, which may
greatly benefit a new cooperative.
In summary, from the focus group discussion of the different cooperatives of the woreda, the
main sources of capital for the cooperatives were the share capital from the members, the reserve
funds obtained from the operation of the cooperatives, borrowings from banks, and, in this case
until now, the government takes the collateral on behalf of the cooperatives to encourage the
cooperative movement and grants from some NGOs like VOCA. Therefore the capital structure
of the cooperatives in the woreda is weak because it is mostly rested on the borrowings and
government assistances.
4.1.7 Human Resource Management of Enderta Cooperatives
Management as a science is the human aspect of management, which is responsible for enlisting
enthusiastic and willing cooperation of the employees, which is the fundamental factor for
efficiency and success of an enterprise. Motivating the human resources and managing the
49
workers are the most vital aspect of management. To make the organization successful and for
achieving the organizational goals, every organization should follow an appropriate and more
suitable human resources management policy. The personnel policy pertaining to broad approach
regarding the type of organizational structure needed for effective personnel management, the
measures to be adopted to secure appropriate manpower for the origination, and the measures
needed to create and maintain a level of morale which evokes full contribution by securing
optimum working conditions.
In the Cooperatives of the Enderta Woreda the personnel policy is designed by the board of
directors. The personnel policy of the cooperatives is influenced by the external social
environment, organization culture, pressure from employees and economic viability of the
organization. It was observed that in the cooperatives of the Enderta Woreda sound personnel
policy has not been developed. The personnel units which were found in the woreda were only
establishment units concerned with only routine services like appointment. In order to create
sound personnel policy it is necessary to create full-fledged personnel department staffed with
competent persons equipped with the necessary skills.
In the cooperatives of in the Woreda, there were certain problems in the recruitment which have
been diagnosed by the focus group discussion and observations. Some of these were:
1.Employee turn over was existed in the cooperative.
2.There was no employment procedure to recruit employees in the Woreda because members
were recruited in most of the cooperatives with out a vacancy.
3.Adequate publicity as to the existence of vacancies was not given because of lack of capacity
and awareness.
4.Enough candidates were not considered for each post to compare.
50
In almost all the focus group discussion of the cooperatives in the Woreda they said that there
was lack of skill manpower in the cooperatives and the reason for this was:
• most of the members were farmers and were therefore illiterate.
• the cooperatives had no enough capacity to recruit skill manpower with adequate salary.
4.1.8. Training and development of Enderta Woreda cooperatives
Training is one of the important personnel functions, which is not only contributing to increase
efficiency but also towards employees’ satisfaction. It is a means for developing knowledge,
skill, attitudes and potentialities of employees. An opportunity for training brightens the chance
of promotions, increase in pay, recognition from colleagues, and a prestige and a combination of
other rewards.
A systematic training programme for different individual has to be evolved on the following
basis.
• The training needs have to be assessed properly by identifying the jobs for which training is
required, number of persons to be trained and the standard of the training.
• The training courses have to be evolved and the course objectives have to be designed for
different types of training.
• The training courses must be organized in such away that the objectives of training are
achieved.
In cooperatives the training needs arise at three levels.
• At the level of workers,
• At the supervisory level, and
• At the managerial level.
51
According the focus group discussion, for example, the members of the Debri Multipurpose
Primary Cooperative they said that different types of training programmes were given to the
cooperatives in the Enderta Woreda at different levels by the Cooperative Promotion Bureau of
Tigray, NGO, like the VOCA, and other external agencies. But, the training programme of the
cooperatives was being set with the following limitations:
• Lack of proper assessment of training needs,
• Problem of the cost of the group of representatives which many institutions were not willing
to bear,
• Absence of incentives and opportunities to use the knowledge and skills acquired as a result
of training and this aroused as a result of lack of awareness of the members.
• Lack of qualified trainers, with regards the quality of training, and
• Lack of physical facilities and equipments for efficient conduct of training programmes.
Adequate opportunities, therefore should be provided for the employees of cooperatives to under
go programmes and acquire skills. The selection for such training programmes should be
objective and impartial. Systematic assessment of training needs, planning and organization of
the training programmes and utilization of the available training facilities will be necessary pre-
requisites for development of cooperatives in the Woreda.
4.2 Measurement of Enderta Woreda Cooperative Financial Performance
4.2.1 Introduction of ratio analysis
To analyze the financial statements of an organization, a number of financial tools are being used
out of which ratio analysis is considered to be the most powerful and popular tool for practical
purposes. The result of ratio analysis is more accurate and it can be used as a basis for future
52
decisions. The financial ratios are relationships expressed in mathematical terms between figures
which are connected with each other in some manner.
Financial ratio indicates the financial position of an organization. An organization is deemed to
be financially sound, if it is in a position to carry its business smoothly and meets all its
obligations both long-term and short-term with out any difficulty.
4.2.2. An evaluation of financial performance of cooperatives in the Woreda
The nature and classification of ratios vary from organization to organization but generally a few
ratios are widely used. Information about financial results of cooperatives is important for
management decisions. The financial statement analysis has some benefits such as identifying
problems, initiating timely corrective action and identifying potential opportunities. Comparison
of financial documents from past years is useful to see trends and financial measurement can be
used to compare current performance to its historical as well as to compare between similar
cooperative businesses.
Based on this, financial statement ratio analysis on Enderta Union and its affiliated cooperatives
(Debri-Multipurpose Cooperative, Romanat Multipurpose Cooperative, Didba Multipurpose
Cooperative and Debre- Harnet Multipurpose cooperative) and three saving and credit
cooperatives (Deremeyti Saving and Credit cooperative, Mayawlia Saving and Credit
cooperative, Hyakihilet Saving and Credit Cooperatives) for three consecutive years (2003/04-
2005/06) were prepared as follows.
1. Liquidity ratios:
Liquidity refers to the solvency of the cooperatives over all financial position and the ease with
which it can pay its bills. The common measurements of liquidity are the current ratio and quick
ratio.
53
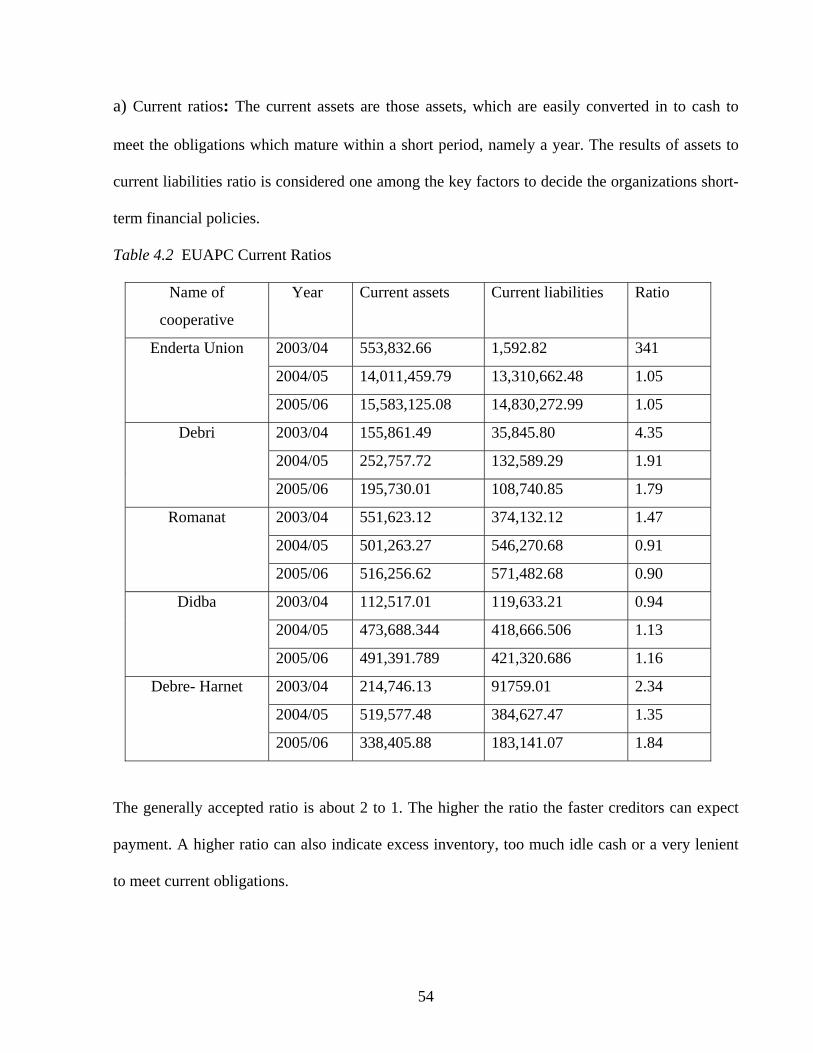
a) Current ratios: The current assets are those assets, which are easily converted in to cash to
meet the obligations which mature within a short period, namely a year. The results of assets to
current liabilities ratio is considered one among the key factors to decide the organizations short-
term financial policies.
Table 4.2 EUAPC Current Ratios
Name of
cooperative
Year Current assets Current liabilities Ratio
2003/04 553,832.66 1,592.82 341
2004/05 14,011,459.79 13,310,662.48 1.05
Enderta Union
2005/06 15,583,125.08 14,830,272.99 1.05
2003/04 155,861.49 35,845.80 4.35
2004/05 252,757.72 132,589.29 1.91
Debri
2005/06 195,730.01 108,740.85 1.79
2003/04 551,623.12 374,132.12 1.47
2004/05 501,263.27 546,270.68 0.91
Romanat
2005/06 516,256.62 571,482.68 0.90
2003/04 112,517.01 119,633.21 0.94
2004/05 473,688.344 418,666.506 1.13
Didba
2005/06 491,391.789 421,320.686 1.16
2003/04 214,746.13 91759.01 2.34
2004/05 519,577.48 384,627.47 1.35
Debre- Harnet
2005/06 338,405.88 183,141.07 1.84
The generally accepted ratio is about 2 to 1. The higher the ratio the faster creditors can expect
payment. A higher ratio can also indicate excess inventory, too much idle cash or a very lenient
to meet current obligations.
54
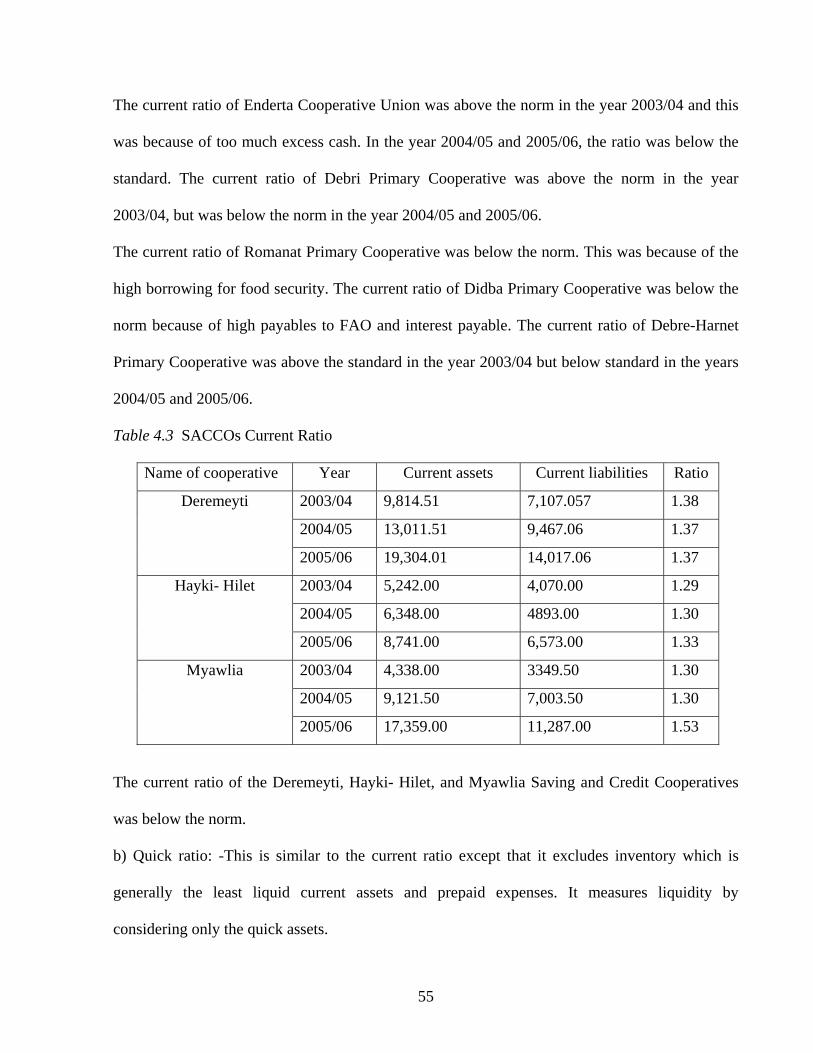
The current ratio of Enderta Cooperative Union was above the norm in the year 2003/04 and this
was because of too much excess cash. In the year 2004/05 and 2005/06, the ratio was below the
standard. The current ratio of Debri Primary Cooperative was above the norm in the year
2003/04, but was below the norm in the year 2004/05 and 2005/06.
The current ratio of Romanat Primary Cooperative was below the norm. This was because of the
high borrowing for food security. The current ratio of Didba Primary Cooperative was below the
norm because of high payables to FAO and interest payable. The current ratio of Debre-Harnet
Primary Cooperative was above the standard in the year 2003/04 but below standard in the years
2004/05 and 2005/06.
Table 4.3 SACCOs Current Ratio
Name of cooperative Year Current assets Current liabilities Ratio
2003/04 9,814.51 7,107.057 1.38
2004/05 13,011.51 9,467.06 1.37
Deremeyti
2005/06 19,304.01 14,017.06 1.37
2003/04 5,242.00 4,070.00 1.29
2004/05 6,348.00 4893.00 1.30
Hayki- Hilet
2005/06 8,741.00 6,573.00 1.33
2003/04 4,338.00 3349.50 1.30
2004/05 9,121.50 7,003.50 1.30
Myawlia
2005/06 17,359.00 11,287.00 1.53
The current ratio of the Deremeyti, Hayki- Hilet, and Myawlia Saving and Credit Cooperatives
was below the norm.
b) Quick ratio: -This is similar to the current ratio except that it excludes inventory which is
generally the least liquid current assets and prepaid expenses. It measures liquidity by
considering only the quick assets.
55
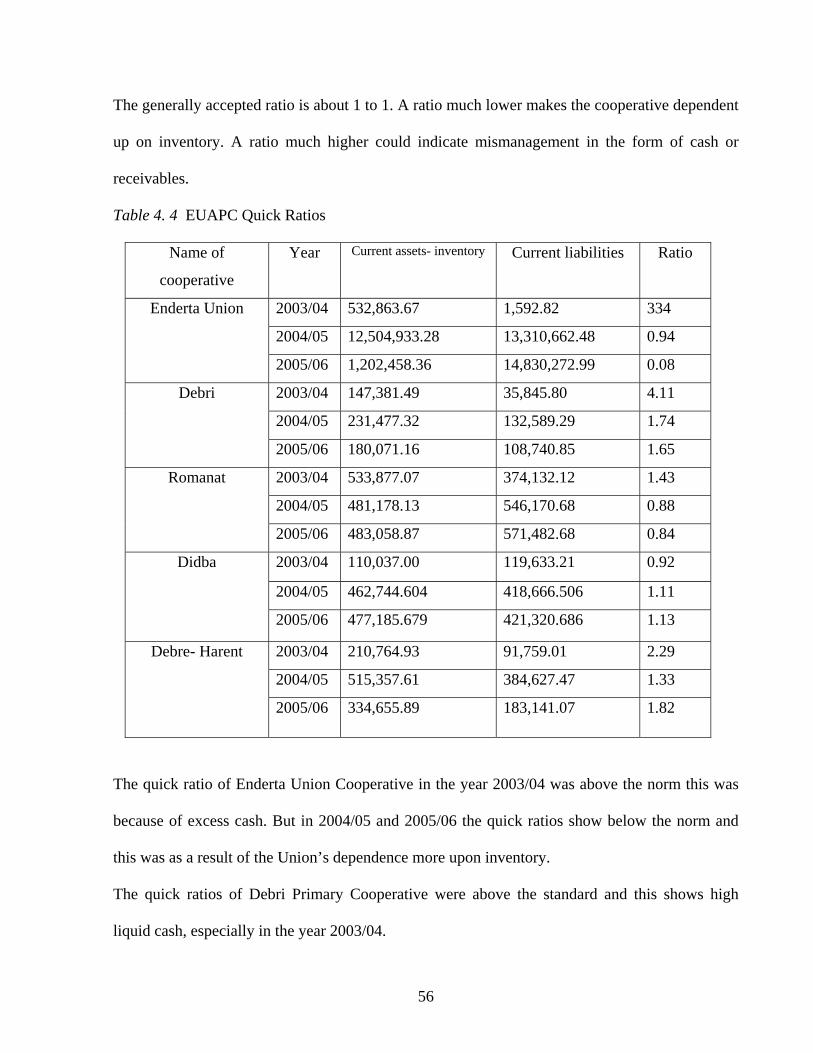
The generally accepted ratio is about 1 to 1. A ratio much lower makes the cooperative dependent
up on inventory. A ratio much higher could indicate mismanagement in the form of cash or
receivables.
Table 4. 4 EUAPC Quick Ratios
Name of
cooperative
Year Current assets- inventory Current liabilities Ratio
2003/04 532,863.67 1,592.82 334
2004/05 12,504,933.28 13,310,662.48 0.94
Enderta Union
2005/06 1,202,458.36 14,830,272.99 0.08
2003/04 147,381.49 35,845.80 4.11
2004/05 231,477.32 132,589.29 1.74
Debri
2005/06 180,071.16 108,740.85 1.65
2003/04 533,877.07 374,132.12 1.43
2004/05 481,178.13 546,170.68 0.88
Romanat
2005/06 483,058.87 571,482.68 0.84
2003/04 110,037.00 119,633.21 0.92
2004/05 462,744.604 418,666.506 1.11
Didba
2005/06 477,185.679 421,320.686 1.13
2003/04 210,764.93 91,759.01 2.29
2004/05 515,357.61 384,627.47 1.33
Debre- Harent
2005/06 334,655.89 183,141.07 1.82
The quick ratio of Enderta Union Cooperative in the year 2003/04 was above the norm this was
because of excess cash. But in 2004/05 and 2005/06 the quick ratios show below the norm and
this was as a result of the Union’s dependence more upon inventory.
The quick ratios of Debri Primary Cooperative were above the standard and this shows high
liquid cash, especially in the year 2003/04.
56
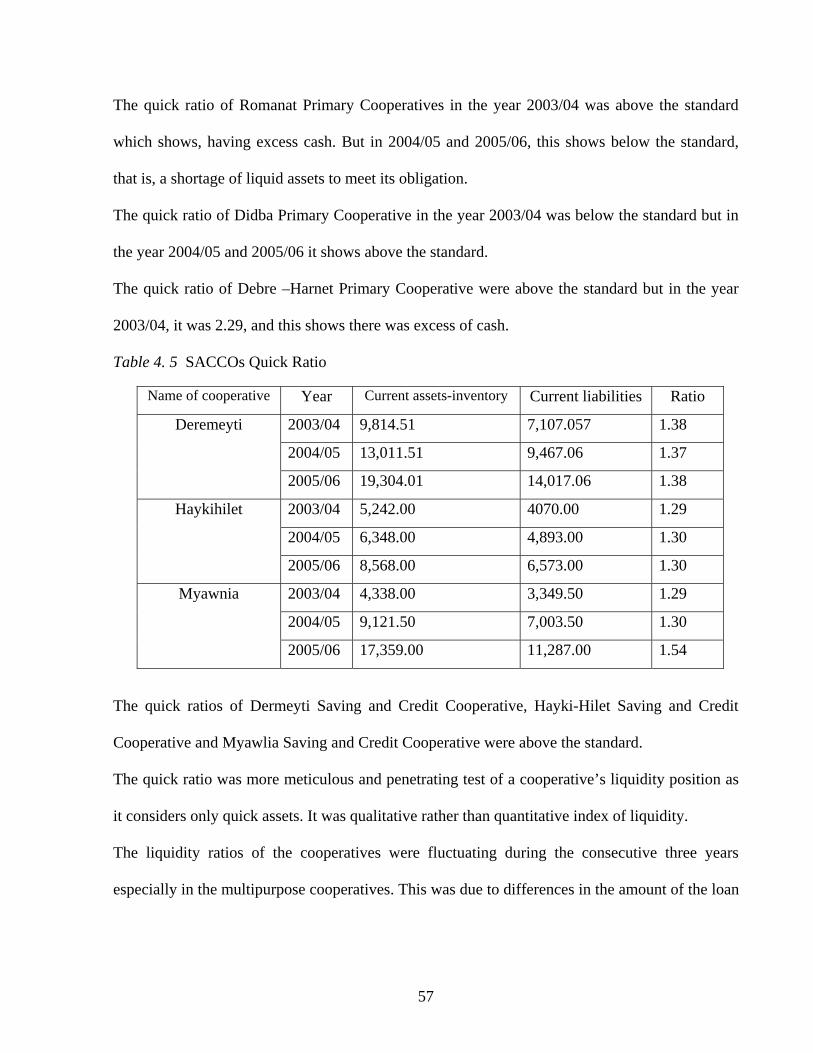
The quick ratio of Romanat Primary Cooperatives in the year 2003/04 was above the standard
which shows, having excess cash. But in 2004/05 and 2005/06, this shows below the standard,
that is, a shortage of liquid assets to meet its obligation.
The quick ratio of Didba Primary Cooperative in the year 2003/04 was below the standard but in
the year 2004/05 and 2005/06 it shows above the standard.
The quick ratio of Debre –Harnet Primary Cooperative were above the standard but in the year
2003/04, it was 2.29, and this shows there was excess of cash.
Table 4. 5 SACCOs Quick Ratio
Name of cooperative Year Current assets-inventory Current liabilities Ratio
2003/04 9,814.51 7,107.057 1.38
2004/05 13,011.51 9,467.06 1.37
Deremeyti
2005/06 19,304.01 14,017.06 1.38
2003/04 5,242.00 4070.00 1.29
2004/05 6,348.00 4,893.00 1.30
Haykihilet
2005/06 8,568.00 6,573.00 1.30
2003/04 4,338.00 3,349.50 1.29
2004/05 9,121.50 7,003.50 1.30
Myawnia
2005/06 17,359.00 11,287.00 1.54
The quick ratios of Dermeyti Saving and Credit Cooperative, Hayki-Hilet Saving and Credit
Cooperative and Myawlia Saving and Credit Cooperative were above the standard.
The quick ratio was more meticulous and penetrating test of a cooperative’s liquidity position as
it considers only quick assets. It was qualitative rather than quantitative index of liquidity.
The liquidity ratios of the cooperatives were fluctuating during the consecutive three years
especially in the multipurpose cooperatives. This was due to differences in the amount of the loan
57
from year to year and the existence of excess cash in the cooperatives and the cooperatives
should increase their capital to minimize the fluctuation.
2. Solvency ratios or leverage ratios
These ratios show the extent to which cooperatives use debt to finance investments and the
cooperatives ability to meet interest charges and other fixed payments.
a) Total liabilities to patron’s equity
This ratio measures the amount of finance supplied by creditors versus the amount provided by
member patrons. A ratio of over 1.1 to 1 and just over the ratio of 1 to 1 is generally accepted as a
desirable objective. This ratio indicates the relative proportion of capital provided by members
and creditors.
58
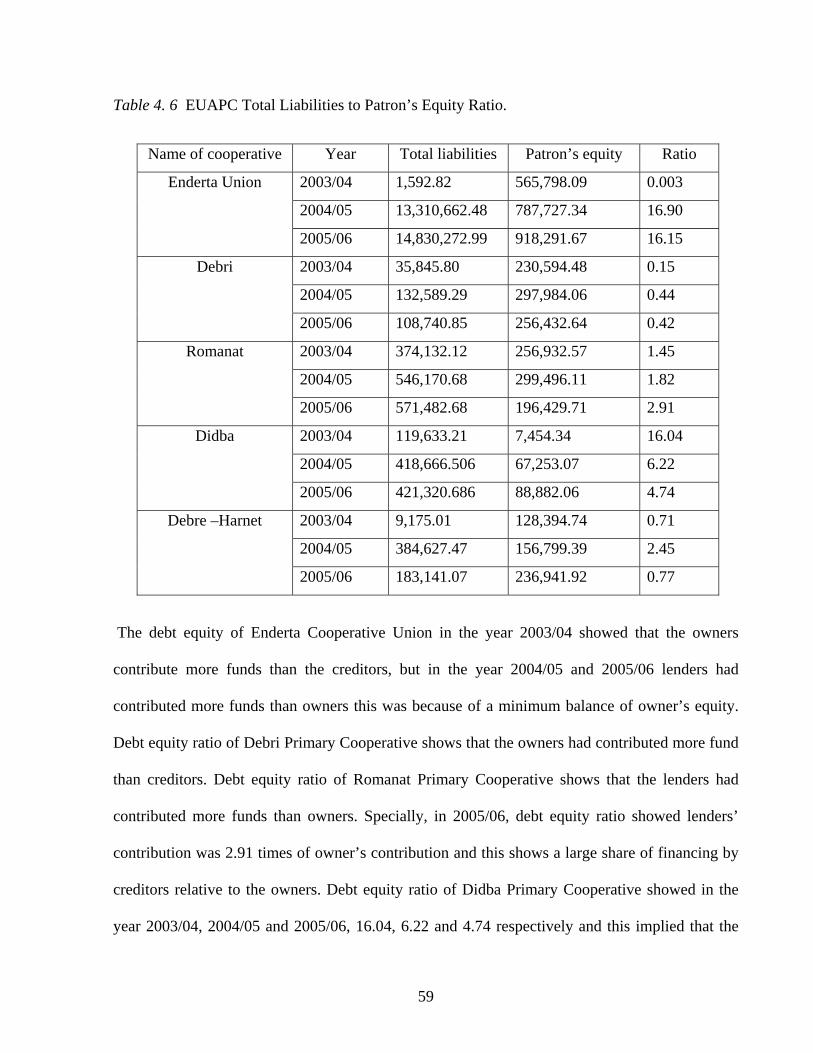
Table 4. 6 EUAPC Total Liabilities to Patron’s Equity Ratio.
Name of cooperative Year Total liabilities Patron’s equity Ratio
2003/04 1,592.82 565,798.09 0.003
2004/05 13,310,662.48 787,727.34 16.90
Enderta Union
2005/06 14,830,272.99 918,291.67 16.15
2003/04 35,845.80 230,594.48 0.15
2004/05 132,589.29 297,984.06 0.44
Debri
2005/06 108,740.85 256,432.64 0.42
2003/04 374,132.12 256,932.57 1.45
2004/05 546,170.68 299,496.11 1.82
Romanat
2005/06 571,482.68 196,429.71 2.91
2003/04 119,633.21 7,454.34 16.04
2004/05 418,666.506 67,253.07 6.22
Didba
2005/06 421,320.686 88,882.06 4.74
2003/04 9,175.01 128,394.74 0.71
2004/05 384,627.47 156,799.39 2.45
Debre –Harnet
2005/06 183,141.07 236,941.92 0.77
The debt equity of Enderta Cooperative Union in the year 2003/04 showed that the owners
contribute more funds than the creditors, but in the year 2004/05 and 2005/06 lenders had
contributed more funds than owners this was because of a minimum balance of owner’s equity.
Debt equity ratio of Debri Primary Cooperative shows that the owners had contributed more fund
than creditors. Debt equity ratio of Romanat Primary Cooperative shows that the lenders had
contributed more funds than owners. Specially, in 2005/06, debt equity ratio showed lenders’
contribution was 2.91 times of owner’s contribution and this shows a large share of financing by
creditors relative to the owners. Debt equity ratio of Didba Primary Cooperative showed in the
year 2003/04, 2004/05 and 2005/06, 16.04, 6.22 and 4.74 respectively and this implied that the
59
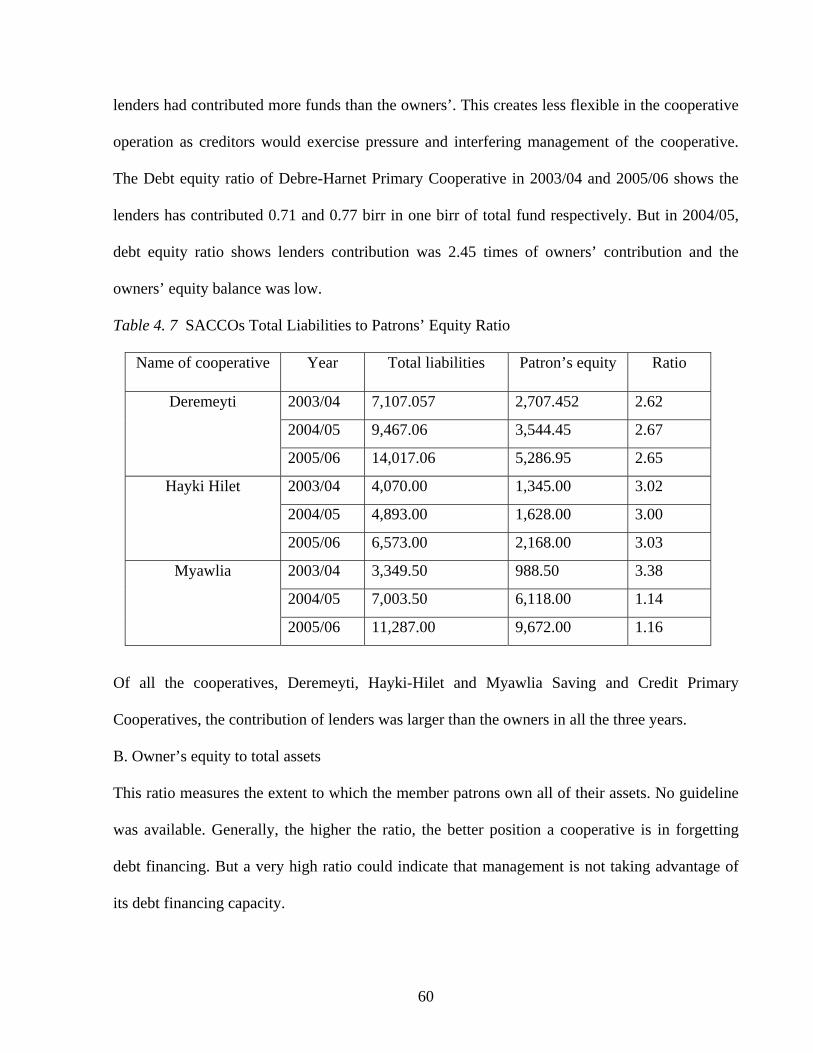
lenders had contributed more funds than the owners’. This creates less flexible in the cooperative
operation as creditors would exercise pressure and interfering management of the cooperative.
The Debt equity ratio of Debre-Harnet Primary Cooperative in 2003/04 and 2005/06 shows the
lenders has contributed 0.71 and 0.77 birr in one birr of total fund respectively. But in 2004/05,
debt equity ratio shows lenders contribution was 2.45 times of owners’ contribution and the
owners’ equity balance was low.
Table 4. 7 SACCOs Total Liabilities to Patrons’ Equity Ratio
Name of cooperative Year Total liabilities Patron’s equity Ratio
2003/04 7,107.057 2,707.452 2.62
2004/05 9,467.06 3,544.45 2.67
Deremeyti
2005/06 14,017.06 5,286.95 2.65
2003/04 4,070.00 1,345.00 3.02
2004/05 4,893.00 1,628.00 3.00
Hayki Hilet
2005/06 6,573.00 2,168.00 3.03
2003/04 3,349.50 988.50 3.38
2004/05 7,003.50 6,118.00 1.14
Myawlia
2005/06 11,287.00 9,672.00 1.16
Of all the cooperatives, Deremeyti, Hayki-Hilet and Myawlia Saving and Credit Primary
Cooperatives, the contribution of lenders was larger than the owners in all the three years.
B. Owner’s equity to total assets
This ratio measures the extent to which the member patrons own all of their assets. No guideline
was available. Generally, the higher the ratio, the better position a cooperative is in forgetting
debt financing. But a very high ratio could indicate that management is not taking advantage of
its debt financing capacity.
60
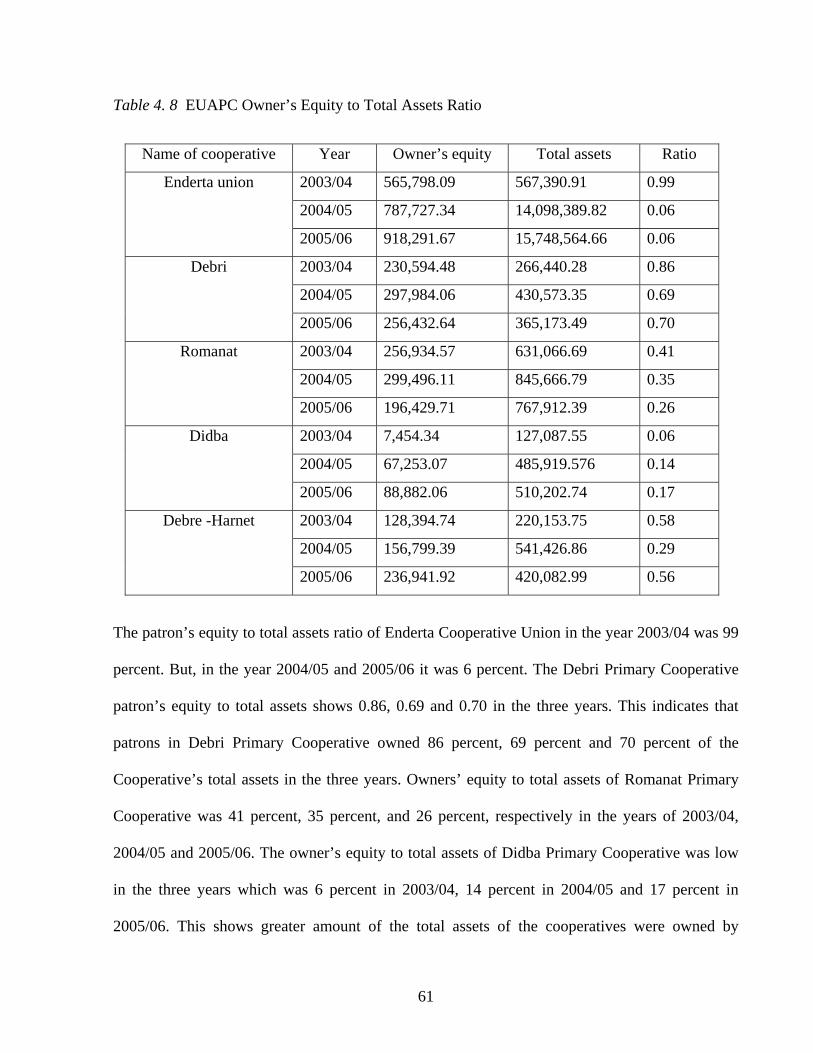
Table 4. 8 EUAPC Owner’s Equity to Total Assets Ratio
Name of cooperative Year Owner’s equity Total assets Ratio
2003/04 565,798.09 567,390.91 0.99
2004/05 787,727.34 14,098,389.82 0.06
Enderta union
2005/06 918,291.67 15,748,564.66 0.06
2003/04 230,594.48 266,440.28 0.86
2004/05 297,984.06 430,573.35 0.69
Debri
2005/06 256,432.64 365,173.49 0.70
2003/04 256,934.57 631,066.69 0.41
2004/05 299,496.11 845,666.79 0.35
Romanat
2005/06 196,429.71 767,912.39 0.26
2003/04 7,454.34 127,087.55 0.06
2004/05 67,253.07 485,919.576 0.14
Didba
2005/06 88,882.06 510,202.74 0.17
2003/04 128,394.74 220,153.75 0.58
2004/05 156,799.39 541,426.86 0.29
Debre -Harnet
2005/06 236,941.92 420,082.99 0.56
The patron’s equity to total assets ratio of Enderta Cooperative Union in the year 2003/04 was 99
percent. But, in the year 2004/05 and 2005/06 it was 6 percent. The Debri Primary Cooperative
patron’s equity to total assets shows 0.86, 0.69 and 0.70 in the three years. This indicates that
patrons in Debri Primary Cooperative owned 86 percent, 69 percent and 70 percent of the
Cooperative’s total assets in the three years. Owners’ equity to total assets of Romanat Primary
Cooperative was 41 percent, 35 percent, and 26 percent, respectively in the years of 2003/04,
2004/05 and 2005/06. The owner’s equity to total assets of Didba Primary Cooperative was low
in the three years which was 6 percent in 2003/04, 14 percent in 2004/05 and 17 percent in
2005/06. This shows greater amount of the total assets of the cooperatives were owned by
61
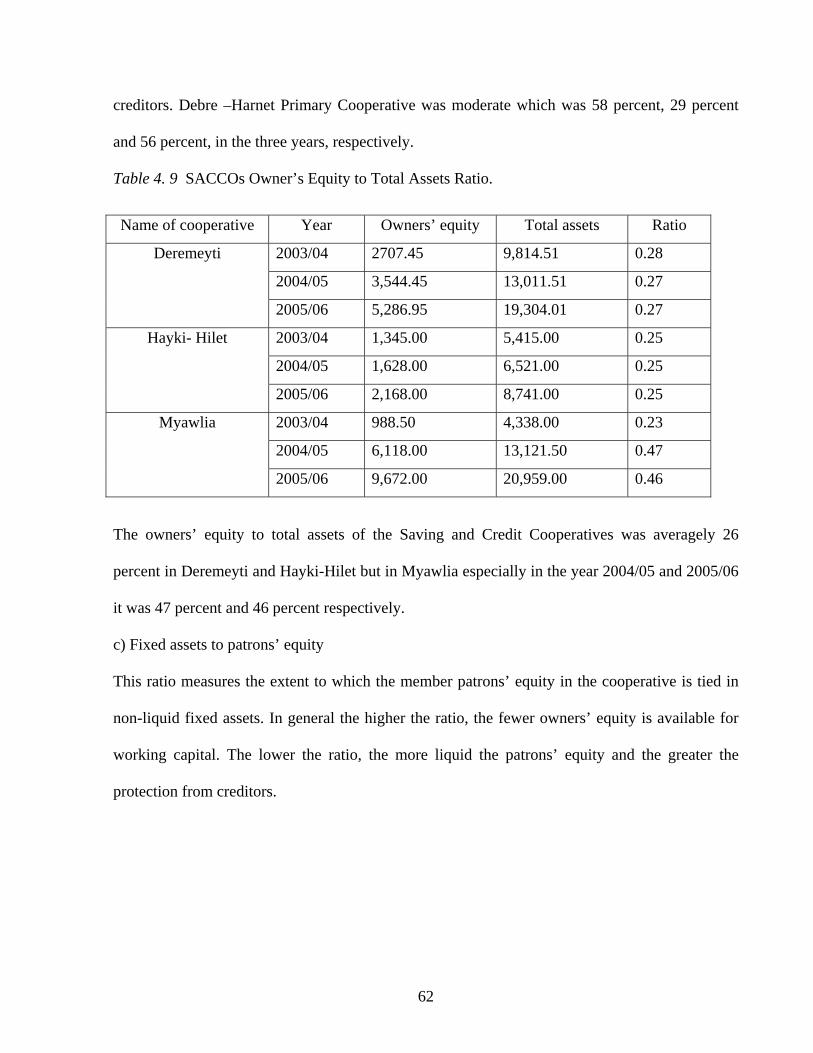
creditors. Debre –Harnet Primary Cooperative was moderate which was 58 percent, 29 percent
and 56 percent, in the three years, respectively.
Table 4. 9 SACCOs Owner’s Equity to Total Assets Ratio.
Name of cooperative Year Owners’ equity Total assets Ratio
2003/04 2707.45 9,814.51 0.28
2004/05 3,544.45 13,011.51 0.27
Deremeyti
2005/06 5,286.95 19,304.01 0.27
2003/04 1,345.00 5,415.00 0.25
2004/05 1,628.00 6,521.00 0.25
Hayki- Hilet
2005/06 2,168.00 8,741.00 0.25
2003/04 988.50 4,338.00 0.23
2004/05 6,118.00 13,121.50 0.47
Myawlia
2005/06 9,672.00 20,959.00 0.46
The owners’ equity to total assets of the Saving and Credit Cooperatives was averagely 26
percent in Deremeyti and Hayki-Hilet but in Myawlia especially in the year 2004/05 and 2005/06
it was 47 percent and 46 percent respectively.
c) Fixed assets to patrons’ equity
This ratio measures the extent to which the member patrons’ equity in the cooperative is tied in
non-liquid fixed assets. In general the higher the ratio, the fewer owners’ equity is available for
working capital. The lower the ratio, the more liquid the patrons’ equity and the greater the
protection from creditors.
62
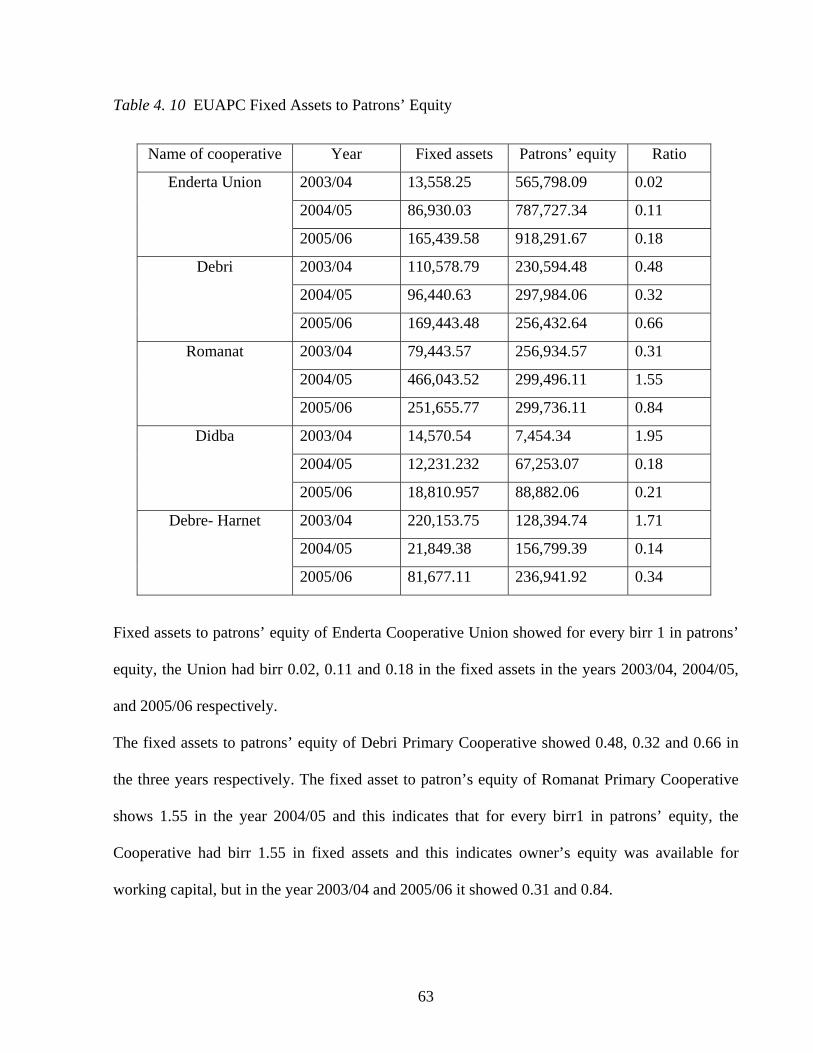
Table 4. 10 EUAPC Fixed Assets to Patrons’ Equity
Name of cooperative Year Fixed assets Patrons’ equity Ratio
2003/04 13,558.25 565,798.09 0.02
2004/05 86,930.03 787,727.34 0.11
Enderta Union
2005/06 165,439.58 918,291.67 0.18
2003/04 110,578.79 230,594.48 0.48
2004/05 96,440.63 297,984.06 0.32
Debri
2005/06 169,443.48 256,432.64 0.66
2003/04 79,443.57 256,934.57 0.31
2004/05 466,043.52 299,496.11 1.55
Romanat
2005/06 251,655.77 299,736.11 0.84
2003/04 14,570.54 7,454.34 1.95
2004/05 12,231.232 67,253.07 0.18
Didba
2005/06 18,810.957 88,882.06 0.21
2003/04 220,153.75 128,394.74 1.71
2004/05 21,849.38 156,799.39 0.14
Debre- Harnet
2005/06 81,677.11 236,941.92 0.34
Fixed assets to patrons’ equity of Enderta Cooperative Union showed for every birr 1 in patrons’
equity, the Union had birr 0.02, 0.11 and 0.18 in the fixed assets in the years 2003/04, 2004/05,
and 2005/06 respectively.
The fixed assets to patrons’ equity of Debri Primary Cooperative showed 0.48, 0.32 and 0.66 in
the three years respectively. The fixed asset to patron’s equity of Romanat Primary Cooperative
shows 1.55 in the year 2004/05 and this indicates that for every birr1 in patrons’ equity, the
Cooperative had birr 1.55 in fixed assets and this indicates owner’s equity was available for
working capital, but in the year 2003/04 and 2005/06 it showed 0.31 and 0.84.
63
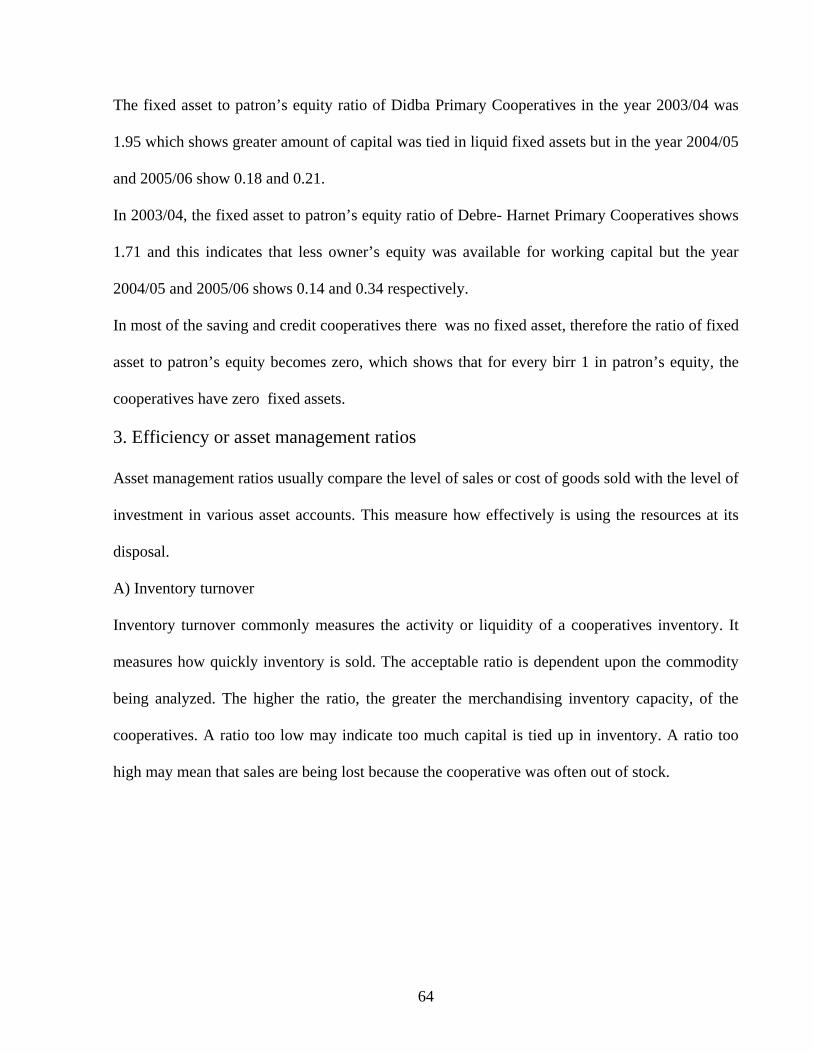
The fixed asset to patron’s equity ratio of Didba Primary Cooperatives in the year 2003/04 was
1.95 which shows greater amount of capital was tied in liquid fixed assets but in the year 2004/05
and 2005/06 show 0.18 and 0.21.
In 2003/04, the fixed asset to patron’s equity ratio of Debre- Harnet Primary Cooperatives shows
1.71 and this indicates that less owner’s equity was available for working capital but the year
2004/05 and 2005/06 shows 0.14 and 0.34 respectively.
In most of the saving and credit cooperatives there was no fixed asset, therefore the ratio of fixed
asset to patron’s equity becomes zero, which shows that for every birr 1 in patron’s equity, the
cooperatives have zero fixed assets.
3. Efficiency or asset management ratios
Asset management ratios usually compare the level of sales or cost of goods sold with the level of
investment in various asset accounts. This measure how effectively is using the resources at its
disposal.
A) Inventory turnover
Inventory turnover commonly measures the activity or liquidity of a cooperatives inventory. It
measures how quickly inventory is sold. The acceptable ratio is dependent upon the commodity
being analyzed. The higher the ratio, the greater the merchandising inventory capacity, of the
cooperatives. A ratio too low may indicate too much capital is tied up in inventory. A ratio too
high may mean that sales are being lost because the cooperative was often out of stock.
64
Table 4. 11 EUAPC Inventory Turnover Ratio
Name of
cooperative
Year Cost of goods sold Ending inventory Ratio
2003/04 802,087.13 18,486.26 43.38
2004/05 47,230,501.60 12,907,125.94 3.66
Enderta Union
2005/06 52,622,567.34 14,380,666.73 3.65
2003/04 144,264.71 8,480.00 17.01
2004/05 197,657.84 21,280.40 9.29
Debri
2005/06 537,379.03 17,494.95 30.72
2003/04 86,837.31 17,746.05 4.89
2004/05 119,853.51 20,085.14 5.97
Romanat
2005/06 362,199.94 67,235.63 5.39
2003/04 167,241.97 2,480.01 67.44
2004/05 312,351.74 10,943.74 28.54
Didba
2005/06 636,420.29 14,206.11 44.80
2003/04 190,466.50 3,981.20 47,84
2004/05 291,609.15 4,219.87 69.10
Debre-Harnet
2005/06 465,720.39 8,151.59 57.13
The largest volume of activities of the Enderta Union and its affiliated multipurpose cooperatives
were purchasing different types of inventories mainly agricultural inputs such as fertilizer,
selected seeds, etc, in order to generate a profit. Based on the analysis made, the inventory
turnover of the Enderta Cooperative Union in the year 2003/04 was 43.38. This shows very low
level of inventory or under investment in inventory. But the years 2004/05 and 2005/06, show
3.66 and 3.65 respectively. This indicates that higher rental of spaces and other inventory
carrying costs.
65
The inventory turn over ratio of Debri Primary Cooperative was fast in all the three years.
Especially in the year 2005/06 it indicated 30.72 which show that sales were lost because the
cooperative was often out of stock. From the focus group discussion this was as a result of a
recent year Teff inventory was not existed in the cooperative. In the years of the 2003/04 and
2004/05, the analysis showed 17.01 and 9.29.The inventory turnover ratio of Romanat Primary
Cooperative was a balanced ratio of 4.89, 5.97 and 5.39 in the three years respectively.
The inventory turnover ratio of Didba and Debre- Harnet Primary Cooperative was high and this
showed inventory was sold directly to purchasers without any delay.
The inventory turnover of Saving and Credit Cooperatives could not be measured because the
figures were not relevant to this cooperative.
B. Fixed asset turnover
The fixed asset turnover measures the efficiency with which the cooperatives have been using
their fixed assets to generate sales. This ratio indicates the efficiency of the management in
managing fixed assets.
66
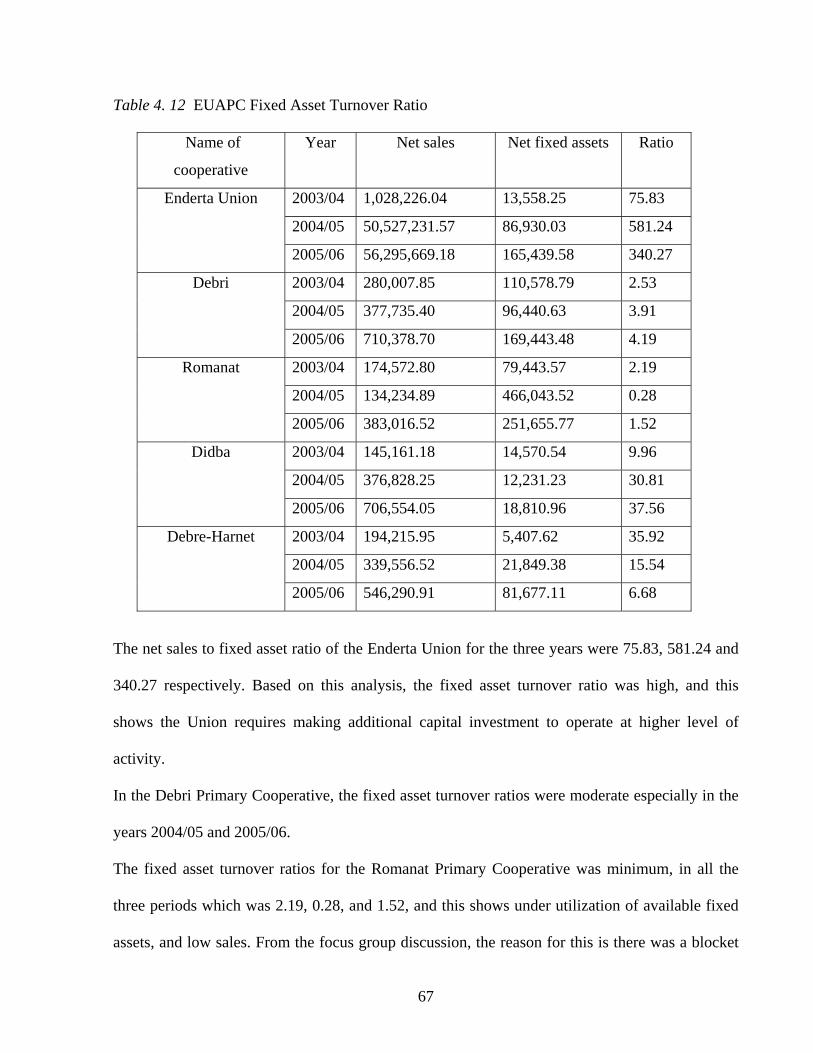
Table 4. 12 EUAPC Fixed Asset Turnover Ratio
Name of
cooperative
Year Net sales Net fixed assets Ratio
2003/04 1,028,226.04 13,558.25 75.83
2004/05 50,527,231.57 86,930.03 581.24
Enderta Union
2005/06 56,295,669.18 165,439.58 340.27
2003/04 280,007.85 110,578.79 2.53
2004/05 377,735.40 96,440.63 3.91
Debri
2005/06 710,378.70 169,443.48 4.19
2003/04 174,572.80 79,443.57 2.19
2004/05 134,234.89 466,043.52 0.28
Romanat
2005/06 383,016.52 251,655.77 1.52
2003/04 145,161.18 14,570.54 9.96
2004/05 376,828.25 12,231.23 30.81
Didba
2005/06 706,554.05 18,810.96 37.56
2003/04 194,215.95 5,407.62 35.92
2004/05 339,556.52 21,849.38 15.54
Debre-Harnet
2005/06 546,290.91 81,677.11 6.68
The net sales to fixed asset ratio of the Enderta Union for the three years were 75.83, 581.24 and
340.27 respectively. Based on this analysis, the fixed asset turnover ratio was high, and this
shows the Union requires making additional capital investment to operate at higher level of
activity.
In the Debri Primary Cooperative, the fixed asset turnover ratios were moderate especially in the
years 2004/05 and 2005/06.
The fixed asset turnover ratios for the Romanat Primary Cooperative was minimum, in all the
three periods which was 2.19, 0.28, and 1.52, and this shows under utilization of available fixed
assets, and low sales. From the focus group discussion, the reason for this is there was a blocket
67
factory which was not used efficiently because of fluctuation of the price of the inputs and prices
of the finished products.
In the Didba and Debre-Harnet Primary Cooperatives, the fixed asset turnover ratio was higher,
which shows that more efficiency in managing and utilizing the fixed assets and the need for
additional investment in fixed assets.
The fixed asset turnover for the saving and credit cooperatives could not be applied because the
figures were not found in the financial statements and their operation was very limited.
c) Total assets turnover
The total assets turnover ratios indicate how much birr in sales the cooperative squeezes out of
each birr it has invested in assets. Generally, the higher a cooperatives total assets turnover, the
more efficiently its assets have been used.
68
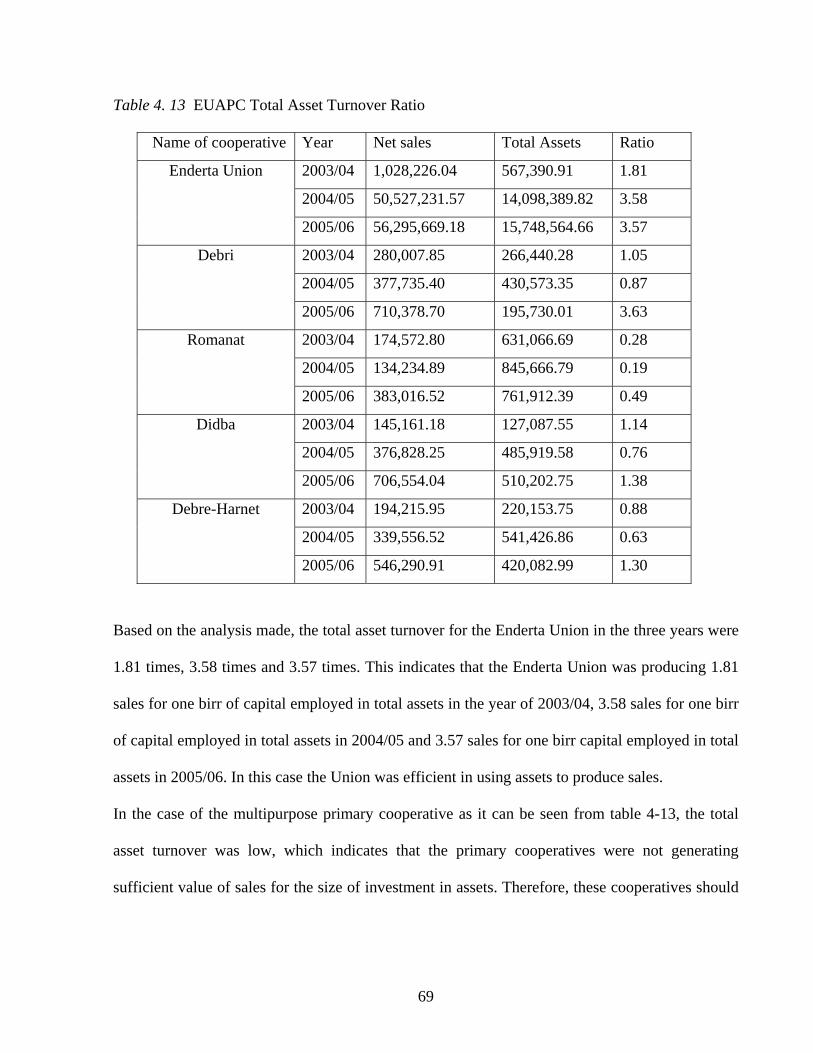
Table 4. 13 EUAPC Total Asset Turnover Ratio
Name of cooperative Year Net sales Total Assets Ratio
2003/04 1,028,226.04 567,390.91 1.81
2004/05 50,527,231.57 14,098,389.82 3.58
Enderta Union
2005/06 56,295,669.18 15,748,564.66 3.57
2003/04 280,007.85 266,440.28 1.05
2004/05 377,735.40 430,573.35 0.87
Debri
2005/06 710,378.70 195,730.01 3.63
2003/04 174,572.80 631,066.69 0.28
2004/05 134,234.89 845,666.79 0.19
Romanat
2005/06 383,016.52 761,912.39 0.49
2003/04 145,161.18 127,087.55 1.14
2004/05 376,828.25 485,919.58 0.76
Didba
2005/06 706,554.04 510,202.75 1.38
2003/04 194,215.95 220,153.75 0.88
2004/05 339,556.52 541,426.86 0.63
Debre-Harnet
2005/06 546,290.91 420,082.99 1.30
Based on the analysis made, the total asset turnover for the Enderta Union in the three years were
1.81 times, 3.58 times and 3.57 times. This indicates that the Enderta Union was producing 1.81
sales for one birr of capital employed in total assets in the year of 2003/04, 3.58 sales for one birr
of capital employed in total assets in 2004/05 and 3.57 sales for one birr capital employed in total
assets in 2005/06. In this case the Union was efficient in using assets to produce sales.
In the case of the multipurpose primary cooperative as it can be seen from table 4-13, the total
asset turnover was low, which indicates that the primary cooperatives were not generating
sufficient value of sales for the size of investment in assets. Therefore, these cooperatives should
69
take steps to increase sales (assets remain the same) or dispose of their investment in assets or
both.
4) Profitability ratios
The profitability ratios measure operating efficiency and ability to ensure adequate return to
members. These ratios were used to evaluate the overall management effectiveness and efficiency
in generating profit on sales, total assets and owner’s equity.
a) Gross profit margin
The gross profit margin measures the percentage of each sales of birr remaining after the
cooperatives had paid for the goods. It measures how effectively a management can adjust
operations to annual changes.
70
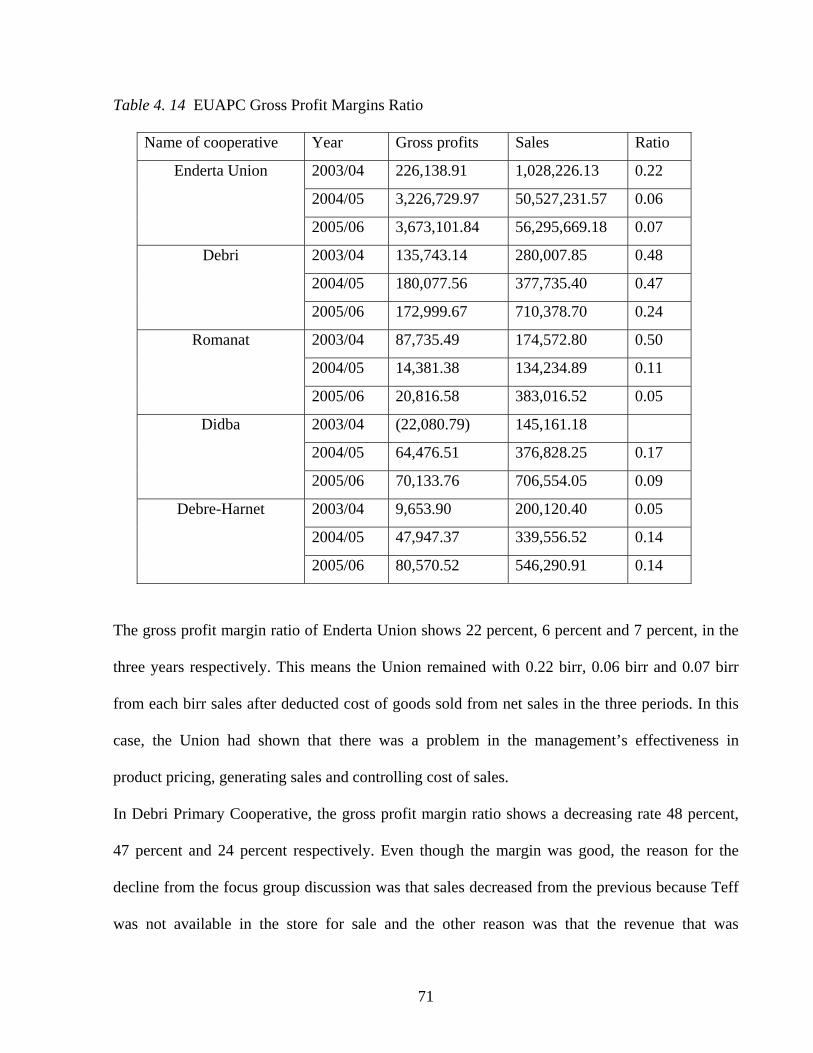
Table 4. 14 EUAPC Gross Profit Margins Ratio
Name of cooperative Year Gross profits Sales Ratio
2003/04 226,138.91 1,028,226.13 0.22
2004/05 3,226,729.97 50,527,231.57 0.06
Enderta Union
2005/06 3,673,101.84 56,295,669.18 0.07
2003/04 135,743.14 280,007.85 0.48
2004/05 180,077.56 377,735.40 0.47
Debri
2005/06 172,999.67 710,378.70 0.24
2003/04 87,735.49 174,572.80 0.50
2004/05 14,381.38 134,234.89 0.11
Romanat
2005/06 20,816.58 383,016.52 0.05
2003/04 (22,080.79) 145,161.18
2004/05 64,476.51 376,828.25 0.17
Didba
2005/06 70,133.76 706,554.05 0.09
2003/04 9,653.90 200,120.40 0.05
2004/05 47,947.37 339,556.52 0.14
Debre-Harnet
2005/06 80,570.52 546,290.91 0.14
The gross profit margin ratio of Enderta Union shows 22 percent, 6 percent and 7 percent, in the
three years respectively. This means the Union remained with 0.22 birr, 0.06 birr and 0.07 birr
from each birr sales after deducted cost of goods sold from net sales in the three periods. In this
case, the Union had shown that there was a problem in the management’s effectiveness in
product pricing, generating sales and controlling cost of sales.
In Debri Primary Cooperative, the gross profit margin ratio shows a decreasing rate 48 percent,
47 percent and 24 percent respectively. Even though the margin was good, the reason for the
decline from the focus group discussion was that sales decreased from the previous because Teff
was not available in the store for sale and the other reason was that the revenue that was
71
generated from the grinding mill decreased because of private competitors and quality problems.
The trend was the same in the case of Romanat Primary Cooperatives.
In the case of Didba Primary Cooperative the gross profit margin ratio for the year 2003/04
shows that it has generated a loss for every birr sales, but for the years 2004/05 and 2005/06, it
has contributed 0.17 birr and 0.09 birr to profits respectively
In the case of Debre –Harnet Primary Cooperative the contribution of gross profit ratio showed
0.05 birr, 0.14 birr and 0.14 birr in the three periods to profit.
In all the Enderta Union and its affiliated Primary Cooperatives the gross profit ratio showed
fluctuations and this was an indication of problems of lack of effectiveness management in
product pricing, generating sales and controlling costs.
b) Net profit margin
The net profit margin measures the percentages of each sales in birr remaining after all costs and
expenses, including interest and taxes have been deducted.
72
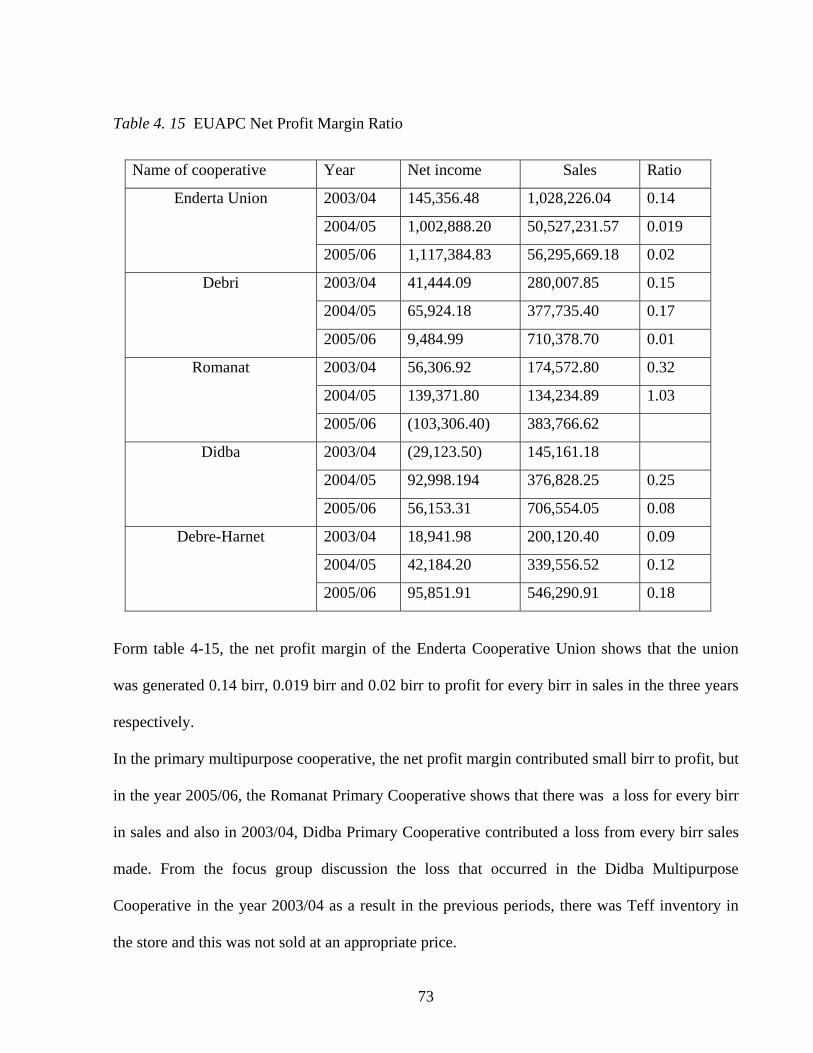
Table 4. 15 EUAPC Net Profit Margin Ratio
Name of cooperative Year Net income Sales Ratio
2003/04 145,356.48 1,028,226.04 0.14
2004/05 1,002,888.20 50,527,231.57 0.019
Enderta Union
2005/06 1,117,384.83 56,295,669.18 0.02
2003/04 41,444.09 280,007.85 0.15
2004/05 65,924.18 377,735.40 0.17
Debri
2005/06 9,484.99 710,378.70 0.01
2003/04 56,306.92 174,572.80 0.32
2004/05 139,371.80 134,234.89 1.03
Romanat
2005/06 (103,306.40) 383,766.62
2003/04 (29,123.50) 145,161.18
2004/05 92,998.194 376,828.25 0.25
Didba
2005/06 56,153.31 706,554.05 0.08
2003/04 18,941.98 200,120.40 0.09
2004/05 42,184.20 339,556.52 0.12
Debre-Harnet
2005/06 95,851.91 546,290.91 0.18
Form table 4-15, the net profit margin of the Enderta Cooperative Union shows that the union
was generated 0.14 birr, 0.019 birr and 0.02 birr to profit for every birr in sales in the three years
respectively.
In the primary multipurpose cooperative, the net profit margin contributed small birr to profit, but
in the year 2005/06, the Romanat Primary Cooperative shows that there was a loss for every birr
in sales and also in 2003/04, Didba Primary Cooperative contributed a loss from every birr sales
made. From the focus group discussion the loss that occurred in the Didba Multipurpose
Cooperative in the year 2003/04 as a result in the previous periods, there was Teff inventory in
the store and this was not sold at an appropriate price.
73
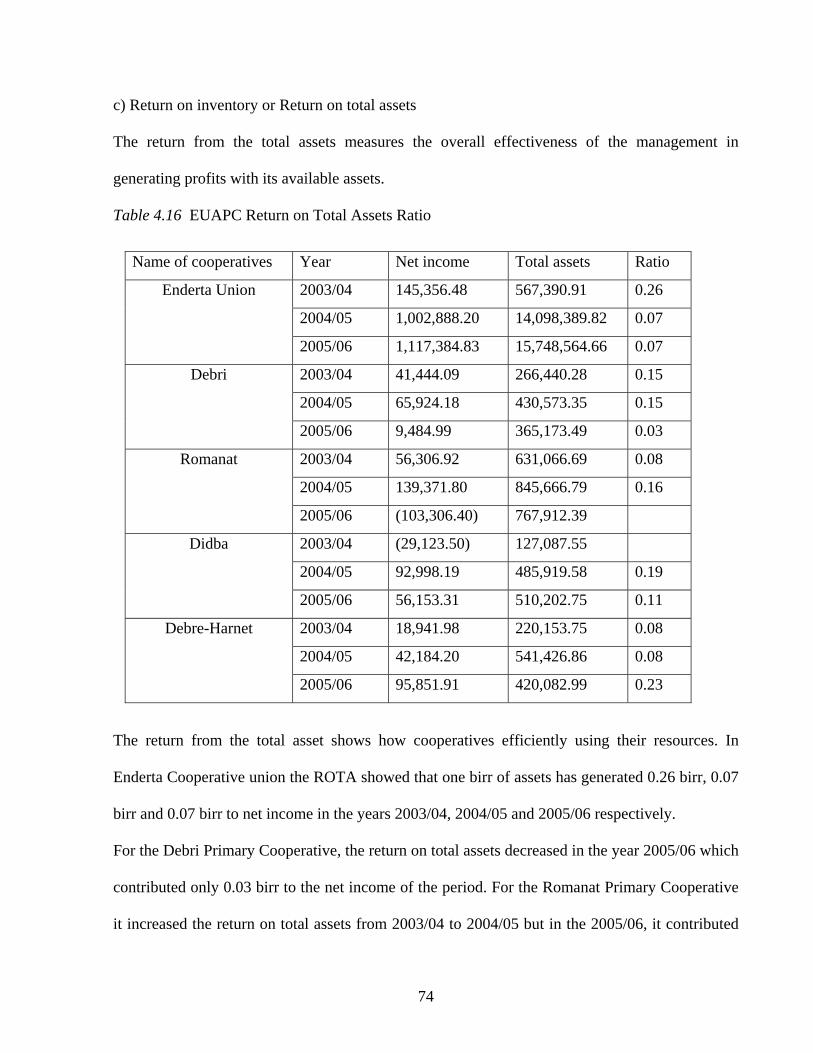
c) Return on inventory or Return on total assets
The return from the total assets measures the overall effectiveness of the management in
generating profits with its available assets.
Table 4.16 EUAPC Return on Total Assets Ratio
Name of cooperatives Year Net income Total assets Ratio
2003/04 145,356.48 567,390.91 0.26
2004/05 1,002,888.20 14,098,389.82 0.07
Enderta Union
2005/06 1,117,384.83 15,748,564.66 0.07
2003/04 41,444.09 266,440.28 0.15
2004/05 65,924.18 430,573.35 0.15
Debri
2005/06 9,484.99 365,173.49 0.03
2003/04 56,306.92 631,066.69 0.08
2004/05 139,371.80 845,666.79 0.16
Romanat
2005/06 (103,306.40) 767,912.39
2003/04 (29,123.50) 127,087.55
2004/05 92,998.19 485,919.58 0.19
Didba
2005/06 56,153.31 510,202.75 0.11
2003/04 18,941.98 220,153.75 0.08
2004/05 42,184.20 541,426.86 0.08
Debre-Harnet
2005/06 95,851.91 420,082.99 0.23
The return from the total asset shows how cooperatives efficiently using their resources. In
Enderta Cooperative union the ROTA showed that one birr of assets has generated 0.26 birr, 0.07
birr and 0.07 birr to net income in the years 2003/04, 2004/05 and 2005/06 respectively.
For the Debri Primary Cooperative, the return on total assets decreased in the year 2005/06 which
contributed only 0.03 birr to the net income of the period. For the Romanat Primary Cooperative
it increased the return on total assets from 2003/04 to 2004/05 but in the 2005/06, it contributed
74
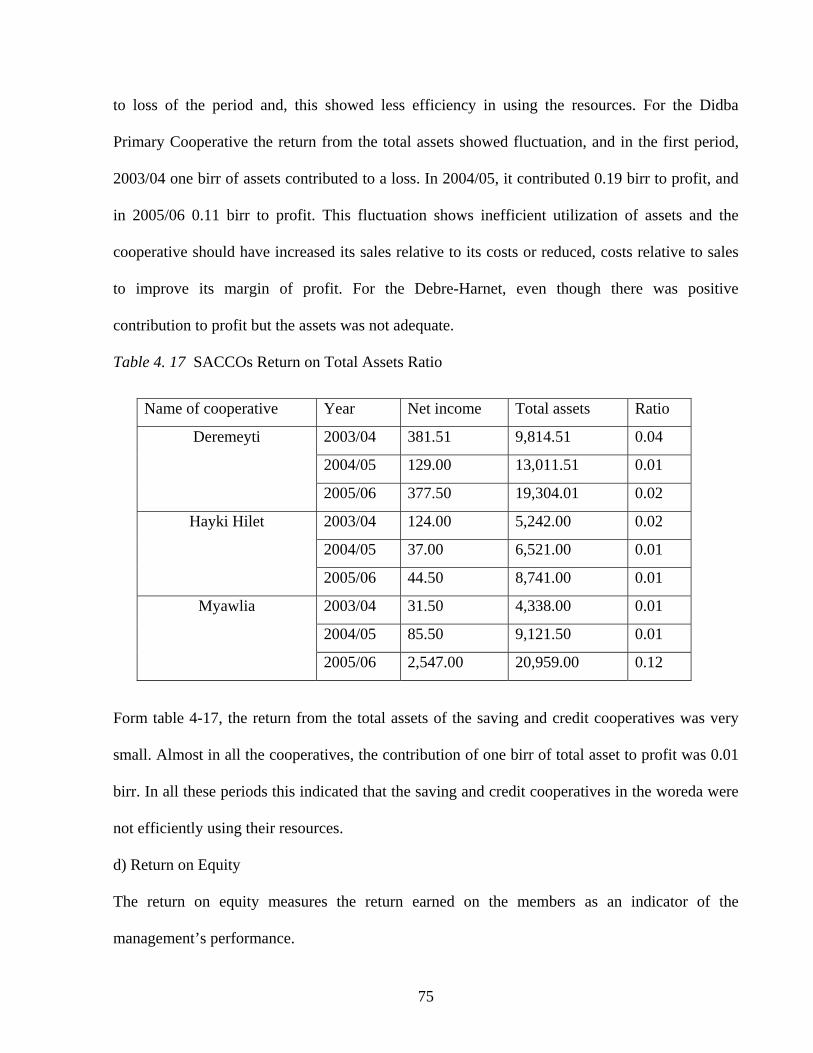
to loss of the period and, this showed less efficiency in using the resources. For the Didba
Primary Cooperative the return from the total assets showed fluctuation, and in the first period,
2003/04 one birr of assets contributed to a loss. In 2004/05, it contributed 0.19 birr to profit, and
in 2005/06 0.11 birr to profit. This fluctuation shows inefficient utilization of assets and the
cooperative should have increased its sales relative to its costs or reduced, costs relative to sales
to improve its margin of profit. For the Debre-Harnet, even though there was positive
contribution to profit but the assets was not adequate.
Table 4. 17 SACCOs Return on Total Assets Ratio
Name of cooperative Year Net income Total assets Ratio
2003/04 381.51 9,814.51 0.04 Deremeyti
2004/05 129.00 13,011.51 0.01
2005/06 377.50 19,304.01 0.02
2003/04 124.00 5,242.00 0.02
2004/05 37.00 6,521.00 0.01
Hayki Hilet
2005/06 44.50 8,741.00 0.01
2003/04 31.50 4,338.00 0.01
2004/05 85.50 9,121.50 0.01
Myawlia
2005/06 2,547.00 20,959.00 0.12
Form table 4-17, the return from the total assets of the saving and credit cooperatives was very
small. Almost in all the cooperatives, the contribution of one birr of total asset to profit was 0.01
birr. In all these periods this indicated that the saving and credit cooperatives in the woreda were
not efficiently using their resources.
d) Return on Equity
The return on equity measures the return earned on the members as an indicator of the
management’s performance.
75
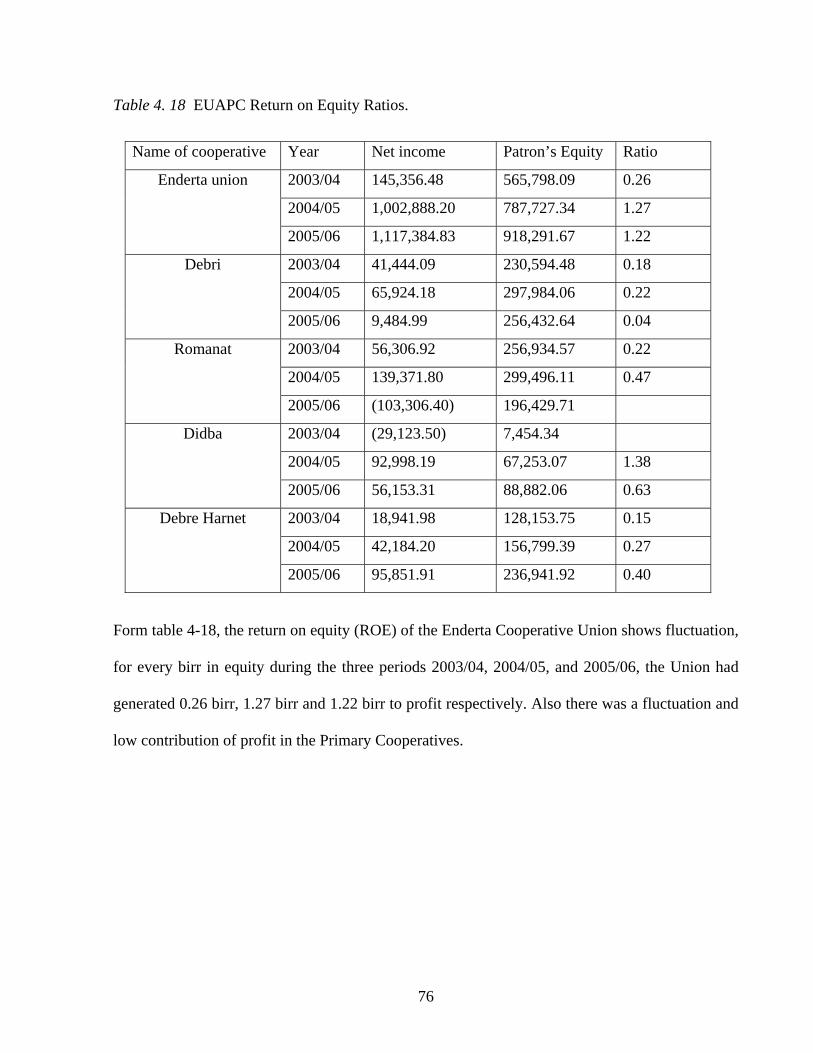
Table 4. 18 EUAPC Return on Equity Ratios.
Name of cooperative Year Net income Patron’s Equity Ratio
2003/04 145,356.48 565,798.09 0.26
2004/05 1,002,888.20 787,727.34 1.27
Enderta union
2005/06 1,117,384.83 918,291.67 1.22
2003/04 41,444.09 230,594.48 0.18
2004/05 65,924.18 297,984.06 0.22
Debri
2005/06 9,484.99 256,432.64 0.04
2003/04 56,306.92 256,934.57 0.22
2004/05 139,371.80 299,496.11 0.47
Romanat
2005/06 (103,306.40) 196,429.71
2003/04 (29,123.50) 7,454.34
2004/05 92,998.19 67,253.07 1.38
Didba
2005/06 56,153.31 88,882.06 0.63
2003/04 18,941.98 128,153.75 0.15
2004/05 42,184.20 156,799.39 0.27
Debre Harnet
2005/06 95,851.91 236,941.92 0.40
Form table 4-18, the return on equity (ROE) of the Enderta Cooperative Union shows fluctuation,
for every birr in equity during the three periods 2003/04, 2004/05, and 2005/06, the Union had
generated 0.26 birr, 1.27 birr and 1.22 birr to profit respectively. Also there was a fluctuation and
low contribution of profit in the Primary Cooperatives.
76
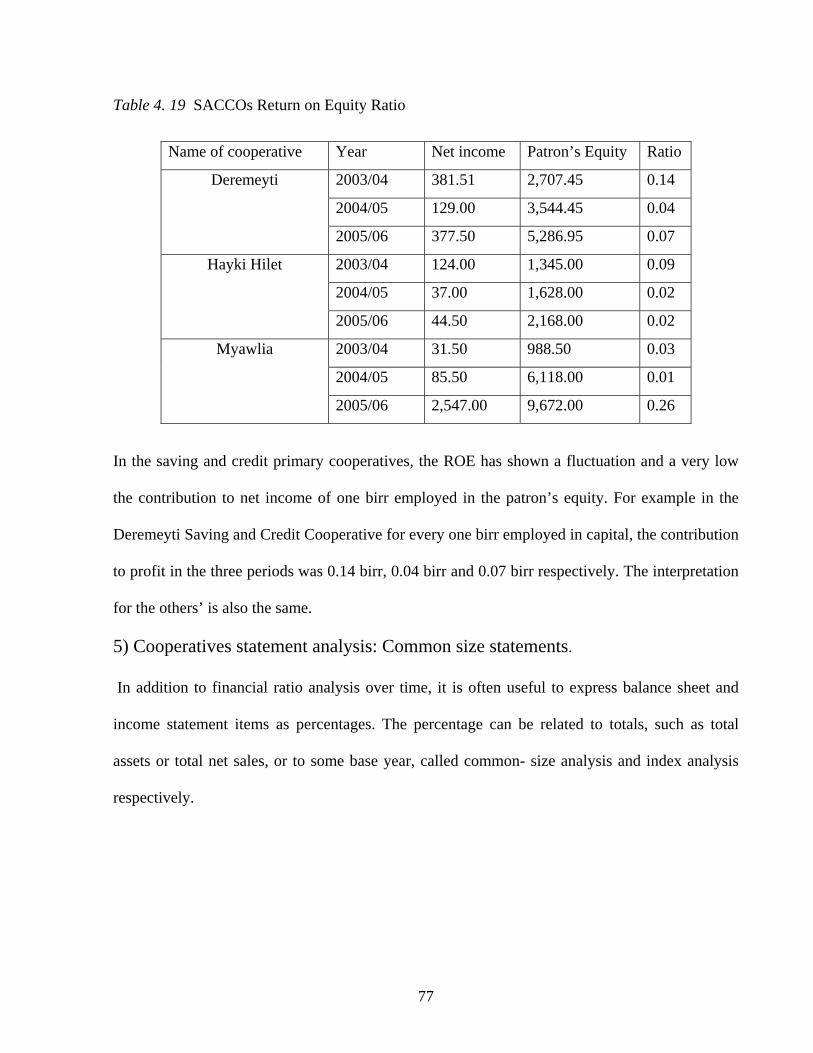
Table 4. 19 SACCOs Return on Equity Ratio
Name of cooperative Year Net income Patron’s Equity Ratio
2003/04 381.51 2,707.45 0.14
2004/05 129.00 3,544.45 0.04
Deremeyti
2005/06 377.50 5,286.95 0.07
2003/04 124.00 1,345.00 0.09
2004/05 37.00 1,628.00 0.02
Hayki Hilet
2005/06 44.50 2,168.00 0.02
2003/04 31.50 988.50 0.03
2004/05 85.50 6,118.00 0.01
Myawlia
2005/06 2,547.00 9,672.00 0.26
In the saving and credit primary cooperatives, the ROE has shown a fluctuation and a very low
the contribution to net income of one birr employed in the patron’s equity. For example in the
Deremeyti Saving and Credit Cooperative for every one birr employed in capital, the contribution
to profit in the three periods was 0.14 birr, 0.04 birr and 0.07 birr respectively. The interpretation
for the others’ is also the same.
5) Cooperatives statement analysis: Common size statements.
In addition to financial ratio analysis over time, it is often useful to express balance sheet and
income statement items as percentages. The percentage can be related to totals, such as total
assets or total net sales, or to some base year, called common- size analysis and index analysis
respectively.
77
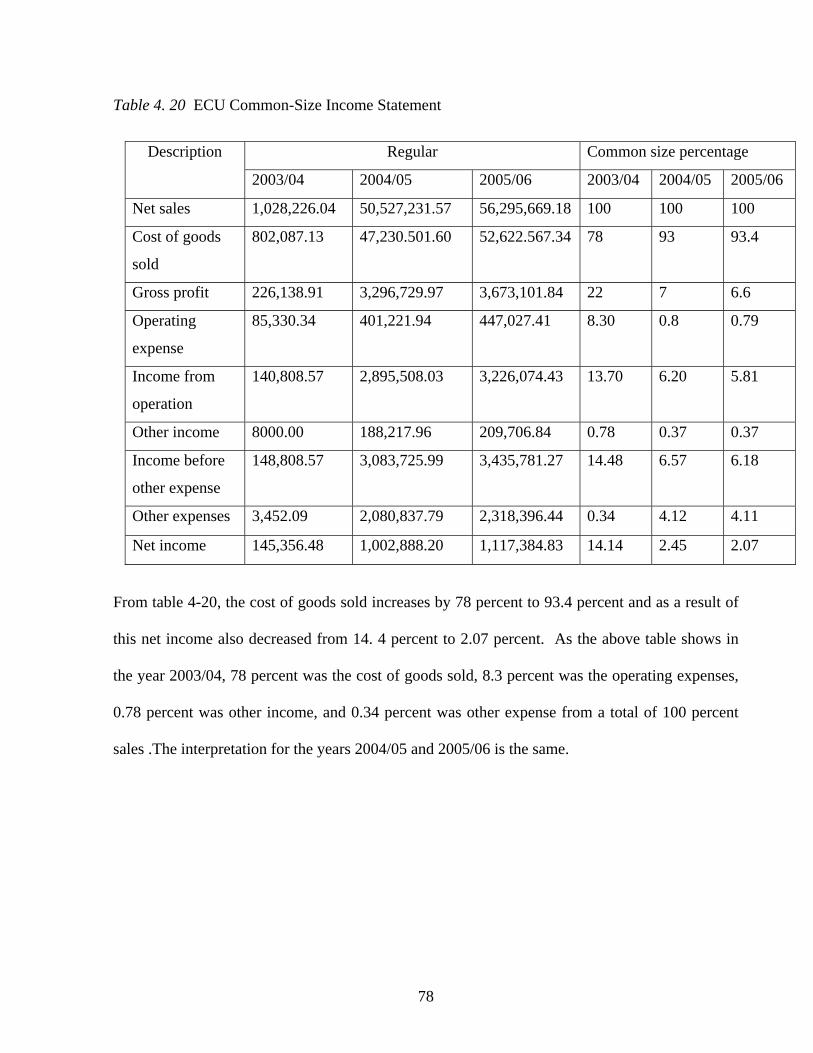
Table 4. 20 ECU Common-Size Income Statement
Regular Common size percentage Description
2003/04 2004/05 2005/06 2003/04 2004/05 2005/06
Net sales 1,028,226.04 50,527,231.57 56,295,669.18 100 100 100
Cost of goods
sold
802,087.13 47,230.501.60 52,622.567.34 78 93 93.4
Gross profit 226,138.91 3,296,729.97 3,673,101.84 22 7 6.6
Operating
expense
85,330.34 401,221.94 447,027.41 8.30 0.8 0.79
Income from
operation
140,808.57 2,895,508.03 3,226,074.43 13.70 6.20 5.81
Other income 8000.00 188,217.96 209,706.84 0.78 0.37 0.37
Income before
other expense
148,808.57 3,083,725.99 3,435,781.27 14.48 6.57 6.18
Other expenses 3,452.09 2,080,837.79 2,318,396.44 0.34 4.12 4.11
Net income 145,356.48 1,002,888.20 1,117,384.83 14.14 2.45 2.07
From table 4-20, the cost of goods sold increases by 78 percent to 93.4 percent and as a result of
this net income also decreased from 14. 4 percent to 2.07 percent. As the above table shows in
the year 2003/04, 78 percent was the cost of goods sold, 8.3 percent was the operating expenses,
0.78 percent was other income, and 0.34 percent was other expense from a total of 100 percent
sales .The interpretation for the years 2004/05 and 2005/06 is the same.
78
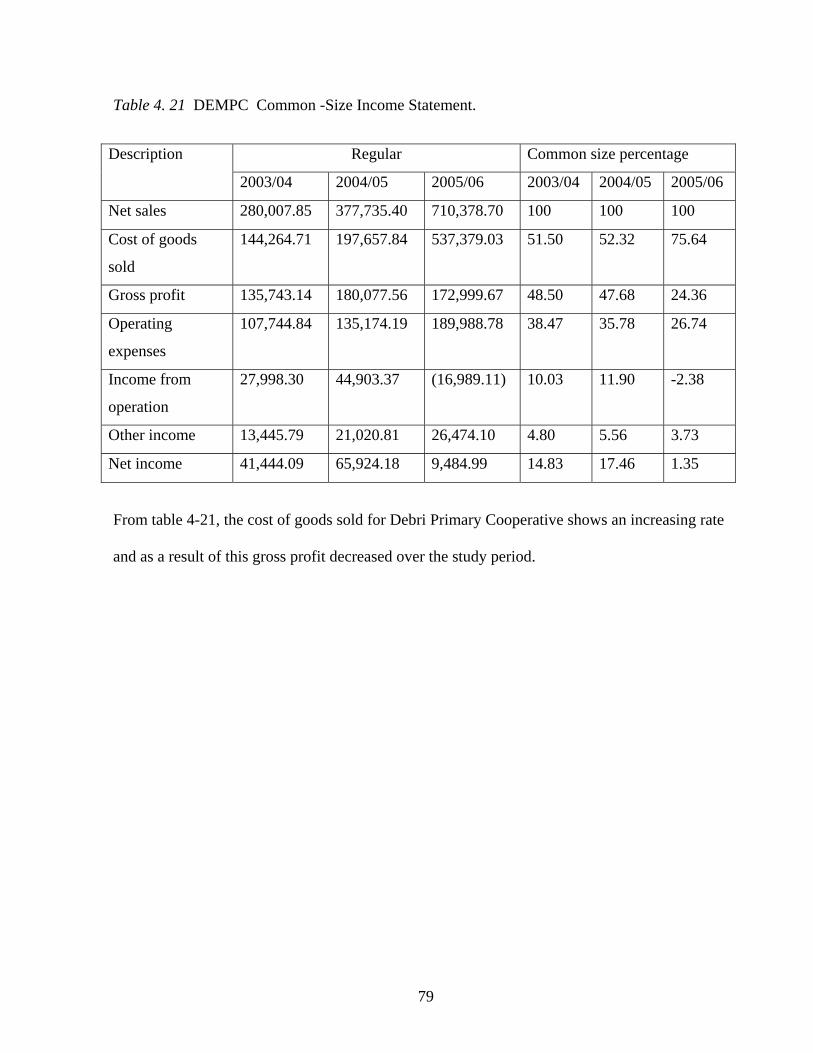
Table 4. 21 DEMPC Common -Size Income Statement.
Regular Common size percentage Description
2003/04 2004/05 2005/06 2003/04 2004/05 2005/06
Net sales 280,007.85 377,735.40 710,378.70 100 100 100
Cost of goods
sold
144,264.71 197,657.84 537,379.03 51.50 52.32 75.64
Gross profit 135,743.14 180,077.56 172,999.67 48.50 47.68 24.36
Operating
expenses
107,744.84 135,174.19 189,988.78 38.47 35.78 26.74
Income from
operation
27,998.30 44,903.37 (16,989.11) 10.03 11.90 -2.38
Other income 13,445.79 21,020.81 26,474.10 4.80 5.56 3.73
Net income 41,444.09 65,924.18 9,484.99 14.83 17.46 1.35
From table 4-21, the cost of goods sold for Debri Primary Cooperative shows an increasing rate
and as a result of this gross profit decreased over the study period.
79
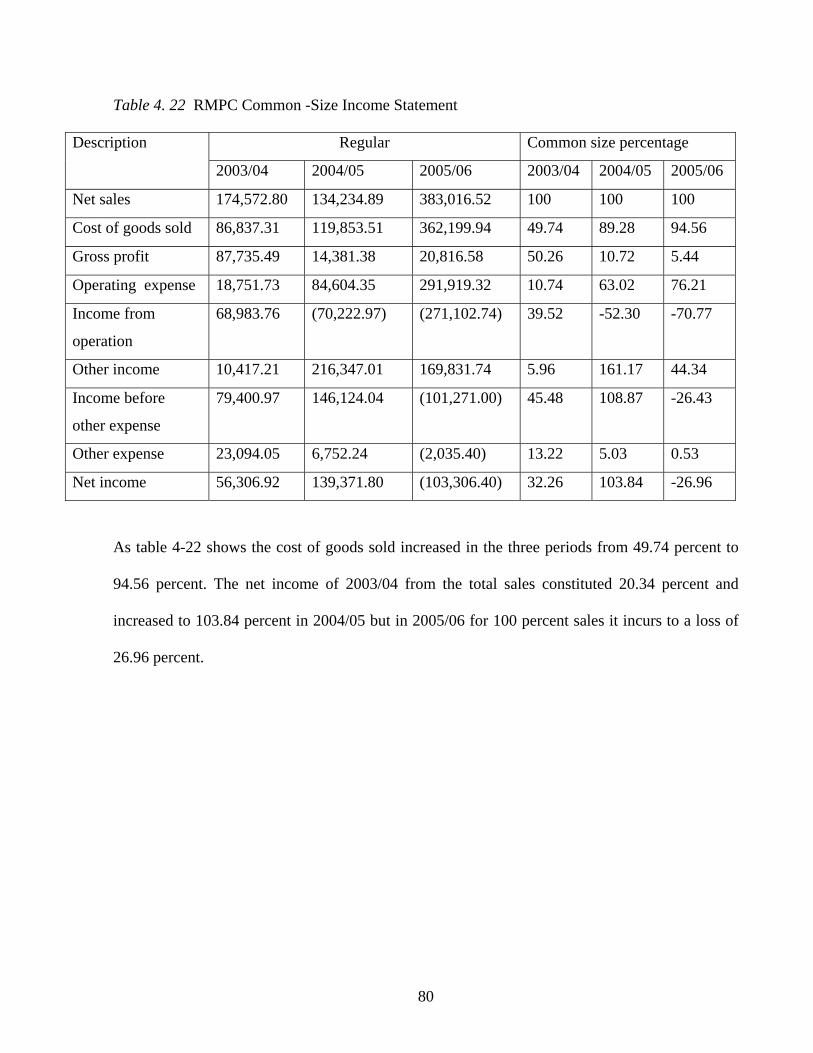
Table 4. 22 RMPC Common -Size Income Statement
Regular Common size percentage Description
2003/04 2004/05 2005/06 2003/04 2004/05 2005/06
Net sales 174,572.80 134,234.89 383,016.52 100 100 100
Cost of goods sold 86,837.31 119,853.51 362,199.94 49.74 89.28 94.56
Gross profit 87,735.49 14,381.38 20,816.58 50.26 10.72 5.44
Operating expense 18,751.73 84,604.35 291,919.32 10.74 63.02 76.21
Income from
operation
68,983.76 (70,222.97) (271,102.74) 39.52 -52.30 -70.77
Other income 10,417.21 216,347.01 169,831.74 5.96 161.17 44.34
Income before
other expense
79,400.97 146,124.04 (101,271.00) 45.48 108.87 -26.43
Other expense 23,094.05 6,752.24 (2,035.40) 13.22 5.03 0.53
Net income 56,306.92 139,371.80 (103,306.40) 32.26 103.84 -26.96
As table 4-22 shows the cost of goods sold increased in the three periods from 49.74 percent to
94.56 percent. The net income of 2003/04 from the total sales constituted 20.34 percent and
increased to 103.84 percent in 2004/05 but in 2005/06 for 100 percent sales it incurs to a loss of
26.96 percent.
80
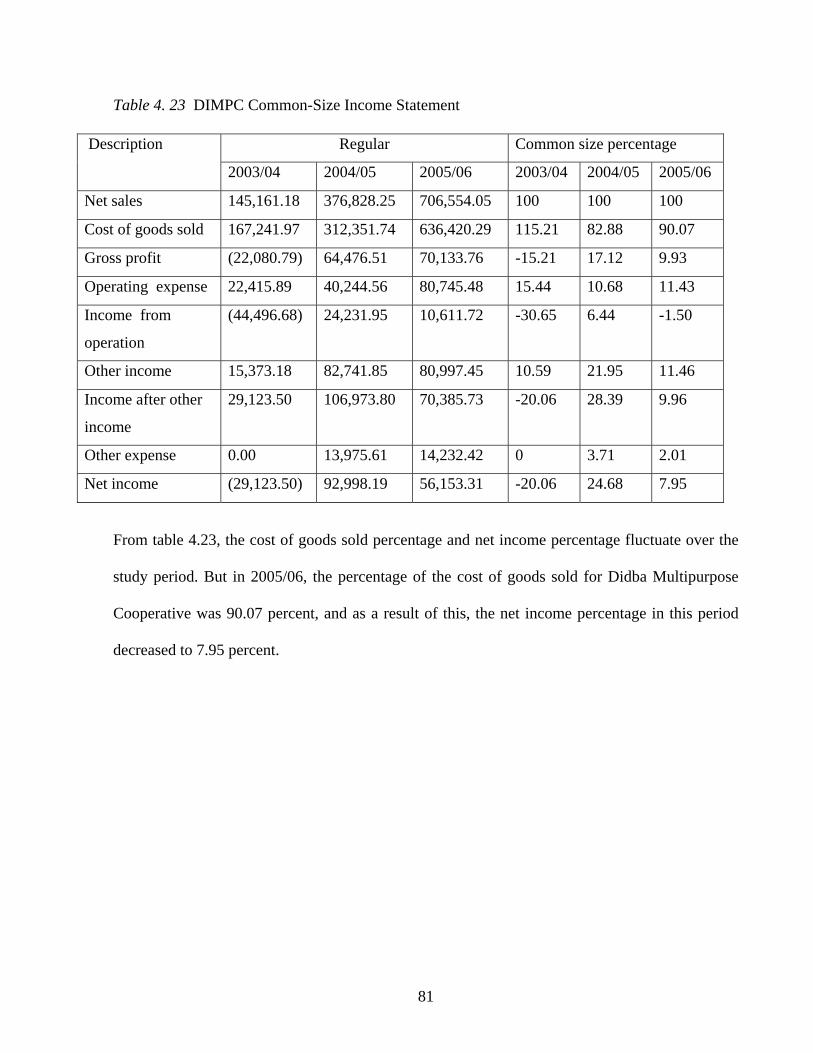
Table 4. 23 DIMPC Common-Size Income Statement
Regular Common size percentage Description
2003/04 2004/05 2005/06 2003/04 2004/05 2005/06
Net sales 145,161.18 376,828.25 706,554.05 100 100 100
Cost of goods sold 167,241.97 312,351.74 636,420.29 115.21 82.88 90.07
Gross profit (22,080.79) 64,476.51 70,133.76 -15.21 17.12 9.93
Operating expense 22,415.89 40,244.56 80,745.48 15.44 10.68 11.43
Income from
operation
(44,496.68) 24,231.95 10,611.72 -30.65 6.44 -1.50
Other income 15,373.18 82,741.85 80,997.45 10.59 21.95 11.46
Income after other
income
29,123.50 106,973.80 70,385.73 -20.06 28.39 9.96
Other expense 0.00 13,975.61 14,232.42 0 3.71 2.01
Net income (29,123.50) 92,998.19 56,153.31 -20.06 24.68 7.95
From table 4.23, the cost of goods sold percentage and net income percentage fluctuate over the
study period. But in 2005/06, the percentage of the cost of goods sold for Didba Multipurpose
Cooperative was 90.07 percent, and as a result of this, the net income percentage in this period
decreased to 7.95 percent.
81
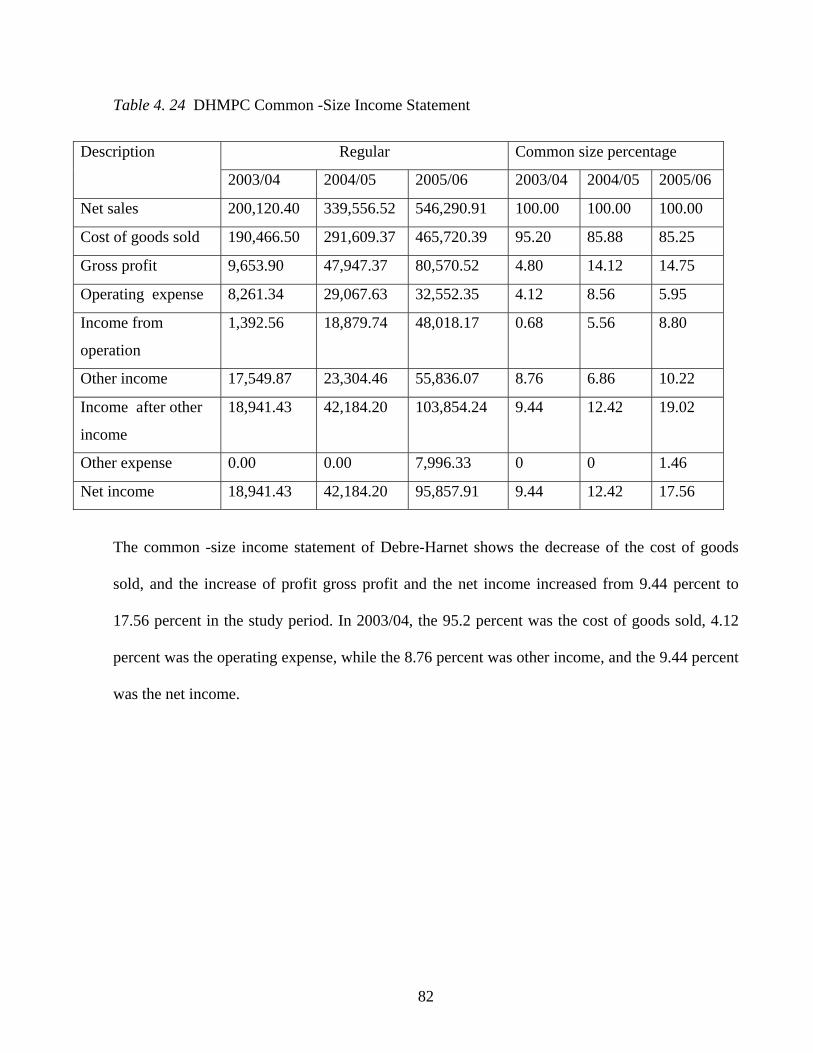
Table 4. 24 DHMPC Common -Size Income Statement
Regular Common size percentage Description
2003/04 2004/05 2005/06 2003/04 2004/05 2005/06
Net sales 200,120.40 339,556.52 546,290.91 100.00 100.00 100.00
Cost of goods sold 190,466.50 291,609.37 465,720.39 95.20 85.88 85.25
Gross profit 9,653.90 47,947.37 80,570.52 4.80 14.12 14.75
Operating expense 8,261.34 29,067.63 32,552.35 4.12 8.56 5.95
Income from
operation
1,392.56 18,879.74 48,018.17 0.68 5.56 8.80
Other income 17,549.87 23,304.46 55,836.07 8.76 6.86 10.22
Income after other
income
18,941.43 42,184.20 103,854.24 9.44 12.42 19.02
Other expense 0.00 0.00 7,996.33 0 0 1.46
Net income 18,941.43 42,184.20 95,857.91 9.44 12.42 17.56
The common -size income statement of Debre-Harnet shows the decrease of the cost of goods
sold, and the increase of profit gross profit and the net income increased from 9.44 percent to
17.56 percent in the study period. In 2003/04, the 95.2 percent was the cost of goods sold, 4.12
percent was the operating expense, while the 8.76 percent was other income, and the 9.44 percent
was the net income.
82
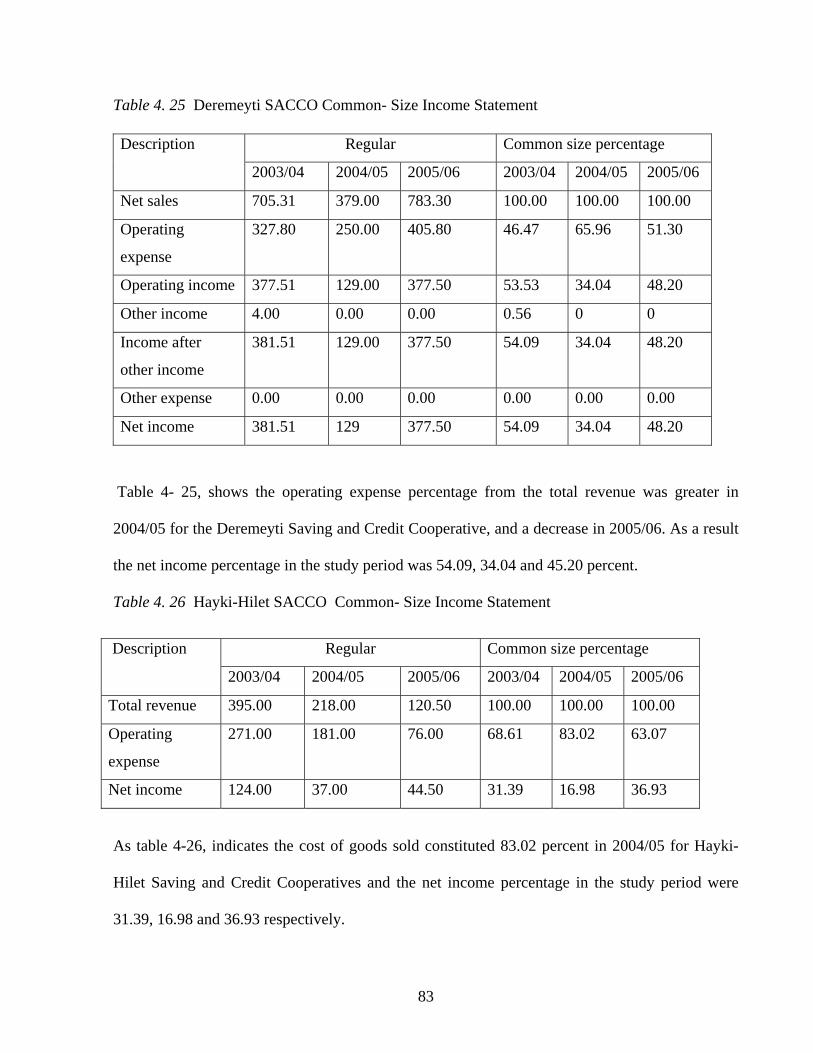
Table 4. 25 Deremeyti SACCO Common- Size Income Statement
Regular Common size percentage Description
2003/04 2004/05 2005/06 2003/04 2004/05 2005/06
Net sales 705.31 379.00 783.30 100.00 100.00 100.00
Operating
expense
327.80 250.00 405.80 46.47 65.96 51.30
Operating income 377.51 129.00 377.50 53.53 34.04 48.20
Other income 4.00 0.00 0.00 0.56 0 0
Income after
other income
381.51 129.00 377.50 54.09 34.04 48.20
Other expense 0.00 0.00 0.00 0.00 0.00 0.00
Net income 381.51 129 377.50 54.09 34.04 48.20
Table 4- 25, shows the operating expense percentage from the total revenue was greater in
2004/05 for the Deremeyti Saving and Credit Cooperative, and a decrease in 2005/06. As a result
the net income percentage in the study period was 54.09, 34.04 and 45.20 percent.
Table 4. 26 Hayki-Hilet SACCO Common- Size Income Statement
Regular Common size percentage Description
2003/04 2004/05 2005/06 2003/04 2004/05 2005/06
Total revenue 395.00 218.00 120.50 100.00 100.00 100.00
Operating
expense
271.00 181.00 76.00 68.61 83.02 63.07
Net income 124.00 37.00 44.50 31.39 16.98 36.93
As table 4-26, indicates the cost of goods sold constituted 83.02 percent in 2004/05 for Hayki-
Hilet Saving and Credit Cooperatives and the net income percentage in the study period were
31.39, 16.98 and 36.93 respectively.
83
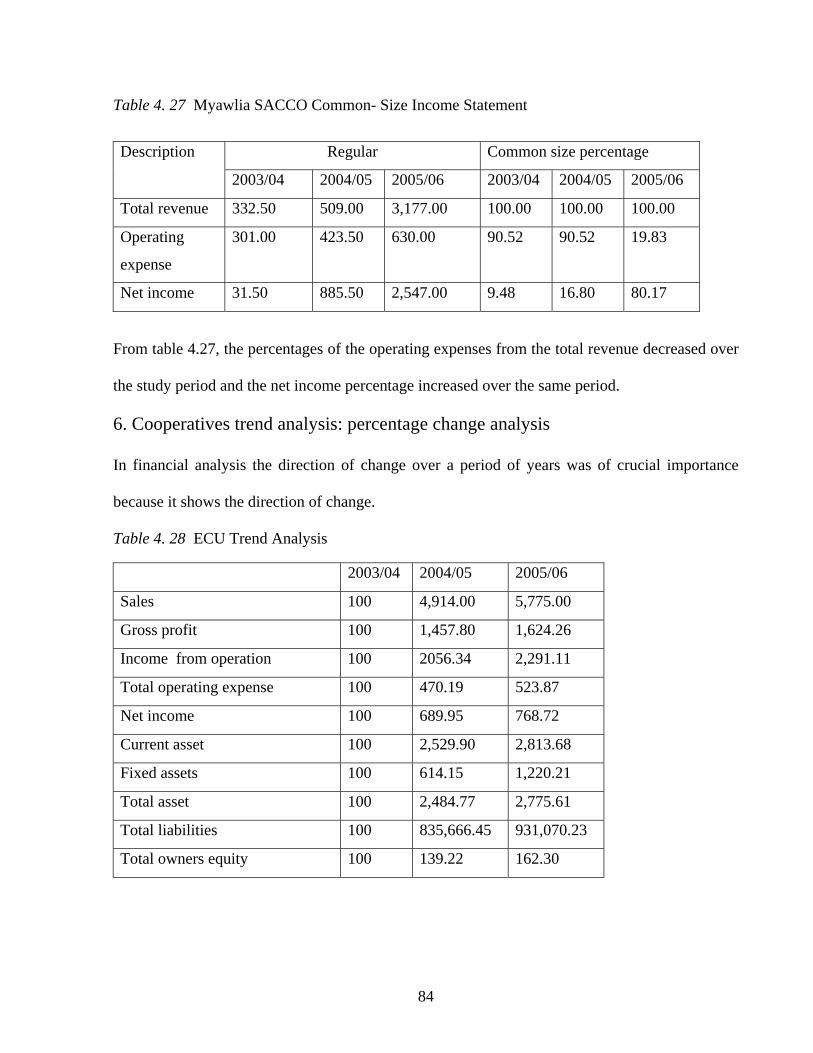
Table 4. 27 Myawlia SACCO Common- Size Income Statement
Regular Common size percentage Description
2003/04 2004/05 2005/06 2003/04 2004/05 2005/06
Total revenue 332.50 509.00 3,177.00 100.00 100.00 100.00
Operating
expense
301.00 423.50 630.00 90.52 90.52 19.83
Net income 31.50 885.50 2,547.00 9.48 16.80 80.17
From table 4.27, the percentages of the operating expenses from the total revenue decreased over
the study period and the net income percentage increased over the same period.
6. Cooperatives trend analysis: percentage change analysis
In financial analysis the direction of change over a period of years was of crucial importance
because it shows the direction of change.
Table 4. 28 ECU Trend Analysis 2003/04 2004/05 2005/06
Sales 100 4,914.00 5,775.00
Gross profit 100 1,457.80 1,624.26
Income from operation 100 2056.34 2,291.11
Total operating expense 100 470.19 523.87
Net income 100 689.95 768.72
Current asset 100 2,529.90 2,813.68
Fixed assets 100 614.15 1,220.21
Total asset 100 2,484.77 2,775.61
Total liabilities 100 835,666.45 931,070.23
Total owners equity 100 139.22 162.30
84
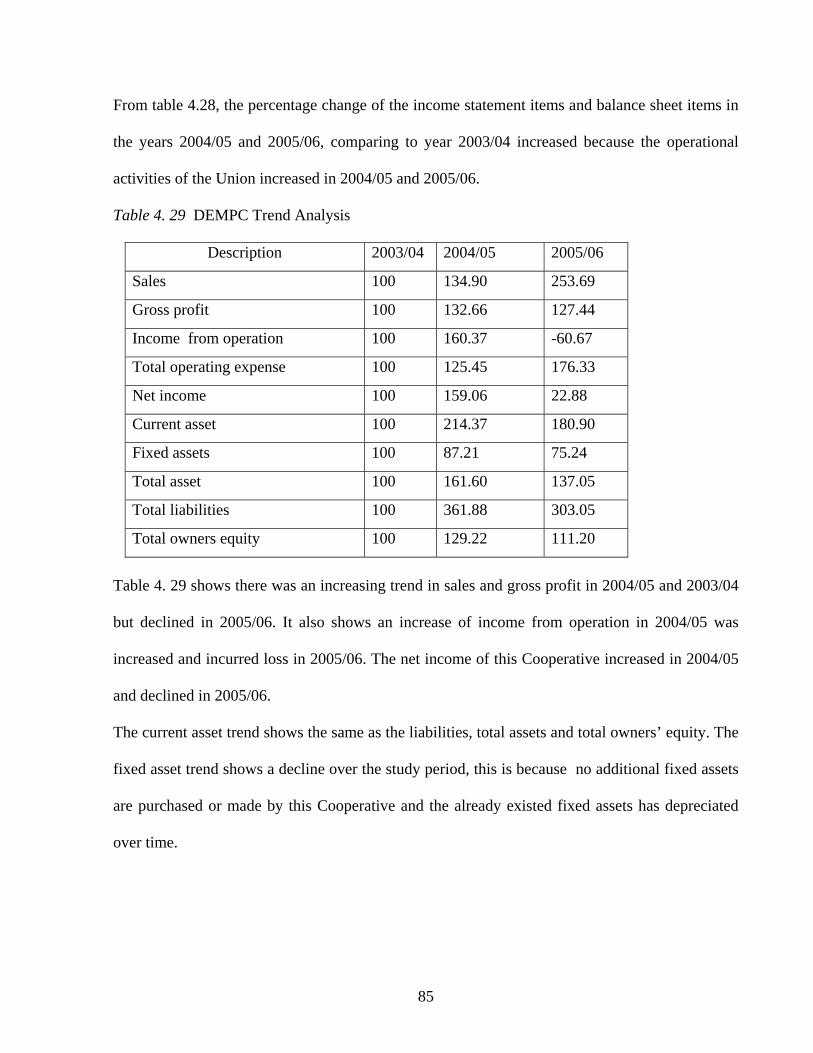
From table 4.28, the percentage change of the income statement items and balance sheet items in
the years 2004/05 and 2005/06, comparing to year 2003/04 increased because the operational
activities of the Union increased in 2004/05 and 2005/06.
Table 4. 29 DEMPC Trend Analysis
Description 2003/04 2004/05 2005/06
Sales 100 134.90 253.69
Gross profit 100 132.66 127.44
Income from operation 100 160.37 -60.67
Total operating expense 100 125.45 176.33
Net income 100 159.06 22.88
Current asset 100 214.37 180.90
Fixed assets 100 87.21 75.24
Total asset 100 161.60 137.05
Total liabilities 100 361.88 303.05
Total owners equity 100 129.22 111.20
Table 4. 29 shows there was an increasing trend in sales and gross profit in 2004/05 and 2003/04
but declined in 2005/06. It also shows an increase of income from operation in 2004/05 was
increased and incurred loss in 2005/06. The net income of this Cooperative increased in 2004/05
and declined in 2005/06.
The current asset trend shows the same as the liabilities, total assets and total owners’ equity. The
fixed asset trend shows a decline over the study period, this is because no additional fixed assets
are purchased or made by this Cooperative and the already existed fixed assets has depreciated
over time.
85
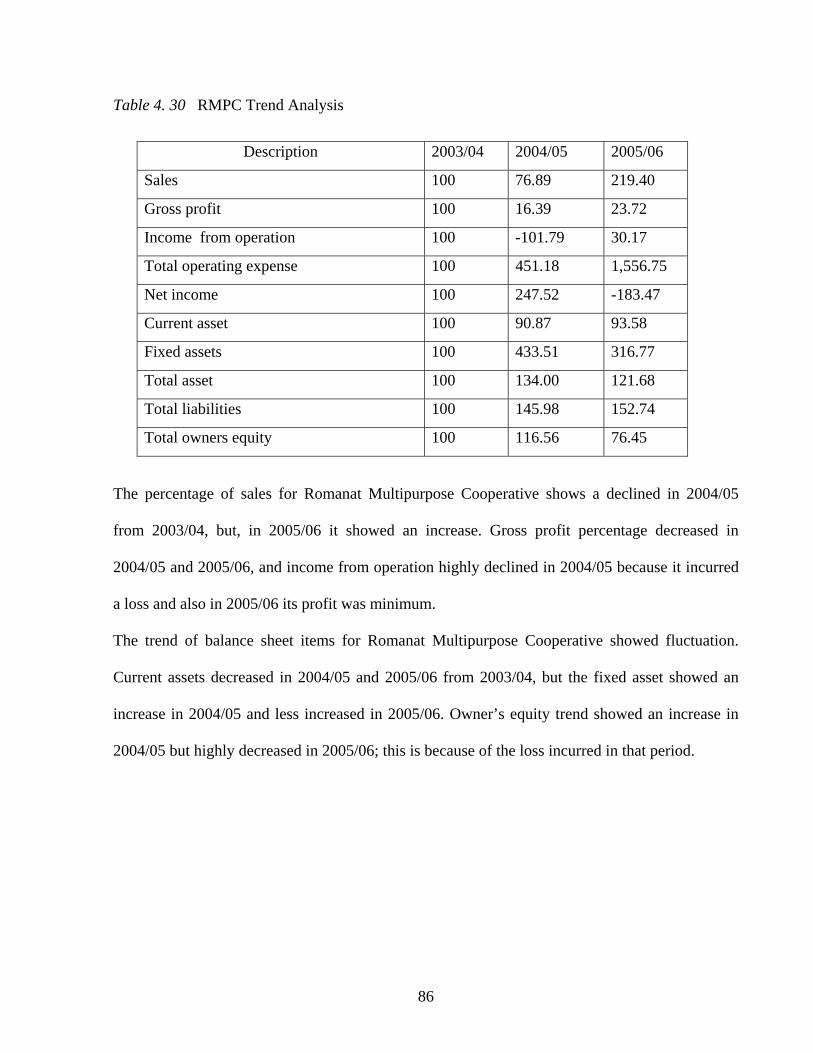
Table 4. 30 RMPC Trend Analysis
Description 2003/04 2004/05 2005/06
Sales 100 76.89 219.40
Gross profit 100 16.39 23.72
Income from operation 100 -101.79 30.17
Total operating expense 100 451.18 1,556.75
Net income 100 247.52 -183.47
Current asset 100 90.87 93.58
Fixed assets 100 433.51 316.77
Total asset 100 134.00 121.68
Total liabilities 100 145.98 152.74
Total owners equity 100 116.56 76.45
The percentage of sales for Romanat Multipurpose Cooperative shows a declined in 2004/05
from 2003/04, but, in 2005/06 it showed an increase. Gross profit percentage decreased in
2004/05 and 2005/06, and income from operation highly declined in 2004/05 because it incurred
a loss and also in 2005/06 its profit was minimum.
The trend of balance sheet items for Romanat Multipurpose Cooperative showed fluctuation.
Current assets decreased in 2004/05 and 2005/06 from 2003/04, but the fixed asset showed an
increase in 2004/05 and less increased in 2005/06. Owner’s equity trend showed an increase in
2004/05 but highly decreased in 2005/06; this is because of the loss incurred in that period.
86
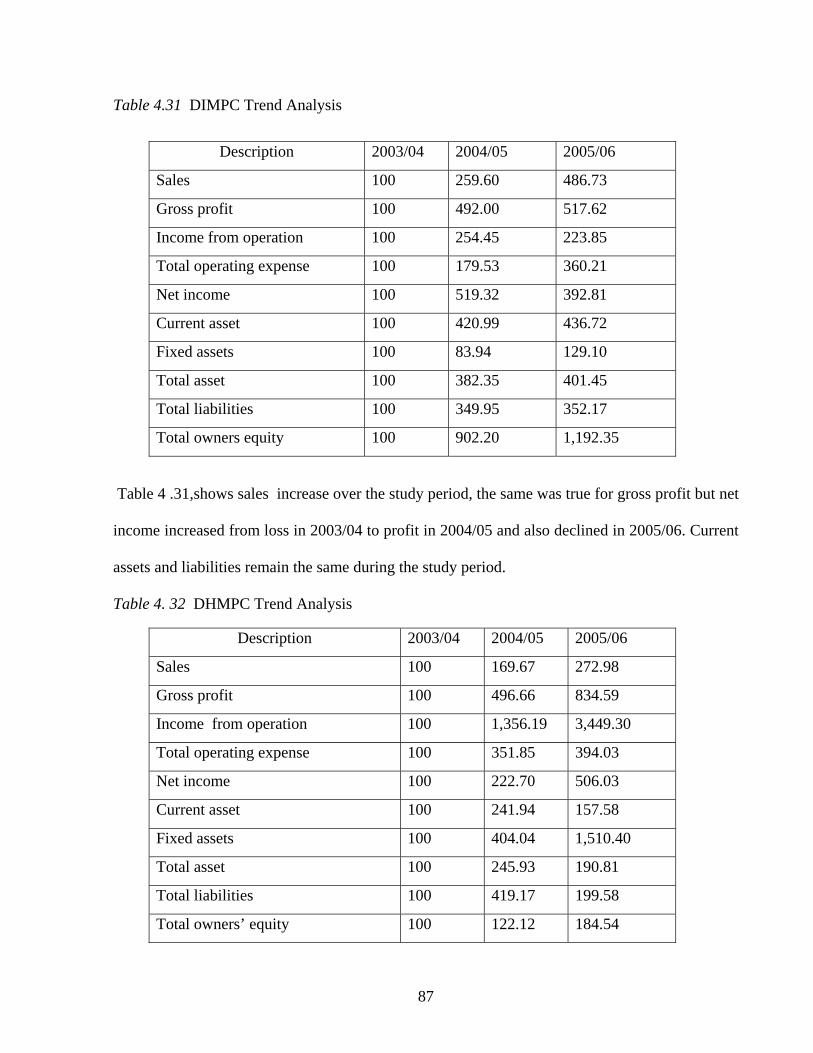
Table 4.31 DIMPC Trend Analysis
Description 2003/04 2004/05 2005/06
Sales 100 259.60 486.73
Gross profit 100 492.00 517.62
Income from operation 100 254.45 223.85
Total operating expense 100 179.53 360.21
Net income 100 519.32 392.81
Current asset 100 420.99 436.72
Fixed assets 100 83.94 129.10
Total asset 100 382.35 401.45
Total liabilities 100 349.95 352.17
Total owners equity 100 902.20 1,192.35
Table 4 .31,shows sales increase over the study period, the same was true for gross profit but net
income increased from loss in 2003/04 to profit in 2004/05 and also declined in 2005/06. Current
assets and liabilities remain the same during the study period.
Table 4. 32 DHMPC Trend Analysis
Description 2003/04 2004/05 2005/06
Sales 100 169.67 272.98
Gross profit 100 496.66 834.59
Income from operation 100 1,356.19 3,449.30
Total operating expense 100 351.85 394.03
Net income 100 222.70 506.03
Current asset 100 241.94 157.58
Fixed assets 100 404.04 1,510.40
Total asset 100 245.93 190.81
Total liabilities 100 419.17 199.58
Total owners’ equity 100 122.12 184.54
87
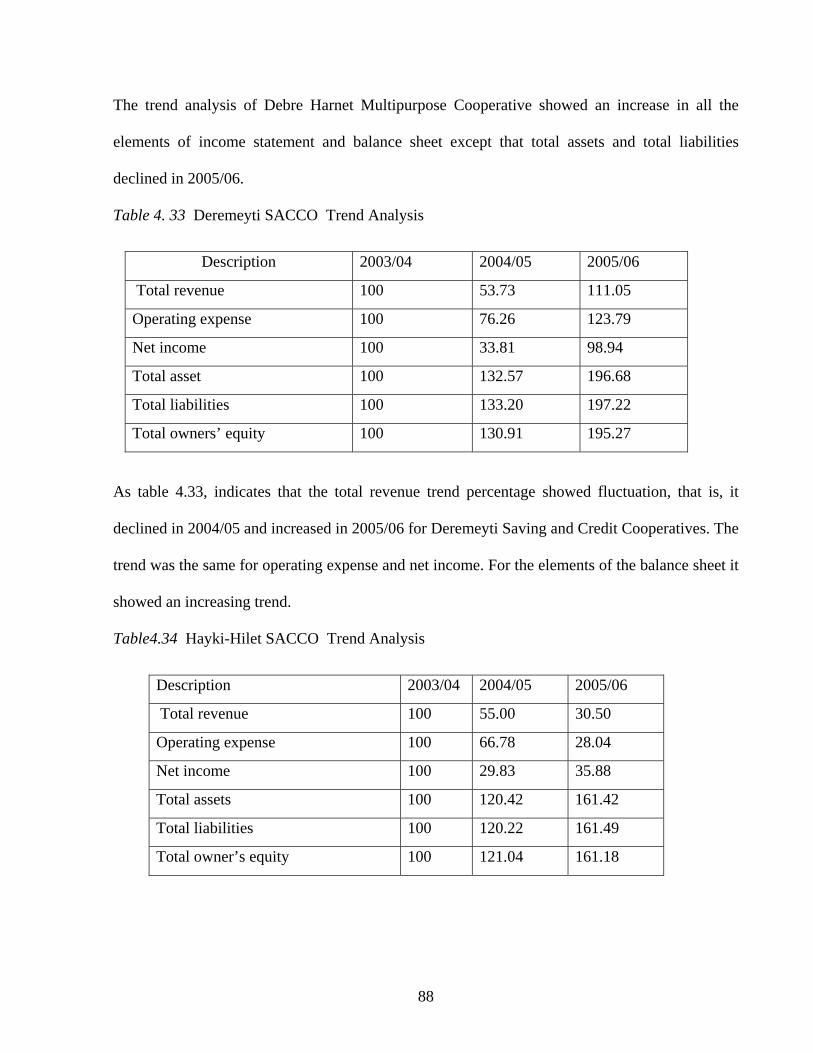
The trend analysis of Debre Harnet Multipurpose Cooperative showed an increase in all the
elements of income statement and balance sheet except that total assets and total liabilities
declined in 2005/06.
Table 4. 33 Deremeyti SACCO Trend Analysis
Description 2003/04 2004/05 2005/06
Total revenue 100 53.73 111.05
Operating expense 100 76.26 123.79
Net income 100 33.81 98.94
Total asset 100 132.57 196.68
Total liabilities 100 133.20 197.22
Total owners’ equity 100 130.91 195.27
As table 4.33, indicates that the total revenue trend percentage showed fluctuation, that is, it
declined in 2004/05 and increased in 2005/06 for Deremeyti Saving and Credit Cooperatives. The
trend was the same for operating expense and net income. For the elements of the balance sheet it
showed an increasing trend.
Table4.34 Hayki-Hilet SACCO Trend Analysis
Description 2003/04 2004/05 2005/06
Total revenue 100 55.00 30.50
Operating expense 100 66.78 28.04
Net income 100 29.83 35.88
Total assets 100 120.42 161.42
Total liabilities 100 120.22 161.49
Total owner’s equity 100 121.04 161.18
88
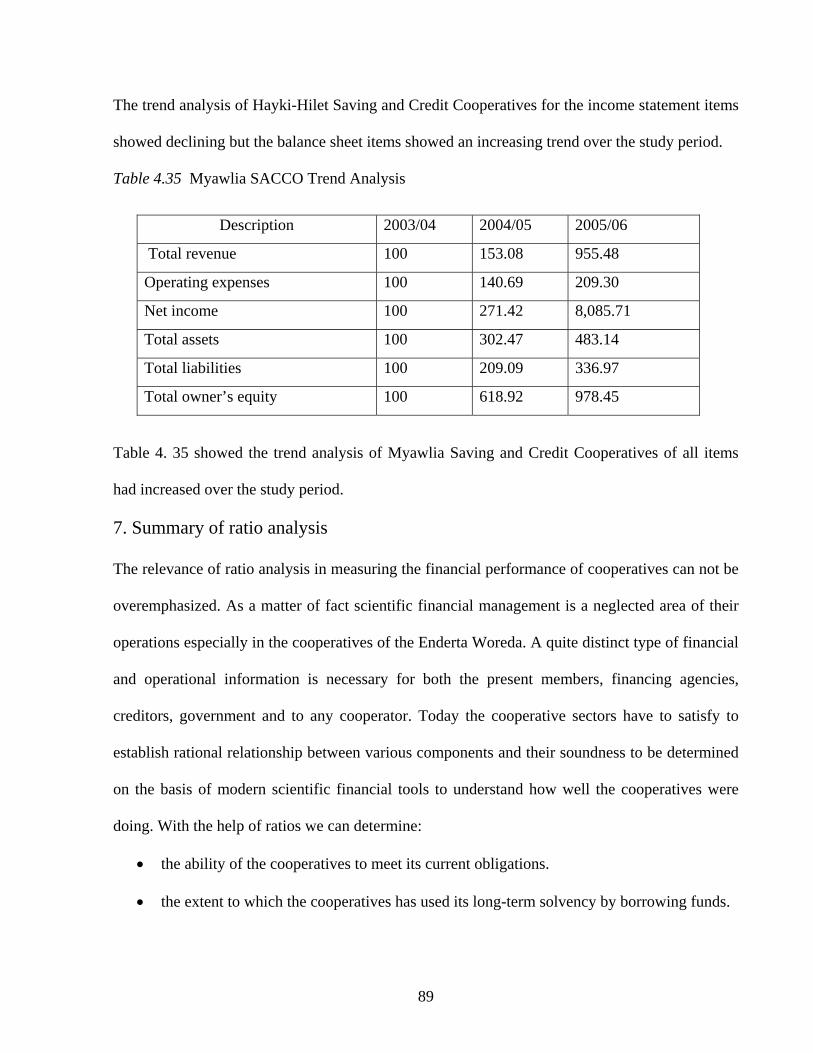
The trend analysis of Hayki-Hilet Saving and Credit Cooperatives for the income statement items
showed declining but the balance sheet items showed an increasing trend over the study period.
Table 4.35 Myawlia SACCO Trend Analysis
Description 2003/04 2004/05 2005/06
Total revenue 100 153.08 955.48
Operating expenses 100 140.69 209.30
Net income 100 271.42 8,085.71
Total assets 100 302.47 483.14
Total liabilities 100 209.09 336.97
Total owner’s equity 100 618.92 978.45
Table 4. 35 showed the trend analysis of Myawlia Saving and Credit Cooperatives of all items
had increased over the study period.
7. Summary of ratio analysis
The relevance of ratio analysis in measuring the financial performance of cooperatives can not be
overemphasized. As a matter of fact scientific financial management is a neglected area of their
operations especially in the cooperatives of the Enderta Woreda. A quite distinct type of financial
and operational information is necessary for both the present members, financing agencies,
creditors, government and to any cooperator. Today the cooperative sectors have to satisfy to
establish rational relationship between various components and their soundness to be determined
on the basis of modern scientific financial tools to understand how well the cooperatives were
doing. With the help of ratios we can determine:
• the ability of the cooperatives to meet its current obligations.
• the extent to which the cooperatives has used its long-term solvency by borrowing funds.
89
• the efficiency with which the cooperative is utilizing its various assets in generating sales
revenue, and
• the overall operating efficiency and performance of the cooperatives.
From the ratio analysis made in the study period, the profit of the cooperatives was fluctuating
from year to year. The reasons for the fluctuation were different. The positive increments were
the result of government assistance in the form of different technical supports given to
cooperatives, like:
• facilitating to farmers input needs and loans.
• gives supports in registration activities and promoting in increasing shareholders or
members.
• providing auditing support. Therefore, the government assists farmers to establish
cooperatives .
• paying experts’ salaries, perdime, transport facilities, office supplies and other necessary
materials are covered by government, and this minimizes costs in order to increase the
profitability of the cooperatives.
Despite of the above supports given to the Cooperatives, there were some problems that affect
them to maximize their profitability especially in the Enderta Union and its affiliated primary
cooperatives. The most important problems are:
• Lack of skilled manpower- cooperatives are business – oriented organizations and
controlled the people who use their services. To implement the objective of the
cooperatives, it is very difficult because the managements are composed of farmers
selected by the general assemblies to organize and run the activities of the cooperatives,
but the farmers have low capacities to manage and achieve the objectives of the
90
cooperatives. From the focus group discussion, the major problems faced by the
cooperatives are planning, financing and, pricing problems and lack of ability to make
decisions that demand current information for marketing activities.
• Problem in cost minimization- cooperatives did not focus on minimizing cost. They
decide prices based on their incurred costs and this minimizes the profit of cooperatives.
For example, the Romanat Multipurpose Cooperative does not have a standard production
cost and selling price for its blockets, simply the cooperative produces and sells its
products, and subsequently its profit declined.
• Poor management and promotion – Some times cooperative promoters did not consult
cooperatives at full capacity for different reasons such as low monthly salary and lack of
budget pay perdime, and even the workers in the Cooperative Promotion Office, in
relation to the number of cooperatives was minimum.
• Lack of coordination between cooperatives – cooperatives purchase the same types of
inputs and other consumable items at the same time and this creates a saturation of the
market and lack of customers for their inventories.
4.3. Perception of members on the role of cooperatives
From the focus group discussion made in the study, the summaries were made in to two, the
EUAPC and SACCOs.
In both the Enderta Union and its affiliated primary cooperatives and the saving and credit
cooperatives, the researcher has made seven focus group discussions with members, four from
EUAPC and three from the SACCOs. From these discussions the following were summarized.
91
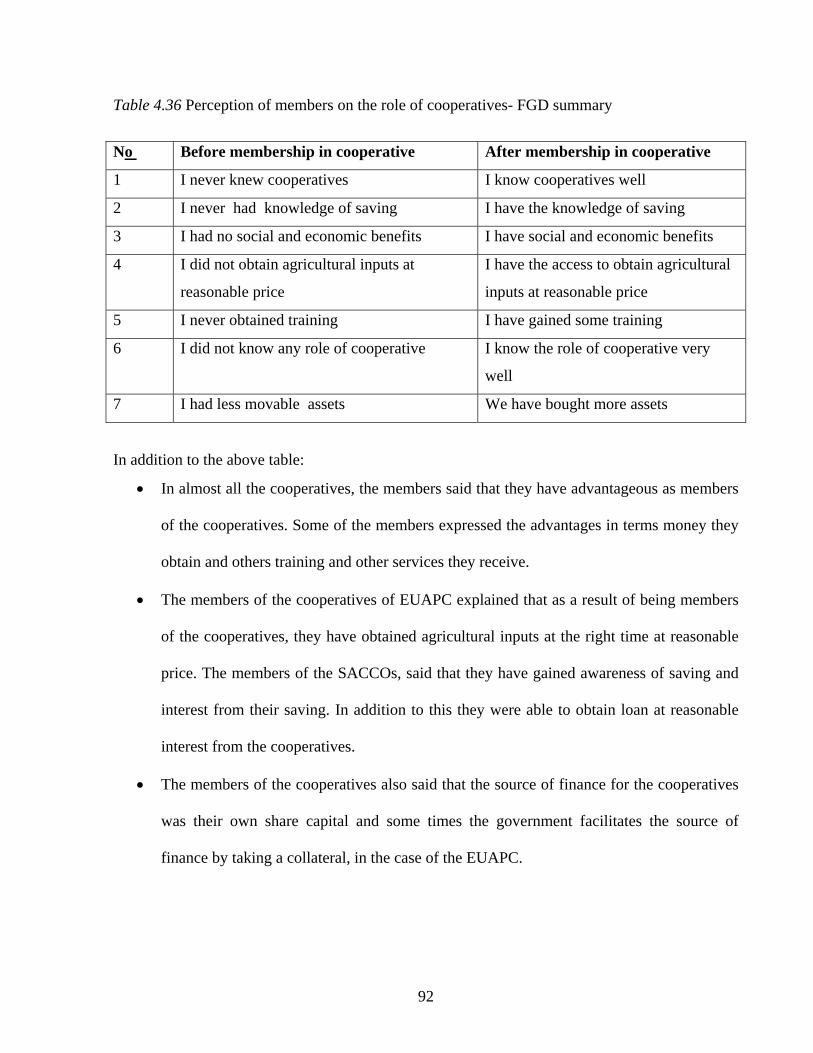
Table 4.36 Perception of members on the role of cooperatives- FGD summary
No Before membership in cooperative After membership in cooperative
1 I never knew cooperatives I know cooperatives well
2 I never had knowledge of saving I have the knowledge of saving
3 I had no social and economic benefits I have social and economic benefits
4 I did not obtain agricultural inputs at
reasonable price
I have the access to obtain agricultural
inputs at reasonable price
5 I never obtained training I have gained some training
6 I did not know any role of cooperative I know the role of cooperative very
well
7 I had less movable assets We have bought more assets
In addition to the above table:
• In almost all the cooperatives, the members said that they have advantageous as members
of the cooperatives. Some of the members expressed the advantages in terms money they
obtain and others training and other services they receive.
• The members of the cooperatives of EUAPC explained that as a result of being members
of the cooperatives, they have obtained agricultural inputs at the right time at reasonable
price. The members of the SACCOs, said that they have gained awareness of saving and
interest from their saving. In addition to this they were able to obtain loan at reasonable
interest from the cooperatives.
• The members of the cooperatives also said that the source of finance for the cooperatives
was their own share capital and some times the government facilitates the source of
finance by taking a collateral, in the case of the EUAPC.
92
• The members said that the main sources of problems of financial performance of the
cooperatives were lack of skill manpower to lead the cooperatives and low capacity to
recruit qualified employees because the cooperatives were organized by farmers.
There fore from the focus group discussion summary, the perception of the members towards the
role of cooperatives was positive or good even though the financial performance of the
cooperatives was fluctuating.
93
Chapter Five
5. Conclusions and Recommendations
5.1 Introduction
Cooperative is an important tool for better living since it enables the individuals to achieve
heights which can not be reached in isolation. Cooperatives improve the standard of living of the
people by providing them with proper education and training and by inculcating them a spirit of
cooperation. The survival of an enterprise including cooperative bodies ultimately depends on
attainment of the target, especially the financial target.
5.2 Conclusions
In general the researcher has analyzed the financial performance of the cooperatives with the help
of information collected from the annual records available in the Woreda Cooperative Office,
Union and Regional Cooperative Promotion Office .In order to analyze the financial performance
of the cooperatives, the powerful tool, namely, the ratio analysis has been used. In this
connection, the researcher has identified different ratios based on the objectives of the present
study. On the basis of the results of the ratio analysis, the researcher found that the financial
performance of the cooperatives was not highly encouraging. In most of the cooperatives the
liquidity positions was not enough to meet its obligations. Specifically the summary of findings is
made based on the analysis of activities of the Enderta Union and its affiliated primary
cooperatives and the saving and credit cooperatives for the three years (from 2003/04 – 2005/06).
From the origin and development of the cooperatives in the woreda, even though cooperatives
started operation during the Haileselassie Regime, the cooperatives in the woreda were registered
only recently. The numbers of members and share capital have been increasing from year to year.
94
From the reports of the Woreda, the numbers of cooperatives in the woreda have increased from
year to year.
According to Proclamation Number of 147/1998 all the managements were included in the by-
laws of the cooperatives of the Woreda even though their application was low. The main sources
of capital for the cooperatives in the Woreda were shares capital from members, reserves
obtained from the cooperatives, borrowings and grants from some NGOs. From the focus group
discussions, even though trainings were given by the government and NGOs, the trainings were
not based on systematic assessment of training needs, planning and organization of the training
programmes and utilization of the available training facilities in the Cooperatives of the Woreda.
Both the Enderta Union and its affiliated cooperatives, and the saving and credit cooperative
require finance from different sources for their operational activities. The paper focuses on the
financial performance and the perception of members on the role of cooperatives. To answer the
research questions, ratio analysis and focus group discussion summaries are:
In EUAPC
• The liquidity ratio in the three years was fluctuating and mostly it was below the norm. This
shows the cooperatives’ ability to meet their financial obligations within the period was not in
a good manner.
• The solvency ratio of EUAPC showed fluctuation over the study period. The debt-equity ratio
of EUAPC showed, in general, the lenders’ contribution was greater than the cooperatives’
share capital contribution. The patron’s equity to total asset ratio of the EUAPC showed more
than 50 percent of the cooperatives’ assets were owned by creditors even though there were
fluctuations in the primary cooperatives. The fixed asset to patron’s equity ratio of the
EUAPC showed low except in some primary cooperatives. For example, the Romanat
95
Primary Cooperative showed 1.55 fixed asset to patrons equity ratio for the year 2004/05, and
this shows for every birr in patron’s equity, the cooperative had birr 1.55 in fixed assets. This
indicates that there was less owner’s equity available for working capital.
• The inventory turnover of all the cooperatives showed there was a high speed of conversion
of assets in to sales. Especially, all the inventories of the primary cooperatives were sold
during the specified period. But in the Enderta Union except during the first year, in the two
consecutive years the inventory turnover showed low ratio and indicated greater carrying cost
for rental space. The total asset turnover of Enderta Union was good, but for the primary
cooperatives, there were not sufficient value of sales generated for the size of investment in
assets.
• The gross profit margin of the cooperatives showed positive amount at fluctuating rate. The
union gross profit ratio showed problems of management effectiveness in product pricing,
generating sales and controlling cost of sales. The net profit margin of the cooperatives
showed positive amount in most of the cooperatives but the amount was at lower level and
the Romanat Primary Cooperative in 2005/06, and the Didba Primary Cooperative in 2003/04
contributed to a loss for every birr in sales. This indicates that the management and efficiency
of each unit of sales to profit was not good. The contribution of total assets to the profit of the
EUAPC shows fluctuation and a decreasing rate. This shows there was inefficient utilization
of assets. The profitability of the owner’s share capital of the cooperatives was fluctuating
from year to year. This showed the resources of the members were not used well to increase
profit and achieving their objectives.
96
• From the common –size percentage analysis of cost of goods sold percentage increased and
net income percentage decreased over the study period of the EUAPC but there was one
exception to this in the case of Debre-Harnet Primary Cooperative.
• The trend analysis of the income statement accounts of the Enderta Union and its primary
cooperatives showed for some times an increase and decreases in some of the cooperatives.
The Enderta Union trend analysis showed an increase from year to year.
• The trend of balance sheet accounts of the Enderta Union shows an increased from year to
year and this indicates an increase in assets liabilities and capital, but in the primary
cooperatives there were fluctuations.
In SACCOs
• The current ratios of the cooperatives in the study period were below a standard. These shows
the liabilities were of greater amounts. But the quick ratio shows above the norm because of
the nature of the cooperatives or absence of inventories.
• The debt ratio of the SACCOs shows high amount of debt comparing to the total financing.
This indicates the contribution of lenders was larger than the owners in the study period. The
owner’s equity to total assets of SACCOs was low and this shows the cooperative financial
position was not good in getting debt financing. The fixed asset to patron’s equity ratio was
almost zero because the SACCOs do not invest in fixed assets and this shows owner’s equity
was available for working capital.
• The return on total assets of the SACCOs shows very small. In all the cooperatives, the
contribution of one birr of total asset to profit was approximately 0.01 birr in all the
cooperatives over the study period. This implies the SACCOs were not efficient in using their
resources. The return on equity of the SACCOs shows low because the contribution of one
97
birr employed in patron’s equity to net income on average shows between 0.01 to 0.09 birr
and this shows the performance of management was weak.
• From the common-size percentage analysis of SACCOs, there was fluctuation. For example,
the percentage analysis of the net income from the net revenue for Deremeyti Saving and
Credit Cooperatives showed a decreasing percentage in 2004/05 and increased in 2005/06, the
same is true for Hayki-Hilet SACCO but for Myawlia SACCO, the percentage shows an
increase.
• The trend analysis of the SACCOs for the income statement accounts showed fluctuation but
for the balance sheet items it showed an increasing trend.
The focus group discussion indicates that, the perception of the cooperative members on their
role was positive.
From this discussion and analysis the main reasons for the poor financial performance of the
cooperatives in the woreda were:
1. The major cause for the poor financial performance of the cooperatives was their inefficient
management. They have been run by inexperienced, untrained and non professional managers
and personnel. The cooperatives were unable to make a good progress because of lack of
leadership, illiteracy of the members and the societies because most of the members were
farmers.
2. From the financial analysis a significant part of the total capital employed was in the form of
borrowed capital. This was reflected in the heavy amount of interest on borrowed capital, which
was a great financial burden. Because of these factors, they could not build up a sound base for
self- financing.
98
3. The other main cause of their poor financial performance of the cooperatives was the non-
availability of adequate quantity and quality of raw materials at reasonable prices and at the right
time. For example, in the case of Romanat the production of blockets requires raw materials, like
cement and other raw materials, but these were not available at reasonable price and this affects
the profitability of the cooperatives.
4. The cooperatives were faced severe competition from outside the cooperative sector. As a
result of lack of marketing information, the cooperatives were unable to sell their products and
most of the cooperatives have pricing problems.
5. It has been observed that in most of the cooperatives the manpower lacks expertise and
professional qualification. There was poor manpower planning and this was clearly reflected in
the inadequate arrangement for training and education.
6. Although all the cooperatives were applying the double entry accounting system, there was no
clear accounting system for all the cooperatives because the operational activities of the
cooperatives were different and requires different chart of accounts.
7. The financial statements of all the cooperatives were not prepared at the end of the fiscal year
because of lack of skilled manpower and skills. Therefore different types of decisions that can be
decided at the right time were postponed and also some of the financial statements were prepared
by auditors by merging different periods which is contrary to GAAP.
5.3 Recommendations
The various problems for poor financial performance of cooperatives were identified in the
preceding paragraphs. Even though the government was undertaking collateral for cooperatives
debt financing in order to increase the productivity of the members, create market stability; solve
the problems of finance of cooperatives, and to create profit to achieve their objectives, according
99
to data of the cooperatives and the analysis made, the cooperatives operational result was either
they earn small profit or they incurred a loss and the operational activity was limited. Based on
this, the final recommendation are as follows:
• The cooperatives must issue additional shares to increase self- financing.
• The cooperatives should launch market surveys and adjust production according to market
needs by diversifying their products. The cooperatives should get timely, accurate and
reliable market information through different communication net work to assess the local and
foreign market.
• A new recruitment policy should be formulated by the government and the cooperatives.
Right types of qualified, experienced and professional personnel should be selected to fill
accounting and management positions of the cooperatives. The cooperative promoters should
also be highly trained professional to support cooperatives in marketing, financial planning
and in giving other technical supports.
• The cooperatives should develop the policy of profitability in order to survive in the market,
whatever may be the principle of cooperatives.
• The cooperatives must have adequate arrangement for supervision, audit and inspection to
keep a check on their operations. The supervising organization or the local bureau of
agriculture and rural development and others should make continuous supervision and
assistance in their purchase process, market assessment and in gathering other important
information.
• The cooperatives must have the habit of saving to increase the interest income and
safeguarded the resources.
100
Finally, since cooperatives play an important role in furthering the process of economic
development in developing countries like Ethiopia, other researchers must make further
researches on the cooperatives financial performance in other regions and woredas, financial
planning and control of cooperatives and the application of accounting and auditing in
cooperatives to find solutions to problems found of cooperatives operations. Therefore this study
could be an input for the future researchers
101
References
1. Beverly, Rotan, (2001), Analysis of Financial Statement, RBS Research Report 182.
2. Bhalla, V.K, (2002), Financial Management and Policy, 3rd edition, New Delhi-110
002(India): Anmol Publications PVT.LTD.
3. Brealey, Richard and Myers, Stewart (1984), Principles of Corporate Finance, Second
Edition, London Madrid: McGraw Hill.
4. Brownlee, Richard, Kenneth Ferris and Mark Haskins, (1994). Corporate Financial
Reporting, Second Edition, Washington Dc: Irwin.
5. Cook, M. & Iliopoulos, C. (1999). “Beginning to Inform the Theory of the Cooperative
Firm: Emergence of the New Generation Cooperatives”. The Finnish Journal of Business
Economics, Volume 4, (Vammalla, Finland). (Also available at
http://www.ssu.missouri.edu/faculty/mcook/cv/finnish.pdf)
6. Cobia, David W., (1989), Cooperatives in Agriculture, New York: Prentice-Hall.
7. Cummins, David E.,(1993), “Corn Belt Grain Cooperatives Adjust to Challenges of
the1980s, Poised for 1990s” United States Department of Agriculture, Agricultural
Cooperatives Service”, ACS Research Report Number 117
8. Davis, Evan and J. Kay, (1990),”Assessing Corporate Performance”, Business Strategy
Review, summer, Vol.1, No.2.
9. Hilton, Ronald W.,(1999), Managerial Accounting, 4th edition, New York, Sanfrancisco:
Irwin/McGraw-Hill
10. Kulandaiswamy.V, (2000), Cooperative Management, India: Arudra Academy.
11. Kuch Hall,S.C. (1990), Financial Management: An Analytical and conceptual Approach.
(Chaitanya Publishing House, University Road, Allahabad 211 002).
102
103
12. Maheswary, S.N, (1988), Management Accounting and Financial Control. New Delhi:
Sultan Chand and sons.
13. Mafulich, Serge, (1985), Financial Accounting ,2nd edition, New York St.Louis :McGraw-
Hill Book Company
14. Oswald D.Bowlin, John D.Martin, (1990): Financial Analysis, 2nd edition, New York
Sanfrancisco: McGraw Hill.
15. Pandey I.M., (2001), Management Accounting 3rd edition: A Planning and Control
Approach. Gandhi Nagar, India: Vikas Publishing House Pvt.Ltd
16. Pandey. I.M., (2002), Financial Management, 8th edition. New Delhi :Vikas Publishing
House Pvt ltd
17. Rao.Y.Kameswara, (1998), Principles and Practice of Cooperative Audit, Hyderabad,
India: Sri Mehersh Publications.
18. Swami Krishna. (2003), Cooperative Ideology and Movement: The Roots, the Trunk and
the Twigs, India: Pulianic and pulianic.
19. Selvaraju R. (2000), Cooperatives in the New Millennium, India: Vikas publishing house
Pvt ltd.
20. Subburaj.B.(2003), Economic Contributions of Cooperatives, Department of Cooperation,
Gandhi gram Rural institute-Deemed University, Gandhi gram 624 302
21. “When Will China’s Financial System Meet China’s Needs?” A paper presented at the
Conference on Policy Reform in China, Center for Research on Economic Development
and Policy Reform, (Stanford University, November 18-20, 1999).
22. Warbasse, J.P., (1947), What is Cooperation? Indore: Modern Publishers.
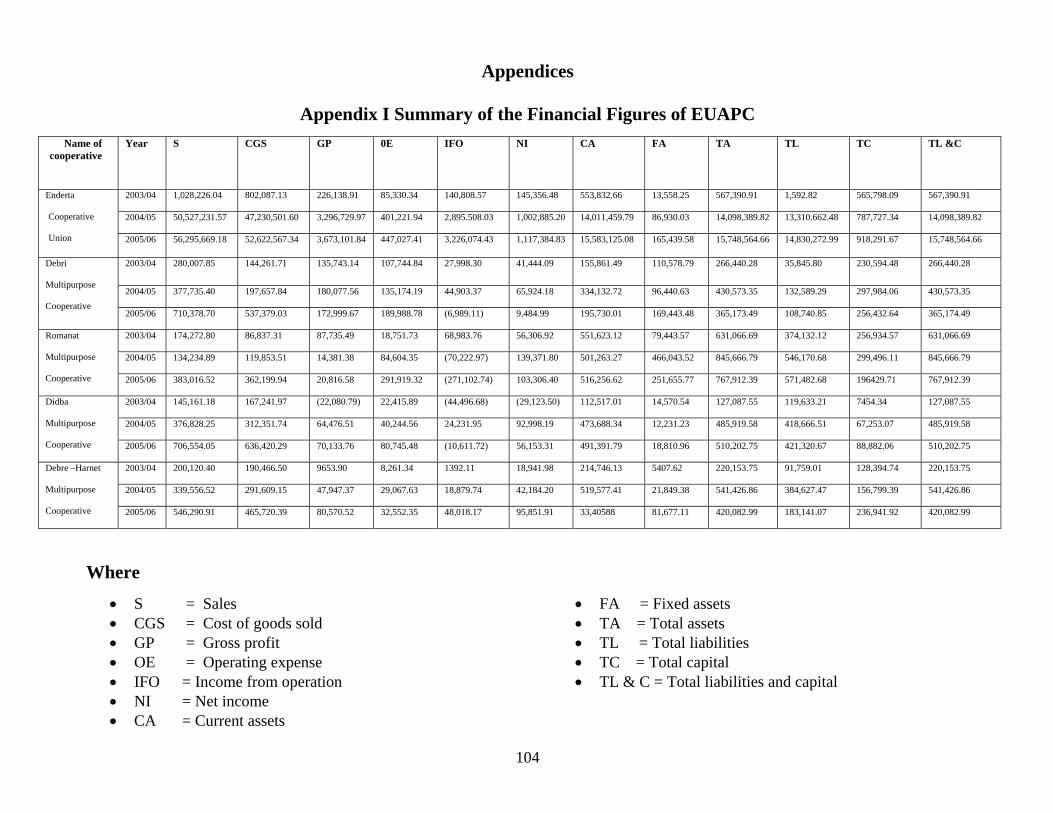
Appendices
Appendix I Summary of the Financial Figures of EUAPC
Name of cooperative
Year S CGS GP 0E IFO NI CA FA TA TL TC TL &C
2003/04 1,028,226.04 802,087.13 226,138.91 85,330.34 140,808.57 145,356.48 553,832.66 13,558.25 567,390.91 1,592.82 565,798.09 567,390.91
2004/05 50,527,231.57 47,230,501.60 3,296,729.97 401,221.94 2,895.508.03 1,002,885.20 14,011,459.79 86,930.03 14,098,389.82 13,310.662.48 787,727.34 14,098,389.82
Enderta
Cooperative
Union 2005/06 56,295,669.18 52,622,567.34 3,673,101.84 447,027.41 3,226,074.43 1,117,384.83 15,583,125.08 165,439.58 15,748,564.66 14,830,272.99 918,291.67 15,748,564.66
2003/04 280,007.85 144,261.71 135,743.14 107,744.84 27,998.30 41,444.09 155,861.49 110,578.79 266,440.28 35,845.80 230,594.48 266,440.28
2004/05 377,735.40 197,657.84 180,077.56 135,174.19 44,903.37 65,924.18 334,132.72 96,440.63 430,573.35 132,589.29 297,984.06 430,573.35
Debri
Multipurpose
Cooperative 2005/06 710,378.70 537,379.03 172,999.67 189,988.78 (6,989.11) 9,484.99 195,730.01 169,443.48 365,173.49 108,740.85 256,432.64 365,174.49
2003/04 174,272.80 86,837.31 87,735.49 18,751.73 68,983.76 56,306.92 551,623.12 79,443.57 631,066.69 374,132.12 256,934.57 631,066.69
2004/05 134,234.89 119,853.51 14,381.38 84,604.35 (70,222.97) 139,371.80 501,263.27 466,043.52 845,666.79 546,170.68 299,496.11 845,666.79
Romanat
Multipurpose
Cooperative 2005/06 383,016.52 362,199.94 20,816.58 291,919.32 (271,102.74) 103,306.40 516,256.62 251,655.77 767,912.39 571,482.68 196429.71 767,912.39
2003/04 145,161.18 167,241.97 (22,080.79) 22,415.89 (44,496.68) (29,123.50) 112,517.01 14,570.54 127,087.55 119,633.21 7454.34 127,087.55
2004/05 376,828.25 312,351.74 64,476.51 40,244.56 24,231.95 92,998.19 473,688.34 12,231.23 485,919.58 418,666.51 67,253.07 485,919.58
Didba
Multipurpose
Cooperative 2005/06 706,554.05 636,420.29 70,133.76 80,745.48 (10,611.72) 56,153.31 491,391.79 18,810.96 510,202.75 421,320.67 88,882.06 510,202.75
2003/04 200,120.40 190,466.50 9653.90 8,261.34 1392.11 18,941.98 214,746.13 5407.62 220,153.75 91,759.01 128,394.74 220,153.75
2004/05 339,556.52 291,609.15 47,947.37 29,067.63 18,879.74 42,184.20 519,577.41 21,849.38 541,426.86 384,627.47 156,799.39 541,426.86
Debre –Harnet
Multipurpose
Cooperative 2005/06 546,290.91 465,720.39 80,570.52 32,552.35 48,018.17 95,851.91 33,40588 81,677.11 420,082.99 183,141.07 236,941.92 420,082.99
Where
• S = Sales • CGS = Cost of goods sold • GP = Gross profit • OE = Operating expense • IFO = Income from operation • NI = Net income • CA = Current assets
• FA = Fixed assets • TA = Total assets • TL = Total liabilities • TC = Total capital • TL & C = Total liabilities and capital
104
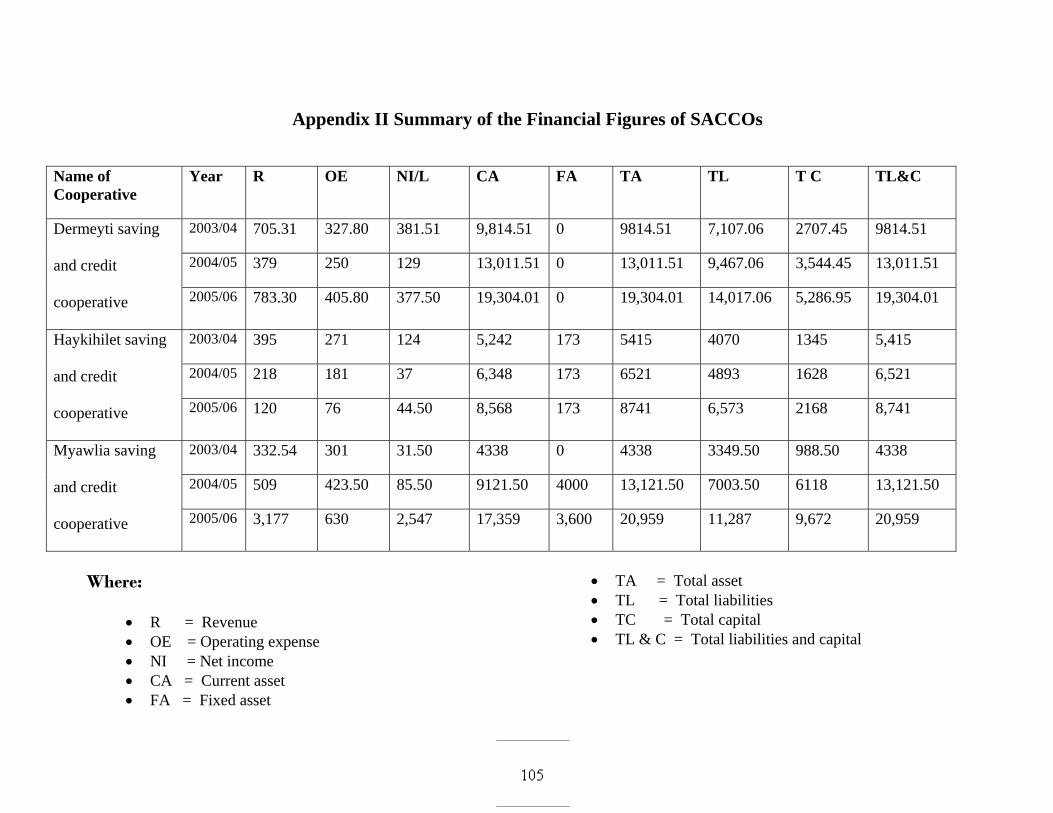
Appendix II Summary of the Financial Figures of SACCOs
Name of Cooperative
Year R OE NI/L CA FA TA TL T C TL&C
2003/04 705.31 327.80 381.51 9,814.51 0 9814.51 7,107.06 2707.45 9814.51
2004/05 379 250 129 13,011.51 0 13,011.51 9,467.06 3,544.45 13,011.51
Dermeyti saving
and credit
cooperative 2005/06 783.30 405.80 377.50 19,304.01 0 19,304.01 14,017.06 5,286.95 19,304.01
2003/04 395 271 124 5,242 173 5415 4070 1345 5,415
2004/05 218 181 37 6,348 173 6521 4893 1628 6,521
Haykihilet saving
and credit
cooperative 2005/06 120 76 44.50 8,568 173 8741 6,573 2168 8,741
2003/04 332.54 301 31.50 4338 0 4338 3349.50 988.50 4338
2004/05 509 423.50 85.50 9121.50 4000 13,121.50 7003.50 6118 13,121.50
Myawlia saving
and credit
cooperative 2005/06 3,177 630 2,547 17,359 3,600 20,959 11,287 9,672 20,959
Where:
• R = Revenue • OE = Operating expense • NI = Net income • CA = Current asset • FA = Fixed asset
• TA = Total asset • TL = Total liabilities • TC = Total capital
107
• TL & C = Total liabilities and capital
106
Appendix III Check List
Focus group discussion questions with the members of the cooperatives
For all the cooperatives selected in the woreda
A) Questions related with introduction
- Name
- Age
- Year of membership
B) Questions related with work
- How is the work with in the cooperative?
-What are the Problems encountered in the day to day activities of the cooperatives
C) Questions related with cooperative
1. Why do you join to this cooperative?
2. What advantages and disadvantages do you obtain from being a membership of the
cooperative
3. What are the main objectives of the cooperatives
4. What are the benefits of being membership of cooperatives?
5. Do you have Access to fertilizer, selected seeds or agricultural inputs?
6. What are the types of services you obtain from the cooperatives?
7. What is the main source of finance for the cooperatives?
8. What is your opinion towards the role of the cooperatives
9. How do you recruit employees in the cooperatives?
10. What are the problems of members of the cooperatives with respect to financial
performance?
11. What are your recommendations to improve the financial performance of the
cooperatives?
107
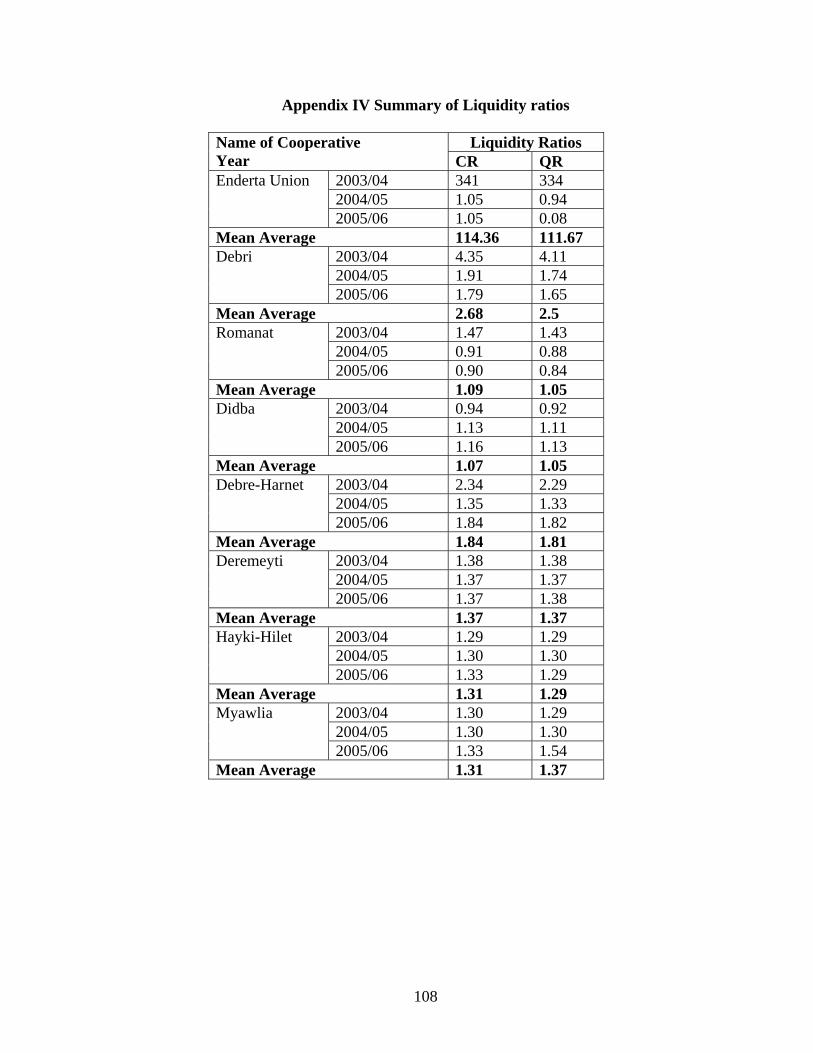
Appendix IV Summary of Liquidity ratios
Liquidity Ratios Name of Cooperative Year CR QR
2003/04 341 334 2004/05 1.05 0.94
Enderta Union
2005/06 1.05 0.08 Mean Average 114.36 111.67
2003/04 4.35 4.11 2004/05 1.91 1.74
Debri
2005/06 1.79 1.65 Mean Average 2.68 2.5
2003/04 1.47 1.43 2004/05 0.91 0.88
Romanat
2005/06 0.90 0.84 Mean Average 1.09 1.05
2003/04 0.94 0.92 2004/05 1.13 1.11
Didba
2005/06 1.16 1.13 Mean Average 1.07 1.05
2003/04 2.34 2.29 2004/05 1.35 1.33
Debre-Harnet
2005/06 1.84 1.82 Mean Average 1.84 1.81
2003/04 1.38 1.38 2004/05 1.37 1.37
Deremeyti
2005/06 1.37 1.38 Mean Average 1.37 1.37
2003/04 1.29 1.29 2004/05 1.30 1.30
Hayki-Hilet
2005/06 1.33 1.29 Mean Average 1.31 1.29
2003/04 1.30 1.29 2004/05 1.30 1.30
Myawlia
2005/06 1.33 1.54 Mean Average 1.31 1.37
108
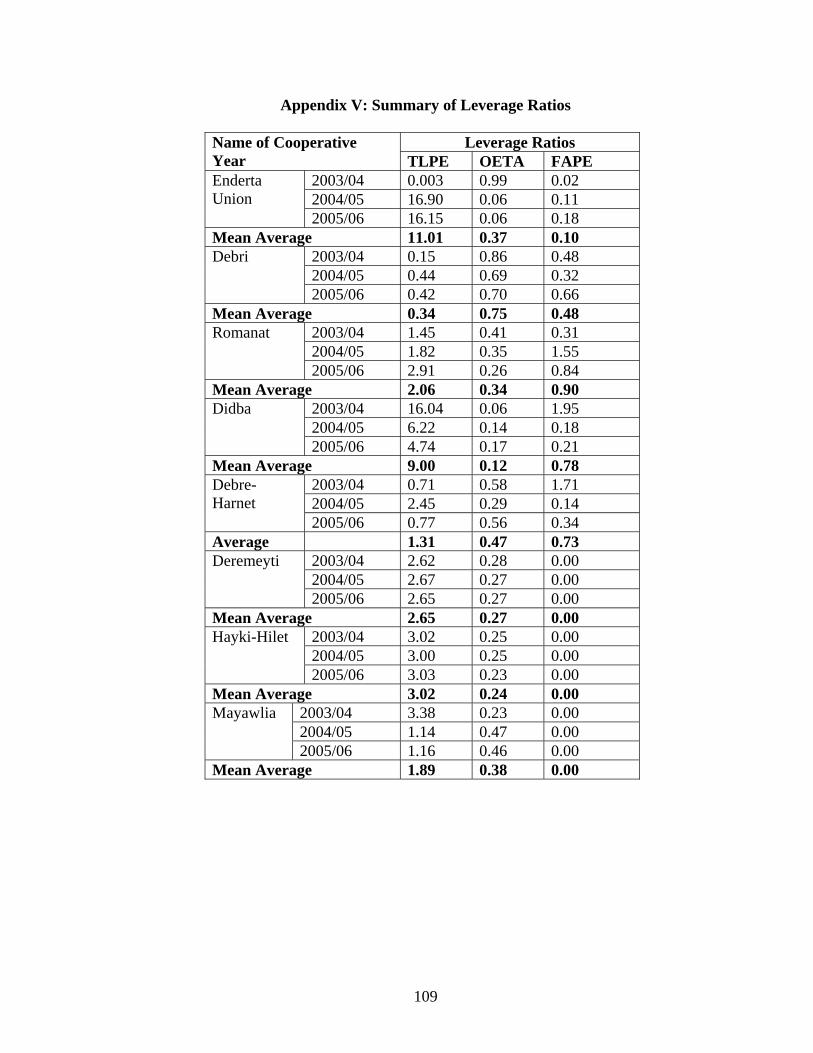
Appendix V: Summary of Leverage Ratios
Leverage Ratios Name of Cooperative Year TLPE OETA FAPE
2003/04 0.003 0.99 0.02 2004/05 16.90 0.06 0.11
Enderta Union
2005/06 16.15 0.06 0.18 Mean Average 11.01 0.37 0.10
2003/04 0.15 0.86 0.48 2004/05 0.44 0.69 0.32
Debri
2005/06 0.42 0.70 0.66 Mean Average 0.34 0.75 0.48
2003/04 1.45 0.41 0.31 2004/05 1.82 0.35 1.55
Romanat
2005/06 2.91 0.26 0.84 Mean Average 2.06 0.34 0.90
2003/04 16.04 0.06 1.95 2004/05 6.22 0.14 0.18
Didba
2005/06 4.74 0.17 0.21 Mean Average 9.00 0.12 0.78
2003/04 0.71 0.58 1.71 2004/05 2.45 0.29 0.14
Debre-Harnet
2005/06 0.77 0.56 0.34 Average 1.31 0.47 0.73
2003/04 2.62 0.28 0.00 2004/05 2.67 0.27 0.00
Deremeyti
2005/06 2.65 0.27 0.00 Mean Average 2.65 0.27 0.00
2003/04 3.02 0.25 0.00 2004/05 3.00 0.25 0.00
Hayki-Hilet
2005/06 3.03 0.23 0.00 Mean Average 3.02 0.24 0.00
2003/04 3.38 0.23 0.00 2004/05 1.14 0.47 0.00
Mayawlia
2005/06 1.16 0.46 0.00 Mean Average 1.89 0.38 0.00
109
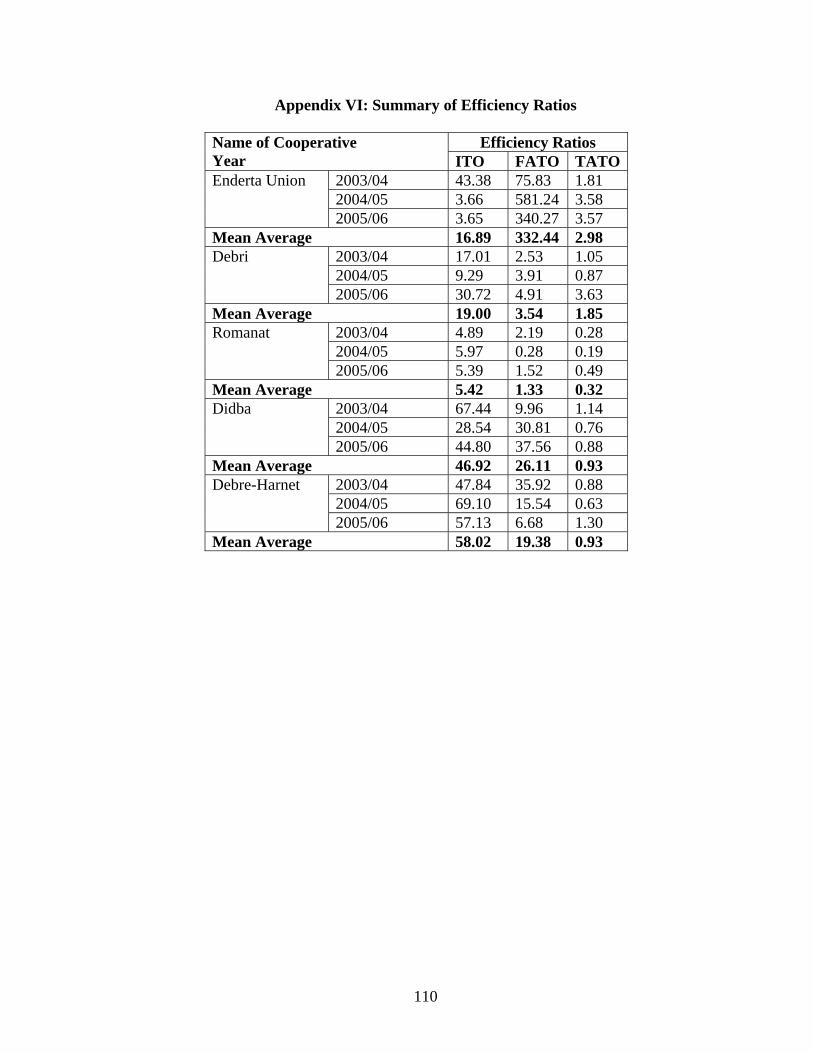
Appendix VI: Summary of Efficiency Ratios
Efficiency Ratios Name of Cooperative Year ITO FATO TATO
2003/04 43.38 75.83 1.81 2004/05 3.66 581.24 3.58
Enderta Union
2005/06 3.65 340.27 3.57 Mean Average 16.89 332.44 2.98
2003/04 17.01 2.53 1.05 2004/05 9.29 3.91 0.87
Debri
2005/06 30.72 4.91 3.63 Mean Average 19.00 3.54 1.85
2003/04 4.89 2.19 0.28 2004/05 5.97 0.28 0.19
Romanat
2005/06 5.39 1.52 0.49 Mean Average 5.42 1.33 0.32
2003/04 67.44 9.96 1.14 2004/05 28.54 30.81 0.76
Didba
2005/06 44.80 37.56 0.88 Mean Average 46.92 26.11 0.93
2003/04 47.84 35.92 0.88 2004/05 69.10 15.54 0.63
Debre-Harnet
2005/06 57.13 6.68 1.30 Mean Average 58.02 19.38 0.93
110
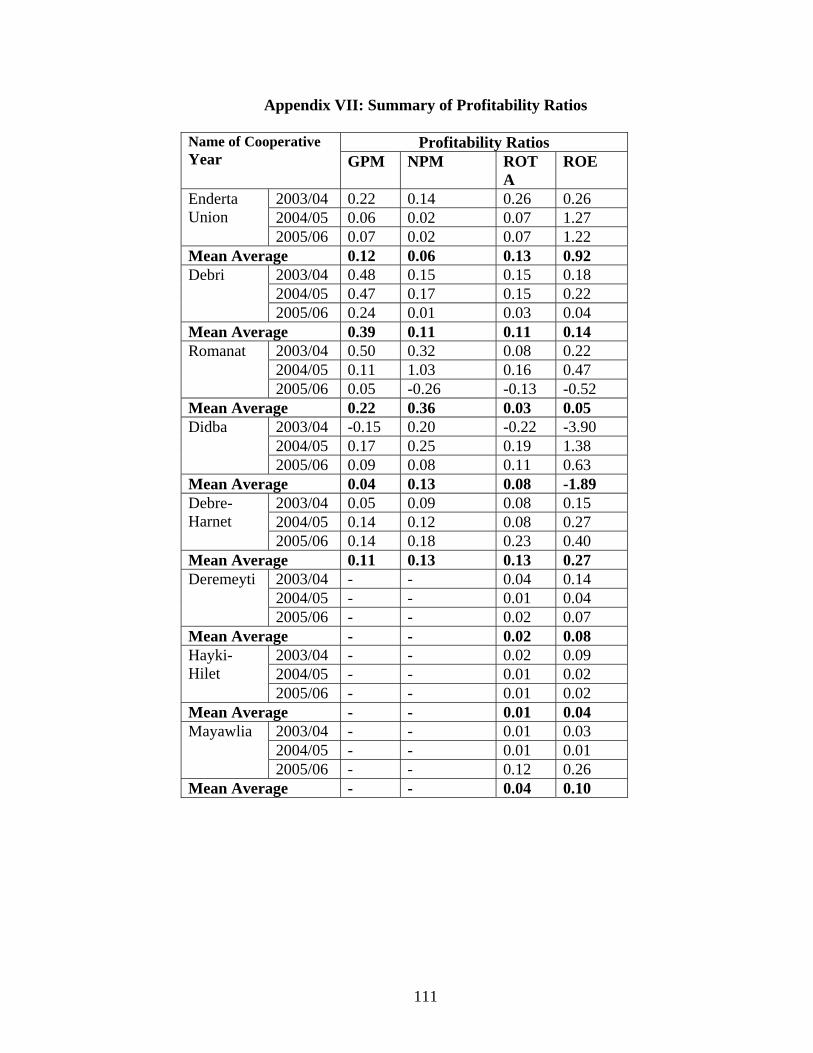
Appendix VII: Summary of Profitability Ratios
Profitability Ratios Name of Cooperative Year GPM NPM ROT
A ROE
2003/04 0.22 0.14 0.26 0.26 2004/05 0.06 0.02 0.07 1.27
Enderta Union
2005/06 0.07 0.02 0.07 1.22 Mean Average 0.12 0.06 0.13 0.92
2003/04 0.48 0.15 0.15 0.18 2004/05 0.47 0.17 0.15 0.22
Debri
2005/06 0.24 0.01 0.03 0.04 Mean Average 0.39 0.11 0.11 0.14
2003/04 0.50 0.32 0.08 0.22 2004/05 0.11 1.03 0.16 0.47
Romanat
2005/06 0.05 -0.26 -0.13 -0.52 Mean Average 0.22 0.36 0.03 0.05
2003/04 -0.15 0.20 -0.22 -3.90 2004/05 0.17 0.25 0.19 1.38
Didba
2005/06 0.09 0.08 0.11 0.63 Mean Average 0.04 0.13 0.08 -1.89
2003/04 0.05 0.09 0.08 0.15 2004/05 0.14 0.12 0.08 0.27
Debre-Harnet
2005/06 0.14 0.18 0.23 0.40 Mean Average 0.11 0.13 0.13 0.27
2003/04 - - 0.04 0.14 2004/05 - - 0.01 0.04
Deremeyti
2005/06 - - 0.02 0.07 Mean Average - - 0.02 0.08
2003/04 - - 0.02 0.09 2004/05 - - 0.01 0.02
Hayki-Hilet
2005/06 - - 0.01 0.02 Mean Average - - 0.01 0.04
2003/04 - - 0.01 0.03 2004/05 - - 0.01 0.01
Mayawlia
2005/06 - - 0.12 0.26 Mean Average - - 0.04 0.10
111


