Embed Size (px)
Citation preview

Group overview Governance Risk review
Zurich Insurance GroupAnnual Report 2019 162
Financial review
Financial review
Group overview Governance Risk review
Zurich Insurance GroupAnnual Report 2019 163
Financial review
296Holding company
178Consolidated financial statements
166Financial overview

Message from our Group Chief Financial Officer
Message from our Group Chief Financial Officer
The results show the Group making further strong progress. All 2017 to 2019 targets were exceeded, with all business units contributing. Together with our customer-focused strategy, a simplified operating model and strong balance sheet, these results position us well for the future.”George QuinnGroup Chief Financial Officer
All targets exceeded
2017– 2019 financial targetsTarget: >12.0%
BOPAT ROE 1
14.2%FY 2019
Target: USD 1.5 bn
Cumulative net expense savings
USD 1.6 bnAs of FY 2019
Target: >USD 9.5 bn
Cumulative cash remittances
USD 10.9 bnAs of FY 2019
Target range: 100 – 120%
Estimated Z-ECM ratio 2
129%FY 2019
1 Business operating profit after tax return on equity, excluding unrealized gains and losses.
2 Full year 2019 Z-ECM reflects midpoint estimate with an error margin of +/–5 percentage points.
Full year 2019 results show strong performance across all businesses, with business operating profit (BOP) up 16 percent and a BOPAT ROE of 14.2 percent. Net income increased 12 percent to the highest level in a decade. A dividend increase of 5 percent has been proposed.
Well positioned for the futureTogether with the Group’s customer-focused strategy and simplified operating model, the results position the Group well to take advantage of ongoing changes within the global insurance industry and to deliver further value to shareholders.
2017 to 2019 targets exceededThe Group has exceeded the ambitious targets set in 2016, resulting in a simpler, more agile and efficient company. The business has been further strengthened through targeted acquisitions in key geographies.
Zurich Insurance GroupAnnual Report 2019 164
Group overview Governance Risk review Financial review
Message from our Group Chief Financial Officer
Continued strong performance across all businesses
Property & Casualty (P&C)
Combined ratio (%)
2018
4.0%
-2.3% -2.3%
63.6% 63.4%
32.4% 32.1%
2019
3.2%97.8% 96.4%
Catastrophes Expense ratioAccident year loss ratio excluding catastrophesPrior year development
2018
+2%
2019
Like-for-like BOP growth (%)4
Life
Combined ratio (CR) (%)
Farmers Exchanges3
2018
6.9%93.0% 93.2%
Like-for-like GWP growth (%)4
2018
2017
2019
Unit-linked, protection and Corporate Life & Pensions 85%
Savings & Annuity 15%
2019 APE share of non-traditional products (%) GWP growth (in USD millions)
2018
+2%
2019
20,325 20,656
2019
6.8%99.9% 100.0%
Catastrophes CR excluding catastrophes
1.2%
6.1%
0.4%
3 Provided for informational purposes only. Zurich Insurance Group has no ownership interest in the Farmers Exchanges. Farmers Group, Inc., a wholly owned subsidiary of the Group, provides certain non-claims services and ancillary services to the Farmers Exchanges as its attorney-in-fact and receives fees for its services.
4 In local currency and adjusted for closed acquisitions and disposals.
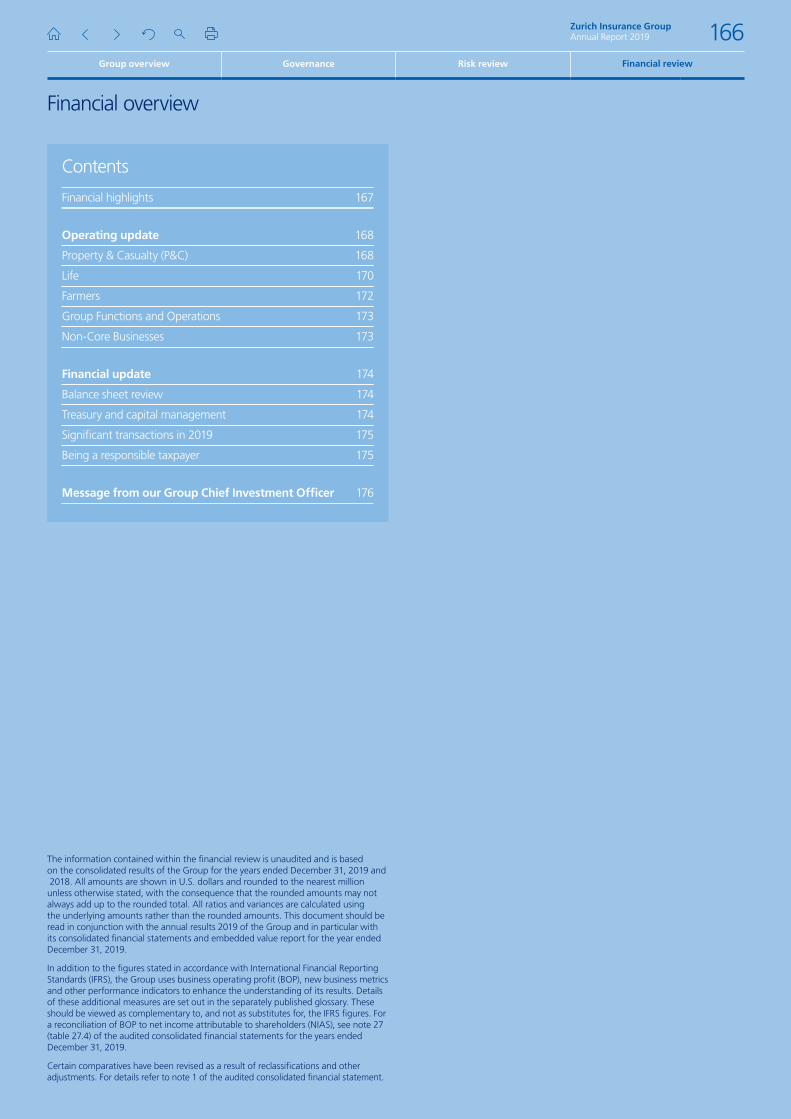
Progress made across all businesses Property & Casualty results showed further strong year-on-year progress with BOP up 38 percent, driven by an improved underwriting performance and higher investment results, which more than compensated for a challenging year in the Group’s North American crop business.
Gross written premiums increased 2 percent with growth strengthening over the year, led by hardening pricing and underlying growth, with current positive pricing trends expected to continue through 2020.
The Group’s combined ratio improved by 1.4 percentage points over the year, continuing the trend of recent years and despite adverse development of the North American crop insurance business.
The results also continued to demonstrate the strength of the Group’s reserves, with prior year reserve development of 2.3 points at the same level as in 2018.
The Group’s Life business delivered a strong performance against a high 2018 result with BOP declining 4 percent due to adverse currency movements. On a like-for-like
basis adjusting for acquisitions, disposals and currency movements, growth was 2 percent, despite a lower contribution from favorable one-time items.
The Group’s strategy of focusing on protection business and capital-efficient savings products positions it well for a continuation of low investment yields, with 85 percent of annual premium equivalent (APE) sales from protection and capital-efficient savings products.
Farmers delivered business operating profit growth of 4 percent, reflecting fee growth and favorable mark-to-market movements on a deferred compensation plan at Farmers Management Services, as well as a strong performance at Farmers Life. The Farmers Exchanges continued to deliver steady and consistent growth supported by Farmers strategy to deepen customer relationships, broaden product offerings and expand in the eastern U.S.
Group Functions and Operations showed an improved performance with the associated net loss reduced by 5 percent due to lower net costs associated with the Group’s headquarters.
A strong capital position and cash generationDuring the year, management continued to improve the Group’s focus and optimize the use of capital. The Group’s balance sheet and internal economic capital model (Z-ECM) remained very strong at an estimated 129 percent 2, above the target range.
Conversion of earnings into distributable cash was strong, with USD 3.4 billion of net cash remittances over the year bringing the total net remittances to USD 10.9 billion over the past three years, well ahead of the USD 9.5 billion set in 2016.
5 percent proposed dividend increaseIn line with the stated dividend policy, the board proposed a 5 percent increase in the dividend to CHF 20 per share.
George QuinnGroup Chief Financial Officer
Zurich Insurance GroupAnnual Report 2019 165
Group overview Governance Risk review Financial review
Contents
Financial highlights 167
Operating update 168
Property & Casualty (P&C) 168
Life 170
Farmers 172
Group Functions and Operations 173
Non-Core Businesses 173
Financial update 174
Balance sheet review 174
Treasury and capital management 174
Significant transactions in 2019 175
Being a responsible taxpayer 175
Message from our Group Chief Investment Officer 176
Financial overview
Financial overview
The information contained within the financial review is unaudited and is based on the consolidated results of the Group for the years ended December 31, 2019 and 2018. All amounts are shown in U.S. dollars and rounded to the nearest million unless otherwise stated, with the consequence that the rounded amounts may not always add up to the rounded total. All ratios and variances are calculated using the underlying amounts rather than the rounded amounts. This document should be read in conjunction with the annual results 2019 of the Group and in particular with its consolidated financial statements and embedded value report for the year ended December 31, 2019.
In addition to the figures stated in accordance with International Financial Reporting Standards (IFRS), the Group uses business operating profit (BOP), new business metrics and other performance indicators to enhance the understanding of its results. Details of these additional measures are set out in the separately published glossary. These should be viewed as complementary to, and not as substitutes for, the IFRS figures. For a reconciliation of BOP to net income attributable to shareholders (NIAS), see note 27 (table 27.4) of the audited consolidated financial statements for the years ended December 31, 2019.
Certain comparatives have been revised as a result of reclassifications and other adjustments. For details refer to note 1 of the audited consolidated financial statement.
Group overview Governance Risk review
Zurich Insurance GroupAnnual Report 2019 166
Financial review
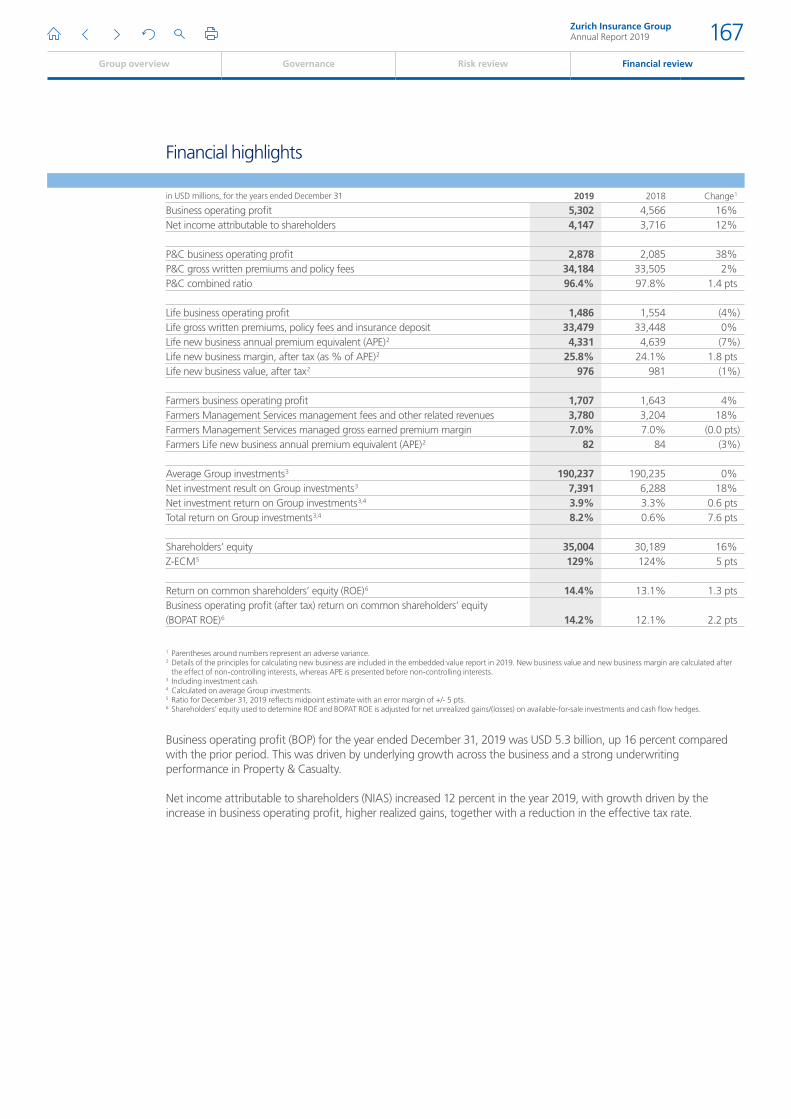
Financial highlights
in USD millions, for the years ended December 31 2019 2018 Change 1
Business operating profit 5,302 4,566 16%Net income attributable to shareholders 4,147 3,716 12%
P&C business operating profit 2,878 2,085 38%P&C gross written premiums and policy fees 34,184 33,505 2%P&C combined ratio 96.4% 97.8% 1.4 pts
Life business operating profit 1,486 1,554 (4%)Life gross written premiums, policy fees and insurance deposit 33,479 33,448 0%Life new business annual premium equivalent (APE) 2 4,331 4,639 (7%)Life new business margin, after tax (as % of APE) 2 25.8% 24.1% 1.8 ptsLife new business value, after tax 2 976 981 (1%)
Farmers business operating profit 1,707 1,643 4%Farmers Management Services management fees and other related revenues 3,780 3,204 18%Farmers Management Services managed gross earned premium margin 7.0% 7.0% (0.0 pts)Farmers Life new business annual premium equivalent (APE) 2 82 84 (3%)
Average Group investments 3 190,237 190,235 0%Net investment result on Group investments 3 7,391 6,288 18%Net investment return on Group investments 3,4 3.9% 3.3% 0.6 ptsTotal return on Group investments 3,4 8.2% 0.6% 7.6 pts
Shareholders’ equity 35,004 30,189 16%Z-ECM 5 129% 124% 5 pts
Return on common shareholders’ equity (ROE) 6 14.4% 13.1% 1.3 ptsBusiness operating profit (after tax) return on common shareholders’ equity (BOPAT ROE) 6 14.2% 12.1% 2.2 pts
1 Parentheses around numbers represent an adverse variance.2 Details of the principles for calculating new business are included in the embedded value report in 2019. New business value and new business margin are calculated after
the effect of non-controlling interests, whereas APE is presented before non-controlling interests.3 Including investment cash.4 Calculated on average Group investments.5 Ratio for December 31, 2019 reflects midpoint estimate with an error margin of +/- 5 pts.6 Shareholders’ equity used to determine ROE and BOPAT ROE is adjusted for net unrealized gains/(losses) on available-for-sale investments and cash flow hedges.
Business operating profit (BOP) for the year ended December 31, 2019 was USD 5.3 billion, up 16 percent compared with the prior period. This was driven by underlying growth across the business and a strong underwriting performance in Property & Casualty.
Net income attributable to shareholders (NIAS) increased 12 percent in the year 2019, with growth driven by the increase in business operating profit, higher realized gains, together with a reduction in the effective tax rate.
Zurich Insurance GroupAnnual Report 2019 167
Group overview Governance Risk review Financial review
Operating update
Operating update
Property & Casualty (P&C)
in USD millions, for the years ended December 31 Total
2019 2018 Change
Gross written premiums and policy fees 34,184 33,505 2%Net earned premiums and policy fees 25,608 26,431 (3%)Insurance benefits and losses, net of reinsurance 16,475 17,291 5%Net underwriting result 922 574 61%Net investment result 2,171 1,884 15%Business operating profit 2,878 2,085 38%Loss ratio 64.3% 65.4% 1.1 ptsExpense ratio 32.1% 32.4% 0.3 ptsCombined ratio 96.4% 97.8% 1.4 pts
Property & Casualty gross written premiums returned to growth in 2019, increasing 2 percent on a reported basis in U.S. dollars terms and 6 percent on a like-for-like basis, after adjusting for closed acquisitions and disposals and currency movements. Underlying growth was achieved in all regions.
Net earned premiums for the year decreased 3 percent in U.S. dollars and increased 1 percent on a like-for-like basis, with growth impacted by the earn-through of reductions in gross written premiums in the prior year and changes in reinsurance programs.
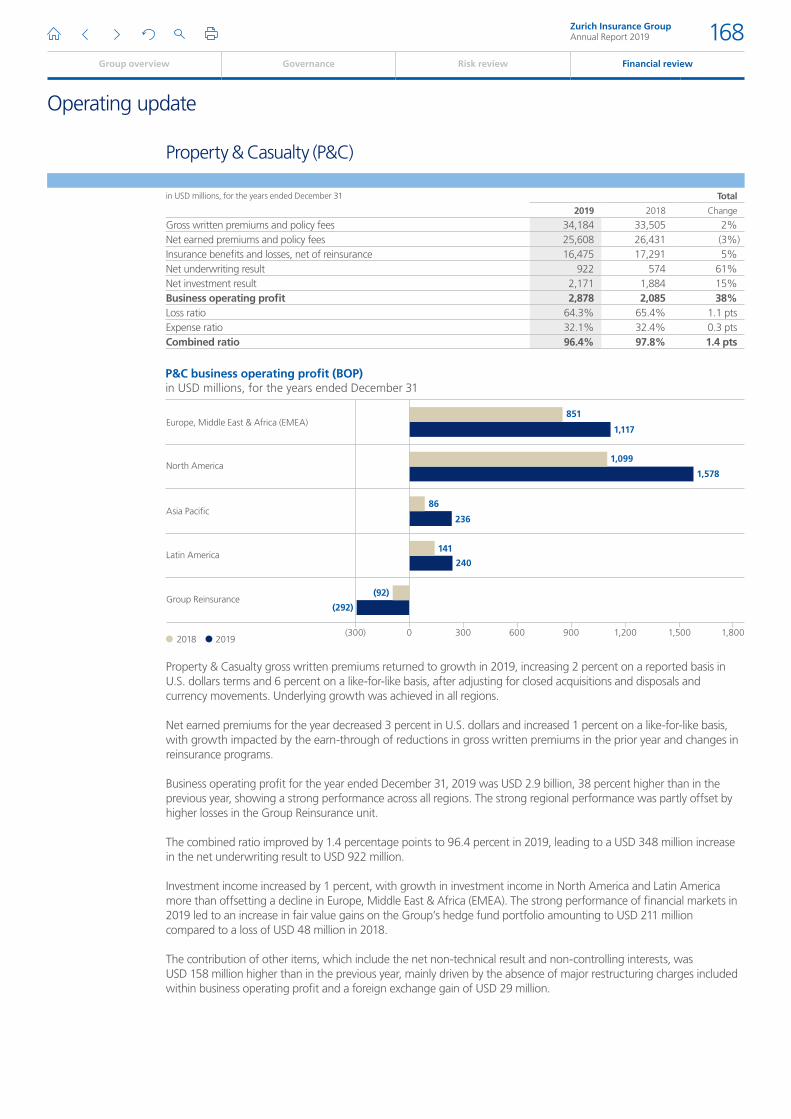
Business operating profit for the year ended December 31, 2019 was USD 2.9 billion, 38 percent higher than in the previous year, showing a strong performance across all regions. The strong regional performance was partly offset by higher losses in the Group Reinsurance unit.
The combined ratio improved by 1.4 percentage points to 96.4 percent in 2019, leading to a USD 348 million increase in the net underwriting result to USD 922 million.
Investment income increased by 1 percent, with growth in investment income in North America and Latin America more than offsetting a decline in Europe, Middle East & Africa (EMEA). The strong performance of financial markets in 2019 led to an increase in fair value gains on the Group’s hedge fund portfolio amounting to USD 211 million compared to a loss of USD 48 million in 2018.
The contribution of other items, which include the net non-technical result and non-controlling interests, was USD 158 million higher than in the previous year, mainly driven by the absence of major restructuring charges included within business operating profit and a foreign exchange gain of USD 29 million.
P&C business operating profit (BOP)in USD millions, for the years ended December 31
(300) 0 300 600 900 1,200 1,500 1,8002018 2019
Europe, Middle East & Africa (EMEA)
Group Reinsurance
Latin America
Asia Pacific
North America
(92)
(292)
141
86
236
1,099
1,578
851
1,117
240
Zurich Insurance GroupAnnual Report 2019 168
Group overview Governance Risk review Financial review
Operating update (continued)
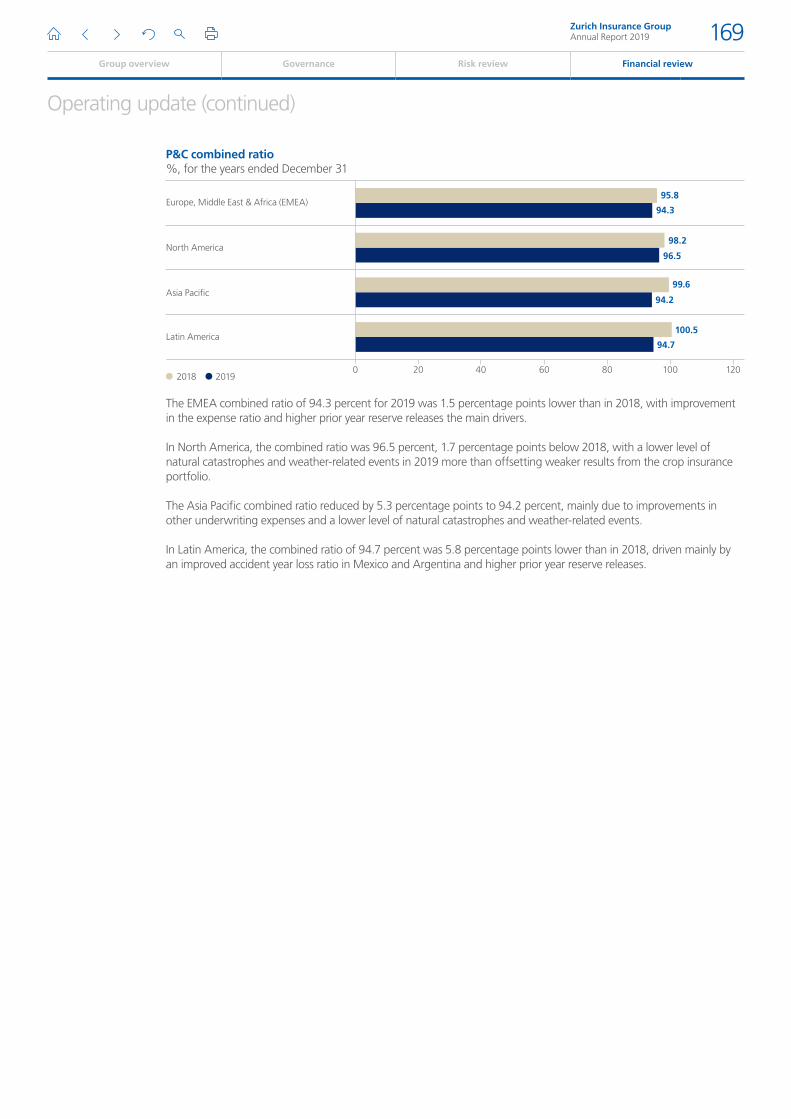
The EMEA combined ratio of 94.3 percent for 2019 was 1.5 percentage points lower than in 2018, with improvement in the expense ratio and higher prior year reserve releases the main drivers.
In North America, the combined ratio was 96.5 percent, 1.7 percentage points below 2018, with a lower level of natural catastrophes and weather-related events in 2019 more than offsetting weaker results from the crop insurance portfolio.
The Asia Pacific combined ratio reduced by 5.3 percentage points to 94.2 percent, mainly due to improvements in other underwriting expenses and a lower level of natural catastrophes and weather-related events.
In Latin America, the combined ratio of 94.7 percent was 5.8 percentage points lower than in 2018, driven mainly by an improved accident year loss ratio in Mexico and Argentina and higher prior year reserve releases.
P&C combined ratio%, for the years ended December 31
0 4020 60 80 100 1202018 2019
Europe, Middle East & Africa (EMEA)
Asia Paci�c
North America
Latin America100.5
99.6
94.2
98.2
96.5
95.8
94.3
94.7
Zurich Insurance GroupAnnual Report 2019 169
Group overview Governance Risk review Financial review
Operating update (continued)
Life
in USD millions, for the years ended December 31 2019 2018 Change
Insurance deposits 18,328 18,694 (2%)Gross written premiums and policy fees 15,151 14,754 3%Net investment income on Group investments 2,915 3,035 (4%)Insurance benefits and losses, net of reinsurance (10,190) (9,702) (5%)Business operating profit 1,486 1,554 (4%)
Net policyholder flows 1 6,320 7,425 (15%)Assets under management 2 275,423 254,248 8%
Total reserves for life insurance contracts, net of reinsurance, and liabilities for investment contracts (net reserves) 226,765 202,024 12%
1 Net policyholder flows are defined as the sum of gross written premiums and policy fees and deposits, less policyholder benefits.2 Assets under management comprise on balance sheet Group investments and unit-linked investments plus assets that are managed by third parties, on which fees
are earned.
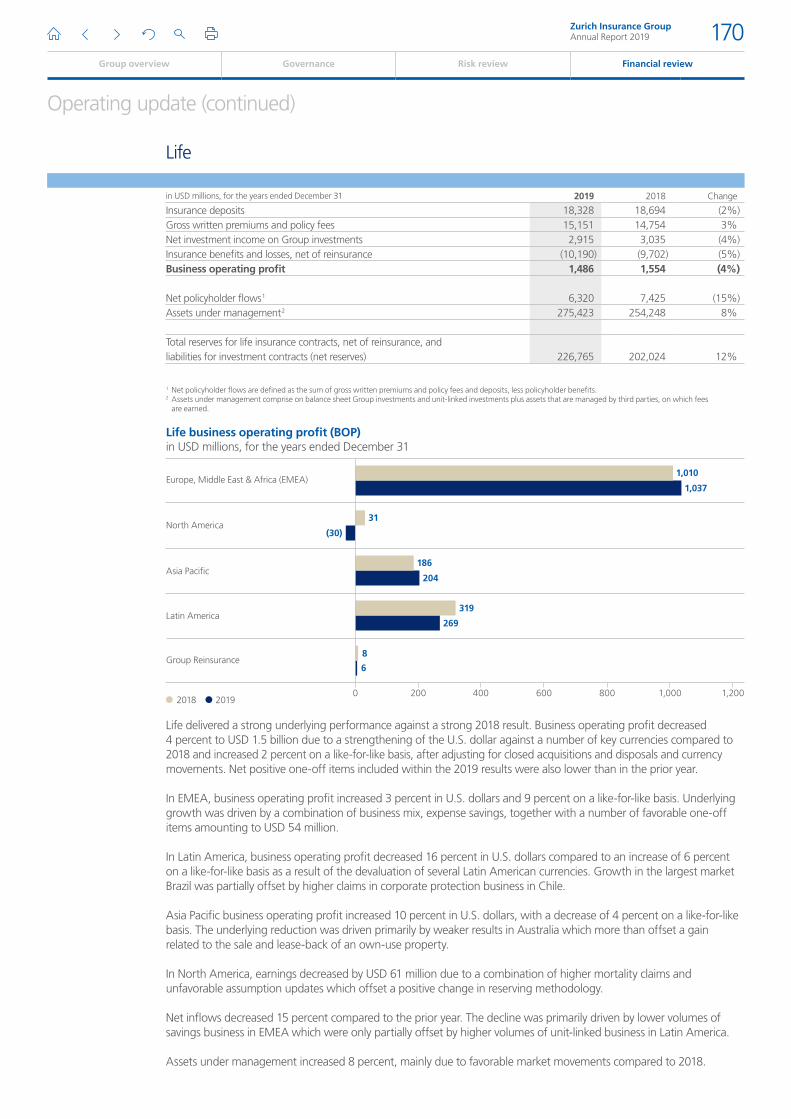
Life delivered a strong underlying performance against a strong 2018 result. Business operating profit decreased 4 percent to USD 1.5 billion due to a strengthening of the U.S. dollar against a number of key currencies compared to 2018 and increased 2 percent on a like-for-like basis, after adjusting for closed acquisitions and disposals and currency movements. Net positive one-off items included within the 2019 results were also lower than in the prior year.
In EMEA, business operating profit increased 3 percent in U.S. dollars and 9 percent on a like-for-like basis. Underlying growth was driven by a combination of business mix, expense savings, together with a number of favorable one-off items amounting to USD 54 million.
In Latin America, business operating profit decreased 16 percent in U.S. dollars compared to an increase of 6 percent on a like-for-like basis as a result of the devaluation of several Latin American currencies. Growth in the largest market Brazil was partially offset by higher claims in corporate protection business in Chile.
Asia Pacific business operating profit increased 10 percent in U.S. dollars, with a decrease of 4 percent on a like-for-like basis. The underlying reduction was driven primarily by weaker results in Australia which more than offset a gain related to the sale and lease-back of an own-use property.
In North America, earnings decreased by USD 61 million due to a combination of higher mortality claims and unfavorable assumption updates which offset a positive change in reserving methodology.
Net inflows decreased 15 percent compared to the prior year. The decline was primarily driven by lower volumes of savings business in EMEA which were only partially offset by higher volumes of unit-linked business in Latin America.
Assets under management increased 8 percent, mainly due to favorable market movements compared to 2018.
Life business operating profit (BOP)in USD millions, for the years ended December 31
0 200 400 600 800 1,000 1,2002018 2019
Europe, Middle East & Africa (EMEA)
Group Reinsurance
Latin America
Asia Pacific
North America
319
186
6
204
31
(30)
1,010
1,037
269
8
Zurich Insurance GroupAnnual Report 2019 170
Group overview Governance Risk review Financial review
Operating update (continued)
NBV, APE and NBM by Segment
in USD millions, for the years ended December 31
New business
value, after tax (NBV) 1
New business
annual premium
equivalent (APE) 2
New business
margin, after tax
(as % of APE) (NBM) 3
2019 2018 2019 2018 2019 2018
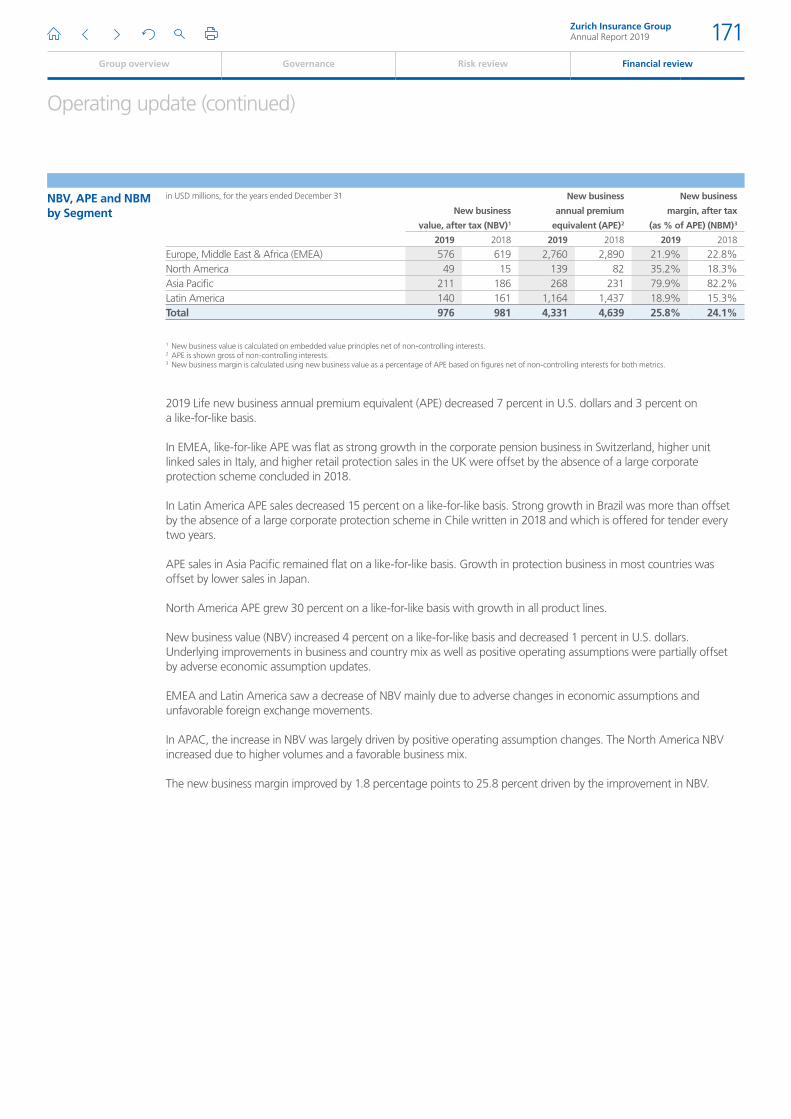
Europe, Middle East & Africa (EMEA) 576 619 2,760 2,890 21.9% 22.8%North America 49 15 139 82 35.2% 18.3%Asia Pacific 211 186 268 231 79.9% 82.2%Latin America 140 161 1,164 1,437 18.9% 15.3%Total 976 981 4,331 4,639 25.8% 24.1%
1 New business value is calculated on embedded value principles net of non-controlling interests.2 APE is shown gross of non-controlling interests.3 New business margin is calculated using new business value as a percentage of APE based on figures net of non-controlling interests for both metrics.
2019 Life new business annual premium equivalent (APE) decreased 7 percent in U.S. dollars and 3 percent on a like-for-like basis.
In EMEA, like-for-like APE was flat as strong growth in the corporate pension business in Switzerland, higher unit linked sales in Italy, and higher retail protection sales in the UK were offset by the absence of a large corporate protection scheme concluded in 2018.
In Latin America APE sales decreased 15 percent on a like-for-like basis. Strong growth in Brazil was more than offset by the absence of a large corporate protection scheme in Chile written in 2018 and which is offered for tender every two years.
APE sales in Asia Pacific remained flat on a like-for-like basis. Growth in protection business in most countries was offset by lower sales in Japan.
North America APE grew 30 percent on a like-for-like basis with growth in all product lines.
New business value (NBV) increased 4 percent on a like-for-like basis and decreased 1 percent in U.S. dollars. Underlying improvements in business and country mix as well as positive operating assumptions were partially offset by adverse economic assumption updates.
EMEA and Latin America saw a decrease of NBV mainly due to adverse changes in economic assumptions and unfavorable foreign exchange movements.
In APAC, the increase in NBV was largely driven by positive operating assumption changes. The North America NBV increased due to higher volumes and a favorable business mix.
The new business margin improved by 1.8 percentage points to 25.8 percent driven by the improvement in NBV.
Zurich Insurance GroupAnnual Report 2019 171
Group overview Governance Risk review Financial review
Operating update (continued)
Farmers
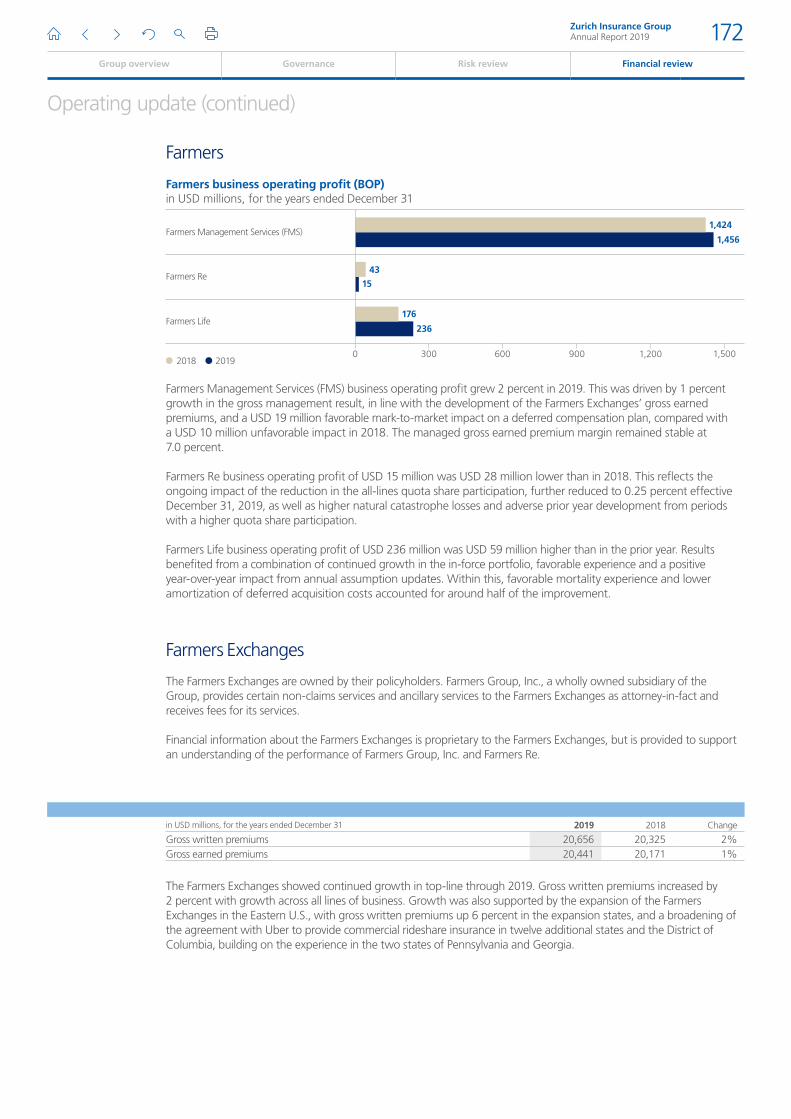
Farmers Management Services (FMS) business operating profit grew 2 percent in 2019. This was driven by 1 percent growth in the gross management result, in line with the development of the Farmers Exchanges’ gross earned premiums, and a USD 19 million favorable mark-to-market impact on a deferred compensation plan, compared with a USD 10 million unfavorable impact in 2018. The managed gross earned premium margin remained stable at 7.0 percent.
Farmers Re business operating profit of USD 15 million was USD 28 million lower than in 2018. This reflects the ongoing impact of the reduction in the all-lines quota share participation, further reduced to 0.25 percent effective December 31, 2019, as well as higher natural catastrophe losses and adverse prior year development from periods with a higher quota share participation.
Farmers Life business operating profit of USD 236 million was USD 59 million higher than in the prior year. Results benefited from a combination of continued growth in the in-force portfolio, favorable experience and a positive year-over-year impact from annual assumption updates. Within this, favorable mortality experience and lower amortization of deferred acquisition costs accounted for around half of the improvement.
Farmers Exchanges
The Farmers Exchanges are owned by their policyholders. Farmers Group, Inc., a wholly owned subsidiary of the Group, provides certain non-claims services and ancillary services to the Farmers Exchanges as attorney-in-fact and receives fees for its services.
Financial information about the Farmers Exchanges is proprietary to the Farmers Exchanges, but is provided to support an understanding of the performance of Farmers Group, Inc. and Farmers Re.
in USD millions, for the years ended December 31 2019 2018 Change
Gross written premiums 20,656 20,325 2%Gross earned premiums 20,441 20,171 1%
The Farmers Exchanges showed continued growth in top-line through 2019. Gross written premiums increased by 2 percent with growth across all lines of business. Growth was also supported by the expansion of the Farmers Exchanges in the Eastern U.S., with gross written premiums up 6 percent in the expansion states, and a broadening of the agreement with Uber to provide commercial rideshare insurance in twelve additional states and the District of Columbia, building on the experience in the two states of Pennsylvania and Georgia.
Farmers business operating profit (BOP)in USD millions, for the years ended December 31
0 300 600 900 1,200 1,5002018 2019
Farmers Re
Farmers Management Services (FMS)
Farmers Life176
43
15
1,424
1,456
236
Zurich Insurance GroupAnnual Report 2019 172
Group overview Governance Risk review Financial review
Operating update (continued)
Group Functions and Operations
in USD millions, for the years ended December 31 2019 2018 Change
Holding and Financing (449) (443) (1%)Headquarters (268) (310) 14%Total business operating profit (716) (753) 5%
The business operating loss reported under Group Functions and Operations improved by USD 36 million to USD 716 million. This was driven by a USD 43 million reduction in headquarter expenses, while Holding and Financing costs remained in line with the prior year.
Non-Core Businesses
in USD millions, for the years ended December 31 2019 2018 Change
Zurich Legacy Solutions (49) 43 nmOther run-off (3) (7) 59%Total business operating profit (52) 37 nm
Non-Core Businesses, which comprise run-off portfolios that are managed with the intention of proactively reducing risk and releasing capital, reported an operating loss of USD 52 million. The loss primarily reflected the net impact of previously announced transactions to exit legacy portfolios related to UK employers’ liability, U.S. asbestos and environmental business, and German professional architects’ and engineers’ professional indemnity, as well as reserve strengthening in selected portfolios.
Zurich Insurance GroupAnnual Report 2019 173
Group overview Governance Risk review Financial review

Financial update
Financial update
Balance sheet review
The total assets for the Group increased to USD 405 billion in 2019 from USD 395 billion in 2018. In 2019, there was an increase in total investments as market valuations improved, particularly in debt and equity securities and investments for unit-linked contracts. This is partially offset by a reduction in other assets as assets held for sale decreased following the divestment of certain businesses in the UK. Additionally, upon adoption of IFRS 16 ‘Leases’ in January 2019, the Group recognized a Right-of-use asset (RoU) of USD 1.4 billion and the Group’s 2019 acquisitions added USD 977 million of goodwill.
These factors also drove an increase in the total liabilities for the Group to USD 368 billion from USD 364 billion in 2018.
Group assetsTotal assets as of December 31, 2019 (in USD millions)
Group liabilities and equityTotal liabilities and equity as of December 31, 2019 (in USD millions)
Cash and cash equivalents 7,880
Total investments 319,523
Reinsurers’ share of liabilities 22,752
Deferred policy acquisition costs 19,207
Goodwill and other intangible assets 8,968
Other assets 26,357
Liabilities for investmentcontracts 61,761
Liabilities for insurance contracts 264,140
Debt 11,999
Other liabilities 30,238
Shareholders’ equity 35,004
Non-controlling interests 1,545
The Group’s shareholder equity increased to USD 35 billion in 2019 from USD 30 billion in 2018. The increase primarily resulted from unrealized gains on available-for-sale investments. The Group’s 2019 net income attributable to shareholders of USD 4.1 billion was offset by a dividend payment of USD 2.8 billion.
Treasury and capital management
The Group’s balance sheet remains very strong, as demonstrated by S&P and Moody’s financial strength ratings for the Zurich Insurance Company Ltd of AA- (positive outlook) and Aa3 (stable outlook), respectively. In addition, as of December 31, 2019, the Group’s estimated Z-ECM ratio remained very strong at 129 percent, with an error margin of +/–5 percentage points.
During the year the Group saw net cash remittances of USD 3.4 billion, with total remittances over the 2017 – 2019 period of USD 10.9 billion, a level consistent with the Group’s target for remittances to exceed USD 9.5 billion over this period. The level of remittances has been driven both by core remittances from operational earnings and capital released by management actions.
Net cash remittances by businessfor the year ended December 31, 2019 (in USD millions)
Property & Casualty 2,262
Life 943
Farmers 1,217
Non-Core Businesses (94)
Group Functions and Operations (928)
Zurich Insurance GroupAnnual Report 2019 174
Group overview Governance Risk review Financial review
Financial update (continued)
Significant transactions in 2019
The Group continued to drive its strategic objectives of investing to improve the quality of service and experience of our customers and becoming a more agile organization.
In May 2019 the Group completed the acquisition of 100 percent of the Australian life and consumer credit insurance business (OnePath Life and OnePath General Insurance) of Australia and New Zealand Banking Group Limited (ANZ) for USD 1.4 billion, making Zurich one of the largest Life insurance players in Australia. As part of the transaction, Zurich will enter into a 20-year strategic alliance agreement with ANZ in Australia to distribute life insurance products through ANZ bank channels.
The Group continues to focus on growth opportunities in the Asia Pacific region. In November 2019 the Group completed the acquisition to acquire 80 percent of Adira Insurance from Bank Danamon Indonesia and a minority investor for approximately USD 465 million. The acquisition includes a 20-year distribution agreement.
Being a responsible taxpayer
As part of Zurich’s tax strategy, the Group strives to manage tax costs and control associated risks for the benefit of its customers, employees, shareholders and for society as a whole. The Group employs rigorous tax accounting and reporting oversight. The location of Group subsidiaries and affiliated companies is driven by business reasons and not the avoidance of tax. The Group’s consolidated result includes only a very limited number of companies located in low or nil tax rate jurisdictions and in all cases these carry out operative insurance, reinsurance and asset management activities.
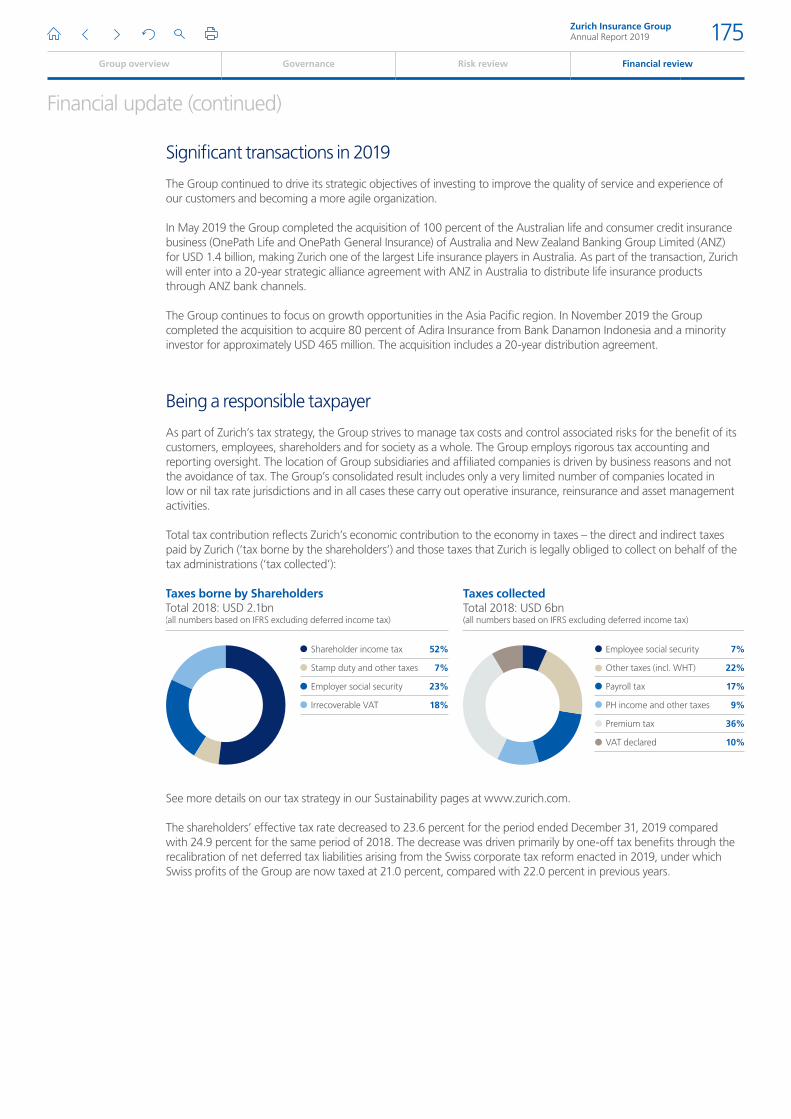
Total tax contribution reflects Zurich’s economic contribution to the economy in taxes – the direct and indirect taxes paid by Zurich (‘tax borne by the shareholders’) and those taxes that Zurich is legally obliged to collect on behalf of the tax administrations (‘tax collected’):
Taxes borne by ShareholdersTotal 2018: USD 2.1bn(all numbers based on IFRS excluding deferred income tax)
Taxes collectedTotal 2018: USD 6bn(all numbers based on IFRS excluding deferred income tax)
Shareholder income tax 52%
Stamp duty and other taxes 7%
Employer social security 23%
Irrecoverable VAT 18%
Employee social security 7%
Other taxes (incl. WHT) 22%
Payroll tax 17%
PH income and other taxes 9%
Premium tax 36%
VAT declared 10%
See more details on our tax strategy in our Sustainability pages at www.zurich.com.
The shareholders’ effective tax rate decreased to 23.6 percent for the period ended December 31, 2019 compared with 24.9 percent for the same period of 2018. The decrease was driven primarily by one-off tax benefits through the recalibration of net deferred tax liabilities arising from the Swiss corporate tax reform enacted in 2019, under which Swiss profits of the Group are now taxed at 21.0 percent, compared with 22.0 percent in previous years.
Zurich Insurance GroupAnnual Report 2019 175
Group overview Governance Risk review Financial review

Message from our Group Chief Investment Officer
Message from our Group Chief Investment Officer
Solid net investment income of USD 5.3 billion and exceptional total investment return of 8.2 percent contributed strongly to Group financial performance in 2019.
Policy easing drives markets higher2019 was an extraordinary year in capital markets. Many asset classes posted new records despite slowing global growth, social unrest and geopolitical friction. Government bonds, credit, equities and real estate all performed strongly, driven in large part by a profound shift toward policy easing by central banks. Amid fears of a manufacturing recession and escalating trade tensions, yields decreased markedly, with some sovereign bond yield curves dropping below zero. As a result, the levels of negative-yielding debt reached an all-time high. For institutional investors such as Zurich, with about 80 percent of assets invested in fixed income, such developments presented challenges when investing their cash flow and managing assets against liabilities. We continue delivering
attractive returns while maintaining discipline and focusing on the quality of our investment portfolios.”Urban AngehrnGroup Chief Investment Officer
Strong performance across asset classes supports investment return
Europe 43%
Switzerland 40%
United States 14%
Other 3%
Totalinvestments¹(%)
USD 205bnTotal investments in 2019
USD 91bnin 2019
USD 13bnin 2019
Non-Financial Credit 31%
Financial Credit 22%
Municipals, Agencies, State Credit 18%
Other 12%
Asset Backed Securities 10%
Covered Bonds 8%
Credit and private debt(%)
USD 91bnin 2019
AAA 21%
AA 15%
A 25%
BBB 33%
Non-investment grade 5%
Unrated 2%
Rating of credit, private debt securities(%)
Direct investment real estate(%)
Credit, private debt 44.2%
Government and government guaranteed 34.1%
Real estate 7.2%
Cash 5.2%
Equities 5.2%
Mortgages 2.4%
Hedge funds, private equity 1.7%
1 Market value of the investment portfolio (economic view).
Zurich Insurance GroupAnnual Report 2019 176
Group overview Governance Risk review Financial review
Message from our Group Chief Investment Officer
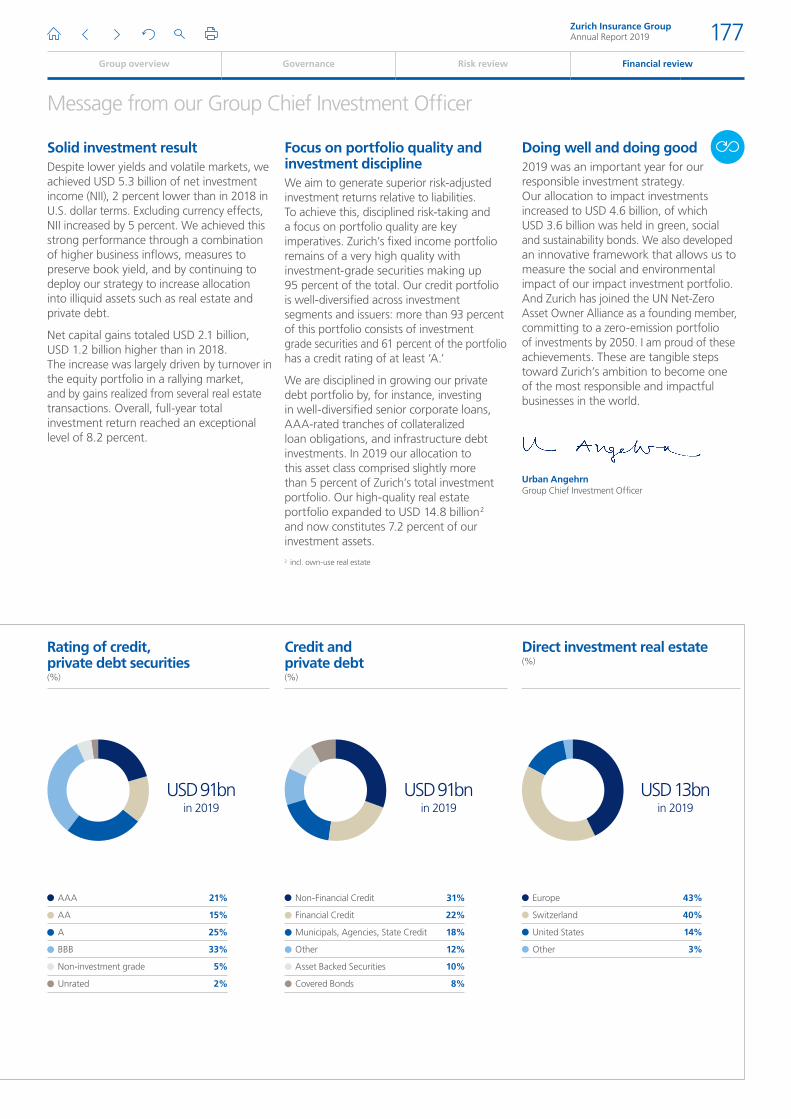
Focus on portfolio quality and investment discipline We aim to generate superior risk-adjusted investment returns relative to liabilities. To achieve this, disciplined risk-taking and a focus on portfolio quality are key imperatives. Zurich’s fixed income portfolio remains of a very high quality with investment-grade securities making up 95 percent of the total. Our credit portfolio is well-diversified across investment segments and issuers: more than 93 percent of this portfolio consists of investment grade securities and 61 percent of the portfolio has a credit rating of at least ‘A.’
We are disciplined in growing our private debt portfolio by, for instance, investing in well-diversified senior corporate loans, AAA-rated tranches of collateralized loan obligations, and infrastructure debt investments. In 2019 our allocation to this asset class comprised slightly more than 5 percent of Zurich’s total investment portfolio. Our high-quality real estate portfolio expanded to USD 14.8 billion 2 and now constitutes 7.2 percent of our investment assets.
Doing well and doing good2019 was an important year for our responsible investment strategy. Our allocation to impact investments increased to USD 4.6 billion, of which USD 3.6 billion was held in green, social and sustainability bonds. We also developed an innovative framework that allows us to measure the social and environmental impact of our impact investment portfolio. And Zurich has joined the UN Net-Zero Asset Owner Alliance as a founding member, committing to a zero-emission portfolio of investments by 2050. I am proud of these achievements. These are tangible steps toward Zurich’s ambition to become one of the most responsible and impactful businesses in the world.
Urban AngehrnGroup Chief Investment Officer
Solid investment result Despite lower yields and volatile markets, we achieved USD 5.3 billion of net investment income (NII), 2 percent lower than in 2018 in U.S. dollar terms. Excluding currency effects, NII increased by 5 percent. We achieved this strong performance through a combination of higher business inflows, measures to preserve book yield, and by continuing to deploy our strategy to increase allocation into illiquid assets such as real estate and private debt.
Net capital gains totaled USD 2.1 billion, USD 1.2 billion higher than in 2018. The increase was largely driven by turnover in the equity portfolio in a rallying market, and by gains realized from several real estate transactions. Overall, full-year total investment return reached an exceptional level of 8.2 percent.
Europe 43%
Switzerland 40%
United States 14%
Other 3%
Totalinvestments¹(%)
USD 205bnTotal investments in 2019
USD 91bnin 2019
USD 13bnin 2019
Non-Financial Credit 31%
Financial Credit 22%
Municipals, Agencies, State Credit 18%
Other 12%
Asset Backed Securities 10%
Covered Bonds 8%
Credit and private debt(%)
USD 91bnin 2019
AAA 21%
AA 15%
A 25%
BBB 33%
Non-investment grade 5%
Unrated 2%
Rating of credit, private debt securities(%)
Direct investment real estate(%)
Credit, private debt 44.2%
Government and government guaranteed 34.1%
Real estate 7.2%
Cash 5.2%
Equities 5.2%
Mortgages 2.4%
Hedge funds, private equity 1.7%
2 incl. own-use real estate
Zurich Insurance GroupAnnual Report 2019 177
Group overview Governance Risk review Financial review
Consolidated financial statements
Contents
Consolidated income statements 179
Consolidated statements of comprehensive income 180
Consolidated balance sheets 182
Consolidated statements of cash flows 184
Consolidated statements of changes in equity 186
1. Basis of presentation 188
2. New accounting standards and amendments to published accounting standards 190
3. Summary of significant accounting policies 194
4. Critical accounting judgments and estimates 201
5. Acquisitions and divestments 205
6. Group investments 208
7. Group derivative financial instruments and hedge accounting 211
8. Liabilities for insurance contracts and reinsurers’ share of liabilities for insurance contracts 215
9. Liabilities for investment contracts 221
10. Gross and ceded insurance revenues and expenses 223
11. Deferred policy acquisition costs and deferred origination costs 224
12. Expenses 225
13. Property and equipment 226
14. Attorney-in-fact contracts, goodwill and other intangible assets 229
15. Receivables and other assets 231
16. Other liabilities 232
17. Income taxes 234
18. Senior and subordinated debt 237
19. Shareholders’ equity, dividends and earnings per share 239
20. Employee benefits 242
21. Share-based compensation and cash incentive plans 250
22. Commitments and contingencies, legal proceedings and regulatory investigations 252
23. Fair value measurement 255
24. Analysis of financial assets 263
25. Related-party transactions 267
26. Relationship with the Farmers Exchanges 268
27. Segment information 270
28. Interest in subsidiaries 285
29. Events after the balance sheet date 289
Report of the statutory auditor 290
Group overview Governance Risk review
Zurich Insurance GroupAnnual Report 2019 178
Financial review
Consolidated financial statements (continued)
Consolidated income statements
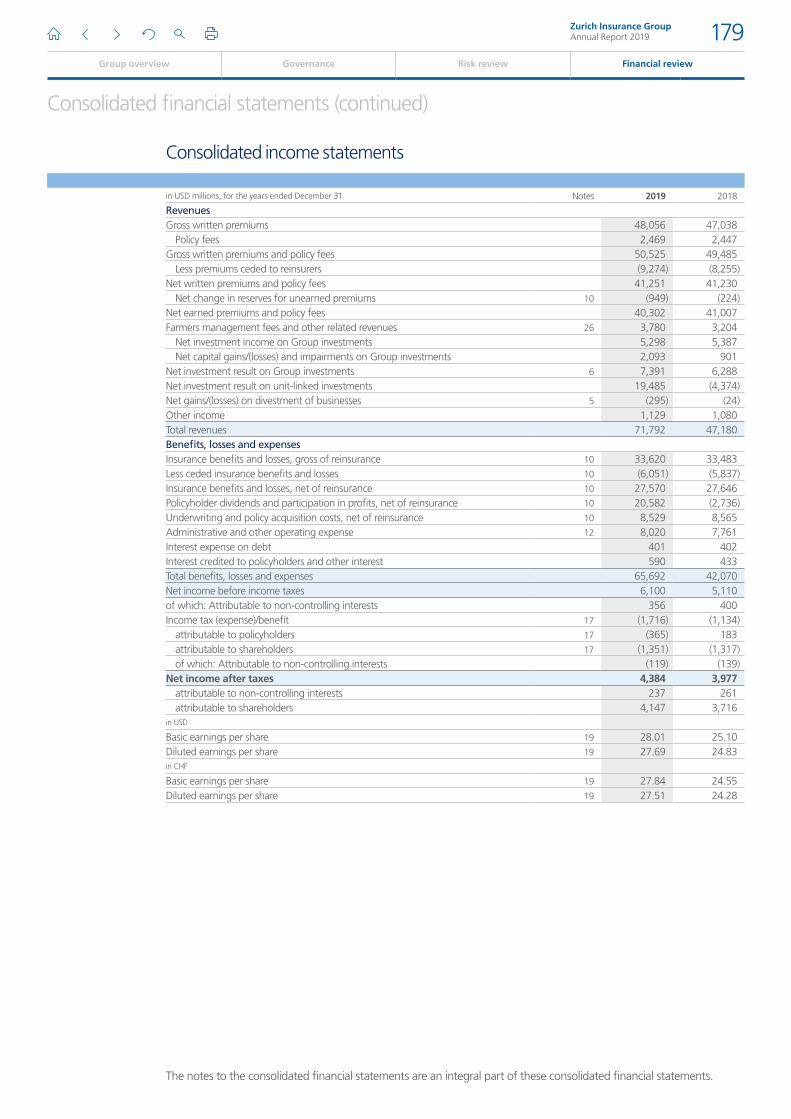
in USD millions, for the years ended December 31 Notes 2019 2018
RevenuesGross written premiums 48,056 47,038
Policy fees 2,469 2,447Gross written premiums and policy fees 50,525 49,485
Less premiums ceded to reinsurers (9,274) (8,255)Net written premiums and policy fees 41,251 41,230
Net change in reserves for unearned premiums 10 (949) (224)Net earned premiums and policy fees 40,302 41,007Farmers management fees and other related revenues 26 3,780 3,204
Net investment income on Group investments 5,298 5,387Net capital gains/(losses) and impairments on Group investments 2,093 901
Net investment result on Group investments 6 7,391 6,288Net investment result on unit-linked investments 19,485 (4,374)Net gains/(losses) on divestment of businesses 5 (295) (24)Other income 1,129 1,080Total revenues 71,792 47,180Benefits, losses and expensesInsurance benefits and losses, gross of reinsurance 10 33,620 33,483Less ceded insurance benefits and losses 10 (6,051) (5,837)Insurance benefits and losses, net of reinsurance 10 27,570 27,646Policyholder dividends and participation in profits, net of reinsurance 10 20,582 (2,736)Underwriting and policy acquisition costs, net of reinsurance 10 8,529 8,565Administrative and other operating expense 12 8,020 7,761Interest expense on debt 401 402Interest credited to policyholders and other interest 590 433Total benefits, losses and expenses 65,692 42,070Net income before income taxes 6,100 5,110of which: Attributable to non-controlling interests 356 400Income tax (expense)/benefit 17 (1,716) (1,134)
attributable to policyholders 17 (365) 183attributable to shareholders 17 (1,351) (1,317)of which: Attributable to non-controlling interests (119) (139)
Net income after taxes 4,384 3,977attributable to non-controlling interests 237 261attributable to shareholders 4,147 3,716
in USD
Basic earnings per share 19 28.01 25.10Diluted earnings per share 19 27.69 24.83in CHF
Basic earnings per share 19 27.84 24.55Diluted earnings per share 19 27.51 24.28
The notes to the consolidated financial statements are an integral part of these consolidated financial statements.
Zurich Insurance GroupAnnual Report 2019 179
Group overview Governance Risk review Financial review
Consolidated financial statements (continued)
The notes to the consolidated financial statements are an integral part of these consolidated financial statements.
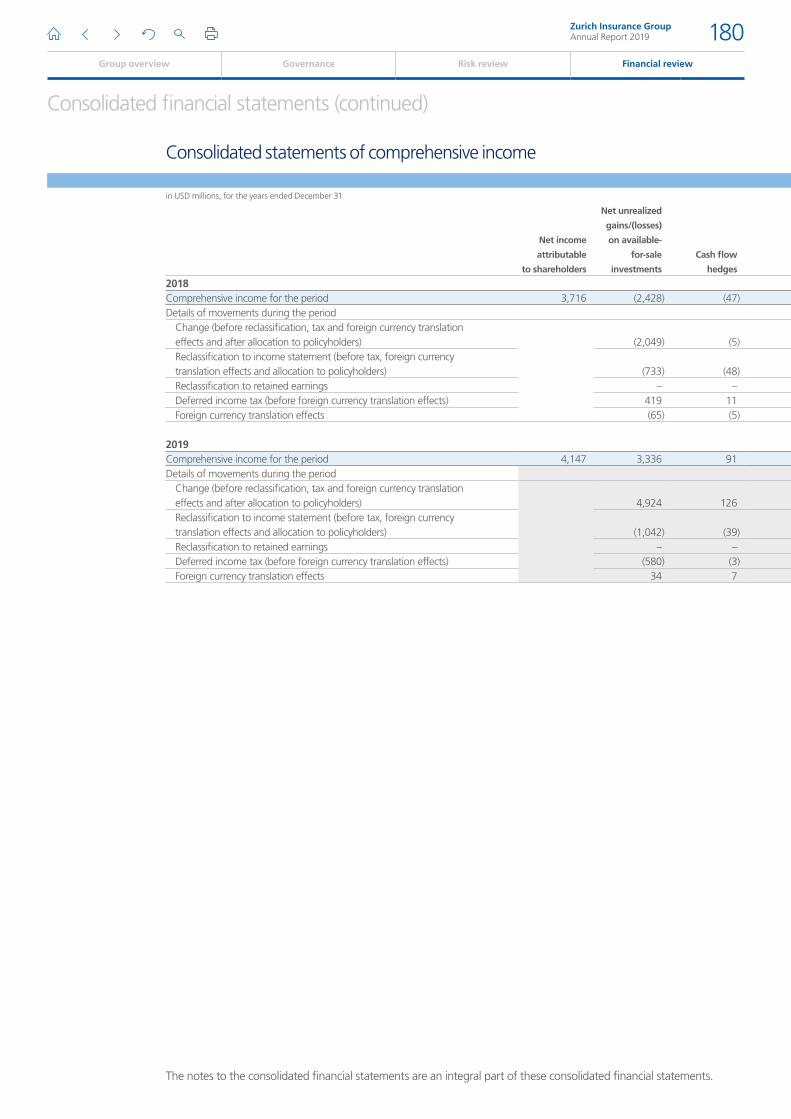
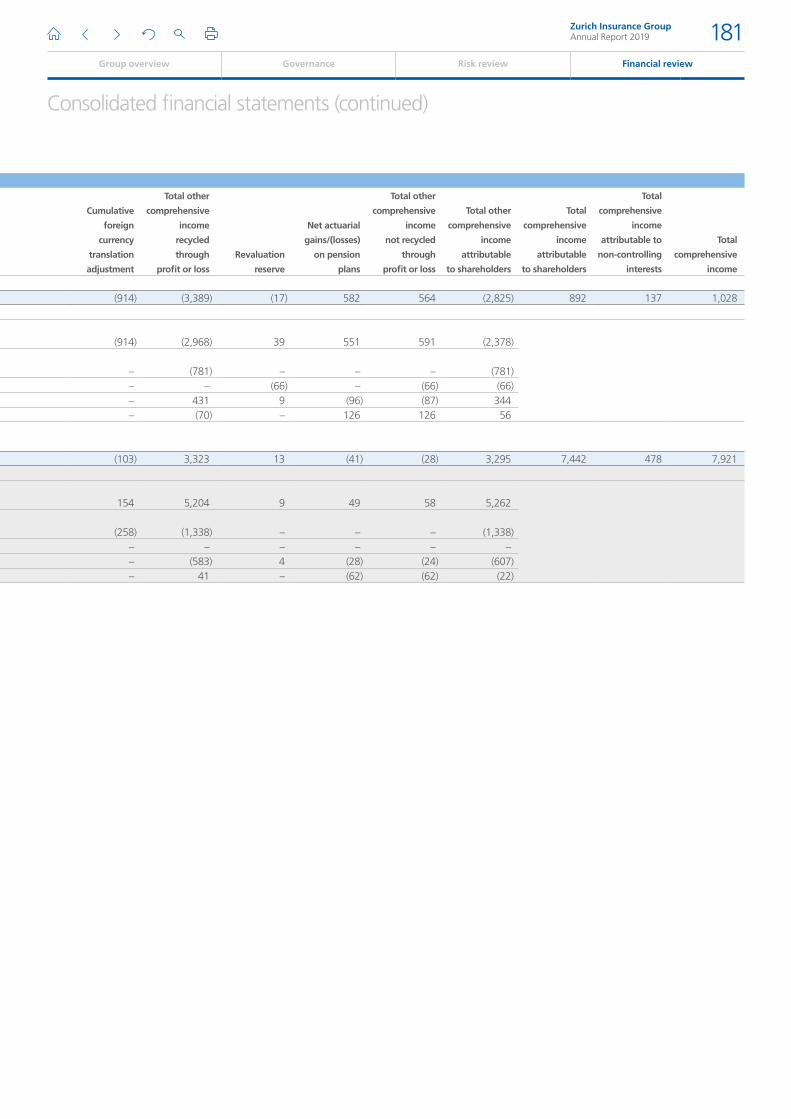
Consolidated statements of comprehensive income
in USD millions, for the years ended December 31
Net income
attributable
to shareholders
Net unrealized
gains/(losses)
on available-
for-sale
investments
Cash flow
hedges
Cumulative
foreign
currency
translation
adjustment
Total other
comprehensive
income
recycled
through
profit or loss
Revaluation
reserve
Net actuarial
gains/(losses)
on pension
plans
Total other
comprehensive
income
not recycled
through
profit or loss
Total other
comprehensive
income
attributable
to shareholders
Total
comprehensive
income
attributable
to shareholders
Total
comprehensive
income
attributable to
non-controlling
interests
Total
comprehensive
income
2018Comprehensive income for the period 3,716 (2,428) (47) (914) (3,389) (17) 582 564 (2,825) 892 137 1,028Details of movements during the period
Change (before reclassification, tax and foreign currency translation effects and after allocation to policyholders) (2,049) (5) (914) (2,968) 39 551 591 (2,378) Reclassification to income statement (before tax, foreign currency translation effects and allocation to policyholders) (733) (48) – (781) – – – (781) Reclassification to retained earnings – – – – (66) – (66) (66) Deferred income tax (before foreign currency translation effects) 419 11 – 431 9 (96) (87) 344 Foreign currency translation effects (65) (5) – (70) – 126 126 56
2019Comprehensive income for the period 4,147 3,336 91 (103) 3,323 13 (41) (28) 3,295 7,442 478 7,921Details of movements during the period
Change (before reclassification, tax and foreign currency translation effects and after allocation to policyholders) 4,924 126 154 5,204 9 49 58 5,262 Reclassification to income statement (before tax, foreign currency translation effects and allocation to policyholders) (1,042) (39) (258) (1,338) – – – (1,338) Reclassification to retained earnings – – – – – – – – Deferred income tax (before foreign currency translation effects) (580) (3) – (583) 4 (28) (24) (607) Foreign currency translation effects 34 7 – 41 – (62) (62) (22)
Zurich Insurance GroupAnnual Report 2019 180
Group overview Governance Risk review Financial review
Consolidated financial statements (continued)
Consolidated statements of comprehensive income
in USD millions, for the years ended December 31
Net income
attributable
to shareholders
Net unrealized
gains/(losses)
on available-
for-sale
investments
Cash flow
hedges
Cumulative
foreign
currency
translation
adjustment
Total other
comprehensive
income
recycled
through
profit or loss
Revaluation
reserve
Net actuarial
gains/(losses)
on pension
plans
Total other
comprehensive
income
not recycled
through
profit or loss
Total other
comprehensive
income
attributable
to shareholders
Total
comprehensive
income
attributable
to shareholders
Total
comprehensive
income
attributable to
non-controlling
interests
Total
comprehensive
income
2018Comprehensive income for the period 3,716 (2,428) (47) (914) (3,389) (17) 582 564 (2,825) 892 137 1,028Details of movements during the period
Change (before reclassification, tax and foreign currency translation effects and after allocation to policyholders) (2,049) (5) (914) (2,968) 39 551 591 (2,378) Reclassification to income statement (before tax, foreign currency translation effects and allocation to policyholders) (733) (48) – (781) – – – (781) Reclassification to retained earnings – – – – (66) – (66) (66) Deferred income tax (before foreign currency translation effects) 419 11 – 431 9 (96) (87) 344 Foreign currency translation effects (65) (5) – (70) – 126 126 56
2019Comprehensive income for the period 4,147 3,336 91 (103) 3,323 13 (41) (28) 3,295 7,442 478 7,921Details of movements during the period
Change (before reclassification, tax and foreign currency translation effects and after allocation to policyholders) 4,924 126 154 5,204 9 49 58 5,262 Reclassification to income statement (before tax, foreign currency translation effects and allocation to policyholders) (1,042) (39) (258) (1,338) – – – (1,338) Reclassification to retained earnings – – – – – – – – Deferred income tax (before foreign currency translation effects) (580) (3) – (583) 4 (28) (24) (607) Foreign currency translation effects 34 7 – 41 – (62) (62) (22)
Zurich Insurance GroupAnnual Report 2019 181
Group overview Governance Risk review Financial review
Consolidated financial statements (continued)
Consolidated balance sheets
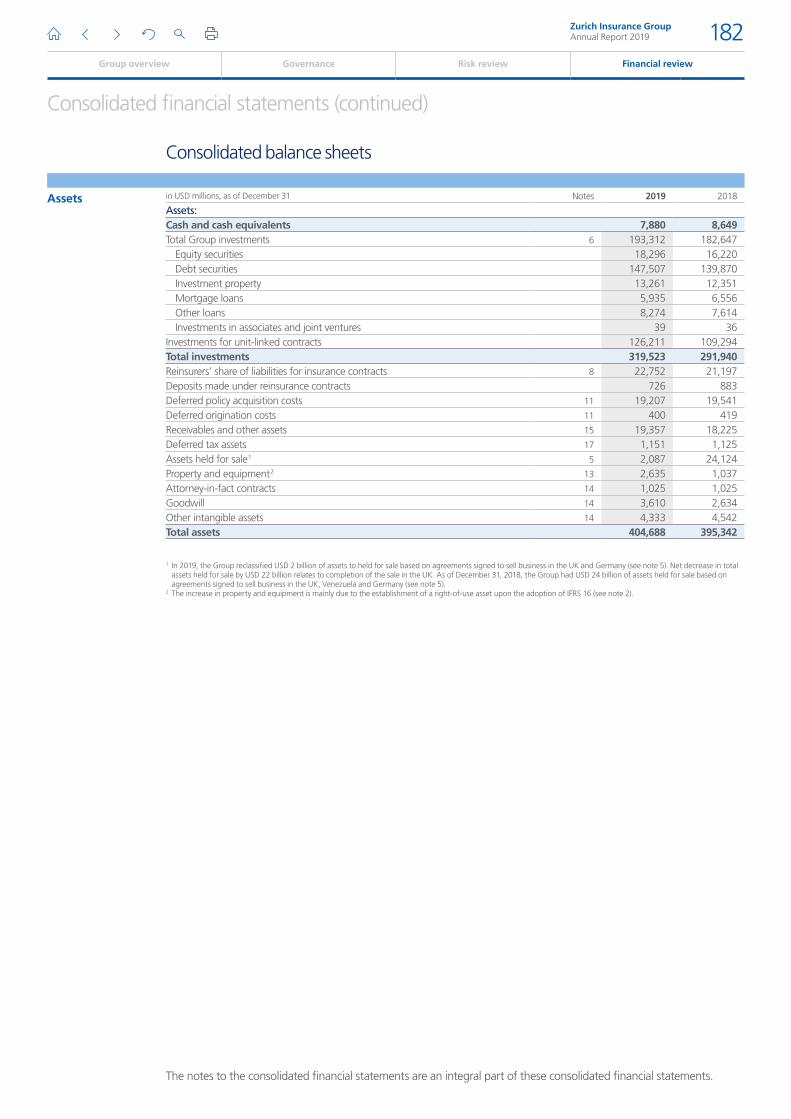
Assets in USD millions, as of December 31 Notes 2019 2018
Assets:Cash and cash equivalents 7,880 8,649Total Group investments 6 193,312 182,647
Equity securities 18,296 16,220Debt securities 147,507 139,870Investment property 13,261 12,351Mortgage loans 5,935 6,556Other loans 8,274 7,614Investments in associates and joint ventures 39 36
Investments for unit-linked contracts 126,211 109,294Total investments 319,523 291,940Reinsurers’ share of liabilities for insurance contracts 8 22,752 21,197Deposits made under reinsurance contracts 726 883Deferred policy acquisition costs 11 19,207 19,541Deferred origination costs 11 400 419Receivables and other assets 15 19,357 18,225Deferred tax assets 17 1,151 1,125Assets held for sale 1 5 2,087 24,124Property and equipment 2 13 2,635 1,037Attorney-in-fact contracts 14 1,025 1,025Goodwill 14 3,610 2,634Other intangible assets 14 4,333 4,542Total assets 404,688 395,342
1 In 2019, the Group reclassified USD 2 billion of assets to held for sale based on agreements signed to sell business in the UK and Germany (see note 5). Net decrease in total assets held for sale by USD 22 billion relates to completion of the sale in the UK. As of December 31, 2018, the Group had USD 24 billion of assets held for sale based on agreements signed to sell business in the UK, Venezuela and Germany (see note 5).
2 The increase in property and equipment is mainly due to the establishment of a right-of-use asset upon the adoption of IFRS 16 (see note 2).
The notes to the consolidated financial statements are an integral part of these consolidated financial statements.
Zurich Insurance GroupAnnual Report 2019 182
Group overview Governance Risk review Financial review
Consolidated financial statements (continued)
Liabilities and equity
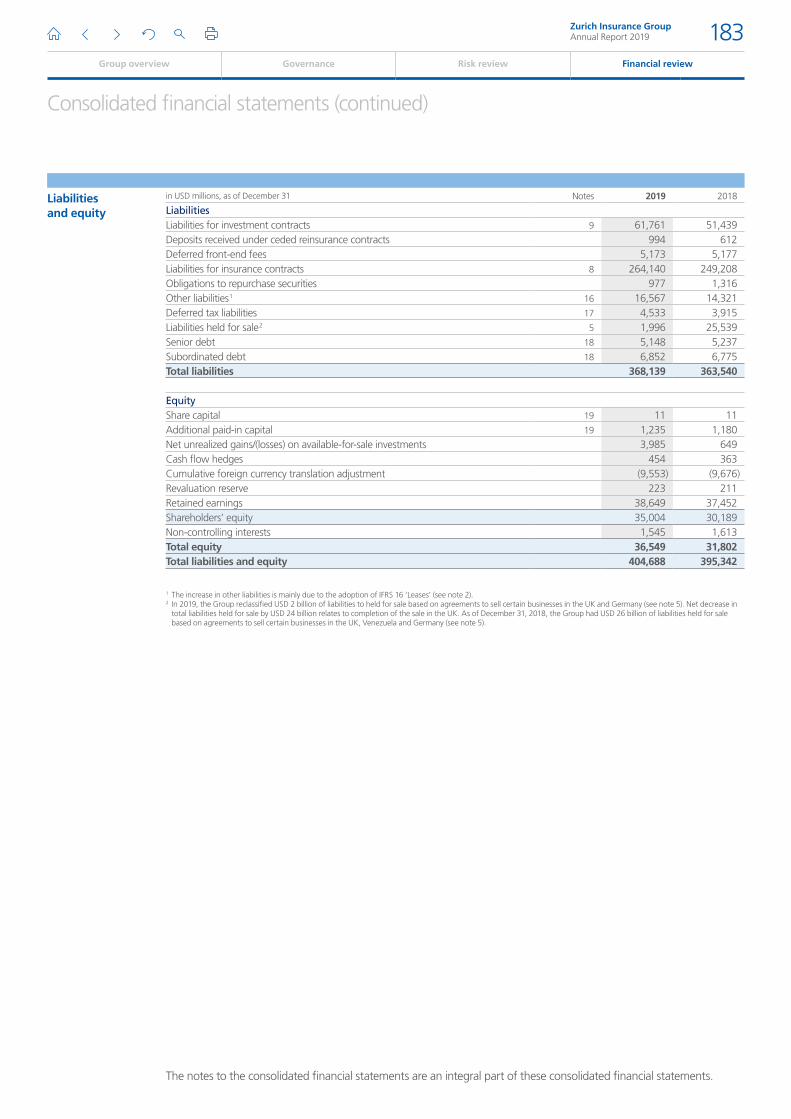
in USD millions, as of December 31 Notes 2019 2018
LiabilitiesLiabilities for investment contracts 9 61,761 51,439Deposits received under ceded reinsurance contracts 994 612Deferred front-end fees 5,173 5,177Liabilities for insurance contracts 8 264,140 249,208Obligations to repurchase securities 977 1,316Other liabilities 1 16 16,567 14,321Deferred tax liabilities 17 4,533 3,915Liabilities held for sale 2 5 1,996 25,539Senior debt 18 5,148 5,237Subordinated debt 18 6,852 6,775Total liabilities 368,139 363,540
EquityShare capital 19 11 11Additional paid-in capital 19 1,235 1,180Net unrealized gains/(losses) on available-for-sale investments 3,985 649Cash flow hedges 454 363Cumulative foreign currency translation adjustment (9,553) (9,676)Revaluation reserve 223 211Retained earnings 38,649 37,452Shareholders’ equity 35,004 30,189Non-controlling interests 1,545 1,613Total equity 36,549 31,802Total liabilities and equity 404,688 395,342
1 The increase in other liabilities is mainly due to the adoption of IFRS 16 ‘Leases’ (see note 2). 2 In 2019, the Group reclassified USD 2 billion of liabilities to held for sale based on agreements to sell certain businesses in the UK and Germany (see note 5). Net decrease in
total liabilities held for sale by USD 24 billion relates to completion of the sale in the UK. As of December 31, 2018, the Group had USD 26 billion of liabilities held for sale based on agreements to sell certain businesses in the UK, Venezuela and Germany (see note 5).
The notes to the consolidated financial statements are an integral part of these consolidated financial statements.
Zurich Insurance GroupAnnual Report 2019 183
Group overview Governance Risk review Financial review
Consolidated financial statements (continued)
Consolidated statements of cash flows
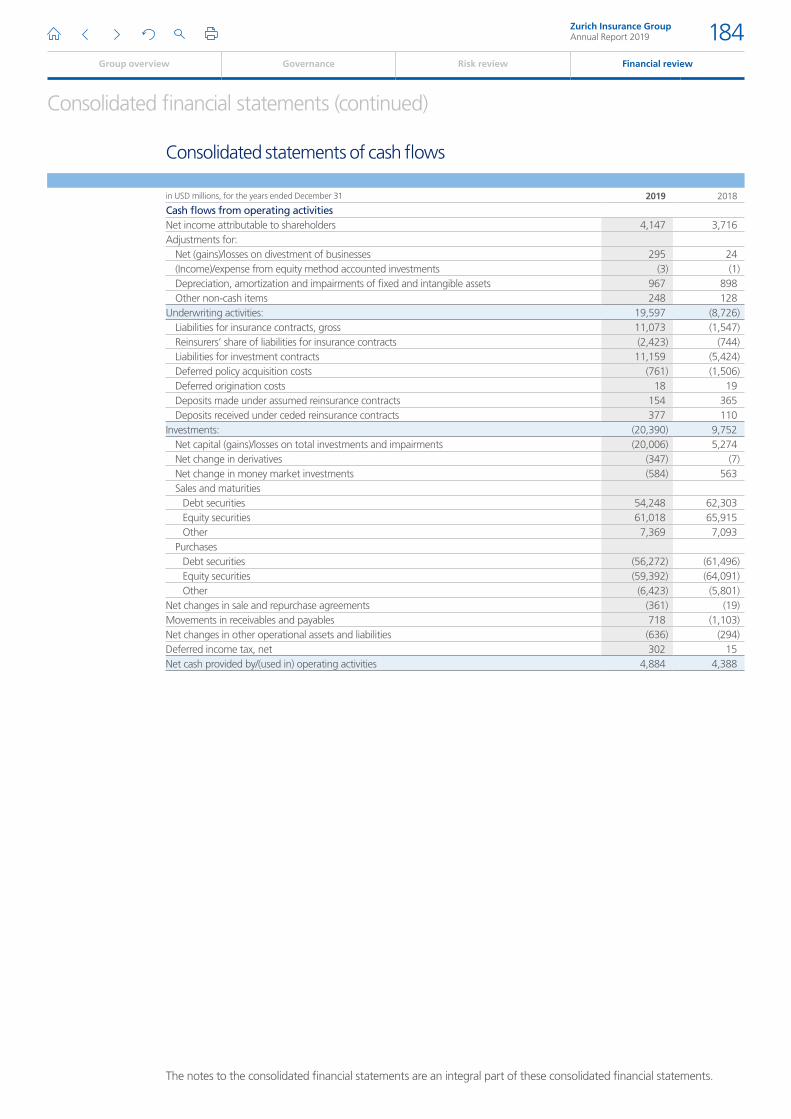
in USD millions, for the years ended December 31 2019 2018
Cash flows from operating activitiesNet income attributable to shareholders 4,147 3,716Adjustments for:
Net (gains)/losses on divestment of businesses 295 24(Income)/expense from equity method accounted investments (3) (1)Depreciation, amortization and impairments of fixed and intangible assets 967 898Other non-cash items 248 128
Underwriting activities: 19,597 (8,726)Liabilities for insurance contracts, gross 11,073 (1,547)Reinsurers’ share of liabilities for insurance contracts (2,423) (744)Liabilities for investment contracts 11,159 (5,424)Deferred policy acquisition costs (761) (1,506)Deferred origination costs 18 19Deposits made under assumed reinsurance contracts 154 365Deposits received under ceded reinsurance contracts 377 110
Investments: (20,390) 9,752Net capital (gains)/losses on total investments and impairments (20,006) 5,274Net change in derivatives (347) (7)Net change in money market investments (584) 563Sales and maturities
Debt securities 54,248 62,303Equity securities 61,018 65,915Other 7,369 7,093
PurchasesDebt securities (56,272) (61,496)Equity securities (59,392) (64,091)Other (6,423) (5,801)
Net changes in sale and repurchase agreements (361) (19)Movements in receivables and payables 718 (1,103)Net changes in other operational assets and liabilities (636) (294)Deferred income tax, net 302 15Net cash provided by/(used in) operating activities 4,884 4,388
The notes to the consolidated financial statements are an integral part of these consolidated financial statements.
Zurich Insurance GroupAnnual Report 2019 184
Group overview Governance Risk review Financial review
Consolidated financial statements (continued)
in USD millions, for the years ended December 31 2019 2018
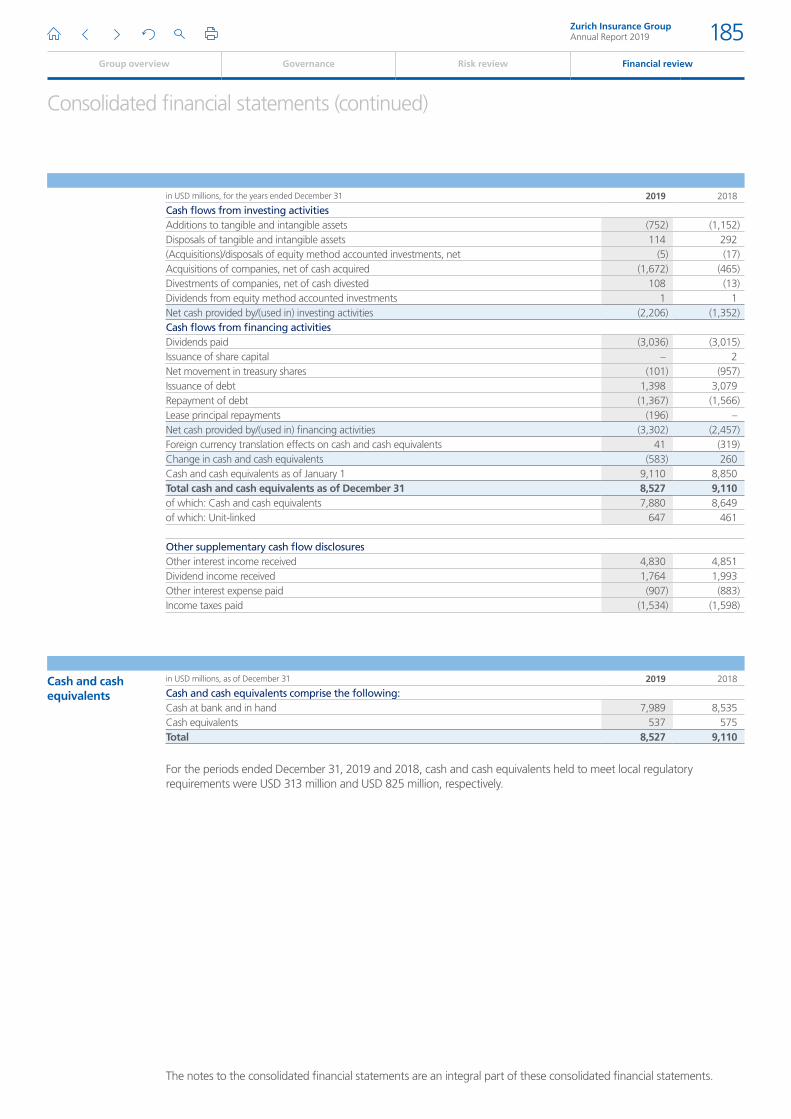
Cash flows from investing activitiesAdditions to tangible and intangible assets (752) (1,152)Disposals of tangible and intangible assets 114 292(Acquisitions)/disposals of equity method accounted investments, net (5) (17)Acquisitions of companies, net of cash acquired (1,672) (465)Divestments of companies, net of cash divested 108 (13)Dividends from equity method accounted investments 1 1Net cash provided by/(used in) investing activities (2,206) (1,352)Cash flows from financing activitiesDividends paid (3,036) (3,015)Issuance of share capital – 2Net movement in treasury shares (101) (957)Issuance of debt 1,398 3,079Repayment of debt (1,367) (1,566)Lease principal repayments (196) –Net cash provided by/(used in) financing activities (3,302) (2,457)Foreign currency translation effects on cash and cash equivalents 41 (319)Change in cash and cash equivalents (583) 260Cash and cash equivalents as of January 1 9,110 8,850Total cash and cash equivalents as of December 31 8,527 9,110of which: Cash and cash equivalents 7,880 8,649of which: Unit-linked 647 461
Other supplementary cash flow disclosuresOther interest income received 4,830 4,851Dividend income received 1,764 1,993Other interest expense paid (907) (883)Income taxes paid (1,534) (1,598)
Cash and cash equivalents
in USD millions, as of December 31 2019 2018
Cash and cash equivalents comprise the following:Cash at bank and in hand 7,989 8,535Cash equivalents 537 575Total 8,527 9,110
For the periods ended December 31, 2019 and 2018, cash and cash equivalents held to meet local regulatory requirements were USD 313 million and USD 825 million, respectively.
The notes to the consolidated financial statements are an integral part of these consolidated financial statements.
Zurich Insurance GroupAnnual Report 2019 185
Group overview Governance Risk review Financial review
Consolidated financial statements (continued)
Consolidated statements of changes in equity
in USD millions
Share capital
Additional
paid-in
capital
Net unrealized
gains/(losses)
on available-
for-sale
investments
Cash flow
hedges
Cumulative
foreign
currency
translation
adjustment
Revaluation
reserve
Retained
earnings
Shareholders’
equity
Non-
controlling
interests
Total
equity
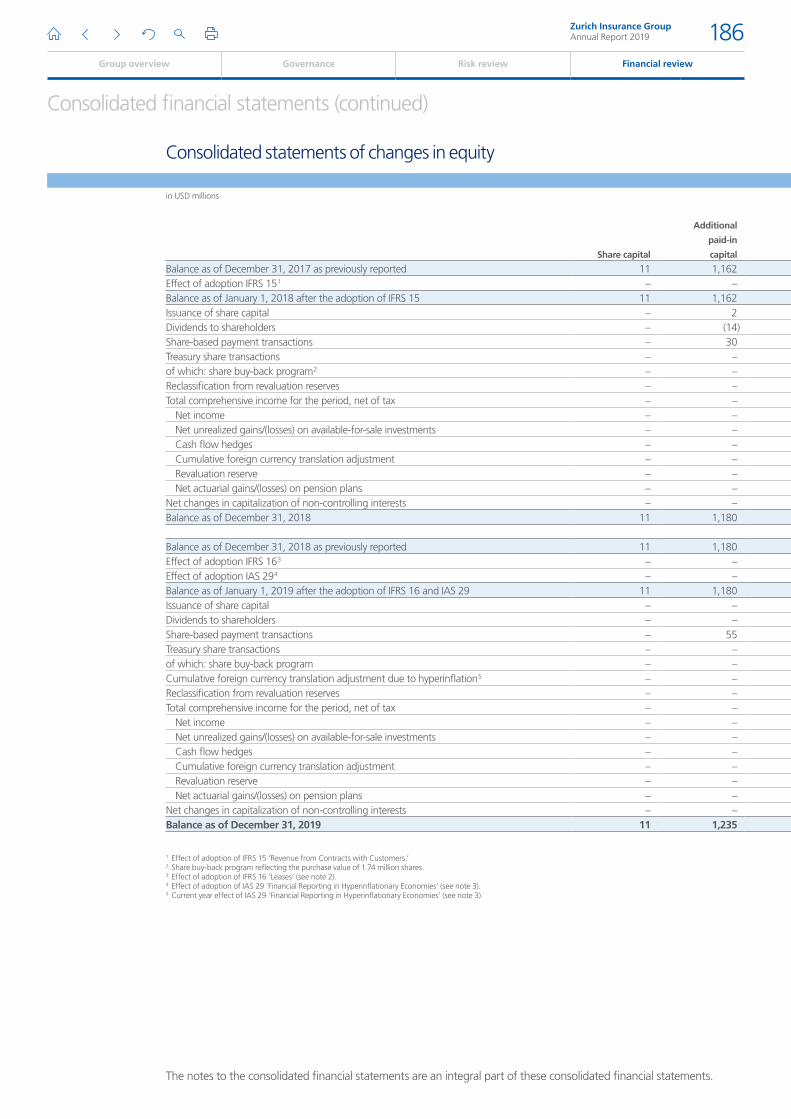
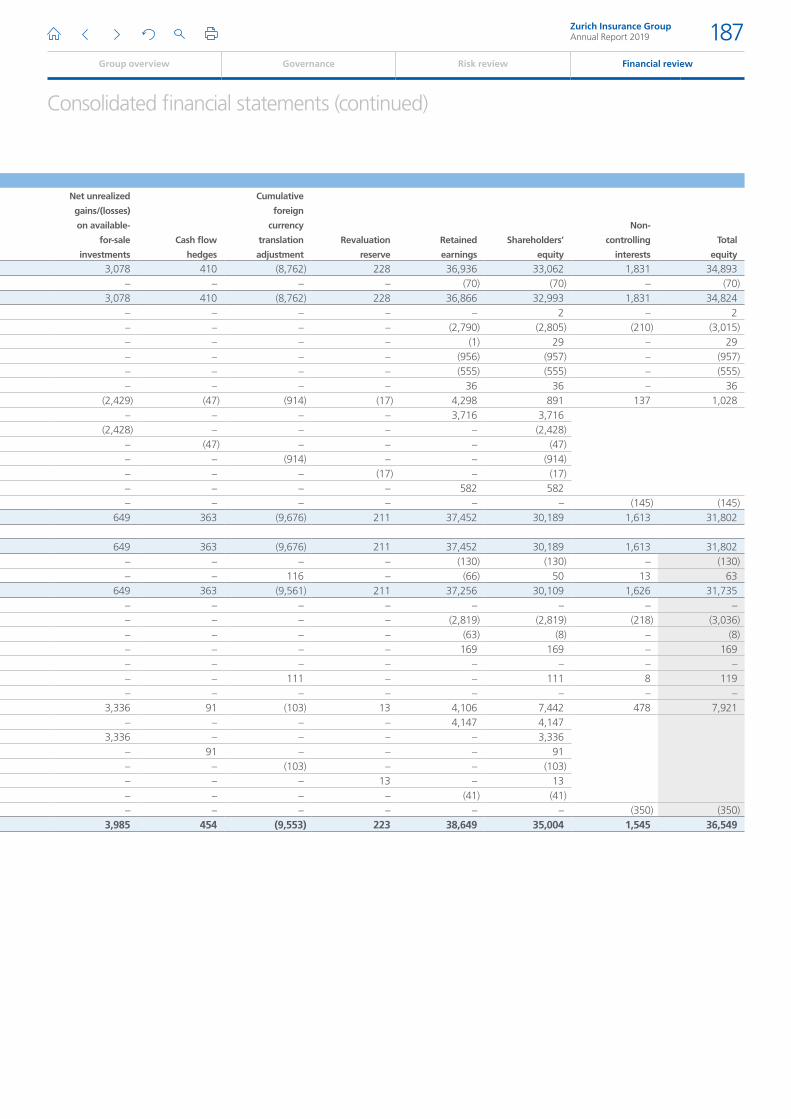
Balance as of December 31, 2017 as previously reported 11 1,162 3,078 410 (8,762) 228 36,936 33,062 1,831 34,893Effect of adoption IFRS 15 1 – – – – – – (70) (70) – (70)Balance as of January 1, 2018 after the adoption of IFRS 15 11 1,162 3,078 410 (8,762) 228 36,866 32,993 1,831 34,824Issuance of share capital – 2 – – – – – 2 – 2Dividends to shareholders – (14) – – – – (2,790) (2,805) (210) (3,015)Share-based payment transactions – 30 – – – – (1) 29 – 29Treasury share transactions – – – – – – (956) (957) – (957)of which: share buy-back program 2 – – – – – – (555) (555) – (555)Reclassification from revaluation reserves – – – – – – 36 36 – 36Total comprehensive income for the period, net of tax – – (2,429) (47) (914) (17) 4,298 891 137 1,028
Net income – – – – – – 3,716 3,716 Net unrealized gains/(losses) on available-for-sale investments – – (2,428) – – – – (2,428) Cash flow hedges – – – (47) – – – (47) Cumulative foreign currency translation adjustment – – – – (914) – – (914) Revaluation reserve – – – – – (17) – (17) Net actuarial gains/(losses) on pension plans – – – – – – 582 582
Net changes in capitalization of non-controlling interests – – – – – – – – (145) (145)Balance as of December 31, 2018 11 1,180 649 363 (9,676) 211 37,452 30,189 1,613 31,802
Balance as of December 31, 2018 as previously reported 11 1,180 649 363 (9,676) 211 37,452 30,189 1,613 31,802Effect of adoption IFRS 16 3 – – – – – – (130) (130) – (130)Effect of adoption IAS 29 4 – – – – 116 – (66) 50 13 63Balance as of January 1, 2019 after the adoption of IFRS 16 and IAS 29 11 1,180 649 363 (9,561) 211 37,256 30,109 1,626 31,735Issuance of share capital – – – – – – – – – –Dividends to shareholders – – – – – – (2,819) (2,819) (218) (3,036)Share-based payment transactions – 55 – – – – (63) (8) – (8)Treasury share transactions – – – – – – 169 169 – 169of which: share buy-back program – – – – – – – – – –Cumulative foreign currency translation adjustment due to hyperinflation 5 – – – – 111 – – 111 8 119Reclassification from revaluation reserves – – – – – – – – – –Total comprehensive income for the period, net of tax – – 3,336 91 (103) 13 4,106 7,442 478 7,921
Net income – – – – – – 4,147 4,147 Net unrealized gains/(losses) on available-for-sale investments – – 3,336 – – – – 3,336 Cash flow hedges – – – 91 – – – 91 Cumulative foreign currency translation adjustment – – – – (103) – – (103) Revaluation reserve – – – – – 13 – 13 Net actuarial gains/(losses) on pension plans – – – – – – (41) (41)
Net changes in capitalization of non-controlling interests – – – – – – – – (350) (350)Balance as of December 31, 2019 11 1,235 3,985 454 (9,553) 223 38,649 35,004 1,545 36,549
1 Effect of adoption of IFRS 15 ’Revenue from Contracts with Customers.’2 Share buy-back program reflecting the purchase value of 1.74 million shares.3 Effect of adoption of IFRS 16 ’Leases’ (see note 2).4 Effect of adoption of IAS 29 ’Financial Reporting in Hyperinflationary Economies’ (see note 3).5 Current year effect of IAS 29 ’Financial Reporting in Hyperinflationary Economies’ (see note 3).
The notes to the consolidated financial statements are an integral part of these consolidated financial statements.
Zurich Insurance GroupAnnual Report 2019 186
Group overview Governance Risk review Financial review
Consolidated financial statements (continued)
Consolidated statements of changes in equity
in USD millions
Share capital
Additional
paid-in
capital
Net unrealized
gains/(losses)
on available-
for-sale
investments
Cash flow
hedges
Cumulative
foreign
currency
translation
adjustment
Revaluation
reserve
Retained
earnings
Shareholders’
equity
Non-
controlling
interests
Total
equity
Balance as of December 31, 2017 as previously reported 11 1,162 3,078 410 (8,762) 228 36,936 33,062 1,831 34,893Effect of adoption IFRS 15 1 – – – – – – (70) (70) – (70)Balance as of January 1, 2018 after the adoption of IFRS 15 11 1,162 3,078 410 (8,762) 228 36,866 32,993 1,831 34,824Issuance of share capital – 2 – – – – – 2 – 2Dividends to shareholders – (14) – – – – (2,790) (2,805) (210) (3,015)Share-based payment transactions – 30 – – – – (1) 29 – 29Treasury share transactions – – – – – – (956) (957) – (957)of which: share buy-back program 2 – – – – – – (555) (555) – (555)Reclassification from revaluation reserves – – – – – – 36 36 – 36Total comprehensive income for the period, net of tax – – (2,429) (47) (914) (17) 4,298 891 137 1,028
Net income – – – – – – 3,716 3,716 Net unrealized gains/(losses) on available-for-sale investments – – (2,428) – – – – (2,428) Cash flow hedges – – – (47) – – – (47) Cumulative foreign currency translation adjustment – – – – (914) – – (914) Revaluation reserve – – – – – (17) – (17) Net actuarial gains/(losses) on pension plans – – – – – – 582 582
Net changes in capitalization of non-controlling interests – – – – – – – – (145) (145)Balance as of December 31, 2018 11 1,180 649 363 (9,676) 211 37,452 30,189 1,613 31,802
Balance as of December 31, 2018 as previously reported 11 1,180 649 363 (9,676) 211 37,452 30,189 1,613 31,802Effect of adoption IFRS 16 3 – – – – – – (130) (130) – (130)Effect of adoption IAS 29 4 – – – – 116 – (66) 50 13 63Balance as of January 1, 2019 after the adoption of IFRS 16 and IAS 29 11 1,180 649 363 (9,561) 211 37,256 30,109 1,626 31,735Issuance of share capital – – – – – – – – – –Dividends to shareholders – – – – – – (2,819) (2,819) (218) (3,036)Share-based payment transactions – 55 – – – – (63) (8) – (8)Treasury share transactions – – – – – – 169 169 – 169of which: share buy-back program – – – – – – – – – –Cumulative foreign currency translation adjustment due to hyperinflation 5 – – – – 111 – – 111 8 119Reclassification from revaluation reserves – – – – – – – – – –Total comprehensive income for the period, net of tax – – 3,336 91 (103) 13 4,106 7,442 478 7,921
Net income – – – – – – 4,147 4,147 Net unrealized gains/(losses) on available-for-sale investments – – 3,336 – – – – 3,336 Cash flow hedges – – – 91 – – – 91 Cumulative foreign currency translation adjustment – – – – (103) – – (103) Revaluation reserve – – – – – 13 – 13 Net actuarial gains/(losses) on pension plans – – – – – – (41) (41)
Net changes in capitalization of non-controlling interests – – – – – – – – (350) (350)Balance as of December 31, 2019 11 1,235 3,985 454 (9,553) 223 38,649 35,004 1,545 36,549
1 Effect of adoption of IFRS 15 ’Revenue from Contracts with Customers.’2 Share buy-back program reflecting the purchase value of 1.74 million shares.3 Effect of adoption of IFRS 16 ’Leases’ (see note 2).4 Effect of adoption of IAS 29 ’Financial Reporting in Hyperinflationary Economies’ (see note 3).5 Current year effect of IAS 29 ’Financial Reporting in Hyperinflationary Economies’ (see note 3).
Zurich Insurance GroupAnnual Report 2019 187
Group overview Governance Risk review Financial review
Consolidated financial statements (continued)
Zurich Insurance Group Ltd and its subsidiaries (collectively the Group) is a provider of insurance products and related services. The Group operates in Europe, Middle East & Africa (EMEA), North America, Latin America and Asia Pacific through subsidiaries, as well as branch and representative offices.
Zurich Insurance Group Ltd, a Swiss corporation, is the holding company of the Group and its shares are listed on the SIX Swiss Exchange. Zurich Insurance Group Ltd was incorporated on April 26, 2000, in Zurich, Switzerland. It is recorded in the Commercial Register of the Canton of Zurich under its registered address at Mythenquai 2, 8002 Zurich.
On February 12, 2020, the Board of Directors of Zurich Insurance Group Ltd authorized these consolidated financial statements for issue. These financial statements will be submitted for approval to the Annual General Meeting of Shareholders to be held on April 1, 2020.
1. Basis of presentation
General informationThe consolidated financial statements of the Group have been prepared in accordance with International Financial Reporting Standards (IFRS) and comply with Swiss law. Where IFRS does not contain clear guidance governing the accounting treatment of certain transactions, including those that are specific to insurance and reinsurance products, IFRS permits reference to another comprehensive body of accounting principles that uses a similar conceptual framework. The Group’s accounting policies for insurance and reinsurance contracts are therefore based on those developed by the Group before the adoption of IFRS 4 in areas where IFRS 4 did not include specific requirements. Before the adoption of IFRS 4, the Group typically applied U.S. GAAP pronouncements issued by the Financial Accounting Standards Board (FASB) on insurance and reinsurance contracts. Any changes to such pronouncements subsequent to this adoption are not reflected in the Group’s accounting policies. In case of business combinations, the Group may decide to maintain the local statutory treatment if this does not distort the fair presentation of the financial position of the Group. If significant, the impact of such cases would be described elsewhere in the notes to these consolidated financial statements.
The accounting policies applied by the reportable segments are the same as those applied by the Group. The Group accounts for inter-segment revenues and transfers as if the transactions were with third parties at current market prices. Dividends, realized capital gains and losses as well as gains and losses on the transfer of net assets are eliminated within the segment, whereas all other intercompany gains and losses are eliminated at Group level. In the consolidated financial statements, inter-segment revenues and transfers are eliminated.
Disclosures under IFRS 4 ‘Insurance Contracts’ and IFRS 7 ‘Financial Instruments: Disclosures’ relating to the nature and extent of risks, and capital disclosures under IAS 1 ‘Presentation of Financial Statements’ have been included in the audited sections of the risk review on pages 129 to 157, and they form an integral part of the consolidated financial statements.
The Group’s consolidated balance sheets are not presented using a current/non-current classification. The following balances are generally considered to be current: cash and cash equivalents, deferred policy acquisition costs on property & casualty contracts, receivables, reserve for premium refunds and obligations to repurchase securities.
The following balances are generally considered to be non-current: equity securities, investment property, investments in associates and joint ventures, deferred policy acquisition costs on life insurance contracts, deferred tax assets, property and equipment, goodwill, other intangible assets and deferred tax liabilities.
The following balances are mixed in nature (including both current and non-current portions): debt securities, mortgage loans, other loans, reinsurers’ share of liabilities for insurance contracts, deposits made under assumed reinsurance contracts, deferred origination costs, other assets, reserves and investments for unit-linked contracts, liabilities for investment contracts, deposits received under ceded reinsurance contracts, deferred front-end fees, reserves for losses and loss adjustment expenses, reserves for unearned premiums, future life policyholder benefits, policyholder contract deposits and other funds, other liabilities, senior and subordinated debt, and assets and liabilities held for sale.
Maturity tables have been provided for the following balances: debt securities (table 6.4), derivative assets and derivative liabilities (tables 7.1 and 7.2), reserves for insurance contracts (tables 8.9a and 8.9b), liabilities for investment contracts (tables 9.3a and 9.3b), finance lease receivables (table 13.6), other financial liabilities (table 16.2), lease liabilities (table 16.3) and outstanding debt (table 18.2).
Zurich Insurance GroupAnnual Report 2019 188
Group overview Governance Risk review Financial review
Consolidated financial statements (continued)
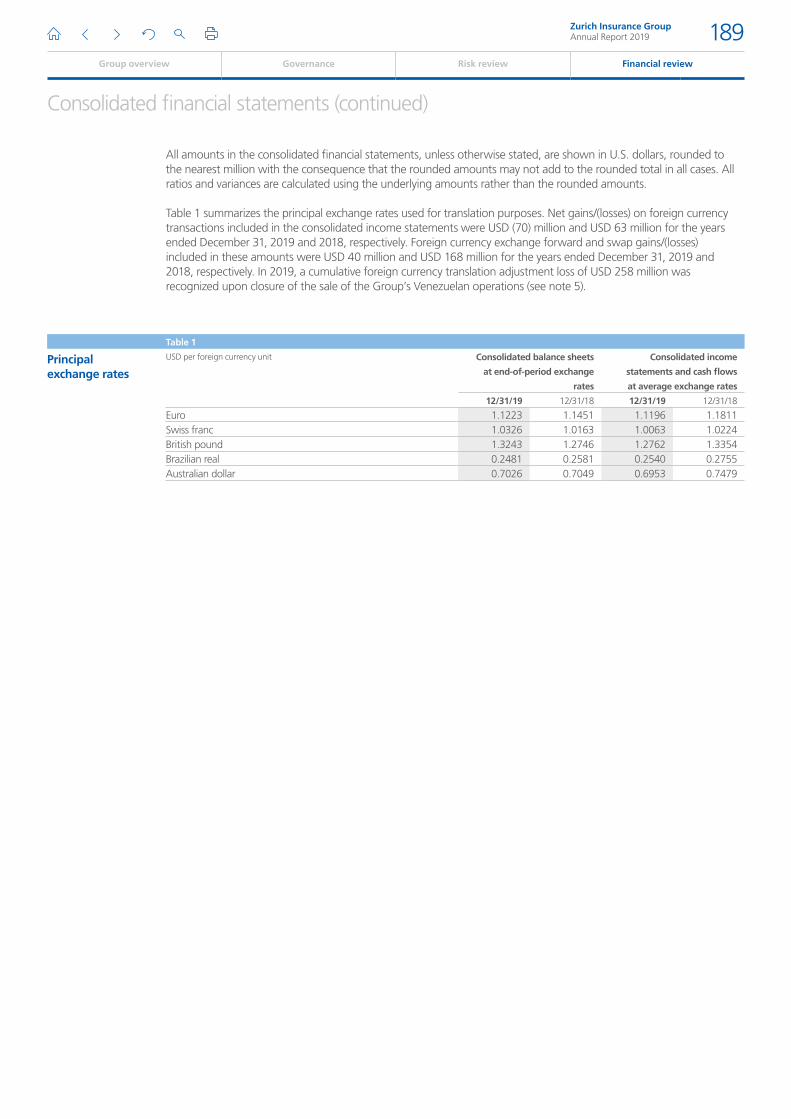
All amounts in the consolidated financial statements, unless otherwise stated, are shown in U.S. dollars, rounded to the nearest million with the consequence that the rounded amounts may not add to the rounded total in all cases. All ratios and variances are calculated using the underlying amounts rather than the rounded amounts.
Table 1 summarizes the principal exchange rates used for translation purposes. Net gains/(losses) on foreign currency transactions included in the consolidated income statements were USD (70) million and USD 63 million for the years ended December 31, 2019 and 2018, respectively. Foreign currency exchange forward and swap gains/(losses) included in these amounts were USD 40 million and USD 168 million for the years ended December 31, 2019 and 2018, respectively. In 2019, a cumulative foreign currency translation adjustment loss of USD 258 million was recognized upon closure of the sale of the Group’s Venezuelan operations (see note 5).
Table 1
Principal exchange rates
USD per foreign currency unit Consolidated balance sheets
at end-of-period exchange
rates
Consolidated income
statements and cash flows
at average exchange rates
12/31/19 12/31/18 12/31/19 12/31/18
Euro 1.1223 1.1451 1.1196 1.1811Swiss franc 1.0326 1.0163 1.0063 1.0224British pound 1.3243 1.2746 1.2762 1.3354Brazilian real 0.2481 0.2581 0.2540 0.2755Australian dollar 0.7026 0.7049 0.6953 0.7479
Zurich Insurance GroupAnnual Report 2019 189
Group overview Governance Risk review Financial review
Consolidated financial statements (continued)
2. New accounting standards and amendments to published accounting standards
Standards, amendments and interpretations effective or early-adopted as of January 1, 2019 and relevant for the Group’s operationsTable 2.1 shows new accounting standards or amendments to and interpretations of standards relevant to the Group that have been implemented for the financial year beginning January 1, 2019. The impact of applying IFRS 16 ‘Leases’ is disclosed below. The other standards/interpretation have no material impact on the Group’s financial position or performance and have been applied prospectively to transactions occurring in the current financial year.
Table 2.1
Standard/ Interpretation
Effective date
New standards/interpretationsIFRS 16 Leases January 1, 2019IFRIC 23 Uncertainty over Income Tax Treatments January 1, 2019Amended standardsIAS 19 Plan Amendment, Curtailment or Settlement January 1, 2019IAS 28 Long-term Interests in Associates and Joint Ventures January 1, 2019
IFRS 16 ‘Leases’IFRS 16 introduces new requirements for lease accounting which have an impact on contracts where the Group acts as a lessee (and intermediate lessor). Under IFRS 16, the Group recognized a right-of-use asset and a lease liability for real estate rental contracts which were mainly classified as operating leases under IAS 17 ‘Leases.’
The Group adopted IFRS 16 on January 1, 2019. As permitted by the transitional provisions of IFRS 16, the Group elected to apply the modified retrospective approach and has not restated comparative figures. The adoption of IFRS 16 resulted in an increase in total assets of USD 1.4 billion and total liabilities of USD 1.5 billion. The cumulative effect of USD 130 million net of tax resulting from the measurement of the right-of-use assets on a retrospective basis was recognized as a decrease in opening retained earnings. For leases previously classified as a finance lease, the carrying amounts were not adjusted on transition to IFRS 16.
The Group applied the following practical expedients permitted on transition to IFRS 16 where the Group acts as a lessee in a lease previously classified as an operating lease:
33 No reassessment whether a contract is, or contains, a lease;
33 Reliance on previous assessments on whether a lease contract is onerous;
33 Scope exemption for operating leases with a remaining lease term of less than 12 months as at January 1, 2019;
33 Exclusion of initial direct costs for the measurement of the right-of-use asset;
33 Use of hindsight in assessing whether the Group is reasonably certain to exercise an option to extend or terminate a lease.
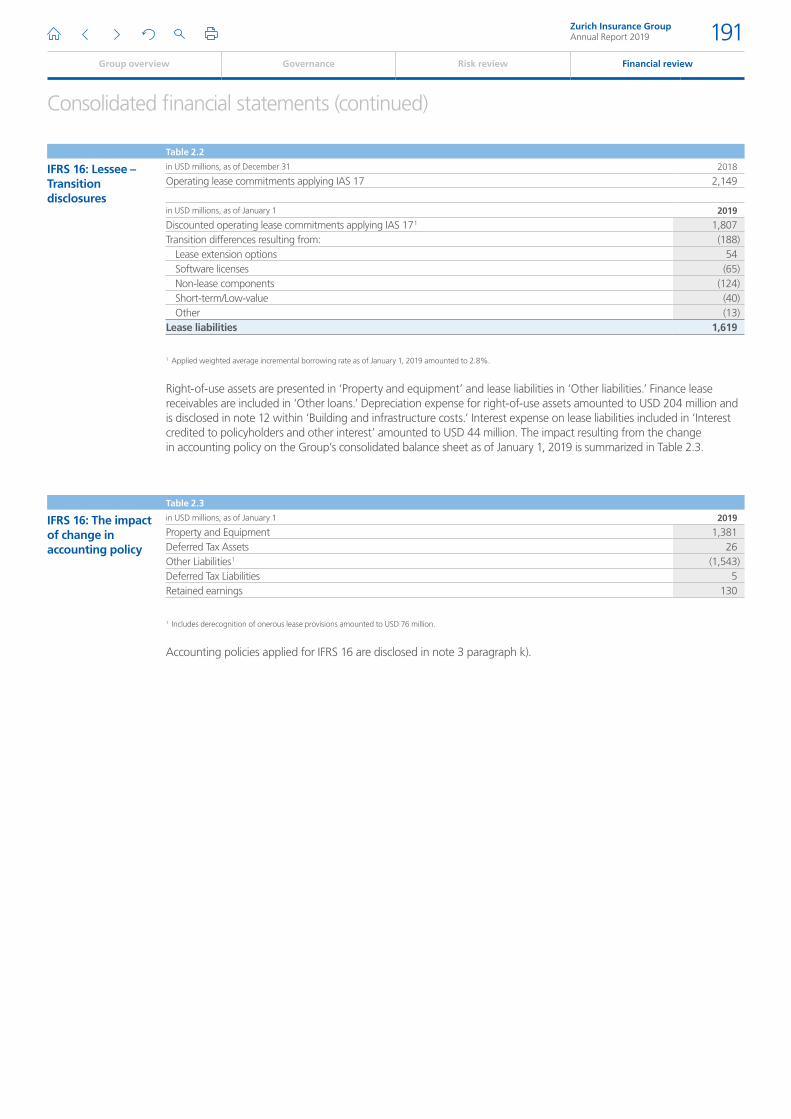
The Table 2.2 reconciles the operating lease obligations as of December 31, 2018 to the opening lease liabilities recognized as of January 1, 2019:
Zurich Insurance GroupAnnual Report 2019 190
Group overview Governance Risk review Financial review
Consolidated financial statements (continued)
Table 2.2
IFRS 16: Lessee – Transition disclosures
in USD millions, as of December 31 2018
Operating lease commitments applying IAS 17 2,149
in USD millions, as of January 1 2019
Discounted operating lease commitments applying IAS 17 1 1,807Transition differences resulting from: (188)
Lease extension options 54Software licenses (65)Non-lease components (124)Short-term/Low-value (40)Other (13)
Lease liabilities 1,619
1 Applied weighted average incremental borrowing rate as of January 1, 2019 amounted to 2.8%.
Right-of-use assets are presented in ‘Property and equipment’ and lease liabilities in ‘Other liabilities.’ Finance lease receivables are included in ‘Other loans.’ Depreciation expense for right-of-use assets amounted to USD 204 million and is disclosed in note 12 within ‘Building and infrastructure costs.’ Interest expense on lease liabilities included in ‘Interest credited to policyholders and other interest’ amounted to USD 44 million. The impact resulting from the change in accounting policy on the Group’s consolidated balance sheet as of January 1, 2019 is summarized in Table 2.3.
Table 2.3
IFRS 16: The impact of change in accounting policy
in USD millions, as of January 1 2019
Property and Equipment 1,381Deferred Tax Assets 26Other Liabilities 1 (1,543)Deferred Tax Liabilities 5Retained earnings 130
1 Includes derecognition of onerous lease provisions amounted to USD 76 million.
Accounting policies applied for IFRS 16 are disclosed in note 3 paragraph k).
Zurich Insurance GroupAnnual Report 2019 191
Group overview Governance Risk review Financial review
Consolidated financial statements (continued)
Standards, amendments and interpretations issued that are not yet effective or adopted by the GroupTable 2.4 shows new accounting standards or amendments to and interpretations of standards relevant to the Group, which are not yet effective or adopted by the Group.
Table 2.4
Standard/ Interpretation
Effective date
New standards/interpretationsIFRS 9 Financial Instruments January 1, 2021IFRS 17 Insurance Contracts January 1, 2021Amended standardsIFRS 3 Definition of a Business January 1, 2020IAS 1/IAS 8 Definition of Material January 1, 2020IFRS 9 Prepayment Features with Negative Compensation January 1, 2021
IFRS 17 ‘Insurance contracts’ and IFRS 9 ‘Financial Instruments’IFRS 17 ‘Insurance contracts’ was published on May 18, 2017 with an effective date of January 1, 2021 (retrospective application). IFRS 17 provides comprehensive guidance on accounting for insurance contracts and investment contracts with discretionary participation features. For non-life and short-term life insurance contracts IFRS 17 introduces mandatory discounting of loss reserves as well as a risk adjustment for non-financial risk, for which confidence level equivalent disclosure will be required. Further, IFRS 17 will change the presentation of insurance contract revenue, as gross written premium will no longer be presented in the statements of comprehensive income.
For long-duration life insurance contracts, IFRS 17 is expected to have a significant impact on actuarial modeling as granular cash flow projections and regular updates of all assumptions will be required resulting in either profit or loss volatility or affecting ‘contractual service margin,’ a separate component of the insurance liability representing unearned profits from in-force contracts. Further, IFRS 17 introduces different measurement approaches for the insurance contract liabilities reflecting a different extent of policyholder participation in investment or insurance entity performance (non-participating, indirect participating, direct participating).
In September 2016, the IASB issued an amendment to IFRS 4 introducing a temporary exemption from the adoption of IFRS 9 for reporting entities that have not previously applied any version of IFRS 9 and whose activities are predominantly related to insurance. Based on the analysis performed as of December 31, 2015, the Group was eligible to apply the temporary exemption as the predominance ratio reflecting the share of liabilities connected with insurance to total liabilities exceeded 90 percent. No reassessment of eligibility was required during subsequent annual periods up to and including 2019 as there was no significant change in the activities performed by the Group. We refer to the Annual Report 2016 for further details on the eligibility assessment. Due to the strong interaction between underlying assets held and the measurement of participating insurance contracts, the Group decided to use the option to defer the full implementation of IFRS 9 until IFRS 17 becomes effective.
Under IFRS 9, all equity securities and fund investments, and more debt instruments will be measured at fair value through profit or loss because the characteristics of the contractual cash flows from such instruments are not solely payments of principal and interest on the principal amount outstanding. Furthermore, credit allowances for financial assets carried at amortized cost and debt securities measured at fair value, with changes in fair value recognized in other comprehensive income (OCI), are expected to increase due to the introduction of the expected credit loss methodology. Though overall profit or loss volatility is expected to increase under IFRS 9, the measurement approach for direct participating contracts in IFRS 17 allows such volatility to be largely absorbed in the measurement of insurance liabilities with an option to reflect in shareholders’ equity (OCI) the effect of any asset-liability mismatch. For further information on effects from IFRS 9 see note 24.
In order to adopt IFRS 17 in the consolidated financial statements, a joint IFRS 17 and IFRS 9 Group Implementation Program (Program) sponsored by the Group Chief Financial Officer has been operating since 2017. A steering committee comprised of senior management from various functions (Finance, Risk, IT, Operations and Investment Management) oversees the work performed by individual work streams.
Zurich Insurance GroupAnnual Report 2019 192
Group overview Governance Risk review Financial review
Consolidated financial statements (continued)
A dedicated methodology work stream covers group accounting policies, actuarial methodologies and disclosure requirements to be consistently implemented throughout the Group. This work stream further contributes to the industry wide discussions on standard interpretation and its operational effects and closely monitors the developments in the IASB Transition Resource Group for IFRS 17 to evaluate the effects and align the accounting policies and actuarial methodologies accordingly. The implementation work stream drives the analysis of processes, data and systems implications which have revealed implementation challenges. In 2019, considerable progress was made in finalizing the core development of the target solution landscape at Group and local levels which concluded with the successful completion of dry-run simulations. In 2020, the focus of the Program will be on finalizing the implementation efforts, analyzing the effects from IFRS 17 on the consolidated financial statements and education of key stakeholders.
In June 2019, the IASB issued an Exposure Draft with limited amendments to IFRS 17, including a proposal to defer by one year, to January 1, 2022, the effective date of IFRS 17 and the fixed expiry date for the temporary exemption in IFRS 4 from applying IFRS 9, so that both standards can be applied simultaneously. The Group completed the analysis of the proposed amendments and will closely monitor the IASB re-deliberations while continuing Program delivery according to the current implementation plan.
The Group is currently assessing the impact of the application of both IFRS 17 and IFRS 9. As of December 31, 2019, it was not practicable to quantify what the potential impact would be on the Group’s financial position or performance once these standards are adopted.
Other standards, amendments and interpretations shown in table 2.4 are expected to have no or an insignificant impact on the Group’s financial position or performance.
Zurich Insurance GroupAnnual Report 2019 193
Group overview Governance Risk review Financial review
Consolidated financial statements (continued)
3. Summary of significant accounting policies
Significant accounting policies applied in these consolidated financial statements are set out below. These policies have been consistently applied to all years presented unless otherwise stated. Other accounting policies are presented as part of the respective note disclosures.
a) Consolidation principlesThe Group’s consolidated financial statements include the assets, liabilities, equity, revenues, expenses and cash flows of Zurich Insurance Group Ltd and its subsidiaries. A subsidiary is an entity that Zurich Insurance Group Ltd either directly or indirectly controls. The results of subsidiaries acquired are included in the consolidated financial statements from the date of acquisition. The results of subsidiaries that have been divested during the year are included up to the date control ceased. All intra-Group balances, profits and transactions are eliminated.
Changes in ownership interests in a subsidiary that do not result in a change in control are recorded within equity.
Non-controlling interests are shown separately in equity, consolidated income statements, consolidated statements of comprehensive income and consolidated statements of changes in equity.
The consolidated financial statements are prepared as of December 31 based on individual company financial statements at the same date. In some cases, information is included with a time lag of up to three months. The consequent effect on the Group’s consolidated financial statements is not material.
b) Foreign currency translation and transactionsForeign currency translationDue to the Group’s economic exposure to the U.S. dollar (USD), the presentation currency of the Group’s consolidated financial statements is USD. Many Group companies have a different functional currency, being that of the respective primary economic environment in which these companies operate. Assets and liabilities are translated into the presentation currency at end-of-period exchange rates, while income statements and statements of cash flows are translated at average exchange rates for the period. The resulting foreign currency translation differences are recorded directly in other comprehensive income (OCI) as cumulative translation adjustment (CTA).
Foreign currency transactions and balancesForeign currency transactions are translated into the functional currency using the spot exchange rate at the date of the transaction or, for practical reasons, a weighted average rate, if exchange rates do not fluctuate significantly. Foreign currency monetary items and foreign currency non-monetary items that are carried at fair value are translated at end-of-period exchange rates. The resulting foreign currency translation differences are recorded in income, except for the following:
33 Foreign currency translation differences that are recognized in OCI in conjunction with the recognition of unrealized gains or losses on available-for-sale investments; and
33 Foreign currency translation differences arising on monetary items that form part of net investments in foreign operations, as well as foreign currency translation differences arising from monetary items that are designated as hedging instruments in a qualifying net investment hedge relationship, are included directly in OCI as CTA.
HyperinflationThe Group considers various factors to determine whether an economy in a country where a foreign operation is situated is hyperinflationary, including the cumulative three-year inflation rate. If an economy becomes hyperinflationary, the financial statements of foreign operations with the functional currency of the hyperinflationary economy are restated to reflect the current purchasing power at the end of the reporting period using the official consumer price indices commonly used in the respective country. The restatement includes all balance sheet amounts that are not expressed in terms of the measuring unit current at the balance sheet date and items of comprehensive income for the current year by applying the change in the price index from the dates when the items of income and expense were originally recorded. The restated financial statements of a foreign operation are translated into the Group’s presentation currency at closing rates. Any translation adjustment resulting from initial application of the hyperinflationary accounting is recognized directly in equity.
c) Insurance contracts and investment contracts with discretionary participating features (DPF)ClassificationContracts issued that transfer significant insurance risk to the Group and obligations arising from investment contracts with DPF are accounted for as insurance contracts.
Zurich Insurance GroupAnnual Report 2019 194
Group overview Governance Risk review Financial review
Consolidated financial statements (continued)
The Group also issues products containing embedded options that entitle the policyholder to switch all or part of the current and future invested funds into another product issued by the Group. Where this results in the reclassification of an investment product to a product that meets the definition of an insurance contract, the previously held reserve and the related deferred origination costs are reclassified and are accounted for in accordance with the accounting policy that is to be applied to the new product on a prospective basis. As a consequence, no gain or loss is recognized when a contract is reclassified from an investment to an insurance contract.
Once a contract has been classified as an insurance contract, no reclassification can subsequently be made.
PremiumsProperty & CasualtyPremiums from the sale of property & casualty products are generally recorded when written and are recognized as revenue in relation to the insurance coverage provided. The unearned premium reserve represents the portion of the premiums written related to the unexpired coverage period.
Life insurancePremiums from traditional life insurance contracts, including participating contracts and annuity policies with life contingencies, are recognized as revenue when they are due from the policyholder. For single premium and limited pay contracts, premiums are recognized as revenue when due, with any excess profit deferred and recognized in income in a constant relationship to the insurance in-force or, for annuities, the amount of expected benefit payments.
Amounts collected as premiums from investment-type insurance contracts such as universal life, unit-linked and unitized with-profits contracts are generally reported as deposits. Revenue from these contracts consists of policy fees for the cost of insurance, administration and surrenders during the period. Front-end fees charged to the customer at inception, particularly for single premium contracts, are deferred and recognized over the estimated life of the contracts following the same pattern that is applied to deferred acquisition costs and addressed below. Regular fees charged to the customer periodically (monthly, quarterly or annually) either directly or by making a deduction from invested funds are billed in advance and recognized on a straight-line basis over the period in which the service is rendered. Fees charged at the end of the period are accrued over the service period as a receivable and are offset against the financial liability when charged to the customer.
Cash flows from certain universal life-type contracts in the Group’s Spanish operations are recognized as gross written premiums and insurance benefits and losses and not as deposits.
Reserves for losses and loss adjustment expensesLosses and loss adjustment expenses are charged to income as incurred. Reserves for losses and loss adjustment expenses represent estimates of future payments of reported and unreported claims for losses and related expenses, with respect to insured events that have occurred. Any changes in estimates are reflected in the results of operations in the period in which estimates are changed. The Group does not discount its loss reserves, other than for claims with payment patterns which are fixed and reasonably determinable, and claims in economies determined to be hyperinflationary where inflation constitutes a significant input in the reserving process.
Reserves for life benefitsFuture life policyholder benefits represent the estimated future benefit liability for traditional life insurance policies and include the value of accumulated declared bonuses or dividends that have vested to policyholders.
The reserves for life benefits for participating traditional life insurance policies are calculated using a net level premium valuation method based on actuarial assumptions taking into account guaranteed mortality benefits and interest rates.
The reserves for life benefits for other traditional life insurance policies are calculated using a net level premium valuation method based on actuarial assumptions including mortality, persistency, expenses and investment return, plus a margin for adverse deviations. These assumptions are locked in at inception and are regularly assessed as part of the liability adequacy testing over the period of the contract.
Policyholder contract deposits represent the estimated policy benefits for investment type insurance contracts invested in non-unit-linked funds. This liability comprises the accumulation of premiums received, less charges, plus declared policyholder dividends.
Certain insurance contracts and investment contracts with DPF offered by the Group contain benefit features for which the amount and timing of declaration and payment are at the discretion of the Group. Where that discretion has not been exercised, the total amount expected to be allocated to policyholders as required by local insurance regulation or contractual provisions is included in the policyholder other funds.
Zurich Insurance GroupAnnual Report 2019 195
Group overview Governance Risk review Financial review
Consolidated financial statements (continued)
Unrealized gains or losses arising on the revaluation of available-for-sale assets are recorded directly in OCI in accordance with the Group’s accounting policy for such assets. Where these assets are related to life insurance, corresponding adjustments to the reserves for life benefits and related assets are also recognized directly in OCI.
Reserves for unit-linked contracts are based on the fair value of the financial instruments backing those contracts less any fees and assessments charged to the policyholders. The related assets for unit-linked insurance contracts are designated at fair value through profit or loss in order to reduce measurement inconsistencies.
For products containing guarantees in respect of minimum death benefits (GMDB), retirement income benefits (GRIB) and/or annuitization options (GAO), additional liabilities are recorded in proportion to the receipt of the contracted revenues which are subject to a loss adequacy test taking into account policyholder behavior and current market conditions.
For products managed on a dynamic basis, an option in IFRS 4 is used to measure insurance liabilities using current financial and non-financial assumptions to better reflect the way that these products are managed. Financial assets related to these liabilities are designated at fair value through profit or loss.
Deferred acquisition costs (DAC)Costs that vary with and are directly related to the acquisition of new and renewal business, including for example commissions and certain underwriting and policy issue expenses, are deferred and subsequently amortized over a defined period. Such costs are presented on balance sheet net of commissions paid to reinsurers in respect of business ceded.
Property & CasualtyDAC for property & casualty contracts is amortized over the period in which the related premiums are earned.
Life insuranceDAC for traditional participating life insurance contracts is amortized based on estimated gross margins expected to be realized over the life of the contract. Estimated gross margins are updated for actual and anticipated future experience and discounted using the latest revised interest rate for the remaining benefit period. Resulting deviations are reflected in income.
DAC for other traditional life insurance and annuity contracts is amortized over the life of the contracts, based on expected premiums. Expected premiums are estimated at the date of policy issue for application throughout the life of the contract unless a premium deficiency subsequently occurs.
DAC for investment type insurance contracts such as universal life, unit-linked and unitized with-profits contracts is amortized based on estimated gross profits expected to be realized over the life of the contract. Estimated gross profits are updated for actual and anticipated future experience and discounted using either the interest rate in effect at the inception of the contracts or the latest revised interest rate for the remaining benefit period, depending on whether crediting is based on the policyholder’s or on the reporting entity’s investment performance. Resulting deviations are reflected in income.
Unamortized DAC for life insurance contracts accrues interest at a rate consistent with the related assumptions for reserves.
For traditional participating and investment-type life insurance contracts, DAC is adjusted for the impact of unrealized gains/(losses) on allocated investments that are recorded in OCI.
Liability adequacy testsLiability adequacy tests are performed annually for groupings of contracts determined in accordance with the Group’s manner of acquiring, servicing and measuring the profitability of its insurance contracts.
Property & CasualtyFor property & casualty contracts, unearned premiums are tested to determine whether they are sufficient to cover related expected losses, loss adjustment expenses, policyholder dividends, unamortized DAC and maintenance expenses, using current assumptions and considering anticipated investment returns. If a premium deficiency is identified, the DAC asset for the respective grouping of contracts is written down by the amount of the deficiency. If, after writing down the DAC asset to nil, a premium deficiency still exists for the respective grouping of contracts, then a premium deficiency reserve is established for the amount of the remaining deficiency.
Zurich Insurance GroupAnnual Report 2019 196
Group overview Governance Risk review Financial review
Consolidated financial statements (continued)
Life insuranceFor life insurance contracts, the carrying amount of the existing reserve for life benefits, including any deferred front-end fees, reduced by the unamortized balance of DAC or present value of future profits of acquired insurance contracts (PVFP), is compared with the reserve for life benefits, calculated using revised assumptions for actual and anticipated experience as of the valuation date. If a deficiency is identified, the DAC or PVFP for the respective grouping of contracts is written down by the amount of the deficiency. If, after writing down the DAC or PVFP to nil, a deficiency still exists for the respective grouping of contracts, the reserve for life benefits is increased by the amount of the remaining deficiency.
ReinsuranceThe Group’s insurance subsidiaries cede risk in the normal course of business to limit the potential for losses arising from certain exposures. Reinsurance does not relieve the originating insurer of its liability. Certain Group insurance companies assume reinsurance business as part of their normal business.
Reinsurance contracts that do not transfer significant insurance risk are accounted for using the deposit method.
A deposit asset or liability is recognized based on the premium paid, or received less any explicitly identified premiums or fees to be retained by the ceding company. Interest on deposits is accounted for using the effective interest rate method. Future cash flows are estimated to calculate the effective yield, and revenues and expenses are recorded as interest income or expense. Reinsurance deposit assets or liabilities also include funds deposited or held by the Group under assumed or ceded reinsurance contracts, respectively, when funds are retained by the reinsured under the terms of the contract.
Reinsurance is recorded gross in the consolidated balance sheet. Reinsurance assets include balances expected to be recovered from reinsurance companies for ceded paid and unpaid losses and loss adjustment expenses, ceded unearned premiums and ceded future life policy benefits. Amounts recoverable from reinsurers are estimated in a manner consistent with the assumptions used for the liabilities associated with the underlying insurance contracts.
Reinsurance assets are assessed for impairment on a regular basis and impairment losses, if any, are recorded in the same manner as for loans and receivables.
d) Liabilities for investment contracts (without DPF)Investment contracts are those contracts that do not transfer significant insurance risk. The Group issues investment contracts without fixed terms (unit-linked) and investment contracts with fixed and guaranteed terms (fixed interest rate).
Unit-linked investment contractsThese represent portfolios maintained to meet the specific investment objectives of policyholders who bear the credit, market and liquidity risks related to the investments. The liabilities are carried at fair value, which is determined by reference to the underlying financial assets. Changes in fair value are recorded in income. The related assets for unit-linked investment contracts are designated at fair value through profit or loss in order to reduce measurement inconsistencies.
The services provided by the Group under such contracts are investment management and policy administration services that are provided over time and are not contingent on meeting specified performance criteria. Fees from such services are recognized ratably over the service period as policy fee revenue except where such fees are charged in connection with contract origination in which case such fees are recognized as contract liabilities (included within deferred front-end fees). The costs to fulfill over time services are generally recognized as incurred, except the costs of acquiring new investment contracts with investment management services, such as commissions and other incremental expenses directly related to the issuance of each new contract. Such fees enhance the resources that will be used to satisfy future performance obligations and – to the extent recoverable – are capitalized as contract assets (deferred origination costs; DOC) and amortized in line with the revenue generated by providing investment management services. Refer to note 11 for further information.
Investment contracts at amortized costLiabilities for investment contracts with fixed and guaranteed terms are measured at amortized cost using the effective interest rate method. Transaction costs are included in the calculation of the effective yield. As of each reporting date, the Group re-estimates the expected future cash flows and re-calculates the carrying amount of the financial liability by computing the present value of estimated future cash flows using the original effective interest rate for the financial liability. Any adjustment is immediately recognized in income.
Zurich Insurance GroupAnnual Report 2019 197
Group overview Governance Risk review Financial review
Consolidated financial statements (continued)
e) Group investments excluding derivative financial instrumentsGroup investments are accounted for at either (a) fair value through OCI; (b) fair value through profit or loss; or (c) amortized cost.
The majority of Group investments are accounted for at fair value through OCI (available-for-sale financial assets) and include debt and equity securities as well as fund investments. Such assets are carried at fair value, with changes in fair value recognized in OCI, until the securities are either sold or impaired. Interest income determined using the effective interest method and dividend income from financial assets at fair value through OCI is included in net investment income. The cumulative unrealized gains or losses recorded in OCI are net of cumulative deferred income taxes, certain related life policyholder liabilities and deferred acquisition costs. When available-for-sale financial assets are sold, impaired or otherwise disposed of, the cumulative gains or losses are reclassified from OCI to income as net capital gains/(losses) on investments and impairments.
Group investments at fair value through profit or loss include debt and equity securities backing certain life insurance contracts with participation features, and financial assets evaluated on a fair value basis. The designation of these assets at fair value through profit or loss eliminates or significantly reduces a measurement inconsistency that would otherwise arise from measuring assets or recognizing the gains and losses on these assets on a different basis to the liabilities.
Group investments at amortized cost include debt securities for which the Group has the positive intention and ability to hold to maturity (held-to-maturity financial assets) as well as mortgage and other loans (loans and receivables). Such investments are carried at amortized cost using the effective interest rate method, less any charges for impairment. When an impairment is determined to have occurred, the carrying amount of held-to-maturity investments and loans and receivables is reduced through the use of an allowance account, and the movement in the impairment allowance is recognized in income as an impairment loss.
The Group recognizes regular purchases and sales of financial assets on the trade date, which is the date on which the Group commits to purchase or sell the asset.
Realized and unrealized gains and losses arising from changes in the fair value are recognized in income, within net capital gains/(losses) on investments and impairments, in the period in which they arise. Interest income determined using the effective interest method and dividend income from financial assets at fair value through profit or loss is included in net investment income.
Group investments include investment property accounted for at fair value through profit or loss. Rental income from investment property is recognized on a straight-line basis over the lease term and included in net investment income along with rental operating expenses for investment property recognized on an accrual basis.
Group investments include the following in cash and cash equivalents: cash on hand, deposits held at call with banks, cash collateral received, and other highly liquid investments with maturities of three months or less from the date of acquisition that are readily convertible into cash and are subject to an insignificant risk of change in fair value. Cash and cash equivalents are stated at current redemption value.
Impairment of financial assetsThe Group assesses at each reporting date whether there is objective evidence that loss events have occurred that negatively affect the estimated future cash flows of a financial asset or a group of financial assets. The evaluation of whether a financial asset is impaired requires significant judgment (see note 4).
f) Derivative financial instruments and hedge accountingDerivative financial instruments, except those designated under a qualifying cash flow or net investment hedge relationship, are carried at fair value on the balance sheet with changes in fair value recognized in income.
Derivative financial instruments that qualify for hedge accountingDerivative financial instruments are used by the Group to economically hedge risks. In limited circumstances derivative financial instruments are designated as hedging instruments for accounting purposes in:
33 Fair value hedges which are hedges of the exposure to changes in the fair value of a recognized asset or liability
33 Cash flow hedges, which are hedges of the exposure to variability in cash flows attributable to a particular risk either associated with a recognized asset or liability, or a highly probable forecast transaction that could affect profit or loss
33 Net investment hedges, which are hedges of a net investment in a foreign operation
Zurich Insurance GroupAnnual Report 2019 198
Group overview Governance Risk review Financial review
Consolidated financial statements (continued)
All hedge relationships are formally documented, including the risk management objectives and strategy for undertaking the hedge. At inception of a hedge and on an ongoing basis, the hedge relationship is formally assessed to determine whether the hedging instruments are expected to be (prospective assessment) and have been (retrospective assessment) highly effective in offsetting changes in fair values or cash flows of hedged items attributable to the hedged risk. If the qualifying criteria for the application of hedge accounting are no longer met, the hedge relationship is discontinued prospectively, in which case the hedging instrument and the hedged item are then subsequently reported independently in accordance with the respective accounting policy.
The accounting treatment of a qualifying hedge relationship is further described in note 7.
g) Attorney-in-fact (AIF) contractsThe AIF contracts reflect the ability of the Group to generate future revenues through Farmers Group Inc. (FGI) based on the FGI’s relationship with the Farmers Exchanges. The Farmers Exchanges are not owned by FGI, a wholly owned subsidiary of the Group. In determining that these relationships have an indefinite useful life, the Group took into consideration the organizational structure of inter-insurance exchanges, under which subscribers exchange contracts with each other and appoint an attorney-in-fact to provide non-claims services, and the historical AIF relationship between FGI and the Farmers Exchanges. The value of the AIF contracts is tested for impairment at least annually.
The services provided by FGI under such contracts are non-claims services including risk selection, preparation and mailing of policy documents and invoices, premium collection, management of the investment portfolios and certain other administrative functions. The multiple performance obligations covered by the consideration received are considered to be a series with the same pattern of transfer, therefore, the performance obligations are not separated. The revenue for the services provided includes Farmers management fee, membership fees and revenues for ancillary services. Farmers management fees are determined as a percentage of gross premiums earned by the Farmers Exchanges and recognized ratably over the period the services are provided. Membership fees are one-time fees charged at the time of the policy issuance that do not cover a distinct performance obligation. Such fees are recognized as revenue over the expected life of the customer relationship. The incremental costs incurred in connection with the customer setup activity are recognized as an asset and subsequently amortized using the same pattern as the related revenue. The revenue for ancillary services includes remuneration for services provided that are not covered by Farmers management fees where FGI acts as a principal. Typically, these services are provided over time, so that the revenue is also recognized over time. Refer to note 26 for further information.
h) GoodwillGoodwill on the acquisition of subsidiaries is capitalized and tested for impairment annually, or more frequently if there are indications of impairment. For the purpose of impairment testing, goodwill is allocated to cash-generating units (CGUs) based on the level at which management monitors operations and makes decisions related to the continuation or disposal of assets and operations. If goodwill has been allocated to a CGU and an operation within that unit is disposed of, the carrying amount of the operation includes attributable goodwill when determining the gain or loss on disposal.
i) Intangible assetsAll intangible assets have finite lives and are carried at cost, less accumulated amortization and impairments. Such assets are generally amortized using the straight-line method over their useful lives and reviewed for impairment at least annually, or whenever events or changes in circumstances indicate that the carrying amount may not be recoverable.
Present value of future profits from acquired insurance contracts (PVFP)An intangible asset representing the PVFP arises from the acquisition of life insurance businesses. Such an asset is amortized over the expected life of the acquired contracts, following the same principles as for DAC. The carrying value of the PVFP asset is tested periodically for impairment as part of the liability adequacy test for insurance contracts.
Distribution agreements Distribution agreements may have useful lives extending up to 30 years, estimated based on the period of time over which they are expected to provide economic benefits, but for no longer than the contractual term, after taking into account all economic and legal factors such as stability of the industry, competitive position and the period of control over the assets.
SoftwareCosts associated with research and maintenance of internally-developed computer software are expensed as incurred. Costs incurred during the development phase are capitalized. Software under development is tested for impairment annually.
Zurich Insurance GroupAnnual Report 2019 199
Group overview Governance Risk review Financial review
Consolidated financial statements (continued)
Acquired computer software licenses are capitalized on the basis of the costs incurred to acquire and bring the specific software into use.
The useful lives of computer software licenses and capitalized internal software development costs generally range from three to five years. In limited circumstances, capitalized software development costs may be amortized over a period of up to ten years, taking into account the effects of obsolescence, technology, competition and other economic and legal factors.
j) Employee benefitsShare-based compensation and cash incentive plansThe Group operates long-term incentive plans that are accounted for as equity-settled share-based compensation plans. The fair value of these incentive plans is determined at the grant date and is recognized as an expense in income over the vesting period, with a corresponding increase recorded in additional paid-in capital.
Subsequently, depending on the underlying performance metrics, the Group revises its estimates of the number of shares that are expected to be issued and recognizes the impact of the revision, if any, in income with a corresponding adjustment to additional paid-in capital. However, no subsequent adjustment is made after the vesting date.
Retirement benefitsContributions to defined contribution plans are recorded as an expense in the period in which the economic benefit from the employees’ service was received.
Defined benefit plan obligations and contributions are determined annually by qualified actuaries using the projected unit credit method. The Group’s expense related to these plans is accrued over the employees’ service periods based on the actuarially determined cost for the period. Net interest and service costs are determined using the spot rate approach. Actuarial gains and losses are recognized, in full in the period in which they occur, in OCI. Past service costs, which result from plan amendments and curtailments, are recognized in income when the plan amendment or curtailment occurs (which is the date from which the plan change is irrevocable) and the date on which a constructive obligation arises. Settlement gains or losses are recognized in income when the settlement occurs.
Other post-employment benefitsOther post-employment benefits, such as medical care and life insurance, are also provided for certain employees and are primarily funded internally. Similar to defined benefit plans, the cost of such benefits is accrued over the service period of the employees based on the actuarially determined cost for the period.
k) LeasesThe Group is typically acting as a lessee in property and car or equipment leases. Further, the Group is acting as a lessor in leases of investment property.
When acting as a lessee, under IFRS 16, the Group recognizes a right-of-use asset and a corresponding lease liability at the lease commencement date when the leased asset is available for use by the Group. The lease liability is measured at the present value of the lease payments due over the lease term, discounted using the Group’s incremental borrowing rate. Any options to extend or terminate a lease that the Group is reasonably certain to exercise are included in the lease term. The right-of-use asset is initially recognized at an amount equal to the lease liability adjusted for lease prepayments made or lease incentives received, initial direct costs and any estimated costs to dismantle or restore the leased asset.
The right-of-use asset is depreciated over the shorter of the leased asset’s useful life or the lease term on a straight-line basis. The right-of-use asset is included in ‘Property and equipment’ and disclosed separately in note 13. The carrying amount of the lease liability is increased to reflect the unwinding of the discount so as to produce a constant periodic rate of interest on the remaining balance of the liability for each period and is reduced by the lease payments made during the period. Lease payments include fixed payments and variable payments that depend on a non-leveraged index or a rate. Lease liabilities are included within ‘Other Liabilities.’
The Group records short-term leases and leases of low-value assets as an expense on a straight-line basis over the lease term. Short-term leases are leases with a lease term of 12 months or less. Low-value assets are comprised of hardware and smaller office equipment. The lease expense is included in ‘Administrative and other operating expense.’
Under IAS 17 all operating leases were accounted for off balance sheet with lease expense recognized on a straight-line basis over the lease term. Future payments under the non-cancellable operating leases were disclosed in note 22.
When acting as a lessor of investment property in an operating lease, the Group follows the accounting policy in paragraph e).
Zurich Insurance GroupAnnual Report 2019 200
Group overview Governance Risk review Financial review
Consolidated financial statements (continued)
4. Critical accounting judgments and estimates
The application of certain accounting policies necessitates critical accounting estimates that involve discretionary judgments and the use of assumptions which are susceptible to change due to inherent uncertainties. Because of the uncertainties involved, actual results could differ significantly from the assumptions and estimates made by management. Such critical accounting estimates are of significance to insurance reserves and deferred acquisition costs, the determination of fair value for financial assets and liabilities, impairment charges, deferred taxes and employee benefits.
a) Reserves for insurance contracts and deferred acquisition costsProperty & CasualtyThe Group is required to establish reserves for payment of losses and loss adjustment expenses that arise from the Group’s property & casualty products. These reserves represent the expected ultimate cost to settle claims occurring prior to, but still outstanding as of, the balance sheet date. The Group establishes its reserves by product line, type and extent of coverage and year of occurrence. There are two categories of loss reserve: reserves for reported losses and reserves for incurred but not reported (IBNR) losses. Additionally, reserves are held for loss adjustment expenses, which contain the estimated legal and other expenses expected to be incurred to finalize the settlement of the losses.
The Group’s reserves for reported losses and loss adjustment expenses are based on estimates of future payments to settle reported claims. The Group bases such estimates on the facts available at the time the reserves are established. These reserves are generally established on an undiscounted basis to recognize the estimated costs of bringing pending claims to final settlement. The reserve calculation takes into account inflation, as well as other factors that can influence the amount of reserves required, some of which are subjective and some of which are dependent on future events. In determining the level of reserves, the Group considers historical trends and patterns of loss payments, pending levels of unpaid claims and types of coverage. In addition, court decisions, economic conditions and public attitudes may affect the ultimate cost of settlement and, as a result, the Group’s estimation of reserves. Between the reporting and final settlement of a claim circumstances may change, which may result in changes to established reserves. Items such as changes in law and interpretations of relevant case law, results of litigation, changes in medical costs, as well as costs of vehicle and home repair materials and labor rates can substantially impact ultimate settlement costs. Accordingly, the Group reviews and re-evaluates claims and reserves on a regular basis. Amounts ultimately paid for losses and loss adjustment expenses can vary significantly from the level of reserves originally set.
The Group establishes IBNR reserves, to recognize the estimated cost of losses for events which have already occurred but which have not yet been notified. These reserves are established to recognize the estimated costs required to bring such claims to final settlement. As these losses have not yet been reported, the Group relies upon historical information and statistical models, based on product line, type and extent of coverage, to estimate its IBNR liability. The Group also uses reported claim trends, claim severities, exposure growth, and other factors in estimating its IBNR reserves. These reserves are revised as additional information becomes available and as claims are actually reported.
The time required to learn of and settle claims is an important consideration in establishing the Group’s reserves. Short-tail claims, such as those for motor and property damage, are normally reported soon after the incident and are generally settled within months. Long-tail claims, such as bodily injury, pollution, asbestos and product liability, can take years to develop and additional time to settle. For these claims, information concerning the event, such as the required medical treatment for bodily injury claims and the required measures to clean up pollution, may not be readily available. Accordingly, the reserving analysis of long-tail lines of business is generally more difficult and subject to greater uncertainties than for short-tail claims.
Since the Group does not establish reserves for catastrophes in advance of the occurrence of such events, these events may cause volatility in the levels of its incurred losses and reserves subject to the effects of reinsurance recoveries. This volatility may also be contingent upon political and legal developments after the occurrence of the event.
The Group uses a number of accepted actuarial methods to estimate and evaluate the amount of reserves recorded. The nature of the claim being reserved for and the geographic location of the claim influence the techniques used by the Group’s actuaries. Additionally, the Group’s Corporate Center actuaries perform periodic reserve reviews of the Group’s businesses throughout the world. Management considers the results of these reviews and adjusts its reserves for losses and loss adjustment expenses, where necessary.
Zurich Insurance GroupAnnual Report 2019 201
Group overview Governance Risk review Financial review
Consolidated financial statements (continued)
Life insuranceThe reserves for future life policyholder benefits and policyholder contract deposits and other funds contain a number of assumptions regarding mortality or longevity, lapses, surrenders, expenses, discount rates and investment returns. These assumptions can vary by country, year of policy issuance and product type and are determined with reference to past experience adjusted for new trends, current market conditions and future expectations. As such the liabilities for future life policyholder benefits and policyholder contract deposits may not represent the ultimate amounts paid out to policyholders. For example:
33 The estimated number of deaths determines the value of the benefit payments. The main source of uncertainty arises because of the potential for pandemics and wide-ranging lifestyle changes, such as changes in eating, smoking and exercise habits, which could result in earlier deaths for age groups in which the Group has significant exposure to mortality risk.
33 For contracts that insure the risk of longevity, such as annuity contracts, an appropriate allowance is made for people living longer. Continuing improvements in medical care and social conditions could result in further improvements in longevity in excess of those allowed for in the estimates used to determine the liability for contracts where the Group is exposed to longevity risk.
33 Under certain contracts, the Group has offered product guarantees (or options to take up product guarantees), including fixed minimum interest rate or mortality rate returns. In determining the value of these options and/or benefits, estimates have been made as to the percentage of contract holders that may exercise them. Changes in investment conditions could result in significantly more contract holders exercising their options and/or benefits than has been assumed.
33 Estimates are made as to future investment income arising from the assets backing long-term insurance contracts. These estimates are based on current market returns as well as expectations about future economic and financial developments.
33 Assumptions are determined with reference to current and historical customer data, as well as industry data. Interest rate assumptions reflect expected earnings on the assets supporting the future policyholder benefits. The information used by the Group’s qualified actuaries in setting such assumptions includes, but is not limited to, pricing assumptions, available experience studies and profitability analysis.
Deferred policy acquisition costs and the present value of future profits (PVFP) are recognized on balance sheet only to the extent that they are recoverable from future policy income which also depends on the above assumptions. Recoverability is tested at contract inception and subsequently on a regular basis with reference to current expectations of future profits or margins.
See note 8 for further information on liabilities for insurance contracts and note 11 for deferred policy acquisition costs. Also refer to the insurance risk section of the risk review.
b) Fair value measurementIn determining the fair values of investments in debt and equity instruments traded on exchanges and in over-the-counter (OTC) markets, the Group makes extensive use of independent, reliable and reputable third-party pricing providers and only in rare cases places reliance on valuations that are derived from internal models.
In addition, the Group’s policy is to ensure that independently-sourced prices are developed by making maximum use of current observable market inputs derived from orderly transactions and by employing widely-accepted valuation techniques and models. When third party pricing providers are unable to obtain adequate observable information for a particular financial instrument, the fair value is determined either by requesting selective non-binding broker quotes or by using internal valuation models.
Valuations can be subject to significant judgment, especially when the fair value is determined based on at least one significant unobservable input parameter; such items are classified within level 3 of the fair value hierarchy. See notes 6, 7 and 23 for further information regarding the estimate of fair value.
Zurich Insurance GroupAnnual Report 2019 202
Group overview Governance Risk review Financial review
Consolidated financial statements (continued)
c) Impairment of assets Financial assets A financial asset is considered impaired if there is objective evidence of impairment as a result of one or more occurred loss events that have an impact on the estimated future cash flows of the financial asset.
The evaluation of whether an available-for-sale debt security is impaired requires analysis of the credit standing of a particular issuer and involves management judgment. When assessing impairment of available-for-sale debt securities, the Group places emphasis on issuer specific factors, such as significant financial difficulty, default or delinquency on interest or principal payments. A credit rating downgrade, worsened liquidity or decline in fair value below the weighted-average cost is not by itself considered a loss event, but rather incorporated in the impairment analysis along with other available information.
The Group determines that there is objective evidence of impairment of an available-for-sale equity security, if at the reporting date:
33 its fair value is below the weighted-average cost by an amount significantly exceeding the volatility threshold determined quarterly for the respective equity market (such as North America, Asia Pacific, UK, Switzerland and other European countries); or
33 its fair value has been below the weighted-average cost for a prolonged period of 24 consecutive months or longer
Goodwill and attorney-in-fact (AIF) contracts Goodwill is allocated to a cash generating unit (CGU) as outlined in note 3. The Group has defined the CGUs according to regions, separating Property & Casualty (P&C), Life businesses and other (see note 27). The CGUs which carry the majority of goodwill and AIF contracts are presented in table 4.
For goodwill impairment testing, the recoverable amount is the higher of its fair value less costs to sell and its value-in-use.
Fair value is determined, considering quoted market prices, current share values in the market place for similar publicly traded entities, and recent sale transactions of similar businesses.
Value-in-use is determined using the present value of estimated future cash flows expected to be generated from the CGU. Cash flow projections are based on financial budgets, which are approved by management, typically covering a three-year period or, if appropriate and adequately justified, a longer period, which may be necessary to more accurately represent the nature of the cash flows used to test the goodwill. Cash flows beyond this period are extrapolated using, among others, estimated perpetual growth rates, which typically do not exceed the expected inflation of the geographical areas in which the cash flows supporting the goodwill are generated. If cash flows are generated in different geographical areas with different expected inflation rates, weighted averages are used. The discount rates applied reflect the respective risk-free interest rate adjusted for the relevant risk factors to the extent they have not already been considered in the underlying cash flows.
The discount rates used in the recoverable amount calculations for developed markets are based on the capital asset pricing model and consider government bond rates which are further adjusted for equity risk premium, appropriate beta and leverage ratio. In emerging markets, discount rates are based on the U.S. dollar discount rate taking into account inflation differential expectations and country risks. All input factors to the discount rates are based on observable market data.
The recoverable amounts of AIF contracts and goodwill are determined on the basis of value-in-use calculations further described above. The basis for determining the values assigned to the key assumptions are current market trends and earnings projections.
Table 4 sets out for the major CGUs the applied discount rates and the perpetual nominal growth rates beyond the projection period that depend on expectations about country-specific growth rates and inflation as of the date of valuation, as well as the value of goodwill and AIF contracts as of December 31, 2019. No impairment was identified.
Zurich Insurance GroupAnnual Report 2019 203
Group overview Governance Risk review Financial review
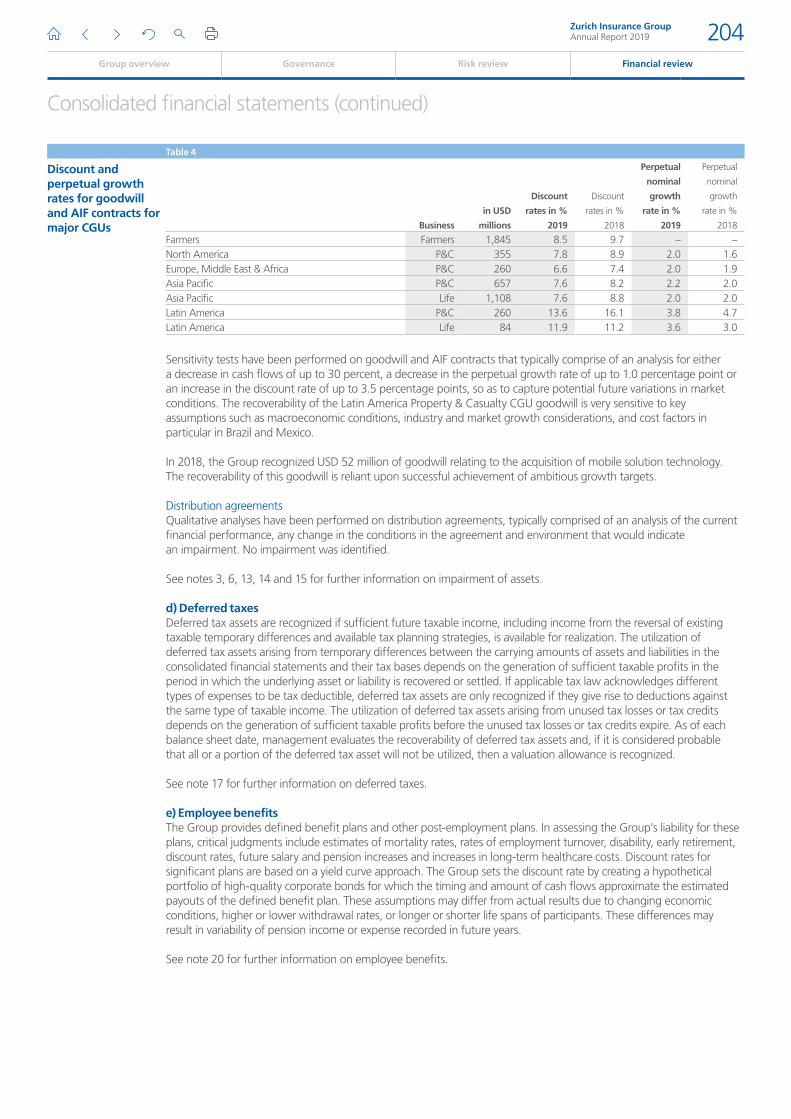
Consolidated financial statements (continued)
Table 4
Discount and perpetual growth rates for goodwill and AIF contracts for major CGUs Business
in USD
millions
Discount
rates in %
2019
Discount
rates in %
2018
Perpetual
nominal
growth
rate in %
2019
Perpetual
nominal
growth
rate in %
2018
Farmers Farmers 1,845 8.5 9.7 – –North America P&C 355 7.8 8.9 2.0 1.6Europe, Middle East & Africa P&C 260 6.6 7.4 2.0 1.9Asia Pacific P&C 657 7.6 8.2 2.2 2.0Asia Pacific Life 1,108 7.6 8.8 2.0 2.0Latin America P&C 260 13.6 16.1 3.8 4.7Latin America Life 84 11.9 11.2 3.6 3.0
Sensitivity tests have been performed on goodwill and AIF contracts that typically comprise of an analysis for either a decrease in cash flows of up to 30 percent, a decrease in the perpetual growth rate of up to 1.0 percentage point or an increase in the discount rate of up to 3.5 percentage points, so as to capture potential future variations in market conditions. The recoverability of the Latin America Property & Casualty CGU goodwill is very sensitive to key assumptions such as macroeconomic conditions, industry and market growth considerations, and cost factors in particular in Brazil and Mexico.
In 2018, the Group recognized USD 52 million of goodwill relating to the acquisition of mobile solution technology. The recoverability of this goodwill is reliant upon successful achievement of ambitious growth targets.
Distribution agreementsQualitative analyses have been performed on distribution agreements, typically comprised of an analysis of the current financial performance, any change in the conditions in the agreement and environment that would indicate an impairment. No impairment was identified.
See notes 3, 6, 13, 14 and 15 for further information on impairment of assets.
d) Deferred taxesDeferred tax assets are recognized if sufficient future taxable income, including income from the reversal of existing taxable temporary differences and available tax planning strategies, is available for realization. The utilization of deferred tax assets arising from temporary differences between the carrying amounts of assets and liabilities in the consolidated financial statements and their tax bases depends on the generation of sufficient taxable profits in the period in which the underlying asset or liability is recovered or settled. If applicable tax law acknowledges different types of expenses to be tax deductible, deferred tax assets are only recognized if they give rise to deductions against the same type of taxable income. The utilization of deferred tax assets arising from unused tax losses or tax credits depends on the generation of sufficient taxable profits before the unused tax losses or tax credits expire. As of each balance sheet date, management evaluates the recoverability of deferred tax assets and, if it is considered probable that all or a portion of the deferred tax asset will not be utilized, then a valuation allowance is recognized.
See note 17 for further information on deferred taxes.
e) Employee benefitsThe Group provides defined benefit plans and other post-employment plans. In assessing the Group’s liability for these plans, critical judgments include estimates of mortality rates, rates of employment turnover, disability, early retirement, discount rates, future salary and pension increases and increases in long-term healthcare costs. Discount rates for significant plans are based on a yield curve approach. The Group sets the discount rate by creating a hypothetical portfolio of high-quality corporate bonds for which the timing and amount of cash flows approximate the estimated payouts of the defined benefit plan. These assumptions may differ from actual results due to changing economic conditions, higher or lower withdrawal rates, or longer or shorter life spans of participants. These differences may result in variability of pension income or expense recorded in future years.
See note 20 for further information on employee benefits.
Zurich Insurance GroupAnnual Report 2019 204
Group overview Governance Risk review Financial review
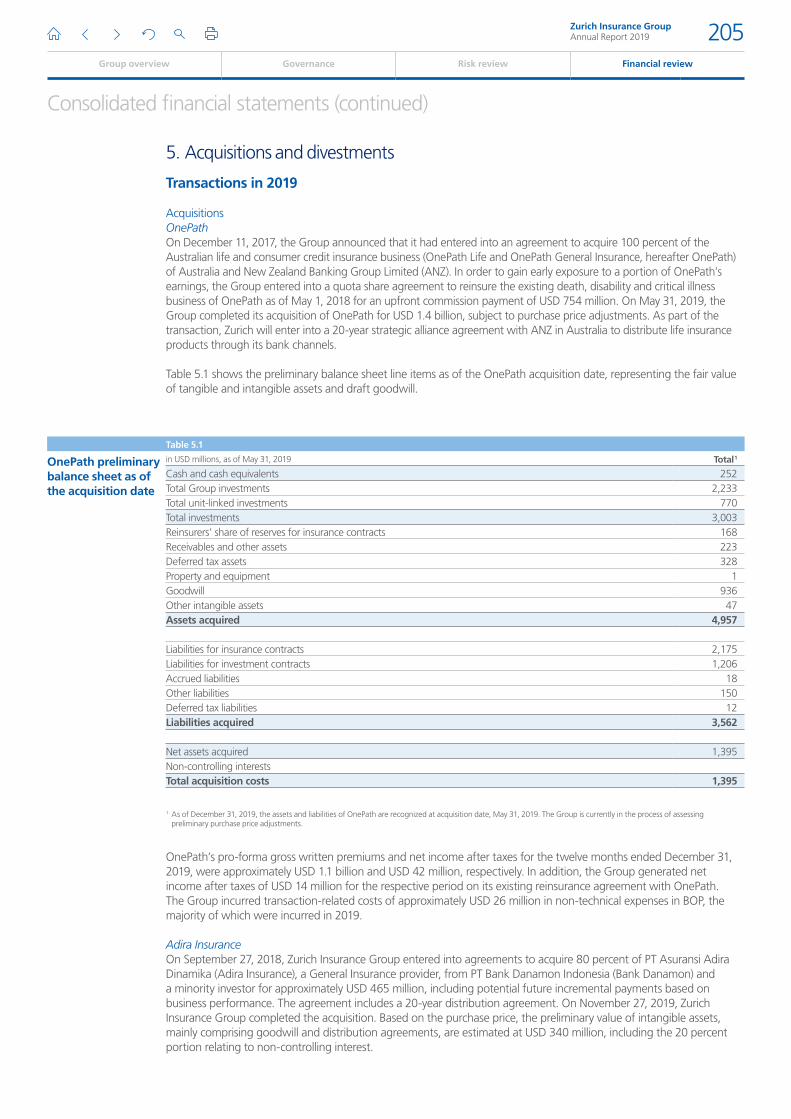
Consolidated financial statements (continued)
5. Acquisitions and divestments
Transactions in 2019
Acquisitions OnePathOn December 11, 2017, the Group announced that it had entered into an agreement to acquire 100 percent of the Australian life and consumer credit insurance business (OnePath Life and OnePath General Insurance, hereafter OnePath) of Australia and New Zealand Banking Group Limited (ANZ). In order to gain early exposure to a portion of OnePath’s earnings, the Group entered into a quota share agreement to reinsure the existing death, disability and critical illness business of OnePath as of May 1, 2018 for an upfront commission payment of USD 754 million. On May 31, 2019, the Group completed its acquisition of OnePath for USD 1.4 billion, subject to purchase price adjustments. As part of the transaction, Zurich will enter into a 20-year strategic alliance agreement with ANZ in Australia to distribute life insurance products through its bank channels.
Table 5.1 shows the preliminary balance sheet line items as of the OnePath acquisition date, representing the fair value of tangible and intangible assets and draft goodwill.
Table 5.1
OnePath preliminary balance sheet as of the acquisition date
in USD millions, as of May 31, 2019 Total 1
Cash and cash equivalents 252Total Group investments 2,233Total unit-linked investments 770Total investments 3,003Reinsurers’ share of reserves for insurance contracts 168Receivables and other assets 223Deferred tax assets 328Property and equipment 1Goodwill 936Other intangible assets 47Assets acquired 4,957
Liabilities for insurance contracts 2,175Liabilities for investment contracts 1,206Accrued liabilities 18Other liabilities 150Deferred tax liabilities 12Liabilities acquired 3,562
Net assets acquired 1,395Non-controlling interestsTotal acquisition costs 1,395
1 As of December 31, 2019, the assets and liabilities of OnePath are recognized at acquisition date, May 31, 2019. The Group is currently in the process of assessing preliminary purchase price adjustments.
OnePath’s pro-forma gross written premiums and net income after taxes for the twelve months ended December 31, 2019, were approximately USD 1.1 billion and USD 42 million, respectively. In addition, the Group generated net income after taxes of USD 14 million for the respective period on its existing reinsurance agreement with OnePath. The Group incurred transaction-related costs of approximately USD 26 million in non-technical expenses in BOP, the majority of which were incurred in 2019.
Adira InsuranceOn September 27, 2018, Zurich Insurance Group entered into agreements to acquire 80 percent of PT Asuransi Adira Dinamika (Adira Insurance), a General Insurance provider, from PT Bank Danamon Indonesia (Bank Danamon) and a minority investor for approximately USD 465 million, including potential future incremental payments based on business performance. The agreement includes a 20-year distribution agreement. On November 27, 2019, Zurich Insurance Group completed the acquisition. Based on the purchase price, the preliminary value of intangible assets, mainly comprising goodwill and distribution agreements, are estimated at USD 340 million, including the 20 percent portion relating to non-controlling interest.
Zurich Insurance GroupAnnual Report 2019 205
Group overview Governance Risk review Financial review
Consolidated financial statements (continued)
DivestmentsHeld for saleOn November 19, 2019, Zurich Financial Services (UKISA) Limited and Allied Zurich Holdings Limited (AZH) entered into an agreement with Embark Group Limited (Embark) to sell the UK Retail Wealth business, which includes an Investment and Retail Wealth Platform business, Sterling ISA Managers Limited (SIML), and an Investment Management business, Zurich Investment Services (UK) Limited (ZISUK). The sale is expected to be completed in Q2 2020, subject to regulatory approval. The Group has recorded a pre-tax loss of USD 123 million in the statement of income, including an impairment of assets of USD 209 million. As of December 31, 2019, assets and liabilities reclassified to held for sale were USD 57 million and USD 7 million, respectively.
On September 15, 2019, Zurich Insurance plc entered into an agreement to transfer the German Architects & Engineers portfolio to Darag Group. As of December 31, 2019, assets reclassified to held for sale were USD 177 million and liabilities reclassified to held for sale were USD 177 million.
On December 14, 2018, Zurich Insurance plc entered into an agreement with Catalina Holdings (Bermuda) Ltd and certain of its subsidiaries to transfer a portfolio of pre-2007 United Kingdom legacy employers’ liability policies to Catalina London Limited, subject to regulatory and court approvals. The transfer is expected to be completed in 2020. As of December 31, 2019, assets reclassified to held for sale were USD 1.8 billion and liabilities reclassified to held for sale were USD 1.8 billion.
As of December 31, 2019, due to the completion of the sale of the UK workplace pensions and savings business by Zurich Assurance Ltd in the UK (see note below), the total assets and liabilities reclassified to held for sale decreased by USD 22 billion and USD 23.5 billion, to USD 2.1 billion and USD 2 billion, respectively.
UK workplace pensions and savings businessOn October 12, 2017 the Group announced a strategic deal under which Lloyds Banking (LBG) would acquire the UK workplace pension and savings business. On April 3, 2018, Sterling ISA Managers Limited completed the sale of its Corporate Savings Platform together with the associated infrastructure, assets and business to LBG subsidiary, Scottish Widows Administration Services Limited. On July 1, 2019, the remaining insurance business was transferred by Zurich Assurance Ltd to Scottish Widows Limited by a UK court process under Part VII of the Financial Services and Markets Act 2000. In 2019, the Group has recorded a pre-tax gain of USD 24 million in the statement of income upon completion of the sale.
Venezuelan OperationsOn May 24, 2019, the Group completed the sale of its 69 percent participation in Zurich Seguros, S.A. The Group has recorded a pre-tax loss of USD 260 million, of which USD 258 million results from negative currency translation adjustments, in the statement of income upon completion of the sale.
ADAC Autoversicherung AG and Bonnfinanz AGOn January 1, 2019, the Group completed the sale of its 51 percent participation in ADAC Autoversicherung AG and on April 2, 2019, the Group completed the sale of Bonnfinanz AG, with pre-tax gains of USD 19 million and USD 39 million, respectively, recorded within net gains/(losses) on divestment of businesses.
Transactions in 2018
Acquisitions Blue InsuranceOn October 3, 2018, Cover-More Australia Pty Ltd, a fully owned subsidiary of Zurich Insurance Company Ltd, completed the acquisition of Blue Insurance Ltd (Blue Insurance), an Irish-domiciled insurance intermediary acquired for approximately USD 64 million, subject to performance adjustments. Based on purchase price accounting, goodwill amounted to USD 37 million, including a USD 2 million increase in goodwill from post-acquisition adjustments in 2019.
EuroAmerica portfolio in ChileOn April 20, 2018, the Group announced it had entered into an agreement to acquire the individual and group life insurance portfolios as well as the long-term savings operations of EuroAmerica in Chile. The Group finalized the acquisition on November 5, 2018, for an estimated aggregate price of USD 144 million, subject to purchase price adjustments. Based on purchase price accounting, goodwill amounted to USD 90 million, including a USD 12 million reduction of goodwill in 2019 from post-acquisition adjustments.
Zurich Insurance GroupAnnual Report 2019 206
Group overview Governance Risk review Financial review
Consolidated financial statements (continued)
Travel Ace and Universal AssistanceOn March 12, 2018, the Group announced the acquisition of Travel Ace and Universal Assistance, the leading providers of traveler assistance in Latin America, for approximately USD 82 million. The transaction encompassed 19 legal entities operating throughout Latin America, most notably in Argentina, Brazil, Chile, Colombia and Mexico. Based on purchase price accounting, goodwill amounted to USD 94 million.
QBE Latin AmericaOn February 24, 2018, the Group entered into an agreement to acquire the Latin American operations of the Australian insurer QBE Insurance Group Limited (QBE) with operations in Argentina, Brazil, Colombia, Ecuador and Mexico. On July 2, 2018, the acquisitions of Argentina and Brazil were closed for an amount, including purchase price adjustments, of USD 190 million and USD 27 million, respectively. The acquisitions of Mexico and Ecuador were closed on August 31, 2018 and October 1, 2018, each for an amount of USD 46 million including purchase price adjustments. The acquisition of Colombia was completed on February 1, 2019, for an amount of USD 18 million, subject to purchase price adjustments.
Table 5.2 shows the main balance sheet line items, including post-acquisition adjustments, representing the fair value of acquired QBE Latin America’s net tangible assets, intangible assets and goodwill, based on purchase price accounting.
Table 5.2
QBE Latin America balance sheet as of the acquisition dates
in USD millions Total
Cash and cash equivalents 89Total investments 397Receivables and other assets 411Deferred tax assets 21Property and equipment 21Goodwill 222Other intangible assets 51Assets acquired 1,212
Liabilities for insurance contracts 736Other liabilities 142Deferred tax liabilities 8Liabilities acquired 886
Net assets acquired 326Total acquisition costs 326
QBE Latin America’s net income after taxes for the months since the acquisition dates, as included in the Group consolidated income statements for the year ended December 31, 2018, amounts to USD 3 million including transaction-related costs. Pro-forma net income after taxes for the full 12 months ended December 31, 2018, amounts to approximately USD 21 million, adjusted for transaction-related costs incurred by QBE Latin America. In addition, the Group incurred transaction-related costs of approximately USD 9 million in non-technical expenses in BOP. The majority has been incurred in 2018.
Divestments Endsleigh LimitedOn March 29, 2018, the Group completed the sale of the Endsleigh Limited group of companies to A-Plan Holdings. A pre-tax loss of USD 116 million has been recorded within net gains/losses on divestment of businesses, of which USD 97 million were recognized in December 2017 at the time the sale was announced.
Zurich Insurance GroupAnnual Report 2019 207
Group overview Governance Risk review Financial review
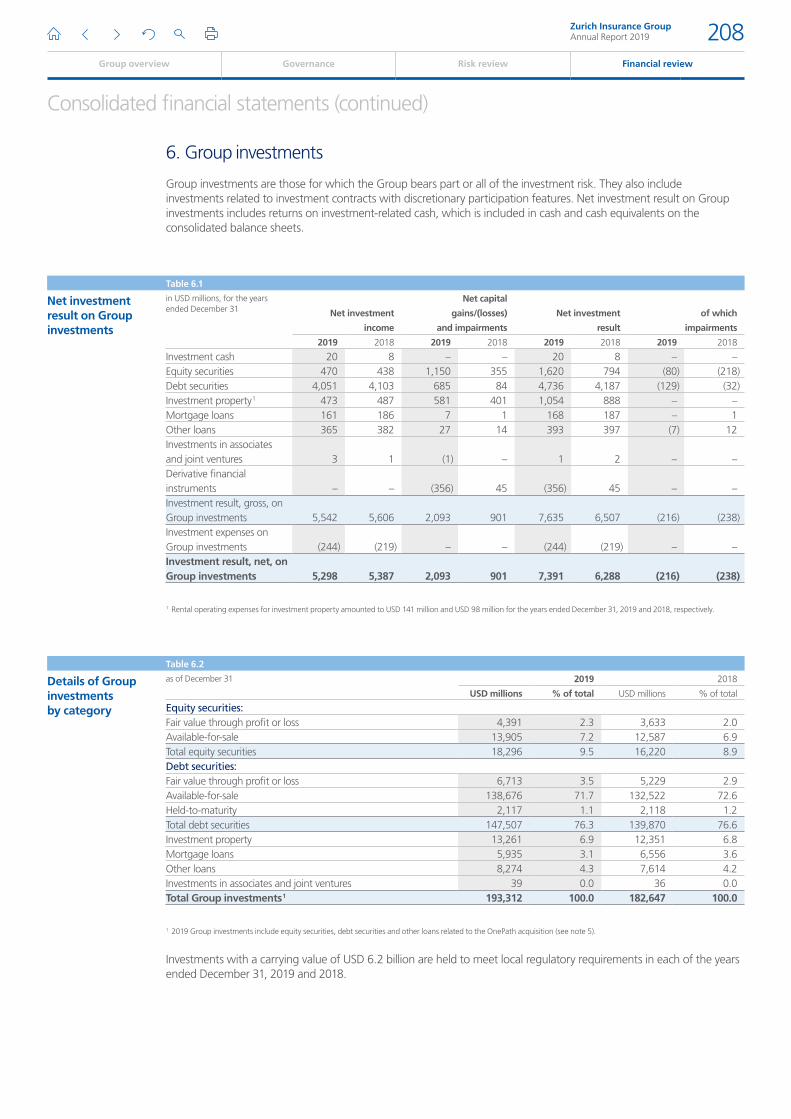
Consolidated financial statements (continued)
6. Group investments
Group investments are those for which the Group bears part or all of the investment risk. They also include investments related to investment contracts with discretionary participation features. Net investment result on Group investments includes returns on investment-related cash, which is included in cash and cash equivalents on the consolidated balance sheets.
Table 6.1
Net investment result on Group investments
in USD millions, for the years ended December 31 Net investment
income
Net capital
gains/(losses)
and impairments
Net investment
result
of which
impairments
2019 2018 2019 2018 2019 2018 2019 2018
Investment cash 20 8 – – 20 8 – –Equity securities 470 438 1,150 355 1,620 794 (80) (218)Debt securities 4,051 4,103 685 84 4,736 4,187 (129) (32)Investment property 1 473 487 581 401 1,054 888 – –Mortgage loans 161 186 7 1 168 187 – 1Other loans 365 382 27 14 393 397 (7) 12Investments in associates and joint ventures 3 1 (1) – 1 2 – –Derivative financial instruments – – (356) 45 (356) 45 – –Investment result, gross, on Group investments 5,542 5,606 2,093 901 7,635 6,507 (216) (238)Investment expenses on Group investments (244) (219) – – (244) (219) – –Investment result, net, on Group investments 5,298 5,387 2,093 901 7,391 6,288 (216) (238)
1 Rental operating expenses for investment property amounted to USD 141 million and USD 98 million for the years ended December 31, 2019 and 2018, respectively.
Table 6.2
Details of Group investments by category
as of December 31 2019 2018
USD millions % of total USD millions % of total
Equity securities:Fair value through profit or loss 4,391 2.3 3,633 2.0Available-for-sale 13,905 7.2 12,587 6.9Total equity securities 18,296 9.5 16,220 8.9Debt securities:Fair value through profit or loss 6,713 3.5 5,229 2.9Available-for-sale 138,676 71.7 132,522 72.6Held-to-maturity 2,117 1.1 2,118 1.2Total debt securities 147,507 76.3 139,870 76.6Investment property 13,261 6.9 12,351 6.8Mortgage loans 5,935 3.1 6,556 3.6Other loans 8,274 4.3 7,614 4.2Investments in associates and joint ventures 39 0.0 36 0.0Total Group investments 1 193,312 100.0 182,647 100.0
1 2019 Group investments include equity securities, debt securities and other loans related to the OnePath acquisition (see note 5).
Investments with a carrying value of USD 6.2 billion are held to meet local regulatory requirements in each of the years ended December 31, 2019 and 2018.
Zurich Insurance GroupAnnual Report 2019 208
Group overview Governance Risk review Financial review
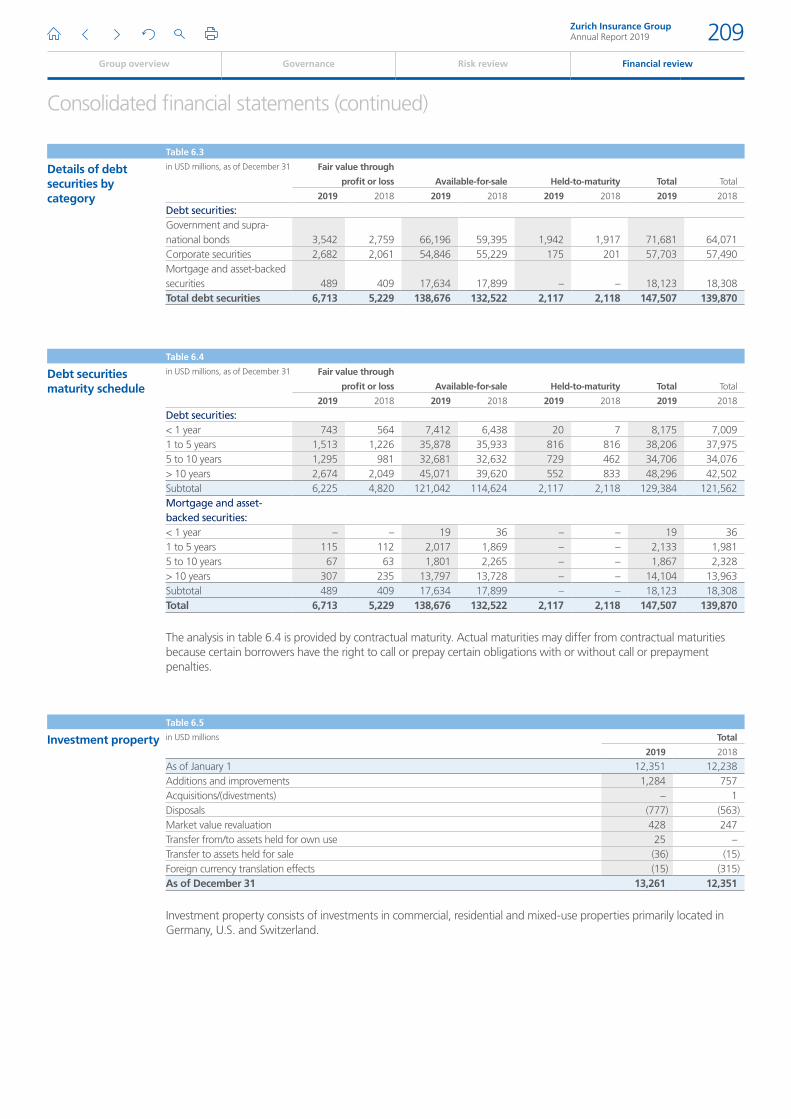
Consolidated financial statements (continued)
Table 6.3
Details of debt securities by category
in USD millions, as of December 31 Fair value through
profit or loss Available-for-sale Held-to-maturity Total Total
2019 2018 2019 2018 2019 2018 2019 2018
Debt securities:Government and supra-national bonds 3,542 2,759 66,196 59,395 1,942 1,917 71,681 64,071Corporate securities 2,682 2,061 54,846 55,229 175 201 57,703 57,490Mortgage and asset-backed securities 489 409 17,634 17,899 – – 18,123 18,308Total debt securities 6,713 5,229 138,676 132,522 2,117 2,118 147,507 139,870
Table 6.4
Debt securities maturity schedule
in USD millions, as of December 31 Fair value through
profit or loss Available-for-sale Held-to-maturity Total Total
2019 2018 2019 2018 2019 2018 2019 2018
Debt securities:< 1 year 743 564 7,412 6,438 20 7 8,175 7,0091 to 5 years 1,513 1,226 35,878 35,933 816 816 38,206 37,9755 to 10 years 1,295 981 32,681 32,632 729 462 34,706 34,076> 10 years 2,674 2,049 45,071 39,620 552 833 48,296 42,502Subtotal 6,225 4,820 121,042 114,624 2,117 2,118 129,384 121,562Mortgage and asset-backed securities:< 1 year – – 19 36 – – 19 361 to 5 years 115 112 2,017 1,869 – – 2,133 1,9815 to 10 years 67 63 1,801 2,265 – – 1,867 2,328> 10 years 307 235 13,797 13,728 – – 14,104 13,963Subtotal 489 409 17,634 17,899 – – 18,123 18,308Total 6,713 5,229 138,676 132,522 2,117 2,118 147,507 139,870
The analysis in table 6.4 is provided by contractual maturity. Actual maturities may differ from contractual maturities because certain borrowers have the right to call or prepay certain obligations with or without call or prepayment penalties.
Table 6.5
Investment property in USD millions Total
2019 2018
As of January 1 12,351 12,238Additions and improvements 1,284 757Acquisitions/(divestments) – 1Disposals (777) (563)Market value revaluation 428 247Transfer from/to assets held for own use 25 –Transfer to assets held for sale (36) (15)Foreign currency translation effects (15) (315)As of December 31 13,261 12,351
Investment property consists of investments in commercial, residential and mixed-use properties primarily located in Germany, U.S. and Switzerland.
Zurich Insurance GroupAnnual Report 2019 209
Group overview Governance Risk review Financial review
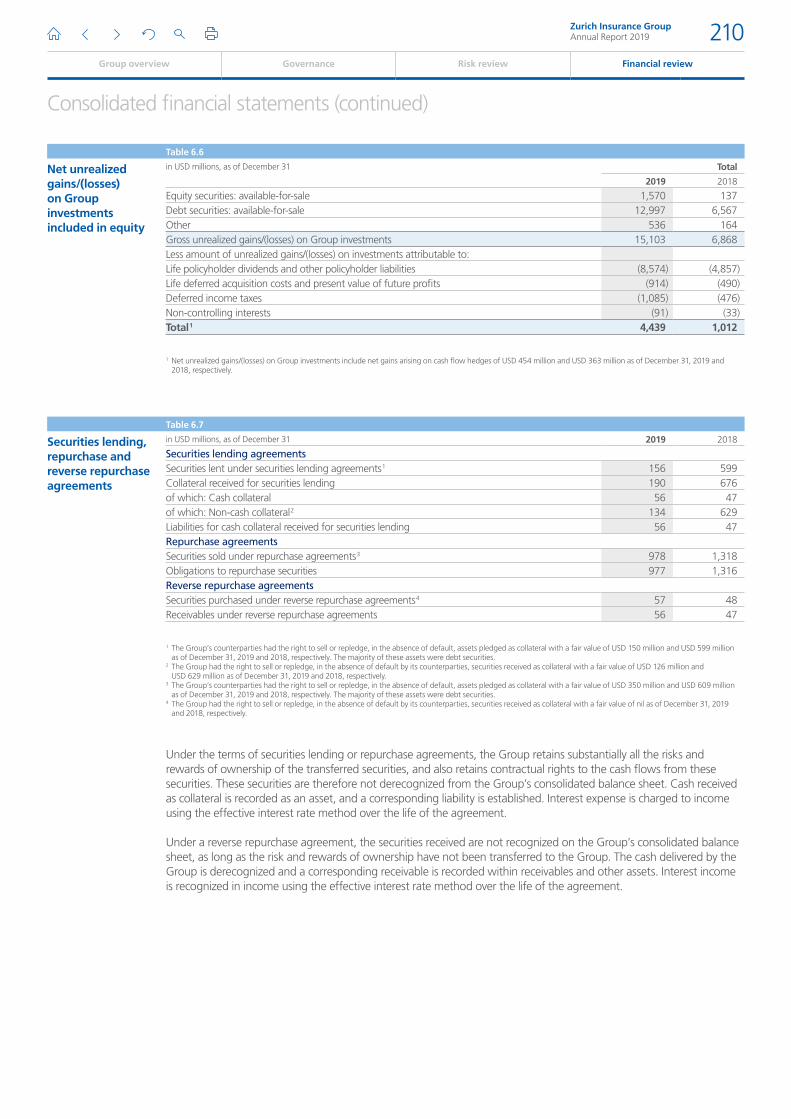
Consolidated financial statements (continued)
Table 6.6
Net unrealized gains/(losses) on Group investments included in equity
in USD millions, as of December 31 Total
2019 2018
Equity securities: available-for-sale 1,570 137Debt securities: available-for-sale 12,997 6,567Other 536 164Gross unrealized gains/(losses) on Group investments 15,103 6,868Less amount of unrealized gains/(losses) on investments attributable to:Life policyholder dividends and other policyholder liabilities (8,574) (4,857)Life deferred acquisition costs and present value of future profits (914) (490)Deferred income taxes (1,085) (476)Non-controlling interests (91) (33)Total 1 4,439 1,012
1 Net unrealized gains/(losses) on Group investments include net gains arising on cash flow hedges of USD 454 million and USD 363 million as of December 31, 2019 and 2018, respectively.
Table 6.7
Securities lending, repurchase and reverse repurchase agreements
in USD millions, as of December 31 2019 2018
Securities lending agreementsSecurities lent under securities lending agreements 1 156 599Collateral received for securities lending 190 676of which: Cash collateral 56 47of which: Non-cash collateral 2 134 629Liabilities for cash collateral received for securities lending 56 47Repurchase agreements Securities sold under repurchase agreements 3 978 1,318Obligations to repurchase securities 977 1,316Reverse repurchase agreementsSecurities purchased under reverse repurchase agreements 4 57 48Receivables under reverse repurchase agreements 56 47
1 The Group’s counterparties had the right to sell or repledge, in the absence of default, assets pledged as collateral with a fair value of USD 150 million and USD 599 million as of December 31, 2019 and 2018, respectively. The majority of these assets were debt securities.
2 The Group had the right to sell or repledge, in the absence of default by its counterparties, securities received as collateral with a fair value of USD 126 million and USD 629 million as of December 31, 2019 and 2018, respectively.
3 The Group’s counterparties had the right to sell or repledge, in the absence of default, assets pledged as collateral with a fair value of USD 350 million and USD 609 million as of December 31, 2019 and 2018, respectively. The majority of these assets were debt securities.
4 The Group had the right to sell or repledge, in the absence of default by its counterparties, securities received as collateral with a fair value of nil as of December 31, 2019 and 2018, respectively.
Under the terms of securities lending or repurchase agreements, the Group retains substantially all the risks and rewards of ownership of the transferred securities, and also retains contractual rights to the cash flows from these securities. These securities are therefore not derecognized from the Group’s consolidated balance sheet. Cash received as collateral is recorded as an asset, and a corresponding liability is established. Interest expense is charged to income using the effective interest rate method over the life of the agreement.
Under a reverse repurchase agreement, the securities received are not recognized on the Group’s consolidated balance sheet, as long as the risk and rewards of ownership have not been transferred to the Group. The cash delivered by the Group is derecognized and a corresponding receivable is recorded within receivables and other assets. Interest income is recognized in income using the effective interest rate method over the life of the agreement.
Zurich Insurance GroupAnnual Report 2019 210
Group overview Governance Risk review Financial review
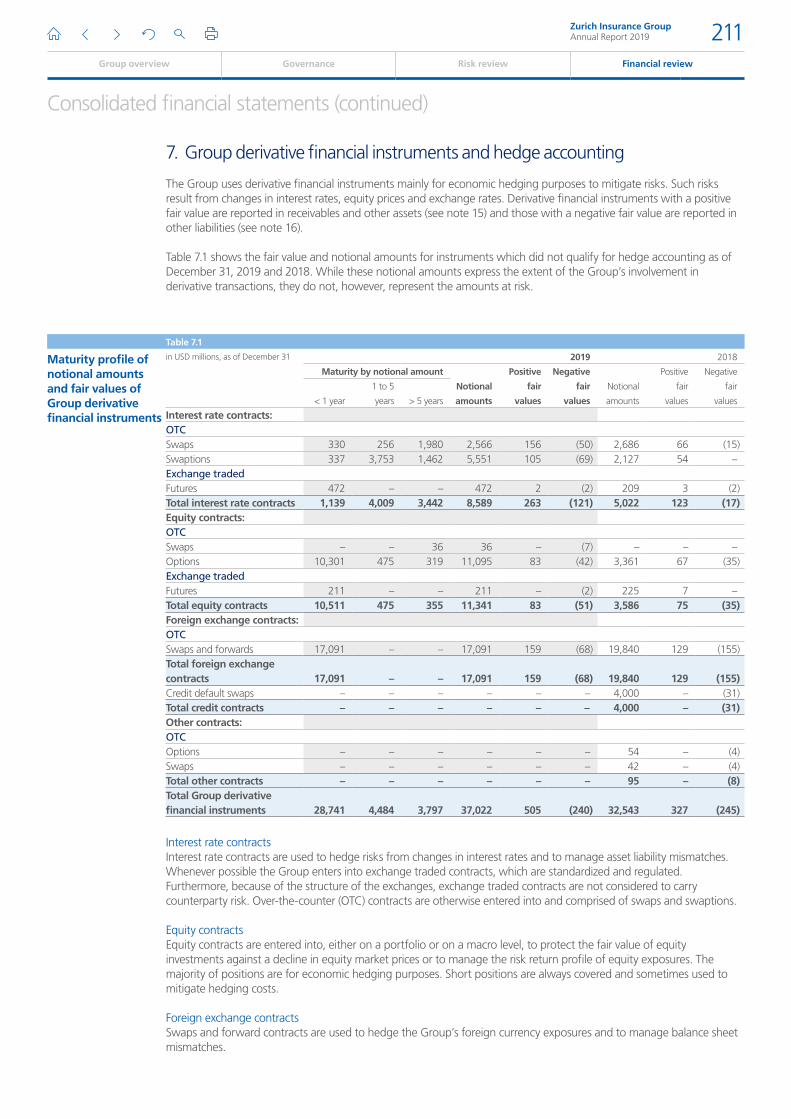
Consolidated financial statements (continued)
7. Group derivative financial instruments and hedge accounting
The Group uses derivative financial instruments mainly for economic hedging purposes to mitigate risks. Such risks result from changes in interest rates, equity prices and exchange rates. Derivative financial instruments with a positive fair value are reported in receivables and other assets (see note 15) and those with a negative fair value are reported in other liabilities (see note 16).
Table 7.1 shows the fair value and notional amounts for instruments which did not qualify for hedge accounting as of December 31, 2019 and 2018. While these notional amounts express the extent of the Group’s involvement in derivative transactions, they do not, however, represent the amounts at risk.
Table 7.1
Maturity profile of notional amounts and fair values of Group derivative financial instruments
in USD millions, as of December 31 2019 2018
Maturity by notional amount
Notional
amounts
Positive
fair
values
Negative
fair
values
Notional
amounts
Positive
fair
values
Negative
fair
values< 1 year
1 to 5
years > 5 years
Interest rate contracts:OTCSwaps 330 256 1,980 2,566 156 (50) 2,686 66 (15)Swaptions 337 3,753 1,462 5,551 105 (69) 2,127 54 –Exchange tradedFutures 472 – – 472 2 (2) 209 3 (2)Total interest rate contracts 1,139 4,009 3,442 8,589 263 (121) 5,022 123 (17)Equity contracts:OTCSwaps – – 36 36 – (7) – – –Options 10,301 475 319 11,095 83 (42) 3,361 67 (35)Exchange tradedFutures 211 – – 211 – (2) 225 7 –Total equity contracts 10,511 475 355 11,341 83 (51) 3,586 75 (35)Foreign exchange contracts:OTCSwaps and forwards 17,091 – – 17,091 159 (68) 19,840 129 (155)Total foreign exchange contracts 17,091 – – 17,091 159 (68) 19,840 129 (155)Credit default swaps – – – – – – 4,000 – (31)Total credit contracts – – – – – – 4,000 – (31)Other contracts:OTCOptions – – – – – – 54 – (4)Swaps – – – – – – 42 – (4)Total other contracts – – – – – – 95 – (8)Total Group derivative financial instruments 28,741 4,484 3,797 37,022 505 (240) 32,543 327 (245)
Interest rate contractsInterest rate contracts are used to hedge risks from changes in interest rates and to manage asset liability mismatches. Whenever possible the Group enters into exchange traded contracts, which are standardized and regulated. Furthermore, because of the structure of the exchanges, exchange traded contracts are not considered to carry counterparty risk. Over-the-counter (OTC) contracts are otherwise entered into and comprised of swaps and swaptions.
Equity contractsEquity contracts are entered into, either on a portfolio or on a macro level, to protect the fair value of equity investments against a decline in equity market prices or to manage the risk return profile of equity exposures. The majority of positions are for economic hedging purposes. Short positions are always covered and sometimes used to mitigate hedging costs.
Foreign exchange contractsSwaps and forward contracts are used to hedge the Group’s foreign currency exposures and to manage balance sheet mismatches.
Zurich Insurance GroupAnnual Report 2019 211
Group overview Governance Risk review Financial review
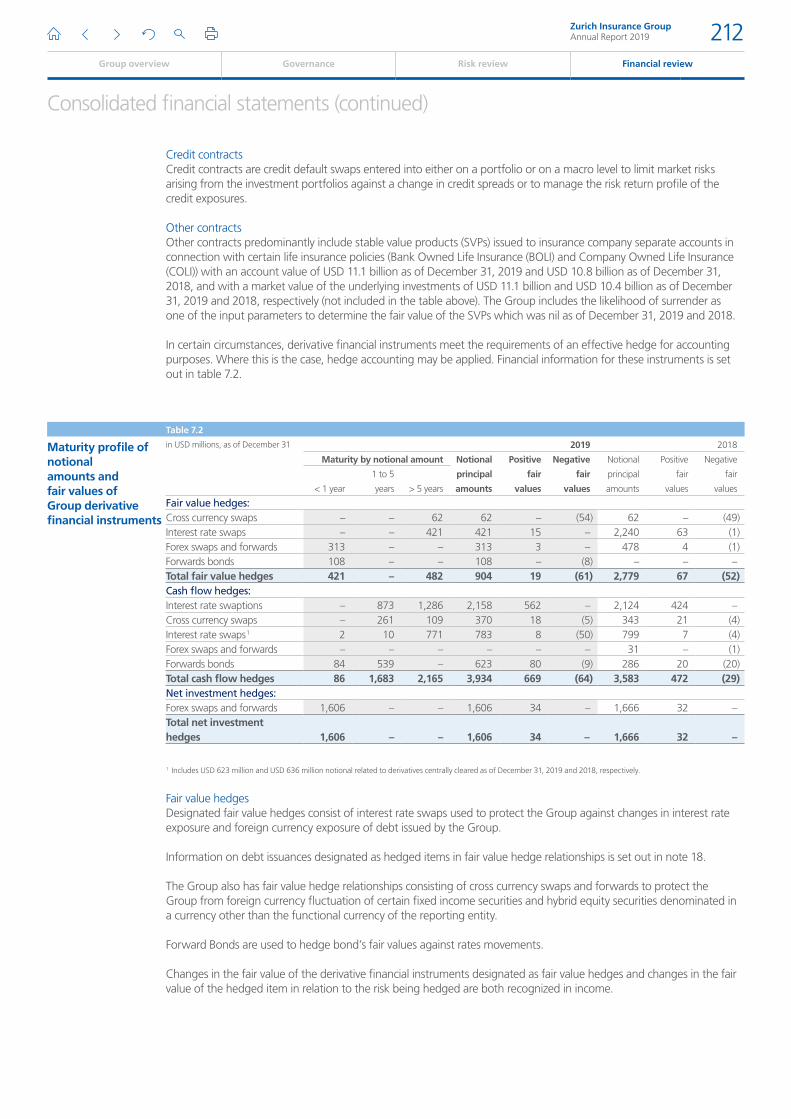
Consolidated financial statements (continued)
Credit contractsCredit contracts are credit default swaps entered into either on a portfolio or on a macro level to limit market risks arising from the investment portfolios against a change in credit spreads or to manage the risk return profile of the credit exposures.
Other contractsOther contracts predominantly include stable value products (SVPs) issued to insurance company separate accounts in connection with certain life insurance policies (Bank Owned Life Insurance (BOLI) and Company Owned Life Insurance (COLI)) with an account value of USD 11.1 billion as of December 31, 2019 and USD 10.8 billion as of December 31, 2018, and with a market value of the underlying investments of USD 11.1 billion and USD 10.4 billion as of December 31, 2019 and 2018, respectively (not included in the table above). The Group includes the likelihood of surrender as one of the input parameters to determine the fair value of the SVPs which was nil as of December 31, 2019 and 2018.
In certain circumstances, derivative financial instruments meet the requirements of an effective hedge for accounting purposes. Where this is the case, hedge accounting may be applied. Financial information for these instruments is set out in table 7.2.
Table 7.2
Maturity profile of notional amounts and fair values of Group derivative financial instruments
in USD millions, as of December 31 2019 2018
Maturity by notional amount Notional
principal
amounts
Positive
fair
values
Negative
fair
values
Notional
principal
amounts
Positive
fair
values
Negative
fair
values< 1 year
1 to 5
years > 5 years
Fair value hedges:Cross currency swaps – – 62 62 – (54) 62 – (49)Interest rate swaps – – 421 421 15 – 2,240 63 (1)Forex swaps and forwards 313 – – 313 3 – 478 4 (1)Forwards bonds 108 – – 108 – (8) – – –Total fair value hedges 421 – 482 904 19 (61) 2,779 67 (52)Cash flow hedges:Interest rate swaptions – 873 1,286 2,158 562 – 2,124 424 –Cross currency swaps – 261 109 370 18 (5) 343 21 (4)Interest rate swaps 1 2 10 771 783 8 (50) 799 7 (4)Forex swaps and forwards – – – – – – 31 – (1)Forwards bonds 84 539 – 623 80 (9) 286 20 (20)Total cash flow hedges 86 1,683 2,165 3,934 669 (64) 3,583 472 (29)Net investment hedges:Forex swaps and forwards 1,606 – – 1,606 34 – 1,666 32 –Total net investment hedges 1,606 – – 1,606 34 – 1,666 32 –
1 Includes USD 623 million and USD 636 million notional related to derivatives centrally cleared as of December 31, 2019 and 2018, respectively.
Fair value hedgesDesignated fair value hedges consist of interest rate swaps used to protect the Group against changes in interest rate exposure and foreign currency exposure of debt issued by the Group.
Information on debt issuances designated as hedged items in fair value hedge relationships is set out in note 18.
The Group also has fair value hedge relationships consisting of cross currency swaps and forwards to protect the Group from foreign currency fluctuation of certain fixed income securities and hybrid equity securities denominated in a currency other than the functional currency of the reporting entity.
Forward Bonds are used to hedge bond’s fair values against rates movements.
Changes in the fair value of the derivative financial instruments designated as fair value hedges and changes in the fair value of the hedged item in relation to the risk being hedged are both recognized in income.
Zurich Insurance GroupAnnual Report 2019 212
Group overview Governance Risk review Financial review
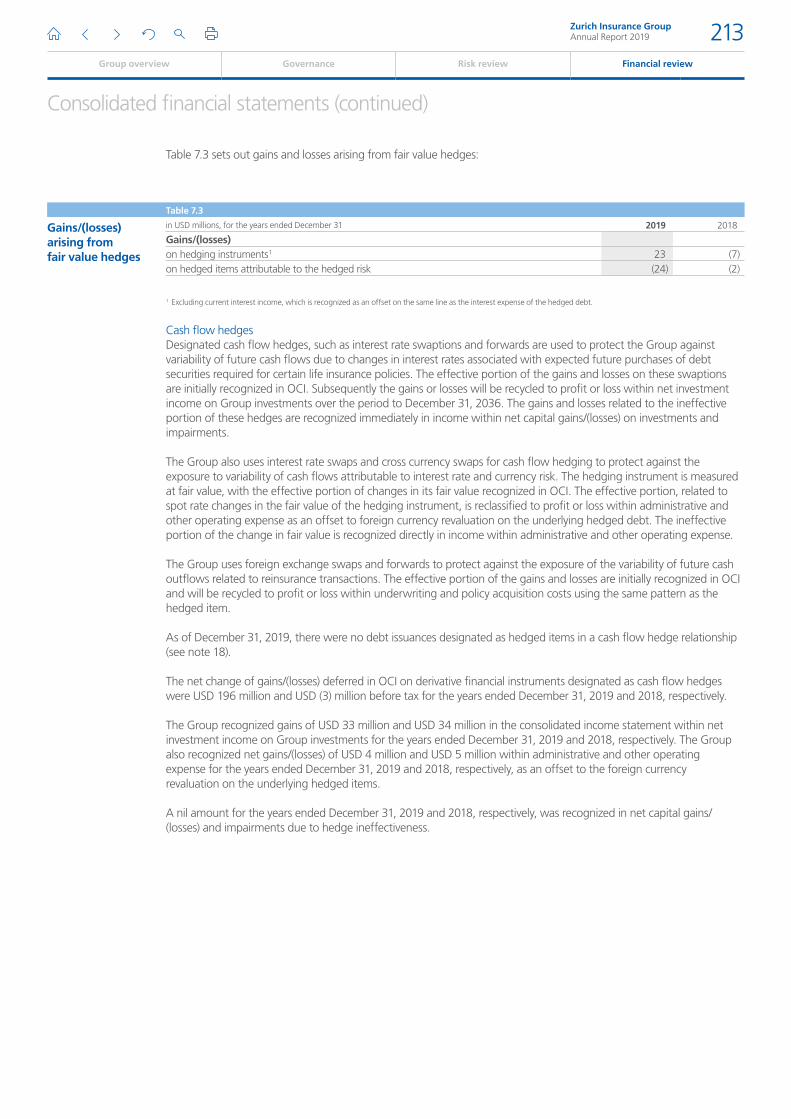
Consolidated financial statements (continued)
Table 7.3 sets out gains and losses arising from fair value hedges:
Table 7.3
Gains/(losses) arising from fair value hedges
in USD millions, for the years ended December 31 2019 2018
Gains/(losses)on hedging instruments 1 23 (7)on hedged items attributable to the hedged risk (24) (2)
1 Excluding current interest income, which is recognized as an offset on the same line as the interest expense of the hedged debt.
Cash flow hedgesDesignated cash flow hedges, such as interest rate swaptions and forwards are used to protect the Group against variability of future cash flows due to changes in interest rates associated with expected future purchases of debt securities required for certain life insurance policies. The effective portion of the gains and losses on these swaptions are initially recognized in OCI. Subsequently the gains or losses will be recycled to profit or loss within net investment income on Group investments over the period to December 31, 2036. The gains and losses related to the ineffective portion of these hedges are recognized immediately in income within net capital gains/(losses) on investments and impairments.
The Group also uses interest rate swaps and cross currency swaps for cash flow hedging to protect against the exposure to variability of cash flows attributable to interest rate and currency risk. The hedging instrument is measured at fair value, with the effective portion of changes in its fair value recognized in OCI. The effective portion, related to spot rate changes in the fair value of the hedging instrument, is reclassified to profit or loss within administrative and other operating expense as an offset to foreign currency revaluation on the underlying hedged debt. The ineffective portion of the change in fair value is recognized directly in income within administrative and other operating expense.
The Group uses foreign exchange swaps and forwards to protect against the exposure of the variability of future cash outflows related to reinsurance transactions. The effective portion of the gains and losses are initially recognized in OCI and will be recycled to profit or loss within underwriting and policy acquisition costs using the same pattern as the hedged item.
As of December 31, 2019, there were no debt issuances designated as hedged items in a cash flow hedge relationship (see note 18).
The net change of gains/(losses) deferred in OCI on derivative financial instruments designated as cash flow hedges were USD 196 million and USD (3) million before tax for the years ended December 31, 2019 and 2018, respectively.
The Group recognized gains of USD 33 million and USD 34 million in the consolidated income statement within net investment income on Group investments for the years ended December 31, 2019 and 2018, respectively. The Group also recognized net gains/(losses) of USD 4 million and USD 5 million within administrative and other operating expense for the years ended December 31, 2019 and 2018, respectively, as an offset to the foreign currency revaluation on the underlying hedged items.
A nil amount for the years ended December 31, 2019 and 2018, respectively, was recognized in net capital gains/(losses) and impairments due to hedge ineffectiveness.
Zurich Insurance GroupAnnual Report 2019 213
Group overview Governance Risk review Financial review
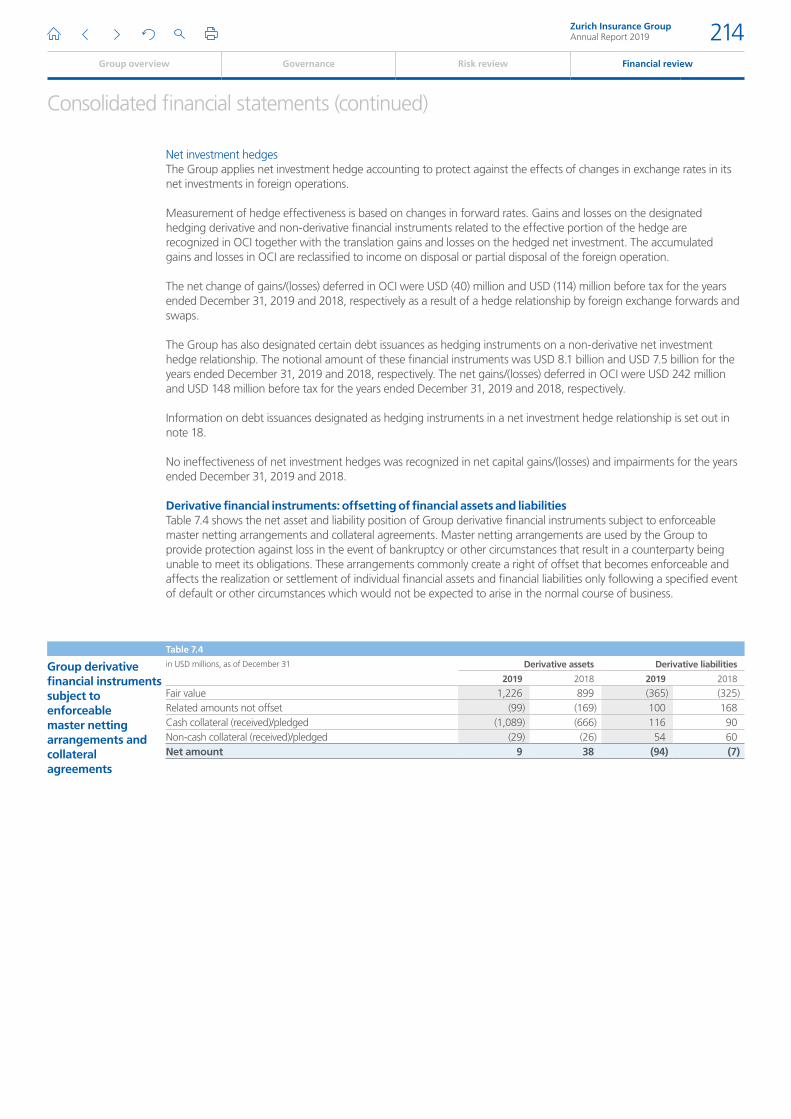
Consolidated financial statements (continued)
Net investment hedgesThe Group applies net investment hedge accounting to protect against the effects of changes in exchange rates in its net investments in foreign operations.
Measurement of hedge effectiveness is based on changes in forward rates. Gains and losses on the designated hedging derivative and non-derivative financial instruments related to the effective portion of the hedge are recognized in OCI together with the translation gains and losses on the hedged net investment. The accumulated gains and losses in OCI are reclassified to income on disposal or partial disposal of the foreign operation.
The net change of gains/(losses) deferred in OCI were USD (40) million and USD (114) million before tax for the years ended December 31, 2019 and 2018, respectively as a result of a hedge relationship by foreign exchange forwards and swaps.
The Group has also designated certain debt issuances as hedging instruments on a non-derivative net investment hedge relationship. The notional amount of these financial instruments was USD 8.1 billion and USD 7.5 billion for the years ended December 31, 2019 and 2018, respectively. The net gains/(losses) deferred in OCI were USD 242 million and USD 148 million before tax for the years ended December 31, 2019 and 2018, respectively.
Information on debt issuances designated as hedging instruments in a net investment hedge relationship is set out in note 18.
No ineffectiveness of net investment hedges was recognized in net capital gains/(losses) and impairments for the years ended December 31, 2019 and 2018.
Derivative financial instruments: offsetting of financial assets and liabilitiesTable 7.4 shows the net asset and liability position of Group derivative financial instruments subject to enforceable master netting arrangements and collateral agreements. Master netting arrangements are used by the Group to provide protection against loss in the event of bankruptcy or other circumstances that result in a counterparty being unable to meet its obligations. These arrangements commonly create a right of offset that becomes enforceable and affects the realization or settlement of individual financial assets and financial liabilities only following a specified event of default or other circumstances which would not be expected to arise in the normal course of business.
Table 7.4
Group derivative financial instruments subject to enforceable master netting arrangements and collateral agreements
in USD millions, as of December 31 Derivative assets Derivative liabilities
2019 2018 2019 2018
Fair value 1,226 899 (365) (325)Related amounts not offset (99) (169) 100 168Cash collateral (received)/pledged (1,089) (666) 116 90Non-cash collateral (received)/pledged (29) (26) 54 60Net amount 9 38 (94) (7)
Zurich Insurance GroupAnnual Report 2019 214
Group overview Governance Risk review Financial review
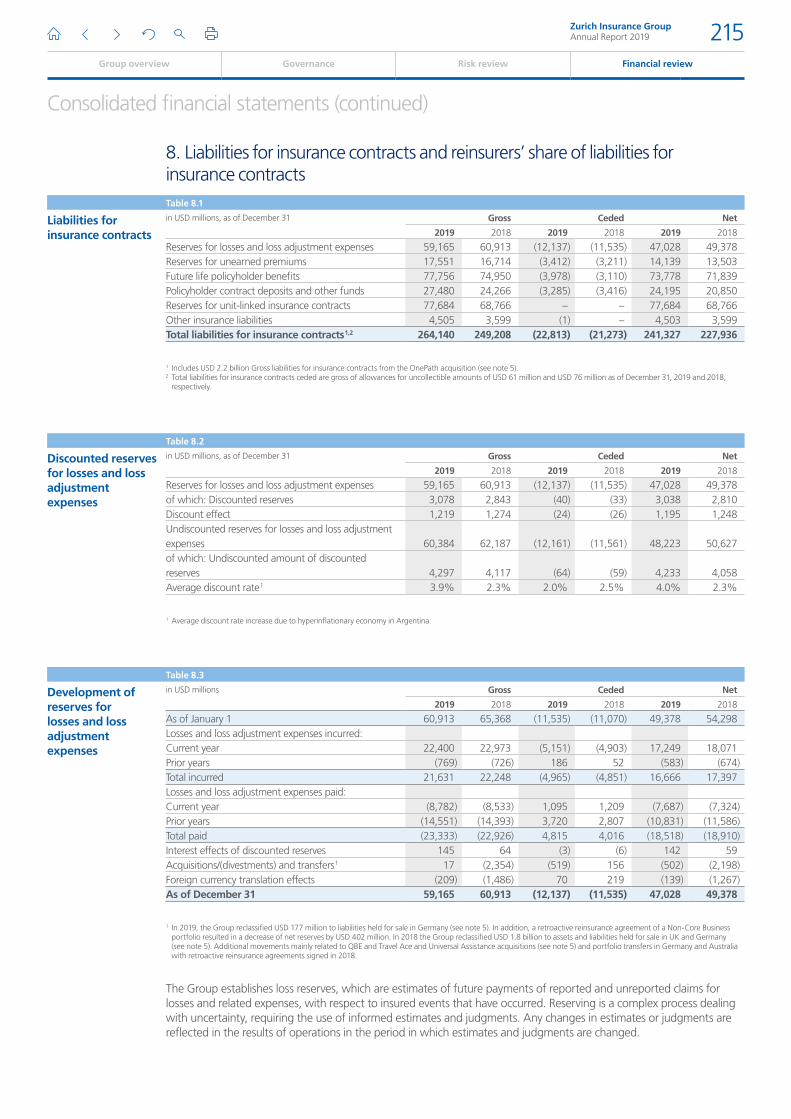
Consolidated financial statements (continued)
8. Liabilities for insurance contracts and reinsurers’ share of liabilities for insurance contractsTable 8.1
Liabilities for insurance contracts
in USD millions, as of December 31 Gross Ceded Net
2019 2018 2019 2018 2019 2018
Reserves for losses and loss adjustment expenses 59,165 60,913 (12,137) (11,535) 47,028 49,378Reserves for unearned premiums 17,551 16,714 (3,412) (3,211) 14,139 13,503Future life policyholder benefits 77,756 74,950 (3,978) (3,110) 73,778 71,839Policyholder contract deposits and other funds 27,480 24,266 (3,285) (3,416) 24,195 20,850Reserves for unit-linked insurance contracts 77,684 68,766 – – 77,684 68,766Other insurance liabilities 4,505 3,599 (1) – 4,503 3,599Total liabilities for insurance contracts 1,2 264,140 249,208 (22,813) (21,273) 241,327 227,936
1 Includes USD 2.2 billion Gross liabilities for insurance contracts from the OnePath acquisition (see note 5).2 Total liabilities for insurance contracts ceded are gross of allowances for uncollectible amounts of USD 61 million and USD 76 million as of December 31, 2019 and 2018,
respectively.
Table 8.2
Discounted reserves for losses and loss adjustment expenses
in USD millions, as of December 31 Gross Ceded Net
2019 2018 2019 2018 2019 2018
Reserves for losses and loss adjustment expenses 59,165 60,913 (12,137) (11,535) 47,028 49,378of which: Discounted reserves 3,078 2,843 (40) (33) 3,038 2,810Discount effect 1,219 1,274 (24) (26) 1,195 1,248Undiscounted reserves for losses and loss adjustment expenses 60,384 62,187 (12,161) (11,561) 48,223 50,627of which: Undiscounted amount of discounted reserves 4,297 4,117 (64) (59) 4,233 4,058Average discount rate 1 3.9% 2.3% 2.0% 2.5% 4.0% 2.3%
1 Average discount rate increase due to hyperinflationary economy in Argentina.
Table 8.3
Development of reserves for losses and loss adjustment expenses
in USD millions Gross Ceded Net
2019 2018 2019 2018 2019 2018
As of January 1 60,913 65,368 (11,535) (11,070) 49,378 54,298Losses and loss adjustment expenses incurred:Current year 22,400 22,973 (5,151) (4,903) 17,249 18,071Prior years (769) (726) 186 52 (583) (674)Total incurred 21,631 22,248 (4,965) (4,851) 16,666 17,397Losses and loss adjustment expenses paid:Current year (8,782) (8,533) 1,095 1,209 (7,687) (7,324)Prior years (14,551) (14,393) 3,720 2,807 (10,831) (11,586)Total paid (23,333) (22,926) 4,815 4,016 (18,518) (18,910)Interest effects of discounted reserves 145 64 (3) (6) 142 59Acquisitions/(divestments) and transfers 1 17 (2,354) (519) 156 (502) (2,198)Foreign currency translation effects (209) (1,486) 70 219 (139) (1,267)As of December 31 59,165 60,913 (12,137) (11,535) 47,028 49,378
1 In 2019, the Group reclassified USD 177 million to liabilities held for sale in Germany (see note 5). In addition, a retroactive reinsurance agreement of a Non-Core Business portfolio resulted in a decrease of net reserves by USD 402 million. In 2018 the Group reclassified USD 1.8 billion to assets and liabilities held for sale in UK and Germany (see note 5). Additional movements mainly related to QBE and Travel Ace and Universal Assistance acquisitions (see note 5) and portfolio transfers in Germany and Australia with retroactive reinsurance agreements signed in 2018.
The Group establishes loss reserves, which are estimates of future payments of reported and unreported claims for losses and related expenses, with respect to insured events that have occurred. Reserving is a complex process dealing with uncertainty, requiring the use of informed estimates and judgments. Any changes in estimates or judgments are reflected in the results of operations in the period in which estimates and judgments are changed.
Zurich Insurance GroupAnnual Report 2019 215
Group overview Governance Risk review Financial review
Consolidated financial statements (continued)
Significant delays may occur in the notification and settlement of claims, and a substantial measure of experience and judgment is involved in assessing outstanding liabilities, the ultimate cost of which cannot be known with certainty as of the balance sheet date. The reserves for losses and loss adjustment expenses are determined on the basis of the information available. However, it is inherent in the nature of the business written that the ultimate liabilities may vary as a result of subsequent developments.
For the year ended December 31, 2019, the decrease of USD 2.3 billion in net reserves for losses and loss adjustment expenses is mainly driven by a decrease in North America Commercial due to higher reinsurance cessions in Property, as well as the disposal of U.S. asbestos and environmental liability insurance portfolios.
Net favorable reserve development emerged from reserves established in prior years amounting to USD 583 million mainly related to the following:
33 In EMEA, favorable prior year development of USD 423 million driven by motor and liability in retail segment;
33 In North America, favorable prior year development of USD 174 million driven by workers’ injury in retail and commercial segments.
For the year ended December 31, 2018, the decrease of USD 4.9 billion in net reserves for losses and loss adjustment expenses is mainly driven by reclassification of USD 1.8 billion to assets and liabilities held for sale (see note 5) and decrease of USD 1.3 billion due to foreign currency translation effects. In addition, certain portfolios with retroactive reinsurance agreements signed in 2018 in Germany and Australia were transferred to external parties, resulting in a decrease of net reserves of USD 690 million.
Net favorable reserve development emerged from reserves established in prior years amounting to USD 674 million mainly related to the following:
33 In EMEA, favorable prior year development of USD 357 million driven by motor and liability in retail;
33 In North America, favorable prior year development of USD 206 million driven by workers’ injury.
Zurich Insurance GroupAnnual Report 2019 216
Group overview Governance Risk review Financial review
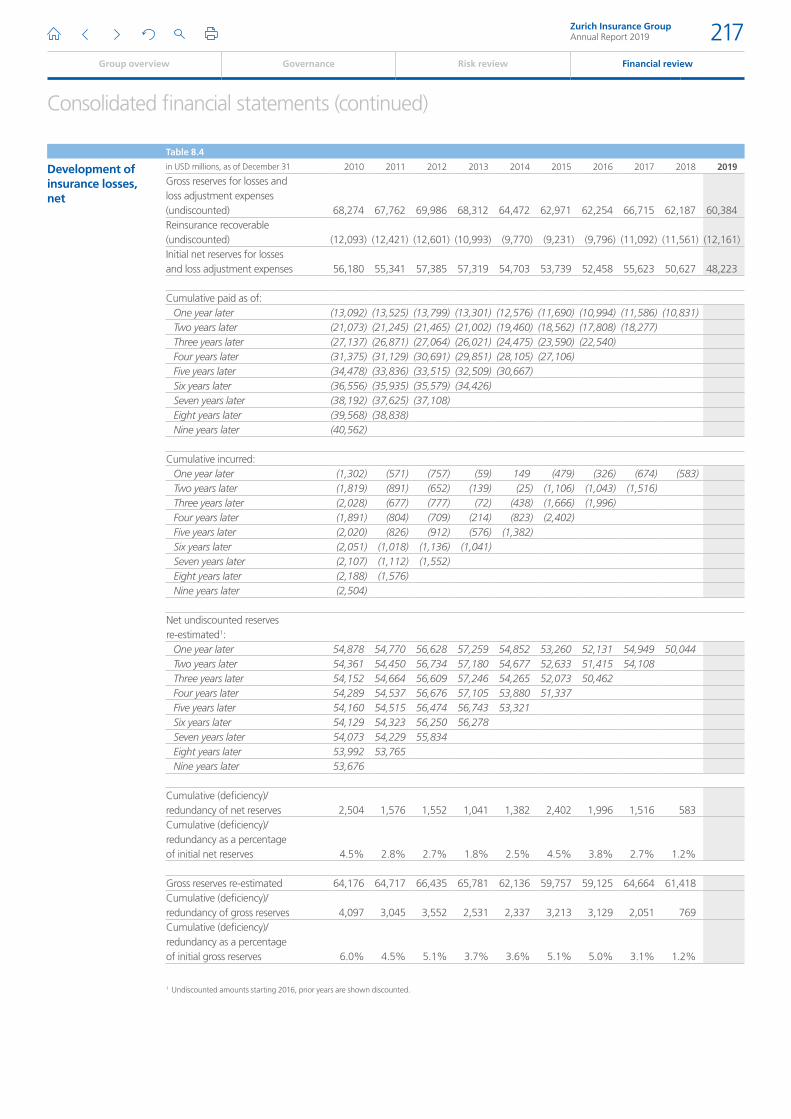
Consolidated financial statements (continued)
Table 8.4
Development of insurance losses, net
in USD millions, as of December 31 2010 2011 2012 2013 2014 2015 2016 2017 2018 2019
Gross reserves for losses and loss adjustment expenses (undiscounted) 68,274 67,762 69,986 68,312 64,472 62,971 62,254 66,715 62,187 60,384Reinsurance recoverable (undiscounted) (12,093) (12,421) (12,601) (10,993) (9,770) (9,231) (9,796) (11,092) (11,561) (12,161)Initial net reserves for losses and loss adjustment expenses 56,180 55,341 57,385 57,319 54,703 53,739 52,458 55,623 50,627 48,223
Cumulative paid as of:One year later (13,092) (13,525) (13,799) (13,301) (12,576) (11,690) (10,994) (11,586) (10,831)Two years later (21,073) (21,245) (21,465) (21,002) (19,460) (18,562) (17,808) (18,277)Three years later (27,137) (26,871) (27,064) (26,021) (24,475) (23,590) (22,540)Four years later (31,375) (31,129) (30,691) (29,851) (28,105) (27,106)Five years later (34,478) (33,836) (33,515) (32,509) (30,667)Six years later (36,556) (35,935) (35,579) (34,426)Seven years later (38,192) (37,625) (37,108)Eight years later (39,568) (38,838)Nine years later (40,562)
Cumulative incurred:One year later (1,302) (571) (757) (59) 149 (479) (326) (674) (583)Two years later (1,819) (891) (652) (139) (25) (1,106) (1,043) (1,516)Three years later (2,028) (677) (777) (72) (438) (1,666) (1,996)Four years later (1,891) (804) (709) (214) (823) (2,402)Five years later (2,020) (826) (912) (576) (1,382)Six years later (2,051) (1,018) (1,136) (1,041)Seven years later (2,107) (1,112) (1,552)Eight years later (2,188) (1,576)Nine years later (2,504)
Net undiscounted reserves re-estimated 1:
One year later 54,878 54,770 56,628 57,259 54,852 53,260 52,131 54,949 50,044Two years later 54,361 54,450 56,734 57,180 54,677 52,633 51,415 54,108Three years later 54,152 54,664 56,609 57,246 54,265 52,073 50,462Four years later 54,289 54,537 56,676 57,105 53,880 51,337Five years later 54,160 54,515 56,474 56,743 53,321Six years later 54,129 54,323 56,250 56,278Seven years later 54,073 54,229 55,834Eight years later 53,992 53,765Nine years later 53,676
Cumulative (deficiency)/ redundancy of net reserves 2,504 1,576 1,552 1,041 1,382 2,402 1,996 1,516 583Cumulative (deficiency)/ redundancy as a percentage of initial net reserves 4.5% 2.8% 2.7% 1.8% 2.5% 4.5% 3.8% 2.7% 1.2%
Gross reserves re-estimated 64,176 64,717 66,435 65,781 62,136 59,757 59,125 64,664 61,418Cumulative (deficiency)/ redundancy of gross reserves 4,097 3,045 3,552 2,531 2,337 3,213 3,129 2,051 769Cumulative (deficiency)/ redundancy as a percentage of initial gross reserves 6.0% 4.5% 5.1% 3.7% 3.6% 5.1% 5.0% 3.1% 1.2%
1 Undiscounted amounts starting 2016, prior years are shown discounted.
Zurich Insurance GroupAnnual Report 2019 217
Group overview Governance Risk review Financial review
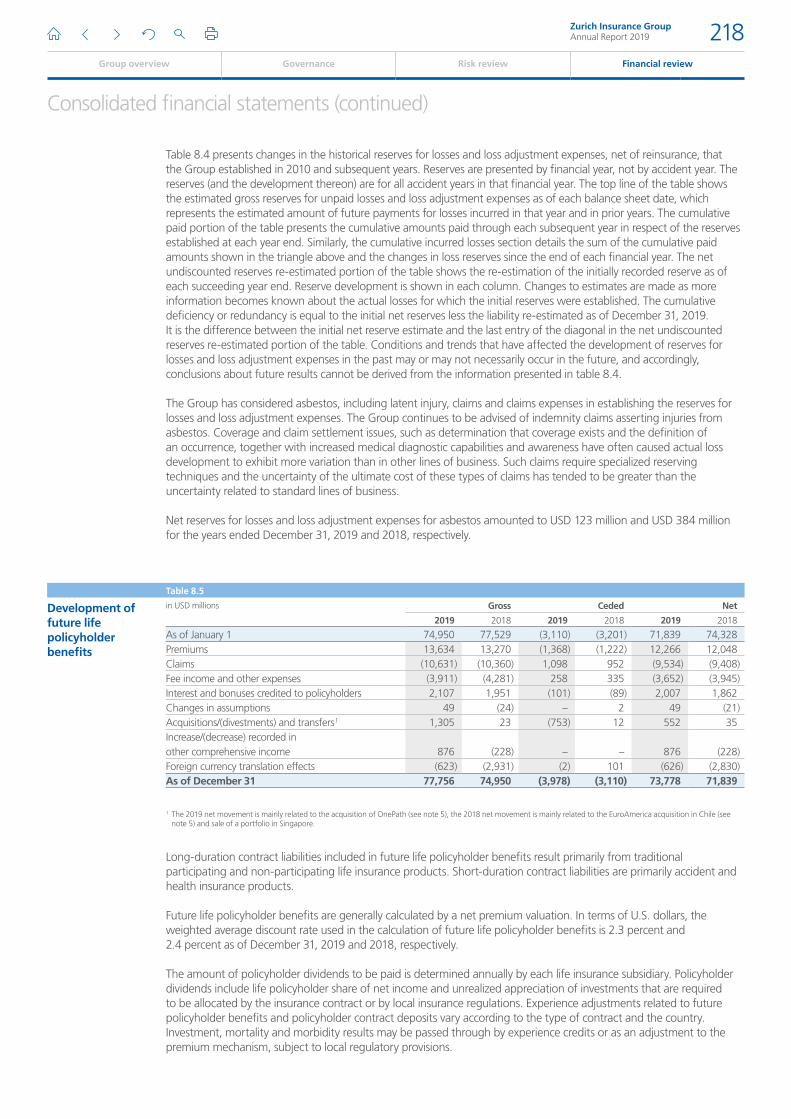
Consolidated financial statements (continued)
Table 8.4 presents changes in the historical reserves for losses and loss adjustment expenses, net of reinsurance, that the Group established in 2010 and subsequent years. Reserves are presented by financial year, not by accident year. The reserves (and the development thereon) are for all accident years in that financial year. The top line of the table shows the estimated gross reserves for unpaid losses and loss adjustment expenses as of each balance sheet date, which represents the estimated amount of future payments for losses incurred in that year and in prior years. The cumulative paid portion of the table presents the cumulative amounts paid through each subsequent year in respect of the reserves established at each year end. Similarly, the cumulative incurred losses section details the sum of the cumulative paid amounts shown in the triangle above and the changes in loss reserves since the end of each financial year. The net undiscounted reserves re-estimated portion of the table shows the re-estimation of the initially recorded reserve as of each succeeding year end. Reserve development is shown in each column. Changes to estimates are made as more information becomes known about the actual losses for which the initial reserves were established. The cumulative deficiency or redundancy is equal to the initial net reserves less the liability re-estimated as of December 31, 2019. It is the difference between the initial net reserve estimate and the last entry of the diagonal in the net undiscounted reserves re-estimated portion of the table. Conditions and trends that have affected the development of reserves for losses and loss adjustment expenses in the past may or may not necessarily occur in the future, and accordingly, conclusions about future results cannot be derived from the information presented in table 8.4.
The Group has considered asbestos, including latent injury, claims and claims expenses in establishing the reserves for losses and loss adjustment expenses. The Group continues to be advised of indemnity claims asserting injuries from asbestos. Coverage and claim settlement issues, such as determination that coverage exists and the definition of an occurrence, together with increased medical diagnostic capabilities and awareness have often caused actual loss development to exhibit more variation than in other lines of business. Such claims require specialized reserving techniques and the uncertainty of the ultimate cost of these types of claims has tended to be greater than the uncertainty related to standard lines of business.
Net reserves for losses and loss adjustment expenses for asbestos amounted to USD 123 million and USD 384 million for the years ended December 31, 2019 and 2018, respectively.
Table 8.5
Development of future life policyholder benefits
in USD millions Gross Ceded Net
2019 2018 2019 2018 2019 2018
As of January 1 74,950 77,529 (3,110) (3,201) 71,839 74,328Premiums 13,634 13,270 (1,368) (1,222) 12,266 12,048Claims (10,631) (10,360) 1,098 952 (9,534) (9,408)Fee income and other expenses (3,911) (4,281) 258 335 (3,652) (3,945)Interest and bonuses credited to policyholders 2,107 1,951 (101) (89) 2,007 1,862Changes in assumptions 49 (24) – 2 49 (21)Acquisitions/(divestments) and transfers 1 1,305 23 (753) 12 552 35Increase/(decrease) recorded in other comprehensive income 876 (228) – – 876 (228)Foreign currency translation effects (623) (2,931) (2) 101 (626) (2,830)As of December 31 77,756 74,950 (3,978) (3,110) 73,778 71,839
1 The 2019 net movement is mainly related to the acquisition of OnePath (see note 5), the 2018 net movement is mainly related to the EuroAmerica acquisition in Chile (see note 5) and sale of a portfolio in Singapore.
Long-duration contract liabilities included in future life policyholder benefits result primarily from traditional participating and non-participating life insurance products. Short-duration contract liabilities are primarily accident and health insurance products.
Future life policyholder benefits are generally calculated by a net premium valuation. In terms of U.S. dollars, the weighted average discount rate used in the calculation of future life policyholder benefits is 2.3 percent and 2.4 percent as of December 31, 2019 and 2018, respectively.
The amount of policyholder dividends to be paid is determined annually by each life insurance subsidiary. Policyholder dividends include life policyholder share of net income and unrealized appreciation of investments that are required to be allocated by the insurance contract or by local insurance regulations. Experience adjustments related to future policyholder benefits and policyholder contract deposits vary according to the type of contract and the country. Investment, mortality and morbidity results may be passed through by experience credits or as an adjustment to the premium mechanism, subject to local regulatory provisions.
Zurich Insurance GroupAnnual Report 2019 218
Group overview Governance Risk review Financial review
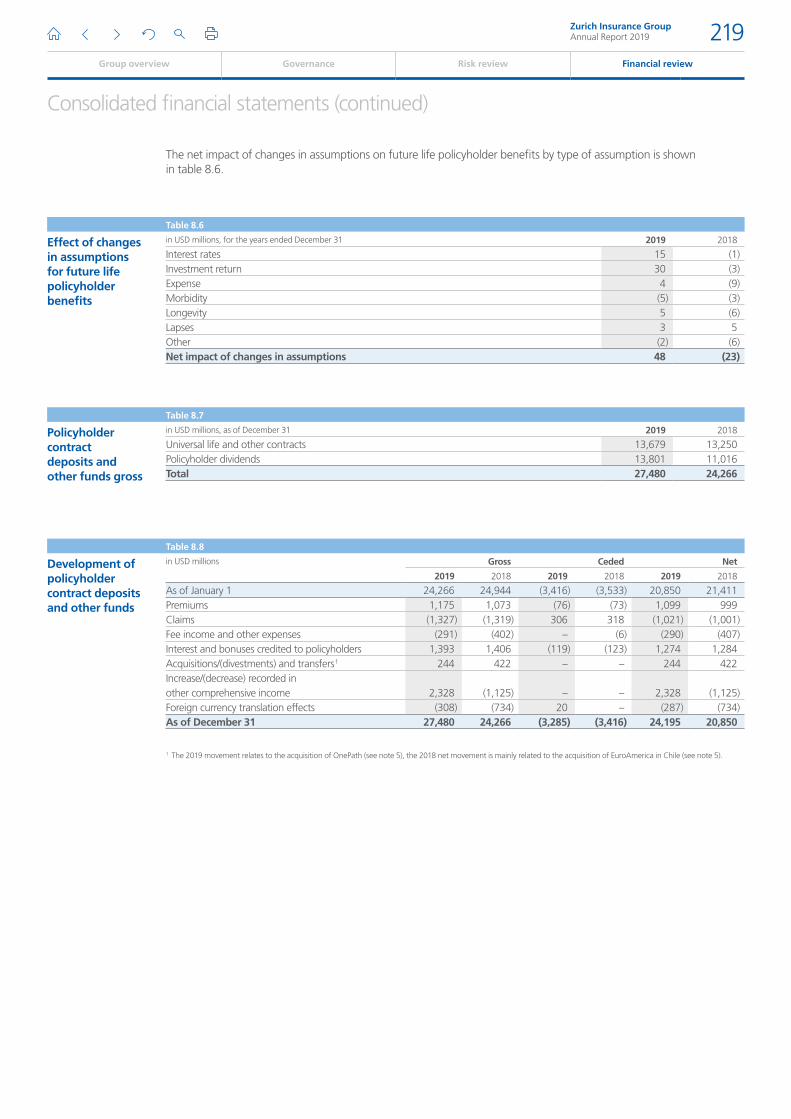
Consolidated financial statements (continued)
The net impact of changes in assumptions on future life policyholder benefits by type of assumption is shown in table 8.6.
Table 8.6
Effect of changes in assumptions for future life policyholder benefits
in USD millions, for the years ended December 31 2019 2018
Interest rates 15 (1)Investment return 30 (3)Expense 4 (9)Morbidity (5) (3)Longevity 5 (6)Lapses 3 5Other (2) (6)Net impact of changes in assumptions 48 (23)
Table 8.7
Policyholder contract deposits and other funds gross
in USD millions, as of December 31 2019 2018
Universal life and other contracts 13,679 13,250Policyholder dividends 13,801 11,016Total 27,480 24,266
Table 8.8
Development of policyholder contract deposits and other funds
in USD millions Gross Ceded Net
2019 2018 2019 2018 2019 2018
As of January 1 24,266 24,944 (3,416) (3,533) 20,850 21,411Premiums 1,175 1,073 (76) (73) 1,099 999Claims (1,327) (1,319) 306 318 (1,021) (1,001)Fee income and other expenses (291) (402) – (6) (290) (407)Interest and bonuses credited to policyholders 1,393 1,406 (119) (123) 1,274 1,284Acquisitions/(divestments) and transfers 1 244 422 – – 244 422Increase/(decrease) recorded in other comprehensive income 2,328 (1,125) – – 2,328 (1,125)Foreign currency translation effects (308) (734) 20 – (287) (734)As of December 31 27,480 24,266 (3,285) (3,416) 24,195 20,850
1 The 2019 movement relates to the acquisition of OnePath (see note 5), the 2018 net movement is mainly related to the acquisition of EuroAmerica in Chile (see note 5).
Zurich Insurance GroupAnnual Report 2019 219
Group overview Governance Risk review Financial review
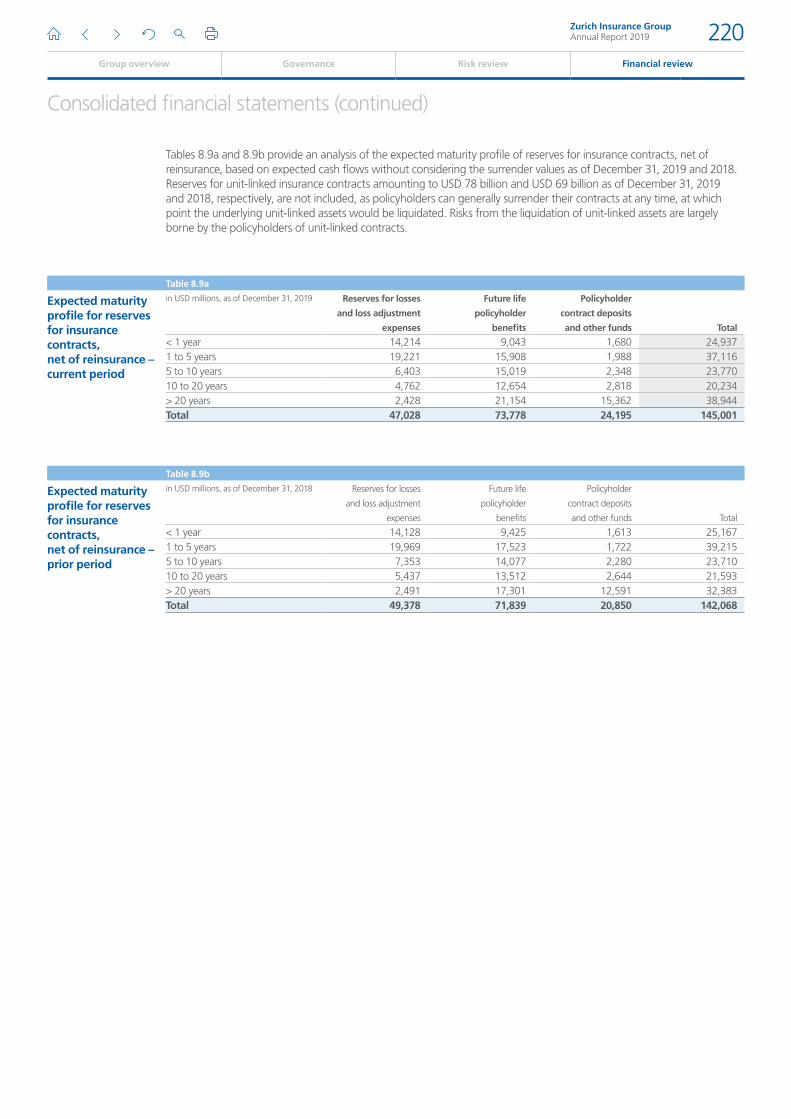
Consolidated financial statements (continued)
Tables 8.9a and 8.9b provide an analysis of the expected maturity profile of reserves for insurance contracts, net of reinsurance, based on expected cash flows without considering the surrender values as of December 31, 2019 and 2018. Reserves for unit-linked insurance contracts amounting to USD 78 billion and USD 69 billion as of December 31, 2019 and 2018, respectively, are not included, as policyholders can generally surrender their contracts at any time, at which point the underlying unit-linked assets would be liquidated. Risks from the liquidation of unit-linked assets are largely borne by the policyholders of unit-linked contracts.
Table 8.9a
Expected maturity profile for reserves for insurance contracts, net of reinsurance – current period
in USD millions, as of December 31, 2019 Reserves for losses
and loss adjustment
expenses
Future life
policyholder
benefits
Policyholder
contract deposits
and other funds Total
< 1 year 14,214 9,043 1,680 24,9371 to 5 years 19,221 15,908 1,988 37,1165 to 10 years 6,403 15,019 2,348 23,77010 to 20 years 4,762 12,654 2,818 20,234> 20 years 2,428 21,154 15,362 38,944Total 47,028 73,778 24,195 145,001
Table 8.9b
Expected maturity profile for reserves for insurance contracts, net of reinsurance – prior period
in USD millions, as of December 31, 2018 Reserves for losses
and loss adjustment
expenses
Future life
policyholder
benefits
Policyholder
contract deposits
and other funds Total
< 1 year 14,128 9,425 1,613 25,1671 to 5 years 19,969 17,523 1,722 39,2155 to 10 years 7,353 14,077 2,280 23,71010 to 20 years 5,437 13,512 2,644 21,593> 20 years 2,491 17,301 12,591 32,383Total 49,378 71,839 20,850 142,068
Zurich Insurance GroupAnnual Report 2019 220
Group overview Governance Risk review Financial review
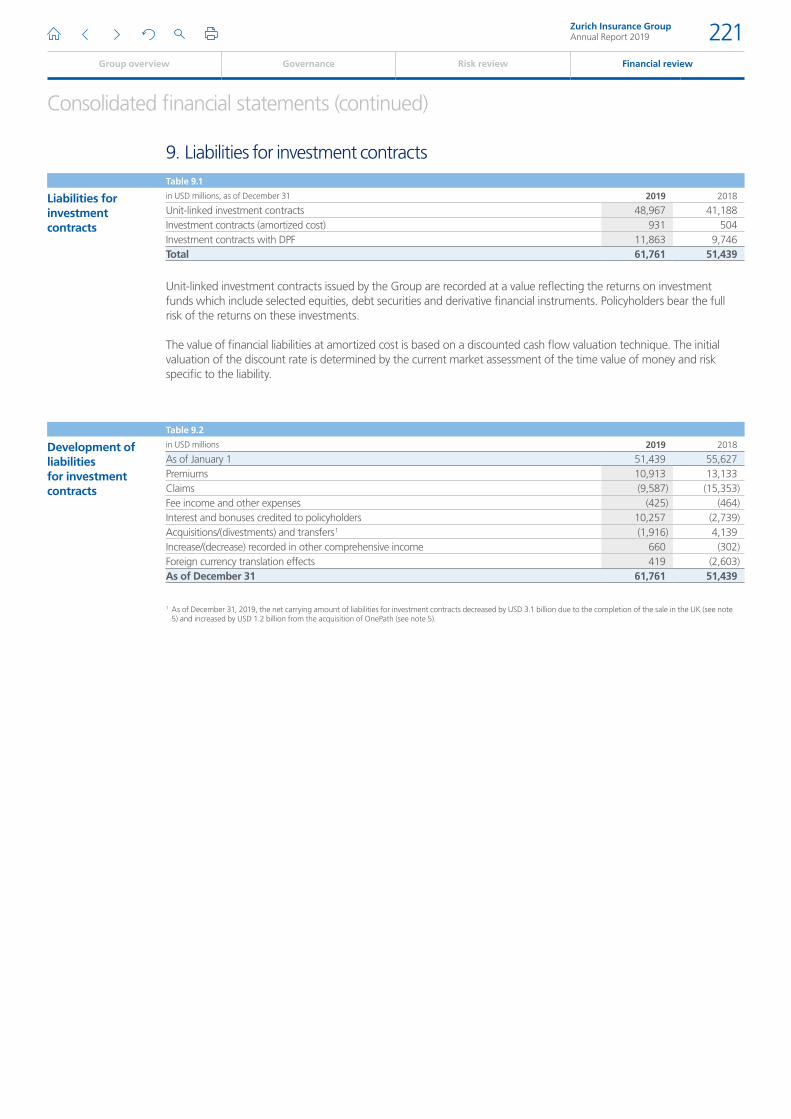
Consolidated financial statements (continued)
9. Liabilities for investment contractsTable 9.1
Liabilities for investment contracts
in USD millions, as of December 31 2019 2018
Unit-linked investment contracts 48,967 41,188Investment contracts (amortized cost) 931 504Investment contracts with DPF 11,863 9,746Total 61,761 51,439
Unit-linked investment contracts issued by the Group are recorded at a value reflecting the returns on investment funds which include selected equities, debt securities and derivative financial instruments. Policyholders bear the full risk of the returns on these investments.
The value of financial liabilities at amortized cost is based on a discounted cash flow valuation technique. The initial valuation of the discount rate is determined by the current market assessment of the time value of money and risk specific to the liability.
Table 9.2
Development of liabilities for investment contracts
in USD millions 2019 2018
As of January 1 51,439 55,627Premiums 10,913 13,133Claims (9,587) (15,353)Fee income and other expenses (425) (464)Interest and bonuses credited to policyholders 10,257 (2,739)Acquisitions/(divestments) and transfers 1 (1,916) 4,139Increase/(decrease) recorded in other comprehensive income 660 (302)Foreign currency translation effects 419 (2,603)As of December 31 61,761 51,439
1 As of December 31, 2019, the net carrying amount of liabilities for investment contracts decreased by USD 3.1 billion due to the completion of the sale in the UK (see note 5) and increased by USD 1.2 billion from the acquisition of OnePath (see note 5).
Zurich Insurance GroupAnnual Report 2019 221
Group overview Governance Risk review Financial review
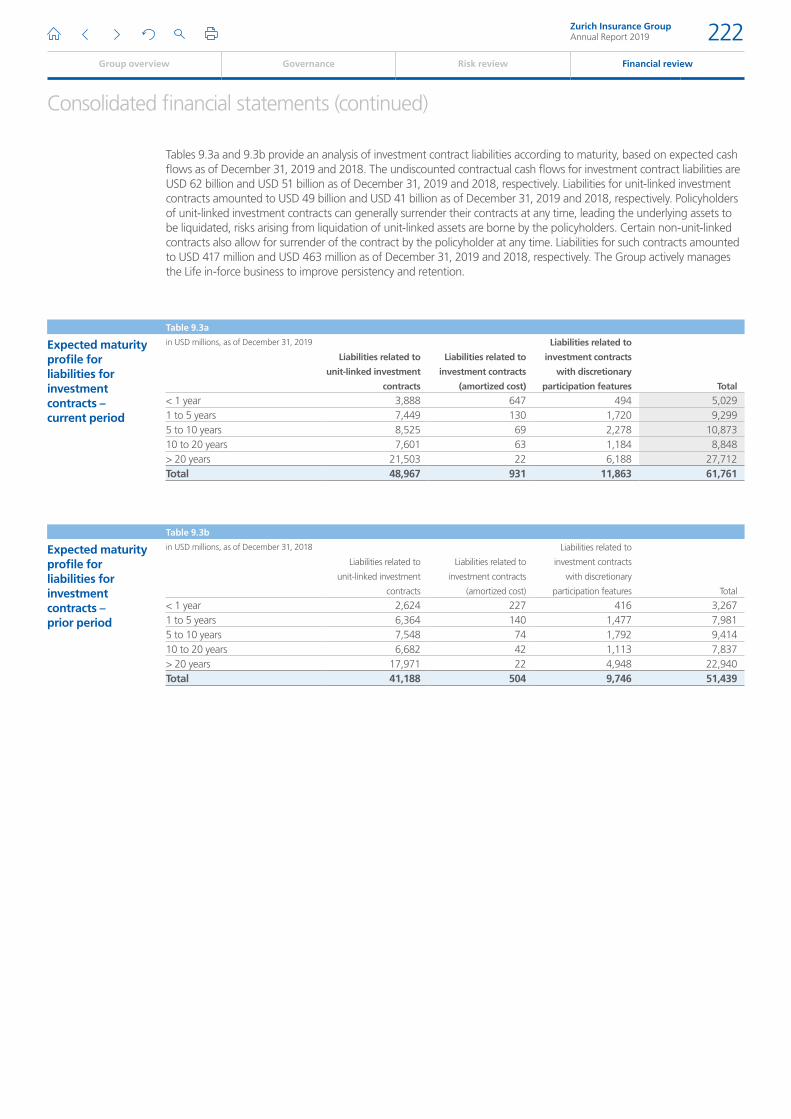
Consolidated financial statements (continued)
Tables 9.3a and 9.3b provide an analysis of investment contract liabilities according to maturity, based on expected cash flows as of December 31, 2019 and 2018. The undiscounted contractual cash flows for investment contract liabilities are USD 62 billion and USD 51 billion as of December 31, 2019 and 2018, respectively. Liabilities for unit-linked investment contracts amounted to USD 49 billion and USD 41 billion as of December 31, 2019 and 2018, respectively. Policyholders of unit-linked investment contracts can generally surrender their contracts at any time, leading the underlying assets to be liquidated, risks arising from liquidation of unit-linked assets are borne by the policyholders. Certain non-unit-linked contracts also allow for surrender of the contract by the policyholder at any time. Liabilities for such contracts amounted to USD 417 million and USD 463 million as of December 31, 2019 and 2018, respectively. The Group actively manages the Life in-force business to improve persistency and retention.
Table 9.3a
Expected maturity profile for liabilities for investment contracts – current period
in USD millions, as of December 31, 2019
Liabilities related to
unit-linked investment
contracts
Liabilities related to
investment contracts
(amortized cost)
Liabilities related to
investment contracts
with discretionary
participation features Total
< 1 year 3,888 647 494 5,0291 to 5 years 7,449 130 1,720 9,2995 to 10 years 8,525 69 2,278 10,87310 to 20 years 7,601 63 1,184 8,848> 20 years 21,503 22 6,188 27,712Total 48,967 931 11,863 61,761
Table 9.3b
Expected maturity profile for liabilities for investment contracts – prior period
in USD millions, as of December 31, 2018
Liabilities related to
unit-linked investment
contracts
Liabilities related to
investment contracts
(amortized cost)
Liabilities related to
investment contracts
with discretionary
participation features Total
< 1 year 2,624 227 416 3,2671 to 5 years 6,364 140 1,477 7,9815 to 10 years 7,548 74 1,792 9,41410 to 20 years 6,682 42 1,113 7,837> 20 years 17,971 22 4,948 22,940Total 41,188 504 9,746 51,439
Zurich Insurance GroupAnnual Report 2019 222
Group overview Governance Risk review Financial review
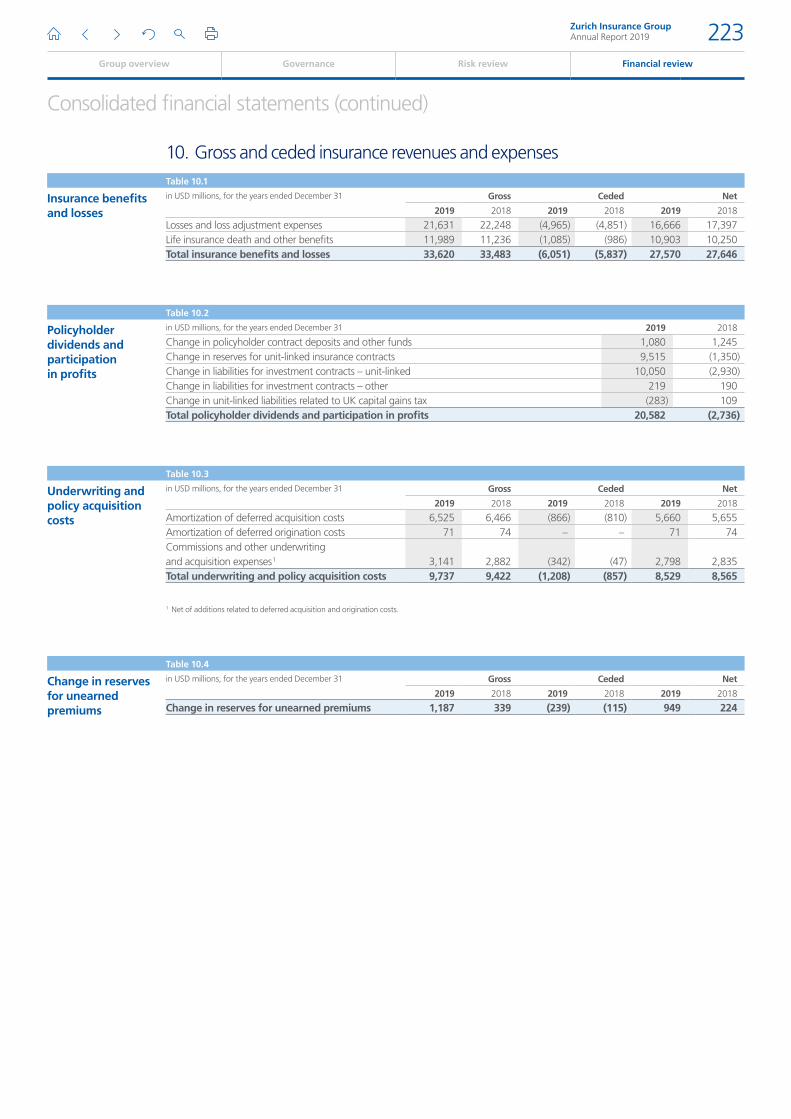
Consolidated financial statements (continued)
10. Gross and ceded insurance revenues and expensesTable 10.1
Insurance benefits and losses
in USD millions, for the years ended December 31 Gross Ceded Net
2019 2018 2019 2018 2019 2018
Losses and loss adjustment expenses 21,631 22,248 (4,965) (4,851) 16,666 17,397Life insurance death and other benefits 11,989 11,236 (1,085) (986) 10,903 10,250Total insurance benefits and losses 33,620 33,483 (6,051) (5,837) 27,570 27,646
Table 10.2
Policyholder dividends and participation in profits
in USD millions, for the years ended December 31 2019 2018
Change in policyholder contract deposits and other funds 1,080 1,245Change in reserves for unit-linked insurance contracts 9,515 (1,350)Change in liabilities for investment contracts – unit-linked 10,050 (2,930)Change in liabilities for investment contracts – other 219 190Change in unit-linked liabilities related to UK capital gains tax (283) 109Total policyholder dividends and participation in profits 20,582 (2,736)
Table 10.3
Underwriting and policy acquisition costs
in USD millions, for the years ended December 31 Gross Ceded Net
2019 2018 2019 2018 2019 2018
Amortization of deferred acquisition costs 6,525 6,466 (866) (810) 5,660 5,655Amortization of deferred origination costs 71 74 – – 71 74Commissions and other underwriting and acquisition expenses 1 3,141 2,882 (342) (47) 2,798 2,835Total underwriting and policy acquisition costs 9,737 9,422 (1,208) (857) 8,529 8,565
1 Net of additions related to deferred acquisition and origination costs.
Table 10.4
Change in reserves for unearned premiums
in USD millions, for the years ended December 31 Gross Ceded Net
2019 2018 2019 2018 2019 2018
Change in reserves for unearned premiums 1,187 339 (239) (115) 949 224
Zurich Insurance GroupAnnual Report 2019 223
Group overview Governance Risk review Financial review
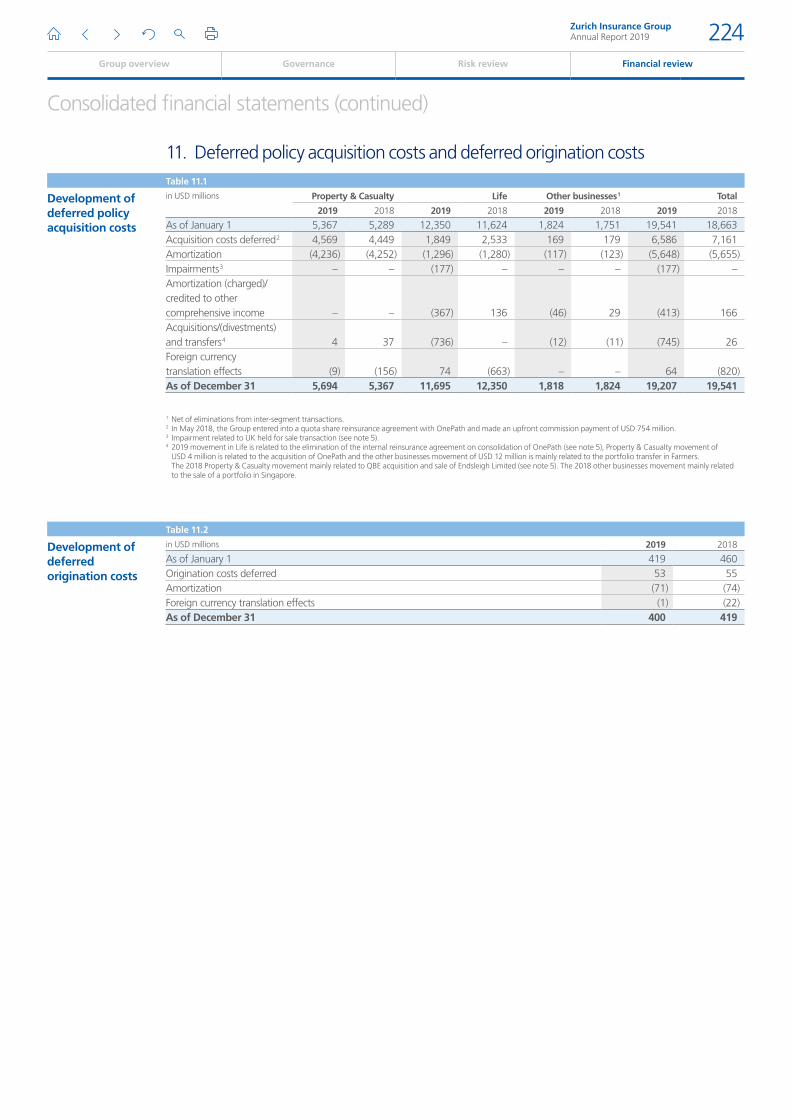
Consolidated financial statements (continued)
11. Deferred policy acquisition costs and deferred origination costsTable 11.1
Development of deferred policy acquisition costs
in USD millions Property & Casualty Life Other businesses 1 Total
2019 2018 2019 2018 2019 2018 2019 2018
As of January 1 5,367 5,289 12,350 11,624 1,824 1,751 19,541 18,663Acquisition costs deferred 2 4,569 4,449 1,849 2,533 169 179 6,586 7,161Amortization (4,236) (4,252) (1,296) (1,280) (117) (123) (5,648) (5,655)Impairments 3 – – (177) – – – (177) –Amortization (charged)/ credited to other comprehensive income – – (367) 136 (46) 29 (413) 166Acquisitions/(divestments) and transfers 4 4 37 (736) – (12) (11) (745) 26Foreign currency translation effects (9) (156) 74 (663) – – 64 (820)As of December 31 5,694 5,367 11,695 12,350 1,818 1,824 19,207 19,541
1 Net of eliminations from inter-segment transactions.2 In May 2018, the Group entered into a quota share reinsurance agreement with OnePath and made an upfront commission payment of USD 754 million.3 Impairment related to UK held for sale transaction (see note 5).4 2019 movement in Life is related to the elimination of the internal reinsurance agreement on consolidation of OnePath (see note 5), Property & Casualty movement of
USD 4 million is related to the acquisition of OnePath and the other businesses movement of USD 12 million is mainly related to the portfolio transfer in Farmers. The 2018 Property & Casualty movement mainly related to QBE acquisition and sale of Endsleigh Limited (see note 5). The 2018 other businesses movement mainly related to the sale of a portfolio in Singapore.
Table 11.2
Development of deferred origination costs
in USD millions 2019 2018
As of January 1 419 460Origination costs deferred 53 55Amortization (71) (74)Foreign currency translation effects (1) (22)As of December 31 400 419
Zurich Insurance GroupAnnual Report 2019 224
Group overview Governance Risk review Financial review
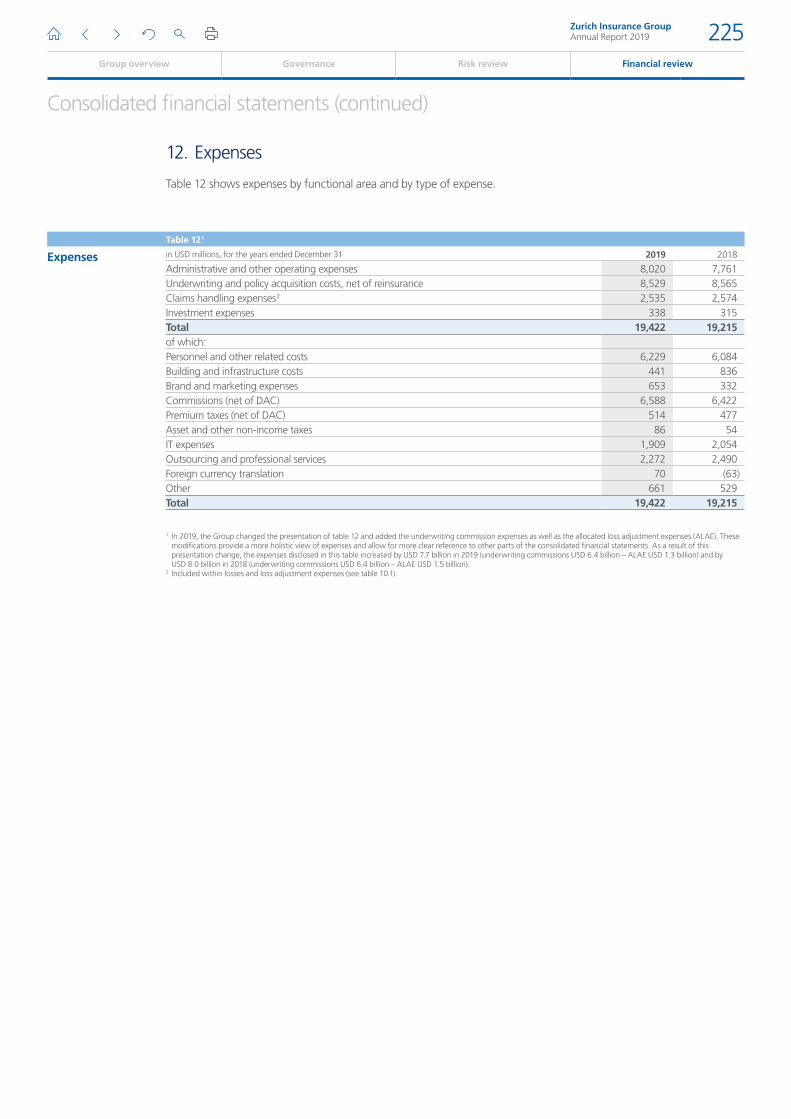
Consolidated financial statements (continued)
12. Expenses
Table 12 shows expenses by functional area and by type of expense.
Table 12 1
Expenses in USD millions, for the years ended December 31 2019 2018
Administrative and other operating expenses 8,020 7,761Underwriting and policy acquisition costs, net of reinsurance 8,529 8,565Claims handling expenses 2 2,535 2,574Investment expenses 338 315Total 19,422 19,215of which:Personnel and other related costs 6,229 6,084Building and infrastructure costs 441 836Brand and marketing expenses 653 332Commissions (net of DAC) 6,588 6,422Premium taxes (net of DAC) 514 477Asset and other non-income taxes 86 54IT expenses 1,909 2,054Outsourcing and professional services 2,272 2,490Foreign currency translation 70 (63)Other 661 529Total 19,422 19,215
1 In 2019, the Group changed the presentation of table 12 and added the underwriting commission expenses as well as the allocated loss adjustment expenses (ALAE). These modifications provide a more holistic view of expenses and allow for more clear reference to other parts of the consolidated financial statements. As a result of this presentation change, the expenses disclosed in this table increased by USD 7.7 billion in 2019 (underwriting commissions USD 6.4 billion – ALAE USD 1.3 billion) and by USD 8.0 billion in 2018 (underwriting commissions USD 6.4 billion – ALAE USD 1.5 billion).
2 Included within losses and loss adjustment expenses (see table 10.1).
Zurich Insurance GroupAnnual Report 2019 225
Group overview Governance Risk review Financial review
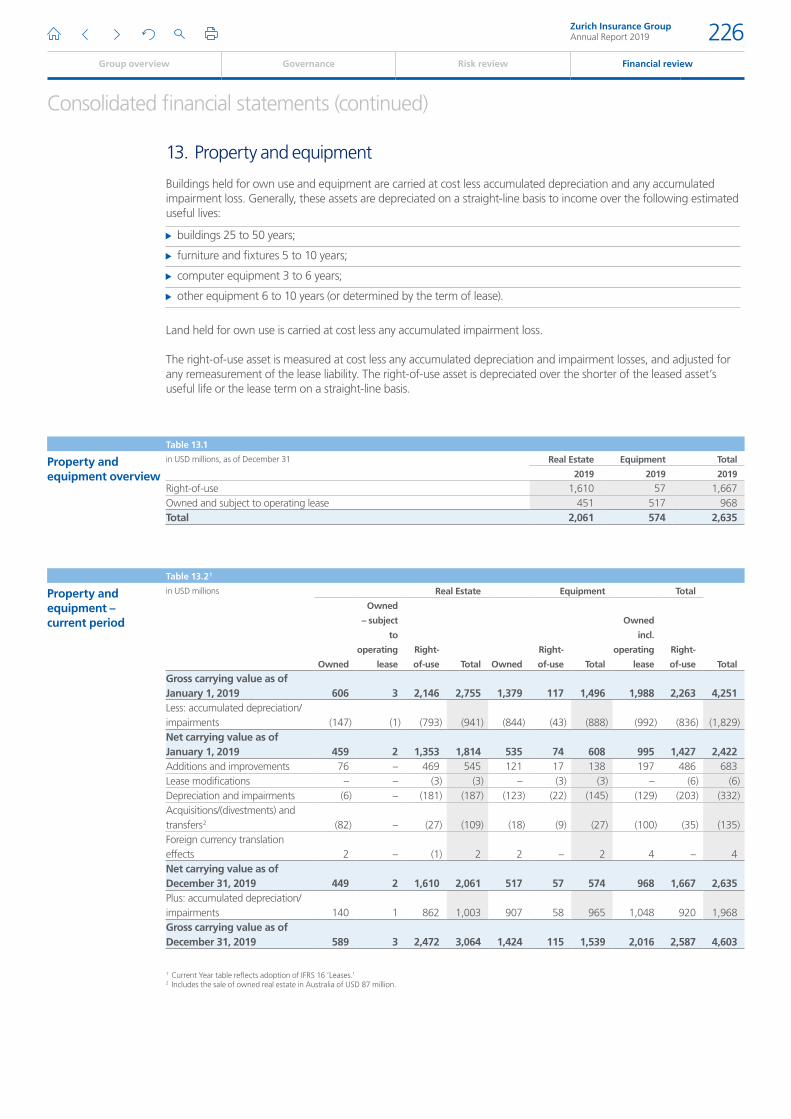
Consolidated financial statements (continued)
13. Property and equipment
Buildings held for own use and equipment are carried at cost less accumulated depreciation and any accumulated impairment loss. Generally, these assets are depreciated on a straight-line basis to income over the following estimated useful lives:
33 buildings 25 to 50 years;
33 furniture and fixtures 5 to 10 years;
33 computer equipment 3 to 6 years;
33 other equipment 6 to 10 years (or determined by the term of lease).
Land held for own use is carried at cost less any accumulated impairment loss.
The right-of-use asset is measured at cost less any accumulated depreciation and impairment losses, and adjusted for any remeasurement of the lease liability. The right-of-use asset is depreciated over the shorter of the leased asset’s useful life or the lease term on a straight-line basis.
Table 13.1
Property and equipment overview
in USD millions, as of December 31 Real Estate Equipment Total
2019 2019 2019
Right-of-use 1,610 57 1,667Owned and subject to operating lease 451 517 968Total 2,061 574 2,635
Table 13.2 1
Property and equipment – current period
in USD millions Real Estate Equipment Total
TotalOwned
Owned
– subject
to
operating
lease
Right-
of-use Total Owned
Right-
of-use Total
Owned
incl.
operating
lease
Right-
of-use
Gross carrying value as of January 1, 2019 606 3 2,146 2,755 1,379 117 1,496 1,988 2,263 4,251Less: accumulated depreciation/impairments (147) (1) (793) (941) (844) (43) (888) (992) (836) (1,829)Net carrying value as of January 1, 2019 459 2 1,353 1,814 535 74 608 995 1,427 2,422Additions and improvements 76 – 469 545 121 17 138 197 486 683Lease modifications – – (3) (3) – (3) (3) – (6) (6)Depreciation and impairments (6) – (181) (187) (123) (22) (145) (129) (203) (332)Acquisitions/(divestments) and transfers 2 (82) – (27) (109) (18) (9) (27) (100) (35) (135)Foreign currency translation effects 2 – (1) 2 2 – 2 4 – 4Net carrying value as of December 31, 2019 449 2 1,610 2,061 517 57 574 968 1,667 2,635Plus: accumulated depreciation/impairments 140 1 862 1,003 907 58 965 1,048 920 1,968Gross carrying value as of December 31, 2019 589 3 2,472 3,064 1,424 115 1,539 2,016 2,587 4,603
1 Current Year table reflects adoption of IFRS 16 ’Leases.’ 2 Includes the sale of owned real estate in Australia of USD 87 million.
Zurich Insurance GroupAnnual Report 2019 226
Group overview Governance Risk review Financial review
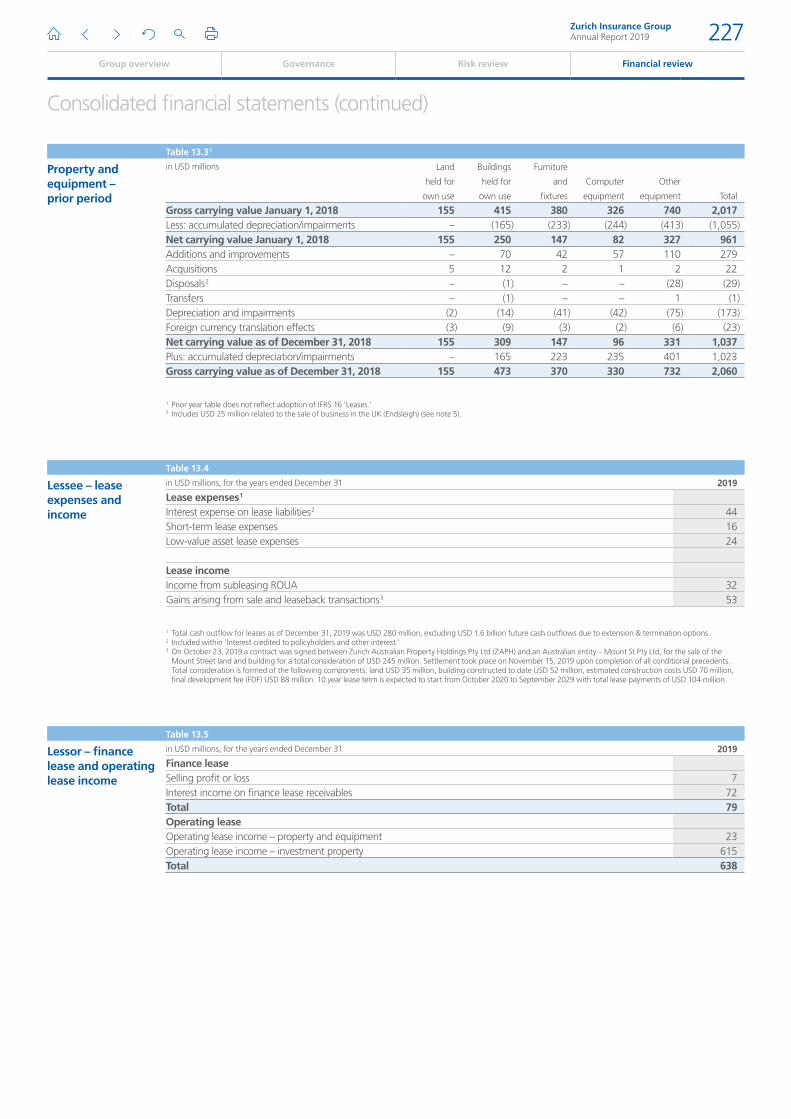
Consolidated financial statements (continued)
Table 13.3 1
Property and equipment – prior period
in USD millions Land
held for
own use
Buildings
held for
own use
Furniture
and
fixtures
Computer
equipment
Other
equipment Total
Gross carrying value January 1, 2018 155 415 380 326 740 2,017Less: accumulated depreciation/impairments – (165) (233) (244) (413) (1,055)Net carrying value January 1, 2018 155 250 147 82 327 961Additions and improvements – 70 42 57 110 279Acquisitions 5 12 2 1 2 22Disposals 2 – (1) – – (28) (29)Transfers – (1) – – 1 (1)Depreciation and impairments (2) (14) (41) (42) (75) (173)Foreign currency translation effects (3) (9) (3) (2) (6) (23)Net carrying value as of December 31, 2018 155 309 147 96 331 1,037Plus: accumulated depreciation/impairments – 165 223 235 401 1,023Gross carrying value as of December 31, 2018 155 473 370 330 732 2,060
1 Prior year table does not reflect adoption of IFRS 16 ’Leases.’2 Includes USD 25 million related to the sale of business in the UK (Endsleigh) (see note 5).
Table 13.4
Lessee – lease expenses and income
in USD millions, for the years ended December 31 2019
Lease expenses 1
Interest expense on lease liabilities 2 44Short-term lease expenses 16Low-value asset lease expenses 24
Lease incomeIncome from subleasing ROUA 32Gains arising from sale and leaseback transactions 3 53
1 Total cash outflow for leases as of December 31, 2019 was USD 280 million, excluding USD 1.6 billion future cash outflows due to extension & termination options.2 Included within ’Interest credited to policyholders and other interest.’3 On October 23, 2019 a contract was signed between Zurich Australian Property Holdings Pty Ltd (ZAPH) and an Australian entity – Mount St Pty Ltd, for the sale of the
Mount Street land and building for a total consideration of USD 245 million. Settlement took place on November 15, 2019 upon completion of all conditional precedents. Total consideration is formed of the following components: land USD 35 million, building constructed to date USD 52 million, estimated construction costs USD 70 million, final development fee (FDF) USD 88 million. 10 year lease term is expected to start from October 2020 to September 2029 with total lease payments of USD 104 million.
Table 13.5
Lessor – finance lease and operating lease income
in USD millions, for the years ended December 31 2019
Finance leaseSelling profit or loss 7Interest income on finance lease receivables 72Total 79Operating leaseOperating lease income – property and equipment 23Operating lease income – investment property 615Total 638
Zurich Insurance GroupAnnual Report 2019 227
Group overview Governance Risk review Financial review
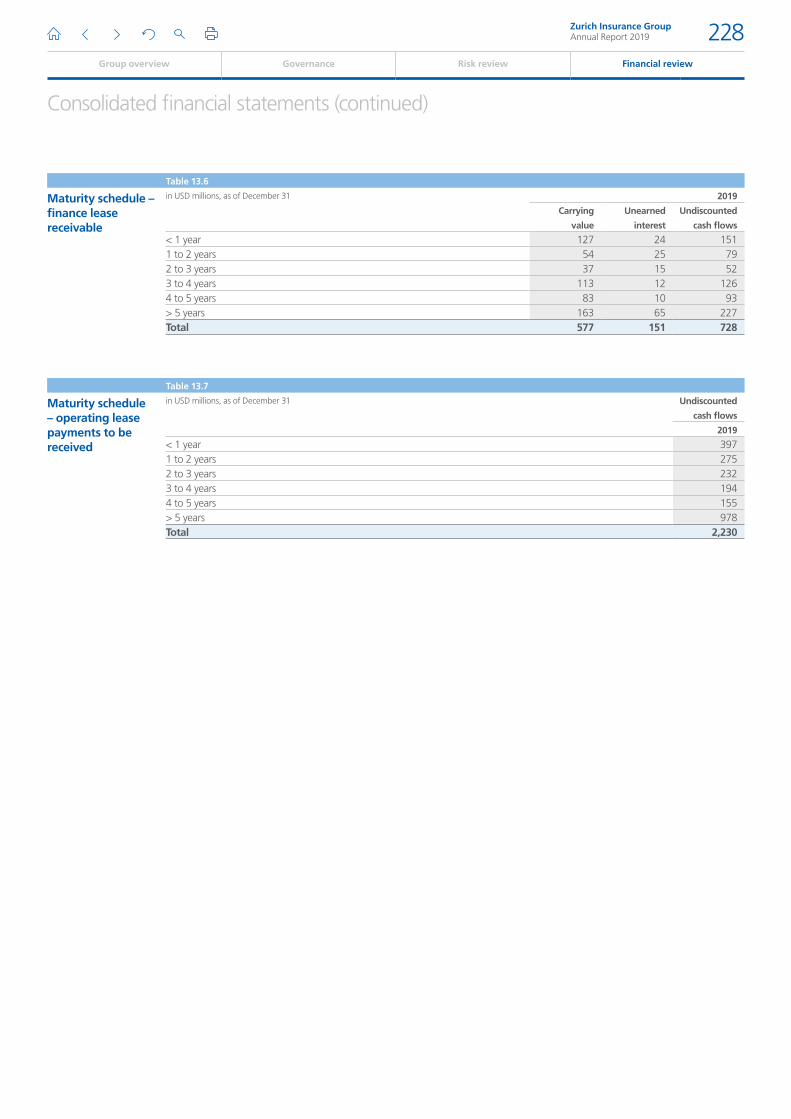
Consolidated financial statements (continued)
Table 13.6
Maturity schedule – finance lease receivable
in USD millions, as of December 31 2019
Carrying
value
Unearned
interest
Undiscounted
cash flows
< 1 year 127 24 1511 to 2 years 54 25 792 to 3 years 37 15 523 to 4 years 113 12 1264 to 5 years 83 10 93> 5 years 163 65 227Total 577 151 728
Table 13.7
Maturity schedule – operating lease payments to be received
in USD millions, as of December 31 Undiscounted
cash flows
2019
< 1 year 3971 to 2 years 2752 to 3 years 2323 to 4 years 1944 to 5 years 155> 5 years 978Total 2,230
Zurich Insurance GroupAnnual Report 2019 228
Group overview Governance Risk review Financial review
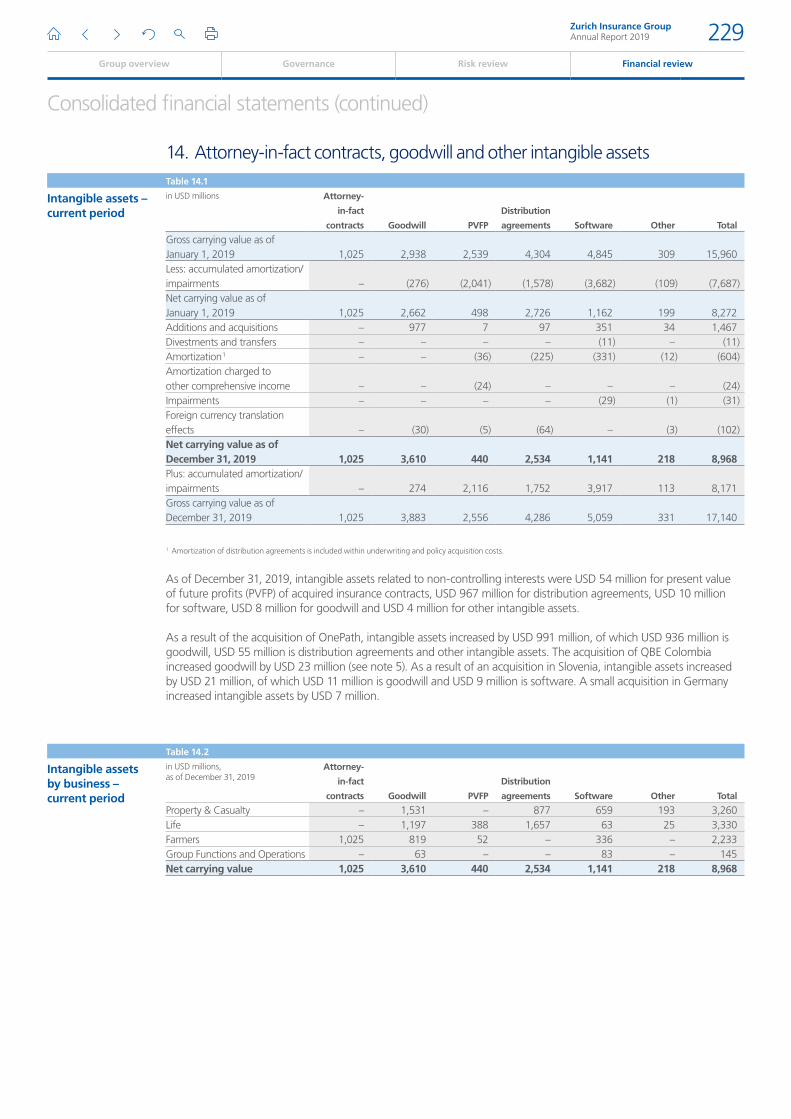
Consolidated financial statements (continued)
14. Attorney-in-fact contracts, goodwill and other intangible assetsTable 14.1
Intangible assets – current period
in USD millions Attorney-
in-fact
contracts Goodwill PVFP
Distribution
agreements Software Other Total
Gross carrying value as of January 1, 2019 1,025 2,938 2,539 4,304 4,845 309 15,960Less: accumulated amortization/impairments – (276) (2,041) (1,578) (3,682) (109) (7,687)Net carrying value as of January 1, 2019 1,025 2,662 498 2,726 1,162 199 8,272Additions and acquisitions – 977 7 97 351 34 1,467Divestments and transfers – – – – (11) – (11)Amortization 1 – – (36) (225) (331) (12) (604)Amortization charged to other comprehensive income – – (24) – – – (24)Impairments – – – – (29) (1) (31)Foreign currency translation effects – (30) (5) (64) – (3) (102)Net carrying value as of December 31, 2019 1,025 3,610 440 2,534 1,141 218 8,968Plus: accumulated amortization/impairments – 274 2,116 1,752 3,917 113 8,171Gross carrying value as of December 31, 2019 1,025 3,883 2,556 4,286 5,059 331 17,140
1 Amortization of distribution agreements is included within underwriting and policy acquisition costs.
As of December 31, 2019, intangible assets related to non-controlling interests were USD 54 million for present value of future profits (PVFP) of acquired insurance contracts, USD 967 million for distribution agreements, USD 10 million for software, USD 8 million for goodwill and USD 4 million for other intangible assets.
As a result of the acquisition of OnePath, intangible assets increased by USD 991 million, of which USD 936 million is goodwill, USD 55 million is distribution agreements and other intangible assets. The acquisition of QBE Colombia increased goodwill by USD 23 million (see note 5). As a result of an acquisition in Slovenia, intangible assets increased by USD 21 million, of which USD 11 million is goodwill and USD 9 million is software. A small acquisition in Germany increased intangible assets by USD 7 million.
Table 14.2
Intangible assets by business – current period
in USD millions, as of December 31, 2019
Attorney-
in-fact
contracts Goodwill PVFP
Distribution
agreements Software Other Total
Property & Casualty – 1,531 – 877 659 193 3,260Life – 1,197 388 1,657 63 25 3,330Farmers 1,025 819 52 – 336 – 2,233Group Functions and Operations – 63 – – 83 – 145Net carrying value 1,025 3,610 440 2,534 1,141 218 8,968
Zurich Insurance GroupAnnual Report 2019 229
Group overview Governance Risk review Financial review
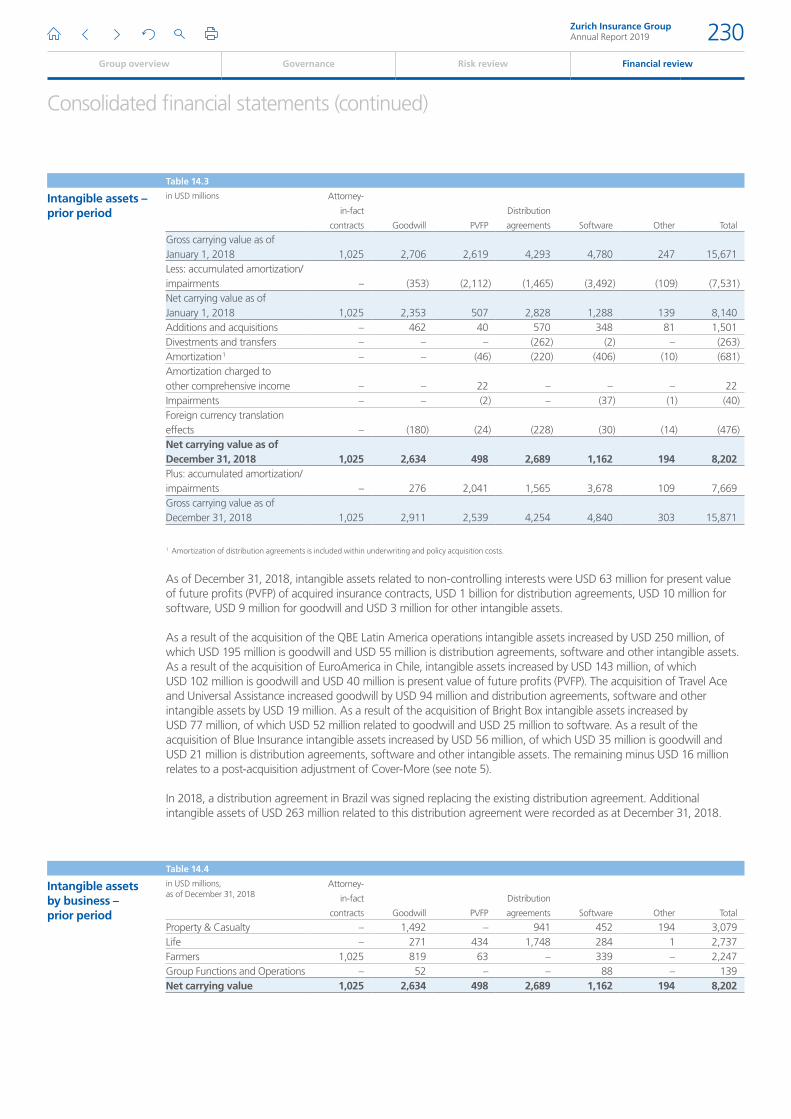
Consolidated financial statements (continued)
Table 14.3
Intangible assets – prior period
in USD millions Attorney-
in-fact
contracts Goodwill PVFP
Distribution
agreements Software Other Total
Gross carrying value as of January 1, 2018 1,025 2,706 2,619 4,293 4,780 247 15,671Less: accumulated amortization/impairments – (353) (2,112) (1,465) (3,492) (109) (7,531)Net carrying value as of January 1, 2018 1,025 2,353 507 2,828 1,288 139 8,140Additions and acquisitions – 462 40 570 348 81 1,501Divestments and transfers – – – (262) (2) – (263)Amortization 1 – – (46) (220) (406) (10) (681)Amortization charged to other comprehensive income – – 22 – – – 22Impairments – – (2) – (37) (1) (40)Foreign currency translation effects – (180) (24) (228) (30) (14) (476)Net carrying value as of December 31, 2018 1,025 2,634 498 2,689 1,162 194 8,202Plus: accumulated amortization/impairments – 276 2,041 1,565 3,678 109 7,669Gross carrying value as of December 31, 2018 1,025 2,911 2,539 4,254 4,840 303 15,871
1 Amortization of distribution agreements is included within underwriting and policy acquisition costs.
As of December 31, 2018, intangible assets related to non-controlling interests were USD 63 million for present value of future profits (PVFP) of acquired insurance contracts, USD 1 billion for distribution agreements, USD 10 million for software, USD 9 million for goodwill and USD 3 million for other intangible assets.
As a result of the acquisition of the QBE Latin America operations intangible assets increased by USD 250 million, of which USD 195 million is goodwill and USD 55 million is distribution agreements, software and other intangible assets. As a result of the acquisition of EuroAmerica in Chile, intangible assets increased by USD 143 million, of which USD 102 million is goodwill and USD 40 million is present value of future profits (PVFP). The acquisition of Travel Ace and Universal Assistance increased goodwill by USD 94 million and distribution agreements, software and other intangible assets by USD 19 million. As a result of the acquisition of Bright Box intangible assets increased by USD 77 million, of which USD 52 million related to goodwill and USD 25 million to software. As a result of the acquisition of Blue Insurance intangible assets increased by USD 56 million, of which USD 35 million is goodwill and USD 21 million is distribution agreements, software and other intangible assets. The remaining minus USD 16 million relates to a post-acquisition adjustment of Cover-More (see note 5).
In 2018, a distribution agreement in Brazil was signed replacing the existing distribution agreement. Additional intangible assets of USD 263 million related to this distribution agreement were recorded as at December 31, 2018.
Table 14.4
Intangible assets by business – prior period
in USD millions, as of December 31, 2018
Attorney-
in-fact
contracts Goodwill PVFP
Distribution
agreements Software Other Total
Property & Casualty – 1,492 – 941 452 194 3,079Life – 271 434 1,748 284 1 2,737Farmers 1,025 819 63 – 339 – 2,247Group Functions and Operations – 52 – – 88 – 139Net carrying value 1,025 2,634 498 2,689 1,162 194 8,202
Zurich Insurance GroupAnnual Report 2019 230
Group overview Governance Risk review Financial review
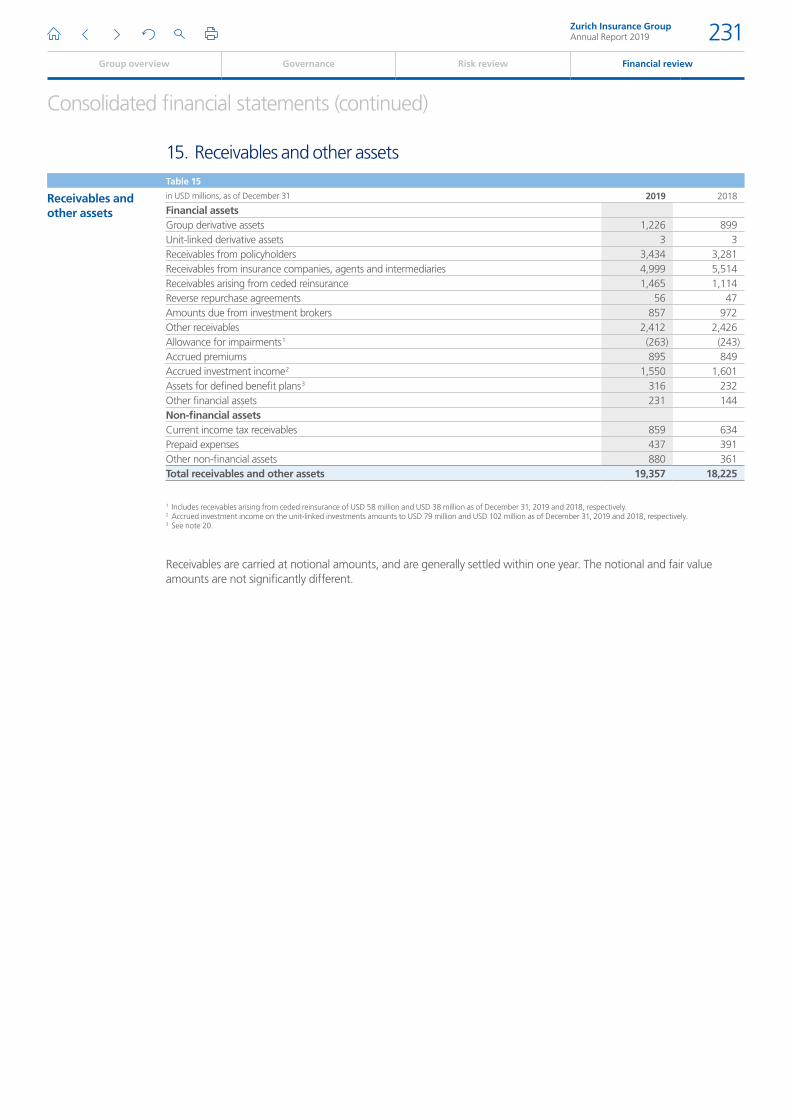
Consolidated financial statements (continued)
15. Receivables and other assetsTable 15
Receivables and other assets
in USD millions, as of December 31 2019 2018
Financial assetsGroup derivative assets 1,226 899Unit-linked derivative assets 3 3Receivables from policyholders 3,434 3,281Receivables from insurance companies, agents and intermediaries 4,999 5,514Receivables arising from ceded reinsurance 1,465 1,114Reverse repurchase agreements 56 47Amounts due from investment brokers 857 972Other receivables 2,412 2,426Allowance for impairments 1 (263) (243)Accrued premiums 895 849Accrued investment income 2 1,550 1,601Assets for defined benefit plans 3 316 232Other financial assets 231 144Non-financial assetsCurrent income tax receivables 859 634Prepaid expenses 437 391Other non-financial assets 880 361Total receivables and other assets 19,357 18,225
1 Includes receivables arising from ceded reinsurance of USD 58 million and USD 38 million as of December 31, 2019 and 2018, respectively.2 Accrued investment income on the unit-linked investments amounts to USD 79 million and USD 102 million as of December 31, 2019 and 2018, respectively.3 See note 20.
Receivables are carried at notional amounts, and are generally settled within one year. The notional and fair value amounts are not significantly different.
Zurich Insurance GroupAnnual Report 2019 231
Group overview Governance Risk review Financial review
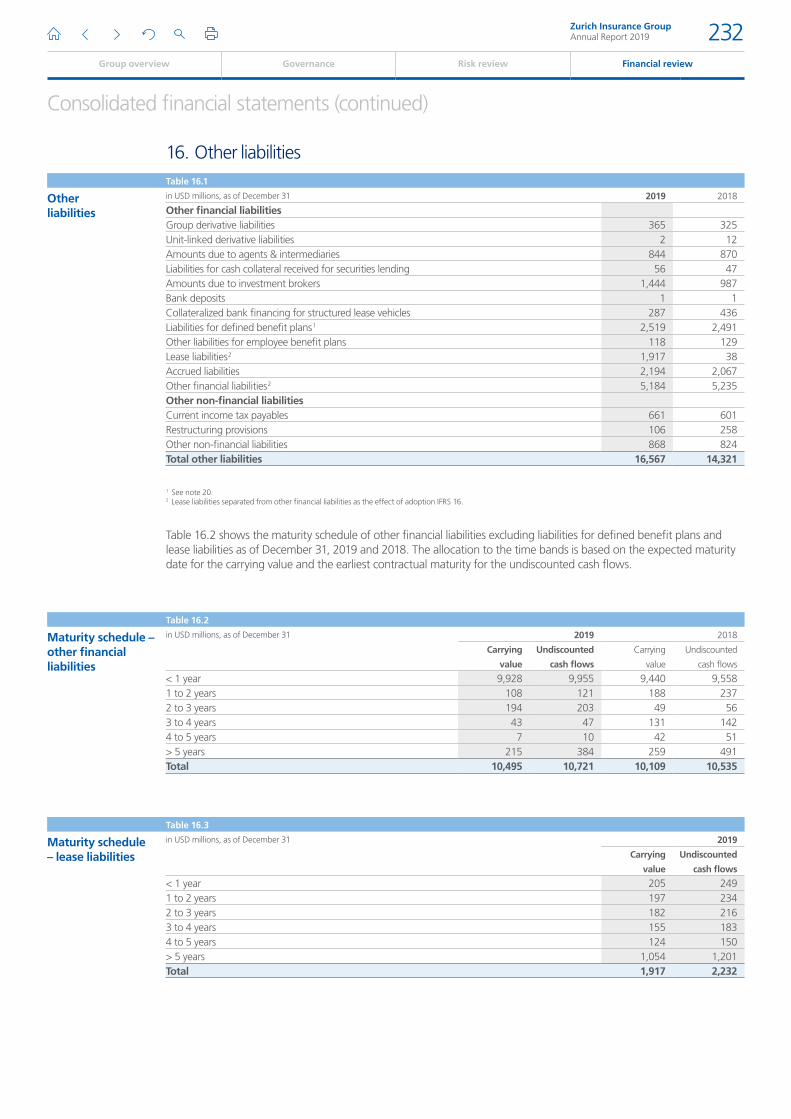
Consolidated financial statements (continued)
16. Other liabilitiesTable 16.1
Other liabilities
in USD millions, as of December 31 2019 2018
Other financial liabilitiesGroup derivative liabilities 365 325Unit-linked derivative liabilities 2 12Amounts due to agents & intermediaries 844 870Liabilities for cash collateral received for securities lending 56 47Amounts due to investment brokers 1,444 987Bank deposits 1 1Collateralized bank financing for structured lease vehicles 287 436Liabilities for defined benefit plans 1 2,519 2,491Other liabilities for employee benefit plans 118 129Lease liabilities 2 1,917 38Accrued liabilities 2,194 2,067Other financial liabilities 2 5,184 5,235Other non-financial liabilitiesCurrent income tax payables 661 601Restructuring provisions 106 258Other non-financial liabilities 868 824Total other liabilities 16,567 14,321
1 See note 20.2 Lease liabilities separated from other financial liabilities as the effect of adoption IFRS 16.
Table 16.2 shows the maturity schedule of other financial liabilities excluding liabilities for defined benefit plans and lease liabilities as of December 31, 2019 and 2018. The allocation to the time bands is based on the expected maturity date for the carrying value and the earliest contractual maturity for the undiscounted cash flows.
Table 16.2
Maturity schedule – other financial liabilities
in USD millions, as of December 31 2019 2018
Carrying
value
Undiscounted
cash flows
Carrying
value
Undiscounted
cash flows
< 1 year 9,928 9,955 9,440 9,5581 to 2 years 108 121 188 2372 to 3 years 194 203 49 563 to 4 years 43 47 131 1424 to 5 years 7 10 42 51> 5 years 215 384 259 491Total 10,495 10,721 10,109 10,535
Table 16.3
Maturity schedule – lease liabilities
in USD millions, as of December 31 2019
Carrying
value
Undiscounted
cash flows
< 1 year 205 2491 to 2 years 197 2342 to 3 years 182 2163 to 4 years 155 1834 to 5 years 124 150> 5 years 1,054 1,201Total 1,917 2,232
Zurich Insurance GroupAnnual Report 2019 232
Group overview Governance Risk review Financial review
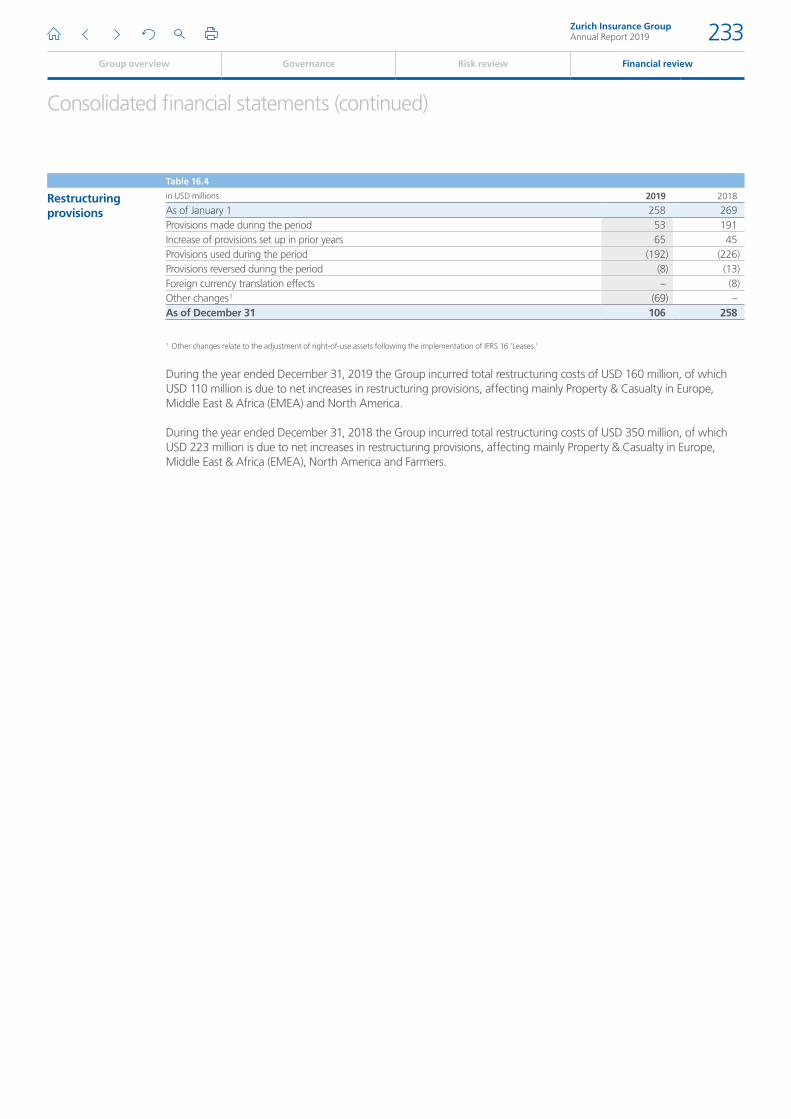
Consolidated financial statements (continued)
Table 16.4
Restructuring provisions
in USD millions 2019 2018
As of January 1 258 269Provisions made during the period 53 191Increase of provisions set up in prior years 65 45Provisions used during the period (192) (226)Provisions reversed during the period (8) (13)Foreign currency translation effects – (8)Other changes 1 (69) –As of December 31 106 258
1 Other changes relate to the adjustment of right-of-use assets following the implementation of IFRS 16 ’Leases.’
During the year ended December 31, 2019 the Group incurred total restructuring costs of USD 160 million, of which USD 110 million is due to net increases in restructuring provisions, affecting mainly Property & Casualty in Europe, Middle East & Africa (EMEA) and North America.
During the year ended December 31, 2018 the Group incurred total restructuring costs of USD 350 million, of which USD 223 million is due to net increases in restructuring provisions, affecting mainly Property & Casualty in Europe, Middle East & Africa (EMEA), North America and Farmers.
Zurich Insurance GroupAnnual Report 2019 233
Group overview Governance Risk review Financial review
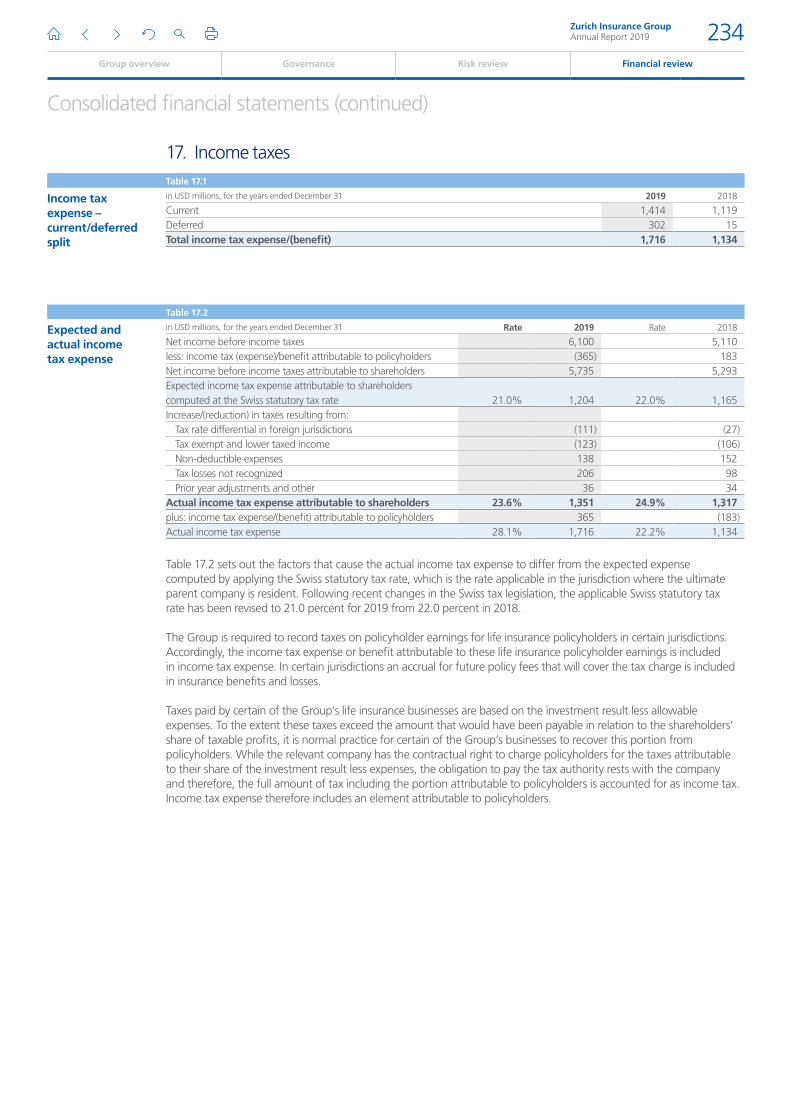
Consolidated financial statements (continued)
17. Income taxesTable 17.1
Income tax expense – current/deferred split
in USD millions, for the years ended December 31 2019 2018
Current 1,414 1,119Deferred 302 15Total income tax expense/(benefit) 1,716 1,134
Table 17.2
Expected and actual income tax expense
in USD millions, for the years ended December 31 Rate 2019 Rate 2018
Net income before income taxes 6,100 5,110less: income tax (expense)/benefit attributable to policyholders (365) 183Net income before income taxes attributable to shareholders 5,735 5,293Expected income tax expense attributable to shareholders computed at the Swiss statutory tax rate 21.0% 1,204 22.0% 1,165Increase/(reduction) in taxes resulting from:
Tax rate differential in foreign jurisdictions (111) (27)Tax exempt and lower taxed income (123) (106)Non-deductible expenses 138 152Tax losses not recognized 206 98Prior year adjustments and other 36 34
Actual income tax expense attributable to shareholders 23.6% 1,351 24.9% 1,317plus: income tax expense/(benefit) attributable to policyholders 365 (183)Actual income tax expense 28.1% 1,716 22.2% 1,134
Table 17.2 sets out the factors that cause the actual income tax expense to differ from the expected expense computed by applying the Swiss statutory tax rate, which is the rate applicable in the jurisdiction where the ultimate parent company is resident. Following recent changes in the Swiss tax legislation, the applicable Swiss statutory tax rate has been revised to 21.0 percent for 2019 from 22.0 percent in 2018.
The Group is required to record taxes on policyholder earnings for life insurance policyholders in certain jurisdictions. Accordingly, the income tax expense or benefit attributable to these life insurance policyholder earnings is included in income tax expense. In certain jurisdictions an accrual for future policy fees that will cover the tax charge is included in insurance benefits and losses.
Taxes paid by certain of the Group’s life insurance businesses are based on the investment result less allowable expenses. To the extent these taxes exceed the amount that would have been payable in relation to the shareholders’ share of taxable profits, it is normal practice for certain of the Group’s businesses to recover this portion from policyholders. While the relevant company has the contractual right to charge policyholders for the taxes attributable to their share of the investment result less expenses, the obligation to pay the tax authority rests with the company and therefore, the full amount of tax including the portion attributable to policyholders is accounted for as income tax. Income tax expense therefore includes an element attributable to policyholders.
Zurich Insurance GroupAnnual Report 2019 234
Group overview Governance Risk review Financial review
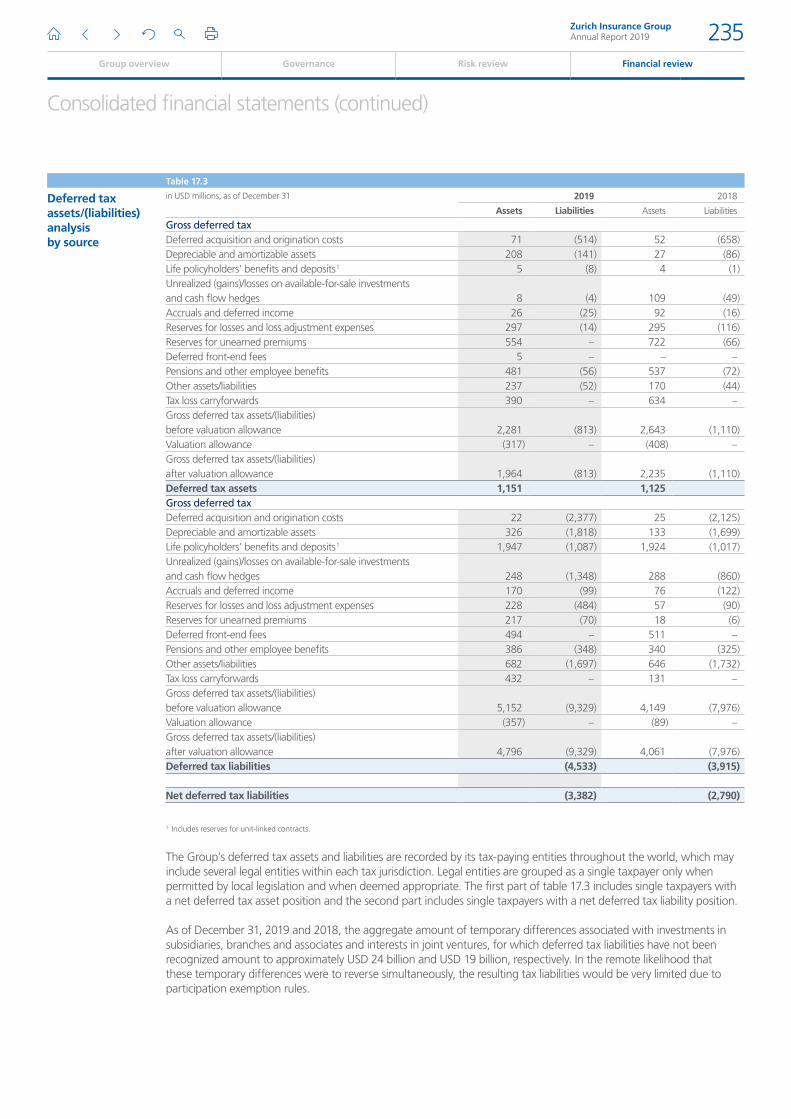
Consolidated financial statements (continued)
Table 17.3
Deferred tax assets/(liabilities) analysis by source
in USD millions, as of December 31 2019 2018
Assets Liabilities Assets Liabilities
Gross deferred taxDeferred acquisition and origination costs 71 (514) 52 (658)Depreciable and amortizable assets 208 (141) 27 (86)Life policyholders’ benefits and deposits 1 5 (8) 4 (1)Unrealized (gains)/losses on available-for-sale investments and cash flow hedges 8 (4) 109 (49)Accruals and deferred income 26 (25) 92 (16)Reserves for losses and loss adjustment expenses 297 (14) 295 (116)Reserves for unearned premiums 554 – 722 (66)Deferred front-end fees 5 – – –Pensions and other employee benefits 481 (56) 537 (72)Other assets/liabilities 237 (52) 170 (44)Tax loss carryforwards 390 – 634 –Gross deferred tax assets/(liabilities) before valuation allowance 2,281 (813) 2,643 (1,110)Valuation allowance (317) – (408) –Gross deferred tax assets/(liabilities) after valuation allowance 1,964 (813) 2,235 (1,110)Deferred tax assets 1,151 1,125Gross deferred taxDeferred acquisition and origination costs 22 (2,377) 25 (2,125)Depreciable and amortizable assets 326 (1,818) 133 (1,699)Life policyholders’ benefits and deposits 1 1,947 (1,087) 1,924 (1,017)Unrealized (gains)/losses on available-for-sale investments and cash flow hedges 248 (1,348) 288 (860)Accruals and deferred income 170 (99) 76 (122)Reserves for losses and loss adjustment expenses 228 (484) 57 (90)Reserves for unearned premiums 217 (70) 18 (6)Deferred front-end fees 494 – 511 –Pensions and other employee benefits 386 (348) 340 (325)Other assets/liabilities 682 (1,697) 646 (1,732)Tax loss carryforwards 432 – 131 –Gross deferred tax assets/(liabilities) before valuation allowance 5,152 (9,329) 4,149 (7,976)Valuation allowance (357) – (89) –Gross deferred tax assets/(liabilities) after valuation allowance 4,796 (9,329) 4,061 (7,976)Deferred tax liabilities (4,533) (3,915)
Net deferred tax liabilities (3,382) (2,790)
1 Includes reserves for unit-linked contracts.
The Group’s deferred tax assets and liabilities are recorded by its tax-paying entities throughout the world, which may include several legal entities within each tax jurisdiction. Legal entities are grouped as a single taxpayer only when permitted by local legislation and when deemed appropriate. The first part of table 17.3 includes single taxpayers with a net deferred tax asset position and the second part includes single taxpayers with a net deferred tax liability position.
As of December 31, 2019 and 2018, the aggregate amount of temporary differences associated with investments in subsidiaries, branches and associates and interests in joint ventures, for which deferred tax liabilities have not been recognized amount to approximately USD 24 billion and USD 19 billion, respectively. In the remote likelihood that these temporary differences were to reverse simultaneously, the resulting tax liabilities would be very limited due to participation exemption rules.
Zurich Insurance GroupAnnual Report 2019 235
Group overview Governance Risk review Financial review
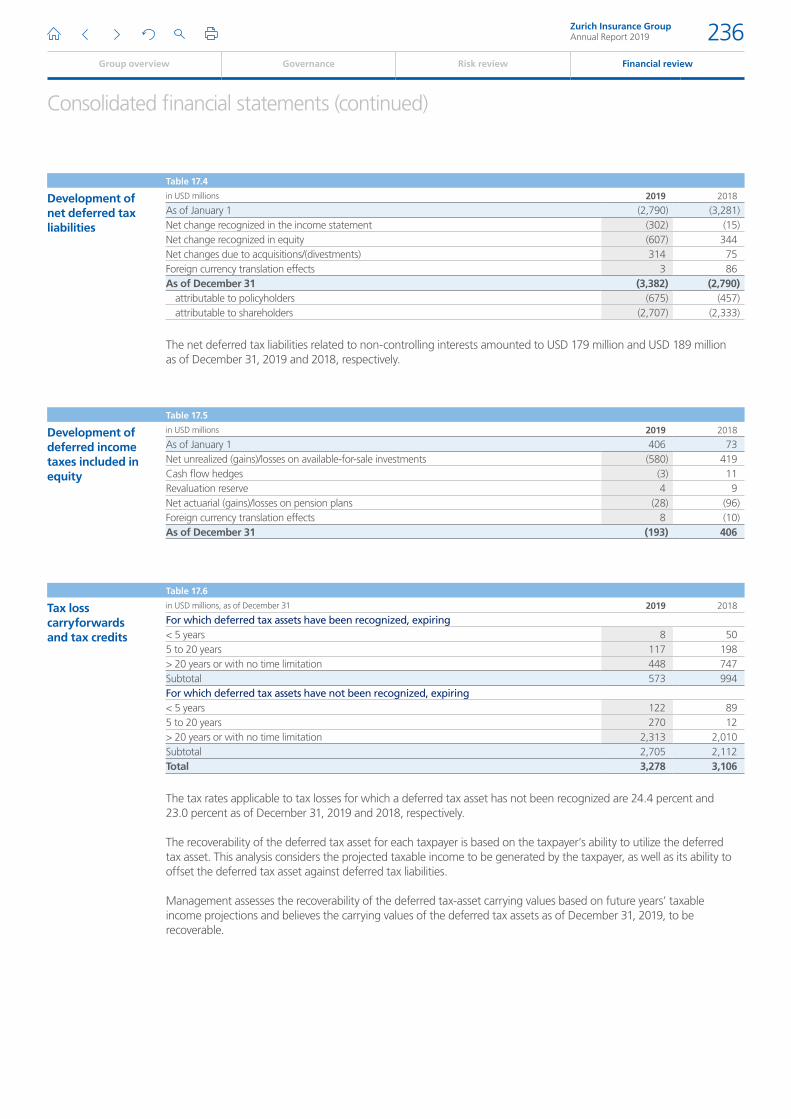
Consolidated financial statements (continued)
Table 17.4
Development of net deferred tax liabilities
in USD millions 2019 2018
As of January 1 (2,790) (3,281)Net change recognized in the income statement (302) (15)Net change recognized in equity (607) 344Net changes due to acquisitions/(divestments) 314 75Foreign currency translation effects 3 86As of December 31 (3,382) (2,790)
attributable to policyholders (675) (457)attributable to shareholders (2,707) (2,333)
The net deferred tax liabilities related to non-controlling interests amounted to USD 179 million and USD 189 million as of December 31, 2019 and 2018, respectively.
Table 17.5
Development of deferred income taxes included in equity
in USD millions 2019 2018
As of January 1 406 73Net unrealized (gains)/losses on available-for-sale investments (580) 419Cash flow hedges (3) 11Revaluation reserve 4 9Net actuarial (gains)/losses on pension plans (28) (96)Foreign currency translation effects 8 (10)As of December 31 (193) 406
Table 17.6
Tax loss carryforwards and tax credits
in USD millions, as of December 31 2019 2018
For which deferred tax assets have been recognized, expiring< 5 years 8 505 to 20 years 117 198> 20 years or with no time limitation 448 747Subtotal 573 994For which deferred tax assets have not been recognized, expiring< 5 years 122 895 to 20 years 270 12> 20 years or with no time limitation 2,313 2,010Subtotal 2,705 2,112Total 3,278 3,106
The tax rates applicable to tax losses for which a deferred tax asset has not been recognized are 24.4 percent and 23.0 percent as of December 31, 2019 and 2018, respectively.
The recoverability of the deferred tax asset for each taxpayer is based on the taxpayer’s ability to utilize the deferred tax asset. This analysis considers the projected taxable income to be generated by the taxpayer, as well as its ability to offset the deferred tax asset against deferred tax liabilities.
Management assesses the recoverability of the deferred tax-asset carrying values based on future years’ taxable income projections and believes the carrying values of the deferred tax assets as of December 31, 2019, to be recoverable.
Zurich Insurance GroupAnnual Report 2019 236
Group overview Governance Risk review Financial review
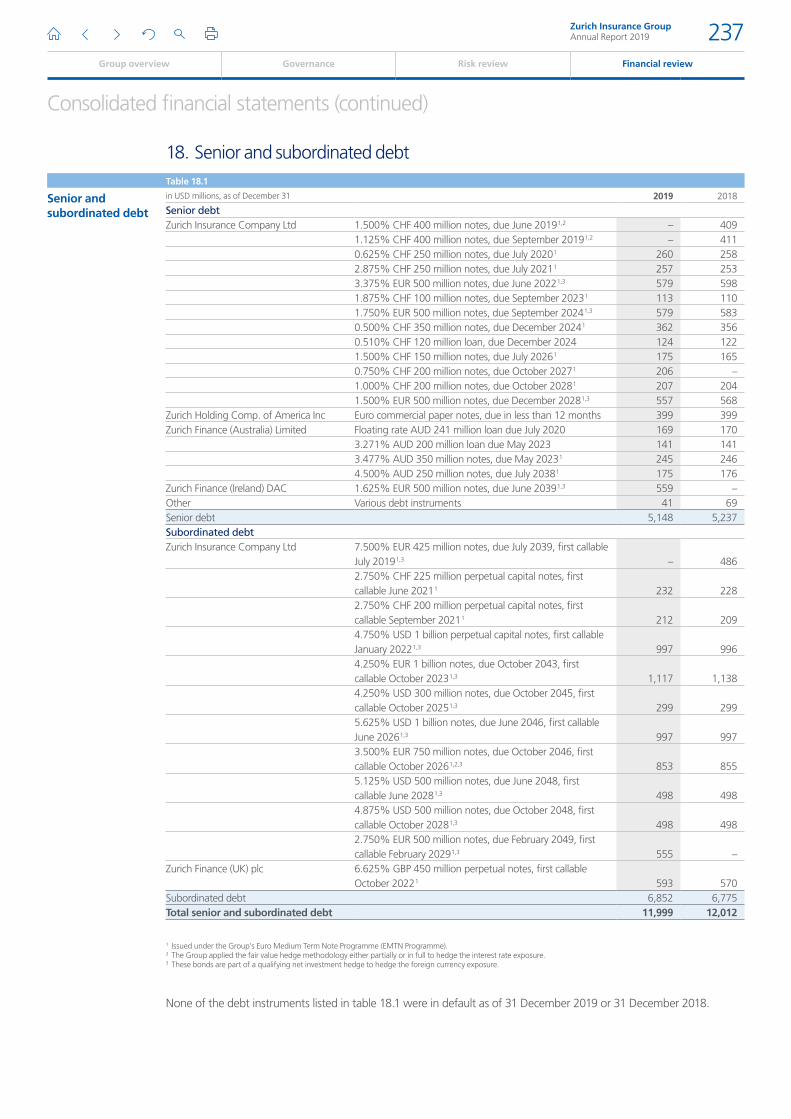
Consolidated financial statements (continued)
18. Senior and subordinated debtTable 18.1
Senior and subordinated debt
in USD millions, as of December 31 2019 2018
Senior debtZurich Insurance Company Ltd 1.500% CHF 400 million notes, due June 2019 1,2 – 409
1.125% CHF 400 million notes, due September 2019 1,2 – 4110.625% CHF 250 million notes, due July 2020 1 260 2582.875% CHF 250 million notes, due July 2021 1 257 2533.375% EUR 500 million notes, due June 2022 1,3 579 5981.875% CHF 100 million notes, due September 2023 1 113 1101.750% EUR 500 million notes, due September 2024 1,3 579 5830.500% CHF 350 million notes, due December 2024 1 362 3560.510% CHF 120 million loan, due December 2024 124 1221.500% CHF 150 million notes, due July 2026 1 175 1650.750% CHF 200 million notes, due October 2027 1 206 –1.000% CHF 200 million notes, due October 2028 1 207 2041.500% EUR 500 million notes, due December 2028 1,3 557 568
Zurich Holding Comp. of America Inc Euro commercial paper notes, due in less than 12 months 399 399Zurich Finance (Australia) Limited Floating rate AUD 241 million loan due July 2020 169 170
3.271% AUD 200 million loan due May 2023 141 1413.477% AUD 350 million notes, due May 2023 1 245 2464.500% AUD 250 million notes, due July 2038 1 175 176
Zurich Finance (Ireland) DAC 1.625% EUR 500 million notes, due June 2039 1,3 559 –Other Various debt instruments 41 69Senior debt 5,148 5,237Subordinated debtZurich Insurance Company Ltd 7.500% EUR 425 million notes, due July 2039, first callable
July 2019 1,3 – 4862.750% CHF 225 million perpetual capital notes, first callable June 2021 1 232 2282.750% CHF 200 million perpetual capital notes, first callable September 2021 1 212 2094.750% USD 1 billion perpetual capital notes, first callable January 2022 1,3 997 9964.250% EUR 1 billion notes, due October 2043, first callable October 2023 1,3 1,117 1,1384.250% USD 300 million notes, due October 2045, first callable October 2025 1,3 299 2995.625% USD 1 billion notes, due June 2046, first callable June 2026 1,3 997 9973.500% EUR 750 million notes, due October 2046, first callable October 2026 1,2,3 853 8555.125% USD 500 million notes, due June 2048, first callable June 2028 1,3 498 4984.875% USD 500 million notes, due October 2048, first callable October 2028 1,3 498 4982.750% EUR 500 million notes, due February 2049, first callable February 2029 1,3 555 –
Zurich Finance (UK) plc 6.625% GBP 450 million perpetual notes, first callable October 2022 1 593 570
Subordinated debt 6,852 6,775Total senior and subordinated debt 11,999 12,012
1 Issued under the Group’s Euro Medium Term Note Programme (EMTN Programme).2 The Group applied the fair value hedge methodology either partially or in full to hedge the interest rate exposure.3 These bonds are part of a qualifying net investment hedge to hedge the foreign currency exposure.
None of the debt instruments listed in table 18.1 were in default as of 31 December 2019 or 31 December 2018.
Zurich Insurance GroupAnnual Report 2019 237
Group overview Governance Risk review Financial review
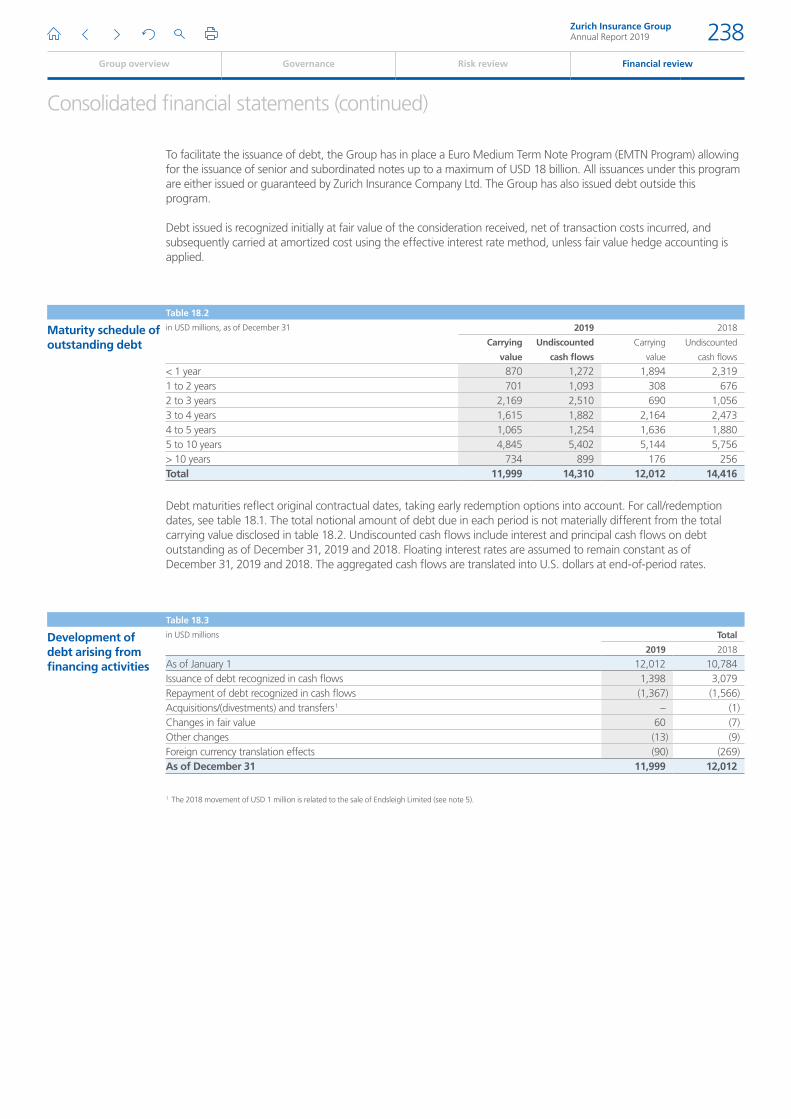
Consolidated financial statements (continued)
To facilitate the issuance of debt, the Group has in place a Euro Medium Term Note Program (EMTN Program) allowing for the issuance of senior and subordinated notes up to a maximum of USD 18 billion. All issuances under this program are either issued or guaranteed by Zurich Insurance Company Ltd. The Group has also issued debt outside this program.
Debt issued is recognized initially at fair value of the consideration received, net of transaction costs incurred, and subsequently carried at amortized cost using the effective interest rate method, unless fair value hedge accounting is applied.
Table 18.2
Maturity schedule of outstanding debt
in USD millions, as of December 31 2019 2018
Carrying
value
Undiscounted
cash flows
Carrying
value
Undiscounted
cash flows
< 1 year 870 1,272 1,894 2,3191 to 2 years 701 1,093 308 6762 to 3 years 2,169 2,510 690 1,0563 to 4 years 1,615 1,882 2,164 2,4734 to 5 years 1,065 1,254 1,636 1,8805 to 10 years 4,845 5,402 5,144 5,756> 10 years 734 899 176 256Total 11,999 14,310 12,012 14,416
Debt maturities reflect original contractual dates, taking early redemption options into account. For call/redemption dates, see table 18.1. The total notional amount of debt due in each period is not materially different from the total carrying value disclosed in table 18.2. Undiscounted cash flows include interest and principal cash flows on debt outstanding as of December 31, 2019 and 2018. Floating interest rates are assumed to remain constant as of December 31, 2019 and 2018. The aggregated cash flows are translated into U.S. dollars at end-of-period rates.
Table 18.3
Development of debt arising from financing activities
in USD millions Total
2019 2018
As of January 1 12,012 10,784Issuance of debt recognized in cash flows 1,398 3,079Repayment of debt recognized in cash flows (1,367) (1,566)Acquisitions/(divestments) and transfers 1 – (1)Changes in fair value 60 (7)Other changes (13) (9)Foreign currency translation effects (90) (269)As of December 31 11,999 12,012
1 The 2018 movement of USD 1 million is related to the sale of Endsleigh Limited (see note 5).
Zurich Insurance GroupAnnual Report 2019 238
Group overview Governance Risk review Financial review
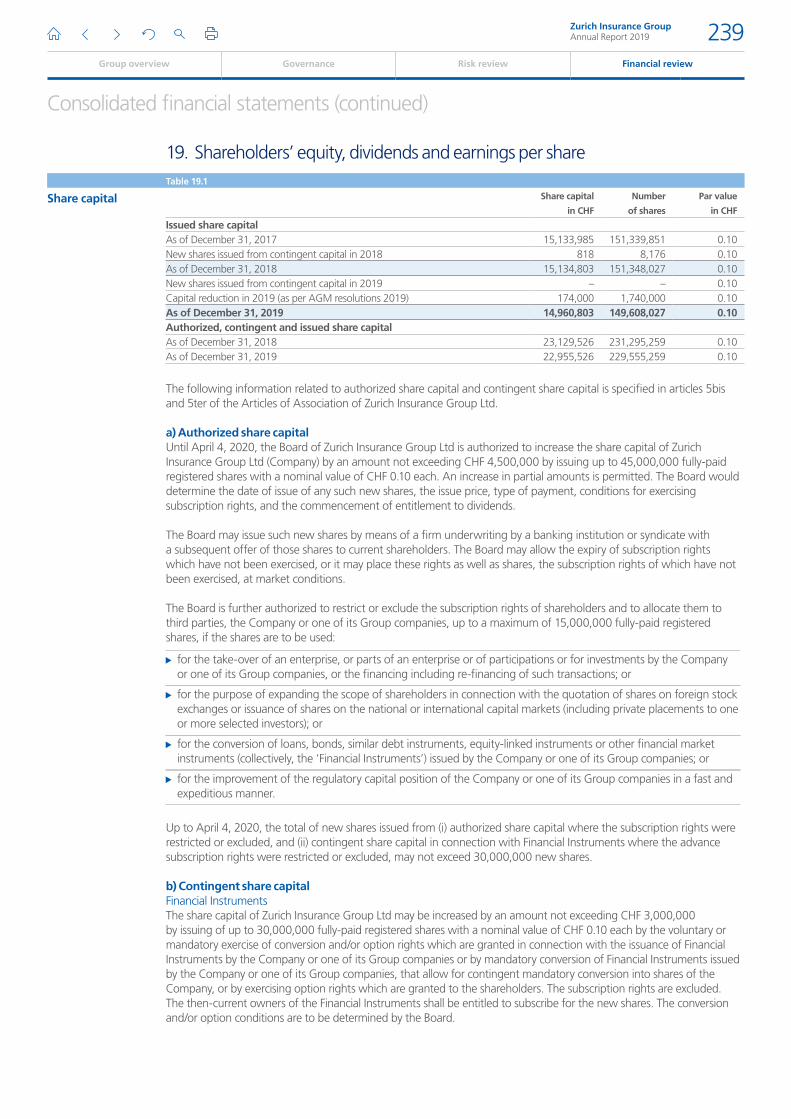
Consolidated financial statements (continued)
19. Shareholders’ equity, dividends and earnings per shareTable 19.1
Share capital Share capital
in CHF
Number
of shares
Par value
in CHF
Issued share capitalAs of December 31, 2017 15,133,985 151,339,851 0.10New shares issued from contingent capital in 2018 818 8,176 0.10As of December 31, 2018 15,134,803 151,348,027 0.10New shares issued from contingent capital in 2019 – – 0.10Capital reduction in 2019 (as per AGM resolutions 2019) 174,000 1,740,000 0.10As of December 31, 2019 14,960,803 149,608,027 0.10Authorized, contingent and issued share capitalAs of December 31, 2018 23,129,526 231,295,259 0.10As of December 31, 2019 22,955,526 229,555,259 0.10
The following information related to authorized share capital and contingent share capital is specified in articles 5bis and 5ter of the Articles of Association of Zurich Insurance Group Ltd.
a) Authorized share capital Until April 4, 2020, the Board of Zurich Insurance Group Ltd is authorized to increase the share capital of Zurich Insurance Group Ltd (Company) by an amount not exceeding CHF 4,500,000 by issuing up to 45,000,000 fully-paid registered shares with a nominal value of CHF 0.10 each. An increase in partial amounts is permitted. The Board would determine the date of issue of any such new shares, the issue price, type of payment, conditions for exercising subscription rights, and the commencement of entitlement to dividends.
The Board may issue such new shares by means of a firm underwriting by a banking institution or syndicate with a subsequent offer of those shares to current shareholders. The Board may allow the expiry of subscription rights which have not been exercised, or it may place these rights as well as shares, the subscription rights of which have not been exercised, at market conditions.
The Board is further authorized to restrict or exclude the subscription rights of shareholders and to allocate them to third parties, the Company or one of its Group companies, up to a maximum of 15,000,000 fully-paid registered shares, if the shares are to be used:
33 for the take-over of an enterprise, or parts of an enterprise or of participations or for investments by the Company or one of its Group companies, or the financing including re-financing of such transactions; or
33 for the purpose of expanding the scope of shareholders in connection with the quotation of shares on foreign stock exchanges or issuance of shares on the national or international capital markets (including private placements to one or more selected investors); or
33 for the conversion of loans, bonds, similar debt instruments, equity-linked instruments or other financial market instruments (collectively, the ‘Financial Instruments’) issued by the Company or one of its Group companies; or
33 for the improvement of the regulatory capital position of the Company or one of its Group companies in a fast and expeditious manner.
Up to April 4, 2020, the total of new shares issued from (i) authorized share capital where the subscription rights were restricted or excluded, and (ii) contingent share capital in connection with Financial Instruments where the advance subscription rights were restricted or excluded, may not exceed 30,000,000 new shares.
b) Contingent share capital Financial Instruments The share capital of Zurich Insurance Group Ltd may be increased by an amount not exceeding CHF 3,000,000 by issuing of up to 30,000,000 fully-paid registered shares with a nominal value of CHF 0.10 each by the voluntary or mandatory exercise of conversion and/or option rights which are granted in connection with the issuance of Financial Instruments by the Company or one of its Group companies or by mandatory conversion of Financial Instruments issued by the Company or one of its Group companies, that allow for contingent mandatory conversion into shares of the Company, or by exercising option rights which are granted to the shareholders. The subscription rights are excluded. The then-current owners of the Financial Instruments shall be entitled to subscribe for the new shares. The conversion and/or option conditions are to be determined by the Board.
Zurich Insurance GroupAnnual Report 2019 239
Group overview Governance Risk review Financial review
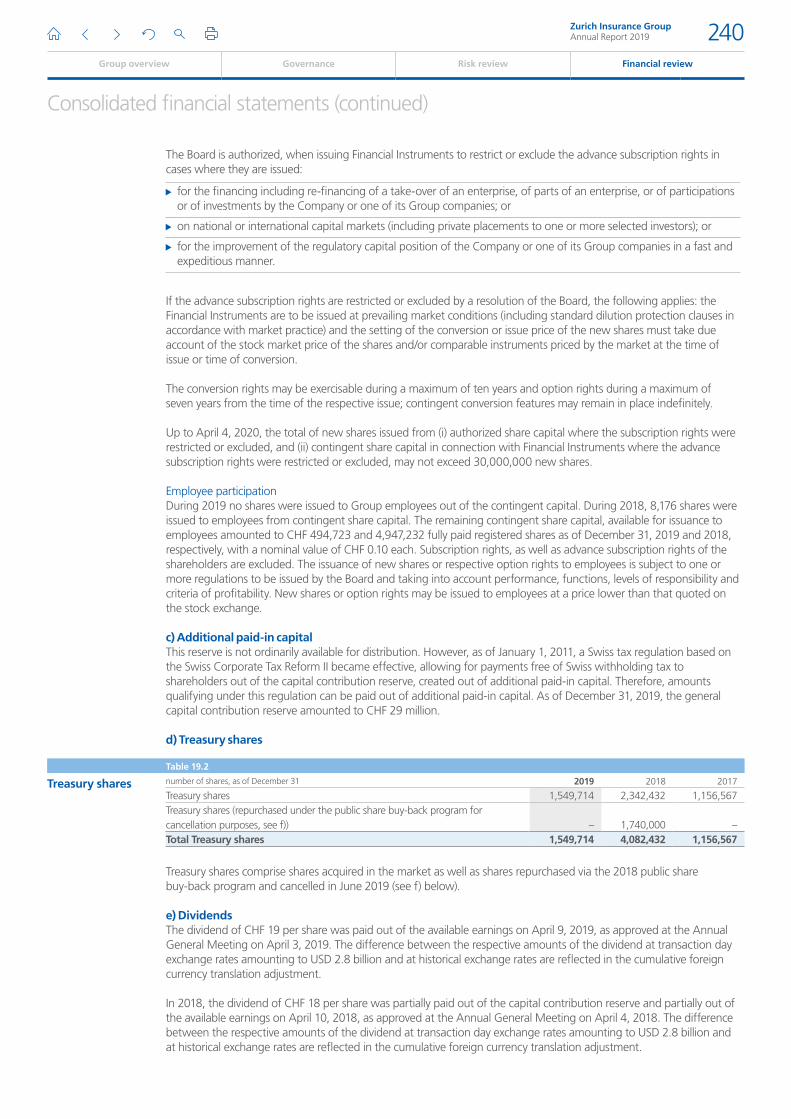
Consolidated financial statements (continued)
The Board is authorized, when issuing Financial Instruments to restrict or exclude the advance subscription rights in cases where they are issued:
33 for the financing including re-financing of a take-over of an enterprise, of parts of an enterprise, or of participations or of investments by the Company or one of its Group companies; or
33 on national or international capital markets (including private placements to one or more selected investors); or
33 for the improvement of the regulatory capital position of the Company or one of its Group companies in a fast and expeditious manner.
If the advance subscription rights are restricted or excluded by a resolution of the Board, the following applies: the Financial Instruments are to be issued at prevailing market conditions (including standard dilution protection clauses in accordance with market practice) and the setting of the conversion or issue price of the new shares must take due account of the stock market price of the shares and/or comparable instruments priced by the market at the time of issue or time of conversion.
The conversion rights may be exercisable during a maximum of ten years and option rights during a maximum of seven years from the time of the respective issue; contingent conversion features may remain in place indefinitely.
Up to April 4, 2020, the total of new shares issued from (i) authorized share capital where the subscription rights were restricted or excluded, and (ii) contingent share capital in connection with Financial Instruments where the advance subscription rights were restricted or excluded, may not exceed 30,000,000 new shares.
Employee participationDuring 2019 no shares were issued to Group employees out of the contingent capital. During 2018, 8,176 shares were issued to employees from contingent share capital. The remaining contingent share capital, available for issuance to employees amounted to CHF 494,723 and 4,947,232 fully paid registered shares as of December 31, 2019 and 2018, respectively, with a nominal value of CHF 0.10 each. Subscription rights, as well as advance subscription rights of the shareholders are excluded. The issuance of new shares or respective option rights to employees is subject to one or more regulations to be issued by the Board and taking into account performance, functions, levels of responsibility and criteria of profitability. New shares or option rights may be issued to employees at a price lower than that quoted on the stock exchange.
c) Additional paid-in capitalThis reserve is not ordinarily available for distribution. However, as of January 1, 2011, a Swiss tax regulation based on the Swiss Corporate Tax Reform II became effective, allowing for payments free of Swiss withholding tax to shareholders out of the capital contribution reserve, created out of additional paid-in capital. Therefore, amounts qualifying under this regulation can be paid out of additional paid-in capital. As of December 31, 2019, the general capital contribution reserve amounted to CHF 29 million.
d) Treasury shares
Table 19.2
Treasury shares number of shares, as of December 31 2019 2018 2017
Treasury shares 1,549,714 2,342,432 1,156,567Treasury shares (repurchased under the public share buy-back program for cancellation purposes, see f)) – 1,740,000 –Total Treasury shares 1,549,714 4,082,432 1,156,567
Treasury shares comprise shares acquired in the market as well as shares repurchased via the 2018 public share buy-back program and cancelled in June 2019 (see f) below).
e) DividendsThe dividend of CHF 19 per share was paid out of the available earnings on April 9, 2019, as approved at the Annual General Meeting on April 3, 2019. The difference between the respective amounts of the dividend at transaction day exchange rates amounting to USD 2.8 billion and at historical exchange rates are reflected in the cumulative foreign currency translation adjustment.
In 2018, the dividend of CHF 18 per share was partially paid out of the capital contribution reserve and partially out of the available earnings on April 10, 2018, as approved at the Annual General Meeting on April 4, 2018. The difference between the respective amounts of the dividend at transaction day exchange rates amounting to USD 2.8 billion and at historical exchange rates are reflected in the cumulative foreign currency translation adjustment.
Zurich Insurance GroupAnnual Report 2019 240
Group overview Governance Risk review Financial review
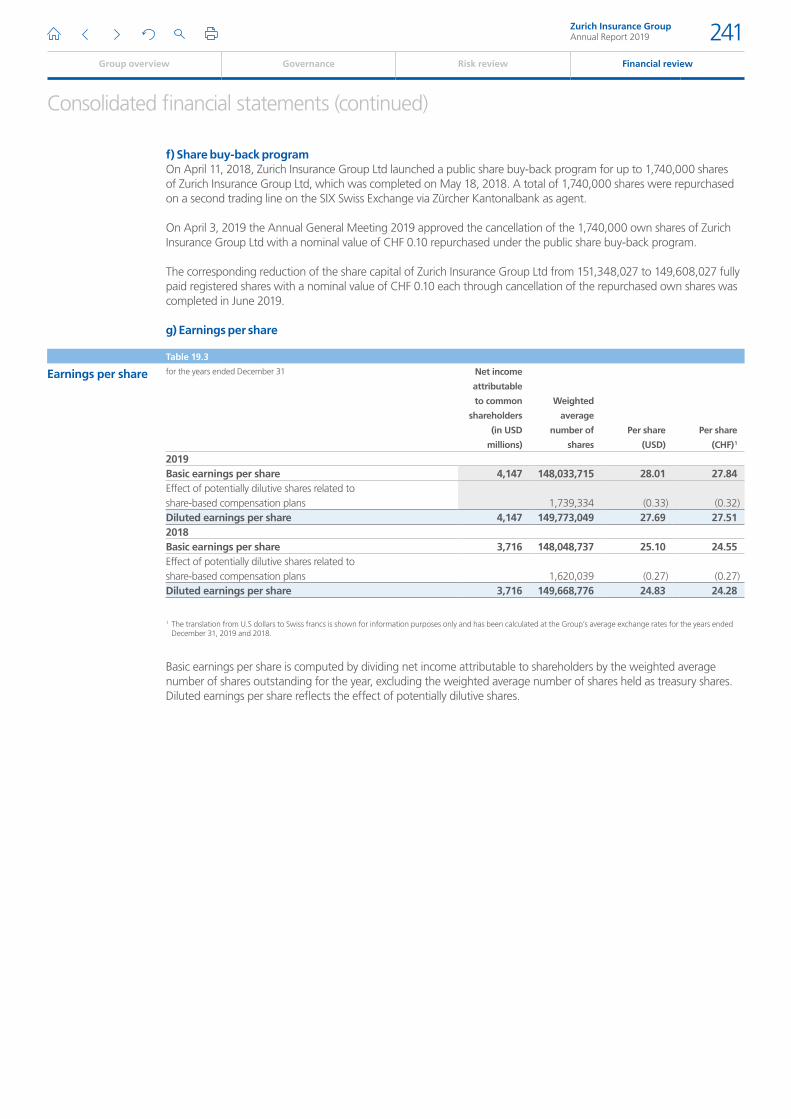
Consolidated financial statements (continued)
f) Share buy-back programOn April 11, 2018, Zurich Insurance Group Ltd launched a public share buy-back program for up to 1,740,000 shares of Zurich Insurance Group Ltd, which was completed on May 18, 2018. A total of 1,740,000 shares were repurchased on a second trading line on the SIX Swiss Exchange via Zürcher Kantonalbank as agent.
On April 3, 2019 the Annual General Meeting 2019 approved the cancellation of the 1,740,000 own shares of Zurich Insurance Group Ltd with a nominal value of CHF 0.10 repurchased under the public share buy-back program.
The corresponding reduction of the share capital of Zurich Insurance Group Ltd from 151,348,027 to 149,608,027 fully paid registered shares with a nominal value of CHF 0.10 each through cancellation of the repurchased own shares was completed in June 2019.
g) Earnings per share
Table 19.3
Earnings per share for the years ended December 31 Net income
attributable
to common
shareholders
(in USD
millions)
Weighted
average
number of
shares
Per share
(USD)
Per share
(CHF) 1
2019Basic earnings per share 4,147 148,033,715 28.01 27.84Effect of potentially dilutive shares related to share-based compensation plans 1,739,334 (0.33) (0.32)Diluted earnings per share 4,147 149,773,049 27.69 27.512018Basic earnings per share 3,716 148,048,737 25.10 24.55Effect of potentially dilutive shares related to share-based compensation plans 1,620,039 (0.27) (0.27)Diluted earnings per share 3,716 149,668,776 24.83 24.28
1 The translation from U.S dollars to Swiss francs is shown for information purposes only and has been calculated at the Group’s average exchange rates for the years ended December 31, 2019 and 2018.
Basic earnings per share is computed by dividing net income attributable to shareholders by the weighted average number of shares outstanding for the year, excluding the weighted average number of shares held as treasury shares. Diluted earnings per share reflects the effect of potentially dilutive shares.
Zurich Insurance GroupAnnual Report 2019 241
Group overview Governance Risk review Financial review
Consolidated financial statements (continued)
20. Employee benefits
The Group had 54’030 and 52’267 employees (full-time equivalents) as of December 31, 2019 and 2018, respectively. Personnel and other related costs incurred were USD 6.2 billion and USD 6.1 billion for the years ended December 31, 2019 and 2018, respectively, including wages, salaries and social security contributions of USD 5.5 billion and USD 5.3 billion respectively.
The Group operates a number of retirement benefit arrangements for employees. Historically, the majority of employees belonged to defined benefit pension plans and will still have past service benefits accrued in those plans.
However, the majority of employees now going forward accrue benefits for future service under defined contribution plans, which provide benefits equal to the amounts contributed by both the employer and the employee plus investment returns.
Certain of the Group’s operating companies also provide post-employment benefit plans covering medical care and life insurance, mainly in the U.S. Eligibility for these plans is generally based on completion of a specified period of eligible service and reaching a specified age. The plans typically pay a stated percentage of medical expenses subject to deductibles and other factors. The cost of post-employment benefits is accrued during the employees’ service periods.
Governance of the Group’s pension and post-employment benefit plans is the responsibility of the Group Pensions Committee. This committee is responsible for developing, reviewing and advising on the Group governance framework for matters related to pension and post-retirement benefit plans, including the relevant policies and processes. The committee provides oversight and guidance over the Group’s principal pension and post-retirement benefit plans for accounting, benefit design, funding and investment and plan governance purposes. This includes, but is not limited to:
33 oversight of the impact of the Group’s principal defined benefit pension and post-retirement benefit plans in terms of cash, expense, and balance sheet accounting impact and capital implications
33 development and maintenance of policies on funding, asset allocation, risk assessment and management, and assumption setting
The Group Pensions Committee provides a point of focus and co-ordination on the topic of pensions and post-retirement benefits at Group level for the supervision and exercise of company powers and obligations in relation to pension and post-retirement benefit plans.
The Group’s policy on funding and asset allocation is subject to local legal and regulatory requirements and tax efficiency.
a) Defined benefit pension plansEmployees of the Group’s companies are or have been covered by various pension plans, the largest of which are in Switzerland, the UK, the U.S. and Germany, which together comprise over 90 percent of the Group’s total defined benefit obligation. The remaining plans in other countries are not individually significant, therefore no separate disclosure is provided.
Certain Group companies provide defined benefit pension plans, some of which provide benefits on retirement, death or disability related to employees’ service periods and pensionable earnings. Others provide cash balance plans where the participants receive the benefit of the accumulated employer and employee contributions (where paid) together with additional cash credits in line with the rules of the plan. Eligibility for participation in the various plans is either immediate on commencement of employment or based on completion of a specified period of continuous service.
Most of the Group’s defined benefit pension plans are funded through contributions by the Group and, in some cases also by employees, to investment vehicles managed by trusts or foundations independent of the Group’s finances, or by management committees with fiduciary responsibilities. Where a trust or foundation exists, it is required by law or by articles of association to act in the interests of the fund and of all relevant beneficiaries to the plan, which can also include the sponsoring company, and is responsible for the investment policy with regard to the assets of the fund. The trust/foundation board or committee is usually composed of representatives from both employers and plan members. In these cases, the annual funding requirements are determined in accordance with the Group’s overall funding policy and local regulation. Independent actuarial valuations for the plans are performed as required. It is the Group’s general principle to ensure that the plans are appropriately funded in accordance with local pension regulations in each country.
Zurich Insurance GroupAnnual Report 2019 242
Group overview Governance Risk review Financial review
Consolidated financial statements (continued)
The pension plans typically expose the company to risks such as interest rate, price inflation, longevity and salary risks. To the extent that pension plans are funded, the assets held mitigate some of the liability risk but introduce investment risk.
The overall investment policy and strategy for the Group’s defined benefit pension plans is to achieve an investment return which, together with contributions, targets having sufficient assets to pay pension benefits as they fall due while also mitigating the various risks in the plans. The actual asset allocation is determined by reference to current and expected economic and market conditions and in consideration of specific asset class risk in the risk profile. The Group has a governance framework to ensure the trust/foundation board or committee considers how the asset investment strategy correlates with the maturity profile of the plan liabilities and the potential impact on the funding status of the plans, including short-term liquidity requirements. The investment strategies for each pension plan are independently determined by the governance body in each country, with oversight by the Group Pensions Committee. The pension assets are invested in diversified portfolios across geographical regions and asset classes to ensure diversified returns, also taking into account local pension laws. The investment strategies aim to mitigate asset-liability mismatches in the long run.
For post-employment defined benefit plans, total contributions to funded plans and benefits paid directly by the Group were USD 282 million for 2019 compared with USD 642 million for 2018. The estimated total for 2020 is USD 278 million (actual amount may differ).
Swiss pension planThe plan provides benefits that exceed the minimum benefit requirements under Swiss pension law. It provides a lifetime pension to members at the normal retirement age of 65 (age 62 for Executive Staff). Participants can draw retirement benefits early from age 60 (age 58 for Executive Staff). Alternatively, the benefit can be taken as a lump sum payment at retirement. Contributions to the plan are paid by the employees and the employer, both for retirement savings and to finance risk benefits paid out in the event of death and disability. The accumulated balance on the pension account is based on the employee and employer pension contributions and interest accrued. The interest rate credited is defined annually by the plan’s Board of Trustees which is responsible for the governance of the plans. The amount of pension payable on retirement is a result of the conversion rate applied on the accumulated balance of the individual participant’s pension account at the retirement date.
The trustees review the Pension Plan’s funding status regularly as well as the technical interest rate and the conversion rates. The conversion rate at age 65 is currently being phased down to 5 percent until 2023 to align it more closely with the low interest rate environment and increased life expectancy. In 2018, both the employer and employee savings contributions were increased. The insured salary was increased by reducing the coordination deduction. The flexibility of both plans was improved by introducing three levels of savings. Top-up payments from the company were introduced to those members’ pension accounts which had been part of the plan in 2017 and were affected by the changes. For them, this ensures that expected benefits at normal retirement age will be at least equal to 98.5 percent of their pensions expectations under the previous conversion rates. The top up payments will be made until 2023.
Although the Swiss plan operates like a defined contribution plan under local regulations, it is accounted for as a defined benefit pension plan under IAS 19 ‘Employee Benefits’ because of the need to accrue interest on the pension accounts and the payment of a lifetime pension at a fixed conversion rate under the plan rules.
Actuarial valuations are completed annually and if the plan becomes underfunded under local regulations, options for dealing with this include the Group paying additional contributions into the plan and/or reducing future benefits. At present, the plan is sufficiently funded, meaning that no additional contributions into the plans are expected to be required in the next year. The investment strategy of the Swiss plan is constrained by Swiss pension law including regulations related to diversification of plan assets. Under IAS 19, volatility arises in the Swiss pension plan net asset because the fair value of the plan assets is not directly correlated to movements in the value of the plan’s defined benefit obligation in the short-term.
Zurich Insurance GroupAnnual Report 2019 243
Group overview Governance Risk review Financial review
Consolidated financial statements (continued)
UK pension planThe major UK pension plan is a hybrid arrangement and defined benefits entitlements accrued to December 31, 2015 increase in line with salary increases. Normal retirement age for the plan is 60. The plan is split into distinct sections and the two defined benefit sections are closed to new entrants and, with effect from January 1, 2016, to future benefit accrual. All employees now participate in a defined contribution section within the same trust. The notes that follow consider only the defined benefit sections. The UK Pension Trustee Board is responsible for the governance of the plan. The employer contributions are determined based on regular triennial actuarial valuations which are conducted using assumptions agreed by the Trustee Board and the sponsoring company. A local statutory valuation was carried out at an effective date of June 30, 2016 and was finalized in June 2017. This valuation disclosed a funding surplus of USD 411 million (GBP 304 million) after taking into account the value of the asset-backed funding arrangement established in 2014. The statutory valuation as at June 30, 2019 is underway and expected to be finalized by September 2020.
The ongoing funding of the plan is closely monitored by the Trustee Board and a dedicated funding committee is made up of representatives from the Trustee Board and the Group. The plan rules and UK pension legislation set out maximum levels of inflationary increases applied to plan benefits. The plan assets are invested in diversified classes of assets.
U.S. pension plansThere are two major pension plans in the U.S., the Zurich North America (ZNA) plan and the Farmers Group, Inc. (FGI) pension plan. Both plans are funded entirely by the participating employers. The ZNA plan is a cash balance and the FGI pension plan utilizes a cash balance pension formula for benefits accruing after January 1, 2009, except with respect to certain grandfathered participants who retained a final average pay formula. Under a cash balance pension formula, an amount is credited to the cash balance account each quarter, determined by an employee’s age, service and their level of earnings up to and above the social security taxable wage base. The minimum annual interest credited on the account balance is 5 percent. The cash balance account is available from age 65, or age 55 with five years of service. The benefit can be taken as a monthly annuity or as a lump sum. Both the ZNA plan and the FGI pension plan have fiduciaries as required under local pension laws. The fiduciaries are responsible for the governance of the plans. Actuarial valuations are completed regularly. The annual employer minimum required contributions are equal to the present value of benefits accrued each year, plus a rolling amortization of any prior underfunding.
The ZNA and FGI plans have been frozen with effect from December 31, 2018. ZNA and FGI employees with a cash balance account will continue to earn interest credits on their existing cash balance account balance after the freeze date and will continue to earn eligibility service used to determine vesting and early retirement eligibility. FGI employees participating in the final average pay formula will continue to earn eligibility service used to determine vesting and the percentage of pension benefit payable for early retirement before normal retirement age of 65. ZNA and FGI employees earn only defined contribution retirement benefits with effect from January 1, 2019. In conjunction with the change in the pension plan, ZNA and FGI employees receive an additional company contribution within their defined contribution plan.
German pension plansThere are a number of legacy defined benefit plans in Germany, most of which were set up under works council agreements. In 2007, a contractual trust arrangement was set up to support all pension commitments of the employing companies in Germany. From this time, new contributions to the contractual trust arrangement relate to the pension payment refund of the employer companies.
A separate arrangement was also established in 2010 to provide for retirement obligations that were in payment at that time. Consideration is given from time to time based on the fiscal efficiency of adding recent retirees to this arrangement and to adding assets to the contractual trust.
The defined benefit plans provide benefits on either a final salary, career average salary or a cash balance basis. These plans are now closed to new entrants, who instead participate in a new cash balance arrangement, which has the characteristics of a defined contribution arrangement with a capital guarantee on members’ balances, which mirrors the capital guarantee given in a conventional life insurance arrangement in Germany.
Zurich Insurance GroupAnnual Report 2019 244
Group overview Governance Risk review Financial review
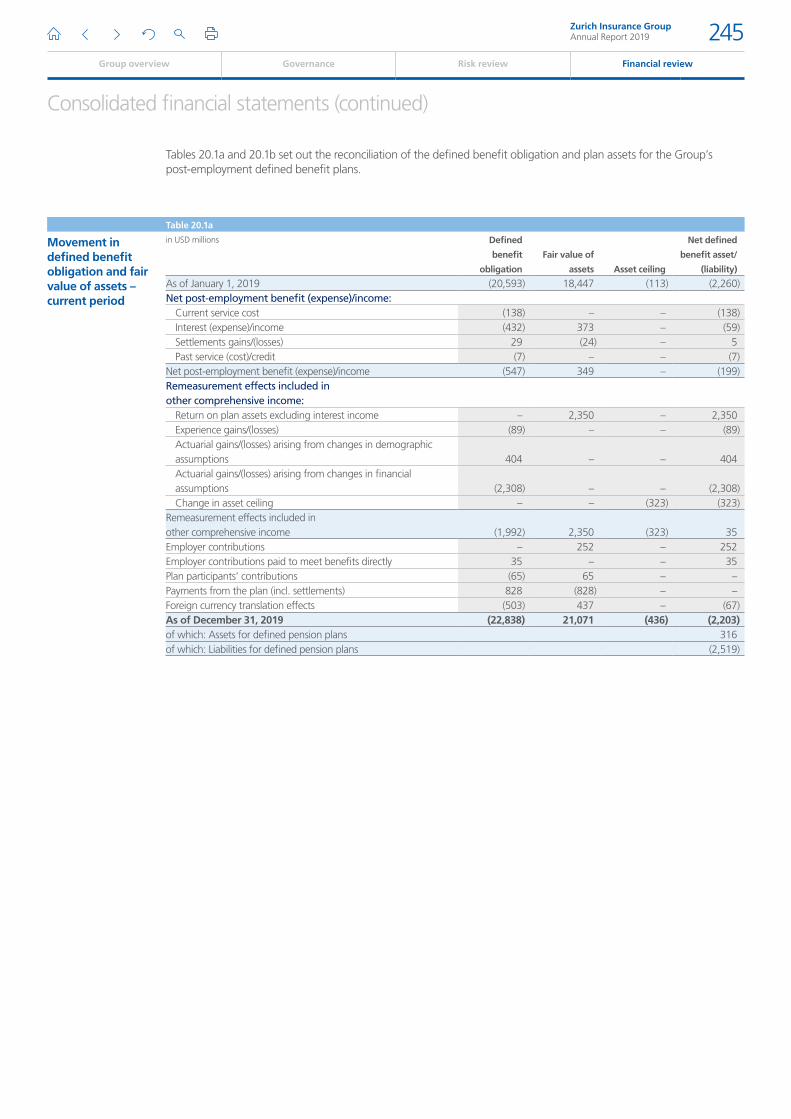
Consolidated financial statements (continued)
Tables 20.1a and 20.1b set out the reconciliation of the defined benefit obligation and plan assets for the Group’s post-employment defined benefit plans.
Table 20.1a
Movement in defined benefit obligation and fair value of assets – current period
in USD millions Defined
benefit
obligation
Fair value of
assets Asset ceiling
Net defined
benefit asset/
(liability)
As of January 1, 2019 (20,593) 18,447 (113) (2,260)Net post-employment benefit (expense)/income:
Current service cost (138) – – (138)Interest (expense)/income (432) 373 – (59)Settlements gains/(losses) 29 (24) – 5Past service (cost)/credit (7) – – (7)
Net post-employment benefit (expense)/income (547) 349 – (199)Remeasurement effects included in other comprehensive income:
Return on plan assets excluding interest income – 2,350 – 2,350Experience gains/(losses) (89) – – (89)Actuarial gains/(losses) arising from changes in demographic assumptions 404 – – 404Actuarial gains/(losses) arising from changes in financial assumptions (2,308) – – (2,308)Change in asset ceiling – – (323) (323)
Remeasurement effects included in other comprehensive income (1,992) 2,350 (323) 35Employer contributions – 252 – 252Employer contributions paid to meet benefits directly 35 – – 35Plan participants’ contributions (65) 65 – –Payments from the plan (incl. settlements) 828 (828) – –Foreign currency translation effects (503) 437 – (67)As of December 31, 2019 (22,838) 21,071 (436) (2,203)of which: Assets for defined pension plans 316of which: Liabilities for defined pension plans (2,519)
Zurich Insurance GroupAnnual Report 2019 245
Group overview Governance Risk review Financial review
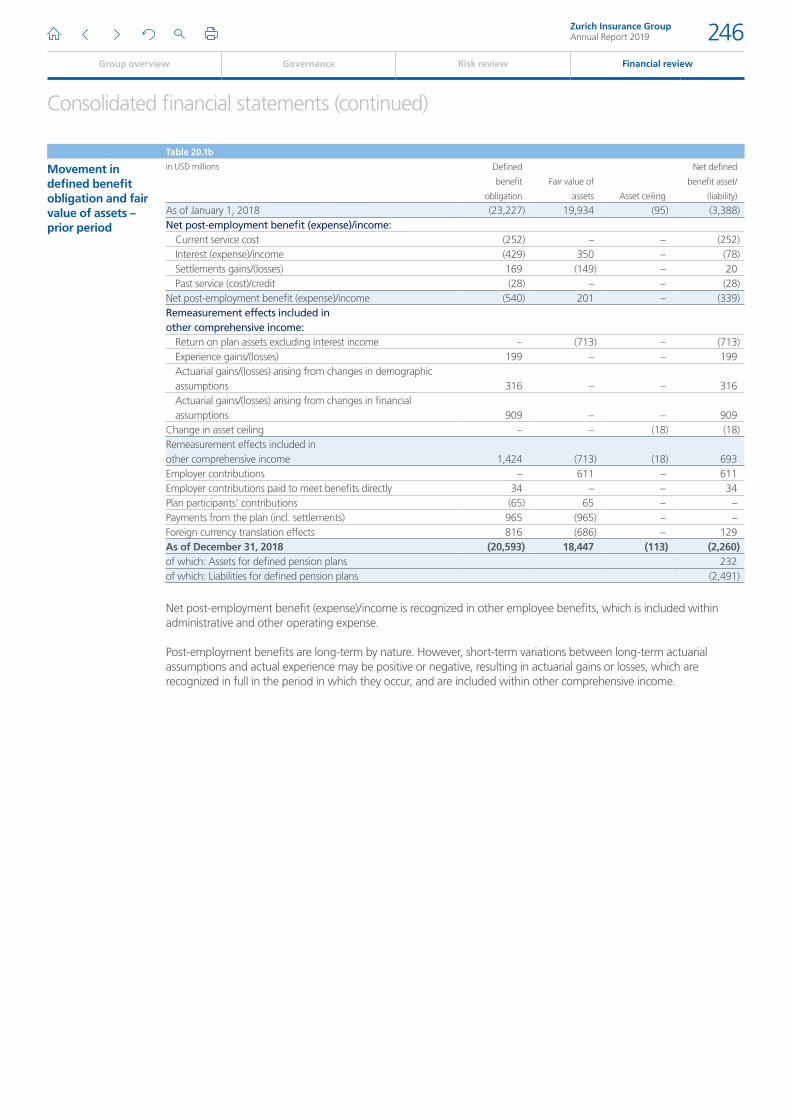
Consolidated financial statements (continued)
Table 20.1b
Movement in defined benefit obligation and fair value of assets – prior period
in USD millions Defined
benefit
obligation
Fair value of
assets Asset ceiling
Net defined
benefit asset/
(liability)
As of January 1, 2018 (23,227) 19,934 (95) (3,388)Net post-employment benefit (expense)/income:
Current service cost (252) – – (252)Interest (expense)/income (429) 350 – (78)Settlements gains/(losses) 169 (149) – 20Past service (cost)/credit (28) – – (28)
Net post-employment benefit (expense)/income (540) 201 – (339)Remeasurement effects included in other comprehensive income:
Return on plan assets excluding interest income – (713) – (713)Experience gains/(losses) 199 – – 199Actuarial gains/(losses) arising from changes in demographic assumptions 316 – – 316Actuarial gains/(losses) arising from changes in financial assumptions 909 – – 909
Change in asset ceiling – – (18) (18)Remeasurement effects included in other comprehensive income 1,424 (713) (18) 693Employer contributions – 611 – 611Employer contributions paid to meet benefits directly 34 – – 34Plan participants’ contributions (65) 65 – –Payments from the plan (incl. settlements) 965 (965) – –Foreign currency translation effects 816 (686) – 129As of December 31, 2018 (20,593) 18,447 (113) (2,260)of which: Assets for defined pension plans 232of which: Liabilities for defined pension plans (2,491)
Net post-employment benefit (expense)/income is recognized in other employee benefits, which is included within administrative and other operating expense.
Post-employment benefits are long-term by nature. However, short-term variations between long-term actuarial assumptions and actual experience may be positive or negative, resulting in actuarial gains or losses, which are recognized in full in the period in which they occur, and are included within other comprehensive income.
Zurich Insurance GroupAnnual Report 2019 246
Group overview Governance Risk review Financial review
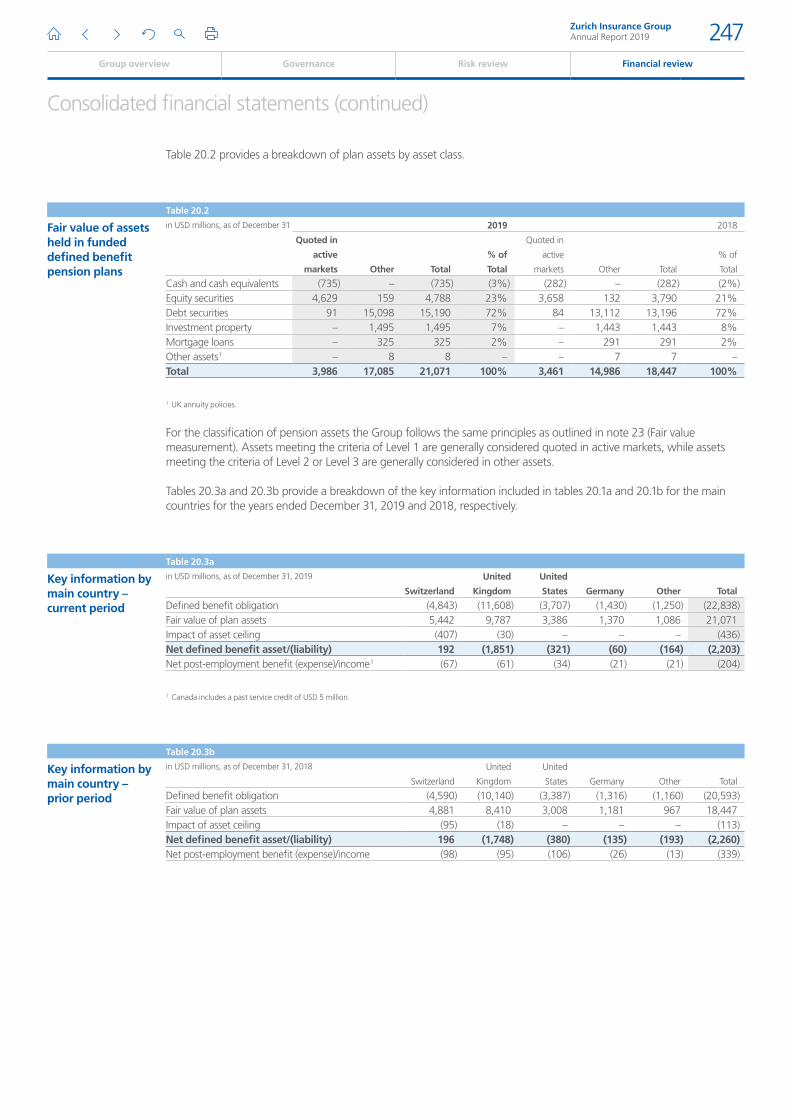
Consolidated financial statements (continued)
Table 20.2 provides a breakdown of plan assets by asset class.
Table 20.2
Fair value of assets held in funded defined benefit pension plans
in USD millions, as of December 31 2019 2018
Quoted in
active
markets Other Total
% of
Total
Quoted in
active
markets Other Total
% of
Total
Cash and cash equivalents (735) – (735) (3%) (282) – (282) (2%)Equity securities 4,629 159 4,788 23% 3,658 132 3,790 21%Debt securities 91 15,098 15,190 72% 84 13,112 13,196 72%Investment property – 1,495 1,495 7% – 1,443 1,443 8%Mortgage loans – 325 325 2% – 291 291 2%Other assets 1 – 8 8 – – 7 7 –Total 3,986 17,085 21,071 100% 3,461 14,986 18,447 100%
1 UK annuity policies.
For the classification of pension assets the Group follows the same principles as outlined in note 23 (Fair value measurement). Assets meeting the criteria of Level 1 are generally considered quoted in active markets, while assets meeting the criteria of Level 2 or Level 3 are generally considered in other assets.
Tables 20.3a and 20.3b provide a breakdown of the key information included in tables 20.1a and 20.1b for the main countries for the years ended December 31, 2019 and 2018, respectively.
Table 20.3a
Key information by main country – current period
in USD millions, as of December 31, 2019
Switzerland
United
Kingdom
United
States Germany Other Total
Defined benefit obligation (4,843) (11,608) (3,707) (1,430) (1,250) (22,838)Fair value of plan assets 5,442 9,787 3,386 1,370 1,086 21,071Impact of asset ceiling (407) (30) – – – (436)Net defined benefit asset/(liability) 192 (1,851) (321) (60) (164) (2,203)Net post-employment benefit (expense)/income 1 (67) (61) (34) (21) (21) (204)
1 Canada includes a past service credit of USD 5 million.
Table 20.3b
Key information by main country – prior period
in USD millions, as of December 31, 2018
Switzerland
United
Kingdom
United
States Germany Other Total
Defined benefit obligation (4,590) (10,140) (3,387) (1,316) (1,160) (20,593)Fair value of plan assets 4,881 8,410 3,008 1,181 967 18,447Impact of asset ceiling (95) (18) – – – (113)Net defined benefit asset/(liability) 196 (1,748) (380) (135) (193) (2,260)Net post-employment benefit (expense)/income (98) (95) (106) (26) (13) (339)
Zurich Insurance GroupAnnual Report 2019 247
Group overview Governance Risk review Financial review
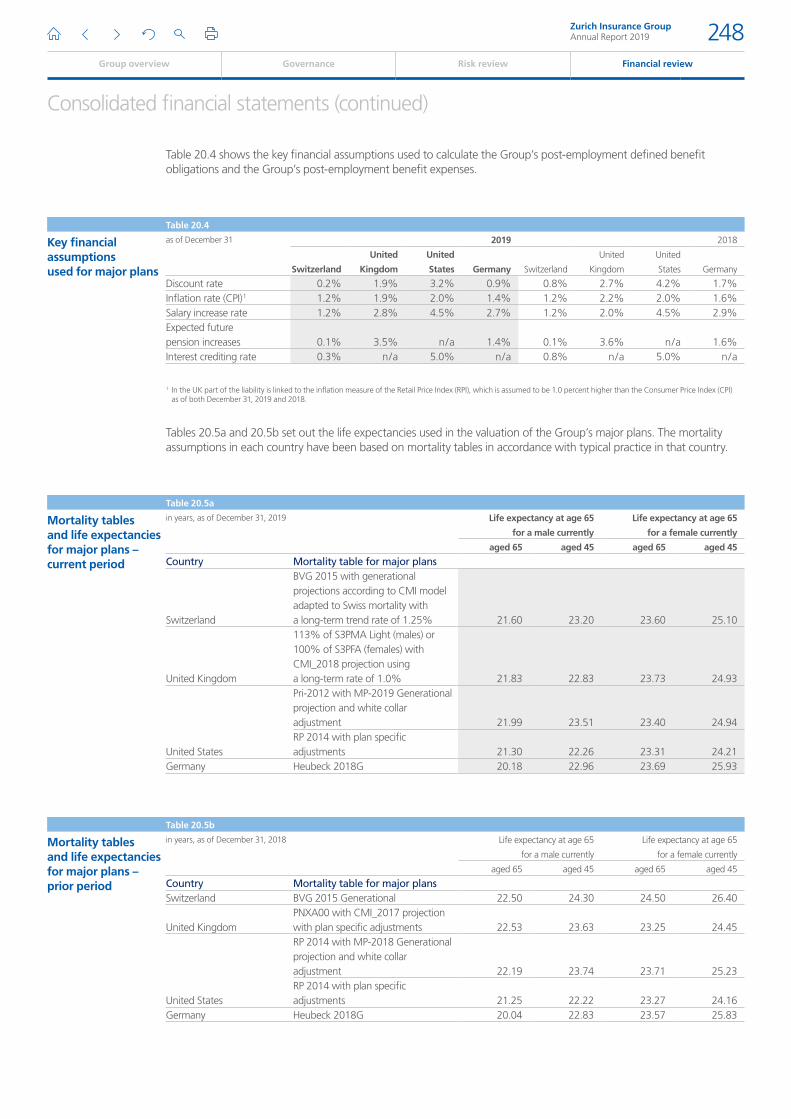
Consolidated financial statements (continued)
Table 20.4 shows the key financial assumptions used to calculate the Group’s post-employment defined benefit obligations and the Group’s post-employment benefit expenses.
Table 20.4
Key financial assumptions used for major plans
as of December 31 2019 2018
Switzerland
United
Kingdom
United
States Germany Switzerland
United
Kingdom
United
States Germany
Discount rate 0.2% 1.9% 3.2% 0.9% 0.8% 2.7% 4.2% 1.7%Inflation rate (CPI) 1 1.2% 1.9% 2.0% 1.4% 1.2% 2.2% 2.0% 1.6%Salary increase rate 1.2% 2.8% 4.5% 2.7% 1.2% 2.0% 4.5% 2.9%Expected future pension increases 0.1% 3.5% n / a 1.4% 0.1% 3.6% n / a 1.6%Interest crediting rate 0.3% n / a 5.0% n / a 0.8% n / a 5.0% n / a
1 In the UK part of the liability is linked to the inflation measure of the Retail Price Index (RPI), which is assumed to be 1.0 percent higher than the Consumer Price Index (CPI) as of both December 31, 2019 and 2018.
Tables 20.5a and 20.5b set out the life expectancies used in the valuation of the Group’s major plans. The mortality assumptions in each country have been based on mortality tables in accordance with typical practice in that country.
Table 20.5a
Mortality tables and life expectancies for major plans – current period
in years, as of December 31, 2019 Life expectancy at age 65
for a male currently
Life expectancy at age 65
for a female currently
aged 65 aged 45 aged 65 aged 45
Country Mortality table for major plans
Switzerland
BVG 2015 with generational projections according to CMI model adapted to Swiss mortality with a long-term trend rate of 1.25% 21.60 23.20 23.60 25.10
United Kingdom
113% of S3PMA Light (males) or 100% of S3PFA (females) with CMI_2018 projection using a long-term rate of 1.0% 21.83 22.83 23.73 24.93
United States
Pri-2012 with MP-2019 Generational projection and white collar adjustment 21.99 23.51 23.40 24.94 RP 2014 with plan specific adjustments 21.30 22.26 23.31 24.21
Germany Heubeck 2018G 20.18 22.96 23.69 25.93
Table 20.5b
Mortality tables and life expectancies for major plans – prior period
in years, as of December 31, 2018 Life expectancy at age 65
for a male currently
Life expectancy at age 65
for a female currently
aged 65 aged 45 aged 65 aged 45
Country Mortality table for major plansSwitzerland BVG 2015 Generational 22.50 24.30 24.50 26.40
United KingdomPNXA00 with CMI_2017 projection with plan specific adjustments 22.53 23.63 23.25 24.45
United States
RP 2014 with MP-2018 Generational projection and white collar adjustment 22.19 23.74 23.71 25.23 RP 2014 with plan specific adjustments 21.25 22.22 23.27 24.16
Germany Heubeck 2018G 20.04 22.83 23.57 25.83
Zurich Insurance GroupAnnual Report 2019 248
Group overview Governance Risk review Financial review
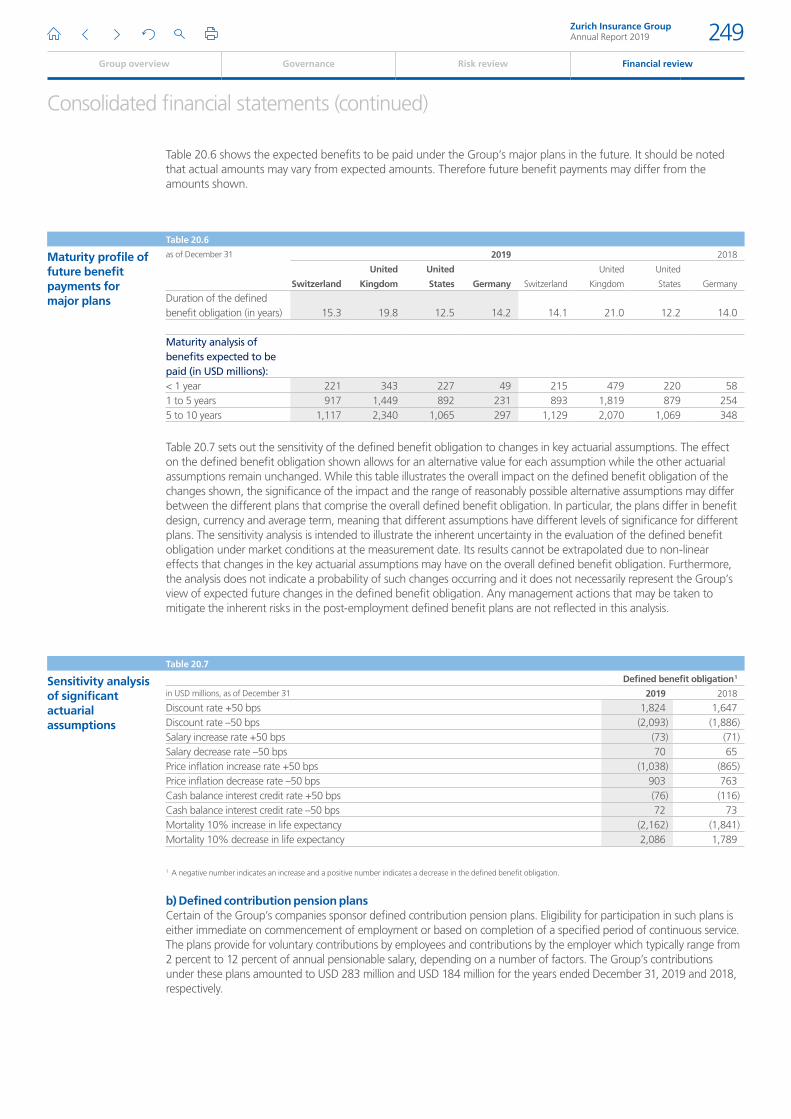
Consolidated financial statements (continued)
Table 20.6 shows the expected benefits to be paid under the Group’s major plans in the future. It should be noted that actual amounts may vary from expected amounts. Therefore future benefit payments may differ from the amounts shown.
Table 20.6
Maturity profile of future benefit payments for major plans
as of December 31 2019 2018
Switzerland
United
Kingdom
United
States Germany Switzerland
United
Kingdom
United
States Germany
Duration of the defined benefit obligation (in years) 15.3 19.8 12.5 14.2 14.1 21.0 12.2 14.0
Maturity analysis of benefits expected to be paid (in USD millions):< 1 year 221 343 227 49 215 479 220 58 1 to 5 years 917 1,449 892 231 893 1,819 879 254 5 to 10 years 1,117 2,340 1,065 297 1,129 2,070 1,069 348
Table 20.7 sets out the sensitivity of the defined benefit obligation to changes in key actuarial assumptions. The effect on the defined benefit obligation shown allows for an alternative value for each assumption while the other actuarial assumptions remain unchanged. While this table illustrates the overall impact on the defined benefit obligation of the changes shown, the significance of the impact and the range of reasonably possible alternative assumptions may differ between the different plans that comprise the overall defined benefit obligation. In particular, the plans differ in benefit design, currency and average term, meaning that different assumptions have different levels of significance for different plans. The sensitivity analysis is intended to illustrate the inherent uncertainty in the evaluation of the defined benefit obligation under market conditions at the measurement date. Its results cannot be extrapolated due to non-linear effects that changes in the key actuarial assumptions may have on the overall defined benefit obligation. Furthermore, the analysis does not indicate a probability of such changes occurring and it does not necessarily represent the Group’s view of expected future changes in the defined benefit obligation. Any management actions that may be taken to mitigate the inherent risks in the post-employment defined benefit plans are not reflected in this analysis.
Table 20.7
Sensitivity analysis of significant actuarial assumptions
Defined benefit obligation 1
in USD millions, as of December 31 2019 2018
Discount rate +50 bps 1,824 1,647 Discount rate –50 bps (2,093) (1,886)Salary increase rate +50 bps (73) (71)Salary decrease rate –50 bps 70 65 Price inflation increase rate +50 bps (1,038) (865)Price inflation decrease rate –50 bps 903 763 Cash balance interest credit rate +50 bps (76) (116)Cash balance interest credit rate –50 bps 72 73 Mortality 10% increase in life expectancy (2,162) (1,841)Mortality 10% decrease in life expectancy 2,086 1,789
1 A negative number indicates an increase and a positive number indicates a decrease in the defined benefit obligation.
b) Defined contribution pension plansCertain of the Group’s companies sponsor defined contribution pension plans. Eligibility for participation in such plans is either immediate on commencement of employment or based on completion of a specified period of continuous service. The plans provide for voluntary contributions by employees and contributions by the employer which typically range from 2 percent to 12 percent of annual pensionable salary, depending on a number of factors. The Group’s contributions under these plans amounted to USD 283 million and USD 184 million for the years ended December 31, 2019 and 2018, respectively.
Zurich Insurance GroupAnnual Report 2019 249
Group overview Governance Risk review Financial review
Consolidated financial statements (continued)
21. Share-based compensation and cash incentive plans
The Group has adopted various share-based compensation and cash incentive plans to attract, retain and motivate executives and employees. The plans are designed to reward employees for their contribution to the performance of the Group and to encourage employee share ownership. Share-based compensation plans include plans under which shares and options to purchase shares, based on the performance of the businesses, can be awarded. Share-based compensation plans are based on the provision of Zurich Insurance Group Ltd shares.
a) Cash incentive plansVarious businesses throughout the Group operate short-term incentive programs for executives, management and, in some cases, for employees of that business. Awards are made in cash, based on the accomplishment of both organizational and individual performance objectives. The expense recognized for these cash incentive plans amounted to USD 511 million and USD 523 million for the years ended December 31, 2019 and 2018, respectively.
b) Share-based compensation plans for employees and executivesThe Group encourages employees to own shares in Zurich Insurance Group Ltd and has set up a framework based on the implementation of performance share programs. Actual plans are tailored to meet local market requirements.
The cost of share-based payments depends on various factors, including achievement of targets, and are subject to the discretion of the Remuneration Committee and the Board. Costs may therefore vary significantly from year to year. The net amounts of USD 229 million and USD 215 million for the years ended December 31, 2019 and 2018, respectively, reflect all aspects of share-based compensation, including adjustments made during the year.
The explanations below provide a more detailed overview of the main plans of the Group.
Employee share plansShare Incentive Plan for employees in the UKThe Group established an Inland Revenue approved Share Incentive Plan and launched the Partnership Shares element of this plan in 2003, which enabled participating employees to make monthly purchases of Zurich Insurance Group Ltd shares at the prevailing market price from their gross earnings. This plan was terminated in 2007. There were 34 and 47 participants in the plan as of December 31, 2019 and 2018, respectively.
A revised Partnership Share Scheme was launched in March 2013. Participants benefit from purchasing shares by making deductions from gross salary up to a maximum of GBP 1,800 or 10 percent of their year-to-date earnings. There were 658 and 688 active participants in the plan as of December 31, 2019 and 2018, respectively.
The Group also operates a profit-sharing element of the Share Incentive Plan (Reward Shares) which was launched in 2004 with annual share allocations being made in May each year subject to business performance. The awards are based on business operating profit (BOP) after tax for the year achieved by the business unit of each participating employee. Individual awards are subject to a maximum of 5 percent of a participant’s base salary (before any flexible benefit adjustments) with an overall maximum of GBP 3,600. The total number of participating employees in Reward Shares as of December 31, 2019 and 2018 was 2,612 and 3,192, respectively.
A Dividend Shares scheme was launched in 2014 which allows employees to reinvest their dividends from Partnership Shares 3 and Reward Shares 3. As of December 31, 2019 and 2018, there were 439 and 385 participants in the scheme, respectively.
Share Incentive Plan for employees in SwitzerlandUnder this plan, employees have the option to acquire sales-restricted shares at a 30 percent discount to the market value. The maximum permitted investment in shares is equivalent to CHF 3,500 per employee per annum. During 2019, 4,096 employees were eligible to participate in the share incentive plan, compared with 4,097 in 2018. For the years ended December 31, 2019 and 2018, 1,761 and 1,648 employees, respectively, purchased shares under the 2018 and 2019 share plans.
The Group Long-Term Incentive Plan (LTIP)Participants in this plan are allocated a target number of performance shares as notional shares of Zurich Insurance Group Ltd in April each year (target shares). The number of target shares is calculated as a percentage of annual base salary of each participant.
Zurich Insurance GroupAnnual Report 2019 250
Group overview Governance Risk review Financial review
Consolidated financial statements (continued)
Target shares allocated in 2019 will vest after a period of three years following the year of allocation (three year cliff vesting), with the actual level of vesting between 0 percent and 200 percent of the target shares allocated, depending on the achievement of pre-defined performance criteria. The performance criteria used to determine the level of vesting are the Group’s return on shareholders’ equity (ROE), the position of its relative total shareholder return (TSR) measured against an international peer group of insurance companies, and the achievement of cash remittance targets. The three pre-defined performance criteria are each assessed over a period of three consecutive financial years starting in the year of allocation and have an equal weighting. One half of the shares that actually vest are sales-restricted for a further three years for members of the Executive Committee. To further align the participants with the interests of the shareholders, effective from January 1, 2014, the target shares are credited with dividend equivalent shares during the vesting period to compensate participants in LTIP for dividends paid to shareholders. As of December 31, 2019 and 2018 there were 1,133 and 1,031 participants in this plan, respectively.
Table 21
Shares allocated during the period
for the years ended December 31
Number
Fair value at the
allocation date (in CHF)
2019 2018 2019 2018
Shares allocated during the period 517,101 544,780 333 310
The shares allocated each year are based on target under the Group’s LTIP. The level of vesting will depend on the level of achievements in the performance criteria. If the vesting level is different to target, the actual cost of the share-based payments is adjusted accordingly in the year when the level of vesting is determined.
Zurich Insurance GroupAnnual Report 2019 251
Group overview Governance Risk review Financial review
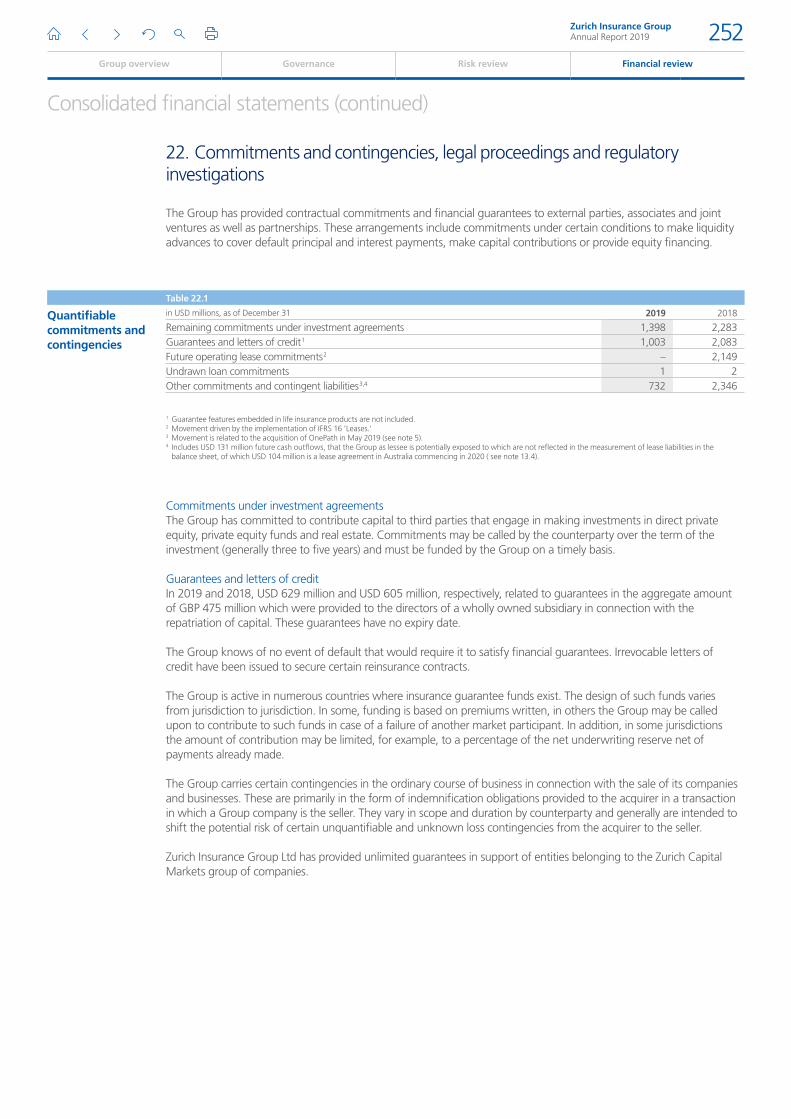
Consolidated financial statements (continued)
22. Commitments and contingencies, legal proceedings and regulatory investigations
The Group has provided contractual commitments and financial guarantees to external parties, associates and joint ventures as well as partnerships. These arrangements include commitments under certain conditions to make liquidity advances to cover default principal and interest payments, make capital contributions or provide equity financing.
Table 22.1
Quantifiable commitments and contingencies
in USD millions, as of December 31 2019 2018
Remaining commitments under investment agreements 1,398 2,283Guarantees and letters of credit 1 1,003 2,083Future operating lease commitments 2 – 2,149Undrawn loan commitments 1 2Other commitments and contingent liabilities 3,4 732 2,346
1 Guarantee features embedded in life insurance products are not included.2 Movement driven by the implementation of IFRS 16 ’Leases.’3 Movement is related to the acquisition of OnePath in May 2019 (see note 5). 4 Includes USD 131 million future cash outflows, that the Group as lessee is potentially exposed to which are not reflected in the measurement of lease liabilities in the
balance sheet, of which USD 104 million is a lease agreement in Australia commencing in 2020 ( see note 13.4).
Commitments under investment agreementsThe Group has committed to contribute capital to third parties that engage in making investments in direct private equity, private equity funds and real estate. Commitments may be called by the counterparty over the term of the investment (generally three to five years) and must be funded by the Group on a timely basis.
Guarantees and letters of creditIn 2019 and 2018, USD 629 million and USD 605 million, respectively, related to guarantees in the aggregate amount of GBP 475 million which were provided to the directors of a wholly owned subsidiary in connection with the repatriation of capital. These guarantees have no expiry date.
The Group knows of no event of default that would require it to satisfy financial guarantees. Irrevocable letters of credit have been issued to secure certain reinsurance contracts.
The Group is active in numerous countries where insurance guarantee funds exist. The design of such funds varies from jurisdiction to jurisdiction. In some, funding is based on premiums written, in others the Group may be called upon to contribute to such funds in case of a failure of another market participant. In addition, in some jurisdictions the amount of contribution may be limited, for example, to a percentage of the net underwriting reserve net of payments already made.
The Group carries certain contingencies in the ordinary course of business in connection with the sale of its companies and businesses. These are primarily in the form of indemnification obligations provided to the acquirer in a transaction in which a Group company is the seller. They vary in scope and duration by counterparty and generally are intended to shift the potential risk of certain unquantifiable and unknown loss contingencies from the acquirer to the seller.
Zurich Insurance Group Ltd has provided unlimited guarantees in support of entities belonging to the Zurich Capital Markets group of companies.
Zurich Insurance GroupAnnual Report 2019 252
Group overview Governance Risk review Financial review
Consolidated financial statements (continued)
Other contingent liabilitiesThe Group has received notices from various tax authorities asserting deficiencies in taxes for various years. The Group is of the view that the ultimate outcome of these reviews will not materially affect the Group’s consolidated financial position.
The Group has commitments to provide collateral on certain contracts in the event of a financial strength downgrading for Zurich Insurance Company Ltd from the current AA– by Standard & Poor’s. Should the rating by Standard & Poor’s fall to A+, then the additional collateral based on information available amounts to nil as of both December 31, 2018 and 2019.
In common with other insurance companies, the Group is mindful of the trend toward enhanced consumer protection. There is significant uncertainty about the ultimate cost this trend might have on our business. The main areas of uncertainty concern court decisions as well as the volume of potential customer complaints related to sales activities and withdrawal rights, and their respective individual assessments.
Pledged assetsThe majority of assets pledged to secure the Group’s liabilities relate to debt securities pledged under short-term sale and repurchase agreements. The total amount of pledged financial assets including the securities under short-term sale and repurchase agreements amounted to USD 1.4 billion and USD 2 billion as of December 31, 2019 and 2018, respectively.
Terms and conditions associated with the financial assets pledged to secure the Group’s liabilities are usual and standard in the markets in which the underlying agreements were executed.
Legal, compliance and regulatory developmentsIn recent years there has been an increase in the number of legislative initiatives that require information gathering and tax reporting regarding the Group’s customers and their contracts, including the U.S. Foreign Account Tax Compliance Act (FATCA) and the expected introduction of other automatic tax information exchange regimes based on the Common Reporting Standard (CRS). The Group’s compliance activities in this area could result in higher compliance costs, remedial actions and other related expenses for its life insurance, savings and pension business. There has also been increased scrutiny by various tax and law enforcement officials regarding cross-border business activities, including in particular by U.S. government authorities looking into activities of U.S. taxpayers with investments held outside the U.S. and activities of non-U.S. financial institutions that hold such investments.
The Group, on its own initiative, undertook an internal review of the life insurance, savings and pension business sold by its non-U.S. operating companies with relevant cross-border business to customers with a nexus to the U.S. The Group engaged outside counsel and other advisors to assist in this review, which was focused on assessing compliance with relevant U.S. tax laws. The review confirmed that the Group’s cross-border business with U.S. persons was very limited and of a legacy nature, with the large majority of sales having occurred more than a decade ago. The review also confirmed that the Group’s U.S. operating companies were not involved in or connected to those activities.
The Group has voluntarily disclosed the results of the review and the regulatory issues presented by sales to U.S. residents to the Swiss Financial Market Supervisory Authority (FINMA), the U.S. Department of Justice (DOJ) and other authorities. The Group is cooperating with these authorities.
On April 25, 2019, the DOJ announced that Zurich Life Insurance Company Ltd (ZLIC) and Zurich International Life Limited (ZILL) entered into a non-prosecution agreement (NPA) with the DOJ, which memorializes the DOJ’s decision not to prosecute these entities for any U.S. tax-related offenses in connection with legacy cross-border sales to U.S. persons. Under the terms of the NPA, ZLIC and ZILL agreed to pay USD 5 million to the U.S. Treasury and to comply with certain specified conditions during the four-year term of the NPA.
This resolution has not had and will not have an adverse effect on the Group’s operating results or consolidated financial condition.
Zurich Insurance GroupAnnual Report 2019 253
Group overview Governance Risk review Financial review

Consolidated financial statements (continued)
Legal proceedings and regulatory investigations The Group’s business is subject to extensive supervision, and the Group is in regular contact with various regulatory authorities. The Group is continuously involved in legal proceedings, claims and regulatory investigations arising, for the most part, in the ordinary course of its business operations.
While the Group believes that it is not a party to, nor are any of its subsidiaries the subject of, any unresolved current legal proceedings, claims, litigation and investigations that will have a material adverse effect on the Group’s consolidated financial condition, proceedings are inherently unpredictable, and it is possible that the outcome of any proceeding could have a material impact on results of operations in the particular reporting period in which it is resolved.
Zurich Insurance GroupAnnual Report 2019 254
Group overview Governance Risk review Financial review
Consolidated financial statements (continued)
23. Fair value measurement
To measure fair value, the Group gives the highest priority to quoted and unadjusted prices in active markets. In the absence of quoted prices, fair values are calculated through valuation techniques, making the maximum use of relevant observable market data inputs. Whenever observable parameters are not available, the inputs used to derive the fair value are based on common market assumptions that market participants would use when pricing assets and liabilities. Depending on the observability of prices and inputs to valuation techniques, the Group classifies instruments measured at fair value within the following three levels (the fair value hierarchy):
Level 1 – includes assets and liabilities for which fair values are determined directly from unadjusted current quoted prices resulting from orderly transactions in active markets for identical assets/liabilities.
Level 2 – includes assets and liabilities for which fair values are determined using significant inputs other than quoted prices included in level 1 that are observable for the asset or liability, either directly or indirectly. These inputs include quoted prices for similar assets or liabilities in active markets, quoted prices for identical or similar assets or liabilities in markets that are not active, and other observable market inputs.
Level 3 – includes assets and liabilities for which fair values are determined using valuation techniques with at least one significant input not being based on observable market data. This approach is used only in circumstances when there is little, if any, market activity for a certain instrument, and the Group is required to rely on third party providers or develop internal valuation inputs based on the best information available about the assumptions that market participants would use when pricing the asset or liability.
The governance framework and oversight of the Group’s standards and procedures regarding the valuation of financial instruments measured at fair value lies within the responsibility of Group Risk Management, Group Investment Management, Treasury Capital Management and Group Finance. Specialists from these departments ensure the adequacy of valuation models, approve methodologies and sources to derive model input parameters, provide oversight over the selection of third party pricing providers, and on a semi-annual basis review the classification within the fair value hierarchy of the financial instruments in scope.
The Group makes extensive use of third-party pricing providers to determine the fair values of its available-for-sale and fair value through profit or loss financial instruments, and only in rare cases places reliance on prices that are derived from internal models. Investment accounting, operations and process functions, are independent from those responsible for buying and selling the assets, and are responsible for receiving, challenging and verifying values provided by third party pricing providers to ensure that fair values are reliable, as well as ensuring compliance with applicable accounting and valuation policies. The quality control procedures used depend on the nature and complexity of the invested assets. They include variance and stale price analysis, and comparisons with fair values of similar instruments and with alternative values obtained from asset managers and brokers.
Zurich Insurance GroupAnnual Report 2019 255
Group overview Governance Risk review Financial review
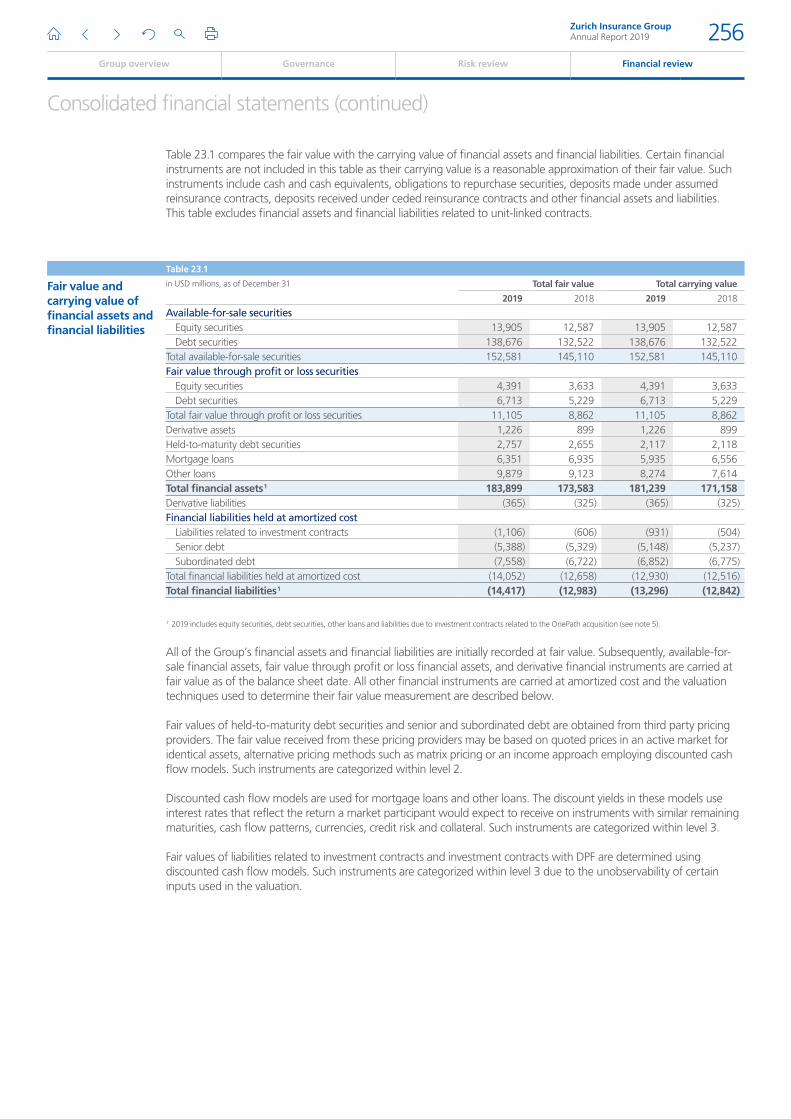
Consolidated financial statements (continued)
Table 23.1 compares the fair value with the carrying value of financial assets and financial liabilities. Certain financial instruments are not included in this table as their carrying value is a reasonable approximation of their fair value. Such instruments include cash and cash equivalents, obligations to repurchase securities, deposits made under assumed reinsurance contracts, deposits received under ceded reinsurance contracts and other financial assets and liabilities. This table excludes financial assets and financial liabilities related to unit-linked contracts.
Table 23.1
Fair value and carrying value of financial assets and financial liabilities
in USD millions, as of December 31 Total fair value Total carrying value
2019 2018 2019 2018
Available-for-sale securitiesEquity securities 13,905 12,587 13,905 12,587Debt securities 138,676 132,522 138,676 132,522
Total available-for-sale securities 152,581 145,110 152,581 145,110Fair value through profit or loss securities
Equity securities 4,391 3,633 4,391 3,633Debt securities 6,713 5,229 6,713 5,229
Total fair value through profit or loss securities 11,105 8,862 11,105 8,862Derivative assets 1,226 899 1,226 899Held-to-maturity debt securities 2,757 2,655 2,117 2,118Mortgage loans 6,351 6,935 5,935 6,556Other loans 9,879 9,123 8,274 7,614Total financial assets 1 183,899 173,583 181,239 171,158Derivative liabilities (365) (325) (365) (325)Financial liabilities held at amortized cost
Liabilities related to investment contracts (1,106) (606) (931) (504)Senior debt (5,388) (5,329) (5,148) (5,237)Subordinated debt (7,558) (6,722) (6,852) (6,775)
Total financial liabilities held at amortized cost (14,052) (12,658) (12,930) (12,516)Total financial liabilities 1 (14,417) (12,983) (13,296) (12,842)
1 2019 includes equity securities, debt securities, other loans and liabilities due to investment contracts related to the OnePath acquisition (see note 5).
All of the Group’s financial assets and financial liabilities are initially recorded at fair value. Subsequently, available-for-sale financial assets, fair value through profit or loss financial assets, and derivative financial instruments are carried at fair value as of the balance sheet date. All other financial instruments are carried at amortized cost and the valuation techniques used to determine their fair value measurement are described below.
Fair values of held-to-maturity debt securities and senior and subordinated debt are obtained from third party pricing providers. The fair value received from these pricing providers may be based on quoted prices in an active market for identical assets, alternative pricing methods such as matrix pricing or an income approach employing discounted cash flow models. Such instruments are categorized within level 2.
Discounted cash flow models are used for mortgage loans and other loans. The discount yields in these models use interest rates that reflect the return a market participant would expect to receive on instruments with similar remaining maturities, cash flow patterns, currencies, credit risk and collateral. Such instruments are categorized within level 3.
Fair values of liabilities related to investment contracts and investment contracts with DPF are determined using discounted cash flow models. Such instruments are categorized within level 3 due to the unobservability of certain inputs used in the valuation.
Zurich Insurance GroupAnnual Report 2019 256
Group overview Governance Risk review Financial review
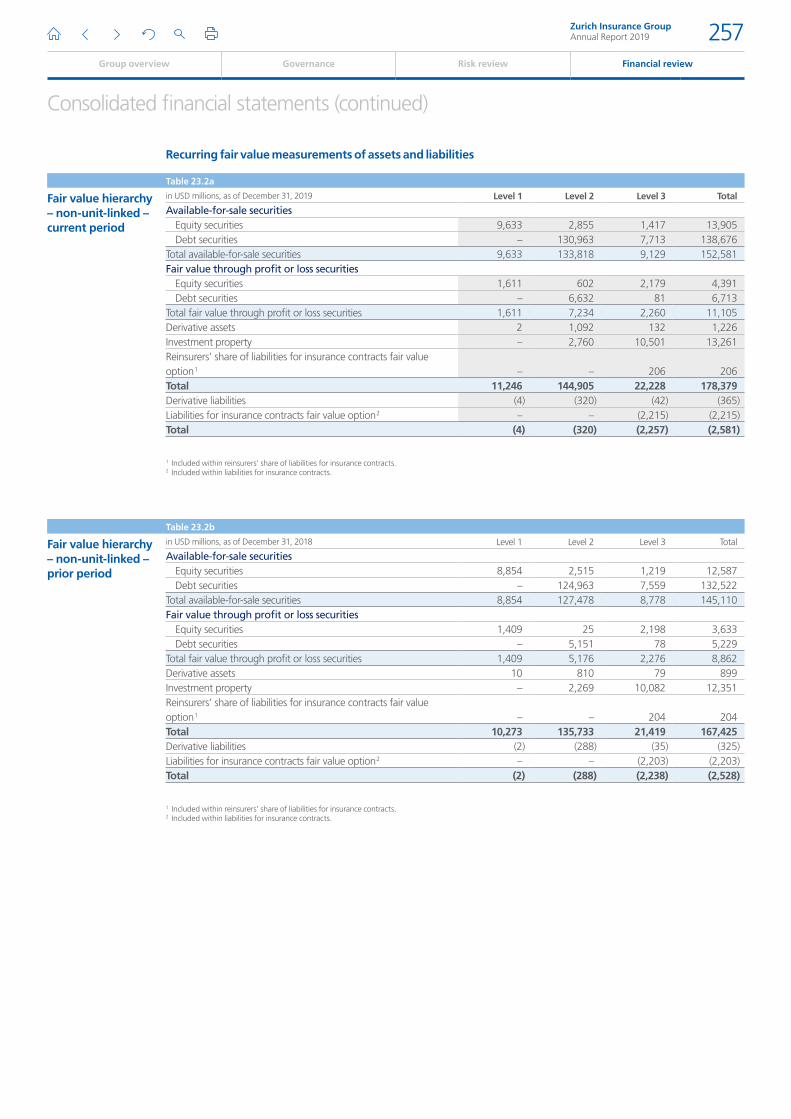
Consolidated financial statements (continued)
Recurring fair value measurements of assets and liabilities
Table 23.2a
Fair value hierarchy – non-unit-linked – current period
in USD millions, as of December 31, 2019 Level 1 Level 2 Level 3 Total
Available-for-sale securitiesEquity securities 9,633 2,855 1,417 13,905Debt securities – 130,963 7,713 138,676
Total available-for-sale securities 9,633 133,818 9,129 152,581Fair value through profit or loss securities
Equity securities 1,611 602 2,179 4,391Debt securities – 6,632 81 6,713
Total fair value through profit or loss securities 1,611 7,234 2,260 11,105Derivative assets 2 1,092 132 1,226Investment property – 2,760 10,501 13,261Reinsurers’ share of liabilities for insurance contracts fair value option 1 – – 206 206Total 11,246 144,905 22,228 178,379Derivative liabilities (4) (320) (42) (365)Liabilities for insurance contracts fair value option 2 – – (2,215) (2,215)Total (4) (320) (2,257) (2,581)
1 Included within reinsurers’ share of liabilities for insurance contracts.2 Included within liabilities for insurance contracts.
Table 23.2b
Fair value hierarchy – non-unit-linked – prior period
in USD millions, as of December 31, 2018 Level 1 Level 2 Level 3 Total
Available-for-sale securitiesEquity securities 8,854 2,515 1,219 12,587Debt securities – 124,963 7,559 132,522
Total available-for-sale securities 8,854 127,478 8,778 145,110Fair value through profit or loss securities
Equity securities 1,409 25 2,198 3,633Debt securities – 5,151 78 5,229
Total fair value through profit or loss securities 1,409 5,176 2,276 8,862Derivative assets 10 810 79 899Investment property – 2,269 10,082 12,351Reinsurers’ share of liabilities for insurance contracts fair value option 1 – – 204 204Total 10,273 135,733 21,419 167,425Derivative liabilities (2) (288) (35) (325)Liabilities for insurance contracts fair value option 2 – – (2,203) (2,203)Total (2) (288) (2,238) (2,528)
1 Included within reinsurers’ share of liabilities for insurance contracts.2 Included within liabilities for insurance contracts.
Zurich Insurance GroupAnnual Report 2019 257
Group overview Governance Risk review Financial review
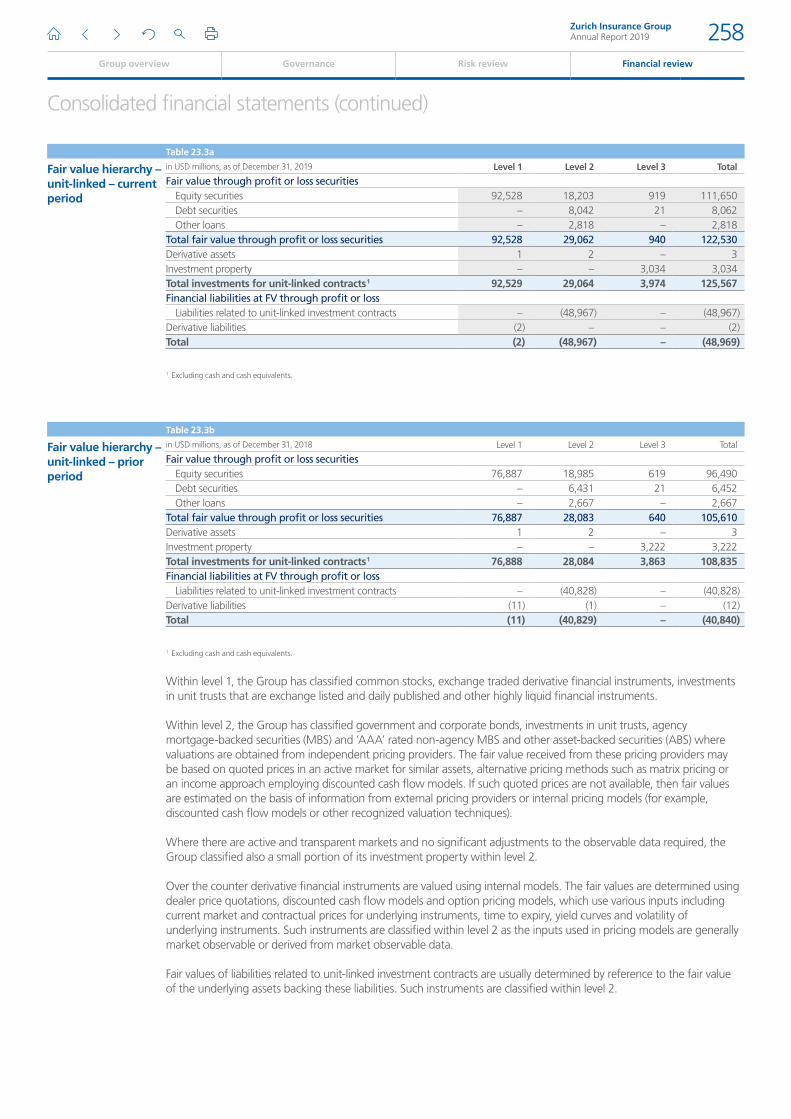
Consolidated financial statements (continued)
Table 23.3a
Fair value hierarchy – unit-linked – current period
in USD millions, as of December 31, 2019 Level 1 Level 2 Level 3 Total
Fair value through profit or loss securitiesEquity securities 92,528 18,203 919 111,650Debt securities – 8,042 21 8,062Other loans – 2,818 – 2,818
Total fair value through profit or loss securities 92,528 29,062 940 122,530Derivative assets 1 2 – 3Investment property – – 3,034 3,034Total investments for unit-linked contracts 1 92,529 29,064 3,974 125,567Financial liabilities at FV through profit or loss
Liabilities related to unit-linked investment contracts – (48,967) – (48,967)Derivative liabilities (2) – – (2)Total (2) (48,967) – (48,969)
1 Excluding cash and cash equivalents.
Table 23.3b
Fair value hierarchy – unit-linked – prior period
in USD millions, as of December 31, 2018 Level 1 Level 2 Level 3 Total
Fair value through profit or loss securitiesEquity securities 76,887 18,985 619 96,490Debt securities – 6,431 21 6,452Other loans – 2,667 – 2,667
Total fair value through profit or loss securities 76,887 28,083 640 105,610Derivative assets 1 2 – 3Investment property – – 3,222 3,222Total investments for unit-linked contracts 1 76,888 28,084 3,863 108,835Financial liabilities at FV through profit or loss
Liabilities related to unit-linked investment contracts – (40,828) – (40,828)Derivative liabilities (11) (1) – (12)Total (11) (40,829) – (40,840)
1 Excluding cash and cash equivalents.
Within level 1, the Group has classified common stocks, exchange traded derivative financial instruments, investments in unit trusts that are exchange listed and daily published and other highly liquid financial instruments.
Within level 2, the Group has classified government and corporate bonds, investments in unit trusts, agency mortgage-backed securities (MBS) and ’AAA’ rated non-agency MBS and other asset-backed securities (ABS) where valuations are obtained from independent pricing providers. The fair value received from these pricing providers may be based on quoted prices in an active market for similar assets, alternative pricing methods such as matrix pricing or an income approach employing discounted cash flow models. If such quoted prices are not available, then fair values are estimated on the basis of information from external pricing providers or internal pricing models (for example, discounted cash flow models or other recognized valuation techniques).
Where there are active and transparent markets and no significant adjustments to the observable data required, the Group classified also a small portion of its investment property within level 2.
Over the counter derivative financial instruments are valued using internal models. The fair values are determined using dealer price quotations, discounted cash flow models and option pricing models, which use various inputs including current market and contractual prices for underlying instruments, time to expiry, yield curves and volatility of underlying instruments. Such instruments are classified within level 2 as the inputs used in pricing models are generally market observable or derived from market observable data.
Fair values of liabilities related to unit-linked investment contracts are usually determined by reference to the fair value of the underlying assets backing these liabilities. Such instruments are classified within level 2.
Zurich Insurance GroupAnnual Report 2019 258
Group overview Governance Risk review Financial review
Consolidated financial statements (continued)
Within level 3, the Group has classified:
33 Unlisted stocks, private equity funds and hedge funds that are not actively traded. Such instruments are obtained from net asset value information and audited financial statements provided by the issuing company. Quantitative unobservable inputs are not developed by the Group when measuring fair value of these assets.
33 Non-agency MBS and ABS rated below ’AAA’ that are valued by independent pricing providers using a variety of valuation techniques which may require use of significant unobservable input parameters such as asset prepayment rate, default rates and credit curves. Quantitative unobservable inputs are not developed by the Group when measuring fair value of these assets.
33 Options and long-dated derivative financial instruments with fair values determined using counterparty valuations or calculated using significant unobservable inputs such as historical volatilities, historical correlation, implied volatilities from the counterparty or derived using extrapolation techniques. Quantitative information on unobservable inputs are not available when counterparty pricing was used. For internally calculated fair values significant increases/(decreases) in volatilities or correlation, would result in a significantly higher/(lower) fair value measurement.
33 Investment properties for which fair value is based on valuations performed annually by internal valuation specialists and generally on a rotation basis at least once every three years by an independent qualified appraiser. In general the portfolio is valued using an internal income capitalization approach. The model is asset specific and capitalizes the sustainable investment income of a property with its risk specific cap rate. This cap rate is an ‘all risk yield’ with components such as asset class yield for core assets (lowest risk) plus additional premiums for additional risks, for example second tier location or deterioration risk. All cap rate components (risk premiums) are reviewed and, if necessary, adjusted annually before revaluations are performed. The model takes into consideration external factors such as interest rate, market rent and vacancy rate. The significant unobservable inputs which are outside this model, are estimated rental value, rental growth, long term vacancy rate and discount rate. Significant increases/(decreases) in rental value and rental growth, in isolation, would result in a significantly higher/(lower) fair value measurement. Significant increases/(decreases) in the long term vacancy rate and discount rate, in isolation, would result in a significantly lower/(higher) fair value measurement.
33 Reinsurers’ share of liabilities and liabilities for insurance contracts fair value option. The fair values are determined using discounted cash flow models. The discount factors used are based on derived rates for LIBOR swap forwards, spreads to U.S. Treasuries and spreads to U.S. corporate A or higher rated bond segments for financials, industrials and utilities. The liability-projected cash flows use contractual information for premiums, benefits and agent commissions, administrative expenses under third party administrative service agreements and best estimate parameters for policy decrements. The primary unobservable inputs are the policy decrement assumptions used in projecting cash flows. These include disability claim parameters for incidence and termination (whether for recovery or death) and lapse rates. Significant increases/(decreases) in claim incidence rates and significant decreases/(increases) in claim termination rates would result in a significantly higher/(lower) fair value measurement.
33 The Group’s private debt holdings comprise certain private placements and other collateralized loan obligations (CLO) which are valued by dedicated external asset managers applying a combination of expert judgment and other specific adjustments for which interest rates as well as credit spreads serve as input parameters. Quantitative unobservable inputs are not developed by the Group when measuring fair value of these assets.
For details on Group investments sensitivities, refer to section analysis by risk type in the risk review.
The fair value hierarchy is reviewed at the end of each reporting period to determine whether significant transfers between levels have occurred. Transfers between levels mainly arise as a result of changes in market activity and observability of the inputs to the valuation techniques used to determine the fair value of certain instruments.
No material transfers between level 1 and level 2 occurred for the year ended December 31, 2019.
Zurich Insurance GroupAnnual Report 2019 259
Group overview Governance Risk review Financial review
Consolidated financial statements (continued)
Table 23.4a
Development of assets and liabilities classified within level 3 – non-unit-linked – current period
in USD millions Available-for-sale
securities
Fair value through profit
or loss securities
Derivative
assets
Derivative
liabilities
Investment
property
Equity
securities
Debt
securities
Equity
securities
Debt
securities
As of January 1, 2019 1,219 7,559 2,198 78 79 (35) 10,082Realized gains/(losses) recognized in income 1 107 7 26 – (12) – 183Unrealized gains/(losses) recognized in income 1,2 (8) (16) 198 2 (6) (17) 213Unrealized gains/(losses) recognized in other comprehensive income 34 286 – – 61 18 –Purchases 286 1,271 237 9 14 (8) 854Settlements/sales/redemptions (228) (809) (491) (1) (2) – (882)Transfer from/to assets held for own use – – – – – – 18Transfers into level 3 – 34 – – – – –Transfers out of level 3 (11) (619) – (7) – – –Foreign currency translation effects 17 – 11 1 (1) 1 33As of December 31, 2019 1,417 7,713 2,179 81 132 (42) 10,501
1 Presented as net capital gains/(losses) and impairments on Group investments in the audited consolidated income statements.2 Unrealized gains/(losses) recognized in income for available-for-sale securities relate to impairments.
For the year ended December 31, 2019, the Group transferred USD 619 million of available-for-sale debt securities out of level 3 into level 2 and USD 34 million out of level 2 into level 3. The transfers were mainly driven by a pricing provider change for a significant portfolio of syndicated loans receiving market quotes on a regular basis as a result of orderly market transactions and a rating upgrading of none-agency asset backed securities to ‘AAA.’
Table 23.4b
Development of assets and liabilities classified within level 3 – non-unit-linked – prior period
in USD millions Available-for-sale
securities
Fair value through profit or
loss securities
Derivative
assets
Derivative
liabilities
Investment
property
Equity
securities
Debt
securities
Equity
securities
Debt
securities
As of January 1, 2018 988 6,251 2,566 84 61 (30) 9,464Realized gains/(losses) recognized in income 1 104 14 38 – (1) – 123Unrealized gains/(losses) recognized in income 1,2 (9) (15) (43) (2) (6) (5) 136Unrealized gains/(losses) recognized in other comprehensive income 102 (163) – – 11 1 –Purchases 278 2,456 511 – 8 (4) 689Settlements/sales/redemptions (212) (1,181) (870) (2) (6) – (668)Transfer to assets held for sale – – – – – – (15)Transfers into level 3 4 352 – – 17 – 554Transfers out of level 3 – (43) – – – – –Foreign currency translation effects (37) (111) (4) (2) (3) 2 (201)As of December 31, 2018 1,219 7,559 2,198 78 79 (35) 10,082
1 Presented as net capital gains/(losses) and impairments on Group investments in the audited consolidated income statements.2 Unrealized gains/(losses) recognized in income for available-for-sale securities relate to impairments.
For the year ended December 31, 2018, the Group transferred USD 352 million of available-for-sale debt securities out of level 2 into level 3. The transfers were mainly due to a review of the classification of certain collateralized loan obligations due to the observability of the inputs used in the valuation techniques to determine its fair value. The Group also transferred USD 554 million of investment property out of level 2 into level 3. The transfer resulted from a review of the classification of the real estate property due to the observability of the inputs used in the valuation techniques to determine its fair value.
Zurich Insurance GroupAnnual Report 2019 260
Group overview Governance Risk review Financial review
Consolidated financial statements (continued)
Table 23.5a
Development of liabilities for insurance contracts fair value option classified within level 3 – current period
in USD millions Gross Ceded Net
As of January 1, 2019 2,203 (204) 1,999Premiums 54 (5) 50Claims (233) 15 (218)Fee income and other expenses 1 5 6Interest and bonuses credited to policyholders 194 (18) 176Changes in assumptions (3) – (3)As of December 31, 2019 2,215 (206) 2,010
Table 23.5b
Development of liabilities for insurance contracts fair value option classified within level 3 – prior period
in USD millions Gross Ceded Net
As of January 1, 2018 2,436 (224) 2,212Premiums 62 (5) 57Claims (249) 22 (227)Fee income and other expenses (15) 2 (12)Interest and bonuses credited to policyholders (26) 1 (24)Changes in assumptions (6) – (6)(Decreases)/increases recorded in other comprehensive income – – –As of December 31, 2018 2,203 (204) 1,999
Table 23.6a
Development assets and liabilities classified within level 3 – unit-linked – current period
in USD millions Fair value through profit or loss
securities
Equity
securities
Debt
securities
Investment
property
As of January 1, 2019 619 21 3,222Realized gains/(losses) recognized in income 1 4 – (55)Unrealized gains/(losses) recognized in income 1 61 – 20Purchases 292 – 144Sales/redemptions (57) (2) (418)Transfers into level 3 1 – –Transfers out of level 3 – – –Acquisitions and divestments – – 7Foreign currency translation effects (1) – 112As of December 31, 2019 919 21 3,034
1 Presented as net investment result on unit-linked investments in the consolidated income statements.
Zurich Insurance GroupAnnual Report 2019 261
Group overview Governance Risk review Financial review
Consolidated financial statements (continued)
Table 23.6b
Development assets and liabilities classified within level 3 – unit-linked – prior period
in USD millions Fair value through profit or loss
securities
Equity
securities
Debt
securities
Investment
property
As of January 1, 2018 503 51 3,410Realized gains/(losses) recognized in income 1 6 – 134Unrealized gains/(losses) recognized in income 1 – 1 (18)Purchases 162 – 232Sales/redemptions (84) (14) (333)Transfers into level 3 32 – –Transfers out of level 3 – (16) –Acquisitions and divestments – – (9)Foreign currency translation effects (1) (1) (195)As of December 31, 2018 619 21 3,222
1 Presented as net investment result on unit-linked investments in the consolidated income statements.
Non-recurring fair value measurements of assets and liabilitiesUnder certain circumstances, the Group may measure certain assets or liabilities at fair value on a non-recurring basis when an impairment charge is recognized.
Zurich Insurance GroupAnnual Report 2019 262
Group overview Governance Risk review Financial review
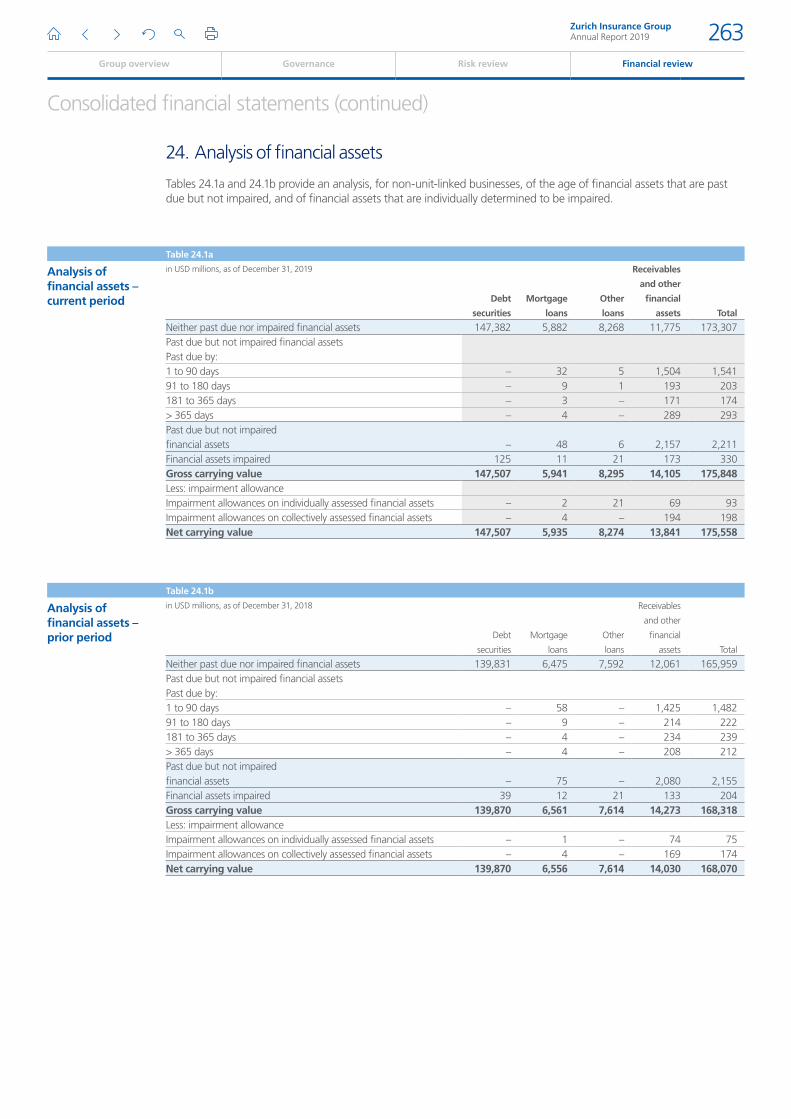
Consolidated financial statements (continued)
24. Analysis of financial assets
Tables 24.1a and 24.1b provide an analysis, for non-unit-linked businesses, of the age of financial assets that are past due but not impaired, and of financial assets that are individually determined to be impaired.
Table 24.1a
Analysis of financial assets – current period
in USD millions, as of December 31, 2019
Debt
securities
Mortgage
loans
Other
loans
Receivables
and other
financial
assets Total
Neither past due nor impaired financial assets 147,382 5,882 8,268 11,775 173,307Past due but not impaired financial assets Past due by:1 to 90 days – 32 5 1,504 1,54191 to 180 days – 9 1 193 203181 to 365 days – 3 – 171 174> 365 days – 4 – 289 293Past due but not impaired financial assets – 48 6 2,157 2,211Financial assets impaired 125 11 21 173 330Gross carrying value 147,507 5,941 8,295 14,105 175,848Less: impairment allowanceImpairment allowances on individually assessed financial assets – 2 21 69 93Impairment allowances on collectively assessed financial assets – 4 – 194 198Net carrying value 147,507 5,935 8,274 13,841 175,558
Table 24.1b
Analysis of financial assets – prior period
in USD millions, as of December 31, 2018
Debt
securities
Mortgage
loans
Other
loans
Receivables
and other
financial
assets Total
Neither past due nor impaired financial assets 139,831 6,475 7,592 12,061 165,959Past due but not impaired financial assets Past due by:1 to 90 days – 58 – 1,425 1,48291 to 180 days – 9 – 214 222181 to 365 days – 4 – 234 239> 365 days – 4 – 208 212Past due but not impaired financial assets – 75 – 2,080 2,155Financial assets impaired 39 12 21 133 204Gross carrying value 139,870 6,561 7,614 14,273 168,318Less: impairment allowanceImpairment allowances on individually assessed financial assets – 1 – 74 75Impairment allowances on collectively assessed financial assets – 4 – 169 174Net carrying value 139,870 6,556 7,614 14,030 168,070
Zurich Insurance GroupAnnual Report 2019 263
Group overview Governance Risk review Financial review
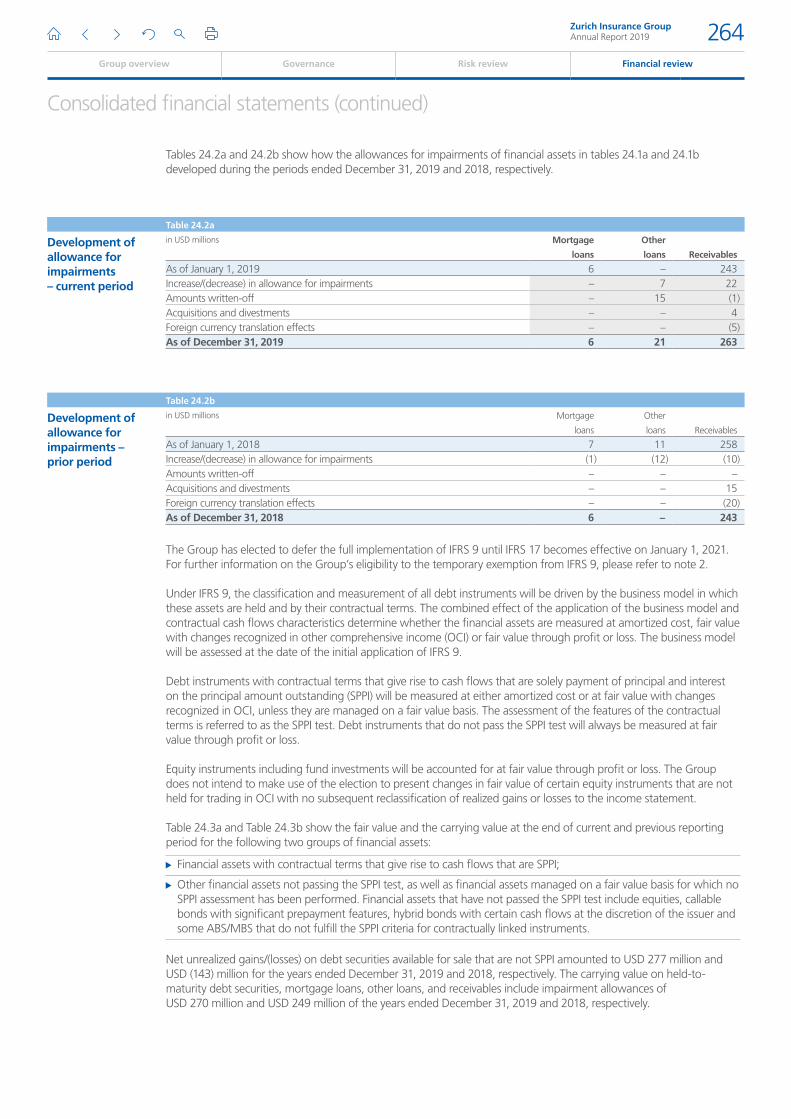
Consolidated financial statements (continued)
Tables 24.2a and 24.2b show how the allowances for impairments of financial assets in tables 24.1a and 24.1b developed during the periods ended December 31, 2019 and 2018, respectively.
Table 24.2a
Development of allowance for impairments – current period
in USD millions Mortgage
loans
Other
loans Receivables
As of January 1, 2019 6 – 243Increase/(decrease) in allowance for impairments – 7 22Amounts written-off – 15 (1)Acquisitions and divestments – – 4Foreign currency translation effects – – (5)As of December 31, 2019 6 21 263
Table 24.2b
Development of allowance for impairments – prior period
in USD millions Mortgage
loans
Other
loans Receivables
As of January 1, 2018 7 11 258Increase/(decrease) in allowance for impairments (1) (12) (10)Amounts written-off – – –Acquisitions and divestments – – 15Foreign currency translation effects – – (20)As of December 31, 2018 6 – 243
The Group has elected to defer the full implementation of IFRS 9 until IFRS 17 becomes effective on January 1, 2021. For further information on the Group’s eligibility to the temporary exemption from IFRS 9, please refer to note 2.
Under IFRS 9, the classification and measurement of all debt instruments will be driven by the business model in which these assets are held and by their contractual terms. The combined effect of the application of the business model and contractual cash flows characteristics determine whether the financial assets are measured at amortized cost, fair value with changes recognized in other comprehensive income (OCI) or fair value through profit or loss. The business model will be assessed at the date of the initial application of IFRS 9.
Debt instruments with contractual terms that give rise to cash flows that are solely payment of principal and interest on the principal amount outstanding (SPPI) will be measured at either amortized cost or at fair value with changes recognized in OCI, unless they are managed on a fair value basis. The assessment of the features of the contractual terms is referred to as the SPPI test. Debt instruments that do not pass the SPPI test will always be measured at fair value through profit or loss.
Equity instruments including fund investments will be accounted for at fair value through profit or loss. The Group does not intend to make use of the election to present changes in fair value of certain equity instruments that are not held for trading in OCI with no subsequent reclassification of realized gains or losses to the income statement.
Table 24.3a and Table 24.3b show the fair value and the carrying value at the end of current and previous reporting period for the following two groups of financial assets:
33 Financial assets with contractual terms that give rise to cash flows that are SPPI;
33 Other financial assets not passing the SPPI test, as well as financial assets managed on a fair value basis for which no SPPI assessment has been performed. Financial assets that have not passed the SPPI test include equities, callable bonds with significant prepayment features, hybrid bonds with certain cash flows at the discretion of the issuer and some ABS/MBS that do not fulfill the SPPI criteria for contractually linked instruments.
Net unrealized gains/(losses) on debt securities available for sale that are not SPPI amounted to USD 277 million and USD (143) million for the years ended December 31, 2019 and 2018, respectively. The carrying value on held-to-maturity debt securities, mortgage loans, other loans, and receivables include impairment allowances of USD 270 million and USD 249 million of the years ended December 31, 2019 and 2018, respectively.
Zurich Insurance GroupAnnual Report 2019 264
Group overview Governance Risk review Financial review
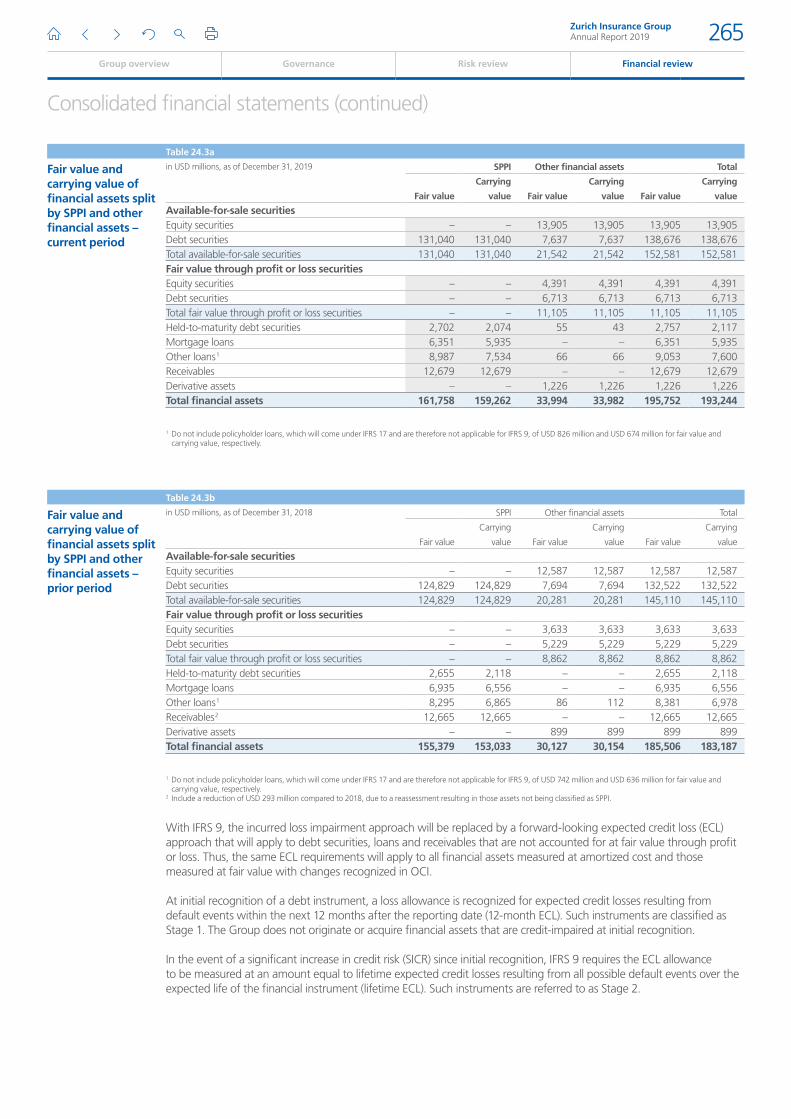
Consolidated financial statements (continued)
Table 24.3a
Fair value and carrying value of financial assets split by SPPI and other financial assets – current period
in USD millions, as of December 31, 2019 SPPI Other financial assets Total
Fair value
Carrying
value Fair value
Carrying
value Fair value
Carrying
value
Available-for-sale securitiesEquity securities – – 13,905 13,905 13,905 13,905Debt securities 131,040 131,040 7,637 7,637 138,676 138,676Total available-for-sale securities 131,040 131,040 21,542 21,542 152,581 152,581Fair value through profit or loss securitiesEquity securities – – 4,391 4,391 4,391 4,391Debt securities – – 6,713 6,713 6,713 6,713Total fair value through profit or loss securities – – 11,105 11,105 11,105 11,105Held-to-maturity debt securities 2,702 2,074 55 43 2,757 2,117Mortgage loans 6,351 5,935 – – 6,351 5,935Other loans 1 8,987 7,534 66 66 9,053 7,600Receivables 12,679 12,679 – – 12,679 12,679Derivative assets – – 1,226 1,226 1,226 1,226Total financial assets 161,758 159,262 33,994 33,982 195,752 193,244
1 Do not include policyholder loans, which will come under IFRS 17 and are therefore not applicable for IFRS 9, of USD 826 million and USD 674 million for fair value and carrying value, respectively.
Table 24.3b
Fair value and carrying value of financial assets split by SPPI and other financial assets – prior period
in USD millions, as of December 31, 2018 SPPI Other financial assets Total
Fair value
Carrying
value Fair value
Carrying
value Fair value
Carrying
value
Available-for-sale securitiesEquity securities – – 12,587 12,587 12,587 12,587Debt securities 124,829 124,829 7,694 7,694 132,522 132,522Total available-for-sale securities 124,829 124,829 20,281 20,281 145,110 145,110Fair value through profit or loss securitiesEquity securities – – 3,633 3,633 3,633 3,633Debt securities – – 5,229 5,229 5,229 5,229Total fair value through profit or loss securities – – 8,862 8,862 8,862 8,862Held-to-maturity debt securities 2,655 2,118 – – 2,655 2,118Mortgage loans 6,935 6,556 – – 6,935 6,556Other loans 1 8,295 6,865 86 112 8,381 6,978Receivables 2 12,665 12,665 – – 12,665 12,665Derivative assets – – 899 899 899 899Total financial assets 155,379 153,033 30,127 30,154 185,506 183,187
1 Do not include policyholder loans, which will come under IFRS 17 and are therefore not applicable for IFRS 9, of USD 742 million and USD 636 million for fair value and carrying value, respectively.
2 Include a reduction of USD 293 million compared to 2018, due to a reassessment resulting in those assets not being classified as SPPI.
With IFRS 9, the incurred loss impairment approach will be replaced by a forward-looking expected credit loss (ECL) approach that will apply to debt securities, loans and receivables that are not accounted for at fair value through profit or loss. Thus, the same ECL requirements will apply to all financial assets measured at amortized cost and those measured at fair value with changes recognized in OCI.
At initial recognition of a debt instrument, a loss allowance is recognized for expected credit losses resulting from default events within the next 12 months after the reporting date (12-month ECL). Such instruments are classified as Stage 1. The Group does not originate or acquire financial assets that are credit-impaired at initial recognition.
In the event of a significant increase in credit risk (SICR) since initial recognition, IFRS 9 requires the ECL allowance to be measured at an amount equal to lifetime expected credit losses resulting from all possible default events over the expected life of the financial instrument (lifetime ECL). Such instruments are referred to as Stage 2.
Zurich Insurance GroupAnnual Report 2019 265
Group overview Governance Risk review Financial review
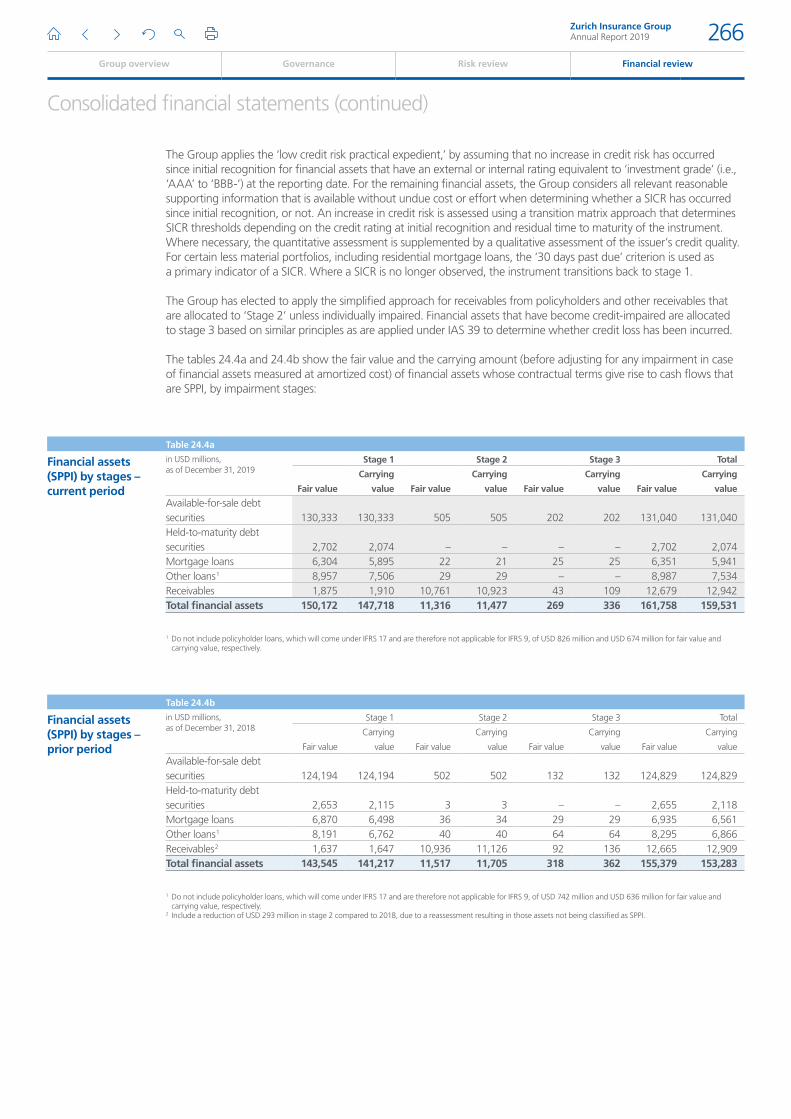
Consolidated financial statements (continued)
The Group applies the ‘low credit risk practical expedient,’ by assuming that no increase in credit risk has occurred since initial recognition for financial assets that have an external or internal rating equivalent to ‘investment grade’ (i.e., ‘AAA’ to ‘BBB-‘) at the reporting date. For the remaining financial assets, the Group considers all relevant reasonable supporting information that is available without undue cost or effort when determining whether a SICR has occurred since initial recognition, or not. An increase in credit risk is assessed using a transition matrix approach that determines SICR thresholds depending on the credit rating at initial recognition and residual time to maturity of the instrument. Where necessary, the quantitative assessment is supplemented by a qualitative assessment of the issuer’s credit quality. For certain less material portfolios, including residential mortgage loans, the ‘30 days past due’ criterion is used as a primary indicator of a SICR. Where a SICR is no longer observed, the instrument transitions back to stage 1.
The Group has elected to apply the simplified approach for receivables from policyholders and other receivables that are allocated to ‘Stage 2’ unless individually impaired. Financial assets that have become credit-impaired are allocated to stage 3 based on similar principles as are applied under IAS 39 to determine whether credit loss has been incurred.
The tables 24.4a and 24.4b show the fair value and the carrying amount (before adjusting for any impairment in case of financial assets measured at amortized cost) of financial assets whose contractual terms give rise to cash flows that are SPPI, by impairment stages:
Table 24.4a
Financial assets (SPPI) by stages – current period
in USD millions, as of December 31, 2019
Stage 1 Stage 2 Stage 3 Total
Fair value
Carrying
value Fair value
Carrying
value Fair value
Carrying
value Fair value
Carrying
value
Available-for-sale debt securities 130,333 130,333 505 505 202 202 131,040 131,040Held-to-maturity debt securities 2,702 2,074 – – – – 2,702 2,074Mortgage loans 6,304 5,895 22 21 25 25 6,351 5,941Other loans 1 8,957 7,506 29 29 – – 8,987 7,534Receivables 1,875 1,910 10,761 10,923 43 109 12,679 12,942Total financial assets 150,172 147,718 11,316 11,477 269 336 161,758 159,531
1 Do not include policyholder loans, which will come under IFRS 17 and are therefore not applicable for IFRS 9, of USD 826 million and USD 674 million for fair value and carrying value, respectively.
Table 24.4b
Financial assets (SPPI) by stages – prior period
in USD millions, as of December 31, 2018
Stage 1 Stage 2 Stage 3 Total
Fair value
Carrying
value Fair value
Carrying
value Fair value
Carrying
value Fair value
Carrying
value
Available-for-sale debt securities 124,194 124,194 502 502 132 132 124,829 124,829Held-to-maturity debt securities 2,653 2,115 3 3 – – 2,655 2,118Mortgage loans 6,870 6,498 36 34 29 29 6,935 6,561Other loans 1 8,191 6,762 40 40 64 64 8,295 6,866Receivables 2 1,637 1,647 10,936 11,126 92 136 12,665 12,909Total financial assets 143,545 141,217 11,517 11,705 318 362 155,379 153,283
1 Do not include policyholder loans, which will come under IFRS 17 and are therefore not applicable for IFRS 9, of USD 742 million and USD 636 million for fair value and carrying value, respectively.
2 Include a reduction of USD 293 million in stage 2 compared to 2018, due to a reassessment resulting in those assets not being classified as SPPI.
Zurich Insurance GroupAnnual Report 2019 266
Group overview Governance Risk review Financial review
Consolidated financial statements (continued)
25. Related-party transactions
In the normal course of business, the Group enters into various transactions with related parties. Parties are considered to be related if one party has the ability to control or exercise significant influence over the other party in making financial or operational decisions, or one other party controls both. Related parties of the Group include, among others, subsidiaries, associates, joint ventures, key management personnel, and the post-employment benefit plans (see note 20). Transactions between the Group and its subsidiaries are eliminated on consolidation, and they are not disclosed in the consolidated financial statements. A list of the Group’s significant subsidiaries is shown in note 28. The transactions of the Group concluded with its associates and with its joint ventures are not considered material to the Group, either individually or in aggregate.
Table 25 summarizes related-party transactions with key management personnel reflected in the consolidated financial statements. Key management personnel includes members of the Board of Directors of Zurich Insurance Group Ltd and Zurich Insurance Company Ltd and members of the Executive Committee.
Table 25
Related party transactions – key personnel
in USD millions, for the years ended December 31 2019 2018
Remuneration of key personnel of the GroupCash compensation, current benefits and fees 32 30Post-employment benefits 4 4Share-based compensation 35 23Other remuneration 5 3Total remuneration of key personnel 76 60
As of December 31, 2019 and 2018, there were no loans, advances or credits outstanding from members of the Executive Committee. Outstanding loans and guarantees granted to members of the Board of Directors amounted to nil for the years ended December 31, 2019 and 2018. The terms ‘members of the Board of Directors’ and ‘members of the Executive Committee’ in this context include the individual as well as members of their respective households. The figures in table 25 include the fees paid to members of the Board of Directors of Zurich Insurance Group Ltd and Zurich Insurance Company Ltd, which were USD 5 million and USD 4 million for the years ended December 31, 2019 and 2018 respectively.
Information required by art. 14 – 16 of the Swiss Ordinance against Excessive Compensation and art. 663c paragraph 3 of the Swiss Code of Obligations is disclosed in the Remuneration report.
The cash compensation, current benefits and fees are short term in nature.
Zurich Insurance GroupAnnual Report 2019 267
Group overview Governance Risk review Financial review
Consolidated financial statements (continued)
26. Relationship with the Farmers Exchanges
Farmers Group, Inc. and its subsidiaries (FGI) provide certain non-claims services to the Farmers Exchanges as their attorneys-in-fact, and also provide certain ancillary services to the Farmers Exchanges. Farmers Group Inc. is a wholly owned subsidiary of the Group. Attorney-in-fact services primarily include risk selection, preparation and mailing of policy documents and invoices, premium collection, management of the investment portfolios and certain other administrative and managerial functions. Fees for these services are primarily determined as a percentage of gross premiums earned by the Farmers Exchanges. Ancillary services primarily include information technology, brand advertising and certain distribution related services that are not covered under the attorney-in-fact contracts for which FGI acts as a principal in arranging for those services to the Exchanges. The finances and operations of the Farmers Exchanges are governed by independent Boards of Governors. In addition, the Group has the following relationships with the Farmers Exchanges.
a) Certificates of contribution/surplus notes issued by the Farmers ExchangesAs of December 31, 2019 and 2018, FGI and its subsidiary held the following surplus note and certificates of contribution issued by the Farmers Exchanges. Originally these were purchased by FGI subsidiaries in order to supplement the policyholders’ surplus of the Farmers Exchanges.
Table 26.1
Certificates of contribution/surplus note
in USD millions, as of December 31 2019 2018
3.758% surplus note, due December 2027 100 100Various other certificates of contribution 23 23Total 123 123
In March 2019, the Farmers Exchanges repaid a USD 0.5 million certificate of contribution at an 8.50 percent rate to the Fire Underwriters Association. The USD 100 million of 10-year, no call five year notes at a 3.758 percent rate that the Farmers Exchanges issued to Farmers New World Life Insurance Company remain unchanged.
Conditions governing payment of interest and repayment of principal are outlined in the surplus note and certificates of contribution. Generally, repayment of principal and payment of interest may be made only when the issuer has an appropriate amount of surplus, and then only after approval is granted by the appropriate state insurance regulatory department in the U.S. Additionally, the approval by the issuer’s governing board is needed for repayment of principal.
b) Quota share reinsurance treaty with the Farmers ExchangesThe Farmers Exchanges cede risk through a quota share reinsurance treaty, the All Lines Quota Share reinsurance agreement (All Lines agreement) with Farmers Reinsurance Company (Farmers Re Co), a wholly owned subsidiary of FGI. The All Lines agreement can be terminated after 90 days’ notice by any of the parties.
The All Lines agreement provides for a cession of a quota share of the premiums written and the ultimate net losses sustained in all lines of business written by the Farmers Exchanges.
Zurich Insurance GroupAnnual Report 2019 268
Group overview Governance Risk review Financial review
Consolidated financial statements (continued)
Table 26.2
Quota share reinsurance treaty
in USD millions, for the years ended December 31 All Lines agreement
2019 1 2018 2
Net earned premiums and policy fees 197 193Insurance benefits and losses, net 3 (143) (129)Total net technical expenses 4 (63) (62)Net underwriting result (9) 2
1 From January 1, 2019, Farmers Re Co assumed a 1.0 percent quota share. Another 28.0 percent was assumed by third parties. Effective December 31, 2019, Farmers Re participation in the All Lines agreement was reduced by 0.75 percent to 0.25 percent. Another 25.75 percent was assumed by third parties.
2 From January 1, 2018, Farmers Re Co assumed a 1.0 percent quota share. Another 28.0 percent was assumed by third parties. 3 Under the All Lines agreement, the Farmers Exchanges catastrophe losses are subject to a provisional maximum of 6.75 percent of net earned premiums dependent on loss
experience and recoveries at a specified rate for each year. Based on the results for 2019, the total catastrophe recoveries subject to the All Lines agreement was USD 1.3 billion.
4 Under the All Lines agreement, the Farmers Exchanges receive a ceding commission of 26.7 percent, 8.1 percent of premiums for unallocated loss adjustment expenses and 5.3 percent of premiums for other expenses.
c) Farmers management fees and other related revenuesFarmers Group, Inc. and its subsidiaries (FGI), wholly-owned subsidiaries of the Group, are the appointed attorneys-in-fact of the Farmers Exchanges, which are not owned by FGI. As the attorney-in-fact, FGI is permitted by policyholders of the Farmers Exchanges to receive a management fee of up to 20 percent (up to 25 percent in the case of the Fire Insurance Exchange) of the gross premiums earned by the Farmers Exchanges. This management fee, the primary source of revenue for FGI, has an agreed upon margin cap of 7% which is derived from FGI gross management result divided by the gross premium earned by the Farmers Exchanges. The expected revenues and expenses are assessed monthly to determine if expected revenues will be in excess of the cap, in which case the revenue is reduced on a pro-rata basis to ensure that no revenue is recognized for the amounts exceeding the cap. In addition, FGI revenue includes reimbursement of certain ancillary service costs incurred by FGI on behalf of primarily the Farmers Exchanges that are not covered under the attorney-in-fact contracts. The amounts incurred for these services are reimbursed to FGI at cost in accordance with allocations that are subject to approval by the Farmers Exchanges Board of Governors.
FGI has historically charged a lower management fee than the amount allowed by policyholders. The range of fees has varied by line of business over time and from year to year. The gross earned premiums of the Farmers Exchanges were USD 20.4 billion and USD 20.2 billion for the years ended December 31, 2019 and 2018, respectively.
Table 26.3
Farmers Management Services
in USD millions, for the years ended December 31 2019 2018 Change
Management fees and other related revenues 3,780 3,204 18%Management fees 2,804 2,796 Revenues for ancillary services 1 858 287 Membership fees 60 60 Other revenues 58 62 Management and other related expenses 2,356 1,792 31%Expenses for ancillary services 1 858 287 Management and other expenses 1,498 1,505 Gross management result 1,424 1,412 1%Managed gross earned premium margin 7.0% 7.0% 0.0 pts
1 2019 balance includes additional effect of adoption of IFRS 15 ’Revenue from Contracts with Customers.’
Zurich Insurance GroupAnnual Report 2019 269
Group overview Governance Risk review Financial review
Consolidated financial statements (continued)
27. Segment information
The Group pursues a customer-centric strategy, where the Property & Casualty (P&C) and Life businesses are managed on a regional basis. The Group’s reportable segments have been identified on the basis of the businesses operated by the Group and how these are strategically managed to offer different products and services to specific customer groups. The Group has identified 13 reportable segments in accordance with IFRS 8 ‘Operating Segments’ and segment information is presented accordingly as follows:
33 Property & Casualty regions
33 Life regions
33 Farmers
33 Group Functions and Operations
33 Non-Core Businesses
The Group’s reportable segments comprise the following:
Property & Casualty and Life regions
33 Europe, Middle East & Africa
33 North America
33 Asia Pacific
33 Latin America
33 Group Reinsurance
Property & Casualty regions provide a variety of motor, home and commercial products and services for individuals, as well as small and large businesses on both a local and global basis. Products are sold through multiple distribution channels including agents, brokers and bank distribution.
Life regions provide a comprehensive range of life and health insurance products on both an individual and a group basis, including annuities, endowment and term insurance, unit-linked and investment-oriented products, as well as full private health, supplemental health and long-term care insurance. In addition to the agent distribution channel, certain of these products are offered via bank distribution channels.
Farmers, through Farmers Group, Inc. and its subsidiaries (FGI), provides certain non-claims services and ancillary services to the Farmers Exchanges, which are owned by their policyholders. This segment also includes all reinsurance assumed from the Farmers Exchanges by the Group. Farmers Exchanges are prominent writers of personal and small commercial lines of business in the U.S. In addition, this segment includes the activities of Farmers Life, a writer of individual life insurance business in the U.S.
Group Functions and Operations comprise the Group’s Holding and Financing, Headquarter and Zurich Insurance Mobile Solutions (ZIMS) activities. Certain alternative investment positions not allocated to business operating segments are included within Holding and Financing. In addition, this segment includes operational technical governance activities relating to technology, underwriting, claims, actuarial and pricing.
Non-Core Businesses include insurance and reinsurance businesses that the Group does not consider core to its operations and that are therefore mostly managed to achieve a beneficial run-off. Non-Core Businesses are mainly situated in the U.S., Bermuda, and in Europe.
Zurich Insurance GroupAnnual Report 2019 270
Group overview Governance Risk review Financial review
Consolidated financial statements (continued)
Aggregations and additional informationRegional Property & Casualty and Life results are further aggregated to show a total Property & Casualty and total Life business view.
33 Property & Casualty – total
33 Life – total
For additional informational purposes, the Group also discloses income statement information for Property & Casualty Commercial Insurance and Property & Casualty Retail and Other Insurance results. Other Insurance includes SME, direct market and other program business.
33 Property & Casualty Commercial Insurance
33 Property & Casualty Retail and Other Insurance
Business operating profitThe segment information includes the Group’s internal performance measure, business operating profit (BOP). This measure is the basis on which the Group manages all of its business units. It indicates the underlying performance of the Group’s business units, after non-controlling interests, by eliminating the impact of financial market volatility and other non-operational variables. BOP reflects adjustments for shareholders’ taxes, net capital gains/(losses) and impairments on investments (except for certain non-insurance operations included in Non-Core Businesses, investments in hedge funds as at fair value through profit or loss, certain securities held for specific economic hedging purposes and policyholders’ share of investment results for the life businesses) and non-operational foreign exchange movements. Significant items arising from special circumstances, including restructuring charges, legal matters or large one-off regulatory projects outside the ordinary course of business, gains and losses on divestment of businesses, certain business combination integration costs and impairments of goodwill are also excluded from BOP.
In 2019 the Group amended its BOP policy to exclude the monetary gains and losses resulting from the application of IAS 29 ‘Financial Reporting in Hyperinflationary Economies.’ The policy change was implemented with prospective effect, as the impact on comparable balances was not material to the Group’s financial results.
Zurich Insurance GroupAnnual Report 2019 271
Group overview Governance Risk review Financial review
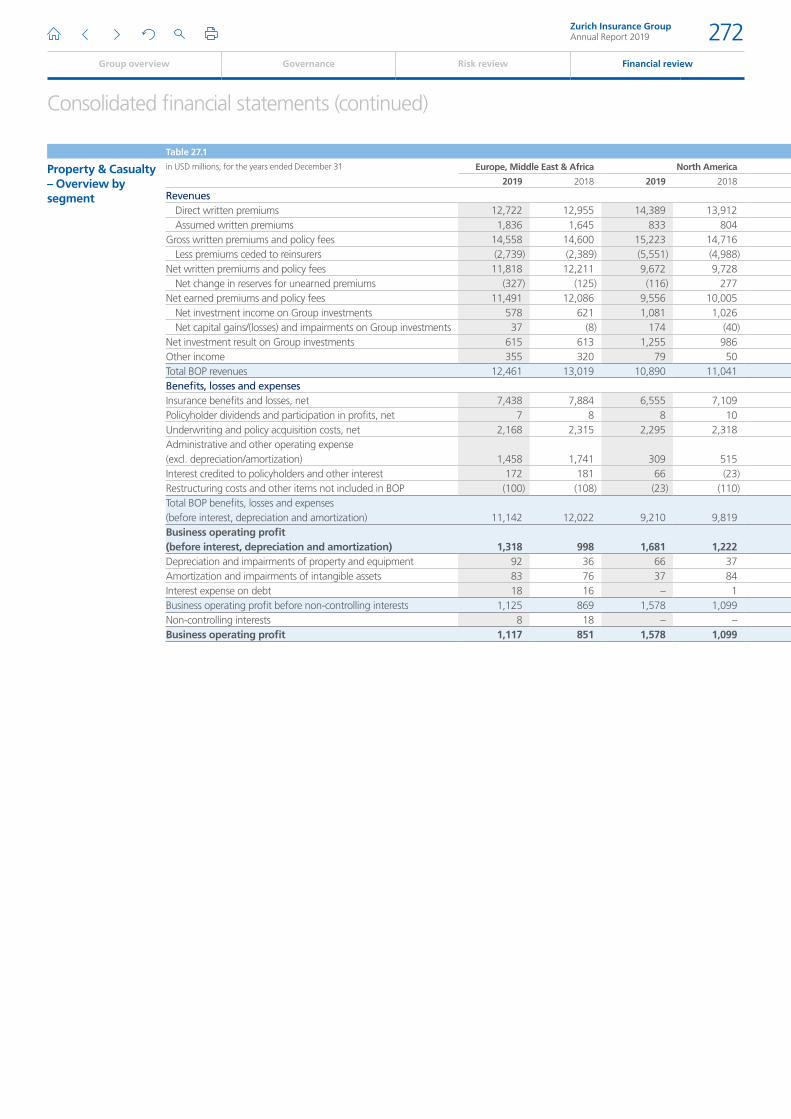
Consolidated financial statements (continued)
Table 27.1
Property & Casualty – Overview by segment
in USD millions, for the years ended December 31 Europe, Middle East & Africa North America Asia Pacific Latin America Group Reinsurance Eliminations Total
2019 2018 2019 2018 2019 2018 2019 2018 2019 2018 2019 2018 2019 2018
RevenuesDirect written premiums 12,722 12,955 14,389 13,912 2,851 2,646 2,790 2,627 – – – – 32,752 32,139Assumed written premiums 1,836 1,645 833 804 179 212 81 77 593 364 (2,091) (1,736) 1,432 1,366
Gross written premiums and policy fees 14,558 14,600 15,223 14,716 3,030 2,858 2,871 2,704 593 364 (2,091) (1,736) 34,184 33,505Less premiums ceded to reinsurers (2,739) (2,389) (5,551) (4,988) (505) (486) (583) (466) (534) (447) 2,091 1,736 (7,822) (7,041)
Net written premiums and policy fees 11,818 12,211 9,672 9,728 2,525 2,372 2,289 2,237 59 (83) – – 26,362 26,465Net change in reserves for unearned premiums (327) (125) (116) 277 (75) (122) (132) (93) (104) 28 – – (754) (34)
Net earned premiums and policy fees 11,491 12,086 9,556 10,005 2,449 2,250 2,157 2,145 (45) (55) – – 25,608 26,431Net investment income on Group investments 578 621 1,081 1,026 74 68 217 204 11 13 – – 1,961 1,932Net capital gains/(losses) and impairments on Group investments 37 (8) 174 (40) – – – – – – – – 211 (48)
Net investment result on Group investments 615 613 1,255 986 74 68 217 204 11 13 – – 2,171 1,884Other income 355 320 79 50 145 137 59 32 30 62 – – 668 601Total BOP revenues 12,461 13,019 10,890 11,041 2,669 2,454 2,432 2,381 (4) 21 – – 28,447 28,916Benefits, losses and expensesInsurance benefits and losses, net 7,438 7,884 6,555 7,109 1,358 1,304 840 960 285 35 – – 16,475 17,291Policyholder dividends and participation in profits, net 7 8 8 10 – – – 1 (2) – – – 12 19Underwriting and policy acquisition costs, net 2,168 2,315 2,295 2,318 579 580 910 916 (13) 7 – – 5,939 6,136Administrative and other operating expense (excl. depreciation/amortization) 1,458 1,741 309 515 441 463 354 239 9 33 – – 2,571 2,992Interest credited to policyholders and other interest 172 181 66 (23) 4 1 32 – (3) (4) – – 271 156Restructuring costs and other items not included in BOP (100) (108) (23) (110) (7) (13) (50) 9 – – – – (180) (221)Total BOP benefits, losses and expenses (before interest, depreciation and amortization) 11,142 12,022 9,210 9,819 2,376 2,335 2,086 2,126 274 72 – – 25,088 26,373Business operating profit (before interest, depreciation and amortization) 1,318 998 1,681 1,222 293 120 346 255 (279) (51) – – 3,359 2,543Depreciation and impairments of property and equipment 92 36 66 37 37 18 18 6 1 3 – – 214 101Amortization and impairments of intangible assets 83 76 37 84 19 16 13 10 – – – – 151 187Interest expense on debt 18 16 – 1 – – 1 – 12 37 – – 32 55Business operating profit before non-controlling interests 1,125 869 1,578 1,099 237 86 315 238 (292) (92) – – 2,962 2,200Non-controlling interests 8 18 – – 1 – 76 97 – – – – 84 115Business operating profit 1,117 851 1,578 1,099 236 86 240 141 (292) (92) – – 2,878 2,085
Zurich Insurance GroupAnnual Report 2019 272
Group overview Governance Risk review Financial review
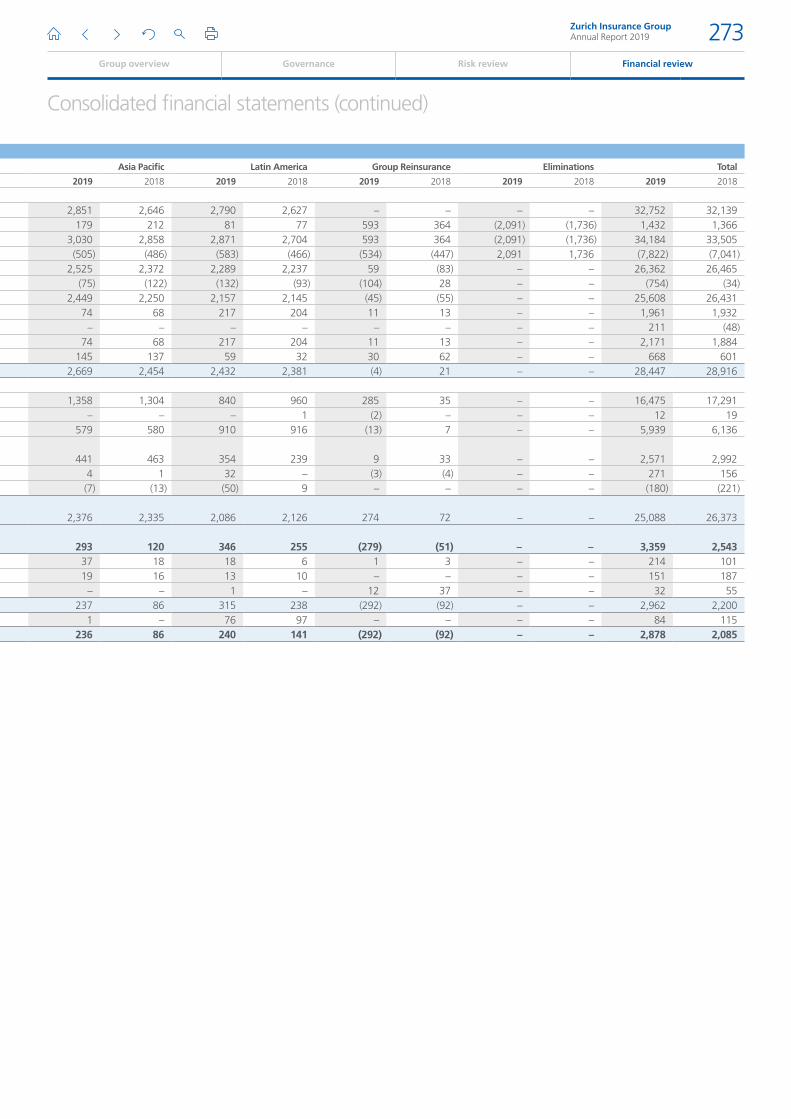
Consolidated financial statements (continued)
Table 27.1
Property & Casualty – Overview by segment
in USD millions, for the years ended December 31 Europe, Middle East & Africa North America Asia Pacific Latin America Group Reinsurance Eliminations Total
2019 2018 2019 2018 2019 2018 2019 2018 2019 2018 2019 2018 2019 2018
RevenuesDirect written premiums 12,722 12,955 14,389 13,912 2,851 2,646 2,790 2,627 – – – – 32,752 32,139Assumed written premiums 1,836 1,645 833 804 179 212 81 77 593 364 (2,091) (1,736) 1,432 1,366
Gross written premiums and policy fees 14,558 14,600 15,223 14,716 3,030 2,858 2,871 2,704 593 364 (2,091) (1,736) 34,184 33,505Less premiums ceded to reinsurers (2,739) (2,389) (5,551) (4,988) (505) (486) (583) (466) (534) (447) 2,091 1,736 (7,822) (7,041)
Net written premiums and policy fees 11,818 12,211 9,672 9,728 2,525 2,372 2,289 2,237 59 (83) – – 26,362 26,465Net change in reserves for unearned premiums (327) (125) (116) 277 (75) (122) (132) (93) (104) 28 – – (754) (34)
Net earned premiums and policy fees 11,491 12,086 9,556 10,005 2,449 2,250 2,157 2,145 (45) (55) – – 25,608 26,431Net investment income on Group investments 578 621 1,081 1,026 74 68 217 204 11 13 – – 1,961 1,932Net capital gains/(losses) and impairments on Group investments 37 (8) 174 (40) – – – – – – – – 211 (48)
Net investment result on Group investments 615 613 1,255 986 74 68 217 204 11 13 – – 2,171 1,884Other income 355 320 79 50 145 137 59 32 30 62 – – 668 601Total BOP revenues 12,461 13,019 10,890 11,041 2,669 2,454 2,432 2,381 (4) 21 – – 28,447 28,916Benefits, losses and expensesInsurance benefits and losses, net 7,438 7,884 6,555 7,109 1,358 1,304 840 960 285 35 – – 16,475 17,291Policyholder dividends and participation in profits, net 7 8 8 10 – – – 1 (2) – – – 12 19Underwriting and policy acquisition costs, net 2,168 2,315 2,295 2,318 579 580 910 916 (13) 7 – – 5,939 6,136Administrative and other operating expense (excl. depreciation/amortization) 1,458 1,741 309 515 441 463 354 239 9 33 – – 2,571 2,992Interest credited to policyholders and other interest 172 181 66 (23) 4 1 32 – (3) (4) – – 271 156Restructuring costs and other items not included in BOP (100) (108) (23) (110) (7) (13) (50) 9 – – – – (180) (221)Total BOP benefits, losses and expenses (before interest, depreciation and amortization) 11,142 12,022 9,210 9,819 2,376 2,335 2,086 2,126 274 72 – – 25,088 26,373Business operating profit (before interest, depreciation and amortization) 1,318 998 1,681 1,222 293 120 346 255 (279) (51) – – 3,359 2,543Depreciation and impairments of property and equipment 92 36 66 37 37 18 18 6 1 3 – – 214 101Amortization and impairments of intangible assets 83 76 37 84 19 16 13 10 – – – – 151 187Interest expense on debt 18 16 – 1 – – 1 – 12 37 – – 32 55Business operating profit before non-controlling interests 1,125 869 1,578 1,099 237 86 315 238 (292) (92) – – 2,962 2,200Non-controlling interests 8 18 – – 1 – 76 97 – – – – 84 115Business operating profit 1,117 851 1,578 1,099 236 86 240 141 (292) (92) – – 2,878 2,085
Zurich Insurance GroupAnnual Report 2019 273
Group overview Governance Risk review Financial review
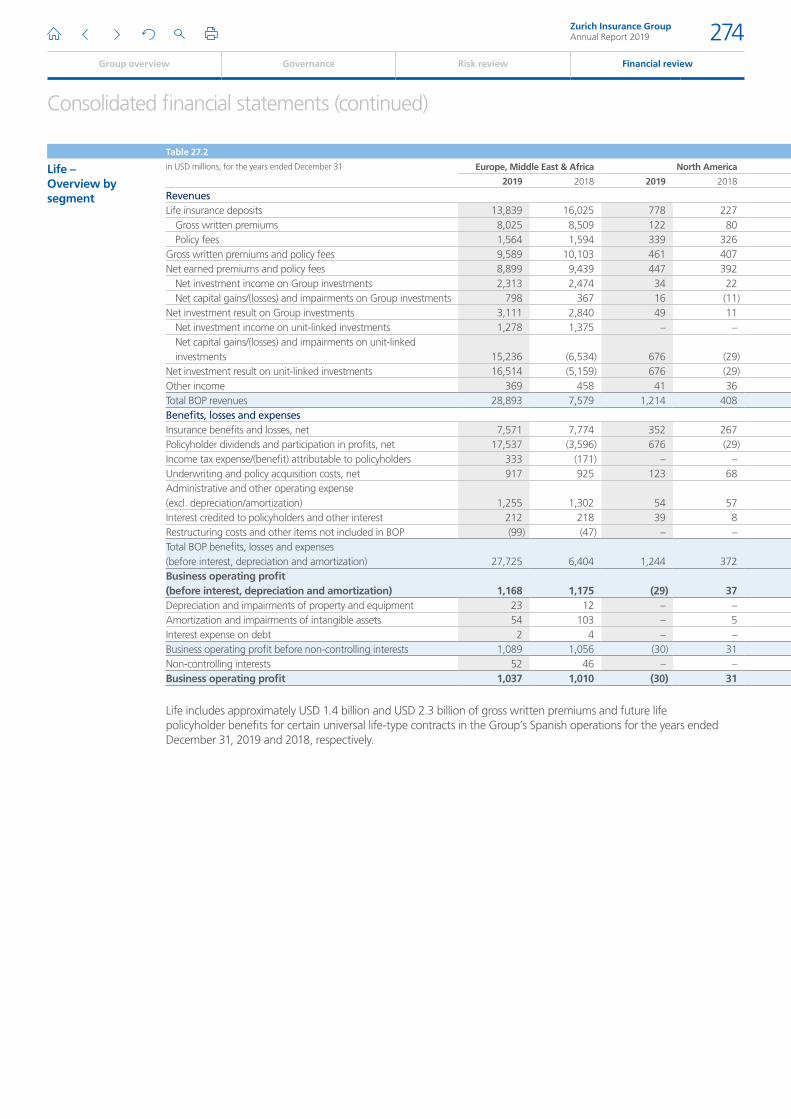
Consolidated financial statements (continued)
Table 27.2
Life – Overview by segment
in USD millions, for the years ended December 31 Europe, Middle East & Africa North America Asia Pacific Latin America Group Reinsurance Eliminations Total
2019 2018 2019 2018 2019 2018 2019 2018 2019 2018 2019 2018 2019 2018
RevenuesLife insurance deposits 13,839 16,025 778 227 87 103 3,624 2,339 – – – – 18,328 18,694
Gross written premiums 8,025 8,509 122 80 1,892 1,249 3,009 2,831 28 20 (37) (28) 13,038 12,662Policy fees 1,564 1,594 339 326 163 130 46 43 – – – – 2,113 2,093
Gross written premiums and policy fees 9,589 10,103 461 407 2,055 1,379 3,056 2,874 28 20 (37) (28) 15,151 14,754Net earned premiums and policy fees 8,899 9,439 447 392 1,756 1,199 2,562 2,473 19 12 – – 13,683 13,514
Net investment income on Group investments 2,313 2,474 34 22 179 152 392 390 – – (2) (2) 2,915 3,035Net capital gains/(losses) and impairments on Group investments 798 367 16 (11) 59 (35) 32 18 – – – – 906 338
Net investment result on Group investments 3,111 2,840 49 11 238 117 424 407 – – (2) (2) 3,821 3,373Net investment income on unit-linked investments 1,278 1,375 – – 99 104 36 22 – – – – 1,413 1,501Net capital gains/(losses) and impairments on unit-linked investments 15,236 (6,534) 676 (29) 126 (163) 1,256 990 – – – – 17,293 (5,737)
Net investment result on unit-linked investments 16,514 (5,159) 676 (29) 225 (60) 1,292 1,012 – – – – 18,706 (4,236)Other income 369 458 41 36 23 25 85 64 – – (1) (1) 518 582Total BOP revenues 28,893 7,579 1,214 408 2,242 1,281 4,363 3,956 19 12 (3) (3) 36,728 13,234Benefits, losses and expensesInsurance benefits and losses, net 7,571 7,774 352 267 1,004 522 1,259 1,137 5 2 – – 10,190 9,702Policyholder dividends and participation in profits, net 17,537 (3,596) 676 (29) 268 (21) 1,288 1,006 – – – – 19,769 (2,640)Income tax expense/(benefit) attributable to policyholders 333 (171) – – 32 (12) – – – – – – 365 (183)Underwriting and policy acquisition costs, net 917 925 123 68 279 220 1,092 1,037 8 2 (1) (1) 2,417 2,252Administrative and other operating expense (excl. depreciation/amortization) 1,255 1,302 54 57 457 337 248 174 1 – – – 2,015 1,871Interest credited to policyholders and other interest 212 218 39 8 26 35 26 20 – – – – 303 282Restructuring costs and other items not included in BOP (99) (47) – – (63) (12) (66) 10 – – – – (228) (50)Total BOP benefits, losses and expenses (before interest, depreciation and amortization) 27,725 6,404 1,244 372 2,003 1,070 3,847 3,385 13 4 (1) (1) 34,831 11,234Business operating profit (before interest, depreciation and amortization) 1,168 1,175 (29) 37 239 212 515 571 6 8 (2) (2) 1,897 2,000Depreciation and impairments of property and equipment 23 12 – – 8 3 7 3 – – – – 39 17Amortization and impairments of intangible assets 54 103 – 5 11 12 14 12 – – – – 80 133Interest expense on debt 2 4 – – 16 13 – – – – (2) (2) 17 15Business operating profit before non-controlling interests 1,089 1,056 (30) 31 202 183 494 556 6 8 – – 1,761 1,834Non-controlling interests 52 46 – – (2) (2) 225 237 – – – – 275 281Business operating profit 1,037 1,010 (30) 31 204 186 269 319 6 8 – – 1,486 1,554
Life includes approximately USD 1.4 billion and USD 2.3 billion of gross written premiums and future life policyholder benefits for certain universal life-type contracts in the Group’s Spanish operations for the years ended December 31, 2019 and 2018, respectively.
Zurich Insurance GroupAnnual Report 2019 274
Group overview Governance Risk review Financial review
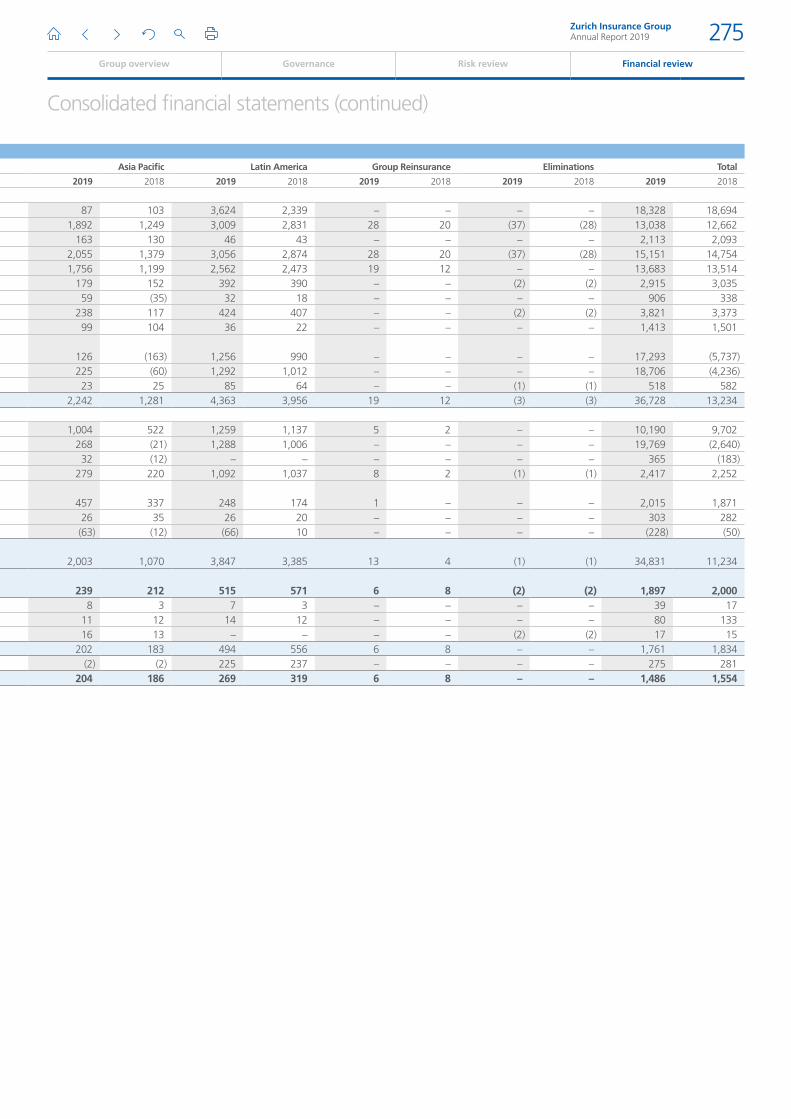
Consolidated financial statements (continued)
Table 27.2
Life – Overview by segment
in USD millions, for the years ended December 31 Europe, Middle East & Africa North America Asia Pacific Latin America Group Reinsurance Eliminations Total
2019 2018 2019 2018 2019 2018 2019 2018 2019 2018 2019 2018 2019 2018
RevenuesLife insurance deposits 13,839 16,025 778 227 87 103 3,624 2,339 – – – – 18,328 18,694
Gross written premiums 8,025 8,509 122 80 1,892 1,249 3,009 2,831 28 20 (37) (28) 13,038 12,662Policy fees 1,564 1,594 339 326 163 130 46 43 – – – – 2,113 2,093
Gross written premiums and policy fees 9,589 10,103 461 407 2,055 1,379 3,056 2,874 28 20 (37) (28) 15,151 14,754Net earned premiums and policy fees 8,899 9,439 447 392 1,756 1,199 2,562 2,473 19 12 – – 13,683 13,514
Net investment income on Group investments 2,313 2,474 34 22 179 152 392 390 – – (2) (2) 2,915 3,035Net capital gains/(losses) and impairments on Group investments 798 367 16 (11) 59 (35) 32 18 – – – – 906 338
Net investment result on Group investments 3,111 2,840 49 11 238 117 424 407 – – (2) (2) 3,821 3,373Net investment income on unit-linked investments 1,278 1,375 – – 99 104 36 22 – – – – 1,413 1,501Net capital gains/(losses) and impairments on unit-linked investments 15,236 (6,534) 676 (29) 126 (163) 1,256 990 – – – – 17,293 (5,737)
Net investment result on unit-linked investments 16,514 (5,159) 676 (29) 225 (60) 1,292 1,012 – – – – 18,706 (4,236)Other income 369 458 41 36 23 25 85 64 – – (1) (1) 518 582Total BOP revenues 28,893 7,579 1,214 408 2,242 1,281 4,363 3,956 19 12 (3) (3) 36,728 13,234Benefits, losses and expensesInsurance benefits and losses, net 7,571 7,774 352 267 1,004 522 1,259 1,137 5 2 – – 10,190 9,702Policyholder dividends and participation in profits, net 17,537 (3,596) 676 (29) 268 (21) 1,288 1,006 – – – – 19,769 (2,640)Income tax expense/(benefit) attributable to policyholders 333 (171) – – 32 (12) – – – – – – 365 (183)Underwriting and policy acquisition costs, net 917 925 123 68 279 220 1,092 1,037 8 2 (1) (1) 2,417 2,252Administrative and other operating expense (excl. depreciation/amortization) 1,255 1,302 54 57 457 337 248 174 1 – – – 2,015 1,871Interest credited to policyholders and other interest 212 218 39 8 26 35 26 20 – – – – 303 282Restructuring costs and other items not included in BOP (99) (47) – – (63) (12) (66) 10 – – – – (228) (50)Total BOP benefits, losses and expenses (before interest, depreciation and amortization) 27,725 6,404 1,244 372 2,003 1,070 3,847 3,385 13 4 (1) (1) 34,831 11,234Business operating profit (before interest, depreciation and amortization) 1,168 1,175 (29) 37 239 212 515 571 6 8 (2) (2) 1,897 2,000Depreciation and impairments of property and equipment 23 12 – – 8 3 7 3 – – – – 39 17Amortization and impairments of intangible assets 54 103 – 5 11 12 14 12 – – – – 80 133Interest expense on debt 2 4 – – 16 13 – – – – (2) (2) 17 15Business operating profit before non-controlling interests 1,089 1,056 (30) 31 202 183 494 556 6 8 – – 1,761 1,834Non-controlling interests 52 46 – – (2) (2) 225 237 – – – – 275 281Business operating profit 1,037 1,010 (30) 31 204 186 269 319 6 8 – – 1,486 1,554
Life includes approximately USD 1.4 billion and USD 2.3 billion of gross written premiums and future life policyholder benefits for certain universal life-type contracts in the Group’s Spanish operations for the years ended December 31, 2019 and 2018, respectively.
Zurich Insurance GroupAnnual Report 2019 275
Group overview Governance Risk review Financial review
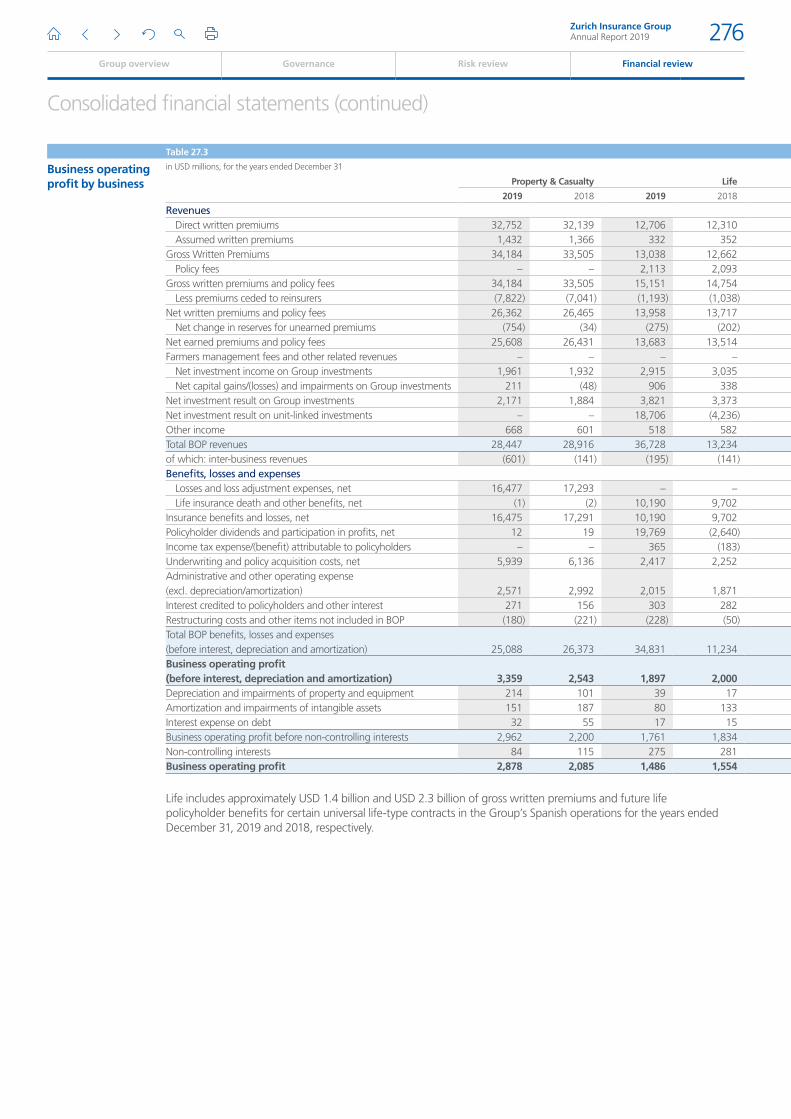
Consolidated financial statements (continued)
Table 27.3
Business operating profit by business
in USD millions, for the years ended December 31
Property & Casualty Life Farmers
Group Functions
and Operations
Non-Core
Businesses Eliminations Total
2019 2018 2019 2018 2019 2018 2019 2018 2019 2018 2019 2018 2019 2018
RevenuesDirect written premiums 32,752 32,139 12,706 12,310 593 580 – – 58 42 – – 46,109 45,071Assumed written premiums 1,432 1,366 332 352 138 194 – 5 62 64 (17) (14) 1,947 1,967
Gross Written Premiums 34,184 33,505 13,038 12,662 731 774 – 5 119 106 (17) (14) 48,056 47,038Policy fees – – 2,113 2,093 326 321 – – 30 34 – – 2,469 2,447
Gross written premiums and policy fees 34,184 33,505 15,151 14,754 1,056 1,095 – 5 150 140 (17) (14) 50,525 49,485Less premiums ceded to reinsurers (7,822) (7,041) (1,193) (1,038) (175) (179) – – (100) (11) 17 14 (9,274) (8,255)
Net written premiums and policy fees 26,362 26,465 13,958 13,717 882 916 – 5 50 129 – – 41,251 41,230Net change in reserves for unearned premiums (754) (34) (275) (202) 59 (1) – – 21 12 – – (949) (224)
Net earned premiums and policy fees 25,608 26,431 13,683 13,514 941 915 – 5 71 141 – – 40,302 41,007Farmers management fees and other related revenues – – – – 3,780 3,204 – – – – – – 3,780 3,204
Net investment income on Group investments 1,961 1,932 2,915 3,035 204 213 196 198 197 222 (174) (212) 5,298 5,387Net capital gains/(losses) and impairments on Group investments 211 (48) 906 338 3 (1) – – 128 (109) – – 1,248 181
Net investment result on Group investments 2,171 1,884 3,821 3,373 207 211 196 198 325 113 (174) (212) 6,546 5,568Net investment result on unit-linked investments – – 18,706 (4,236) 194 (52) – – 584 (86) – – 19,485 (4,374)Other income 668 601 518 582 123 95 218 194 51 34 (448) (425) 1,129 1,080Total BOP revenues 28,447 28,916 36,728 13,234 5,245 4,373 414 397 1,031 201 (623) (636) 71,242 46,484of which: inter-business revenues (601) (141) (195) (141) (39) (51) (261) (282) 473 (21) 623 636 – –Benefits, losses and expenses
Losses and loss adjustment expenses, net 16,477 17,293 – – 143 129 – 1 47 (27) – – 16,666 17,397Life insurance death and other benefits, net (1) (2) 10,190 9,702 419 434 – – 295 116 – – 10,903 10,250
Insurance benefits and losses, net 16,475 17,291 10,190 9,702 562 563 – 1 342 89 – – 27,570 27,646Policyholder dividends and participation in profits, net 12 19 19,769 (2,640) 204 (43) – – 597 (72) – – 20,582 (2,736)Income tax expense/(benefit) attributable to policyholders – – 365 (183) – – – – – – – – 365 (183)Underwriting and policy acquisition costs, net 5,939 6,136 2,417 2,252 152 167 2 – 20 10 – – 8,529 8,565Administrative and other operating expense (excl. depreciation/amortization) 2,571 2,992 2,015 1,871 2,333 1,800 383 342 70 75 (69) 7 7,303 7,086Interest credited to policyholders and other interest 271 156 303 282 111 95 150 135 37 44 (282) (279) 590 433Restructuring costs and other items not included in BOP (180) (221) (228) (50) (17) (49) (47) (43) (4) (1) – – (476) (364)Total BOP benefits, losses and expenses (before interest, depreciation and amortization) 25,088 26,373 34,831 11,234 3,345 2,533 488 435 1,061 144 (351) (272) 64,462 40,448Business operating profit (before interest, depreciation and amortization) 3,359 2,543 1,897 2,000 1,900 1,840 (74) (38) (31) 57 (272) (365) 6,780 6,037Depreciation and impairments of property and equipment 214 101 39 17 69 45 10 9 – – – – 331 173Amortization and impairments of intangible assets 151 187 80 133 125 152 30 30 – – – – 386 501Interest expense on debt 32 55 17 15 – – 604 676 21 20 (272) (365) 401 402Business operating profit before non-controlling interests 2,962 2,200 1,761 1,834 1,707 1,643 (717) (754) (52) 37 – – 5,661 4,961Non-controlling interests 84 115 275 281 – – (1) (1) – – – – 359 395Business operating profit 2,878 2,085 1,486 1,554 1,707 1,643 (716) (753) (52) 37 – – 5,302 4,566
Life includes approximately USD 1.4 billion and USD 2.3 billion of gross written premiums and future life policyholder benefits for certain universal life-type contracts in the Group’s Spanish operations for the years ended December 31, 2019 and 2018, respectively.
Zurich Insurance GroupAnnual Report 2019 276
Group overview Governance Risk review Financial review
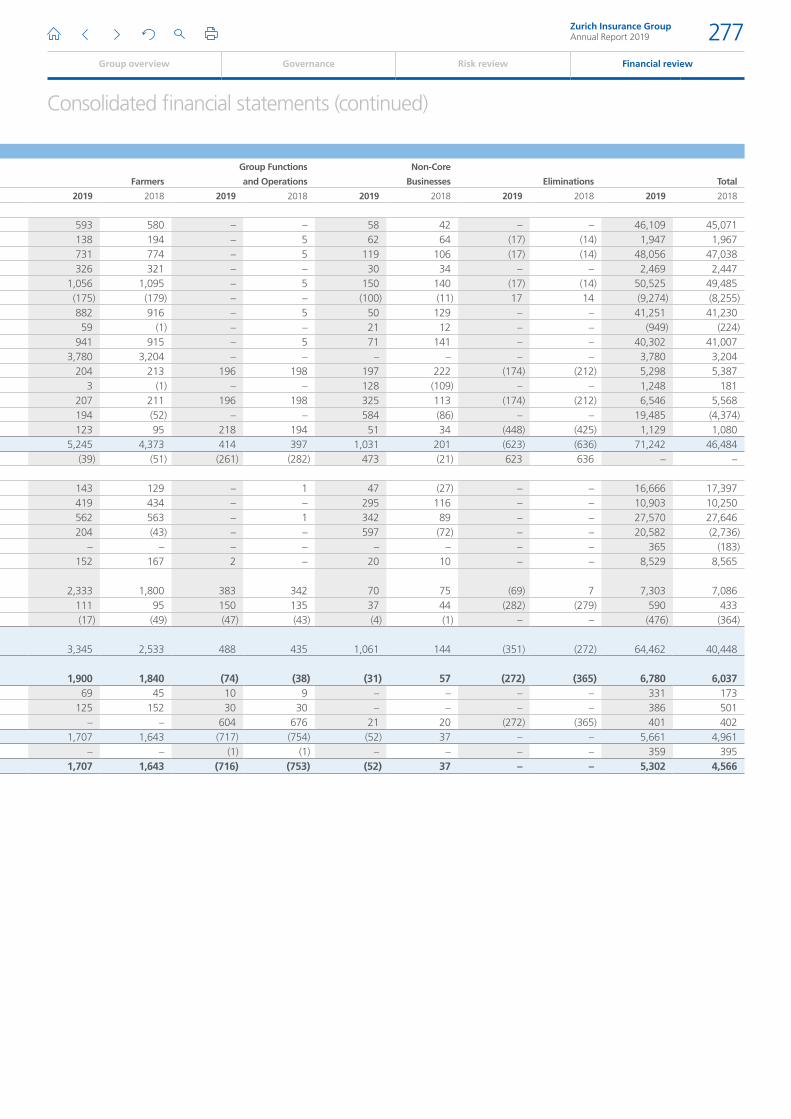
Consolidated financial statements (continued)
Table 27.3
Business operating profit by business
in USD millions, for the years ended December 31
Property & Casualty Life Farmers
Group Functions
and Operations
Non-Core
Businesses Eliminations Total
2019 2018 2019 2018 2019 2018 2019 2018 2019 2018 2019 2018 2019 2018
RevenuesDirect written premiums 32,752 32,139 12,706 12,310 593 580 – – 58 42 – – 46,109 45,071Assumed written premiums 1,432 1,366 332 352 138 194 – 5 62 64 (17) (14) 1,947 1,967
Gross Written Premiums 34,184 33,505 13,038 12,662 731 774 – 5 119 106 (17) (14) 48,056 47,038Policy fees – – 2,113 2,093 326 321 – – 30 34 – – 2,469 2,447
Gross written premiums and policy fees 34,184 33,505 15,151 14,754 1,056 1,095 – 5 150 140 (17) (14) 50,525 49,485Less premiums ceded to reinsurers (7,822) (7,041) (1,193) (1,038) (175) (179) – – (100) (11) 17 14 (9,274) (8,255)
Net written premiums and policy fees 26,362 26,465 13,958 13,717 882 916 – 5 50 129 – – 41,251 41,230Net change in reserves for unearned premiums (754) (34) (275) (202) 59 (1) – – 21 12 – – (949) (224)
Net earned premiums and policy fees 25,608 26,431 13,683 13,514 941 915 – 5 71 141 – – 40,302 41,007Farmers management fees and other related revenues – – – – 3,780 3,204 – – – – – – 3,780 3,204
Net investment income on Group investments 1,961 1,932 2,915 3,035 204 213 196 198 197 222 (174) (212) 5,298 5,387Net capital gains/(losses) and impairments on Group investments 211 (48) 906 338 3 (1) – – 128 (109) – – 1,248 181
Net investment result on Group investments 2,171 1,884 3,821 3,373 207 211 196 198 325 113 (174) (212) 6,546 5,568Net investment result on unit-linked investments – – 18,706 (4,236) 194 (52) – – 584 (86) – – 19,485 (4,374)Other income 668 601 518 582 123 95 218 194 51 34 (448) (425) 1,129 1,080Total BOP revenues 28,447 28,916 36,728 13,234 5,245 4,373 414 397 1,031 201 (623) (636) 71,242 46,484of which: inter-business revenues (601) (141) (195) (141) (39) (51) (261) (282) 473 (21) 623 636 – –Benefits, losses and expenses
Losses and loss adjustment expenses, net 16,477 17,293 – – 143 129 – 1 47 (27) – – 16,666 17,397Life insurance death and other benefits, net (1) (2) 10,190 9,702 419 434 – – 295 116 – – 10,903 10,250
Insurance benefits and losses, net 16,475 17,291 10,190 9,702 562 563 – 1 342 89 – – 27,570 27,646Policyholder dividends and participation in profits, net 12 19 19,769 (2,640) 204 (43) – – 597 (72) – – 20,582 (2,736)Income tax expense/(benefit) attributable to policyholders – – 365 (183) – – – – – – – – 365 (183)Underwriting and policy acquisition costs, net 5,939 6,136 2,417 2,252 152 167 2 – 20 10 – – 8,529 8,565Administrative and other operating expense (excl. depreciation/amortization) 2,571 2,992 2,015 1,871 2,333 1,800 383 342 70 75 (69) 7 7,303 7,086Interest credited to policyholders and other interest 271 156 303 282 111 95 150 135 37 44 (282) (279) 590 433Restructuring costs and other items not included in BOP (180) (221) (228) (50) (17) (49) (47) (43) (4) (1) – – (476) (364)Total BOP benefits, losses and expenses (before interest, depreciation and amortization) 25,088 26,373 34,831 11,234 3,345 2,533 488 435 1,061 144 (351) (272) 64,462 40,448Business operating profit (before interest, depreciation and amortization) 3,359 2,543 1,897 2,000 1,900 1,840 (74) (38) (31) 57 (272) (365) 6,780 6,037Depreciation and impairments of property and equipment 214 101 39 17 69 45 10 9 – – – – 331 173Amortization and impairments of intangible assets 151 187 80 133 125 152 30 30 – – – – 386 501Interest expense on debt 32 55 17 15 – – 604 676 21 20 (272) (365) 401 402Business operating profit before non-controlling interests 2,962 2,200 1,761 1,834 1,707 1,643 (717) (754) (52) 37 – – 5,661 4,961Non-controlling interests 84 115 275 281 – – (1) (1) – – – – 359 395Business operating profit 2,878 2,085 1,486 1,554 1,707 1,643 (716) (753) (52) 37 – – 5,302 4,566
Life includes approximately USD 1.4 billion and USD 2.3 billion of gross written premiums and future life policyholder benefits for certain universal life-type contracts in the Group’s Spanish operations for the years ended December 31, 2019 and 2018, respectively.
Zurich Insurance GroupAnnual Report 2019 277
Group overview Governance Risk review Financial review
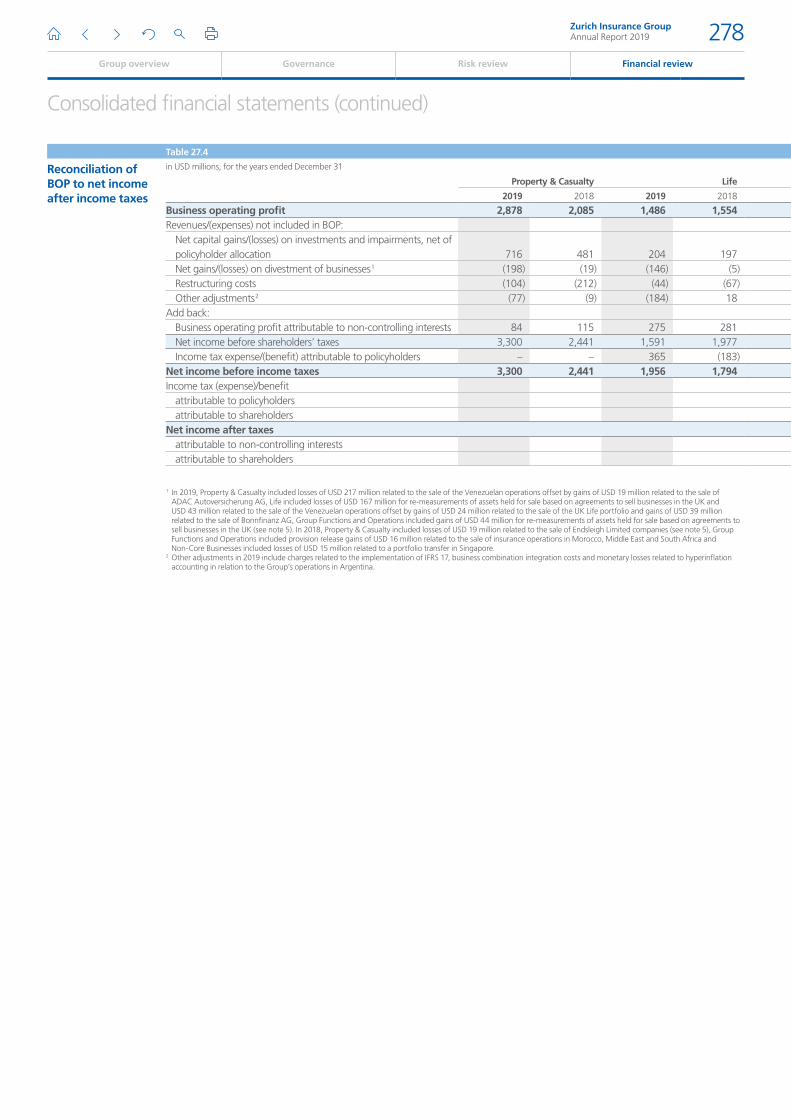
Consolidated financial statements (continued)
Table 27.4
Reconciliation of BOP to net income after income taxes
in USD millions, for the years ended December 31
Property & Casualty Life Farmers
Group Functions
and Operations
Non-Core
Businesses Total
2019 2018 2019 2018 2019 2018 2019 2018 2019 2018 2019 2018
Business operating profit 2,878 2,085 1,486 1,554 1,707 1,643 (716) (753) (52) 37 5,302 4,566Revenues/(expenses) not included in BOP:
Net capital gains/(losses) on investments and impairments, net of policyholder allocation 716 481 204 197 5 28 (151) (9) 70 24 845 720Net gains/(losses) on divestment of businesses 1 (198) (19) (146) (5) – – 49 16 – (15) (295) (24)Restructuring costs (104) (212) (44) (67) (9) (45) – (25) (4) (1) (160) (350)Other adjustments 2 (77) (9) (184) 18 (8) (4) (47) (18) – – (316) (14)
Add back:Business operating profit attributable to non-controlling interests 84 115 275 281 – – (1) (1) – – 359 395Net income before shareholders’ taxes 3,300 2,441 1,591 1,977 1,695 1,622 (866) (790) 14 44 5,735 5,293Income tax expense/(benefit) attributable to policyholders – – 365 (183) – – – – – – 365 (183)
Net income before income taxes 3,300 2,441 1,956 1,794 1,695 1,622 (866) (790) 14 44 6,100 5,110Income tax (expense)/benefit (1,716) (1,134)
attributable to policyholders (365) 183attributable to shareholders (1,351) (1,317)
Net income after taxes 4,384 3,977attributable to non-controlling interests 237 261attributable to shareholders 4,147 3,716
1 In 2019, Property & Casualty included losses of USD 217 million related to the sale of the Venezuelan operations offset by gains of USD 19 million related to the sale of ADAC Autoversicherung AG, Life included losses of USD 167 million for re-measurements of assets held for sale based on agreements to sell businesses in the UK and USD 43 million related to the sale of the Venezuelan operations offset by gains of USD 24 million related to the sale of the UK Life portfolio and gains of USD 39 million related to the sale of Bonnfinanz AG, Group Functions and Operations included gains of USD 44 million for re-measurements of assets held for sale based on agreements to sell businesses in the UK (see note 5). In 2018, Property & Casualty included losses of USD 19 million related to the sale of Endsleigh Limited companies (see note 5), Group Functions and Operations included provision release gains of USD 16 million related to the sale of insurance operations in Morocco, Middle East and South Africa and Non-Core Businesses included losses of USD 15 million related to a portfolio transfer in Singapore.
2 Other adjustments in 2019 include charges related to the implementation of IFRS 17, business combination integration costs and monetary losses related to hyperinflation accounting in relation to the Group’s operations in Argentina.
Zurich Insurance GroupAnnual Report 2019 278
Group overview Governance Risk review Financial review
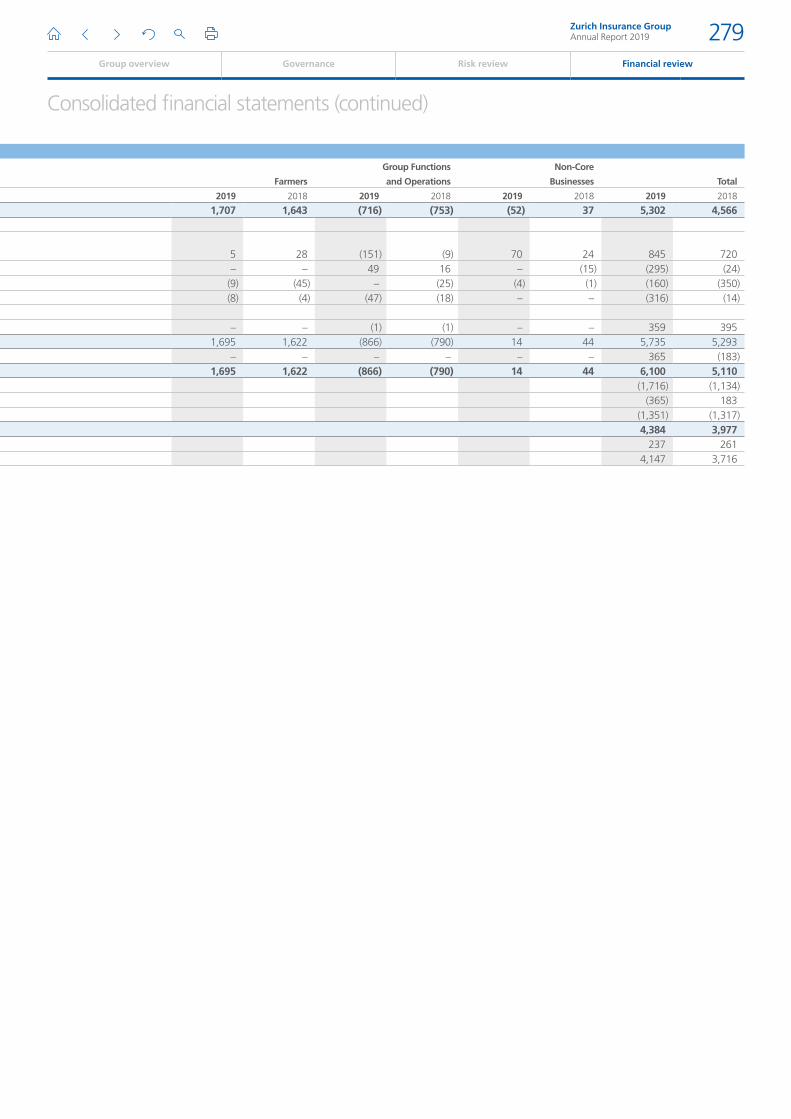
Consolidated financial statements (continued)
Table 27.4
Reconciliation of BOP to net income after income taxes
in USD millions, for the years ended December 31
Property & Casualty Life Farmers
Group Functions
and Operations
Non-Core
Businesses Total
2019 2018 2019 2018 2019 2018 2019 2018 2019 2018 2019 2018
Business operating profit 2,878 2,085 1,486 1,554 1,707 1,643 (716) (753) (52) 37 5,302 4,566Revenues/(expenses) not included in BOP:
Net capital gains/(losses) on investments and impairments, net of policyholder allocation 716 481 204 197 5 28 (151) (9) 70 24 845 720Net gains/(losses) on divestment of businesses 1 (198) (19) (146) (5) – – 49 16 – (15) (295) (24)Restructuring costs (104) (212) (44) (67) (9) (45) – (25) (4) (1) (160) (350)Other adjustments 2 (77) (9) (184) 18 (8) (4) (47) (18) – – (316) (14)
Add back:Business operating profit attributable to non-controlling interests 84 115 275 281 – – (1) (1) – – 359 395Net income before shareholders’ taxes 3,300 2,441 1,591 1,977 1,695 1,622 (866) (790) 14 44 5,735 5,293Income tax expense/(benefit) attributable to policyholders – – 365 (183) – – – – – – 365 (183)
Net income before income taxes 3,300 2,441 1,956 1,794 1,695 1,622 (866) (790) 14 44 6,100 5,110Income tax (expense)/benefit (1,716) (1,134)
attributable to policyholders (365) 183attributable to shareholders (1,351) (1,317)
Net income after taxes 4,384 3,977attributable to non-controlling interests 237 261attributable to shareholders 4,147 3,716
1 In 2019, Property & Casualty included losses of USD 217 million related to the sale of the Venezuelan operations offset by gains of USD 19 million related to the sale of ADAC Autoversicherung AG, Life included losses of USD 167 million for re-measurements of assets held for sale based on agreements to sell businesses in the UK and USD 43 million related to the sale of the Venezuelan operations offset by gains of USD 24 million related to the sale of the UK Life portfolio and gains of USD 39 million related to the sale of Bonnfinanz AG, Group Functions and Operations included gains of USD 44 million for re-measurements of assets held for sale based on agreements to sell businesses in the UK (see note 5). In 2018, Property & Casualty included losses of USD 19 million related to the sale of Endsleigh Limited companies (see note 5), Group Functions and Operations included provision release gains of USD 16 million related to the sale of insurance operations in Morocco, Middle East and South Africa and Non-Core Businesses included losses of USD 15 million related to a portfolio transfer in Singapore.
2 Other adjustments in 2019 include charges related to the implementation of IFRS 17, business combination integration costs and monetary losses related to hyperinflation accounting in relation to the Group’s operations in Argentina.
Zurich Insurance GroupAnnual Report 2019 279
Group overview Governance Risk review Financial review
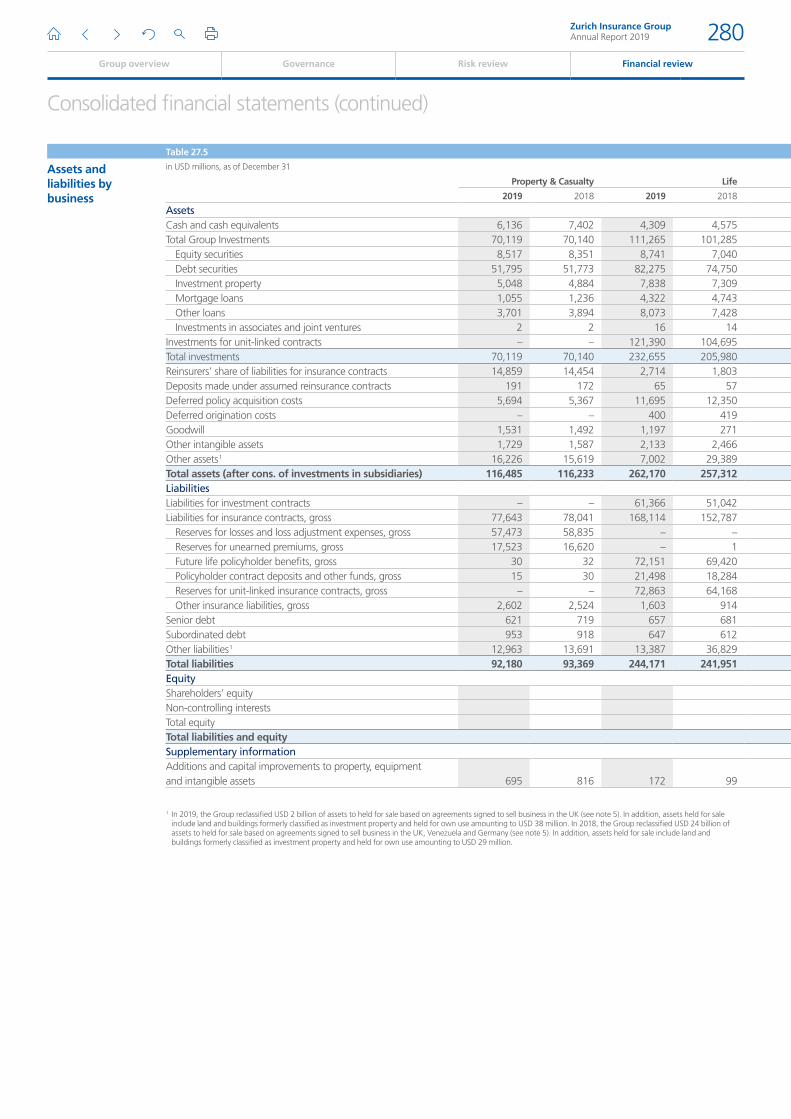
Consolidated financial statements (continued)
Table 27.5
Assets and liabilities by business
in USD millions, as of December 31
Property & Casualty Life Farmers
Group Functions
and Operations
Non-Core
Businesses Eliminations Total
2019 2018 2019 2018 2019 2018 2019 2018 2019 2018 2019 2018 2019 2018
AssetsCash and cash equivalents 6,136 7,402 4,309 4,575 1,102 1,428 7,983 10,212 776 1,398 (12,426) (16,366) 7,880 8,649Total Group Investments 70,119 70,140 111,265 101,285 5,488 5,348 9,311 9,747 5,834 6,172 (8,704) (10,045) 193,312 182,647
Equity securities 8,517 8,351 8,741 7,040 49 65 835 638 155 126 – – 18,296 16,220Debt securities 51,795 51,773 82,275 74,750 3,821 3,462 5,467 6,030 4,562 4,841 (412) (987) 147,507 139,870Investment property 5,048 4,884 7,838 7,309 142 133 – – 233 25 – – 13,261 12,351Mortgage loans 1,055 1,236 4,322 4,743 559 577 – – – – – – 5,935 6,556Other loans 3,701 3,894 8,073 7,428 918 1,110 2,991 3,063 882 1,177 (8,291) (9,058) 8,274 7,614Investments in associates and joint ventures 2 2 16 14 – – 17 16 3 3 – – 39 36
Investments for unit-linked contracts – – 121,390 104,695 932 746 – – 3,889 3,852 – – 126,211 109,294Total investments 70,119 70,140 232,655 205,980 6,420 6,094 9,311 9,747 9,723 10,024 (8,704) (10,045) 319,523 291,940Reinsurers’ share of liabilities for insurance contracts 14,859 14,454 2,714 1,803 2,142 2,242 – – 3,072 2,765 (34) (67) 22,752 21,197Deposits made under assumed reinsurance contracts 191 172 65 57 229 400 – – 258 254 (17) – 726 883Deferred policy acquisition costs 5,694 5,367 11,695 12,350 1,811 1,818 – – 4 2 2 3 19,207 19,541Deferred origination costs – – 400 419 – – – – – – – – 400 419Goodwill 1,531 1,492 1,197 271 819 819 63 52 – – – – 3,610 2,634Other intangible assets 1,729 1,587 2,133 2,466 388 402 83 88 – – – – 4,333 4,542Other assets 1 16,226 15,619 7,002 29,389 1,854 1,657 1,624 908 2,932 1,679 (3,383) (3,716) 26,256 45,536Total assets (after cons. of investments in subsidiaries) 116,485 116,233 262,170 257,312 14,765 14,860 19,063 21,007 16,766 16,122 (24,562) (30,190) 404,688 395,342LiabilitiesLiabilities for investment contracts – – 61,366 51,042 225 213 – – 170 184 – – 61,761 51,439Liabilities for insurance contracts, gross 77,643 78,041 168,114 152,787 7,364 7,311 3 27 11,075 11,139 (59) (96) 264,140 249,208
Reserves for losses and loss adjustment expenses, gross 57,473 58,835 – – 316 467 1 23 1,404 1,649 (30) (61) 59,165 60,913Reserves for unearned premiums, gross 17,523 16,620 – 1 20 79 – 2 10 14 (2) (2) 17,551 16,714Future life policyholder benefits, gross 30 32 72,151 69,420 2,200 2,151 2 2 3,376 3,348 (2) (4) 77,756 74,950Policyholder contract deposits and other funds, gross 15 30 21,498 18,284 3,867 3,882 – – 2,101 2,071 – – 27,480 24,266Reserves for unit-linked insurance contracts, gross – – 72,863 64,168 932 746 – – 3,889 3,852 – – 77,684 68,766Other insurance liabilities, gross 2,602 2,524 1,603 914 29 (16) – – 296 206 (25) (29) 4,505 3,599
Senior debt 621 719 657 681 – – 9,709 11,157 274 273 (6,113) (7,593) 5,148 5,237Subordinated debt 953 918 647 612 – – 7,726 7,579 – – (2,475) (2,334) 6,852 6,775Other liabilities 1 12,963 13,691 13,387 36,829 2,020 1,756 13,463 14,246 4,325 4,529 (15,919) (20,169) 30,238 50,881Total liabilities 92,180 93,369 244,171 241,951 9,610 9,279 30,900 33,009 15,843 16,124 (24,565) (30,191) 368,139 363,540EquityShareholders’ equity 35,004 30,189Non-controlling interests 1,545 1,613Total equity 36,549 31,802Total liabilities and equity 404,688 395,342Supplementary informationAdditions and capital improvements to property, equipment and intangible assets 695 816 172 99 171 181 68 56 – – – – 1,105 1,152
1 In 2019, the Group reclassified USD 2 billion of assets to held for sale based on agreements signed to sell business in the UK (see note 5). In addition, assets held for sale include land and buildings formerly classified as investment property and held for own use amounting to USD 38 million. In 2018, the Group reclassified USD 24 billion of assets to held for sale based on agreements signed to sell business in the UK, Venezuela and Germany (see note 5). In addition, assets held for sale include land and buildings formerly classified as investment property and held for own use amounting to USD 29 million.
Zurich Insurance GroupAnnual Report 2019 280
Group overview Governance Risk review Financial review
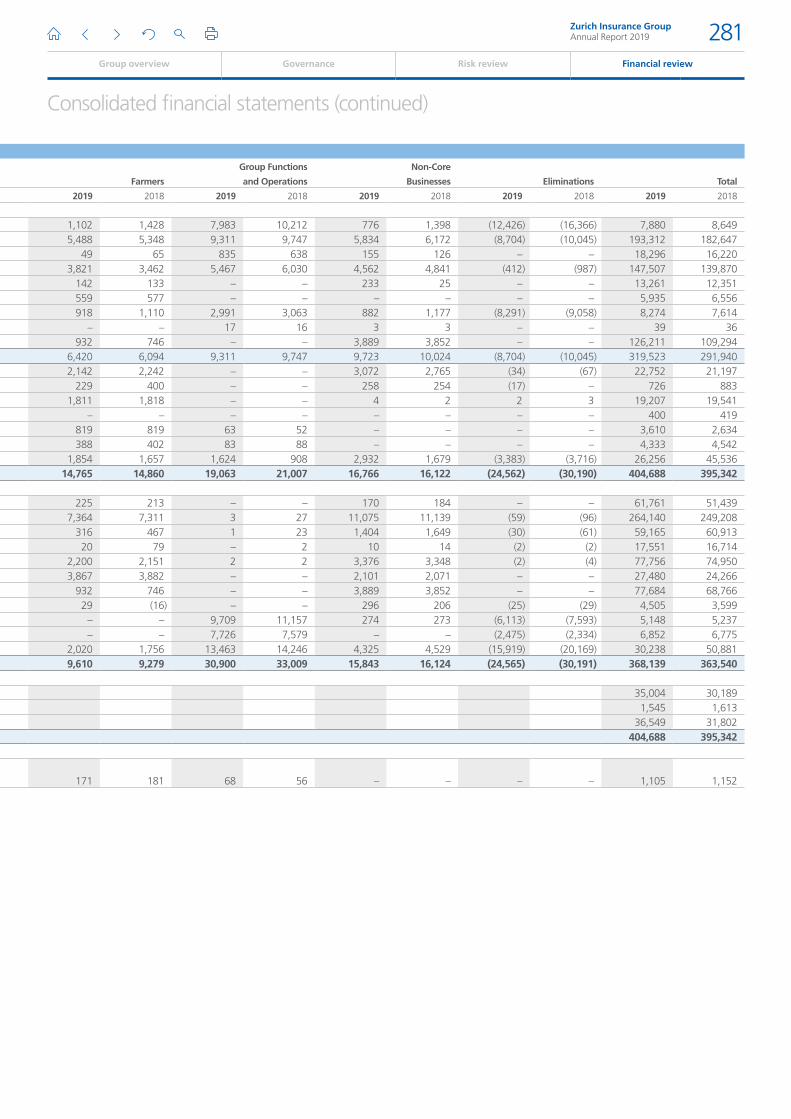
Consolidated financial statements (continued)
Table 27.5
Assets and liabilities by business
in USD millions, as of December 31
Property & Casualty Life Farmers
Group Functions
and Operations
Non-Core
Businesses Eliminations Total
2019 2018 2019 2018 2019 2018 2019 2018 2019 2018 2019 2018 2019 2018
AssetsCash and cash equivalents 6,136 7,402 4,309 4,575 1,102 1,428 7,983 10,212 776 1,398 (12,426) (16,366) 7,880 8,649Total Group Investments 70,119 70,140 111,265 101,285 5,488 5,348 9,311 9,747 5,834 6,172 (8,704) (10,045) 193,312 182,647
Equity securities 8,517 8,351 8,741 7,040 49 65 835 638 155 126 – – 18,296 16,220Debt securities 51,795 51,773 82,275 74,750 3,821 3,462 5,467 6,030 4,562 4,841 (412) (987) 147,507 139,870Investment property 5,048 4,884 7,838 7,309 142 133 – – 233 25 – – 13,261 12,351Mortgage loans 1,055 1,236 4,322 4,743 559 577 – – – – – – 5,935 6,556Other loans 3,701 3,894 8,073 7,428 918 1,110 2,991 3,063 882 1,177 (8,291) (9,058) 8,274 7,614Investments in associates and joint ventures 2 2 16 14 – – 17 16 3 3 – – 39 36
Investments for unit-linked contracts – – 121,390 104,695 932 746 – – 3,889 3,852 – – 126,211 109,294Total investments 70,119 70,140 232,655 205,980 6,420 6,094 9,311 9,747 9,723 10,024 (8,704) (10,045) 319,523 291,940Reinsurers’ share of liabilities for insurance contracts 14,859 14,454 2,714 1,803 2,142 2,242 – – 3,072 2,765 (34) (67) 22,752 21,197Deposits made under assumed reinsurance contracts 191 172 65 57 229 400 – – 258 254 (17) – 726 883Deferred policy acquisition costs 5,694 5,367 11,695 12,350 1,811 1,818 – – 4 2 2 3 19,207 19,541Deferred origination costs – – 400 419 – – – – – – – – 400 419Goodwill 1,531 1,492 1,197 271 819 819 63 52 – – – – 3,610 2,634Other intangible assets 1,729 1,587 2,133 2,466 388 402 83 88 – – – – 4,333 4,542Other assets 1 16,226 15,619 7,002 29,389 1,854 1,657 1,624 908 2,932 1,679 (3,383) (3,716) 26,256 45,536Total assets (after cons. of investments in subsidiaries) 116,485 116,233 262,170 257,312 14,765 14,860 19,063 21,007 16,766 16,122 (24,562) (30,190) 404,688 395,342LiabilitiesLiabilities for investment contracts – – 61,366 51,042 225 213 – – 170 184 – – 61,761 51,439Liabilities for insurance contracts, gross 77,643 78,041 168,114 152,787 7,364 7,311 3 27 11,075 11,139 (59) (96) 264,140 249,208
Reserves for losses and loss adjustment expenses, gross 57,473 58,835 – – 316 467 1 23 1,404 1,649 (30) (61) 59,165 60,913Reserves for unearned premiums, gross 17,523 16,620 – 1 20 79 – 2 10 14 (2) (2) 17,551 16,714Future life policyholder benefits, gross 30 32 72,151 69,420 2,200 2,151 2 2 3,376 3,348 (2) (4) 77,756 74,950Policyholder contract deposits and other funds, gross 15 30 21,498 18,284 3,867 3,882 – – 2,101 2,071 – – 27,480 24,266Reserves for unit-linked insurance contracts, gross – – 72,863 64,168 932 746 – – 3,889 3,852 – – 77,684 68,766Other insurance liabilities, gross 2,602 2,524 1,603 914 29 (16) – – 296 206 (25) (29) 4,505 3,599
Senior debt 621 719 657 681 – – 9,709 11,157 274 273 (6,113) (7,593) 5,148 5,237Subordinated debt 953 918 647 612 – – 7,726 7,579 – – (2,475) (2,334) 6,852 6,775Other liabilities 1 12,963 13,691 13,387 36,829 2,020 1,756 13,463 14,246 4,325 4,529 (15,919) (20,169) 30,238 50,881Total liabilities 92,180 93,369 244,171 241,951 9,610 9,279 30,900 33,009 15,843 16,124 (24,565) (30,191) 368,139 363,540EquityShareholders’ equity 35,004 30,189Non-controlling interests 1,545 1,613Total equity 36,549 31,802Total liabilities and equity 404,688 395,342Supplementary informationAdditions and capital improvements to property, equipment and intangible assets 695 816 172 99 171 181 68 56 – – – – 1,105 1,152
1 In 2019, the Group reclassified USD 2 billion of assets to held for sale based on agreements signed to sell business in the UK (see note 5). In addition, assets held for sale include land and buildings formerly classified as investment property and held for own use amounting to USD 38 million. In 2018, the Group reclassified USD 24 billion of assets to held for sale based on agreements signed to sell business in the UK, Venezuela and Germany (see note 5). In addition, assets held for sale include land and buildings formerly classified as investment property and held for own use amounting to USD 29 million.
Zurich Insurance GroupAnnual Report 2019 281
Group overview Governance Risk review Financial review
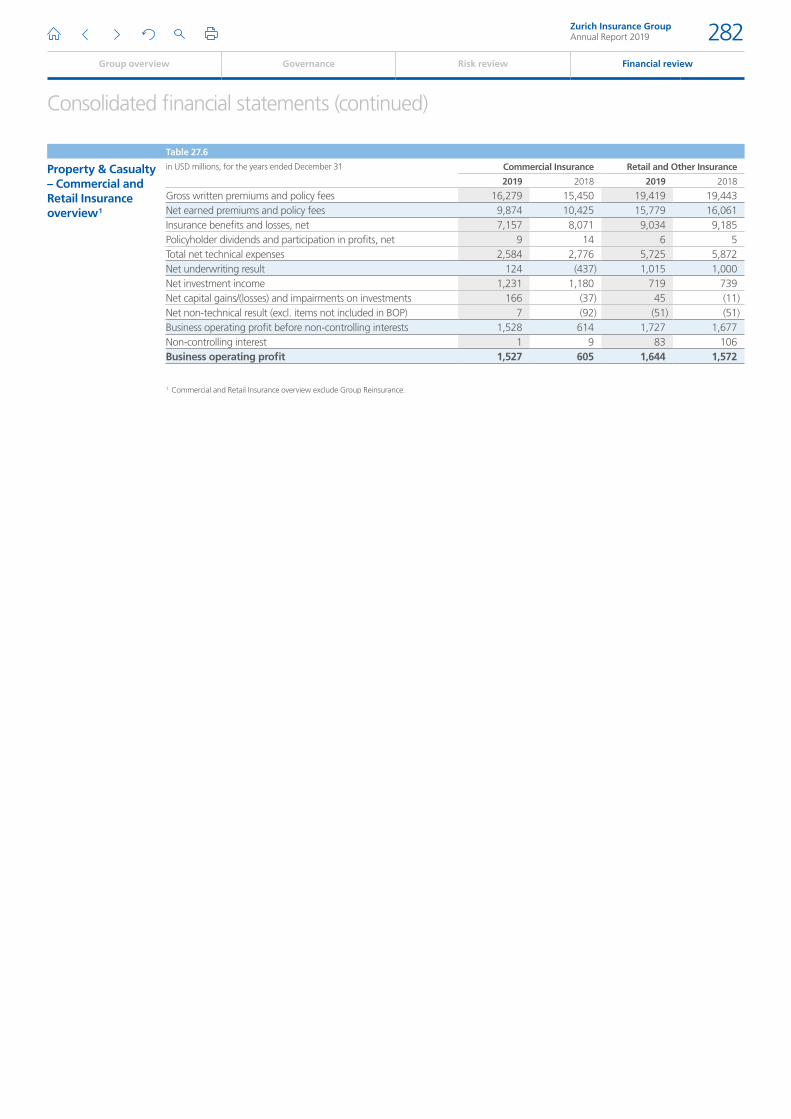
Consolidated financial statements (continued)
Table 27.6
Property & Casualty – Commercial and Retail Insurance overview 1
in USD millions, for the years ended December 31 Commercial Insurance Retail and Other Insurance
2019 2018 2019 2018
Gross written premiums and policy fees 16,279 15,450 19,419 19,443Net earned premiums and policy fees 9,874 10,425 15,779 16,061Insurance benefits and losses, net 7,157 8,071 9,034 9,185Policyholder dividends and participation in profits, net 9 14 6 5Total net technical expenses 2,584 2,776 5,725 5,872Net underwriting result 124 (437) 1,015 1,000Net investment income 1,231 1,180 719 739Net capital gains/(losses) and impairments on investments 166 (37) 45 (11)Net non-technical result (excl. items not included in BOP) 7 (92) (51) (51)Business operating profit before non-controlling interests 1,528 614 1,727 1,677Non-controlling interest 1 9 83 106Business operating profit 1,527 605 1,644 1,572
1 Commercial and Retail Insurance overview exclude Group Reinsurance.
Zurich Insurance GroupAnnual Report 2019 282
Group overview Governance Risk review Financial review
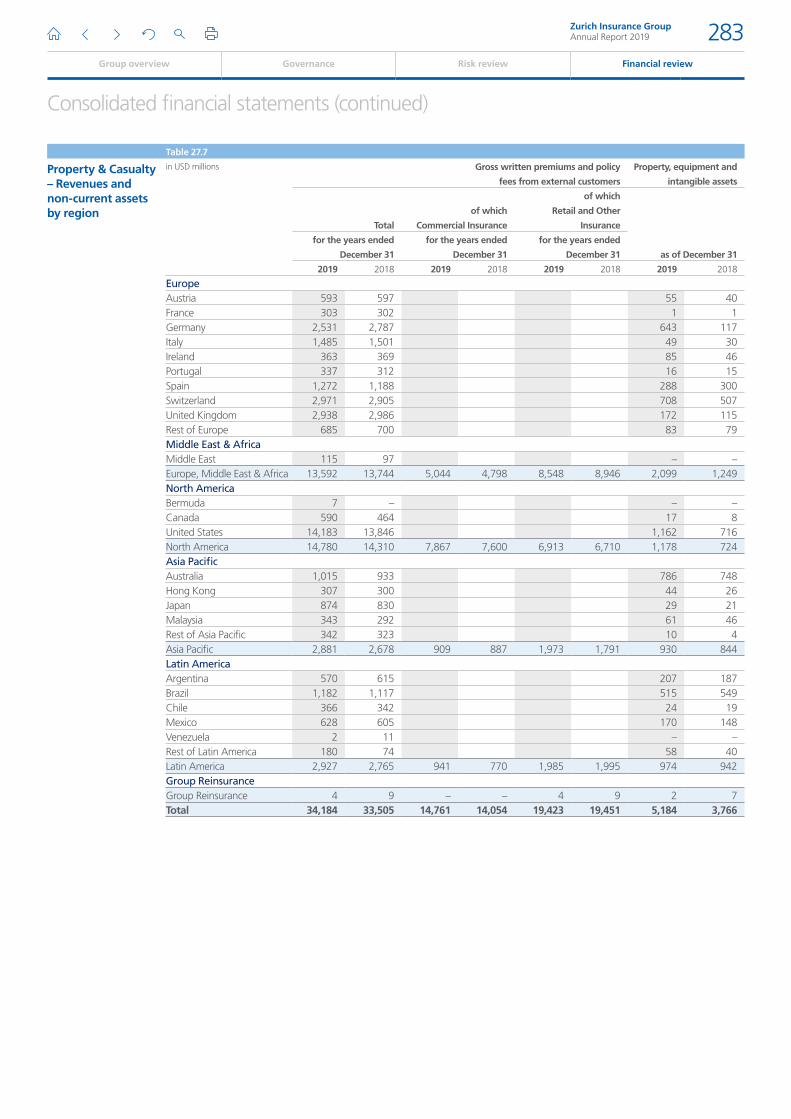
Consolidated financial statements (continued)
Table 27.7
Property & Casualty – Revenues and non-current assets by region
in USD millions Gross written premiums and policy
fees from external customers
Property, equipment and
intangible assets
Total
of which
Commercial Insurance
of which
Retail and Other
Insurance
as of December 31
for the years ended
December 31
for the years ended
December 31
for the years ended
December 31
2019 2018 2019 2018 2019 2018 2019 2018
EuropeAustria 593 597 55 40France 303 302 1 1Germany 2,531 2,787 643 117Italy 1,485 1,501 49 30Ireland 363 369 85 46Portugal 337 312 16 15Spain 1,272 1,188 288 300Switzerland 2,971 2,905 708 507United Kingdom 2,938 2,986 172 115Rest of Europe 685 700 83 79Middle East & AfricaMiddle East 115 97 – –Europe, Middle East & Africa 13,592 13,744 5,044 4,798 8,548 8,946 2,099 1,249North AmericaBermuda 7 – – –Canada 590 464 17 8United States 14,183 13,846 1,162 716North America 14,780 14,310 7,867 7,600 6,913 6,710 1,178 724Asia PacificAustralia 1,015 933 786 748Hong Kong 307 300 44 26Japan 874 830 29 21Malaysia 343 292 61 46Rest of Asia Pacific 342 323 10 4Asia Pacific 2,881 2,678 909 887 1,973 1,791 930 844Latin AmericaArgentina 570 615 207 187Brazil 1,182 1,117 515 549Chile 366 342 24 19Mexico 628 605 170 148Venezuela 2 11 – –Rest of Latin America 180 74 58 40Latin America 2,927 2,765 941 770 1,985 1,995 974 942Group ReinsuranceGroup Reinsurance 4 9 – – 4 9 2 7Total 34,184 33,505 14,761 14,054 19,423 19,451 5,184 3,766
Zurich Insurance GroupAnnual Report 2019 283
Group overview Governance Risk review Financial review
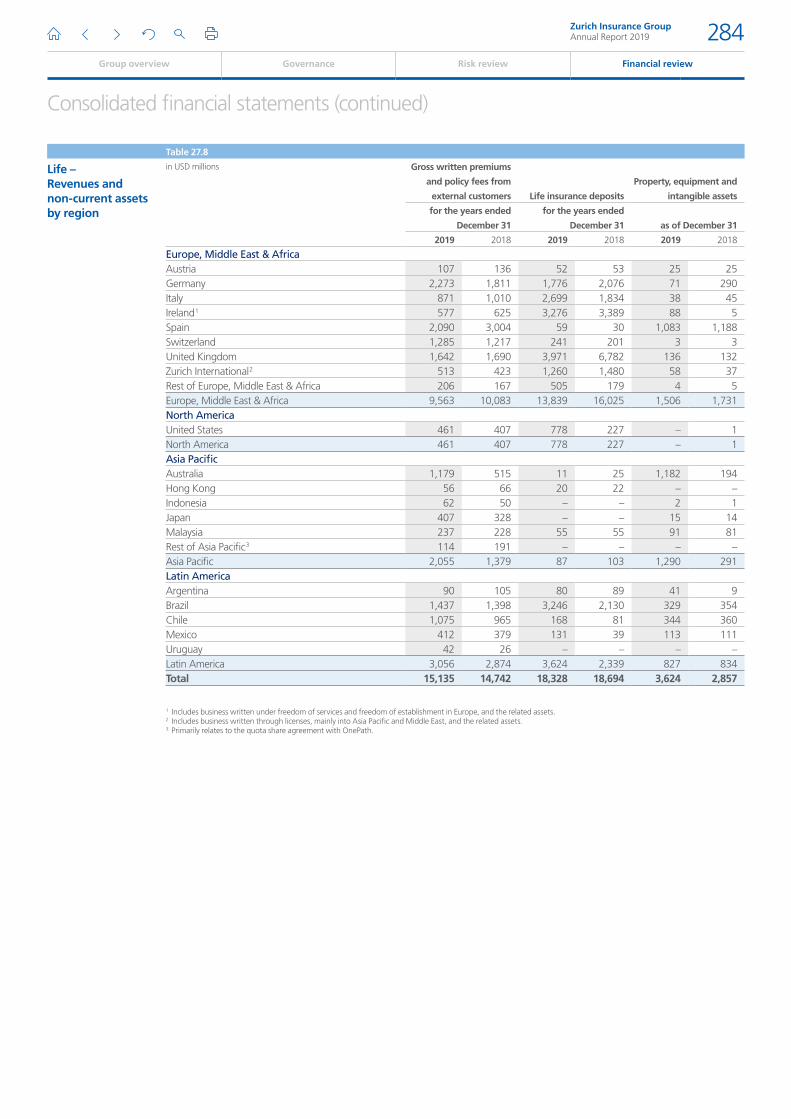
Consolidated financial statements (continued)
Table 27.8
Life – Revenues and non-current assets by region
in USD millions Gross written premiums
and policy fees from
external customers Life insurance deposits
Property, equipment and
intangible assets
for the years ended
December 31
for the years ended
December 31 as of December 31
2019 2018 2019 2018 2019 2018
Europe, Middle East & AfricaAustria 107 136 52 53 25 25Germany 2,273 1,811 1,776 2,076 71 290Italy 871 1,010 2,699 1,834 38 45Ireland 1 577 625 3,276 3,389 88 5Spain 2,090 3,004 59 30 1,083 1,188Switzerland 1,285 1,217 241 201 3 3United Kingdom 1,642 1,690 3,971 6,782 136 132Zurich International 2 513 423 1,260 1,480 58 37Rest of Europe, Middle East & Africa 206 167 505 179 4 5Europe, Middle East & Africa 9,563 10,083 13,839 16,025 1,506 1,731North AmericaUnited States 461 407 778 227 – 1North America 461 407 778 227 – 1Asia PacificAustralia 1,179 515 11 25 1,182 194Hong Kong 56 66 20 22 – –Indonesia 62 50 – – 2 1Japan 407 328 – – 15 14Malaysia 237 228 55 55 91 81Rest of Asia Pacific 3 114 191 – – – –Asia Pacific 2,055 1,379 87 103 1,290 291Latin AmericaArgentina 90 105 80 89 41 9Brazil 1,437 1,398 3,246 2,130 329 354Chile 1,075 965 168 81 344 360Mexico 412 379 131 39 113 111Uruguay 42 26 – – – –Latin America 3,056 2,874 3,624 2,339 827 834Total 15,135 14,742 18,328 18,694 3,624 2,857
1 Includes business written under freedom of services and freedom of establishment in Europe, and the related assets.2 Includes business written through licenses, mainly into Asia Pacific and Middle East, and the related assets.3 Primarily relates to the quota share agreement with OnePath.
Zurich Insurance GroupAnnual Report 2019 284
Group overview Governance Risk review Financial review
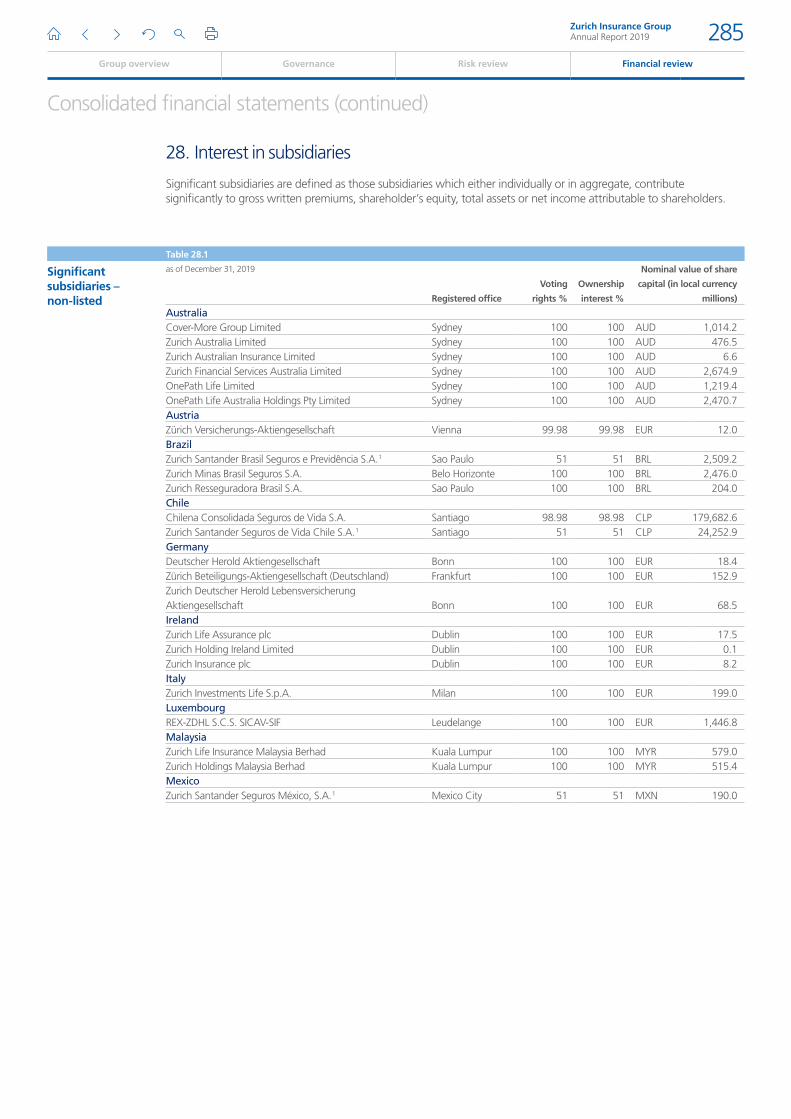
Consolidated financial statements (continued)
28. Interest in subsidiaries
Significant subsidiaries are defined as those subsidiaries which either individually or in aggregate, contribute significantly to gross written premiums, shareholder’s equity, total assets or net income attributable to shareholders.
Table 28.1
Significant subsidiaries – non-listed
as of December 31, 2019
Registered office
Voting
rights %
Ownership
interest %
Nominal value of share
capital (in local currency
millions)
AustraliaCover-More Group Limited Sydney 100 100 AUD 1,014.2Zurich Australia Limited Sydney 100 100 AUD 476.5Zurich Australian Insurance Limited Sydney 100 100 AUD 6.6Zurich Financial Services Australia Limited Sydney 100 100 AUD 2,674.9OnePath Life Limited Sydney 100 100 AUD 1,219.4OnePath Life Australia Holdings Pty Limited Sydney 100 100 AUD 2,470.7AustriaZürich Versicherungs-Aktiengesellschaft Vienna 99.98 99.98 EUR 12.0BrazilZurich Santander Brasil Seguros e Previdência S.A. 1 Sao Paulo 51 51 BRL 2,509.2Zurich Minas Brasil Seguros S.A. Belo Horizonte 100 100 BRL 2,476.0Zurich Resseguradora Brasil S.A. Sao Paulo 100 100 BRL 204.0ChileChilena Consolidada Seguros de Vida S.A. Santiago 98.98 98.98 CLP 179,682.6Zurich Santander Seguros de Vida Chile S.A. 1 Santiago 51 51 CLP 24,252.9GermanyDeutscher Herold Aktiengesellschaft Bonn 100 100 EUR 18.4Zürich Beteiligungs-Aktiengesellschaft (Deutschland) Frankfurt 100 100 EUR 152.9Zurich Deutscher Herold Lebensversicherung Aktiengesellschaft Bonn 100 100 EUR 68.5IrelandZurich Life Assurance plc Dublin 100 100 EUR 17.5Zurich Holding Ireland Limited Dublin 100 100 EUR 0.1Zurich Insurance plc Dublin 100 100 EUR 8.2ItalyZurich Investments Life S.p.A. Milan 100 100 EUR 199.0LuxembourgREX-ZDHL S.C.S. SICAV-SIF Leudelange 100 100 EUR 1,446.8MalaysiaZurich Life Insurance Malaysia Berhad Kuala Lumpur 100 100 MYR 579.0Zurich Holdings Malaysia Berhad Kuala Lumpur 100 100 MYR 515.4MexicoZurich Santander Seguros México, S.A. 1 Mexico City 51 51 MXN 190.0
Zurich Insurance GroupAnnual Report 2019 285
Group overview Governance Risk review Financial review
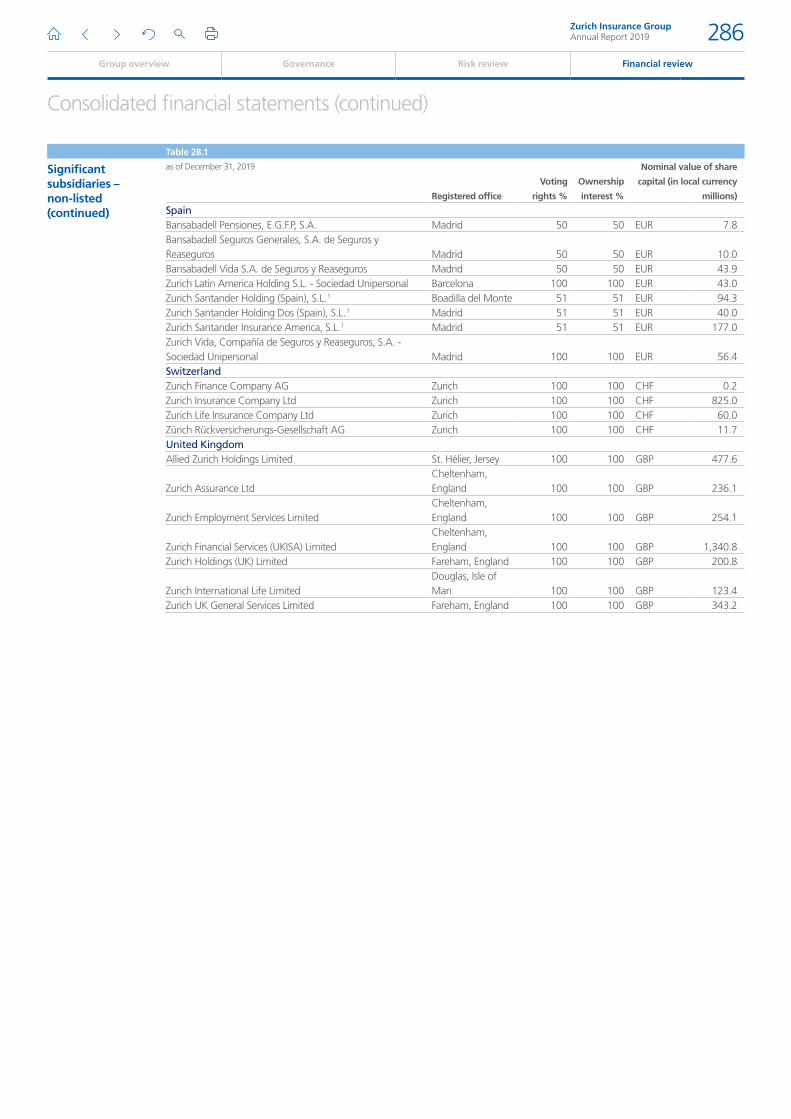
Consolidated financial statements (continued)
Table 28.1
Significant subsidiaries – non-listed (continued)
as of December 31, 2019
Registered office
Voting
rights %
Ownership
interest %
Nominal value of share
capital (in local currency
millions)
SpainBansabadell Pensiones, E.G.F.P, S.A. Madrid 50 50 EUR 7.8Bansabadell Seguros Generales, S.A. de Seguros y Reaseguros Madrid 50 50 EUR 10.0Bansabadell Vida S.A. de Seguros y Reaseguros Madrid 50 50 EUR 43.9Zurich Latin America Holding S.L. - Sociedad Unipersonal Barcelona 100 100 EUR 43.0Zurich Santander Holding (Spain), S.L. 1 Boadilla del Monte 51 51 EUR 94.3Zurich Santander Holding Dos (Spain), S.L. 1 Madrid 51 51 EUR 40.0Zurich Santander Insurance America, S.L. 1 Madrid 51 51 EUR 177.0Zurich Vida, Compañía de Seguros y Reaseguros, S.A. - Sociedad Unipersonal Madrid 100 100 EUR 56.4SwitzerlandZurich Finance Company AG Zurich 100 100 CHF 0.2Zurich Insurance Company Ltd Zurich 100 100 CHF 825.0Zurich Life Insurance Company Ltd Zurich 100 100 CHF 60.0Zürich Rückversicherungs-Gesellschaft AG Zurich 100 100 CHF 11.7United KingdomAllied Zurich Holdings Limited St. Hélier, Jersey 100 100 GBP 477.6
Zurich Assurance LtdCheltenham, England 100 100 GBP 236.1
Zurich Employment Services LimitedCheltenham, England 100 100 GBP 254.1
Zurich Financial Services (UKISA) LimitedCheltenham, England 100 100 GBP 1,340.8
Zurich Holdings (UK) Limited Fareham, England 100 100 GBP 200.8
Zurich International Life LimitedDouglas, Isle of Man 100 100 GBP 123.4
Zurich UK General Services Limited Fareham, England 100 100 GBP 343.2
Zurich Insurance GroupAnnual Report 2019 286
Group overview Governance Risk review Financial review
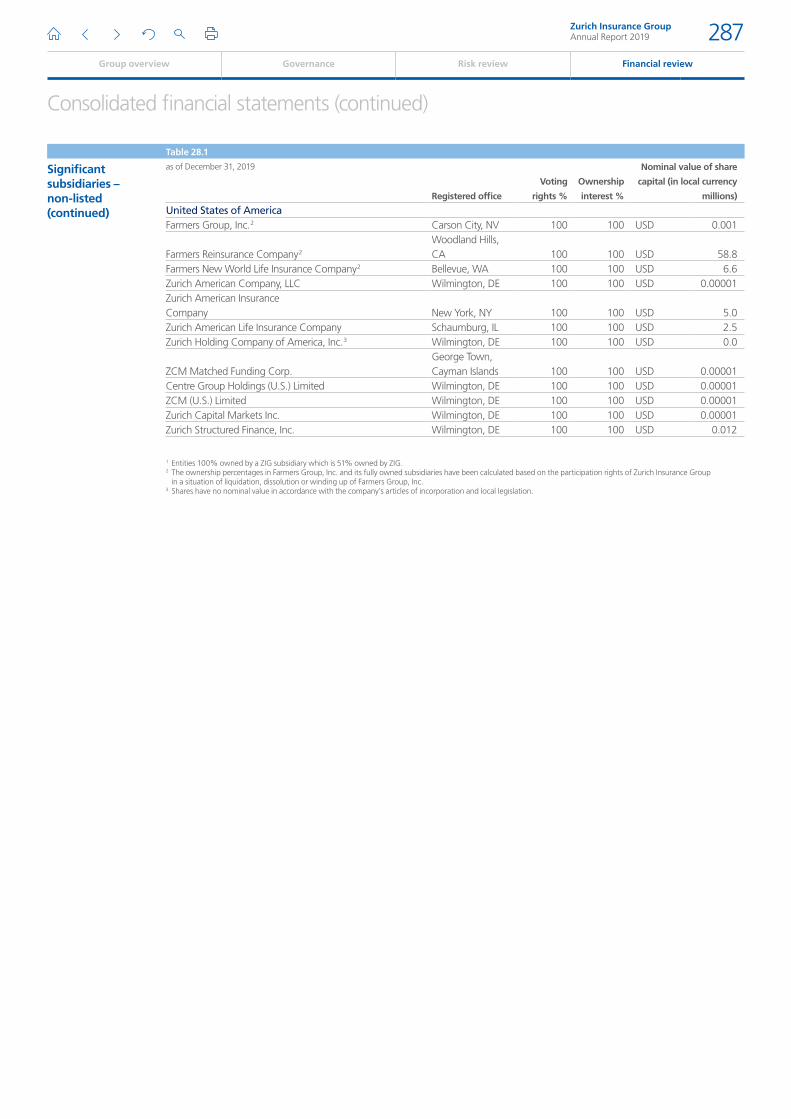
Consolidated financial statements (continued)
Table 28.1
Significant subsidiaries – non-listed (continued)
as of December 31, 2019
Registered office
Voting
rights %
Ownership
interest %
Nominal value of share
capital (in local currency
millions)
United States of AmericaFarmers Group, Inc. 2 Carson City, NV 100 100 USD 0.001
Farmers Reinsurance Company 2
Woodland Hills, CA 100 100 USD 58.8
Farmers New World Life Insurance Company 2 Bellevue, WA 100 100 USD 6.6Zurich American Company, LLC Wilmington, DE 100 100 USD 0.00001Zurich American Insurance Company New York, NY 100 100 USD 5.0Zurich American Life Insurance Company Schaumburg, IL 100 100 USD 2.5Zurich Holding Company of America, Inc. 3 Wilmington, DE 100 100 USD 0.0
ZCM Matched Funding Corp.George Town, Cayman Islands 100 100 USD 0.00001
Centre Group Holdings (U.S.) Limited Wilmington, DE 100 100 USD 0.00001ZCM (U.S.) Limited Wilmington, DE 100 100 USD 0.00001Zurich Capital Markets Inc. Wilmington, DE 100 100 USD 0.00001Zurich Structured Finance, Inc. Wilmington, DE 100 100 USD 0.012
1 Entities 100% owned by a ZIG subsidiary which is 51% owned by ZIG.2 The ownership percentages in Farmers Group, Inc. and its fully owned subsidiaries have been calculated based on the participation rights of Zurich Insurance Group
in a situation of liquidation, dissolution or winding up of Farmers Group, Inc.3 Shares have no nominal value in accordance with the company’s articles of incorporation and local legislation.
Zurich Insurance GroupAnnual Report 2019 287
Group overview Governance Risk review Financial review
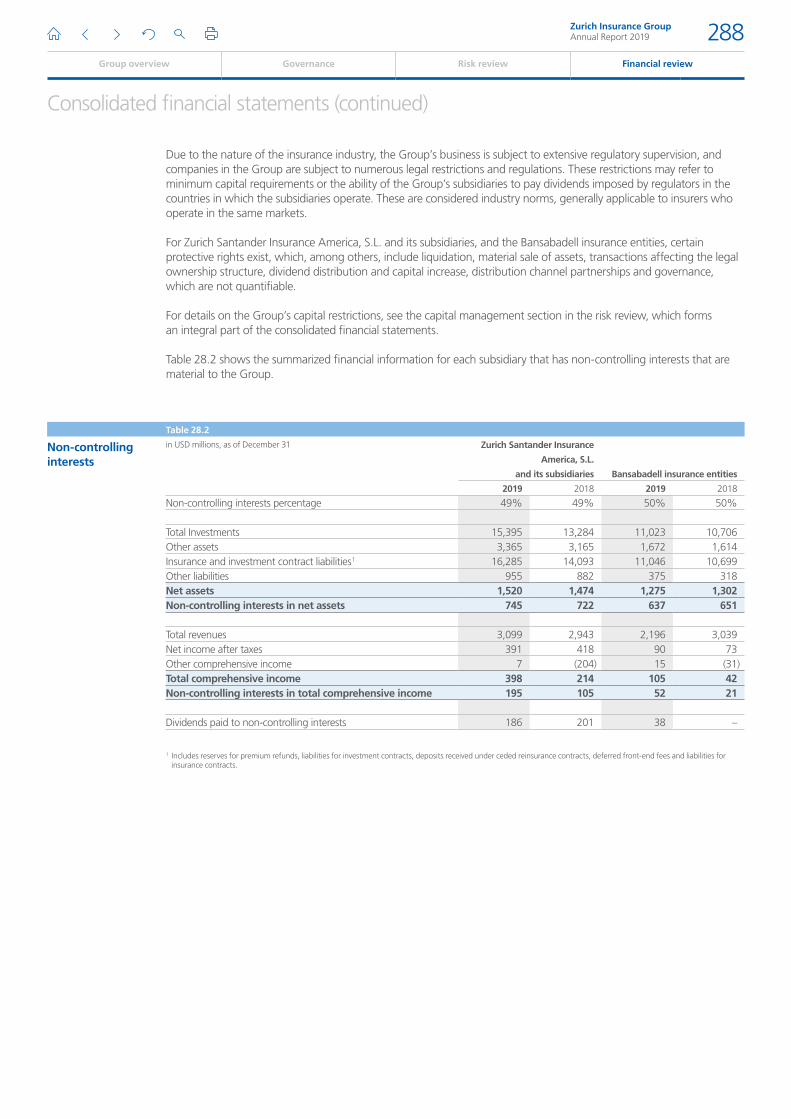
Consolidated financial statements (continued)
Due to the nature of the insurance industry, the Group’s business is subject to extensive regulatory supervision, and companies in the Group are subject to numerous legal restrictions and regulations. These restrictions may refer to minimum capital requirements or the ability of the Group’s subsidiaries to pay dividends imposed by regulators in the countries in which the subsidiaries operate. These are considered industry norms, generally applicable to insurers who operate in the same markets.
For Zurich Santander Insurance America, S.L. and its subsidiaries, and the Bansabadell insurance entities, certain protective rights exist, which, among others, include liquidation, material sale of assets, transactions affecting the legal ownership structure, dividend distribution and capital increase, distribution channel partnerships and governance, which are not quantifiable.
For details on the Group’s capital restrictions, see the capital management section in the risk review, which forms an integral part of the consolidated financial statements.
Table 28.2 shows the summarized financial information for each subsidiary that has non-controlling interests that are material to the Group.
Table 28.2
Non-controlling interests
in USD millions, as of December 31 Zurich Santander Insurance
America, S.L.
and its subsidiaries Bansabadell insurance entities
2019 2018 2019 2018
Non-controlling interests percentage 49% 49% 50% 50%
Total Investments 15,395 13,284 11,023 10,706Other assets 3,365 3,165 1,672 1,614Insurance and investment contract liabilities 1 16,285 14,093 11,046 10,699Other liabilities 955 882 375 318Net assets 1,520 1,474 1,275 1,302Non-controlling interests in net assets 745 722 637 651
Total revenues 3,099 2,943 2,196 3,039Net income after taxes 391 418 90 73Other comprehensive income 7 (204) 15 (31)Total comprehensive income 398 214 105 42Non-controlling interests in total comprehensive income 195 105 52 21
Dividends paid to non-controlling interests 186 201 38 –
1 Includes reserves for premium refunds, liabilities for investment contracts, deposits received under ceded reinsurance contracts, deferred front-end fees and liabilities for insurance contracts.
Zurich Insurance GroupAnnual Report 2019 288
Group overview Governance Risk review Financial review

Consolidated financial statements (continued)
29. Events after the balance sheet date
No events after the balance sheet date.
Zurich Insurance GroupAnnual Report 2019 289
Group overview Governance Risk review Financial review
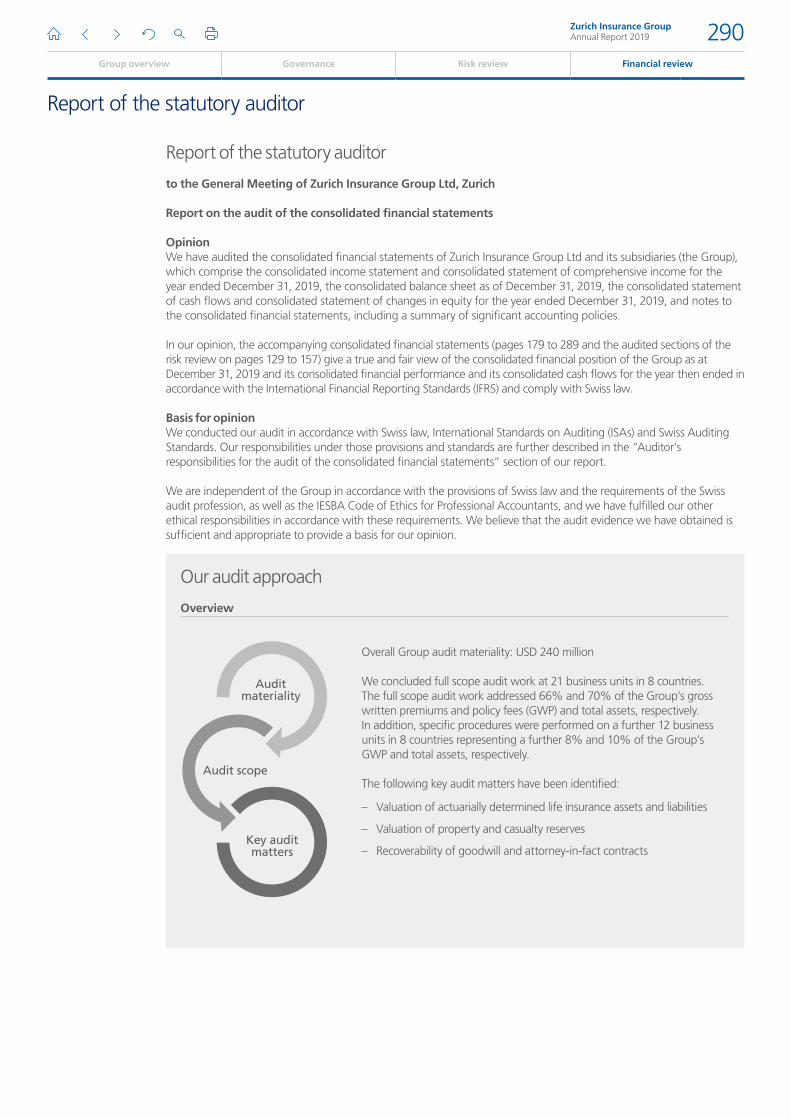
Report of the statutory auditor
Report of the statutory auditor
to the General Meeting of Zurich Insurance Group Ltd, Zurich
Report on the audit of the consolidated financial statements
OpinionWe have audited the consolidated financial statements of Zurich Insurance Group Ltd and its subsidiaries (the Group), which comprise the consolidated income statement and consolidated statement of comprehensive income for the year ended December 31, 2019, the consolidated balance sheet as of December 31, 2019, the consolidated statement of cash flows and consolidated statement of changes in equity for the year ended December 31, 2019, and notes to the consolidated financial statements, including a summary of significant accounting policies.
In our opinion, the accompanying consolidated financial statements (pages 179 to 289 and the audited sections of the risk review on pages 129 to 157) give a true and fair view of the consolidated financial position of the Group as at December 31, 2019 and its consolidated financial performance and its consolidated cash flows for the year then ended in accordance with the International Financial Reporting Standards (IFRS) and comply with Swiss law.
Basis for opinionWe conducted our audit in accordance with Swiss law, International Standards on Auditing (ISAs) and Swiss Auditing Standards. Our responsibilities under those provisions and standards are further described in the “Auditor’s responsibilities for the audit of the consolidated financial statements” section of our report.
We are independent of the Group in accordance with the provisions of Swiss law and the requirements of the Swiss audit profession, as well as the IESBA Code of Ethics for Professional Accountants, and we have fulfilled our other ethical responsibilities in accordance with these requirements. We believe that the audit evidence we have obtained is sufficient and appropriate to provide a basis for our opinion.
Our audit approach
Auditmateriality
Audit scope
Key auditmatters
Overall Group audit materiality: USD 240 million
We concluded full scope audit work at 21 business units in 8 countries.The full scope audit work addressed 66% and 70% of the Group’s gross written premiums and policy fees (GWP) and total assets, respectively.In addition, specific procedures were performed on a further 12 business units in 8 countries representing a further 8% and 10% of the Group’s GWP and total assets, respectively.
The following key audit matters have been identified:
– Valuation of actuarially determined life insurance assets and liabilities
– Valuation of property and casualty reserves
– Recoverability of goodwill and attorney-in-fact contracts
Overview
Report of the statutory auditor
Zurich Insurance GroupAnnual Report 2019 290
Group overview Governance Risk review Financial review
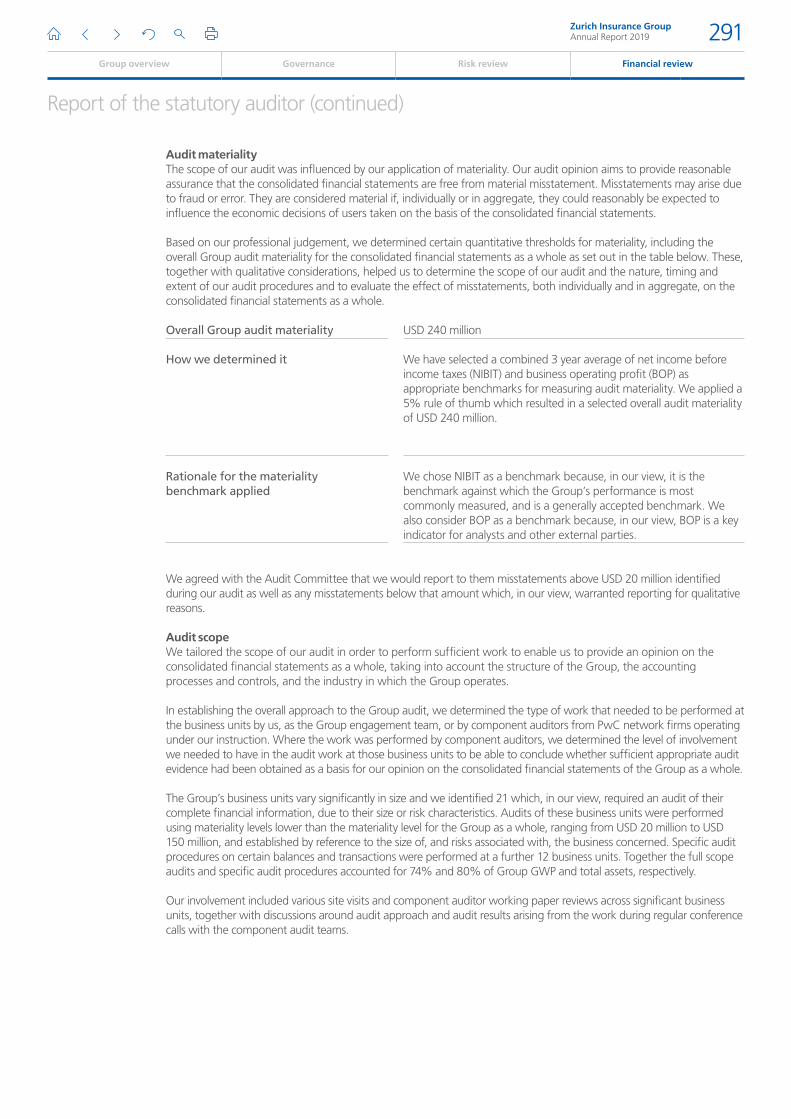
Report of the statutory auditor (continued)
Audit materialityThe scope of our audit was influenced by our application of materiality. Our audit opinion aims to provide reasonable assurance that the consolidated financial statements are free from material misstatement. Misstatements may arise due to fraud or error. They are considered material if, individually or in aggregate, they could reasonably be expected to influence the economic decisions of users taken on the basis of the consolidated financial statements.
Based on our professional judgement, we determined certain quantitative thresholds for materiality, including the overall Group audit materiality for the consolidated financial statements as a whole as set out in the table below. These, together with qualitative considerations, helped us to determine the scope of our audit and the nature, timing and extent of our audit procedures and to evaluate the effect of misstatements, both individually and in aggregate, on the consolidated financial statements as a whole.
Overall Group audit materiality
How we determined it
Rationale for the materiality benchmark applied
USD 240 million
We have selected a combined 3 year average of net income before income taxes (NIBIT) and business operating profit (BOP) as appropriate benchmarks for measuring audit materiality. We applied a 5% rule of thumb which resulted in a selected overall audit materiality of USD 240 million.
We chose NIBIT as a benchmark because, in our view, it is the benchmark against which the Group’s performance is most commonly measured, and is a generally accepted benchmark. We also consider BOP as a benchmark because, in our view, BOP is a key indicator for analysts and other external parties.
We agreed with the Audit Committee that we would report to them misstatements above USD 20 million identified during our audit as well as any misstatements below that amount which, in our view, warranted reporting for qualitative reasons.
Audit scopeWe tailored the scope of our audit in order to perform sufficient work to enable us to provide an opinion on the consolidated financial statements as a whole, taking into account the structure of the Group, the accounting processes and controls, and the industry in which the Group operates.
In establishing the overall approach to the Group audit, we determined the type of work that needed to be performed at the business units by us, as the Group engagement team, or by component auditors from PwC network firms operating under our instruction. Where the work was performed by component auditors, we determined the level of involvement we needed to have in the audit work at those business units to be able to conclude whether sufficient appropriate audit evidence had been obtained as a basis for our opinion on the consolidated financial statements of the Group as a whole.
The Group’s business units vary significantly in size and we identified 21 which, in our view, required an audit of their complete financial information, due to their size or risk characteristics. Audits of these business units were performed using materiality levels lower than the materiality level for the Group as a whole, ranging from USD 20 million to USD 150 million, and established by reference to the size of, and risks associated with, the business concerned. Specific audit procedures on certain balances and transactions were performed at a further 12 business units. Together the full scope audits and specific audit procedures accounted for 74% and 80% of Group GWP and total assets, respectively.
Our involvement included various site visits and component auditor working paper reviews across significant business units, together with discussions around audit approach and audit results arising from the work during regular conference calls with the component audit teams.
Zurich Insurance GroupAnnual Report 2019 291
Group overview Governance Risk review Financial review
Report of the statutory auditor (continued)
Key audit mattersKey audit matters are those matters that, in our professional judgement, were of most significance in our audit of the consolidated financial statements of the current period. These matters were addressed in the context of our audit of the consolidated financial statements as a whole, and in forming our opinion thereon, and we do not provide a separate opinion on these matters.
Valuation of actuarially determined life insurance assets and liabilities
Key audit matter
The Group’s valuation of the actuarially determined life insurance assets (including deferred policy acquisition costs, deferred origination costs, and present value of future profits) and liabilities (reserves for insurance contracts and deferred front-end fees) is based on complex actuarial methodologies and models and involves comprehensive assumption setting processes with regards to future events. Actuarial assumptions selected by the Group with respect to interest rates, investment returns, mortality, morbidity, longevity, persistency, expenses, stock market volatility and future policyholder behavior and the underlying methodologies and assumptions used may result in material impacts on the valuation of actuarially determined life insurance assets and liabilities.
Specifically, the continued low interest rate environment, which results in reduced investment returns, influences policyholders’ behaviors, thereby creating a risk of accelerated amortization of deferred policy acquisition costs and a strain on the sufficiency of reserves for traditional life insurance contracts.
Refer to Notes 4, 8 and 11 to the consolidated financial statements.
How our audit addressed the key audit matter
We assessed and tested the design and operating effectiveness of selected key controls over actuarial methodology, integrity of data used in the actuarial valuation, and the assumptions setting processes used by management related to the valuation of actuarially determined life insurance assets and liabilities.
In relation to the particular matters set out opposite, our substantive testing procedures included the following:
– Testing the completeness and accuracy of underlying data to source documentation.
– Involving our life insurance actuarial experts to independently test and challenge management’s methodology and the assumptions used, with particular consideration of industry studies, the Group’s experience and management’s liability adequacy testing procedures. We focused on the changes to life actuarial methodology and assumptions during the year and assessed whether the methodologies are in compliance with recognized actuarial practices as well as regulatory and reporting requirements.
– Testing, on a sample basis, the calculation models applied to estimate the actuarially determined life insurance assets and liabilities.
Based on the work performed we determined that the methodologies, assumptions and underlying data used in the valuation of actuarially determined life insurance assets and liabilities are reasonable and in line with industry accepted practice.
Zurich Insurance GroupAnnual Report 2019 292
Group overview Governance Risk review Financial review
Report of the statutory auditor (continued)
Valuation of property and casualty reserves
Key audit matter
The valuation of property and casualty loss reserves involves a high degree of subjectivity and complexity. Reserves for losses and loss adjustment expenses represent estimates of future payments of reported and unreported claims for losses and related expenses at a given date. The Group uses a range of actuarial methodologies to estimate these provisions. Property and casualty loss reserves require significant judgment relating to factors and assumptions such as inflation, claims development patterns and regulatory changes.
Specifically, long-tail lines of business, which often have low frequency, high severity claims settlements, are generally more difficult to project and subject to greater uncertainties than those with short-tail, high frequency claims. Further, not all natural catastrophes can be modeled using actuarial methodologies, which increases the degree of judgment needed in estimating property and casualty loss reserves.
Refer to Notes 4 and 8 to the consolidated financial statements.
How our audit addressed the key audit matter
We assessed and tested the design and operating effectiveness of selected key controls over actuarial methodology, integrity of data used in the actuarial valuation, and the assumptions setting and governance processes used by management related to the valuation of property and casualty reserves.
In relation to the particular matters set out opposite, our substantive testing procedures included the following:
– Testing the completeness and accuracy of underlying claims data utilized by the Group’s actuaries in estimating property and casualty loss reserves.
– Utilizing information technology audit techniques to analyse claims through claims data plausibility checks and recalculation of claims development patterns.
– Involving our actuarial experts to independently test management’s property and casualty loss reserve studies and evaluate the reasonableness of the methodology and assumptions used against recognized actuarial practices and industry standards.
– Performing independent re-projections on selected product lines, particularly focusing on the largest and most uncertain property and casualty reserves. For these product lines our actuarial experts compared their re-projected reserves to those recorded by the Group, and assessed whether the recorded reserves were within a reasonable range.
– Performing sensitivity testing and evaluated the appropriateness of any significant adjustments made by management relating to property and casualty reserve estimates.
Based on the work performed we determined that the methodologies, assumptions and underlying data used in the valuation of property and casualty reserves are reasonable and in line with industry accepted practice.
Zurich Insurance GroupAnnual Report 2019 293
Group overview Governance Risk review Financial review
Report of the statutory auditor (continued)
Recoverability of goodwill and attorney-in-fact contracts
Key audit matter
The Group’s goodwill is allocated to cash generating units (CGUs) that are identified generally at a segment level. Acquisitions which closed in 2019 have added substantial amounts of goodwill. The valuation and recoverability of significant goodwill and attorney-in-fact contracts involves complex judgments and estimates, including projections of future income, terminal growth rate assumptions, and discount rates. These assumptions and estimates can have a material impact on the valuations and impairment decisions reflected in the consolidated financial statements of the Group.
Refer to Notes 3, 4 and 14 to the consolidated financial statements.
How our audit addressed the key audit matter
We assessed the design effectiveness of selected key controls over terminal growth rate assumptions, and discount rates related to the recoverability of goodwill and attorney-in-fact contracts. In relation to the particular matters set out opposite, our substantive testing procedures included the following:
– Corroborating the justification of the CGUs defined by management for goodwill allocation.
– Testing the Group’s discounted cash flow model that supports the value-in-use calculations in order to assess the appropriateness of the methodology applied in the Group’s annual impairment assessment.
– Testing the reasonableness of the assumptions used in the impairment assessment including projections of future income, terminal growth rate assumptions, discount rates and sensitivity analyses to determine the impact of those assumptions.
– Engaging our internal valuation experts to assist in the testing of key assumptions and inputs.
Based on the work performed we consider Management’s impairment testing including the assumptions used to support the carrying value of goodwill and attorney-in-fact contracts as reasonable.
Zurich Insurance GroupAnnual Report 2019 294
Group overview Governance Risk review Financial review
Report of the statutory auditor (continued)
Other information in the annual reportThe Board of Directors is responsible for the other information in the annual report. The other information comprises all information included in the annual report, but does not include the consolidated financial statements, the stand-alone financial statements of Zurich Insurance Group Ltd, the audited sections of the risk review on pages 129 to 157, the Remuneration report of Zurich Insurance Group Ltd and our auditor’s reports thereon.
Our opinion on the consolidated financial statements does not cover the other information in the annual report and we do not express any form of assurance conclusion thereon
In connection with our audit of the consolidated financial statements, our responsibility is to read the other information in the annual report and, in doing so, consider whether the other information is materially inconsistent with the consolidated financial statements or our knowledge obtained in the audit, or otherwise appears to be materially misstated. If, based on the work we have performed, we conclude that there is a material misstatement of this other information, we are required to report that fact. We have nothing to report in this regard.
Responsibilities of the Board of Directors for the consolidated financial statementsThe Board of Directors is responsible for the preparation of the consolidated financial statements that give a true and fair view in accordance with IFRS and the provisions of Swiss law, and for such internal control as the Board of Directors determines is necessary to enable the preparation of consolidated financial statements that are free from material misstatement, whether due to fraud or error.
In preparing the consolidated financial statements, the Board of Directors is responsible for assessing the Group’s ability to continue as a going concern, disclosing, as applicable, matters related to going concern and using the going concern basis of accounting unless the Board of Directors either intends to liquidate the Group or to cease operations, or has no realistic alternative but to do so.
Auditor’s responsibilities for the audit of the consolidated financial statementsOur objectives are to obtain reasonable assurance about whether the consolidated financial statements as a whole are free from material misstatement, whether due to fraud or error, and to issue an auditor’s report that includes our opinion. Reasonable assurance is a high level of assurance, but is not a guarantee that an audit conducted in accordance with Swiss law, ISAs and Swiss Auditing Standards will always detect a material misstatement when it exists. Misstatements can arise from fraud or error and are considered material if, individually or in the aggregate, they could reasonably be expected to influence the economic decisions of users taken on the basis of these consolidated financial statements.
A further description of our responsibilities for the audit of the consolidated financial statements is located at the website of EXPERTsuisse: http://expertsuisse.ch/en/audit-report-for-public-companies. This description forms part of our auditor’s report.
Report on other legal and regulatory requirementsIn accordance with article 728a paragraph 1 item 3 CO and Swiss Auditing Standard 890, we confirm that an internal control system exists which has been designed for the preparation of consolidated financial statements according to the instructions of the Board of Directors.
We recommend that the consolidated financial statements submitted to you be approved.
PricewaterhouseCoopers AG
Alex Finn Mark HumphreysAudit expert Audit expertAuditor in charge
Zurich, February 12, 2020
Zurich Insurance GroupAnnual Report 2019 295
Group overview Governance Risk review Financial review
Holding company
Holding company
Review of the year Zurich Insurance Group Ltd’s net income after taxes for the year was CHF 2,864 million compared with CHF 67 million in 2018. In 2019, the net income after taxes mainly reflects dividend income from its subsidiary Zurich Insurance Company Ltd (ZIC) in the amount of CHF 2,750 million. No dividend was paid by ZIC in 2018, but ZIC repaid CHF 2,700 million of the subordinated debt to its parent in 2018.
The Annual General Meeting on April 3, 2019, approved a dividend of CHF 19.00 less 35 percent Swiss withholding tax per share out of the available earnings.
Shareholders’ equity increased by CHF 47 million to CHF 13,608 million as of December 31, 2019, from CHF 13,561 million as of December 31, 2018, as a result of the net income after taxes for the year, partially offset by the dividend paid in 2019. During 2018, Zurich Insurance Group Ltd repurchased 1,740,000 treasury shares via a public share buy-back program. At the Annual General Meeting of April 3, 2019, the shareholders approved the cancellation of these shares. The corresponding reduction of the share capital of Zurich Insurance Group Ltd from 151,348,027 to 149,608,027 fully paid registered shares with a nominal value of CHF 0.10 each through cancellation of the repurchased treasury shares was completed in June 2019.
The Board of Directors proposes to the Annual General Meeting, which is to be held on April 1, 2020, to distribute a dividend from available earnings for 2019 of CHF 20.00 less 35 percent Swiss withholding tax per share.
Contents
Income statements 297
Balance sheets 298
Notes to the financial statements 299
Proposed appropriation of available earnings 304
Report of the statutory auditor 306
Group overview Governance Risk review
Zurich Insurance GroupAnnual Report 2019 296
Financial review
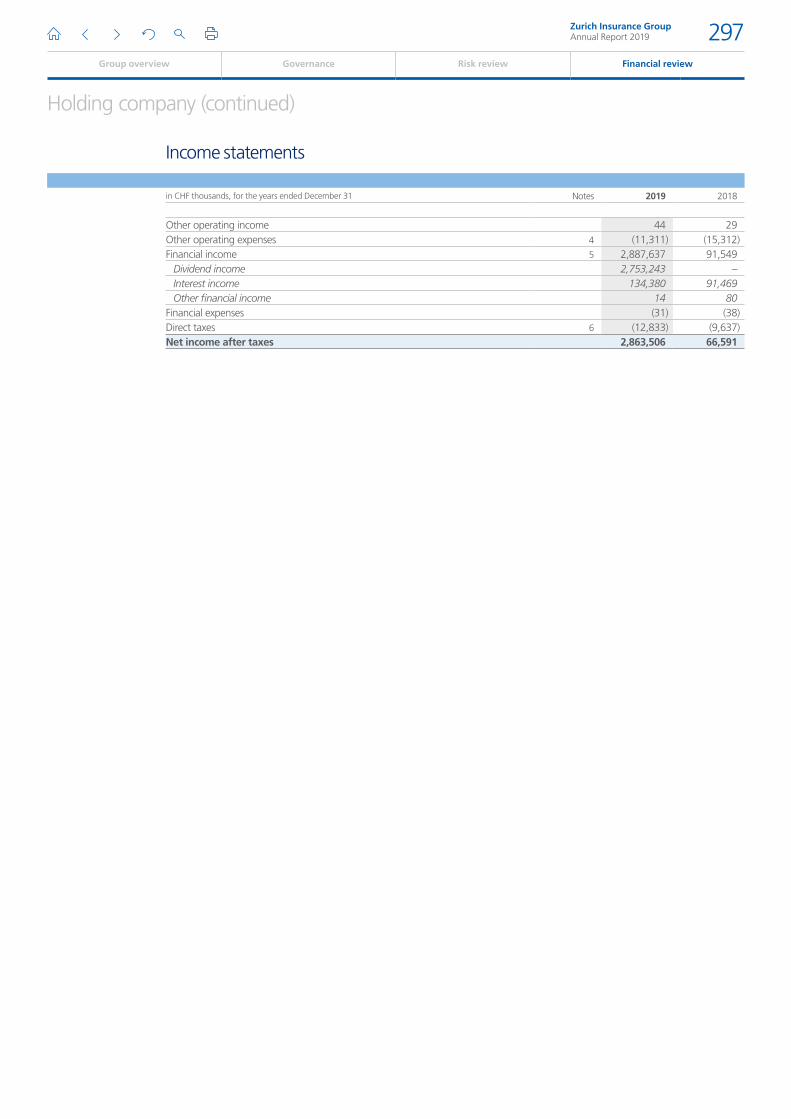
Holding company (continued)
Income statements
in CHF thousands, for the years ended December 31 Notes 2019 2018
Other operating income 44 29Other operating expenses 4 (11,311) (15,312)Financial income 5 2,887,637 91,549
Dividend income 2,753,243 –Interest income 134,380 91,469Other financial income 14 80
Financial expenses (31) (38)Direct taxes 6 (12,833) (9,637)Net income after taxes 2,863,506 66,591
Zurich Insurance GroupAnnual Report 2019 297
Group overview Governance Risk review Financial review
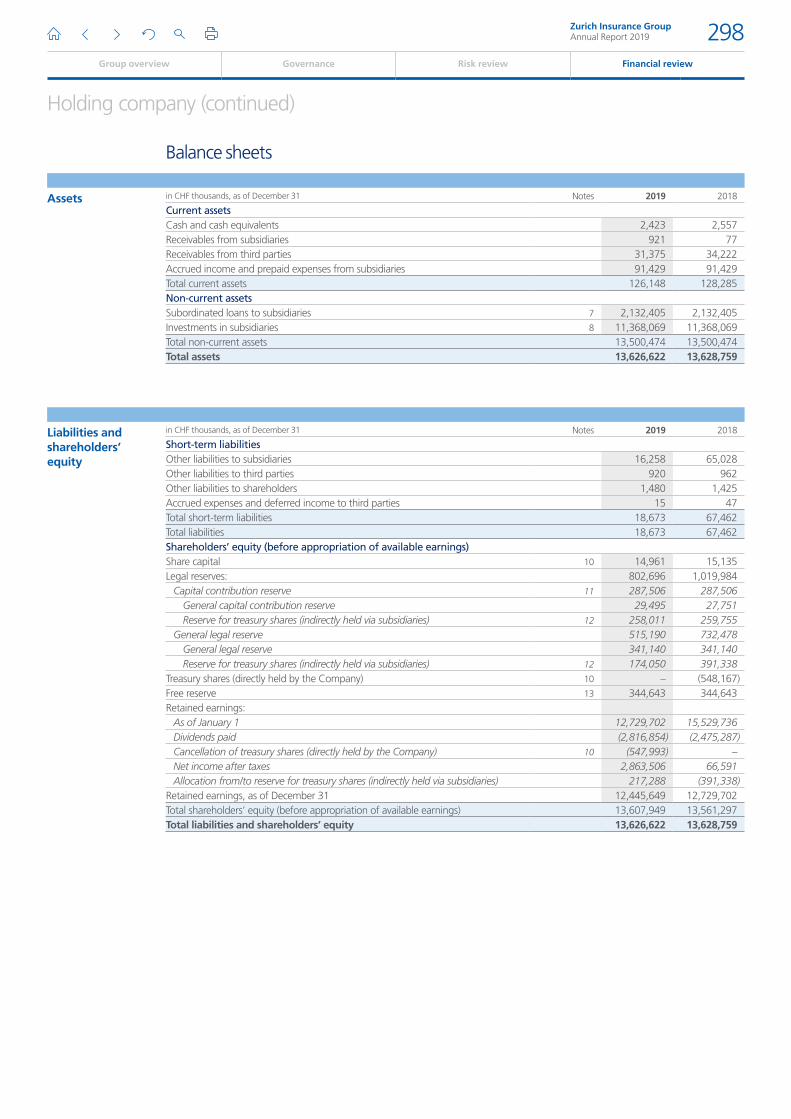
Holding company (continued)
Balance sheets
Assets in CHF thousands, as of December 31 Notes 2019 2018
Current assetsCash and cash equivalents 2,423 2,557Receivables from subsidiaries 921 77Receivables from third parties 31,375 34,222Accrued income and prepaid expenses from subsidiaries 91,429 91,429Total current assets 126,148 128,285Non-current assetsSubordinated loans to subsidiaries 7 2,132,405 2,132,405Investments in subsidiaries 8 11,368,069 11,368,069Total non-current assets 13,500,474 13,500,474Total assets 13,626,622 13,628,759
Liabilities and shareholders’ equity
in CHF thousands, as of December 31 Notes 2019 2018
Short-term liabilitiesOther liabilities to subsidiaries 16,258 65,028Other liabilities to third parties 920 962Other liabilities to shareholders 1,480 1,425Accrued expenses and deferred income to third parties 15 47Total short-term liabilities 18,673 67,462Total liabilities 18,673 67,462Shareholders’ equity (before appropriation of available earnings)Share capital 10 14,961 15,135Legal reserves: 802,696 1,019,984
Capital contribution reserve 11 287,506 287,506General capital contribution reserve 29,495 27,751Reserve for treasury shares (indirectly held via subsidiaries) 12 258,011 259,755
General legal reserve 515,190 732,478General legal reserve 341,140 341,140Reserve for treasury shares (indirectly held via subsidiaries) 12 174,050 391,338
Treasury shares (directly held by the Company) 10 – (548,167)Free reserve 13 344,643 344,643Retained earnings:
As of January 1 12,729,702 15,529,736Dividends paid (2,816,854) (2,475,287)Cancellation of treasury shares (directly held by the Company) 10 (547,993) –Net income after taxes 2,863,506 66,591Allocation from/to reserve for treasury shares (indirectly held via subsidiaries) 217,288 (391,338)
Retained earnings, as of December 31 12,445,649 12,729,702Total shareholders’ equity (before appropriation of available earnings) 13,607,949 13,561,297Total liabilities and shareholders’ equity 13,626,622 13,628,759
Zurich Insurance GroupAnnual Report 2019 298
Group overview Governance Risk review Financial review
Holding company (continued)
Notes to the financial statements
1. General informationZurich Insurance Group Ltd (the Company) is a corporation domiciled in Zurich, Switzerland, and its shares are listed on the SIX Swiss Exchange. It was incorporated on April 26, 2000, and is the holding company of the Zurich Insurance Group with the principal activity of holding subsidiary companies. The Company does not employ staff, as employees work in a joint capacity for Zurich Insurance Company Ltd (ZIC).
2. Basis of presentationZurich Insurance Group Ltd presents its financial statements in accordance with Swiss law.
All amounts in these financial statements including the notes are shown in Swiss franc thousands, rounded to the nearest thousand, unless otherwise specified.
3. Summary of significant accounting policiesa) Exchange ratesUnless otherwise stated, assets and liabilities expressed in currencies other than Swiss francs are translated at year end exchange rates. Revenues and expenses are translated using the exchange rate at the date of the transaction. Net unrealized exchange losses are recorded in the income statements and net unrealized exchange gains are deferred until realized.
b) Investments in subsidiariesInvestments in subsidiaries are equity interests, held on a long-term basis for the purpose of the holding company’s business activities. Each investment in subsidiaries is valued individually and carried at its cost less adjustments for impairments.
c) Accrued incomeIncome is accrued for interest which is earned but not yet due for payment at the end of the reporting period.
d) Reserves for treasury shares (indirectly held via subsidiaries)Reserves for treasury shares are accounted for at the acquisition costs of these shares held by the respective subsidiary.
e) Treasury shares (directly held by the Company)All treasury shares held directly by the Company as of December 31, 2018, were cancelled upon approval by the Annual General Meeting of April 3, 2019, and completion of the share capital reduction process in June 2019. In 2018, treasury shares are carried at acquisition cost and presented as a deduction in shareholders’ equity.
4. Other operating expensesOther operating expenses include directors’ fees of CHF 4.7 million and CHF 4.3 million for the years ended December 31, 2019, and December 31, 2018, respectively. Overhead expenses decreased by CHF 3.2 million to CHF 3.6 million in 2019. In addition, fees paid to the Swiss Financial Market Supervisory Authority of CHF 2.5 million and CHF 3.4 million are included for the years ended December 31, 2019, and December 31, 2018.
5. Financial incomeFinancial income for the year 2019 consists of dividend income of CHF 2,753 million mainly received from the Company’s subsidiary ZIC and interest income of CHF 134.3 million (2018: CHF 91.4 million) on the subordinated loan with ZIC. This interest income is recognized when Zurich Insurance Company Ltd declares its intention to pay a dividend to the Company.
Zurich Insurance GroupAnnual Report 2019 299
Group overview Governance Risk review Financial review
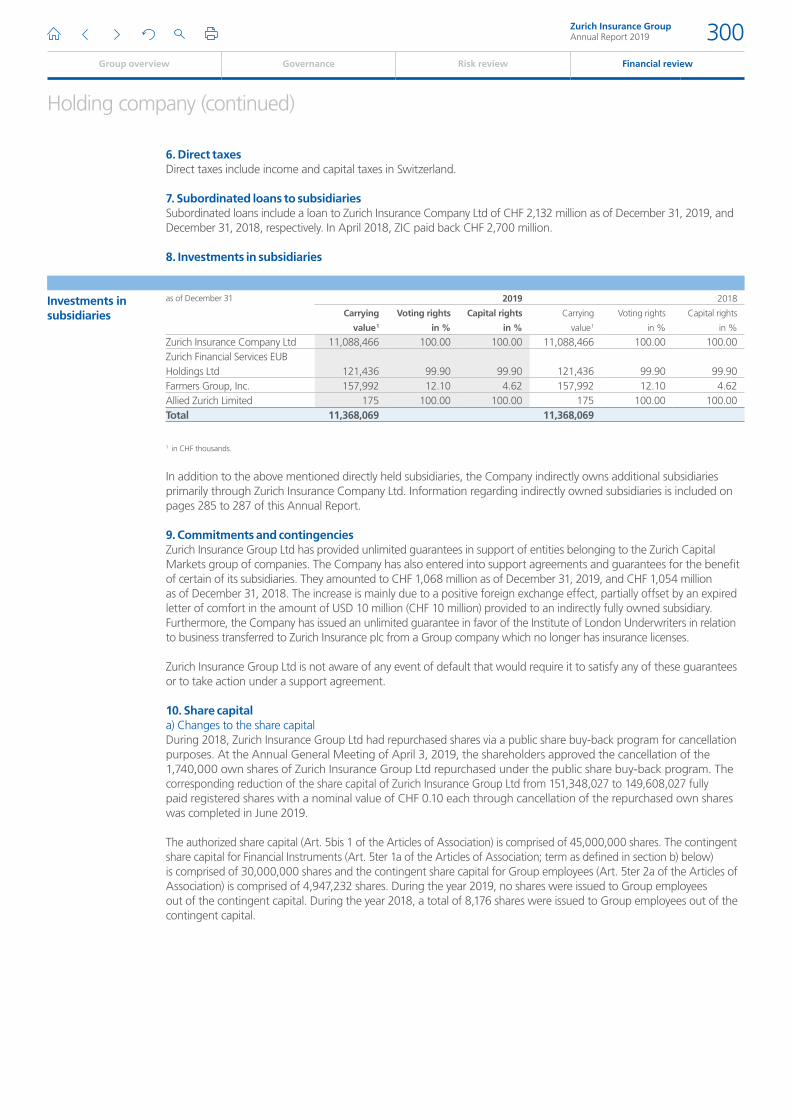
Holding company (continued)
6. Direct taxesDirect taxes include income and capital taxes in Switzerland.
7. Subordinated loans to subsidiariesSubordinated loans include a loan to Zurich Insurance Company Ltd of CHF 2,132 million as of December 31, 2019, and December 31, 2018, respectively. In April 2018, ZIC paid back CHF 2,700 million.
8. Investments in subsidiaries
Investments in subsidiaries
as of December 31 2019 2018
Carrying
value 1
Voting rights
in %
Capital rights
in %
Carrying
value 1
Voting rights
in %
Capital rights
in %
Zurich Insurance Company Ltd 11,088,466 100.00 100.00 11,088,466 100.00 100.00Zurich Financial Services EUB Holdings Ltd 121,436 99.90 99.90 121,436 99.90 99.90Farmers Group, Inc. 157,992 12.10 4.62 157,992 12.10 4.62Allied Zurich Limited 175 100.00 100.00 175 100.00 100.00Total 11,368,069 11,368,069
1 in CHF thousands.
In addition to the above mentioned directly held subsidiaries, the Company indirectly owns additional subsidiaries primarily through Zurich Insurance Company Ltd. Information regarding indirectly owned subsidiaries is included on pages 285 to 287 of this Annual Report.
9. Commitments and contingenciesZurich Insurance Group Ltd has provided unlimited guarantees in support of entities belonging to the Zurich Capital Markets group of companies. The Company has also entered into support agreements and guarantees for the benefit of certain of its subsidiaries. They amounted to CHF 1,068 million as of December 31, 2019, and CHF 1,054 million as of December 31, 2018. The increase is mainly due to a positive foreign exchange effect, partially offset by an expired letter of comfort in the amount of USD 10 million (CHF 10 million) provided to an indirectly fully owned subsidiary. Furthermore, the Company has issued an unlimited guarantee in favor of the Institute of London Underwriters in relation to business transferred to Zurich Insurance plc from a Group company which no longer has insurance licenses.
Zurich Insurance Group Ltd is not aware of any event of default that would require it to satisfy any of these guarantees or to take action under a support agreement.
10. Share capital a) Changes to the share capitalDuring 2018, Zurich Insurance Group Ltd had repurchased shares via a public share buy-back program for cancellation purposes. At the Annual General Meeting of April 3, 2019, the shareholders approved the cancellation of the 1,740,000 own shares of Zurich Insurance Group Ltd repurchased under the public share buy-back program. The corresponding reduction of the share capital of Zurich Insurance Group Ltd from 151,348,027 to 149,608,027 fully paid registered shares with a nominal value of CHF 0.10 each through cancellation of the repurchased own shares was completed in June 2019.
The authorized share capital (Art. 5bis 1 of the Articles of Association) is comprised of 45,000,000 shares. The contingent share capital for Financial Instruments (Art. 5ter 1a of the Articles of Association; term as defined in section b) below) is comprised of 30,000,000 shares and the contingent share capital for Group employees (Art. 5ter 2a of the Articles of Association) is comprised of 4,947,232 shares. During the year 2019, no shares were issued to Group employees out of the contingent capital. During the year 2018, a total of 8,176 shares were issued to Group employees out of the contingent capital.
Zurich Insurance GroupAnnual Report 2019 300
Group overview Governance Risk review Financial review
Holding company (continued)
b) Authorized share capital (as specified in Article 5bis of the Articles of Association)Until April 4, 2020, the Board of Zurich Insurance Group Ltd is authorized to increase the share capital of Zurich Insurance Group Ltd by an amount not exceeding CHF 4,500,000 by issuing up to 45,000,000 fully paid registered shares with a nominal value of CHF 0.10 each. An increase in partial amounts is permitted. The Board would determine the date of issue of any such new shares, the issue price, type of payment, conditions for exercising subscription rights, and the commencement of entitlement to dividends.
The Board may issue such new shares by means of a firm underwriting by a banking institution or syndicate with a subsequent offer of those shares to current shareholders. The Board may allow the expiry of subscription rights which have not been exercised, or it may place these rights as well as shares, the subscription rights of which have not been exercised, at market conditions.
The Board is further authorized to restrict or exclude the subscription rights of shareholders and to allocate them to third parties, Zurich Insurance Group Ltd or one of its Group companies, up to a maximum of 15,000,000 shares, if the shares are to be used:
33 for the take-over of an enterprise, of parts of an enterprise or of participations or for investments by Zurich Insurance Group Ltd or one of its Group companies, or the financing including re-financing of such transactions; or
33 for the purpose of expanding the scope of shareholders in connection with the quotation of shares on foreign stock exchanges or issuance of shares on the national or international capital markets (including private placements to one or more selected investors); or
33 for the conversion of loans, bonds, similar debt instruments, equity-linked instruments or other financial market instruments (collectively, the ‘Financial Instruments’) issued by Zurich Insurance Group Ltd or one of its Group companies; or
33 for the improvement of the regulatory capital position of Zurich Insurance Group Ltd or one of its Group companies in a fast and expeditious manner.
Up to April 4, 2020, the total of new shares issued from (i) authorized share capital where the subscription rights were restricted or excluded, and (ii) contingent share capital in connection with Financial Instruments where the advance subscription rights were restricted or excluded, may not exceed 30,000,000 new shares.
c) Contingent share capital (as specified in Article 5ter of the Articles of Association)Financial InstrumentsThe share capital of Zurich Insurance Group Ltd may be increased by an amount not exceeding CHF 3,000,000 by issuing of up to 30,000,000 fully paid registered shares with a nominal value of CHF 0.10 each by the voluntary or mandatory exercise of conversion and/or option rights which are granted in connection with the issuance of Financial Instruments by Zurich Insurance Group Ltd or one of its Group companies or by mandatory conversion of Financial Instruments issued by the Zurich Insurance Group Ltd or one of its Group companies, that allow for contingent mandatory conversion into shares of Zurich Insurance Group Ltd, or by exercising option rights which are granted to the shareholders. The subscription rights are excluded. The then-current owners of the Financial Instruments shall be entitled to subscribe for the new shares. The conversion and/or option conditions are to be determined by the Board.
The Board is authorized, when issuing Financial Instruments to restrict or exclude the advance subscription rights in cases where they are issued:
33 for the financing including re-financing of a take-over of an enterprise, of parts of an enterprise, or of participations or of investments by Zurich Insurance Group Ltd or one of its Group companies; or
33 on national or international capital markets (including private placements to one or more selected investors); or
33 for the improvement of the regulatory capital position of Zurich Insurance Group Ltd or one of its Group companies in a fast and expeditious manner.
If the advance subscription rights are restricted or excluded by a resolution of the Board, the following applies: the Financial Instruments are to be issued at prevailing market conditions (including standard dilution protection clauses in accordance with market practice) and the setting of the conversion or issue price of the new shares must take due account of the stock market price of the shares and/or comparable instruments priced by the market at the time of issue or time of conversion.
The conversion rights may be exercisable during a maximum of ten years and option rights during a maximum of seven years from the time of the respective issue; contingent conversion features may remain in place indefinitely.
Zurich Insurance GroupAnnual Report 2019 301
Group overview Governance Risk review Financial review
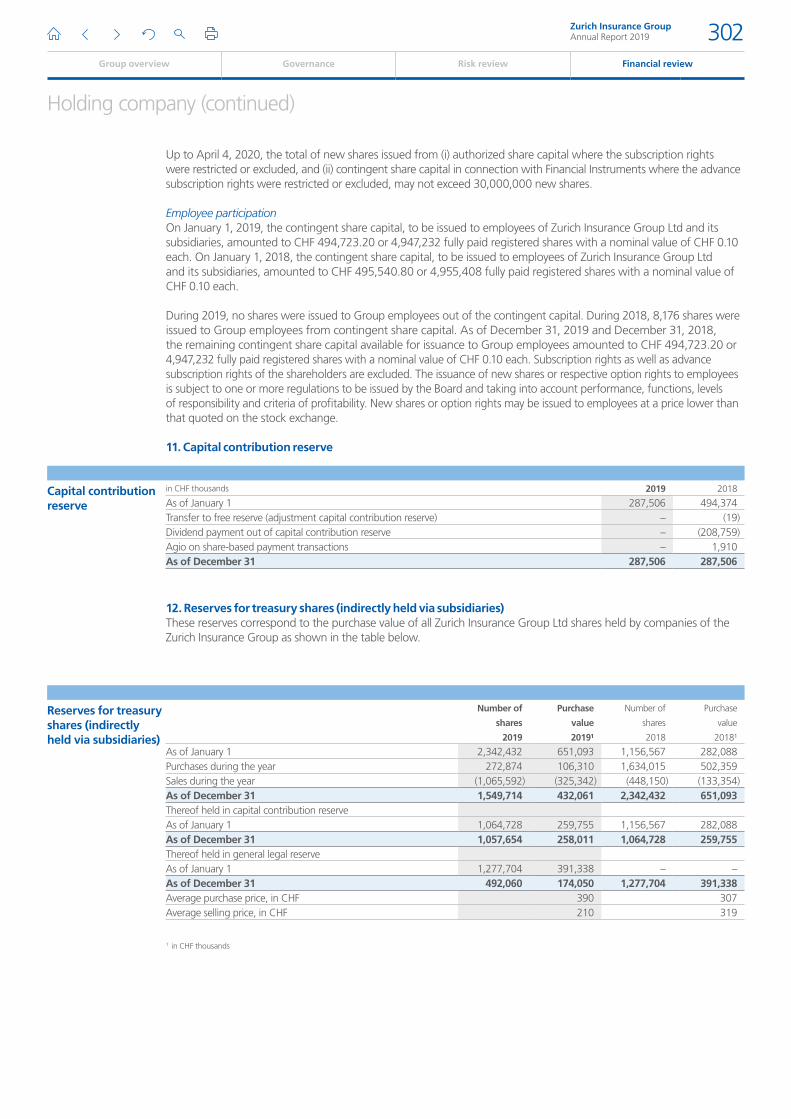
Holding company (continued)
Up to April 4, 2020, the total of new shares issued from (i) authorized share capital where the subscription rights were restricted or excluded, and (ii) contingent share capital in connection with Financial Instruments where the advance subscription rights were restricted or excluded, may not exceed 30,000,000 new shares.
Employee participationOn January 1, 2019, the contingent share capital, to be issued to employees of Zurich Insurance Group Ltd and its subsidiaries, amounted to CHF 494,723.20 or 4,947,232 fully paid registered shares with a nominal value of CHF 0.10 each. On January 1, 2018, the contingent share capital, to be issued to employees of Zurich Insurance Group Ltd and its subsidiaries, amounted to CHF 495,540.80 or 4,955,408 fully paid registered shares with a nominal value of CHF 0.10 each.
During 2019, no shares were issued to Group employees out of the contingent capital. During 2018, 8,176 shares were issued to Group employees from contingent share capital. As of December 31, 2019 and December 31, 2018, the remaining contingent share capital available for issuance to Group employees amounted to CHF 494,723.20 or 4,947,232 fully paid registered shares with a nominal value of CHF 0.10 each. Subscription rights as well as advance subscription rights of the shareholders are excluded. The issuance of new shares or respective option rights to employees is subject to one or more regulations to be issued by the Board and taking into account performance, functions, levels of responsibility and criteria of profitability. New shares or option rights may be issued to employees at a price lower than that quoted on the stock exchange.
11. Capital contribution reserve
Capital contribution reserve
in CHF thousands 2019 2018
As of January 1 287,506 494,374Transfer to free reserve (adjustment capital contribution reserve) – (19)Dividend payment out of capital contribution reserve – (208,759)Agio on share-based payment transactions – 1,910As of December 31 287,506 287,506
12. Reserves for treasury shares (indirectly held via subsidiaries)These reserves correspond to the purchase value of all Zurich Insurance Group Ltd shares held by companies of the Zurich Insurance Group as shown in the table below.
Reserves for treasury shares (indirectly held via subsidiaries)
Number of
shares
2019
Purchase
value
2019¹
Number of
shares
2018
Purchase
value
2018¹
As of January 1 2,342,432 651,093 1,156,567 282,088Purchases during the year 272,874 106,310 1,634,015 502,359Sales during the year (1,065,592) (325,342) (448,150) (133,354)As of December 31 1,549,714 432,061 2,342,432 651,093Thereof held in capital contribution reserveAs of January 1 1,064,728 259,755 1,156,567 282,088As of December 31 1,057,654 258,011 1,064,728 259,755Thereof held in general legal reserveAs of January 1 1,277,704 391,338 – –As of December 31 492,060 174,050 1,277,704 391,338Average purchase price, in CHF 390 307Average selling price, in CHF 210 319
1 in CHF thousands
Zurich Insurance GroupAnnual Report 2019 302
Group overview Governance Risk review Financial review
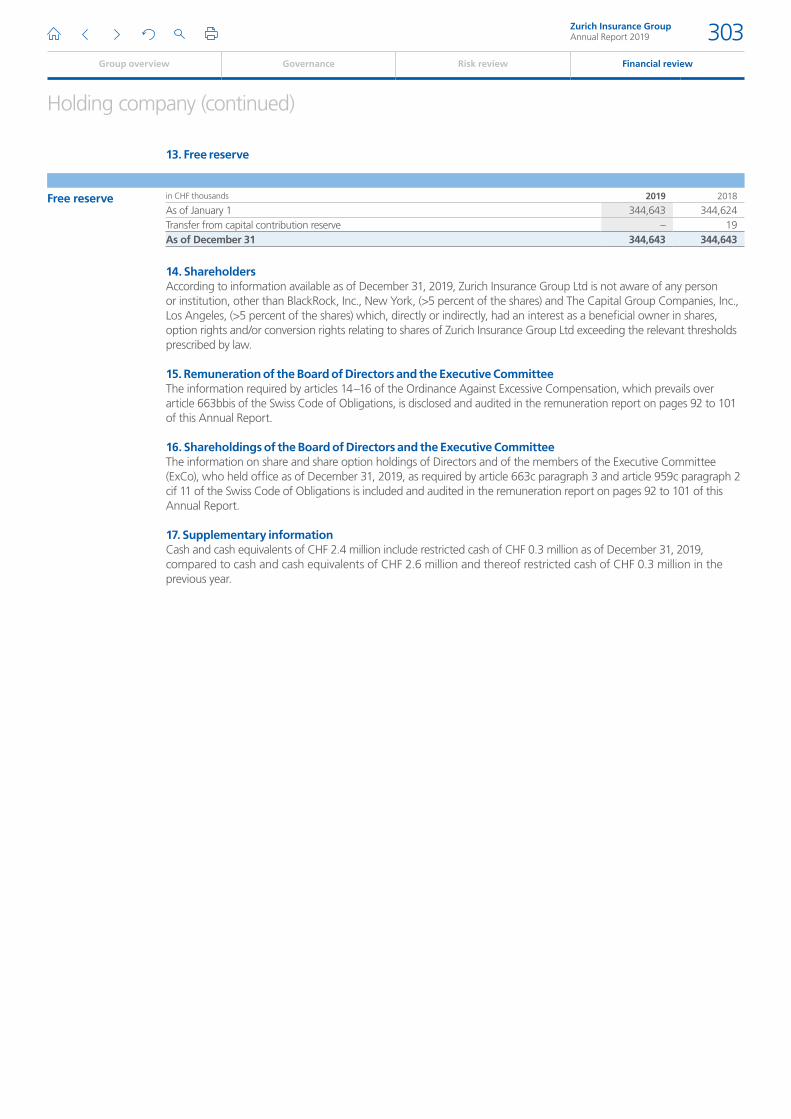
Holding company (continued)
13. Free reserve
Free reserve in CHF thousands 2019 2018
As of January 1 344,643 344,624Transfer from capital contribution reserve – 19As of December 31 344,643 344,643
14. ShareholdersAccording to information available as of December 31, 2019, Zurich Insurance Group Ltd is not aware of any person or institution, other than BlackRock, Inc., New York, (>5 percent of the shares) and The Capital Group Companies, Inc., Los Angeles, (>5 percent of the shares) which, directly or indirectly, had an interest as a beneficial owner in shares, option rights and/or conversion rights relating to shares of Zurich Insurance Group Ltd exceeding the relevant thresholds prescribed by law.
15. Remuneration of the Board of Directors and the Executive CommitteeThe information required by articles 14 –16 of the Ordinance Against Excessive Compensation, which prevails over article 663bbis of the Swiss Code of Obligations, is disclosed and audited in the remuneration report on pages 92 to 101 of this Annual Report.
16. Shareholdings of the Board of Directors and the Executive CommitteeThe information on share and share option holdings of Directors and of the members of the Executive Committee (ExCo), who held office as of December 31, 2019, as required by article 663c paragraph 3 and article 959c paragraph 2 cif 11 of the Swiss Code of Obligations is included and audited in the remuneration report on pages 92 to 101 of this Annual Report.
17. Supplementary informationCash and cash equivalents of CHF 2.4 million include restricted cash of CHF 0.3 million as of December 31, 2019, compared to cash and cash equivalents of CHF 2.6 million and thereof restricted cash of CHF 0.3 million in the previous year.
Zurich Insurance GroupAnnual Report 2019 303
Group overview Governance Risk review Financial review
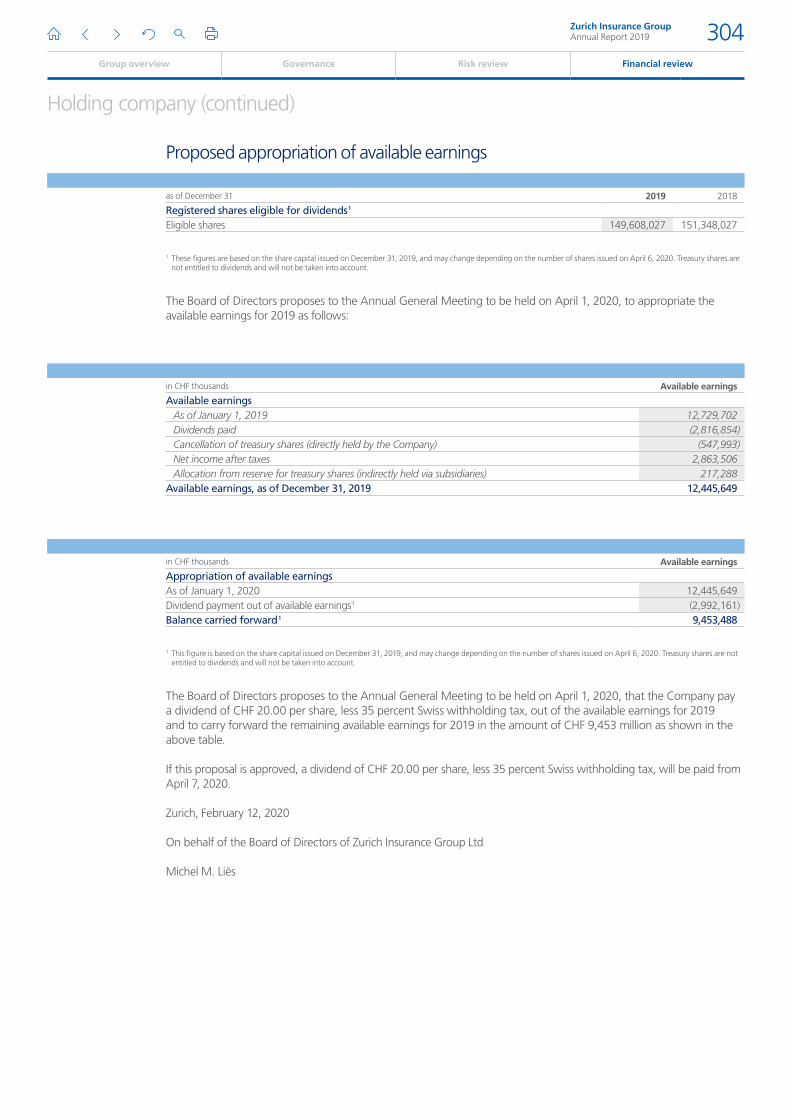
Holding company (continued)
Proposed appropriation of available earnings
as of December 31 2019 2018
Registered shares eligible for dividends 1
Eligible shares 149,608,027 151,348,027
1 These figures are based on the share capital issued on December 31, 2019, and may change depending on the number of shares issued on April 6, 2020. Treasury shares are not entitled to dividends and will not be taken into account.
The Board of Directors proposes to the Annual General Meeting to be held on April 1, 2020, to appropriate the available earnings for 2019 as follows:
in CHF thousands Available earnings
Available earningsAs of January 1, 2019 12,729,702Dividends paid (2,816,854)Cancellation of treasury shares (directly held by the Company) (547,993)Net income after taxes 2,863,506Allocation from reserve for treasury shares (indirectly held via subsidiaries) 217,288
Available earnings, as of December 31, 2019 12,445,649
in CHF thousands Available earnings
Appropriation of available earningsAs of January 1, 2020 12,445,649Dividend payment out of available earnings 1 (2,992,161)Balance carried forward 1 9,453,488
1 This figure is based on the share capital issued on December 31, 2019, and may change depending on the number of shares issued on April 6, 2020. Treasury shares are not entitled to dividends and will not be taken into account.
The Board of Directors proposes to the Annual General Meeting to be held on April 1, 2020, that the Company pay a dividend of CHF 20.00 per share, less 35 percent Swiss withholding tax, out of the available earnings for 2019 and to carry forward the remaining available earnings for 2019 in the amount of CHF 9,453 million as shown in the above table.
If this proposal is approved, a dividend of CHF 20.00 per share, less 35 percent Swiss withholding tax, will be paid from April 7, 2020.
Zurich, February 12, 2020
On behalf of the Board of Directors of Zurich Insurance Group Ltd
Michel M. Liès
Zurich Insurance GroupAnnual Report 2019 304
Group overview Governance Risk review Financial review

THIS PAGE HAS INTENTIONALLY BEEN LEFT BLANK
Zurich Insurance GroupAnnual Report 2019 305
Group overview Governance Risk review Financial review
Report of the statutory auditor
Report of the statutory auditor
to the General Meeting of Zurich Insurance Group Ltd, Zurich
Report on the audit of the financial statements
OpinionWe have audited the financial statements of Zurich Insurance Group Ltd (the Company), which comprise the income statement for the year ended December 31, 2019, balance sheet as of December 31, 2019, and notes, including a summary of significant accounting policies.
In our opinion, the accompanying financial statements (pages 297 to 303) as of December 31, 2019 comply with Swiss law and the Company’s articles of association.
Basis for opinionWe conducted our audit in accordance with Swiss law and Swiss Auditing Standards. Our responsibilities under those provisions and standards are further described in the “Auditor’s responsibilities for the audit of the financial statements” section of our report.
We are independent of the entity in accordance with the provisions of Swiss law and the requirements of the Swiss audit profession and we have fulfilled our other ethical responsibilities in accordance with these requirements. We believe that the audit evidence we have obtained is sufficient and appropriate to provide a basis for our opinion.
Our audit approach
Auditmateriality
Audit scope
Key auditmatters
Overall audit materiality: CHF 135 million
We tailored the scope of our audit in order to perform sufficient work to enable us to provide an opinion on the financial statements as a whole, taking into account the structure of the entity, the accounting processes and controls, and the industry in which the entity operates.
As key audit matter the following area of focus has been identified:
Recoverability of carrying value of investments in subsidiaries
Overview
Zurich Insurance GroupAnnual Report 2019 306
Group overview Governance Risk review Financial review
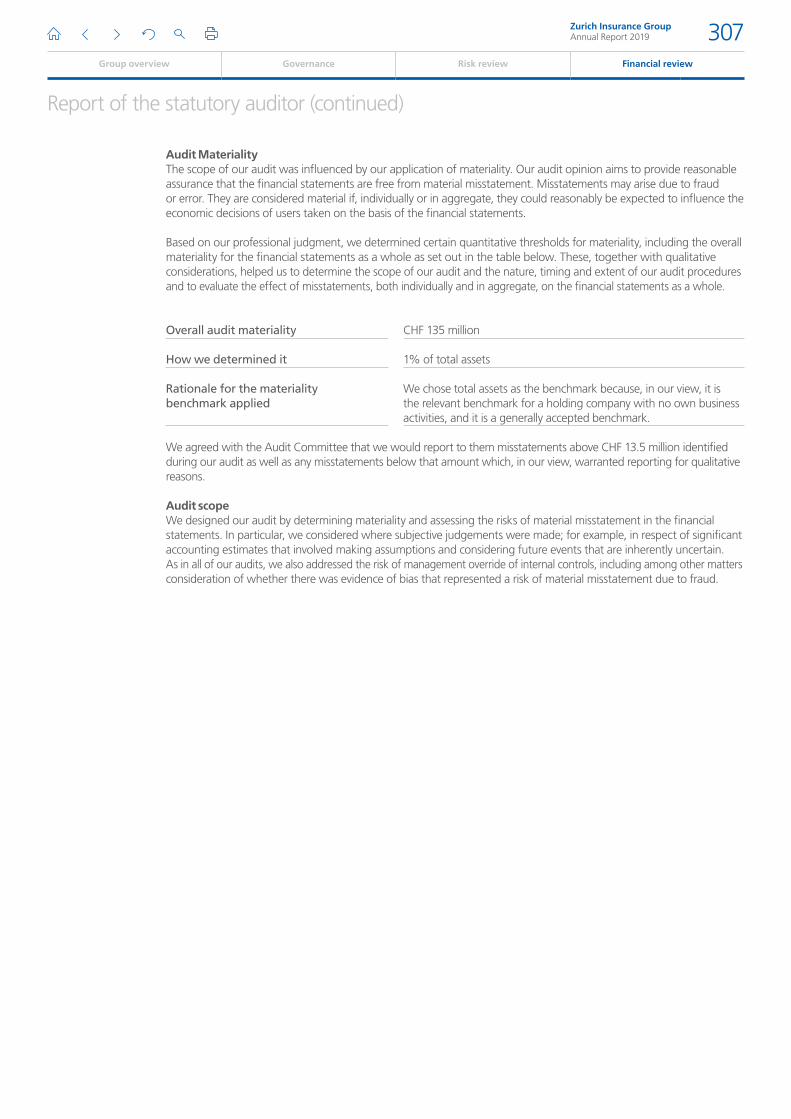
Report of the statutory auditor (continued)
Audit MaterialityThe scope of our audit was influenced by our application of materiality. Our audit opinion aims to provide reasonable assurance that the financial statements are free from material misstatement. Misstatements may arise due to fraud or error. They are considered material if, individually or in aggregate, they could reasonably be expected to influence the economic decisions of users taken on the basis of the financial statements.
Based on our professional judgment, we determined certain quantitative thresholds for materiality, including the overall materiality for the financial statements as a whole as set out in the table below. These, together with qualitative considerations, helped us to determine the scope of our audit and the nature, timing and extent of our audit procedures and to evaluate the effect of misstatements, both individually and in aggregate, on the financial statements as a whole.
Overall audit materiality
How we determined it
Rationale for the materiality benchmark applied
CHF 135 million
1% of total assets
We chose total assets as the benchmark because, in our view, it is the relevant benchmark for a holding company with no own business activities, and it is a generally accepted benchmark.
We agreed with the Audit Committee that we would report to them misstatements above CHF 13.5 million identified during our audit as well as any misstatements below that amount which, in our view, warranted reporting for qualitative reasons.
Audit scopeWe designed our audit by determining materiality and assessing the risks of material misstatement in the financial statements. In particular, we considered where subjective judgements were made; for example, in respect of significant accounting estimates that involved making assumptions and considering future events that are inherently uncertain. As in all of our audits, we also addressed the risk of management override of internal controls, including among other matters consideration of whether there was evidence of bias that represented a risk of material misstatement due to fraud.
Zurich Insurance GroupAnnual Report 2019 307
Group overview Governance Risk review Financial review
Report of the statutory auditor (continued)
Report on key audit matters based on the circular 1/2015 of the Federal Audit Oversight AuthorityKey audit matters are those matters that, in our professional judgement, were of most significance in our audit of the financial statements of the current period. These matters were addressed in the context of our audit of the financial statements as a whole, and in forming our opinion thereon, and we do not provide a separate opinion on these matters.
Recoverability of carrying value of investments in subsidiaries
Key audit matter
We consider the investments in subsidiaries to be a key audit matter not only due to the judgment involved but also based on the magnitude of CHF 11.4 billion, which makes up more than 83% of the Company’s total assets.
Investments in subsidiaries are carried at cost less necessary impairments and valued on an individual basis.
Management assesses whether there are any impairments in the carrying value of the investments in subsidiaries. The determination whether an investment in subsidiary needs to be impaired includes assumptions about the profitability of the underlying business and growth, which involves management’s judgment.
We refer to note 3, para b) (“Summary of significant accounting policies”) and note 8 (“Investments in subsidiaries”) to the financial statements 2019.
How our audit addressed the key audit matter
We obtained an understanding of management’s process and controls, and assessed and tested the design and operating effectiveness of a selected key control over the recoverability of the carrying value of investments in subsidiaries.
In relation to the particular matters set out opposite, our testing procedures included the following:
– Assessed the appropriateness of the Company’s impairment testing methodology.
– Tested the mathematical accuracy of management’s calculations.
– Tested the reasonableness of the assumptions used in the impairment assessment including projections of future income, terminal growth rate assumptions and discount rates.
– Re-performed management’s impairment test on the carrying value of each investment in subsidiary, and challenged the impairment decisions taken.
Based on the work performed we consider management’s impairment testing including the assumptions used to support the carrying value of investments in subsidiaries as reasonable.
Zurich Insurance GroupAnnual Report 2019 308
Group overview Governance Risk review Financial review
Report of the statutory auditor (continued)
Responsibilities of the Board of Directors for the financial statementsThe Board of Directors is responsible for the preparation of the financial statements in accordance with the provisions of Swiss law and the Company’s articles of association, and for such internal control as the Board of Directors determines is necessary to enable the preparation of financial statements that are free from material misstatement, whether due to fraud or error.
In preparing the financial statements, the Board of Directors is responsible for assessing the entity’s ability to continue as a going concern, disclosing, as applicable, matters related to going concern and using the going concern basis of accounting unless the Board of Directors either intends to liquidate the entity or to cease operations, or has no realistic alternative but to do so.
Auditor’s responsibilities for the audit of the financial statementsOur objectives are to obtain reasonable assurance about whether the financial statements as a whole are free from material misstatement, whether due to fraud or error, and to issue an auditor’s report that includes our opinion. Reasonable assurance is a high level of assurance, but is not a guarantee that an audit conducted in accordance with Swiss law and Swiss Auditing Standards will always detect a material misstatement when it exists. Misstatements can arise from fraud or error and are considered material if, individually or in the aggregate, they could reasonably be expected to influence the economic decisions of users taken on the basis of these financial statements.
A further description of our responsibilities for the audit of the financial statements is located at the website of EXPERTsuisse: http://expertsuisse.ch/en/audit-report-for-public-companies. This description forms part of our auditor’s report.
Report on other legal and regulatory requirementsIn accordance with article 728a paragraph 1 item 3 CO and Swiss Auditing Standard 890, we confirm that an internal control system exists which has been designed for the preparation of financial statements according to the instructions of the Board of Directors.
We further confirm that the proposed appropriation of available earnings complies with Swiss law and the Company’s articles of association. We recommend that the financial statements submitted to you be approved.
PricewaterhouseCoopers AG
Mark Humphreys Ray Kunz Audit expert Audit expert Auditor in charge
Zurich, February 12, 2020
Zurich Insurance GroupAnnual Report 2019 309
Group overview Governance Risk review Financial review
Glossary (continued)
Zurich Insurance GroupAnnual Report 2019 1
Group
Book value per shareis a measure that is calculated by dividing shareholders’ equity by the number of shares issued less the number of treasury shares as of the period end.
Business operating profit (BOP)is the Group’s internal performance measure, on which the Group manages all of its business units. It indicates the underlying performance, after non-controlling interests, by eliminating the impact of financial market volatility and other non-operational variables. BOP reflects adjustments for shareholders’ taxes, net capital gains/(losses) and impairments on investments (except for certain non-insurance operations included in Non-Core Businesses, investments in hedge funds as at fair value through profit or loss, certain securities held for specific economic hedging purposes and policyholders’ share of investment results for the life businesses) and non- operational foreign exchange movements. Significant items arising from special circumstances, including restructuring charges, legal matters or large one-off regulatory projects outside the ordinary course of business, gains and losses on divestment of businesses, certain business combination integration costs and impairments of goodwill are also excluded from BOP. Business operating profit before interest, depreciation and amortization (BOPBIDA) excludes interest expense on debt, depreciation and impairments of property and equipment and amortization and impairments of intangible assets. BOPBIDA includes amortization of deferred policy acquisition costs, deferred origination costs and distribution agreements. Please refer to the ‘consolidated financial statements, Note 27. Segment information, Table 27.4’ for further information.
Business operating profit (after-tax) return on shareholders’ equity (BOPAT ROE)indicates the level of BOP relative to resources provided by shareholders. It is calculated as BOP, annualized on a linear basis and adjusted for taxes, divided by the average value of shareholders’ equity, adjusted for net unrealized gains/(losses) on available-for-sale investments and cash flow hedges, using the value at the beginning and end of each quarter within the period. The average shareholders’ equity for each quarter is then added together and divided by the number of quarters. If the dividend is approved at the Annual General Meeting within the first ten working days in April, then the dividend is deducted from the second quarter opening shareholders’ equity. Please refer to the ‘supplementary information (unaudited)/ROE, EPS and BVPS’ for further information.
Cash remittancesis the net extraction of capital from each of the business units (P&C, Life, Farmers and Non-Core Business) to Group Functions & Operations (GF&O) and after all central costs in GF&O. Cash remittances are typically extracted from subsidiaries by way of dividends, capital reductions, repayment of intragroup debt and reinsurance profits.
InvestmentsTotal investments in the consolidated balance sheets include Group investments and investments for unit-linked contracts. Group investments are those for which the Group bears part or all of the investment risk. They also include investments related to investment contracts with discretionary participation features. Average invested assets include investment cash, but exclude cash collateral received for securities lending. The Group manages its diversified investment portfolio to optimize benefits for both shareholders and policyholders while ensuring compliance with local regulatory and business requirements under the guidance of the Group’s Asset/Liability Management and Investment Committee. Investments for unit-linked contracts include investments where the policyholder bears the investment risk, and are held for liabilities related to unit-linked investment contracts and reserves for unit-linked contracts. They are managed in accordance with the investment objectives of each unit-linked fund. The investment result for unit-linked products is passed to policyholders through a charge to policyholder dividends and participation in profits.
Like-for-likeis the change in the underlying metric over a period of time and after removing the impact of foreign exchange movements and the impact of acquisitions and disposals.
Net savingsare based on savings calculated on the total direct cash expenses of the Group including unallocated loss adjustment expenses (ULAE) after allowance for inflation and incremental investment.
Return on shareholders’ equity (ROE)is a measure that indicates the level of profit or loss relative to resources provided by shareholders. It is calculated as net income after taxes attributable to shareholders, annualized on a linear basis, divided by the average value of shareholders’ equity, adjusted for net unrealized gains/(losses) on available-for-sale investments and cash flow hedges, using the value at the beginning and end of each quarter within the period. The average shareholders’ equity for each quarter is then added together and divided by the number of quarters. If the dividend is approved at the Annual General Meeting within the first ten working days in April, then the dividend is deducted from the second quarter opening shareholders’ equity. Please refer to the ‘supplementary information (unaudited)/ROE, EPS and BVPS’ for further information.
Zurich Economic Capital Model (Z-ECM)is an internal economic capital model which defines the Z-ECM capital required to protect the Group’s policyholders in order to meet all of their claims with a confidence level of 99.95 percent over a one-year time horizon. The Z-ECM ratio is defined as the ratio of the Group’s available financial resources defined under the Z-ECM to the required capital under the Z-ECM model. Please refer to the ‘Annual Report/risk review’ for further information.
Q4_2019_Glossary_online_en.indd 1 27.02.2020 13:12:56
Glossary
Zurich Insurance GroupAnnual Report 2019 310
Group overview Governance Risk review Financial review
Glossary
Glossary (continued)
Zurich Insurance GroupAnnual Report 2019 1
Group
Book value per shareis a measure that is calculated by dividing shareholders’ equity by the number of shares issued less the number of treasury shares as of the period end.
Business operating profit (BOP)is the Group’s internal performance measure, on which the Group manages all of its business units. It indicates the underlying performance, after non-controlling interests, by eliminating the impact of financial market volatility and other non-operational variables. BOP reflects adjustments for shareholders’ taxes, net capital gains/(losses) and impairments on investments (except for certain non-insurance operations included in Non-Core Businesses, investments in hedge funds as at fair value through profit or loss, certain securities held for specific economic hedging purposes and policyholders’ share of investment results for the life businesses) and non- operational foreign exchange movements. Significant items arising from special circumstances, including restructuring charges, legal matters or large one-off regulatory projects outside the ordinary course of business, gains and losses on divestment of businesses, certain business combination integration costs and impairments of goodwill are also excluded from BOP. Business operating profit before interest, depreciation and amortization (BOPBIDA) excludes interest expense on debt, depreciation and impairments of property and equipment and amortization and impairments of intangible assets. BOPBIDA includes amortization of deferred policy acquisition costs, deferred origination costs and distribution agreements. Please refer to the ‘consolidated financial statements, Note 27. Segment information, Table 27.4’ for further information.
Business operating profit (after-tax) return on shareholders’ equity (BOPAT ROE)indicates the level of BOP relative to resources provided by shareholders. It is calculated as BOP, annualized on a linear basis and adjusted for taxes, divided by the average value of shareholders’ equity, adjusted for net unrealized gains/(losses) on available-for-sale investments and cash flow hedges, using the value at the beginning and end of each quarter within the period. The average shareholders’ equity for each quarter is then added together and divided by the number of quarters. If the dividend is approved at the Annual General Meeting within the first ten working days in April, then the dividend is deducted from the second quarter opening shareholders’ equity. Please refer to the ‘supplementary information (unaudited)/ROE, EPS and BVPS’ for further information.
Cash remittancesis the net extraction of capital from each of the business units (P&C, Life, Farmers and Non-Core Business) to Group Functions & Operations (GF&O) and after all central costs in GF&O. Cash remittances are typically extracted from subsidiaries by way of dividends, capital reductions, repayment of intragroup debt and reinsurance profits.
InvestmentsTotal investments in the consolidated balance sheets include Group investments and investments for unit-linked contracts. Group investments are those for which the Group bears part or all of the investment risk. They also include investments related to investment contracts with discretionary participation features. Average invested assets include investment cash, but exclude cash collateral received for securities lending. The Group manages its diversified investment portfolio to optimize benefits for both shareholders and policyholders while ensuring compliance with local regulatory and business requirements under the guidance of the Group’s Asset/Liability Management and Investment Committee. Investments for unit-linked contracts include investments where the policyholder bears the investment risk, and are held for liabilities related to unit-linked investment contracts and reserves for unit-linked contracts. They are managed in accordance with the investment objectives of each unit-linked fund. The investment result for unit-linked products is passed to policyholders through a charge to policyholder dividends and participation in profits.
Like-for-likeis the change in the underlying metric over a period of time and after removing the impact of foreign exchange movements and the impact of acquisitions and disposals.
Net savingsare based on savings calculated on the total direct cash expenses of the Group including unallocated loss adjustment expenses (ULAE) after allowance for inflation and incremental investment.
Return on shareholders’ equity (ROE)is a measure that indicates the level of profit or loss relative to resources provided by shareholders. It is calculated as net income after taxes attributable to shareholders, annualized on a linear basis, divided by the average value of shareholders’ equity, adjusted for net unrealized gains/(losses) on available-for-sale investments and cash flow hedges, using the value at the beginning and end of each quarter within the period. The average shareholders’ equity for each quarter is then added together and divided by the number of quarters. If the dividend is approved at the Annual General Meeting within the first ten working days in April, then the dividend is deducted from the second quarter opening shareholders’ equity. Please refer to the ‘supplementary information (unaudited)/ROE, EPS and BVPS’ for further information.
Zurich Economic Capital Model (Z-ECM)is an internal economic capital model which defines the Z-ECM capital required to protect the Group’s policyholders in order to meet all of their claims with a confidence level of 99.95 percent over a one-year time horizon. The Z-ECM ratio is defined as the ratio of the Group’s available financial resources defined under the Z-ECM to the required capital under the Z-ECM model. Please refer to the ‘Annual Report/risk review’ for further information.
Q4_2019_Glossary_online_en.indd 1 27.02.2020 13:12:56
Glossary (continued)
Zurich Insurance GroupAnnual Report 2019 2
Property & Casualty
The following Property & Casualty (P&C) measures are net of reinsurance.
Net underwriting resultis calculated as the difference between net earned premiums and policy fees and the sum of net insurance benefits and losses and net technical expenses. Please refer to the ‘supplementary information (unaudited)/P&C by segment & customer units’ for further information.
Total net technical expensesincludes underwriting and policy acquisition costs, as well as the technical elements of administrative and other operating expenses, amortization of intangible assets, interest credited to policyholders and other interest, and other income. Please refer to the ‘supplementary information (unaudited)/P&C by segment & customer units’ for further information.
Combined ratiois a performance measure that indicates the level of claims and net technical expenses during the period, relative to net earned premiums and policy fees. It is calculated as the sum of the loss ratio and the expense ratio. Please refer to the ‘supplementary information (unaudited)/P&C by segment & customer units’ for further information.
Loss ratiois a performance measure that indicates the level of claims during the period relative to net earned premiums and policy fees. It is calculated as insurance benefits and losses net, which include paid claims, claims incurred but not reported (IBNR) and claims handling costs, divided by net earned premiums and policy fees. Please refer to the ‘supplementary information (unaudited)/P&C by segment & customer units’ for further information.
Expense ratiois a performance measure that indicates the level of technical expenses during the period relative to net earned premiums and policy fees. It is calculated as the sum of net technical expenses and policyholder dividends and participation in profits, divided by net earned premiums and policy fees. Please refer to the ‘Supplementary information (unaudited)/P&C by segment & customer units’ for further information.
Net non-technical resultincludes expenses or income not directly linked to insurance operating performance, such as gains/losses on foreign currency translation and interest expense on debt. It includes the impact of financial market volatility and other non-operational variables that distort the ongoing business performance. Please refer to the ‘supplementary information (unaudited)/P&C by segment & customer units’ for further information.
Life
Embedded value (EV) principlesis a methodology using a ‘bottom-up’ market consistent approach, which explicitly allows for market risk. In particular, asset and liability cash flows are valued using risk discount rates consistent with those applied to similar cash flows in the capital markets. Options and guarantees are valued using market consistent models calibrated to observable market prices. Please refer to the ‘embedded value report/embedded value methodology’ for further information.
Insurance depositsare deposits, similar to customer account balances, not recorded as revenues. However, the fees charged on insurance deposits are recorded as revenue within gross written premiums and policy fees. These deposits arise from investment contracts and insurance contracts that are accounted for under deposit accounting. They represent the pure savings part, which is invested.
New business annual premium equivalent (APE)is a sales index that reflects the volume of life new business sales during the period. APE is calculated as the value of new annual premiums plus 10 percent of new single premiums sold in the period and is stated before the effect of non-controlling interests. Present value of new business premiums (PVNBP) is calculated as the present value of new business premiums discounted at the risk-free rate, before the effect of non-controlling interests.
New business margin (NBM)is a measure that reflects the profitability of new business and is calculated as the new business value divided by APE after the effect of non-controlling interests.
New business value (NBV), after taxis a measure that reflects the value added by new business written during the period, including allowances for frictional costs, time value of options and guarantees, and the cost of non-market risk, and is valued at the point of sale. It is calculated as the present value of the projected after-tax profit from life insurance contracts sold during the period using a valuation methodology consistent with the EV principles, after the effect of non-controlling interests.
Q4_2019_Glossary_online_en.indd 2 27.02.2020 13:12:56
Zurich Insurance GroupAnnual Report 2019 311
Group overview Governance Risk review Financial review
Glossary (continued)
Glossary (continued)
Zurich Insurance GroupAnnual Report 2019 3
Farmers
Gross management resultis a performance measure of Farmers Management Services calculated as management fees and other related revenues minus management and other related expenses, including amortization and impairments of intangible assets. Please refer to the ‘supplementary information (unaudited)/Farmers’ for further information.
Managed gross earned premium marginis a performance measure calculated as the gross operating profit of Farmers Management Services divided by the gross earned premiums of the Farmers Exchanges, which are owned by their policyholders. Farmers Group, Inc., a wholly owned subsidiary of the Group, provides certain non-claims services and ancillary services to the Farmers Exchanges.
Q4_2019_Glossary_online_en.indd 3 27.02.2020 13:12:56
Zurich Insurance GroupAnnual Report 2019 312
Group overview Governance Risk review Financial review
Glossary (continued)
Contact information
For more information please contact the appropriate office below, or visit our website at www.zurich.com
Registered OfficeZurich Insurance Group Ltd Mythenquai 2 8002 Zurich, Switzerland
Media RelationsZurich Insurance Group Ltd, Switzerland Telephone: +41 (0)44 625 21 00 Email: [email protected]
Investor RelationsZurich Insurance Group Ltd, Switzerland Telephone: +41 (0)44 625 22 99 Email: [email protected]
Share Register ServicesZurich Insurance Group Ltd, Switzerland Telephone: +41 (0)44 625 22 55 Email: [email protected] Website: www.zurich.com/shareholder-area
SustainabilityZurich Insurance Group Ltd, Switzerland Email: [email protected]
Financial calendar
For more information see page 25 of this report or website: www.zurich.com/en/investor-relations/calendar
ImprintThe Annual Report is published in English and German, with the financial statements in English only. In the event of inconsistencies in the German translation, the English original version shall prevail.
Our reporting consists of the Annual Report, which is divided into the Group overview, the governance, the risk review and the financial review, and which contains the annual financial statements (Holding Company) and the consolidated financial statements. With regards to content, the management report as per the Articles of Association consists of the aforementioned reports excluding the remuneration report.
Design by Radley Yeldar, www.ry.com
Photography: cover, pages 2, 4, 20, 38, 90, 126, 164, 176, Jorma Müller; page 6, José Bernad; pages 10–11, Getty; pages 12–13, Ruben Sprich; pages 13, 19, 21, 22, 24, 27, 29, Daniel Bürgisser; pages 14–15, Belinda Mason; pages 16–17, Stephan Birrer; page 23, John H. Sauer; page 26, Michael Szoenyi; page 28, Zurich Colombia.
Layout: NeidhartSchön AG, Zurich, www.neidhartschoen.ch
Publishing system: ns.publish by mms solutions AG, Zurich, www.mmssolutions.io
Disclaimer and cautionary statementCertain statements in this document are forward-looking statements, including, but not limited to, statements that are predictions of or indicate future events, trends, plans or objectives of Zurich Insurance Group Ltd or the Zurich Insurance Group (the Group). Forward-looking statements include statements regarding the Group’s targeted profit, return on equity targets, expenses, pricing conditions, dividend policy and underwriting and claims results, as well as statements regarding the Group’s understanding of general economic, financial and insurance market conditions and expected developments. Undue reliance should not be placed on such statements because, by their nature, they are subject to known and unknown risks and uncertainties and can be affected by other factors that could cause actual results and plans and objectives of Zurich Insurance Group Ltd or the Group to differ materially from those expressed or implied in the forward-looking statements (or from past results). Factors such as (i) general economic conditions and competitive factors, particularly in key markets; (ii) the risk of a global economic downturn; (iii) performance of financial markets; (iv) levels of interest rates and currency exchange rates; (v) frequency, severity and development of insured claims events; (vi) mortality and morbidity experience; (vii) policy renewal and lapse rates; and (viii) changes in laws and regulations and in the policies of regulators may have a direct bearing on the results of operations of Zurich Insurance Group Ltd and its Group and on whether the targets will be achieved. Zurich Insurance Group Ltd undertakes no obligation to publicly update or revise any of these forward-looking statements, whether to reflect new information, future events or circumstances or otherwise.
All references to ‘Farmers Exchanges’ mean Farmers Insurance Exchange, Fire Insurance Exchange, Truck Insurance Exchange and their subsidiaries and affiliates. The three Exchanges are California domiciled interinsurance exchanges owned by their policyholders with governance oversight by their Boards of Governors. Farmers Group, Inc. and its subsidiaries are appointed as the attorneys-in-fact for the Farmers Exchanges and in that capacity provide certain non-claims services and ancillary services to the Farmers Exchanges. Neither Farmers Group, Inc., nor its parent companies, Zurich Insurance Company Ltd and Zurich Insurance Group Ltd, have any ownership interest in the Farmers Exchanges. Financial information about the Farmers Exchanges is proprietary to the Farmers Exchanges, but is provided to support an understanding of the performance of Farmers Group, Inc. and Farmers Reinsurance Company.
It should be noted that past performance is not a guide to future performance. Please also note that interim results are not necessarily indicative of full year results.
Persons requiring advice should consult an independent advisor.
This communication does not constitute an offer or an invitation for the sale or purchase of securities in any jurisdiction.
THIS COMMUNICATION DOES NOT CONTAIN AN OFFER OF SECURITIES FOR SALE IN THE UNITED STATES; SECURITIES MAY NOT BE OFFERED OR SOLD IN THE UNITED STATES ABSENT REGISTRATION OR EXEMPTION FROM REGISTRATION, AND ANY PUBLIC OFFERING OF SECURITIES TO BE MADE IN THE UNITED STATES WILL BE MADE BY MEANS OF A PROSPECTUS THAT MAY BE OBTAINED FROM THE ISSUER AND THAT WILL CONTAIN DETAILED INFORMATION ABOUT THE COMPANY AND MANAGEMENT, AS WELL AS FINANCIAL STATEMENTS.
Glossary (continued)
Zurich Insurance GroupAnnual Report 2019 3
Farmers
Gross management resultis a performance measure of Farmers Management Services calculated as management fees and other related revenues minus management and other related expenses, including amortization and impairments of intangible assets. Please refer to the ‘supplementary information (unaudited)/Farmers’ for further information.
Managed gross earned premium marginis a performance measure calculated as the gross operating profit of Farmers Management Services divided by the gross earned premiums of the Farmers Exchanges, which are owned by their policyholders. Farmers Group, Inc., a wholly owned subsidiary of the Group, provides certain non-claims services and ancillary services to the Farmers Exchanges.
Q4_2019_Glossary_online_en.indd 3 27.02.2020 13:12:56
Zurich Insurance GroupAnnual Report 2019 313
Group overview Governance Risk review Financial review

Zurich Insurance Group Mythenquai 2 8002 Zurich, Switzerland Phone +41 (0) 44 625 25 25 www.zurich.com


