Embed Size (px)
Citation preview

C A C H E C O U N T Y
F I N A N C I A L S T A T E M E N T S F O R T H E Y E A R E N D E D D E C E M B E R 3 1 , 2 0 1 0

CACHE COUNTY
FINANCIAL STATEMENTS
DECEMBER 31, 2010

C A C H E C O U N T Y
FINANCIAL STATEMENTS FOR THE YEAR ENDED DECEMBER 31, 2010
TABLE OF CONTENTS
1
Page FINANCIAL SECTION
Independent Auditors’ Report ................................................................................................................................................. 3 Management Discussion and Analysis ..................................................................................................................................... 5
Basic Financial Statements
Government‐wide Financial Statements Statement of Net Assets ...................................................................................................................................................... 13 Statement of Activities ........................................................................................................................................................ 14
Fund Financial Statements Governmental Funds Balance Sheet ................................................................................................................................................................... 15 Reconciliation of the Balance Sheet of Governmental Funds to the Statement Net Assets ........................................ 16 Statement of Revenues, Expenditures, and Changes in Fund Balances ........................................................................ 17 Reconciliation of the Statement of Revenues, Expenditures, and Changes in Fund Balances of Governmental Funds to the Statement of Activities .............................................................................................. 18
Fiduciary Funds Statement of Fiduciary Net Assets .................................................................................................................................. 19
Component Units Combining Statement of Net Assets .............................................................................................................................. 20 Combining Statement of Activities .................................................................................................................................. 21
Notes to the Financial Statements ........................................................................................................................................ 23
Required Supplementary Information
Budgetary Comparison Schedules General Fund ........................................................................................................................................................................ 41 Assessing and Collecting Fund ........................................................................................................................................... 43 Municipal Services Fund ..................................................................................................................................................... 44 Mental Health Fund ............................................................................................................................................................ 46
Notes to the Required Supplementary Information ............................................................................................................. 47
Supplementary Information
Nonmajor Governmental Funds Combining Balance Sheet ................................................................................................................................................... 49 Combining Schedule of Revenues, Expenditures, and Changes in Fund Balances .......................................................... 50 Budgetary Comparison Schedules Health Fund ....................................................................................................................................................................... 51 Visitor’s Bureau Fund ....................................................................................................................................................... 52 Council on Aging Fund ..................................................................................................................................................... 53 Recreation Fund .............................................................................................................................................................. 54 Planning and Development Fund ................................................................................................................................... 55 Children’s Justice Center Fund ........................................................................................................................................ 56 RAPZ Tax Fund ................................................................................................................................................................. 57 Ambulance Fund .............................................................................................................................................................. 58 Debt Service Fund ............................................................................................................................................................ 59
Combining Statement of Fiduciary Net Assets – Agency Funds .......................................................................................... 60 Treasurer’s Tax Fund – Schedule of Taxes Charged, Collected and Disbursed .................................................................... 61 Component Units North Park Interlocal Cooperative Combining Statement of Net Assets .............................................................................................................................. 65 Combining Statement of Activities ................................................................................................................................. 66

C A C H E C O U N T Y
FINANCIAL STATEMENTS FOR THE YEAR ENDED DECEMBER 31, 2010
TABLE OF CONTENTS
2
Page SINGLE AUDIT REPORTS
Schedule of Expenditures of Federal Awards ....................................................................................................................... 69 Notes to the Schedule of Expenditures of Federal Awards ................................................................................................. 74 Independent Auditors’ Report on Internal Control over Financial Reporting and Compliance and Other Matters Based on an Audit of Financial Statements Performed in Accordance with Government Auditing Standards .................................................................................... 75
Independent Auditors’ Report on Compliance with Requirements That Could Have a Material Effect on Each Major Program and on Internal Control over Compliance in Accordance with OMB Circular A‐133 ...................... 77
Schedule of Findings and Questioned Costs ......................................................................................................................... 79 Summary Schedule of Prior Year Audit Findings ................................................................................................................... 82 Corrective Action Plan ............................................................................................................................................................ 83
STATE COMPLIANCE REPORT
Independent Auditors’ Report on Compliance with State Legal Compliance Requirements ............................................ 84 Schedule of Expenditures of Transient Room Taxes and Tourism, Recreation, Cultural and Convention Facilities Taxes................................................................................................................................................. 86

-3-
Member of the American Institute of Certified Public Accountants
OFFICERS: Paul D. Simkins, CPA
Michael C. Kidman, CPA, MBA Brent S. Sandberg, CPA Mark E. Low, CPA H. Paul Gibbons, CPA 1011 West 400 North, Suite 100 Robert D. Thomas, CPA P.O. Box 747 Paul R. Campbell, CPA Logan, UT 84323-0747 Phone: (435) 752-1510 ● (877) 752-1510 Fax: (435) 752-4878
INDEPENDENT AUDITORS’ REPORT
To the Cache County Council Logan, Utah
We have audited the accompanying financial statements of the governmental activities, the aggregate discretely presented component units, each major fund, and the aggregate remaining fund information of Cache County, Utah (the County), as of and for the year ended December 31, 2010, which collectively comprise the County’s basic financial statements as listed in the table of contents. These financial statements are the responsibility of the County’s management. Our responsibility is to express opinions on these financial statements based on our audit. We did not audit the financial statements of Bridgerland Community Ice Arena (a component unit of North Park Interlocal Cooperative), which represent 3 percent, 2 percent, and 6 percent, respectively, of the assets, net assets, and revenues of the aggregate discretely presented component units. We also did not audit the financial statements of Cache County Emergency Medical Service Authority, which represent 7 percent, 5 percent, and 19 percent, respectively, of the assets, net assets, and revenues of the aggregate discretely presented component units. Those financial statements were audited by other auditors whose reports thereon have been furnished to us, and our opinion, insofar as it relates to the amounts included for Bridgerland Community Ice Arena and Cache County Emergency Medical Service Authority is based on the reports of the other auditors.
We conducted our audit in accordance with auditing standards generally accepted in the United States of America and the standards applicable to financial audits contained in Government Auditing Standards, issued by the Comptroller General of the United States. Those standards require that we plan and perform the audit to obtain reasonable assurance about whether the financial statements are free of material misstatement. The financial statements of Bridgerland Community Ice Arena were not audited in accordance with Government Auditing Standards. An audit includes examining, on a test basis, evidence supporting the amounts and disclosures in the financial statements. An audit also includes assessing the accounting principles used and significant estimates made by management, as well as evaluating the overall financial statement presentation. We believe that our audit and the report of other auditors provide a reasonable basis for our opinions.
In our opinion, based on our audit and the report of other auditors, the financial statements referred to above present fairly, in all material respects, the respective financial position of the governmental activities, the aggregate discretely presented component units, each major fund, and the aggregate remaining fund information of the County as of December 31, 2010, and the

-4-
respective changes in financial position for the year then ended in conformity with accounting principles generally accepted in the United States of America.
In accordance with Government Auditing Standards, we have also issued a report dated June 27, 2011, on our consideration of the County's internal control over financial reporting and on our tests of its compliance with certain provisions of laws, regulations, contracts, grant agreements and other matters. The purpose of that report is to describe the scope of our testing of internal control over financial reporting and compliance and the results of that testing and not to provide an opinion on the internal control over financial reporting or on compliance. That report is an integral part of an audit performed in accordance with Government Auditing Standards and should be considered in conjunction with this report in considering the results of our audit. Accounting principles generally accepted in the United States of America require that the management’s discussion and analysis and budgetary comparison information as listed in the table of contents be presented to supplement the basic financial statements. Such information, although not a part of the basic financial statements, is required by the Governmental Accounting Standards Board, who considers it to be an essential part of financial reporting for placing the basic financial statements in an appropriate operational, economic, or historical context. We have applied certain limited procedures to the required supplementary information in accordance with auditing standards generally accepted in the United States of America, which consisted of inquiries of management about the methods of preparing the information and comparing the information for consistency with management’s responses to our inquiries, the basic financial statements, and other knowledge we obtained during our audit of the basic financial statements. We did not express an opinion or provide any assurance on the information because the limited procedures do not provide us with sufficient evidence to express an opinion or provide any assurance. Our audit was conducted for the purpose of forming opinions on the financial statements that collectively comprise the County’s basic financial statements as a whole. The supplementary information listed in the table of contents is presented for purposes of additional analysis and is not a required part of the basic financial statements. The accompanying schedule of expenditures of federal awards is presented for purposes of additional analysis as required by U.S. Office of Management and Budget Circular A-133, Audits of States, Local Governments, and Non-Profit Organizations, and is also not a required part of the basic financial statements. The accompanying schedule of expenditures of transient room taxes and tourism, recreation, cultural and convention facilities taxes is presented for purposes of additional analysis as required by the Utah Code section 17-31-5.5(3) and is also not a required part of the basic financial statements. The supplementary information and the schedules described above have been subjected to the auditing procedures applied by us and the other auditors in the audit of the basic financial statements and, in our opinion, based on our audit and the report of other auditors, is fairly stated in all material respects in relation to the basic financial statements taken as a whole.
JONES SIMKINS, P.C. June 27, 2011

C A C H E C O U N T Y
MANAGEMENT DISCUSSION AND ANALYSIS FOR THE YEAR ENDED DECEMBER 31, 2010
5
INTRODUCTION
The following discussion and analysis is presented as an overview of the financial performance of Cache County for the year ended December 31, 2010. Please consider information presented here in context with the financial statements and the notes to the financial statements for a full understanding of the condition of the County.
FINANCIAL HIGHLIGHTS
• The County’s net assets increased by approximately $2.3 million or about 4.6 percent over the prior year. The portion of total net assets which represents the amount the County can use to meet ongoing, financial obligations is the unrestricted net assets. This amount was approximately $8.7 million at the end of the year.
• During the year, the County had net program expenses of approximately $21.2 million. This compares to last year, when net program expenses were approximately 17.0 million. The total cost of the County’s programs was about $34.8 million and increased approximately $1.4 million, or about 4.2 percent.
• Combined fund balances of the County amounted to about $27.3 million, an increase of approximately $2.6 million or about 10.3 percent, from the prior year. Of this total, approximately $18.4 million, or 67.5 percent, is subject to external restrictions on its use.
• Unassigned fund balance of the General Fund was approximately $6.4 million, which amount was approximately 35.9 percent of the total expenditures of the fund.
USING THIS REPORT
This annual financial report consists of financial statements from two different perspectives. The Statement of Net Assets and the Statement of Activities, known as the government‐wide financial statements, provide information to help assess a long‐term view of the County’s financial health. Fund financial statements are also provided to show how services are financed in the short‐term as well as what financing is available for future spending. Fund financial statements also report the County’s operations in more detail than the government‐wide statements by providing information about the County’s most significant funds.
Government‐wide Statements – Reporting the County as a Whole
These statements provide a broad overview with a long‐term focus of the County’s finances as a whole and are prepared using the accrual basis of accounting, similar to private sector companies. This means all revenues and expenses are recognized regardless of when cash is received or spent, and all assets and liabilities, including capital assets and long‐term debt, are reported at the entity level.
The government‐wide statements report the County’s net assets, the difference between total assets and total liabilities, and how they have changed from the prior year. Over time, increases or decreases in the County’s net assets are an indicator of whether its financial health is improving or declining.
The County’s activities are divided into two basic groups, either governmental activities or component units.
Governmental Activities – The County’s basic services are reported here and are principally supported by taxes and intergovernmental revenues such as state and federal grants. The activities include general government, public safety, streets, health and welfare and culture and recreation.
Component Units – Some separate legal entities are included in the County’s report because the County is financially accountable for them. The entities include the Logan‐Cache Airport Authority, North Park Interlocal Cooperative, which includes the Bridgerland Community Ice Arena as its own component unit, Bear River Health Department, Cache County Emergency Medical Service Authority, and the Roads Special Service District.

C A C H E C O U N T Y
MANAGEMENT DISCUSSION AND ANALYSIS FOR THE YEAR ENDED DECEMBER 31, 2010
6
A third common division is business‐type activities. These types of activities are intended to recover all, or almost all, of their costs through user fees and charges. The County does not have any business‐type activities.
Fund Financial Statements
A fund is a group of accounts that the County uses to keep track of specific resources that are segregated for a specific purpose. Some funds are required by law to exist, while others are established internally to maintain control over a particular activity. There are three broad classifications of fund types: governmental, proprietary, and fiduciary. All of the funds of the County can be classified as either a governmental fund or a fiduciary fund.
Governmental funds – Most of the County’s basic services are accounted for in governmental funds and are essentially the same functions reported as governmental activities in the government‐wide statements. Governmental funds use the modified accrual basis of accounting, which measures the flow of current financial resources that can be converted to cash and the balances that are left at the end of the year that are available for future spending. This short‐term view of the County’s financial position helps determine whether the County has sufficient resources to cover expenditures for its basic services in the near future.
Fiduciary funds – Fiduciary funds are used to account for resources held for the benefit of parties outside the government. The County’s fiduciary funds are agency funds. These funds are custodial in nature and do not involve measuring results of operations. Accordingly, a statement of fiduciary net assets is presented, but a statement of changes in fiduciary net assets is not. Fiduciary funds are not reflected in the government‐wide financial statements because the resources of those funds are not available to support the programs of the County.
Notes to the Financial Statements
The notes to the financial statements provide additional information that is essential to a full understanding of the data provided in the government‐wide and fund financial statements.
THE COUNTY AS A WHOLE
As noted earlier, net assets may serve over time as a beneficial tool in determining whether the financial position of the County is improving or declining. Net assets are the difference between total assets and total liabilities. Total assets of the County amounted to $69,130,933. More than half of those assets, $37,198,703 or 53.8 percent, are capital assets used to provide services to residents of the County. Liabilities totaled $17,010,577, of which 13,628,298, or 80.1 percent, represent long‐term liabilities. At the end of 2010, assets exceeded liabilities by $52,120,356, an improvement of $2,273,995 over the prior year.
Approximately half of the County’s net assets, $25,000,180 or 48.0 percent, reflect its investment in capital assets (e.g. land, construction in process, buildings and improvements, equipment, and infrastructure) less any related, outstanding
2010 2009 % Change
ASSETS
Current and other assets 31,932,230$ 28,276,494$ 12.9%
Capital assets 37,198,703 38,377,999 ‐3.1%
Total assets 69,130,933 66,654,493 3.7%
LIABILITIES
Current liabilities 3,382,279 2,309,724 46.4%
Long‐term liabilities 13,628,298 14,498,408 ‐6.0%
Total liabilities 17,010,577 16,808,132 1.2%
NET ASSETS
Invested in capital assets,
net of related debt 25,000,180 25,286,203 ‐1.1%
Restricted 18,423,536 14,904,922 23.6%
Unrestricted 8,696,640 9,655,236 ‐9.9%
Total net assets 52,120,356$ 49,846,361$ 4.6%
CACHE COUNTY'S NET ASSETSGOVERNMENTAL ACTIVITIES

C A C H E C O U N T Y
MANAGEMENT DISCUSSION AND ANALYSIS FOR THE YEAR ENDED DECEMBER 31, 2010
7
debt used to acquire the assets. The County uses these assets to provide services to its citizens and, consequently, these assets are not available for future spending.
An additional $18,423,536, or 35.3 percent, represents the restricted net assets of the County. These assets are restricted because of various contracts and agreements with outside entities, or laws and regulations, which dictate how these resources may be used. The remaining balance of $8,696,640, or 16.7 percent, may be used to meet the general, ongoing financial obligations of the County.
Governmental Activities
As discussed previously, activities can commonly be divided into either government‐type or business‐type activities. However, none of the operations of the County meet the definition of business‐type activities. Therefore, the entire increase in net assets of $2,273,995 over the prior year is attributable to governmental activities.
In total, revenues for the County decreased $2,294,888, or 5.8 percent, from the prior year. The primary reason for the decrease is due to the reduction of federal funding for road projects in the national forest that were primarily completed during the prior year. Revenue from charges for services also decreased significantly due to changes in road service contracts and public safety contracts, but was offset by increases in the sales taxes and increased federal funding for other projects.
Road service contracts are demand driven by local municipalities in the County and primarily are to provide road maintenance. Public safety contracts are also demand driven by the local municipalities and the local school districts to provide law enforcement and animal control services.
The increase in sales taxes reflects an economic recovery from prior years. No additional rates have been imposed. Increased federal funding provided resources for fire and other public safety equipment as well as additional resources for current programs for social services.
Property tax revenue, the most significant tax revenue source, was relatively flat growing by only $157,934, or 1.2 percent, and totaled $13,295,904. Sales tax revenue, the second most significant source of tax revenue, benefitted from a slight economic recovery growing by $513,091, or 5.7 percent, and totaled $9,467,117.
Combined property taxes, sales taxes, and other taxes the County collects create the majority of revenues for the County totaling $23,106,150, or 62.3 percent of all revenues. Grants and contributions, totaling $7,548,992 or 20.4
2010 2009 % Change
REVENUES
Program revenues
Charges for services 6,013,480$ 7,146,416$ ‐15.9%
Operating grants and contributions 7,001,532 6,264,608 11.8%
Capital grants and contributions 547,460 3,035,036 ‐82.0%
General revenues
Property taxes 13,295,904 13,137,970 1.2%
Sales taxes 9,467,117 8,954,026 5.7%
Other taxes 343,129 317,919 7.9%
Other general revenues 412,281 519,816 ‐20.7%
Total revenues 37,080,903 39,375,791 ‐5.8%
EXPENSES
General government 8,069,654 8,062,830 0.1%
Public safety 14,041,850 13,801,046 1.7%
Streets 4,800,434 3,681,128 30.4%
Health and welfare 4,274,483 4,069,942 5.0%
Culture and recreation 3,049,748 3,175,764 ‐4.0%
Interest on long‐term debt 570,739 605,565 ‐5.8%
Total expenses 34,806,908 33,396,275 4.2%
Increase in net assets 2,273,995 5,979,516 ‐62.0%
Net assets ‐ January 1 49,846,361 43,866,845 13.6%
Net assets ‐ December 31 52,120,356$ 49,846,361$ 4.6%
CHANGES IN CACHE COUNTY'S NET ASSETSGOVERNMENTAL ACTIVITIES

C A C H E C O U N T Y
MANAGEMENT DISCUSSION AND ANALYSIS FOR THE YEAR ENDED DECEMBER 31, 2010
8
percent, always play an important role in financing the County’s capital and operational needs. Charges for services made a significant contribution to total revenues at $6,013,480 or 16.2 percent.
Total expenses increased for the County by $1,410,633, or 4.2 percent, over the prior year. The activity with the largest increase was Streets, experiencing an increase of $1,119,306, or 30.4 percent. Even though there was a decrease in the amount of road maintenance contracts with municipalities, the County spent significant resources on new road construction. Funding for this expense came from a special road tax that was implemented in 2008. Completed roads were not capitalized by the County as the County does not own or maintain the roads.
Public safety services generate the most significant expenses of the County amounting to $14,041,850, or 40.3 percent of total expenses. The most costly programs within the County’s public safety services are the Sheriff Patrol, the Support Services function, and the operation of the County jail. These costs are $3,268,779, $1,783,151, and $5,853,377 respectively. Combined, these three programs account for 31.3 percent of the County’s total expenses. These costs decreased by 3.5 percent from the prior year.
The following table and graph shows to what extent the County’s governmental activities relied on program‐related revenues to cover program costs. In 2010, these activities covered $13,562,472, or 39.0 percent, of total expense through charges for services, grants and contributions. Taxes and other general revenues covered the remaining 61.0 percent of expenses.
Less
Program Program
Expenses Revenues
2010 2010 2010 2009 2010 2009
ACTIVITIES
General government 8,069,654$ (3,430,593)$ 4,639,061$ 4,449,034$ 42.5% 44.8%
Public safety 14,041,850 (5,304,062) 8,737,788 8,419,625 37.8% 39.0%
Streets 4,800,434 (1,378,854) 3,421,580 (477,705) 28.7% 113.0%
Health and welfare 4,274,483 (2,938,479) 1,336,004 1,186,918 68.7% 70.8%
Culture and recreation 3,049,748 (510,484) 2,539,264 2,766,778 16.7% 12.9%
Interest on long‐term debt 570,739 ‐ 570,739 605,565 0.0% 0.0%
Total governmental activities 34,806,908$ (13,562,472)$ 21,244,436$ 16,950,215$ 39.0% 49.2%
CACHE COUNTY'S NET PROGRAM COSTSGOVERNMENTAL ACTIVITIES
Program
Costs
Program Revenues
as a Percentage of
Program Expenses
Net

C A C H E C O U N T Y
MANAGEMENT DISCUSSION AND ANALYSIS FOR THE YEAR ENDED DECEMBER 31, 2010
9
CAPITAL ASSETS AND DEBT ADMINISTRATION
Capital assets
The investment in capital assets, net of accumulated depreciation, of the County for its governmental activities totaled $37,198,703 at the end of the year. This investment in capital assets includes land, buildings and improvements, equipment, and infrastructure. The total net amount decreased from the prior year by $1,179,296, or 3.1 percent. No individually significant additions to capital assets were made during the year. The decrease represents additional depreciation over the prior year.
Long‐term Debt
Bonded debt outstanding at the end of the year, consisting of revenue bonds, had a balance of $12,048,025 compared to $12,796,611 at the prior year end. No additional bonds were issued in 2010, so the reduction represents payment on existing debt. Capital leases outstanding at the end of the year totaled $150,498 compared to $295,185 at the prior year end. There was only one lease outstanding which was for the acquisition of vehicles and equipment for the fire department. In addition to the revenue bonds and the capital lease, the County’s long‐term obligations include an accrual for compensated absences in the amount of $1,429,775. The adjoining table presents changes to long‐term obligations relative to the prior year.
THE COUNTY’S FUNDS
As noted earlier, a fund is a group of accounts that the County uses to keep track of specific resources that are segregated for a specific purpose. Some funds are required by law to exist. The County uses fund accounting to ensure and demonstrate compliance with the Uniform Fiscal Procedures Act (Utah Code Title 17 Chapter 36). Other funds are established internally to maintain control over a particular activity, such as capital projects.
Governmental Funds
The focus of the governmental funds of the County is to provide information on near‐term inflows, outflows and balances of resources available for appropriation. Such information is a useful measure of the net resources of the County available for spending at the end of the year.
As of December 31, 2010, the combined fund balance of the governmental funds of the County was $27,284,174, an increase of $2,552,641 in comparison with the prior year. Of that fund balance, $6,435,062 was unassigned and was available for appropriation by the County at its discretion. The remainder of the fund balance was either restricted or assigned and was available for spending subject to specific constraints.
2010 2009 % Change
Land 2,477,015$ 2,477,015$ 0.0%
Buildings and improvements 19,072,252 19,415,967 ‐1.8%
Equipment 4,582,757 5,162,120 ‐11.2%
Infrastructure 11,066,679 11,322,897 ‐2.3%
Total capital assets, net 37,198,703$ 38,377,999$ ‐3.1%
CACHE COUNTY'S CAPITAL ASSETS, NETGOVERNMENTAL ACTIVITIES
2010 2009 % Change
Sales tax revenue bonds, net
of premiums and refundings 12,048,025$ 12,796,611$ ‐5.8%
Capital lease 150,498 295,185 ‐49.0%
Compensated absences 1,429,775 1,406,612 1.6%
Total long‐term debt 13,628,298$ 14,498,408$ ‐6.0%
CACHE COUNTY'S LONG‐TERM DEBTGOVERNMENTAL ACTIVITIES

C A C H E C O U N T Y
MANAGEMENT DISCUSSION AND ANALYSIS FOR THE YEAR ENDED DECEMBER 31, 2010
10
The general fund is the principal operating fund of the County. As of December 31, 2010, the unassigned fund balance of the general fund was $6,435,062. This amount represents 35.9 percent of the total expenditures of the general fund.
General Fund Budgetary Highlights
The final adopted revenue budget increased by $907,968 over the original budget. The most significant increases in budgeted revenues were part of the public safety program. Operating grants and contributions increased by $329,000, primarily due to a federal grant for fire safety. In addition, federal and state reimbursements for housing inmates increased budgeted charges for services by $400,000 and $188,000 respectively.
Budgeted expenditures increased by $1,124,782 over the original budget. Some of the most notable increases are as follows:
• The application of new accounting standards resulted in the Water Development special revenue fund and the Library special revenue fund being closed to the general fund, causing correlated increases in General fund expenditures of $339,379 and $118,084.
• Additions to Homeland Security grants in the fire department allowing for the purchase of radio equipment, combined with other minor increases, totaled $292,507.
• An increase of $104,725 for the County Fairgrounds is primarily comprised of increases for capital improvements including painting buildings, landscaping and the purchase of new equipment.
CONTACTING THE COUNTY’S FINANCIAL MANAGEMENT
This financial report is designed to provide a general overview of the County’s finances for citizens, taxpayers, creditors and all others with an interest in the government’s finances. Questions concerning any of the information in this report or requests for additional financial information should be addressed to the County Auditor’s office at 179 North Main, Logan, Utah, 84321.
2009
Restricted Assigned Unassigned Total Total % Change
FUNDS
General 850,000$ ‐$ 6,435,062$ 7,285,062$ 6,530,022$ 11.6%
Assessing and Collecting 3,006,470 ‐ ‐ 3,006,470 2,239,228 34.3%
Municipal Services 5,212,086 ‐ ‐ 5,212,086 5,231,397 ‐0.4%
Capital Projects 5,045,891 2,148,736 ‐ 7,194,627 6,330,774 13.6%
Other (Nonmajor) 4,309,089 276,840 ‐ 4,585,929 4,400,112 4.2%
Total fund balances 18,423,536$ 2,425,576$ 6,435,062$ 27,284,174$ 24,731,533$ 10.3%
CACHE COUNTY'S FUND BALANCESGOVERNMENTAL FUNDS
2010

11
This page intentionally left blank.

12
BASIC FINANCIAL STATEMENTS

C A C H E C O U N T Y
STATEMENT OF NET ASSETS AS OF DECEMBER 31, 2010
13
The notes to the financial statements are an integral part of this statement.
Governmental Component
Activities Total Units
ASSETS
Cash and cash equivalents…………………… 5,632,206$ 5,632,206$ 4,948,287$
Equity in investment pool…………………… 19,023,254 19,023,254 314,403
Taxes receivable……………………………… 3,113,837 3,113,837 ‐
Accounts receivable, net……………………… 44,775 44,775 2,095,153
Accrued interest……………………………… 47,550 47,550 ‐
Pledges receivable, net……………………… ‐ ‐ 198,379
Due from other governments………………… 1,948,998 1,948,998 602,561
Investments………………………………….. 2,016,266 2,016,266 ‐
Inventory……………………………………… ‐ ‐ 298,998
Restricted cash and investments…………… 21,152 21,152 202
Other assets, net……………………………… 84,192 84,192 285,623
Noncurrent pledges receivable, net………… ‐ ‐ 15,197
Capital assets:
Land………………………………………… 2,477,015 2,477,015 1,718,969
Construction in process…………………… ‐ ‐ 57,371
Buildings, improvements and equipment… 40,395,566 40,395,566 27,051,845
Infrastructure……………………………… 14,953,633 14,953,633 ‐
Accumulated depreciation………………… (20,627,511) (20,627,511) (8,423,704)
Total assets………………………………… 69,130,933$ 69,130,933$ 29,163,284$
LIABILITIES
Accounts payable and accrued liabilities…… 2,242,241$ 2,242,241$ 786,723$
Due to other governments…………………… 1,133,128 1,133,128 ‐
Deferred revenue…………………………… 6,910 6,910 59,040
Long‐term liabilities:
Due within one year………………………… 1,983,498 1,983,498 387,272
Due in more than one year………………… 11,644,800 11,644,800 829,405
Total liabilities……………………………… 17,010,577 17,010,577 2,062,440
NET ASSETS
Invested in capital assets,
net of related debt………………………… 25,000,180 25,000,180 19,797,804
Restricted for:
Air pollution control………………………… 97,422 97,422 ‐
Ambulance services………………………… 179,278 179,278 ‐
Capital projects……………………………… ‐ ‐ 83,886
Debt service…….…………………………… 21,152 21,152 202
Election equipment………………………… 850,000 850,000 ‐
Health services……………………………… 688,068 688,068 ‐
Municipal services…………………………… 1,110,258 1,110,258 ‐
Parks and recreation………………………… 3,375,728 3,375,728 ‐
Property tax administration………………… 3,006,470 3,006,470 ‐
Streets……………………………………… 9,076,731 9,076,731 ‐
Other purposes……………………………… 18,429 18,429 287,789
Unrestricted…………………………………… 8,696,640 8,696,640 6,931,163
Total net assets…………………………… 52,120,356$ 52,120,356$ 27,100,844$
Primary Government

C A C H E C O U N T Y
STATEMENT OF ACTIVITIES FOR THE YEAR ENDED DECEMBER 31, 2010
The notes to the financial statements are an integral part of this statement.
Operating Capital
Charges for Grants and Grants and Governmental Component
Functions/Programs Expenses Services Contributions Contributions Activities Total Units
Primary government:
Governmental activities:
General government……………… 8,069,654$ 1,785,587$ 1,187,473$ 457,533$ (4,639,061)$ (4,639,061)$ ‐$
Public safety………………………… 14,041,850 3,686,609 1,617,453 ‐ (8,737,788) (8,737,788) ‐
Streets……………………………… 4,800,434 31,904 1,257,023 89,927 (3,421,580) (3,421,580) ‐
Health and welfare………………… 4,274,483 113,222 2,825,257 ‐ (1,336,004) (1,336,004) ‐
Culture and recreation…………… 3,049,748 396,158 114,326 ‐ (2,539,264) (2,539,264) ‐
Interest and long‐term debt……… 570,739 ‐ ‐ ‐ (570,739) (570,739) ‐
Total governmental activities…… 34,806,908 6,013,480 7,001,532 547,460 (21,244,436) (21,244,436) ‐
Total primary government…… 34,806,908$ 6,013,480$ 7,001,532$ 547,460$ (21,244,436) (21,244,436) ‐
Component Units:
Airport Authority……………………… 881,682$ 82,893$ 134,708$ 311,989$ ‐ ‐ (352,092)
North Park Interlocal Cooperative…… 838,907 406,412 495,561 ‐ ‐ ‐ 63,066
Bear River Health Department……… 8,921,572 2,533,692 6,946,654 25,000 ‐ ‐ 583,774
CCEMS Authority……………………… 2,495,611 2,249,254 475,000 ‐ ‐ ‐ 228,643
Roads Special Service District………… 280,700 ‐ 303,868 ‐ ‐ ‐ 23,168
Total component units……………… 13,418,472$ 5,272,251$ 8,355,791$ 336,989$ ‐ ‐ 546,559
General revenues:
Property taxes…………………………………………………………… 13,295,904 13,295,904 ‐
Sales and use taxes……………………………………………………… 9,467,117 9,467,117 100,328
Other taxes……………………………………………………………… 343,129 343,129 ‐
Interest and investment income………………………………………… 171,323 171,323 24,782
Loss on disposal of assets………………………………………………… (18,684) (18,684) (9,682)
Miscellaneous income…………………………………………………… 259,642 259,642 10,234
Total general revenues………………………………………………… 23,518,431 23,518,431 125,662
Changes in net assets………………………………………………… 2,273,995 2,273,995 672,221
Net assets ‐ January 1…………………………………………………… 49,846,361 49,846,361 26,428,623
Net assets ‐ December 31………………………………………………… 52,120,356$ 52,120,356$ 27,100,844$
Primary Government
Program Revenues Changes in Net Assets
Net (Expenses) Revenues
14

C A C H E C O U N T Y
BALANCE SHEET
GOVERNMENTAL FUNDS AS OF DECEMBER 31, 2010
15
The notes to the financial statements are an integral part of this statement.
Nonmajor Total
Assessing and Municipal Mental Capital Governmental Governmental
General Collecting Services Health Projects Funds Funds
ASSETS
Cash and cash equivalents…………………… 4,038,976$ 1,253,986$ 1,476$ ‐$ ‐$ 337,768$ 5,632,206$
Equity in investment pool…………………… 1,328,050 1,651,383 4,933,879 529,622 6,664,270 3,916,050 19,023,254
Interfund receivable ‐ investment pool……… ‐ ‐ 29,353 ‐ ‐ ‐ 29,353
Taxes receivable, net………………………… 1,551,918 368,905 165,910 ‐ 534,510 492,594 3,113,837
Accounts receivable, net……………………… 31,815 1,750 11,210 ‐ ‐ ‐ 44,775
Accrued interest……………………………… 47,550 ‐ ‐ ‐ ‐ ‐ 47,550
Due from other governments………………… 887,843 23,459 227,771 603,506 56,382 150,037 1,948,998
Investments…………………………………… 2,016,266 ‐ ‐ ‐ ‐ ‐ 2,016,266
Prepaid expenditures………………………… 7,415 ‐ ‐ ‐ ‐ ‐ 7,415
Restricted cash and investments…………… ‐ ‐ ‐ ‐ ‐ 21,152 21,152
Total assets………………………………… 9,909,833$ 3,299,483$ 5,369,599$ 1,133,128$ 7,255,162$ 4,917,601$ 31,884,806$
LIABILITIES
Interfund payable ‐ investment pool………… ‐ ‐ ‐ ‐ ‐ 29,353 29,353
Accounts payable and accrued liabilities…… 1,753,161 44,013 157,513 ‐ 60,535 227,019 2,242,241
Due to other governments…………………… ‐ ‐ ‐ 1,133,128 ‐ ‐ 1,133,128
Deferred revenue…………………………… 871,610 249,000 ‐ ‐ ‐ 75,300 1,195,910
Total liabilities……………………………… 2,624,771 293,013 157,513 1,133,128 60,535 331,672 4,600,632
FUND BALANCES
Restricted for:
Air pollution control………………………… ‐ ‐ ‐ ‐ ‐ 97,422 97,422
Ambulance services………………………… ‐ ‐ ‐ ‐ ‐ 179,278 179,278
Debt service...……………………………… ‐ ‐ ‐ ‐ ‐ 21,152 21,152
Election equipment………………………… 850,000 ‐ ‐ ‐ ‐ ‐ 850,000
Health services……………………………… ‐ ‐ ‐ ‐ ‐ 688,068 688,068
Municipal services…………………………… ‐ ‐ 1,110,258 ‐ ‐ ‐ 1,110,258
Parks and recreation………………………… ‐ ‐ 70,988 ‐ ‐ 3,304,740 3,375,728
Property tax administration………………… ‐ 3,006,470 ‐ ‐ ‐ ‐ 3,006,470
Streets……………………………………… ‐ ‐ 4,030,840 ‐ 5,045,891 ‐ 9,076,731
Other purposes……………………………… ‐ ‐ ‐ ‐ ‐ 18,429 18,429
Assigned to:
Capital projects……………………………… ‐ ‐ ‐ ‐ 2,148,736 ‐ 2,148,736
Debt service………………………………… ‐ ‐ ‐ ‐ ‐ 139,383 139,383
Health and welfare………………………… ‐ ‐ ‐ ‐ ‐ 133,007 133,007
Planning and development services……… ‐ ‐ ‐ ‐ ‐ 4,450 4,450
Unassigned…………………………………… 6,435,062 ‐ ‐ ‐ ‐ ‐ 6,435,062
Total fund balances………………………… 7,285,062 3,006,470 5,212,086 ‐ 7,194,627 4,585,929 27,284,174
Total liabilities and fund balances…………… 9,909,833$ 3,299,483$ 5,369,599$ 1,133,128$ 7,255,162$ 4,917,601$ 31,884,806$
Special Revenue
C A C H E C O U N T Y
RECONCILIATION OF THE BALANCE SHEET OF GOVERNMENTAL FUNDS TO THE STATEMENT OF NET ASSETS
AS OF DECEMBER 31, 2010
16
The notes to the financial statements are an integral part of this statement.
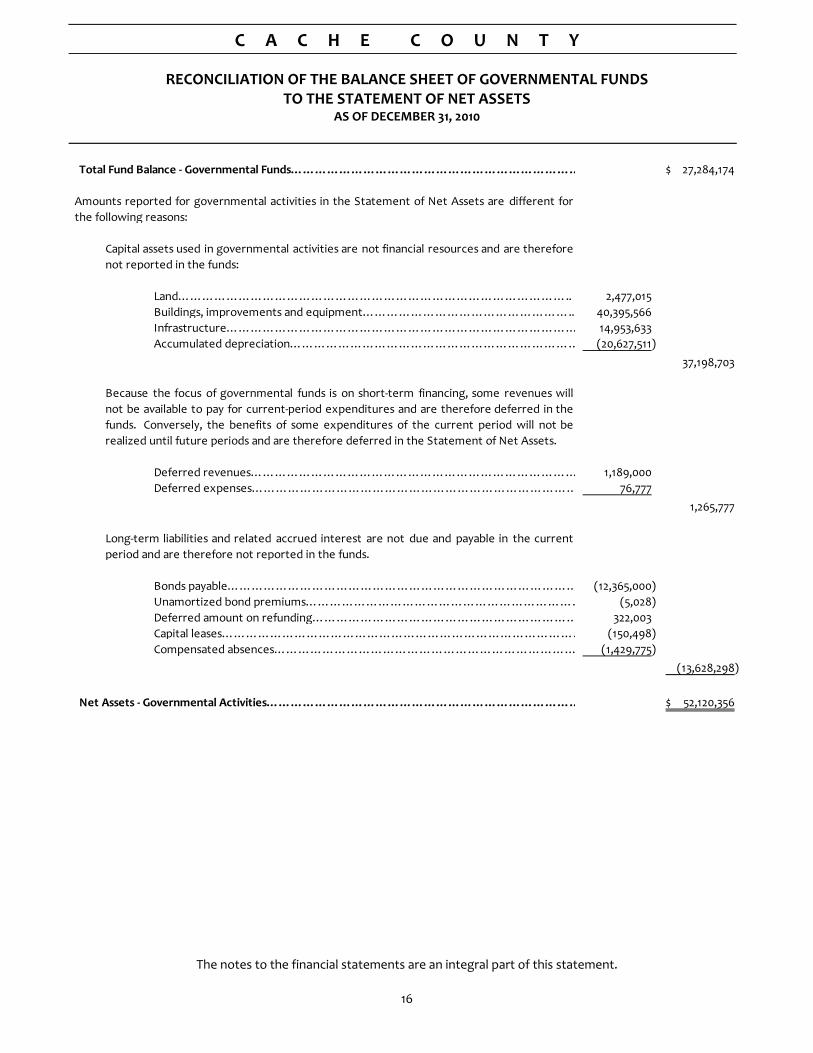
Total Fund Balance ‐ Governmental Funds……………………………………………………………… 27,284,174$
Land…………………………………………………………………………………….. 2,477,015
Buildings, improvements and equipment…………………………………………….. 40,395,566
Infrastructure…………………………………………………………………………… 14,953,633
Accumulated depreciation……………………………………………………………… (20,627,511)
37,198,703
Deferred revenues……………………………………………………………………… 1,189,000
Deferred expenses……………………………………………………………………… 76,777
1,265,777
Bonds payable…………………………………………………………………………… (12,365,000)
Unamortized bond premiums…………………………………………………………… (5,028)
Deferred amount on refunding………………………………………………………… 322,003
Capital leases……………………………………………………………………………… (150,498)
Compensated absences………………………………………………………………… (1,429,775)
(13,628,298)
Net Assets ‐ Governmental Activities…………………………………………………………………… 52,120,356$
Because the focus of governmental funds is on short‐term financing, some revenues will
not be available to pay for current‐period expenditures and are therefore deferred in the
funds. Conversely, the benefits of some expenditures of the current period will not be
realized until future periods and are therefore deferred in the Statement of Net Assets.
Long‐term liabilities and related accrued interest are not due and payable in the current
period and are therefore not reported in the funds.
Amounts reported for governmental activities in the Statement of Net Assets are different for
the following reasons:
Capital assets used in governmental activities are not financial resources and are therefore
not reported in the funds:

C A C H E C O U N T Y
STATEMENT OF REVENUES, EXPENDITURES, AND CHANGES IN FUND BALANCES
GOVERNMENTAL FUNDS FOR THE YEAR ENDED DECEMBER 31, 2010
17
The notes to the financial statements are an integral part of this statement.
Nonmajor Total
Assessing and Municipal Mental Capital Governmental Governmental
General Collecting Services Health Projects Funds Funds
REVENUES
Taxes:
Property……………………………………… 9,512,465$ 2,926,953$ 23,835$ ‐$ ‐$ 795,713$ 13,258,966$
Sales and use………………………………… 3,718,000 ‐ 848,105 ‐ 2,799,012 2,102,000 9,467,117
Other………………………………………… ‐ ‐ 2,345 ‐ ‐ 340,784 343,129
13,230,465 2,926,953 874,285 ‐ 2,799,012 3,238,497 23,069,212
Other revenues:
Intergovernmental………………………… 1,748,549 ‐ 1,951,838 2,498,458 203,603 1,075,556 7,478,004
Charges for services………………………… 4,366,450 378,760 675,844 ‐ ‐ 200,110 5,621,164
Licenses and permits………………………… 25,240 ‐ 244,177 ‐ ‐ ‐ 269,417
Fines and forfeitures………………………… 122,899 ‐ ‐ ‐ ‐ ‐ 122,899
Interest and investment income…………… 146,385 1,863 22,530 ‐ ‐ 545 171,323
Rental income……………………………… 176,337 ‐ ‐ ‐ ‐ ‐ 176,337
Public contributions………………………… 46,868 ‐ ‐ ‐ ‐ 24,120 70,988
Miscellaneous……………………………… 65,944 1,872 391 ‐ ‐ 15,098 83,305
Total revenues…………………………… 19,929,137 3,309,448 3,769,065 2,498,458 3,002,615 4,553,926 37,062,649
EXPENDITURES
General government………………………… 4,832,770 2,542,206 247,444 ‐ 1,900 103,814 7,728,134
Public safety…………………………………… 11,884,041 ‐ 838,575 ‐ 182,767 680,495 13,585,878
Streets………………………………………… 163,750 ‐ 2,293,905 ‐ 1,954,095 ‐ 4,411,750
Health and welfare…………………………… 315,630 ‐ ‐ 2,498,458 ‐ 1,427,855 4,241,943
Culture and recreation……………………… 746,528 ‐ 2,043 ‐ ‐ 2,303,306 3,051,877
Debt service principal………………………… ‐ ‐ ‐ ‐ ‐ 919,687 919,687
Debt service interest………………………… ‐ ‐ ‐ ‐ ‐ 570,739 570,739
Total expenditures………………………… 17,942,719 2,542,206 3,381,967 2,498,458 2,138,762 6,005,896 34,510,008
Revenues over (under) expenditures…… 1,986,418 767,242 387,098 ‐ 863,853 (1,451,970) 2,552,641
OTHER FINANCING SOURCES (USES)
Transfers in…………………………………… 485,232 ‐ 10,548 ‐ ‐ 1,853,866 2,349,646
Transfers out………………………………… (1,716,610) ‐ (416,957) ‐ ‐ (216,079) (2,349,646)
Total other financing sources (uses)……… (1,231,378) ‐ (406,409) ‐ ‐ 1,637,787 ‐
Net change in fund balances……………… 755,040 767,242 (19,311) ‐ 863,853 185,817 2,552,641
Fund balances ‐ January 1, as restated……… 6,530,022 2,239,228 5,231,397 ‐ 6,330,774 4,400,112 24,731,533
Fund balances ‐ December 31………………… 7,285,062$ 3,006,470$ 5,212,086$ ‐$ 7,194,627$ 4,585,929$ 27,284,174$
Special Revenue

C A C H E C O U N T Y
RECONCILIATION OF THE STATEMENT OF REVENUES, EXPENDITURES AND CHANGES IN FUND BALANCES OF GOVERNMENTAL FUNDS TO THE STATEMENT OF ACTIVITIES
FOR THE YEAR ENDED DECEMBER 31, 2010
18
The notes to the financial statements are an integral part of this statement.
Net Changes in Fund Balances ‐ Total Governmental Funds…………………………………………………… 2,552,641$
Capital outlay…………………………………………………………………………………… 921,917
Depreciation expense…………………………………………………………………………… (2,082,529)
(1,160,612)
(18,684)
Payments of bond principal…………………………………………………………………… 775,000
Payments of capital lease principal…………………………………………………………… 144,687
919,687
36,938
Amortization of bond premiums and deferred interest……………………………………… (26,414)
Deferred costs of bond issuance……………………………………………………………… (6,398)
Increase in compensated absences liability…………………………………………………… (23,163)
(55,975)
Change in Net Assets of Governmental Activities……………………………………………………………… 2,273,995$
Some expenses reported in the Statement of Activities do not require the use of current
financial resources and therefore are not reported as expenditures in governmental funds. The
activities consist of the following:
Amounts reported for governmental activities in the Statement of Activities are different for the
following reasons:
Governmental funds report capital outlays as expenditures. However, in the Statement of
Activities, the cost of capital assets is allocated over their estimated useful lives as depreciation
expense. In addition, donated capital assets are not recognized in governmental funds, but are
recognized as revenue on the statement of activities. In the current year, these amounts were
as follows:
In the Statement of Activities, only the gain or loss on the sale of assets is reported, whereas in
governmental funds, the proceeds from the sales increase financial resources. Changes in net
assets differ from changes in fund balance by the book value of assets sold...................................
Repayment of long‐term debt is reported as an expenditure in governmental funds, but the
repayment reduces long‐term liabilities in the Statement of Net Assets. In the current year,
these amounts were as follows:
Revenues in the Statement of Activities that do not provide current financial resources are
deferred and not reported as revenues in governmental funds……………………………….

C A C H E C O U N T Y
STATEMENT OF FIDUCIARY NET ASSETS
FIDUCIARY FUNDS AS OF DECEMBER 31, 2010
19
The notes to the financial statements are an integral part of this statement.
Agency
Funds
ASSETS
Cash and cash equivalents…………………… 22,755,611$
Equity in investment pool…………………… 185,125
Taxes receivable……………………………… 706,288
Total assets………………………………… 23,647,024$
LIABILITIES
Due to other taxing units…………………… 23,008,607$
Due to employees…………………………… 4,810
Refunds payable……………………………… 448,482
Other payables………………………………… 185,125
Total liabilities……………………………… 23,647,024$

C A C H E C O U N T Y
COMBINING STATEMENT OF NET ASSETS
COMPONENT UNITS AS OF DECEMBER 31, 2010
20
The notes to the financial statements are an integral part of this statement.
North Park Bear River Roads
Airport Interlocal Health CCEMS Special Service
Authority Cooperative Department Authority District Total
ASSETS
Cash and cash equivalents………………………… ‐$ 176,646$ 4,472,338$ 273,411$ 25,892$ 4,948,287$
Equity in investment pool………………………… 314,403 ‐ ‐ ‐ ‐ 314,403
Accounts receivable, net………………………… 4,970 711 1,498,614 590,858 ‐ 2,095,153
Pledges receivable, net…………………………… ‐ 198,379 ‐ ‐ ‐ 198,379
Due from other governments…………………… 127,561 ‐ ‐ 475,000 ‐ 602,561
Inventory…………………………………………. ‐ 18,187 280,811 ‐ ‐ 298,998
Restricted cash and investments………………… ‐ 202 ‐ ‐ ‐ 202
Other assets……………………………………… ‐ 285,623 ‐ ‐ ‐ 285,623
Noncurrent pledges receivable, net……………… ‐ 15,197 ‐ ‐ ‐ 15,197
Capital assets:
Land……………………………………………… 1,289,262 ‐ 429,707 ‐ ‐ 1,718,969
Construction in process………………………… ‐ ‐ 57,371 ‐ ‐ 57,371
Buildings, improvements and equipment……… 13,369,479 4,835,940 7,942,549 903,877 ‐ 27,051,845
Accumulated depreciation……………………… (3,623,520) (1,068,510) (3,584,788) (146,886) ‐ (8,423,704)
Total assets…………………………………… 11,482,155 4,462,375 11,096,602 2,096,260 25,892 29,163,284
LIABILITIES
Accounts payable and accrued liabilities………… 235,539 24,088 500,893 26,203 ‐ 786,723
Deferred revenue………………………………… 59,040 ‐ ‐ ‐ ‐ 59,040
Noncurrent liabilities:
Due within one year…………………………… ‐ 50,000 245,000 92,272 ‐ 387,272
Due in more than one year……………………… ‐ 50,000 265,000 514,405 ‐ 829,405
Total liabilities………………………………… 294,579 124,088 1,010,893 632,880 ‐ 2,062,440
NET ASSETS
Invested in capital assets, net of related debt…… 11,035,221 3,767,430 4,844,839 150,314 ‐ 19,797,804
Restricted for:
Capital projects………………………………… ‐ 83,886 ‐ ‐ ‐ 83,886
Debt service……………………………………… ‐ 202 ‐ ‐ ‐ 202
Other purposes………………………………… ‐ 287,789 ‐ ‐ ‐ 287,789
Unrestricted……………………………………… 152,355 198,980 5,240,870 1,313,066 25,892 6,931,163
Total net assets………………………………… 11,187,576$ 4,338,287$ 10,085,709$ 1,463,380$ 25,892$ 27,100,844$

C A C H E C O U N T Y
COMBINING STATEMENT OF ACTIVITIES
COMPONENT UNITS FOR THE YEAR ENDED DECEMBER 31, 2010
21
The notes to the financial statements are an integral part of this statement.
North Park Bear River Roads
Airport Interlocal Health CCEMS Special Service
Authority Cooperative Department Authority District Total
Expenses……………………………………… 881,682$ 838,907$ 8,921,572$ 2,495,611$ 280,700$ 13,418,472$
Program revenues
Charges for services…………………………… 82,893 406,412 2,533,692 2,249,254 ‐ 5,272,251
Operating grants and contributions………… 134,708 495,561 6,946,654 475,000 303,868 8,355,791
Capital grants and contributions……………… 311,989 ‐ 25,000 ‐ ‐ 336,989
Total program revenues…………………… 529,590 901,973 9,505,346 2,724,254 303,868 13,965,031
Net revenues (expenses)………………… (352,092) 63,066 583,774 228,643 23,168 546,559
General revenues
Sales and use taxes…………………………… ‐ 100,328 ‐ ‐ ‐ 100,328
Interest income……………………………… 2,243 5,216 10,227 5,700 1,396 24,782
Miscellaneous income………………………… ‐ ‐ 4,540 5,694 ‐ 10,234
Loss on disposal of assets……………………… ‐ ‐ ‐ (9,682) ‐ (9,682)
Total general revenues……………………… 2,243 105,544 14,767 1,712 1,396 125,662
Change in net assets……………………… (349,849) 168,610 598,541 230,355 24,564 672,221
Net assets ‐ beginning………………………… 11,537,425 4,169,677 9,487,168 1,233,025 1,328 26,428,623
Net assets ‐ ending…………………………… 11,187,576$ 4,338,287$ 10,085,709$ 1,463,380$ 25,892$ 27,100,844$

22
NOTES TO THE
FINANCIAL STATEMENTS

C A C H E C O U N T Y
NOTES TO THE FINANCIAL STATEMENTS FOR THE YEAR ENDED DECEMBER 31, 2010
23
NOTE 1 – SUMMARY OF SIGNIFICANT ACCOUNTING POLICIES
The financial statements of Cache County (the County) have been prepared in conformity with accounting principles generally accepted in the United States of America (GAAP) as applied to governmental entities. The Governmental Accounting Standards Board (GASB) is the accepted standard‐setting body for establishing governmental accounting and financial reporting principles. The more significant accounting policies of the County are described below.
A. Financial Reporting Entity
Cache County operates under a County Council/County Executive form of government. A brief description of this form of government follows:
1. The powers and duties of the government are divided between an elected seven‐member County Council and an elected County Executive.
2. The County Council exercises legislative and policy making powers and is composed of seven members elected for four‐year terms from different geographical districts in the County on a population basis.
3. The County Executive exercises administrative powers and fiscal control of the County and may exercise a veto upon legislative actions of the County Council which in turn may be overridden by the affirmative vote of five council members. The Executive is elected to a four‐year term in a County‐wide election.
As required by GAAP, these financial statements present Cache County, the primary government, and its component units. In evaluating how to define the government for financial reporting purposes, management has considered all potential component units.
As defined by GASB, component units are legally separate organizations for which the elected officials of the primary government are financially accountable. In addition, component units can be other organizations for which the nature and significance of their relationship with a primary government are such that exclusion would cause the reporting entity’s financials statements to be misleading or incomplete.
A component unit may be a government organization, a nonprofit corporation, or a for‐profit corporation.
Based on the foregoing definition and additional guidance from GASB, the financial statements of the following organizations are included in the reporting entity either as blended component units, reported within the funds of the County, or as discretely presented component units, reported outside the funds of the County in a separate column.
Blended component units
Cache County Municipal Building Authority (MBA) – The MBA is a nonprofit corporation established to administer the sale of bonds and related construction and remodeling projects of the County. The Governing Board of the MBA is comprised of the County Council. Investment and debt service activity of the MBA is accounted for in the Debt Service Fund. Construction activity of the MBA is accounted for in the Capital Projects Fund.
Cache County Special Service District #1 (SSD) – SSD is organized under Utah law as a separate public corporation to provide garbage collection services to the citizens of the County. The County Council has appointed itself as the Board of Trustees for the District. SSD collects fees from citizens in the unincorporated areas of the County and has contracted with the City of Logan to provide garbage collection services for citizens of the County. It pays any uncollected fees to Logan City. SSD’s operations are accounted for in the Municipal Services Fund, a special revenue fund which is reported as a major governmental fund in the financial statements.
Cache County Fire Protection District (FPD) – FPD is organized as a separate public corporation under Utah law to provide fire protection to the citizens residing in the County. The County Council appoints the Board of Directors for FPD and has appointed two council members and the County Executive to the board. Distributions are made to local governments to provide fire protection services in their communities. The County also purchases and provides firefighting equipment for FPD. The revenues and expenses of FPD are reported in the Municipal Services Fund.
Community Foundation – The Community Foundation is a nonprofit corporation established to receive contributions to benefit certain community projects.

C A C H E C O U N T Y
NOTES TO THE FINANCIAL STATEMENTS FOR THE YEAR ENDED DECEMBER 31, 2010
24
The officers of the Community Foundation are members of the County Council, the County Auditor, and the County Executive. The Community Foundation is reported as a nonmajor governmental fund of the County.
Discretely Presented Component Units
Logan‐Cache Airport Authority – The Airport Authority has been organized as a separate corporate body under Utah law to facilitate the construction and operation of a public airport. The Board of Directors is appointed equally by the County Council and the Municipal Council of the City of Logan. The Airport Authority does not issue separate financial statements.
North Park Interlocal Cooperative (NPIC) – NPIC was organized to facilitate the construction and operation of a recreational ice arena facility and to finance the costs. The cooperative members are Cache County, the City of Logan, the City of North Logan, and the City of Hyde Park. NPIC is a separate legal entity created in accordance with Utah Law. Cache County appoints 3 board members and each city appoints 2 board members. NPIC receives funding from an allocation of Restaurant Tax collections from Cache County and from dedicated sales tax collections from the other members and cities within the county limits. The County has entered into agreements to account for the dedicated sales tax collections. NPIC could be included in the financial statements of another member; however, the County has elected to include NPIC as a component unit. NPIC does not issue separate financial statements.
NPIC includes the financial statements of Bridgerland Community Ice Arena, Inc. (BCIA), which operates as a nonprofit organization for the purpose of raising money for the construction, maintenance, and operation of the ice arena owned by NPIC. NPIC evaluated BCIA in accordance with GASB statement 39 and determined that BCIA is a component unit of NPIC. BCIA’s primary sources of funding are user fees and donations. BCIA’s fiscal year ends June 30, of each year. BCIA issues separate financial statements, which can be obtained at 2825 North 200 East, North Logan, Utah, 84341.
Bear River Health Department (BRHD) – BRHD was organized to provide public health services, as allowed by state law, to Cache County, Box Elder County, and Rich County. BRHD is a separate legal entity created in
accordance with Utah law and it issues separate financial statements which can be obtained at 655 East 1300 North, Logan, Utah, 84341.
Cache County Emergency Medical Service Authority (CCEMS) – CCEMS is a jointly governed program by contractual agreement of the Office of the Cache County EMS Coordinator and the ambulance program of the City of Logan Fire Department. CCEMS operates under a 7‐member governing board with the following composition: 2 members of the City of Logan Municipal Council, 2 members of the Cache County Council, 1 member appointed by the City of Logan Municipal Council, the Cache County Executive, 1 member appointed by the other 6 members with a minimum of 4 votes approving the appointment. CCEMS provides ambulance services to Cache County residents. CCEMS issues separate financial statements which can be obtained at 199 North Main, Logan, Utah, 84321.
Cache County Roads Special Service District (RSSD) – RSSD has been organized as a separate corporate body under Utah law. Directors of the board are appointed by the County Council and RSSD receives mineral lease revenues from the State of Utah which are dedicated for the improvement of roads within the district. RSSD does not issue separate financial statements.
The Logan‐Cache Airport Authority, The Roads Special Service District, NPIC and CCEMS have their books and records maintained by the County.
Interlocal Agreements
Cache County has fiduciary responsibilities for the following interlocal agreements and their activities are accounted for as nonmajor governmental funds.
Cache Valley Visitors Bureau – The Visitors Bureau is operated under an agreement between Cache County and Rich County to promote tourism to the common region.
County Planner – The County Planner is operated under an agreement between Cache County and various cities of the County to provide planning and economic development services.
B. Government‐wide and Fund Financial Statements
Government‐wide Financial Statements
The government‐wide financial statements (i.e. the
C A C H E C O U N T Y
NOTES TO THE FINANCIAL STATEMENTS FOR THE YEAR ENDED DECEMBER 31, 2010
25
statement of net assets and the statement of activities) report information on all of the non‐fiduciary activities of the County and its component units. Primary government activities are distinguished between governmental activities and business‐type activities. However, there are currently no County activities that meet the definition of business‐type activities.
Governmental activities are usually financed through taxes, intergovernmental revenues, and other non‐exchange revenues. Business‐type activities are financed in whole or in part by fees charged to external parties for goods or services.
The Statement of Net Assets presents the reporting entities’ non‐fiduciary assets and liabilities, with the difference reported as net assets. Net assets are restricted when constraints placed upon them are either externally imposed or are imposed by constitutional provisions or enabling legislation.
The Statement of Activities demonstrates the degree to which the direct expense of a given function or segment is offset by program revenues. Direct expenses are those that are clearly identifiable with a specific function. Program revenues include 1) charges to customers or applicants who purchase, use or directly benefit from goods, services or privileges provided by a given function and 2) grants and contributions that are restricted to meeting the operational or capital requirements of a particular function. Taxes and other revenues not meeting the definition of program revenues are reported as general revenues.
Fund Financial Statements
The County’s accounting system is organized on a fund basis. A fund is a fiscal and accounting entity with a self‐balancing set of accounts that the government establishes for accountability purposes in accordance with statutes, laws, regulations, restrictions or specific purposes.
Separate financial statements are provided for governmental funds and fiduciary funds, even though the latter are excluded from the government‐wide financial statements. For governmental funds, the emphasis is on major individual funds with each displayed as a separate column. All remaining governmental funds are aggregated and reported as nonmajor funds.
C. Measurement Focus, Basis of Accounting, and Statement Presentation
Government‐wide Financial Statements
The government‐wide financial statements are reported using the economic resources measurement focus and the accrual basis of accounting, as are the component unit financial statements and the fiduciary fund financial statements. Revenues are recorded when earned and expenses are recorded when incurred, regardless of the timing of related cash flows. Property tax revenues are recognized in the year for which they are levied. Grants and similar items are recognized as revenue as soon as all eligibility requirements imposed by the providers have been met.
Governmental Fund Financial Statements
Governmental funds are reported using the current resources measurement focus and the modified accrual basis of accounting. Revenues are recognized as soon as they are both measurable and available. Revenues are considered to be available when they are collectible in the current period or soon enough thereafter to pay liabilities of the current period. For this purpose, the County considers revenues to be available if they are collected within 60 days of the end of the current fiscal period. Property taxes, franchise taxes, licenses, fees‐in‐lieu of taxes, and interest associated with the current fiscal period are all considered to be susceptible to accrual and have been recognized as revenues of the current fiscal period. Property taxes and fees‐in‐lieu of taxes associated with future periods are deferred. All other revenue items are considered to be measurable and available only when the County receives cash. Grants are usually reimbursable grants and are thus recognized as revenue at the time the related expenditures are made. Expenditures are generally recorded when a liability is incurred as under accrual accounting. However, debt service and compensated absences expenditures are recorded only when payment is due.
When both restricted and unrestricted resources are available for use, it is the policy of the County to use restricted resources first, then unrestricted resources as they are needed.
Major Funds
The County reports the following major governmental funds:

C A C H E C O U N T Y
NOTES TO THE FINANCIAL STATEMENTS FOR THE YEAR ENDED DECEMBER 31, 2010
26
The General Fund is the general operating fund of the County. It is used to account for all financial resources except those required to be accounted for in another fund.
The Assessing and Collecting Fund is a special revenue fund used to report expenditures related to the assessing and collecting of property taxes which are funded through a special tax at the state and local level.
The Municipal Services Fund is a special revenue fund used to report the municipal‐type services provided by the County to residents living in unincorporated areas of the County.
The Mental Health Fund is a special revenue fund used to report the expenditures of state provided funding for mental health services in the Mental Health Authority jurisdiction, comprising Cache, Box Elder, and Rich counties.
The Capital Projects Fund is used to account for financial resources that are restricted, committed, or assigned for the acquisition or construction of major capital facilities or other capital assets.
Nonmajor Funds
The County’s nonmajor governmental funds include other special revenue funds and a debt service fund. The nonmajor special revenue funds account for specific revenue sources that are restricted or committed to expenditures for specified purposes. Examples of restricted, committed, or assigned revenue sources include certain taxes, federal and state grants, and user fees. The debt service fund accounts for resources used for the payment of principal and interest on long‐term debt.
Fiduciary Fund Financial Statements
The fiduciary funds account for assets held by the County in a trustee capacity or as an agent for other individuals or organizations. The fiduciary fund financial statements are reported using the economic resources measurement focus and the accrual basis of accounting. The following fiduciary funds are reported:
Agency Funds – Agency funds are used to account for assets held by the County as an agent for other governmental units, other organizations, or individuals.
These funds include tax collections, refundable fees, and employee withholdings.
Component Unit Financial Statements
The combining component unit financial statements are presented in order to provide information on each of the major component units included in the component units column of the government‐wide financial statements. The component unit financial statements are reported using the economic resources measurement focus and the accrual basis of accounting. The information is presented in order to be consistent with the government‐wide financial statements. The fiscal years of the component units are the same as the primary government, except for BCIA, a component unit of NPIC, which has a fiscal year ending June 30.
D. Assets, Liabilities, and Net Assets/Fund Balances
Cash and Cash Equivalents
Cash and cash equivalents represent petty cash or demand deposits or other liquid investments that are kept in accounts separate from the investment pool of the County.
The County considers all investments with an original maturity of 3 months or less to be cash equivalents. The County follows the requirements of the Utah Money Management Act (Utah Code Annotated 1953, Section 541, Chapter 7) in handling its depository and temporary investment transactions. This law requires the depositing of County funds in a “qualified depository.” The Act defines a qualified depository as any financial institution whose deposits are insured by an agency of the federal government and which has been certified by the Commissioner of Financial Institutions as meeting the requirements of the Act and adhering to the rules of the Utah Money Management Council.
Equity in Investment Pool
Cash in all funds except the Treasurer’s Tax Agency Fund, certain restricted bond funds, and certain discretely presented component units, is pooled into common accounts in order to maximize investment opportunities. Each fund whose monies are deposited in the investment pool cash accounts has equity therein. An individual fund’s equity in the pooled cash accounts is available upon demand and is considered to

C A C H E C O U N T Y
NOTES TO THE FINANCIAL STATEMENTS FOR THE YEAR ENDED DECEMBER 31, 2010
27
be a cash equivalent when preparing these financial statements. Negative balances incurred in pooled cash at the end of the year are treated as interfund payables of the deficit fund and as interfund receivables in other funds with positive equity. Investments of the pool are stated at fair value.
Receivables
All trade and property tax receivables are shown net of any allowance for uncollectable amounts. Property taxes are due by November 30 of each year, after which the applicable property is subject to lien and penalties and interest are assessed. At December 31, 2010, all receivables of the County were considered to be fully collectible and no allowance was established. BRHD has estimated that $200,000 of its accounts receivable were uncollectable. The uncollectable receivables result primarily from services for substance abuse counseling and treatment. The CCEMS Authority has estimated that $199,000 of its accounts receivable were uncollectable. These uncollectable receivables result from ambulance services.
Property Taxes
Property taxes attach as an enforceable lien on property on January 1 of each year. Taxes are levied on property owners in July and are payable by November 30. The County bills and collects property taxes for all taxing entities within the County through the Treasurer’s Tax Fund (Agency Fund). Collections are periodically distributed to the taxing entities, with final settlement due March 31 of the subsequent year. The County records a receivable and deferred revenue for delinquent taxes, but no allowance for doubtful accounts is made as uncollected taxes are deemed to be substantially collectible or recoverable through foreclosure.
Inventory
Inventory is valued at the lower of cost or market, using the first‐in, first‐out method. Inventory in the BRHD consists of immunization serum and is valued based on information provided by the donor agency (the State of Utah) or the cost to purchase the serum.
Restricted Assets
Resources set aside for the repayment of the County’s revenue bonds are classified as restricted assets on the
balance sheet because their use is limited by applicable bond covenants.
Capital Assets
Capital assets which include land, buildings, equipment and infrastructure such as roads, bridges, and similar items, are reported in the governmental column or in the component units column of the government‐wide Statement of Net Assets. Capital assets are defined by the County as assets that cost $5,000 or more when acquired and have an estimated useful life of greater than one year. Purchased or constructed capital assets are recorded at historical cost or estimated historical costs where historical cost is not available. Donated assets are recorded at the estimated fair value on the date of donation.
Capital assets purchased by governmental funds are recorded as expenditures in the fund financial statements. Associated interest expense is not capitalized.
Buildings, equipment and other depreciable assets are depreciated using the straight‐line method over the following estimated useful lives:
Buildings and other improvements 15 – 40 years Machinery and equipment 3 – 15 years Infrastructure 80 – 100 years
Compensated Absences
In the government‐wide financial statements, accumulated leave is recorded as a liability and an expense when vested with the employee. In the governmental fund financial statements, vested or accumulated leave that is expected to be liquidated with expendable available financial resources is reported as an expenditure and a liability of the governmental fund that will pay it.
Long‐term Liabilities
In the government‐wide Statement of Net Assets, long‐term debt and other long‐term obligations are reported as liabilities. Bond premiums and discounts, as well as issuance costs, are deferred and amortized over the life of the bonds using the straight‐line method. Bonds payable are reported net of applicable bond premiums or discounts. Bond issuance costs are reported as other assets and amortized over the term of the related debt.

C A C H E C O U N T Y
NOTES TO THE FINANCIAL STATEMENTS FOR THE YEAR ENDED DECEMBER 31, 2010
28
In the fund financial statements governmental funds recognize bond premiums and discounts, as well as bond issuance costs incurred during the current period. The face amount of debt issued is reported as other financing sources. Premiums received on debt issuances are reported as other financing uses. Issuance costs, whether withheld or not from the actual debt proceeds received, are reported as debt service expenditures.
Interfund Transactions
In the government‐wide financial statements, interfund transactions have been eliminated to minimize the double counting of internal activity. Interfund receivables and payables have also been eliminated from the government‐wide Statement of Net Assets.
In the governmental fund financial statements, transfers between funds are used to report flows of cash or other assets between funds without equivalent flows of assets in return or a requirement for repayment. The County’s transfers are based on appropriations. Interfund receivables and payables are presented in the appropriate funds and are presented as “due from other funds” or “due to other funds.”
Fund Balance Classification
The governmental fund financial statements present fund balances based on classifications that comprise a hierarchy that is based primarily on the extent to which the County is bound to honor constraints on the specific purposes for which amounts in the respective governmental funds can be spent. The classifications used in the governmental fund financial statements are as follows:
Nonspendable – This classification includes amounts that cannot be spent because they are either (a) not in spendable form or (b) are legally or contractually required to be maintained intact. The County has not classified any amount of fund balance as nonspendable.
Restricted – This classification includes amounts for which constraints have been placed on the use of the resources either (a) externally imposed by creditors (such as through a debt covenant), grantors, contributors, or laws or regulations of other governments, or (b) imposed by law through constitutional provisions or enabling legislation.
Committed – This classification includes amounts that can be used only for specific purposes pursuant to constraints imposed by formal action of the County Council. These amounts cannot be used for any other purpose unless the County Council removes or changes the specified use by taking the same type of action (ordinance or resolution) that was employed when the funds were initially committed. This classification also includes contractual obligations to the extent that existing resources have been specifically committed for use in satisfying those contractual requirements.
Assigned – This classification includes amounts that are constrained by the County’s intent to be used for a specific purpose but are neither restricted nor committed. This intent can be expressed by the County Council; no other body or official has this authority delegated to them. This classification also includes the remaining positive fund balance for all governmental funds except for the General Fund.
Unassigned – This classification includes the residual fund balance for the General Fund. The Unassigned classification also includes negative residual fund balance of any other governmental fund that cannot be eliminated by the offsetting of assigned fund balance amounts.
When an expenditure is incurred for purposes for which both restricted and unrestricted fund balance is available, the County considers restricted funds to have been spent first. When an expenditure is incurred for which committed, assigned, or unassigned fund balances are available, the County considers amounts to have been spent first out of committed funds, then assigned funds, and finally unassigned funds, as needed.
E. Estimates
The preparation of financial statements requires management to make estimates and assumptions that affect the reported amounts of assets and liabilities and disclosures of contingent assets and liabilities as of the date of the financial statements and the reported amount of revenues and expenses during the reporting period. Actual amounts could differ from those estimates.
F. Effect of Change in Accounting Principal
During the year ended December 31, 2010, the County adopted Governmental Accounting Standards Board

C A C H E C O U N T Y
NOTES TO THE FINANCIAL STATEMENTS FOR THE YEAR ENDED DECEMBER 31, 2010
29
Statement No 54 Fund Balance Reporting and Governmental Fund Type Definitions (GASBS 54). As a result of adopting the standards contained in GASBS 54, the operations and balances previously reported in the Water Development Special Revenue Fund and Library Special Revenue Fund are now included within the County’s general fund. As required by GASBS 54, this change in reporting is performed retrospectively to prior periods. The resulting change is reflected as an increase of $186,706 to the fund balance of the general fund.
NOTE 2 – DEPOSITS AND INVESTMENTS
The State of Utah Money Management Council has the responsibility to advise the State Treasurer about investment policies, promote measures and rules that will assist in strengthening the banking and credit structure of the State and review the rules adopted by the State of Utah Money Management Act that relate to the deposit and investment of public funds.
The County follows the requirements of the Utah Money Management Act (Utah Code, Title 51, Chapter 7) in handling its depository and investment transactions. The Money Management Act (Act) requires the depositing of funds in a qualified depository. The Act defines a qualified depository as any financial institution whose deposits are insured by an agency of the Federal Government and has been certified by the State Commissioner of Financial Institutions as meeting the requirements of the Act and adhering to the rules of the Utah Money Management Council.
A. Deposits
Custodial Credit Risk
Custodial credit risk is the risk that, in the event of a bank failure, the County’s deposits may not be returned. The County does not have a formal policy relating to custodial credit risk. As of December 31, 2010, $10,883,513 of the County’s bank balances of $11,905,590 was uninsured and uncollateralized.
B. Investments
The Act authorizes investments in both negotiable and nonnegotiable deposits of qualified depositories and permitted negotiable depositories; repurchase and reverse repurchase agreements; commercial paper that is classified as “first tier” by two nationally recognized statistical rating organizations, one of which must be Moody’s Investors Services or Standard & Poor’s; bankers’ acceptances; obligations of the United States Treasury including bills, notes, and bonds; obligations, other than mortgage derivative products, issued by U.S. government sponsored enterprises (U.S. Agencies) such as the Federal Home Loan Bank System, Federal Home Loan Mortgage Corporation (Freddie Mac), Federal National Mortgage Association (Fannie Mae), and Student Loan Marketing Association (Sallie Mae); bonds, notes, and other evidence of indebtedness of political subdivisions of the State; fixed rate corporate obligations and variable rate securities rated “A” or higher, or the equivalent of “A” or higher, by two nationally recognized statistical rating organizations; and shares or certificates in a money market mutual fund as defined in the Act.
The Utah State Treasurer’s Office operates the Public Treasurer’s Investment Fund (PTIF). The PTIF is available for investment of funds administered by any Utah public treasurer.
The PTIF is not registered with the SEC as an investment company. The PTIF is authorized and regulated by the Money Management Act. The Act established the Money Management Council, which oversees the activities of the State Treasurer and the PTIF and details the types of authorized investments.
Deposits in the PTIF are not insured or otherwise guaranteed by the State of Utah and participants share proportionally in any realized gains or losses on investments.
The County’s investments at December 31, 2010 are presented on the following page:
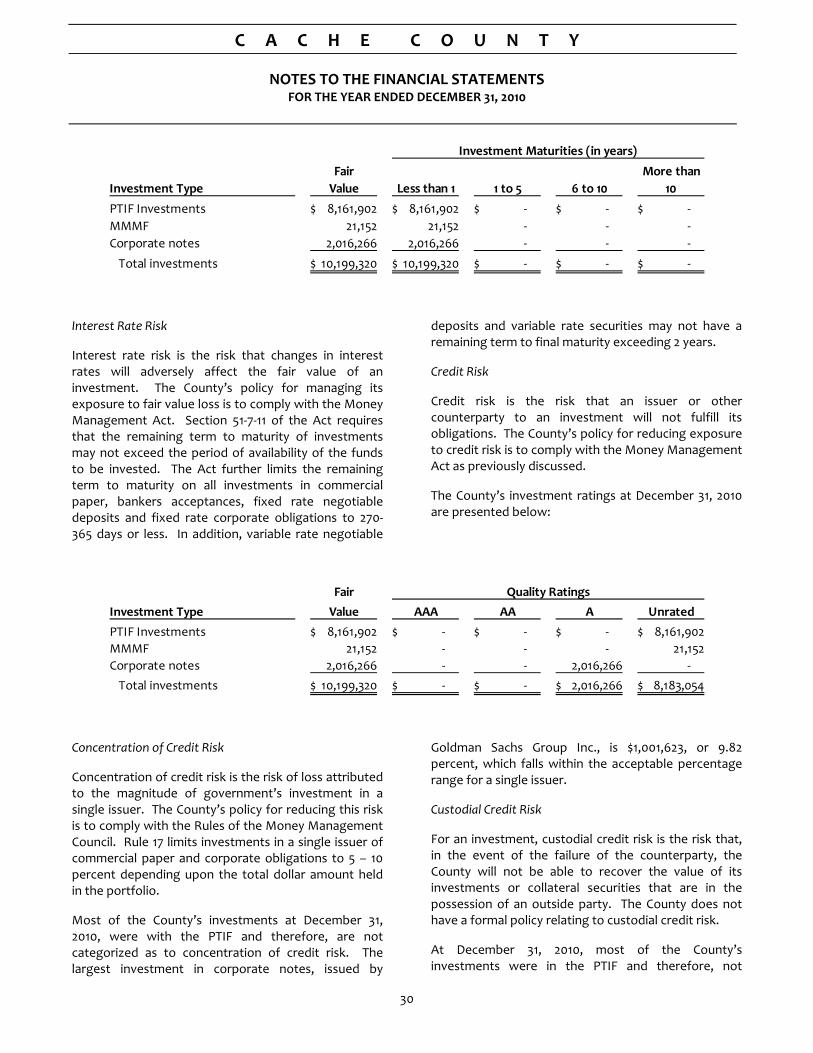
C A C H E C O U N T Y
NOTES TO THE FINANCIAL STATEMENTS FOR THE YEAR ENDED DECEMBER 31, 2010
30
Interest Rate Risk
Interest rate risk is the risk that changes in interest rates will adversely affect the fair value of an investment. The County’s policy for managing its exposure to fair value loss is to comply with the Money Management Act. Section 51‐7‐11 of the Act requires that the remaining term to maturity of investments may not exceed the period of availability of the funds to be invested. The Act further limits the remaining term to maturity on all investments in commercial paper, bankers acceptances, fixed rate negotiable deposits and fixed rate corporate obligations to 270‐365 days or less. In addition, variable rate negotiable
deposits and variable rate securities may not have a remaining term to final maturity exceeding 2 years.
Credit Risk
Credit risk is the risk that an issuer or other counterparty to an investment will not fulfill its obligations. The County’s policy for reducing exposure to credit risk is to comply with the Money Management Act as previously discussed.
The County’s investment ratings at December 31, 2010 are presented below:
Concentration of Credit Risk
Concentration of credit risk is the risk of loss attributed to the magnitude of government’s investment in a single issuer. The County’s policy for reducing this risk is to comply with the Rules of the Money Management Council. Rule 17 limits investments in a single issuer of commercial paper and corporate obligations to 5 – 10 percent depending upon the total dollar amount held in the portfolio.
Most of the County’s investments at December 31, 2010, were with the PTIF and therefore, are not categorized as to concentration of credit risk. The largest investment in corporate notes, issued by
Goldman Sachs Group Inc., is $1,001,623, or 9.82 percent, which falls within the acceptable percentage range for a single issuer.
Custodial Credit Risk
For an investment, custodial credit risk is the risk that, in the event of the failure of the counterparty, the County will not be able to recover the value of its investments or collateral securities that are in the possession of an outside party. The County does not have a formal policy relating to custodial credit risk.
At December 31, 2010, most of the County’s investments were in the PTIF and therefore, not
Fair More than
Investment Type Value Less than 1 1 to 5 6 to 10 10
PTIF Investments 8,161,902$ 8,161,902$ ‐$ ‐$ ‐$
MMMF 21,152 21,152 ‐ ‐ ‐
Corporate notes 2,016,266 2,016,266 ‐ ‐ ‐
Total investments 10,199,320$ 10,199,320$ ‐$ ‐$ ‐$
Investment Maturities (in years)
Fair
Investment Type Value AAA AA A Unrated
PTIF Investments 8,161,902$ ‐$ ‐$ ‐$ 8,161,902$
MMMF 21,152 ‐ ‐ ‐ 21,152
Corporate notes 2,016,266 ‐ ‐ 2,016,266 ‐
Total investments 10,199,320$ ‐$ ‐$ 2,016,266$ 8,183,054$
Quality Ratings
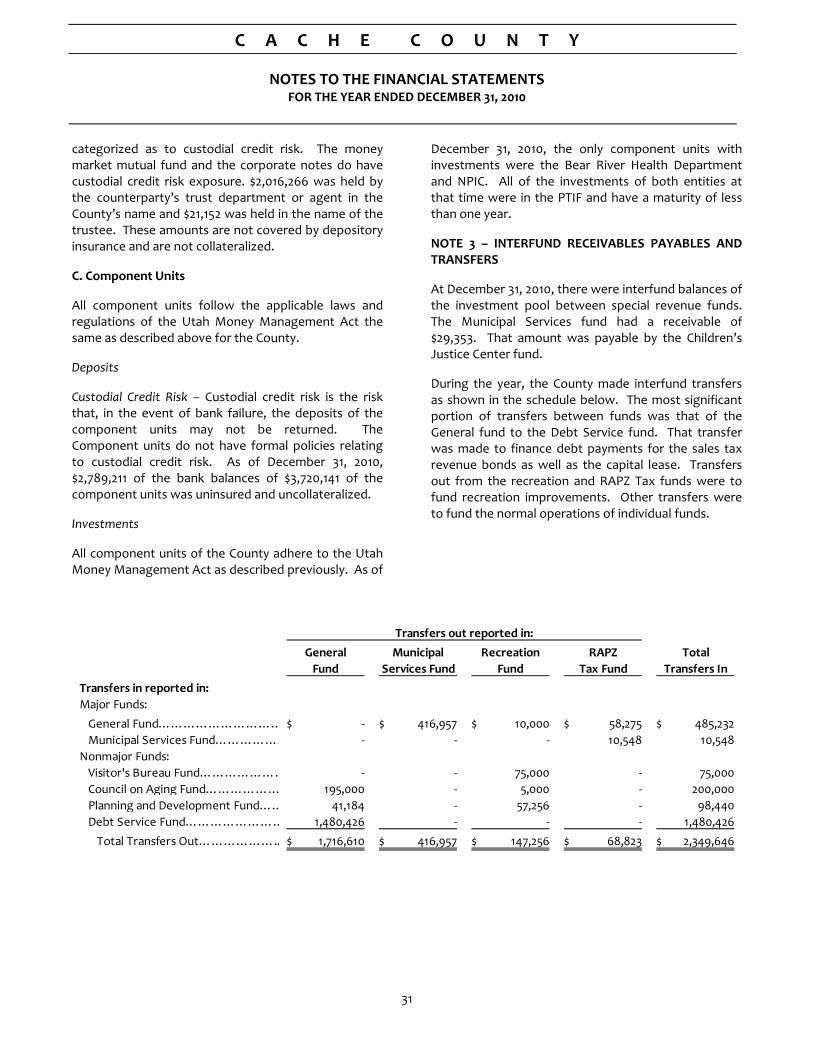
C A C H E C O U N T Y
NOTES TO THE FINANCIAL STATEMENTS FOR THE YEAR ENDED DECEMBER 31, 2010
31
categorized as to custodial credit risk. The money market mutual fund and the corporate notes do have custodial credit risk exposure. $2,016,266 was held by the counterparty’s trust department or agent in the County’s name and $21,152 was held in the name of the trustee. These amounts are not covered by depository insurance and are not collateralized.
C. Component Units
All component units follow the applicable laws and regulations of the Utah Money Management Act the same as described above for the County.
Deposits
Custodial Credit Risk – Custodial credit risk is the risk that, in the event of bank failure, the deposits of the component units may not be returned. The Component units do not have formal policies relating to custodial credit risk. As of December 31, 2010, $2,789,211 of the bank balances of $3,720,141 of the component units was uninsured and uncollateralized.
Investments
All component units of the County adhere to the Utah Money Management Act as described previously. As of
December 31, 2010, the only component units with investments were the Bear River Health Department and NPIC. All of the investments of both entities at that time were in the PTIF and have a maturity of less than one year.
NOTE 3 – INTERFUND RECEIVABLES PAYABLES AND TRANSFERS
At December 31, 2010, there were interfund balances of the investment pool between special revenue funds. The Municipal Services fund had a receivable of $29,353. That amount was payable by the Children’s Justice Center fund.
During the year, the County made interfund transfers as shown in the schedule below. The most significant portion of transfers between funds was that of the General fund to the Debt Service fund. That transfer was made to finance debt payments for the sales tax revenue bonds as well as the capital lease. Transfers out from the recreation and RAPZ Tax funds were to fund recreation improvements. Other transfers were to fund the normal operations of individual funds.
General Municipal Recreation RAPZ Total
Fund Services Fund Fund Tax Fund Transfers In
Transfers in reported in:
Major Funds:
General Fund………………………… ‐$ 416,957$ 10,000$ 58,275$ 485,232$
Municipal Services Fund……………… ‐ ‐ ‐ 10,548 10,548
Nonmajor Funds:
Visitor's Bureau Fund………………… ‐ ‐ 75,000 ‐ 75,000
Council on Aging Fund……………… 195,000 ‐ 5,000 ‐ 200,000
Planning and Development Fund…… 41,184 ‐ 57,256 ‐ 98,440
Debt Service Fund…………………… 1,480,426 ‐ ‐ ‐ 1,480,426
Total Transfers Out……………….. 1,716,610$ 416,957$ 147,256$ 68,823$ 2,349,646$
Transfers out reported in:

C A C H E C O U N T Y
NOTES TO THE FINANCIAL STATEMENTS FOR THE YEAR ENDED DECEMBER 31, 2010
32
NOTE 4 – CAPITAL ASSETS
Primary Government
Changes in the County’s capital assets are as follows:
Depreciation expense was charged to the functions of the County as follows:
Component Units
Changes in capital assets of component units are as follows:
Balance Balance
01/01/10 Additions Deletions 12/31/10
Capital assets, nondepreciable
Land…………………………………………………… 2,477,015$ ‐$ ‐$ 2,477,015$
Capital assets, depreciable
Buildings……………………………………………… 21,983,942 222,086 ‐ 22,206,028
Improvements……………………………………… 1,795,350 45,420 ‐ 1,840,770
Equipment…………………………………………… 15,998,224 392,667 (42,123) 16,348,768
Infrastructure………………………………………… 14,691,889 261,744 ‐ 14,953,633
Totals………………………………………………… 54,469,405 921,917 (42,123) 55,349,199
Accumulated depreciation
Buildings……………………………………………… (3,815,818) (538,415) ‐ (4,354,233)
Improvements……………………………………… (547,507) (72,806) ‐ (620,313)
Equipment…………………………………………… (10,836,104) (953,346) 23,439 (11,766,011)
Infrastructure………………………………………… (3,368,992) (517,962) ‐ (3,886,954)
Totals………………………………………………… (18,568,421) (2,082,529) 23,439 (20,627,511)
Total capital assets, net……………………………… 38,377,999$ (1,160,612)$ (18,684)$ 37,198,703$
General government………………………………… 400,276$
Public safety………………………………………… 810,820
Streets………………………………………………… 758,550
Health and welfare…………………………………… 32,272
Culture and recreation……………………………… 80,611
Total depreciation expense……………………… 2,082,529$
Balance Balance
01/01/10 Additions Deletions 12/31/10
Land…………………………………………………… 1,613,969$ 105,000$ ‐$ 1,718,969$
Construction in process……………………………… 82,014 2,492 (27,135) 57,371
Buildings and improvements………………………… 23,241,595 803,487 ‐ 24,045,082
Equipment and machinery…………………………… 2,233,880 837,883 (65,000) 3,006,763
Accumulated depreciation…………………………… (7,201,997) (1,277,025) 55,318 (8,423,704)
Capital assets, net…………………………………… 19,969,461$ 471,837$ (36,817)$ 20,404,481$

C A C H E C O U N T Y
NOTES TO THE FINANCIAL STATEMENTS FOR THE YEAR ENDED DECEMBER 31, 2010
33
NOTE 5 – LONG‐TERM LIABILITIES
A. Changes in Long‐term Liabilities
Long‐term liability activity for the year ended December 31, 2010, was as follows:
B. Sales Tax Revenue Bonds
Primary Government
Sales tax revenue bonds payable at December 31, 2010, were as follows:
Proceeds from the 2002 sales tax revenue bonds were used in the acquisition, construction, and furnishing of the County Administration Building and the Public Safety Complex as well as the renovations to the County’s Historic Courthouse. The bond covenants require a sinking fund to provide for the $2,970,000 balloon payment. The sinking fund requirement is
effective December 15, 2020 to December 15, 2022 with payments ranging from $940,000 to $1,040,000.
Proceeds from the 2003 sales tax revenue bonds were used to expand the construction of the Public Safety Complex. The bond covenants require a sinking fund to provide for the $780,000 balloon payment. The
Balance Balance Due Within
01/01/10 Additions Deletions 12/31/10 One Year
Primary Government
Sales tax revenue bonds…………………… 13,140,000$ ‐$ (775,000)$ 12,365,000$ 805,000$
Deferred amounts:
Deferred interest…………………………… (348,836) ‐ 26,833 (322,003) ‐
Bond Premium……………………………… 5,447 ‐ (419) 5,028 ‐
Total bonds payable………………………… 12,796,611 ‐ (748,586) 12,048,025 805,000
Capital leases………………………………… 295,185 ‐ (144,687) 150,498 150,498
Compensated absences……………………… 1,406,612 1,034,107 (1,010,944) 1,429,775 1,028,000
Total long‐term liabilities………………… 14,498,408$ 1,034,107$ (1,904,217)$ 13,628,298$ 1,983,498$
Component Units
Sales tax revenue bonds…………………… 691,000$ ‐$ (691,000)$ ‐$ ‐$
Notes payable………………………………… 100,000 ‐ ‐ 100,000 50,000
Capital leases………………………………… 695,700 ‐ (89,023) 606,677 92,272
Compensated absences……………………… 461,000 245,445 (196,445) 510,000 245,000
Total long‐term liabilities…………………… 1,947,700$ 245,445$ (976,468)$ 1,216,677$ 387,272$
Maturity Interest Original
Series Date Rate % Amount Balance
Construction of the County jail and renovation of the
historic courthouse………………………………………… 2002 12/15/22 3.50 ‐ 5.00 13,835,000$ 2,630,000$
Additions to County jail construction………………………… 2003 12/15/22 3.00 ‐ 4.15 3,340,000 2,365,000
Advance refund a portion of the 2002 series………………… 2007 12/15/22 4.00 ‐ 4.50 7,580,000 7,370,000
Total sales tax revenue bonds outstanding……………………………………………………………………………………… 12,365,000
Add unamortized premium………………………………………………………………………………………………………… 5,028
Less deferred interest on refunding……………………………………………………………………………………………… (322,003)
Total sales tax revenue bonds payable…………………………………………………………………………………………… 12,048,025$
Purpose

C A C H E C O U N T Y
NOTES TO THE FINANCIAL STATEMENTS FOR THE YEAR ENDED DECEMBER 31, 2010
34
sinking fund requirement is effective December 15, 2015 to December 15, 2018 with payments ranging from $185,000 to $205,000. The bond covenants also require a sinking fund to provide for the $920,000 balloon payment. The sinking fund requirement is effective December 15, 2019 to December 15, 2022 with payments ranging from $215,000 to $245,000.
Proceeds from the 2007 sales tax revenue bonds were used to advance refund a portion of the Series 2002 sales tax revenue bonds.
The advance refunding will save the County $305,340 over the life of the bonds and resulted in a net present value benefit of $230,303.
C. Note Payable
Component Units
In June of 2009, BCIA received a $100,000, no interest, unsecured loan from a foundation to make capital improvements. The loan is to be repaid in two annual installments of $50,000, due on July 30, 2011 and 2012. The Cache County Council has pledged $100,000 in future RAPZ funds to BCIA to pay these installments.
Maturities of long‐term debt are as follows:
D. Capital Leases
Primary Government
The County entered into a capital lease agreement on May 23, 2007, in the amount of $711,048 for the purchase of fire fighting vehicles and equipment. Lease payments are due annually on November 15, in the amount of $156,544, until 2011, with an applicable interest rate of 3.92 percent. Total payments outstanding are $156,544, including $6,046 in interest.
The present value of future payments is $150,498. The cost of assets on the balance sheet recorded under capital leases and associated accumulated amortization are $789,165 and $207,547 respectively.
Component Units
The CCEMS Authority entered in to a capital lease on November 24, 2009, in the amount of $695,700 for the purchase of ambulance vehicles and equipment. Lease payments are due annually on November 24, in the amount of $114,416, until 2016, with an applicable interest rate of 3.65 percent. Total payments outstanding are $686,494, including $79,817 in interest. The present value of future payments is $606,677. The cost of assets on the balance sheet recorded under capital leases and associated accumulated amortization are $808,877 and $91,435 respectively.
Year Principal Interest Principal Interest Principal Interest Principal Interest
2011………… 615,000$ 125,225$ 155,000$ 98,650$ 35,000$ 296,198$ 805,000$ 520,073$
2012………… 640,000 97,550 165,000 92,838 40,000 294,710 845,000 485,098
2013………… 670,000 68,750 170,000 86,650 40,000 293,010 880,000 448,410
2014………… 705,000 35,250 175,000 79,850 40,000 291,310 920,000 406,410
2015………… ‐ ‐ 185,000 72,850 780,000 289,610 965,000 362,460
2016 ‐ 2020…… ‐ ‐ 1,035,000 242,948 4,415,000 952,650 5,450,000 1,195,598
2021 ‐ 2022…… ‐ ‐ 480,000 31,900 2,020,000 123,525 2,500,000 155,425
Total……… 2,630,000$ 326,775$ 2,365,000$ 705,686$ 7,370,000$ 2,541,013$ 12,365,000$ 3,573,474$
Series 2002
Sales Tax Revenue Bonds ‐ Debt Service Requirements to Maturity
Series 2003 Series 2007 Total
Amount
2011……………………… 50,000$
2012……………………… 50,000
Total 100,000$
Year ending June 30,
Year Principal Interest Total
2011………… 92,272$ 22,144$ 114,416$
2012………… 95,640 18,776 114,416
2013………… 99,131 15,285 114,416
2014………… 102,749 11,667 114,416
2015………… 106,500 7,916 114,416
2016………… 110,385 4,029 114,414
Total 606,677$ 79,817$ 686,494$
Debt Service Requirements to Maturity

C A C H E C O U N T Y
NOTES TO THE FINANCIAL STATEMENTS FOR THE YEAR ENDED DECEMBER 31, 2010
35
NOTE 6 – PENSION PLANS
A. Defined Benefit Plans
Cache County contributes to the following cost sharing multiple‐employer defined benefit pension plans administered by the Utah Retirement Systems (URS): 1) Utah Public Employees Contributory Retirement, 2) Utah Public Employees Noncontributory Retirement, 3) Utah Public Safety Retirement, and 4) Utah Firefighters Retirement. URS provides refunds, retirement benefits, and cost of living adjustments and death benefits to plan members and beneficiaries in accordance with retirement statutes. The following briefly summarizes types of employees covered, benefit provisions, eligibility requirements, and vesting for the systems participated in by the County:
1) Public Employees Contributory and Noncontributory – All County employees hired to a position expected to last longer than 9 months and that work 30 or more hours per week are eligible to participate. Employees attaining age 60 to 65 with 4 to 20 years of service credit, or any age with 30 or more years of service credit are entitled to monthly benefits based on age, years of service credit, and final average monthly salary. Matching contributions made by the County are not vested in the employee’s name. All other contributions are fully vested at the time of contribution.
2) Public Safety Employees – All employees employed in the recognized public safety departments of the County who work 40 or more hours per week and are regularly assigned to hazardous duty are eligible to participate. Employees attaining age 60 to 65 with 4 to 10 years of credited service, or any age with 20 or more years of credited service, are entitled to monthly benefits based on years of credited service and final average monthly salary. Matching contributions made by the County are not vested in the employee’s name. All other contributions are fully vested at the time of contribution.
3) Firefighters – All employees employed in the recognized fire department of the County who work 40 or more hours per week and are regularly assigned to hazardous duty are eligible to participate. Employees attaining age 60 to 65 with 4 to 10 years of credited service, or any age with 20 or more years of credited service are entitled to
monthly benefits based on years of credited service and final average monthly salary. Matching contributions made by the County are not vested in the employee’s name. All other contributions are vested at the time of contribution.
These URS systems are established and governed by respective sections of Chapter 49 of the Utah Code Annotated 1953 as amended. The Utah State Retirement Act provides for the administration of URS under the direction of the Utah State Retirement Board whose members are appointed by the Governor. URS issues a publicly available financial report that includes financial statements and required supplementary information for the Local Government Contributory Retirement System, the Local Government Noncontributory Retirement System, the Public Safety Retirement System, and the Firefighters Retirement System. A copy of the report may be obtained by writing to URS, 540 East 200 South, Salt Lake City, Utah, 84102‐2099, or by calling 800‐365‐8772.
Plan members in the Local Government Contributory Retirement System are required to contribute 6.00 percent of their annual salary (paid by the County) and the County was required to contribute 7.65 percent to 9.36 percent of their annual covered salary. In the Local Government Noncontributory Retirement System, the County was required to contribute 11.66 percent to 13.70 percent of the eligible employees’ annual covered salary. In the Public Safety Retirement System, contributory division members were required to contribute 12.29 percent of their annual covered salary (paid by the County) and the County was required to contribute 12.47 percent to 14.86 percent of their annual covered salary and 23.34 percent to 26.13 of the annual covered salary of noncontributory division members. In the Firefighters Retirement System plan members were required to contribute 13.49 to 15.05 percent of their annual covered salary (paid by the County) and the County was required to contribute 1.72 percent of their annual covered salary. The contribution requirements of URS are authorized by statute and specified by the board.
The County contributions to URS for the years ended December 31, 2010, 2009, and 2008 were as follows:

C A C H E C O U N T Y
NOTES TO THE FINANCIAL STATEMENTS FOR THE YEAR ENDED DECEMBER 31, 2010
36
All contributions by Cache County were paid by the due dates or within 30 days thereafter and were equal to the required contributions for each year. The Utah State Retirement Board of URS provides the County with the necessary retirement disclosures for this report.
B. Defined Contribution Plan
The County maintains a qualified cash or deferred compensation plan under section 401(k) of the Internal Revenue Code that is administered by URS. Under the plan, eligible employees may elect to defer a portion of their salary, subject to Internal Revenue Service limits. Contributions of $644,306, $668,373, and $699,289, were made to the 401(k) plan during the years ended
December 31, 2010, 2009, and 2008, respectively. Of this amount $ 268,973, $294,270, and $309,467 was contributed by employees and $375,333, $374,103, and $389,822, was contributed by the County on behalf of employees, respectively.
C. Component Units
Defined Benefit Plans
BRHD also participated in the Local Government Systems retirement plans administered by URS. BRHD’s required contribution rates are the same as the County’s rates. BRHD contributions to the system for the years ended December 31, 2010, 2009, and 2008 were as follows:
2010 2009 2008
A. Local Governmental ‐ Contributory
Employer paid for employee contributions……………… 7,069$ 7,043$ 6,893$
Employer contributions…………………………………… 10,020 8,956 8,743
B. Local Governmental ‐ Noncontributory
Employer contributions…………………………………… 631,209 587,653 590,979
C. Public Safety ‐ Contributory
Employer paid for employee contributions……………… 4,805 6,859 6,715
Employer contributions…………………………………… 5,142 6,611 6,130
D. Public Safety ‐ Noncontributory
Employer contributions…………………………………… 1,016,430 947,432 908,759
E. Firefighter's
Employer paid for employee contributions……………… 9,554 6,812 11,652
Employer contributions…………………………………… 576 ‐ ‐
2010 2009 2008
A. Local Governmental ‐ Contributory
Employer paid for employee contributions……………… 1,724$ 1,600$ 1,454$
Employer contributions…………………………………… 2,464 2,035 1,844
B. Local Governmental ‐ Noncontributory
Employer contributions…………………………………… 461,219 442,403 421,820

C A C H E C O U N T Y
NOTES TO THE FINANCIAL STATEMENTS FOR THE YEAR ENDED DECEMBER 31, 2010
37
All contributions by BRHD were paid by the due dates or within 30 days thereafter and were equal to the required contributions for each year.
Defined Contribution Plan
BRHD maintains a qualified cash or deferred compensation plan under section 401(k) of the Internal Revenue Code that is administered by URS. Under the plan, eligible employees may elect to defer a portion of their salary, subject to Internal Revenue Service limits. Contributions of $362,938, $419,070, and $337,693 were made to the 401(k) plan during the years ended December 31, 2010, 2009, and 2008, respectively. Of this amount, $122,526, $177,060, and $107,443 was contributed by employees and $240,412, $242,010, and $230,250 was contributed by BRHD on behalf of employees, respectively.
NOTE 7 – DEFERRED COMPENSATION PLAN
The County and BRHD offer employees a deferred compensation plan created in accordance with the Internal Revenue Code Section 457. The plans are available to all employees and are administered by the Utah Retirement Systems (URS). The plans permit employees to defer a portion of their salary until future years. The deferred compensation is not available to employees until termination, retirement, death, or unforeseeable emergency.
The assets of the plans are not subject to the claims of the general creditors of the County or BRHD and are held by URS as trustee of the plans. The County’s and BRHD’s involvement is limited to withholding the amounts elected by employees and remitting those amounts to URS.
NOTE 8 – PUBLIC ENTITY RISK POOL
The County is exposed to various risks of loss related to torts, theft of, damage to and destruction of assets, errors and omissions and natural disasters. The County participates in the Utah Counties Insurance Pool (UCIP), a public entity risk pool, to manage its risk of loss. The County pays an annual premium to the trust for its general insurance coverage. The pool was created to be self‐sustaining through member premiums and will reinsure through commercial companies for claims in excess of $1,000,000 for each insured event. In addition, the County has purchased commercial insurance related to airport operations,
steam boiler usage, employee performance, and workers’ compensation.
As of December 31, 2010, there were no outstanding unpaid claims in excess of insurance coverage. Also, the County had no claim settlements over the past three years that exceeded its insurance coverage.
NOTE 9 – COMMITMENTS & CONTINGENCIES
The County collects sales tax under the Restaurant Tax and RAPZ Tax programs enabled by state legislation and awards funds to various entities. Awards become payable by the County when the conditions of the award are met. At December 31, 2010, there were $463,054 in Restaurant Tax funds and $583,995 in RAPZ Tax funds that had been awarded but were not payable because applicable conditions had not been met.
The County has also committed future Restaurant Tax revenues to certain organizations. These amounts include $152,750 over the next 2 years to Logan City for payment of bonds financing the rehabilitation of the Eccles Theatre, $371,412 to NPIC over the next 4 years for facility improvements, and $50,000 in 2011 to BCIA for payment of a loan where the proceeds were used for capital improvements of the facility.
NOTE 10 – INDUSTRIAL REVENUE BONDS
On October 25, 2006, the County issued Industrial Revenue Bonds on behalf of Sunshine Terrace Foundation, Inc. in the amount of $5,000,000. Sunshine Terrace is responsible for all bond payments and neither the County nor its resources are liable for repayment. The bonds are scheduled to mature on December 1, 2026.
On December 22, 2006, the County issued $3,000,000 of Industrial Revenue Bonds on behalf of Lower Foods, Inc. Lower Foods is responsible for all bond payments and neither the County nor its resources are liable for repayment. The bonds are scheduled to mature on December 1, 2026.
NOTE 11 – COMPLIANCE RELATED MATTERS
In the General fund, the Geographic Information Systems department expenditures exceeded its budget by $21,515. Total expenditures in the Mental Health fund exceeded its budget by $812,458.
NOTE 12 – RELATED PARTY TRANSACTIONS

C A C H E C O U N T Y
NOTES TO THE FINANCIAL STATEMENTS FOR THE YEAR ENDED DECEMBER 31, 2010
38
Primary Government
In addition to the transactions previously described in these notes, the County entered into the following significant transactions with component units:
Airport Authority – The County provided services and operating funds based on the budget adopted by the Airport Authority and the agreement with Logan City.
NPIC – The County transferred tax revenues to NPIC in accordance with debt agreements.
BRHD – The County assessed and collected property taxes in its Health fund. The County transferred the appropriated amount of property taxes to BRHD to provide operating funds.
CCEMS – The County provided operating funds based on the budget adopted by CCEMS and the agreement with Logan City. The County also receives contract payments for services provided to CCEMS.
Component Units
Airport Authority – Logan City provides operating funds based on the budget adopted by the Airport Authority and the agreement with Cache County.
CCEMS – Logan City receives contract payments for services provided to CCEMS.

39
This page intentionally left blank.

40
REQUIRED SUPPLEMENTARY INFORMATION

C A C H E C O U N T Y
BUDGETARY COMPARISON SCHEDULE
GENERAL FUND FOR THE YEAR ENDED DECEMBER 31, 2010
41
Variance With
Original Final Actual Final Budget
REVENUES
Taxes:
Property……………………………………… 9,409,262$ 9,407,453$ 9,512,465$ 105,012$
Sales and use………………………………… 3,800,000 3,650,000 3,718,000 68,000
13,209,262 13,057,453 13,230,465 173,012
Other revenues:
Intergovernmental………………………… 1,224,268 1,790,102 1,748,549 (41,553)
Charges for services………………………… 3,979,334 4,591,106 4,366,450 (224,656)
Licenses and permits………………………… 32,000 28,000 25,240 (2,760)
Fines and forfeitures………………………… 152,000 107,000 122,899 15,899
Interest and investment income…………… 150,000 130,000 146,385 16,385
Rental income……………………………… 210,000 210,000 176,337 (33,663)
Public contributions………………………… 44,500 48,671 46,868 (1,803)
Miscellaneous………………………………… 86,050 33,050 65,944 32,894
Total revenues…………………………… 19,087,414 19,995,382 19,929,137 (66,245)
EXPENDITURES
General government:
Council……………………………………… 102,729 102,729 93,498 9,231
Water development………………………… ‐ 339,379 165,545 173,834
Public defender……………………………… 342,108 357,108 322,878 34,230
Executive…………………………………… 211,675 214,675 204,134 10,541
Human resources…………………………… 186,835 186,835 163,737 23,098
Geographic information systems…………… 72,021 33,189 54,704 (21,515)
Information technology…………………… 86,651 86,651 84,850 1,801
Auditor……………………………………… 172,301 172,795 164,932 7,863
Clerk………………………………………… 155,434 155,434 147,799 7,635
Treasurer…………………………………… 18,787 18,787 18,463 324
Recorder…………………………………… 192,567 158,967 155,259 3,708
Attorney……………………………………… 961,244 995,644 967,406 28,238
Surveyor……………………………………… 154,789 182,189 171,557 10,632
Victim services……………………………… 253,127 320,695 266,542 54,153
Elections……………………………………… 251,505 254,855 250,216 4,639
Economic development…………………… 35,000 35,000 35,000 ‐
USU Ag extension services………………… 152,126 153,057 142,857 10,200
Agricultural promotion……………………… 56,650 66,114 50,611 15,503
Miscellaneous and general………………… 628,686 703,340 568,885 134,455
Contributions to other units………………… 754,354 804,354 803,897 457
4,788,589 5,341,797 4,832,770 509,027
Public safety:
Sheriff patrol………………………………… 2,995,406 2,972,653 2,941,901 30,752
Support services…………………………… 1,781,866 1,839,477 1,783,151 56,326
Search and rescue…………………………… 57,500 95,734 43,379 52,355
Mounted posse……………………………… 27,900 27,900 26,966 934
Liquor law enforcement…………………… 52,000 52,000 43,996 8,004
Fire department…………………………… 376,025 668,532 588,595 79,937
County Jail…………………………………… 6,278,531 6,213,474 5,853,377 360,097
Emergency management…………………… 616,238 658,548 602,676 55,872
12,185,466 12,528,318 11,884,041 644,277
Budget Amounts

C A C H E C O U N T Y
BUDGETARY COMPARISON SCHEDULE
GENERAL FUND FOR THE YEAR ENDED DECEMBER 31, 2010
42
Variance With
Original Final Actual Final Budget
Budget Amounts
Streets:
Weed eradication…………………………… 181,245 166,645 163,750 2,895
181,245 166,645 163,750 2,895
Health and welfare:
Mental health services……………………… 185,000 185,000 185,000 ‐
Health services……………………………… 63,490 63,490 63,490 ‐
Welfare services…………………………… 67,500 69,500 67,140 2,360
315,990 317,990 315,630 2,360
Culture and recreation:
Fairgrounds………………………………… 307,656 412,381 406,066 6,315
TV translator station………………………… 14,600 15,600 11,037 4,563
Library services……………………………… 81,553 199,637 129,204 70,433
Fair and rodeo……………………………… 156,900 174,413 166,022 8,391
Demolition derbies………………………… 46,000 46,000 34,199 11,801
606,709 848,031 746,528 101,503
Total expenditures………………………… 18,077,999 19,202,781 17,942,719 1,260,062
Revenues over expenditures………………… 1,009,415 792,601 1,986,418 1,193,817
OTHER FINANCING SOURCES (USES)
Transfers in:
Municipal services fund……………………… 416,957 416,957 416,957 ‐
Recreation fund……………………………… ‐ 10,000 10,000 ‐
RAPZ tax fund……………………………… 16,275 58,275 58,275 ‐
Total transfers in…………………………… 433,232 485,232 485,232 ‐
Transfers out:
Water development fund…………………… (206,281) ‐ ‐ ‐
Council on aging fund……………………… (195,000) (195,000) (195,000) ‐
Planning and development fund…………… (59,500) (41,184) (41,184) ‐
Library fund………………………………… (35,000) ‐ ‐ ‐
Debt service fund…………………………… (1,480,426) (1,480,426) (1,480,426) ‐
Total transfers out………………………… (1,976,207) (1,716,610) (1,716,610) ‐
Total other financing sources (uses)…. (1,542,975) (1,231,378) (1,231,378) ‐
Net change in fund balances………… (533,560) (438,777) 755,040 1,193,817
Fund balances ‐ January 1, as restated………… 6,530,022 6,530,022 6,530,022 ‐
Fund balances ‐ December 31………………… 5,996,462$ 6,091,245$ 7,285,062$ 1,193,817$

C A C H E C O U N T Y
BUDGETARY COMPARISON SCHEDULE
ASSESSING AND COLLECTING FUND FOR THE YEAR ENDED DECEMBER 31, 2010
43
Variance With
Original Final Actual Final Budget
REVENUES
Taxes:
Property…………………………………… 2,624,684$ 2,635,908$ 2,926,953$ 291,045$
Other revenues:
Charges for services……………………… 434,000 390,000 378,760 (11,240)
Interest income…………………………… ‐ ‐ 1,863 1,863
Miscellaneous…………………………… ‐ ‐ 1,872 1,872
Total revenues………………………… 3,058,684 3,025,908 3,309,448 283,540
EXPENDITURES
General government:
Council…………………………………… 11,414 11,414 10,389 1,025
Executive………………………………… 37,406 37,406 36,023 1,383
Human resources………………………… 31,489 31,489 28,894 2,595
Geographic information systems………… 168,050 168,050 127,644 40,406
Information technology………………… 491,023 491,023 480,819 10,204
Auditor…………………………………… 146,775 146,775 140,498 6,277
Treasurer………………………………… 216,056 216,056 212,321 3,735
Recorder………………………………… 128,378 128,378 103,507 24,871
Attorney…………………………………… 95,068 95,068 95,678 (610)
Assessor…………………………………… 1,340,086 1,400,310 1,129,950 270,360
Miscellaneous and general……………… 110,721 110,721 109,204 1,517
Contributions to other units……………… ‐ 62,705 67,279 (4,574)
Total expenditures……………………… 2,776,466 2,899,395 2,542,206 357,189
Revenues over expenditures……………… 282,218 126,513 767,242 640,729
Net change in fund balances……… 282,218 126,513 767,242 640,729
Fund balances ‐ January 1…………………… 2,239,228 2,239,228 2,239,228 ‐
Fund balances ‐ December 31……………… 2,521,446$ 2,365,741$ 3,006,470$ 640,729$
Budget Amounts
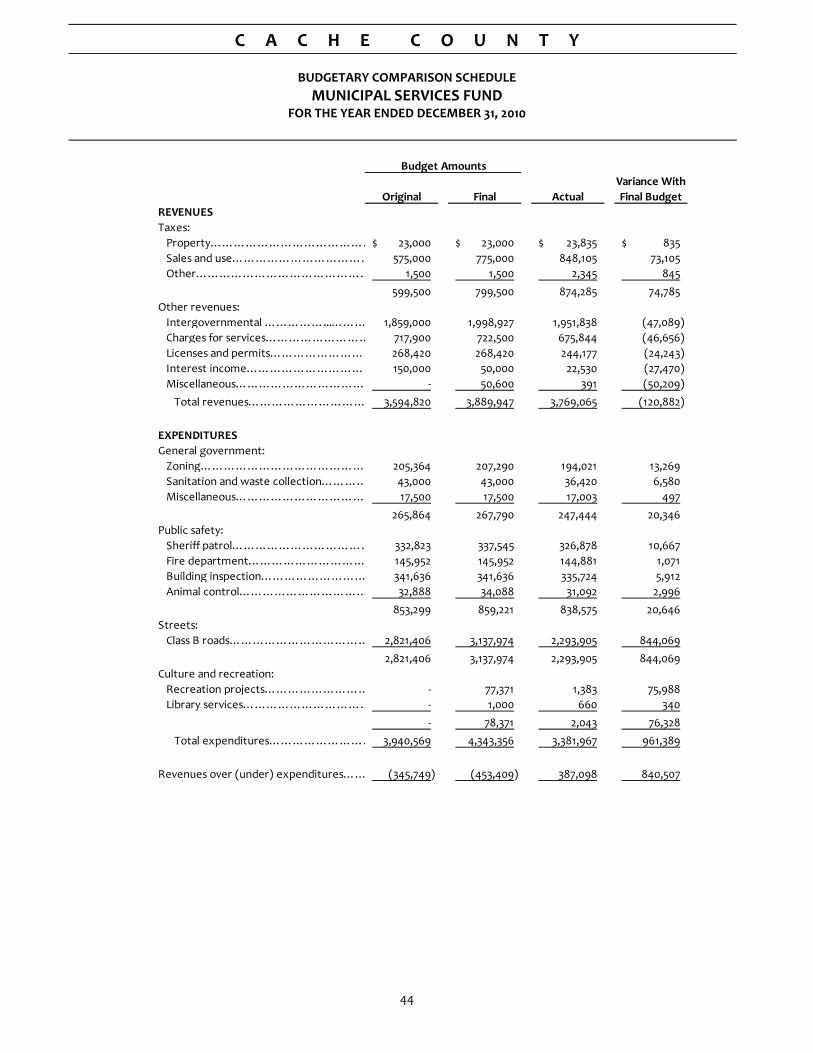
C A C H E C O U N T Y
BUDGETARY COMPARISON SCHEDULE
MUNICIPAL SERVICES FUND FOR THE YEAR ENDED DECEMBER 31, 2010
44
Variance With
Original Final Actual Final Budget
REVENUES
Taxes:
Property…………………………………… 23,000$ 23,000$ 23,835$ 835$
Sales and use……………………………… 575,000 775,000 848,105 73,105
Other……………………………………… 1,500 1,500 2,345 845
599,500 799,500 874,285 74,785
Other revenues:
Intergovernmental ……………...……… 1,859,000 1,998,927 1,951,838 (47,089)
Charges for services……………………… 717,900 722,500 675,844 (46,656)
Licenses and permits……………………… 268,420 268,420 244,177 (24,243)
Interest income…………………………… 150,000 50,000 22,530 (27,470)
Miscellaneous…………………………… ‐ 50,600 391 (50,209)
Total revenues………………………… 3,594,820 3,889,947 3,769,065 (120,882)
EXPENDITURES
General government:
Zoning…………………………………… 205,364 207,290 194,021 13,269
Sanitation and waste collection………… 43,000 43,000 36,420 6,580
Miscellaneous…………………………… 17,500 17,500 17,003 497
265,864 267,790 247,444 20,346
Public safety:
Sheriff patrol……………………………… 332,823 337,545 326,878 10,667
Fire department………………………… 145,952 145,952 144,881 1,071
Building inspection……………………… 341,636 341,636 335,724 5,912
Animal control…………………………… 32,888 34,088 31,092 2,996
853,299 859,221 838,575 20,646
Streets:
Class B roads……………………………… 2,821,406 3,137,974 2,293,905 844,069
2,821,406 3,137,974 2,293,905 844,069
Culture and recreation:
Recreation projects……………………… ‐ 77,371 1,383 75,988
Library services…………………………… ‐ 1,000 660 340
‐ 78,371 2,043 76,328
Total expenditures……………………… 3,940,569 4,343,356 3,381,967 961,389
Revenues over (under) expenditures…… (345,749) (453,409) 387,098 840,507
Budget Amounts

C A C H E C O U N T Y
BUDGETARY COMPARISON SCHEDULE
MUNICIPAL SERVICES FUND FOR THE YEAR ENDED DECEMBER 31, 2010
45
Variance With
Original Final Actual Final Budget
Budget Amounts
OTHER FINANCING SOURCES (USES)
Transfers in:
RAPZ tax fund…………………………… ‐ 10,548 10,548 ‐
Total transfers in………………………… ‐ 10,548 10,548 ‐
Transfers out:
General fund……………………………… (416,957) (416,957) (416,957) ‐
Total transfers out……………………… (416,957) (416,957) (416,957) ‐
Total other financing sources (uses)… (416,957) (406,409) (406,409) ‐
Net change in fund balances……… (762,706) (859,818) (19,311) 840,507
Fund balances ‐ January 1…………………… 5,231,397 5,231,397 5,231,397 ‐
Fund balances ‐ December 31……………… 4,468,691$ 4,371,579$ 5,212,086$ 840,507$

C A C H E C O U N T Y
BUDGETARY COMPARISON SCHEDULE
MENTAL HEALTH FUND FOR THE YEAR ENDED DECEMBER 31, 2010
46
Variance With
Original Final Actual Final Budget
REVENUES
Other revenues:
Intergovernmental revenue…………… 1,686,000$ 1,686,000$ 2,498,458$ 812,458$
Total revenues………………………… 1,686,000 1,686,000 2,498,458 812,458
EXPENDITURES
Health and welfare:
Mental health services…………………… 1,686,000 1,686,000 2,498,458 (812,458)
Total expenditures……………………… 1,686,000 1,686,000 2,498,458 (812,458)
Revenues under expenditures…………… ‐ ‐ ‐ ‐
Net change in fund balances………… ‐ ‐ ‐ ‐
Fund balances ‐ January 1…………………… ‐ ‐ ‐ ‐
Fund balances ‐ December 31……………… ‐$ ‐$ ‐$ ‐$
Budget Amounts

C A C H E C O U N T Y
NOTES TO THE REQUIRED SUPPLEMENTARY INFORMATION FOR THE YEAR ENDED DECEMBER 31, 2010
47
NOTE 1 – BUDGETS AND BUDGETARY ACCOUNTING
The County is required by state statute and the Uniform Fiscal Procedures Act for Utah Counties to adopt annual budgets for its governmental funds on or before December 15, for the succeeding fiscal year beginning January 1. This budget is shown as the original budget on the budgetary comparison schedules. Final budgets include the original budget amounts plus any amendments made to the budget during the year by the County Council through formal resolution.
The budgets for the County’s funds are adopted on a basis consistent with generally accepted accounting principles (GAAP). All annual appropriations lapse at year end. Project‐length financial plans have been adopted for the Capital Projects Fund.
The County complies with the following procedures in establishing the budgetary data reflected in the financial statements:
1. On or before November 1, the County Executive prepares a tentative budget for the next budget year, with the assistance of the County Auditor and Finance Director.
2. A public hearing is then held on the adoption of the budget.
3. After the public hearing the County Council makes final adjustments to the tentative budget.
4. On or before December 15, the County Council adopts the budget by resolution.
5. Department heads may transfer unexpended budgeted amounts within their departments with approval of the County Council.
6. The County Council may transfer unexpended budgeted amounts from one department to another in the same fund by resolution.
7. Budget appropriations may be increased only after a public hearing has been held and followed by resolution of the County Council.
NOTE 2 – BUDGETED FUND BALANCE
Each fund had a balanced budget in accordance with state law. As allowed by state law, the County Council has authorized the use of unassigned fund balances to provide the necessary resources to balance each fund’s budget.
NOTE 3 – ENCUMBRANCES
The County uses encumbrances during the year to recognize the use of appropriations. The County’s policy is for all appropriations to lapse at year end. Therefore, there are no encumbrances at year end.
NOTE 4 – EXPENDITURES IN EXCESS OF BUDGET
In the General fund the Geographic Information Systems department exceeded its budget by $21,515. Total expenditures in the Mental Health fund exceeded its budget by $812,458.

48
SUPPLEMENTARY INFORMATION

C A C H E C O U N T Y
COMBINING BALANCE SHEET
NONMAJOR GOVERNMENTAL FUNDS FOR THE YEAR ENDED DECEMBER 31, 2010
Total
Council Planning Children's Nonmajor
Visitor's on and Justice RAPZ Community Debt Governmental
Health Bureau Aging Recreation Development Center Tax Ambulance Foundation Service Funds
ASSETS
Cash and cash equivalents………………… 331,152$ 225$ 90$ ‐$ 25$ 100$ ‐$ ‐$ 6,176$ ‐$ 337,768$
Equity in investment pool………………… 454,338 470,356 86,661 892,222 161,210 ‐ 1,438,634 273,246 ‐ 139,383 3,916,050
Taxes receivable, net……………………… 74,000 35,782 ‐ 168,492 ‐ ‐ 214,320 ‐ ‐ ‐ 492,594
Due from other governments…………… ‐ 13,226 84,205 ‐ ‐ 36,652 ‐ 15,954 ‐ ‐ 150,037
Restricted cash and investments………… ‐ ‐ ‐ ‐ ‐ ‐ ‐ ‐ ‐ 21,152 21,152
Total assets……………………………… 859,490$ 519,589$ 170,956$ 1,060,714$ 161,235$ 36,752$ 1,652,954$ 289,200$ 6,176$ 160,535$ 4,917,601$
LIABILITIES
Interfund payable ‐ investment pool……… ‐$ ‐$ ‐$ ‐$ ‐$ 29,353$ ‐$ ‐$ ‐$ ‐$ 29,353$
Accounts payable and accrued liabilities… ‐ 38,345 27,262 30,000 3,255 4,533 13,702 109,922 ‐ ‐ 227,019
Deferred revenue………………………… 74,000 ‐ 1,300 ‐ ‐ ‐ ‐ ‐ ‐ ‐ 75,300
Total liabilities…………………………… 74,000 38,345 28,562 30,000 3,255 33,886 13,702 109,922 ‐ ‐ 331,672
FUND BALANCE
Restricted for:
Air pollution control……………………… 97,422 ‐ ‐ ‐ ‐ ‐ ‐ ‐ ‐ ‐ 97,422
Ambulance services……………………… ‐ ‐ ‐ ‐ ‐ ‐ ‐ 179,278 ‐ ‐ 179,278
Debt service……...……………………… ‐ ‐ ‐ ‐ ‐ ‐ ‐ ‐ ‐ 21,152 21,152
Health services…………………………… 688,068 ‐ ‐ ‐ ‐ ‐ ‐ ‐ ‐ ‐ 688,068
Parks and recreation……………………… ‐ 481,244 ‐ 1,030,714 153,530 ‐ 1,639,252 ‐ ‐ ‐ 3,304,740
Other purposes…………………………… ‐ ‐ 9,387 ‐ ‐ 2,866 ‐ ‐ 6,176 ‐ 18,429
Assigned to:
Debt service……………………………… ‐ ‐ ‐ ‐ ‐ ‐ ‐ ‐ ‐ 139,383 139,383
Health and welfare……………………… ‐ ‐ 133,007 ‐ ‐ ‐ ‐ ‐ ‐ ‐ 133,007
Planning and development services…… ‐ ‐ ‐ ‐ 4,450 ‐ ‐ ‐ ‐ ‐ 4,450
Total fund balances…………………… 785,490 481,244 142,394 1,030,714 157,980 2,866 1,639,252 179,278 6,176 160,535 4,585,929
Total liabilities and fund balances………… 859,490$ 519,589$ 170,956$ 1,060,714$ 161,235$ 36,752$ 1,652,954$ 289,200$ 6,176$ 160,535$ 4,917,601$
Special Revenue
49

C A C H E C O U N T Y
COMBINING SCHEDULE OF REVENUES, EXPENDITURES, AND CHANGES IN FUND BALANCES
NONMAJOR GOVERNMENTAL FUNDS FOR THE YEAR ENDED DECEMBER 31, 2010
Total
Council Planning Children's Nonmajor
Visitor's on and Justice RAPZ Community Debt Governmental
Health Bureau Aging Recreation Development Center Tax Ambulance Foundation Service Funds
REVENUES
Taxes:
Property…………………………………. 795,713$ ‐$ ‐$ ‐$ ‐$ ‐$ ‐$ ‐$ ‐$ ‐$ 795,713$
Sales and use……………………………… ‐ ‐ ‐ 978,994 ‐ ‐ 1,123,006 ‐ ‐ ‐ 2,102,000
Other……………………………………… ‐ 340,784 ‐ ‐ ‐ ‐ ‐ ‐ ‐ ‐ 340,784
795,713 340,784 ‐ 978,994 ‐ ‐ 1,123,006 ‐ ‐ ‐ 3,238,497
Other revenues:
Intergovernmental……………………… ‐ 60,512 310,573 ‐ ‐ 142,017 ‐ 562,454 ‐ ‐ 1,075,556
Charges for services……………………… 62 40,441 113,222 ‐ 46,385 ‐ ‐ ‐ ‐ ‐ 200,110
Interest income………………………… 542 ‐ ‐ ‐ ‐ ‐ ‐ ‐ 3 ‐ 545
Public contributions……………………… ‐ 6,300 16,226 ‐ ‐ 1,594 ‐ ‐ ‐ ‐ 24,120
Miscellaneous…………………………… ‐ 245 10,518 ‐ ‐ ‐ ‐ ‐ 4,335 ‐ 15,098
Total revenues………………………… 796,317 448,282 450,539 978,994 46,385 143,611 1,123,006 562,454 4,338 ‐ 4,553,926
EXPENDITURES
General government……………………… ‐ ‐ ‐ ‐ 99,502 ‐ ‐ ‐ 4,312 ‐ 103,814
Public safety………………………………… ‐ ‐ ‐ ‐ ‐ 140,413 ‐ 540,082 ‐ ‐ 680,495
Health and welfare………………………… 780,057 ‐ 647,798 ‐ ‐ ‐ ‐ ‐ ‐ ‐ 1,427,855
Culture and recreation…………………… ‐ 401,835 ‐ 1,146,334 ‐ ‐ 755,137 ‐ ‐ ‐ 2,303,306
Debt service principal……………………… ‐ ‐ ‐ ‐ ‐ ‐ ‐ ‐ ‐ 919,687 919,687
Debt service interest……………………… ‐ ‐ ‐ ‐ ‐ ‐ ‐ ‐ ‐ 570,739 570,739
Total expenditures……………………… 780,057 401,835 647,798 1,146,334 99,502 140,413 755,137 540,082 4,312 1,490,426 6,005,896
Revenues over (under) expenditures…… 16,260 46,447 (197,259) (167,340) (53,117) 3,198 367,869 22,372 26 (1,490,426) (1,451,970)
OTHER FINANCING SOURCES (USES)
Transfers in………………………………… ‐ 75,000 200,000 ‐ 98,440 ‐ ‐ ‐ ‐ 1,480,426 1,853,866
Transfers out……………………………… ‐ ‐ ‐ (147,256) ‐ ‐ (68,823) ‐ ‐ ‐ (216,079)
Total other financing sources (uses)…… ‐ 75,000 200,000 (147,256) 98,440 ‐ (68,823) ‐ ‐ 1,480,426 1,637,787
Net change in fund balances…………… 16,260 121,447 2,741 (314,596) 45,323 3,198 299,046 22,372 26 (10,000) 185,817
Fund balances ‐ January 1, as restated…… 769,230 359,797 139,653 1,345,310 112,657 (332) 1,340,206 156,906 6,150 170,535 4,400,112
Fund balances ‐ December 31……………… 785,490$ 481,244$ 142,394$ 1,030,714$ 157,980$ 2,866$ 1,639,252$ 179,278$ 6,176$ 160,535$ 4,585,929$
Special Revenue
50

C A C H E C O U N T Y
BUDGETARY COMPARISON SCHEDULE
HEALTH FUND FOR THE YEAR ENDED DECEMBER 31, 2010
51
Variance With
Original Final Actual Final Budget
REVENUES
Taxes:
Property…………………………………… 785,658$ 784,053$ 795,713$ 11,660$
Other revenues:
Charges for services……………………… ‐ ‐ 62 62
Interest income…………………………… ‐$ ‐$ 542$ 542$
Total revenues………………………… 785,658 784,053 796,317 12,264
EXPENDITURES
Health and welfare:
Air pollution control……………………… 28,000 47,700 47,607 93
Bear River Health Department………… 747,099 747,099 732,450 14,649
Total expenditures……………………… 775,099 794,799 780,057 14,742
Revenues over (under) expenditures…… 10,559 (10,746) 16,260 27,006
Net change in fund balances………… 10,559 (10,746) 16,260 27,006
Fund balances ‐ January 1…………………… 769,230 769,230 769,230 ‐
Fund balances ‐ December 31……………… 779,789$ 758,484$ 785,490$ 27,006$
Budget Amounts

C A C H E C O U N T Y
BUDGETARY COMPARISON SCHEDULE
VISITOR’S BUREAU FUND FOR THE YEAR ENDED DECEMBER 31, 2010
52
Variance With
Original Final Actual Final Budget
REVENUES
Taxes:
Other……………………………………… 300,000$ 305,600$ 340,784$ 35,184$
Other revenues:
Intergovernmental …………………...… 95,400 150,397 60,512 (89,885)
Charges for services……………………… 28,000 28,000 40,441 12,441
Public contributions……………………… 4,000 7,500 6,300 (1,200)
Miscellaneous…………………………… ‐ ‐ 245 245
Total revenues………………………… 427,400 491,497 448,282 (43,215)
EXPENDITURES
Culture and recreation:
Cache Valley Visitor's Bureau…………… 467,975 566,497 401,835 164,662
Total expenditures……………………… 467,975 566,497 401,835 164,662
Revenues over (under) expenditures…… (40,575) (75,000) 46,447 121,447
OTHER FINANCING SOURCES
Transfers in:
Recreation fund…………………………… ‐ 75,000 75,000 ‐
Total other financing sources………… ‐ 75,000 75,000 ‐
Net change in fund balances………… (40,575) ‐ 121,447 121,447
Fund balances ‐ January 1…………………… 359,797 359,797 359,797 ‐
Fund balances ‐ December 31……………… 319,222$ 359,797$ 481,244$ 121,447$
Budget Amounts

C A C H E C O U N T Y
BUDGETARY COMPARISON SCHEDULE
COUNCIL ON AGING FUND FOR THE YEAR ENDED DECEMBER 31, 2010
53
Variance With
Original Final Actual Final Budget
REVENUES
Other revenues:
Intergovernmental……………………… 321,546$ 347,962$ 310,573$ (37,389)$
Charges for services……………………… 135,500 119,500 113,222 (6,278)
Public contributions……………………… 20,500 22,500 16,226 (6,274)
Miscellaneous…………………………… 9,000 9,000 10,518 1,518
Total revenues………………………… 486,546 498,962 450,539 (48,423)
EXPENDITURES
Health and welfare:
Nutrition mandated……………………… 400,511 395,811 380,533 15,278
Senior center……………………………… 104,764 107,964 98,153 9,811
Retired service volunteer program……… 46,561 73,417 45,998 27,419
Access mandated………………………… 88,195 83,195 78,351 4,844
County administrative support…………… 45,301 45,301 44,763 538
Total expenditures……………………… 685,332 705,688 647,798 57,890
Revenues under expenditures…………… (198,786) (206,726) (197,259) 9,467
OTHER FINANCING SOURCES
Transfers in:
General fund……………………………… 195,000 195,000 195,000 ‐
Recreation fund…………………………… ‐ 5,000 5,000 ‐
RAPZ tax fund…………………………… ‐ ‐ ‐ ‐
Total other financing sources………… 195,000 200,000 200,000 ‐
Net change in fund balances………… (3,786) (6,726) 2,741 9,467
Fund balances ‐ January 1…………………… 139,653 139,653 139,653 ‐
Fund balances ‐ December 31……………… 135,867$ 132,927$ 142,394$ 9,467$
Budget Amounts

C A C H E C O U N T Y
BUDGETARY COMPARISON SCHEDULE
RECREATION FUND FOR THE YEAR ENDED DECEMBER 31, 2010
54
Variance With
Original Final Actual Final Budget
REVENUES
Taxes:
Sales and use………...…………………… 940,000$ 970,000$ 978,994$ 8,994$
Total revenues………………………… 940,000 970,000 978,994 8,994
EXPENDITURES
Culture and Recreation:
Projects……...…………………………… 940,000 1,903,224 1,146,334 756,890
Total expenditures……………………… 940,000 1,903,224 1,146,334 756,890
Revenues under expenditures…………… ‐ (933,224) (167,340) 765,884
OTHER FINANCING USES
Transfers out:
General fund……………………………… ‐ (10,000) (10,000) ‐
Visitor's Bureau fund……………………… ‐ (75,000) (75,000) ‐
Council on aging fund…………………… ‐ (5,000) (5,000) ‐
Planning and development fund………… ‐ (57,256) (57,256) ‐
Total other financing uses………….…… ‐ (147,256) (147,256) ‐
Net change in fund balances………… ‐ (1,080,480) (314,596) 765,884
Fund balances ‐ January 1…………………… 1,345,310 1,345,310 1,345,310 ‐
Fund balances ‐ December 31……………… 1,345,310$ 264,830$ 1,030,714$ 765,884$
Budget Amounts

C A C H E C O U N T Y
BUDGETARY COMPARISON SCHEDULE
PLANNING AND DEVELOPMENT FUND FOR THE YEAR ENDED DECEMBER 31, 2010
55
Variance With
Original Final Actual Final Budget
REVENUES
Other revenues:
Charges for services……………………… 41,184$ 41,184$ 46,385$ 5,201$
Total revenues………………………… 41,184 41,184 46,385 5,201
EXPENDITURES
General government:
Planning and development services…… 163,585 253,841 99,502 154,339
Total expenditures……………………… 163,585 253,841 99,502 154,339
Revenues under expenditures…………… (122,401) (212,657) (53,117) 159,540
OTHER FINANCING SOURCES
Transfers in:
General fund……………………………… 41,184 41,184 41,184 ‐
Recreation fund…………………………… ‐ 57,256 57,256 ‐
Total other financing sources……...…… 41,184 98,440 98,440 ‐
Net change in fund balances………… (81,217) (114,217) 45,323 159,540
Fund balances ‐ January 1…………………… 112,657 112,657 112,657 ‐
Fund balances ‐ December 31……………… 31,440$ (1,560)$ 157,980$ 159,540$
Budget Amounts

C A C H E C O U N T Y
BUDGETARY COMPARISON SCHEDULE
CHILDREN’S JUSTICE CENTER FUND FOR THE YEAR ENDED DECEMBER 31, 2010
56
Variance With
Original Final Actual Final Budget
REVENUES
Other revenues:
Intergovernmental……………………… 145,540$ 171,124$ 142,017$ (29,107)$
Public contributions……………………… ‐ 1,594 1,594 ‐
Total revenues………………………… 145,540 172,718 143,611 (29,107)
EXPENDITURES
Public safety:
Children's services 145,540 172,385 140,413 31,972
Total expenditures……………………… 145,540 172,385 140,413 31,972
Revenues over expenditures……………… ‐ 333 3,198 2,865
Net change in fund balances………… ‐ 333 3,198 2,865
Fund balances ‐ January 1…………………… (332) (332) (332) ‐
Fund balances ‐ December 31……………… (332)$ 1$ 2,866$ 2,865$
Budget Amounts

C A C H E C O U N T Y
BUDGETARY COMPARISON SCHEDULE
RAPZ TAX FUND FOR THE YEAR ENDED DECEMBER 31, 2010
57
Variance With
Original Final Actual Final Budget
REVENUES
Taxes:
Sales and use……………………………… 1,100,000$ 1,100,000$ 1,123,006$ 23,006$
Total revenues………………………… 1,100,000 1,100,000 1,123,006 23,006
EXPENDITURES
Culture and recreation:
Projects……..…………………………… 1,068,725 1,420,830 755,137 665,693
Total expenditures……………………… 1,068,725 1,420,830 755,137 665,693
Revenues over (under) expenditures…… 31,275 (320,830) 367,869 688,699
OTHER FINANCING USES
Transfers out:
General fund……………………………… (16,275) (58,275) (58,275) ‐
Municipal services fund…………………… ‐ (10,548) (10,548) ‐
Total other financing uses…………...… (16,275) (68,823) (68,823) ‐
Net change in fund balances………… 15,000 (389,653) 299,046 688,699
Fund balances ‐ January 1…………………… 1,340,206 1,340,206 1,340,206 ‐
Fund balances ‐ December 31……………… 1,355,206$ 950,553$ 1,639,252$ 688,699$
Budget Amounts

C A C H E C O U N T Y
BUDGETARY COMPARISON SCHEDULE
AMBULANCE FUND FOR THE YEAR ENDED DECEMBER 31, 2010
58
Variance With
Original Final Actual Final Budget
REVENUES
Other revenues:
Intergovernmental……………………… 546,210$ 563,469$ 562,454$ (1,015)$
Total revenues………………………… 546,210 563,469 562,454 (1,015)
EXPENDITURES
Public safety:
Ambulance services……………………… 539,472 558,613 540,082 18,531
Total expenditures……………………… 539,472 558,613 540,082 18,531
Revenues over expenditures……………… 6,738 4,856 22,372 17,516
Net change in fund balances………… 6,738 4,856 22,372 17,516
Fund balances ‐ January 1…………………… 156,906 156,906 156,906 ‐
Fund balances ‐ December 31……………… 163,644$ 161,762$ 179,278$ 17,516$
Budget Amounts

C A C H E C O U N T Y
BUDGETARY COMPARISON SCHEDULE
DEBT SERVICE FUND FOR THE YEAR ENDED DECEMBER 31, 2010
59
Variance With
Original Final Actual Final Budget
REVENUES
Other revenues:
Interest income…………………………… 10,000$ ‐$ ‐$ ‐$
Total revenues………………………… 10,000 ‐ ‐ ‐
EXPENDITURES
Debt service:
Principal…………………………………… 919,687 920,687 919,687 1,000
Interest …………………………..……… 570,739 570,739 570,739 ‐
Total expenditures……………………… 1,490,426 1,491,426 1,490,426 1,000
Revenues under expenditures…………… (1,480,426) (1,491,426) (1,490,426) 1,000
OTHER FINANCING SOURCES
Transfers in:
General fund……………………………… 1,480,426 1,480,426 1,480,426 ‐
Total other financing sources………… 1,480,426 1,480,426 1,480,426 ‐
Net change in fund balances………… ‐ (11,000) (10,000) 1,000
Fund balances ‐ January 1…………………… 170,535 170,535 170,535 ‐
Fund balances ‐ December 31……………… 170,535$ 159,535$ 160,535$ 1,000$
Budget Amounts

C A C H E C O U N T Y
COMBINING SCHEDULE OF FIDUCIARY NET ASSETS
AGENCY FUNDS FOR THE YEAR ENDED DECEMBER 31, 2010
60
Health Total
Fee Trust Department Treasurer's Agency
Fund 125 Plan Tax Fund Funds
ASSETS
Cash and cash equivalents…………………… ‐$ 4,810$ 22,750,801$ 22,755,611$
Equity in investment pool…………………… 185,125 ‐ ‐ 185,125
Taxes receivable……………………………… ‐ ‐ 706,288 706,288
Total assets………………………………… 185,125$ 4,810$ 23,457,089$ 23,647,024$
LIABILITIES
Due to other taxing units…………………… ‐$ ‐$ 23,008,607$ 23,008,607$
Due to employees…………………………… ‐ 4,810 ‐ 4,810
Refunds payable……………………………… ‐ ‐ 448,482 448,482
Other payables………………………………… 185,125 ‐ ‐ 185,125
Total liabilities……………………………… 185,125$ 4,810$ 23,457,089$ 23,647,024$

C A C H E C O U N T Y TREASURER’S TAX FUND
SCHEDULE OF TAXES CHARGED, COLLECTED, AND DISBURSED FOR THE YEAR ENDED DECEMBER 31, 2010
61
CURRENT YEAR TAXES
1 2 3 4 5 6 7 8 9 10 11
Taxing Entities Year‐End Real
Property Value
Year‐End
Centrally
Assessed
Property Value
Total Real and
Centrally
Assessed RDA
Value
Total Adjusted
Real and Centrally
Assesed Value
(2 + 3 ‐ 4)
Year‐End
Personal
Property Value
Personal
Property RDA
Value
Total Adjusted
Personal
Property Value
(6 ‐ 7)
Total Adjusted
Value
(5 + 8)
Current Year
Real & Centrally
Assessed Prop.
Tax Rate
Prior Year
Personal Tax
Rate
County Funds
Cache County General Fund 4,808,811,930 167,278,305 202,882,861 4,773,207,374 421,201,612 81,799,895 339,401,717 5,112,609,091 0.001672 0.001574
Cache County Health 4,808,811,930 167,278,305 202,882,861 4,773,207,374 421,201,612 81,799,895 339,401,717 5,112,609,091 0.000142 0.000134
Multi‐County Assessing/Coll 4,808,811,930 167,278,305 ‐ 4,976,090,235 421,201,612 ‐ 421,201,612 5,397,291,847 0.000162 0.000142
County Assessing/Collecting 4,808,811,930 167,278,305 ‐ 4,976,090,235 421,201,612 ‐ 421,201,612 5,397,291,847 0.000318 0.000300
Cities and Towns
Amalga 26,924,000 1,039,440 ‐ 27,963,440 12,276,181 ‐ 12,276,181 40,239,621 0.000639 0.000595
Clarkston 18,467,210 734,705 ‐ 19,201,915 52,100 ‐ 52,100 19,254,015 0.001769 0.001683
Cornish 9,935,935 2,350,490 ‐ 12,286,425 16,293 ‐ 16,293 12,302,718 0.002029 0.002104
Hyde Park 203,676,695 2,937,685 ‐ 206,614,380 4,774,529 ‐ 4,774,529 211,388,909 0.001012 0.000917
Hyrum 229,898,060 2,931,020 ‐ 232,829,080 14,942,384 ‐ 14,942,384 247,771,464 0.001658 0.001437
Lewiston 74,835,000 4,374,350 ‐ 79,209,350 9,702,667 ‐ 9,702,667 88,912,017 0.002152 0.002115
Logan 1,827,576,475 32,291,875 187,520,434 1,672,347,916 260,567,930 74,430,207 186,137,723 1,858,485,639 0.002296 0.002157
Mendon 46,209,220 1,007,005 ‐ 47,216,225 283,731 ‐ 283,731 47,499,956 0.001684 0.001579
Millville 76,596,435 1,897,140 ‐ 78,493,575 1,687,474 ‐ 1,687,474 80,181,049 0.000678 0.000632
Newton 25,570,545 727,975 ‐ 26,298,520 464,737 ‐ 464,737 26,763,257 0.001236 0.001285
Nibley 200,912,780 4,030,650 ‐ 204,943,430 4,044,397 ‐ 4,044,397 208,987,827 0.001587 0.001426
North Logan 537,968,155 8,198,965 ‐ 546,167,120 29,695,998 ‐ 29,695,998 575,863,118 0.001759 0.001616
Paradise 36,221,325 1,013,660 ‐ 37,234,985 334,957 ‐ 334,957 37,569,942 0.001052 0.000948
Providence 359,028,970 5,429,260 ‐ 364,458,230 8,474,385 ‐ 8,474,385 372,932,615 0.001124 0.001039
Richmond 83,362,705 3,697,595 ‐ 87,060,300 4,847,715 ‐ 4,847,715 91,908,015 0.001102 0.001057
River Heights 64,586,690 956,945 ‐ 65,543,635 373,255 ‐ 373,255 65,916,890 0.001284 0.001194
Smithfield 376,179,720 8,830,020 15,362,428 369,647,312 20,952,591 7,369,688 13,582,903 383,230,215 0.001364 0.001486
Trenton 17,988,255 2,816,510 ‐ 20,804,765 664,490 ‐ 664,490 21,469,255 0.000751 0.000817
Wellsville 132,036,015 4,443,840 ‐ 136,479,855 1,248,239 ‐ 1,248,239 137,728,094 0.001154 0.001072
Special Districts
Dranage #3 ‐ ‐ ‐ ‐ ‐ ‐ ‐ ‐ 1.000000 1.000000
Dranage #4 ‐ ‐ ‐ ‐ ‐ ‐ ‐ ‐ 3.000000 3.000000
Dranage #5 ‐ ‐ ‐ ‐ ‐ ‐ ‐ ‐ 1.000000 1.000000
Dranage #6 ‐ ‐ ‐ ‐ ‐ ‐ ‐ ‐ 0.500000 0.500000
Wellsville / Mendon ‐ ‐ ‐ ‐ ‐ ‐ ‐ ‐ 19.000000 19.000000
Noxious Weeds ‐ ‐ ‐ ‐ ‐ ‐ ‐ ‐ 1.000000 1.000000
Garbage ‐ ‐ ‐ ‐ ‐ ‐ ‐ ‐ 1.000000 1.000000
Greenbelt Rollback ‐ ‐ ‐ ‐ ‐ ‐ ‐ ‐ 1.000000 1.000000
Logan Special Improve #1 ‐ ‐ ‐ ‐ ‐ ‐ ‐ ‐ 1.000000 1.000000
Logan Special Improve #2 ‐ ‐ ‐ ‐ ‐ ‐ ‐ ‐ 1.000000 1.000000
Logan Temple Improvement ‐ ‐ ‐ ‐ ‐ ‐ ‐ ‐ 1.000000 1.000000
Logan 600 W 100 S Improv. ‐ ‐ ‐ ‐ ‐ ‐ ‐ ‐ 1.000000 1.000000
State Assessed Revision ‐ ‐ ‐ ‐ ‐ ‐ ‐ ‐ 1.000000 1.000000
Penalty ‐ ‐ ‐ ‐ ‐ ‐ ‐ ‐ 1.000000 1.000000
Delinquent Benson Culinary ‐ ‐ ‐ ‐ ‐ ‐ ‐ ‐ 1.000000 1.000000
Powder Mountain 1,862,450 60,015 ‐ 1,922,465 5,018,973 ‐ 5,018,973 6,941,438 0.000413 0.000311
Cache Mosquito Abatement 2,842,038,340 131,090,240 ‐ 2,973,128,580 159,925,470 ‐ 159,925,470 3,133,054,050 0.000085 0.000065
Mosquito Abatement 38,389,100 1,925,585 ‐ 40,314,685 ‐ ‐ ‐ 40,314,685 0.000243 0.000227
Benson Culinary H2O 27,001,690 1,824,615 ‐ 28,826,305 50,759 ‐ 50,759 28,877,064 0.000000 0.000000
Cache Valley Transit District 3,982,025,970 75,251,065 ‐ 4,057,277,035 360,063,326 ‐ 360,063,326 4,417,340,361 0.000000 0.000000
Cemetery Districts
Avon Cemetery 52,479,490 874,320 ‐ 53,353,810 5,046,488 ‐ 5,046,488 58,400,298 0.000135 0.000119
Cornish Cemetery 11,851,490 13,680,320 ‐ 25,531,810 16,293 ‐ 16,293 25,548,103 0.000356 0.000367
Hyde Park Cemetery 303,194,505 4,597,220 ‐ 307,791,725 5,706,851 ‐ 5,706,851 313,498,576 0.000205 0.000189
Millville/Nibley Cemetery 252,212,695 7,245,785 ‐ 259,458,480 5,731,871 ‐ 5,731,871 265,190,351 0.000097 0.000089
Newton Cemetery 38,871,540 9,842,715 ‐ 48,714,255 464,737 ‐ 464,737 49,178,992 0.000094 0.000095
Paradise Cemetery 74,125,285 5,446,050 ‐ 79,571,335 334,957 ‐ 334,957 79,906,292 0.000094 0.000086
Richmond Cemetery 142,010,670 10,073,155 ‐ 152,083,825 16,789,586 ‐ 16,789,586 168,873,411 0.000128 0.000122
School Districts
Cache County Schools 3,042,641,790 135,457,185 31,567,638 3,146,531,337 164,305,005 5,003,042 159,301,963 3,305,833,300 0.004969 0.004780
Cache Statewide Schools 3,042,641,790 135,457,185 31,567,638 3,146,531,337 164,305,005 5,003,042 159,301,963 3,305,833,300 0.001495 0.001433
Logan City Schools 1,766,170,140 31,821,120 171,315,224 1,626,676,036 256,896,607 76,796,853 180,099,754 1,806,775,790 0.006373 0.005871
Logan Statewide Schools 1,766,170,140 31,821,120 171,315,224 1,626,676,036 256,896,607 76,796,853 180,099,754 1,806,775,790 0.001495 0.001433
Redevelopment Districts
Cache County ‐ ‐ (202,882,861) 202,882,861 ‐ (81,799,895) 81,799,895 284,682,756 0.001814 0.001708
Logan City ‐ ‐ (187,520,434) 187,520,434 ‐ (74,430,207) 74,430,207 261,950,641 0.002296 0.002157
Smithfield City ‐ ‐ (15,362,428) 15,362,428 ‐ (7,369,688) 7,369,688 22,732,116 0.001364 0.001486
Logan City Schools ‐ ‐ (171,315,224) 171,315,224 ‐ (76,796,853) 76,796,853 248,112,077 0.007868 0.007304
Cache County Schools ‐ ‐ (31,567,638) 31,567,638 ‐ (5,003,042) 5,003,042 36,570,680 0.006464 0.006213
TOTALS

62
12 13 14 15 16 17 18 19 20 21 22 23 24
Real & Centrally
Assessed Prop.
Taxes Charged
(5 x 10)
Personal
Property Taxes
Charged
(8 x 11)
Total Taxes
Charged
(12 + 13)
Unpaid Taxes Abatements Other Total Relief
(15 + 16 + 17)
Taxes
Collected
(14 ‐ 18)
Annual
Collection Rate
(19 ÷ 14)
Fee‐in‐lieu Misc.
Collections
Tax Interest /
Penalty
7,980,803 534,218 8,515,021 401,606 57,452 8,931 467,989 8,047,032 94.50% 887,687 107,575 317,042 104,253
677,795 45,480 723,275 34,108 4,879 759 39,746 683,529 94.50% 75,573 9,153 27,118 881
806,127 59,811 865,938 38,912 5,567 858 45,337 820,601 94.76% 80,020 10,053 26,854 816
1,582,397 126,360 1,708,757 76,382 10,927 1,699 89,008 1,619,749 94.79% 169,153 20,946 58,879 1,840
17,869 7,304 25,173 725 29 4 758 24,415 96.99% 1,731 131 664 8
33,968 88 34,056 806 744 6 1,556 32,500 95.43% 7,375 207 388 35
24,929 34 24,963 588 ‐ 130 718 24,245 97.12% 2,386 561 645 ‐
209,094 4,378 213,472 10,996 1,572 46 12,614 200,858 94.09% 24,293 1,512 5,097 138
386,031 21,472 407,503 18,288 4,115 977 23,380 384,123 94.26% 55,219 15,911 13,838 432
170,459 20,521 190,980 3,390 1,560 101 5,051 185,929 97.36% 20,204 1,788 2,188 36
3,839,711 401,499 4,241,210 208,379 28,163 4,954 241,496 3,999,714 94.31% 372,244 28,237 152,276 4,172
79,512 448 79,960 2,246 868 29 3,143 76,817 96.07% 13,546 506 1,573 70
53,219 1,066 54,285 1,091 283 30 1,404 52,881 97.41% 8,110 346 572 7
32,505 597 33,102 1,177 527 5 1,709 31,393 94.84% 6,103 202 346 3
325,245 5,767 331,012 26,755 1,804 130 28,689 302,323 91.33% 36,360 5,141 15,760 448
960,708 47,989 1,008,697 50,156 4,248 2,003 56,407 952,290 94.41% 75,288 14,280 33,706 793
39,171 318 39,489 2,291 721 8 3,020 36,469 92.35% 7,560 1,725 1,005 38
409,651 8,805 418,456 11,061 3,547 330 14,938 403,518 96.43% 52,419 2,838 21,889 990
95,940 5,124 101,064 2,154 1,454 52 3,660 97,404 96.38% 14,909 942 2,073 57
84,158 446 84,604 1,529 997 5 2,531 82,073 97.01% 12,194 823 2,595 130
504,199 20,184 524,383 24,355 4,989 433 29,777 494,606 94.32% 83,994 5,434 18,368 562
15,624 543 16,167 401 151 7 559 15,608 96.54% 2,280 366 350 12
157,498 1,338 158,836 8,818 1,197 19 10,034 148,802 93.68% 30,859 1,792 13,760 447
1,609 ‐ 1,609 10 ‐ ‐ 10 1,599 99.38% ‐ ‐ 10 ‐
4,826 ‐ 4,826 47 ‐ ‐ 47 4,779 99.03% ‐ ‐ 50 ‐
1,710 ‐ 1,710 15 ‐ ‐ 15 1,695 99.12% ‐ ‐ ‐ ‐
5,554 ‐ 5,554 184 ‐ ‐ 184 5,370 96.69% ‐ ‐ 20 ‐
137,475 ‐ 137,475 2,567 ‐ ‐ 2,567 134,908 98.13% ‐ ‐ 5,935 ‐
889 ‐ 889 136 ‐ ‐ 136 753 84.70% ‐ ‐ ‐ ‐
2,904 ‐ 2,904 26,416 ‐ ‐ 26,416 (23,512) ‐809.64% ‐ (360) 10,584 ‐
37,298 ‐ 37,298 ‐ ‐ ‐ ‐ 37,298 100.00% ‐ ‐ ‐ ‐
17,160 ‐ 17,160 ‐ ‐ ‐ ‐ 17,160 100.00% ‐ ‐ ‐ ‐
17,835 ‐ 17,835 540 ‐ ‐ 540 17,295 96.97% ‐ ‐ 4,132 ‐
7,063 ‐ 7,063 ‐ ‐ ‐ ‐ 7,063 100.00% ‐ ‐ ‐ ‐
3,481 ‐ 3,481 ‐ ‐ ‐ ‐ 3,481 100.00% ‐ ‐ ‐ ‐
8 ‐ 8 ‐ ‐ ‐ ‐ 8 100.00% ‐ ‐ ‐ ‐
2,192 ‐ 2,192 335 ‐ ‐ 335 1,857 84.72% ‐ ‐ ‐ ‐
4,151 ‐ 4,151 ‐ ‐ ‐ ‐ 4,151 100.00% ‐ ‐ ‐ ‐
794 1,561 2,355 707 ‐ ‐ 707 1,648 69.98% ‐ 1,289 50 1
252,716 10,395 263,111 12,283 1,736 257 14,276 248,835 94.57% 24,099 2,601 8,295 289
9,796 ‐ 9,796 381 51 3 435 9,361 95.56% 556 (16) 90 4
‐ ‐ ‐ 551 ‐ ‐ 551 (551) 0.00% ‐ ‐ ‐ ‐
‐ ‐ ‐ ‐ ‐ ‐ ‐ ‐ 0.00% ‐ ‐ ‐ ‐
7,203 601 7,804 1,573 19 1 1,593 6,211 79.59% 223 409 438 24
9,089 6 9,095 106 ‐ 57 163 8,932 98.21% 454 122 112 ‐
63,097 1,079 64,176 3,637 417 164 4,218 59,958 93.43% 6,643 444 2,134 52
25,167 510 25,677 934 146 12 1,092 24,585 95.75% 3,355 355 653 18
4,579 44 4,623 195 47 4 246 4,377 94.68% 540 62 67 1
7,480 29 7,509 451 64 1 516 6,993 93.13% 917 178 219 7
19,467 2,048 21,515 843 173 8 1,024 20,491 95.24% 2,260 223 646 16
15,635,114 761,463 16,396,577 776,984 110,843 15,912 903,739 15,492,838 94.49% 1,876,392 265,916 611,610 20,598
4,704,064 228,280 4,932,344 233,768 33,349 4,783 271,900 4,660,444 94.49% 562,278 78,777 177,992 5,868
10,366,806 1,057,366 11,424,172 534,243 76,821 13,752 624,816 10,799,356 94.53% 1,005,703 71,111 405,510 11,053
2,431,881 258,083 2,689,964 125,324 18,021 3,219 146,564 2,543,400 94.55% 245,307 17,879 96,357 2,620
368,030 139,714 507,744 ‐ ‐ ‐ ‐ 507,744 100.00% ‐ ‐ ‐ ‐
430,547 160,546 591,093 ‐ ‐ ‐ ‐ 591,093 100.00% ‐ ‐ ‐ ‐
20,954 10,951 31,905 ‐ ‐ ‐ ‐ 31,905 100.00% ‐ ‐ ‐ ‐
1,347,908 560,924 1,908,832 ‐ ‐ ‐ ‐ 1,908,832 100.00% ‐ ‐ ‐ ‐
204,053 31,084 235,137 ‐ ‐ ‐ ‐ 235,137 100.00% ‐ ‐ ‐ ‐
54,639,513$ 4,538,474$ 59,177,987$ 2,648,444$ 377,481$ 59,689$ 3,085,614$ 56,092,373$ 94.79% 5,768,234$ 669,459$ 2,041,890$ 156,719$
Treasurer's Relief Delinquencies

63
This page intentionally left blank.

64
COMPONENT UNITS
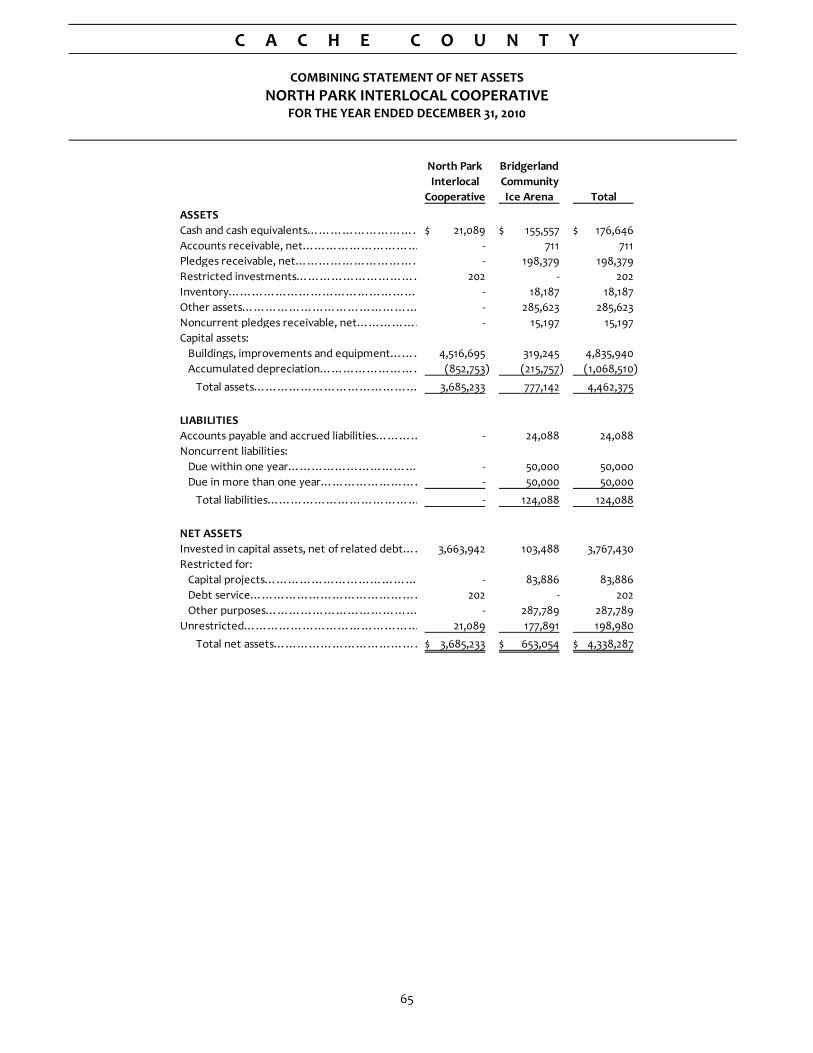
C A C H E C O U N T Y
COMBINING STATEMENT OF NET ASSETS
NORTH PARK INTERLOCAL COOPERATIVE FOR THE YEAR ENDED DECEMBER 31, 2010
65
North Park Bridgerland
Interlocal Community
Cooperative Ice Arena Total
ASSETS
Cash and cash equivalents………………………… 21,089$ 155,557$ 176,646$
Accounts receivable, net………………………… ‐ 711 711
Pledges receivable, net…………………………… ‐ 198,379 198,379
Restricted investments…………………………… 202 ‐ 202
Inventory…………………………………………… ‐ 18,187 18,187
Other assets……………………………………… ‐ 285,623 285,623
Noncurrent pledges receivable, net……………… ‐ 15,197 15,197
Capital assets:
Buildings, improvements and equipment……… 4,516,695 319,245 4,835,940
Accumulated depreciation……………………… (852,753) (215,757) (1,068,510)
Total assets…………………………………… 3,685,233 777,142 4,462,375
LIABILITIES
Accounts payable and accrued liabilities………… ‐ 24,088 24,088
Noncurrent liabilities:
Due within one year…………………………… ‐ 50,000 50,000
Due in more than one year……………………… ‐ 50,000 50,000
Total liabilities………………………………… ‐ 124,088 124,088
NET ASSETS
Invested in capital assets, net of related debt…… 3,663,942 103,488 3,767,430
Restricted for:
Capital projects………………………………… ‐ 83,886 83,886
Debt service……………………………………… 202 ‐ 202
Other purposes………………………………… ‐ 287,789 287,789
Unrestricted……………………………………… 21,089 177,891 198,980
Total net assets………………………………… 3,685,233$ 653,054$ 4,338,287$

C A C H E C O U N T Y
COMBINING STATEMENT OF ACTIVITIES
NORTH PARK INTERLOCAL COOPERATIVE FOR THE YEAR ENDED DECEMBER 31, 2010
66
North Park Bridgerland
Interlocal Community
Cooperative Ice Arena Total
Expenses……………………………………… 143,350$ 695,557$ 838,907$
Internal payments / (receipts)……………… (243,523) 243,523 ‐
Program revenues
Charges for services…………………………… ‐ 406,412 406,412
Operating grants and contributions………… 92,853 402,708 495,561
Total program revenues…………………… 92,853 809,120 901,973
Net revenues (expenses)………………… 193,026 (129,960) 63,066
General revenues
Sales and use taxes…………………………… 100,328 ‐ 100,328
Interest income……………………………… 2,323 2,893 5,216
Total general revenues……………………… 102,651 2,893 105,544
Change in net assets……………………… 295,677 (127,067) 168,610
Net assets ‐ beginning………………………… 3,389,556 780,121 4,169,677
Net assets ‐ ending…………………………… 3,685,233$ 653,054$ 4,338,287$

67
This page intentionally left blank.

68
CACHE COUNTY
SINGLE AUDIT REPORTS

C A C H E C O U N T Y
SCHEDULE OF EXPENDITURES OF FEDERAL AWARDS FOR THE YEAR ENDED DECEMBER 31, 2010
69
Federal Pass‐Through
Federal Grantor/Pass‐Through Grantor/Program Title CFDA No. Grant No. Expenditures
U.S. Department of Agriculture (USDA)
Direct Program
Secure Rural Schools‐Title III 10.665 FY10 280,700
Forest Service Recovery Act Project 10.687 09‐RO‐110482B1‐010 89,927
NRCS Canal Project 10.923 10‐16‐01 5,739
Passed through Bear River Association of Governments
Elderly Feeding Program, Cash‐In‐Lieu 10.550 FY 09‐10 13,723
Elderly Feeding Program, Cash‐In‐Lieu 10.550 FY 10‐11 10,786
Passed through Utah Department of Health
Special Supplemental Food Program for Women, Infants and Children:
Food Vouchers 2010 10.557 C7 2,057,112
Food Vouchers 2011 10.557 C7 672,678
Administrative Costs 2010 10.557 C7 736,468
Administrative Costs 2011 10.557 C7 290,214
Summer Food 2010 10.559 C6‐IV 300
Summer Food 2011 10.559 C6‐IV 300
Total USDA 4,157,947
U.S. Department of Health & Human Services (HHS)
Passed through Bear River Association of Governments
Aging Cluster
Special Programs for Aging, Title III, Part B 93.044 FY 09‐10 25,382
Special Programs for Aging, Title III, Part B 93.044 FY 10‐11 33,562
Special Programs for Aging, CMM Title III, Part C1 93.045 FY 09‐10 39,487
Special Programs for Aging, HDM Title III, Part C2 93.045 FY 10‐11 46,145
Special Programs for Aging, IIID PHP 93.045 FY 10‐11 1,348
Health Insurance Counseling 93.779 FY 10‐11 2,081
Title XX Discretionary Fund 93.667 FY 09‐10 4,608
Passed through State Department of Health
General Federal Block MHF 93.958 #092576 106,473
Federal Block Children MHX 93.958 #092576 27,840
Passed through Utah Department of Health and Human Services
NAACHO 2010 93.008 MRC 10 473 5,000
NAACHO 2011 93.008 MRC 10 158 5,000

C A C H E C O U N T Y
SCHEDULE OF EXPENDITURES OF FEDERAL AWARDS FOR THE YEAR ENDED DECEMBER 31, 2010
70
Federal Pass‐Through
Federal Grantor/Pass‐Through Grantor/Program Title CFDA No. Grant No. Expenditures
Public Health Emergency Response 93.069 101119 166,420
Public Health Emergency Response 93.069 101288 166,028
TB Elimination 2010 93.116 C5‐I 3,942
Immunization 2010 93.268 C4‐II 14,627
Immunization 2011 93.268 C4‐II 50,319
Immunization ARRA 93.712 C5‐V 17,561
Drug Free Communities 2010 93.276 IH79SP015878‐01 104,952
Arthritis 2010 93.283 C3‐VI 954
Arthritis 2011 93.283 C3‐VI 5,000
Bioterrorism 2010 93.283 C8‐I 223,912
Bioterrorism 2011 93.283 C8‐I 116,354
Cancer Control 2010 93.283 C3‐I 10,728
Cancer Control 2011 93.283 C3‐I 12,566
Regional EPI 2010 93.283 102158 7,211
Regional EPI 2011 93.283 C8‐I 25,196
Tobacco Control 2010 93.283 C3‐V 33,725
Tobacco Control 2011 93.283 C3‐V 21,473
TB Special Populations 2010 93.566 C5‐IV 4,822
TB Special Populations 2011 93.566 C5‐IV 5,663
Case Management 2010 93.778 CI‐II 33,653
Case Management 2011 93.778 CI‐II 57,646
CHEC 2010 93.778 CI‐I 14,602
CHEC 2011 93.778 CI‐I 23,561
State Medical Reserve Corp. 2010 93.889 C8 8,894
State Medical Reserve Corp. 2011 93.889 C8 11,281
Regional Healthcare Preparedness 93.889 101367 128,636
Regional Healthcare Preparedness 93.889 C8 74,445
AIDS 2010 93.940 C5‐III 4,000
Substance Abuse ‐ SAPT Block Grant 2010 93.959 052366 205,581
Substance Abuse ‐ SAPT Block Grant 2011 93.959 092177 620,169
STD Basic 2010 93.977 C5‐II 4,200
Diabetes 2010 93.988 C3‐VI 4,866
Diabetes 2011 93.988 C3‐VI 4,127
Injury Prevention 2010 93.991 C3‐III 7,150
Injury Prevention 2011 93.991 C3‐III 7,978

C A C H E C O U N T Y
SCHEDULE OF EXPENDITURES OF FEDERAL AWARDS FOR THE YEAR ENDED DECEMBER 31, 2010
71
Federal Pass‐Through
Federal Grantor/Pass‐Through Grantor/Program Title CFDA No. Grant No. Expenditures
Preventative Block Grant 2010 93.991 C3‐II 12,694
Preventative Block Grant 2011 93.991 C3‐II 9,548
Home Visitation 2010 93.994 C4‐I 8,597
Home Visitation 2011 93.994 C4‐I 9,872
MCH Community Injury 2010 93.994 C3‐III 20,085
MCH Community Injury 2011 93.994 C3‐III 15,695
Maternal & Child Health 2010 93.994 C4‐I 47,099
Maternal & Child Health 2011 93.994 C4‐I 47,099
Total HHS 2,669,857
U.S. Dept of Housing and Urban Development (HUD)
Passed through State Department of Community
and Economic Development
Community Development Block Grant‐Comm Nursing Svc 14.228 10‐0007 26,136
Community Development Block Grant‐Options for Independence 14.228 10‐1055 19,657
Community Development Block Grant‐NNHC‐Land Acq 14.228 10‐2471 100,000
Community Development Block Grant‐Cache Employ. Training Ctr. 14.228 10‐2467 424
Community Development Block Grant‐BR Adult Skill Center 14.228 10‐2545 1,974
Total HUD 148,191
U.S. Department of Energy (DOE)
Direct Program
Energy Efficiency & Conservation Block Grant (EECBG) 81.128 DE‐RW0000101 196,140
Total DOE 196,140
U.S. Department of the Interior (DOI)
Passed through State Division of Wildlife Resources
Pittman‐Robertson Program 15.611 FY2010 9,053
Total DOI 9,053
U.S. Department of Justice (DOJ)
Passed through State Office of the Attorney General
Victim Assistance Services Grant 16.575 09‐VOCA‐04 76,539
Victim Assistance Services Grant 16.575 10‐VOCA‐04 47,846
Violence Against Women Grant (Detective) 16.588 09‐VAWA‐04 24,349
Violence Against Women Grant (Special Prosecutor) 16.588 09‐VAWA‐03 76,297

C A C H E C O U N T Y
SCHEDULE OF EXPENDITURES OF FEDERAL AWARDS FOR THE YEAR ENDED DECEMBER 31, 2010
72
Federal Pass‐Through
Federal Grantor/Pass‐Through Grantor/Program Title CFDA No. Grant No. Expenditures
ARRA VAWA Recovery 16.588 09WREC02/15 36,054
ARRA VOCA Recovery 16.588 09VREC01 19,081
Total DOJ 280,166
U.S. Department of Transportation (DOT)
Direct Program
Airport Improvement Project #21 Crack seal/Markings 20.106 DOT‐FA10NM‐1086 150,602
Airport Improvement Project #19 Master Plan 20.106 DOT‐FA07NM‐1068 8,603
Passed through State Department of Transportation
Logan Canyon Scenic Byway ‐ Projects 20.205 98288, 98289, 58377 30,301
Passed through State Division of Homeland Security
2010 LEPC Hazardous Materials Planning Grant 20.703 SFM‐2008‐LEPC‐CC 3,200
Passed Through Utah Highway Safety Office
BC Occupant Protection 2010 20.600 CP080204 15,535
BC Occupant Protection 2011 20.600 CP100204 11,122
Hispanic Outreach 20.600 CP100213 18,108
Total DOT 237,471
U.S. Environmental Protection Agency (EPA)
Passed through Utah Division of Environmental Quality
DEQ Drinking Water 2010 66.468 50580 5,655
DEQ Drinking Water 2011 66.468 50580 5,655
DEQ Environmental Services 2011 66.605 50580 3,000
Total EPA 14,310
The Corporation for National and Community Service (CNCS)
Direct Program
Retired Service Volunteer Program 94.002 09SRPUT001 39,674
Total CNCS 39,674

C A C H E C O U N T Y
SCHEDULE OF EXPENDITURES OF FEDERAL AWARDS FOR THE YEAR ENDED DECEMBER 31, 2010
73
Federal Pass‐Through
Federal Grantor/Pass‐Through Grantor/Program Title CFDA No. Grant No. Expenditures
U.S. Department of Homeland Security (DHS)
Passed through State Department of Public Safety
Assistance to Firefighters Grant (AFG) 97.044 EMW‐2009‐FR‐00123 252,192
HS Grant‐State HS Program Grant Allocation 97.067 ODP‐FY08 5,147
HS Grant‐State HS Program Grant Allocation 97.067 ODP‐FY09 429,957
Emergency Management Performance Grant 97.042 2009 EMPG 3,000
Emergency Management Performance Grant 97.042 2010 EMPG 32,492
Total DHS 722,788
GRAND TOTAL 8,475,597$

C A C H E C O U N T Y
NOTES TO THE SCHEDULE OF EXPENDITURES OF FEDERAL AWARDS FOR THE YEAR ENDED DECEMBER 31, 2010
74
NOTE 1 – PURPOSE OF THE SCHEDULE
The Schedule of Expenditures of Federal Awards (the Schedule) is a supplementary schedule to the basic financial statements designed to provide expenditure information for each federal program in which the County participated. The schedule is required by the U.S. Office of Management and Budget (OMB) Circular A‐133 Audits of States, Local Governments, and Non‐Profit Organizations.
NOTE 2 – SIGNIFICANT ACCOUNTING POLICIES
A. Basis of Accounting
The Schedule is prepared using the same accounting policies and basis of accounting as the basic financial statements.
B. CFDA Numbers
The schedule shows the total expenditures for each of the County’s federal financial assistance programs as identified in the Catalog of Federal Domestic Assistance (CFDA). The CFDA is a government‐wide compendium of individual federal programs. Each program included in the CFDA is assigned a five‐digit program identification number (CFDA number).
C. Major Programs
OMB Circular A‐133 establishes the levels of expenditures or expenses and other criteria to be used in defining major federal financial assistance. Major programs have been noted on the Schedule of Findings and Questioned Costs in accordance with those definitions.
D. Indirect Costs
The Schedule includes a portion of costs associated with general activities that are allocated to federal financial assistance programs using direct labor as a basis of allocation.
E. WIC Vouchers
Expenditures are recorded for WIC vouchers on the schedule based on information provided by the State of Utah Department of Health. The value of WIC vouchers is excluded from grant revenue and grant expenditures in the financial statements of Bear River Health Department.

-75-
Member of the American Institute of Certified Public Accountants
OFFICERS: Paul D. Simkins, CPA
Michael C. Kidman, CPA, MBA Brent S. Sandberg, CPA Mark E. Low, CPA H. Paul Gibbons, CPA 1011 West 400 North, Suite 100 Robert D. Thomas, CPA P.O. Box 747 Paul R. Campbell, CPA Logan, UT 84323-0747 Phone: (435) 752-1510 ● (877) 752-1510 Fax: (435) 752-4878
INDEPENDENT AUDITORS’ REPORT ON INTERNAL CONTROL OVER FINANCIAL REPORTING AND ON COMPLIANCE AND OTHER MATTERS BASED ON AN AUDIT
OF FINANCIAL STATEMENTS PERFORMED IN ACCORDANCE WITH GOVERNMENT AUDITING STANDARDS
To the Cache County Council Logan, Utah
We have audited the financial statements of the governmental activities, the aggregate discretely presented component units, each major fund, and the aggregate remaining fund information of Cache County, Utah (the County), as of and for the year ended December 31, 2010, which collectively comprise the County’s basic financial statements and have issued our report thereon dated June 27, 2011. We conducted our audit in accordance with auditing standards generally accepted in the United States of America and the standards applicable to financial audits contained in Government Auditing Standards, issued by the Comptroller General of the United States. Other auditors audited the financial statements of Bridgerland Community Ice Arena (a component unit of North Park Interlocal Cooperative), and Cache County Emergency Medical Service Authority, as described in our report on the County’s financial statements. The financial statements of Bridgerland Community Ice Arena were not audited in accordance with Government Auditing Standards. This report does not include the results of the other auditors’ testing of internal control over financial reporting or compliance and other matters that are reported on separately by those auditors.
Internal Control Over Financial Reporting
In planning and performing our audit, we considered the County’s internal control over financial reporting as a basis for designing our auditing procedures for the purpose of expressing our opinions on the financial statements, but not for the purpose of expressing an opinion on the effectiveness of the County’s internal control over financial reporting. Accordingly, we do not express an opinion on the effectiveness of the County’s internal control over financial reporting.
Our consideration of internal control over financial reporting was for the limited purpose described in the preceding paragraph and was not designed to identify all deficiencies in internal control over financial reporting that might be significant deficiencies, or material weaknesses and therefore, there can be no assurance that all deficiencies, significant deficiencies, or material weaknesses have been identified. However, as described in the accompanying schedule of

-76-
findings and questioned costs, we identified certain deficiencies in internal control over financial reporting that we consider to be material weaknesses and other deficiencies that we consider to be significant deficiencies.
A deficiency in internal control exists when the design or operation of a control does not allow management or employees, in the normal course of performing their assigned functions, to prevent, or detect and correct misstatements on a timely basis. A material weakness is a deficiency, or a combination of deficiencies, in internal control such that there is a reasonable possibility that a material misstatement of the entity’s financial statements will not be prevented, or detected and corrected on a timely basis. We consider the deficiency described in the accompanying schedule of findings and questioned costs as item 10-01 to be a material weakness.
A significant deficiency is a deficiency, or a combination of deficiencies, in internal control that is less severe than a material weakness, yet important enough to merit attention by those charged with governance. We consider the deficiency described in the accompanying schedule of findings and questioned costs as item 10-02 to be a significant deficiency.
Compliance and Other Matters
As part of obtaining reasonable assurance about whether the County’s financial statements are free of material misstatement, we performed tests of its compliance with certain provisions of laws, regulations, contracts, and grant agreements, noncompliance with which could have a direct and material effect on the determination of financial statement amounts. However, providing an opinion on compliance with those provisions was not an objective of our audit, and accordingly, we do not express such an opinion. The results of our tests disclosed no instances of noncompliance or other matters that are required to be reported under Government Auditing Standards.
We noted certain other matters that we reported to management of the County in a separate letter dated June 27, 2011.
The County’s response to the findings identified in our audit is described in the accompanying schedule of findings and questioned costs. We did not audit the County’s response and, accordingly, we express no opinion on it.
This report is intended solely for the information and use of management, the County Council, others within the entity, and federal awarding agencies and pass-through entities and is not intended to be and should not be used by anyone other than these specified parties.
JONES SIMKINS, P.C. June 27, 2011

-77-
Member of the American Institute of Certified Public Accountants
OFFICERS: Paul D. Simkins, CPA
Michael C. Kidman, CPA, MBA Brent S. Sandberg, CPA Mark E. Low, CPA H. Paul Gibbons, CPA 1011 West 400 North, Suite 100 Robert D. Thomas, CPA P.O. Box 747 Paul R. Campbell, CPA Logan, UT 84323-0747 Phone: (435) 752-1510 ● (877) 752-1510 Fax: (435) 752-4878
INDEPENDENT AUDITOR’S REPORT ON COMPLIANCE WITH REQUIREMENTS THAT COULD HAVE A DIRECT AND MATERIAL EFFECT ON EACH MAJOR
PROGRAM AND ON INTERNAL CONTROL OVER COMPLIANCE IN ACCORDANCE WITH OMB CIRCULAR A-133
To the Cache County Council Logan, Utah Compliance
We have audited Cache County, Utah’s (the County) compliance with the types of compliance requirements described in the OMB Circular A-133 Compliance Supplement that could have a direct and material effect on each of the County’s major federal programs for the year ended December 31, 2010. The County’s major federal programs are identified in the summary of auditor’s results section of the accompanying schedule of findings and questioned costs. Compliance with the requirements of laws, regulations, contracts, and grants applicable to each of its major federal programs is the responsibility of the County’s management. Our responsibility is to express an opinion on the County’s compliance based on our audit.
We conducted our audit of compliance in accordance with auditing standards generally accepted in the United States of America; the standards applicable to financial audits contained in Government Auditing Standards, issued by the Comptroller General of the United States; and OMB Circular A-133, Audits of States, Local Governments, and Non-Profit Organizations. Those standards and OMB Circular A-133 require that we plan and perform the audit to obtain reasonable assurance about whether noncompliance with the types of compliance requirements referred to above that could have a direct and material effect on a major federal program occurred. An audit includes examining, on a test basis, evidence about the County’s compliance with those requirements and performing such other procedures as we considered necessary in the circumstances. We believe that our audit provides a reasonable basis for our opinion. Our audit does not provide a legal determination of the County’s compliance with those requirements.
In our opinion, the County, complied, in all material respects, with the compliance requirements referred to above that could have a direct and material effect on each of its major federal programs for the year ended December 31, 2010.

-78-
Internal Control over Compliance
Management of the County is responsible for establishing and maintaining effective internal control over compliance with the requirements of laws, regulations, contracts, and grants applicable to federal programs. In planning and performing our audit, we considered the County’s internal control over compliance with the requirements that could have a direct and material effect on a major federal program to determine the auditing procedures for the purpose of expressing our opinion on compliance and to test and report on internal control over compliance in accordance with OMB Circular A-133, but not for the purpose of expressing an opinion on the effectiveness of internal control over compliance. Accordingly, we do not express an opinion on the effectiveness of the County’s internal control over compliance.
A deficiency in internal control over compliance exists when the design or operation of a control over compliance does not allow management or employees, in the normal course of performing their assigned functions, to prevent, or detect and correct, noncompliance with a type of compliance requirement of a federal program on a timely basis. A material weakness in internal control over compliance is a deficiency, or combination of deficiencies, in internal control over compliance, such that there is a reasonable possibility that material noncompliance with a type of compliance requirement of a federal program will not be prevented, or detected and corrected, on a timely basis.
Our consideration of internal control over compliance was for the limited purpose described in the first paragraph of this section and was not designed to identify all deficiencies in internal control over compliance that might be deficiencies, significant deficiencies, or material weaknesses. We did not identify any deficiencies in internal control over compliance that we consider to be material weaknesses, as defined above.
This report is intended solely for the information and use of management, the County Council, others within the entity, federal awarding agencies, and pass-through entities and is not intended to be and should not be used by anyone other than these specified parties.
JONES SIMKINS, P.C. June 27, 2011

CACHE COUNTY Schedule of Findings and Questioned Costs
Year Ended December 31, 2010
- 79 -
A. Summary of Audit Findings:
1. Type of report issued Unqualified 2. Internal control over financial reporting: Material weaknesses identified: Yes – One Significant deficiencies identified that were not considered to be material weaknesses: Yes – One 3. Non-compliance material to financial statements noted: No 4. Internal control over major programs: Material weaknesses identified: No Significant deficiencies identified that were not considered to be material weaknesses: None reported 5. Type of auditors’ report issued on compliance for major programs: Unqualified 6. Any audit findings disclosed that are required to be reported in accordance with section 510(d) of Circular A-133: None 7. Federal programs tested as major programs WIC 10.557 Substance Abuse 93.959 Energy Efficiency and Conservation Block Grant 81.128 8. Dollar threshold used to distinguish between
Type A and Type B programs: $300,000
9. Auditee qualification as high or low risk High

CACHE COUNTY Schedule of Findings and Questioned Costs
Year Ended December 31, 2010
- 80 -
B. Findings related to the financial statements required to be reported in accordance with Government Auditing Standards:
Finding 10-01
Criteria: Internal control standards adopted by the Government Accountability Office (GAO) expect that management or employees, in the normal course of performing their assigned functions, will prevent or detect misstatements in account balances prior to their being reported in the financial statements. Condition: Controls over financial close and reporting are insufficient to prevent misstatements in the presentation of the financial statements. Auditor-proposed adjustments were made to the balances of revenues and associated receivables, expenditures and associated payables, cash allocations, and investments.
Cause: Insufficient monitoring of centralized accounting personnel by management. Effect: The County has a material weakness in internal controls with respect to the accurate recording, reporting, and disclosure of transactions and balances in accordance with Generally Accepted Accounting Principles.
Recommendation: Management should consider ways to reduce the number of audit adjustments and consider whether obtaining the necessary training and resources to allow the County to produce annual financial statements with reduced misstatements is cost beneficial.
Finding 10-02
Criteria: Internal control standards adopted by the GAO expect that the individuals charged with governance of an organization establish an effective control environment, assess internal control risks, establish appropriate control activities, document and communicate controls and procedures, and monitor compliance with policies and procedures.
Condition: The County’s internal control system is not designed in accordance with the expectations of the GAO. Cause: The County has elected not to meet all internal control expectations established by the GAO. Effect: The County has a significant deficiency in the design of its internal control processes.
Recommendation: Those charged with governance should continue to evaluate the cost and benefit of improving controls in accordance with GAO expectations.

CACHE COUNTY Schedule of Findings and Questioned Costs
Year Ended December 31, 2010
- 81 -
C. Findings and questioned costs related to federal awards required to be reported in accordance with OMB Circular A-133.
None

CACHE COUNTY Summary Schedule of Prior Year Audit Findings
Year Ended December 31, 2010
- 82 -
There were no audit findings in the prior year related to federal awards.
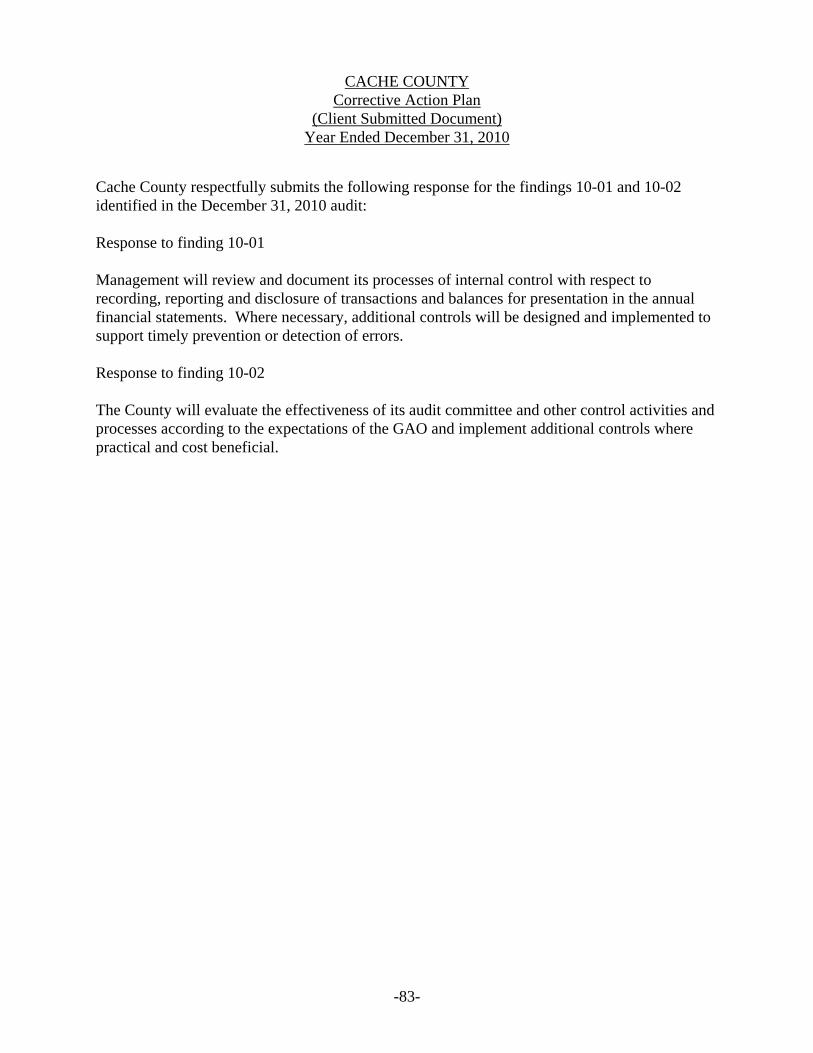
CACHE COUNTY Corrective Action Plan
(Client Submitted Document) Year Ended December 31, 2010
-83-
Cache County respectfully submits the following response for the findings 10-01 and 10-02 identified in the December 31, 2010 audit: Response to finding 10-01 Management will review and document its processes of internal control with respect to recording, reporting and disclosure of transactions and balances for presentation in the annual financial statements. Where necessary, additional controls will be designed and implemented to support timely prevention or detection of errors. Response to finding 10-02 The County will evaluate the effectiveness of its audit committee and other control activities and processes according to the expectations of the GAO and implement additional controls where practical and cost beneficial.
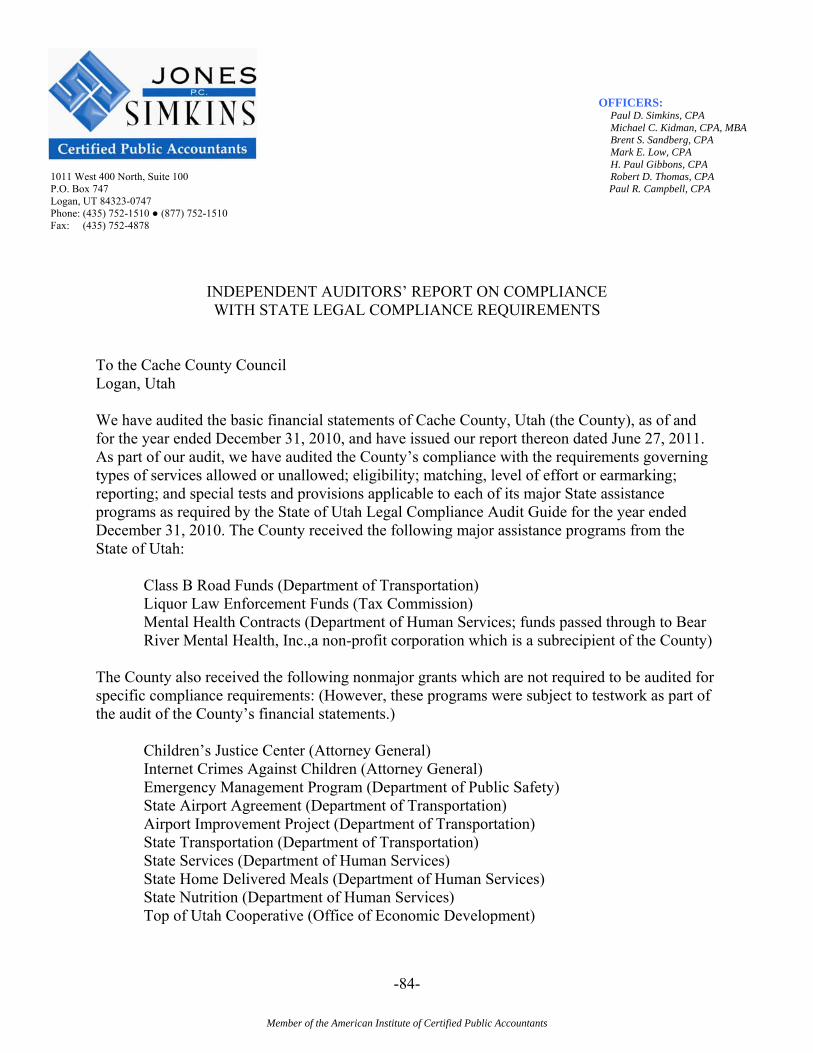
-84-
Member of the American Institute of Certified Public Accountants
OFFICERS: Paul D. Simkins, CPA
Michael C. Kidman, CPA, MBA Brent S. Sandberg, CPA Mark E. Low, CPA H. Paul Gibbons, CPA 1011 West 400 North, Suite 100 Robert D. Thomas, CPA P.O. Box 747 Paul R. Campbell, CPA Logan, UT 84323-0747 Phone: (435) 752-1510 ● (877) 752-1510 Fax: (435) 752-4878
INDEPENDENT AUDITORS’ REPORT ON COMPLIANCE WITH STATE LEGAL COMPLIANCE REQUIREMENTS
To the Cache County Council Logan, Utah We have audited the basic financial statements of Cache County, Utah (the County), as of and for the year ended December 31, 2010, and have issued our report thereon dated June 27, 2011. As part of our audit, we have audited the County’s compliance with the requirements governing types of services allowed or unallowed; eligibility; matching, level of effort or earmarking; reporting; and special tests and provisions applicable to each of its major State assistance programs as required by the State of Utah Legal Compliance Audit Guide for the year ended December 31, 2010. The County received the following major assistance programs from the State of Utah:
Class B Road Funds (Department of Transportation) Liquor Law Enforcement Funds (Tax Commission) Mental Health Contracts (Department of Human Services; funds passed through to Bear River Mental Health, Inc.,a non-profit corporation which is a subrecipient of the County)
The County also received the following nonmajor grants which are not required to be audited for specific compliance requirements: (However, these programs were subject to testwork as part of the audit of the County’s financial statements.)
Children’s Justice Center (Attorney General) Internet Crimes Against Children (Attorney General) Emergency Management Program (Department of Public Safety) State Airport Agreement (Department of Transportation) Airport Improvement Project (Department of Transportation) State Transportation (Department of Transportation) State Services (Department of Human Services) State Home Delivered Meals (Department of Human Services) State Nutrition (Department of Human Services) Top of Utah Cooperative (Office of Economic Development)
-85-
Our audit also included testwork on the County’s compliance with the following general compliance requirements identified in the State of Utah Legal Compliance Audit Guide:
Public Debt Cash Management Purchasing Requirements Budgetary Compliance Truth in Taxation and Property Tax Limitations Special Service and Local Districts Other General Compliance Issues Uniform Building Code Standards Statement of Taxes Charged, Collected, and Disbursed Assessing and Collecting of Property Taxes Transient Room Tax and Tourism, Recreation, Culture, and Convention Facilities Tax Impact Fees and Other Development Fees
Asset Forfeiture Utah Retirement Systems Compliance Fund Balance Limitation The management of the County is responsible for the County’s compliance with all compliance requirements identified above. Our responsibility is to express an opinion on compliance with those requirements based on our audit. We conducted our audit in accordance with auditing standards generally accepted in the United States of America and Government Auditing Standards, issued by the Comptroller General of the United States. Those standards require that we plan and perform the audit to obtain reasonable assurance about whether material noncompliance with the requirements referred to above occurred. An audit includes examining, on a test basis, evidence about the County’s compliance with those requirements. We believe that our audit provides a reasonable basis for our opinion which is expressed in the following paragraph. In our opinion, the County complied, in all material respects, with the general compliance requirements identified above and the requirements governing types of services allowed or unallowed; eligibility; matching, level of effort, or earmarking; reporting; and special tests and provisions, that are applicable to each of its major State assistance programs for the year ended December 31, 2010.
JONES SIMKINS, P.C. June 27, 2011

C A C H E C O U N T Y
SCHEDULE OF EXPENDITURES OF TRANSIENT ROOM TAXES AND TOURISM, RECREATION, CULTURAL, AND CONVENTION FACILITIES TAXES
FOR THE YEAR ENDED DECEMBER 31, 2010
86
Transient Room Tax
Establishing and promoting:
Recreation…………………………………………………………………… ‐$
Tourism……………………………………………………………………… 289,677
Film production…………………………………………………………….. ‐
Conventions………………………………………………………………… ‐
Acquiring, leasing, constructing, furnishing, or operating: ‐
Convention meeting rooms………………………………………………… ‐
Exhibit halls…………………………………………………………………. ‐
Visitor information centers………………………………………………… 51,107
Museums……………………………………………………………………… ‐
Related facilities………………………………………………………….. ‐
Acquiring or leasing land required for or related to: ‐
Convention meeting rooms………………………………………………… ‐
Exhibit halls…………………………………………………………………. ‐
Visitor information centers………………………………………………… ‐
Museums……………………………………………………………………… ‐
Related facilities………………………………………………………….. ‐
Mitigation costs……………………………………………………………. ‐
Payment of principal, interest, and premiums on bonds………………… ‐
Total Transient Room Tax Expenditures………………………………… 340,784$
Tourism, Recreation, Cultural, and Convention (TRCC) Facilities Taxes
Financing tourism promotion………………………………………………… ‐$
Development, operation, and maintenance of:
Tourist facilities……………………………………………………………. ‐
Recreation facilities………………………………………………………… ‐
Cultural facilities………………………………………………………….. ‐
Total TRCC Facilities Tax Expenditures…………………………………… ‐$
Reserves and Pledges
Reserves on bonds related to TRT funds……………………………………… ‐$
Pledges as security for evidences of indebtedness related to TRCC………. ‐
Total Pledges of TRT and TRCC Taxes……………………………………… ‐$


