Embed Size (px)
Citation preview
Socioeconomic Institute Sozialökonomisches Institut
Working Paper No. 0916
Fine Tuning of Health Insurance Regulation: Unhealthy Consequences for an Individual Insurer
Johannes Schoder, Michèle Sennhauser and Peter Zweifel
August 2009
Socioeconomic Institute University of Zurich Working Paper No. 0916
Fine Tuning of Health Insurance Regulation: Unhealthy Consequences for an Individual Insurer
August 2009 Author's address: Johannes Schoder E-mail: [email protected] Michèle Sennhauser E-mail: [email protected] Peter Zweifel E-mail: [email protected]
Publisher Sozialökonomisches Institut
Bibliothek (Working Paper) Rämistrasse 71 CH-8006 Zürich Phone: +41-44-634 21 37 Fax: +41-44-634 49 82 URL: www.soi.uzh.ch E-mail: [email protected]
Fine Tuning of Health Insurance
Regulation: Unhealthy Consequences
for an Individual Insurer
Johannes Schoder∗†, Michele Sennhauser†, and Peter Zweifel†
June 2009
Abstract
This paper sheds light on some unexpected consequences of health insurance
regulation that may pose a big challenge to insurers’ risk management. Because
mandated uniform contributions to health insurance trigger risk selection ef-
forts risk adjustment (RA) schemes become necessary. A good deal of research
into the optimal RA formula has been performed (Ellis and Van de Ven [2000]).
A recent proposal has been to add ”Hospitalization exceeding three days during
the previous year” as an indicator of high risk (Beck et al. [2006]). Applying
the new formula to an individual Swiss health insurer, its payments into the
RA scheme are postdicted to explode, reaching up to 13 percent of premium
income. Its mistake had been to successfully implement Managed Care, result-
ing in low rates of hospitalization. The predicted risk management response is
to extend hospital stays beyond three days, contrary to stated policy objectives
also of the United States.
JEL-Classification: I18, L51, H51
Keywords: Health insurance, regulation, risk adjustment, risk management
∗Correspondence to: Columbia University, 3022 Broadway, NY 10027, NY, USA, email:[email protected] (until September), [email protected] (from October).
†Socioeconomic Institute, University of Zurich, Hottingerstr. 10, CH-8032 Zurich. Wethank the four involved insurers for providing their data.
1 Introduction and Motivation
When premiums are mandated to be independent of risk, competitive health
insurers have an incentive to select clients whose future expected health care
expenditure does not exceed their contribution. This consideration has induced
secondary regulation in the guise of risk adjustment (RA) schemes. Basically,
RA makes insurers with an above-average share of favorable risks pay into a
fund, whose proceeds are used to cross-subsidize those insurers with many un-
favorable risks. The design of an optimal RA formula is a widely discussed
topic (see for example Jack [2006], Glazer and McGuire [2002], Lamers [1999],
Van de Ven et al. [2004], Lamers and Van Vliet [2003a], Lamers and Van Vliet
[2003b], Ellis and Van de Ven [2000], Beck et al. [2006], Van de Ven and Schut
[2007], and Zweifel and Breuer [2006]). The adoption and implementation by
Medicaid and private health insurers has been analyzed by e.g. Bumenthal
et al. [2005]. The RA formula for Medicare is being refined continuously (see
e.g Calfo [2009]). However, so far the consequences of this fine tuning of regu-
lation for the risk management of insurers seem to have been neglected.
This contribution focuses on this issue through a case study from Switzerland,
a country that relies on competitive health insurance in a way similar to the
United States. A RA scheme was introduced in 1996, using the two criteria
age and gender only. Effective 2012, the RA formula will include a third in-
dicator of high risk, viz. ”Hospitalization of more than three days or living
in a nursing home during the previous year” (see Spycher [2000]). A more
sophisticated version known as ”Principal Inpatient Diagnostic Cost Groups
(PIPDCG)” has been in use with US Medicare (see Ingber [2000]).1 Using
previous hospitalization as a risk adjuster has recommendable features in that
it (1) has significant predictive power (see Beck [2004] and Holly et al. [2003]),
(2) relates to a previous period so does not undermine insurers’ effort at con-
trolling health care cost, (3) is not easily manipulated, and (4) can be measured
at little administrative expense. The benefit of fine tuning RA consists in the
reduction of risk-selection efforts by health insurers. However, there may also
be disadvantages (for an explicit analysis of advantages and disadvantages of
this criterion in the case of Medicare, see Pope et al. [2000]).
1 There are three main differences between the US and Swiss version: (a) WhereasPIPDCG categories take into consideration the severity of a case, the Swiss criterion isbinary, distinguishing only hospitalization from no hospitalization. (b) To avoid gamingby health plans, Medicare RA counts stays of at least two days. Swiss RA counts staysof at least four days. (c) Whereas maternity stays count in PIPDCG, the Swiss for-mula excludes the stay because Beck [2004] found no significantly higher costs followingmaternity.
2
The purpose of this paper is to show that this recommendable refinement of
RA may boost payments into the RA scheme as to jeopardize the economic
survival of an otherwise viable health insurer, posing a great challenge to its
risk management (RM). Now insolvency and hence market exit of an insurer
who only survived thanks to cream skimming may be considered to increase
market efficiency. However, this case study deals with an innovative health
insurer, who had successfully implemented Managed Care to lower rates of
hospitalization. Bankruptcy of such an insurer would be inefficient both in
Switzerland and the United States, with Miller and Luft [1997] showing that
most cost savings of US Managed Care Organizations are due to lower rates of
hospitalization.
The evidence comes from simulating payments for a particular health insurer A
into the RA scheme applying the old and the new formula. The results postdict
that A’s payments would have increased by a factor of 4 in the year 2005 if
the new formula had already been implemented, by a factor of 28 in 2006, and
of 35 in 2007 to attain between 9 and 13 percent of premium income. Extra
payments of these magnitudes would have seriously endangered this insurer’s
economic survival, leading to a cumulative loss in excess of CHF 250 mn. (1
CHF = 0.8 US$ at 2008 exchange rates) over three years.
While A’s risk management response cannot be predicted, there are two main
alternatives. One is to enlist unfavorable risks, as intended by the regulator.
The other is to extend hospital stays from three to four days. This strategy
would have decreased this insurer’s RA payments by an estimated 11 percent
in 2007. The consequences would be unhealthy for taxpayers (who subsidize
hospital cost), employers (who lose workdays), and patients (who lose quality
of life). While not directly transferable to other countries with competitive
health insurance (such as the United States, but also Germany, Israel, and
the Netherlands), the findings of this contribution convey a clear message.
Seemingly minor fine tuning of health insurance regulation has the potential of
challenging an insurer’s risk management.
The remainder of this paper is structured as follows. Section 2 describes the
method for calculating risk adjustment values in general and the data basis.
In the first part of Section 3, RA values are simulated according to the new
3
formula and applied to insurer A. The second part then analyzes the impact of
this regulatory change on insurer A’s risk management. The paper concludes
with lessons learned from this case study and its implications.
2 Simulation of Risk Adjustment Values and
Data Basis
2.1 Methodology
Traditionally, analysis of risk management focuses on payments between health
insurers. However, this neglects the fact that payments into the RA scheme
are ultimately borne by low-risk consumers while payment from the scheme
benefit high-risk consumer. Economic theory has always distinguished between
payers and bearers of a cost or levy, in particular in the context of an indirect
tax. To see the analogy, define P as the community-rated premium, La,g, the
average HCE paid by the insurer in one of the age-gender cells (a, g) of RA
(neglecting administrative expense for simplicity), and RAa,g the payment to
the RA scheme. The premium paid by a specific low risk i whose cost are under
average for the specific age-gender cell (a, g) then amounts to
P = La,g + RAa,g
= ELi + (La,g − ELi) + (P − La,g). (1)
Therefore, this particular low risk bears a cross-subsidy in favor of high risks
consisting of two components. The first component is the difference between
average HCE of group (a, g) and the individuals expected HCE ELi; the second,
the contribution to the RA scheme, to be paid by the insurer. The sum of the
two will be referred to as cross-subsidization (CS) values. As to the second
component, the current Swiss RA formula has only two criteria, age and gender.
The age classification comprises 15 classes, starting from age 19 to 25 and
continuing in 5-year steps. Thus, there are overall 30 RA categories. Since risk
adjustment must not lead to a cross-subsidization between the 26 cantons (i.e.
member states of Switzerland), the RA values are calculated for each canton
in the following way (see Beck et al. [2006], ch. 4),
RAa,g = La,g − L (2)
4
with L (= P in eq. (1) since administrative expense is neglected) denoting
average health care expenditure (HCE) in the canton’s population as a whole.2
Rather than the consumer’s, the insurer’s point of view is adopted now. Thus,
the insurer has to contribute to the RA fund for favorable risks (La,g<L). The
RA fund uses the proceeds to cover the deficits generated by unfavorable risks
(La,g>L). Average HCE of a canton’s population, L, is calculated as follows,
L =
∑15
a=1
∑1
g=0La,gna,g
∑15
a=1
∑1
g=0na,g
, (3)
where na,g represents the number of individuals in cell (a, g). An insurer’s total
payment into/from the RA fund depends on the composition of its insured,
(k=1,..., 26 denotes canton),
V =
26∑
k=1
15∑
a=1
1∑
g=0
RAa,g,kna,g,k. (4)
An insurer receives payments if V >0 and contributes to risk adjustment if V <0.
The values RAa,g,k for each cell are calculated yearly by the Joint Organization
KVG based on data of all Swiss health insurers (see Joint Organization KVG
[2007]).
Several studies showed that including the criterion ”Hospitalization”3 improves
the prediction of expected HCE (Beck [2004], Holly et al. [2003]). This changes
eq. (2) to
RAa,g,s,k = La,g,s,k − Lk. (5)
The subscript s is equal to 1 if a hospital stay in the previous year exceeds
three days and otherwise 0. Average HCE, La,g,s,k, of the respective RA cell
now has to be calculated for 60 instead of 30 groups, while L remains the same.
2.2 Data
For calculating the RAa,g,s,k in eq. (4) for a given health insurer, the cell-
specific averages La,g,s,k must be known. Since RAa,g,s,k is not published by
the Joint Organization KVG, two different sources are used to analyze the
impact of the new RA formula on an individual health insurer. The first is
2 Note that eq. (1) is from the individuals point of view, whereas eq. (2) is from thehealth insurers’ perspective.
3 This is shorthand for ”Hospitalization during the previous year of four days and more”.Nursing home stays are also counted. For more details, see footnote 1.
5
constructed by merging individual HCE data provided by three large health
insurers. It is needed for calculating the average RAa,g,s,k and should ideally
be representative of all Swiss health insurers. The second data base comes from
the one individual Swiss health insurer ”A”. Both are limited to individuals
having mandatory health insurance. Besides socioeconomic variables like age,
gender, and canton of residence, data on ambulatory and hospital HCE, ex-
penditure on pharmaceuticals, and a variable indicating hospitalization in the
previous year are available. To characterize the type of health insurance, the
deductible selected and a variable indicating choice between conventional and
Managed Care were included as well.
Descriptive Statistics
Data of the three large Swiss health insurers (out of a total of 70 serving a
population of 7.5 mn.) is available for the period 2001 to 2005. The sample
is well balanced with respect to gender (49.5 percent of women). The market
share covered is stable across age classes, amounting to 25 percent on average.
Across the 26 cantons, the three insurers are over-represented in eastern and
central Switzerland and under-represented in the northern and western parts
of the country. With regard to choice of contract, there is a clear trend towards
higher deductibles. The three highest deductibles (CHF 1,500, 2,000 and 2,500;
1 CHF=0.8 US$ at 2008 exchange rates) increased in importance from 12 to
over 22 percent from 2001 to 2005. There is a similar trend in favor of Managed
Care contracts, reaching a share of 12 percent in 2005 (compared to the Swiss
average of less than 10 percent in 2005, see Eugster et al. [2009]).
The second data source, obtained from A, covers the period 2001 to 2007. With
51.3 percent of women, the sample is almost balanced. The insurer’s nationwide
market share is 4 percent; with 3.8 percent, women above age 76 are under-
and with 4.7 percent, men above the same age overrepresented. Conversely,
the age group 19 to 25 is slightly overrepresented (ca. 5 percent). The clientele
of A also tends towards higher deductibles. The share of the three highest
deductibles (CHF 1,000: 3 percent, CHF 1,500: 18 percent, and CHF 2,500:
6 percent) exceeds the nation-wide average of 22 percent. Managed Care con-
tracts account for almost 35 percent (2007), way above the nationwide average
of less than 10 percent. This makes A an innovative insurer and explains its
comparatively low rate of hospitalization (see Figure 2 below).
6
Checking Simulated RA Payments
First, the data provided by the three large health insurers had to be checked for
representativeness using the current RA formula. The values for RAa,g were
calculated for all 30 cells along with their standard errors according to the
methodology described in Section 2.1 and compared with the official nation-
wide values. The insurers on average pay for women aged 19 to 25 more than
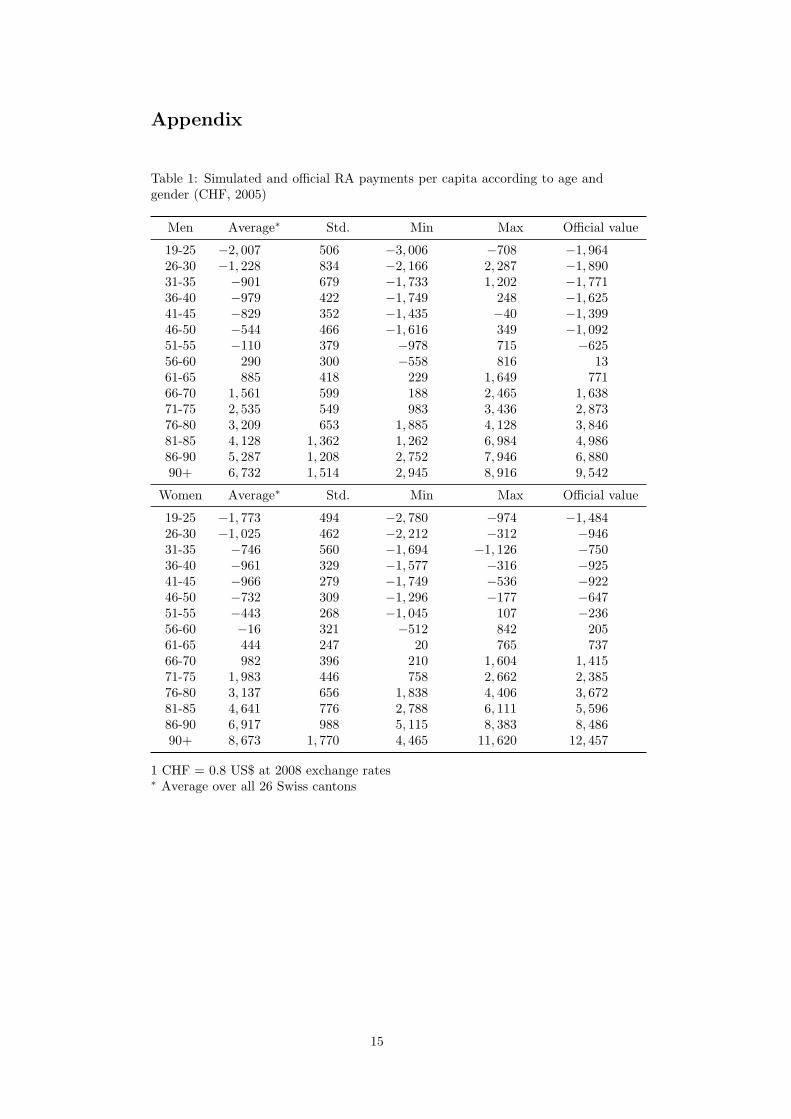
CHF 1,700 per year (see Table 1 in the Appendix). Conversely, they receive
payment for over 90 year old women to the tune of some CHF 8,600. While the
fit is good in general, RA contributions by the three insurers are lower than
the official figures from age 61 on.
Based on the evidence, one can conclude that the three major health insur-
ers sampled are sufficiently representative of the Swiss population to enable
a simulation of the new RA formula based on their data. This conclusion is
also supported by the fact that one of the three is a net recipient of payments
from the RA scheme, one breaks even, and one is a net contributor to the
scheme. Also note that according to Table 1 of the Appendix, the standard
error and hence variance of RA payments increases with age, reflecting the fact
that variance of HCE increases as well. This means that for a risk-averse health
insurer, risk selection effort has a high payoff if focused on older clients. By
the same token, however, an insurer like A who counts on having to pay into
the RA scheme permanently faces a liability characterized by great risk as its
population ages.
3 Simulating the Impacts of the New
RA Formula
In this section, estimated RA values with the new RA formula including hos-
pitalization during the previous year are presented first. Then, the impacts of
the regulatory fine-tuning on health insurer A in terms of financial burden and
choice of strategy are shown.
3.1 Risk Adjustment with the New Criterion
Official RA values grouped according to the additional criterion, ”Hospitaliza-
tion during the previous year” are not available.4 They have been simulated
4 Official statistics do show RA values as ”RA payments between consumers”, but onlyaccording to the current RA formula see Joint Organization KVG [2007].
7
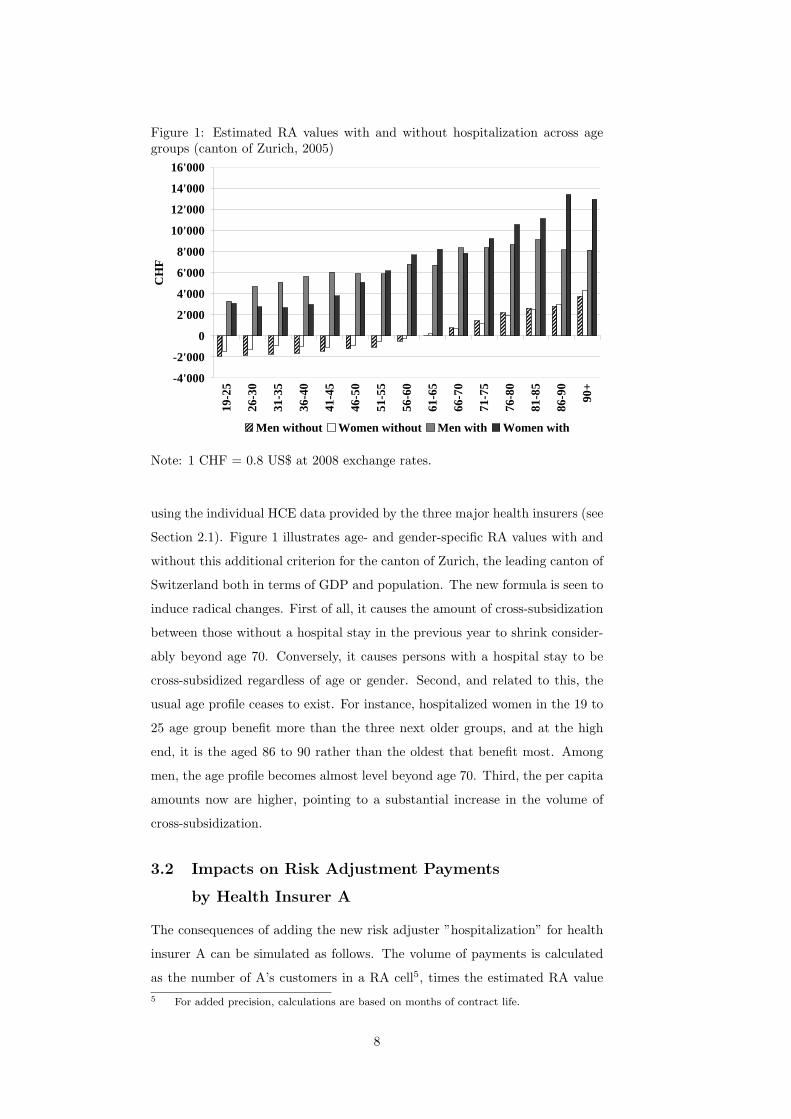
Figure 1: Estimated RA values with and without hospitalization across agegroups (canton of Zurich, 2005)
-4'000
-2'000
0
2'000
4'000
6'000
8'000
10'000
12'000
14'000
16'000
19-2
5
26-3
0
31-3
5
36-4
0
41-4
5
46-5
0
51-5
5
56-6
0
61-6
5
66-7
0
71-7
5
76-8
0
81-8
5
86-9
0
90+
CH
F
Men without Women without Men with Women with
Note: 1 CHF = 0.8 US$ at 2008 exchange rates.
using the individual HCE data provided by the three major health insurers (see
Section 2.1). Figure 1 illustrates age- and gender-specific RA values with and
without this additional criterion for the canton of Zurich, the leading canton of
Switzerland both in terms of GDP and population. The new formula is seen to
induce radical changes. First of all, it causes the amount of cross-subsidization
between those without a hospital stay in the previous year to shrink consider-
ably beyond age 70. Conversely, it causes persons with a hospital stay to be
cross-subsidized regardless of age or gender. Second, and related to this, the
usual age profile ceases to exist. For instance, hospitalized women in the 19 to
25 age group benefit more than the three next older groups, and at the high
end, it is the aged 86 to 90 rather than the oldest that benefit most. Among
men, the age profile becomes almost level beyond age 70. Third, the per capita
amounts now are higher, pointing to a substantial increase in the volume of
cross-subsidization.
3.2 Impacts on Risk Adjustment Payments
by Health Insurer A
The consequences of adding the new risk adjuster ”hospitalization” for health
insurer A can be simulated as follows. The volume of payments is calculated
as the number of A’s customers in a RA cell5, times the estimated RA value
5 For added precision, calculations are based on months of contract life.
8
pertaining to that RA cell, and adding up [see eq. (4), Section 2.1]. The results
are striking.
• Payments of A into the RA scheme increase in all cantons. In some, A
even turns from receiver into payer, such as in the cantons of Vaud (VD)
and Geneva (GE). The biggest absolute increase occurs in the canton of
Berne (BE). Here, payments increase by CHF 24 mn., which corresponds
to a relative increase of 190 percent over the actual 2005 value.
• Total payments of A into the RA scheme explode. Under the old formula,
they amount to CHF 24.2 mn. in 2005, corresponding to 3 percent of pre-
mium income. Had the new RA formula already been in effect, payments
would have been CHF 101.6 mn., amounting to no less than 13 percent
of premium income. Considering that A operated at a loss of CHF 8.2
mn. in 2005, the new formula would, ceteris paribus, have caused a total
loss of CHF 85.6 mn. (= 8.2 + 101.6 − 24.2).
• For the years 2006 and 2007, payments according to the new RA formula
are estimated to be CHF 73.5 and 82.3 mn., respectively. Compared
to the CHF 2.6 and 2.3 mn. under the current RA formula, these are
multiples of 28 and 35. In terms of premium income, the share would
have been 9 and 13 percent, respectively, resulting in losses of CHF 54.8
and 86.2 mn., ceteris paribus.
Arguably, these developments would have jeopardized A’s economic survival.
Starting with the underwriting result, the combined ratio (defined as loss pay-
ments plus administrative expense plus RA values relative to premium income)
was very close to 100 percent over the time period considered, viz. 102.3 (2005),
99.8 (2006), and 100.3 percent (2007).6 This is not fatal as long as the insurer
is making enough profits from capital investment (see e.g. Zweifel and Eisen
[2003], ch. 5), which was indeed the case in 2007. However, the new RA formula
would have caused the combined ratio to attain 111.9 (2005), 107.5 (2006), and
110.7 percent (2007) respectively, amounts that could not have easily been com-
pensated by profits from capital investment. According to Browne and Hoyt
[1995], who analyze market predictors of insolvencies in US property-liability
insurance between 1970 and 1990, a 5 point increase of the combined ratio
causes the insolvency rate to increase by roughly 22 percent. Even if this result
cannot be directly applied to health insurers operating in a different country, a
10 point hike in the combined ratio must substantially increase the insolvency
6 The expense ratio was 5.6 (2005), 5.9 (2006) and 5.6 percent (2007), which is averagefor Swiss statutory health insurers.
9
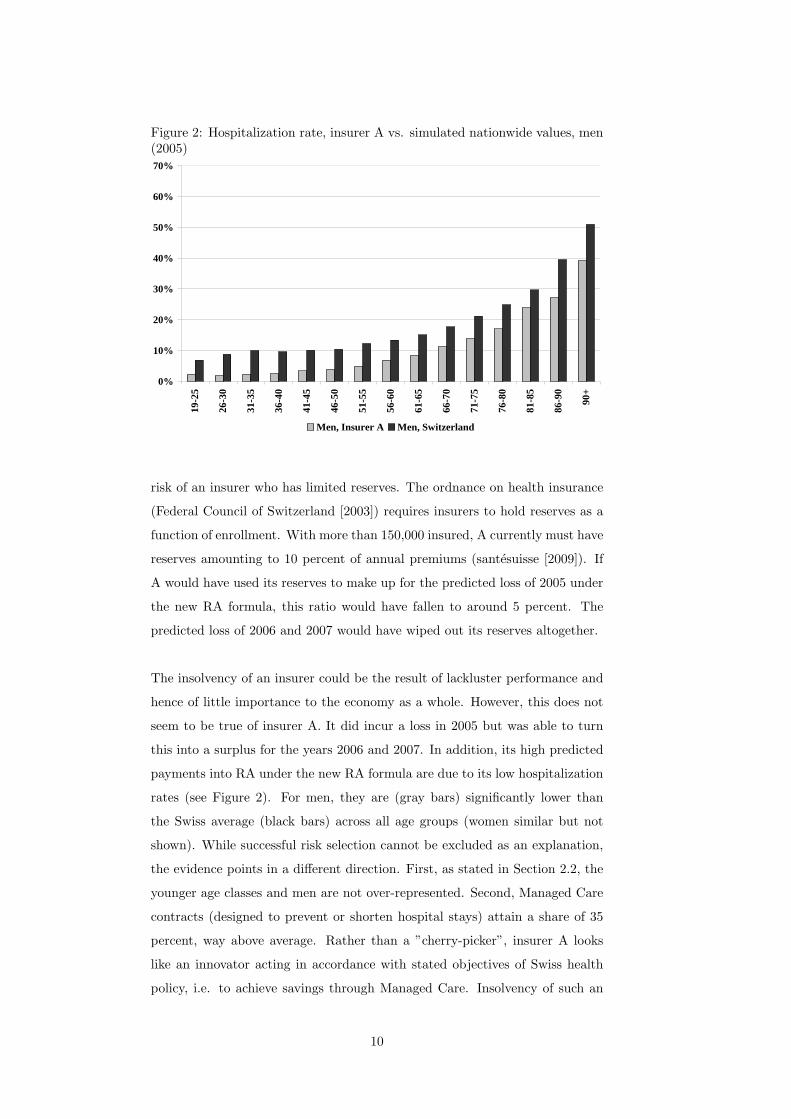
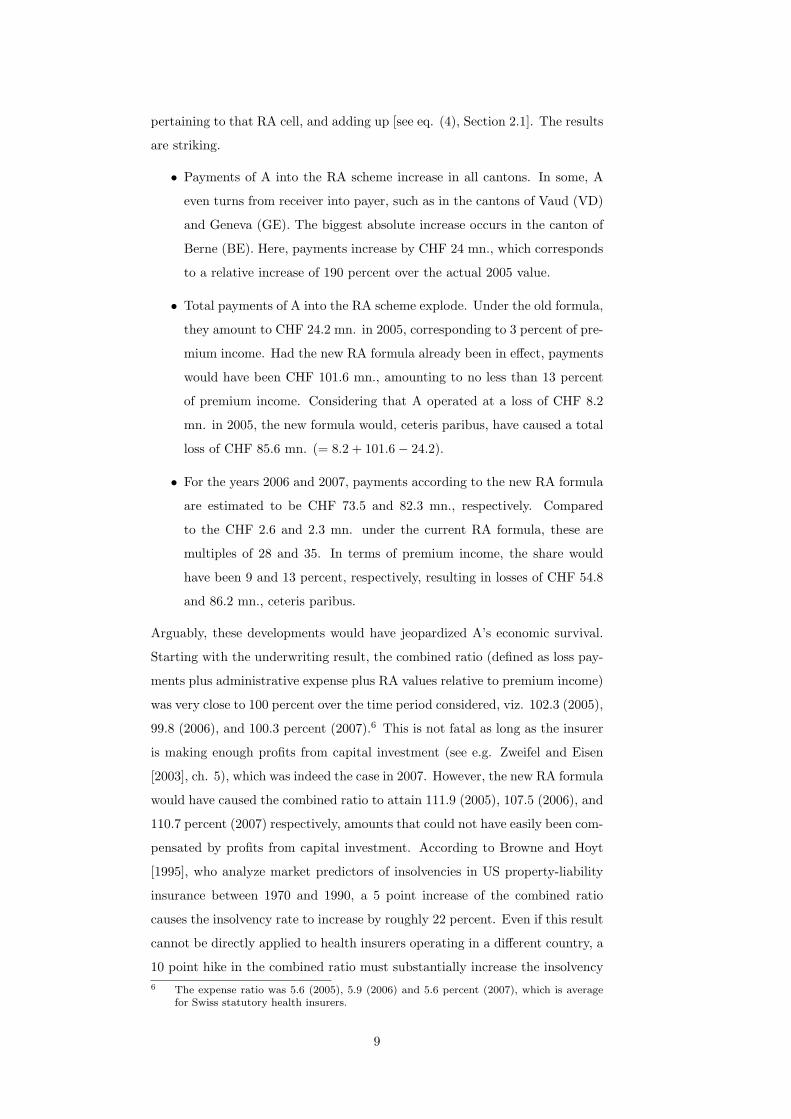
Figure 2: Hospitalization rate, insurer A vs. simulated nationwide values, men(2005)
0%
10%
20%
30%
40%
50%
60%
70%
19-2
5
26-3
0
31-3
5
36-4
0
41-4
5
46-5
0
51-5
5
56-6
0
61-6
5
66-7
0
71-7
5
76-8
0
81-8
5
86-9
0
90+
Men, Insurer A Men, Switzerland
risk of an insurer who has limited reserves. The ordnance on health insurance
(Federal Council of Switzerland [2003]) requires insurers to hold reserves as a
function of enrollment. With more than 150,000 insured, A currently must have
reserves amounting to 10 percent of annual premiums (santesuisse [2009]). If
A would have used its reserves to make up for the predicted loss of 2005 under
the new RA formula, this ratio would have fallen to around 5 percent. The
predicted loss of 2006 and 2007 would have wiped out its reserves altogether.
The insolvency of an insurer could be the result of lackluster performance and
hence of little importance to the economy as a whole. However, this does not
seem to be true of insurer A. It did incur a loss in 2005 but was able to turn
this into a surplus for the years 2006 and 2007. In addition, its high predicted
payments into RA under the new RA formula are due to its low hospitalization
rates (see Figure 2). For men, they are (gray bars) significantly lower than
the Swiss average (black bars) across all age groups (women similar but not
shown). While successful risk selection cannot be excluded as an explanation,
the evidence points in a different direction. First, as stated in Section 2.2, the
younger age classes and men are not over-represented. Second, Managed Care
contracts (designed to prevent or shorten hospital stays) attain a share of 35
percent, way above average. Rather than a ”cherry-picker”, insurer A looks
like an innovator acting in accordance with stated objectives of Swiss health
policy, i.e. to achieve savings through Managed Care. Insolvency of such an
10
insurer caused by a change in the RA formula can be justifiably qualified as
regulatory failure.
3.3 Impact on Risk Management
It is unlikely that an insurer confronted with the changes described in the
preceding sections can continue with its risk management (RM) strategy un-
changed. The two main alternatives revolve around the two principal activities
of an insurer, viz. underwriting and capital investment. Starting with the lat-
ter, the insurer could seek offsetting returns on capital investments. However,
in the present state of the economy this is very difficult. In addition, capital
market theory predicts that higher expected returns can only be achieved in
return for more risk once the efficient frontier has been reached, a consequence
that is not easily accepted by a regulator of social health insurance. The sec-
ond possibility is to increase margins from underwriting either by increasing net
premiums or reducing claims. Swiss statutory health insurers have to pay by
law for all services included in the official list of benefits, with most prices reg-
ulated. Therefore, it is not possible to decrease insurance claims significantly.
Liabilities arising from underwriting can be reduced by purchasing reinsurance;
however, up to present reinsurers have not been providing coverage against RA
liabilities. This leaves an increase of premiums net of RA payments as the
likely RM response. Since premiums are fixed by community rating regulation,
lowering payments into the RA scheme becomes the preferred alternative.
One way to achieve this objective is to enroll more unfavorable risks, in par-
ticular persons who were hospitalized during the previous year. This is the
adjustment the new RA formula was designed to bring about. The challenge
to the insurer’s RM now becomes to come up with more hospitalizations with-
out incurring much additional cost. Recall that a hospitalization counts as
soon as it exceeds three days. When segmenting A’s HCE function according
to length of stay in the hospital during the previous year, it turns out that
patients with four days do not cost significantly more than those with three.
Therefore, A has to weigh the once-and-for-all extra cost of a hospital day
against the extra contribution from the RA scheme, which may amount to sev-
eral thousand CHF (see Table 1 of the Appendix).
The possible reduction of RA payments can be estimated as follows. While
11
it may not be possible to collude with the public hospitals (who obtain a per
diem roughly twice the amount paid by the insurer because one-half of their
extra operating cost is covered by the canton) to extend all hospital stays from
three to four days, this should be possible in 50 percent of all cases. The effect
of such a RM response can be estimated with sufficient precision for the three
cantons where A has the highest market share [viz. Zurich (ZH), Berne (BE),
and Vaud (VD)]. There, it would have reduced RA payments by CHF 5 mn.
in 2007. Extrapolating to A’s entire population, one obtains CHF 9 mn., or
11.2 percent of the estimated CHF 82.3 mn. Savings of this magnitude would
have been important enough to induce a change in RM.
The cost of this change would fall on taxpayers (who cover one half of the
increased operating costs of public hospital through cantonal subsidies), em-
ployers (who bear the workdays lost), and patients (who presumably enjoy a
higher quality of life outside the hospital). For this reason, reducing the length
of hospital stays has been a stated goal of Swiss health policy, notably justi-
fying the introduction of hospital payment through Diagnosis Related Groups
by 2012 (DRGs, see SwissDRG [2009]). Thus, the fine tuning of regulation
through an improvement of the RA formula risks to burden the economy with
sizable inefficiencies.
4 Conclusion
Regulation may pose unintended challenges to the risk management (RM) of
a company. This contribution analyzes the case of health insurance, where the
imposition of community rating creates an incentive to select favorable risks.
Risk adjustment (RA) schemes have been implemented in the United States
and a few other countries to counteract this incentive. They make insurers
with an above-average share of favorable risks (indicated by age, gender, and
other adjusters) to pay into the scheme, which supports those insurers with
an above-average share of unfavorable risks. Since its current RA formula fails
to neutralize the incentive for risk selection, Switzerland will complement it in
2012 with the adjuster, ”Hospitalization of more than three days or living in
a nursing home during the previous year”. This seemingly minor fine tuning
of regulation is shown to have a potentially fatal effect on a particular health
insurer A whose payments into the RA scheme would have exploded between
2005 and 2007 if the new RA formula had been in effect. The reason is a low
rate of hospitalization thanks to a commitment to Managed Care. Therefore,
12
A’s most likely RM response would have been to increase recognized hospital-
izations by increasing length of stay from three to four days, triggering extra
payments from the RA scheme at a limited once-and-for-all cost of an extra
hospital day. The cost of this change of RM strategy would have been borne
by taxpayers (through increased subsidies of hospitals’ operating expense), em-
ployers (through lost workdays), and patients (through lower quality of life).
These findings are based on individual health expenditure data provided by
three major health insurers that are found to be sufficiently representative of
the Swiss population. Using the estimated values as the nationwide mean val-
ues per RA cell, payments by A under the current and the new RA formula
can be postdicted. The new formula is found to increase A’s RA payment by a
factor of 4 in the year 2005, by 28 in 2006, and by 35 in 2007, reaching between
9 and 13 percent of premium income. Ceteris paribus, the new RA formula
would have caused A to operate at a loss as high as CHF 85.6 mn. rather than
8.5 mn., reaching CHF 86.2 mn. (2007, 1 CHF = 0.8 US$ at 2008 exchange
rates). Losses of this magnitude would jeopardize the economic survival of an
innovative health insurer who had successfully implemented Managed Care,
very much in accordance with the stated objectives of Swiss health policy.
In view of the increased insolvency risk, a change in RM strategy would have
to be considered. Among the few options available to a regulated social health
insurer, reducing RA payments by extending hospital stays from three to four
days turns out to be the most promising. If successful in 50 percent of all
cases (say), this change would reduce A’s payments by CHF 9 mn. from an
estimated 82.3 mn. in 2007. Therefore, this particular fine tuning of regulation
may not only run counter stated policy objectives (viz. to reduce length of stay
in hospital through Managed Care) but also the interests of taxpayers who sub-
sidize current operations of hospitals, those of employers who lose workdays,
and quite likely patients who enjoy a better quality of life outside the hospital.
This particular fine tuning of health regulation therefore may have unhealthy
consequences for the economy as a whole.
There are lessons to be learned for other countries who impose community
rating on competitive health insurers, among them, the United States. First,
it is practically impossible to fully neutralize insurers’ risk selection incentive
through an RA scheme, and be it only due to their different rates of discount
13
in estimating the present value of the benefits and costs associated with risk
selection. Second, perfecting the RA formula can have unintended side effects
at the level of an individual insurer that go as far as jeopardizing its economic
survival in spite of innovative effort. In the case studied here, the insurer is
even punished for its innovative commitment to Managed Care. Finally, the
threat of survival may well trigger adjustments in RM strategy that cause an
efficiency loss to the economy as a whole.
There is an alternative that avoids the regulatory spiral described here. Health
insurers could be simply permitted to charge premiums according to estimated
risk. With sufficient pressure of competition, this would boil down to ”price
equal to expected marginal cost” since expected future health care expendi-
ture importantly reflects the insurer’s cost of enrolling an additional customer.
Wealthy individuals can pay a high risk-based premium out of their own means.
The same is true of low-income individuals who are favorable risks. The prob-
lematic group are low-income individuals who are unfavorable risks. They can
be entitled to an earmarked subsidy that kicks in as soon as their premium
exceeds a certain percentage of their income (see Zweifel and Breuer [2006]).
In fact, the new law on health insurance of 2004 introduced such a targeted
subsidy in Switzerland - without however lifting the premium regulation intro-
duced in 1911. The consequence is an avoidable fine tuning of health insurance
regulation with its unhealthy impacts not only on an individual insurer but the
economy as a whole.
14
Appendix
Table 1: Simulated and official RA payments per capita according to age andgender (CHF, 2005)
Men Average∗ Std. Min Max Official value
19-25 −2, 007 506 −3, 006 −708 −1, 96426-30 −1, 228 834 −2, 166 2, 287 −1, 89031-35 −901 679 −1, 733 1, 202 −1, 77136-40 −979 422 −1, 749 248 −1, 62541-45 −829 352 −1, 435 −40 −1, 39946-50 −544 466 −1, 616 349 −1, 09251-55 −110 379 −978 715 −62556-60 290 300 −558 816 1361-65 885 418 229 1, 649 77166-70 1, 561 599 188 2, 465 1, 63871-75 2, 535 549 983 3, 436 2, 87376-80 3, 209 653 1, 885 4, 128 3, 84681-85 4, 128 1, 362 1, 262 6, 984 4, 98686-90 5, 287 1, 208 2, 752 7, 946 6, 88090+ 6, 732 1, 514 2, 945 8, 916 9, 542
Women Average∗ Std. Min Max Official value
19-25 −1, 773 494 −2, 780 −974 −1, 48426-30 −1, 025 462 −2, 212 −312 −94631-35 −746 560 −1, 694 −1, 126 −75036-40 −961 329 −1, 577 −316 −92541-45 −966 279 −1, 749 −536 −92246-50 −732 309 −1, 296 −177 −64751-55 −443 268 −1, 045 107 −23656-60 −16 321 −512 842 20561-65 444 247 20 765 73766-70 982 396 210 1, 604 1, 41571-75 1, 983 446 758 2, 662 2, 38576-80 3, 137 656 1, 838 4, 406 3, 67281-85 4, 641 776 2, 788 6, 111 5, 59686-90 6, 917 988 5, 115 8, 383 8, 48690+ 8, 673 1, 770 4, 465 11, 620 12, 457
1 CHF = 0.8 US$ at 2008 exchange rates∗ Average over all 26 Swiss cantons
15
References
K. Beck. Risiko Krankenversicherung, Risikomanagement in einem regulierten
Krankenversicherungsmarkt (Risk Health Insurance. Risk Management in a
Regulated Market for Health Insurance). Haupt Verlag, Bern, 2004.
K. Beck, M. Trottmann, U. Kaeser, B. Keller, S. von Rotz, and P. Zweifel.
Nachhaltige Gestaltung des Risikoausgleichs in der Schweizer Krankenver-
sicherung - (Sustainable Design of Risk Adjustment in Swiss Health Insur-
ance). Ott Verlag, Basel, 2006.
M. J. Browne and R. E. Hoyt. Economic and market predictors of insolvencies
in the property-liability industry. The Journal of Risk and Insurance, 62(2):
309–327, 1995.
D. Bumenthal, J. S. Weissman, M. Wachterman, E. Weil, R. S. Stafford, J. M.
Perrin, T. G. Ferris, K. Kuhlthau, R. Kaushal, and L. I. Lezzoni. The who,
what, and why of risk adjustment: A technology on the cusp of adoption.
Journal of Health Politics, Policy and Law, 30(3):453–473, 2005.
S. Calfo. Medicare risk adjustment, 2009. URL www.maac-actuary.org/
Past_Meetings/2008_Annual_Meeting/Session_5B_Medicare_Risk_
Adjustment.ppt. Center for Medicare and Medicaid Services.
R. Ellis and W. Van de Ven. Risk adjustment in competitive health plan mar-
kets. In A. Culyer and J. Newhouse, editors, Handbook of Health Economics,
pages 755–845. North-Holland, Amsterdam, 2000.
P. Eugster, M. Sennhauser, and P. Zweifel. Capping risk adjustment? Under
revision: Journal of Health Economics, 2009.
Federal Council of Switzerland. Verordnung uber die Krankenversicherung
(Regulation on health insurance). 2003. URL http://www.admin.ch/ch/
d/sr/832_102/.
J. Glazer and T. G. McGuire. Setting health plan premiums to ensure efficient
quality in health care: Minimum variance optimal risk adjustment. Journal
of Public Economics, 84:153–173, 2002.
A. Holly, L. Gardiol, Y. Eggli, and T. Yalcin. Health-based risk adjustment in
Switzerland: An exploration using medical information from prior hospital-
ization. Mimeo; Institut d’Economie et management de la santE: Lausanne,
2003.
16
M. J. Ingber. Implementation of risk adjustment for Medicare. Health Care
Financing Review, 21(3):119–126, 2000.
W. Jack. Optimal risk adjustment with adverse selection and spatial competi-
tion. Journal of Health Economics, 25:908–926, 2006.
Joint Organization KVG. Geschaftsbericht (Business report). Solothurn, 2007.
URL www.kvg.org/info/gbericht/default.htm.
L. Lamers. Risk adjusted capitation based on the diagnostic cost group model:
An empirical evaluation with health survey information. Health Services
Research, 33(6):1727–44, 1999.
L. Lamers and R. Van Vliet. The Pharmacy-based Cost Group Model: Vali-
dating and adjusting the classification of medications for chronic conditions
to the Dutch situation. Health Policy, 68:113–128, 2003a.
L. Lamers and R. Van Vliet. Health-based risk adjustment: Improving the
pharmacy-based cost group model to reduce gaming possibilities. European
Journal of Health Economics, 4:107–114, 2003b.
R. Miller and H. Luft. Does Managed Care lead to better or worse quality of
care? Health Affairs, 16(5):7–25, 1997.
G. C. Pope, R. P. Ellis, A. S. Ash, C.-F. Liu, J. Z. Ayanian, D. W. Bates,
H. Burstin, L. I. Iezzoni, and M. Ingber. Principal inpatient diagnostic cost
group model for medicare risk adjustment. Health Care Financing Review,
21(3):93–118, 2000.
santesuisse. Die Reserven in der obligatorischen Krankenpflegeversicherung
(Reserves in statutory health insurance), 2009. Swiss Association of Health
Insurers.
S. Spycher. Reform des Risikoausgleichs in der Krankenversicherung (Reform of
risk adjustment in health insurance). In Bundesamt fur Sozialversicherung,
editor, Beitrage zur sozialen Sicherheit, page 54. Berne, 2000.
SwissDRG. Swissdrg, 2009. URL www.swissdrg.org.
W. Van de Ven and F. Schut. Risk equalization in an individual health in-
surance market: The only escape from the tradeoff between affordability,
efficiency and selection - the Netherlands as a case study. Working Paper,
2007.
17

W. Van de Ven, R. Van Vliet, and L. Lamers. Health-adjusted premium sub-
sidies in the Netherlands. Health Affairs, 23(3):45–55, 2004.
P. Zweifel and M. Breuer. The case for risk-based premiums in public health
insurance. Health Economics, Policy and Law, 1(2):171–188, 2006.
P. Zweifel and R. Eisen. Versicherungsokonomie (Insurance Economics).
Springer Verlag, 2nd. ed., Heidelberg, 2003.
18
Working Papers of the Socioeconomic Institute at the University of Zurich
The Working Papers of the Socioeconomic Institute can be downloaded from http://www.soi.uzh.ch/research/wp_en.html
0916 Fine Tuning of Health Insurance Regulation: Unhealthy Consequences for an Individual Insurer, Johannes Schoder, Michèle Sennhauser, Peter Zweifel, August 2009, 18 p.
0915 Capping Risk Adjustment?, Patrick Eugster, Michèle Sennhauser, Peter Zweifel, September 2009, 27 p.
0914 A Pharmaceutical Innovation: Is it Worth the Money? Whose Money?, Michèle Sennhauser, Peter Zweifel, September 2009, 22 p.
0913 Copula-based bivariate binary response models, Rainer Winkelmann, August 2009, 26 p.
0912 Simulating WTP Values from Random-Coefficient Models, Maurus Rischatsch, July 2009, 6 p.
0911 Physician dispensing and the choice between generic and brand-name drugs – Do margins affect choice?, Maurus Rischatsch, Maria Trottmann, July 2009, 15 p.
0910 GPs' preferences: What price fee-for-service?, Peter Zweifel, Maurus Rischatsch, Angelika Brändle, July 2009, 21 p.
0909 Social Mobility and Preferences for Income Redistribution: Evidence from a Discrete Choice Experiment, Ilja Neustadt, Peter Zweifel, July 2009, 31 p.
0908 Robust estimation of zero-inflated count models, Kevin E. Staub, Rainer Winkelmann June 2009, 22 p.
0907 Competitive Screening in Insurance Markets with Endogenous Wealth Heterogeneity, Nick Netzer, Florian Scheuer, April 2009, 28 p.
0906 New Flight Regimes and Exposure to Aircraft Noise: Identifying Housing Price Effects Using a Ratio-of-Ratios Approach, Stefan Boes, Stephan Nüesch, April 2009, 40 p.
0905 Patents versus Subsidies – A Laboratory Experiment, Donja Darai, Jens Großer, Nadja Trhal, March 2009, 59 p.
0904 Simple tests for exogeneity of a binary explanatory variable in count data regression models, Kevin E. Staub, February 2009, 30 p.
0903 Spurious correlation in estimation of the health production function: A note, Sule Akkoyunlu, Frank R. Lichtenberg, Boriss Siliverstovs, Peter Zweifel, February 2009, 13 p.
0902 Making Sense of Non-Binding Retail-Price Recommendations, Stefan Bühler, Dennis L. Gärtner, February 2009, 30 p.
0901 Flat-of-the-Curve Medicine – A New Perspective on the Production of Health, Johnnes Schoder, Peter Zweifel, January 2009, 35 p.
0816 Relative status and satisfaction, Stefan Boes, Kevin E. Staub, Rainer Winkelmann, December 2008, 11 p.
0815 Delay and Deservingness after Winning the Lottery, Andrew J. Oswald, Rainer Winkelmann, December 2008, 29 p.
0814 Competitive Markets without Commitment, Nick Netzer, Florian Scheuer, November 2008, 65 p.
0813 Scope of Electricity Efficiency Improvement in Switzerland until 2035, Boris Krey, October 2008, 25 p.
0812 Efficient Electricity Portfolios for the United States and Switzerland: An Investor View, Boris Krey, Peter Zweifel, October 2008, 26 p.
0811 A welfare analysis of “junk” information and spam filters; Josef Falkinger, October 2008, 33 p.
0810 Why does the amount of income redistribution differ between United States and Europe? The Janus face of Switzerland; Sule Akkoyunlu, Ilja Neustadt, Peter Zweifel, September 2008, 32 p.
0809 Promoting Renewable Electricity Generation in Imperfect Markets: Price vs. Quantity Policies; Reinhard Madlener, Weiyu Gao, Ilja Neustadt, Peter Zweifel, July 2008, 34p.
0808 Is there a U-shaped Relation between Competition and Investment? Dario Sacco, July 2008, 26p.
0807 Competition and Innovation: An Experimental Investigation, May 2008, 20 p. 0806 All-Pay Auctions with Negative Prize Externalities: Theory and Experimental
Evidence, May 2008, 31 p. 0805 Between Agora and Shopping Mall, Josef Falkinger, May 2008, 31 p. 0804 Provision of Public Goods in a Federalist Country: Tiebout Competition, Fiscal
Equalization, and Incentives for Efficiency in Switzerland, Philippe Widmer, Peter Zweifel, April 2008, 22 p.
0803 Stochastic Expected Utility and Prospect Theory in a Horse Race: A Finite Mixture Approach, Adrian Bruhin, March 2008, 25 p.
0802 The effect of trade openness on optimal government size under endogenous firm entry, Sandra Hanslin, March 2008, 31 p.
0801 Managed Care Konzepte und Lösungsansätze – Ein internationaler Vergleich aus schweizerischer Sicht, Johannes Schoder, Peter Zweifel, February 2008, 23 p.
0719 Why Bayes Rules: A Note on Bayesian vs. Classical Inference in Regime Switching Models, Dennis Gärtner, December 2007, 8 p.
0718 Monoplistic Screening under Learning by Doing, Dennis Gärtner, December 2007, 29 p.
0717 An analysis of the Swiss vote on the use of genetically modified crops, Felix Schläpfer, November 2007, 23 p.
0716 The relation between competition and innovation – Why is it such a mess? Armin Schmutzler, November 2007, 26 p.
0715 Contingent Valuation: A New Perspective, Felix Schläpfer, November 2007, 32 p. 0714 Competition and Innovation: An Experimental Investigation, Dario Sacco, October
2007, 36p. 0713 Hedonic Adaptation to Living Standards and the Hidden Cost of Parental Income,
Stefan Boes, Kevin Staub, Rainer Winkelmann, October 2007, 18p. 0712 Competitive Politics, Simplified Heuristics, and Preferences for Public Goods,
Felix Schläpfer, Marcel Schmitt, Anna Roschewitz, September 2007, 40p. 0711 Self-Reinforcing Market Dominance,
Daniel Halbheer, Ernst Fehr, Lorenz Goette, Armin Schmutzler, August 2007, 34p. 0710 The Role of Landscape Amenities in Regional Development: A Survey of Migration,
Regional Economic and Hedonic Pricing Studies, Fabian Waltert, Felix Schläpfer, August 2007, 34p.
0709 Nonparametric Analysis of Treatment Effects in Ordered Response Models, Stefan Boes, July 2007, 42p.
0708 Rationality on the Rise: Why Relative Risk Aversion Increases with Stake Size, Helga Fehr-Duda, Adrian Bruhin, Thomas F. Epper, Renate Schubert, July 2007, 30p.
0707 I’m not fat, just too short for my weight – Family Child Care and Obesity in Germany, Philippe Mahler, May 2007, 27p.
0706 Does Globalization Create Superstars?, Hans Gersbach, Armin Schmutzler, April 2007, 23p.