Embed Size (px)
Citation preview

arX
iv:0
808.
0932
v1 [
astr
o-ph
] 7
Aug
200
8
First Resolved Images of the Eclipsing and Interacting Binary β
Lyrae
M. Zhao1, D. Gies2, J. D. Monnier1, N. Thureau3, E. Pedretti3, F. Baron4, A. Merand2,
T. ten Brummelaar2, H. McAlister2, S. T. Ridgway5, N. Turner2, J. Sturmann2, L.
Sturmann2, C. Farrington2, P. J. Goldfinger2
ABSTRACT
We present the first resolved images of the eclipsing binary β Lyrae, obtained
with the CHARA Array interferometer and the MIRC combiner in the H band.
The images clearly show the mass donor and the thick disk surrounding the mass
gainer at all six epochs of observation. The donor is brighter and generally ap-
pears elongated in the images, the first direct detection of photospheric tidal
distortion due to Roche-lobe filling. We also confirm expectations that the disk
component is more elongated than the donor and is relatively fainter at this wave-
length. Image analysis and model fitting for each epoch were used for calculating
the first astrometric orbital solution for β Lyrae, yielding precise values for the
orbital inclination and position angle. The derived semi-major axis also allows
us to estimate the distance of β Lyrae; however, systematic differences between
the models and the images limit the accuracy of our distance estimate to about
15%. To address these issues, we will need a more physical, self-consistent model
to account for all epochs as well as the multi-wavelength information from the
eclipsing light curves.
Subject headings: binaries: eclipsing – stars: fundamental parameters – stars:
individual (β Lyrae) – techniques: interferometric – infrared: stars – facility:
CHARA
[email protected]: University of Michigan Astronomy Department, 941 Dennison Bldg, Ann Arbor,
MI 48109-1090, USA
2The CHARA Array, Georgia State University, USA
3University of St. Andrews, Scotland, UK
4University of Cambridge, UK
5National Optical Astronomy Observatory, NOAO, Tucson, AZ

– 2 –
1. Introduction
Interacting binaries are unique testbeds for many important astrophysical processes,
such as mass and momentum transfer, accretion, tidal interaction, etc. These processes
provide information on the evolution and properties of many types of objects, including
low-mass black holes and neutron stars (in low-mass X-ray binaries), symbiotic binaries,
cataclysmic variables, novae, etc. Although these types of objects are widely studied by
indirect methods such as spectroscopy, radial velocity, and sometimes eclipse mapping, very
few of them have been directly resolved because they are very close to each other and far
away from us. Thus, directly imaging interacting binaries, although very challenging, will
greatly help us to improve our understanding of these objects.
The star β Lyrae (Sheliak, HD 174638, HR 7106, V = 3.52, H=3.35) is a well known
interacting and eclipsing binary that has been widely studied since its discovery in 1784
(Goodricke 1785). According to the current picture (Harmanec 2002), the system consists of
a B6-8 II Roche-lobe filling mass-losing star, which is generally denoted as the donor or the
primary, and an early B type mass-gaining star that is generally denoted as the gainer or the
secondary. The donor, which was initially more massive than the gainer, has a current mass
of about 3 M⊙, while the gainer has a mass of about 13 M⊙. It is thought that the gainer is
completely embedded in a thick accretion disk with bipolar jet-like structures perpendicular
to the disk, which creates a light-scattering halo above its poles. The orbit of the system
is highly circular (Harmanec & Scholz 1993), and is very close to edge-on (Linnell 2000).
Recent RV study on the ephemeris of the system gives a period of 12.d94 (Ak et al. 2007).
The period is increasing at a rate of ∼ 19 sec per year due to the high mass transfer rate,
2 × 10⁻⁵ M⊙ yr−1, of the system.
The primary eclipse of the light curve (i.e., at phase 0) corresponds to the eclipse of
the donor. In the UBV bands, the surface of the donor is brighter than that of the gainer,
and therefore the primary minimum is deeper than the secondary minimum. At longer
wavelengths, however, the studies of Jameson & Longmore (1976) and Zeilik et al. (1982)
suggest that the relative depth of the secondary minimum in the light curve gradually deepens
and becomes deeper than the primary minimum at wavelengths longer than 3.6µm.
Light curve studies and theoretical models have shown that, at the distance of 296pc
(van Leeuwen 2007), the estimated separation of the binary is only 0.92 milli-arcsecond
(hereafter mas, 58.5R⊙). The angular diameter of the donor is ∼0.46 mas (29.4R⊙), and
the disk surrounding the gainer is only ∼ 1 mas across (e.g., Linnell 2000; Harmanec 2002).
The goal of directly imaging β Lyr, therefore, requires the angular resolution only achievable
by today’s long-baseline interferometers. Recently, Schmitt et al. (2008) used the NPOI
interferometer to image successfully the Hα emission of β Lyr, an update to the pioneering

– 3 –
work of Harmanec et al. (1996). Also, radio work using MERLIN found a nebula surrounding
the secondary but could not resolve its bipolar shape (Umana et al. 2000). Despite recent
progress, the individual objects of the system have not been resolved yet, putting even a
simple astrometric orbit beyond our reach.
In this study, we present the first resolved images of the β Lyr system at multiple phases,
obtained with the CHARA Array and the MIRC combiner. We give a brief introduction to
our observations and data reduction in §2. We present our aperture synthesis images with
simple models in §3. In §4 we discuss our astrometric orbit of β Lyr and we give the outlook
for future work in §5.
2. Observations and data reduction
Our observations were conducted at the Georgia State University (GSU) Center for
High Angular Resolution Astronomy (CHARA) interferometer array along with the MIRC
instrument. The CHARA array, located on Mt. Wilson and consisting of six 1-meter tele-
scopes, is the longest optical/IR interferometer array in the world (ten Brummelaar et al.
2005). It has 15 baselines ranging from 34m to 331m, providing resolutions up to ∼0.5 mas
at H band and ∼ 0.7 mas at K band.
The Michigan Infra-Red Combiner (MIRC) was used here to combine 4 CHARA tele-
scopes together for true interferometric imaging in H band, providing 6 visibilities, 4 closure
phases and 4 triple amplitudes simultaneously in 8 narrow spectral bands (see Monnier et al.
2004, 2006, for details). Specifically, the β Lyr system was observed on 6 nights in 2006 and
2007 using an array configuration optimized for good imaging (equal Fourier coverage in all
directions) and following standard observing procedures (Monnier et al. 2007, M. Zhao et
al. 2008, in preparation). A typical baseline coverage of our observations is shown in Figure
1. In short, we observed our target along with two or three calibrators on each night and a
complete observing log is listed in Table 1.
The data reduction process follows the pipeline outlined by Monnier et al. (2007). In
brief, after frame co-adding, background subtraction and Fourier transform of the raw data,
fringe amplitudes and phases are used to form squared-visibilities and triple products. Pho-
tometric calibrations are estimated using shutter matrix measurements and partial beam
chopping. Finally, calibrators with known sizes (see Table 1) are used to calibrate the drifts
in overall system response before obtaining final calibrated squared-visibilites and complex
triple amplitudes.

– 4 –
3. Synthesis imaging and modeling
For imaging with optical interferometry data, we employed two independent applica-
tions: “Markov-Chain Imager for Optical Interferometry (MACIM)” (Ireland et al. 2006)
and the Maximum-Entropy-based BSMEM (Buscher 1994). Further description and a de-
tailed comparison of these algorithms on simulated data appear in Lawson et al. (2004,
2006). Both of these algorithms benefit from use of prior information, generally based on
lower resolution data. For β Lyr we began each image reconstruction with a two-component
Gaussian model which mainly acts to limit the field-of-view of the image. The final images
do not resemble the priors except in general extent, i.e., the final positions, relative sizes,
and relative brightnesses are not dependent on the priors. The final reconstructed images
from both methods are shown in Figure 2. The MACIM and BSMEM images are consistent
with each other, although they use very different algorithms, giving confidence to the image
fidelity. Any differences, such as the more Gaussian shapes for BSMEM compared to the
more “flat-top” profiles for MACIM, illustrate the limitations of our dataset. We present
here results from both algorithms in lieu of image “error bars” which are notoriously difficult
to define in aperture synthesis imaging.
The six epochs span all phases of the orbit, changing from middle primary eclipse
(phase=0.035) to nearly maximum elongation (phase=0.210 and 0.828), and secondary
eclipse (phase=0.438). The system is well resolved into two separate components at phases
close to the maximum elongation. Since the primary eclipse is still the deeper one in the
H-band (Jameson & Longmore 1976), we can conclude that the object with higher surface
brightness is the mass donor star (i.e., the component moving from left to right in the 2007
July sequence). The donor is partially resolved and appears elongated at all epochs except at
phase 0.035 when it is blocked by the disk, directly confirming its Roche-lobe filling picture.
The thick disk surrounding the gainer is also resolved and appears elongated. At the first
epoch (phase = 0.035), we see mostly the emission from the disk superposed with a small
amount of light from the poles of the donor.
We can extract further information by constructing a simple two-component model to
determine the separation and position angle for each epoch. We assume the donor and gainer
can be modeled as uniform ellipses. Other models, such as two truncated gaussian ellipses,
a rain-drop-shaped Roche-lobe filling star with a truncated gaussian disk, etc., were also
considered and gave equivalent results due to limited resolution. Therefore, for simplicity
and to minimize the degrees of freedom of the model, uniform ellipses are adopted. The free
parameters in the models are: the semi-major and semi-minor axes of the two components,
their individual position angles, the separation and position angle of the system, and the flux
ratio of the donor and the disk. We used ephemeris data from Ak et al. (2007) to fix which
– 5 –
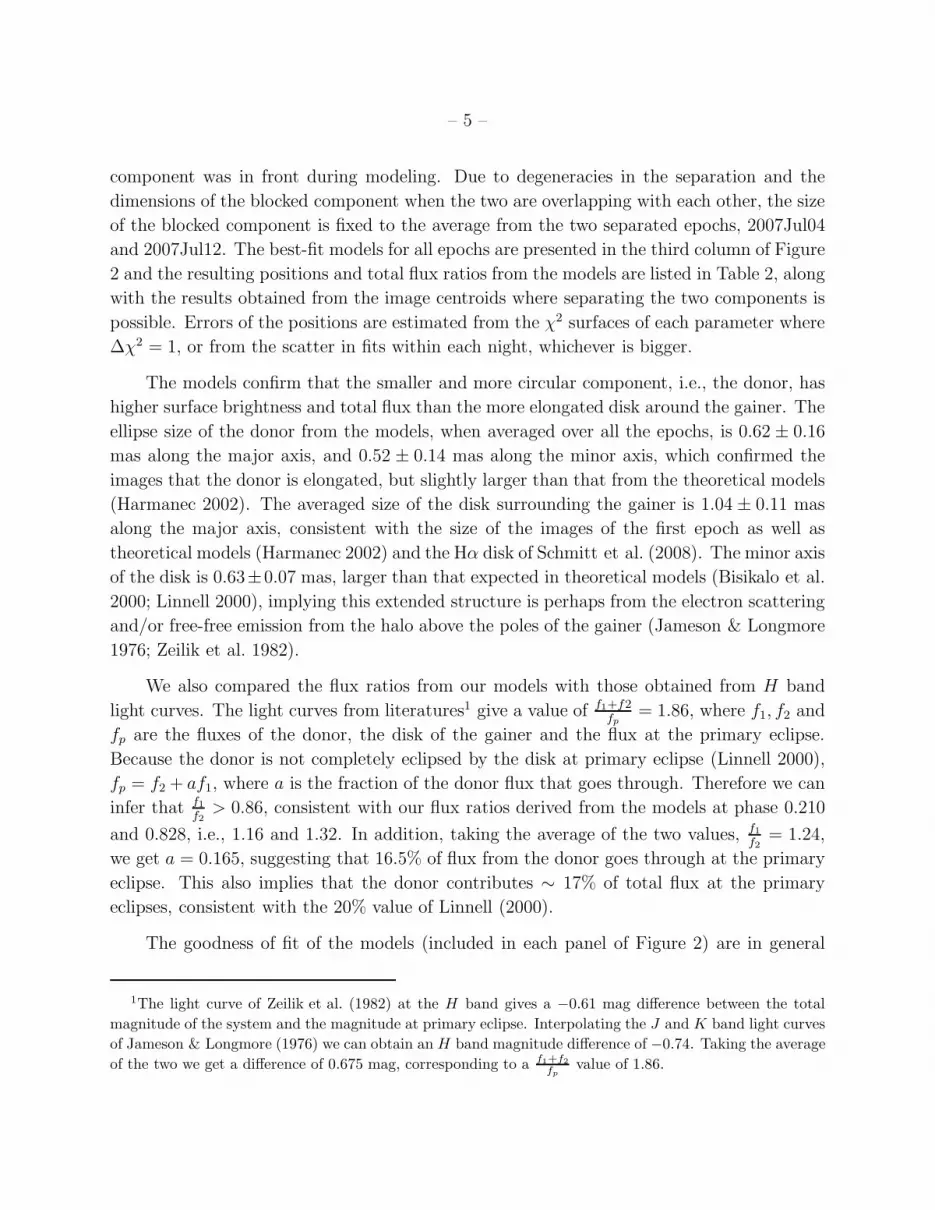
component was in front during modeling. Due to degeneracies in the separation and the
dimensions of the blocked component when the two are overlapping with each other, the size
of the blocked component is fixed to the average from the two separated epochs, 2007Jul04
and 2007Jul12. The best-fit models for all epochs are presented in the third column of Figure
2 and the resulting positions and total flux ratios from the models are listed in Table 2, along
with the results obtained from the image centroids where separating the two components is
possible. Errors of the positions are estimated from the χ2 surfaces of each parameter where
∆χ2 = 1, or from the scatter in fits within each night, whichever is bigger.
The models confirm that the smaller and more circular component, i.e., the donor, has
higher surface brightness and total flux than the more elongated disk around the gainer. The
ellipse size of the donor from the models, when averaged over all the epochs, is 0.62 ± 0.16
mas along the major axis, and 0.52 ± 0.14 mas along the minor axis, which confirmed the
images that the donor is elongated, but slightly larger than that from the theoretical models
(Harmanec 2002). The averaged size of the disk surrounding the gainer is 1.04 ± 0.11 mas
along the major axis, consistent with the size of the images of the first epoch as well as
theoretical models (Harmanec 2002) and the Hα disk of Schmitt et al. (2008). The minor axis
of the disk is 0.63±0.07 mas, larger than that expected in theoretical models (Bisikalo et al.
2000; Linnell 2000), implying this extended structure is perhaps from the electron scattering
and/or free-free emission from the halo above the poles of the gainer (Jameson & Longmore
1976; Zeilik et al. 1982).
We also compared the flux ratios from our models with those obtained from H band
light curves. The light curves from literatures1 give a value of f1+f2fp
= 1.86, where f1, f2 and
fp are the fluxes of the donor, the disk of the gainer and the flux at the primary eclipse.
Because the donor is not completely eclipsed by the disk at primary eclipse (Linnell 2000),
fp = f2 + af1, where a is the fraction of the donor flux that goes through. Therefore we can
infer that f1
f2> 0.86, consistent with our flux ratios derived from the models at phase 0.210
and 0.828, i.e., 1.16 and 1.32. In addition, taking the average of the two values, f1
f2= 1.24,
we get a = 0.165, suggesting that 16.5% of flux from the donor goes through at the primary
eclipse. This also implies that the donor contributes ∼ 17% of total flux at the primary
eclipses, consistent with the 20% value of Linnell (2000).
The goodness of fit of the models (included in each panel of Figure 2) are in general
1The light curve of Zeilik et al. (1982) at the H band gives a −0.61 mag difference between the total
magnitude of the system and the magnitude at primary eclipse. Interpolating the J and K band light curves
of Jameson & Longmore (1976) we can obtain an H band magnitude difference of −0.74. Taking the average
of the two we get a difference of 0.675 mag, corresponding to a f1+f2
fp
value of 1.86.

– 6 –
similar to that of the images. Nevertheless, discrepancies exist between the models and
the images. For instance, the components’ separations from the models are slightly smaller
than the images. The gainer disk appears bigger in the models than in the images. These
properties demonstrate the complexity of β Lyr and suggest that the disk may be asymmetric.
They also highlight the deficiencies in our models and underscore the need for a self-consistent
model that treats the radiative transfer properly and accounts for all epochs simultaneously.
4. The orbit of β Lyr
Despite the deficiencies in our simplified models, the positions of each component’s
center of light are well-constrained, especially near the maximum elongation of the orbit.
Thus, the above results, along with the elements obtained from RV and light curve studies
allow us to calculate the astrometric orbit of β Lyr for the first time. We adopt P = 12.d9414
and Tmini = JD2454283.0430 (on 2007Jul01) from the recent ephemeris2 (Ak et al. 2007),
and e = 0 (Harmanec 2002). The best-fit orbit using the model positions is shown in Figure
3. The resultant inclination, position angle of the ascending node (Ω) and semi-major axis
are listed in Table 3. Other orbital solutions using positions from the images are also listed
in the table. Errors of orbital elements are estimated using Monte-Carlo simulations. The 3
sets of inclination and Ω in Table 3 are consistent with each other and suggest a retrograde
orbit (i.e., position angle decreasing with time). Our estimate on Ω is roughly consistent
with the 248.8 value in Schmitt et al. (2008), and is almost perpendicular to the orientation
of the jet (163.5) implied by Hoffman et al. (1998).
We can also estimate the distance of β Lyr using orbital parallax (see Table 3) by
combining its angular semi-major axis with the linear a sin i value, 57.87±0.62R⊙3. The
distance from our models, 314±17 pc, is larger than that from the images, 278±24 pc and
274±34 pc, but they are all consistent within errors with the Hipparcos distance, 296±16
pc (van Leeuwen 2007). Finally, using the newly estimated M sin3 i for both components
(see footnote 3) together with the inclination from the models, we get mass of the gainer =
12.76±0.27M⊙ and mass of the donor= 2.83±0.18M⊙.
2Tmini (phase 0) is the epoch of primary minimum light.
3We obtain the semimajor axis by combining the semiamplitude of the gainer K1 (41.4 ± 1.3 km s−1,
Harmanec & Scholz 1993; 42.1 ± 1.3 km s−1 [error assumed], Bisikalo et al. 2000; 35.4 ± 2.7 km s−1 [from
their Fig. 5], Ak et al. 2007; yielding a weighted average of 41.1 ± 2.7 km s−1) with that for the donor K2
(185.27 ± 0.20 km s−1, Ak et al. 2007). We derive q = M2/M1 = 0.222 ± 0.013, a sin i = 57.87 ± 0.62R⊙,
M1 sin3 i = 12.73± 0.27 M⊙, and M2 sin3 i = 2.82 ± 0.18 M⊙

– 7 –
5. Future work
We have only presented simple two-component models in this work since we mostly
focus on the orbital positions of β Lyr. We have already discussed problematic discrepancies
between the models and the images and also some internal inconsistencies between the model
epochs. The systematic difference in component separations between the images compared to
the model fits poses the most severe problem, limiting the accuracy of our distance estimates
to ∼ 15%. To address these issues and better understand other physical properties of β
Lyrae, a more physical, self-consistent model is required that treats the radiative transfer
and the sizes of the two components properly, accounts for all epochs simultaneously, and
incorporates the multi-wavelength information from eclipsing light curves.
We thank Michael Ireland for the MACIM package used in this work. We also thank the
referee’s valuable suggestions and comments. The CHARA Array is funded by the National
Science Foundation through NSF grants AST-0307562 and AST-0606958 and by the Georgia
State University. We thank the support for this work by the Michelson Graduate Fellowship
(MZ), the NSF Grants AST-0606861 (DG), nsf-ast 0352723, nsf-ast 0707927, NASA NNG
04GI33G (JDM), and EU grant MOIF-CT-2004-002990 (NT). EP was formally supported by
the Michelson Postdoctoral Fellowship and is currently supported by a Scottish Universities
Physics Association (SUPA) advanced fellowship.
REFERENCES
Ak, H., Chadima, P., Harmanec, P., et al. 2007, A&A, 463, 233
Bisikalo, D. V., Harmanec, P., Boyarchuk, A. A., Kuznetsov, O. A., & Hadrava, P. 2000,
A&A, 353, 1009
Blackwell, D. E., & Lynas-Gray, A. E. 1994, A&A, 282, 899
Buscher, D. F., 1994, Proc. SPIE 2200, 260
Goodricke, J. 1785, Phil. Trans. Roy. Soc., 75
Harmanec, P. 2002, Astronomische Nachrichten, 323, 87
Harmanec, P., Morand, F., et al. 1996, A&A, 312, 879
Harmanec, P., & Scholz, G. 1993, A&A, 279, 131

– 8 –
Hoffman, J. L., Nordsieck, K. H., & Fox, G. K. 1998, AJ, 115, 1576
Ireland, M. J., Monnier, J. D., & Thureau, N. 2006, Proc. SPIE, 6268, 62681T
Jameson, R. F., & Longmore, A. J. 1976, MNRAS, 174, 217
Lawson, P. R., et al. 2004, Proc. SPIE, 5491, 886
Lawson, P. R., et al. 2006, Proc. SPIE, 6268, 62681U
Leggett, S. K., Mountain, C. M., Selby, M. J., Blackwell, D. E., Booth, A. J., Haddock,
D. J., & Petford, A. D. 1986, A&A, 159, 217
Linnell, A. P. 2000, MNRAS, 319, 255
Monnier, J. D., Berger, J.-P., Millan-Gabet, R., & Ten Brummelaar, T. A. 2004, Proc. SPIE,
5491, 1370
Monnier, J. D., et al. 2006, Proc. SPIE, 6268, 62681
Monnier, J. D., et al. 2007, Science, 317, 342
Schmitt, H. R., et al. 2008, ApJ, submitted (ArXiv:0801.4772)
ten Brummelaar, T. A., et al. 2005, ApJ, 628, 453
Umana, G., Maxted, P. F. L., Trigilio, C., Fender, R. P., Leone, F., & Yerli, S. K. 2000,
A&A, 358, 229
van Leeuwen, F. 2007, Hipparcos, the New Reduction of the Raw Data (ASSL 350) (Dor-
drecht: Springer)
Zeilik, M., Heckert, P., Henson, G., & Smith, P. 1982, AJ, 87, 1304
This preprint was prepared with the AAS LATEX macros v5.2.
– 9 –
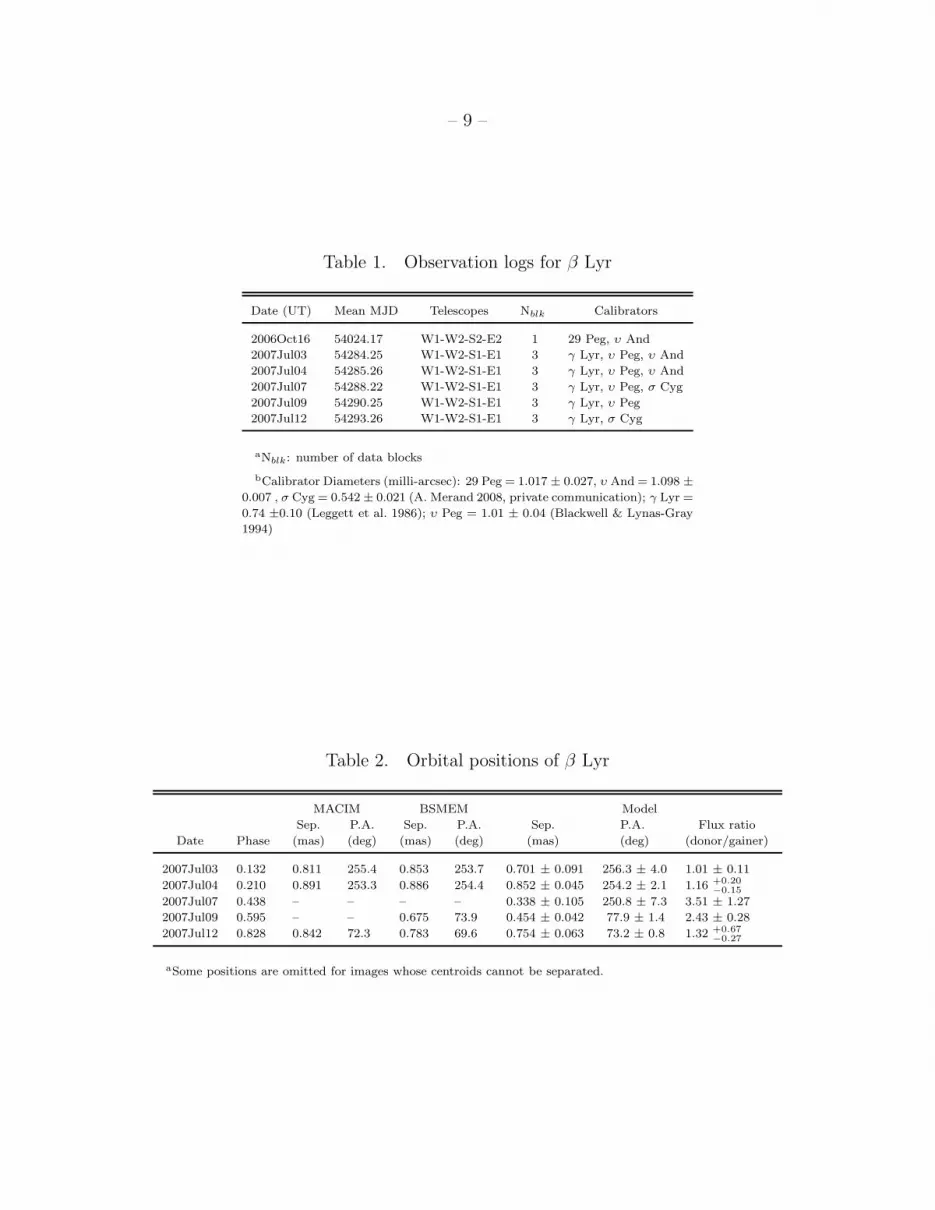
Table 1. Observation logs for β Lyr
Date (UT) Mean MJD Telescopes Nblk Calibrators
2006Oct16 54024.17 W1-W2-S2-E2 1 29 Peg, υ And
2007Jul03 54284.25 W1-W2-S1-E1 3 γ Lyr, υ Peg, υ And
2007Jul04 54285.26 W1-W2-S1-E1 3 γ Lyr, υ Peg, υ And
2007Jul07 54288.22 W1-W2-S1-E1 3 γ Lyr, υ Peg, σ Cyg
2007Jul09 54290.25 W1-W2-S1-E1 3 γ Lyr, υ Peg
2007Jul12 54293.26 W1-W2-S1-E1 3 γ Lyr, σ Cyg
aNblk: number of data blocks
bCalibrator Diameters (milli-arcsec): 29 Peg = 1.017 ± 0.027, υ And = 1.098 ±
0.007 , σ Cyg = 0.542 ± 0.021 (A. Merand 2008, private communication); γ Lyr =
0.74 ±0.10 (Leggett et al. 1986); υ Peg = 1.01 ± 0.04 (Blackwell & Lynas-Gray
1994)
Table 2. Orbital positions of β Lyr
MACIM BSMEM Model
Sep. P.A. Sep. P.A. Sep. P.A. Flux ratio
Date Phase (mas) (deg) (mas) (deg) (mas) (deg) (donor/gainer)
2007Jul03 0.132 0.811 255.4 0.853 253.7 0.701 ± 0.091 256.3 ± 4.0 1.01 ± 0.11
2007Jul04 0.210 0.891 253.3 0.886 254.4 0.852 ± 0.045 254.2 ± 2.1 1.16 +0.20−0.15
2007Jul07 0.438 – – – – 0.338 ± 0.105 250.8 ± 7.3 3.51 ± 1.27
2007Jul09 0.595 – – 0.675 73.9 0.454 ± 0.042 77.9 ± 1.4 2.43 ± 0.28
2007Jul12 0.828 0.842 72.3 0.783 69.6 0.754 ± 0.063 73.2 ± 0.8 1.32 +0.67−0.27
aSome positions are omitted for images whose centroids cannot be separated.
– 10 –
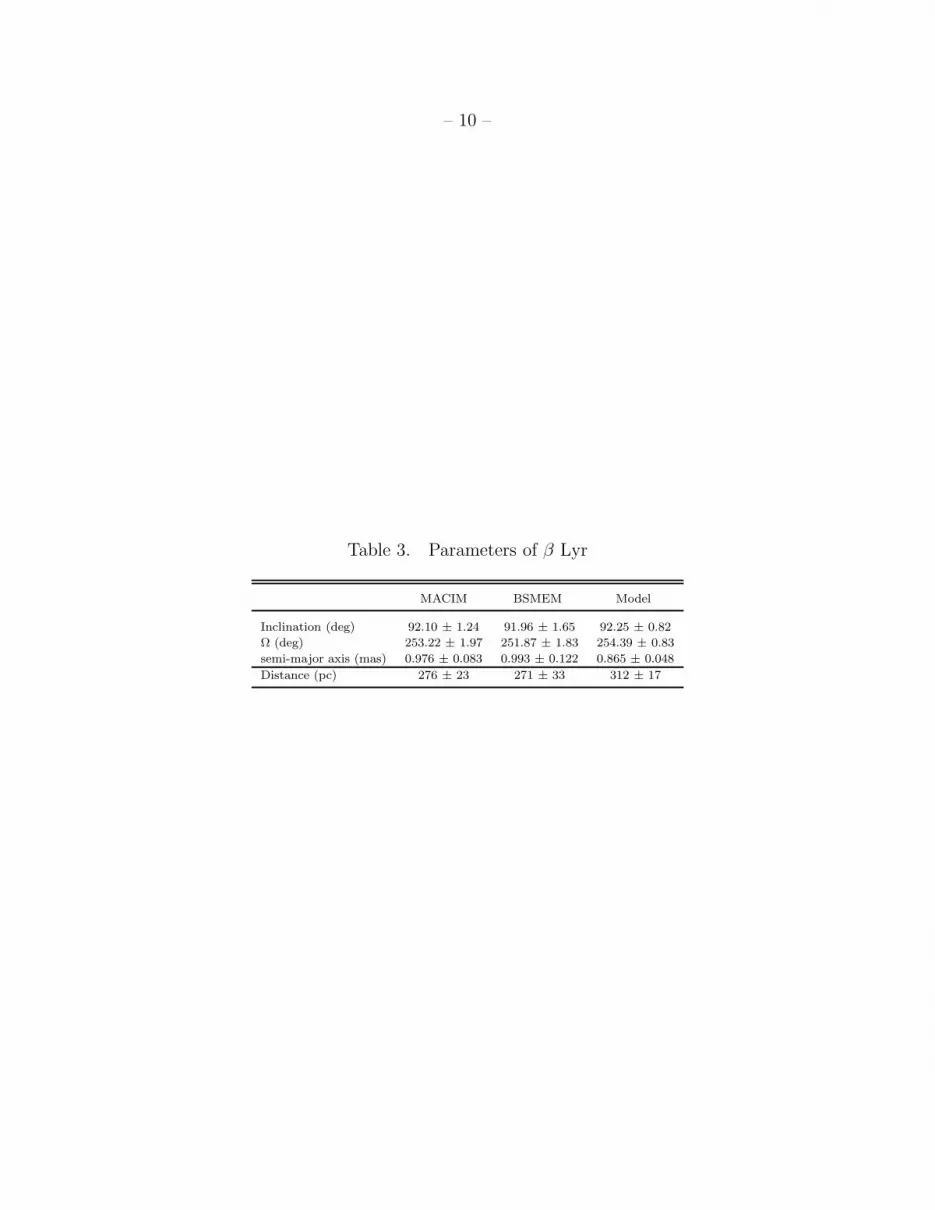
Table 3. Parameters of β Lyr
MACIM BSMEM Model
Inclination (deg) 92.10 ± 1.24 91.96 ± 1.65 92.25 ± 0.82
Ω (deg) 253.22 ± 1.97 251.87 ± 1.83 254.39 ± 0.83
semi-major axis (mas) 0.976 ± 0.083 0.993 ± 0.122 0.865 ± 0.048
Distance (pc) 276 ± 23 271 ± 33 312 ± 17

– 11 –
400 200 0 -200 -400East (m)
-400
-200
0
200
400
Nor
th (
m)
S1-E1S1-W1S1-W2E1-W1E1-W2W1-W2
2007Jul04
Fig. 1.— Telescope spatial coverage of β Lyr on UT 2007Jul04, using the W1-W2-S1-E1
configuration of CHARA. The symbols stand for different baselines. The longest projected
baseline in this observation is 328.5m, corresponding to a resolution of 0.52 milli-arcseconds
in the H band. The actual UV coverage is similar to this spatial coverage but each point
spreads over 8 wavelength channels.

– 12 –
-1.0
-0.5
0.0
0.5
Nor
th (
mas
)
MACIM Image
2006Oct16 φ = 0.035
χ2ν = 0.67
BSMEM Image
χ2ν = 0.28
Model
Too unresolved at primary eclipse for reliable modeling
-1.0
-0.5
-0.0
0.5
Nor
th (
mas
)
2007Jul03 φ = 0.132
χ2ν = 1.06
χ2ν = 1.42
χ2ν = 1.31
-1.0
-0.5
-0.0
0.5
Nor
th (
mas
)
2007Jul04 φ = 0.210
χ2ν = 0.42
χ2ν = 0.30
χ2ν = 0.46
-1.0
-0.5
-0.0
0.5
Nor
th (
mas
)
2007Jul07 φ = 0.438
χ2ν = 0.93
χ2ν = 0.87
χ2ν = 0.69
-1.0
-0.5
-0.0
0.5
Nor
th (
mas
)
2007Jul09 φ = 0.595
χ2ν = 0.81
χ2ν = 0.79
χ2ν = 0.66
0.5 0.0 -0.5 -1.0East (mas)
-1.0
-0.5
-0.0
0.5
Nor
th (
mas
)
2007Jul12 φ = 0.828
χ2ν = 0.58
0.5 0.0 -0.5 -1.0East (mas)
χ2ν = 0.52
0.5 0.0 -0.5East (mas)
χ2ν = 0.52
Fig. 2.— Reconstructed images and two-component models of β Lyr . The left, middle
and right columns show the MACIM, BSMEM and model images respectively. Darker colors
indicate higher intensity. The darker component is the donor. The contours in the images
correspond to 0.3, 0.6, 0.9 of the peak intensity. Observing dates and corresponding phases
(from the ephemeris in Ak et al. 2007) are labeled in the first column. The best-fit χ2/DOF
of each image is labeled in the bottom left corner. The resolution of the reconstructed images
is 0.69 mas for the first epoch and 0.52 mas for the other 5 epochs, and the corresponding
beams are shown in the first and second epochs in the middle panels respectively. Due to
lack of enough resolution and the complexity of the radiative transfer at the first epoch when
the star is behind the disk, no reliable model is available for our limited data.

– 13 –
1.0 0.5 0.0 -0.5 -1.0East (mas)
-0.4
-0.2
0.0
0.2
0.4
Nor
th (
mas
)
β Lyr orbit
2007Jul03
2007Jul042007Jul07
2007Jul09
2007Jul12
Fig. 3.— The best fit relative orbit of β Lyr (solid line). The donor is indicated as a filled
dot in the center. Positions of each epoch are shown by the open dots, surrounded by their
error ellipses in dashed lines. The upper part of the ellipse is located towards the observer.


