Embed Size (px)
Citation preview

1人文論集 第 49 巻
First-Year Japanese University Studentsand TOEIC Scores
Brian D. Bresnihan
AbstractThis study addresses two questions using data collected at one department, not
of English, in a Japanese university. Do university students, who choose to enter a
program requiring them to take more courses involving English usage, tend to achieve
higher TOEIC scores and greater gains in TOEIC scores than other students in the
same department during their fi rst year at university? The fi ndings are that yes, the
students who choose such a program do tend to have higher TOEIC scores on average
than those who do not, but no, they do not tend to achieve greater gains in TOEIC
scores as a group than the other students. Most of the discussion concerns reasons for
the latter finding. General recommendations for ways that Japanese universities can
better assist their students in improving their English language abilities are given at the
end.
1.IntroductionAt the beginning of the 2011 school year, one department at a university in Japan
instituted a new course of study, which I will call the Extra English Course (EEC), with
the aim of preparing students for future employment in which they would be expected
to interact and communicate with people from other countries and to work competently
using the English language. The program requires fi rst-year students to take one more
required English language course than the other freshmen in this department. 1 After
the fi rst year, they are required to take a number of lecture courses in their major that
are taught partially and sometimes completely in English, and they are encouraged to
take elective courses that require the study and/or use of English.
All entering freshmen are eligible to apply for the EEC program. For the fi rst
semester of classes, only forty are accepted. Selection is made based on the same 1 In the 2011 school year, this meant taking a fourth mandatory English language course. In the 2012 school
year, the department reduced the number of required English language courses from three to two. So, the EEC students needed to take three mandatory English language courses, not four.
brought to you by COREView metadata, citation and similar papers at core.ac.uk

English test scores that are used in determining university admissions. Before the
second semester begins, all other freshmen are again eligible to apply for the program.
From those who apply, enough are chosen to ensure that there results in being fifty
students in the program, making up approximately 25% of the freshman class. So, at
least ten students are chosen, but more if any students drop out of the program during
or at the end of the fi rst semester. The students’ TOEIC scores and fi rst semester
course grades plus a short essay about why they want to join the program are used
in determining which additional students are admitted into the program at this time. 2
No students are added to the program after this. Students, who join the EEC in the
second semester, need to take the fi rst semester of the extra mandatory English course
sometime before graduation, preferably during the fi rst semester of their second year
at university. All EEC students need to pass this course each semester they take it in
order to remain in the program. The course may not be repeated. 3
The first group of forty students in 2011 had eighteen males and twenty-two
females. In the second semester, there were twenty-four males and twenty-six females.
In 2012, there were seventeen males and twenty-three females in the initial group of
forty students. In the second semester, the group consisted of twenty-fi ve males and
twenty-fi ve females. There has been no attempt to balance the genders of the students
in the program.
Two of the eight sections of each of the two department-wide required first-
year English language courses consisted solely of EEC program students. From the
beginning, the students on the whole in these two sections clearly had more interest in
using and improving their English and seemed to be better at using and understanding
English than the students on the whole in the six other sections. The research questions
in this paper concern these distinctions, which were observable by the teachers. One
question is, are these diff erences identifi able in the students’ TOEIC scores. Another 2 In the fi rst year, seventy-eight students initially applied for the program, and forty were accepted. At the
end of the fi rst semester, two students dropped out of the program, and twelve students applied for the program, all of who were accepted. In the second year, ninety-two students applied for the program. Forty were accepted. After the fi rst semester, three students dropped out, and twenty-three students applied to join the program. Thirteen students were admitted.
3 No students failed this course, which was held in the third and fourth periods on Tuesdays, during either semester in the fi rst year of the program, and no students failed this course in the fi rst semester of the program’s second year, when it was held during the fi rst and second periods on Wednesdays. However, three students failed it in the second semester of the second year, mainly due to inadequate attendance, less than fi fty percent, two from the fi rst period class and one from the second period class, and had to leave the program. An additional four students in the fi rst period class and six students in the second period class came very close to failing for the same reason.
2
First-Year Japanese University Students and TOEIC Scores
人文論集 第 49 巻

question is, did these EEC students achieve greater increases in their TOEIC scores
than the other students.
2 .Comparisons of the Magnitudes of the Students’ TOEIC ScoresDo students in the Extra English Course program tend to achieve higher TOEIC
scores than other students in the same department? All first-year students in this
department are required to take the TOEIC in order to be eligible to pass any of their
mandatory semester-long Core English courses. Nearly all of them take the TOEIC IP
Test, which is administered on-campus in the latter third of each semester. To begin
investigating this first question, Table 1 presents the numbers and percentages of
students’ Total, Listening, and Reading scores in various ranges for both groups on both
tests taken in the two years the EEC program had been running. 4
4 These ranges are based on the most recent study on TOEIC scores by the Educational Testing Service
(ETS), Powers, et al. (2008, 2010), the creator and producer of the TOEIC, even though “An arbitrary TOEIC (Listening and Reading) score range of 55 points was chosen for each interval, except for the lowest one. For this lowest interval, a range of 130 points was used because there were very few test takers in this lowest score range.” (page 4/6.3) As very few scores in this study fall into this lowest range, it was decided to combine the lowest range with the one immediately above it. And, as the method of calculation of the Total score is simply to add the Listening score and the Reading score, Total score intervals were created in this manner. The “TOEIC Listening and Reading Score Descriptors” was published by ETS in 2007, and the study it came from is by Liao, but it is not very useful for making comparisons of scores. It provides descriptions of strengths and weaknesses of non-native English users for the following levels: for Listening scores of around 200, around 300, and around 400 and for Reading scores of around 150, around 250, around 350, and around 450, with no descriptions provided for Total scores. In 2012, The Institute for International Business Communication (IIBC), the organization that handles the TOEIC in Japan, published the “TOEIC Profi ciency Scale,” with copyright by ETS noted. It also has ranges that are not very useful for comparisons of scores as two of the intervals account for nearly every score in these data sets: for Total scores of 10-215, 220-465, 470-725, 730-855, and 860-990, with no ranges given for Listening scores or Reading scores. The most recent TOEIC levels table by The Chauncey Group International, a subsidiary of ETS, was published in 2000, before the changes to the TOEIC were implemented in 2007, TOEIC Can-Do Guide. It uses the following ranges for both Listening scores and Reading scores: 5-100, 105-225, 230-350, 355-425, and 430-495. No ranges are given for Total scores. This table replaced the one that had been used earlier,
“TOEIC Can-Do Levels Table,” which used these ranges: for Listening scores and Reading scores, 5-125, 130-200, 205-300, 305-390, 395-450, and 455-495, and for Total scores 10-250, 255-400, 405-600, 605-780, 785-900, and 905-990.
First-Year Japanese University Students and TOEIC Scores
3人文論集 第 49 巻

Table 1Numbers of Students Whose Scores Are within Specifi c Ranges
TotalExtra English Course* Not Extra English Course#
2011 n=50 2012 n=50/49 Score 2011 n=155 2012 n=152Test 1 Test 2 Test 1 Test 2 Range Test 1 Test 2 Test 1 Test 2
00 %
00 %
00 %
00 %
875-990
00 %
00 %
00 %
00 %
00 %
36 %
00 %
24 %
755-870
00 %
11 %
00 %
00 %
612%
714%
1224%
612%
635-750
64 %
128 %
75 %
85 %
3264%
2856%
2856%
1837%
515-630
4428%
5636%
5234%
4530%
1224%
1122%
816%
2245%
395-510
8454%
7448%
7449%
7952%
00 %
12 %
24 %
12 %
10-390
2114%
128 %
1913%
2013%
Listening00 %
12 %
00 %
00 %
440-495
00 %
00 %
00 %
00 %
12 %
48 %
12 %
36 %
380-435
00 %
11 %
00 %
11 %
1326%
1122%
1836%
918%
320-375
85 %
1510%
149 %
1812%
2856%
2346%
2040%
2653%
260-315
5032%
7045%
6241%
4731%
714%
1122%
1020%
1122%
200-255
7649%
4932%
6341%
7650%
12 %
00 %
12 %
00 %
5-195
2114%
2013%
139 %
107 %
Reading00 %
00 %
00 %
00 %
440-495
00 %
00 %
00 %
00 %
00 %
24 %
12 %
36 %
380-435
11 %
21 %
11 %
00 %
816%
714%
1020%
36 %
320-375
96 %
106 %
85 %
75 %
1428%
2550%
1836%
1224%
260-315
3925%
5535%
3926%
3422%
2754%
1428%
1836%
2041%
200-255
6743%
5938%
6845%
8355%
12 %
24 %
36 %
1122%
5-195
3925%
2919%
3624%
2818%
*Scores of students who were in the EEC during the second semester. One EEC student did not sit for the second administration in 2012. Also, one student took the TOEIC SP Test off -campus rather than the on-campus TOEIC IP Test for the second test in 2011. Those scores are included here. These conditions will also be the case in all subsequent tables.
# Only scores of students who sat for both administrations and were not in the EEC course in the second semester. These conditions will also be the case in all subsequent tables.
Percentages may not total to 100 due to rounding.
4
First-Year Japanese University Students and TOEIC Scores
人文論集 第 49 巻

In Table 1, although there are not many, there are more of the EEC students’
scores in the upper third of the intervals, the top two rows, for Total scores (755-870 and
875-990), Listening scores (380-435 and 440-495), and Reading scores (380-435 and 440-495),
than of the Not EEC students’ scores. There are almost no students’ scores, between
0% and 1%, in the upper two intervals in the Not EEC groups. The students in the EEC
groups have between 0% and 8% of their scores in these upper intervals.
In the third highest score intervals, the third row from the top of each chart, the
EEC groups have between 12% and 24% of their Total scores (635-750), between 18%
and 36% of their Listening scores (320-375), and between 6% and 20% of their Reading
scores (320-375). For the Not EEC groups in these intervals, there are between 4% and
8% of the Total scores, between 5% and 12% of the Listening scores, and between 5%
and 6% of the Reading scores. Except for the Reading scores on the second test in 2012,
the percentages of the EEC groups’ scores in these ranges are much higher than those
of the Not EEC groups’ scores.
There are much greater percentages of the Not EEC students’ Total scores,
Listening scores, and, except for the second test in 2012, Reading scores in the lowest
interval in each chart in Table 1 (10-390, 5-195, and 5-195, respectively) than of the EEC
students’ scores. There are between 8% and 14% of the Not EEC groups’ Total scores,
between 7% and 14% of the Not EEC groups’ Listening scores, and between 18% and
25% of the Not EEC groups’ Reading scores in these lowest intervals. For the EEC
groups, there are between 0% and 4% of the Total scores, between 0% and 2% of the
Listening scores, and between 2% and 6%, plus 22% on the second test in 2012, of the
Reading scores.
Most of the Not EEC students’ Total scores fall in the second lowest interval
(395-510), between 48% and 54%, and between 28% and 36% are in the third lowest
interval (515-630). On three of the administrations, most of the EEC students’ Total
scores fall in the third lowest interval, between 56% and 64%. It is only the percentage
of the EEC students’ Total scores on the second test in 2012 that is lower at another
interval, with 37% of the scores falling in the third lowest interval, while 45% fall in the
second lowest interval. For the other three EEC groups, between 16% and 24% of the
Total scores are in the second lowest interval. Also, for each test administration, the
percentages of the EEC students’ Total scores are higher in the third lowest interval
and lower in the second lowest interval than the percentages of the associated Not EEC
First-Year Japanese University Students and TOEIC Scores
5人文論集 第 49 巻

students’ scores, being 64%, 56%, 56%, and 37% vs. 28%, 36%, 34%, and 30% and 24%,
22%, 16%, and 45% vs. 54%, 48%, 49%, and 52%, respectively. The percentages of scores
in the three lowest ranges indicate that the EEC groups’ Total scores are higher than
those of the Not EEC groups’ Total scores.
In all four cases, there are greater percentages of the Not EEC students’
Listening scores in the second lowest interval (200-255), the second row from the bottom,
than the EEC students’ Listening scores, and they are from 32% to 50% vs. 14% to
22%, respectively. In the third row from the bottom (260-315), in two instances, for Test
1 in 2011 and Test 2 in 2012, the percentages of the EEC students’ Listening scores
are much greater than the Not EEC students’ scores, 56% and 53% vs. 32% and 31%,
respectively. The other two pairings have percentages of scores that are very similar
to each other, being 46% and 40% vs. 45% and 40%, respectively. Looking at the three
lowest intervals, the EEC groups’ Listening scores are clearly generally higher than the
Not EEC groups’ Listening scores.
Adding together the percentages of the students’ Reading scores in the two
lowest intervals (5-195 and 200-255), in the bottom two rows, for each group, they are
56%, 32%, 42%, and 63% for the EEC groups and 68%, 57%, 69%, and 73% for the Not
EEC groups, respectively. The percentages are higher in each case for the Not EEC
students’ group. In the third row from the bottom, the third lowest interval (260-315),
the percentages of the EEC students’ Reading scores are always at least a little higher
than the Not EEC students’ scores for each pairing, 28% vs. 25%, 50% vs. 35%, 36% vs.
26%, and 24% vs. 22%, respectively. Based on the scores in these three lowest intervals,
the EEC groups’ Reading scores are somewhat higher on the whole than the Not EEC
groups’ Reading scores.
Also, looking at the upper half of each of the three charts in Table 1, on each test
administration for each of the three scores, it appears that the EEC students performed
better than the Not EEC students. Summarizing this tendency, between 12% and 24%
of the EEC students’ Total scores are 635 or higher, while only between 4% and 9% of
the Not EEC students’ Total scores are in the same range. On the Listening section,
between 24% and 38% of the EEC students scored 320 or higher, but only between 5%
and 13% of the Not EEC students’ scores are in this range. Between 12% and 22% of
the EEC students’ Reading scores are 320 or higher, while only between 6% and 7% of
the Not EEC students scored in this range.
6
First-Year Japanese University Students and TOEIC Scores
人文論集 第 49 巻

The overall impression of the scores in Table 1 is that the EEC students generally
scored higher as groups than the Not EEC students as groups; but individually, the
students’ scores were quite variable in both groups.
Another way to compare these scores is to find the range in which most of
the scores lie. Tables 2 and 3 display where two thirds of the scores surrounding the
means/medians fall for each of the three TOEIC scores the students received; i.e., the
ranges in which the majority of the scores can be found. Table 2 is of scores from the
two 2011 administrations, and Table 3 is of scores from the two 2012 administrations.
On each administration, the range of the variation in scores is higher for the EEC group
than the Not EEC group, though there is often a great deal of overlapping of associated
ranges. Looking at the second and sixth columns of data, for the Total scores, they
are 515-640 vs. 410-540, 495-635 vs. 425-590, 445-630 vs. 415-560, and 490-650 vs. 405-575,
respectively. For the Listening scores, they are 270-345 vs. 215-295, 275-380 vs. 225-305,
235-330 vs. 230-295, and 255-330 vs. 215-305, respectively. And for the Reading scores,
they are 235-325 vs. 180-275, 220-315 vs. 205-300, 230-330 vs. 165-285, and 205-315 vs. 170-
280, respectively.
Table 2Ranges of Variations in Students’ Scores for Two Thirds of the Scores
Surrounding the Means/Medians: 2011Total Scores
Test1: EEC n=50; Not EEC n=155 Test2: EEC n=50; Not EEC n=155Group Mean/Med. Range % Spread Mean/Med. Range % Spread
ICC 560/550 515-640 66.0 125 pts 578/580 495-635 68.0 140 ptsNot ICC 480/480 410-540 67.1 130 pts 504/500 425-590 65.8 165 pts
Listening ScoresICC 300/300 270-345 66.0 75 pts 301/288 275-380 68.0 105 ptsNot ICC 247/245 215-295 66.5 80 pts 261/260 225-305 67.7 80 pts
Reading ScoresICC 260/250 235-325 66.0 90 pts 276/280 220-315 66.0 95 ptsNot ICC 233/235 180-275 67.1 95 pts 244/240 205-300 66.5 95 pts
First-Year Japanese University Students and TOEIC Scores
7人文論集 第 49 巻

Table 3Ranges of Variations in Students’ Scores for Two Thirds of the Scores
Surrounding the Means/Medians: 2012Total Scores
Test1: EEC n=50; Not EEC n=152 Test2: EEC n=49; Not EEC n=152Group Mean/Med. Range % Spread Mean/Med. Range % Spread
ICC 570/595 445-630 66.0 185 545/515 490-650 67.3 160Not ICC 486/490 415-560 67.1 145 482/475 405-575 67.1 170
Listening ScoresICC 297/305 235-330 66.0 95 296/295 255-330 67.3 75Not ICC 258/258 230-295 67.1 65 256/245 215-305 67.8 110
Reading ScoresICC 273/273 230-330 66.0 100 249/245 205-315 65.3 110Not ICC 228/230 165-285 68.4 120 225/225 170-280 67.7 110
In data columns one and fi ve of Table 2 and Table 3, the means and medians are
given. In every case, they are higher for the EEC group than the Not EEC group; for
the Total scores being 560 and 550 vs. 480 and 480, 578 and 580 vs. 504 and 500, 570
and 595 vs. 486 and 490, and 545 and 515 vs. 482 and 475; for the Listening scores being
300 and 300 vs. 247 and 245, 301 and 288 vs. 261 and 260, 297 and 305 vs. 258 and 258,
and 296 and 295 vs. 256 and 245; for the Reading scores being 260 and 250 vs. 233 and
235, 276 and 280 vs. 244 and 240, 273 and 273 vs. 228 and 230, and 249 and 245 vs. 225
and 225, respectively. The information presented in this paragraph and the preceding
paragraph seems to indicate that generally the EEC students scored higher than the Not
EEC students.
Tables 4, 5, 6, and 7 present basic statistics concerning the sets of scores being
used in this study. Tables 4 and 5 concern scores from the two 2011 administrations.
Tables 6 and 7 are of scores from the two 2012 administrations. Looking at the last two
rows of each table, there are occasional single outlying scores that are more than three
standard deviations above the mean. However, this number of scores greater and/
or less that three standard deviations from the mean does not indicate any anomaly
with the data. Looking at the pairs of means and medians in each table, some of those
for the EEC groups are not very similar, for example, for the Total scores and for the
Reading scores on the fi rst administration and for the Listening scores on the second
administration in 2011 and for the Total scores on both administrations in 2012. Since
the populations of the EEC groups are rather small, that these cases appear is not very
strange. However, they do indicate that the data sets may not be normally distributed.
8
First-Year Japanese University Students and TOEIC Scores
人文論集 第 49 巻

Two of the Not EEC groups’ means and medians on the second test in 2012 are also not
very similar, for the Total scores and for the Listening scores. These also indicate that
perhaps the data sets are not normally distributed.
Table 4Basic Statistics for Extra English Course Students’ Scores: 2011June 2011: n=50 December 2011: n=50
Total1 Listen1 Read1 Total2 Listen2 Read2740 400 355 Maximum 855 470 385395 180 190 Minimum 370 205 145345 220 165 Variation 485 265 240560 300 260 Mean 578 301 276550 300 250 Median 580 288 28072.9 44.1 43.9 Stdv 85.8 53.1 50.80 0 0 No.>3 Stdv 1 1 00 0 0 No.<3 Stdv 0 0 0
Table 5Basic Statistics for Not Extra English Course Students’ Scores: 2011June 2011: n=155 December 2011: n=155
Total1 Listen1 Read1 Total2 Listen2 Read2735 355 380 Maximum 800 395 405265 135 115 Minimum 280 120 110470 220 265 Variation 520 275 295480 247 233 Mean 504 261 244480 245 235 Median 500 260 24083.7 44.5 51.6 Stdv 89.3 47.7 54.71 0 0 No.>3 Stdv 1 0 00 0 0 No.<3 Stdv 0 0 0
Table 6Basic Statistics for Extra English Course Students’ Scores: 2012June 2012: n=50 December 2012: n=49
Total1 Listen1 Read1 Total2 Listen2 Read2735 385 395 Maximum 820 430 395345 160 130 Minimum 375 200 140390 225 265 Variation 445 230 255570 297 273 Mean 545 296 249595 305 273 Median 515 295 24586.3 46.3 55.0 Stdv 94.0 48.6 62.8 0 0 0 No.>3 Stdv 0 0 00 0 0 No.<3 Stdv 0 0 0
First-Year Japanese University Students and TOEIC Scores
9人文論集 第 49 巻

Table 7Basic Statistics for Not Extra English Course Students’ Scores: 2012June 2012: n=152 December 2012: n=152
Total1 Listen1 Read1 Total2 Listen2 Read2740 360 390 Maximum 740 395 370285 140 105 Minimum 305 145 110455 220 285 Variation 435 250 260486 258 228 Mean 482 256 225490 258 230 Median 475 245 22584.6 42.0 55.5 Stdv 89.6 47.4 55.3 0 0 0 No.>3 Stdv 0 1 00 0 0 No.<3 Stdv 0 0 0
The maximum and minimum scores are in the fi rst two rows of each of these
four tables. Comparing the EEC scores and the Not EEC scores, in almost all cases, the
EEC score is higher than the associated Not EEC score. The only diff erences from this
pattern are the maximum Reading scores on the second test in 2011 and the maximum
Total scores on the fi rst test in 2012. These scores are 405 and 740 for the Not EEC
groups and 385 and 735 for the EEC groups, respectively.
In Table 8 and Table 9, the means for the EEC and the Not EEC Total scores,
Listening scores, and Reading scores on Test 1 and Test 2 are again displayed, here
in the fi rst two rows. As mentioned earlier, in every case, the EEC mean is higher
than the Not EEC mean. However, more information is needed to be sure if this is
truly the case. Using standard errors of the mean, it can be determined if the means
of paired groups of scores are actually distinct or not, if the mean of one group is truly
greater than or less than the mean of the other group. Tables 8 and 9 also provide this
information. To be 95% certain, two standard errors of the mean are used to create
the confi dence interval or error bar ranges. In the bottom two rows, these ranges are
shown. In all cases, the EEC mean’s confi dence interval range is higher than the Not
EEC mean’s confi dence interval range, and there is no overlapping of the two ranges.
Therefore, according to this analysis, all of the EEC means are truly greater than their
associated Not EEC means.
10
First-Year Japanese University Students and TOEIC Scores
人文論集 第 49 巻

Table 8Confi dence Intervals for Students’ Scores’ Means: 2011
Total Listening ReadingEEC Not EEC EEC Not EEC EEC Not EEC
Test1 Mean 560 480 300 247 260 233Test2 Mean 578 504 301 261 276 244Test1 SEM +/-10.3 +/-6.7 +/-6.2 +/-3.6 +/-6.2 +/-4.1Test2 SEM +/-12.1 +/-7.2 +/-7.5 +/-3.8 +/-7.2 +/-4.4Test1 95% CI Range
540-580
467-493
288-312
240-254
248-272
225-241
Test2 95% CI Range
554-602
490-518
286-316
254-268
262-290
235-253
The confi dence interval (CI) or error bar surrounding the mean provides about 68% certainty of the mean’s correctness in regard to the group of test takers’ scores’ true mean. To be 95% certain, the CI used here is two standard errors of the mean (SEM), which is SEM x 1.96.
Table 9Confi dence Intervals for Students’ Scores’ Means: 2012
Total Listening ReadingEEC Not EEC EEC Not EEC EEC Not EEC
Test1 Mean 570 486 297 258 273 228Test2 Mean 545 482 296 256 249 225Test1 SEM +/-12.2 +/-6.9 +/-6.5 +/-3.4 +/-7.8 +/-4.5Test2 SEM +/-13.4 +/-7.3 +/-7.0 +/-3.8 +/-9.0 +/-4.5Test1 95% CI Range
546-594
472-500
284-310
251-265
258-288
219-237
Test2 95% CI Range
519-571
468-496
282-310
249-263
231-267
216-234
The confi dence interval (CI) or error bar surrounding the mean provides about 68% certainty of the mean’s correctness in regard to the group of test takers’ scores’ true mean. To be 95% certain, the CI used here is two standard errors of the mean (SEM), which is SEM x 1.96.
The presentation above makes it clear that, although the TOEIC scores of
individual students varied greatly within both the EEC groups and the Not EEC groups,
and certainly there are many students in each group who scored lower and many who
scored higher than many students in the other group, the students in the EEC groups
on the whole achieved higher TOEIC scores than students in the Not EEC groups. As
this department hopes to attract its students with the strongest English abilities into its
Extra English Course program, these fi ndings would be considered positive, though it
should be noted that not all of the students with stronger English abilities have chosen
to join it.
First-Year Japanese University Students and TOEIC Scores
11人文論集 第 49 巻

3 .Comparisons of the Magnitudes of the Changes in the Students’ TOEIC Scores
Do students in the Extra English Course program tend to achieve greater
increases in their TOEIC scores than other students in the same department? As
mentioned earlier, all of the fi rst-year students are required to take the TOEIC IP Test
on-campus in the latter third of both semesters, unless they take the TOEIC SP Test
off -campus instead. To begin examining this second question, Table 10 and Table 11
present basic statistics for the changes in the students’ Total scores, Listening scores,
and Reading scores on the second test administration when compared to the fi rst test
administration in the two years the EEC program had been running.
Table 10Basic Statistics for Changes in Students’ Scores: 2011
Extra English Course Not Extra English CourseT2-T1 L2-L1 R2-R1 T2-T1 L2-L1 R2-R1135 100 95 Maximum 175 100 125
-185 -85 -105 Minimum -140 -115 -105320 185 200 Variation 315 215 23018 2 16 Mean 25 14 1110 0 20 Median 25 15 1060.7 43.3 40.4 Stdv 60.6 39.5 41.10 0 0 No.>3 Stdv 0 0 01 0 0 No.<3 Stdv 0 1 0
EEC n=50; Not EEC n=155
Table 11Basic Statistics for Changes in Students’ Scores: 2012
Extra English Course Not Extra English CourseT2-T1 L2-L1 R2-R1 T2-T1 L2-L1 R2-R1
85 105 70 Maximum 215 145 105-125 -100 -115 Minimum -205 -100 -140210 205 185 Variation 420 245 245-23 0 -23 Mean -5 -2 -3-20 -5 -20 Median -5 5 056.2 47.2 37.9 Stdv 67.3 41.7 43.2 0 0 0 No.>3 Stdv 1 1 00 0 0 No.<3 Stdv 0 0 1
EEC n=49; Not EEC n=152
12
First-Year Japanese University Students and TOEIC Scores
人文論集 第 49 巻

The fi rst two rows of Table 10 and Table 11 give the maximum and minimum
changes in scores. For both groups, all of these fi gures seem rather large. In 2011 and
2012, respectively, the EEC groups’ maximum increases in Total score are 135 and 85,
in Listening score are 100 and 105, and in Reading score are 95 and 70, and for the Not
EEC groups, they are 175 and 215, 100 and 145, and 125 and 105, respectively. For the
same two years, the EEC groups’ maximum decreases in Total score are -185 and
-125, in Listening score are -85 and -100, and in Reading score are -105 and -115,
and for the Not EEC groups, they are -140 and -205, -115 and -100, and -105
and -140, respectively. Given these changes in scores, the variations in the maximum
changes in scores, given in the third rows, are also quite large; for the EEC groups being
320 and 210 for Total score, 185 and 205 for Listening score, and 200 and 185 for Reading
score, and for the Not EEC groups being 315 and 420 for Total score, 215 and 245 for
Listening score, and 230 and 245 for Reading score, in 2011 and 2012, respectively. All of
this demonstrates great variability in individual student’s achievements.
The means of these changes in scores, in the fourth rows, seem to indicate
that the students in the Not EEC groups on the whole performed slightly better,
comparatively, on the second test than the fi rst test than did the students in the EEC
groups on the whole, in most cases, though not for the Reading scores in 2011 or for the
Listening scores in 2012. In 2011 and 2012, respectively, the mean changes for the EEC
groups’ Total scores, Listening scores, and Reading scores are 18 and -23, 2 and 0, and
16 and -23, while for the Not EEC groups they are 25 and -5, 14 and -2, and 11 and
-3. The medians, being rather close to the means in all cases, and the small number of
scores greater than or less than three standard deviations of the means, no more than
one, indicate that these data sets are likely normally distributed.
As discussed concerning Table 8 and Table 9, a further analysis must be carried
out to determine if any of these means of the changes in scores for one group are truly
higher than the associated means of the changes in scores for the other group. Table 12
gives the required information, the standard errors of the mean and the 95% confi dence
interval or error bar ranges for these changes in scores’ means. These ranges appear
in the two bottom rows. In all cases except one, except for the change in Reading
scores’ means in 2012, the EEC groups’ means’ confi dence interval ranges overlap the
associated Not EEC groups’ means’ confi dence interval ranges. Therefore, according
to this analysis, none of the EEC groups’ changes in scores’ means are truly larger or
First-Year Japanese University Students and TOEIC Scores
13人文論集 第 49 巻

smaller than their associated Not EEC groups’ changes in scores’ means, except for the
Not EEC group’s change in Reading scores’ mean in 2012 being truly greater than the
associated EEC group’s change in Reading scores’ mean, as their intervals being -10-
4 and -34--12, respectively, do not overlap.
Table 12Confi dence Intervals for Changes in Students’ Scores’ Means
Total Listening ReadingEEC Not EEC EEC Not EEC EEC Not EEC
2011 Mean 18 25 2 14 16 112012 Mean -23 -5 0 -2 -23 -32011 SEM +/-8.7 +/-4.9 +/-6.2 +/-3.2 +/-5.8 +/-3.32012 SEM +/-8.1 +/-5.5 +/-6.8 +/-3.4 +/-5.5 +/-3.5
2011 95% CI Range
1-35
15-35
-10-14
8-20
5-27
5-17
2012 95% CI Range
-39--7
-16-6
-13-13
-9-5
-34--12
-10-4
The confi dence interval (CI) or error bar surrounding the mean provides about 68% certainty of the mean’s correctness in regard to the group of test takers’ scores’ true mean. To be 95% certain, the CI used here is two standard errors of the mean (SEM), which is SEM x 1.96.
Tables 13 and 14 present the numbers of students whose scores were higher,
remained the same, and were lower on the second test than the fi rst for both the EEC
and the Not EEC groups in 2011 and 2012, along with the maximum, minimum, and
average changes, which were mentioned above. As seen in the means for changes
in scores, the percentages of students whose scores are higher and lower seem to
imply that the Not EEC students performed better, in a comparative sense, than the
EEC students on the second test administration than the fi rst. In almost all cases, the
percentage of the Not EEC groups’ scores that increase is greater than the percentage
of the EEC groups’ scores that increase. The only diff erence is for the Reading scores
in 2011, where the opposite is true, with 62% of the EEC students’ scores and 61% of
the Not EEC students’ scores increasing and 30% of the EEC students’ scores and 37%
of the Not EEC students’ scores decreasing. Otherwise, in 2011 and 2012, respectively,
for the Total scores, 58% and 35% of the EEC students’ scores and 65% and 46% of the
Not EEC students’ score increase, and 40% and 59% of the EEC students’ scores and
34% and 51% of the Not EEC students’ scores decrease, and for the Listening scores,
48% and 43% of the EEC students’ scores and 62% and 52% of the Not EEC students’
scores increase, and 48% and 51% of the EEC students’ scores and 35% and 45% of the
14
First-Year Japanese University Students and TOEIC Scores
人文論集 第 49 巻

Not EEC students’ scores decrease. For the Reading scores in 2012, 31% of the EEC
students’ scores and 47% of the Not EEC students’ scores increase, and 69% of the
EEC students’ scores and 49% of the Not EEC students’ scores decrease.
Table 13Numbers of Students Whose Scores Are Diff erent
on Test 2 and Test 1 and Ranges and Means of the Changes: 2011Total Scores
Number Number Number Maximum Maximum MeanGroup Increased No Change Decreased Increase Decrease ChangeEEC 29 58% 1 2% 20 40% 135 -185 18
Not EEC 101 65% 2 1% 52 34% 175 -140 25Listening Scores
Number Number Number Maximum Maximum MeanGroup Increased No Change Decreased Increase Decrease ChangeEEC 24 48% 2 4% 24 48% 100 -85 2
Not EEC 96 62% 5 3% 54 35% 100 -115 14Reading Scores
Number Number Number Maximum Maximum MeanGroup Increased No Change Decreased Increase Decrease ChangeEEC 31 62% 4 8% 15 30% 95 -105 16
Not EEC 95 61% 2 1% 58 37% 125 -105 11EEC n=50; Not EEC n=155Percentages may not total to 100 due to rounding.
Table 14Numbers of Students Whose Scores Are Diff erent
on Test 2 and Test 1 and Ranges and Means of the Changes: 2012Total Scores
Number Number Number Maximum Maximum MeanGroup Increased No Change Decreased Increase Decrease ChangeEEC 17 35% 3 6% 29 59% 85 -125 -23
Not EEC 70 46% 5 3% 77 51% 215 -205 -5Listening Scores
Number Number Number Maximum Maximum MeanGroup Increased No Change Decreased Increase Decrease ChangeEEC 21 43% 3 6% 25 51% 105 -100 0
Not EEC 77 52% 6 4% 69 45% 145 -100 -2Reading Scores
Number Number Number Maximum Maximum MeanGroup Increased No Change Decreased Increase Decrease ChangeEEC 15 31% 0 0% 34 69% 70 -115 -23
Not EEC 71 47% 7 5% 74 49% 105 -140 -3EEC n=49; Not EEC n=152Percentages may not total to 100 due to rounding.
First-Year Japanese University Students and TOEIC Scores
15人文論集 第 49 巻
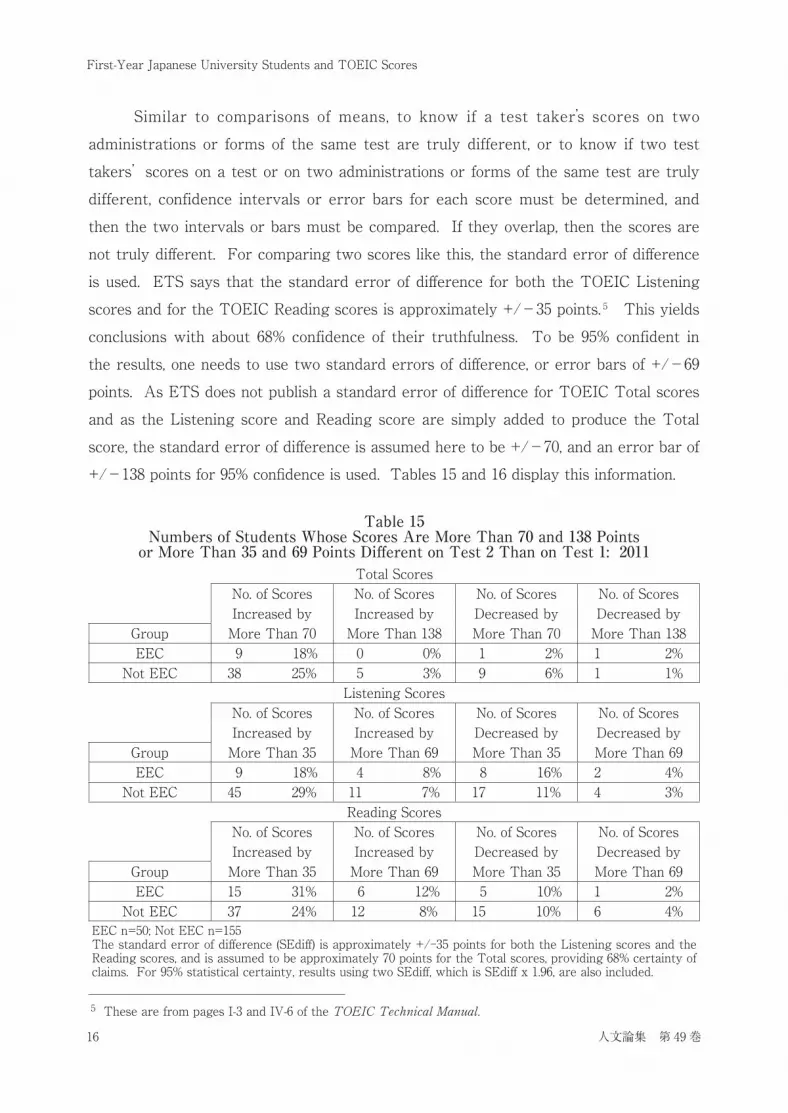
Similar to comparisons of means, to know if a test taker’s scores on two
administrations or forms of the same test are truly different, or to know if two test
takers’ scores on a test or on two administrations or forms of the same test are truly
different, confidence intervals or error bars for each score must be determined, and
then the two intervals or bars must be compared. If they overlap, then the scores are
not truly diff erent. For comparing two scores like this, the standard error of diff erence
is used. ETS says that the standard error of diff erence for both the TOEIC Listening
scores and for the TOEIC Reading scores is approximately +/-35 points. 5 This yields
conclusions with about 68% confidence of their truthfulness. To be 95% confident in
the results, one needs to use two standard errors of diff erence, or error bars of +/-69
points. As ETS does not publish a standard error of diff erence for TOEIC Total scores
and as the Listening score and Reading score are simply added to produce the Total
score, the standard error of diff erence is assumed here to be +/-70, and an error bar of
+/-138 points for 95% confi dence is used. Tables 15 and 16 display this information.
Table 15Numbers of Students Whose Scores Are More Than 70 and 138 Pointsor More Than 35 and 69 Points Diff erent on Test 2 Than on Test 1: 2011
Total ScoresNo. of Scores No. of Scores No. of Scores No. of ScoresIncreased by Increased by Decreased by Decreased by
Group More Than 70 More Than 138 More Than 70 More Than 138EEC 9 18% 0 0% 1 2% 1 2%
Not EEC 38 25% 5 3% 9 6% 1 1%Listening Scores
No. of Scores No. of Scores No. of Scores No. of ScoresIncreased by Increased by Decreased by Decreased by
Group More Than 35 More Than 69 More Than 35 More Than 69EEC 9 18% 4 8% 8 16% 2 4%
Not EEC 45 29% 11 7% 17 11% 4 3%Reading Scores
No. of Scores No. of Scores No. of Scores No. of ScoresIncreased by Increased by Decreased by Decreased by
Group More Than 35 More Than 69 More Than 35 More Than 69EEC 15 31% 6 12% 5 10% 1 2%
Not EEC 37 24% 12 8% 15 10% 6 4%EEC n=50; Not EEC n=155The standard error of diff erence (SEdiff ) is approximately +/-35 points for both the Listening scores and the Reading scores, and is assumed to be approximately 70 points for the Total scores, providing 68% certainty of claims. For 95% statistical certainty, results using two SEdiff , which is SEdiff x 1.96, are also included.
5 These are from pages I-3 and IV-6 of the TOEIC Technical Manual.
16
First-Year Japanese University Students and TOEIC Scores
人文論集 第 49 巻

Table 16Numbers of Students Whose Scores Are More Than 70 and 138 Pointsor More Than 35 and 69 Points Diff erent on Test 2 Than on Test 1: 2012
Total ScoresNo. of Scores No. of Scores No. of Scores No. of ScoresIncreased by Increased by Decreased by Decreased by
Group More Than 70 More Than 138 More Than 70 More Than 138EEC 2 4% 0 0% 10 20% 0 0%
Not EEC 16 11% 4 3% 24 16% 3 2%Listening Scores
No. of Scores No. of Scores No. of Scores No. of ScoresIncreased by Increased by Decreased by Decreased by
Group More Than 35 More Than 69 More Than 35 More Than 69EEC 10 20% 4 8% 12 24% 3 6%
Not EEC 27 18% 7 5% 31 20% 9 6%Reading Scores
No. of Scores No. of Scores No. of Scores No. of ScoresIncreased by Increased by Decreased by Decreased by
Group More Than 35 More Than 69 More Than 35 More Than 69EEC 2 4% 1 2% 17 35% 7 14%
Not EEC 27 18% 8 5% 32 21% 12 8%EEC n=49; Not EEC n=152The standard error of diff erence (SEdiff ) is approximately +/-35 points for both the Listening scores and the Reading scores, and is assumed to be approximately 70 points for the Total scores, providing 68% certainty of claims. For 95% statistical certainty, results using two SEdiff , which is SEdiff x 1.96, are also included.
The top charts in Table 15 and Table 16 concern the Total scores. The second
column of data shows that in both 2011 and 2012 no EEC students can be said to have
achieved higher Total scores on the second administration than the first with 95%
confi dence, but 3% of the Not EEC students in both 2011 and 2012 can be said to have
achieved higher Total scores on the second administration than the first with 95%
confidence. The fourth data column shows that 2% of the EEC students and 1% of
the Not EEC students probably achieved truly lower Total scores on second test than
the fi rst in 2011, and in 2012, probably no EEC students achieved a truly lower Total
score the second time they took the test than the fi rst, but 2% of the Not EEC students
probably did.
The same columns of the two middle charts give similar information for Listening
scores. From what is displayed, for both years, it is likely that 8% of the EEC students
truly achieved higher Listening scores on the second test than the fi rst, while it is likely
that 7% of the Not EEC students in 2011 and 5% of the Not EEC students in 2012 also
achieved truly higher scores on the second test than the fi rst. As for probable lower
First-Year Japanese University Students and TOEIC Scores
17人文論集 第 49 巻

achievement on the second administration of the Listening section than the first, the
charts show that 4% of the EEC students’ scores in 2011, 3% of the Not EEC students’
scores in 2011, and 6% of both groups of students’ scores in 2012 and were probably
truly lower.
In the bottom charts in the same columns as for the Total scores and the
Listening scores, there are the number of students in each group who, with 95%
confi dence, can be said to have achieved a higher or lower Reading score on the second
test than the fi rst. In comparison, these percentages show more variability than they
did for the Total scores and the Listening scores. In 2011, it is likely that 12% of the
EEC students and 8% of the Not EEC students achieved truly higher Reading scores on
the second test than the fi rst. In 2012, probably 2% of the EEC students and 5% of the
Not EEC students also achieved truly higher scores on the second test than the fi rst.
Probably 2% of the EEC students and 4% of the Not EEC students in 2011 and 14% of
the EEC students and 8% of the Not EEC students in 2012 achieved truly lower Reading
scores on the second test than the fi rst.
However, in all of these cases, there are no more than a handful or two of
students who can be said, with 95% confidence, to have achieved truly higher or
truly lower Total scores, Listening scores, and/or Reading scores on the second test
administration than the fi rst.
Concerning students’ gains in TOEIC scores during their fi rst year at university,
the results presented above sometimes show very slight diff erences between the EEC
groups and the Not EEC groups, sometimes favoring one group and sometimes favoring
the other. Only one pair of changes in the mean is signifi cantly, with 95% confi dence,
diff erent, and it is the Not EEC group’s change that is greater than the EEC group’s. As
for claims, with 95% confi dence, of greater numbers of individual students whose scores
increased, each of the groups has greater percentages of students with score gains for
three of the six pairings of scores. Also with 95% confi dence, three of the EEC groups
and two of the Not EEC groups can be said to have greater percentages of students
whose scores decreased than the associated groups. Considering the small numbers
and percentages of students in either group whose TOEIC scores were meaningfully
higher or lower the second time they sat for the test than the fi rst, the only real claims
that can be made in comparing the two groups is that these differences, and their
achievements, were negligible, at best, and nearly equal in measure for the most part. It
18
First-Year Japanese University Students and TOEIC Scores
人文論集 第 49 巻

is only isolated individuals whose scores on the TOEIC were truly diff erent the second
time they took the test than the first. As this department hopes its students in the
Extra English Course program, in particular, will improve their TOEIC scores, and will
do so more than its other students, these fi ndings would be considered negative.
4 .DiscussionAs each student in the Extra English Course program had some reason for
deciding to join it, and because one of the stated purposes of the program is for students
to improve their English abilities, and because many of the courses these students will
be required to pass will be taught partially or entirely in English, it seems reasonable
to assume that each of these students had some interest in English and in using English
and some expectations about needing to use English while studying and doing classroom
activities. Therefore, that the EEC students’ TOEIC scores as a group were found to
be higher than the other students’ TOEIC scores in this department as a group is what
might be expected. What might not be expected, and yet was found to be the case,
is that the EEC students’ gains in TOEIC scores as a group, during the year, did not
surpass the Not EEC students’ gains in TOEIC scores as a group. This requires some
explanation.
ETS writes,
“The TOEIC . . . is an English language proficiency test for people
whose native language is not English.”6
“Test scores can give TOEIC users very general information about
a test-taker. However, a score in and of itself does not provide
information about an examinee’s specifi c English-language abilities: It
does not provide information about the specific actions or behaviors
that an examinee can perform or may be expected to perform in
English. For example, a score does not provide information about what
an examinee with a total score of 400 may be able to do in English
as compared to an examinee with a total score of 300. Furthermore,
the scores do not diff erentiate between candidates in diff erent score 6 This is from page II-1 of the TOEIC Technical Manual. The italics are added.
First-Year Japanese University Students and TOEIC Scores
19人文論集 第 49 巻

ranges (for example 200 to 250, 300 to 350) in terms of English use.” 7
So, TOEIC scores cannot be used to determine exactly what a student’s English
abilities are. They cannot measure precisely how well a student can do anything in
particular using English nor how much better or worse a student has become at doing
anything in particular using English. TOEIC scores also cannot be used to determine
definitively whether someone has greater or lesser English language abilities than
someone else, unless perhaps the difference in abilities, and therefore scores, is very
large. This is because of the type of profi ciency test the TOEIC is.
ETS explains:
“Tests, including second-language proficiency tests, can be either
of two types: criterion-referenced tests or norm-referenced tests.
Both supply needed and valuable information, but in different ways.
Criterion-referenced test are used to identify an individual’s status
with respect to an established standard of performance. For example,
“X” must correctly answer 70 percent of the questions on a given
test in order to demonstrate his/her competence in that area, i.e., to
“pass” the test. Or, “X” may earn a particular score or grade and is,
as a result, expected to possess certain abilities or to have mastered
specifi c tasks within the area tested.
Norm-referenced tests, on the other hand, measure the learner’s
profi ciency in relation to the performance of other individuals on the
same measure, i.e., “X” performed better than “Y” but not as well
as “Z.” These scores do not, in an of themselves, establish, defi ne, or
explain distinct levels of ability associated with various scores.
TOEIC is an example of a norm-referenced test.” 8
Language testing expert J.D. Brown also explains:
“The basic purpose of criterion-referenced tests is to foster 7 This is from page 2 of the TOEIC Can-Do Guide. The italics are added.8 This is from page 2 of Wilson (1993). The italics are added.
20
First-Year Japanese University Students and TOEIC Scores
人文論集 第 49 巻

learning. Typically, teachers administer CRTs in order to encourage
students to study, review, or practice the material being covered
in a course and/or in order to give students feedback on how well
they have learned the material. In contrast, the underlying purpose
for norm-referenced tests is usually to spread students’ performances
out along a continuum of scores so the students can be classifi ed or
grouped for admissions or placement purposes. . . . NRTs are not
typically designed to test material that is specifi cally and directly related
to a single course or program. Thus, NRTs are not directly created to
foster learning.
. . . criterion-referenced tests . . . are well suited to making
diagnostic, progress, and achievement decisions. . . . Norm-
referenced tests are more appropriately used for aptitude, profi ciency,
and placement decisions.” 9
“Criterion-referenced tests are usually based on the very
specifi c objectives of a course or program. . . . Norm-referenced tests
must . . . be based on knowledge, skills, or abilities that are common to
a number of institutions, programs, or courses. . . .
Students generally know what to expect on a criterion-
referenced test. . . . On norm-referenced tests . . . They may have
some idea of the types of questions that will be on the test . . . but they
will have virtually no idea of the exact content that the test questions
will cover.” 10
These explanations about criterion-referenced and norm-referenced tests are very
clear about which kinds would be wise and fair to use in which situations and for which
purposes, in schools or elsewhere. For example, if schools want to know the general
level of their students overall or are planning to level their students before placement
in courses, a norm-referenced test could be appropriate and helpful. However, once the
semester ends and judgments need to be made about what each student learned and 9 This is from page 13 of Brown. The italics are added.10 This is from page 14 of Brown. The italics are added.
First-Year Japanese University Students and TOEIC Scores
21人文論集 第 49 巻

learned how to do and how well, then a criterion-referenced test would be the right
choice. Or, if the school or the teacher wants to determine what the students know
and do not know in detail, then again a criterion-referenced test would be the correct
choice. Therefore, it would be a mistake to use the TOEIC, a norm-referenced test, to
fi nd out what students gained from a course or courses, how well and what students
learned and did not learn, how well they performed, in their courses, or what they need
to learn next. However, if the content of the TOEIC is determined to be suitable for
the students to be tested with, which is questionable, then TOEIC scores could be used
rightly for placement purposes or as measures of overall English language profi ciency of
groups of students as a whole. This leads to the next issue, that of the TOEIC’s target
audience.
ETS states,
“The Test of English for International Communication (TOEIC) was
developed to measure the English language skills used in international
corporations around the globe.” 11
“The TOEIC test measures the everyday English skills of people
working in an international environment. Test scores indicate how
well people can communicate in English with others in the global
workplace. The test does not require specialized knowledge or
vocabulary beyond that of a person who uses English in everyday work
activities.” 12
“The TOEIC test is designed for use by organizations working in
an international market where English is the primary language of
communication.” 13
As very few Japanese students work, or have ever worked, in an international
business situation, it clear that the TOEIC is not intended to be used for decisions
11 This is from page 1 of Wilson (1993). The italics are added.12 This is from page II-1 of the TOEIC Technical Manual. The italics are added.13 This is from page 2 of the TOEIC Can-Do Guide. The italics are added.
22
First-Year Japanese University Students and TOEIC Scores
人文論集 第 49 巻
related to their English language abilities, studies, or course evaluations or to any other
school-related questions in Japan concerning students’ English language abilities. Most
of the students in Japan do not have the international business background experiences
and knowledge that are the expected foundation and basis of the test materials and
questions. This will hinder them in answering some of the questions in ways that have
nothing to do with their English abilities, making the test less valid and the scores less
reliable than they should be due to at least some of the items containing situations and
ideas they are not familiar with simply because they are students instead of international
business workers. Again from ETS,
“The TOEIC test measures English-language proficiency in the
international work environment . . . . TOEIC is designed to evaluate, in
the context of real-life, business-world situations, the English language
listening comprehension and reading ability of those adults whose
native language is not English.” 14
As pointed out earlier,
“A generic problem with norm-referenced tests of second-language
profi ciency is that the test scores do not provide any direct indication
of actual levels of functional ability to use the target language(s)
involved.” 15
To try to overcome this problem, ETS and other norm-referenced, standardized
test makers have engaged in many research studies and collaborative efforts. Now,
most of the most widely administered English language tests created by the largest
standardized test makers in the world are cross-referenced on charts and tables showing
the accepted equivalencies of various individual scores. And language abilities have also
been referenced to individual scores. In fact, the TOEIC was the fi rst norm-referenced,
standardized test for which this was somewhat “feasible,”16 and ETS has produced a
14 This is from page 2 of Wilson (1993). The italics are added.15 This is from page 1 of Wilson (1989). The italics are added.16 This is on page 4 of Woodford.
First-Year Japanese University Students and TOEIC Scores
23人文論集 第 49 巻

number of “can-do” levels tables over the years trying to pin down exactly what a test
taker with a given score can and cannot do. 17 However, despite all of these eff orts, the
following is what ETS says about its “can-do” levels tables.
“Three points should be noted when using the score interpretation
information presented here.
1 . This information is based on the ratings given by examinees about
their own ability to perform English-language tasks. No objective
measures of English-language abilities were obtained. Although third-
party ratings of an examinee’s English profi ciency were collected and
were moderately to highly related to self-ratings, it is still unclear
whether or not test takers can actually perform the English-language
activities which they reported being able to do.
2 . The tables presented here are based on the average ratings of
a group of examinees. These tables present the tasks that a group of
people in a certain score band are likely to be able to do. However,
there will be people in a given score range who may be able to do
more, or fewer, tasks than are indicated. These tables are intended to
serve as guidelines only and will not necessarily apply equally to every
individual.
3 . The score interpretations are based solely on a Japanese sample
which may not be representative of the population of test-takers in
Japan. In this sample, 60% were male, 98% had a graduate education,
67% were in the electronics industry, and 40% were electrical
engineers. The information presented here may not apply to test-takers
from other countries, educational backgrounds, or industries. Decision-
makers should be cautious when applying these score interpretations to
other groups of employees.” 18
“. . . decision-makers must be aware that proficiency scales 17 See footnote 4 for details about this.18 This is from page 1 of the TOEIC Can-Do Guide. The italics are added, but the bold is in original. Although
a newer table of sorts is available, as mentioned in footnote 4, this earlier table is still available from the ETS website.
24
First-Year Japanese University Students and TOEIC Scores
人文論集 第 49 巻

are useful for describing the abilities of a group of examinees, but can
only describe what a given individual is likely to do, not necessarily
what that person can actually do. . . . these standards describe the
appropriate score for a group of examinees, not necessarily for an
individual test taker.” 19
Therefore, even if a student achieves certain TOEIC scores, it is uncertain what
specifi c language abilities those scores are related to, even if it is known where they
fi t in the tables that ETS provides for that purpose. And take note, in 3 above, from
whose scores these tables were created. Also, these tables are not very detailed at
all. For example, in the tables included in the report from which the above quotes are
taken, for each ability, Reading, Writing, Listening, Speaking, and Interacting, there are
fi fteen statements, such as “read and understand an agenda for a meeting” or “give and
take messages over the telephone.” No further specifi cs are given. Each statement is
placed in one of three categories, “can do,” can do with diffi culty,” or “cannot do” per
each of fi ve Listening or Reading score intervals. So, each statement in included for the
associated ability for each score interval of the appropriate test section, but perhaps in a
diff erent category depending on the score interval. 20
It should also be pointed out here that ETS explicitly states that TOEIC scores
are much better at indicating the levels of groups of test takers’ abilities on the whole
than they are at assessing individual test takers’ abilities. 21 This point was made in the
statements just above from the “can-do” levels table report, but are repeated below in
order to focus on them specifi cally.
“These tables present the tasks that a group of people in a certain
score band are likely to be able to do. However, there will be people in
a given score range who may be able to do more, or fewer, tasks than
are indicated. . . . Decision- makers should be cautious when applying
these score interpretations to other groups of employees.” 22
19 This is from page 3 of the TOEIC Can-Do Guide. The italics are added.20 This is based on Appendix B of the TOEIC Can-Do Guide.21 This is also pointed out on pages 71 and 74 of Childs.22 This is from page 1 of the TOEIC Can-Do Guide. The italics are added.
First-Year Japanese University Students and TOEIC Scores
25人文論集 第 49 巻

“. . . decision-makers must be aware that proficiency scales are
useful for describing the abilities of a group of examinees, but can
only describe what a given individual is likely to do, not necessarily
what that person can actually do. . . . these standards describe the
appropriate score for a group of examinees, not necessarily for an
individual test taker.” 23
Another issue related to these “can-do” tables for the TOEIC is to what extent
they are truthful or not, even in their lack of precision, when they make statements
about abilities not included in the test. ETS claims that test takers’ Listening scores
imply their level of speaking ability and their Reading scores imply their level of writing
ability. It has produced a number of studies, ever since the TOEIC was fi rst introduced,
making these claims based on correlations with other test scores and with test takers’
self-reported abilities. 24 Others disagree. They have found much weaker correlations
than ETS reports and also question some of the implications that ETS has made
concerning the strengths of some of the correlations it has reported, either for between
TOEIC scores and other tests’ scores or between various TOEIC scores. 25
Tables 8, 9, and 12 above included standard errors of the mean (SEM), and Table
15 and Table 16 concerned standard errors of diff erence (SEdiff ). For there to be any
true meaning or fairness involved with the use of TOEIC scores in evaluating test
takers, these standard errors, and one more kind, standard errors of measurement (SEm),
need to be used to understand what the scores actually mean and what they really
imply about the test takers’ abilities, individually and in comparison with other test
takers. Any achieved or actual score is only an approximation of the test taker’s true
or real ability as implied by the score. Standard errors are used to create confi dence
intervals or error bars surrounding the achieved scores to produce estimations of the
true scores with specified degrees of statistical certainty. Using one standard error
creates a confi dence interval around an achieved score that has about 68.3% certainty of
including the test taker’s true score. Using two standard errors results in a confi dence
interval with certainty of including the true score of almost 95.5%. Confi dence intervals
23 This is from page 3 of the TOEIC Can-Do Guide. The italics are added.24 For example, see Liao, et al., Wilson (1989, 1993), and Woodford.25 For example, see Bresnihan (2010, 2012, 2013), Childs, and Hirai (2002, 2008, 2009, 2013).
26
First-Year Japanese University Students and TOEIC Scores
人文論集 第 49 巻

of three standard errors give the possibility of about 99.7% statistical certainty of one’s
claims.
The SEM is used to estimate the true mean from an achieved mean and to
compare two or more means to fi nd out if it can be estimated that they are truly the
same or diff erent. The SEm is used to estimate a test taker’s true score from her/his
actual achieved score. The SEdiff is used to compare two or more test takers’ achieved
scores and to compare two or more scores achieved by one test taker on two or more
administrations or forms of the same test, in all cases to estimate if they are truly the
same or diff erent. Just having a TOEIC score or a few TOEIC scores or the mean of a
set of TOEIC scores has very little, if any, meaning. The appropriate standard errors
must be incorporated with the achieved scores to know their real meaning and to make
fair and sound decisions based on them. Based on these error bars, it was shown that
the average scores for the EEC groups were always higher than the average scores
of the associated Not EEC groups. It was also shown that only one of the six average
changes in the students’ scores’ means were truly diff erent than the associated average
change in students’ scores mean and that very few of the EEC students or the Not EEC
students really achieved higher or lower scores on the second test than the fi rst, and
they did so in similar numbers.
When someone really tries to answer the question of how much studying needs to
be done for a person to raise her/his TOEIC score a certain amount, the fi ndings of only
one study seem to ever come up. It was carried out by Saegusa in 1985, and it is often
cited, or at least its fi ndings are mentioned, whenever this question arises. Charts and
tables have also been produced from the data and analyses he included in his paper. 26
Using the TOEIC scores of thousands of workers, who were studying English in courses
arranged for by their companies and who took the TOEIC twice, and information about
their amounts of classroom English language study time, he came to the following
conclusions.
“. . . less than 80 hours of (English language) instruction is
not very eff ective. In such classes, a majority will make little or no
progress. If effectiveness is given top priority, at least more than
100 hours of instruction, and ideally 200 hours of instruction, as a unit 26 For example, see Newfi elds (page 91), TOEIC Info, Trew (page 6), Ross (page 71), and Wood (page 42).
First-Year Japanese University Students and TOEIC Scores
27人文論集 第 49 巻
should be recommended.” 27
“It usually takes more time to improve English proficiency
than is generally believed. Our studies show that it will take an
average of 400 hours of instruction to raise the profi ciency of TOEIC
450 . . . to that of TOEIC 600 . . . . The general defi nition of (TOEIC
450) is the elementary proficiency of (survival English); and that of
(TOEIC 600) is the minimum working profi ciency. This distinction is
very important, because (TOEIC 600) can be a criterion upon which
to distinguish between working and non-working proficiency. To
successfully carry out business in English, however, a higher level . .
. roughly equivalent to TOEIC 730 . . . will be required, and to reach
that level it is estimated that another 400 hours of instruction will be
needed.” 28
These recommendations are for very much greater amounts of classroom study
time than most Japanese university students spend studying in English language classes.
Only students majoring in English might study this many hours in English classes at
their university. (The students whose data was used in this study were required to take
between two and four one and a half hour English language classes per week for fi fteen
weeks for two fi fteen week semesters, with a summer break of more than two months
in between; so between 45 hours and 90 hours per semester.) Yet, many colleges and
universities in Japan are now using TOEIC scores for various purposes. However, no
one has ever attempted to contradict these fi ndings and conclusions. Just the opposite is
true. However, the present author pointed out in an earlier paper that these estimates
of necessary classroom English language study time are probably about 30% too low due
to the use of the SEm when the SEdiff should have been used. 29
It is also worth noting details of the classes these workers (all college graduates)
were studying in. Saegusa says the classes were taught by native speakers of English
and there were about ten students per class, which usually met two but sometimes 27 This is from page 174 of Saegua.28 This is from page 181 of Saegua. The TOEIC scores in parentheses are substituted for the scores from
another test as per equivalencies made by the author in the article.29 This is explained on pages 213 and 214 of Bresnihan (2010).
28
First-Year Japanese University Students and TOEIC Scores
人文論集 第 49 巻

three times a week for usually two hours at a time. Attendance was about 80%. 30 I
doubt there are any university programs that off er such a situation for its students, and
most are nowhere near this in terms of the possible opportunities and benefi ts it would
offer for studying English. (There were between twenty and forty students in the
classes the data for this study came from. A few of the teachers were native English
speakers, but most were Japanese. The required attendance was between 60% and
70%.)
5 . ConclusionsWhat does all of this imply? One thing is that TOEIC scores will probably not
prove useful to this department in promoting its Extra English Course. TOEIC scores
will not be able to demonstrate what its students have learned in nor what gains in
English language abilities its students have made in its courses or the program as a
whole. Being a norm-referenced profi ciency test, the TOEIC is a poor choice for either
of these goals. As J.D. Brown writes,
“. . . the content of the (TOEIC) is entirely too broadly defined to
be useful in tracking the progress of students, or measuring their
achievement in semester-long, or even year-long courses. . . .
Administrators and teachers alike should also realize that using NRTs
for CTR purposes minimizes the possibilities that their program will
look good.” 31
It is also a fact that the amount of English language classroom study time is insuffi cient
to expect gains in English language profi ciency to be able to be measured using TOEIC
scores, as Saegusa made very clear in his much cited study, which was quoted from
above. 32
Tables 13 and 14 present data showing that many of these students’ achieved
TOEIC scores that were both lower and higher the second time they took the test 30 This is on page 167 of Saegusa.31 This is from page 18 of Brown. TOEIC has been substituted for TOEFL At the time the article was written,
the TOEIC was still basically unknown to most teachers and administrators, while the TOEFL was already very well known. As the two are the same kind of test, substituting one for the other in this context is legitimate.
32 See quotations for footnotes 27 and 28.
First-Year Japanese University Students and TOEIC Scores
29人文論集 第 49 巻

than the fi rst. This is a consistent fi nding in studies of TOEIC scores ; 33 “. . . jumping
around is in the nature of TOEIC scores.” 34 An individual’s scores on a number of
TOEIC administrations will usually be too randomly variable due, at least partially,
to the wide range of the TOEIC scale and the wide error bars, SEm and SEdiff, to
consistently demonstrate improvement, even if it is taking place. Another possible
reason for students’ TOEIC scores fl uctuating even more greatly than would be usual
from one test administration to another is that the TOEIC is meant to be taken by
workers in international business situations, rather than university students, who will
lack the background knowledge and experiences of such workers that is assumed for
understanding the context of some of the test items. For this reason, and also possibly
because the English itself included in the test is too diffi cult for them, some students
may guess at a great number of the answers to the questions. This will also result in
seemingly random fl uctuations in individual’s scores, as they are sometimes luckier at
guessing than at other times.
It should be noted that the students will not be helped with any of these
hindrances by instituting courses in TOEIC preparation. The TOEIC is produced to
measure English language profi ciency, not to measure what is studied in a course.
“. . . the student needs to be motivated to learn English and NOT
simply to pass the test. . . . TOEIC is a test, not a language, so teaching
TOEIC is not really an option. The best thing to do is to teach English
focusing on profi ciency rather than rules or vocabulary.” 35
After test takers know the format of the test, the only thing that will truly
help them to increase their scores is a real improvement in English language ability.
This will only happen with suffi cient exposure to and usage of English, both at a level
appropriate for the students. In Japan, the most eff ective and effi cient place for this to
take place for most students is in English language classes focusing on the acquisition
and usage of English language abilities. This is often the only place where they will be
33 For example, see Bresnihan (2010, 2012, 2013), Childs, and Saegusa.34 This is on page 73 of Childs. On page 74, the author also states, “Students may be counseled that if they
take the test several times, they can expect that by chance alone they will achieve a score that is higher than their true score.”
35 This is from page 44 of Wood, and is stated by ETS representative Robert Woodhead.
30
First-Year Japanese University Students and TOEIC Scores
人文論集 第 49 巻

regularly exposed to English at their level of ability, will pay attention to it, and will use
it, which are requirements for acquisition of English and for improvement in English
language abilities to take place.
Sitting in lecture classes is not the most effi cient or eff ective way for students
to improve their English language abilities, unless perhaps their abilities are already
quite high. In the most recent study published by ETS concerning “can-do” guidelines,
the only tasks similar to this activity were reported to be expected to be able to be
performed adequately by less than half of the test takers whose Listening scores were at
the top level, between 440 and 495. 36 Very few students in this study have a Listening
score anywhere near this level. Therefore, such experiences will not give most of the
students the opportunities they need to improve their English abilities because what is
required of them is too far above their current English language abilities for them to be
able to successfully accomplish the task. Also, “Discussions with leaders of multinational
organizations indicated that nonnative English speakers’ ability to function during social
occasions was often more problematic than their ability to perform on the job.” 37 This
indicates that students will be best served by taking English language classes that focus
primarily on usage in many contexts and not specifi cally in contexts related to business
or specifi c fi elds, work-related or otherwise.
This study has presented the TOEIC scores of the first-year students in one
department at a university in Japan during the first two years of its new program
of study, which I have called the Extra English Course. All of the students took the
TOEIC twice during their first school year. The scores of the students in the EEC
program were shown to have been higher on average than those, on average, who were
not in the program. However, there were no greater gains in the TOEIC scores of the
students overall for either group; for certain individuals, yes, but generally in any way,
no. That this was the case was explained to be as should be expected for the following
reasons.
The TOEIC is a norm-referenced English language profi ciency test that utilizes
a large scale and has wide standard errors associated with its scores. Therefore, it is
not capable of measuring small gains or losses in test takers’ English language abilities.
36 This is based on Table 2 on pages 8-9 of Powers, et al. (2008) and on Table 2 on pages 6.5-6.6 of Powers, et
al. (2010).37 This is from the footnote on page 4 of the TOEIC Can-Do Guide.
First-Year Japanese University Students and TOEIC Scores
31人文論集 第 49 巻

Generally, test takers’ scores will appear to vary randomly, if they sit for the test many
times over a short period of time. Actually, if the standard errors are considered, it is
very likely that the scores would actually be considered the same. What specifi c English
language abilities individuals have and what specifi c gains in English language abilities
individuals accomplish will also not be able to be identifi ed with TOEIC scores because
of the kind of test it is. There are only minimal descriptions of a small number of tasks
that groups of test takers achieving scores within certain wide ranges might generally
be expected to be capable of performing or not. However, it is pointed out that even
these guidelines might prove to be misleading or untrue for certain individuals. That
the TOEIC was created for non-native English speakers working in international
business situations and that the level of English itself on test might be too diffi cult were
suggested to be likely hindrances in the test’s accurate assessment of these students’
English language abilities, resulting in unstable assessments.
It was also explained that the amount of classroom English language study time
required for a majority of learners to really improve their English language abilities,
which would then be reflected in true gains in their TOEIC scores, is very much
greater than that taken by the students whose scores were used in this study. Most
increases or decreases in individual students’ scores, then, would be due to factors other
than changes in their English language abilities. Theoretically, the only true changes
that could have taken place in any of these students’ English language abilities, as
measured by the TOEIC, should have been improvements in abilities due to extensive
individual study of, exposure to, and/or usage of English. No true loss in abilities that
could be measured by the TOEIC should have occurred. 38 It was also pointed out that
almost none of these students have English language abilities even close to what would
be needed for them to benefit from sitting in lectures given in English. What these
students really need to improve their English language abilities are many more hours of
practice and study in classes set at their levels of ability that emphasize using English
actively and accurately in a variety of ways. Along with such classes, attending lectures
given in English might eventually be benefi cial for the students.
One does not become capable of using a language, or improve one’s capabilities
38 As stated on page 10 of the TOEIC User Guide and page 22 of the TOEIC Examinee Handbook, ETS will
issue a test taker’s TOEIC scores for up to two years, therefore at least implying that the scores are valid for those two years.
32
First-Year Japanese University Students and TOEIC Scores
人文論集 第 49 巻

in a language, in a manner similar to holding out one’s glass and having it fi lled with
water by someone else. One’s language abilities improve by using them willingly
and actively in a variety of ways and by paying attention to and taking notice of the
language one is exposed to and the language one produces. Schools and programs need
to off er appropriate opportunities and set appropriate goals for their students if they
want their students’ foreign, here English, language abilities to improve. To encourage
their students to make the most of such opportunities and to try to achieve such goals,
they need to institute requirements that necessitate the students’ willing and active
engagement in English language learning activities both inside and outside of their
classes.
Students should be engaged in various activities that compel them to use English
for speaking, reading, listening, writing, interacting, and communicating in each class
meeting, not in different, separate classes. And their teachers should be modeling
such usage by doing the same things. Communication, fluency, and accuracy should
be integrated and emphasized; not one or the other, but all three together, integrating
vocabulary, grammar, communication, and understanding. Students should primarily
use English as a whole in their English language classes, not primarily study about bits
and pieces of English. And for the most part, the language used by the students and
their teachers should be English. The number of mandatory, or of required selective,
English classes per semester of this type should be increased, and students should be
required to take such English classes during at least their fi rst three years, not only
during their fi rst year, at university. There should be no more than twenty students in
English language classes in order to ensure that teachers can successfully monitor and
encourage the usage of English and give needed feedback.
If a certain minimum score on a test, such as, but not necessarily, the TOEIC,
were to be required, it should be made an additional program requirement, not a
part of any specific class. Students should be expected to accomplish it without
specifi c reference to it or study of it in classes. Test preparation should be done alone
individually, just as the test will be taken, and not in classes. This would also encourage
students to study English more than is required for their English classes and to become
more self-motivated in their studies, both of which are defi nitely necessary for them to
improve their English abilities. Students have to be able to do much more with English
than a test, like the TOEIC, can urge them to learn how to do or can measure. Also,
First-Year Japanese University Students and TOEIC Scores
33人文論集 第 49 巻

the fact is that after the format is familiar, drilling for the test is not the most effi cient
or eff ective way to improve English language abilities, and therefore TOEIC scores. So,
classes should not focus on it anyway.
If students could spend at least half a year, but a whole year would be much
better, studying and/or doing internships and/or working in an English speaking
country or in an English speaking environment overseas, a great many of them would
improve their English language abilities signifi cantly. Schools should institute policies
that will allow students to receive ample credits for all such endeavors. In addition,
schools should provide at least some funding to assist students so that many students
can participate in them. If schools are able arrange such study, internship, and/or work
situations, that would be helpful. However, even if they cannot, they should still award
students credits for any such endeavors they successfully participate in, and they should
assist with the funding.
These are just a few general ideas for how university programs could encourage
and help their students to improve their English language abilities.
34
First-Year Japanese University Students and TOEIC Scores
人文論集 第 49 巻

ReferencesBresnihan, B. 2010. Possible Reliability Problems Aff ecting Use of TOEIC IP Test Scores. Kobe:
Institute for Policy Analysis and Social Innovation, University of Hyogo.Bresnihan, B. 2012. “Using TOEIC Scores to Evaluate Student Performance in English Language
Courses.” The Jimbun Ronshu, Vol. 47. pp. 1-47. Kobe: Institute for Policy Analysis and Social Innovation, University of Hyogo.
Bresnihan, B. 2013. “Have the Changes Made to the TOEIC Caused Any Diff erences in the Ways It Assesses Test Takers’ English Language Abilities?” The Jimbun Ronshu, Vol. 48. pp. 1-34. Kobe: Institute for Policy Analysis and Social Innovation, University of Hyogo.
Brown, J.D. 1995. “Differences between Norm-referenced and Criterion-referenced Tests.” In Brown, J.D. & Yamashita, S.O.(Eds.) Language Testing in Japan. pp. 12-19. Tokyo: JALT.
Childs, M. 1995. “Good and Bad Uses of TOEIC by Japanese Companies.” In Brown , J.D. & Yamashita, S.O. (Eds.) Language Testing in Japan. pp. 66-75. Tokyo: JALT.
Hirai, M. 2002. “Correlations between Active Skill and Passive Skill Test Scores.” Shiken: JALT Testing & Evaluation SIG Newsletter, Vol. 6, No. 3, Sept. 2002. pp. 2-8. Tokyo: JALT. Feb. 12, 2010.
<http://jalt.org/test/hir_1.htm>.Hirai, M. 2008. “Correlations between STEP BULATS Writing and TOEIC Scores.” In Newfi elds,
T., Wanner, P., & Kawate-Mierzejewska, M. (Eds.) Divergence and Convergence. Educating with Integrity: Proceedings of the 7th Annual JALT Pan-SIG Conference. May 10-11. pp. 36-46. Kyoto: Doshisha University, Shinmachi Campus. Mar. 9, 2010.
<http://jalt.org/pansig/2008/HTML/Hirai1.htm>.Hirai, M. 2009. “Correlations between STEP BULATS Speaking and TOEIC Scores.” In Skier,
E. & Newfi elds, T. (Eds.) Infi nite Possibilities. Expanding Limited Opportunities in Language Education. Proceedings of the 8th Annual JALT Pan-SIG Conference. May 23-24. pp. 12-25. Chiba: Toyo Gakuen University, Nagareyama Campus. Feb. 15, 2010.
<http://jalt.org/pansig/2009/HTML/Hirai.htm>.Hirai, M. 2013. “Correlations between BULATS Speaking/Writing and TOEIC Scores.” In
Chartrand, R., Crofts, S., & Brooks, G. (Eds.) Literacy: SIGnals of Emergence. Proceedings of the 11th Annual JALT Pan-SIG Conference. Hiroshima: Hiroshima University, Higashi-Hiroshima Campus. Feb. 26, 2013.
<http://www.pansig.org/2013/JALTPanSIG2013/Proceedings/The2012Pan-SIGProceedings.pdf>
Liao, C.W. 2010. TOEIC Compendium Study: TOEIC Listening and Reading Test Scale Anchoring Study. ETS.TOEIC. Feb. 6, 2013.
<http://www.ets.org/Media/Research/pdf/TC-10-05.pdf>.Liao, C.W., Qu,Y., & Morgan, R. 2010. TOEIC Compendium Study: The Relationships of Test
Scores Measured by the TOEIC Listening and Reading Test and TOEIC Speaking and Writing Tests. ETS.TOEIC. Jan. 20, 2013.
<http://www.ets.org/Media/Research/pdf/TC-10-13.pdf>.Newfields, T. 2005. “TOEIC Washback Effects on Teachers: A Pilot Study at One University
First-Year Japanese University Students and TOEIC Scores
35人文論集 第 49 巻

Faculty.” Tokyo: Toyo University Keizai Ronshu. Vol. 31. No. 1. pp. 83-106. Feb. 6, 2013. <http://www.tnewfi elds.info/Articles/PDF/Newfi elds-Washback.pdf>.Saegusa, Y. 1985. “Prediction of English Profi ciency Progress.” Musashino English and American
Literature, Vol. 18. pp. 165-185. Tokyo: Musashino Women’s University.Powers, D.E., Kim, H.J., & Weng, V.Z. 2008. TOEIC Can-Do Guide--Executive Summary. The
Redesigned TOEIC (Listening and Reading) Test: Relations to Test Taker Perceptions of Profi ciency in English. ETS.TOEIC. Jan. 17, 2013.
<http://www.ets.org/Media/Tests/Test_of_English_for_International_Communication/TOEIC_Can_Do.pdf>.
Powers, D.E., Kim, H.J., & Weng, V.Z. 2010. TOEIC Compendium Study: The redesigned TOEIC Listening and Reading Test: Relations to Test Taker Perceptions of Profi ciency in English. ETS.TOEIC. Jan. 20, 2013.
<http://www.ets.org/Media/Research/pdf/TC-10-06.pdf>.Ross, S. 1998. Measuring Gain in Language Programs: Theory and Research. Sydney: Macquarie
University, National Centre for English Language Teaching and Research. Feb. 6, 2013. <http://www.ameprc.mq.edu.au/docs/research_reports/research_report_series/book_12_
Measuring_Gains.pdf>.TOEIC Can-Do Guide: Linking TOEIC Scores to Activities Performed Using English, The
Chauncey Group International. 2000. ETS.TOEIC. Jan. 17, 2013. <http://www.ets.org/Media/Research/pdf/TOEIC_CAN_DO.pdf>.TOEIC Can-Do Levels Table. ETS.TOEIC. Jan. 17, 2013. <http://www.amideast.org/sites/default/fi les/otherfi les/hq/advising%20testing/toeic20can-do-
20levels20table1.pdf>.TOEIC Examinee Handbook: Listening & Reading. 2012. ETS.TOEIC. Feb. 6, 2013. <http://www.ets.org/Media/Tests/TOEIC/pdf/TOEIC_LR_examinee_handbook.pdf>.TOEIC Info. 2000. Prolingua Executive Language Services. Feb.6, 2013. <http://www.prolingua.co.jp/toeic_e.html>.TOEIC Listening and Reading Score Descriptors. 2007. ETS.TOEIC. Jan. 17, 2013. <http://www.ets.org/Media/Tests/TOEIC/pdf/TOEIC_LR_Score_Desc.pdf>.TOEIC Profi ciency Scale. 2012. ETS.TOEIC. Jan. 20, 2013. <http://www.toeic.or.jp/toeic/pdf/data/profi ciency.pdf>.TOEIC Technical Manual. 1998. Princeton: The Chauncey Group International & ETS. Jan. 27,
2013. <http://www.lc.fcu.edu.tw/Foreign_language_division/Linked%20documents/TOEIC_Tech_
Man.pdf>.TOEIC User Guide: Listening & Reading. 2007. ETS.TOEIC. Feb. 6, 2013. <http://www.ets.org/Media/Tests/Test_of_English_for_International_Communication/
TOEIC_User_Gd.pdf>.Trew, G. 2007. A Teachers’s Guide to TOEIC Listening and Reading Test: Preparing Your
Students for Success. Oxford: Oxford University Press. Feb. 6, 2013. <http://elt.oup.com/elt/students/exams//pdf/elt/toeic_teachers_guide_international.pdf>.Wilson, K. 1989. TOEIC Research Report, No. 1: Enhancing the Interpretation of a Norm-
36
First-Year Japanese University Students and TOEIC Scores
人文論集 第 49 巻

Referenced Second-Language Test through Criterion Referencing: A Research Assessment of Experience in the TOEIC Testing Context. Princeton: ETS. Jan. 27, 2013.
<http://www.ets.org/Media/Research/pdf/RR-89-39.pdf>.Wilson, K. 1993. TOEIC Research Summaries, No. 1: Relating TOEIC Scores to Oral Profi ciency
Interview Ratings. Princeton: ETS. Jan. 27, 2013. <http://www.ets.org/Media/Research/pdf/TOEIC-RS-01.pdf>.Wood, J. 2010. “TOEIC Materials and Preparation Questions: Interview with an ETS
Representative.” The Language Teacher, Vol. 34. No. 6. Nov./Dec. pp. 41-45. Tokyo: JALT.Woodford, P. 1982. TOEIC Research Summaries: An Introduction to TOEIC: The Initial Validity
Study. Princeton: ETS. Jan. 27, 2013. <http://www1.ets.org/Media/Research/pdf/TOEIC-RS-00.pdf>.
First-Year Japanese University Students and TOEIC Scores
37人文論集 第 49 巻


