Embed Size (px)
Citation preview
Copyright 0 1997 by the Genetics Society of America
Fixation, Segregation and Linkage of Allozyme Loci in Inbred Families of the Pacific Oyster Crassostrea gigas (Thunberg): Implications
for the Causes of Inbreeding Depression
Daniel J. McGoldrick and Dennis Hedgecock
The Bodega Marine Laboratoly, The University of California, Davis, Bodega Bay, California 9492? Manuscript received July 16, 1996
Accepted for publication February 3, 1997
ABSTRACT The effect that inbreeding has on the fixation and segregation of genes has rarely been confirmed
by direct observation. Here, fixation, segregation, and linkage of allozymes is investigated in the progeny of self-fertilized hermaphrodites of the normally outcrossing Pacific oyster Crassostrea gigas. The estimate of fixation pooled over loci, individuals, and families, F = 0.462, is significantly lower than the expected value of 0.5. Log-likelihood ratios reveal significant heterogeneity in fixation among individuals, among families, and among loci. In addition, the grand pooled segregation ratio, 127:243:54, deviates signifi- cantly from 1:2:1, with a bias against homozygotes for alleles of lesser frequency in the natural population. Segregation ratios for 11 of 14 loci are significantly heterogeneous among families, and exact tests for segregation within families reveal 16 significant results out of 51 tests. Thus, fixation and segregation of allozyme markers in inbred oyster families deviates from the expectations of neutral inbreeding theory. Di-genic disequilibria are significant for four of 74 di-locus pairs revealing two linkage groups. Strong viability selection is apparently conditional on the genotype of the hermaphrodite-founders and is largely focused on these two linkage groups. These genetic effects are explained by interaction between &linked factors and polymorphic regulatory backgrounds.
P OPULATION genetic study of marine molluscs, particularly bivalves, which have exceptionally
large amounts of electrophoretically detectable protein variation (BUROKER et al. 1979; FUJIO et al. 1983; NEVO et al. 1984; BLANC and BONHOMME 1987), is germane to the general, still unresolved debate over the adaptive significance of this variation (LEWONTIN 1974). Allo- zyme heterozygosity has been directly related to traits associated with fitness for molluscs. There is, for exam- ple, a significant tendency for mean weight to be corre- lated with allozyme heterozygosity in cohorts of oysters derived from natural populations (SINGH and ZOUROS 1978; ZOUROS et al. 1980; FUJIO 1982). Moreover, allo- zyme heterozygosity is inversely correlated with routine respiration rate, providing a physiological rationale for the positive correlation between allozyme heterozygos- ity and growth rate (KOEHN and SHUMWAY 1982; GAR TON et al. 1984; HAWKINS et al. 1989; HILBISH et al. 1994). Two hypotheses have emerged to explain these observa- tions: the overdominance hypothesis, which posits a di- rect functional role for allozymes in fitness, and the associative overdominance hypothesis, which holds that allozymes, as genetic markers, are only indirectly associ- ated with fitness-related traits through linkage disequi- libria with agent loci segregating for deleterious reces- sive alleles (see reviews by ZOUROS and FOLTZ 1987;
Cmresponding author: Daniel J. McGoldrick, CSIRO-Division of Ma- rine Research, G.P.O. Box 1538, Hobart, Tasmania, Australia 7001. E-mail: [email protected]
Genetics 146: 321-334 (May, 1997)
ZOUROS and POGSON 1994). Evidence in support of a direct role for allozymes includes the greater contribu- tions to the growth-rate us. heterozygosity correlation by enzymes involved in glycolysis and protein catabo- lism than by other proteins (KOEHN et al. 1988), over- dominance at single allozyme loci ($ GILLESPIE and LANGLEY 1974; KACSER and BURNS 1981; SUCITA and FUJIO 1982; POGSON 1991; SARVER et al. 1992), and cor- relation of protein markers but not restriction fragment length polymorphism (RFLP) DNA markers with growth (POGSON and ZOUROS 1994). Evidence in s u p port of an indirect role for allozymes includes failure to find a correlation between allozyme heterozygosity and fitness-related traits in hatchery-produced cohorts (BEAUMONT et al. 1983; GAFFNEY and SCOTT 1984; BEAU- MONT 1991) or in temporal samples from the same locality (GAFFNEY 1990), correlation between heterozy- gote-deficiency at an allozyme marker and that marker’s contribution to the multiple-locus heterozygosity-fitness correlation (GAFFNEY et al. 1990), and relatively high frequencies for null alleles at allozyme loci (FOLTZ 1986; GAFFNEY 1994). However, these studies vary in at least three key ways that may obscure the true associa- tion of allozymes and fitness-related traits: (1) the spe- cific loci examined are not the same across studies, which varies the chromosomal linkage relationships of the marker loci observed; (2) the population structures vary from cohorts to mass spawnings to pair crosses, which confounds the amount of gametic phase disequi-

322 D. J. McColdrick and D. Hedgecock
librium and the specific alleles segregating in the sam- ple units; and (3) the species examined varies from snails, to oysters, clams, mussels, scallops etc., which confounds differences in ecological and selective re- gimes, chromosome number and structure, phylogeny, and evolutionary history. Given the many differences among studies, the extent to which they find heterozy- gosity-fitness correlation in bivalve molluscs is all the more remarkable.
We have adopted crosses among inbred progeny from selfed Pacific oysters as an experimental approach to testing alternative explanations for heterozygosity- fitness correlation and for heterosis in general (HEDGECOCK et al. 1995, 1996). This approach includes the production of inbred lines and the verification of parentage for the broodstock, because contamination among bivalve larval cultures is widespread (FOLTZ 1986; GAFFNEY and ALLEN 1993; MALLET et al. 1985; ZOUROS et al. 1992). Here we show that allozyme mark- ers are sufficient to confirm the parentage of inbred families, and further, we estimate fixation rates, segre- gation ratios, and linkage of allozyme markers for seven inbred families. Data are analyzed in a hierarchical fash- ion, separating observations by locus within family, by individuals within family, by families within the collec- tion of inbred lines, by locus across families, and over all individuals and loci (the grand pool). According to the laws of Mendelian inheritance and neutral inbreed- ing theory (WRIGHT 1917), inbred families should ex- hibit 1:2:1 segregation ratios for each allozyme locus heterozygous in the selfed hermaphrodite, making half of each family homozygous, identically by descent. We ask whether allozyme markers conform to these expec- tations, both on average and across individuals, families and loci.
MATERIALS AND METHODS
Experimental material: Six hermaphroditic oysters were selfed in 1989 by KEN COOPER of Coast Oyster Go. (now Coast Seafoods, Bellevue, WA) to produce lines 89-1, 89-3, 89-4, 89-5, 89-6, and 89-7. In addition, a hermaphrodite was self- fertilized at the Bodega Marine Laboratory in 1992 to produce line 92-1. These seven hermaphrodites, hereafter called founders, were all collected from the semi-isolated, natural- ized population of Crassostrea gigas in Dabob Bay, Puget Sound, Washington, which was itself established by massive importation of seed oysters from native populations in Miyagi, Japan (CHEW 1979); tissue samples of founders were not kept and were thus unavailable for electrophoretic analysis. Full- sibs of families 89-1 and 89-5 were mated in 1992 to produce a second generation of inbred stocks, designated 92-89-1 and 92-89-5, respectively. Each family was caged separately and set out to grow in Tomales Bay, California, prior to crosses conducted in the summers of 1993 and 1994. Owing to small numbers, sampling was restricted to a total of 99 adult individ- uals that were destructively killed in the process of making second-generation experimental crosses (see HEDGECOCK et al. 1995, 1996). After sacrifice, brood stock (both parents of second-generation crosses and unmated sibs of the first in- bred generation) were each stored at -80" in plastic bags labeled with the sex, family, and an individual number.
Allozyme electrophoresis: A survey of 24 loci (Aut, Acon-1, Acon-2, Adk, Diu, G"pdh, Cpi, Dap2, Idh-I, Idh-2, Lap-1, Lap- 2, Tap-3, Mdh-1, Mdh-2, Mpi, q g d h , Pgm, To-1, To-2, Pt-1, l" 2, Mp-1, and Sdh) yielded 14 loci that were segregating in at least one family and were thus inferred to be heterozygous in at least one of the seven founding hermaphrodites. Electro- phoretic protocol and allozyme nomenclature were essentially that of HEDGECOCK and SLY (1990) and HEDGECOCK (1994), who together with BANKS et al. (1994) are the sources for allelic frequencies in the Dabob Bay population for all loci but Sdh; allelic frequencies for Sdh are here inferred from the founders.
Verification of pedigrees: Because only two alleles can be segregating in the progeny from a selfed diploid, the presence of more than two alleles at any locus is evidence of contamina- tion of the full-sib family examined. Those individuals having the least frequent of the three alleles can be excluded; for example, if most sibs are AA, AB, or BB at a locus, a putative sib with genotype AC is assumed to be a contaminant and is excluded from further analysis. Genotypes of the founders were inferred from the genotypes of the nonexcluded prog- eny. Finally, the parentage of each progeny was ascertained on the basis of allozyme genotype, using a computer program written in the IML language of SAS (SAS Institute, Inc., 1988; D. J. MCGOIDRICK, unpublished data). This program per- forms, for each progeny genotype, a step-wise check, by locus, then family, for consistency with the genotypes expected from self fertilization of the founders, assuming Mendelian inheri- tance of markers. Failure to be excluded at any locus results in assignment of a progeny to that family. Ideally, each progeny would be assigned to one and only one family, the same family with which that individual had been caged and identified. To test how often a randomly drawn wild individual could match any of the seven inbred families by chance, we generated 1000 simulated multilocus genotypes by computer assisted, pseudomultinomial sampling from the known allele-fre- quency distributions in Dabob Bay. We assumed gametic phase equilibrium at the 14 loci, which was justified by the absence of significant digenic disequilibria in the Dabob Bay population, using contingency tables and a resampling pro- gram (D. ZAYKIN, personal communication). This random test population was treated as a putative progeny group and matched against sets of genotypes expected from the selfed founders.
Statistical analysis: Raw genotypic data for the 99 individu- als are tabulated in the Appendix. We addressed fixation lev- els and segregation ratios separately. The fixation index, F, was calculated as F = 1 - (HGl/HP), where HGI and HPare the heterozygosities for the first inbred generation and the founder, respectively. To analyze segregation, we tabulated, by locus and across group (family or total), three pooled genotypic proportions, AJ,, AJ,, A/,, where the frequency of allele A, is greater than that of allele A, in the Dabob Bay wild population. For nine loci, the A, and A, alleles were the same for all families; for three loci (Acon-1, Adk, Sdh), allele A, was the same but allele A, differed from family to family; for only two loci (Aut, Pp), did both alleles vary across families. Segregation in the second-generation 92-89-5 group, which resulted from the mating of male 3 by female 4 of 89-5 (APPEN- DIX), was analyzed separately.
Hierarchical log-likelihood ratio or Gtests (SOUL. and ROHLF 1981) were made to assess both agreement with mean expectations ( F = 0.5 or 1:2:1 segregation ratios, tested by
and G,,,,,l statistics) and the heterogeneity of fixation levels or segregation ratios within and among families and loci (tested by GtnrltalduoO, Gfnmllrn, and statistics). Significance levels of Gtests were adjusted for simultaneous testing over multiple families, individuals, or loci (WEIR 1990); however, the correction was not applied to tests of heterogeneity by

Segregating Inbred Oyster Families 323
locus across families because loci proved significantly hetero- geneous in fixation and segregation. Exact tests for individual segregation ratios within particular families were conducted (by summing over all outcomes with equal or lesser probabil- ity). These tests were not corrected for multiple testing be- cause of significant family by locus interaction. In addition, we pooled genotypic classes for loci on two known linkage groups and tested for 1:2:1 pooled segregation and heteroge- neity among loci within linkage groups.
Linkage disequilibrium and linkage: With 14 allozyme loci, 91 unique di-locus comparisons were possible. For each com- parison, tests of association were based on the significance of a di-locus disequilibrium coefficient, which was estimated by a resampling procedure that tests for di-genic and higher order disequilibria (D. ZAYKIN, personal communication). Pairs of loci with significant associations in at least one family were then examined for evidence of linkage. To estimate link- age, we used the maximum likelihood approach, combining data from all families for which at least one parent was doubly heterozygous and segregation was Mendelian (see ALLARD 1956; KOROI. et al. 1994). Portions of the data set were not used for estimating linkage because of deviations from 1:2:1 segregation. Families that failed Mendelian segregation tests were dropped from data sets used for maximum likelihood estimation. Standard deviations for the uncorrected recombi- nation fraction were estimated by taking the inverse of the square root of the total information for a given di-locus pair. Finally, map distances were derived, correcting for interfer- ence with KOSAMBI’S mapping function (KOSAMBI 1944; KOROI. et al. 1994).
RESULTS
Contamination: Five of 99 progeny (5.0%) are classi- fied as contaminants: males 16, 17, and 18 in family 92- 89-1, female 1 in family 89-3, and female 4 in family 89- 7 (APPENDIX). Whereas, in family 89-7, five sibs are A I and one is AA at the Pgm locus; female 4 in this family is heterozygous Ab (lower case letters denote third alleles within families). The genotype of this same female is unlikely, though not excludable, at three other loci (she is AD at Aut in a sibship of AA, AE at Gpi in a sibship of AA, and IF at Lap-2 in a sibship of AA), further supporting classification as a contaminant. This female has a genotype that cannot occur in any of the seven inbred families. Regarding the four other contaminants detected, female 1 in family 89-3 is rejected by a third allele at Adk, males 17 and 18 of family 92-89-1 are rejected by third alleles at Lap2 and Sdh, while male 16 of this family is rejected by third alleles at Aut, Adk, and Lap-2. None of these individuals has a genotype consistent with any of the other inbred families.
Family assignments: Excluding these five contami- nants, 94 remaining progeny have genotypes consistent with their family and founder. Based solely on allozyme genotype, 78 of these, 83%, are assigned to one and only one family, the same family with which each was caged and identified. Of the remaining progeny-geno- types, 14 (14.9%) are assigned to the expected family plus one other, and two (2.1%) are assigned to three families, including the expected family. Only one of the 1000 random-test genotypes fit a family by chance (and this genotype would have appeared 50% fixed). Con-
versely, 999 of 1000 random-test genotypes do not fit any family and would be rejected as contaminants. Since we actually reject five individuals, we estimate the num- ber of undetected contaminant individuals as 5/999 = 0.005. This yields an estimate of 0.005/99 - 0.00005 for the probability that undetected contaminants remain in any one of the families.
Two-locus disequilibria and linkage: Of the 91 possi- ble di-locus comparisons, only three fail to have at least one parent doubly heterozygous in at least one family, leaving 88 di-locus pairs as preliminary candidates for linkage tests. Excluding pairs that deviate from Mende- lian segregation leaves 74 di-locus pairs. Of these, four pairs show significant di-locus disequilibria by the re- sampling test (Table 1A). Using the resampling test results as indicators of potential linkage, we estimate recombination fractions by pooling data for all informa- tive families having Mendelian segregation for the di- locus pairs of interest, where a value of 0.5 is the expec- tation when there is no linkage (Table 1B). In addition to the four significant associations, we also estimate re- combination fractions for two implied associations, Aat/ bpgdh and Acon-l/Idh-2. Two linkage groups are evident, one containing Aut, Gpi, and 6pgdh and a sec- ond with Idh-2, Acon-1, and Pgm. The most likely gene orders for these linkage groups (in Kosambi map units) are as follows: (1) Aat-28.8- Gpi-27.4- 6pgdh and (2) Idh-2-23.6-Acon-1-9.9-Pgm.
Average fixation levels: An estimate of the fixation index averaged over all inbred lines and loci is F = 0.462 (bottom rows of Tables 2 and 3). This grand pooled fixation estimate is slightly but significantly lower than the expected 0.5 (Grand = 4.099, 1 d.f., P = 0.043). Moreover, there is significant heterogeneity in fixation levels both among families ( G,~Lmzltur = 72.395, 6 d.f., P << 0.001, Table 2, bottom row) and among loci (Gloci = 39.759, 13 d.f., P+ 0.001, Table 3, bottom row).
Fixation levels by family: We now consider, by family, Gtests of mean against expected fixation and of hetero- geneity of fixation among loci and among individuals (Table 2) and find some families that are overfixed and some that are underfixed. Family 89-1 is significantly less fixed than neutral inbreeding theory would predict ( F = 0.217; Gpookd = 36.058, 1 d.f., P < 0.001, Table 2). There is no significant heterogeneity in fixation among the 89-1 sibs or among the eight segregating loci. Family 89-4, on the other hand, is significantly overfixed ( F = 0.690; Gpookd = 14.809, 1 d.f., P e 0.001); there is no significant heterogeneity among loci, but, after correct- ing for multiple testing, there is significant heterogene- ity among sibs ( Gindividuuh = 23.554, 9 d.f., P = 0.035). One sib is completely fixed for all 10 loci that were heterozygous in the parent, and three sibs are fixed for all but one locus while the remaining sibs fix as ex- pected. Family 89-5 has no systematic deviation in the pooled fixation index and no heterogeneity of fixation among individuals; however, it does have significant heterogeneity of fixation among loci (G,,,, = 33.513, 11

324 D. J. McGoldrick and D. Hedgecock
TABLE 1
Two-locus disequilibria (A) and linkage (B) of allozyme markers
Loci paired D(AB) D(AAB) D(ABB) D(AABB) Family Mendel?
A. Significance of two-locus disequilibria coefficients
Aat/Gpi 0.04625 0.04000 0.04219 0.02875 89-4 No Gpi/G+gdh 0.01656 0.00125 0.00094 NS 92-89-5 Yes Acon-l/Pgm 0.03562 0.01438 NS NS 92-89-5 No Idh-Z/Pgm 0.02937 0.73313 0.49656 0.81094 89-3 Yes
Loci paired Families used Recombination fraction" Kosambi map units (cM)
B. Linkage
Aat/Cpi 89-5, 6 0.25981 2 0.1077 28.8 Gpi/G-pgdh 89-5, 92-89-5 0.24858 2 0.0741 27.4 Aat/G-pgdh 89-5 0.34277 2 0.1954 42.0 Acon- l /Pp 89-3, 5, 7, 92-1 0.09979 2 0.0432 9.9 Acon-l/Idh-Z 89-3, 92-1 0.21960 2 0.0851 23.6 Idh-Z/PP 89-3, 92-1 0.24595 2 0.0832 26.9
"Values are means 2 SD. NS, not significant.
d.f., P = 0.003). Lap2 and Pgm are underfixed in this family, while Sdh and Dap-2 are overfixed. Family 89-6 is significantly underfixed ( F = 0.129; Gfl,,ow = 19.133, 1 d.f., P < 0.001) but has no significant heterogeneity either among loci or sibs. The remaining three families, 89-3, 89-7, and 92-1, have mean fixation levels no differ- ent than expected and no heterogeneity of fixation, either among individuals or loci.
Fixation levels by locus: We next examine fixation by locus, over families (Table 3, for loci grouped into two linkage groups, shown in A and B, and unlinked markers, in C), classifying departures from neutral in- breeding expectations as systematic, when mean fixa- tion for a locus across families is not 0.5 (tested by Gfl,,ok,i), and erratic, when there is significant heteroge- neity of fixation among families for a locus (tested by G,(zmlliv,). We conservatively treat each locus as represent- ing an independent test of the same fixation hypothesis
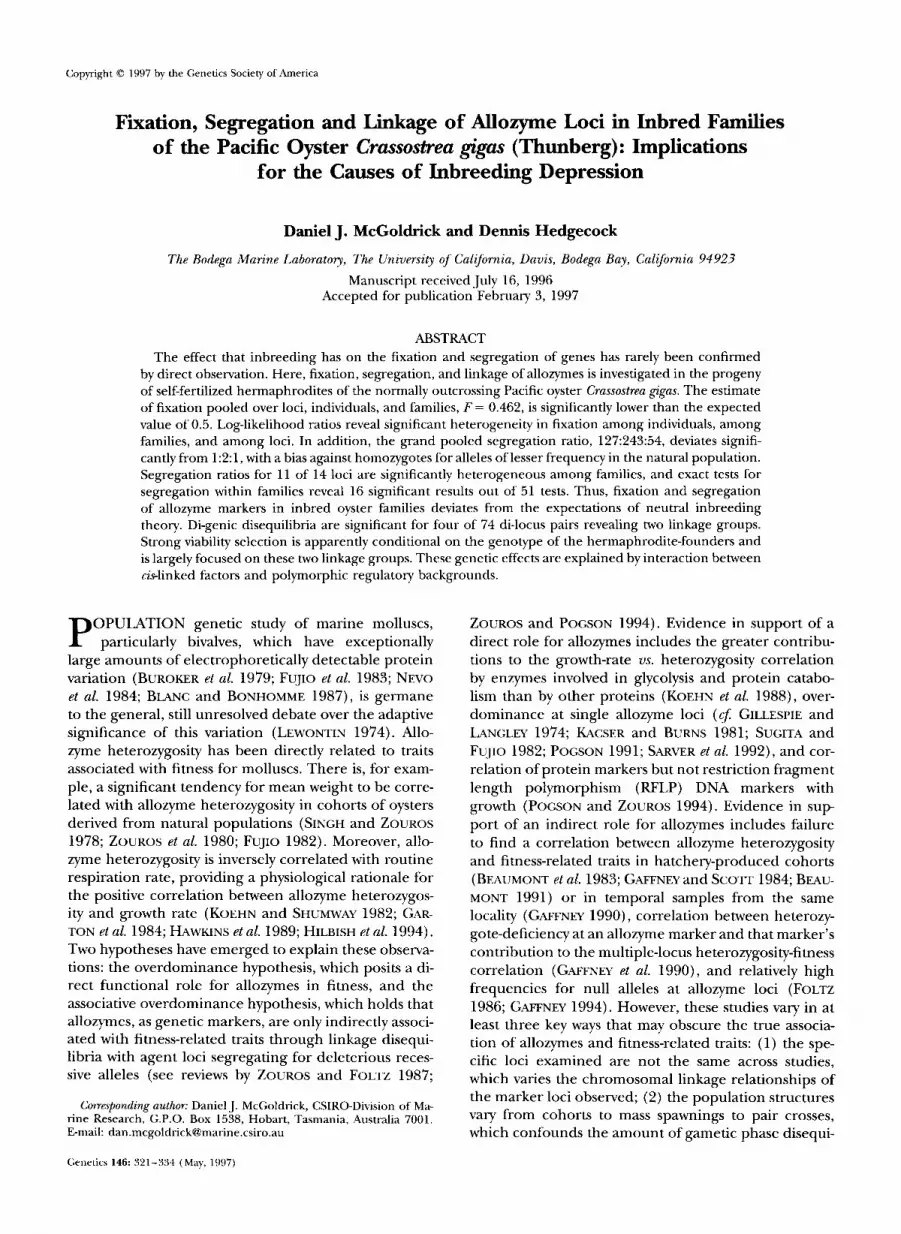
and therefore adjust the significance of the GPonlpd statis- tic for multiple testing. However, because there is sub- stantial heterogeneity in fixation among loci ( Giocz, bot- tom row, Table 3), we consider the test of heterogeneity among families for each locus to be a unique test, with degrees of freedom equal to one less than the number of families in which the locus is segregating. Probabili- ties associated with the systematic and erratic depar- tures from expected fixation for each locus are plotted in Figure 1. The magnitude of the heterogeneity in fixation among families is colinear with the estimated gene orders for Aut, Gpz, and 69gdh as well as Zdh-2, Acon-1, and Pgm.
Seven of 14 segregating loci (Acon-2, Adk, Diu, G3- pdh, Dap-2, Idh-2, and Mpl) show neither systematic nor erratic departures from neutral inbreeding expec- tations (Table 3 and Figure 1). Of the remaining seven loci, however, Lap-2 has a significant excess of heterozy-
TABLE 2
Fixation of allozyme markers within inbred families of Pacific oysters
Estimated No. of heterozygotes fixation"
No. of No. of Family loci individuals Expected Observed F
Gtests for F heterogeneity
Gtests, mean F
89-1 8 15 53 83 0.217 ? 0.040 89-3 6 11 33 42 0.364 ? 0.059 89-4 10 10 50 31 0.690 2 0.046 89-5 12 38 173.5 167 0.519 2 0.027 89-6 4 8 15.5 27 0.129 2 0.060 89-7 6 7 18.5 18 0.514 ? 0.082 92-1 5 5 12.5 15 0.400 2 0.098
16.538 22.140 3.306 20.619
22.479 23.554* 33.513** 46.580 0.015 12.751 7.101 7.356 1.726 3.452
G,,,,,,,,,,
36.058*** 4.972
0.487
0.027 1.007
14.809***
19.133***
Pooled 14 94 356 383 0.462 t 0.019 72.395*** ~~
4.099"
* P < 0.05; ** P < 0.01; *** P < 0.001. "Values are means ? SD.
325 Segregating Inbred Oyster Families
TABLE 3
Fixation of allozyme loci among inbred families of Pacific oysters
Estimated Gtest for F No. of heterozygotes
No. of fixation" heterogeneity Gtests, mean F
Locus families Expected Observed F G,nm?l,r, Gp,M
A. Linkage group I
Aut 4 31.5 31 0.508 2 0.063 9.103* 0.016 cpi 3 24 24 0.520 2 0.071 8.962* 0.080 6&dh 3 31.5 32 0.492 ? 0.063 18.237*** 0.016
B. Linkage group I1
Zdh-2 4 19.5 28 0.282 ? 0.072 3.472 7.665 Acorn-I 5 32.5 29 0.554 i- 0.062 9.872* 0.755 Pgm 5 35 43 0.386 2 0.058 15.553** 3.690
C. Unlinked
Lap2 4 34 48 0.294 ? 0.055 17.713*** 11.880**
Sdh 4 18 15 0.583 2 0.082 19.865*** 1.005 Acon-2 3 22.5 21 0.533 2 0.074 0.404 0.200 Adk 3 32 41 0.359 ? 0.060 3.506 5.131 Dap2 3 25 16 0.680 2 0.066 5.128 6.628 Diu 3 16 14 0.563 ? 0.088 1.834 0.501 G3-pdh 2 12.5 12 0.520 2 0.100 0.338 0.040
M P l 5 21 29 0.310 ? 0.071 3.328 6.252
G h Grand
Pooled 7 356 383 0.462 2 0.019 39.759*** 4.099*
* P < 0.05; ** P < 0.01; *** P < 0.001. I' Values are means ? SD.
gotes ( F = 0.294), and all seven show erratic deviations in fixation among families. Systematic departures from expected fixation are large for Adk, Mp-1, Dap-2, and Zdh-2, but these fail to achieve significance after correct- ing for multiple testing. Systematic and erratic depar- tures appear uncorrelated; heterogeneity in fixation is significant for 6-pgdh, Cpi, and Aut, which have low sys- tematic deviations, as well as for Sdh, Lap-2, Pgm, and Acon-1, which have larger systematic departures. Sig- nificant heterogeneity for fixation of linked allozyme loci (Aat-6-pgdh-Gpi and Acon-1-Pgm) is accompanied by concordance of fixation levels for these markers within families, whether over or under the expected value of 0.5 (see bottom of next section and Table 4).
Significant heterogeneity in fixation among families (Table 2) is not determined only by the systematic ef- fects of allozyme loci that are segregating within a fam- ily. This observation is made clear by contrasting how loci are contributing to overall fixation in the two fami- lies that are overfixed ( i .e. , losing too much heterozy- gosity) and the one that is underfixed ( i . e . , retaining heterozygosity). The two families that are significantly underfixed, 89-1 and 89-6, are indeed segregating for some loci that tend to be systematically underfixed (A& Mp-1, Zdh-2, and Lap-2). These loci surely contrib ute to the overall significance of the reduction in fixa-
tion in the family. However, in family 89-1, 7 of 12 progeny are heterozygous for Dap-2, a locus that tends to be overfixed. Similarly, the one family that is signifi- cantly overfixed, 89-4, is segregating for 10 loci, includ- ing 3 that meet expectation, 5 that are erratically fixed, and Lap-2, the only locus that is significantly underfixed on average. The three that meet expectation do not contribute much. The five erratic loci all show defi- ciencies of heterozygotes while at Lap-& the locus that shows systematic underfixing, only 3 of 10,89-4 progeny are heterozygous.
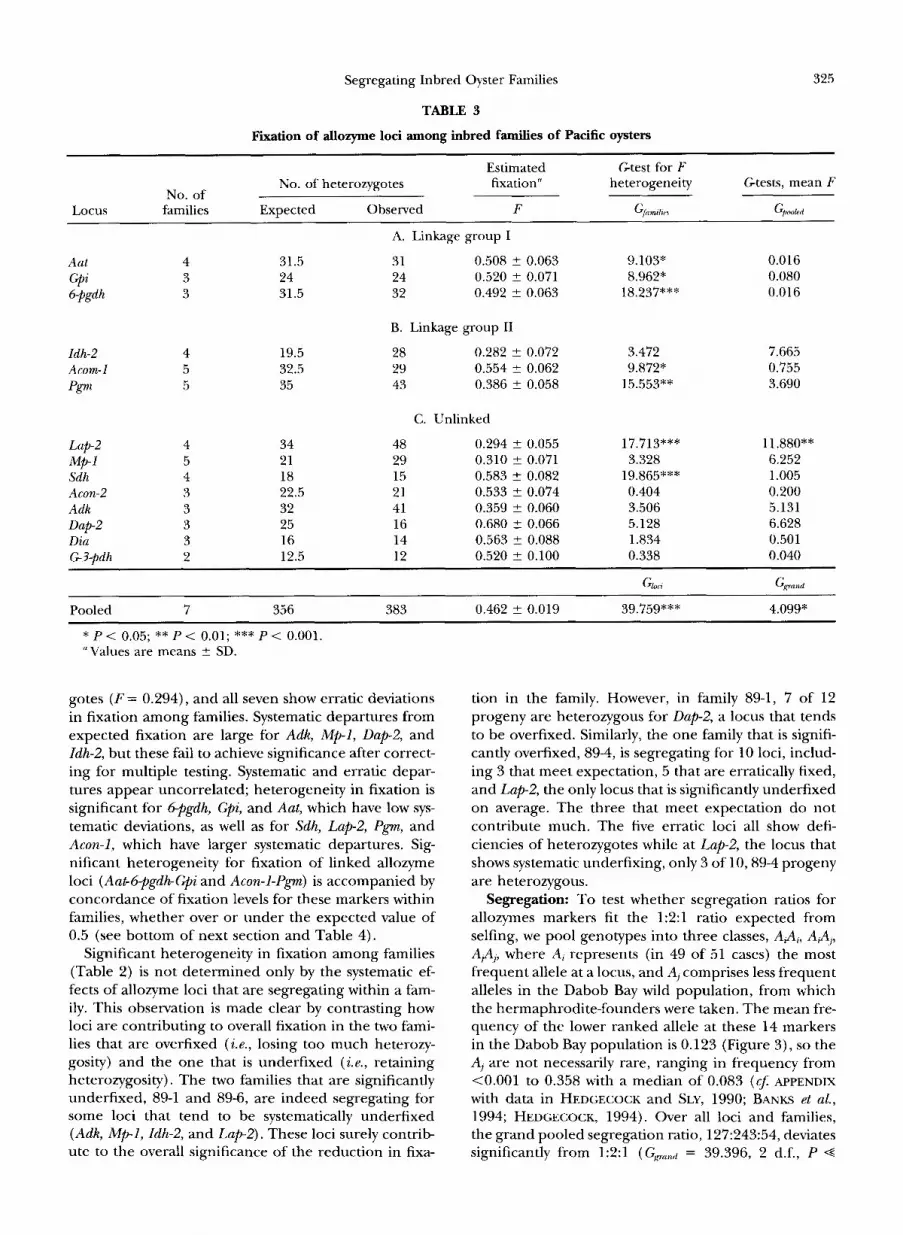
Segregation: To test whether segregation ratios for allozymes markers fit the 1:2:1 ratio expected from selfing, we pool genotypes into three classes, A& AJ$, A4,, where Ai represents (in 49 of 51 cases) the most frequent allele at a locus, and A, comprises less frequent alleles in the Dabob Bay wild population, from which the hermaphrodite-founders were taken. The mean fre- quency of the lower ranked allele at these 14 markers in the Dabob Bay population is 0.123 (Figure 3), so the AI are not necessarily rare, ranging in frequency from <0.001 to 0.358 with a median of 0.083 ( c t APPENDIX
with data in HEDGECOCK and SLY, 1990; BANKS et al., 1994; HEDGECOCK, 1994). Over all loci and families, the grand pooled segregation ratio, 127:243:54, deviates significantly from 1:2:1 ( GAWmrLd = 39.396, 2 d.f., P 4

326 D. J. McGoldrick and D. Hedgecock
systematic D
0.0000001
o.ooooo1 1
0.1
Idh-1
1 I 0. I 0.01 0.001 o.wo1
p{cpooledI
FIGURE 1.-Fixation of loci over families, presented as a bivariate plot of probabilities in Gtests for systematic (PIGpwM/) and erratic (P/Gfamtlzes/) departures from expected fixation of 0.5. The dotted lines indicate nominal significance levels, the solid line indicates an experiment-wide significance threshold for Gpoolpn corrected for 14 testS (0.00366). Several loci are significantly erratic in fixation while Lap2 shows sys- tematic underfixing, with a significant erratic fixation re- sponse over families. The magnitude of erratic responses is colinear with the known gene orders for 6-pgdh, G p i , and Aut, as well as Pgm, Acon-I, and Zdh-2 (see Table 1).
0.001), with an overall bias against homozygotes for the allele of lesser frequency in the natural population (Table 4). Indeed, the grand pooled numbers of homo- zygotes for the common allele and heterozygotes are in a ratio, 127:243, that is not significantly different than 1:2 (goodness-of-fit x2 = 0.16, 1 d.f.), suggesting that the deviation from the expected pooled segregation ratio of 1:2:1 results from a pervasive deficiency of ho- mozygotes for less frequent alleles. Segregation ratios are significantly heterogeneous among the seven first- generation inbred families (C;fnmtljuT = 100.835, 12 d.f., P -G 0.001). Five of the seven families (89-1, 89-3, 89-4, 89-5, and 89-6; see Table 4) have significant departures from the expected 1:2:1 ratio. Families 89-1 and 89- 6, which are significantly underfixed (Table 2), show corresponding, substantial excesses of heterozygotes. Family 89-4, which is significantly overfixed, has the most extreme bias of any family towards homozygotes for the common allele.
Analyses of segregation ratios by locus, pooled over families, reveal significant departures, either systematic, erratic, or both, for 11 of 14 loci (Table 4). We consider each locus to represent a unique test of a segregation hypothesis because loci are segregating for different alleles and may form different multilocus associations; thus, the significance levels of the tests are the nominal, a = 0.05 level in Table 4 and Figure 2. System- atic and erratic departures from the expected 1:2:1 seg- regation ratio at each locus are more pronounced than the deviations from expected 0.5 fixation ( CJ Figures 1
and 2). Exact tests for segregation within families that are significant at or above the P = 0.05 threshold are indicated in bold, and the significance levels of Gtests for heterogeneity of segregation are noted with asterisks (Table 4). As for fixation, we can infer that heterogene- ity in segregation ratios across families is not solely caused by the particular loci segregating in families. Indeed, significant effects at a locus in a particular fam- ily can run counter to the overall trends for that locus; for example, Gpi is heterozygous in seven of eight 89-6 progeny despite an overall segregation ratio of 11: 11: 1 across a total of three families. Genotypic ratios in the second-generation family, 92-89-5, are also significantly different from Mendelian expectations for 4 of 11 suf- ficiently sampled segregating loci ( P p , Acon-1, Lap-2, and Dap-2 Table 5).
Taking into account chromosomal linkage, we find that reductions in the homozygote for the rarer allele occurs globally in the pooled ratio, on both linkage groups, and for the third unassigned group, being (35:48:6) in the linkage group containing Aut, and (32:’i’l:ll) on the linkage group containing Idh-2, and (60:124:37) for the set of unassigned markers. Testing 1 2 1 segregation ratios within Iinkage groups reveals that three of four families fail systematically for one linkage group, and two of seven families for the other- or 5 of 14 total unique tests that fail (Table 4). There is no heterogeneity for the segregation of allozyme markers within the linkage group Aat-Gp;G$~gdh, or Zdh- 2-Acon-1-Pp (Table 4).
DISCUSSION
We have four major observations in these inbred progenies that must be explained: (1) Fixation and seg- regation of allozymes after inbreeding are distorted from neutral expectations. (2) Overall, there is a slight excess of heterozygotes, but fixation and segregation are extremely heterogeneous among families and loci. (3) The majority of significant effects are accounted for by two linkage groups and the magnitude of the effect appears colinear with the most probable gene order. (4) We observe very strong selection against rarer allo- zyme alleles. These observations cannot be attributed to contamination or lack of statistical power.
Deviations from the expected Mendelian segregation of allozymes are not uncommon in bivalves, having been reported in random pair-crosses of American oysters C. uirginicu (FOLTZ 1986; HU et al. 19931, Pacific oysters (THIRIOT-QUIEVREUX et al. 1992), and the mus- sel Mytilus edulis (BEAUMONT et al. 1983). In our study, the pervasive deficiency of homozygotes for rarer alleles implies strong selection. If a genotypic ratio of 127:243:54 were observed in the first generation after selfing at a single locus with complete dominance, a reduction in the frequency of the recessive allele as large as that observed for the pooled Aj allele, from 0.5 to 0.4, would imply a relative fitness for the rare

Segregating Inbred Oyster Families
TABLE 4
Segregation of allozyme loci in inbred families of the Pacific oyster
327
Family
89-1 89-3 89-4 89-5 89-6 89-7 92-1 Marginal
A. Linkage group I
Ant 4 7 2 - - - 8 2 0 2 3 0 1 7 0 - - - - - - 15 19 2* cpi - " " - 8 2 0 2 2 1 1 7 0 - - - - - - 11 11 1* dpgdh 0 14 1 - - - 8 2 0 1 2 2 " " " _ " 9 18 3***
Pooled 4 21 3 - - - 24 6 0 5 7 3 2 1 4 0 - - - - - - 35 48 6***
B. Linkage group I1
Idh-2 3 1 2 0 1 6 4 - - - - - - 1 7 0 " - 0 3 2 5 28 6* Acon-1 - - - 3 8 0 6 4 0 0 4 1 - - - 2 5 0 1 3 1 12 24 2** Pgm - - - 3 6 2 9 1 0 2 3 0 - - - 1 5 0 0 4 1 15 19 3***
Pooled 3 12 0 7 20 6 15 5 0 2 7 1 1 7 0 3 10 0 1 10 4 32 71 11***
C. Unlinked
L a p 2
Sdh Acon-2 Adk D a p 2 Dia G 3 9 d h
MP1 0 1 5 0 - - 2 7 0 4 7 0 1 0 2 "
1 1 1 3 2 9 2 7 3 "
2 6
_ " "
_ " " - _ -
7 3 0 0 7 3 8 0 2 6 4 0
- _ - 3 6 1
0 3 2
4 1 0 3 2 0 4 1 0 0 1 4 1 3 0 3 2 0
" - ""
1 3 2 0 - 0 2 4 ""
- " - - 1 2 3 - 2 2 3
2 -
3 -
9 24 2*** 9 29 4***
12 13 8*** 9 8 3** 7 21 3** 3 10 10 6 11 4 5 8 3
Pooled 5 50 8* 8 22 3 27 17 6*** 15 11 8*** 0 6 1 6 8 10 2 5 3 60 124 37***
Grand 12 83 11* 15 42 9 63 31 6*** 22 27 10* 3 27 1 9 18 10 3 15 7 127 243 54***
Boldface in the body of the table indicates P < 0.05 for an exact test of the segregation ratio. Asterisks denote significant heterogeneity of the segregation ratio among families using a Gtest (* P < 0.05; ** P < 0.01; *** P < 0.001) Bolding in the margin indicates P < 0.05 for a Gtest of the pooled segregation ratio.
homozygote only one-third that of the dominant phe- notype (FALCONER 1989). The tendency to observe se- lection biases against rarer alleles in pair crosses is also not exclusive to this study. For example, deficiencies of homozygotes for the rarer esterase allele, (Est-D'") in M. edulis have been observed (BEAUMONT et al. 1983), and the authors hypothesized that the bias was attribut- able to unobserved linked deleterious agents. In loblolly pines, "severe survival selection against rare alleles" was similarly observed for both selfed and outcrossed progeny (BUSH and SMOUSE 1991), suggesting a taxo- nomic generality to the observations that have been made of bivalve molluscs.
The rarer allozyme alleles have frequencies in the natural oyster population that are orders of magnitude greater than the simple mutation-selection equilibrium frequency for recessive alleles generated at typical rates of mutation (CROW and KIMURA 1970). How do these rare alleles persist if they are apparently so strongly selected against when homozygous? This "rare allele" paradox implies that more complex forms of balancing selection are at play both in the natural population and in the inbred families. We therefore reject purifying selection directed against rare allozymes as a general mode of selection in our families.
Heterogeneity in fixation levels among families for
Aat, Acon-I, Gpi, La@, 6-pgdh, Pgm, and Sdh (Table 3) and in segregation ratios among families and markers (Table 4) suggests that selection is not operating di- rectly on the allozyme markers themselves. HU et al. (1993) observed a heterogeneous overdominant pat- tern in segregation ratios for Gpi in inbred families of C. virgznica and concluded that Gpi is linked to a reces- sive gene of major effect. Our results confirm this heter- ogeneity in the congener, C. gigas, and associate it with distortions at the Aat and 6-Pgdh loci (Figures 1 and 2 and below).
Linkage of allozymes has also been found in other studies. The linkage group containing Aat-GpCG-pgdh has been observed in families of C. gzgas (G. POCSON, personal communication; X. GUO, personal communi- cation) and in C. virgznica (FOLTZ 1986). The second linkage group Idh-2-Acon-1-Pgm, has not been reported previously. We note that the majority of significant sys- tematic and erratic departures from expected fixation and segregation are distributed on two linkage groups, accounting for five of seven significant tests for hetero- geneity of marker fixation across families, five of seven significant tests for systematic departures from the 1:2:1 segregation ratio, and 6 of 11 significant tests for hetero- geneity of segregation ratios across families. The sig- nificance thresholds of erratic effects appear to be co-
328 D. J. McGoldrick and D. Hedgecock
systematic D
Acond A'
................-
1 0. I
Mp-1 Aeon-I
Gpi Idh-2 A& .....................................
I , ' , , ' ' ' '
1 erratic
0.01 0.001 0.0001
P(Gpooled'
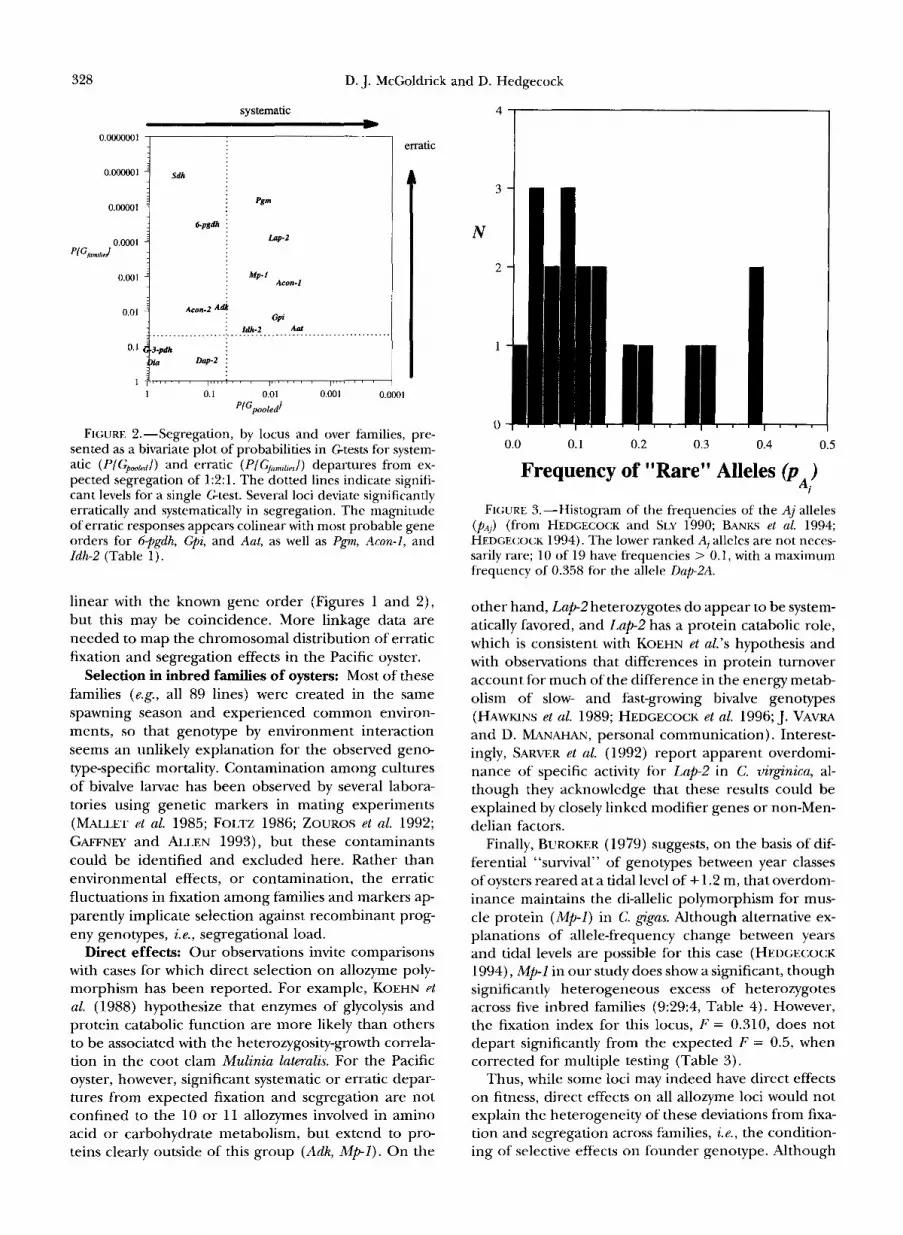
FIGURE 2.-Segregation, by locus and over families, pre- sented as a bivariate plot of probabilities in Gtests for system- atic (P{Gpmkd)) and erratic (P/GfamS,,/) departures from ex- pected segregation of 121. The dotted lines indicate signifi- cant levels for a single Gtest. Several loci deviate significantly erratically and systematically in segregation. The magnitude of erratic responses appears colinear with most probable gene orders for 6+gdh, Gpi, and Aat, as well as Pgm, Acon-1, and Zdh-2 (Table 1).
linear with the known gene order (Figures 1 and 2) , but this may be coincidence. More linkage data are needed to map the chromosomal distribution of erratic fixation and segregation effects in the Pacific oyster.
Selection in inbred families of oysters: Most of these families (e.g., all 89 lines) were created in the same spawning season and experienced common environ- ments, so that genotype by environment interaction seems an unlikely explanation for the observed geno- type-specific mortality. Contamination among cultures of bivalve larvae has been observed by several labora- tories using genetic markers in mating experiments (MALLET et al. 1985; FOLTZ 1986; ZOUROS et al. 1992; GAFFNEY and ALLEN 1993), but these contaminants could be identified and excluded here. Rather than environmental effects, or contamination, the erratic fluctuations in fixation among families and markers ap- parently implicate selection against recombinant prog- eny genotypes, i.e., segregational load.
Direct effects Our observations invite comparisons with cases for which direct selection on allozyme poly- morphism has been reported. For example, KOEHN et al. (1988) hypothesize that enzymes of glycolysis and protein catabolic function are more likely than others to be associated with the heterozygosity-growth correla- tion in the coot clam Mulinia lateralis. For the Pacific oyster, however, significant systematic or erratic depar- tures from expected fixation and segregation are not confined to the 10 or 11 allozymes involved in amino acid or carbohydrate metabolism, but extend to pro- teins clearly outside of this group (Adk, M P I ) . On the
4
3
N
2
L 0.0 0.1 0.2 0.3 0.4 0.5
Frequency of "Rare" Alleles (p ) Ai
FIGURE 3.-Histogram of the frequencies of the Aj alleles (p,.]) (from HEDGECOCK and SLY 1990; BANKS et al. 1994; HEDGECOCK 1994). The lower ranked AI alleles are not neces- sarily rare; 10 of 19 have frequencies > 0.1, with a maximum frequency of 0.358 for the allele Dap-ZA.
other hand, Lap2 heterozygotes do appear to be system- atically favored, and Lap2 has a protein catabolic role, which is consistent with KOEHN et al.'s hypothesis and with observations that differences in protein turnover account for much of the difference in the energy metab- olism of slow- and fast-growing bivalve genotypes (HAWKINS et al. 1989; HEDGECOCK et al. 1996;J. VAVRA and D. MANAHAN, personal communication). Interest- ingly, SARVER et al. (1992) report apparent overdomi- nance of specific activity for Lap-2 in C. uirginica, al- though they acknowledge that these results could be explained by closely linked modifier genes or non-Men- delian factors.
Finally, BUROKER (1979) suggests, on the basis of dif- ferential "survival" of genotypes between year classes of oysters reared at a tidal level of -t 1.2 m, that overdom- inance maintains the di-allelic polymorphism for mus- cle protein (Mp-I) in C. @gas. Although alternative ex- planations of allele-frequency change between years and tidal levels are possible for this case (HEDGECOCK 1994), Mp-1 in our study does show a significant, though significantly heterogeneous excess of heterozygotes across five inbred families (9:29:4, Table 4). However, the fixation index for this locus, F = 0.310, does not depart significantly from the expected F = 0.5, when corrected for multiple testing (Table 3) .
Thus, while some loci may indeed have direct effects on fitness, direct effects on all allozyme loci would not explain the heterogeneity of these deviations from fixa- tion and segregation across families, i.e., the condition- ing of selective effects on founder genotype. Although

Segregating Inbred Oyster Families 329
one might hypothesize that conditioning on founder genotype merely reflects the heterogeneity of allozyme alleles at the level of amino acid or DNA sequence, selection of the observed magnitude should rapidly eliminate deleterious alleles from the outbred popula- tion and reduce the extant allozyme polymorphisms to just those alleles maintained by balancing selection. Moreover, direct effects do not explain the rare-allele effect.
Epistasis and association: Linkage of Aut, 6+gdh, and Gpi in C. gzgas leads us to expect that strong selection on any one of these loci might affect deviations in the fixation and segregation of the others, which appears to be the case (Figures 1 and 2). In Drosophila melanogas- ter, 6-pgdh and G69dh interact epistatically in vivo (EANES 1984) ; the interaction leads to high levels of 6- phosphogluconate, which then inhibits Gpi (KAHANA et al. 1960; KOEHN et al. 1983). If this interaction of 6-pgdh and Gbpdh occurs in cupped oysters and modulates 6-phosphogluconate levels, the fitness consequence of which (through inhibition of glycolysis) is further mod- ulated by variants at the Cpi locus, the opportunity for coevolution of Gpi and G-pgdh alleles exists. Allelic vari- ants might then be maintained in disequilibrium owing to linkage of Cpi and G-pgdh in C. gigas and C. virgnica. Perhaps, the Drosophila epistatic selection scenario is occurring in oysters, or bivalves in general, and is exhib ited as growth and survival differences for the whole linkage group (FOLTZ 1986), including Cpi (Hu et al. 1993), Aut (see SUGITA and FUJIO 1982), and 6-pgdh. Even so, this specific epistatic interaction would not solely account for our observations because allozymes on chromosomes without the 6-pgdh and Gpi loci had distorted segregation ratios, heterogeneity of fixation
and segregation across families, and selection against homozygotes for rarer alleles.
The pervasive distortions of fixation and segregation observed for allozyme loci could be explained by close linkage of these markers with a rather small number of genes having major effects on fitness. Evidence from oysters (FOLTZ 1986) and other bivalve species (BEAU- MONT 1994) leads us to suspect that certain specific linkage relationships for allozymes might be detected in further investigations. If syntenic relationships hold, and no chromosomal fissions, or translocation have oc- curred, Aut, Gpi, 6+gdh, Xdh, Lap-2, EsD, Mpi, and Odh may be on the same linkage group (BEAUMONT 1994) and hence may behave in correlated fashion in inbred families.
Lap, which is reported to be on the same linkage group as Gpi in the mussel Mytilus edulis (BEAUMONT 1994), has significant systematic and erratic departures from both expected fixation and segregation. It is possi- ble, for example, that balancing selection at or near the Lap-2 and Mp-1 loci and epistasis associated with 6- pgdh could explain most of our results. However, it is difficult to see how strong selection focused on a few agent loci or epistatic interactions could account for the rare-allele paradox. Further mapping of allozyme markers in large families is needed to resolve this issue.
Two classes of hypotheses appear to be capable of explaining all observations concerning fixation, segre- gation, and linkage of allozymes in inbred families of oysters. First are hypotheses that involve fitness genes distinct from, but linked to, allozyme loci. Second are hypotheses that involve the interactions of allozyme genes (including their promoters, signal sequences, and gene products) in various genetic backgrounds.
TABLE 5
Segregation of 11 allozymes in inbred Pacific oyster family, 92-89-5
Parental genotype Observed nos. Expected nos.
Locus Male 3 Female 4 '44, A A AP, A+% A/, N X 2
A. Linkage group I
Aut AD AA 15 12 - 13.5 13.5 - 27 0.333 cpi EE AE 14 13 - 13.5 13.5 - 27 0.037 69gdh AA AC 19 14 - 16.5 16.5 - 33 0.758
B. Linkage group I1 Acon-1 AC AC 21 5 1 6.75 13.5 6.75 27 40.333*** Pgm AB AA 9 24 - 16.5 16.5 - 33 6.818**
C. Unlinked
Lap2 AC cc 9 24 - 16.5 16.5 - 33 6.818** Acon-2 AB AA 12 13 - 12.5 12.5 - Adk
25 0.040
Dap-2 AA AB 21 6 - 13.5 13.5 - 27 8.333* Diu AD AD 2 3 6 2.75 5.5 2.75 11 G3,dh AB AB 5 4 0 2.25 4.5 2.25 9 5.667
5.182
AA AC 13 20 - 16.5 16.5 - 33 1.485
Family 92-89-5 is a second inbred generation made by mating full-siblings, male 3 and female 4 of family 89-5.

330 D. J. McGoldrick and D. Hedgecock
Associative overdominance: The associative over- dominance hypothesis attempts to explain correlation of allozyme heterogeneity and fitness traits by linkage of the allozyme to fitness genes having deleterious re- cessive alleles. In our inbred families, the associative overdominance hypothesis requires deleterious reces- sive mutations to be preferentially associated in cis con- figuration with rarer allozyme alleles in the natural pop- ulation (see ZOUROS 1993) because selfing of sampled heterozygotes produces segregation ratios that are sys- tematically deficient for the rarer homozygote classes. The hypothesis offers no explanation for why recessive fitness mutations are repeatedly and preferentially in cis configuration with rarer allozyme alleles. Random mutations to deleterious recessive alleles at fitness loci should arise more often in cis configuration with more common alleles; instead only two of 14 loci (Dap-2 and Zdh-2) show a bias against homozygotes for the more common allele (Table 4). Therefore, it is necessary to explain how deleterious recessive mutations became preferentially associated with rarer allozyme alleles in the natural population of oysters in Dabob Bay. Associa- tive overdominance cannot explain this rare allele para- dox nor the patterns underlying the heterogeneity of fixation and segregation among families. An alternative hypothesis, however, can explain the rare allele para- dox and the heterogeneity in the fixation and segrega- tion ratios of our inbred lines.
Regulatory epistasis: Let us suppose that selection is operating on a hierarchically structured, epistatic gene regulatory system (sensu HEDRICK and MCDONALD 1980). At the base of the hierarchy are “producer genes,” such as allozymes. At the top of this hierarchy are regulatory factors that modulate the expression of these “producer loci.” We do not suppose these regula- tory factors are necessarily genes, but at least the result of gene action, such as substrate that accumulates dur- ing metabolism (e.g., 6-phosphogluconate) or part of the structure of cells (e.g., molecular chaperones or membrane receptors). In these inbred lines, we suspect that responsive elements are linked in cis configuration with allozyme alleles and are coadapted with these regu- latory factors thus forming an interaction system (sensu WRIGHT 1969).
One example of such genetic elements would be pro- moters (of allozyme loci or promoters of genes closely linked in cis configuration to allozymes). We envision variation in promoter sequence that is linked to neutral structural differences in the products whose transcrip- tion the promoters control (see PAIGEN 1989). We pro- pose that rarer allozyme alleles are correlated with rarer promoter structures due to chromosomal linkage and the evolution of a multilocus systems. These promoters must be conditionally deleterious depending on ge- netic background and would persist in cis configuration for long periods of time. For example, if the recombina- tion fraction were 0.001 cM, gametic disequilibrium in the gene complex would only be reduced by half in 693
generations (years) and would still be 0.05 in 2994 years (LEWONTIN 1974), if recombination is not suppressed and there is no selection. The frequency bias for co- adapted promoter-gene complexes is maintained in- definitely by selection in a randomly mating population in the absence of stochastic forces.
Selective bias against homozygotes for rare alleles, under this hypothesis, is explained by a higher fre- quency of regulatory genetic backgrounds favoring A,- linked promoters. The system could exhibit an appar- ent intermediate A,A, heterozygote in a &favoring regu- latory genetic background and an overdominant Asl, in an i j background, while the A& preferring back- ground j j remains rare. Indeed, such dominance fluc- tuation across families was significant at unlinked allo- zyme loci 6-Pgdh, Lap-2, and Adk (Table 4). Family 89-1 is consistent with an i j genetic background, while family 89-4 is consistent with an ii genetic background. Furthermore, the fact that these three allozyme markers are unlinked suggests that chromosomal linkage might not be required to produce heterogeneity in the segre- gation and fixation of allozymes.
A further prediction under regulatory epistasis is that producer genes would exhibit greater segregational bi- ases due to selection than other classes of genetic mark- ers that do not interact with regulatory factors. Greater heterozygosity-growth correlation for protein markers rather than for RFLPs (POCSON and ZOUROS 1994) in Placopecten magellanicus (the deep-sea scallop) has been observed, but the authors concede that further data from diverse taxa is still needed before we can conclude that this is a general pattern.
The regulatory epistasis hypothesis also predicts a re- lationship between the magnitude of the fitness reduc- tion and the measures of gene expression in cells, e.g., specific messenger RNAs (mRNAs), allozyme amounts, or general protein content. This hypothesis is also con- gruent with the physiological observation that differ- ences in protein turnover can account for much of the difference in the metabolism of slow- and fast-growing bivalve genotypes (HAWKINS et al. 1989; BAYNE and HAWKINS 1995; HEDGECOCK et al. 1996). Under this hy- pothesis, the regulation of genome expression would give rise to changes in levels of transcription of proteins, including allozymes, which would then influence com- ponents of physiological energetics such as protein me- tabolism, (DAMERVAL. et al. 1994), oxygen uptake in adults and larvae (KOEHN and SHUMWAY 1982), and perhaps cellular stress response (J. S. CLEGG, personal communication), so as to produce metabolic load upon inbreeding, owing to loss of regulatory interactions. Other hypotheses could also produce such effects, e.g., protein localization signals might be variable and inter- act with protein translocation systems (SCHATZ and DOBBERSTEIN 1996).
Thus, a regulatory-epistasis hypothesis can explain all of the features of our data and makes several specific predictions. Many observable quantities (mRNA expres-

Segregating Inbred Oyster Families 331
sion differences, structural differences in promoters, protein expression differences, and higher correlation between allozyme markers and fitness-related re- sponses) can be measured and used to falsify a null hypothesis of regulatory-epistasis.
Conclusions: Clearly, this study requires more repli- cation. Studies of more families, with various levels of inbreeding, should be used to characterize fixation and segregation in Pacific oysters and other bivalves. Use of other DNA markers such as complementary DNA RFLPs (POCSON and ZOUROS 1994), anonymous single- copy nuclear DNA (KARL and AVISE 1993), EPIC PCR (PAI~UMBI and BAKER 1994), and microsatellites (WEBER and MAY 1989, MCGOLDRICK and HEDGECOCK 1996) will be beneficial for teasing apart the effects of direct selection on protein- or enzyme-coding genes from the effects of indirect selection on unobserved linked loci. Saturation of the genome with multiple markers will help to define how and where selection distorts fixation and segregation of different marker classes.
Two of the three major shortcomings of previous studies are alleviated in this study. We avoided variation in ecological and evolutionary histories by working within a deme, in common environments, and by using a common ancestral stock. We addressed variation in levels of gametic phase disequilibrium by replicating self-fertilizations to produce progeny with the same ex- pected inbreeding level. We did not, however, screen all of the allozymes that have been used in other studies of bivalves and, in light of our results, limitation in the number and genomic distribution of markers is a significant constraint to understanding how selection operates. Nevertheless, we conclude that fixation and segregation of allozymes are substantially distorted by strong selection in inbred oyster families. Mapping of QTL for growth, growth physiology, and survival in F2 hybrid and backcross generations resulting from crosses among these inbred lines are presently underway to test alternative hypotheses for heterosis (HEDGECOCK et al. 1996). The association of allozymes and QTL for these traits is of great interest.
We thank GANG LI for helping conduct portions of the allozyme electrophoresis and WII.I. BORCESON for help in oyster husbandry. We also thank CHAKLEs LANGL.EY, PHII. HEDRICK, GRANT POCSON, and PAT GnFFNEY for commenting on an earlier draft of this manuscript. This work was supported by grants from the U.S. Department of Agriculture's Western Regional Aquaculture Consortium and the Na- tional Research Initiative Competitive Grants Program (92-37206- 8003).
LITERATURE CITED
ALLARU, R. W., 1956 Formulae and tables to facilitate the calculation of recombination values in heredity. Hilgardia 24: 235-278.
BANKS, M. A,, D. J. MCGOLDRICK, W. BORCESON and D. HEDGECOCK, 1994 Gametic incompatibility and genetic divergence of Pacific and Kumamoto oysters, Crassostrea gzga and C. Sikamea. Mar.
BEAUMONT, A. R., 1991 Genetic studies of laboratory reared mus- sels, Mytilus edulis: heterozygote deficiencies, heterozygosity and growth. Biol. J. Linn. Soc. 44: 273-285.
Biol. 121: 127-135.
BEAUMONT, A. R., 1994 Linkage studies in Mytilus edulis, the mussel. Heredity 72: 557-562.
BEAUMONT, A. R., C. M. BEVERIDCE and M. D. BUDD, 1983 Selection and heterozygosity within single families of the mussel Mytilus edulis (L.). Mar. Biol. Lett. 4: 151-161.
BLANC, F., and F. BONHOMME, 1987 A genetic bases of species im- provements in aquaculture: polymorphism6 gen6tique des popu- lations naturalles de mollusques d'interet aquicole, pp. 59-78 in Srlection, Hybridization and Genetic Engznem'ng in Aquaculture, edited by K. TIEWS. Vol. I, H. Heenemann GmbH and Co., Berlin.
BUROKER, N. E., 1979 Overdominance of a muscle protein ( M p I ) locus in theJapanese oyster, Crassostrea gigas (Ostreidae). J. Fish. Res. Board Can. 3 6 1313-1318.
BUROKER, N. E., W. IC HERSHBERGER, and K.K. CHEW, 1979 Popula- tion genetics of the family ostreidae. I . Intraspecific studies of Crassostrea @gas and Saccostrea rommerrialis. Mar. Biol. 54: 157- 169.
BUSH, R. M., and P. E. SMOUSE, 1991 The impact of electrophoretic genotype on life history traits in Pinus taedu. Evolution 45: 481 - 498.
CHEW, K. K, 1979 The Pacific oyster (Crassostrea gzgas) in the west coast of the United States, pp. 54-82 in Exotic Species in Maricul- ture, edited by R. " V N . MIT Press, Cambridge, MA.
CROW, J. F., and M. KIMURA, 1970 A n Introduction toPupulatzon Chwt- ics Theo7y. Alpha Editions, Edina, MN.
DAMERVAL, C., A. MAURICE, J. M. JOSSE and D. DEVIENNE, 1994 Quan- titative trait loci underlying gene product variation: a novel per- spective for analyzing regulation of genome expression. Genetics 137: 289-301.
EIZNES, W. F., 1984 Viability interactions, in vivo activity and the G6PDpolymorphism in Drosophila melanogastrr. Genetics 106: 95- 107.
FALCONER, D. S., 1989 Introduction to Quantitative Genetics. John Wiley and Sons Inc., New York.
FOLTZ, D. W., 1986 Segregation and linkage studies of allozyme loci in pair crosses of the oyster Crassostrea uirgznica. Biochem. Genet.
FUJIO, Y., 1982 A correlation of heterozygosity with growth rate in the Pacific oyster, Crassostrta gigas. Tohoku J. Agric. Res. 33: 66- 75.
FUJIO Y., R. YAMANAKA and P. SMITH, 1983 Genetic variation in ma- rine molluscs. Bull. Jpn. Soc. Sci. Fish. 49: 1809-1817.
GAFFNEY, P. M., 1990 Enzyme heterozygosity, growth rate, and viabil- ity in Mytilzls edulis: another look. Evolution 44: 204-210.
GAFFNEY, P. M., 1994 Heterosis and heterozygote deficiencies in ma- rine bivalves: more light? pp. 146-153 in Cmetics and Euolution of Aquatic Organisms, edited by A. R. BEAUMONT. Chaplnan & Hall, London.
GAFFNEY, P. M., and S. K. ALLEN, 1993 Hybridization among Crassos- trea species: a review. Aquaculture 116: 1-13.
GAFFNW, P. M., and T.M. SCOTT, 1984 Genetic heterozygosity and production traits in natural and hatchery populations of bivalves. Aquaculture, 42: 289-302.
GAFFMY, P. M., T. M. SCOTT, R. K. KOEHN and W. J. DIEHI., 1990 Interrelationships of heterozygosity, growth rate and heterozy- gote deficiencies in the coot clam, Mulinin latwalis. Genetics 124:
GARTON, D. W., R. K. KOEHN and T. M. SCOTT, 1984 Multiple locus heterozygosity and the physiological energetics of growth in the Coot clam, Mulinia lateralis, from a natural population. Genetics 108: 445-455.
GILLESPIE, J.H., and C. H. L~NCIEY, 1974 A general model to ac- count for enzyme variation in natural populations. Genetics 76:
HAWKINS, A. J. S., B. L. BAYNE, A. J. DAY, J. RUSIN and C. M. WORRAI., 1989 Genotype-dependent interrelations between energy me- tabolism, protein metabolism and fitness, pp. 283-292 in Rfpm duction, Gmetics and Distributions of Marine Organisms, edited by J. S. RYIAND and P. A. TYLER. Olsen & Olsen, Fredensborg, Den- mark.
HEDGECOCK, D., 1994 Does variance in reproductive success limit effective population sizes of marine organisms? in Genetics and Euolution ofAquatic Organisms, edited by A. R. BEAUMONT. Chap- man & Hall, London.
HEDGECOCK, D., and F. SIX, 1990 Genetic drift and effective popula- tion sizes of hatchery-propagated stocks of the Pacific oyster Cms- sostrea gigas. Aquaculture 88: 21-38.
24: 941-956.
687-699.
837-848.

332 D. J. McColdrick and D. Hedgecock
HEDGECOCK, D., D. J. MCGOLDFXK and B. L. BAYNE, 1995 Hybrid vigor in Pacific oysters: an experimental approach using crosses among inbred lines. Aquaculture 137: 285-298.
HEDGECOCK, D., D. J. MCGOI~DRICK, D. T. MANAHAN, J. VAVRA, N. APPELMANS et aL, 1996 Quantitative and molecular genetic anal- ysis of heterosis in bivalve molluscs. J. Exp. Mar. Bid. Ecol. 203: 49-59.
HEDRICK, P. W., and J. F. MCDONAIB, 1980 Regulatory gene evolu- tion. Heredity 45: 85-99.
HII.BISII, T. J., B. L. BAYNE and A. DAY, 1994 Genetics of physiologi- cal differentiation within the marine mussel genus Mytilus. Evolu- tion 48: 267-286.
H L ~ , Y-P., R. A. LUTZ and R. C. VRI[ENHOEK, 1993 Overdominance in early life stages of an American oyster strain. J. Hered. 84: 254-258.
KA(:SER, H., and J. A. BURNS, 1981 The molecular basis of domi- nance. Genetics 97: 639-666.
KAH;\NA, S. E., 0. H. LOWRY, D. W. ScHr!r.Z,J. V. PASSONNEA and E. J. CRAWFORD, 1960 The kinetics of phosphoglucoisomerase. J. Biol. Chem. 235: 2178-2184.
KARI., S. A,, and J. C. AVISE, 1993 PCR-based assays of Mendelian polymorphisms from anonymous single-copy nuclear DNA- techniques and applications for population genetics. Mol. Biol. Evol. 10: 342-361.
KOEHN, R. K., and S. E. SIfLTMWAY, 1982 A genetic/physiological ex- planation for differential growth rate among individuals of the American oyster Crassostrru uirgznica (Gmelin). Mar. Biol. Lett. 3: 35-82.
KOEHN, R. K., ZERA, A. J. and J. G. HAIL, 1983 Enzyme polymor- phism and natural selection, pp. 115-136 in Euolution of Gene3 and Protrins, edited by M. NEI, and R. K. KOEHN. Sinauer Assoc., Sunderland, MA.
KomfN, R. K., W. J. DIEHI. and T. M. SCOTT, 1988 The differential contribution by individual enzymes of glycolysis and protein ca- tabolism to the relationship between heterozygosity and growth rate in the Coot clam, Mulinia laterulis. Genetics 118: 121-130.
KOROI., A. B., 1. A. PREYGEI. and S. 1. PREYGEL, 1994 firombinational t'un'ability and Evolution. Chapman & Hall, New York.
KOSAMBI, D. D., 1944 The estimation of recombination values. Ann. Eugen. 12: 172-175.
LEM'ONTIN, R. C., 1974 Thr Grnetir Basis of Evolutionafy Change. Co- lumbia University Press, New York.
MAILET, A. L., E. ZoURos, K. E. GARTNER-KE.PKAY, K. R. FREEMAN and I,. M. DICKIE, 1985 Larval viability and heterozygote deficiency in populations of marine bivalves: evidence from pair matings o f mussels. Mar. Biol. 87: 165-172.
MCGOI.I)RI(:K D:]., and D. HEDG~:CO(:K, 1996 Microsatellite develop- ment in the Pacific oyster Crassostrta gzgas (Thunberg). J. Shell- fish Res. 15: .512.
NEVO, E., A. BF,II.ES and R. BEN-SHLOMO, 1984 The evolutionary significance of genetic diversity: ecological, demographic and life
history correlates, pp. 13-213 in Evolutionaly Dynamics of Genetic. Diversity, edited by G. S. MANI. Springer-Verlag. Berlin.
PAIGEN, K., 1989 Experimental approaches to the study of regula- tory evolution. A m . Nat. 1 3 4 440-458.
P.U.LIMBI. S. R., and C. S. BAKER, 1994 Contrasting population struc- ture from nuclear sequences and mtDNA of humpback whales. Mol. Bid. Evol. 11: 426-435.
POGSON, G. H., 1991 Expression of- overdominance for specific ac- tivity at the phosphoglucomutase-2 locus in the Pacific oyster, Crassostrea gigas. Genetics 128: 133-141.
POGSON, G. H., and E. ZOUKOS, 1994 Allozyme and RFLP heterozy- gosities as correlates of growth rate in the scallop I'laroprctm magullanicus-a test of the associative overdominance hypothesis. Genetics 137: 221-231.
SARVER, S. K., M. KAI'OH and D. W. FOI.TZ, 1992 Apparent overdomi- nance of enzyme specific activity in two marine bivalves. Genetica 8 5 231-239.
SCHATL, G., and B. DORBERSTEIN, 1996 Common principles of pro- tein translocation across membranes. Science 271: 1519-1526.
S1iw;tr, S. M., and E. ZOLTROS, 1978 Genetic variation associated with growth rate in the American oyster (Cmssoslrea uirginzra). Evolu- tion 32: 342-353.
SOW., R. R., and J. F. ROHII, 1981 Biometq. W.H. Freeman and Company, New York.
SLwr.a, M., and Y. Fryro, 1982 Effects of genotypes at the Ant-1 locus on the survival and growth rates in the cultured oyster. Tohoku J. Agric. Res. 33: 42-49.
THIRIOT-YUIEVREL'X, C., G. H. POCSON, and E. ZOL'ROS, 1992 Genet- ics of growth rate variation in bivalves: aneuploidy and heterozy- gosity effects in a Crassostrea gigas family. Genome 35: 39-45.
WEBER, J. L., and P. E. MAY, 1989 Abundant class of human DNA polymorphisms which can he typed using the polymerase chain reaction. Genetics 44: 388-396.
WRI(xrT, S., 1917 Coefficients of inbreeding and relationship, A m .
Nat. 51: 545-5511. WRIGIIT, S., 1969 Luolution and thr Grnrtics ofPopulationr, Vol. 2. The
University of' Chicago Press, Chicago. ZOUROS, E., 1993 Associative overdominance: evaluating the effects
of inbreeding and linkage disequilibrium. Genetica 89: 35-46. ZOUROS, E., and D. W. FOI.TZ, 1987 The use of allelic isozyme varia-
tion for the study of heterosis. Isozymes Curr. Top. Bid. Med.
ZOCROS, E., and G. H. POC;SON, 1994 Heterozygosity, heterosis and adaptation, pp, 135- 146 in CPnetirs andEuolution ofilquatir Organ- isms, edited by A. R. BEAUMONI'. Chapman & Hall, London.
ZOUROS, E., S. M. SIN(;H and H. E. MILES, 1980 Growth rate in oysters: an overdominant phenotype and i ts possible explana- tions. Evolution 34: 896-867.
ZOLJROS, E., K. R. FREEMAN, A. 0. BAI.I. and G. H. POGSON, 1992 Di- rect evidence for extensive paternal mitochondrial DNA inheri- tance in the marine mussel Mytilus. Nature 359: 412-414.
Res. 13: 1-59.
Communicating editor: D. CHARLESWORI'II

Segregating Inbred Oyster Families 333
Appendix
Genotypes for 99 progeny and inferred genotypes for hermaphroditic founders of seven inbred families of Pacific oysters:
Locus
89-9
894
89-5
Family Individuals
89-1 0
1
2 3
4
5
6
7
8
9
10
11
I:!
13
14
15
16
17
18
n 1
2 9
4
3
6
7 x 9
10
11
12 0
1
2 9
4
1
6
7 x 9
I n 0
1
2 3
4
5
92-89-5 6
7 8
Y
In
Sex" 1 2 3 4 5 6
M / F M
M
M
F
F
F
M -
- M
F
F
F
F
F M
M
M
M / F F
F
F
F
F
F
F
F
F
F
F -
M / F M
M
M
F
F
F
M
F - -
M/F F
F
M
F -
M M M -
-
AD AD AA AD AD AD DD AD AA DD AD AD AA AA . .
. .
cA AD AA DD AD DD DD DD DD DD DD DD DD DD DD DD AD AA AA AA AA AA AD AD AA AA AA AD AA AD AD AA AD AD AD AA AA AD
AA AA AA AA AA AA AA AA AA AA AA AA AA . .
. .
. .
. .
. .
AB Ac AB AB AA AB AB AA AB AB AA AB AB AC AA AA AA AC AC AC AC AA AA AA AC CC AC AC AC AC AA AA AA AA AA
. .
AA AA AA AA AA AA AA AA AA AA AA . .
AA . . . . . . . .
. .
AA AC AA AA AA AA AA
. .
AA AA AA AA AA AB AA AB AA AB AA AA AB AA AA AB AB AB AA AB AA AA AB AA AA AB
. .
. .
AC AC AC AC AA CC
CC AC AC CC
AC AC AC AC AC AC bC
AA AC AD cc AD AA AD AA AD AD AD AD AD AD AD AA AA AA AA AA AA AA AA AA AA AA AC AA AA AA AC AA AA AC AC AC AC
DD DD DD DD DD DD DD DD Dn DD DD DD DD . .
. .
. .
. .
. .
AA AD AA AA AA AA AA AA AA AA AA AA AA AD AD AA AA AD AD AD AD AD AA DD AD
. .
AD AD AD AA DD DD AD
. .
. .
. .
AA . . . . . . . . . .
AA AA AA AA AA AA AA AA AA AB BB BB AB AB AB AB BB AA BB AB BB AB AB AA AB AA AA AA AA AA AA AA AA AA AA AA AB AA AA AB AB AA AA AB AA
. .
AA AA AA AA AA AA AA AA AA AA AA AA AA . .
. .
. .
. .
. .
AA AA AA AA AA AA AA AA AA AA AA AA AA AE AA AA AA AA AA AE AE AA AA AA AE AA AE EE AE AA EE AE EE AE EE
. .
AB AA AB AB AB AA AB AB BB AA AB AB BB . .
. .
. .
. .
. .
BB AA BB BB BB BB BB BB BB BB BB BB BB AA AA AA AA AA AA AA AA AA AA AA AB AA AA AA AB AA AA AA AB AB AA
. .
AB AB AA AB AB AB AB AB AB AA AB AB AB AB AB AA AB AA AA AB AA AB AB BB AA AB BB BB AB BB AB AB AA AA AA AA AA AA AA AA AA AA AA AA AA AA AA AA AA AA AA AA
AF AF AF AF AF AF AF AF AF AF FF FF AF AF AF AF bF Ad Ad AA AA AA AA AA AA AA AA AA AA AA AA AA AF AA AF AA AA AF AF AA AA AA AA AF FF AF AF FF AF AF AF FF AF FF
AC AC AC AC AC AC AC AC AC AC AC AC AC cc AC
AC AA AA AA AA AE AA AA AA AA AA AA AA AA AA AA AA AC AA AC AA AA AA AA AA AA AA AC A c CC
CC AA AC AC AA AC AA AA AA
AA AA AA AA AA AA AA AA AA AA AA AA AA AA AA AA AA AB AC AE AA AE AE AA EE EE AA AE AE AA AE AE AB AA AA PA AA AA AA AA PA AA AB AB AA AB AB AA AB AB AB AB AB AB
AB . . . . . . . . . .
AB BB AB AB AB AB AB BB AB AB
. .
. . AB AB AA AB AB AB BB AB AB AB BB BB AB BB AB AA AB AB AB AB AB AB AA AA AB BB BB BB BB BB BB BB BB BB . . . .
AC AC AC AC CC
AC CC
AC AC AC AC AC AC . . . . . . AA ee
eA AA . . . . AA AA AA AA AA AA AA AA AA AA AE AA AA EE AA AA AA EE AA AA AA AC AA AA AA AC AA AC AA AC . . . .

334 D. J. McGoldrick and D. Hedgecock
Appendix
Continued
Family Illdividuals Sex” 1 2 3 4 5
89-6
89-7
92-1
11
12 I3
14
15
16
17
18
19
2 0 21 22 23
24 25
26
27 28 29 50
31
32 33
34
35 36
37 38
0
1
2 3
4
7
6
7 8
0
1
2 3
4
5 f i
7 X
0
1
2 3 4
5
AD
AA
AD
AA
AA
AA
AA
AA
AA
AA
AA
AD
AD
AA
AD
AD
AA
AD
AD
AD
AA
AA
. .
. .
. .
. .
. .
. . CD
CD
CD
CD
cn CD
CD
DD
CD
AA
AA
AA
AA
AD
AA
AA
AA
AA
AA
AA
AA
AA
AA
AA
A C
AA
AA
AA
A C
A C
A C
AA
AA
AA
AA
AA
AA
AA
AA
CC
AA
AA
A C
AA
AA
AA
. .
. .
. .
. .
. .
. . AA
AA
AA
AA
AA
AA
AA
AA
AA
A C
AA
A C
A C
AA
A C
A C
A C
AA
A C
A C
AC
CC
A C
AA
AA
AA
AA
AB
AB
A B
AA
. . A B
AA
A B
A B
A B
A B
A B
A B
AB
AA
AA
AA
AA
AA
. I
. .
. .
. .
. .
. . AA
AA
AA
AA
AA
. . AA
AA
AA
AA
AA
AA
AA
AA
AA
AA
AA
AA
A B
B B
AB
B B
B B
A B
AA
A C
A C
AA
A C
AA
A C
AA
A C
A C
A c A C
AA
AA
AA
A C
AA
A C
AA
A C
A C
A C
A C
A C
AA
AA
A C
AA
AA
AA
AA
AA
AA
AA
AA
AA
AA
AA
AA
AA
AA
AA
AA
. . AA
. . AA
AA
AA
AA
AA
AP
. .
. .
. .
. .
. .
. .
. .
. .
. .
. .
. .
. .
. .
. . AA
AA
AD
AD
DD
DD
DD
DD
. .
. .
. .
. .
. .
. . AA
AA
AA
AA
AA
AA
AA
AA
AA
AD
AD
AD
AA
AA
D n
nn DD
AA
AA
AA
AA
AA
AA
AA
ti 7 8
. .
. .
. .
. .
. .
. .
. .
. .
. .
. .
. .
. .
. .
. .
. .
. .
. .
. . A B
A B
AA
AA
A B
AA
AA
AA
AA
AA
AA
AA
AA
AA
AA
AA
AA
AA
AA
AA
AA
AA
AA
AA
. .
. .
. .
. .
. .
EE
A E
EE
A E
A E
A E
EE
EE
A E
A E
A E
EE
A E
EE A E
EE
A E
EE
EE
A E
EE
EE
. .
. .
. .
. .
. .
. . A E
A E
A E
A E
A E
A E
A E
AA
A E
AA
AA
AA
AA
A E
AA
AA
AA
AA
. .
. .
. .
. .
. .
. .
AA
AA
A B
AA
AA
AA
AA
AA
A B
AA
A B
AA
AA
A B
AA AA
AA
A.4
AA
AA
AA
.4 A
. .
. .
. .
. .
. .
. . AA
AA
AA
AA
AA
AA
AA
AA
AA
A B
AA
AA
A B
AA
AA
. . B B
A B
AA
AA
AA
AA
AA
AA
IO 11 12 i:4 14
. .
. .
. .
. .
. .
. .
. .
. .
. .
. . AA
AA
AA
AA
AA
AA
AA
AA
. .
. .
. .
. .
. .
. . A B
A B
A B
A B
A B
AB
A B
A B
AA
AA
AA
AA
AA
AA
AA
AA
AA
AA
A B
A B
B B
A B
BE A B
A E’
A F
A F
A F
A F
FF
A F
FF
A F
FF
FF
A F
FF
A F
A F
A F
A F
A F
A F
FF
A F
FF
A F
A F
A F
A F
A F
A F
AA
.4A
AA
AA
A.4
AA
AA
AA
AA
AA
AA
AA
AA
FF
AA
. . AA
AA
A F
A F
AA
A F
AA
A F
AA
A C
AA
A C
A C
AA
AA
AA
A C
A C
A C
AA
AA
AA
A C
A C
A C
AA
AA
A C
AA
AA
AA
AA
AA
A C
A C
A C
AA
AA
AA
AA
AA
AA
AA
AA
AA
AA
AA
AA
AA
A C
AA
AA
AA
AA
. .
. .
. .
. .
. .
. .
AA
A B
4 E
AA
AB
AA
AA
A B
A B
A B
AB
AA
AA
AA
A B
AA
A B
AB
AA
AB
AB
AB
A B
A B
A B
A B
AB
A n
AA
AA
AA
AA
AA
AA
AA
AA
AA
A i
AA
A I
A 1
A b
A I
. . A T
A I
mi
DH D H
DD
DH
DH
. .
. .
. .
. .
. .
. .
. .
. .
. .
. .
. .
. .
. .
. .
. .
. .
. .
. . BE
B E
B E
B E
B E
BB
A B
AB
AB
AB
A B
. . AB
AB
AA
AH
AB
B E
A B
RH
AB
. . BB
. .
. .
. .
. .
. .
. .
. .
. .
. .
. .
. .
. .
. .
. .
. .
. .
. .
. .
. .
. .
. .
. .
. .
. .
. .
. .
. .
. .
. .
. .
. .
. .
. .
. .
. . EE
EE
Eti
EF: EE
EE
EE
EE
EE
A E
A 4
A B
AB
AA
AA
. . AA
AA
. .
. .
. .
. .
. .
. .
“Loci numbered in order: (1) Aut, (2) Acon-1, (3) Acon-2, (4) Adk, (5) Diu, (6) G3pdh, (7) Gpi, (8 ) Dup2, (9) Zdh-2, (10) Lap 2, (11 ) 6pgdh, (12) Pgm, (13) Mpl and (14) Sdh; . ., unscored genotypes; individuals numbered 0 are hermaphrodite founders.


