Embed Size (px)
Citation preview
Flexibility in Enabling education: the equity/efficiency trade-off
Ms Cheryl Bookallil Prof John Rolfe
CQUniversity, Australia CQUniversity, Australia
[email protected] [email protected]
Flexibility in Enabling education provides greater equity by making the
programs more accessible to a wider range of people. This study covers a
variety of accessibility options for Enabling and demonstrates that the more
flexible an Enabling program is in terms of enrolment, mode of delivery and
expectations with respect to completion dates the lower the outcomes in terms
of completions of the program and articulations to undergraduate study.
Flexibility induces a much higher enrolment that costs more in terms of
Commonwealth funding but the outcomes are far lower than for more
structured offerings. The very strength of flexibility can also be its weakness.
Widening access to tertiary qualifications for disadvantaged groups in Australia was
enshrined in the 1990 policy discussion paper ‘A fair chance for all’ and has been a
national objective for over two decades (Dept. Employment, Education and Training
1990). Access to university education involves notions of equity as fairness and justice
(Gale & Tranter 2011). University education confers higher lifetime earnings benefits to
the individual (Chapman 2011; James 2002) as well as personal development, social
status and enhanced career possibilities (James 2008).
University Enabling programs are an access and equity initiative incorporating social
justice ideals (Trow 1974, 1981) and serve an important role in delivering equity in access
to higher education for people from disadvantaged1 groups (Willans & Seary 2011;
Miyamoto 2005; Ross & Gray 2005). Enabling programs provide a mechanism for
advancing equity in access to higher education by providing the requisites for entry to
university study but there are tensions and trade-offs between equity and efficiency goals.
Although greater economic efficiency is gained by funding of educational interventions
early in life (Heckman 2000), equity considerations require that the needs of those whose
education has been disrupted are not ignored.
The need for a national “systematic evaluation” on the efficacy of alternative entry
programs was recognised nearly two decades ago (Cobbin and Barlow 1993, p.ix) and
1 Six equity categories of disadvantage are defined as Low socioeconomic status (LowSES), rural and
isolated (R&I), Aboriginal and Torres Strait Islander (ATSI), Non-English speaking background (NESB),
people with disability (PWD) and women in non-traditional areas of study (Women non-Trad) were
defined in the government publication ‘A fair chance for all’ (DEET 1990)
continues with Aird et al. (2010 p.iv) calling for research on Enabling programs to
undergo the scrutiny of academic peer-review. In their final report on the higher education
base funding review, Lomax-Smith, Watson and Webster (2011) stated that “Enabling
courses are not part of the Australian Qualifications Framework and seem not to have
been subject to a targeted review of effectiveness despite having existed since 1990”
(p.122).
Most research on Enabling education in Australia has been qualitative, focussed upon the
teaching and learning aspects and identifying significant personal outcomes for students
such as increased self-confidence and self-esteem (see for example Cantwell & Grayson
2002; Debbenham & May 2005; Cullity 2006; Spreadbury 2007; Stone 2008; Willans &
Seary 2011).
While Enabling education for its own sake has private benefits and increases in self-
confidence are important, these studies do not necessarily demonstrate improvements in
individuals’ human capital as defined by Becker (1964) that can be marketed into the
professional workforce. Nor do they provide direct returns back to the tax payers or the
university making considerable “in-kind” investments. Ramsay (2008) lamented that,
despite 180% expansion in Enabling programs 1989-1999, there remained no national
coordination or monitoring. Giving attention to the end product of providing free
Enabling programs is important as competing claims of success may draw debate away
from the primary objective of widening participation in university and encouraging
accumulation of human capital.
In an attempt to achieve both equity and efficiency there can be trade-offs with some
economists believing greater equity comes at the inevitable cost of a loss of efficiency
consistent with Okun’s (1975) ‘leaky bucket’ concept2. However, Blank (2002)
demonstrates circumstances in which equity-increasing transfers can occur without
seriously reducing efficiency “…if the behavioral [sic] changes induced …are large and
positive … transfers can produce both greater equity and greater efficiency” (p.12). Public
investment in improving human capital accumulation by increasing access to education
for the disadvantaged can be a win-win situation (Berg & Ostry 2011; Blank 2002).
Equity for individuals is defined in this case by the notion of inclusion based upon the
principle of personal agency as espoused by Sen (2009) which emphasises developing
individual’s capabilities Sen (2008). This is measured by completion of Enabling and
progression into university level study through which significant human capital may be
accumulated.
Economic efficiency relates to the use of society’s resources for achieving the maximum
possible production of goods and services. This can also be measured by completion of
Enabling and articulation to university level study with respect to the levels of Australian
government funding for Enabling programs. This measure is consistent with the
Australian government’s definition of an Enabling program for which Commonwealth
2 Okun’s “leaky bucket” concept relates to social welfare and income redistributions. He posits that the
full amount of any dollars transferred from rich to poor individuals will not be received due to
administrative costs and changes in work and investment behaviours by individuals. Okun declared that
“….the conflict between equality and economic efficiency is inescapable” (Okun 1975 p.120).
funding is received and that is to enable “…the person to undertake a course leading to a
higher education award…” (HE Support Act 2012 p.302). Therefore, Enabling programs
can be considered as an intermediate good assisting in the achievement of targets
recommended by the Bradley Review of Higher Education (Bradley et.al 2008).
In his review of Enabling at CQUniversity, Professor King defined success of Enabling
programs as moving students through to university study. “The ultimate test of an
enabling program is the proportion of students who move from it to take an undergraduate
place and subsequently graduate” (2011 p. 8). This is also consistent with the Higher
Education Support Act 2003 definition of an Enabling program.
Since the dual goals of equity and efficiency can both be evaluated by the same measure
of completion and articulation, this provides an indication how well either goals are being
met. Analysing the outcomes of university Enabling programs though an economic lens
this quantitative study shows that providing greater flexibility in study options provides
more equity in access but also demonstrates the loss of economic efficiency in doing so.
Context
Enabling education at CQUniversity has been operating since 1986 and there are many
anecdotal stories of lives changed (Doyle 2006). However, as with programs offered at
other Australian universities, there has been no systematic evaluation of the outcomes.
By 2011, Enabling at CQUniversity included Skills for Tertiary Education Preparatory
Studies (STEPS), Women Into Science and Technology (WIST) and Lifting the
Boundaries to University (LIFT) programs, each with different structures and levels of
flexibility (see table 1). The only aspect in common is that they were all offered free of
charge to participants.
Applicants for both STEPS and LIFT completed intake testing. There was no intake test
for WIST. The application, enrolment and course assessment of STEPS and LIFT
students complied with set dates from the CQUniversity academic calendar for terms 1
and 2 with LIFT also offered during term 3.
STEPS had a set curriculum and students were expected to complete all courses listed
under the program. LIFT made only one course compulsory but students had to complete
at least two courses. WIST applicants could enrol at any time during the year and
commence study almost immediately on only the courses they wished to study. There was
no set minimum number of courses and students could study at their own pace.
While STEPS offerings included distance study it was the only one of these Enabling
programs that provided internal study options. WIST and LIFT were taught exclusively
by distance.
The WIST program provided the greatest contrast having been designed to fit flexibly
around women’s busy lifestyles of employment and/or family responsibilities allowing
enrolment at any time of the year and self-paced study.
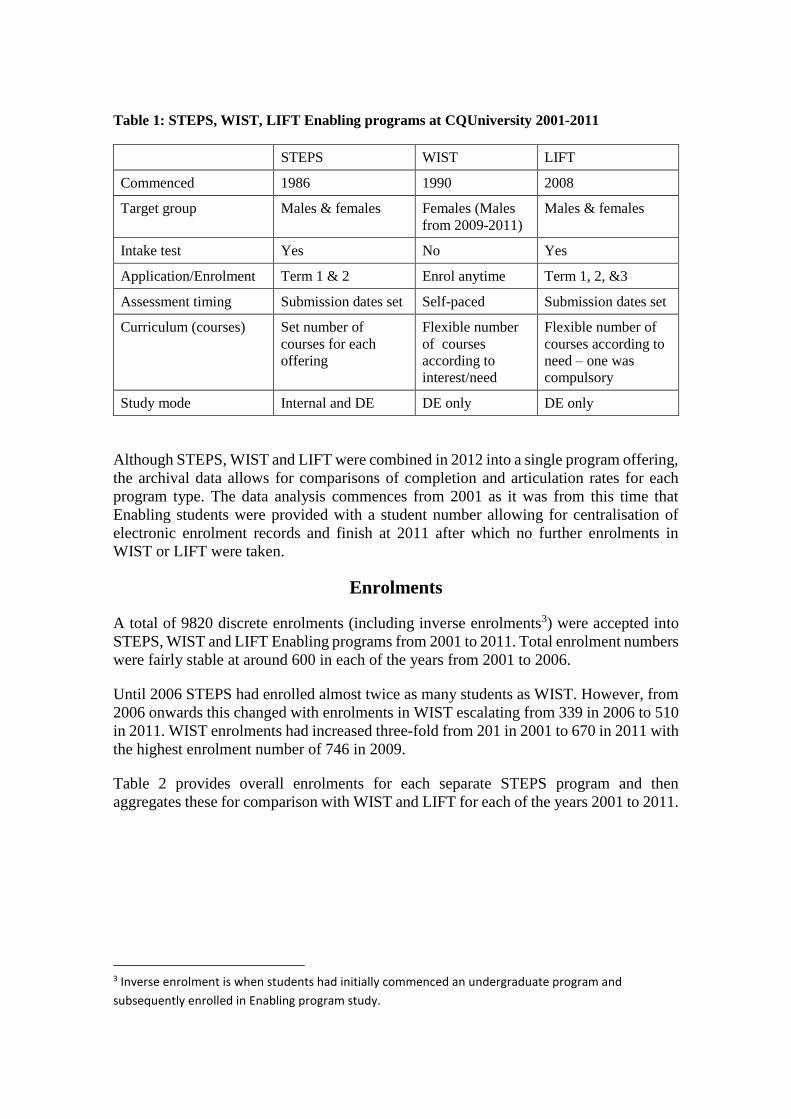
Table 1: STEPS, WIST, LIFT Enabling programs at CQUniversity 2001-2011
STEPS WIST LIFT
Commenced 1986 1990 2008
Target group Males & females Females (Males
from 2009-2011)
Males & females
Intake test Yes No Yes
Application/Enrolment Term 1 & 2 Enrol anytime Term 1, 2, &3
Assessment timing Submission dates set Self-paced Submission dates set
Curriculum (courses) Set number of
courses for each
offering
Flexible number
of courses
according to
interest/need
Flexible number of
courses according to
need – one was
compulsory
Study mode Internal and DE DE only DE only
Although STEPS, WIST and LIFT were combined in 2012 into a single program offering,
the archival data allows for comparisons of completion and articulation rates for each
program type. The data analysis commences from 2001 as it was from this time that
Enabling students were provided with a student number allowing for centralisation of
electronic enrolment records and finish at 2011 after which no further enrolments in
WIST or LIFT were taken.
Enrolments
A total of 9820 discrete enrolments (including inverse enrolments3) were accepted into
STEPS, WIST and LIFT Enabling programs from 2001 to 2011. Total enrolment numbers
were fairly stable at around 600 in each of the years from 2001 to 2006.
Until 2006 STEPS had enrolled almost twice as many students as WIST. However, from
2006 onwards this changed with enrolments in WIST escalating from 339 in 2006 to 510
in 2011. WIST enrolments had increased three-fold from 201 in 2001 to 670 in 2011 with
the highest enrolment number of 746 in 2009.
Table 2 provides overall enrolments for each separate STEPS program and then
aggregates these for comparison with WIST and LIFT for each of the years 2001 to 2011.
3 Inverse enrolment is when students had initially commenced an undergraduate program and
subsequently enrolled in Enabling program study.
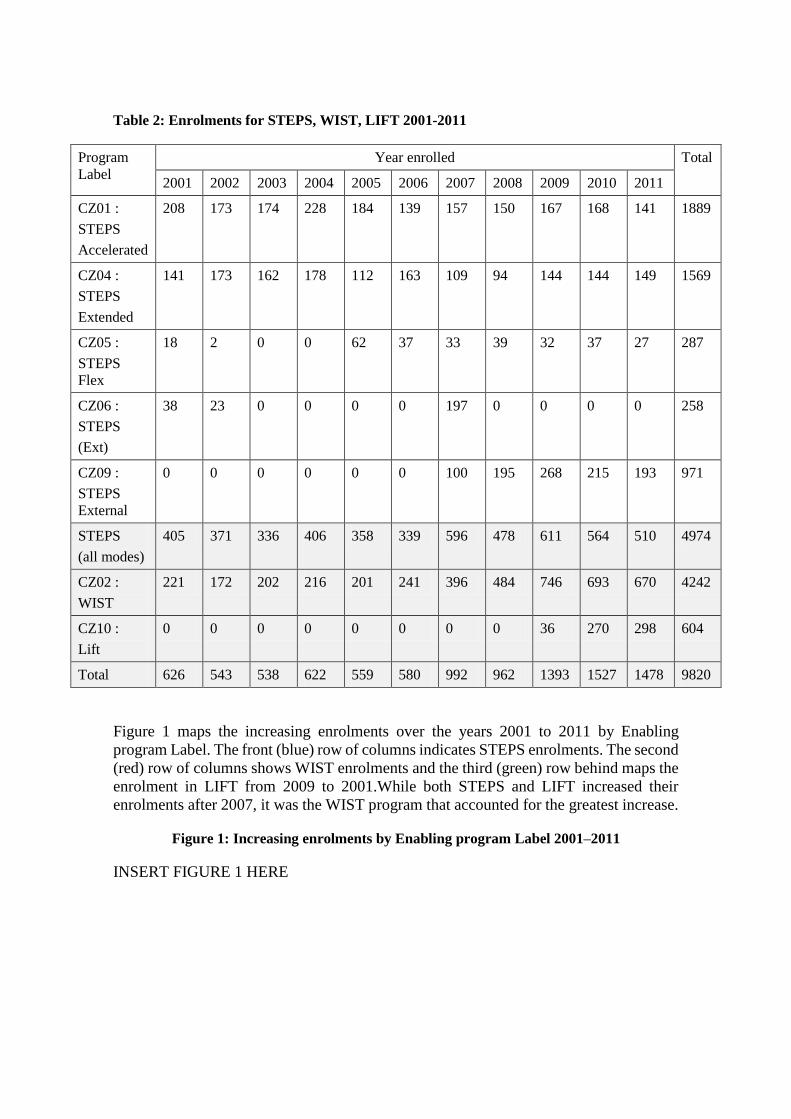
Table 2: Enrolments for STEPS, WIST, LIFT 2001-2011
Program
Label
Year enrolled Total
2001 2002 2003 2004 2005 2006 2007 2008 2009 2010 2011
CZ01 :
STEPS
Accelerated
208 173 174 228 184 139 157 150 167 168 141 1889
CZ04 :
STEPS
Extended
141 173 162 178 112 163 109 94 144 144 149 1569
CZ05 :
STEPS
Flex
18 2 0 0 62 37 33 39 32 37 27 287
CZ06 :
STEPS
(Ext)
38 23 0 0 0 0 197 0 0 0 0 258
CZ09 :
STEPS
External
0 0 0 0 0 0 100 195 268 215 193 971
STEPS
(all modes)
405 371 336 406 358 339 596 478 611 564 510 4974
CZ02 :
WIST
221 172 202 216 201 241 396 484 746 693 670 4242
CZ10 :
Lift
0 0 0 0 0 0 0 0 36 270 298 604
Total 626 543 538 622 559 580 992 962 1393 1527 1478 9820
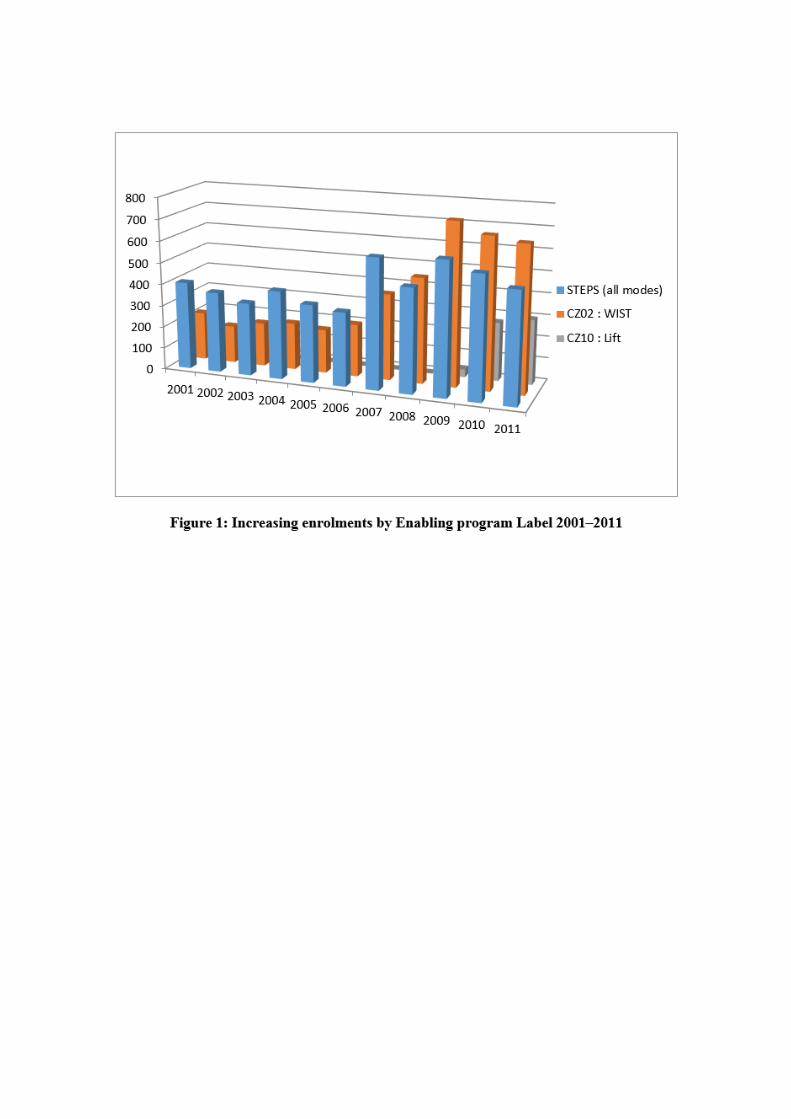
Figure 1 maps the increasing enrolments over the years 2001 to 2011 by Enabling
program Label. The front (blue) row of columns indicates STEPS enrolments. The second
(red) row of columns shows WIST enrolments and the third (green) row behind maps the
enrolment in LIFT from 2009 to 2001.While both STEPS and LIFT increased their
enrolments after 2007, it was the WIST program that accounted for the greatest increase.
Figure 1: Increasing enrolments by Enabling program Label 2001–2011
INSERT FIGURE 1 HERE
Completions
Only the 9493 records of first enrolments in Enabling were used to calculate completion
and articulation rates to avoid skewing the findings since those who enrolled inversely in
Enabling were already in undergraduate study.
Enabling program completions increased from 39.2% in 2001 to peak at 52.9% in 2005.
From 2006, as enrolments experienced a sustained increase, the completion rate fell
reaching a low of 30% in 2008. Although completions improved in the ensuing years was
still only a 39.1% completion rate in 2011.
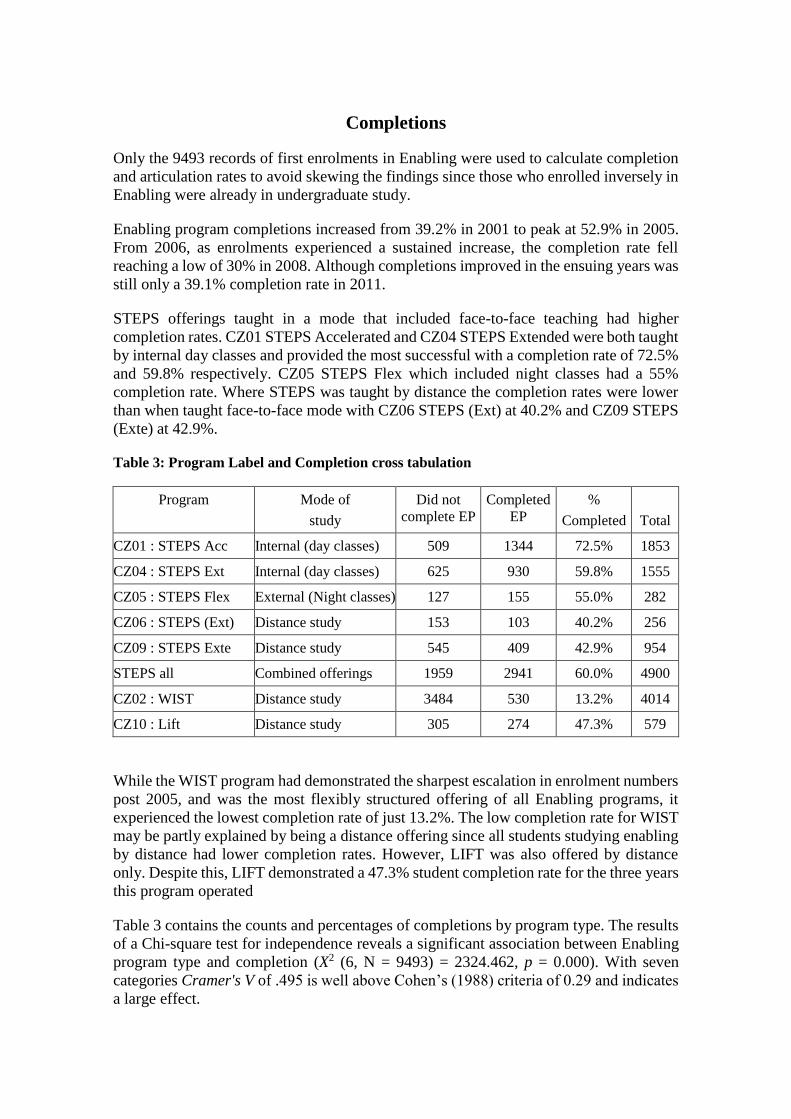
STEPS offerings taught in a mode that included face-to-face teaching had higher
completion rates. CZ01 STEPS Accelerated and CZ04 STEPS Extended were both taught
by internal day classes and provided the most successful with a completion rate of 72.5%
and 59.8% respectively. CZ05 STEPS Flex which included night classes had a 55%
completion rate. Where STEPS was taught by distance the completion rates were lower
than when taught face-to-face mode with CZ06 STEPS (Ext) at 40.2% and CZ09 STEPS
(Exte) at 42.9%.
Table 3: Program Label and Completion cross tabulation
Program Mode of
study
Did not
complete EP
Completed
EP
%
Completed Total
CZ01 : STEPS Acc Internal (day classes) 509 1344 72.5% 1853
CZ04 : STEPS Ext Internal (day classes) 625 930 59.8% 1555
CZ05 : STEPS Flex External (Night classes) 127 155 55.0% 282
CZ06 : STEPS (Ext) Distance study 153 103 40.2% 256
CZ09 : STEPS Exte Distance study 545 409 42.9% 954
STEPS all Combined offerings 1959 2941 60.0% 4900
CZ02 : WIST Distance study 3484 530 13.2% 4014
CZ10 : Lift Distance study 305 274 47.3% 579
While the WIST program had demonstrated the sharpest escalation in enrolment numbers
post 2005, and was the most flexibly structured offering of all Enabling programs, it
experienced the lowest completion rate of just 13.2%. The low completion rate for WIST
may be partly explained by being a distance offering since all students studying enabling
by distance had lower completion rates. However, LIFT was also offered by distance
only. Despite this, LIFT demonstrated a 47.3% student completion rate for the three years
this program operated
Table 3 contains the counts and percentages of completions by program type. The results
of a Chi-square test for independence reveals a significant association between Enabling
program type and completion (X2 (6, N = 9493) = 2324.462, p = 0.000). With seven
categories Cramer's V of .495 is well above Cohen’s (1988) criteria of 0.29 and indicates
a large effect.
Articulations
Inverse enrolments were not considered when analysing articulations as these students
were already in undergraduate prior to undertaking Enabling study and to include them
would have overstated the figures.
The articulation figures in this section should be read with some minor caution because
students who undertake an Enabling program may subsequently enrol in an undergraduate
program with another university. However, in the eleven-year time frame of this study
QTAC advise that only 241 (2.5%) applicants accepted an offer to other Queensland
universities where STEPS, WIST or LIFT formed the basis of their Tertiary Entrance
Ranking (TER).
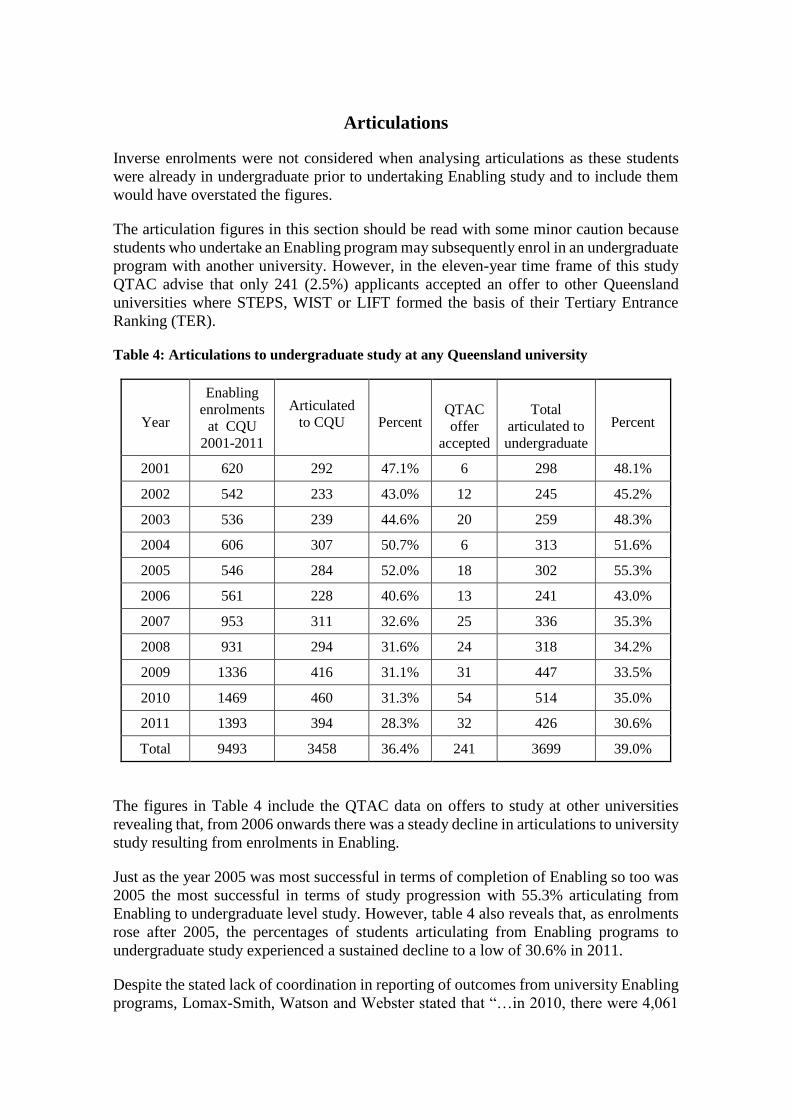
Table 4: Articulations to undergraduate study at any Queensland university
Year
Enabling
enrolments
at CQU
2001-2011
Articulated
to CQU
Percent
QTAC
offer
accepted
Total
articulated to
undergraduate
Percent
2001 620 292 47.1% 6 298 48.1%
2002 542 233 43.0% 12 245 45.2%
2003 536 239 44.6% 20 259 48.3%
2004 606 307 50.7% 6 313 51.6%
2005 546 284 52.0% 18 302 55.3%
2006 561 228 40.6% 13 241 43.0%
2007 953 311 32.6% 25 336 35.3%
2008 931 294 31.6% 24 318 34.2%
2009 1336 416 31.1% 31 447 33.5%
2010 1469 460 31.3% 54 514 35.0%
2011 1393 394 28.3% 32 426 30.6%
Total 9493 3458 36.4% 241 3699 39.0%
The figures in Table 4 include the QTAC data on offers to study at other universities
revealing that, from 2006 onwards there was a steady decline in articulations to university
study resulting from enrolments in Enabling.
Just as the year 2005 was most successful in terms of completion of Enabling so too was
2005 the most successful in terms of study progression with 55.3% articulating from
Enabling to undergraduate level study. However, table 4 also reveals that, as enrolments
rose after 2005, the percentages of students articulating from Enabling programs to
undergraduate study experienced a sustained decline to a low of 30.6% in 2011.
Despite the stated lack of coordination in reporting of outcomes from university Enabling
programs, Lomax-Smith, Watson and Webster stated that “…in 2010, there were 4,061
students who had progressed to a Bachelor degree level course out of the 12,411 students
who undertook a pathway Enabling course in 2009” (2011 p.123) representing 32.72%
of the 2010 Enabling cohort. CQUniversity’s articulation rate from Enabling to
Undergraduate of 35.0% in 2010 compares favourably since it is 2.28 percentage points
above this figure.
Cost of Enabling programs and the outcomes
Prior to 2005 Enabling programs were funded from the CQUniversity budget with no
specific funding model directly contributing towards Enabling. This analysis of Enabling
costs is only in regard to the specific Commonwealth ‘Enabling loading’ received from
when it commenced in 2005 up until 2011. It was not possible to determine the cost of
“in kind” support provided by CQUniversity to these programs over the time frame.
Specific Commonwealth funding of ‘Enabling loading’ commenced 2005 and the
allocations to each university are listed on the DEEWR web site. Over the seven years
from 2005 to 2011 CQUniversity received $19,648,295 in Commonwealth funding to
support provision of STEPS, WIST and LIFT Enabling programs.
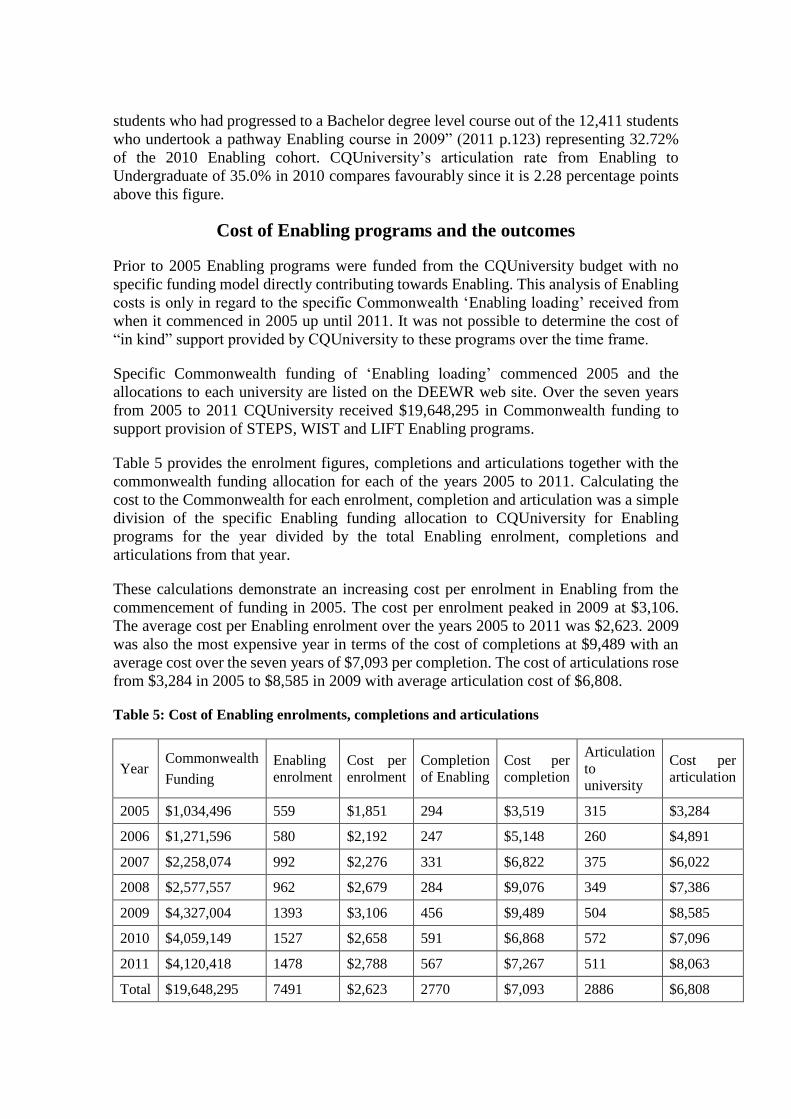
Table 5 provides the enrolment figures, completions and articulations together with the
commonwealth funding allocation for each of the years 2005 to 2011. Calculating the
cost to the Commonwealth for each enrolment, completion and articulation was a simple
division of the specific Enabling funding allocation to CQUniversity for Enabling
programs for the year divided by the total Enabling enrolment, completions and
articulations from that year.
These calculations demonstrate an increasing cost per enrolment in Enabling from the
commencement of funding in 2005. The cost per enrolment peaked in 2009 at $3,106.
The average cost per Enabling enrolment over the years 2005 to 2011 was $2,623. 2009
was also the most expensive year in terms of the cost of completions at $9,489 with an
average cost over the seven years of $7,093 per completion. The cost of articulations rose
from $3,284 in 2005 to $8,585 in 2009 with average articulation cost of $6,808.
Table 5: Cost of Enabling enrolments, completions and articulations
Year Commonwealth
Funding
Enabling
enrolment
Cost per
enrolment
Completion
of Enabling
Cost per
completion
Articulation
to
university
Cost per
articulation
2005 $1,034,496 559 $1,851 294 $3,519 315 $3,284
2006 $1,271,596 580 $2,192 247 $5,148 260 $4,891
2007 $2,258,074 992 $2,276 331 $6,822 375 $6,022
2008 $2,577,557 962 $2,679 284 $9,076 349 $7,386
2009 $4,327,004 1393 $3,106 456 $9,489 504 $8,585
2010 $4,059,149 1527 $2,658 591 $6,868 572 $7,096
2011 $4,120,418 1478 $2,788 567 $7,267 511 $8,063
Total $19,648,295 7491 $2,623 2770 $7,093 2886 $6,808
That the average cost of articulations is lower than the average cost of completions is the
subject of further analysis as the records indicated that some Enabling students articulated
to undergraduate even though they did not complete the Enabling program. This anomaly
relates mostly to the WIST program as demonstrated in the individual program
calculations below.
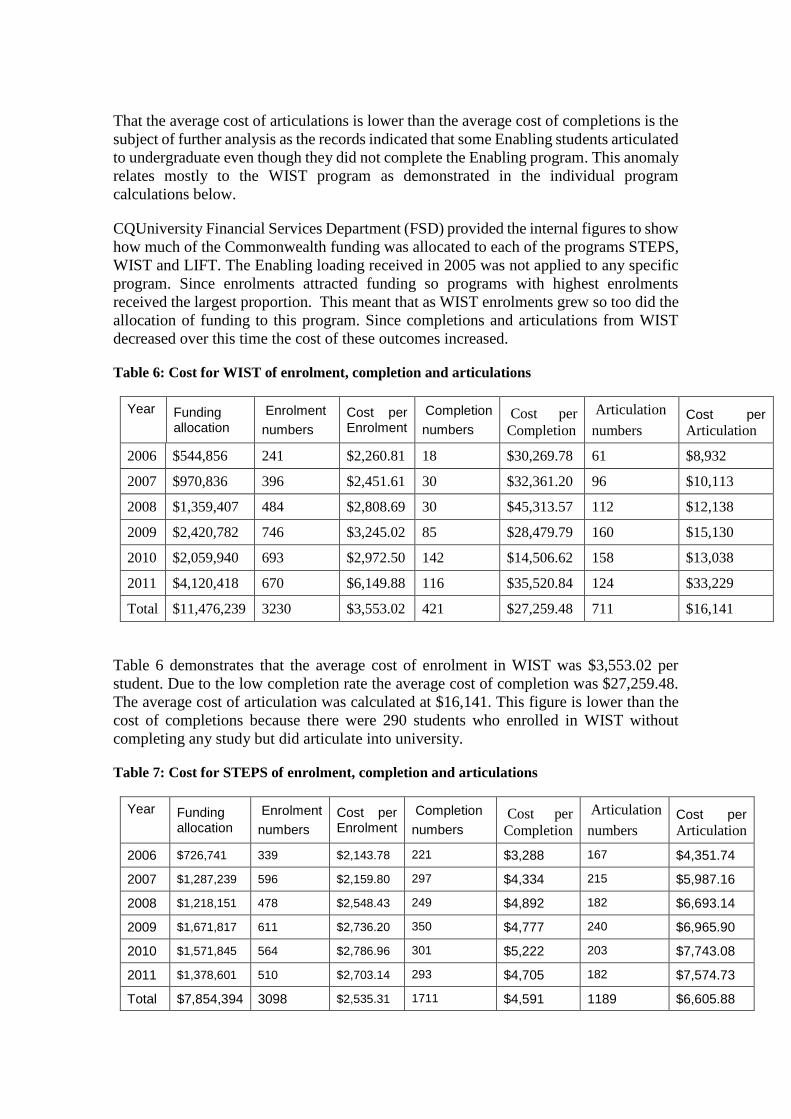
CQUniversity Financial Services Department (FSD) provided the internal figures to show
how much of the Commonwealth funding was allocated to each of the programs STEPS,
WIST and LIFT. The Enabling loading received in 2005 was not applied to any specific
program. Since enrolments attracted funding so programs with highest enrolments
received the largest proportion. This meant that as WIST enrolments grew so too did the
allocation of funding to this program. Since completions and articulations from WIST
decreased over this time the cost of these outcomes increased.
Table 6: Cost for WIST of enrolment, completion and articulations
Year Funding allocation
Enrolment
numbers
Cost per Enrolment
Completion
numbers
Cost per
Completion
Articulation
numbers Cost per Articulation
2006 $544,856 241 $2,260.81 18 $30,269.78 61 $8,932
2007 $970,836 396 $2,451.61 30 $32,361.20 96 $10,113
2008 $1,359,407 484 $2,808.69 30 $45,313.57 112 $12,138
2009 $2,420,782 746 $3,245.02 85 $28,479.79 160 $15,130
2010 $2,059,940 693 $2,972.50 142 $14,506.62 158 $13,038
2011 $4,120,418 670 $6,149.88 116 $35,520.84 124 $33,229
Total $11,476,239 3230 $3,553.02 421 $27,259.48 711 $16,141
Table 6 demonstrates that the average cost of enrolment in WIST was $3,553.02 per
student. Due to the low completion rate the average cost of completion was $27,259.48.
The average cost of articulation was calculated at $16,141. This figure is lower than the
cost of completions because there were 290 students who enrolled in WIST without
completing any study but did articulate into university.
Table 7: Cost for STEPS of enrolment, completion and articulations
Year Funding allocation
Enrolment
numbers
Cost per Enrolment
Completion
numbers
Cost per
Completion
Articulation
numbers Cost per Articulation
2006 $726,741 339 $2,143.78 221 $3,288 167 $4,351.74
2007 $1,287,239 596 $2,159.80 297 $4,334 215 $5,987.16
2008 $1,218,151 478 $2,548.43 249 $4,892 182 $6,693.14
2009 $1,671,817 611 $2,736.20 350 $4,777 240 $6,965.90
2010 $1,571,845 564 $2,786.96 301 $5,222 203 $7,743.08
2011 $1,378,601 510 $2,703.14 293 $4,705 182 $7,574.73
Total $7,854,394 3098 $2,535.31 1711 $4,591 1189 $6,605.88
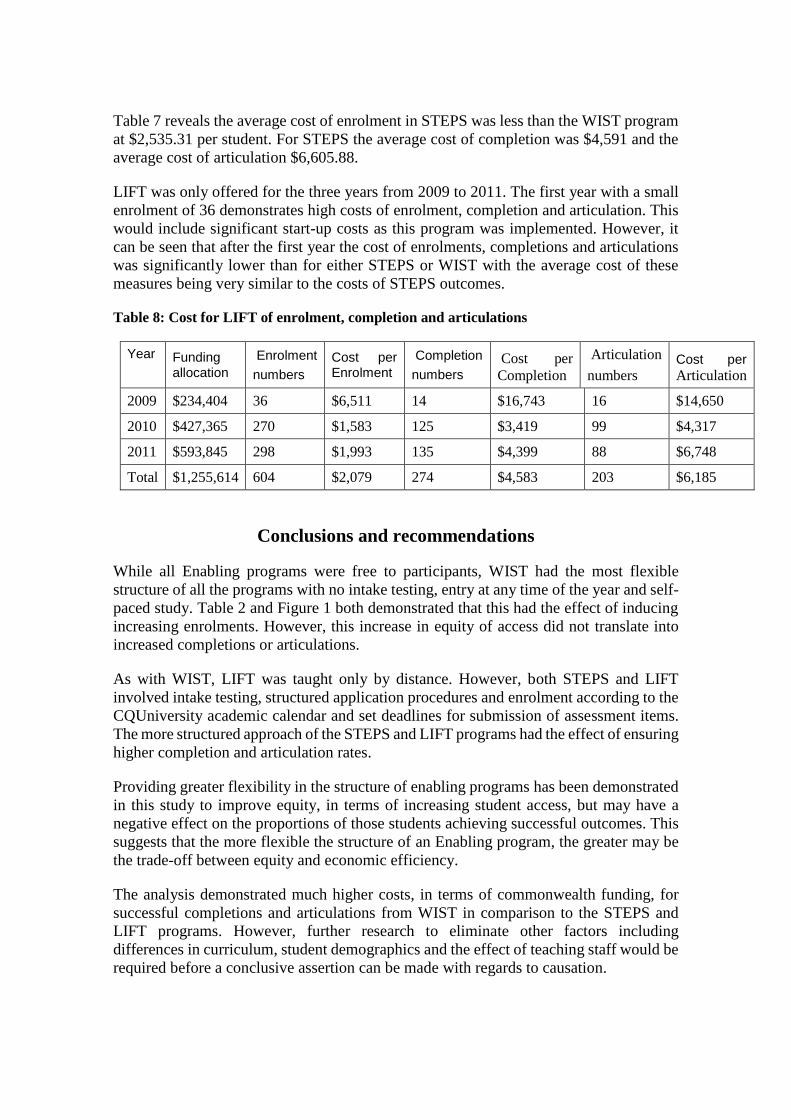
Table 7 reveals the average cost of enrolment in STEPS was less than the WIST program
at $2,535.31 per student. For STEPS the average cost of completion was $4,591 and the
average cost of articulation $6,605.88.
LIFT was only offered for the three years from 2009 to 2011. The first year with a small
enrolment of 36 demonstrates high costs of enrolment, completion and articulation. This
would include significant start-up costs as this program was implemented. However, it
can be seen that after the first year the cost of enrolments, completions and articulations
was significantly lower than for either STEPS or WIST with the average cost of these
measures being very similar to the costs of STEPS outcomes.
Table 8: Cost for LIFT of enrolment, completion and articulations
Year Funding allocation
Enrolment
numbers
Cost per Enrolment
Completion
numbers
Cost per
Completion
Articulation
numbers Cost per Articulation
2009 $234,404 36 $6,511 14 $16,743 16 $14,650
2010 $427,365 270 $1,583 125 $3,419 99 $4,317
2011 $593,845 298 $1,993 135 $4,399 88 $6,748
Total $1,255,614 604 $2,079 274 $4,583 203 $6,185
Conclusions and recommendations
While all Enabling programs were free to participants, WIST had the most flexible
structure of all the programs with no intake testing, entry at any time of the year and self-
paced study. Table 2 and Figure 1 both demonstrated that this had the effect of inducing
increasing enrolments. However, this increase in equity of access did not translate into
increased completions or articulations.
As with WIST, LIFT was taught only by distance. However, both STEPS and LIFT
involved intake testing, structured application procedures and enrolment according to the
CQUniversity academic calendar and set deadlines for submission of assessment items.
The more structured approach of the STEPS and LIFT programs had the effect of ensuring
higher completion and articulation rates.
Providing greater flexibility in the structure of enabling programs has been demonstrated
in this study to improve equity, in terms of increasing student access, but may have a
negative effect on the proportions of those students achieving successful outcomes. This
suggests that the more flexible the structure of an Enabling program, the greater may be
the trade-off between equity and economic efficiency.
The analysis demonstrated much higher costs, in terms of commonwealth funding, for
successful completions and articulations from WIST in comparison to the STEPS and
LIFT programs. However, further research to eliminate other factors including
differences in curriculum, student demographics and the effect of teaching staff would be
required before a conclusive assertion can be made with regards to causation.
How some students articulated from WIST into undergraduate study without completing
the Enabling program is already the subject of further research by the authors. Further
understanding of why some students who successfully complete Enabling do not progress
to university study will also be gained from a large scale survey of past and present
enabling students currently being undertaken.
Further research into the learning styles of Enabling students with respect to intrinsic
versus extrinsic motivation might shed further light on why greater flexibility in access
and structure does not provide greater equity or efficiency in terms of positive outcomes;
particularly since undertaking Enabling by internal study had the most positive outcomes.
References
Aird, R, Miller E, van Meden, K & Buys, L 2010, ‘Issues for students navigating alternative pathways to
higher education: barriers, access an d equity’, A literature review prepared for the Adult Learner
Social Inclusion Project, Queensland University of Technology, bridgetostudy.com.au, 01.01.10,
http://www.academia.edu/834001/Issues_for_students_navigating_alternative_pathways_to_highe
r_education_Barriers_access_and_equity accessed 17.01.12.
Becker, G1964, Human Capital, National Bureau for Economic Research, New York.
Berg, A & Ostry, D 2011, ‘Equality and efficiency: is there a trade-off between the two or do they do
hand in hand?”, Finance and Development, Sept. 2011, pp.12-15.
Blank, R 2002, ‘Can equity and efficiency complement each other?’, Labour Economics, Sept. 2002, vol.
9, no. 4, pp.451-468.
Bradley, D, Noonan, P, Nugent, H, & Scales, B 2008, ‘Review of Australian Higher Education: Final
Report’, Canberra: Commonwealth of Australia,
http://www.innovation.gov.au/HigherEducation/ResourcesAndPublications/ReviewOfAustralianH
igherEducation/Pages/ReviewOfAustralianHigherEducationReport.aspx accessed 01.11.12.
Cantwell, R & Grayson, R 2002, ‘Individual differences among enabling students: A comparison across
three enabling programmes’, Journal of Further and Higher Education, vol. 26, no 4, pp.293–306.
Chapman, B 2011 ‘The Australian University Student Financing System: The rationale for, and
experience with, income-contingent loans’, in Financing Higher Education and Economic
Development in East Asia, Armstrong, S and Chapman, B (eds), ANU Epress, Australia, 2011@
http://epress.anu.edu.au/financing_citation.html, viewed 17.02.12.
Cobbin, D & Barlow, A 1993, Executive summary in Cobbin and Barlow (Eds), ‘Tertiary access and
equity initiatives: a handbook for evaluative research’, AGPS, Canberra, pp.ix-x.
Cohen, J 1988, Statistical power analysis for the behavioral sciences (2nd Ed), Hillsdale, NJ: Lawrence
Erlbaum Associates.
Cullity, M 2006, ‘Challenges in understanding and assisting mature-age students who participate in
alternative entry programs’, Australian Journal of Adult Learning, vol.46, no. 2, pp.175–201.
Debbenham, J, & May, J 2005, ‘Making connections: A dialogue about learning and teaching in a tertiary
enabling program’, Australian Journal of Adult Learning, vol.45, no. 1, pp.83-105.
Department of Employment, Education and Training (DEET) 1990, ‘A Fair Chance for All’, National and
Institutional Planning for Equity in Higher Education, A Discussion Paper, Feb. 1990, AGPS,
Canberra.
Doyle, S 2006, STEPS celebrating 20 years 1986 – 2006, Central Queensland University, Rockhampton,
Qld.
Gale, T & Tranter, D 2011, ‘Social justice in Australian higher education policy: an historical and
conceptual account of student participation’, Critical Studies in Education, vol. 52, no. 1, pp.29-
46.
Heckman, J 2000, ‘Policies to foster human capital’, Research in Economics, vol. 54, no. 1, pp.3-56.
Higher Education Support Act No. 149 of 2003 as amended, compilation prepared 9 March 2012,
Australian Government Common Law, http://www.comlaw.gov.au/Details/C2012C00679
accessed 27.06.12.
James, R 2008, ‘Achieving social inclusion and universal participation: towards new conceptions of
higher education, New Zealand Annual Review of Education, Vol. 18, pp.47-63.
James, R 2002, ‘Socioeconomic background and higher education participation: An analysis of school
students’ aspirations and expectations’, Department of Education, Science and Training,
Commonwealth of Australia.
Miyamoto, K 2005, ‘Promoting adult learning’, Organisation for Economic Co-operation and
Development, Paris.
Okun, A 1975, ‘Equality and Efficiency: the big tradeoff’, Brookings Institution Press, Washington,
USA.
Ramsay, E 2008, ‘Australian Higher Education Equity: Current challenges & emerging opportunities for
bridging and enabling education’, Presentation to the National Conference of the New Zealand
Association of Bridging Educators, Bridging Education – a pathway to the future. Waiariki
Institute of Technology, Rotorua, 10 October 2008.
Okun, A 1975, ‘Equality and Efficiency: the big tradeoff’, Brookings Institution Press, Washington,
USA.
Ross, S & Gray, J 2005,’Transitions and re-engagement through second chance education’, The
Australian Educational Researcher, vol. 32, no. 3, Dec. 2005, pp.103-140.
Sen, A 2008, ‘The idea of justice’, Journal of Human Development, vol. 9, no. 3, pp.331-342.
Sen, A 2009, ‘The idea of justice’, Penguin, London.
Spreadbury, S 2007, ‘Liberal learning and working-class adults: The meaningfulness of education’,
Continuing Higher Education Review, vol. 71, pp.71–89.
Stone, C 2008, ‘Listening to individual voices and stories – the mature-age student experience’,
Australian Journal of Adult Learning, vol. 48, no. 2, pp.263–290.
Trow, M 1981, ‘Comparative perspectives on access’ in Fulton, O (Ed.), Access to higher education,
pp.89-121, Milton Keynes, England: The SRHE & Open University Press.
Trow, M 1974, ‘Problems in the transition from elite to mass higher education’, in Conference on Future
Structures of Post-Secondary Education: General report, pp.51-101, Paris: OECD.
Willans, J & Seary, K 2011, ‘I feel like I’m being hit from all directions: Enduring the bombardment as a
mature age learner returning to formal learning’, Australian Journal of Adult Learning, vol. 51, no.
1, pp.119-142.