Embed Size (px)
Citation preview
Floods of March-May 1965 in the Upper Mississippi River Basin
GEOLOGICAL SURVEY WATER-SUPPLY PAPER 1850-A
Prepared in cooperation with the States of Minnesota, Wisconsin, Iowa, Illinois, and Missouri and with agencies of the Federal Government
Floods of March-May 1965 in the Upper Mississippi River BasinBy D. B. ANDERSON and I. L. BURMEISTER
FLOODS OF 1965 IN THE UNITED STATES
GEOLOGICAL SURVEY WATER-SUPPLY PAPER 1850-A
Prepared in cooperation with the States of Minnesota, Wisconsin, Iowa, Illinois, and Missouri and with agencies of the Federal Government
UNITED STATES GOVERNMENT PRINTING OFFICE, WASHINGTON : 1970
UNITED STATES DEPARTMENT OF THE INTERICR
WALTER J. HICKEL, Secretary
GEOLOGICAL SURVEY
William T. Pecora, Director
For sale by the Superintendent of Documents, U.S. Government Printing Office Washington, D.C. 20402 - Price $2.25 (paper cover)
CONTENTS
Page Abstract. _________________________________________________________ AlIntroduction._____________________________________________________ 1Purpose and scope.________________________________________________ 3Acknowledgments.________________________________________________ 6Flood forecasts.___________________________________________________ 6Meteorological conditions causing floods._____________________________ 7
Conditions previous to March..______ ___________________________ 7March climatological events.-___--______-_---_-_-_-_____-_-____ 9April climatological events___________________-_-________________ 13
Thefloods________._______.____.____________________ 15Mississippi River main stem.___________________________________ 15Sauk and Elk River basins.____________________________________ 56Crow River basin____________________________________________ 57Rum River basin____________________________________________ 61Minnesota River basin.________________________________________ 61St. Croix River basin._________________________________________ 79Mississippi River tributary basins in southeastern Minnesota.______ 81Chippewa River basin________________________________________ 87Wisconsin River basin__________________________________________ 88Other Mississippi River tributary basins in Wisconsin._____________ 91Mississippi River tributary basins in northeastern Iowa.___________ 91Iowa River basin______________________________________________ 92Cedar River basin-____________________________________________ 95Skunk River basin___________________________________________ 96Des Moines River basin_-_________________________-_______-_-_- 97Mississippi River tributary ba sins in Illinois ______________________ 104Mississippi River tributary basins in Missouri.-__________________ 105
Flood operations._________________________________________________ 105Flood damages____________________________________________________ 107Drainage and storage effects________________________________________ 109Effect of timing of tributary flow on main stem peaks._________________ 113Recurrence intervals of peak discharges._____________________________ 114Determination of flood discharges_________-____--_______--__-_-_-__ 116Streamflow data at gaging stations_________________________________ 117
Station descriptions and discharge tables______-____________-_____ 118Summary of flood stages and discharges._________________________ 119Station data._________________________________________________ 145
References cited.__________________________________________________ 443In dex____________________________________________________________ 445
in
IV CONTENTS
ILLUSTRATIONS
Page FIGURE 1. Map showing area covered by this report_______________ A2
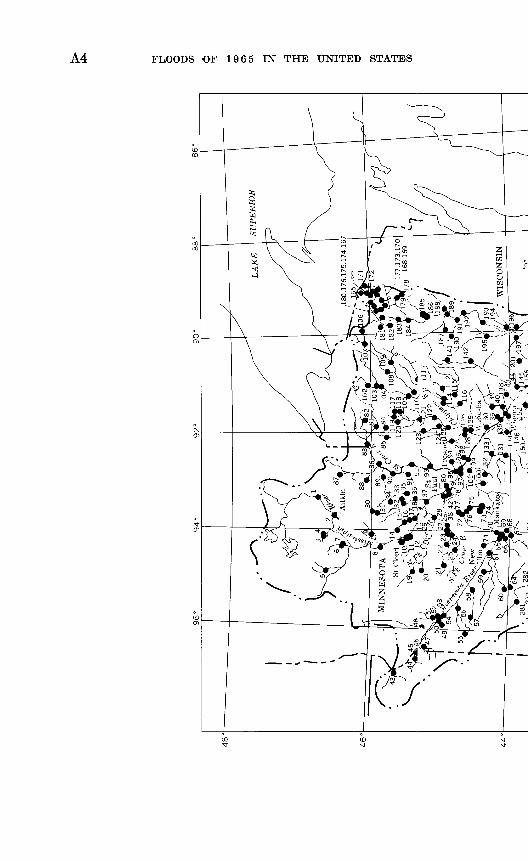
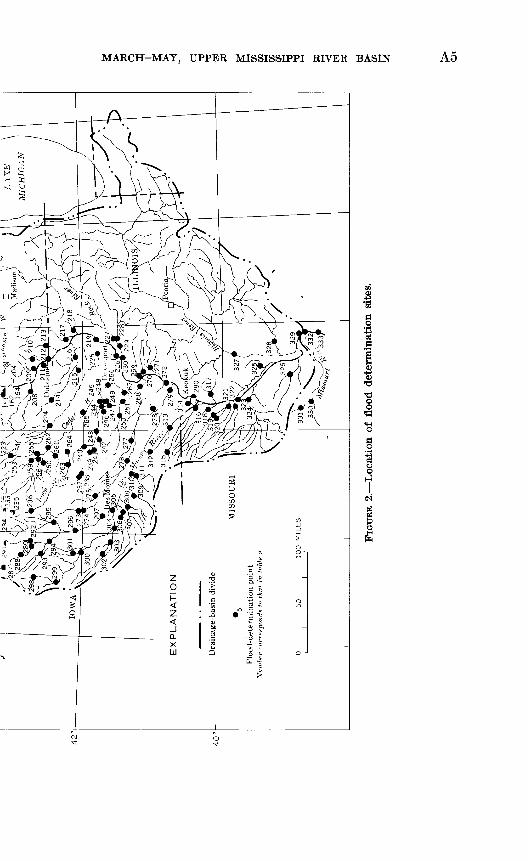
2. Map showing location of flood determination sites_________ 43. Chart showing daily range in temperature at four U.S.
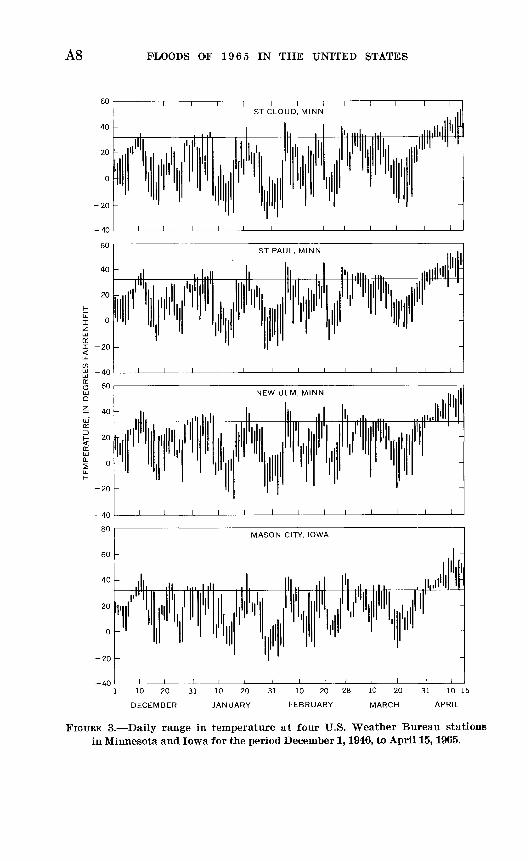
Weather Bureau stations in Minnesota and Iowa for the period December 1, 1964, to April 15, 1965_____________ 8
4. Map showing snow cover on the ground as of March 18 1965- 105. Map showing water equivalent of snow on the ground at the
end of March 1965__________.___.-__._______________ 116. Isohyetal map showing precipitation during the period
April3-7, 1965-__________-_____-_-__-_-___-_--______ 137. Isohyetal map showing precipitation during April 1965_____ 158. Photographs of flood damage caused by the Mississippi
River at Elk River, Minn____ _________________ _______ 189. Photograph of flood-damaged home in Lilydale, Mirn____ 20
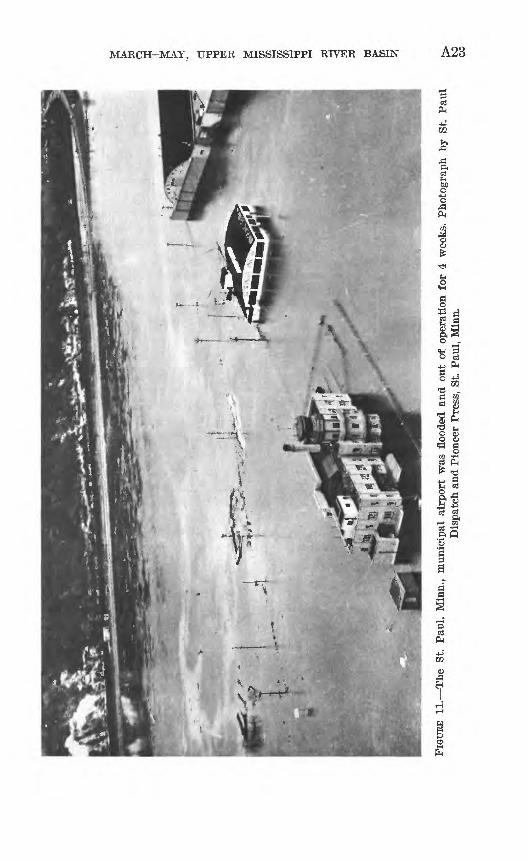
10. Map of flooded area in St. Paul, Minn__________________ 2211. Photograph of the St. Paul, Minn., municipal airport covered
by flood waters_____________________________________ 2312. Map of flooded area in Wabasha, Minn__________________ 2513. Map of flooded area in Winona, Minn____--__-_________- 2814. Photograph of flood damage to railroad trackage near
Winona, Minn______________________________________ 2915. Photograph of a flooded area in LaCrosse, Wis____________ 3016. Map of flooded area in LaCrosse, Wis__-__-_________-_-_ 3117. Photograph of flooded interstate bridge approach rnd an
area in Praire du Chien, Wis________________________ 3318. Photograph of flooded industrial area in Dubuque, ]~owa__ 3419. Map of flooded area in Dubuque, Iowa_________________ 3520. Map of flooded area in Clinton, Iowa___-__-_________--__ 3621. Photograph of flooded area in Fulton, 111.________________ 3822. Map of flooded area in Davenport and Bettendorf, Iowa,
and Rock Island, Moline and East Moline, !!!_________ 4023. Photograph of flooded area in Davenport, Iowa___________ 4224. Map or flooded area in Muscatine, Iowa________________ 4325. Photograpn of flooded area in Hannibal, Mo______________ 4426. Flood-crest profiles of Mississippi River__________________ 4627. Comparative discharge hydrographs at selected gaging
stations on the Mississippi River, April-May 1965______ 5128. Discharge hydrographs at selected gaging stations on Missis
sippi River tributaries upstream from St. Paul, Minn., April 1965__________________________________ 57
29. Flood-crest profiles of the North and South Forks of CrowRiver__ _____________________..________________ 58
30. Map of flooded area in Mankato, Minn__________________ 6431. Photograph of flooded area in Mankato, Minn____________ 6532. Map of flooded area in Henderson, Minn_________________ 6633. Photograph of flooded area in Henderson, Minn___________ 6734. Map of flooded area in Carver, Minn_ ___________________ 6835. Photograph of flooded area in Carver, Minn ______________ 6936. Map of flooded area in Chaska, Minn___-_____-_________- 74
CONTENTS V
Page FIGURE 37. Photograph of flooded area in Chaska, Minn______________ A75
38. Flood-crest profiles of Minnesota River __________________ 7639. Discharge hydrograph at selected gaging stations in tin
Minnesota River basin__----_----_----------_------__ 7840. Discharge hydrographs at selected gaging stations on the
Mississippi River tributaries in Wisconsin and south eastern Minnesota.- _ ________________________________ 80
41. Map of flooded area in Hastings, Minn_________________ 8242. Photograph of flooded area in Hastings, Minn____________ 8343. Flood-crest profiles of South Fork Zumbro River and Zumbro
River---------------------------------------------- 8544. Photograph of flooded area in Schofield, Wis_____-________ 9045. Discharge hydrographs at selected gaging stations in Iowa
River basin_________--______-_-_---___--______-__- 9446. Photograph of flooded area in Jackson, Minn_____________ 9847. Flood-crest profile of West Fork Des Moines River___--___ 10048. Discharge hydrographs at selected gaging stations in Der<
Moines River basin___---___-----------------___----- 10149. Effect of timing of Minnesota River peak on maximum dis
charge of Mississippi River at St. Paul, Minn___________ 11450. Flood frequency curves for selected Mississippi River gaging
stations ____________________________________________ 115
TABLES
TABLES 1-5. Flood-crest elevations: ?*&1. Mississippi River___-_-_-_--__--_---___-_-______ A522. North and South Forks Crow River_____________ 603. Minnesota River___-__---_-___-__--_______.-___ 714. South Fork Zumbro River and Zumbro River._____ 845. West Fork Des Moines River, April 6-13, 1965____- 101
6. Flood damages by States.-____--__---.-_-__-.____..__.__ 1077. Communities where flood damages exceeded $1 million_____ 1098. Effectiveness of reservoirs in upper Mississippi River basir
during flood of 1965_________________________________ 1129. Summary of flood stages and discharges.-________________ 120
FLOODS OF 1965 IN THE UNITED STATES
FLOODS OF MARCH-MAY 1965 IN THE UPPEP MISSISSIPPI RIVER BASIN
By D. B. ANDERSON and I. L. BURMEISTEE
ABSTRACT
The floods of March-May 1965 in the upper Mississippi Eiver basin occrirred as two different events, one during the latter part of February and early March and the other starting early in April and extending into May. Factors contribut ing to the floods were rapid melting of the winter accumulation of snow, heavy rains on the snow pack, and deeply frozen ground throughout much of the basin, which made the soil almost impervious and thereby greatly incrersed the amount of runoff.
Peak stages and discharges during the floods exceeded previous known maxima at many points. The maximum discharge at St. Paul, Minn., for example, was 137 percent of the previous known maximum, and the stage was 4 feet higher than the previous maximum during a period of known floods extend ing back to 1851. Flood magnitudes exceeding those corresponding to a 50-year recurrence interval occurred at 37 sites where discharge records have been collected.
Flood damage was estimated to be about $160 million in a five-State area comprising Minnesota, Wisconsin, Iowa, Illinois, and Missouri. Fifteen lives were lost and over 700 persons were injured or became ill as a result of the floods. More than 11,000 homes were flooded, and many thousand acres of rich agricultural land was inundated.
This report summarizes peak stages and discharges for this flood at 333 sites in the upper Mississippi River basin and presents the previous maxima at these sites where such data are available. The recurrence interval (the average period of time in which the 1965 flood is apt to be equaled or exceede-1 once) is tabulated for many sites. The report discusses flood damages and tabulates damage figures by States and by type of damage incurred. It also d'scusses briefly the effect of drainage and storage on flood peaks and describes the operations of the U.S. Geological Survey and other Federal agencies during the flood emergency.
INTRODUCTION
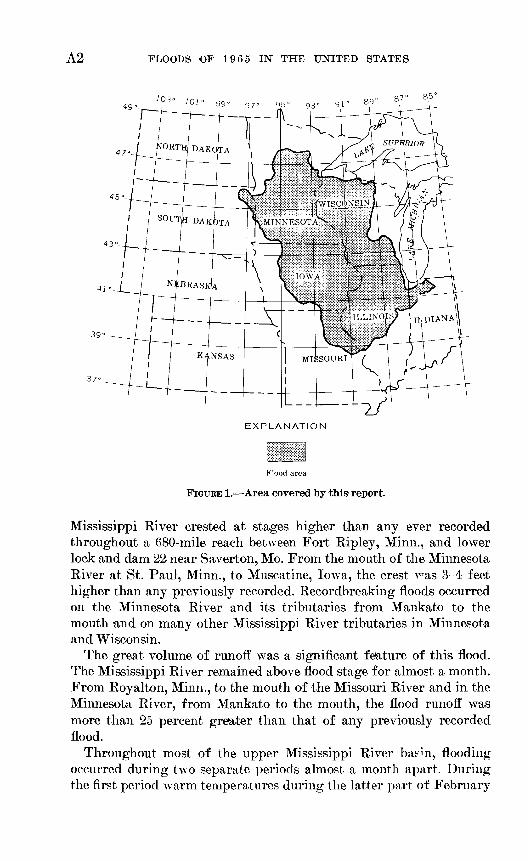
The floods of March-May 1965 were the most devastating in the history of the upper Mississippi River basin. Five States Minnesota, Wisconsin, Iowa, Illinois, and Missouri were affected (fig. 1). The
Al
A2 FLOODS OF 1965 IN THE UNITED STATES
49 =103« 101° 99
87" 85°
45
EXPLANATION
Flood area
FIGURE 1. Area covered by this report.
Mississippi River crested at stages higher than any ever recorded throughout a 680-mile reach between Fort Ripley, Minn., and lower lock and dam 22 near Saverton, Mo. From the mouth of the Minnesota River at St. Paul, Minn., to Muscatine, Io\va, the crest was 3-4 feet higher than any previously recorded. Recordbreaking floods occurred on the Minnesota River and its tributaries from Mankato to the mouth and on many other Mississippi River tributaries in Minnesota and Wisconsin.
The great volume of runoff was a significant feature of this flood. The Mississippi River remained above flood stage for almost a month. From Royalton, Minn., to the mouth of the Missouri River and in the Minnesota River, from Mankato to the mouth, the flood runoff was more than 25 percent greater than that of any previously recorded flood.
Throughout most of the upper Mississippi River baem, flooding occurred during two separate periods almost a month apart. During the first period warm temperatures during the latter part of February
MARCH-MAY, UPPER MISSISSIPPI RIVER BASIN A3
and early March melted the winters accumulation of snow in south eastern Minnesota, northeastern Iowa, southwestern Wisconsin. The runoff from snowmelt and rainfall, which in some areas exceeded 2 inches during the first 3 days in March, caused severe flooding in the Zumbro and Root Eiver basins in Minnesota and in the Cedar Eiver basin in Minnesota and Iowa. During the second period, which started early in April and extended into May, floods occurred in the entire upper Mississippi River basin. These floods were caused by the rapid melting of the winter's accumulation of snow in northern Mirnesota and Wisconsin and the March accumulation of snow in northerr Iowa, southern Minnesota and Wisconsin. The water equivalent of snow in the upper part of the basin was as much as 11 inches. Warm tempera tures moved northward into Minnesota during the last clays of March and nighttime temperatures remained above freezing. As much as 3 inches of rain fell during the period April 3-7; it accelerated the snowmelt and increased the runoff. Frost penetrated the ground deeply, as a result of the severe winter, and consequently much of the rain and snowmelt ran off. Those streams which flooded early in March flooded again, but this time more extensively. Many of the streams which were covered by snow and ice in March were raging torrents in full flood in April. Fifteen lives were lost and more than 700 person were injured as a result of the floods or associated events. Property damage was estimated at $160 million. Damage would have more than doubled had it not been for the flood warning and crest predictions issued by gov ernmental agencies and the enthusiastic response of thousands of volunteers who built emergency flood-protection works.
PURPOSE AND SCOPE
The purpose of this report is to provide a historical and statistical record of the extreme 1965 floods in the upper Mississippi River basin. Data presented may be used for planning and designing structures af fected by floodwaters and for studying hydrologic events. Flood data are provided for 333 sites (fig. 2). Discharges at 192 sites are tabulated on a daily basis or for increments of time within each day during the flood period so that the discharge hydrograph can be accurately recon structed. The antecedent and immediate conditions, flood descriptions, and damages are discussed by basins. If available, pictures of inundated areas in cities and towns are sihown. Discharge hydrographs at selected gaging stations are presented. The recurrence interval of the peak discharge or the ratio of the peak discharge to the theoretical flood hav ing a 50-year recurrence interval x is shown for many of the gaging
1 For simplicity of expression in this report, a flood with a given recurrence inte-val, say 50 years, is expressed as a 50-year flood.
96
Flo
od-d
ete
rmin
ati
on p
oin
t N
um
ber
cor
resp
ond*
to
that
in t
able
9
FIG
URE
2. L
ocat
ion
of f
lood
det
erm
inat
ion
site
s.
A6 FLOODS OF 1965 IN THE UNITED STATES
stations. Flood profiles for both the 1952 and 1965 floods in the Mis sissippi Eiver are shown from Royalton, Minn., to St. Louis, Mo., and flood profiles of some Mississippi River tributaries are shown for the 1965 flood.
ACKNOWLEDGMENTS
Discharge records and other flood data appearing in this report were collected as part of cooperative programs between th°s U.S. Geo logical Survey and the States of Minnesota, Wisconsin, Iowa, Illinois, and Missouri, the St. Paul, Rock Island, and St. Louis Districts of the U.S. Army Corps of Engineers; and the U.S. Bureau of Sport Fish eries and Wildlife. Other Federal and State agencies, municipalities and corporations gave assistance, financial or otherwise, in the col lection of flood data. Credit is given for this assistance ir the appro priate station description.
Isohyetal maps were prepared from data furnished t:y the U.S. Weather Bureau, and damage figures were furnished by the U.S. Army Corps of Engineers. Aerial photographs taken near the flood crests in the Minnesota and Mississippi River basins were obtained from Mark Hurd Aerial Surveys Inc. These photographs were helpful in defining inundated areas in some urban communities.
The basic data for this report were computed and compiled under the direction of the following district engineers or acting district engi neers of the Surface Water Branch, Water Resources Division: D. B. Anderson, Minnesota; K. B. Young, Wisconsin; H. H. S°/hwob suc ceeded by S. W. Wiitala, Iowa; W. D. Mitchell, Illinois; and A. Homyk, Missouri.
During the flood emergency, engineers and technicians of the U.S. Geological Survey were detailed to the Minnesota district from Ne braska, South Dakota, Ohio, California, and Michigan. Their assist ance is gratefully acknowledged.
FLOOD FORECASTS
On March 19, the ESSA-Weather Bureau Office at Minneapolis-St. Paul, Minn., forecast spring floods for the Mississippi River and its tributaries in Minnesota and in parts of Wisconsin and Iowa. At this time, although it was recognized that there was a flood potential, the condition was not considered serious. For example, the peak stage of of the Mississippi River at St. Paul, was predicted to be 16.5 feet, 2.5 feet above flood stage and 9.5 feet lower than the actual peak which occurred on April 16. On March 30, the Weather Bureau stated that "if snowmelt takes 3 days or more, Minnesota streams will not crest as high as 1952 even though the water content of snow on the ground is comparable." On April 7, owing to warm temperatures and exces-
MARCH-MAY, UPPER MISSISSIPPI RIVER BASIN A7
sive rainfall, the Minnesota River at Mankato, Minn., was predicted to crest at 26.5 feet on April 9, and the Mississippi River at St. Paul, Minn., was predicted to crest at 21.0 feet on April 14 or 15. F°!cause on-the-spot streamflow measurements indicated runoff greater than anticipated, on April 8, these predictions were revised to 3C.O feet at Mankato to occur April 10 and 27.0 feet at St. Paul to occur April 16. Actual peaks were 29.09 feet at Mankato and 26.01 feet at Sf- Paul on the dates predicted. On April 9, the Weather Bureau predicted that crests on the Mississippi River below St. Paul would exceed tH 1952 flood peaks at Winona, Minn., and La Crosse, Wis. A later prediction was issued on the morning of April 16 that the Mississippi R ; ver at St. Paul would crest at 26.9 feet on April 20. Actually, the cres^ at St. Paul occurred later in the day on April 16 and the additional C.9 foot stage did not materialize.
Throughout the period in which the preceding predictions were be ing made, the Weather Bureau stressed that rapid thawing and rain fall during the snowmelt would intensify the flood threat. Tempera tures were above freezing throughout most of the flood area during the first part of April when the Minnesota River and its tributaries reached their crests. During the first 14 days of April, precipitation ranged roughly from 2 to 4 inches over the Minnesota River basin and over much of the basin of the Mississippi River and its tributaries downstream from Minneapolis. Normal precipitation during April for this area is about 2 inches.
METEOROLOGICAL CONDITIONS CAUSING FLOODS
CONDITIONS PREVIOUS TO MARCH
Precipitation in the upper Mississippi River basin during the fall of 1964 was considerably higher than normal. For example, in Septem ber 1964, the U.S. Weather Bureau station at the Minneapolis-Sf . Paul airport recorded precipitation on 16 of the 30 days. The departure above normal at this station was 2.78 inches for the month. T> Q. sta tion at Mason City, Iowa, recorded 7.96 inches of precipitation in September, which was 4.76 inches above normal. Generally, above normal precipitation was recorded throughout the basin during Sep tember. Precipitation was below normal during October and Fovem- ber, but because of the heavy rains in September, the ground was well saturated when winter set in.
Temperatures through the first half of November were unseasonably mild; then they plunged and severe freezing ensued. Temperatures ranged widely during the month. Britt, Iowa, for example, observed a high of 78° and a low of 10°. Record low temperatures for November were observed at many Weather Bureau stations. Temperatures re-
1
10
20
31
10
20
31
10
20
28
10
20
31
1
DECEMBER
JANUARY FEBRUAR
Y MARC
H APF
FIGURE
3. Dail
y range
in
temperature at
four
U.S.
Weather Bureau
s
in
Minnesota
and
Iowa
for
the
period Decembe
r 1,
1946
, to
Apr
il 15
, 19( Si
£
r-
°
rt-
i-1
1 »
N>
l\>
3 O
O
O
-=
-p.
O>
00
4 0
0
0
C
MASON
,lll
, ,11
i.,,. hll
,1
.
o o
^=F
==
r ,
TE
MP
ER
AT
UR
E,
IN
DE
GR
EE
S F
AH
RE
NH
EIT
1 1
3O
OO
OO
OO
O
O
1 1
1 '
z m Z
Z
1
-
1 1
1 ~
->
CT0
C
H
13 Z
Z
|
i\
*, N>
N>
3
O
O
O
1 1
1
->
CT
0
C
H
O
=
c 0 z z
p=
-
> 00
MARCH-MAY, UPPER MISSISSIPPI RIVER BASIN A9
mained exceptionally low for much of the remainder of the winter (fig. 3). Frost penetration was unusually deep throughout irost of the upper Mississippi Eiver basin.
During December 1964 and January 1965, there was a normal amount of snowfall. An exceptional amount of sleet fell and glaze formed in Iowa during these 2 months. A January 24-hour rainfall record was broken when 5.11 inches of rain fell at Keokuk, Iowa, on New Year's day. The monthly precipitation at this station wrs 8.58 inches; it was the wettest January in 95 years. February precipitation in the southern half of Minnesota and Wisconsin exceeded the rormal by an inch or more. The rain that fell early in February in this area compacted the winter snowpack and materially increased its water equivalent. Most of the rain was absorbed in the snowpack or was re tained on the ground as a heavy glaze. The February precipitation in Illinois was generally below normal, but snow drifted heavily over most of the State on the 23d and 24th. A considerable amount of sleet fell and glaze formed in Iowa during February. Eain fell in the South ern counties and snow fell heavily in the northern and western counties, much of it over the glaze. A storm on the llth, the worst in years, deposited 10 inches of snow over glaze in the north-central part of the State. Frost penetration was deeper than normal and extended to 5 feet in this area. In Iowa, the winter of 1964-65 was the fourth coldest since 1935-36. Temperatures rose however, at the end of February and started melting the snow as far north as the Min- neapolis-St. Paul area in Minnesota, but did not begin to thaw the ground in the upper reaches of the Minnesota River basin.
MARCH CLIMATOLOGICAL EVENTS
The relatively warm temperatures at the end of February and during the first part of March created heavy snowmelt runoff in the Mississippi River basin in southeastern Minnesota, northeastern Iowa, and southwestern Wisconsin. Rainfall exceeded 2 inches at several Weather Bureau stations during the first 3 days of March. This combi nation of snowmelt and rainfall caused some of the highest floods of record in certain of the Mississippi River tributaries in southern Minnesota. The Cedar River at Austin, Minn,, and the Root River near Houston, Minn., had the highest stages of record during this flood.
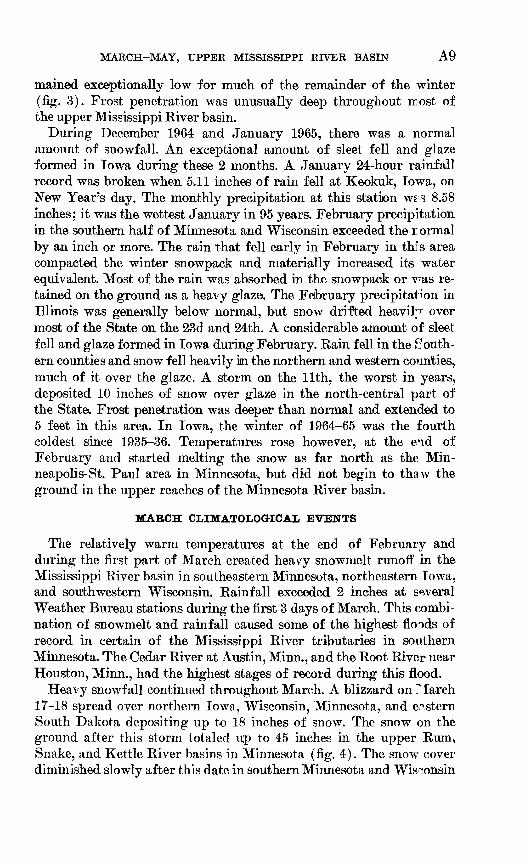
Heavy snowfall continued throughout March. A blizzard on ? larch 17-18 spread over northern Iowa, Wisconsin, Minnesota, and eastern South Dakota depositing up to 18 inches of snow. The snow on the ground after this storm totaled up to 45 inches in the upper Rum, Snake, and Kettle River basins in Minnesota (fig. 4). The snow cover diminished slowly after this date in southern Minnesota and Wisconsin
A10 FLOODS OF 1965 IN THE UNITED STATES
96° 94° 92
FIGURE 4. Snow cover on the ground as of March 18,19f 5.
and northern Iowa, but additional storms late in March maintained or increased the accumulation in northern Minnesota and Wisconsin. The water equivalent of the snow on the ground and the rate of thawing are important factors in forecasting runoff from snowmeH. The later that warm temperatures arrive in the spring, the greater the probabil ity of rapid thawing and heavy runoff. On the basis of snow surveys conducted by the Weather Bureau and Corps of Engineer? during the last 2 weeks in March, the water equivalent ranged from 2 inches in central Iowa to 11 inches in the vicinity of St. Cloud, Minn. (fig. 5).
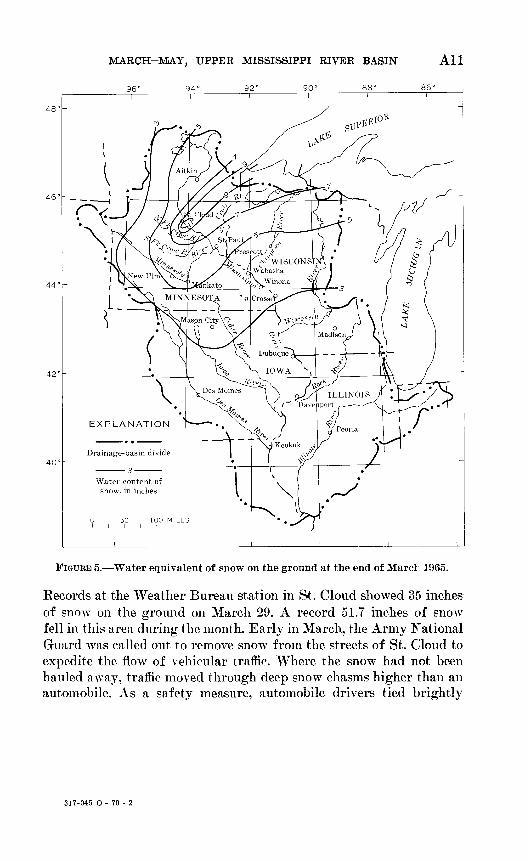
MARCH-MAY, UPPER MISSISSIPPI RIVER BASIN All
FIGURE 5. Water equivalent of snow on the ground at the end of Marc! 1965.
Records at the Weather Bureau station in St. Cloud showed 35 inches of snow on the ground on March 29. A record 51.7 inches of snow fell in this area during the month. Early in March, the Army National Guard was called out to remove snow from the streets of St. Cloud to expedite the flowr of vehicular traffic. Where the snow had not been hauled away, traffic moved through deep snow chasms higher than an automobile. As a safety measure, automobile drivers tied brightly
317-045 O - 70 - 2
A12 FLOODS OF 1965 IN THE UNITED STATES
colored streamers to their auto aerials to warn other drivers of their approach at intersections.
In many places in northern Wisconsin, the depth of snow on the ground on March 31 was the maximum recorded and was 2-4 inches above normal in water equivalent.
A study of Weather Bureau climatological data collected at Minne apolis, Minn., reveals some of the conditions prevalent in the upper Mississippi River basin during March. Precipitation at this station for the month was 4.75 inches or 1.38 inches more than tr°, previous March high in 1949. Snowfall amounted to 37.1 inches, which was only exceeded by 40 inches i'n March 1952. Snowfall for the season at the end of March was 71.7 inches compared to the seasonal record of 88.9 inches in 1950-51. Precipitation, most of it as rain, amounted to 1.62 inches on March 1. This was a new 24-hour record for March. Average temperature was 19.4°, which was 8° below normal, the second coldest average temperature on record, and the coldest since March 1899. Record-low daily minimum temperatures were equaled or broken on 5 days during March.
The extremely cold temperatures during most of March caused deep frost penetration. In the extreme upper part of the basin where heavy snow cover existed, the average penetration was 1 foot. Farther south, where little or no snow cover existed, frost penetrated to 5 feet in some areas. There was heavy precipitation during the first part of March, followed by below freezing temperatures which reached the subzero range during the period March 19-26. In some r.reas, there was a layer of ice on the ground from the storm on March 1 and previ ous storms. The frozen ground covered with glaze was a very impor tant factor in intensifying the spring flood of 1965.
In Iowa, two snowstorms with heavy snowfalls occurred on March 1-2 and on March 17-18. In the southern and central counti°s of Iowa, considerable sleet fell and ice formed as a result of the first storm, and in the northern counties, from 6 to 10 inches of snow fell. The second storm was concentrated in the northern part of Iowa and resulted in additional snow cover ranging from 4 to 12 inches. Snowfall in central and northern Iowa during the month of March was the fourth highest of record, and the average temperature at Des Moines for March was the second coldest of record. Below-normal temperatures continued until April 1. That part of Illinois which lies in the Mississippi River drainage basin had weather conditions similar to those in Iowa. As a result of the rainfall, snowfall and freezing temperatures, many of the small streams were locked with snow and ice in southeastern Minne-
MARCH-MAY, UPPER MISSISSIPPI RIVER BASIN A13
sota and northeastern Iowa. This obstruction of the smaller drainage channels had an effect on the timing of runoff and may have increased the flood intensity on some streams.
APEIL CLIMATOLOGICAL EVENTS
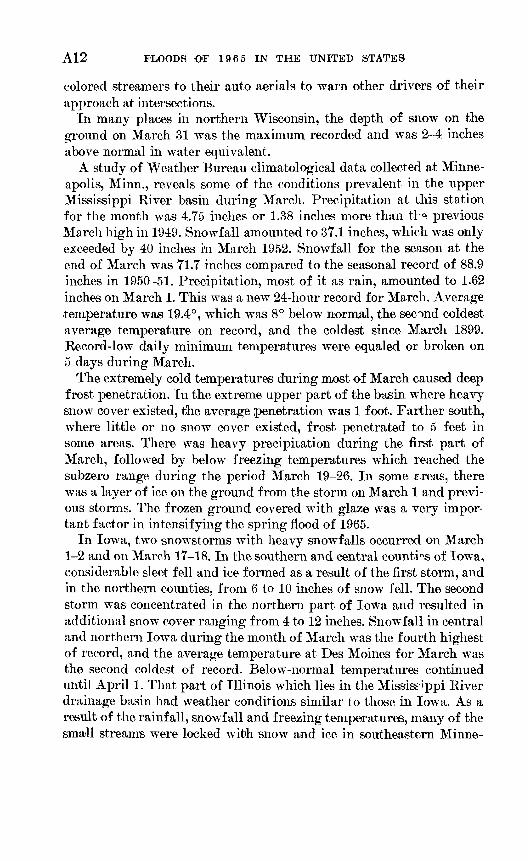
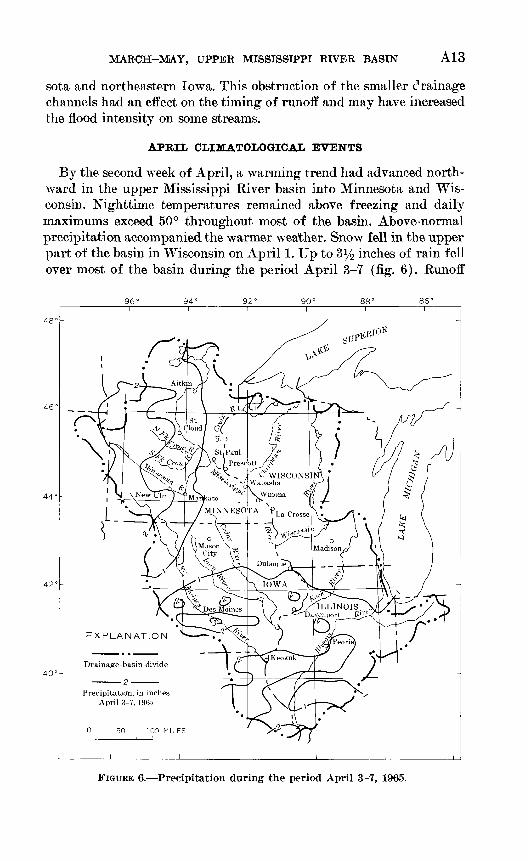
By the second week of April, a warming trend had advanced north ward in the upper Mississippi River basin into Minnesota and Wis consin. Nighttime temperatures remained above freezing and daily maximums exceed 50° throughout most of the basin. Above-normal precipitation accompanied the warmer weather. Snow fell in the upper part of the basin in Wisconsin on April 1. Up to 3% inches of rain fell over most of the basin during the period April 3-7 (fig. 6). Runoff
96°
44'
42
FIGURE 6. Precipitation during the period April 3-7, 1965.
A14 FLOODS OF 1965 IN THE UNITED STATES
from these widespread rains was intensified by snowirelt runoff. Snow melted steadily and was gone in Iowa and Illinois by April 6 and in the area south of St. Paul, Minn., by April 11. The snow melted slower in the extreme north. A 17-inch snow cover remained at Eagle River, Wis., on April 14, and a 10-inch cover remained at Grand Rapids, Minn., on April 11. All of the snow had melted by April 29.
The combination of rainfall and snowmelt during the first few days in April set the stage for the severe floods which were to follow. Large amounts of ponded water were visible in the Minnesota River basin downstream from New Ulm and also in the basins of the small tribu taries of the Mississippi River downstream from St. Paul. Personnel of the Corps of Engineers estimated from aerial observation that 40- 50 percent of the Crow River basin in Minnesota was covered by water. This ponded condition, which was accentuated by the flat topography of the basin, resulted from rainfall and snowmelt which could not run off freely through normal channels because they were obstructed by snow and ice. The ponding affected the timing of runoff from many of the smaller basins. There were extremely high rates1 of runoff because of the abnormally high precipitation, rapid snowmelt, and the impervious condition of the soil which was still deeply frozen and covered with ice throughout much of the basin.
Precipitation for April at North Mankato and New Ulm, Minn., was nearly 5 inches, which was 2i/£ inches above normal. In Iowa, the departure above normal was 1 inch in the north-central part of the State and 5 inches in the southeastern part. Exceptionally severe thun derstorms, accompanied by hail and tornadoes, dumped up to 6 inches of rain over an area between Marshalltown and Muscatin«', Iowa, on the 23d. This storm caused additional flooding in the area and hamp ered the Mississippi River flood fight on the already w^.ter-soaked levees. In Missouri and Illinois, showers and thunderstorms, during the period April 3-7, produced some rises on streams tributary to the Mississippi River. In general, these streams did not exceed bank-full stage. The widespread rains that fell in Illinois on April 15, 24, and 25 caused the Illinois River to rise above flood stage. Total precipita tion during the month in the upper Mississippi River basin is shown in figure 7.
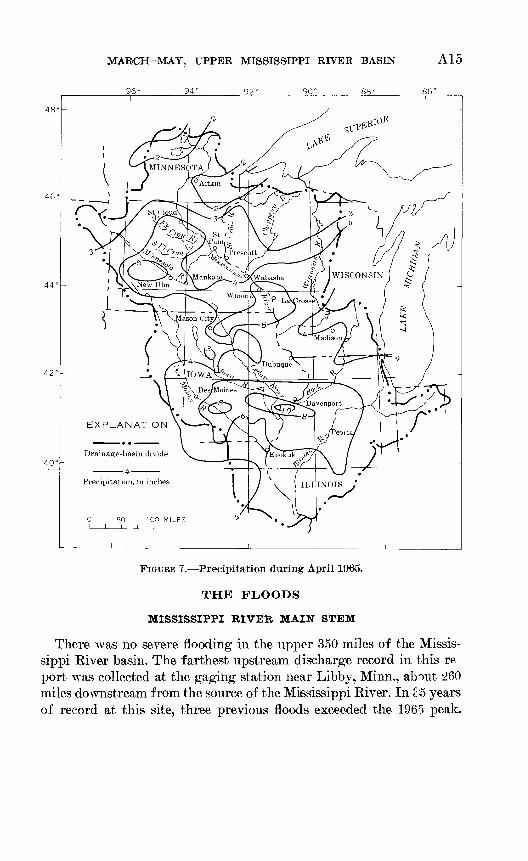
MARCH-MAY, UPPER MISSISSIPPI RIVER BASIN A15
40°-
FIGURE 7. Precipitation during April 1965.
THE FLOODS
MISSISSIPPI RIVER MAIN STEM
There was no severe flooding in the upper 350 miles of the Missis sippi River basin. The farthest upstream discharge record in this re port was collected at the gaging station near Libby, Minn., about 260 miles downstream from the source of the Mississippi River. In 25 years of record at this site, three previous floods exceeded the 1965 peak.
A16 FLOODS OP 1965 IN THE UNITED STATES
There are six headwater reservoirs on the main stem of the 1 lississippi River or its tributaries. These reservoirs, all in Minnesota, are Winni- bigoshish Lake near Deer River, Leech Lake at Federal Dam, Poke- gama Lake near Grand Rapids, Sandy Lake at Libby, Pine River Reservoir at Cross Lake, and Gull Lake near Brainerd. Data from Pine River Reservoir and Gull Lake are included in this report, and they show only a moderate amount of storage from the spring runoff. A diversion channel at Aitkin, 310 miles downstream from the source, handled the spring runoff well and reduced flood damages considerably in Aitkin and the surrounding area. The recurrence inteival of the peak discharge at Aitkin was 13 years.
In the 100-mile reach between Aitkin and Royalton, flood runoff became severe. At Fort Ripley, Minn., about 25 miles upstream from Royalton, the maximum stage was higher than any previously re corded. This situation prevailed for about 680 miles downstream to lower lock and dam 22 near Saverton, Mo.
Flood damage resulted from Mississippi River overflow in St. Cloud, Minn. Ice started breaking up above the mouth of the IS auk River and moved downstream to two bridges in St. Cloud where it jammed a'nd caused a sudden rise of 3-4 feet in river stage, which flooded 17th Street North to Third Street North. Fifth Avenue North was inun dated with 5 or 6 feet of water between Third Street and the water treatment plant. There was $50,000 worth of damage to the bridge at Sartell, just upstream from St. Cloud.
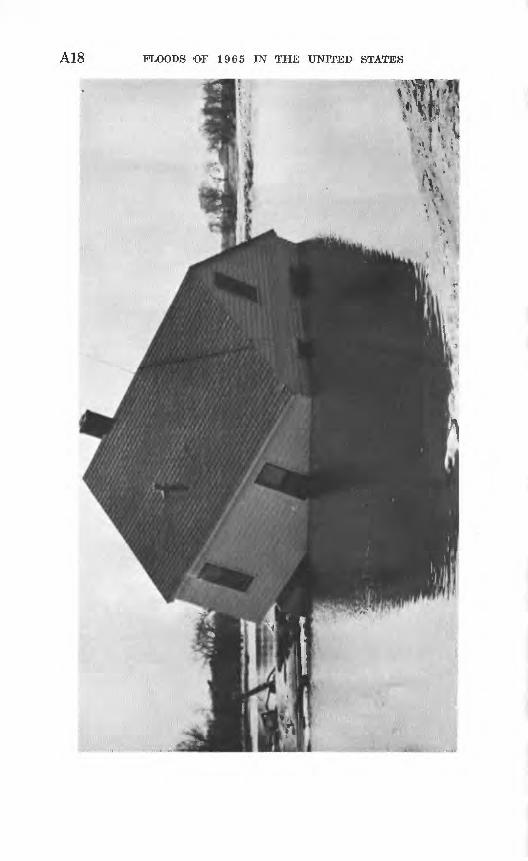
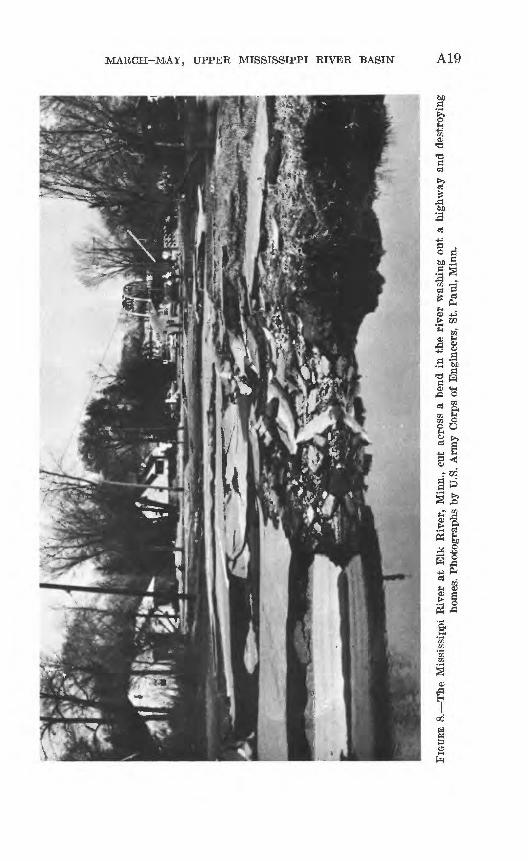
At the town of Elk River, Minn., the Mississippi River makes a sharp horseshoe bend. Water cut across the open end of the horseshoe washing out several hundred yards of highway, flooding 26 homes and severely damaging 14 of them (fig. 8). The stage at Elk River was 2.7 feet higher than the highest stage of the 1952 flood, which was the previous maximum during the period of record. The discharge was 1.23 times that of a 50-year flood. Downstream, at the gaging station near Anoka, the 1965 flood peak was 2.0 feet higher than the 1952 peak, the previous maximum in 34 years of record.
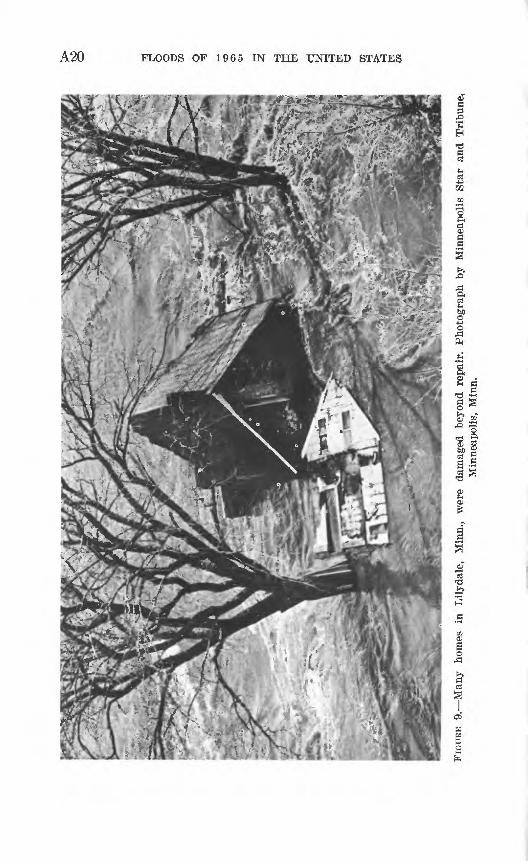
In Minneapolis, severe damage was inflicted on the Great Northern Railway stone arch bridge just downstream from St. Anthony Falls. The scouring of the flood waters caused one of the piers to settle; as a result the bridge needed extensive repairs. Lily dale, (fig. 9) a small, unincorporated community across the river from St. Paul and just downstream from the mouth of the Minnesota River, was flooded extensively. Floodwaters covered the town to a depth of 6-8 feet and swept some homes from their foundations. Many of the 33 homes in this community were damaged beyond repair.
At St. Paul, downstream from the mouth of the Minnesota River,
MARCH-MAY, UPPER MISSISSIPPI RIVER BASIN A17
the peak stage of 26.01 feet was the highest since at least 1851.2 It exceeded by 4 feet the 1952 peak stage which was the previous maxi mum. The 1965 peak discharge was 171,000 cfs (cubic feet per second); in 1952 it was 125,000 cfs. The recording gaging station on Shepard Road was inundated and rendered inoperative, but stages were read at frequent intervals dn a temporary staff gage. Flooding in St. Paul was intensified by the high discharge of the Minnesota River; the peak discharge of the Minnesota River was greater than the peak discharge of the Mississippi River above the mouth of the Minnesota River. It was fortunate, indeed, that the Minnesota and Mississippi Rivers did not crest concurrently at St. Paul; the Mississippi River peak above St. Paul occurred 6 days after the Minnesota River peak.
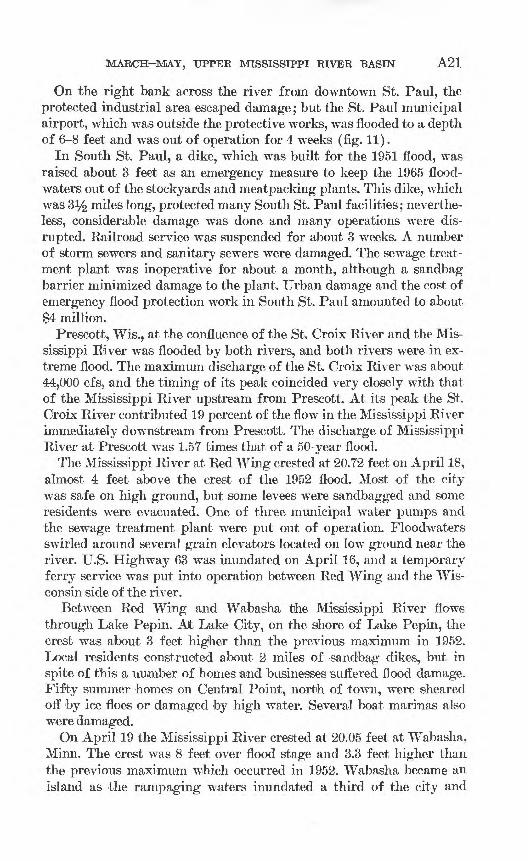
Damages, including the cost of flood fighting, exceeded $4 million in St. Paul. If flood protective works on both banks of the Mississippi River had not been constructed, additional damages would have been about $8 million, according to Corps of Engineers' estimates. About 800 persons were evacuated from low-lying areas in St. Paul. Local overflow, undermining, and seepage on the left river bank along Shep ard Road caused damage to industrial properties. Five of the flood- affected industries on Shepard Road, Northern States Power Co., In dustrial Steel Container Co., West Publishing Co., The Farmers' Un ion Grain Terminal Association, and Pure Oil Co., shared in the cost of reinforcing the dikes. Shepard Road and several other streets were inundated and closed to traffic (fig. 10). The Union Depot was closed to rail traffic for more than 2 weeks and the Minneapolis-St. Paul sew age treatment plant could not operate for 4 weeks. Water lapped at the foot of the Post Office Building and prevented the handling of mail. The Golden Garter, a night club atop the 95-year old Minnesota Boat Club on Navy Island, wanted to stay open but was closed by police order. The morning after it was closed, part of the upstream wall of the boat club gave way to the rushing waters which flovred across the island. The Navy Island Bridge, a small, 150-foot long, tim ber bridge, broke loose from its moorings and was carried downstream. In order to prevent the St. Paul Yacht Club on Harriet Island from becoming a hazard to two downstream bridges and many moored boats, it \vas dynamited. Not according to plan, the building caught fire, and burned to the waterline thus averting the threat that it posed.
2 Previous reports state that the period of known stages at St. Paul is "since at least 1870." A recent study by the Corps of Engineers of 1870 newspaper accounts and 1952 flood records reveals, however, that the 1870 peak stage and discharge were probably ex ceeded by the 1952 flood and were certainly exceeded by the 1965 flood. The 1870 newspaper accounts state that "a flood prevails which was only surpassed by that which occurred in the spring of 1851" ; so it seems safe to say that the 1965 flood was the greatest since at least 1851. Newspaper accounts of 1851 are also available, and they state that the 1851 peak was the greatest since 1832.
A18 FLOODS OF 1965 IN THE UNITED STATES
MARCH-MAY, UPPER MISSISSIPPI RIVER BASIN A19
aa a
%aeS4J
o ejfee .9 fl ^
> ui
roc §P
II« -a
& a
to o H
en
FIGU
RE
9.
Man
y
hom
es
in
Lily
dale
, M
inn.
, w
ere
dam
aged
be
yond
rep
air.
P
hoto
grap
h by
M
inne
apol
is
Sta
r an
d T
ribu
ne,
Min
neap
olis
, M
inn.
MARCH-MAY, UPPER MISSISSIPPI RIVER BASIN A21
On the right bank across the river from downtown St. Paul, the protected industrial area escaped damage; but the St. Paul municipal airport, which was outside the protective works, was flooded to a depth of 6-8 feet and was out of operation for 4 weeks (fig. 11).
In South St. Paul, a dike, which was built for the 1951 flood, was raised about 3 feet as an emergency measure to keep the 1965 flood- waters out of the stockyards and meatpacking plants. This dike, which was 31/2 miles long, protected many South St. Paul facilities; neverthe less, considerable damage was done and many operations were dis rupted. Railroad service was suspended for about 3 weeks. A number of storm sewers and sanitary sewers were damaged. The sewage treat ment plant was inoperative for about a month, although a sandbag barrier minimized damage to the plant. Urban damage and the cost of emergency flood protection work in South St. Paul amounted to about $4 million.
Prescott, Wis., at the confluence of the St. Croix River and the Mis sissippi Kiver was flooded by both rivers, and both rivers were in ex treme flood. The maximum discharge of the St. Croix River was about 44,000 cfs; and the timing of its peak coincided very closely with that of the Mississippi River upstream from Prescott. At its peak the St. Croix River contributed 19 percent of the flow in the Mississippi River immediately downstream from Prescott. The discharge of Mississippi River at Prescott was 1.57 times that of a 50-year flood.
The Mississippi River at Red Wing crested at 20.72 feet on April 18, almost 4 feet above the crest of the 1952 flood. Most of the city was safe on high ground, but some levees were sandbagged and some residents were evacuated. One of three municipal water pumps and the sewage treatment plant were put out of operation. Floodwaters swirled around several grain elevators located on low ground near the river. U.S. Highway 63 was inundated on April 16, and a temporary ferry service was put into operation between Red Wing and the Wis consin side of the river.
Between Red Wing and Wabasha the Mississippi River flows through Lake Pepin. At Lake City, on the shore of Lake Pepin, the crest was about 3 feet higher than the previous maximum in 1952. Local residents constructed about 2 miles of sandbag dikes, but in spite of this a number of homes and businesses suffered flood damage. Fifty summer homes on Central Point, north of town, were sheared off by ice floes or damaged by high water. Several boat marinas also were damaged.
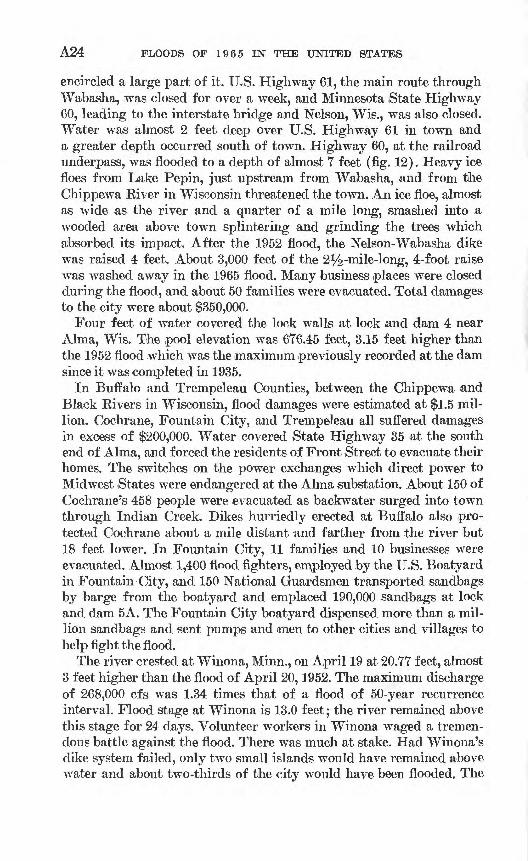
On April 19 the Mississippi River crested at 20.05 feet at Wabasha. Minn. The crest was 8 feet over flood stage and 3.3 feet higher than the previous maximum which occurred in 1952. Wabasha became an island as the rampaging waters inundated a third of the city and
A22 FLOODS OF 1965 IN THE UNITED STATES
MARCH-MAY, UPPER MISSISSIPPI RIVER BASIN A23
O 0)O Hi
02
G>
H
A24 FLOODS O'F 1965 IN THE UNITED STATES
encircled a large part of it. ILS. Highway 61, the main route through Wabasha, was closed for over a week, and Minnesota State Highway 60, leading to the interstate bridge and Nelson, Wis., was also closed. Water was almost 2 feet deep over U.S. Highway 61 in town and a greater depth occurred south of town. Highway 60, at the railroad underpass, was flooded to a depth of almost 7 feet (fig. 12). Heavy ice floes from Lake Pepin, just upstream from Wabasha, and from the Chippewa River in Wisconsin threatened the town. An ice floe, almost as wide as the river and a quarter of a mile long, smashed into a wooded area above town splintering and grinding the trees which absorbed its impact. After the 1952 flood, the Nelson-Wabasha dike was raised 4 feet. About 3,000 feet of the 2^-mile-long, 4-foot raise Avas washed away in the 1965 flood. Many business places were closed during the flood, and about 50 families were evacuated. Total damages to the city were about $350,000.
Four feet of water covered the lock walls at lock and dam 4 near Alma, Wis. The ,pool elevation was 676.45 feet, 3.15 feet higher than the 1952 flood which was the maximum previously recorded at the dam since it was completed in 1935.
In Buffalo and Trempeleau Counties, between the Chippewa and Black Rivers in Wisconsin, flood damages were estimated at $1.5 mil lion. Cochrane, Fountain City, and Trempeleau all suffered damages in excess of $200,000. Water covered State Highway 35 at the south end of Alma, and forced the residents of Front Street to evacuate their homes. The switches on the power exchanges which direct power to Midwest States were endangered at the Alma substation. About 150 of Cochrane's 458 people were evacuated as backwater surged into town through Indian Creek. Dikes hurriedly erected at Buffalo also pro tected Cochrane about a mile distant and farther from the river but 18 feet lower. In Fountain City, 11 families and 10 businesses were evacuated. Almost 1,400 flood fighters, employed by the U.S. Boatyard in Fountain City, and 150 National Guardsmen transported sandbags by barge from the boatyard and emplaced 190,000 sandbags at lock and dam 5A. The Fountain City boatyard dispensed more than a mil lion sandbags and sent pumps and men to other cities and villages to help fight the flood.
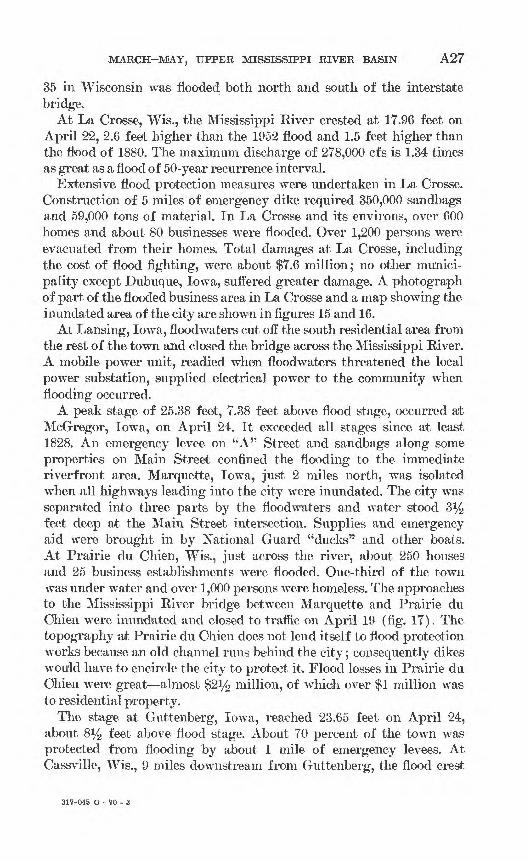
The river crested at Winona, Minn., on April 19 at 20.77 feet, almost 3 feet higher than the flood of April 20,1952. The maximum discharge of 268,000 cfs was 1.34 times that of a flood of 50-year recurrence interval. Flood stage at Winona is 13.0 feet; the river remained above this stage for 24 days. Volunteer workers in Winona waged a tremen dous battle against the flood. There was much at stake. Had Winona's dike system failed, only two small islands would have remained above water and about two-thirds of the city would have been flooded. The
MARCH-MAY, UPPER MISSISSIPPI RIVER BASIN A25
OS aOS §
a o o
A26 FLOODS OF 1965 IN THE UNITED STATES
flood-fighting effort was costly, about $2.6 million, but it probably prevented about $20 million in damages. Total damages to the city including the flood-fighting effort were $3.7 million.
The massive effort at Winona involved ringing the city with 9 miles of dikes at the 22-foot gage elevation. Some existing dikes were raised and new ones were built. Over 250,000 cubic yards of earth was re quired to build the dikes, and during peak periods of operation, over 400 trucks, bulldozers, earthmovers, power shovels, and draglines were used at one time. Dozens of pumps were required to remove water seeping through and under the floodwalls. On April 18 and 19 high winds and lapping waves threatened to destroy some critical sections of the dikes, but because sandbagging and earthfilling operations were accelerated the dikes held. Though there was no physical loss to the
510-city-block residential and business area, there was a substantial loss to business because of the disruption of transportation facilities and because of the diversion of many residents into flood-fighting work.
There was great danger also when storm sewers seemed about to erupt from the high water pressures. To counteract this threat, a pioneering effort was made by city officials who hired a professional diver to seal off critical storm sewers with inflatable rubber bags. This technique proved successful and was later used by several cities farther downstream. During the period when the eruption of storm sewers threatened, over a thousand persons were evacuated from the danger areas.
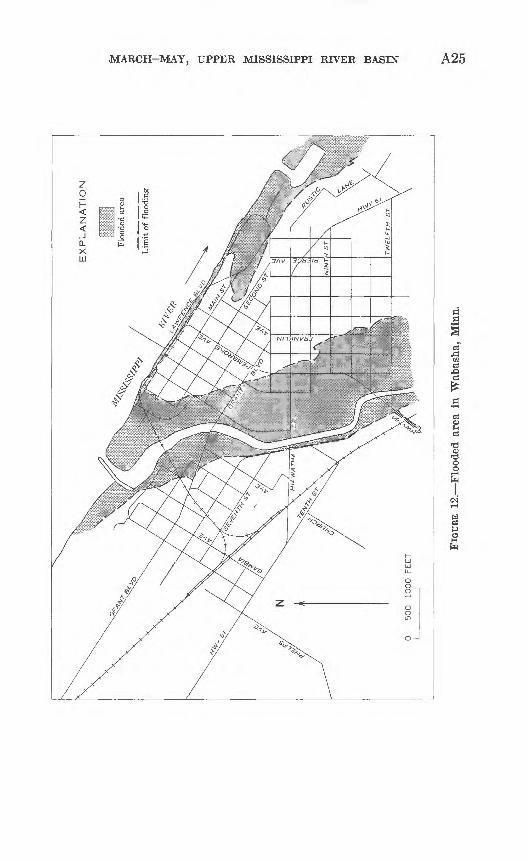
The area inundated in Winona at the flood crest is shown in figure 13.The flood prevented rail and air travel to Winona, and by April 15
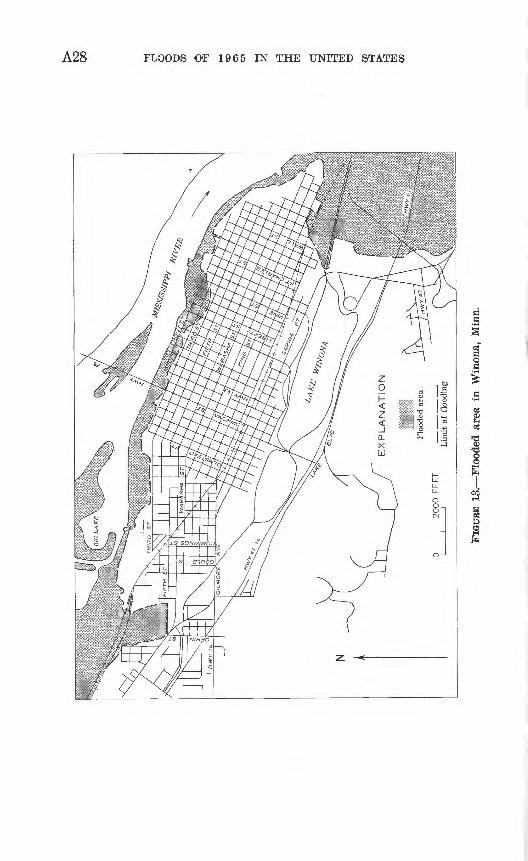
only buses remained in operation. Max Conrad Airport was under water. Railroad trackage suffered heavy damage. A break in the road bed of the Burlington track on the Wisconsin side upstream from Winona released water to a flood plain area of 5,000 acres on the Delta Fish and Fur Farm lands and may have reduced the peak at Winona somewhat. The water which poured into the flood plain undermined the dike which carried the tracks of the Green Bay and Western Railroad (fig. 14) and rejoined the main channel just across the river from Winona. The Burlington Railroad lost additional trackage farther downstream near Trempealeau. The Chicago and North Western Railway and the Milwaukee Railroad also suffered severe flood damage. Rail transportation into Winona resumed on April 27 during the flood's recession, but it was several days before all the railroads were back in operation.
The two main highways through Winona, U.S. Highways 61 and 14, remained open although Highway 61 was flooded to the north in the Wabasha area, Across the river from Winona, State Highway
MARCH-MAY, UPPER MISSISSIPPI RIVER BASIN A27
35 in Wisconsin was flooded both north and south of the interstate bridge.
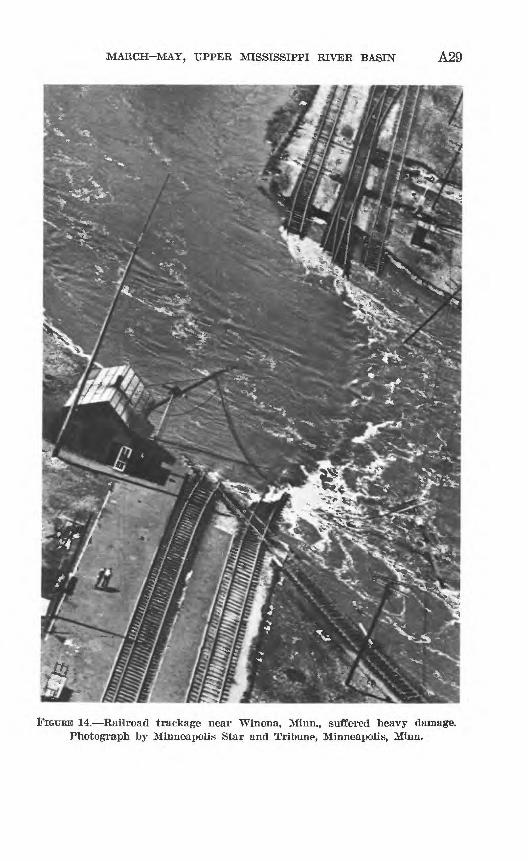
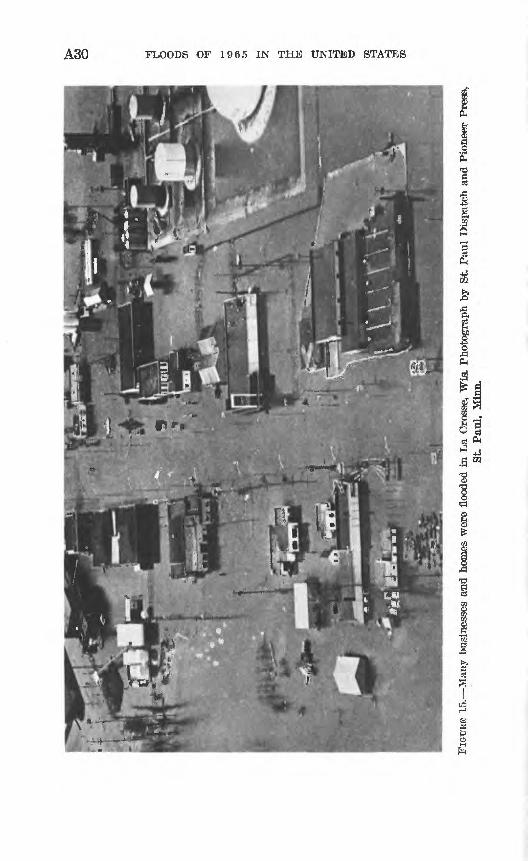
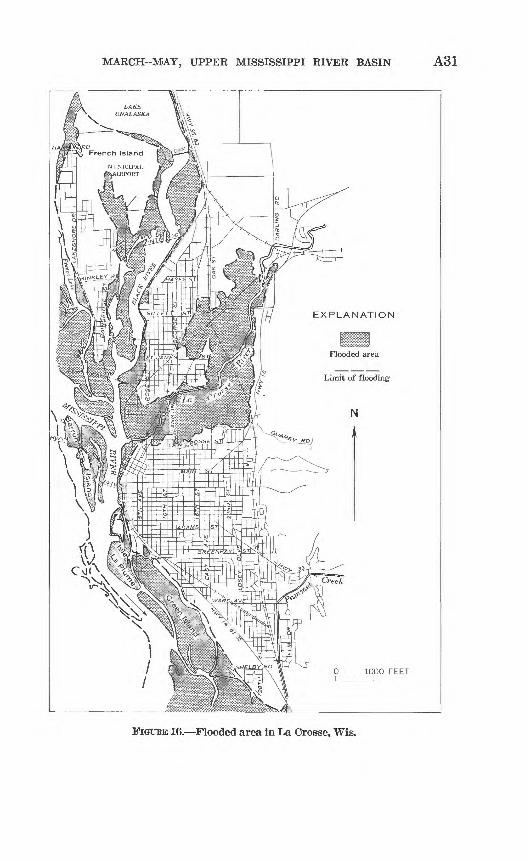
At La Crosse, Wis., the Mississippi Eiver crested at 17.96 feet on April 22, 2.6 feet higher than the 1952 flood and 1.5 feet higher than the flood of 1880. The maximum discharge of 278,000 cfs is 1.34 times as great as a flood of 50-year recurrence interval.
Extensive flood protection measures were undertaken in La Crosse. Construction of 5 miles of emergency dike required 350,000 sandbags and 59,000 tons of material. In La Crosse and its environs, over 600 homes and about 80 businesses were flooded. Over 1,200 persons were evacuated from their homes. Total damages at La Crosse, including the cost of flood fighting, were about $7.6 million; no other munici pality except Dubuque, Iowa, suffered greater damage. A photograph of part of the flooded business area in La Crosse and a map showing the inundated area of the city are shown in figures 15 and 16.
At Lansing, Iowa, floodwaters cut off the south residential area from the rest of the town and closed the bridge across the Mississippi River. A mobile power unit, readied when floodwaters threatened the local power substation, supplied electrical power to the community when flooding occurred.
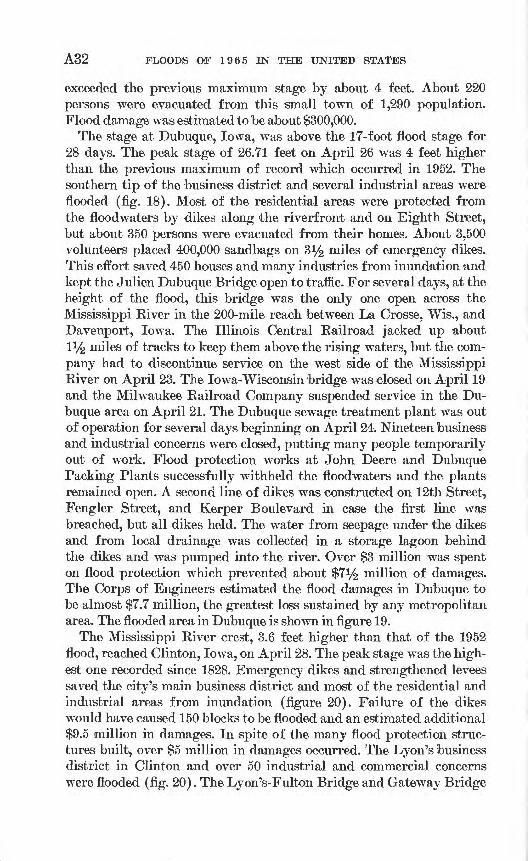
A peak stage of 25.38 feet, 7.38 feet above flood stage, occurred at McGregor, Iowa, on April 24. It exceeded all stages since at least 1828. An emergency levee on l'A" Street and sandbags along some properties on Main Street confined the flooding to the immediate riverfront area. Marquette, Iowa, just 2 miles north, was isolated when all highways leading into the city were inundated. The city was separated into three parts by the floodwaters and water stood 3% feet deep at the Main Street intersection. Supplies and emergency aid were brought in by National Guard "ducks" and other boats. At Prairie du Chien, Wis., just across the river, about 250 houses and 25 business establishments were flooded. One-third of the town was under water and over 1,000 persons were homeless. The approaches to the Mississippi River bridge between Marquette and Prairie du Ohien were inundated and closed to traffic on April 19 (fig. 17). The topography at Prairie du Chien does not lend itself to flood protection works because an old channel runs behind the city; consequently dikes would have to encircle the city to protect it. Flood losses in Prairie du Ohien were great almost $21^ million, of which over $1 million was to residential property.
The stage at Guttenberg, Iowa, reached 23.65 feet on April 24, about 8l/2 feet above flood stage. About 70 percent of the town was protected from flooding by about 1 mile of emergency levees. At Cassville, Wis., 9 miles downstream from Guttenberg, the flood crest
317-045 O - 70 - 3
1 i
FIGU
RE 1
3. F
lood
ed a
rea
in W
inon
a, M
inn.
MARCH-MAY, UPPER MISSISSIPPI RIVER BASIN A29
FIGURE 14. Railroad trackage near Winona, Minn,, suffered heavy damage. Photograph by Minneapolis Star and Tribune, Minneapolis, Minn.
A30 FLOODS OF 1965 IN THE UNITED STATES
&
a
ICLI
MARCH-MAY, UPPER MISSISSIPPI RIVER BASIN A31
FIGUKE 16. Flooded area in La Orosse, Wis.
A32 FLOODS OF 1965 IN THE UNITED STATES
exceeded the previous maximum stage by about 4 feet. About 220 persons were evacuated from this small town of 1,290 population. Flood damage was estimated to be about $300,000.
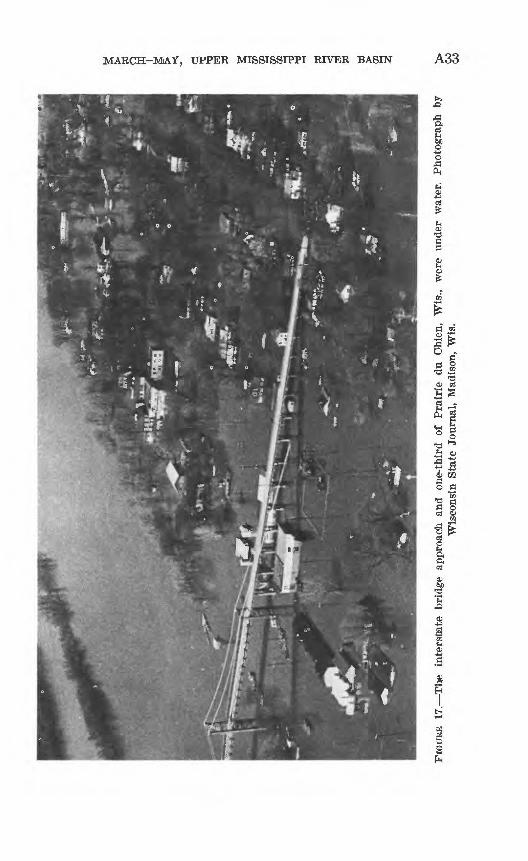
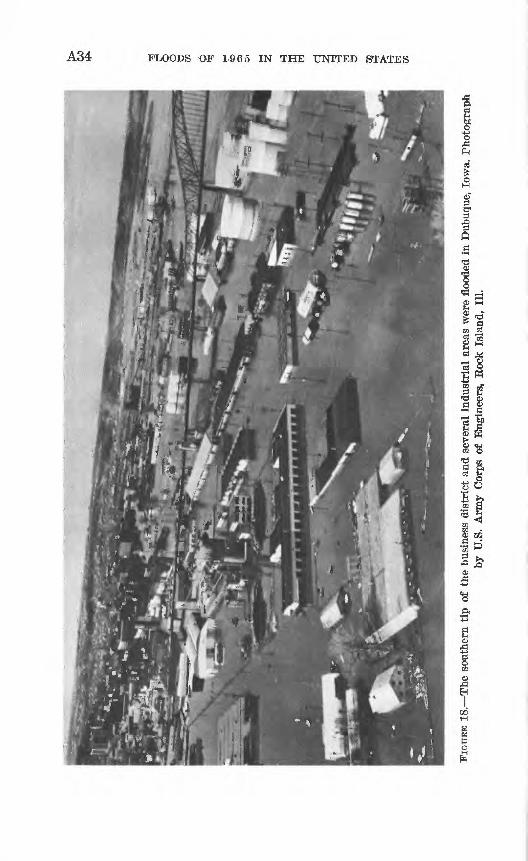
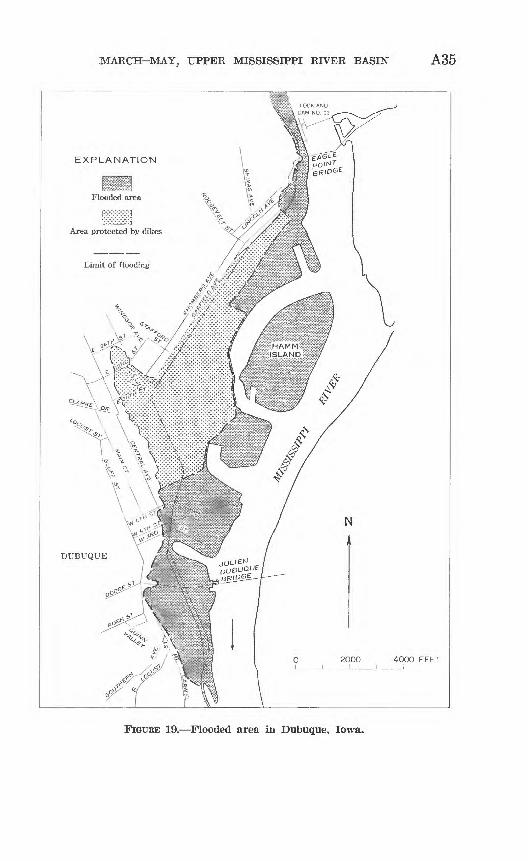
The stage at Dubuque, Iowa, was above the 17-foot flood stage for 28 days. The peak stage of 26.71 feet on April 26 was 4 feet higher than the previous maximum of record which occurred in 1952. The southern tip of the business district and several industrial areas were flooded (fig. 18). Most of the residential areas were protected from the floodwaters by dikes along the riverfront and on Eighth Street, but about 350 persons were evacuated from their homes. About 3,500 volunteers placed 400,000 sandbags on 3i/£ miles of emergency dikes. This effort saved 450 houses and many industries from inundation and kept the Julien Dubuque Bridge open to traffic. For several days, at the height of the flood, this bridge was the only one open across the Mississippi River in the 200-mile reach between La Crosse, Wis., and Davenport, Iowa. The Illinois Central Railroad jacked up about ll/2 miles of tracks to keep them above the rising waters, but the com pany had to discontinue service on the west side of the Mississippi River on April 23. The Iowa-Wisconsin bridge was closed on April 19 and the Milwaukee Railroad Company suspended service in the Du buque area on April 21. The Dubuque sewage treatment plant was out of operation for several days beginning on April 24. Nineteen business and industrial concerns were closed, putting many people temporarily out of work. Flood protection works at John Deere and Dubuque Packing Plants successfully withheld the floodwaters and the plants remained open. A second line of dikes was constructed on 12th Street, Fengler Street, and Kerper Boulevard in case the first line was breached, but all dikes held. The water from seepage under the dikes and from local drainage was collected in a storage lagoon behind the dikes and was pumped into the river. Over $3 million was spent on flood protection which prevented about $71/£ million of damages. The Corps of Engineers estimated the flood damages in Dubuque to be almost $7.7 million, the greatest loss sustained by any metropolitan area. The flooded area in Dubuque is shown in figure 19.
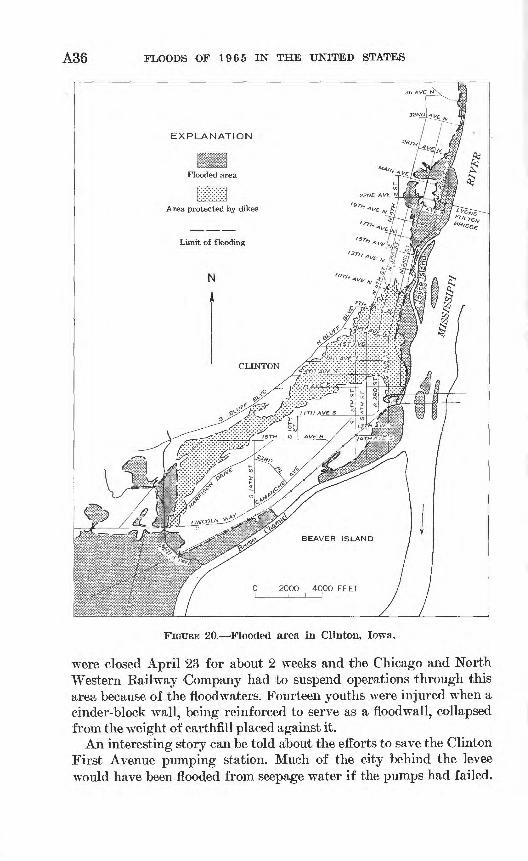
The Mississippi River crest, 3.6 feet higher than that of the 1952 flood, reached Clinton, Iowa, on April 28. The peak stage was the high est one recorded since 1828. Emergency dikes and strengthened levees saved the city's main business district and most of the residential and industrial areas from inundation (figure 20). Failure of the dikes would have caused 150 blocks to be flooded and an estimated additional $9.5 'million in damages. In spite of the many flood protection struc tures built, over $5 million in damages occurred. The Lyon's business district in Clinton and over 50 industrial and commercial concerns were flooded (fig. 20). The Lyon's-Fulton Bridge and Gateway Bridge
MARCH-MAY, UPPER MISSISSIPPI RIVER BASIN A33
tS
-4-1 O ft
l aOJ Cj
02§ s-a Io 5eS tj
A34 FLOODS OF L965 IN THE UNITED STATES
8?
cr
MARCH-MAY, UPPER MISSISSIPPI RIVER BASIN A35
EXPLANATION
Flooded area
Area protected by dikes
Limit of flooding"
DUBUQUE
4000 FEET
FIGURE 19. Flooded area in Dubuque, Iowa.
A36 FLOODS OF 1965 IN THE UNITED STATES
Area protected by dikes
Limit of flooding
FIGITRE 20. Flooded area in Clinton, Iowa.
were closed April 23 for about 2 weeks and the Chicago and North Western Railway Company had to suspend operations through this area because of the floodwaters. Fourteen youths were injured when a cinder-block wall, being reinforced to serve as a floodwall, collapsed from the weight of earthfill placed against it.
An interesting story can be told about the efforts to save the Clinton First Avenue pumping station. Much of the city behind the levee would have been flooded from seepage water if the pumps had failed.
MARCH-MAY, UPPER MISSISSIPPI RIVER BASIN A37
The sandbagged station, resembling a fortified island in the rampag ing waters became known as Fort Johannsen, named after Lt. Jo- hannsen of the Iowa National Guard. He, along with a band of fellow National Guardsmen, manned the station day after day and kept the pumps operating and the dikes intact.
Another interesting story was that of "Silent Henry" Steele. Silent Henry, about 72 years old, had lived for 30 years on his small island near Clinton. Throughout the 1965 flood, he floated above his shack on a raft tied to the top of a tree; he not only refused evacuation but also any assistance for food and supplies.
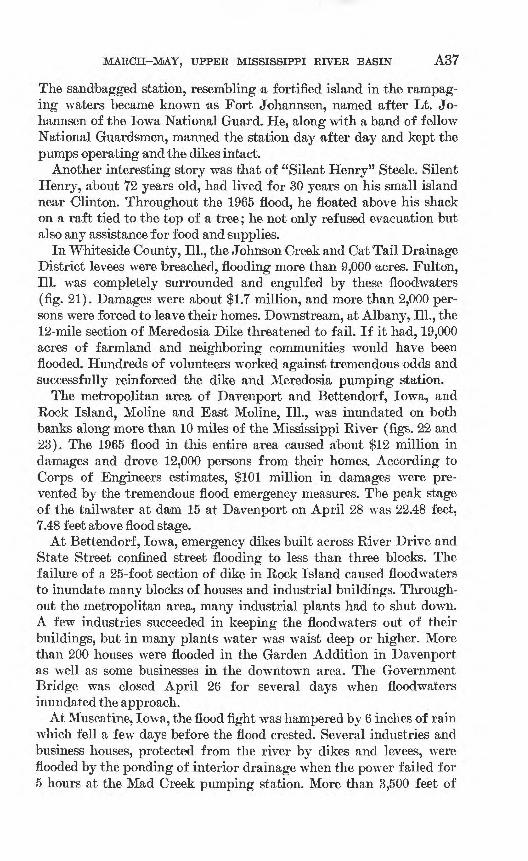
In Whiteside County, 111., the Johnson Creek and Cat Tail Drainage District levees were breached, flooding more than 9,000 acres. Fulton, 111. was completely surrounded and engulfed by these floodwaters (fig. 21). Damages were about $1.7 million, and more than 2,000 per sons were forced to leave their homes. Downstream, at Albany, 111., the 12-mile section of Meredosia Dike threatened to fail. If it had, 19,000 acres of farmland and neighboring communities would have been flooded. Hundreds of volunteers worked against tremendous odds and successfully reinforced the dike and Meredosia pumping station.
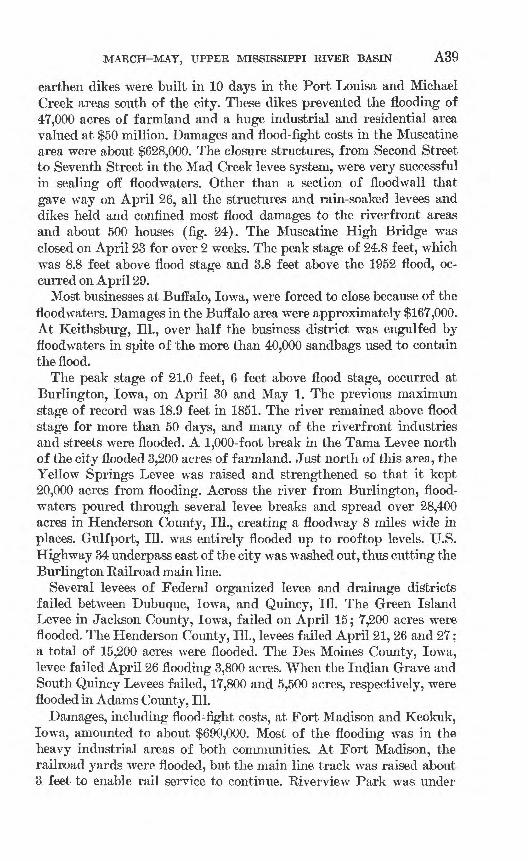
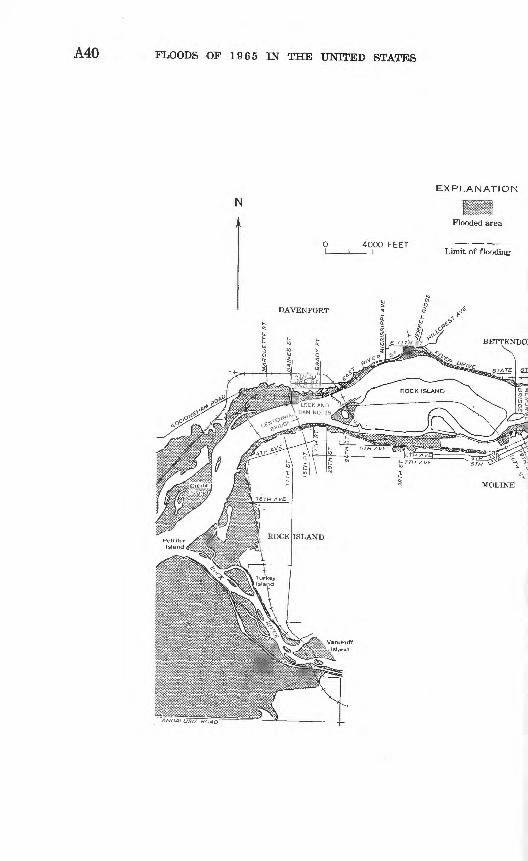
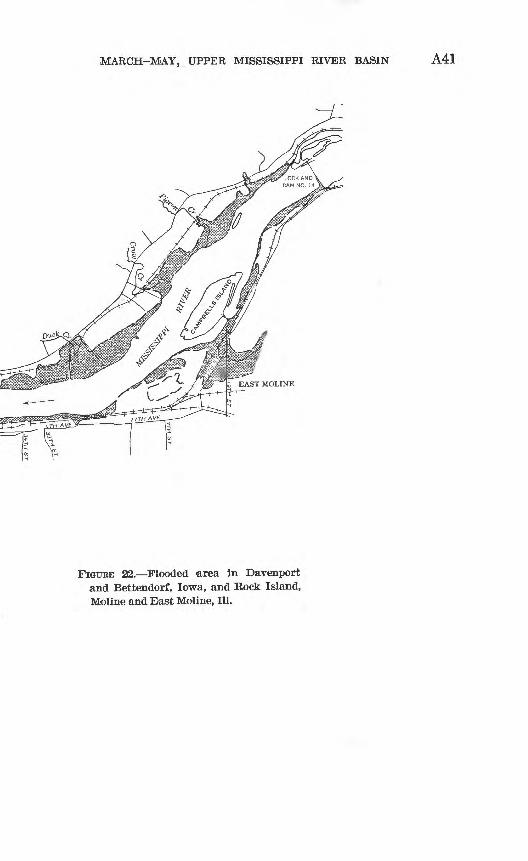
The metropolitan area of Davenport and Bettendorf, Iowa, and Rock Island, Moline and East Moline, 111., was inundated on both banks along more than 10 miles of the Mississippi River (figs. 22 and 23). The 1965 flood in this entire area caused about $12 million in damages and drove 12,000 persons from their homes. According to Corps of Engineers estimates, $101 million in damages were pre vented by the tremendous flood emergency measures. The peak stage of the tailwater at dam 15 at Davenport on April 28 was 22.48 feet, 7.48 feet above flood stage.
At Bettendorf, Iowa, emergency dikes built across River Drive and State Street confined street flooding to less than three blocks. The failure of a 25-foot section of dike in Rock Island caused floodwaters to inundate many blocks of houses and industrial buildings. Through out the metropolitan area, many industrial plants had to shut down. A few industries succeeded in keeping the floodwaters out of their buildings, but in many plants water was waist deep or higher. More than 200 houses were flooded in the Garden Addition in Davenport as well as some businesses in the downtown area. The Government Bridge was closed April 26 for several days when floodwaters inundated the approach.
At Muscatine, Iowa, the flood fight was hampered by 6 inches of rain which fell a few days before the flood crested. Several industries and business houses, protected from the river by dikes and levees, were flooded by the ponding of interior drainage when the power failed for 5 hours at the Mad Creek pumping station. More than 3,500 feet of
CO
00
CO
FIG
URE
21. F
ult
on,
111.,
w
as
surr
ound
ed a
nd e
ngul
fed
by f
lood
wat
ers.
V
iew
of
sout
heas
tern
pa
rt o
f to
wn,
Apr
il 27
, 19
65.
Pho
togr
aph
by
U.S
. A
rmy
Cor
ps
of
Eng
inee
rs,
Roc
k Is
land
, 11
1.
MARCH-MAY, UPPER MISSISSIPPI RIVER BASEST A39
earthen dikes were built in 10 days in the Port Louisa and Michael Creek areas south of the city. These dikes prevented the flooding of 47,000 acres of farmland and a huge industrial and residential area valued at $50 million. Damages and flood-fight costs in the Muscatine area were about $628,000. The closure structures, from Second Street to Seventh Street in the Mad Creek levee system, were very successful in sealing off floodwaters. Other than a section of floodwall that gave way on April 26, all the structures and rain-soaked levees and dikes held and confined most flood damages to the riverfront areas and about 500 houses (fig. 24). The Muscatine High Bridge was closed on April 23 for over 2 weeks. The peak stage of 24.8 feet, which was 8.8 feet above flood stage and 3.8 feet above the 1952 flood, oc curred on April 29.
Most businesses at Buffalo, Iowa, were forced to close because of the floodwaters. Damages in the Buffalo area were approximately $167,000. At Keithsburg, 111., over half the business district was engulfed by floodwaters in spite of the more than 40,000 sandbags used to contain the flood.
The peak stage of 21.0 feet, 6 feet above flood stage, occurred at Burlington, Iowa, on April 30 and May 1. The previous maximum stage of record was 18.9 feet in 1851. The river remained above flood stage for more than 50 days, and many of the riverfront industries and streets were flooded. A 1,000-foot break in the Tama Levee north of the city flooded 3,200 acres of farmland. Just north of this area, the Yellow Springs Levee was raised and strengthened so that it kept 20,000 acres from flooding. Across the river from Burlington, flood- waters poured through several levee breaks and spread over 28,400 acres in Henderson County, 111., creating a floodway 8 miles wide in places. Gulfport, 111. was entirely flooded up to rooftop levels. U.S. Highway 34 underpass east of the city was washed out, thus cutting the Burlington Railroad main line.
Several levees of Federal organized levee and drainage districts failed between Dubuque, Iowa, and Quincy, 111. The Green Island Levee in Jackson County, Iowa, failed on April 15; 7,200 acres were flooded. The Henderson County, 111., levees failed April 21, 26 and 27; a total of 15,200 acres were flooded. The Des Moines County, Iowa, levee failed April 26 flooding 3,800 acres. When the Indian Grave and South Quincy Levees failed, 17,800 and 5,500 acres, respectively, were flooded in Adams County, 111.
Damages, including flood-fight costs, at Fort Madison and Keokuk, Iowa, amounted to about $690,000. Most of the flooding was in the heavy industrial areas of both communities. At Fort Madison, the railroad yards were flooded, but the main line track was raised about 3i feet to enable rail service to continue. Riverview Park was under
A40 FLOODS OP 1965 IN THE UNITED STATES
4000 FEET
EXPLANATION
Flooded area
Limit of flooding
MARCH-MAY, UPPER MISSISSIPPI RIVER BASIN A41
K EAST MOLINE
FIGTTEE 22. Flooded area in Davenport and Bettendorf, Iowa, and Rock Island, Moline and East Moline, 111.
A42 FLOODS OF 1965 IN THE UNITED STATES
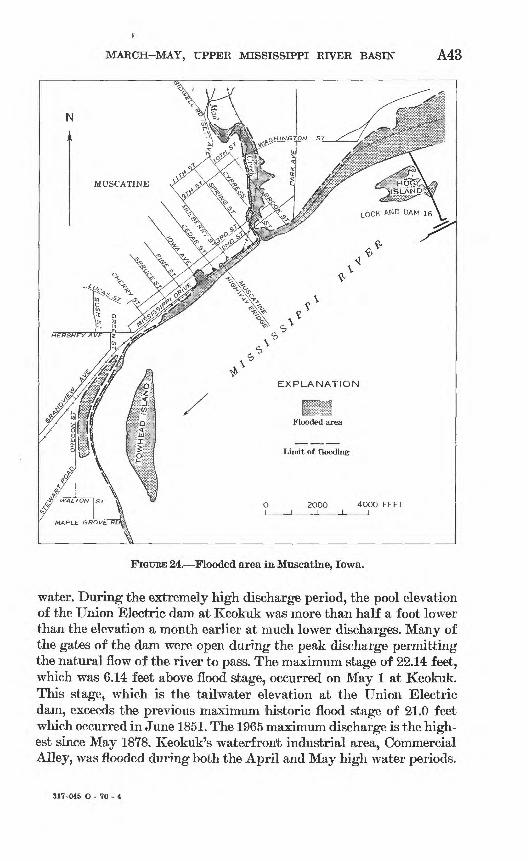
MARCH-MAY, UPPER MISSISSIPPI RIVER BASIN A43
O 2OOO 4OOO FEETI I I 1 I
FIGURE 24. Flooded area in Muscatine, Iowa.
water. During the extremely high discharge period, the pool elevation of the Union Electric dam at Keokuk was more than half a foot lower than the elevation a month earlier at much lower discharges. Many of the gates of the dam were open during the peak discharge permitting the natural flow of the river to pass. The maximum stage of 22.14 feet, which was 6.14 feet above flood stage, occurred on May 1 at Keokuk. This stage, which is the tailwater elevation at the Union Electric dam, exceeds the previous maximum 'historic flood stage of 21.0 feet which occurred in June 1851. The 1965 maximum discharge is the high est since May 1878. Keokuk's waterfront industrial area, Commercial Alley, was flooded during both the April and May high water periods.
317-045 O - 70 - 4
A44 FLOODS OF 1965 IN THE UNITED STATES
aa
53
*§ A o"§
MARCH-MAY, UPPER MISSISSIPPI RIVER BASIN A45
All waterfront industries except one closed for 2-3 weeks. Over 1,000 persons were temporarily dismissed from work. Downstream from the Union Electric dam at Keokuk, Iowa, there were two major crests on the Mississippi River during the period March-May 1965. The, first crest occurred in April as a result of high inflow from the Des Moines River and other tributaries. The second crest occurred early in May. The May crest exceeded the April crest except in the reach between La Grange and Palmyra, Mo., where levee breaks lowered the, peak stage in May, and in the reach downstream from Grafton, 111., where less backwater from the Missouri River, occurred in May.
Downstream from Mundy's Landing, Mo., the 1965 crest was lower than the previously known maximum at each point of determination. Two peaks about equal in discharge occurred at Alton, 111., on April 19 and May 13. Higher peaks discharged at Alton in 1943 and 1944, and a peak discharge in 1947 was equal to that of 1965, but in each of the 3 earlier years, overflow from the Missouri River, caused by levee breaks, entered the Mississippi River upstream from Alton. After deducting this overflow, the peak discharges in 1943, 1944, and 1947 were lower than the peak discharge in 1965 when there was nc over flow. The peak discharge of 380,000 cfs at Alton has a recurrence inter val of 11 years.
The 1965 maximum discharge at St. Louis, below the mouth of the Missouri River, was 525,000 cfs on April 16, about equal to a 2-year flood. This peak was relatively small because the Missouri River, which is now extensively regulated, did not contribute greatly to the flood condition. The Missouri River inflow was greater in April than in May, and as a, result the maximum discharge at St. Louis occurred during the April peak. The highest discharge at St. Louis in May was 431,000 cfs on May 1.
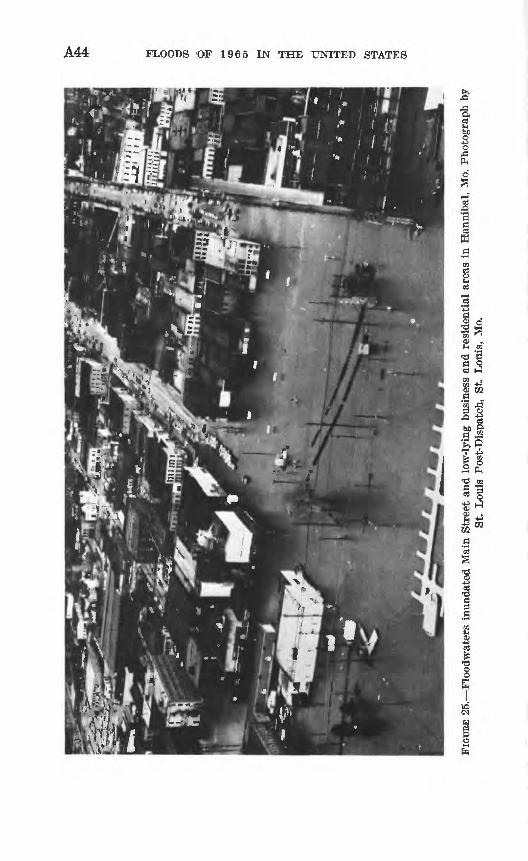
Most of the flood damage below Keokuk, Iowa, resulted from inun dation of farmland, river cottages, highways, and business houses. The residents of Alexandria, Mo., were evacuated during both the April and May crests. The system of previously constructed levees, flood- walls, pumping plants, and closure structures successfully protected Canton, Mo., and prevented more than $2 million damages. Quincy, 111., incurred damages of about $367,000 including cost of flood fighting. The floodwaters in April and May inundated Main Street and low- lying business and residential areas in Hannibal, Mo. (fig. 25). Sand bagged storefronts and improvised walkways permitted most stores to remain open for business. Hannibal incurred damages ?nd flood- fighting costs of about $875,000. The Mark Twain Memorial Bridge at Hannibal and U.S. Highway 36 in Kinderbrook, 111., were closed. The main river levee failed near Saverton, Mo., and the floodwaters spread
A46
1060
1020
980
940
900
980
FLOODS OF 1965 IN THE UNITED STATES
EXPLANATION
o 1965X 1952
Floodmark elevation
Flood of 1965
Flood of 1952
i i i
C V= M 2 "3
970 960 950 940 930 920
DISTANCE, IN MILES UPSTREAM FROM MOUTH OF OHIO R
910 900
940
900
860
820
< 780
740
700
900 890 880 870 860 850 840 830 820
DISTANCE, IN MILES UPSTREAM FROM MOUTH OF OHIO RIVER
MARCH-MAY, UPPER MISSISSIPPI RIVER BASIN A47
820 810 800 790 780 770 760
DISTANCE, IN MILES UPSTREAM FROM MOUTH OF OHIO RIVER
750
680
w 660 -
- 640 -
620 £
740 730 720 710 700 690 680
DISTANCE, IN MILES UPSTREAM FROM MOUTH OF OHIO RIVER
660
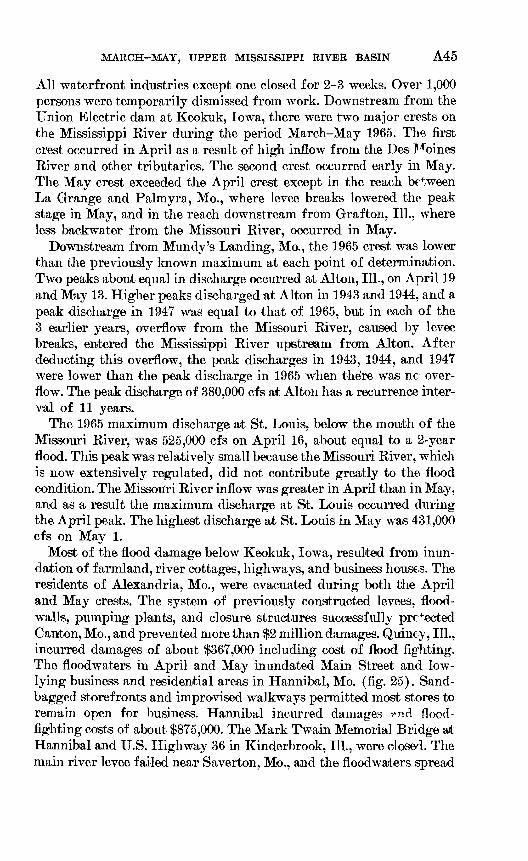
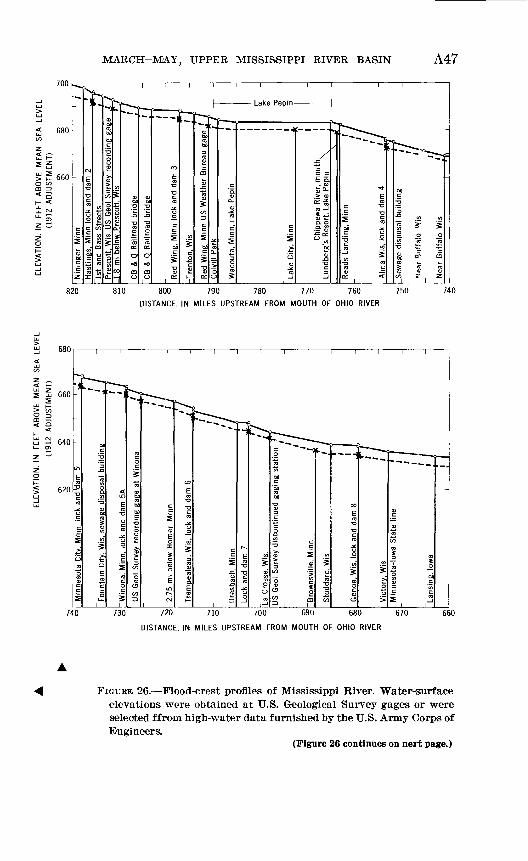
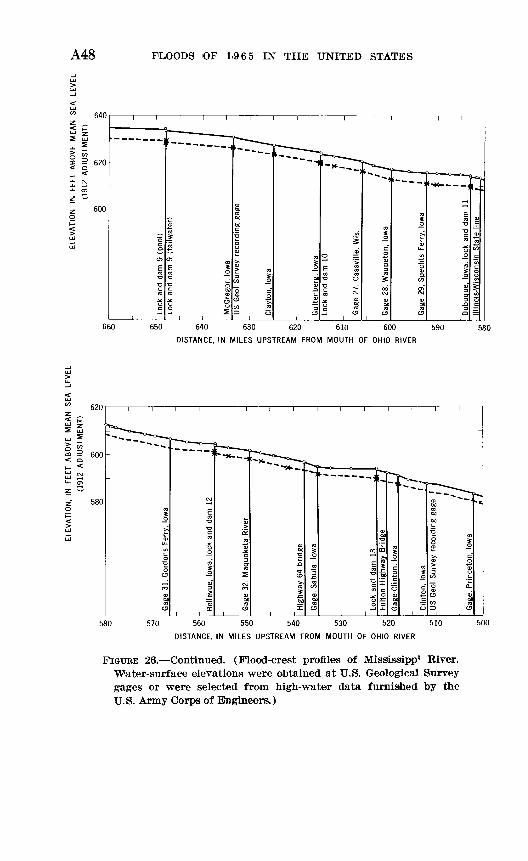
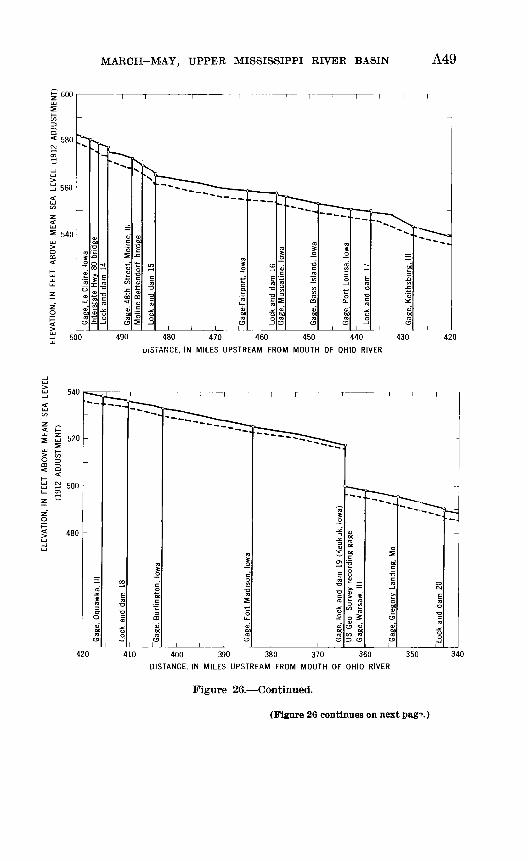
FIGURE 26. Flood-crest profiles of Mississippi River. Water-surface elevations were obtained at U.S. Geological Survey gages or were selected ffrom high-water data furnished by the U.S. Army Corps of Engineers.
(Figure 26 continues on nert page.)
ELE
VA
TIO
N,
IN
FEET
AB
OVE
M
EA
N
SEA
LEV
EL
(191
2 A
DJU
STM
EN
T)E
LEV
ATI
ON
, IN
FE
ET
ABO
VE
ME
AN
SE
A LE
VE
L
(191
2 A
DJU
STM
EN
T)
H»
O
S
-Gag
e 32
, M
aquo
keta
Riv
er
Gag
e 31
, G
ordo
ns F
erry
, Io
wa
Bel
levu
e, I
owa,
loc
k an
d da
m
12
Hig
hway
64
brid
ge
Gag
e, S
abul
a, I
owa
Lock
and
dam
13
Ful
ton
Hig
hway
Brid
ge
Gag
e-C
linto
n, I
owa
Clin
ton,
Iow
aU
S G
eol
Sur
vey
reco
rdin
g ga
ge
' I
Gag
e, P
rince
ton,
Iow
a
Lock
and
dam
9 (
tailw
ater
)
-McG
rego
r, I
owa
Lock
and
dam
9 (
pool
)
US
Geo
l S
urve
y re
cord
ing
gage
Cla
yton
, Io
wa
Gut
tenb
erg,
Iow
aLo
ck a
nd d
am 1
0
Gag
e 27
, C
assv
ille,
Wis
.
Gag
e 28
, W
aupe
ton,
Iow
a
Gag
e 29
, S
pech
ts F
erry
, Io
wa
Dub
uque
, Io
wa,
loc
k an
d da
m 1
1lin
ois-
Wis
cons
in S
tate
lin
e
MARCH-MAY, UPPER MISSISSIPPI RIVER BASIN A49
580
560
540
500 480 470 460 450 440
ANCE, IN MILES UPSTREAM FROM MOUTH OF OHIO RIVER
430 420
540
if 520
2 500
420 400 390 380 370 360
DISTANCE, IN MILES UPSTREAM FROM MOUTH OF OHIO RIVER
350 340
Figure 26. Continued.
(Figure 26 continues on next pag?.)
A50 FLOODS OF 1965 IN THE UNITED STATES
490
470
450
340 330 320 310 300 290 280
DISTANCE, IN MILES UPSTREAM FROM MOUTH OF OHIO RIVER
270 260
250 240 230 220 210 200
DISTANCE, IN MILES UPSTREAM FROM MOUTH OF OHIO RIVER
190
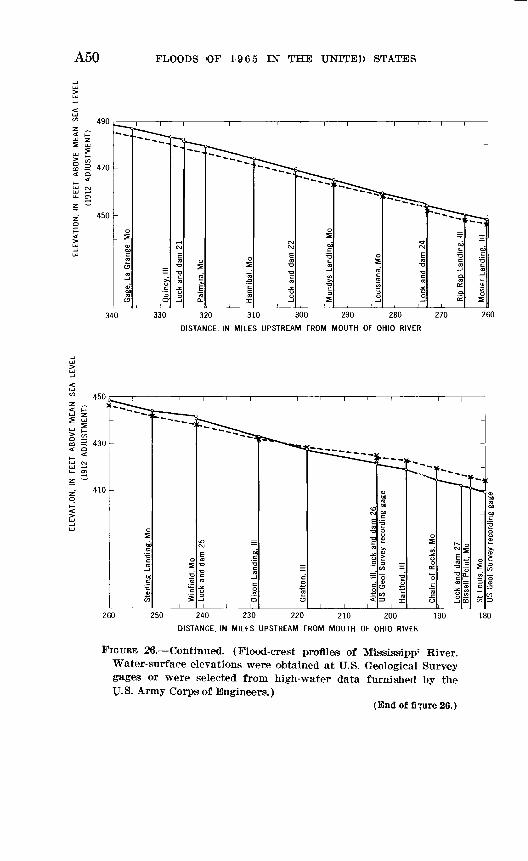
FIGURE 26. Continued. (Flood-crest profiles of Mississipp' River. Water-surface elevations were obtained at U.S. Geological Survey gages or were selected from high-water data furnished by the U.S. Army Corps of Engineers.)
(End of firure26.)
180
MARCH-MAY, UPPER MISSISSIPPI RIVER BASIN A51
over 1,000 acres of farmland engulfing the small community of Hull, 111., to depths of 4-6 feet. The 535 residents had been evacuated earlier.
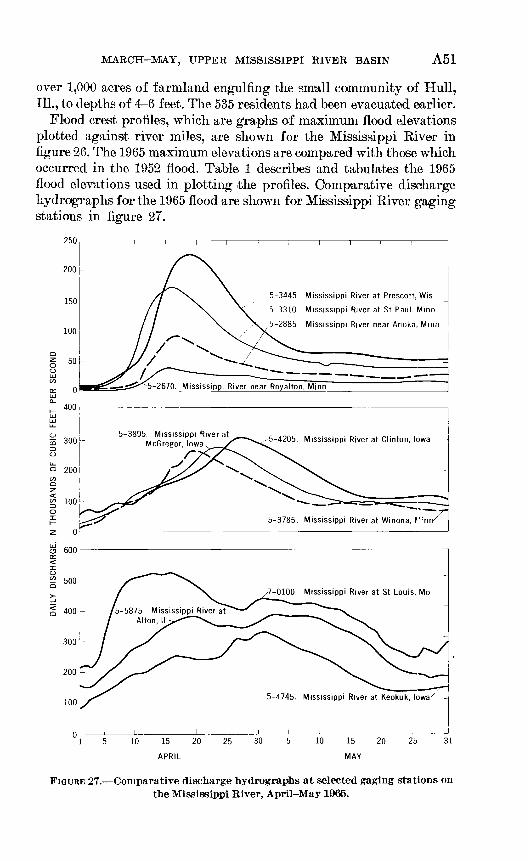
Flood crest profiles, which are graphs of maximum flood elevations plotted against river miles, are shown for the Mississippi River in figure 26. The 1965 maximum elevations are compared with those which occurred in the 1952 flood. Table 1 describes and tabulates the 1965 flood elevations used in plotting the profiles. Comparative discharge hydrographs for the 1965 flood are shown for Mississippi River gaging stations in figure 27.
5-3445 Mississippi River at Prescott, Wis
5-3310 Mississippi River at St Paul, Mmn
5-2885 Mississippi River near Anoka, Mmn
5-2670. Mississippi River near Royalton, Minn
5-3895. Mississippi River at5-4205. Mississippi River at Clinton, Iowa
5-3785. Mississippi River at Winona, fl' ; nn
Mississippi River at Keokuk
15 10 15 20 25 30 5 10 15 20 25 31
FIGURE 27. Comparative discharge hydrographs at selected gaging stations on the Mississippi River, April-May 1965.
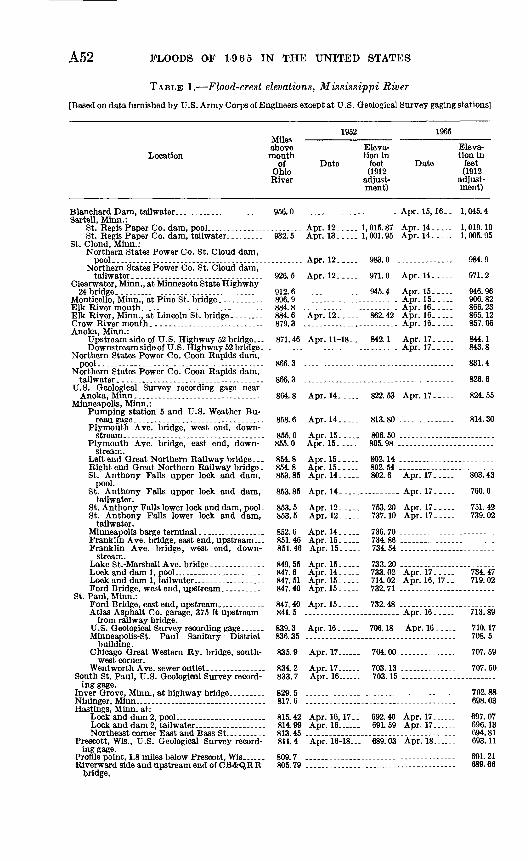
A52 FLOODS OF 1965 IN THE UNITED STATES
TABLE 1. Flood-crest elevations, Mississippi River
[Based on data furnished by U.S. Army Corps of Engineers except at U.S. Geological Survey gaging stations]
Location
Miles -above mouth
of Ohio River
1952Eleva tion in
Date feet (1912
adjust ment)
1965Eleva tion in
Date feet (1912
adjust ment)
Blanchard Dam, tailwater -.................. 956.0 ........................ Apr. 15,16.. 1,045.4Sartell, Minn.:
St. Regis Paper Co. dam, pool--.-.-----.--------.--- Apr. 12..... 1,015.87 Apr. 14....- 1,019.10St. Regis Paper Co. dam, tailwater.--...--- 932.5 Apr. 13..... 1,001.95 Apr. 14...-. 1,005.95
St. Clond, Minn.:Northern States Power Co. St. Cloud dam,
pool..-----...--------..-.-----.--..-----.--------.. Apr. 12..... 983.0 .............. 984.9Northern States Power Co. St. Cloud dam,
tailwater................................ 926.5 Apr. 12..... 971.0 Apr. 14..... 971.2Clearwater, Minn., at Minnesota State Highway
24 bridge.....-..-.-............... .....-- 912.6 .............. 945.4 Apr. 15....- 946.96MonticeUo, Minn., at Pine St. bridge........... 896.9 ........................ Apr. 15.-... 906.82Elk River mouth............................... 884.8 ........................ Apr. 16..... 866.23Elk River, Minn., at Lincoln St. bridge........ 884.6 Apr. 12..... 862.42 Apr. 16..... 865.12Crow River mouth.--...--..----...-.--.- 879.3 ........................ Apr. 16..... 857.06Anoka, Minn.:
Upstream side of U.S. Highway 52 bridge... 871.46 Apr.11-18.. 842.1 Apr.17-.... 844.1Downstream side of U.S. Highway 52 bridge..........--....--........-------. Apr. 17.-... 843.8
Northern States Power Co. Coon Rapids dam, pool-.----...-----.----.-.-- -- 866.3 _____.__.__-_-- _- -.- - 831.4
Northern States Power Co. Coon Rapids dam, tailwater.-.--....-.--...------.-...----. 866.3 ...................................... 826.6
U.S. Geological Survey recording gage near Anoka, Mfiin................................. 864.8 Apr. 14..... 822.53 Apr. 17..... 824.55
Minneapolis, Minn.:Pumping station 5 and U.S. Weather Bu-
reaugage..-............................. 858.6 Apr.14..-- 813.80 .....-..-..-. 814.30Plymouth Ave. bridge, west end, down
stream. .. ..... ...................... 855.0 Apr. 15.. . 806.50 .-_._.---------------Plymouth Ave. bridge, east end, down- 855.0 Apr. 15.._ 805.98 _- _-
stream. Left end Great Northern Railway bridge... 854.8 Apr. 15.-. 802.14----------__---------Right end Great Northern Railway bridge. 854.8 Apr. 15...-- 802.54---__-------- _-St. Anthony Falls upper lock and dam, 853.85 Apr. 14_._ 802.6 Apr. 17..... 803.43
pool. St. Anthony Falls upper lock and dam, 853.85 Apr. 14...... .... Apr. 17..-. 760.0
tailwater. St. Anthony Falls lower lock and dam, pool- 853.5 Apr. 12--..- 753.20 Apr.17---- 751.42St. Anthony Falls lower lock and dam, 853.5 Apr. 12-- 737.10 Apr. 17--..- 739.02
tailwater. Minneapolis barge terminal-......-__...-. 852.6 Apr.14.-_ 736.70 . Franklin Ave. bridge, east end, upstream.-- 851.46 Apr. 15.._ 734.86 ------------------------Franklin Ave. bridge, west end, down- 851.46 Apr. 15--.._ 734.54 _--------__-_ ____
stream. Lake St.-Marshall Ave. bridge-.-..--_.... 849.55 Apr.15.-... 733.20 - .--. ... .- Lock and dam 1, pool....................... 847.6 Apr. 14.-.- 733.02 Apr. 17..... 734.47Lockanddaml, tailwater- .. -..-.- 847.51 Apr.15-. 714.02 Apr. 16,17-- 719.02 Ford Bridge, west end, upstream.-.---.---- 847.40 Apr.15.._ 732.71---_-----_......
St. Paul, Minn.:Ford Bridge, east end, upstream...---.--_ 847.40 Apr.15--_ 732.48 - _ ., .. Atlas Asphalt Co. garage, 375 ft upstream 84L5 __...___-----__ Apr. 16-_ 713.89
from railway bridge. U.S. Geological Survey recording gage...... 839.3 Apr. 16..... 706.18 Apr. 16 _.. _ - 710.17Minneapolis-St. Paul Sanitary District 836.35 ..._. . . -. - 708.5
building. Chicago Great Western Ry. bridge, south- 835.9 Apr.17... 704.00 ------------- 707.59
west corner. Wentworth Ave. sewer outlet............... 834.2 Apr. 17...... 703.13. 707.50
South St. Paul, U.S. Geological Survey record- 833.7 Apr. 16...... 703.15 ---------------- -----ing gage.
Inver Grove, Minn., at highway bridge...._.. 829.5 -----_...._ . 702.88Nininger, Minn . -.- -. ... . 817.6 _ __ . 698.03Hastings, Minn. at:
Lock and dam 2, pool ... . 815.42 Apr. 16,17-. 692.40 Apr.17... 697.07 Lock and dam 2, tailwater------------------ 814.99 Apr. 16 .. 691.59 Apr. 17- __ 696.13Northeast corner East and Bass St_.._-. 813.45 ___.__._..._..._-----_ . 694.81
Prescott, Wis., U.S. Geological Survey record- 811.4 Apr. 16-18... 689.03 Apr. 18 693.11ing gage.
Profile point, 1.8 miles below Prescott, Wis-.--- 809.7 ---------_-----__ . 691.21Riverward side and upstream end of CB&QRR 805.79 .._...._.. 689.66
bridge.
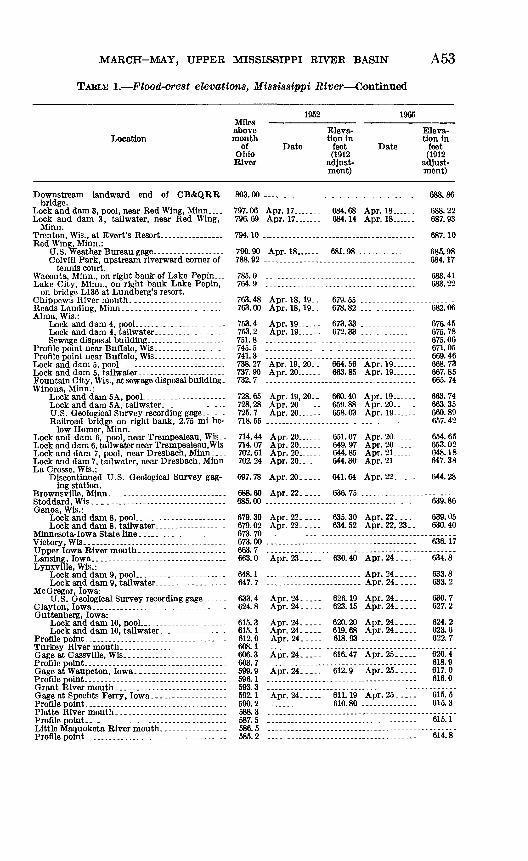
MARCH-MAY, UPPER MISSISSIPPI RIVER BASIN A53
TABLE 1. Flood-crest elevations, Mississippi River Continued
Location
Downstream landward end of CB&QRR bridge.
Lock and dam 3, pool, near Red Wing, Minn .... Lock and dam 3, tailwater, near Red Wing,
Minn.
Red Wing, Minn.:
Colvill Park, upstream riverward corner of tennis court.
Lake City, Minn., on right bank Lake Pepin, on bridge L136 at Lundberg's resort.
Alma, Wis.:
Fountain City, Wis., at sewage disposal building. Winona, Minn.:
Railroad bridge on right bank, 2.75 mi be low Homer, Minn.
Lock and dam 6, pool, near Trempealeau, Wis_. Lock and dam 6, tailwater near Trempealeau.Wis
Lock and dam 7, tailwater, near Dresbach, Minn La Crosse, Wis.;
Discontinued U.S. Geological Survey gag ing station.
Genoa, Wis.:
Victory, Wis.. ...___ ...___.
Lynxville, Wis.:
McGregor, Iowa:
Guttenberg, Iowa:
Gage at Cassville, Wls... -....--. ---------------
Profile noint- -----------------------------------
Miles above mouth
of Ohio River
803.00
797.06 796.69
794. 10 .
790. 90788. 92
785.0764.9
763.48 763.00
753.4753.2 751.8745.5741.3738.27 737.90 732.7
728.65 728.28 725.7718. 55
714.44 714. 07 702.61 702.24
697.78
688.60 685.00
679.39679.02 673. 70673.00663.7663.0
648.1 647 7
633.4 624.8
615.3 615.1 612.0 608.1606.3 603.7 599.9 596.1 593.3 592.1 590.2588.3 587.5586.5 585.2
1952
Date
Apr. 17. Apr. 17 .
Apr. 18
Apr. 18, 19. -Apr. 18, 19..
Apr. 19, 20_- Apr. 20.. -
Apr. 19,20.. Apr. 20 ...
Apr. 20...- _.
Apr. 20. -
Apr. 20.....
Apr. 22...--
Apr. 22-. Apr. 22--...
Apr. 23---.-
Apr. 24-..--Apr. 24.----
Apr. 24-..--Apr. 24.-...Apr. 24. ..--
Apr. 24.....
Apr. 24-..--
Apr. 24...--
Eleva- tion in
feet (1912
adjust ment)
684.68 684.14
681.98 .
679. 55678.82
673. 33 672.33
664.56 663.85
660.40 659.88 658.03
651.07649.97 644.85 644.30
641.64
636.75
635.30 634.52
630.40
626. 19 623.15
620.20 619.68 618.93
616. 47
612.9
611. 19 610.80
1965
Eleva tion in
Date feet (1912
adjust ment)
Apr. 18 Apr. 18
Apr. 19- -Apr. 19___
Apr. 19 ...Apr. 20......Apr. 19 .-.
Apr. 20 ...Apr. 21. .-Apr. 21... -..
Apr. 22. ....
Apr. 22.....Apr. 22, 23..
Apr. 24.-...
Apr. 24..---Apr. 24.....
Apr. 24-. Apr. 24.-...
Apr. 24.-...Apr. 24.-...
Apr. 25..-.-
Apr. 25.-...
Apr. 25.-..-
688.86
688.22 687. 93
687.10
685.98 684.17
683.41 683.22
682.06
676.45 675. 78 675. 06 671. 05 669.46 668.73 667. 85 665.74
663.74 663.35 660.89 657.42
654.65 653.02 648.18 647.38
644.28
639.86
639. 05 630.40
636.17
634.8
633.8 633.2
630.7 627.2
624.2 623.6622.7
620.4 618.9 617.0 616.0
615.5 615.3
615.1
614.8
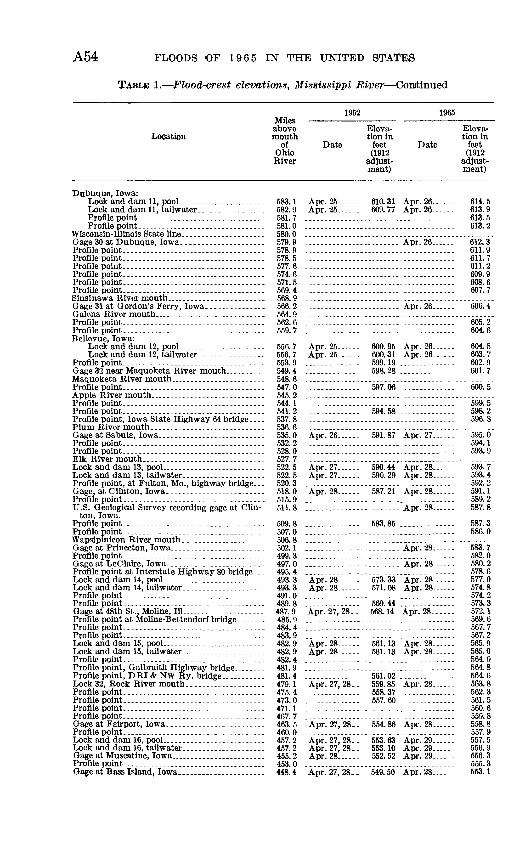
A54 FLOODS OF 1965 IN THE UNITED STATES
TABLE 1. Flood-crest elevations, Mississippi River Continued
Location
Dubuque, Iowa:
Profile point.. ............................. .
Profile point_-___-_-_---_________ .......... .....Profile point.. ..................................
Bellevue, Iowa:
Profile point. -------------_---_----.- -----------
Profile point, Iowa State Highway 64 bridge- .. .
Profile point... .................................
ton, Iowa. Profile point.. ...._..--_..___-_____________...--
Profile point. ---.--.----...---.-.-.........-..- .
Profile point. ................................. ..Profile point..... ............... . _.___.__..__Gage at 48th St., Moline, HI... ..................
Profile point... .----............ ...... .....Profile point. ............................. ......
Profile point.... ................ ...Profile point, Galbraith Highway bridge .Profile point, D RI & NW Ry. bridge ...........Lock 32, Rock River mouth. ...................Profile point..-----.------...-....... _ ........Profile point--.---------.. .Profile point_-----_-__-._. _______ . .....Profile point.. ..................................
Lock and dam 16, pool..........................
Gage at Muscatine, Iowa . .
Gage at Bass Island, Iowa... ...... ....... ..-.-.
Miloa
above mouth
of Ohio River
583.1582.9581.7581.0580.0579.9578.9578.5577.6574.6571.5569.4568.9566.2564.9562.6559.7
553.9549.4
547.0545.2544.1541.2537.8536.6
532.2528.0527.7522.5
520.3518.0515.9511.8
509.8507.0506.8502.1499.3497.0495.4493.3493.3491.0489.8487.9485.9484.4483.9482.9
482.4481.9481.4479.1475.4473.0471.1467.7
460.0457.2457.2455.2
448.4
1952
Date
Apr. 25 ..-Apr. 25......
Apr. 26 - .
Apr. 27. _.
Apr.28 Apr. 28
Apr. 27, 28. _
Apr. 28 ...Apr. 28 .
Apr. 27, 28-.
Apr. 27, 28. .
Apr. 27, 28. .Apr. 27, 28 . .Apr. 28 .-
Aor. 27. 28..
Eleva tion in
feet (1912
adjust ment)
610. 31609.77
600.95600.31599.19598. 28
597.06
594.58
591. 87
590.44590. 29
587. 21
583.85
573.33571.08
569.44568.14
561. 13561. 13
561. 02559.85558. 37557.60
554.86
553.63
552. 52
549.50
1965
Date
Apr. 26, ..Apr. 26 ...
Apr. 26 --
Api. 26
Apr. 26 ...
Apr. 27 ..-
Apr. 28 ...Apr. 28 ---
Apr. 28 -
Apr.28 ,--
Apr. 28 -
Apr. 28. .-Apr.28- -
Apr.28-.
Apr.28 Apr. 28 .
Apr. 28 ...
Apr. 28 ...
Apr. 29 .Apr. 29 Apr. 29
Apr.28
Eleva tion in
feet (1912
adjust ment)
614.5613.9613.5613.2
612.3611.9611.7611.2609.9608.6607.7
606.4
605.2604.6
604.5603.7602.9601.7
600.5
599.5598.2596.8
595.0594.1593.9
593.7593.4592.2591.1589.2587.8
587.3586.0
583.7582.0580.2578.6577.0574.8574.2573.3572.1569.6567.7567.2565.9565.0564.9564.8564.6563.8562.3561.5560.6559.8558.8557.9557.5556.9556.3555.3553.1
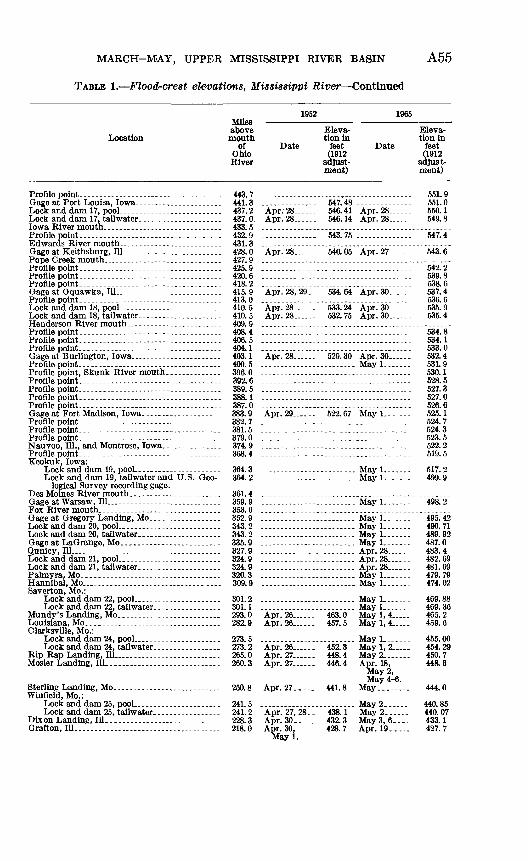
MARCH-MAY, UPPER MISSISSIPPI RIVER BASIN A55
TABLE 1. Flood-crest elevations, Mississippi River Continued
Location
Profile point. --------- _ .---...-.--..- -......
Keokuk, Iowa:
Lock and dam 19, tailwater and U.S. Geo logical Survey recording gage.
Qunicy, 111. ..................................
Saverton, Mo.:
Clarksville, Mo.:
Sterling Landing, Mo....... __ ...............Winfield, Mo.:
Grafton, 111... .................................
Milesabove mouth
of Ohio River
443.744L3437.2437.0433.5432.943L3428.0427.9425.9420.6418.2415.9413.0410.5410.5409.9408.4406.5404.1403.1400.5396.0392.6389.5388.1387.0383.9382.7381.5379.0374.9368.4
364.3364.2
361.4359.9353.6352.9^n 9
343 2335.9327.9324.9324.9320.3309.9
301.2301.1293.0282.9
273.5273.2265.0260.3
250.8
241.5241.2228.3218.0
1952
Date
Apr. 28.---.Apr. 28... ...
Apr. 28... .-.
Apr. 28, 29. .
Apr. 28......Apr. 28... ...
Apr. 28 . -.
Apr. 29.... .-
..............
Apr. 26... _-_Apr. 26....--
Apr. 27 ...Apr. 27. .-
Apr. 27.---
Apr. 27, 28. .Apr. 30.....Apr. 30,
May 1.
»
Eleva tion in
feet (1912
adjust ment)
. 647. 48
. 546. 41
. 546.14
. 543. 75
540.05
534.64
533.24532. 75
529.30
------
463.0457.5
452.3448.4446.4
441.8
438.1432.3428.7
1965
Date
Apr. 28 ...Apr. 28 ...
Apr. 27 ---
ATav 1
Mnv 1
May 1.......Mayl.----.-
May 1.......
Mayl.------May 1-------Apr. 28......Apr. 28....--Apr. 28......Mayl ----May 1 -.-
May 1.... ...May 1----May 1, 4.....May 1, 4
Mnv 1May 1, 2 May 2..---..Apr. 18,
May 2, May 4-6.
May 2......TWav 9
May3, 6....Apr. 19--...
Eleva tion in
feet (1912
adjust ment)
551.9551.0550.1549.8
547.4
543.6
542.2539.8538.6537.4536.6535.9535.4
534.8534.1533.0532.4531.9530.1528.5527.3527.0526.6525.15247524.3523.5522.2519.5
517.2499.9
498.2
495. 42490.71489. 92487.0483.4482. 69481. 69479. 79474. 02
469.88469. 36465.2459.6
455.00454.29450.7448.6
444.0
440.85440.07433.1427.7
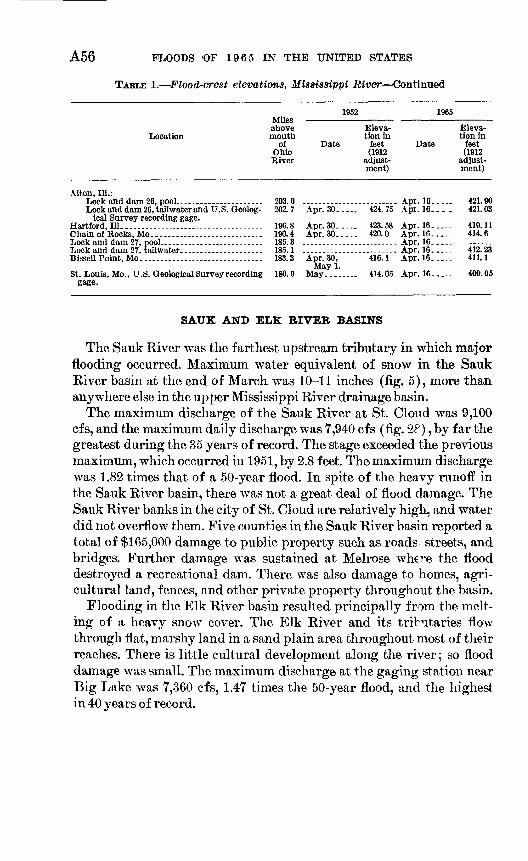
A56 FLOODS OF 1965 IN THE UNITED STATES
TABLE 1. Flood-crest elevations, Mississippi River Continued
Location
Miles -above mouth
of Ohio River
1952
Eleva tion in
Date feet (1912
adjust ment)
1966
Eleva tion in
Date feet (1912
adjust ment)
Alton, 111.:Lock and dam 26, pool.......... ......... 203.0 ........................ Apr. 16..... 421.90Lockanddam26,tailwaterandU.S. Qeolog- 202.7 Apr.30..... 424.75 Apr.16.... 421.03
ical Survey recording gage. Hartford, 111.................................... 196.8 Apr.30..... 423.58 Apr. 16..... 419.11Chainof Rocks, Mo.--.-.--------.-...-..------ 190.4 Apr. 30..... 420.0 Apr. 16....- 414.6Lock and dam 27, pool..---..-.-------.-..-.-..- 185.3 ........................ Apr. 16..... ......Lockand dam 27, tailwater..................... 185.1 ........................ Apr. 16..... 412.23Bissell Point, Mo............................... 183.3 Apr.30, 416.1 Apr.l6._... 411.1
May 1.St. Louis, Mo., U.S. Geological Survey recording 180.0 May.-..._ 414.05 Apr. 16.._ 409.05
gage.
SAUK AND ELK RIVER BASINS
The Sauk River was the farthest upstream tributary in which major flooding occurred. Maximum water equivalent of snow in the Sauk River basin at the end of March was 10-11 inches (fig. 5), more than anywhere else in the upper Mississippi River drainage basin.
The maximum discharge of the Sauk River at St. Cloud was 9,100 cfs, and the maximum daily discharge was 7,940 cfs (fig. 2P), by far the greatest during the 35 years of record. The stage exceeded the previous maximum, which occurred in 1951, by 2.8 feet. The maximum discharge was 1.82 times that of a 50-year flood. In spite of the heavy runoff in the Sauk River basin, there was not a great deal of flood damage. The Sauk River banks in the city of St. Cloud are relatively high, and water did not overflow them. Five counties in the Sauk River basin reported a total of $165,000 damage to public property such as roads streets, and bridges. Further damage was sustained at Melrose where the flood destroyed a recreational dam. There was also damage to homes, agri cultural land, fences, and other private property throughout the basin.
Flooding in the Elk River basin resulted principally from the melt ing of a heavy snow cover. The Elk River and its tributaries flow through flat, marshy land in a sand plain area throughout most of their reaches. There is little cultural development along the river; so flood damage was small. The maximum discharge at the gaging station near Big Lake was 7,360 cfs, 1.47 times the 50-year flood, and the highest in 40 years of record.
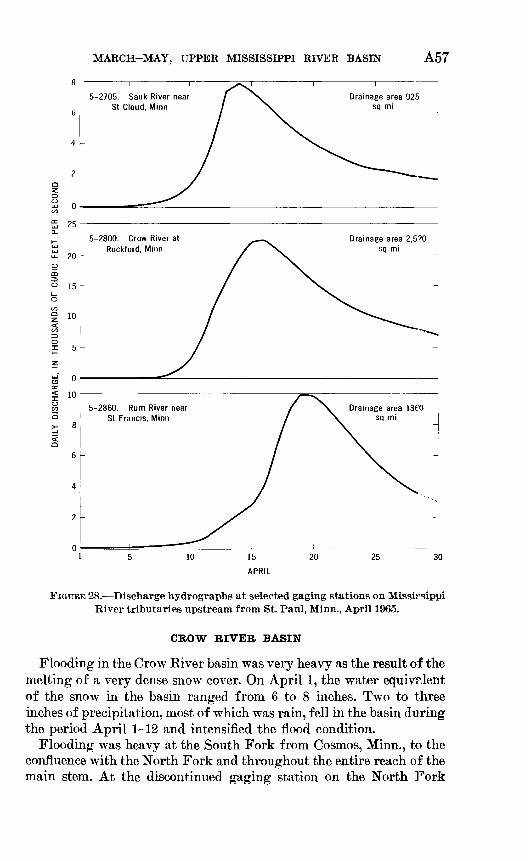
MARCH-MAY, UPPER MISSISSIPPI RIVER BASIN A57
FIGURE 28. Discharge hydrographs at selected gaging stations on Mississippi River tributaries upstream from St. Paul, Minn., April 1965.
CROW RIVER BASIN
Flooding in the Crow River basin was very heavy as the result of the melting of a very dense snow cover. On April 1, the water equivalent of the snow in the basin ranged from 6 to 8 inches. Two to three inches of precipitation, most of which was rain, fell in the basin during the period April 1-12 and intensified the flood condition.
Flooding was heavy at the South Fork from Cosmos, Minn., to the confluence with the North Fork and throughout the entire reach of the main stem. At the discontinued gaging station on the North Fork
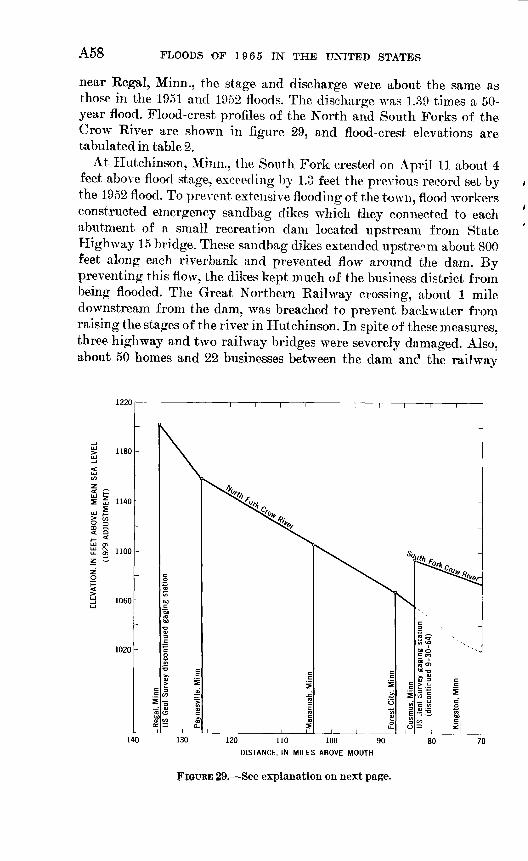
ELEV
ATI
ON
, IN
FEE
T A
BO
VE
MEA
N S
EA L
EVEL
(192
9 A
DJU
STM
ENT)
-Reg
al, M
inn
__
__
__
__
__
__
__
__
__
_
US G
eol
Surv
ey d
isco
ntin
ued
gagi
ng s
tatio
n
Fore
st C
ity, M
inn
____________
Cosm
os, M
inn
__
__
__
__
__
_/
US j
eo!
ilurv
ey g
agin
g s:
a:io
n (d
isco
ntin
ued
9-30
-64)
raising the
stag
es of
th
three
highway and
tw
about
50
homes
and
2 to o
I-T-
3 ailw
ay bridg
es were severely
damaged. .
msinesses
between
the
dam
anc1
the
rai
% ^
3?
CD "-J ver in
Hutchinson.
In
spite of
these
meas 3 I v*
constructed
emergenc
abutment
of
a small
Highway 15
bridge. T
feet
along each
river
preventing this
flow
, t
being
flooded.
The
G
downstream
from
the ^
CD
CO
gs t
Northern
Railway
crossing, abou
t 1
m,
was breached
to
prevent backwater 11 3
CD
3^ ~
CD
?° HJ
eifr
ST
eM
3
>r P
-fl
>
I !
^d ^
^ 3 is O rt-
r^
~g
>
^ i
CD
^
2" f
o 3
i-jOT
O
3*
3
§
»
OT
Oj
CP a, s
tCT
. 3^
M
CD
trt-
2.
P-
0
P^ 3
t-b
i-J §
w3
vj
3"
M
& 3 creatio
n dam
locate
d upstre
am from
1
e sandbag dikes
extended
upstream abou in-
(Jl
00
ST
0
g-
O
CD
^ M andbag dike
s whic
h the
y connected to CD
§ 3"
£ B
» S"
o^ a
05^ 3
£L
M
i CD
3^
CDa^-^^d
go
gS^
EI^ ^
^ ^S
^W
^W
S^'^
rlle-
a^fS
.2
^S
i'-i
w
®"
Hll
lspl
Occ3<
5Q
P-'
t-'3
^ §r
r. .K>
a o
p j
3?
? S
§ i
g, a
2
CDe
x ceeding
by
1.3
feet
the
previous recor
d s
t
extensive
flooding of
the
town, flood
wo <t
mt^r
8-
% 0-
CO ^
3 r+-
CD
C/i 0 r^-
3^ S3 & o 3 S- CD
p,
O 3 t>
T3
>-i ! '
t k
t
k
g-
§ rt-
rf^-
3
3 5'
th
? 3 to ov* § a. 3a
O
O a. Q 1^ CD 03 <r
i-
CD 5
§- O
3 CO P
>-i
CD
c+-
V
Si-J
OT
O
LO
35
P-K
H-"
3
2CD
O
CP
g
o J^
Kb
.w
£3 CD
3"^
?s. W
|-J
3-
S
3"^
3"1
P S
3
CTQ
PJ
CD
02
si
tf
Ul
?-
bjg
S
ET
.S
3 o
^t-
b
p
f§
CD
t» 3
PL.
!'
CD 3 £0 cr
§ el- CD
VI
CD
VI
>
Oi oo g o » en 3 1965
IN
THE
UNITE
D STATE
S
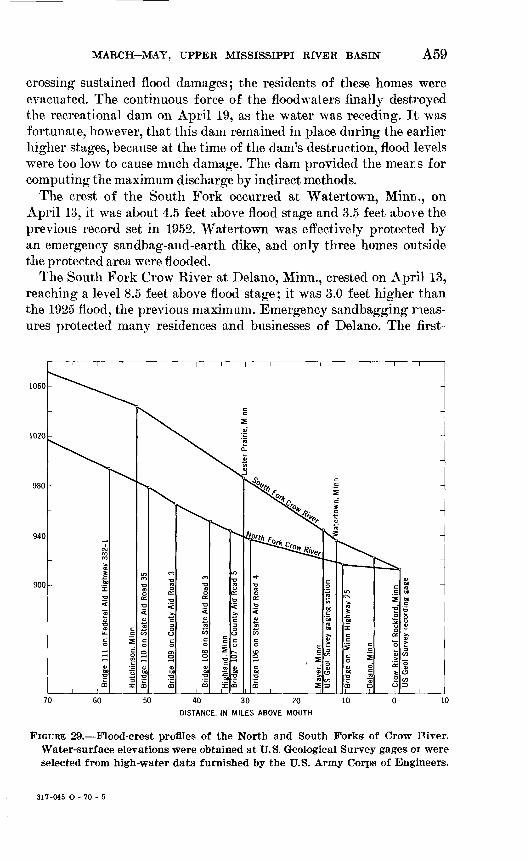
MARCH-MAY, UPPER MISSISSIPPI RIVER BASIN A59
crossing sustained flood damages; the residents of these homes were evacuated. The continuous force of the floodwaters finally destroyed the recreational dam on April 19, as the water was receding. It was fortunate, however, that this dam remained in place during the earlier higher stages, because at the time of the dam's destruction, flood levels were too low to cause much damage. The dam provided the mean s for computing the maximum discharge by indirect methods.
The crest of the South Fork occurred at Watertown, Mini]., on April 13, it was about 4.5 feet above flood stage and 3.5 feet above the previous record set in 1952. Watertown was effectively protected by an emergency sandbag-and-earth dike, and only three homes outside the protected area were flooded.
The South Fork Crow Kiver at Delano, Minn., crested on April 13, reaching a level 8.5 feet above flood stage; it was 3.0 feet higher than the 1925 flood, the previous maximum. Emergency sandbagging meas ures protected many residences and businesses of Delano. The first-
1060
1020 -
60 50 40 30 20
DISTANCE, IN MILES ABOVE MOUTH
10 -10
FIGURE 29. Flood-crest profiles of the North and South Forks of Grow Piver. Water-surface elevations were obtained at U.S. Geological Survey gages or were selected from high-water data furnished by the U.S. Army Corps of Engineers.
317-045 0-70-5
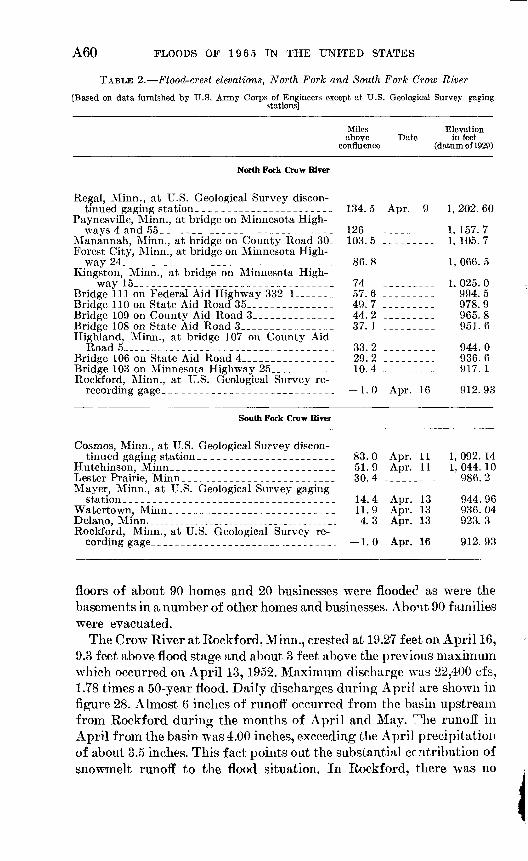
AGO FLOODS OF 1965 IN THE UNITED STATES
TABLE 2. Flood-crest elevations, North Fork and South Fork Crow River
[Based on data furnished by U.S. Army Corps of Engineers except at U.S. Geological Survey gagingstations]
Miles Elevationabove Date in feet
confluence (datum of 1929)
North Fork Crow River
Regal, Minn., at U.S. Geological Survey discon tinued gaging station_______________________ 134.5 Apr. 9 1,202.60
Paynesville, Minn., at bridge on Minnesota High ways 4 and 55___________________________ 126 _________ 1,157.7
Manannah, Minn., at bridge on County Road 30_ 103.5 _________ 1, 105. 7Forest City, Minn., at bridge on Minnesota High
way 24_______________________-_________.__ 86.8 _________ 1,066.5Kingston, Minn., at bridge on Minnesota High
way 15______________________-____--_--__ 74 _________ 1,025.0Bridge 111 on Federal Aid Highway 332-1_____ 57. 6 _________ 994.5Bridge 110 on State Aid Road 35_________-_____ 49. 7 _________ 978.9Bridge 109 on County Aid Road 3______________ 44. 2 _________ 965.8Bridge 108 on State Aid Road 3______________ 37. 1 _________ 951.6Highland, Minn., at bridge 107 on County Aid
Road5_.____________________________._____ 33.2 _________ 944.0Bridge 106 on State Aid Road 4______________ 29.2 _________ 936.6Bridge 103 on Minnesota Highway 25_ ________ 10. 4 _________ 917.1Rockford, Minn., at U.S. Geological Survey re-
recording gage_ ____________________________ 1.0 Apr. 16 912.93
South Fork Crow River
Cosmos, Minn., at U.S. Geological Survey discon tinued gaging station__ _____________________ 83.0 Apr. 11 1,092.14
Hutchinson, Minn____________________________ 51.9 Apr. 11 1,044.10Lester Prairie, Minn__________________________ 30.4 _________ 986.2Mayer, Minn., at U.S. Geological Survey gaging
station____________________________________ 14.4 Apr. 13 944.96Watertown, Minn____________________________ 11.9 Apr. 13 936.04Delano, Minn.______________,_______________________ 4.3 Apr. 13 923.3Rockford, Minn., at U.S. Geological Survey re
cording gage______________________.___!____. 1.0 Apr. 16 912.93
floors of about 90 homes and 20 businesses were floodec1 as were the basements in a number of other homes and businesses. Abont 90 families were evacuated.
The Crow River at Rockford, Minn., crested at 19.27 feet on April 16, 9.3 feet above flood stage and about 3 feet above the previous maximum which occurred on April 13, 1952. Maximum discharge was 22,400 cfs, 1.78 times a 50-year flood. Daily discharges during April are shown in figure 28. Almost 6 inches of runoff occurred from the basin upstream from Rockford during the months of April and May. ^he runoff in April from the basin was 4.00 inches, exceeding the April precipitation of about 3.5 inches. This fact points out the substantial cc ntribution of snowmelt runoff to the flood situation. In Rockford, there was no
MARCH-MAY, UPPER MISSISSIPPI RIVER BASIN A61
community-wide project to protect the town against flood damage, but local residents endeavored to protect individual homes and businesses. About 45 families were evacuated. First floors were flooded in 35 homes and 15 businesses, and basements flooded in an additional 10 homes and five businesses.
At Hanover, Minn., ice floes destroyed a new timber bridge on County Highway 19. Other bridges, roads, and urban property in the lower part of the basin were damaged. Extensive inundation of agri cultural lands damaged crops, and the floodwaters destroyed fences.
The total damage in the basin was estimated at $2.9 million by the Corps of Engineers; a major share represents costs for flood-fighting activities in the river communities.
BUM BIVEB BASIN
Flooding in the Rum River basin was caused principally by the melting of heavy snow cover augmented by more than an inch of rain which fell during the first part of April. At the end of March, water equivalent of snow in the basin ranged from 6 to 9 inches (fig. 5). The heaviest snow cover was in the upstream or north end of the basin. Daily discharges at the gaging station near St. Francis are shown in figure 28. The maximum discharge of 10,100 cfs was 1.11 times a 50- year flood and was the maximum of record during a continuous period since 1929. Mille Lacs Lake, a natural reservoir in the upper part of the basin, partly regulated the floodflow.
The floods inundated agricultural lands, roads, and bridges in the reach between Princeton and Isanti. Residences in the comrrunity of Isanti were also damaged by floodwaters. Total damage in the basin was estimated at $200,000 by the Corps of Engineers.
MINNESOTA BIVEB BASIN
The upper part of the Minnesota River basin is formed by th^ Lit tle Minnesota River, which originates on the eastern slope of the Da kota foothills (Coteau des Prairies) in South Dakota about 30 miles west of Lake Traverse. The Little Minnesota River flows into the upper end of Big Stone Lake on the South Dakota-Minnesota border. Big Stone Lake, which is only about a mile and a half in width, extends southeastward for 26 miles. Although the extreme upper end of the Minnesota River basin is in South Dakota, modern maps indicate that the source of the Minnesota River is at the lower end of Big Stone Lake. The river flows southeastward through Minnesota for 225 miles to Mankato where it turns abruptly to the northeast and flows another 106 miles to its mouth near Fort Snelling, Minn. on the southern out skirts of the Twin Cities.
A62 FLOODS OF 1965 IN THE UNITED STATES
During the glacial epoch, the River Warren, which f owed in the present Minnesota River valley, drained glacial Lake Agassiz, a vast body of water in the Northwestern part of the State. As a consequence of the great volume of this early drainage, the Minnesota River flows through wide flood plains, which intensify flood problems in the basin. At the downstream gaging station near Carver, Minn., measurements of flood discharge were made by boat across a valley 2 miles wide. In other locations the valley is as much as -3 miles wide, but throughout much of its reach it is from 1 to l 1/^ miles in width. TT Q, Minnesota River itself has little slope, but its tributaries are comparatively steep; their steepness compounds the flood problem.
The flood in the upper part of the Minnesota River Easin was not severe. In fact, the Little Minnesota River had its annual peak in June, after the flood period. The recurrence intervals of maximum discharges in tributaries upstream from the Lac qui Parle River varied from 4 to 11 years. Peak discharge of the Lac qui Parle River, which joins the Minnesota River 41 miles downstream from Big Stone Lake, was 8,370 cfs, a 40-year flood, and the second highest peak discharge in 38 years of record.
The next major tributaries downstream from the Lac qui Parle River are the Chippewa River, draining an area on the north, and the Yellow Medicine and Redwood Rivers, which drain areas on the south. The recurrence interval of peak discharges in the?e tributaries in their lower reaches varied from 8 to 20 years. The Minnesota River is gaged at Montevideo, Minn. just downstream from the mouth of the Chippewa River. Flood discharge at this location was 12,900 cfs, a 13-year flood. Records have been collected at this site for 56 years. The 1965 flood was exceeded only by the thunderstorm flood of June 1919 and the snowmelt flood of April 1952. The discharge of the 1952 flood, however, was almost twice that of the 1965 flood.
The discharge of the Minnesota River and its tributaries from New Ulm Minn., to the mouth 145 miles downstream, exceeded all previ ously known peak discharges. The runoff from the area south of New Ulm and Mankato, Minn., was particularly intense. The April runoff from the Blue Earth and Le Sueur River basins was 6.08 inches and 6.66 inches, respectively, which was greater than that from any other large gaged area in Minnesota with the exception of the Cannon River basin.
Severe urban and agricultural damages occurred in the Minnesota River basin downstream from New Ulm. Because of tl °- wide river valley, a great deal of rich agricultural land was flooded. Fla'ndrau Dam on the Cottonwood River and Rapidan Dam on the Blue Earth River were damaged. The greatest damage by far, however, was to
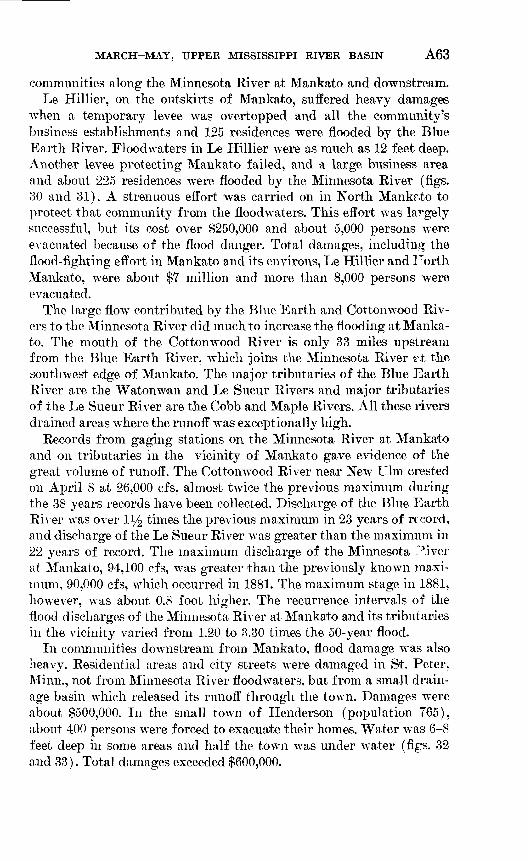
MARCH-MAT, UPPER MISSISSIPPI RIVER BASIN A63
communities along the Minnesota River at Mankato and downstream.Le Hillier, on the outskirts of Mankato, suffered heavy damages
when a temporary levee was overtopped and all the community's business establishments and 125 residences were flooded by the Blue Earth River. Floodwaters in Le Hillier were as much as 12 feet deep. Another levee protecting Mankato failed, and a large business area and about 225 residences were flooded by the Minnesota River (figs. 30 and 31). A strenuous effort was carried on in North Mankrto to protect that community from the floodwaters. This effort was largely successful, but its cost over $250,000 and about 5,000 persons were evacuated because of the flood danger. Total damages, including the flood-fighting effort in Mankato and its environs, Le Hillier and l Torth Mankato, were about $7 million and more than 8,000 persons were evacuated.
The large flow contributed by the Blue Earth and Cottonwood Riv ers to the Minnesota River did much to increase the flooding at Manka to. The mouth of the Cottonwood River is only 33 miles upstream from the Blue Earth River, which joins the Minnesota River e'k the southwest edge of Mankato. The major tributaries of the Blue Earth River are the Watonwan and Le Sueur Rivers and major tributaries of the Le Sueur River are the Cobb and Maple Rivers. All these rivers drained areas where the runoff was exceptionally high.
Records from gaging stations on the Minnesota River at Mankato and on tributaries in the vicinity of Mankato gave evidence of the great volume of runoff. The Cottonwood River near New Ulm crested on April 8 at 26,000 cfs, almost twice the previous maximum during the 38 years records have been collected. Discharge of the Blue Earth River was over iy2 times the previous maximum in 23 years of record, and discharge of the Le Sueur River was greater than the maximum in 22 years of record. The maximum discharge of the Minnesota Fiver at Mankato, 94,100 cfs, was greater than the previously known maxi mum, 90,000 cfs, which occurred in 1881. The maximum stage in 1881, however, was about 0.8 foot higher. The recurrence intervals of the flood discharges of the Minnesota River at Mankato and its tributaries in the vicinity varied from 1.20 to 3.30 times the 50-year flood.
In communities downstream from Mankato, flood damage was also heavy. Residential areas and city streets were damaged in St. Peter, Minn., not from Minnesota River floodwaters, but from a small drain age basin which released its runoff through the town. Damages were about $500,000. In the small town of Henderson (population 765), about 400 persons were forced to exacuate their homes. Water was 6-8 feet, deep in some areas and half the town was under water (figs. 32 and 33). Total damages exceeded $600,000.
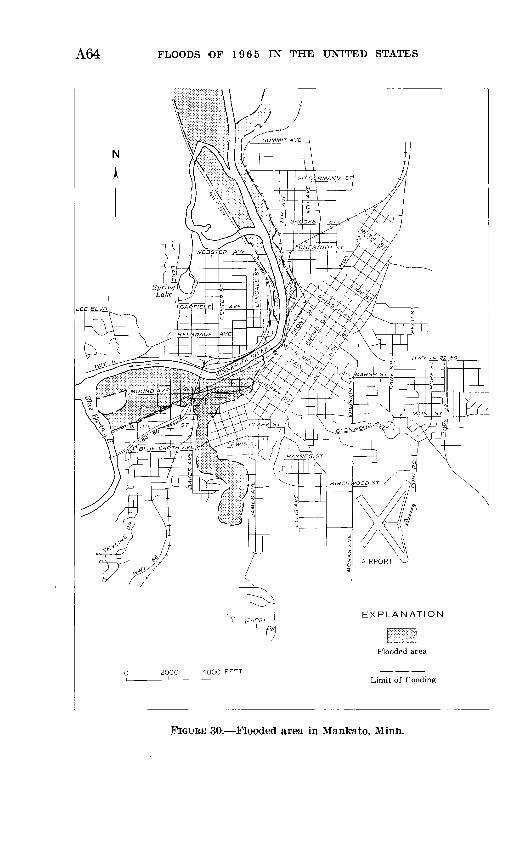
A64 FLOODS OF 1965 IN THE UNITED STATES
FIGURE 30. Flooded area in Manbato, Minn.
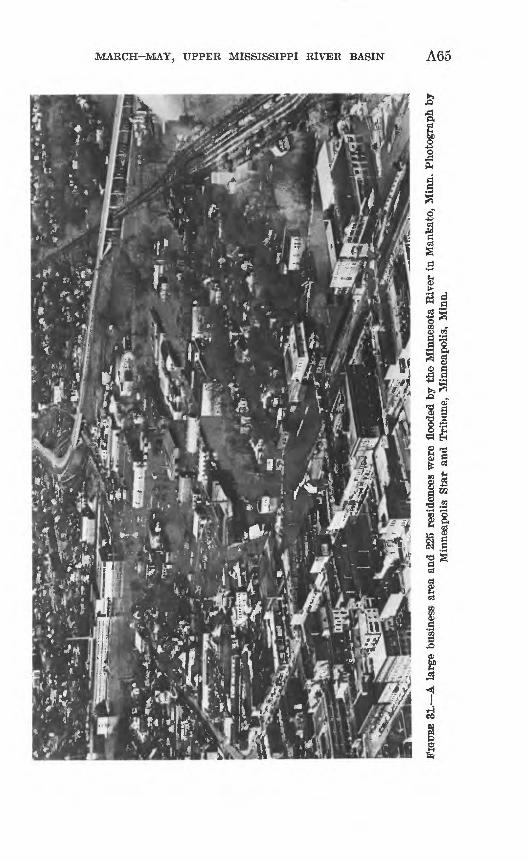
FIGI
TBE
31.
A l
arge
bus
ines
s ar
ea a
nd 2
25 r
esid
ence
s w
ere
flood
ed b
y th
e M
inne
sota
Eiv
er i
n M
anka
to,
Min
n. P
hoto
grap
h by
Min
neap
olis
Sta
r an
d T
ribu
ne,
Min
neap
olis
, M
inn.
O3
A66 FLOODS OF L965 IN THE UNITED STATES
FIGURE 32. Flooded area in Henderson, Minn.
At Carver, Minn., the Minnesota River crested 16 feet over flood stage and damaged a large part of the town's business district and resi dential area (figs. 34 and 35). About 60 families were forced to leave their homes. The gaging station on the Minnesota River, 3 miles up stream from Carver, was inundated, and the concrete structure was severely damaged when struck by trees and debris which were carried downstream by the current. The maximum stage at this site, deter mined from floodmark, was 34.37 feet, more than 6 feet higher than the maximum previous stage of record which occurred in 1952. The maximum discharge, 117,000 cfs, was 1.83 times that of a 50-year flood.
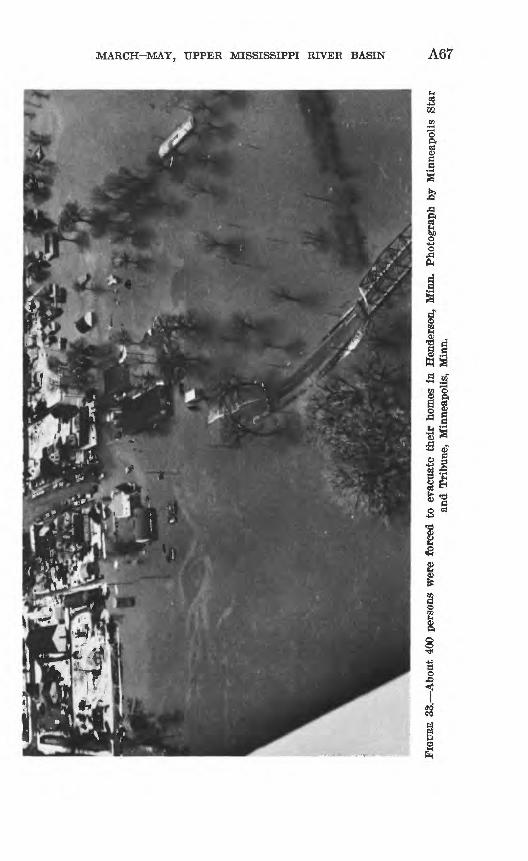
MARCH-MAY, UPPER MISSISSIPPI RIVER BASIN A67
t
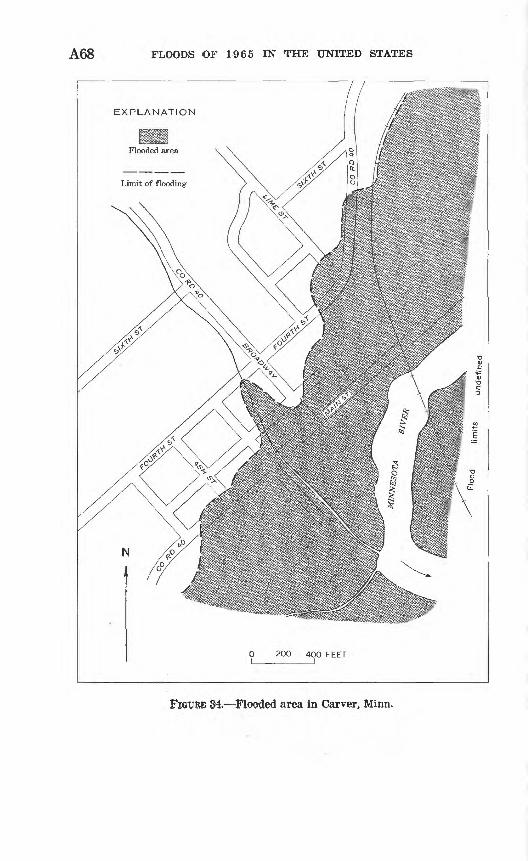
A68 FLOODS OF 1965 IN THE UNITED STATES
EXPLANATION
FIGURE 34. Flooded area in Carver, Minn.
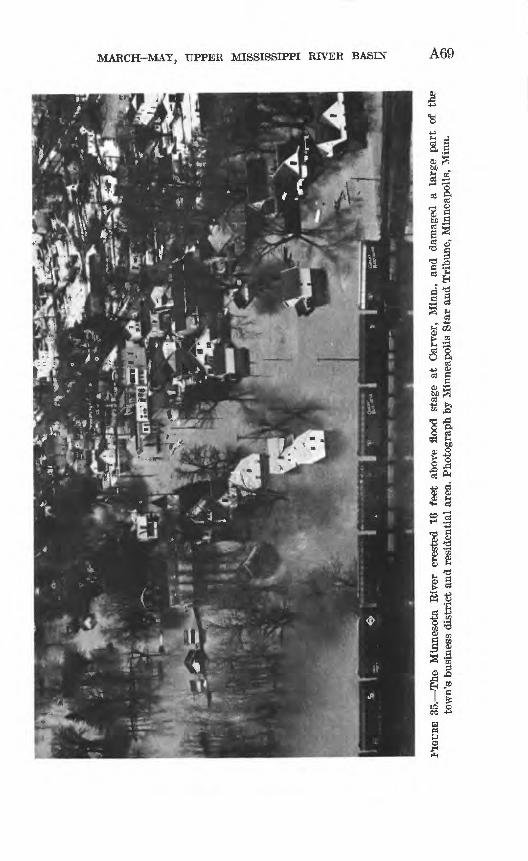
MARCH-MAY, UPPER MISSISSIPPI RIVER BASIN A69
A70 FLOODS or 1965 IN THE UNITED STATES
About 500 persons in Chaska, Minn., were forced to leave their homes when the floodwaters overtopped a 1,600-foot-long dike constructed by local residents (figs. 36 and 37). The new Carver County Court house and sewage disposal plant were protected, however, by emer gency sandbag dikes.
Several oil and grain terminals at Savage, Minn., suffered severe damage from the recordbreaking floods, which exceeded the 1952 stages by almost. 5 feet. The residential part of the community and a 14-million-bushel grain elevator complex were protected by emer gency sandbag dikes.
There was a great deal of damage to highways and railways in the Minnesota River valley. For several days during the flood, only one highway, U.S. Highway 169 at Le Sueur, was open across the Min nesota River in the area from the mouth to Mankota, 106 miles up stream. Of the three bridges crossing the Minnesota River in the Twin City area, only Mendota Bridge at the mouth was open. It was choked by commuter traffic for hours each day. Water was about 12 feet deep on Cedar Avenue near Cedar Avenue Bridge, and Interstate Highway 35 W was inundated by about 2 feet of water south of the bridge. Railroads suffered losses to track, roadbed, and bridges as well as operational losses from interruption of service.
Total damages in the Minnesota River basin, including the cost of flood fighting, were estimated by the Corps of Engineers to be over $38 million.
A profile of 1965 flood elevations for the Minnesota River is shown in figure 38, and tabulated elevations are given in table 3. Discharge hydrographs for Le Sueur, Blue Earth, and Minnesota Rivers are shown in figure 39.
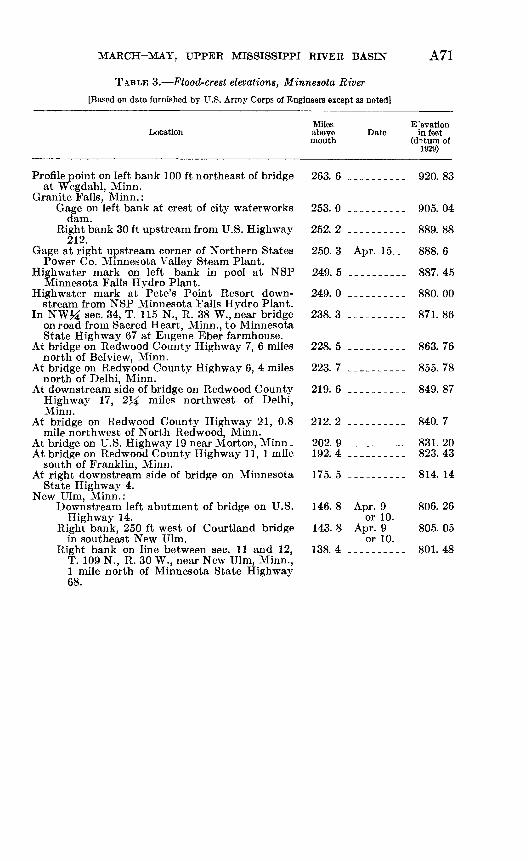
MARCH-MAY, UPPER MISSISSIPPI RIVER BASIN A71
TABLE 3. Flood-crest elevations, Minnesota River
[Based on data furnished by U.S. Army Corps of Engineers except as noted]
Location
Profile point on left bank 100 ft northeast of bridgeat Wegdahl, Minn.
Granite Falls, Minn. :Gage on left bank at crest of city waterworks
dam.Right bank 30 ft upstream from U.S. Highway
212.Gage at right upstream corner of Northern States
Power Co. Minnesota Valley Steam Plant.Highwater mark on left bank in pool at NSP
Minnesota Falls Hydro Plant.Highwater mark at Pete's Point Resort down
stream from NSP Minnesota Falls Hydro Plant.In NWM sec. 34, T. 115 N., R. 38 W., near bridge
on road from Sacred Heart, Minn., to MinnesotaState Highway 67 at Eugene Eber farmhouse.
At bridge on Redwood County Highway 7, 6 milesnorth of Belview, Minn.
At bridge on Redwood County Highway 6, 4 milesnorth of Delhi, Minn.
At downstream side of bridge on Redwood CountyHighway 17, 2*^ miles northwest of Delhi,Minn.
At bridge on Redwood County Highway 21, 0.8mile northwest of North Redwood, Minn.
At bridge on U.S. Highway 19 near Morton, Minn.At bridge on Redwood County Highway 11, 1 mile
south of Franklin, Minn.At right downstream side of bridge on Minnesota
State Highway 4.New Ulm, Minn.:
Downstream left abutment of bridge on U.S.Highway 14.
Right bank, 250 ft west of Courtland bridgein southeast New Ulm.
Right bank on line between sec. 11 and 12,T. 109 N., R. 30 W., near New Ulm, Minn.,1 mile north of Minnesota State Highway68.
Milesabovemouth
263. 6
253. 0
252. 2
250. 3
249. 5
249. 0
238. 3
228. 5
223. 7
219. 6
212. 2
202. 9192.4
175. 5
146. 8
143. 8
138.4
E'evationDate in feet
(d-rtum of1929)
__________ 920.83
____..._._ 905.04
__________ 889.88
Apr. 15.. _ 888. 6
__________ 887.45
__._____._ 880.00
__________ 871.86
__________ 863.76
__________ 855.78
__________ 849.87
__________ 840.7
_________ 831.20__________ 823.43
__________ 814.14
Apr. 9 806. 26or 10.
Apr. 9 805. 05or 10.
.__._____- 801.48
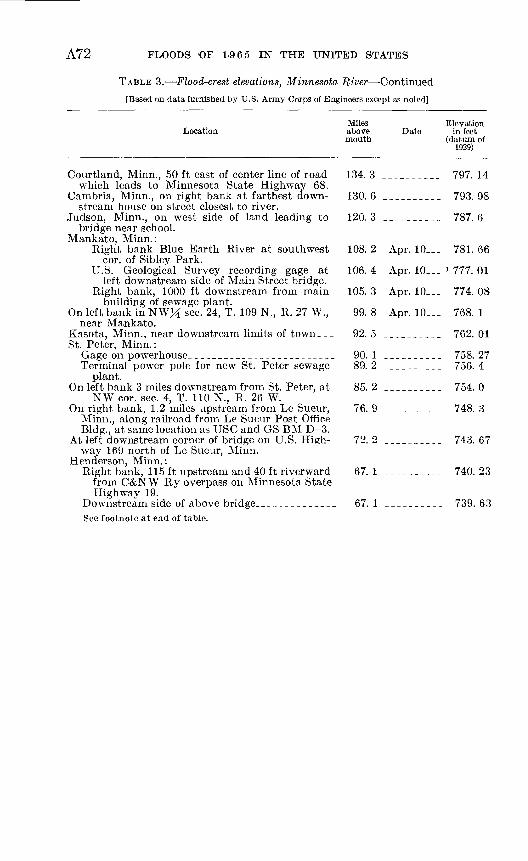
A72 FLOODS 'OF 1,965 IN THE UNITED STATES
TABLE 3. Flood-crest elevations, Minnesota River Continued
[Based on data furnished by U.S. Army Corps of Engineers except as noted]
Miles ElevationLocation above Date in feet
mouth (datum of 1929)
Courtland, Minn., 50 ft east of center line of road 134. 3 __________ 797. 14which leads to Minnesota State Highway 68.
Cambria, Minn., on right bank at farthest down- 130. 6 __________ 793. 98stream house on street closest to river.
Judson, Minn., on west side of land leading to 120. 3 __________ 787. 6bridge near school.
Mankato, Minn.:Right bank Blue Earth River at southwest 108. 2 Apr. 10_ 781. 66
cor. of Sibley Park. U.S. Geological Survey recording gage at 106. 4 Apr. 10___ : 777. 01
left downstream side of Main Street bridge. Right bank, 1000 ft downstream from main 105. 3 Apr. 10_ 774. 08
building of sewage plant. On left bank in NWM sec. 24, T. 109 N., R. 27 W., 99.8 Apr. 10_ 768.1
near Mankato. Kasota, Minn., near downstream limits of town___ 92. 5 __________ 762. 01St. Peter, Minn.:
Gage on powerhouse,________________________ 90. 1 __________ 758. 27Terminal power pole for new St. Peter sewage 89. 2 __________ 756. 4
plant. On left bank 3 miles downstream from St. Peter, at 85. 2 __________ 754. 0
NW cor. sec. 4, T. 110 N., R. 26 W. On right bank, 1.2 miles upstream from Le Sueur, 76. 9 __________ 748. 3
Minn., along railroad from Le Sueur Post Office Bldg., at same location as USC and GS BM D-3.
At left downstream corner of bridge on U.S. High- 72. 2 __________ 743. 67way 169 north of Le Sueur, Minn.
Henderson, Minn.:Right bank, 115 ft upstream and 40 ft riverward 67. 1 __________ 740. 23
from C&NW Ry overpass on Minnesota State Highway 19.
Downstream side of above bridge______________ 67.1 __________ 739.63See footnote at end of table.
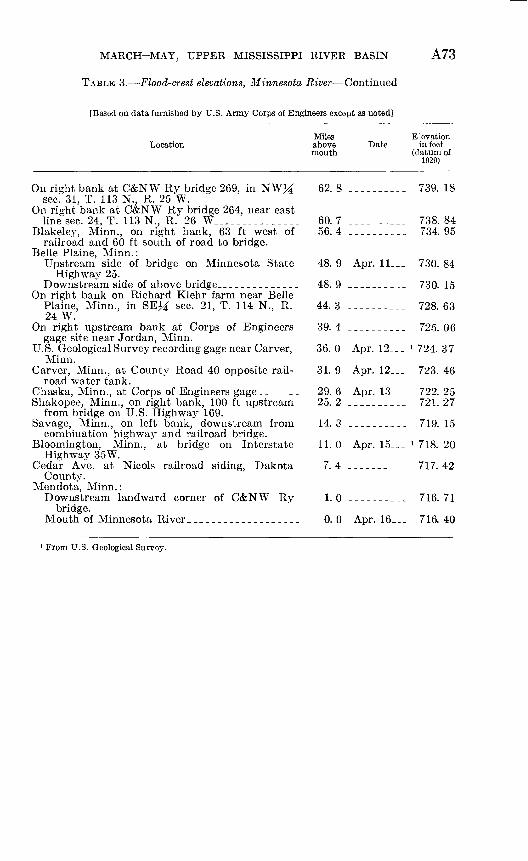
MARCH-MAY, UPPER MISSISSIPPI RIVER BASIN
TABLE 3. Flood-crest elevations, Minnesota River Continued
A73
[Based on data furnished by U.S. Army Corps of Engineers except as noted]
LocationMiles above mouth
DateE'evation
in feet(datum of
1929)
On right bank at C&NW Ry bridge 269, in NWM 62. 8 __________ 739.18sec. 31, T. 113 N., R. 25 W.
On right bank at C&NW Ry bridge 264, near eastline sec. 24, T. 113 N., R. 26 W_______________ 60. 7 __________ 738. 84
Blakeley, Minn., on right bank, 63 ft west of 56.4 __________ 734.95railroad and 60 ft south of road to bridge.
Belle Plaine, Minn. :Upstream side of bridge on Minnesota State 48. 9 Apr. !!___ 730. 84
Highway 25.Downstream side of above bridge_-_____- ______ 48.9 __________ 730.15
On right bank on Richard Klehr farm near BellePlaine, Minn., in SE^ sec. 21, T. 114 N., R. 44.3 ____-_-_-_ 728.6324 W.
On right upstream bank at Corps of Engineers 39. 4 __________ 725. 06gage site near Jordan, Minn.
U.S. Geological Survey recording gage near Carver, 36. 0 Apr. 12___ l 724. 37Minn.
Carver, Minn., at County Road 40 opposite rail- 31. 9 Apr. 12___ 723. 46road water tank.
Chaska, Minn., at Corps of Engineers gage_ ______ 29. 6 Apr. 13___ 722. 25Shakopee, Minn., on right bank, 100 ft upstream 25. 2 __________ 721. 27
from bridge on U.S. Highway 169. Savage, Minn., on left bank, downstream from 14.3 __________ 719.15
combination highway and railroad bridge. Bloomington, Minn., at bridge on Interstate 11. 0 Apr. 15___ r 718. 20
Highway 35W. Cedar Ave. at Nicols railroad siding, Dakota 7. 4 __________ 717. 42
County. Mendota, Minn.:
Downstream landward corner of C&NW Ry 1. 0 ---------- 716.71bridge.
Mouth of Minnesota River___________________ 0.0 Apr. 16___ 716.40
From U.S. Geological Survey.
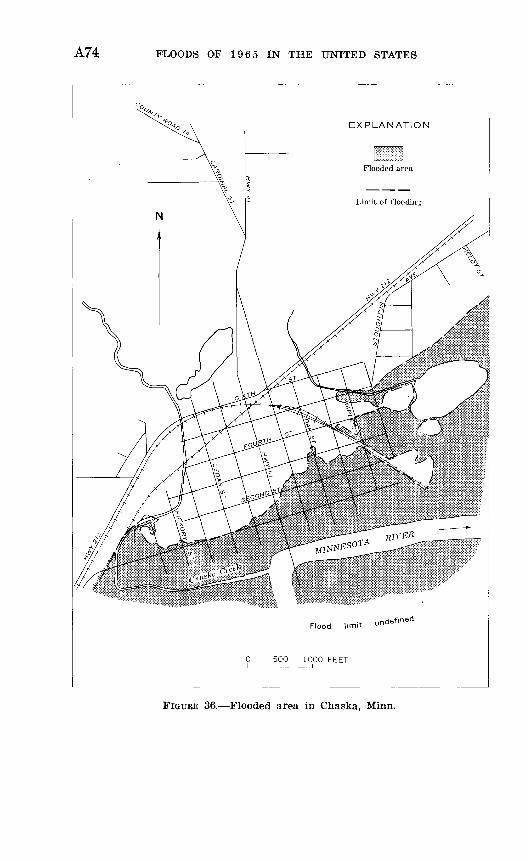
A74 FLOODS OF 1965 IN THE UNITED STATES
FIGURE 36. Flooded area in Chaska, Minn.
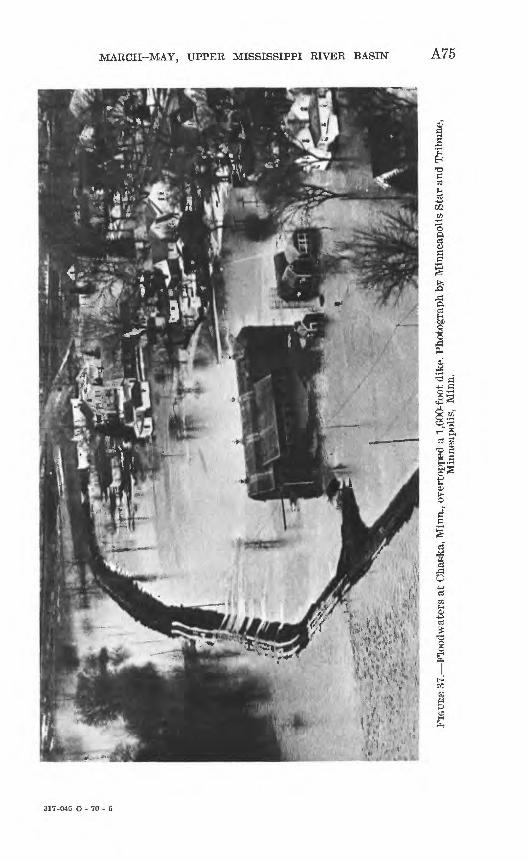
MARCH-MAY, UPPER MISSISSIPPI RIVER BASIN A75
acS t-ia-u
COa
1
o 4^
e3
317-045 0-70-6
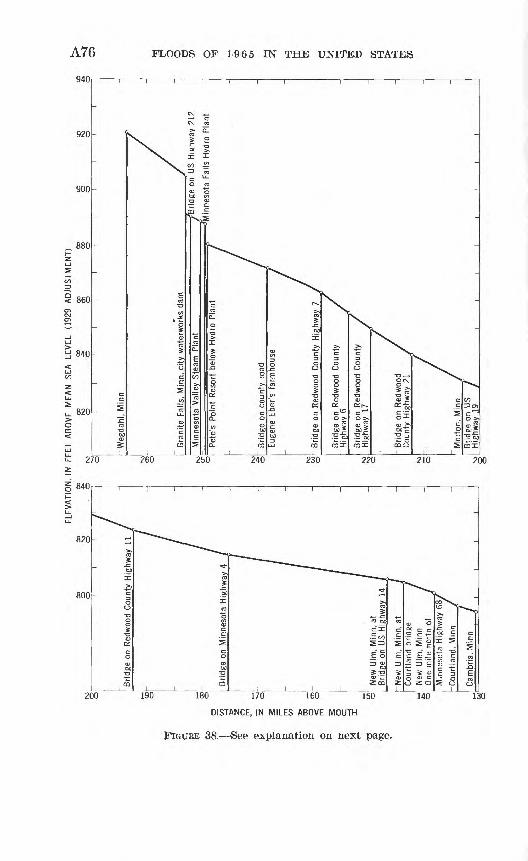
ELEV
ATIO
N,
IN
FEET
AB
OVE
M
EA
N
SEA
LEVE
L (1
929
AD
JUS
TME
NT)
oo
oo
oo
aN>
*»
01
a
N>
o
o
o
c
*JU I
Brid
ge o
n R
edw
ood
Cou
nty
Hig
hway
11
Gra
nite
Fal
ls,
Min
n, c
ity w
ater
wor
ks d
am
Min
neso
ta V
alle
y S
team
Pla
nt
Pet
e's
Poi
nt R
esor
t be
low
Hyd
ro P
lant
Brid
ge o
n M
inne
sota
Hig
hway
4
Brid
ge o
n co
unty
roa
dE
ugen
e E
ber
s fa
rmho
use
Brid
ge o
n R
edw
ood
Cou
nty
Hig
hway
7
Brid
ge o
n R
edw
ood
Cou
nty
Hig
hway
6
Brid
ge o
n R
edw
ood
Cou
nty
Hig
hway
17
New
Ulm
, M
inn,
at
Brid
ge o
n US
Hig
hway
14
Brid
ge o
n R
edw
ood
Cou
nty
Hig
hway
21
Cou
rtla
nd b
ridge
N
ew U
lm,
Min
n O
ne m
ile n
orth
of
Min
neso
ta H
ighw
ay 6
8
Cou
rtla
nd,
Min
n
Brid
ge o
n U
S H
ighw
ay 1
9
-^B
rid
ge
on
US H
ighw
ay 2
12
^Min
neso
ta F
alls
Hyd
ro P
lant
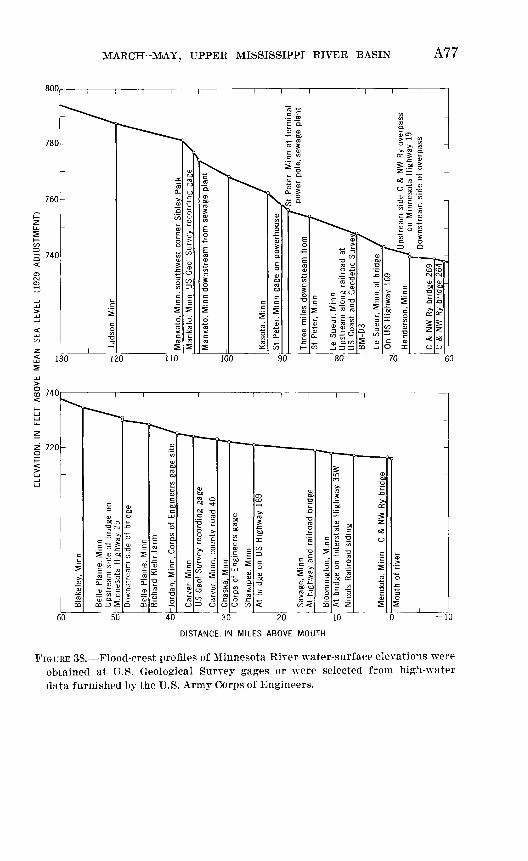
MARCH-MAY, UPPER MISSISSIPPI RIVER BASIN A77
50 40 30 20 -10
DISTANCE, IN MILES ABOVE MOUTH
FIGURE 38. Flood-crest profiles of Minnesota River water-surface elevations were obtained at U.S. Geological Survey gages or were selected from high-water data furnished by the U.S. Army Corps of Engineers.
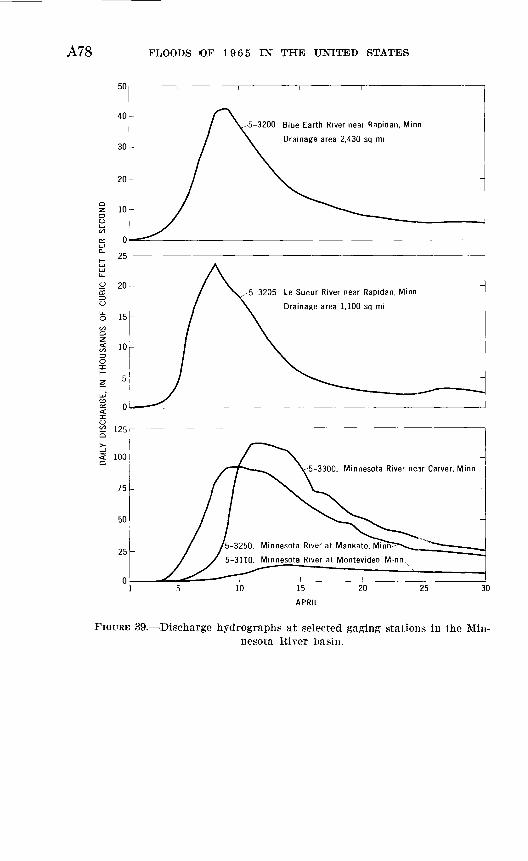
A78 FLOODS 'OF 1965 IN THE UNITED STATES
y 20
<2 125
< 100k
5-3200 Blue Earth River near Rapidan, Minn
Drainage area 2,430 sq mi
5-3205 Le Sueur River near Rapidan, Minn
Drainage area 1,100 sq mi
-3300. Minnesota River near Carver, Minn
5-3250. Minnesota River at Mankato, Minn
5-3110. Minnesota River at Montevideo, Minn
FIGURE 39. Discharge hydrographs at selected gaging stations in the Min nesota River basin.
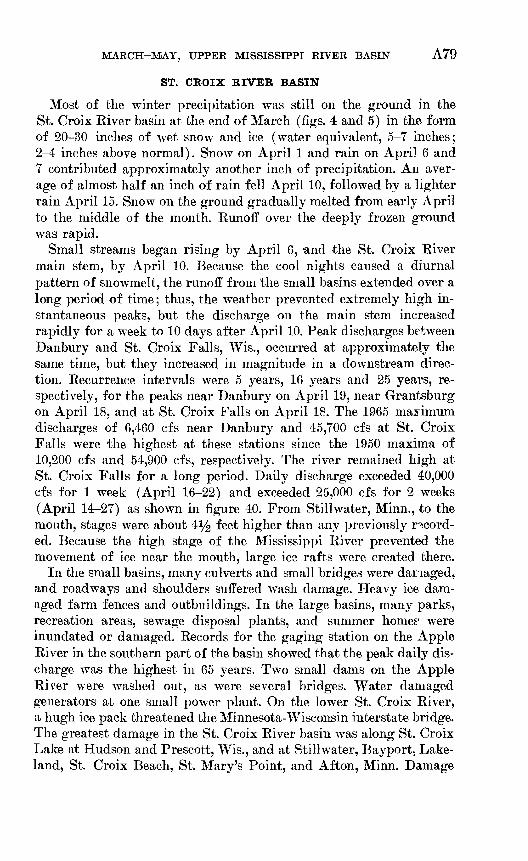
MARCH-MAY, UPPER MISSISSIPPI RIVER BASIN A79
ST. CROIX RIVER BASIN
Most of the winter precipitation was still on the ground in the St. Croix River basin at the end of March (figs. 4 and 5) in the/ form of 20-30 inches of wet snow and ice (water equivalent, 5-7 inches; 2-4 inches above normal). Snow on April 1 and rain on April 6 and 7 contributed approximately another inch of precipitation. An aver age of almost half an inch of rain fell April 10, followed by a lighter rain April 15. Snow on the ground gradually melted from early April to the middle of the month. Runoff over the deeply frozen ground was rapid.
Small streams began rising by April 6, and the St. Croix River main stem, by April 10. Because the cool nights caused a diurnal pattern of snowmelt, the runoff from the small basins extended over a long period of time; thus, the weather prevented extremely high in stantaneous peaks, but the discharge on the main stem increased rapidly for a week to 10 days after April 10. Peak discharges between Danbury and St. Croix Falls, Wis., occurred at approximately the same time, but they increased in magnitude in a downstream direc tion. Recurrence intervals were 5 years, 16 years and 25 years, re spectively, for the peaks near Danbury on April 19, near Grantsburg on April 18, and at St. Croix Falls on April 18. The 1965 maximum discharges of 6,460 cfs near Danbury and 45,700 cfs at St. Croix Falls were the highest at these stations since the 1950 maxima of 10,200 cfs and 54,900 cfs, respectively. The river remained high at St. Croix Falls for a long period. Daily discharge exceeded 40,000 cfs for 1 week (April 16-22) and exceeded 25,000 cfs for 2 weeks (April 14-27) as shown in figure 40. From Stillwater, Minn., to the mouth, stages were about 4% feet higher than any previously record ed. Because the high stage of the Mississippi River prevented the movement of ice near the mouth, large ica rafts were created there.
In the small basins, many culverts and small bridges were damaged, and roadways and shoulders suffered wash damage. Heavy ice dam aged farm fences and outbuildings. In the large basins, many parks, recreation areas, sewage disposal plants, and summer homee were inundated or damaged. Records for the gaging station on the Apple River in the southern part of the basin showed that the peak daily dis charge was the highest in 65 years. Two small dams on the Apple River were washed out, as were several bridges. Water damaged generators at one small power plant. On the lower St. Croix River, a hugh ice pack threatened the Minnesota-Wisconsin interstate bridge. The greatest damage in the St. Croix River basin was along St. Croix Lake at Hudson and Prescott, Wis., and at Stillwater, Bayport. Lake land, St. Croix Beach, St. Mary's Point, and Afton, Minn. Damage
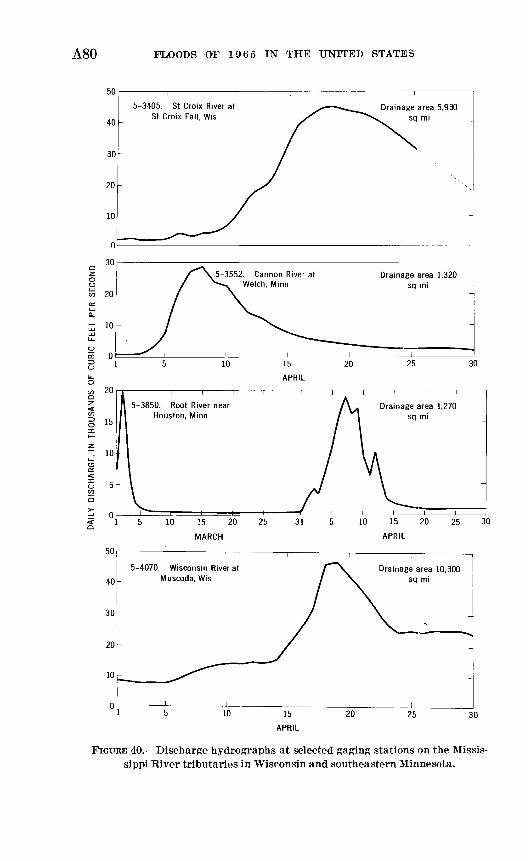
A80 FLOODS OF 1965 IN THE UNITED STATES
5 5
30
FIGURE 40. Discharge hydrographs at selected gaging stations on the Missis sippi River tributaries in Wisconsin and southeastern Minnesota.
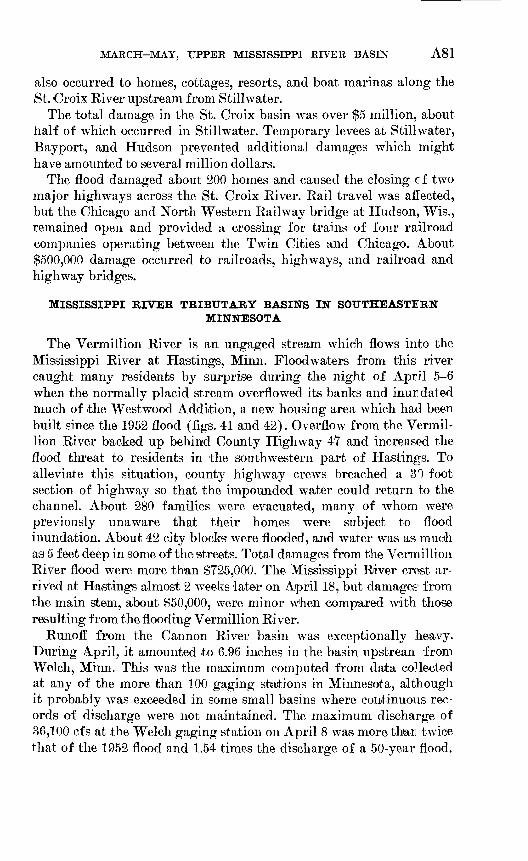
MARCH-MAY, UPPER MISSISSIPPI RIVER BASIN A81
also occurred to homes, cottages, resorts, and boat marinas along the St. Croix River upstream from Stillwater.
The total damage in the St. Croix basin was over $5 million, about half of which occurred in Stillwater. Temporary levees at Stillw^ater, Bayport, and Hudson prevented additional damages which might have amounted to several million dollars.
The flood damaged about 200 homes and caused the closing cf two major highways across the St. Croix River. Rail travel was affected, but the Chicago and North Western Railway bridge at Hudson, Wis., remained open and provided a crossing for trains of four railroad companies operating between the Twin Cities and Chicago. About $500,000 damage occurred to railroads, highways, and railroad and highway bridges.
MISSISSIPPI RIVER TRIBUTARY BASINS IN SOUTHEASTERNMINNESOTA
The Vermillion River is an ungaged stream which flows into the Mississippi River at Hastings, Minn. Flood waters from this river caught many residents by surprise during the night of April 5-6 when the normally placid stream overflowed its banks and inur dated much of the Westwood Addition, a new housing area which had been built since the 1952 flood (figs. 41 and 42). Overflow from the Vermil lion River backed up behind County Highway 47 and increased the flood threat to residents in the southwestern part of Hastings. To alleviate this situation, county highway crews breached a 30-foot section of highway so that the impounded water could return to the channel. About 280 families were evacuated, many of whom were previously unaware that their homes were subject to flood inundation. About 42 city blocks were flooded, and water was as much as 5 feet deep in some of the streets. Total damages from the Vermillion River flood were more than $725,000. The Mississippi River crest ar rived at Hastings almost 2 weeks later on April 18, but damages from the main stem, about $50,000, were minor when compared with those resulting from the flooding Vermillion River.
Runoff from the Cannon River basin was exceptionally heavy. During April, it amounted to 6.96 inches in the basin upstreair from Welch, Minn. This was the maximum computed from data collected at any of the more than 100 gaging stations in Minnesota, although it probably was exceeded in some small basins where continuous rec ords of discharge were not maintained. The maximum discharge of 36,100 cf s at the Welch gaging station on April 8 was more thai twice that of the 1952 flood and 1.54 times the discharge of a 50-year flood.
A82 FLOODS OF 1965 IN THE UNITED STATES
FIGURE 41. Flooded area in Hastings, Minn.
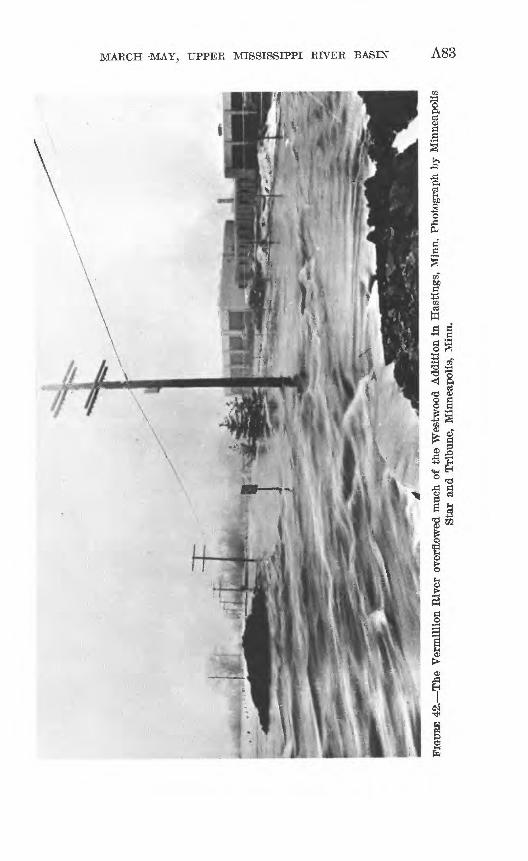
MARCH-MAY, UPPER MISSISSIPPI RIVER BASIN A83
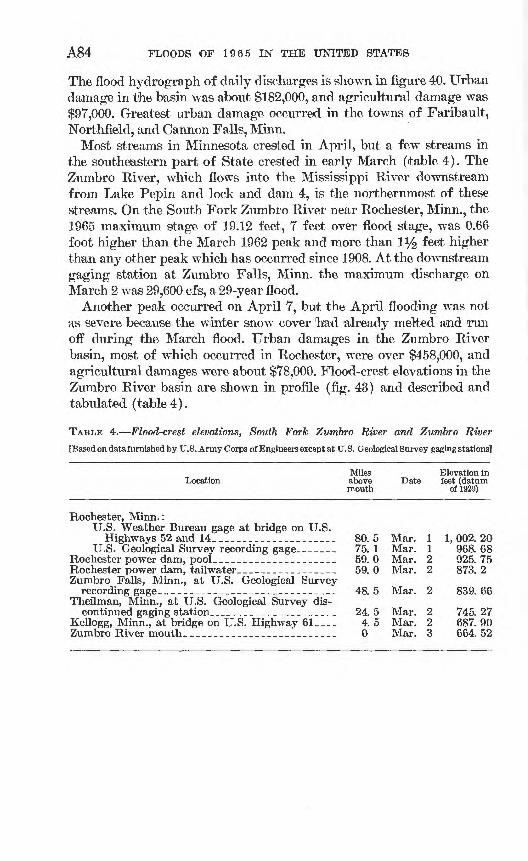
A84 FLOODS OF 1965 IN THE UNITED STATES
The flood hydrograph of daily discharges is shown in figure 40. Urban damage in the basin was about $182,000, and agricultural damage was $97,000. Greatest urban damage occurred in the towns of Faribault, Northfield, and Cannon Falls, Minn.
Most streams in Minnesota crested in April, but a few streams in the southeastern part of State crested in early March (table 4). The Zumbro River, which flows into the Mississippi River downstream from Lake Pepin and lock and dam 4, is the northernmost of these streams. On the South Fork Zumbro River near Rochester, Minn., the 1965 maximum stage of 19.12 feet, 7 feet over flood stage, was 0.66 foot higher than the March 1962 peak and more than iy2 feet higher than any other peak which has occurred since 1908. At the downstream gaging station at Zumbro Falls, Minn. the maximum discharge on March 2 was 29,600 cf s, a 29-year flood.
Another peak occurred on April 7, but the April flooding was not as severe because the winter snow cover had already melted and run off during the March flood. Urban damages in the Zumbro River basin, most of which occurred in Rochester, were over $458,000, and agricultural damages were about $78,000. Flood-crest elevations in the Zumbro River basin are shown in profile (fig. 43) and described and tabulated (table 4).
TABLE 4. Flood-crest elevations, South Fork Zumbro River and Zumbro River
[Based on data furnished by U.S. Army Corps of Engineers except at U.S. Geological Survey gaging stations]
Miles Elevation inLocation above Date feet (datum
mouth of 1929)
Rochester, Minn.:U.S. Weather Bureau gage at bridge on U.S.
Highways 52 and 14_____________ 80.5 Mar. 1 1,002.20U.S. Geological Survey recording gage.------ 75. 1 Mar. 1 968. 68
Rochester power dam, pool______________.______ 59.0 Mar. 2 925.75Rochester power dam, tailwater_________________ 59.0 Mar. 2 873.2Zumbro Falls, Minn., at U.S. Geological Survey
recording gage______________________ 48.5 Mar. 2 839.66Theilman, Minn., at U.S. Geological Survey dis
continued gaging station____________________ 24.5 Mar. 2 745.27Kellogg, Minn., at bridge on U.S. Highway 61__ 4. 5 Mar. 2 687. 90 Zumbro River mouth. _______________ 0 Mar. 3 664.52
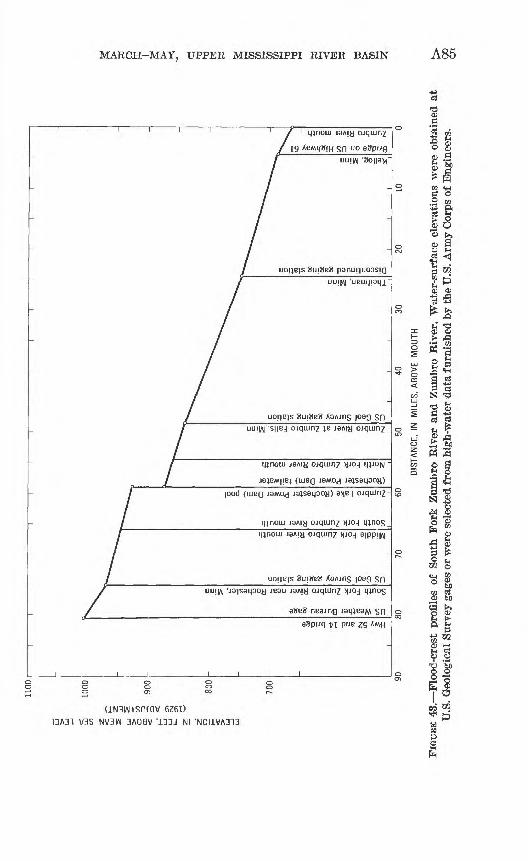
ELEVATION. IN FEET, ABOVE MEAN SEA LEVEL
(1929 ADJUSTMENT)
Hwy 52 and 14 bridge
US Weather Bureau gage
South Fork Zumbro River near Rochester, MinnUS Geol Survey gaging station
Middle Fork Zumbro River mouthSouth Fork Zumbro River mouth
Zumbro Lake (Rochester Power Dam) pool
(Rochester Power Dam) tailwater
North Fork Zumbro River mouth
S8VJSIISVS H3AIH WJISSISSIK H3<I<m
A86 FLOODS OF 1965 IN THE UNITED STATES
The only gaging station in the Whitewater River basin is on a relatively small drainage area on the South Fork Whitewater River near Altura, Minn. Flooding and damages in this basin were not severe. The maximum stage at the Altura gaging station, with occurred on March 1, was largely the result of rapid snowmelt runoff and ice backwater. The maximum discharge of 2,360 cfs which occurred during a later peak on April 7 was only a 2-year flood.
The Root River, which joins the Mississippi River about 3 miles downstream from La Crosse, Wis., drains an area in extreme south eastern Minnesota and also a few square miles on northeastern Iowa. The topography of the Root River basin is characteristic of south eastern Minnesota. It is rolling and undulating and contains a number of steep bluffs. The greater part of the basin is under cultivation, but the plateaus at the top of the bluff and many of the hillsides are forested. The topographic relief varies more than 650 feet within the basin, and as a consequence, runoff is more rapid than in many areas in Minnesota.
Runoff from snowmelt started in the Root River basin at the end of February, as the result of warm temperatures, and was intensified by a heavy rain which fell on March 1. This condition created very sharp ice-affected peaks in the basin on March 1 and 2 (fig. 40). Stages exceeded any previously known from Lanesboro, Minn., to the mouth. At the gaging station near Houston, Minn., the maximum stage of 18.32 feet was more than 3 feet higher than the previous maximum stage in 44 years of record, but the maximum discharge of the 1965 flood was exceeded twice during the period of record. Recurrence inter vals of the maximum discharge varied from 19 years at Lanesboro to 30 years near Houston. Paradoxically, the recurrence intervals of tributary peaks on Rush Creek and South Fork Root River were only 5 years and 3 years, respectively.
The economy of the Root River basin, which depends largely upon agriculture, was not seriously affected because most of the damage was urban. Greatest damage occurred in Houston where most of the busi ness establishments and about 255 homes were flooded. Streets and sewerlines also were damaged. In Rushford, 150 homes and 40 busi nesses were flooded, and in Peterson, 35 homes were flooded. Total damages in the basin exceeded $2 million to urban property and about $320,000 to agricultural property.
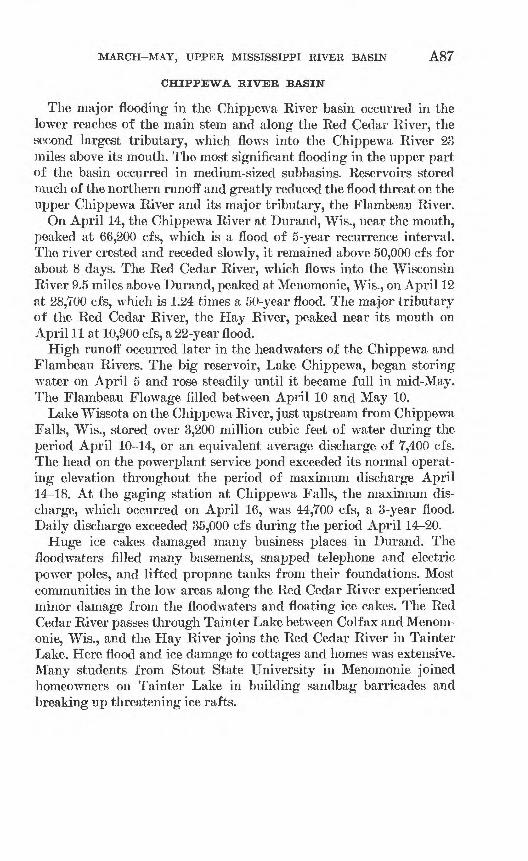
MARCH-MAY, UPPER MISSISSIPPI RIVER BASIN A87
CHIPPEWA RIVER BASIN
The major flooding in the Chippewa River basin occurred in the lower reaches of the main stem and along the Red Cedar River, the second largest tributary, which flows into the Chippewa River 23 miles above its mouth. The most significant flooding in the upper part of the basin occurred in medium-sized subbasins. Reservoirs stored much of the northern runoff and greatly reduced the flood threat on the upper Chippewa River and its major tributary, the Flambeau River.
On April 14, the Chippewa River at Durand, Wis., near the mouth, peaked at 66,200 cfs, which is a flood of 5-year recurrence interval. The river crested and receded slowly, it remained above 50,000 cfs for about 8 days. The Red Cedar River, which flows into the Wisconsin River 9.5 miles above Durand, peaked at Menomonie, Wis., on April 12 at 28,700 cfs, which is 1.24 times a 50-year flood. The major tributary of the Red Cedar River, the Hay River, peaked near its mouth on April 11 at 10,900 cfs, a 22-year flood.
High runoff occurred later in the headwaters of the Chippewa and Flambeau Rivers. The big reservoir, Lake Chippewa, began storing water on April 5 and rose steadily until it became full in mid-May. The Flambeau Flowage filled between April 10 and May 10.
Lake Wissota on the Chippewa River, just upstream from Chippewa Falls, Wis., stored over 3,200 million cubic feet of water during the period April 10-14, or an equivalent average discharge of 7,400 cfs. The head on the powerplant service pond exceeded its normal operat ing elevation throughout the period of maximum discharge April 14^18. At the gaging station at Chippewa Falls, the maximum dis charge, which occurred on April 16, was 44,700 cfs, a 3-year flood. Daily discharge exceeded 35,000 cfs during the period April 14^-20.
Huge ice cakes damaged many business places in Durand. The floodwaters filled many basements, snapped telephone and electric power poles, and lifted propane tanks from their foundations. Most communities in the low areas along the Red Cedar River experienced minor damage from the floodwaters and floating ice cakes. The Red Cedar River passes through Tainter Lake between Coif ax and Menom onie, Wis., and the Hay River joins the Red Cedar River in Tainter Lake. Here flood and ice damage to cottages and homes was extensive. Many students from Stout State University in Menomonie joined homeowners on Tainter Lake in building sandbag barricades and breaking up threatening ice rafts.
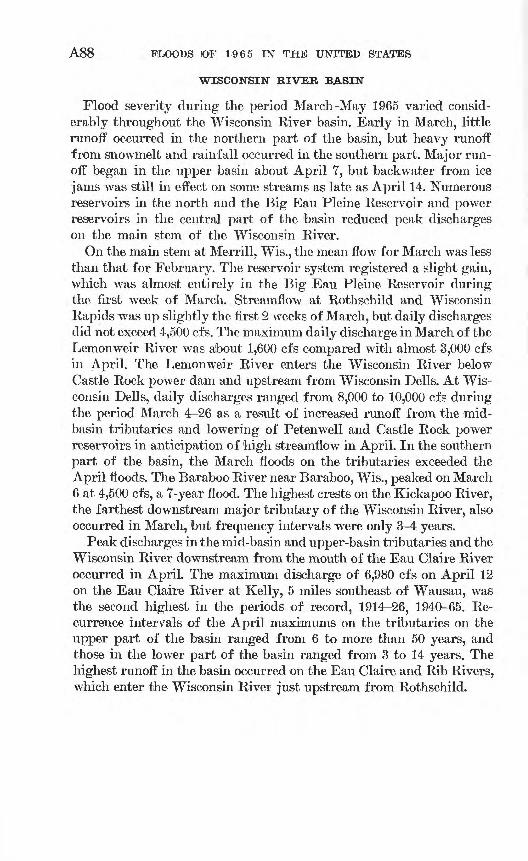
A88 FLOODS OF 1965 IN THE UNITED STATES
WISCONSIN RIVER BASIN
Flood severity during the period March-May 1965 varied consid erably throughout the Wisconsin River basin. Early in March, little runoff occurred in the northern part of the basin, but heavy runoff from snowmelt and rainfall occurred in the southern part. Major run off began in the upper basin about April 7, but backwater from ice jams was still in effect 011 some streams as late as April 14. Numerous reservoirs in the north and the Big Eau Pleine Reservoir and power reservoirs in the central part of the basin reduced peak discharges on the main stem of the Wisconsin River.
On the main stem at Merrill, Wis., the mean flow for March was less than that for February. The reservoir system registered a slight gain, which was almost entirely in the Big Eau Pleine Reservoir during the first week of March. Streamflow at Rothschild and Wisconsin Rapids was up slightly the first 2 weeks of March, but daily discharges did not exceed 4,500 cfs. The maximum daily discharge in March of the Lemonweir River was about 1,600 cfs compared with almost 3,000 cfs in April. The Lemonweir River enters the Wisconsin River below Castle Rock power dam and upstream from Wisconsin Dells. At Wis consin Dells, daily discharges ranged from 8,000 to 10,000 cfs during the period March 4-26 as a result of increased runoff from the mid- basin tributaries and lowering of Petenwell and Castle Rock power reservoirs in anticipation of high streamflow in April. In the southern part of the basin, the March floods on the tributaries exceeded the April floods. The Baraboo River near Baraboo, Wis., peaked on March 6 at 4,500 cfs, a 7-year flood. The highest crests on the Kickapoo River, the farthest downstream major tributary of the Wisconsin River, also occurred in March, 'but frequency intervals were only 3-4 years.
Peak discharges in the mid-basin and upper-basin tributaries and the Wisconsin River downstream from the mouth of the Eau Claire River occurred in April. The maximum discharge of 6,980 cfs on April 12 on the Eau Claire River at Kelly, 5 miles southeast of Wausau, was the second highest in the periods of record, 1914-26, 1940-65. Re currence intervals of the April maximums on the tributaries on the upper part of the basin ranged from 6 to more than 50 years, and those in the lower part of the basin ranged from 3 to 14 years. The highest runoff in the basin occurred on the Eau Claire and Rib Rivers, which enter the Wisconsin River just upstream from Rothschild.
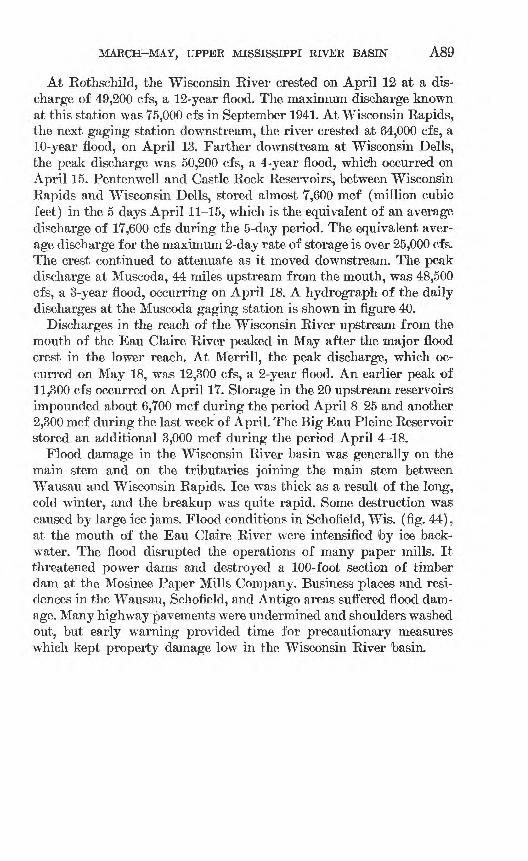
MARCH-MAY, UPPER MISSISSIPPI RIVER BASIN A89
At Rothschild, the Wisconsin Eiver crested on April 12 at a dis charge of 49,200 cfs, a 12-year flood. The maximum discharge known at this station was 75,000 cfs in September 1941. At Wisconsin Eapids, the next gaging station downstream, the river crested at 64,000 cfs, a 10-year flood, on April 13. Farther downstream at Wisconsin Dells, the peak discharge was 50,200 cfs, a 4-year flood, which occurred on April 15. Pentenwell and Castle Eock Reservoirs, between Wisconsin Eapids and Wisconsin Dells, stored almost 7,600 mcf (million cubic feet) in the 5 days April 11-15, which is the equivalent of an average discharge of 17,600 cfs during the 5-day period. The equivalent aver age discharge for the maximum 2-day rate of storage is over 25,000 cfs. The crest continued to attenuate as it moved downstream. The peak discharge at Muscoda, 44 miles upstream from the mouth, was 48,500 cfs, a 3-year flood, occurring on April 18. A hydrograph of the daily discharges at the Muscoda gaging station is shown in figure 40.
Discharges in the reach of the Wisconsin Eiver upstream from the mouth of the Eau Claire Eiver peaked in May after the major flood crest in the lower reach. At Merrill, the peak discharge, which oc curred on May 18, was 12,300 cfs, a 2-year flood. An earlier peak of 11,300 cfs occurred on April 17. Storage in the 20 upstream reservoirs impounded about 6,700 mcf during the period April 8-25 and another 2,300 mcf during the last week of April. The Big Eau Pleine Eeservoir stored an additional 3,000 mcf during the period April 4-18.
Flood damage in the Wisconsin Eiver basin was generally on the main stem and on the tributaries joining the main stem between Wausau and Wisconsin Eapids. Ice was thick as a result of the long, cold winter, and the breakup was quite rapid. Some destruction was caused by large ice jams. Flood conditions in Schofield, Wis. (fig. 44), at the mouth of the Eau Claire Elver were intensified 'by ice back water. The flood disrupted the operations of many paper mills. It threatened power dams and destroyed a 100-foot section of timber dam at the Mosinee Paper Mills Company. Business places and resi dences in the Wausau, Schofield, and Antigo areas suffered flood dam age. Many highway pavements were undermined and shoulders washed out, but early warning provided time for precautionary measures which kept property damage low in the Wisconsin Eiver basin.
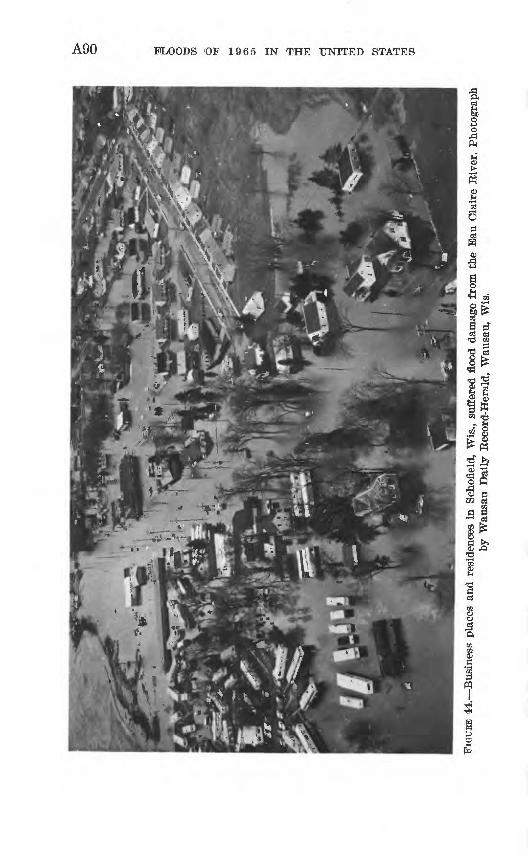
A90 FLOODS OF 1965 IN THE UNITED STATES
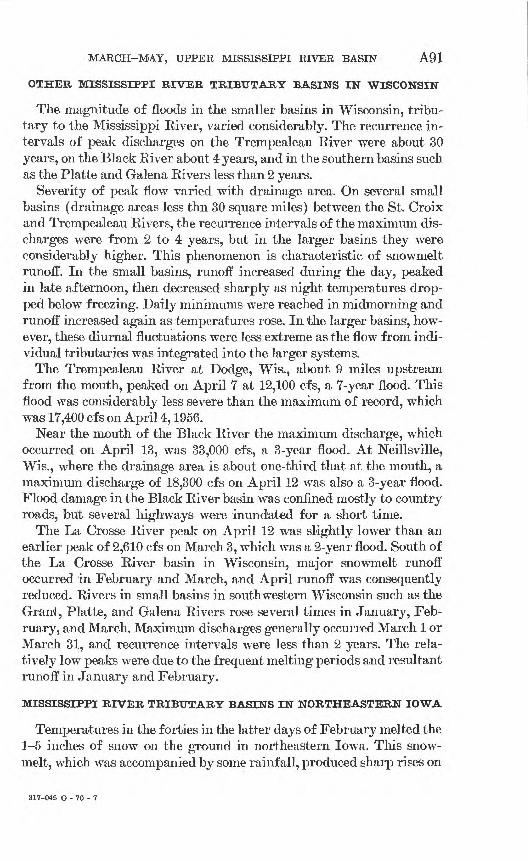
MARCH-MAY, UPPER MISSISSIPPI RIVER BASIN A91
OTHER MISSISSIPPI RIVER TRIBUTARY BASINS IN WISCONSIN
The magnitude of floods in the smaller basins in Wisconsin, tribu tary to the Mississippi River, varied considerably. The recurrence in tervals of peak discharges on the Trempealeau River were about 30 years, on the Black River about 4 years, and in the southern basins such as the Platte and Galena Rivers less than 2 years.
Severity of peak flow varied with drainage area. On several small basins (drainage areas less thn 30 square miles) between the St. Croix and Trempealeau Rivers, the recurrence intervals of the maximum dis charges were from 2 to 4 years, but in the larger basins they were considerably higher. This phenomenon is characteristic of snowmelt runoff. In the small basins, runoff increased during the day, peaked in late afternoon, then decreased sharply as night temperatures drop ped below freezing. Daily minimums were reached in midmorning and runoff increased again as temperatures rose. In the larger basins, how ever, these diurnal fluctuations were less extreme as the flow from indi vidual tributaries was integrated into the larger systems.
The Trempealeau River at Dodge, Wis., about 9 miles upstream from the mouth, peaked on April 7 at 12,100 cfs, a 7-year flood. This flood was considerably less severe than the maximum of record, which was 17,400 cfs on April 4,1956.
Near the mouth of the Black River the maximum discharge, which occurred on April 13, was 33,000 cfs, a 3-year flood. At Neillsville, Wis., where the drainage area is about one-third that at the mouth, a maximum discharge of 18,300 cfs on April 12 was also a 3-year flood. Flood damage in the Black River basin was confined mostly to country roads, but several highways were inundated for a short time.
The La Crosse River peak on April 12 was slightly lower than an earlier peak of 2,610 cfs on March 3, which was a 2-year flood. South of the La Crosse River basin in Wisconsin, major snowmelt runoff occurred in February and March, and April runoff was consequently reduced. Rivers in small basins in southwestern Wisconsin such as the Grant, Platte, and Galena Rivers rose several times in January, Feb ruary, and March. Maximum discharges generally occurred March 1 or March 31, and recurrence intervals were less than 2 years. The rela tively low peaks were due to the frequent melting periods and resultant runoff in January and February.
MISSISSIPPI RIVER TRIBUTARY BASINS IN NORTHEASTERN IOWA
Temperatures in the forties in the latter days of February melted the 1-5 inches of snow on the ground in northeastern Iowa. This snow- melt, which was accompanied by some rainfall, produced sharp rises on
317-045 0-70-7
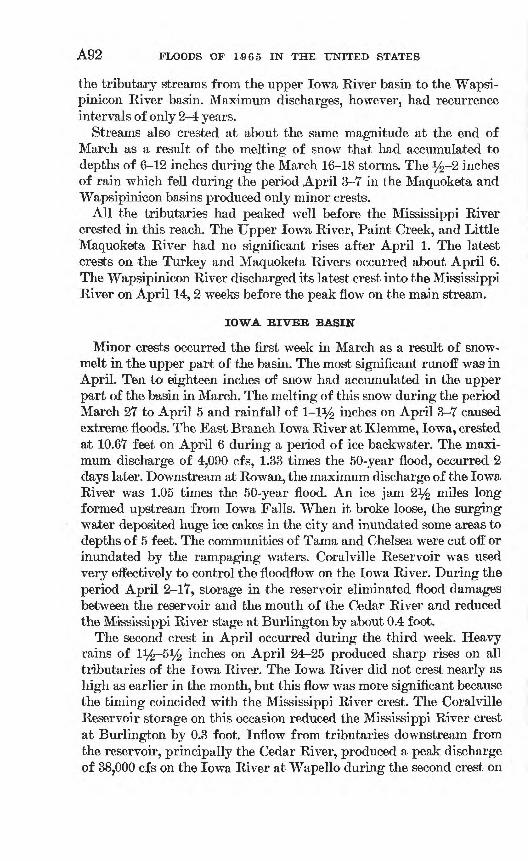
A92 FLOODS OF 1965 IN THE UNITED STATES
the tributary streams from the upper Iowa River basin to the Wapsi- pinicon River basin. Maximum discharges, however, had recurrence intervals of only 2-4 years.
Streams also crested at about the same magnitude at the end of March as a result of the melting of snow that had accumulated to depths of 6-12 inches during the March 16-18 storms. The %-2 inches of rain which fell during the period .April 3-7 in the Maquoketa and Wapaipinicon basins produced only minor crests.
All the tributaries had peaked well before the Mississippi River crested in this reach. The Upper Iowa River, Paint Creek, and Little Maquoketa River had no significant rises after April 1. The latest crests on the Turkey and Maquoketa Rivers occurred about April 6. The Wapsipinicon River discharged its latest crest into the Mississippi River on April 14, 2 weeks before the peak flow on the main stream.
IOWA RIVER BASIN
Minor crests occurred the first week in March as a result of snow- melt in the upper part of the basin. The most significant runoff was in April. Ten to eighteen inches of snow had accumulated in the upper part of the basin in March. The melting of this snow during the period March 27 to April 5 and rainfall of 1-1% inches on April 3-7 caused extreme floods. The East Branch Iowa River at Klemme, Iowa, crested at 10.67 feet on April 6 during a period of ice backwater. The maxi mum discharge of 4,090 cfs, 1.33 times the 50-year flood, occurred 2 days later. Downstream at Rowan, the maximum discharge of the Iowa River was 1.05 times the 50-year flood. An ice jam 2i/£ miles long formed upstream from Iowa Falls. When it broke loose, the surging water deposited huge ice cakes in the city and inundated some areas to depths of 5 feet. The communities of Tama and Chelsea were cut off or inundated by the rampaging waters. Coralville Reservoir was used very effectively to control the floodflow on the Iowa River. During the period April 2-17, storage in the reservoir eliminated flood damages between the reservoir and the mouth of the Cedar River and reduced the Mississippi River stage at Burlington by about 0.4 foot.
The second crest in April occurred during the third week. Heavy rains of l^-S1/^ inches on April 24-25 produced sharp rises on all tributaries of the Iowa River. The Iowa River did not crest nearly as high as earlier in the month, but this flow was more significant because the timing coincided with the Mississippi River crest. The Coralville Reservoir storage on this occasion reduced the Mississippi River crest at Burlington by 0.3 foot. Inflow from tributaries downstream from the reservoir, principally the Cedar River, produced a peak discharge of 38,000 cfs on the Iowa River at Wapello during the second crest on
MARCH-MAY, UPPER MISSISSIPPI RIVER BASIN A93
April 26, just 3 days prior to the arrival of the crest of the Mississippi River at the mouth of the Iowa River. At the time of the Mississippi River crest, discharge from the Iowa River was approximately 5 per cent of the total discharge of the Mississippi River below the mouth of the Iowa River.
Discharge hydrographs at selected gaging stations in the Iowa River basin are shown in figure 45.
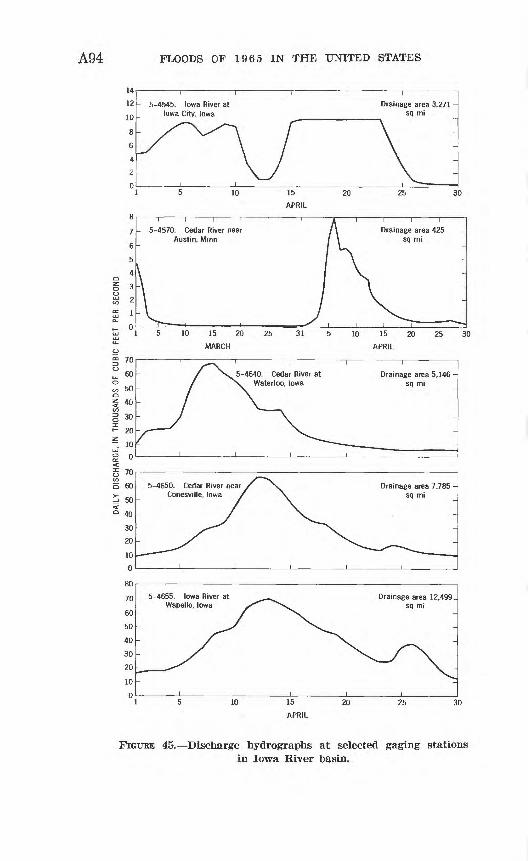
CO
DAI
LY
DIS
CH
ARG
E, I
N TH
OU
SAN
DS
OF
CU
BIC
FE
ET
PER
SEC
ON
D
2 o.
l|
W 3 CO
O1
PBS»
«
5' x
_
oo
oo
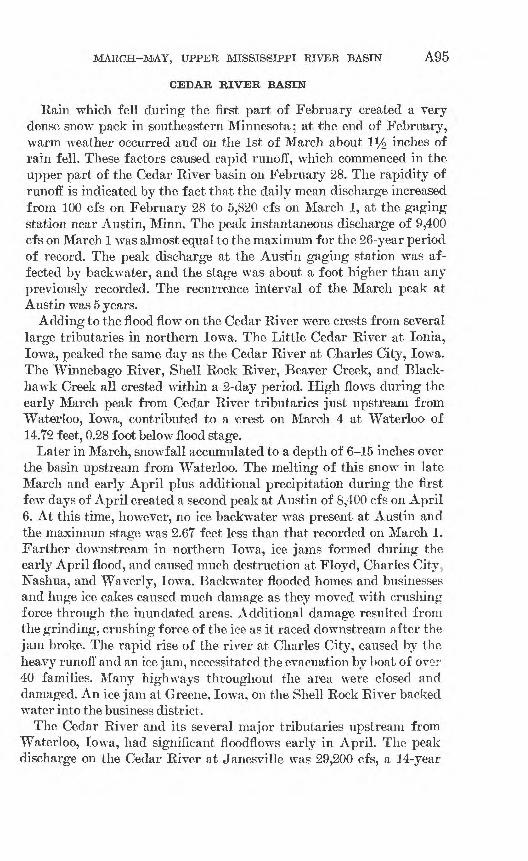
MARCH-MAY, UPPER MISSISSIPPI RIVER BASIN A95
CEDAR RIVER BASIN
Rain which fell during the first part of February created a very dense snow pack in southeastern Minnesota; at the end of February, warm weather occurred and on the 1st of March about li/£ inches of rain fell. These factors caused rapid runoff, which commenced in the upper part of the Cedar River basin on February 28. The rapidity of runoff is indicated by the fact that the daily mean discharge increased from 100 cfs on February 28 to 5,820 cfs on March 1, at the gaging station near Austin, Minn. The peak instantaneous discharge of 9,400 cfs on March 1 was almost equal to the maximum for the 26-year period of record. The peak discharge at the Austin gaging station was af fected by backwater, and the stage was about a foot higher than any previously recorded. The recurrence interval of the March peak at Austin was 5 years.
Adding to the flood flow on the Cedar River were crests from several large tributaries in northern Iowa. The Little Cedar River at Ionia, Iowa, peaked the same day as the Cedar River at Charles City, Iowa. The Winnebago River, Shell Rock River, Beaver Creek, and Black- hawk Creek all crested within a 2-day period. High flows during the early March peak from Cedar River tributaries just upstream from Waterloo, Iowa, contributed to a crest on March 4 at Waterloo of 14.72 feet, 0.28 foot below flood stage.
Later in March, snowfall accumulated to a depth of 6-15 inches over the basin upstream from Waterloo. The melting of this snow in late March and early April plus additional precipitation during the first few days of April created a second peak at Austin of 8,400 cfs on April 6. At this time, however, no ice backwater was present at Austin and the maximum stage was 2.67 feet less than that recorded on March 1. Farther downstream in northern Iowa, ice jams formed during the early April flood, and caused much destruction at Floyd, Charles City, Nashua, and Waverly, Iowa. Backwater flooded homes and businesses and huge ice cakes caused much damage as they moved with crushing force through the inundated areas. Additional damage resulted from the grinding, crushing force of the ice as it raced downstream after the jam broke. The rapid rise of the river at Charles City, caused by the heavy runoff and an ice jam, necessitated the evacuation by boat of over 40 families. Many highways throughout the area were closed and damaged. An ice jam at Greene, Iowa, on the Shell Rock River backed water into the business district.
The Cedar River and its several major tributaries upstream from Waterloo, Iowa, had significant floodflows early in April. The peak discharge on the Cedar River at Janesville was 29,200 cfs, a 14-year
A96 FLOODS OF L965 IN THE UNITED STATES
flood. The recurrence interval of the peak discharges on the West Fork Cedar River at Finchford, Iowa, and Beaver Creek at New Hartford, Iowa, were 30 and 32 years, respectively. Shell Rock River at Shell Rock, Iowa, had a 7-year flood and Blackhawk Creek at Hudson, Iowa, had a 16-year flood. Fortunately, the crests from all the tributaries did not occur simultaneously with the crest on the Cedar River, but the combined flow on the Cedar River at Waterloo, Iowa, was 69,500 cfs almost 80 percent of the potential peak discharges from the upstream stations. The recurrence interval of the Waterloo peak discharge was 34 years. The peak stage reached 21.67 feet, 6.67 feet above flood stage and only 0.19 foot below the record flood of 1961. More than 400 fami lies were forced from their homes in Waterloo, Cedar Falls, and Evansdale. Many homes were saved from the flood by the gallant ef forts of the local residents and a detachment of the Iowa National Guard, who carried out the flood fight as planned by the respective city officials.
The crest at Cedar Rapids, Iowa, was 18.51 feet on April 10, 1.49 feet below the record stage of March 1929 and 1.15 feet below that of March 1961. The Cedar River joins the Iowa River downstream from Cedar Rapids. The Iowa River floodflow above the junction was con trolled by Coralville Reservoir, but the Cedar River crest continued down the Iowa River below the junction and reached the mouth of the Iowa River 2 weeks before the crest on the Mississippi River arrived. High flow continued in the Iowa River for the remainder of the month.
SKUNK BIVEB BASIN
A blizzard in the upper Skunk River basin and a 1-inch rain in the lower basin occurred during the period March 16-18. The runoff from the snowmelt and rain produced peaks with recurrence intervals up to 2^/2 years. Crests in the lower part of the basin were more significant than those upstream. The stage at the downstream station at Augusta, Iowa, reached 16.99 feet, 2 feet above flood stage, on March 18.
During the storm of April 3-7, iy2-3 inches of rain fell in the basin. The recurrence intervals of flood peaks resulting from this storm ranged from 3 to 5 years. The crests at the upstream stations were more significant than those in March, but the Augusta crest in April was 0.54 foot lower. This crest reached the mouth 2 weeks before the Mississippi River crest.
A minor flood crested the last week in April as a result of heavy rains in the southeastern part of Iowa. This crest was perhaps more significant in relation to the Mississippi River flood because the peak
MARCH-MAY, UPPER MISSISSIPPI RIVER BASIN A97
outflow at the mouth occurred almost simultaneously with that of the Mississippi River crest. The discharge from the Skunk River, how ever, was only about 3 percent of the peak flow of the Mississippi River at the mouth of the Skunk River.
DES MOINES RIVER BASIN
Minor flooding of the Des Moines River and its tributaries between the North Raccoon River and Cedar Creek was caused by the l-l1/^ inches of rain that fell during the middle of March. The recurrence interval of the tributary floods ranged from 3 to 18 years.
The outstanding flood occurred early in April. At the end of March, snow on the ground in the West Fork Des Moines River basin in Minnesota varied from 7 to almost 30 inches. Warm temperatures beginning March 27 began to melt this snow. During the period April 3-7, rainfall, varying from 11^ to 2 inches in the upper part of the basin, increased the amount of runoff and intensified the flood condition. A rainfall of up to 3 inches in the lower part of the basin produced floods on the tributaries and a rise on the Des Moines River ahead of the main crest moving downstream. Rapid runoff over the frozen ground caused streams to rise, breaking up the heavy ice cover. Numerous ice jams caused flooding and damage.
A maximum stage of 18.62 feet, determined from floodmark occurred on West Fork Des Moines River at Jackson, Minn., on April 6. Heavy ice floes destroyed the gaging station at this time. The maximum discharge of 9,530 cfs, 1.23 times the 50-year flood, was greater than 'any previous discharge during the 30 years of record, and the maxi mum stage was 1.2 feet higher than any previously recorded (fig. 46). The flood on the West Fork Des Moines River at Estherville, Iowa, was 1.17 times the 50-year flood; on the East Fork Des Moines River near Burt, Iowa, the recurrence interval was 50 years; and on the East Fork at Dakota City, Iowa, it was 1.03 times the 50-year flood.
At Fort Dodge, Iowa, a large ice jam on the Des Moines River broke and damaged the hydroelectric power dam necessitating hurried con struction of a rock fill to prevent failure of the dam. The maximum discharge of 35,600 cfs was greater than any previous discharge during 34 years of record, but the stage was 1.83 feet lower than the flood of June 1947. The recurrence interval of the 1965 flood is 17 years.
The peak stage of Boone River near Webster City, Iowa, reached 15.91 feet, 2.64 feet lower than the flood of June 1954 and 3.2 feet lower than the flood of 1918. The peak discharge had a recurrence interval of 21 years.
The Raccoon River flows into the Des Moines River at the City of Des Moines, Iowa. Fortunately, the flood crest on the Raccoon River preceded the crest on the Des Moines River by about 5 days. The peak
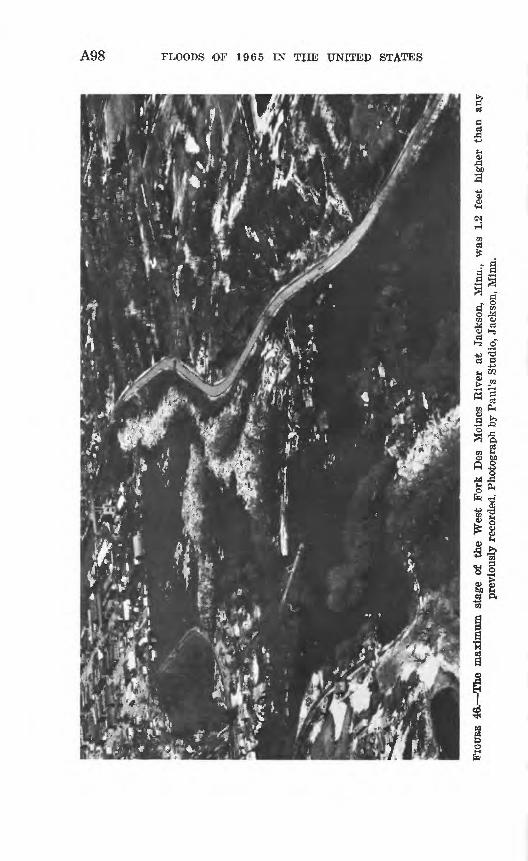
A98 FLOODS OF 1965 IN THE UNITED STATES
I
=? i
*"g« -3
5(1
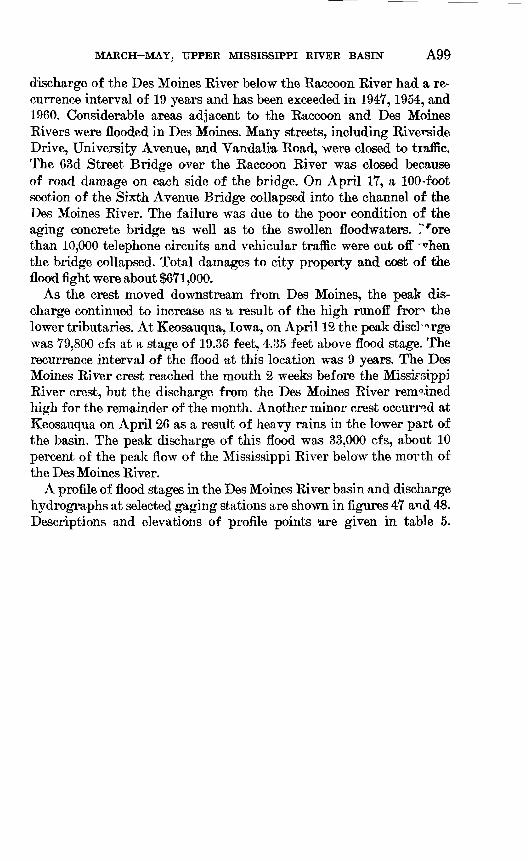
MARCH-MAY, TIPPER MISSISSIPPI RIVER BASIN A99
discharge of the Des Moines River below the Raccoon River had a re currence interval of 19 years and has been exceeded in 1947, 1954, and 1960. Considerable areas adjacent to the Raccoon and Des Moines Rivers were flooded in Des Moines. Many streets, including Riverside Drive, University Avenue, and Vandalia Road, were closed to traffic. The 63d Street Bridge over the Raccoon River was closed because of road damage on each side of the bridge. On April 17, a 100-foot section of the Sixth Avenue Bridge collapsed into the channel of the Des Moines River. The failure was due to the poor condition of the aging concrete bridge 'as well as to the swollen floodwaters. ? rore than 10,000 telephone circuits and vehicular traffic were cut off ^hen the bridge collapsed. Total damages to city property and cost of the flood fight were about $671,000.
As the crest moved downstream from Des Moines, the peak dis charge continued to increase as 'a result of the high runoff f ror* the lower tributaries. At Keosauqua, Iowa, on April 12 the peak disci *\rge was 79,800 cfs at a stage of 19.36 feet, 4.35 feet above flood stage. The recurrence interval of the flood at this location was 9 years. The Des Moines River crest reached the mouth 2 weeks before the Mississippi River crest, but the discharge from the Des Moines River remained high for the remainder of the month. Another minor crest occurred at Keosauqua on April 26 as a result of heavy rains in the lower part of the basin. The peak discharge of this flood was 33,000 cfs, about 10 percent of the peak flow of the Mississippi River below the morth of the Des Moines River.
A profile of flood stages in the Des Moines River basin and discharge hydrographs at selected gaging stations are shown in figures 47 and 48. Descriptions and elevations of profile points 'are given in table 5.
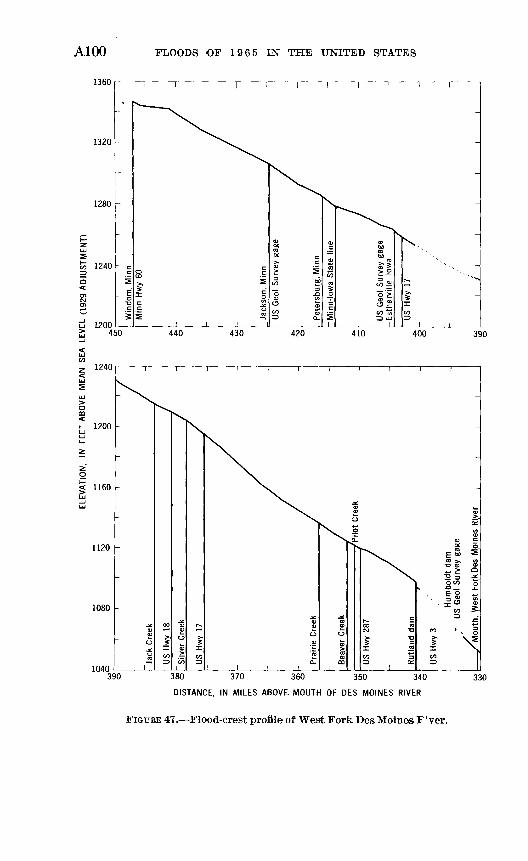
ELE
VA
TIO
N,
IN
FEET
AB
OV
E
ME
AN
SE
A LE
VE
L (1
929
AD
JUS
TME
NT)
s & (f
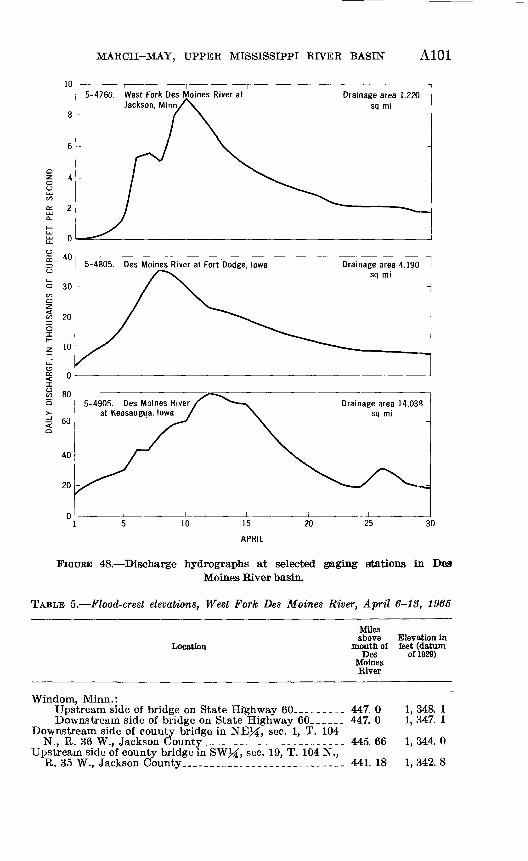
MARCH-MAY, UPPER MISSISSIPPI RIVER BASIN A101
10
5-4805. Des Moines River at Fort Dodge, Iowa
5-4760. West Fork Des Moines River at Jackson, Minn
FIGURE 48. Discharge hydrographs at selected gaging stations in DesMoines River basin.
TABLE 5. Flood-crest elevations, West Fork Des Moines River, April 6-13, 1965
Location
Milesabove Elevation in
mouth of feet (datumDes of 1929)
Moines River
Windom, Minn.:Upstream side of bridge on State Highway 60_______ 447. 0 1, 348. 1Downstream side of bridge on State Highway 60______ 447. 0 1, 347. 1
Downstream side of county bridge in NEJ^, sec. 1, T. 104N., R. 36 W., Jackson County____________________ 445. 66 1, 344. 0
Upstream side of county bridge in SWJ£, sec. 19, T. 104 N.,R. 35 W., Jackson County___________________ 441. 18 1, 342. 8
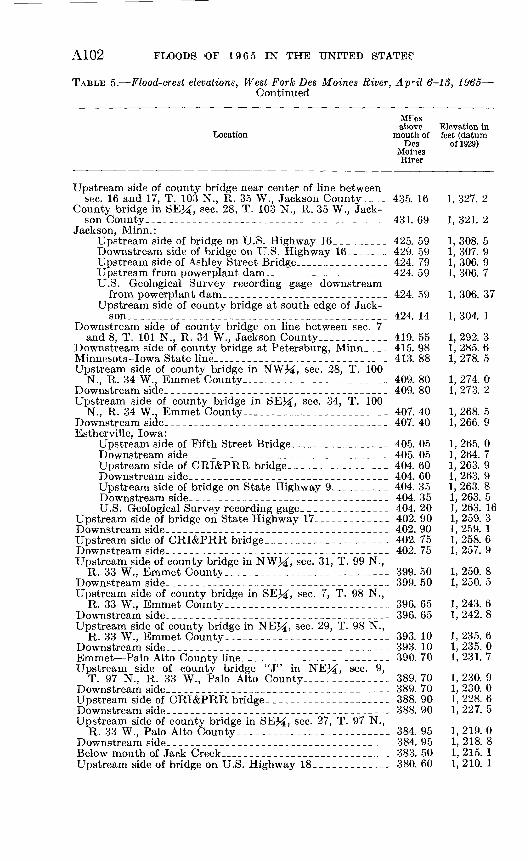
A102 FLOODS OF 1965 IN THE UNITED STATE!?
TABLE 5. Flood-crest elevations, West Fork Des Moines River, Ap*il 6-13, 1965 Continued
Mi'esabove Elevation in
Location mouth of feet (datumDes of 1929)
Mones River
Upstream side of county bridge near center of line betweensec. 16 and 17, T. 103 N., R. 35 W., Jackson County____ 435. 16 1, 327. 2
County bridge in SE^, sec. 28, T. 103 N., R. 35 W., Jack son County_________________________________________ 431. 69 1, 321. 2
Jackson, Minn.:Upstream side of bridge on U.S. Highway 16_________ 425. 59 1, 308. 5Downstream side of bridge on U.S. Highway 16_____-_ 429. 59 1, 307. 9Upstream side of Ashley Street Bridge______________ 424. 79 1, 306. 9Upstream from powerplant dam_____________________ 424. 59 1, 306. 7U.S. Geological Survey recording gage downstream
from powerplant dam----_--___-_________________ 424.59 1,306.37Upstream side of county bridge at south edge of Jack-
son_______________________________________-____ 424.14 1,304.1Downstream side of county bridge on line between sec. 7
and 8, T. 101 N., R. 34 W., Jackson County-__________ 419. 55 1, 292. 3Downstream side of county bridge at Petersburg, Minn____ 415. 98 1, 285. 6Minnesota-Iowa State line____________________________ 413. 88 1, 278. 5Upstream side of county bridge in NWM, sec. 28, T. 100
N., R. 34 W., Emmet County_________________________ 409. 80 1, 274. 0Downstream side______________________________________ 409. 80 1, 273. 2Upstream side of county bridge in SE%, sec. 34, T. 100
N., R. 34 W., Emmet County__.______________________ 407. 40 1, 268. 5Downstream side____-____-_-______-__________________- 407. 40 1, 266. 9Estherville, Iowa:
Upstream side of Fifth Street Bridge_______________ 405. 05 1, 265. 0Downstream side__________________________________ 405.05 1,264.7Upstream side of CRI&PRR bridge.____-___--_-_-__ 404. 60 1, 263. 9Downstream side_______-_--_-_----_-__---_-____-_- 40460 1,263.9Upstream side of bridge on State Highway 9___ _______ 404. 35 1, 263. 8Downstream side---------------------------------- 404.35 1,263.5U.S. Geological Survey recording gage-__------__---- 404.20 1,263.16
Upstream side of bridge on State Highway 17 ----------- 402. 90 1, 259. 3Downstream side-------------------------------------- 402. 90 1, 259. 1Upstream side of CRI&PRR bridge_____________________ 402. 75 1, 258. 6Downstream side----_-_-----------_-------------_---_- 402. 75 1, 257. 9Upstream side of county bridge in NWM, sec. 31, T. 99 N.,
R. 33 W., Emmet County-.- _- ----- --_--- --- 399.50 1,250.8Downstream side--- --------------------------------- 399. 50 1, 250. 5Upstream side of county bridge in SE^, sec. 7, T. 98 N.,
R. 33 W., Emmet County_____________-_-__-_--__--_- 396.65 1,243.6Downstream side------------------------------------- 396. 65 1,242.8Upstream side of county bridge in NE^, sec. 29, T. 98 N.,
R. 33 W., Emmet County_-__-_----___-__-_-__-_-_-_- 393.10 1,235.6Downstream side- - - -- - 393. 10 1, 235. 0Emmet Palo Alto County line__ _ _ - 390. 70 1, 231. 7 Upstream side of county bridge "J" in NEM, sec. 9,
T. 97 N., R. 33 W., Palo Alto County____________-__ 389.70 1,230.9Downstream side _ _ - - - - 389. 70 1, 230. 0 Upstream side of CRI&PRR bridge--------------------- 388.90 1,228.6Downstream side 388. 90 1, 227. 5Upstream side of county bridge in SEJ^, sec. 27, T. 97 N.,
R. 33 W., Palo Alto County__-______-_____---___---_- 384. 95 1, 219. 0Downstream side-______-____-_-_________--_____-_----- 384. 95 1, 218. 8Below mouth of Jack Creek ______________________ 383. 50 1, 215. 1Upstream side of bridge on U.S. Highway 18. __ _____ 380. 60 1, 210. 1
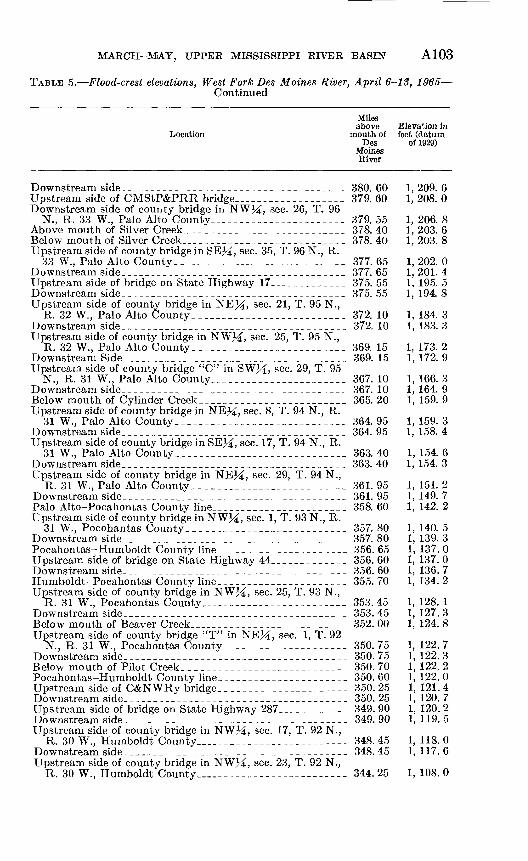
MARCH-MAY, UPPER MISSISSIPPI RIVER BASIN A103
TABLE 5. Flood-crest elevations, West Fork Des Moines River, April 6-18, 1965 Continued
Milesabove Elevation in
Location mouth of feet (datumDes of 1929)
Moines River
Downstream side--__-----__-___-__--___--__--________- 380. 60 1, 209. 6Upstream side of CMStP&PRR bridge_________________ 379. 60 1, 208. 0Downstream side of county bridge in NWJ^, sec. 26, T. 96
N., R. 33 W., Palo Alto County_______________________ 379. 55 1, 206. 8Above mouth of Silver Creek_ __________________________ 378. 40 1, 203. 6Below mouth of Silver Creek__________________________ 378. 40 1, 203. 8Upstream side of county bridge in SEJ4, sec. 35, T. 96 N., R.
33 W., Palo Alto County-.........-.............._._....__ 377.65 1,202.0Downstream side______________________________________ 377. 65 1, 201. 4Upstream side of bridge on State Highway 17_____________ 375. 55 1, 195. 5Downstream side______________________________________ 375. 55 1, 194. 8Upstream side of county bridge in NEJ4, sec. 21, T. 95 N.,
R. 32 W., Palo Alto County--------------.---.------- 372.10 1,184.3Downstream side____________________________________ 372. 10 1, 183. 3Upstream side of county bridge in NWJ4, sec. 25, T. 95 N.,
R. 32 W., Palo Alto County__ ___ ___________________ 369.15 1,173.2Downstream Side______________ _______________________ 369.15 1,172.9Upstream side of county bridge "C" in SWJ4, sec. 29, T. 95
N., R. 31 W., Palo Alto County-- ______--__-__---___. 367. 10 1, 166. 3Downstream side______________________________________ 367. 10 1, 164. 9Below mouth of Cylinder Creek_________________________ 365. 20 1, 159. 9Upstream side of county bridge in NEJ4, sec. 8, T. 94 N., R.
31 W., Palo Alto County___________________________ 364.95 1,159.3Downstream side_.____________________________________ 364. 95 1, 158. 4Upstream side of county bridge in SEJ4, sec. 17, T. 94 N., R.
31 W., Palo Alto County-__--___-___--______________- 363.40 1,154.6Downstream side______________________________________ 363. 40 1, 154. 3Upstream side of county bridge in NEJ4, sec. 29, T. 94 N.,
R. 31 W., Palo Alto County-------------------------- 361.95 1,151.2Downstream side._____________________________________ 361. 95 1, 149. 7Palo Alto-Pocahontas County line_____________________ 358. 60 1, 142. 2Upstream side of county bridge in NWJ4, sec. 1, T. 93 N., R.
31 W., Pocohantas County---_--_ ___________________ 357.80 1,140.5Downstream side______________________________________ 357. 80 1, 139. 3Pocahontas-Humboldt County line_.____________________ 356.65 1, 137.0Upstream side of bridge on State Highway 44___________ 356. 60 1, 137. 0Downstream side_______________________--___________-_ 356.60 1, 136.7Humboldt-Pocahontas County line______________________ 355. 70 1, 134. 2Upstream side of county bridge in NWM, sec. 25, T. 93 N.,
R. 31 W., Pocahontas County_______________________ 353.45 1,128.1Downstream side______________________________________ 353. 45 1, 127. 3Below mouth of Beaver Creek_________________________ 352.00 1, 124.8Upstream side of county bridge "T" in NEM, sec. 1, T. 92
N., R. 31 W., Pocahontas County__--___-__---_-___--_ 350.75 1, 122.7 Downstream side____________________________________ 350. 75 1, 122. 3Below mouth of Pilot Creek_____--__--__--____-____-_-_ 350.70 1, 122.2Pocahontas-Humboldt County line_ _____________________ 350. 60 1, 122. 0Upstream side of C&NWRy bridge._ ____________________ 350.25 1,121.4Downstream side______________________________________ 350.25 1, 120.7Upstream side of bridge on State Highway 287____________ 349. 90 1, 120. 2Downstream side____-__--__________--_-_____-_-__-___- 349.90 1, 119.5Upstream side of county bridge in NWM, sec. 17, T. 92 N.,
R. 30 W., Humboldt County,_____________________ 348.45 1,118.0Downstream side______________________________________ 348. 45 1,117.6Upstream side of county bridge in NWJ4, sec. 23, T. 92 N.,
R. 30 W., Humboldt County _-__--_- - _ --- 344. 25 1, 108. 0
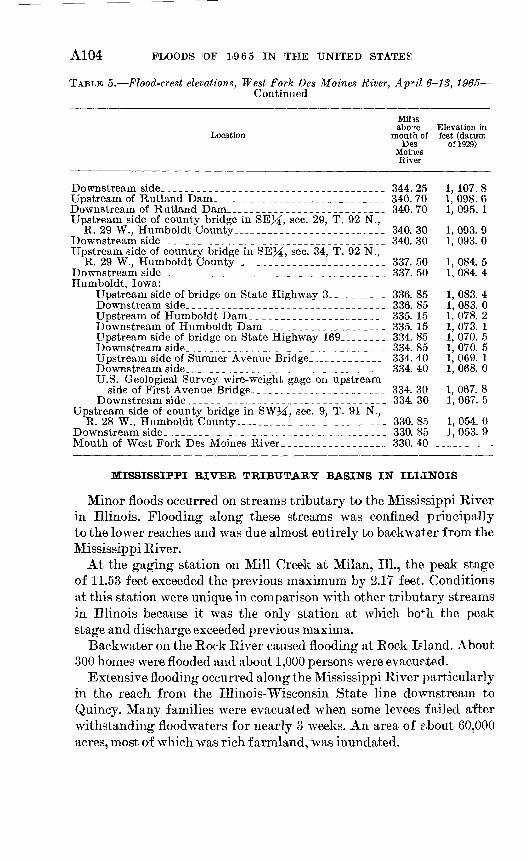
A104 FLOODS OF 1965 IN THE UNITED STATES
TABLE 5. Flood-crest elevations, West Fork Des Moines River, Ap*il 6-13, 1965 -Continued
Mihsabo^e Elevation in
Location mouth of feet (datumDes of 1929)
Moiies River
Downstream side______________________________________ 344. 25 1, 107. 8Upstream of Rutland Dam.____________________________ 340. 70 1, 098. 6Downstream of Rutland Dam_______________________ 340. 70 1, 095. 1Upstream side of county bridge in SE^, sec. 29, T. 92 N.,
R. 29 W., Humboldt County__________________________ 340.30 1,093.9Downstream side._____________________________________ 340. 30 1, 093. 0Upstream side of country bridge in SE^£, sec. 34, T. 92 N.,
R. 29 W., Humboldt County-__-._____________________ 337.50 1,084.5Downstream side______________________________________ 337. 50 1, 084. 4Humboldt, Iowa:
Upstream side of bridge on State Highway 3__________ 336. 85 1, 083. 4Downstream side__________________________________ 336.85 1,083.0Upstream of Humboldt Dam_______________________ 335.15 1,078.2Downstream of Humboldt Dam_____________________ 335. 15 1, 073. 1Upstream side of bridge on State Highway 169________ 334. 85 1, 070. 5Downstream side_______________________________.__ 334.85 1,070.5Upstream side of Sumner Avenue Bridge_____________- 334. 40 1, 069. 1Downstream side_ _________________________________ 334.40 1,068.0U.S. Geological Survey wire-weight gage on upstream
side of First Avenue Bridge-_.____________________ 334.30 1,067.8Downstream side__________________________________ 334.30 1,067.5
Upstream side of county bridge in SWM, sec. 9, T. 91 N.,R. 28 W., Humboldt County_---____-___-____-_____-_- 330.85 1,054.0
Downstream side___________.__________________________ 330. 85 1, 053. 9Mouth of West Fork Des Moines River__________________ 330. 40 __________
MISSISSIPPI BIVEB TBIBUTAKY BASINS IN ILIJNOIS
Minor floods occurred on streams tributary to the Mississippi River in Illinois. Flooding along these streams was confined principally to the lower reaches and was due almost entirely to backwater from the Mississippi Eiver.
At the gaging station on Mill Creek at Milan, 111., the peak stage of 11.53 feet exceeded the previous maximum by 2.17 feet. Conditions at this station were unique in comparison with other tributary streams in Illinois because it was the only station at which both the peak stage and discharge exceeded previous maxima.
Backwater on the Eock River caused flooding at Rock Island. About 300 homes were flooded and about 1,000 persons were evacuated.
Extensive flooding occurred along the Mississippi River particularly in the reach from the Illinois-Wisconsin State line downstream to Quincy. Many families were evacuated when some levees failed after withstanding floodwaters for nearly 3 weeks. An area of p.bout 60,000 acres, most of which was rich farmland, was inundated.
MARCH-MAY, UPPER MISSISSIPPI RIVER BASIN A105
MISSISSIPPI BIVEB TBIBUTABY BASINS IN MISSOUBI
During the period March-May 1965, only minor crests occurred on the streams in Missouri that are tributary to the Mississippi River upstream from the mouth of the Missouri River. Peak discharges having recurrence intervals of 1 or 2 years occurred in March or April prior to the time of the peak discharge on the Mississippi River. The runoff from the tributary basins was less than 1 percent of that c f the Mississippi River at Alton, 111., during the period March-May 1965.
FLOOD OPERATIONS
The President of the United States declared a total of 183 counties in the five-State area eligible for natural-disaster assistance under Public Law 875. Eighty-seven of these counties were in Iowa, 65 in Minnesota, 14 in Wisconsin, 10 in Illinois, and seven in Missouri.
The Office of Emergency Planning set up disaster field offices in Mankato and St. Paul, Minn., La Crosse, Wis., and Iowa City, Iowa, to ,provide information for local communities on the (procedures for applying for Federal disaster assistance under Public Law 875.
All the military services were involved in the flood-fighting effort. The Army National Guard expended 7,186 man-days on flood-fighting activities in Minnesota and 2,410 man-days in Wisconsin. Records show that 2,830 guardsmen were called to duty during the flcod in Iowa; 612 were called in Illinois, and 279 in Missouri. In addition, the National Guard furnished mobile equipment, airplanes, and heli copters. The U.S. Navy and U.S. Air Force provided helicopters for reconnaissance and rescue missions and the Coast Guard provided emergency communications equipment and patrol boats for rescue and security missions. Navy and private .planes obtained aerial pho tographs of the Mississippi River and the Minnesota River at or near their crests.
Early in March the U.S. Army Corps of Engineers made snow sur veys in the Minnesota and upper Mississippi River basins. During the flood, the Corps of Engineers North-Central Division office in CHcago and the district offices in St. Paul, Minn., and Rock Island, 111., estab lished emergency operations centers in 60 major disaster areas. These centers assisted the local communities and provided vital informa tion concerning flood-fighting techniques. The Corps also made sur veys of damage during and after the flood.
The U.S. Bureau of Public Roads, in cooperation with the State Highway Departments, provided cost estimates for emergency road repairs and restoration of damaged highway structures. The Bureau of Public Roads also provided assistance to States and counties in implementing the provisions of Public Law 875.
A106 FLOODS OF 1965 IN THE UNITED STATES
The Department of Health, Education, and Welfare, in cooperation with State Departments of Health, inspected public water supply and sewage disposal systems and evaluated applications for disaster relief from the stricken communities.
The Federal Housing Commission surveyed damage to public build ings in the flood-stricken area and informed flood-affected communi ties on its programs for granting low-interest loans.
The National Red Cross provided staff workers in the flooded areas to assist local chapters. Total expenditures by the National Red Cross were about $1,800,000. More than 150,000 flood victims and workers received Red Cross care and assistance.
Recognition should be given to the inhabitants of the etricken com munities for the great effort they put forth to diminish damages to public property, businesses, and homes. Volunteer flood workers turned out by the thousands and great quantities of equipment and supplies were donated to the flood-fighting effort. High school and college stu dents, in particular, endeared themselves to many communities by their selfless and tireless efforts to control and minimize the damage caused by floods of unprecedented magnitude.
In the five-State flood-affected area, about 50 engineers and tech nicians of the Water Resources Division, U.S. Geological Survey, col lected the stage and discharge data which are tabulated in this report. Many of the discharge measurements upon which the computation of data depends were made under extremely adverse conditions involv ing inclement weather, impassable roads, ice floes, submerged gages, high stream velocities, deep soundings, and wide overflow channels. Discharge measurements in channels and overflows up to a mile and a half wide had to be made by boat. The U.S. Geological Survey Flood Coordinator in St. Paul forwarded discharge data as foon as they were available to the Weather Bureau and the Corps of Engineers. These data were very useful in forecasting flood stages.
In addition to data obtained at gaging stations, flood information was obtained at many other sites. At the request of the Corps of En gineers district office in St. Paul, the U.S. Geological Survey made discharge measurements at lock and dams 3, 4, 5, and 7 at the peak and during the recession. Measurements made at gaging stations at Prescott, Wis., and Winona, Minn., provided discharges for dams 2 and 5A, respectively. Discharges at dams 3 and 7 were measured from highway bridges in Red Wing, Minn., and La Crosse, Wis., respec tively. Discharges at dams 4 and 5 were obtained by working over the upstream side of the dam in a basket suspended from a crane located on the dam. The discharge at Lansing, Iowa, was measured from the highway bridge and from a 'boat and the inflow of the, Wisconsin River measured from the highway bridge near its mouth was added to it.
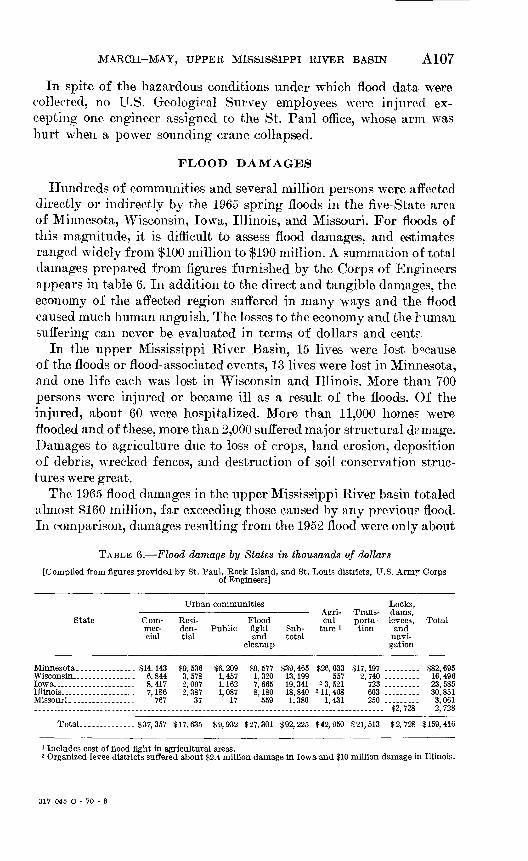
MARCH-MAY, UPPER MISSISSIPPI RIVER BASIN A107
In spite of the hazardous conditions under which flood data were collected, no U.S. Geological Survey employees were injured ex cepting one engineer assigned to the St. Paul office, whose arm was hurt when a power sounding crane collapsed.
FLOOD DAMAGES
Hundreds of communities and several million persons were affected directly or indirectly by the 1965 spring floods in the five-State area of Minnesota, Wisconsin, Iowa, Illinois, and Missouri. For floods of this magnitude, it is difficult to assess flood damages, and estimates ranged widely from $100 million to $190 million. A summation of total damages prepared from figures furnished by the Corps of Engineers appears in table 6. In addition to the direct and tangible damages, the economy of the affected region suffered in many ways and the flood caused much human anguish. The losses to the economy and the Hunan suffering can never be evaluated in terms of dollars and cent?,
In the upper Mississippi River Basin, 15 lives were lost because of the floods or flood-associated events, 13 lives were lost in Minnesota, and one life each was lost in Wisconsin and Illinois. More than 700 persons were injured or became ill as a result of the floods. Of the injured, about 60 were hospitalized. More than 11,000 homes were flooded and of these, more than 2,000 suffered major structural drmage. Damages to agriculture due to loss of crops, land erosion, deposition of debris, wrecked fences, and destruction of soil conservation struc tures were great.
The 1965 flood damages in the upper Mississippi River basin totaled almost $160 million, far exceeding those caused by any previous1 flood. In comparison, damages resulting from the 1952 flood were only about
TABLE 6. Flood damage by States in thousands of dollars
[Compiled from figures provided by St. Paul, Rock Island, and St. Louis districts, U.S. Army Corpsof Engineers]
Urban communities
State
Illinois.... ____ ...
Com mer cial
_-_.. 6,844--_._ 8,417----- 7,186
Resi den tial
$9, 536 3,578 2,097 2,387
37
Public
$6, 209 1,457 1,162 1,087
17
Flood fight and
cleanup
$9, 577 1,320 7,665 8,180
559
Sub total
$39, 465 13, 199 19, 341 18, 840 1,380
Agri cul
ture !
$26, 033 557
2 3, 521 2 11, 408
1,431
Trans porta tion
$17, 197 2,740
723 603 250
Locks, dams, levees,
and navi gation
$2,728
Total
$82, 695 16, 496 23, 585 30, 851 3,061 2,728
Total..-...__.._... $37,357 $17,635 $9,932 $27,301 $92,225 $42,950 $21,513 $2,728 $159,416
1 Includes cost of flood fight in agricultural areas.2 Organized levee districts suffered about $2.4 million damage in Iowa and $10 million damage in Illinois.
317-045 O - 70 - 8
A108 FLOODS OF 1965 IN THE UNITED STATES
$20 million. It is interesting to conjecture as to the reasons for the eight-fold increase in flood damages. One of the reasons for this great increase in damage is that the magnitude of the 1965 flood was greater than any other previously known. Also property values have increased over the years, and the cost of materials and labor for flood-fighting has also increased. Perhaps the greatest consideration is the increased occu pancy of flood plains. The tremendous property damage that results from major floods points out the need for flood-plain zoning.
A special congressional subcommittee headed by Congressman John Blatnik of Minnesota was appointed by the chairman of the House Committee on Public Works to visit the flood-devastated areas, the committee inspected the damages and met with Federal, State, and local officials. The information obtained was provided to the Commit tee on Public Works so that this committee could consider legislative matters pertaining to flood control and water resources development (89th Cong., 1st sess., House Committee Print No. 13). The subcom mittee made early estimates of flood damages including the cost of
«/ o ~
flood fighting.Extensive flood damages occurred in many communities. Twenty-
three urban and industrial areas suffered damages in excess of $1 mil lion each (table 7). More detailed information concerning flood losses in the individual basins is presented in the discussion pertaining to the basin.
The losses arising from the 1965 floods would have been much greater had not many communities, industries, and individuals undertaken emergency flood-protection measures which curtailed flood damages by many millions of dollars. The flood-fighting effort in itself was costly. In the urban areas flood-fighting costs amounted to over $27 million, about equal to 30 percent of total urban damages. According to Corps of Engineers estimates, additional losses of almost $300 mil lion would have occurred if emergency flood-fighting measures had riot been undertaken.
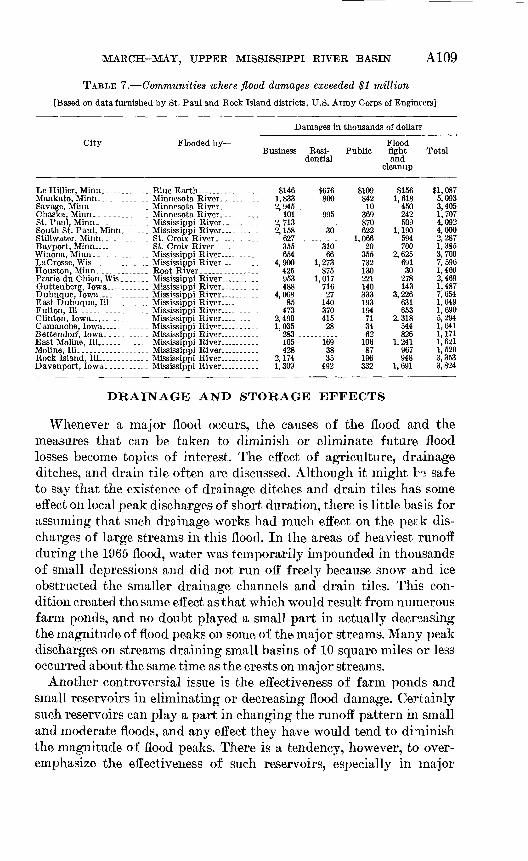
MARCH-MAY, TIPPER MISSISSIPPI RIVER BASEST A109
TABLE 7. Communities where flood damages exceeded $1 million
[Based on data furnished by St. Paul and Rock Island districts, U.S. Army Corps of Engineers]
City
Damages in thousands of dollars'
Flooded by FloodBusiness Resi- Public fight Total
dential and cleanup
Le Hillier, Minn. --------Mankato, Minn. .........Savage, Minn._ ..........C haska, Minn ......St. Paul, Minn.... __ .South St. Paul, Minn____Stillwater, Minn. ........Bayport. Minn _ ._Winona, Minn ...........LaCrosse, Wis. _---._ ..Houston, Minn. ___..-_._Prarie du Chien, Wis____Guttenberg, Iowa----_-__ Dubuque, Iowa __ ______East Dubuque, 111. ......Fulton, 111-.....-......--Clinton, Iowa ...-.....-C amanche , Iowa _ _Bettendorf, Iowa. --_.__-East Moline, 111,-..-- .Moline, 111. .............. Rock Island, 111 .......D avenport. Iowa --------
_-. BlueEarth ...... .---_.- Minnesota River..- ....-._ Minnesota River. ......-_. Minnesota River. ......_._ Mississippi River.----.... Mississippi River _ ...__. St. Croix River---... ..._ St. Croix River.. -....-__- Mississippi River _ ..._- Mississippi River _ ..._-. Root River.... ........-._ Mississippi River __ _.... Mississippi River -... ..- Mississippi River __ ..... Mississippi River.... ...... Mississippi River _ _._- Mississippi River.. _ ..... Mississippi River ...... Mississippi River _ ....... Mississippi River ...-.. Mississippi River _ ... ... Mississippi River.. _ .... Mississippi River ...
$1461,8332,945 ..
1012,713 ..2,158
627 -355654
4,900425953488
4,06885
4732,4901,035
283 _.105428
2,1741,309
$676800
995
30
31066
1,273875
1,017716 27
140370415
28
16938 35
492
$109842
10369870622
1,06620
355732130221140 333193194
713462
10687
196332
$1561,618
450242509
1,190594700
2,62569130
278143
3,226631653
2,318544826
1,241967 948
1,691
$1, 0875,0933,4051,7074,0924,0002,2871,3853,7007,5961,4602,4691,487 7,6541,0491,6905,2941,6411,1711,6211,520 3,3533,824
DRAINAGE AND STORAGE EFFECTS
Whenever a major flood occurs, the causes of the flood and the measures that can be taken to diminish or eliminate future flood losses become topics of interest. The effect of agriculture, drainage ditches, and drain tile often are discussed. Although it might H safe to say that the existence of drainage ditches and drain tiles has some effect on local peak discharges of short duration, there is little basis for assuming that such drainage works had much effect on the per.k dis charges of large streams in this flood. In the areas of heaviest runoff during the 1965 flood, water was temporarily impounded in thousands of small depressions and did not run off freely because snow and ice obstructed the smaller drainage channels and drain tiles. This con dition created the same effect as that which would result from numerous farm ponds, and no doubt played a small part in actually decreasing the magnitude of flood peaks on some of the major streams. Many peak discharges on streams draining small basins of 10 square miles or less occurred about the same time as the crests on major streams.
Another controversial issue is the effectiveness of farm ponds and small reservoirs in eliminating or decreasing flood damage. Certainly such reservoirs can play a part in changing the runoff pattern in small and moderate floods, and any effect they have would tend to diminish the magnitude of flood peaks. There is a tendency, however, to over emphasize the effectiveness of such reservoirs, especially in major
A110 FLOODS OF 1965 IN THE UNITED STATES
floods. For example, consider a hypothetical effort to sto^e the flood- flows of the Minnesota River and its tributaries between Montevideo and Mankato, Minn. The area drained in this part of Minnesota, 8,720 square miles, is almost entirely agricultural land of good quality and is worth about $300 to $400 per acre. Flood stage at Mankato is 19.0 feet and the corresponding discharge is about 30,000 cfs. Flood stage on the Minnesota River at Mankato was exceeded for 17 days in April. During this time 1,108,000 acre-feet in excess of the discharge which occurs at flood stage passed the Mankato gage. During the smie period, 265,000 acre-feet ran off at Montevideo. Therefore, the area between Montevideo and Mankato contributed 843,000 acre-feet in excess of the discharge at Mankato flood stage. If this runoff excess were stored in the basin between Montevideo and Mankato, 97-acre-feet would have to be stored for each square mile of drainage area.
Most conservation reservoirs or farm ponds cover an acre or two in area and probably would not exceeed a usable capacity of 6 acre-feet on the average. Their cost of construction is from about $2,000 to $3,000 each. It follows, then, that to contain the discharge in excess of flood stage which occurred at Mankato, about 140,000 farm jionds would have to be constructed at a cost of about $350 million. In addition, about 200,000 acres of land worth about $70 million would be removed from agricultural use. Perhaps the total storage volume in the preceding computation could be reduced somewhat because storing wrier in head waters basins would have the effect of flattening out the crest of the unstored water which found its way into the Minnesota River. Never theless, providing the farm-pond storage capacity which would have maintained the flow below flood stages at Mankato would have been a formidable undertaking and would have been economically infeasible. It is a fallacy to contend that farm ponds can prevent floods of great magnitude. Knowledgeable proponents of farm-pond construction make no such claim. They do claim, with justification, that farm ponds are an important conservation measure. Proper upstream land manage ment is very effective in minimizing the damages which occur in the many floods of low recurrence intervals.
Large storage reservoirs played an important part in minimizing flood damages. In the Wisconsin River basin, Pentenwell and Castle
MARCH-MAY, UPPER MISSISSIPPI RIVER BASIN Alll
Rock Reservoirs stored about 174,000 acre-feet during the 5 days of maximum flow and materially reduced the discharge of the Wisconsin River below the reservoirs. The peak discharge at Wisconsin Dells was 50,200 cfs, a 4-year flood; it would have been over 70,000 cfs a 15- year flood, without the storage in Pentenwell and Castle Rock Reser voirs. It is apparent that these reservoirs performed an important flood- control function although they were designed primarily for power production.
A further example of the effect of large reservoirs on the magnitude of flooding is illustrated by the Coralville Reservoir on the Iowa River 9 miles upstream from Iowa City. This reservoir is designed to store floodflows temporarily during high-water periods. Its capacity fo^ flood storage is 458,000 acre-feet, equivalent to 2% inches of runof. The reservoir is operated to minimize flood damages along the Iowa River and the Mississippi River below the mouth of the Iowa River.
During the period April 1-15, the reservoir stored about 300,00 acre- feet. Maximum discharge above the reservoir at Marengo, Iowa, was 19,900 cfs; below the reservoir at Iowa City it was 9,4CO cfs. Reservoir release was maintained at about 10,000 cfs to draw down the reservoir to provide more storage for possible future floods. On April 23, storage was resumed, and during the period April 23 to May 5, an additional 123,000 acre-feet was stored. During this period, the peak discharge of the Iowa River upstream from the reservoir was 7,770 cfs, not nearly so high as early in April; so it was possible to reduce the release from the reservoir to about 150 cfs. The operation of this reservoir during these two periods reduced the flood crest by 0.4 foot on the Mississippi River downstream from the mouth of the Iowa River.
Two reservoirs (Red Rock and Saylorville) are under construction on the Des Moines River. The effect on the Mississippi River stage by the Coralville Reservoir operation during the 1965 flood period, and the predicted future effect that Coralville, Red Rock, and Saylorville Reservoirs would have on the same flood conditions are shown in table 8.
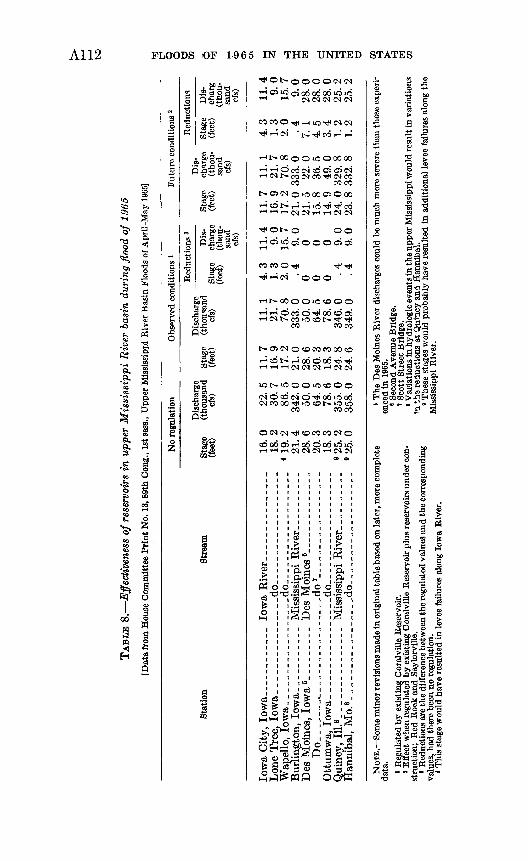
to
TA
BL
E 8
. E
ffec
tive
ness
of
rese
rvoi
rs i
n u
pper
Mis
siss
ippi
Riv
er b
asin
dur
ing
floo
d of
1965
[Dat
a fr
om H
ouse
Com
mitt
ee P
rint
No.
13,
89th
Con
g., 1
st se
ss.,
Upp
er M
issi
ssip
pi R
iver
Bas
in F
lood
s of
Apr
il-M
ay 1
965]
No
regu
latio
n O
bser
ved
cond
ition
s *
Stat
ion
Iow
a C
ity,
Iow
a __ _
____
___
Wap
ello
, Io
wa_
____
____
____
Bur
lingt
on,
Iow
a___
___
____
Des
Moi
nes,
Iow
a 5_
___
___
_D
o___
_ _ _
__-_
____
__O
ttum
wa,
Iow
a_ _
____
____
__
Han
niba
l, M
o.8
____
____
_ _
Stre
am
____
_do_
____
.___
____
____
____
_do_
_ _
__
__
_ _ ___
Mis
siss
ippi
Riv
er __
__
____
Des
Moi
nes
6 __ _
____
_ _.
____
_do
7___
___ _ _
___
_.__
_-.d
o-__
___-
-_._
-_-_
_-M
issi
ssip
pi R
iver
_ _
____
____
do__
__ _
___
_ __
_.
Stag
e (fe
et)
16.
18.
._
« 19
.._
21
.._
28
.._
20
.._
18
.._
9
25.
._
"25.
0 2 2 4 6 3 3 2 0
NO
TE
. Som
e m
inor
revi
sion
s mad
e in
orig
inal
tabl
e ba
sed
on la
ter,
mor
e co
mpl
ete
data
.i
Reg
ulat
ed b
y ex
istin
g C
oral
ville
Res
ervo
ir.
" Ef
fect
whe
n re
gula
ted
by e
xist
ing
Cor
alvi
lle R
eser
voir
plus
rese
rvoi
rs u
nder
con
st
ruct
ion;
Red
Roc
k an
d Sa
ylor
ville
. 3
Red
uctio
ns a
re th
e di
ffer
ence
bet
wee
n th
e re
gula
ted
valu
es a
nd th
e co
rres
pond
ing
valu
es, h
ad th
ere
been
no
regu
latio
n.
* Thi
s st
age
wou
ld h
ave
resu
lted
in le
vee
failu
res
alon
g Io
wa
Riv
er.
Dis
char
ge
Dis
char
ge
(tho
usan
d St
age
(tho
usan
d cf
s)
(fee
t) cf
s)
22.
5 11
. 7
11.
1 30
. 7
16.
9 21
. 7
86.
5 17
. 2
70.
8 34
2. 0
21
. 0
333.
0
50.
0 28
. 6
50.
0 64
. 5
20.
3 64
. 5
78.
6 18
. 3
78.
6 35
5. 0
24
. 8
346.
0
358.
0
24.
6 34
9. 0
Red
uctio
ns *
Stag
e (fe
et)
4.3
1.3
2.
0
.4
0 0 0 . 4
. 4
Dis
ch
arge
(t
hou
sa
nd
cfs)
11
.4
9.0
1
5.7
9.
0
0 0 0 9.0
9.
0
Stag
e (f
eet)
11.7
16
. 9
17.
2 21.0
21
. 5
15.
8 14
. 9
24.
0 23
. 8
Fut
ure
cond
ition
s 2
Dis
ch
arge
(t
hou
sa
nd
cfs)
11.
1 21.7
70
. 8
333.0
22
. 0
36.5
49.0
329.8
33
2. 8
Red
uctio
ns
Stag
e (f
eet)
4.3
1.3
2.
0 . 4
7. 1
4.
5
3.4
1.
2
1. 2
Dis
- ch
arg
(tho
u
sand
cf
s) 11.4
9.
0
15.7
9
.0
28.0
28.0
28.0
25
. 2
25.
2
' The
Des
Moi
nes
Riv
er d
isch
arge
s co
uld
be m
uch
mor
e se
vere
than
thos
e ex
peri
en
ced
in 1
965.
« Sec
ond
Ave
nue
Bri
dge.
' S
cott
Stre
et B
ridg
e.
8 Var
iatio
ns in
hyd
rolo
gic
even
ts in
the
uppe
r M
issi
ssip
pi w
ould
resu
lt in
var
iatio
ns
iu th
a re
duct
ions
at Q
uinc
y an
d H
anni
bal.
' The
se s
tage
s w
ould
pro
babl
y ha
ve r
esul
ted
in a
dditi
onal
leve
e fa
ilure
s al
ong
the
Mis
siss
ippi
Riv
er.
FLOODS
OF
1965
IN
THE
UNITED
STATES
MARCH-MAY, UPPER MISSISSIPPI RIVER BASIN A113
EFFECT OF TIMING OF TRIBUTARY FLOW ON MAINSTEM PEAKS
Under slightly different meteorological conditions some of the flood crests could have been considerably higher, a disconcerting thought.
Since March 1951 there have been 5 years in which the annual maxi mum discharges resulted from snow-melt floods in both the Mississippi River and the Minnesota River above their confluence at the southwest edge of St. Paul. During these five periods of runoff, which include the three highest floods of record at most gaging stations in the upper Mississippi River basin, the crest on the Minnesota River arrived at the confluence before the crest on the Mississippi River on three occa sions and after the crest on two occasions. In April 1965, the Missis sippi River above the Minnesota River crested 6 days after the Min nesota River at its mouth. Meteorological conditions could be such that crests would occur simultaneously in the Minnesota and Missis sippi Rivers above St. Paul. If this had occurred in 1965, pea-k dis charge of the Mississippi River at St. Paul would have been more than 200,000 cfs and the stage would have been 2 or 3 feet higher (fig. 49). Other examples could be cited where slightly different meteoro logical conditions would have caused much greater flood stages and discharges.
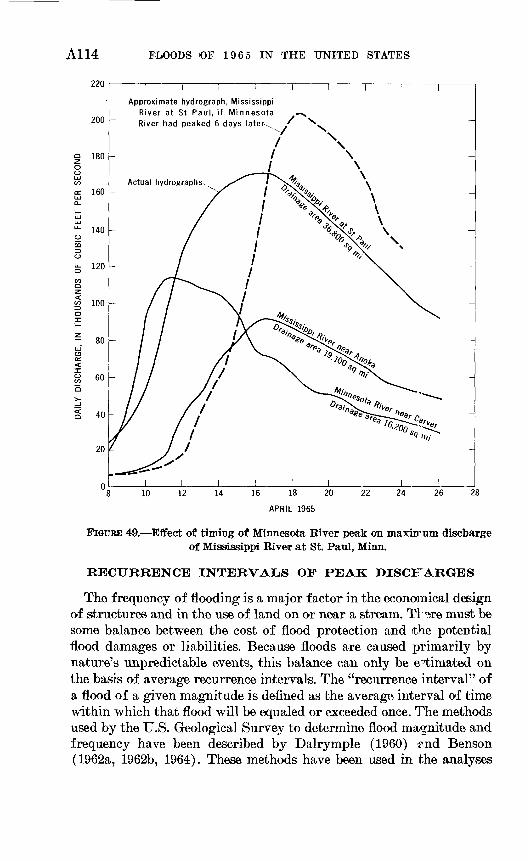
A114 FLOODS OF 1965 IN THE UNITED STATES
220
200
180
160
140
120
100
- 80
60
40
20
I I I I
Approximate hydrograph, Mississippi River at St Paul, if Minnesota River had peaked 6 days later
Actual hydrographs
10 12 14 16 18
APRIL 1965
20 22 24 26 28
FIGTTEE 49. Effect of timing of Minnesota River peak on maxhrnm discharge of Mississippi Bivear at St. Paul, Minn.
RECURRENCE INTERVALS OF PEAK DISCHARGES
The frequency of flooding is a major factor in the economical design of structures and in the use of land on or near a stream. TJ °;re must be some balance between the cost of flood protection and the potential flood damages or liabilities. Because floods are caused primarily by nature's unpredictable events, this balance can only be estimated on the basis of average recurrence intervals. The "recurrence interval" of a flood of a given magnitude is defined as the average interval of time within which that flood will be equaled or exceeded once. The methods used by the U.S. Geological Survey to determine flood magnitude and frequency have been described by Dalrymple (1960) p.nd Benson (1962a, 1962b, 1964). These methods have been used in the analyses
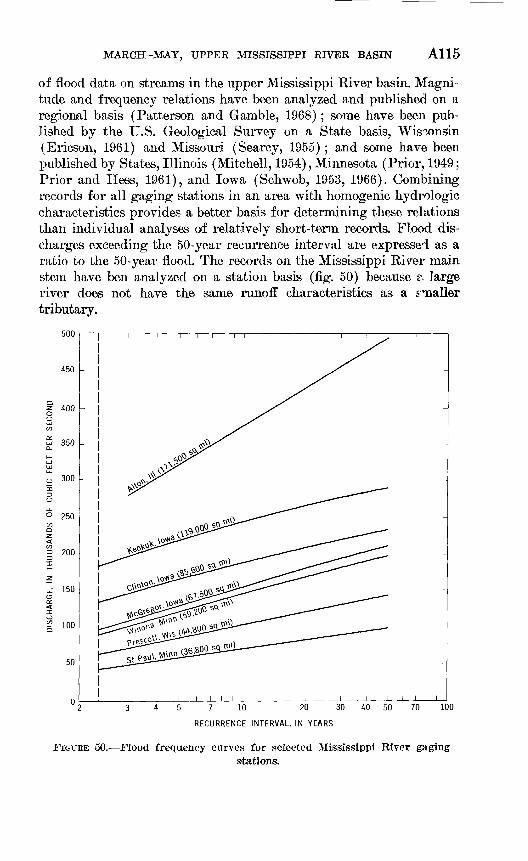
MARCH-MAY, UPPER MISSISSIPPI RIVER BASIN A115
of flood data on streams in the upper Mississippi Kiver basin. Magni tude and frequency relations have been analyzed and published on a regional basis (Patterson and Gamble, 1968); some have been pub lished by the U.S. Geological Survey on a State basis, Wis°.onsin (Ericsoii, 1961) and Missouri (Searcy, 1955); and some have been published by States, Illinois (Mitchell, 1954), Minnesota (Prior, 1949; Prior and Hess, 1961), and Iowa (Schwob, 1953, 1966). Combining records for all gaging stations in an area with homogenic hydrologic characteristics provides a better basis for determining these relations than individual analyses of relatively short-term records. Flood dis charges exceeding the 50-year recurrence interval are expressed as a ratio to the 50-year flood. The records on the Mississippi River main stem have ben analyzed on a station basis (fig. 50) because r. large river does not have the same runoff characteristics as a smaller tributary.
500
7 10 20 30 40 50 70
RECURRENCE INTERVAL, IN YEARS
100
FIGURE 50. Flood frequency curves for selected Mississippi River gagingstations.
All6 FLOODS OF 1965 IN THE UNITED STATES
The recurrence intervals for the floods during the period March to May 1965 on streams throughout the upper Mississippi River basin varied considerably. The Mississippi River main stem and its tribu taries, originating mostly in Minnesota and northwester! Wisconsin, had the greatest recurrence intervals. On the main stem, these values increased from 4 years downstream from the Sandy River near Libby, Minn., to 1.68 times the 50-year flood at St. Paul, Minn., then dimin ished slowly to 11 years at Alton, 111., and to only 2 years at St. Louis, Mo., below the mouth of the Missouri River. This pattern of flood- frequency values indicates or substantiates the flood-producing areas. The upstream tributaries, almost all having floods of 1-2 times the 50-year recurrence interval, added their flows to the main-stem flood. Fortunately, peaks from these tributaries did not occur simultaneously with the main-stem peak, but those entering the main stem, upstream from the Root River, which flows into the Mississippi River in south eastern Minnesota, were close enough to contribute an abnormal share to the Mississippi River flow. On tributaries downstream from the Root River, the recurrence intervals of flood peaks were either less than those for upstream tributaries or the timing of the peaks was such that they did not contribute significantly to the main-stem flood. The upper parts of the Cedar and Des Moines River basins experienced floods having recurrence intervals of 5 years to 1.23 times the 50-year flood, but they attenuated considerably before they entered the Mis sissippi River ahead of the main-stem peak. The other tributaries generally had minor floods to 1-10 year recurrence intervals.
DETERMINATION OF FLOOD DISCHARGES
The flood data in this report were obtained principally at stream- gaging stations which are operated to provide stage and discharge data at the gaging site. A stage-discharge relation is developed by measuring discharge at the site at various stages throughout the range of recorded stages. A rating curve is then drawn by plotting discharge against stage, and the curve is translated into a table so tl at the dis charge can be determined easily from the recorded or observed stages collected at the gaging site.
Discharges are usually measured by current meter, but during floods they may be determined indirectly by running surveys to high water marks and applying slope-area methods or by computing flow over dams or through contracted openings. These indirect methods are considerably more expensive and time-consuming than current-meter measurements, but they are often necessary because of the difficulties of obtaining current-meter measurements at all sites during flood
MARCH-MAY, UPPER MISSISSIPPI RIVER BASIN All?
periods. Such difficulties are created by impassable roads to gagir g sta tions, running ice floes and debris which make it impossible to make soundings and velocity observations, destruction of bridges and cable- ways from which discharge measurements are made, and rapid crest ing of streams (many crest about the same time) so that there is insufficient time and manpower to obtain current-meter measurements near the crest. Most discharge measurements at gaging-station sites during the 1965 spring flood were made by current meter. Some indi rect measurements were obtained, particularly at miscellaneous sites and at crest-stage partial-record stations, where only flood-peak infor mation is obtained.
If a rating curve is fairly well defined throughout most of its range by discharge measurements, either direct or indirect, short extensions may be permissable. Such extensions are usually based on logarithmic plotting or velocity-area studies. At most gaging sites on alluvial streams, the stage-discharge relationship frequently changes as a result of varying control features or shifting control in the channel below the gage; consequently, it is necessary to make discharge measure ments at gaging sites at fairly regular intervals even though the stage- discharge relationship is apparently well defined throughout the range in stage.
STREAMFLOW DATA AT GAGING STATIONS
One of the purposes of this report is to present detailed hydrologic information for streams in the upper Mississippi River basin during the period March-May 1965. Streams on the fringes of the flooded area are included so that the flood can be well defined on an areal basis. Detailed discharge data are presented so that flood hydrographs can be accurately reproduced and the data used in flood-control and watershed development studies. Some streams, particularly those in Minnesota and parts of Wisconsin, had only normal, low-flow dis charges during March and for these no March discharge data are provided in this report.
The operation of a stream-gaging station requires a stage record, discharge measurements at various stages, and other information pertinent to the computation of the discharge record such as ir forma tion on channel changes or ice formation. The stage record may be obtained from an automatic water-stage recorder which provides a continuous graphic record, from a digital recorder which punches stage on a paper tape usually at 15-minute intervals, or by reading a nonrecording gage. At many gaging sites which are included in this
All8 FLOODS OF 1965 IN THE UNITED STATES
report, the automatic gages were inundated and it was necessary to manually record the flood stages at these sites from nonautomatic temporary gages.
Included in this report are data collected at crest-stage stations which are generally on streams having small drainage areas. The primary function of these stations is to provide data pertaining to peak stages and discharges, and consequently a continuous record of discharge throughout the flood period is not available at these site~.
STATION DESCRIPTIONS AND DISCHARGE TABLES
The description of the gaging station gives information concerning location, datum and type of gage, area of the drainage basin, details of gage-height and discharge records, and miscellaneous remarks. The paragraph on discharge records briefly explains the methods used to define the stage-discharge relation over the range in stage that oc curred during the flood period, use of auxiliary gages or other methods used to obtain discharge, and conditions that may have affected the stage-discharge relation.
The maximum stage and discharge are given for most stations for the flood period March-May 1965, for the previous period of gaging station record, and for any known maximum floods that occurred out side the period of record. Kemarks on cooperation, regulation, and other pertinent information are included where applicable.
The table of daily mean discharge gives data for the period March- May 1965, a sufficient length of time in most cases, to show discharges during antecedent and recession periods. The table also shows the monthly mean discharge, in cubic feet per second, and the runoff, in inches, from the drainage basin.
The table of stages and discharges at indicated times defines the stage and discharge during significant flood flows during the report period so that accurate hydrographs can be drawn.
The stages of most stations were obtained from records c f digital or continuous water-stage recorders. For a station with an incomplete record, the gage height for an indicated time may be selected from a graph which has been constructed from supplemental gage readings, high-water marks, and other pertinent information. Description of the methods used in defining the stage are given in the section of the description concerning gage-height record.
The stations are numbered and arranged in downstream order from headwater to mouth, with stations on tributaries inserted in corresponding order following the order in which the tributaries enter the main stream. The reference number in parentheses preceding the name of the gaging station is the same as that used in figure 2 and will aid in identifying the site.
MARCH-MAY, UPPER MISSISSIPPI RIVER BASIN A119
SUMMARY OF F1LOOD STAGES AND DISCHARGES
Maximum stages and discharges at stream-gaging stations, crest- stage stations, and miscellaneous sites are summarized in table 9. Most of the column headings are self explanatory. The numbers in th e first column correspond to those designating the site in figure 2. Except for a few miscellaneous stations, all stations in the report have permanent station numbers (column 2) as used in the annual streamflow reports of the Geological Survey. Drainage-area determinations are not avail able for a number of streams.
The first column under maximum previously known floods shows the period prior to March 1965 for which information is available concerning the magnitude of previous floods. The length of this period may exceed that in which continuous records of discharge we^e ob tained. More than one period is shown for some stations differentiating between the period of known maximum stages or discharges and the period of known maximum stages and discharges. At stations where the maximum discharge of the period did not occur simultar eously with the maximum stage, the maxima are given on separate lines and a dash inserted in the respective gage-height or discharge column.
The last column shows the average interval of time in which the peak discharge of the 1965 flood can be expected to be equaled or ex ceeded once. Whenever the interval exceeds 50 years, the ratio of the peak discharge to the discharge of the 50-year flood for that station is shown.
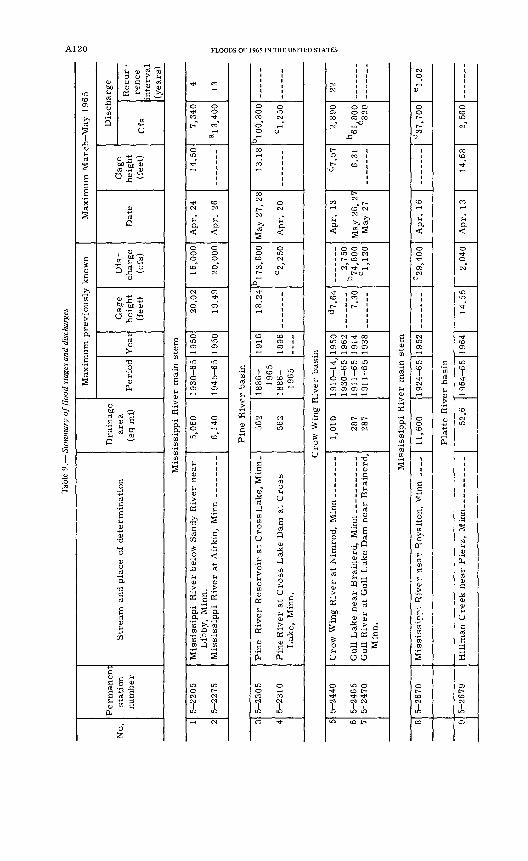
Tab
le 9
. Su
mm
ary
off
load s
tage
s an
d di
scha
rges
No.
Per
man
ent
stat
ion
nu
mb
erS
tream
and p
lace
of
det
erm
inat
ion
Dra
inag
e are
a
(sq m
i)
Max
imu
m p
revio
usl
y k
now
n
Peri
od
Yea
rG
age
hei
ght
(fee
t)
Dis
ch
arge
(cfs
)
Max
imu
m M
arc
h M
ay 1
965
Dat
eG
age
hei
ght
(fee
t)
Dis
char
ge
Cfs
Recu
r
rence
inte
rval
(yea
rs)
Mis
siss
ipp
i R
iver
mai
n s
tem
1 2
5-2
205
5-2
275
Mis
siss
ippi
Riv
er b
elow
San
dy R
iver
near
Lib
by,
Min
n.5,
060
6,14
0
19
30
-65
19
45
-65
1950
1950
20.0
2
19.4
9
16,0
00
20,0
00
Ap
r. 2
414
.50
7,3
40
al 3
,400
4 13
Pin
e R
iver
bas
in
3 4
5-2
30
5
5-23
10L
ake,
M
inn.
562
562
1886-
1965
1
88
6-
1965
1916
1896
18.2
4b
!73
,60
0
C2,
250
May
27,
28
13.1
8b
!00
,80
0
cl,
250
Cro
w W
ing
Riv
er b
asin
5 6 7
5-24
40
5-24
655-
2470
Min
n.
1,01
0
287
287
1910-1
4,
1930-6
51911-6
51911-6
5
1950
1962
1914
1938
d7.6
4
7 30
27
^n74
,800
Cl,
120
Ap
r.
13
May
27
d7.5
7
6.31
2,8
90
b61
80
0C
820
22
Mis
siss
ippi
Riv
er m
ain s
tem
8 9
5-26
70
5-26
79
Mis
siss
ipp
i R
iver
near
Royal
ton
, M
inn
_ _
_ 11
,600
19
24
-65
1952
C2
9,4
00
Ap
r.
16---
--°3
7,7
00
e1
.02
Pla
tte R
iver
bas
in
52.6
19
64
-65
1964
14.5
52,
040
Apr.
13
14
.68
2,5
60
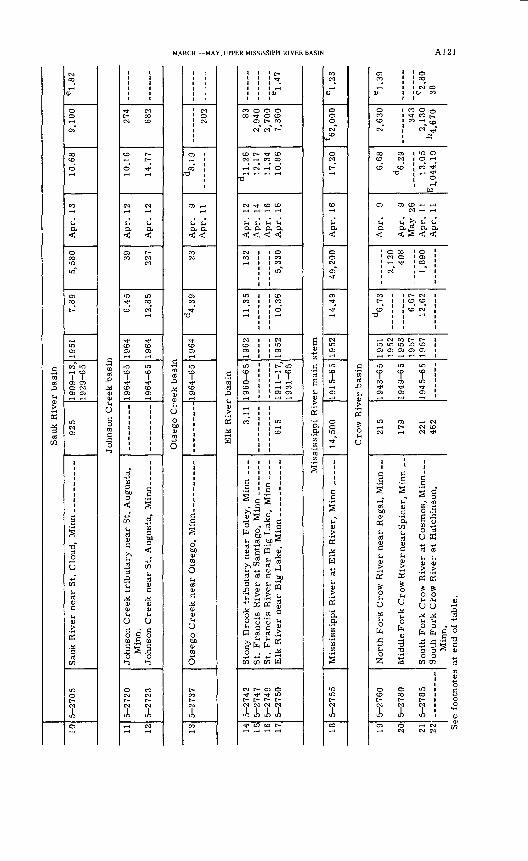
10
Sau
k R
iver
bas
in
5-2
70
592
51909-1
3,
19
29
-65
1951
7.89
5,58
0A
pr.
13
10.6
89,1
00
e1.
82
Johnso
n C
reek
bas
in
11
12
5-27
20
5-27
23
Johnso
n C
reek
tri
bu
tary
nea
r S
t. A
ugust
a,
Min
n.
19
64
-65
1964-6
5
1964
1964
6.4
5
12.8
5
39
227
Ap
r.
12
Apr.
12
10.1
6
14.7
7
274
682
Ots
ego
Cre
ek b
asin
135-
2737
1964-6
519
64d4
.39
23A
pr.
9
Ap
r.
11d
8.19
202
Elk
Riv
er b
asin
14 15 16 17
5 2
742
5 2
74
7t_
97
4Q
5-2
75
0
31
1
615
19
60
-65
1911-1
7,
1931-6
5
1962
1952
11
35
10.3
6
1 Q
O
5,33
0A
pr.
16
Apr.
16
d!1
.26
12.1
711
.34
10.8
6
839
Q4O
2,70
07,
360
61.
47
Mis
siss
ipp
i R
iver
mai
n s
tem
185
-27
55
14,5
001915-6
519
5214
.49
49,2
00A
pr.
16
17.2
0f6
2,00
0e
1.23
Cro
w R
iver
bas
in
19
20 21
22 S«
5-27
60
5-2
78
0
5-2
78
5
;e f
oo
tnote
s
No
rth
Fork
Cro
w R
iver
nea
r R
egal
, M
inn
__
Mid
dle
Fork
Cro
w R
iver
nea
r S
pic
er,
Min
n _
_
South
Fork
Cro
w R
iver
at
Cosm
os,
Min
n___
S
outh
Fork
Cro
w R
iver
at
Hutc
hin
son,
Min
n.
at e
nd o
f ta
ble
.
215
179
221
462
19
43
-65
1949-6
5
1945-6
5
1951
19
52
1953
19
57
1957
d6.
73
6.67
12
.62
2,12
0 40
8
1,89
0
Ap
r.
9
Ap
r.
9 M
ay
26
Apr.
11
A
pr.
11
6.68
d6.2
9
13.0
5
gl,
044.1
0
2,63
0
343
2,13
0 h
4,6
70
e1.
39
62.
80
38
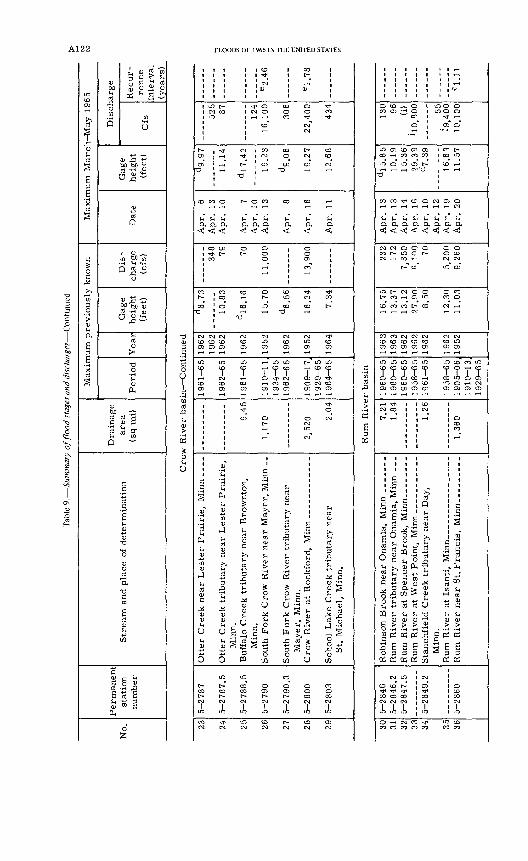
Tab
le 9
. Su
mm
ary
of f
lood s
tage
s an
d di
scha
rges
Co
nti
nu
ed
No.
Per
man
ent
stat
ion
num
ber
Str
eam
an
d p
lace
of
det
erm
inat
ion
Dra
inag
e are
a
(sq m
i)
Max
imu
m p
revio
usl
y k
now
n
Peri
od
Yea
rG
age
hei
ght
(fee
t)
Dis
ch
arg
e (c
fs)
Max
imu
m M
arch
-May
196
5
Dat
eG
age
hei
ght
(fee
t)
Dis
char
ge
Cfs
Rec
ur
re
nce
in
terv
al
(yea
rs)
Cro
w R
iver
basi
n C
onti
nued
23 24 25 26 27 28 29
5-27
87
5-2
787
.5
5-2
788
.5
5-27
90
5-2
790.3
5-28
00
5-28
03
Min
n.
Sou
th F
ork
Cro
w R
iver
near
May
er,
Min
n __
May
er,
Min
n.
St.
Mic
hae
l,
Min
n.
9 A
p:
1,17
0
2 52
0 2 04
19
61
-65
1962-6
5
1961-6
5
1910
-11,
1934-6
5
1 Q
AQ
1
7
19
29
-65
1964-6
5
1962
1962
1962
1962
1952
1 Q
fi 9
1 95
2
1964
d8.7
3
10.8
3
d!6
.16
15.7
0
d6.
56
16.2
4
7 34
348 79 70
11,0
00
1 3
900
Apr.
13
Apr.
10
Apr.
13
A m
- 11
d9.
97
11.1
4
d!7
42
19.2
3
d9.
06
1927
12.6
8
525 87 1 24
16,1
00
306
22 4
00
A3
A
e2.
46
el.
V8
Rum
Riv
er b
asin
30 31 32 33 34 35 36
5-28
465
-28
46.2
5-2
847.5
5-2
849.2
5-28
60
Min
n.
Rum
Riv
er n
ear
St.
Fra
ncis
, M
inn _
____
__
7.21
1.84
1.26
1,36
0
19
60
-65
19
60
-65
1960-6
51958-6
51961-6
5
1958-6
51
90
5-0
6,
1910-1
3,
1929-6
5
1963
1963
1962
1962
1962
1962
1952
16.7
51
3 37
13.1
227
nn
8.50
1 9
*3fi
11.0
3
232
172
7,35
06,
mo 70
5,20
09,
260
Ap
r.
13
Apr.
12
Apr.
20
d!5
.85
10.1
915
.36
29.3
3d
7.3
9
16.6
311
.57
130 96 (i)
ho,
300
. 55
39,4
0010
,100
el.
ll
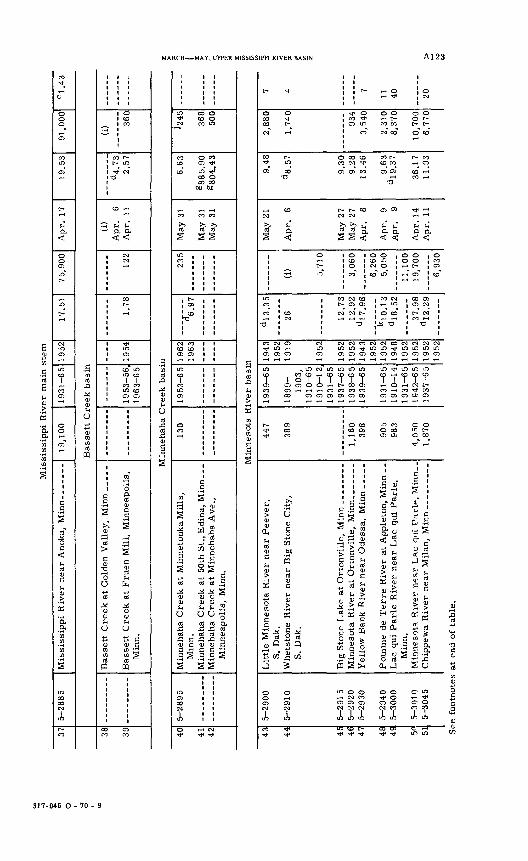
Mis
siss
ippi
Riv
er m
ain
ste
m
37 38
39
5-2
88
519
,100
19
31
-65
1952
17.5
175
,900
Apr.
17
19.5
391
,000
e1.
43
Bass
ett
Cre
ek b
asin
Bass
ett
Cre
ek a
t G
old
en V
alle
y,
Min
n __ -
Bass
ett
Cre
ek
at
Fru
en M
ill,
Min
nea
poli
s,
Min
n.
1953
-56,
19
63
-65
1954
1.78
122
(i)
Apr.
6
Ap
r.
11d
4.7
3
2.57
(i) 36
0
Min
neh
aha
Cre
ek b
asin
40 41 4?,
5-2
895
Min
nea
poli
s, M
inn.
130
1953-6
51
Qfi
O
1963
^6.9
7
HO
CM
ay 3
1
May
31
May
31
6.63
i>88
5 go
S804.4
3
^245
368
500
43
44 4E
46
47 48 49 50
51
Min
nes
ota
Riv
er b
asin
i£
5-2
90
0
5-2
91
0
5-2
91
5
5-29
20
5-2
93
0
5-29
40
5-3
00
0
5-30
10
5-3
04
5
Lit
tle
Min
nes
ota
Riv
er n
ear
Pee
ver
, S.
Dak
. W
het
stone
Riv
er n
ear
Big
Sto
ne
Cit
y,
S.
Dak
.
Yel
low
Ban
k R
iver
near
Odes
sa,
Min
n ..
...
Po
mm
e de
Terr
e R
iver
at
Ap
ple
ton,
Min
n _.
Lac
qui
Parl
e R
iver
near
Lac
qu
i P
arl
e,
Min
n.
Min
nes
ota
Riv
er n
ear
Lac
qni
Parl
p,
Mir
m__
447
389
1,16
0 39
8
905
983
4,ns
n 1,
870
1939-6
5
18
99
- 19
03,
19
10
-65
19
10-1
2,
19
31
-65
1937-6
5
19
38
-65
1939-6
5
19
31
-65
1910-1
4,
1931-6
5
19
42
-65
1937-6
5
1943
19
52
1919
1952
1952
19
52
1943
19
52
1952
19
48
1952
19
52
1952
19
52
d!3
.35
26 12
.73
12
.92
d!7
.98
k!0
.13
d!8
.52
37
.98
d
!2.2
9
(i) 5,71
0
3,06
0
6,26
0 5,
050
11,1
00
19,7
00
6,93
0
May
21
Apr.
6
May
27
May
27
Ap
r.
8
Apr.
9
Ap
r.
9
Aor.
14
Ap
r.
11
9.48
d8.5
7
9.3
0
9.28
13
.46
9.6
3
d!9
.37
36.1
7 11
.93
2,88
0
1,74
0
934
3,5
40
2,31
0 8,3
70
10,7
00
6,7
70
IPPI
RIVER
BASIN
t-
* 7
11
40 20
>
to CO
See
footn
ote
s at
end
of
tab
le.
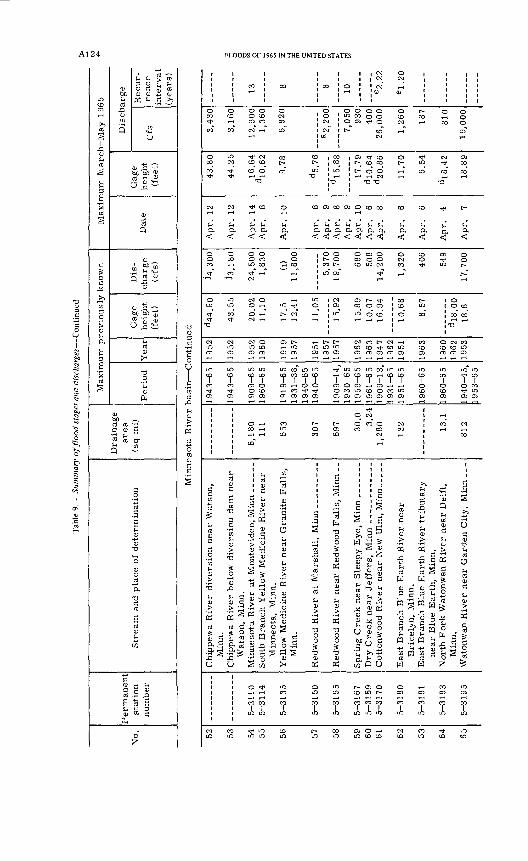
Tab
le 9
. Su
mm
ary
off
load s
tage
s an
d di
scha
rges
Con
tinue
d
No.
Per
man
ent
stat
ion
nu
mb
erS
trea
m a
nd p
lace
of
det
erm
inat
ion
Dra
inag
e are
a
(sq
mi)
Max
imum
pre
vio
usl
y k
now
n
Per
iod
Yea
rG
age
hei
gh
t (f
eet)
Dis
ch
arge
(cfs
)
Max
imu
m M
arc
h M
ay 1
965
Dat
eG
age
hei
gh
t (f
eet)
Dis
char
ge
Cfs
Rec
ur
re
nce
in
terv
al
(yea
rs)
Min
nes
ota
Riv
er b
asin
C
on
tin
ued
52
53 54
55 56 57
58 59
60
61 62
33
64
65
_
__
5-3
110
5-3
11
4
5-3
135
5-3
15
0
5-3
165
5-3
16
7
5-3
16
9
5-3
17
0
5-3
18
0
5-3
18
1
5-3
183
5-3
195
Chip
pew
a R
iver
div
ersi
on n
ear
Wat
son,
Min
n.
Chip
pew
a R
iver
bel
ow
div
ersi
on
dam
nea
r W
atso
n,
Min
n.
Min
nes
ota
Riv
er a
t M
on
tev
ideo
, M
inn
____
__
Sou
th B
ran
ch Y
ello
w M
edic
ine
Riv
er n
ear
Min
neo
ta,
Min
n.
Yel
low
Med
icin
e R
iver
nea
r G
ranit
e F
all
s,
Min
n.
Red
woo
d R
iver
near
Red
woo
d F
all
s, M
inn
__
Cot
tonw
ood
Riv
er n
ear
New
Ulm
, M
inn_
____
East
Bra
nch
Blu
e E
art
h R
iver
nea
r B
rice
lyn,
Min
n.
Eas
t B
ran
ch B
lue
Eart
h R
iver
tri
bu
tary
nea
r B
lue
Eart
h,
Min
n.
Nort
h F
ork
Wat
on
wan
Riv
er n
ear
Del
ft,
Min
n.
Wat
onw
an R
iver
near
Gar
den
Cit
y,
Min
n __
-
6,1
80
111
653
307
697 30
.0
3.2
4
1,2
80
132 13
.1
81
2
1943-6
5
19
43
-65
1909-6
5
19
60
-65
1919-6
5
1931-3
8,
1940-6
5
1940-6
5
1909-1
4,
1930-6
5
1959-6
5
19
61
-65
1909-1
3,
1931-6
5
19
51
-65
1960-6
5
1960-6
5
19
40
^15
, 1953-6
5
1952
1952
1952
19
60
1919
19
57
1951
19
57
1957
1962
19
63
1947
19
62
1951
1963
1960
19
62
1953
d4
4.9
0
43.5
5
20.0
2
11
.10
17
.5
12.4
1
11
.05
15
.92
15
.89
10.0
7
16
.94
10
.68
8.5
7
d!8
.00
1
8.6
14,
300
J3.1
80
24
,50
0
1,8
30
(i)
11
,80
0
5,3
70
1
9,7
00
680
508
14
,20
0
1,3
20
406
549
17
,70
0
Apr.
12
Apr.
12
Apr.
14
A
pr.
6
Apr.
10
Apr.
6
Apr.
9
Apr.
8
Ap
r.
9 A
pr.
10
A
pr.
6
Ap
r.
8
Apr.
6
Apr.
6
Apr.
4
Ap
r.
7
43.8
0
44
.25
16
.64
d
!0.6
2
9.7
8
d5.7
6
d!5
.88
17.7
9
dlO
.64
d
20.8
6
11.7
0
6.5
4
d!8
.42
18
.89
3,4
30
3,1
60
12
,90
0
1,3
60
6,8
20
a2,2
00
7,0
50
9
30
4
00
2
6,0
00
1,2
60
187
81
0
19
,00
0
13 8 8
10 e2
.22
e1
.20
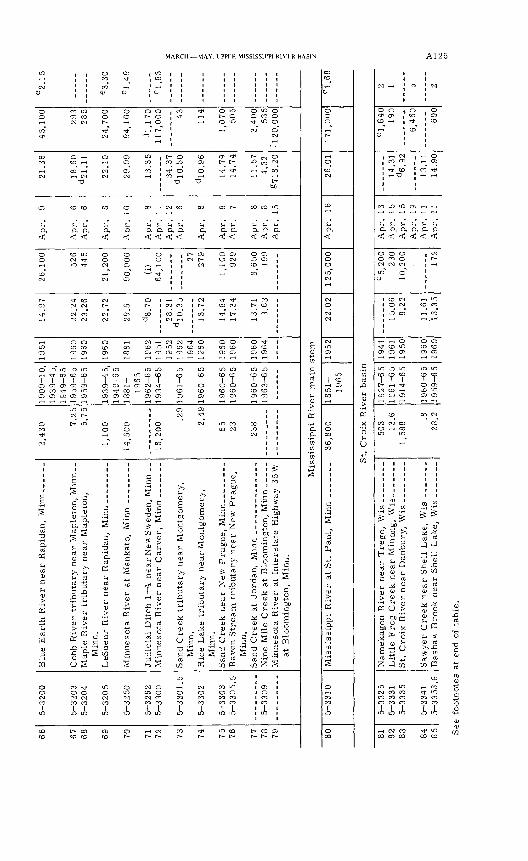
66 67
68 69
70 71
72 73
74 75
76 77
78
79
5-3
20
0
5-3
20
3
5-3
204
5-3
205
5-3
250
5-3
262
5-3
300
5-3
30
1.5
5-3
302
5-3
303
5-3
30
5.5
5-3
30
9
Blu
e E
art
h R
iver
near
Rap
idan
, M
inn _
___
Map
le R
iver
trib
uta
ry n
ear
Map
leto
n,
Min
n,
Min
neso
ta R
iver
near
Carv
er,
M
inn _
______
San
d C
reek
tri
buta
ry n
ear
Mo
ntg
om
ery
, M
inn
. R
ice
Lak
e tr
ibuta
ry n
ear
Montg
om
ery,
Min
n.
San
d C
reek n
ear
New
Pra
gue,
Min
n_
--_
_--
_
Rav
en S
tream
tri
buta
ry n
ear
New
Pra
gue,
Min
n.
Min
neso
ta R
iver
at I
nte
rsta
te H
igh
way
35
W
at B
loom
ingto
n,
Min
n.
2,4
30 7
.25
5.7
5
1,1
00
14,9
00
16
,20
0 .2
9
2.4
9
65
23
238
19
09
-10
, 1
93
9-4
5,
19
49
-65
1
95
9-6
5
1959-6
5
19
39
-45
, 1
94
9-6
5
1881-
19
65
1962-6
5
19
34
-65
19
61
-65
19
60
-65
1960-6
5
19
60
-65
19
60
-65
1
96
3-6
5
1951
1960
19
60
1960
1881
1962
19
51
1952
19
62
1964
19
60
1960
19
60
1960
19
64
14
.97
22
.24
2
3.2
6
22
.72
29.9
d8.7
0
28.3
1
d!0
.35
13
.72
14
.84
1
7.3
4
13
.71
3.6
3
26,1
00
526
44
5
21,2
00
90,0
00
(i)
64,1
00 27
27
9
1,1
00
929
8,6
50
199
Apr.
9
Ap
r.
6 A
pr.
6
Ap
r.
8
Ap
r.
10
Ap
r.
8 A
pr.
11
A
pr.
12
A
pr.
6
Ap
r.
6
Apr.
8
Ap
r.
7
Ap
r.
8 A
pr.
8
Ap
r.
15
21
.36
18
.60
d
21
.11
22
.10
29
.09
13
.35
34
.37
d
!0.5
0
d!0
.96
14
.79
1
4.7
4
11
.57
4.3
2
§7
18
.20
43,1
00
293
28
5
24,7
00
94
,10
0
J1.1
70
11
7,0
00 43
114
1,0
70
50
5
3,4
00
53
5 J1
20,0
00
e2.1
5
e3.3
0
e1.4
9
e1
.83
Mis
siss
ippi
Riv
er
main
ste
m
805
-33
10
Mis
siss
ipp
i R
iver
at S
t. P
au
l,
Min
n
_______
36,8
00
1851-
1965
1952
22
.02
12
5,0
00
Ap
r.
162
6.0
11
71
,00
0e
1.6
8
St.
Cro
ix R
iver
basi
n
81
82
83 84
85
5-3
32
5
5-3
331
5-3
335
5-3
341
5-3
35
3.8
Nam
ekag
on R
iver
near
Tre
go,
Wis
____--
-_
Bas
haw
B
rook n
ear
Shell
Lak
e.
Wis
_______
503 13.6
1
,58
8
.8
28.2
1927-6
5
1961-6
5
19
14
-65
19
60
-65
1959-6
5
1941
19
61
1950
1960
19
60
15
.06
8.2
2
11
.61
1
3.3
5
C5
,20
0
230
10
,20
0
172
Ap
r.
13
Ap
r.
15
Ap
r.
15
Ap
r.
19
Ap
r.
11
An
r.
11
14.3
1 d
6.9
2
13
.11
1
4.9
0
cl,
640
190
6,4
60
60
0
2 1 5 2
See
fo
otn
ote
s at
en
d o
f ta
ble
.
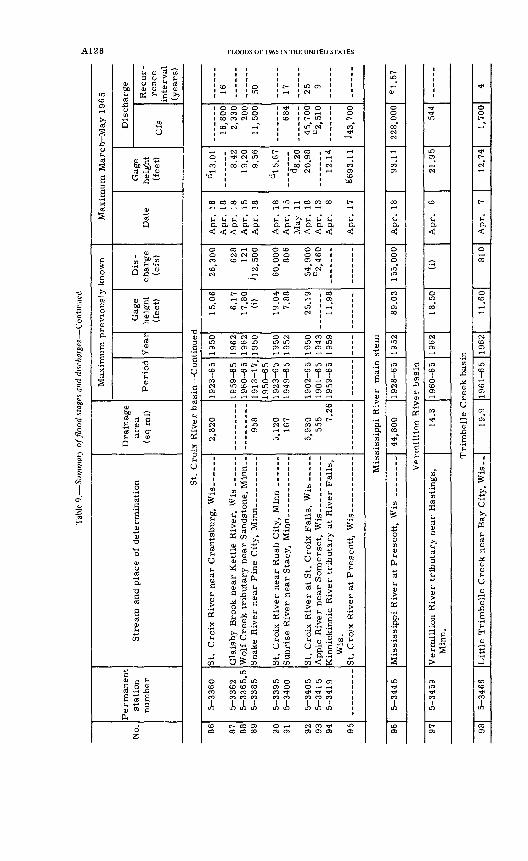
Tab
le 9
. Su
mm
ary
off
load s
tage
s an
d di
scha
rges
Con
tinue
d
No.
Perm
anent
stat
ion
num
ber
Str
eam
an
d p
lace
of
det
erm
inat
ion
Dra
inag
e are
a
(sq m
i)
Max
imu
m p
revio
usl
y k
now
n
Peri
od
Yea
rG
age
hei
gh
t (f
eet)
Dis
ch
arge
(cfs
)
Max
imu
m M
arc
h M
ay 1
965
Dat
eG
age
hei
gh
t (f
eet)
Dis
char
ge
Cfs
Recu
r
rence
in
terv
al
(yea
rs)
St.
Cro
ix R
iver
basi
n C
onti
nued
86 87 88 89 Qfl 91 no
no 94 n c
5-3
360
5-3
362
5-3
365.5
5-3
38
5
c_
Q c
5-3
400
5 3
405
5-3
41
5R 9
d1 Q
St.
C
roix
Riv
er n
ear
Gra
nts
burg
, W
is_
--_
__
Wis
.
2,8
20
958
5,12
016
7
5 93
055
5 7.26
1923-6
5
19
59
-65
1960-6
51
Q1
9 1
7
1 9 5
0-6
5 1923-6
51949-6
5
1902-6
51
90
1-6
51
Q C
Q _
_ C
C
1950
1962
1962
1950
1950
1952
1950
1 943
1 Q
RQ
15
.06
6.17
17.8
0(i
)
1 Q
C
\A
7.88
2519
11.9
8
26,3
00
628
112
,500
60,0
00
806
54,9
00C
2,4
60
Apr.
16
Ap
r.
18A
pr.
18
Apr.
18
Ap
r.
15M
ay
11A
pr.
18
Ap
r. 1
3
Ap
r.
17
d!3
.01
8.42
1 Q
on9
56
d!5
.67
d8.
2020.9
8
12.1
4
S6
93
.ll
16,8
002
330
200
11,5
00 684
45,7
00
C2,
510
J43.
700
16 50 17 259
Mis
siss
ipp
i R
iver
m
ain
ste
m
965
-34
45
Mis
siss
ippi
Riv
er a
t P
resc
ott
, W
is _
____
_4
4,8
00
19
28
-65
1952
89.0
315
5,00
0A
pr.
18
93.1
12
28
,00
0e
1.57
Vfr
mil
lion R
iver
bas
in
975-3
459
Ver
mil
lion R
iver
tri
buta
ry n
ear
Has
tings,
M
inn.
14.3
19
60
-65
1962
18.5
0(i
)A
pr.
6
21.9
554
4
Tri
mb
ell
e C
reek
bas
in
98
5-3
46
6
Lit
tle T
rim
bel
le C
reek
near
Bay
Cit
y, W
is.J
19
.9
1961-6
5
1962
11
.60
81
0A
pr.
7
12.7
41,
700
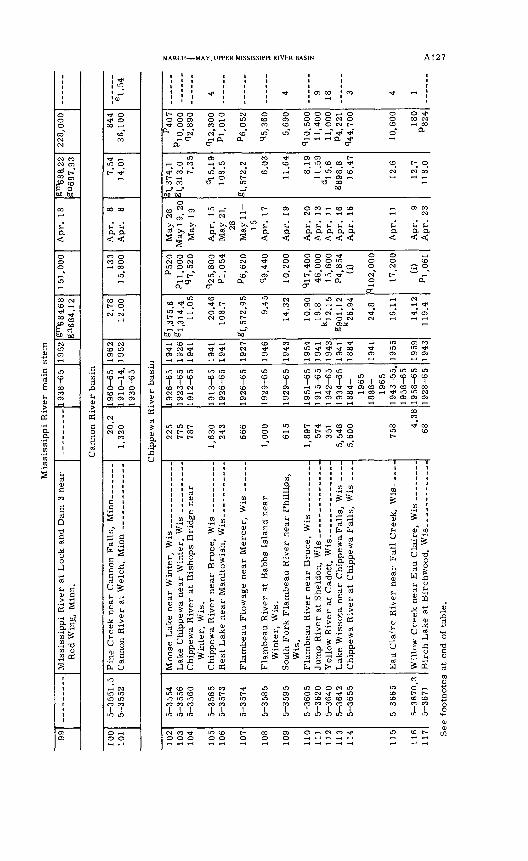
Mis
siss
ippi
Riv
er m
ain
ste
m
99R
ed W
ing,
M
inn.
1938-6
519
52£"
1684
68i
n68
4.12
151,
000
Ap
r.
18§"
1688
.22
§"6
87.9
322
8,00
0
Can
no
n R
iver
bas
in
100
101
5-3
55
1.5
5 _ 3
552
20.2
1 **
9n1
96
0-6
519
10
141930-6
5
1 Q
fi9
1 Q
^9
2.78
12.0
01
^*3
15,8
007
5414
.01
844
36,1
00e
1.54
Chip
pew
a R
iver
bas
in
1 02
i n^
104
105
106
107
108
109
110
111
112
113
114
115
llfi
11
7
5 35
545
-35
56
5-3
56
0
5-3
565
5 3
573
5 3
574
5-3
585
5-3
595
5-3
605
5-3
62
05
-36
40
5-36
425-3
655
5-3
66
5
S-3
R70
.3
5-36
71
M
Lak
e ar
Win
t W
is
Win
ter,
W
is.
Win
ter,
W
is.
So
uth
Fork
Fla
mbea
u R
iver
near
Phil
lips,
W
is.
Chip
pew
a R
iver
at
Ch
ipp
ewa
Fall
s,
Wis
___
_
Eau
Cla
ire
Riv
er n
ear
Fal
l C
reek
, W
is-_
__-
Wil
lnw
Crp
ek n
ear
Eau
Cla
ire,
Wis
___
____
_ B
irch
Lak
e at
Bir
chw
oo
d.
Wis
_
____
___
225
775
787
1,63
024
3
1,00
0
615
1 89
757
435
15,
548
5,60
0
758 4
.38
68
1926-6
51923-6
51
91
2-6
5
1913-6
51926-6
5
192
9 _ 6
5
1929-6
5
1951-6
51915-6
51
94
2-6
51934-6
51884-
1965
1
88
8-
1965
1943-5
5,
1958-6
5
1958-6
5
1928-6
5
1941
1926
1941
1941
1 Q
d1
1927
1946
1943
1954
1941
1943
1941
1884
1941
1955
1959
19
43
§1 3
75 6
gl,
314.4
11.0
5
20.4
610
8.7
§1 5
72 9
5
945
14.3
2
10.9
018
.8k!2
.15
§901
.12
k26
.94
24.8
16.1
1
14.1
2 11
9.4
P52
0P
ll.O
OO
q7
,52
0
q25
,800
Pi,
054
P6,6
20
A
Af)
10
,20
0
917,4
00
46
,00
015
,600
P4.8
54
(i)
q!0
2,0
00
17,2
00
(i)
pl.
061
May
28
May
1 9
, 20
Apr.
15
Mav
71
28M
ay 1
115
A
pr
17
Apr.
19
Apr.
20
Apr.
13
Apr.
11
Ap
r.
16A
pr.
16
Apr.
11
Apr.
9
Ao
r.
23
§1,3
74.1
§1,3
13.0 7.3
5
d!5.1
910
8.5
§1 5
72 2 6.03
11.6
4
81
Q
11.5
9d!5
.6§8
98.8
16.4
7
12.6
12.7
11
8.0
P40
7
P10
,000
12,8
90
q!2
,30
0P
i, 0
10
P6,0
52
q5,
360
5,69
0
q!0
,500
11,4
0011
,000
P4.
221
q44,7
00
10,6
00 180
P82
4
4 4 9 18
3 4 1
See
footn
ote
s at
end
of
table
.
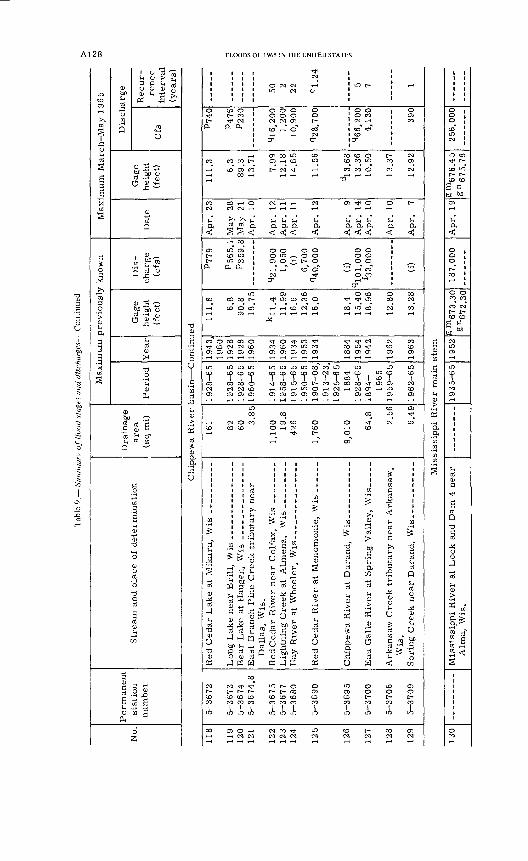
Tab
le 9
. S
umm
arv
off
load s
tage
s an
d di
scha
rges
- -
Con
tinu
ed
No.
Perm
anent
stat
ion
num
ber
Str
eam
an
d p
lace
of
det
erm
inat
ion
Dra
inag
e are
a
(sq m
i)
Max
imu
m p
revio
usl
y k
now
n
Peri
od
Year
Gag
e h
eig
ht
(fee
t)
Dis
ch
arge
(cfs
)
Max
imu
m M
arc
h M
ay 1
965
Dat
eG
age
hei
ght
(fee
t)
Dis
char
ge
Cfs
Recu
r
rence
in
terv
al
(yea
rs)
Chip
pew
a R
iver
basi
n C
onti
nued
118
119
120
121
122
123
124
125
126
127
128
129
5-3
67
2
5-3
673
5-3
67
45
-36
74
.8
5-3
67
55-3
677
5-3
680
5-3
69
0
5-3
69
5
5-3
700
5-3
70
6
5-3
70
9
Dal
las,
W
is.
Red
Ced
ar R
iver
near
Colf
ax,
Wis
_ _
_ _
_
Red
Ced
ar R
iver
at
Men
om
on
ie,
Wis
___
___
Wis
.S
pri
ng C
reek
near
Dura
nd,
Wis
_-_
___--
___
161 82 603.8
5
1,10
0
426
1,76
0
9,01
0 64.8 2.56
6.49
1928-6
5
19
28
-65
1928-6
51960-6
5
19
14
-65
1915-6
51950-6
51907-0
8,
19
13
-23
,1
92
5-6
518
841928-6
51
89
4-
1965
1959-6
5
19
62
-65
1943
,19
6019
2819
2819
60
1934
1960
1934
1953
1934
1884
1954
1 Q
49
1962
1963
111.
6
6.8
90.8
18.7
5
k!1
.41 1
99
16.6
12.3
616
.0
18.4
15.4
0
12.8
0
13.2
8
P77
9
P56
5.1
?35
9 s
q21
,900
1,05
0(i
)6,
700
q40,0
00
(i)
qioi
,ooo
f q o
n n
n
(i)
May
28
Ap
r.
10
Apr.
12
Ap
r. 1
1A
pr.
11
Apr.
12
Apr.
9
Apr.
14
Ap
r.
10
Apr.
10
Apr.
7
111.
3
6.3
89.3
13.7
1
7.99
12.1
814
.65
11.5
6
d!3
.68
13.3
610
.50
13.3
7
12.9
2
P74
0
P47
6P
230
q!6
,20
01,
200
10,9
00
q2
8,7
00
q66
,200
4,1
30
390
50 222 e
1.24
5 1
Mis
siss
ippi
Riv
er m
ain s
tem
130
19
35
-65
1952
S m
673
30gn
672
30 "18
7,00
0A
nr-
1
QS
m67
6.4
5£
"67
5.7
82
56
,00
0
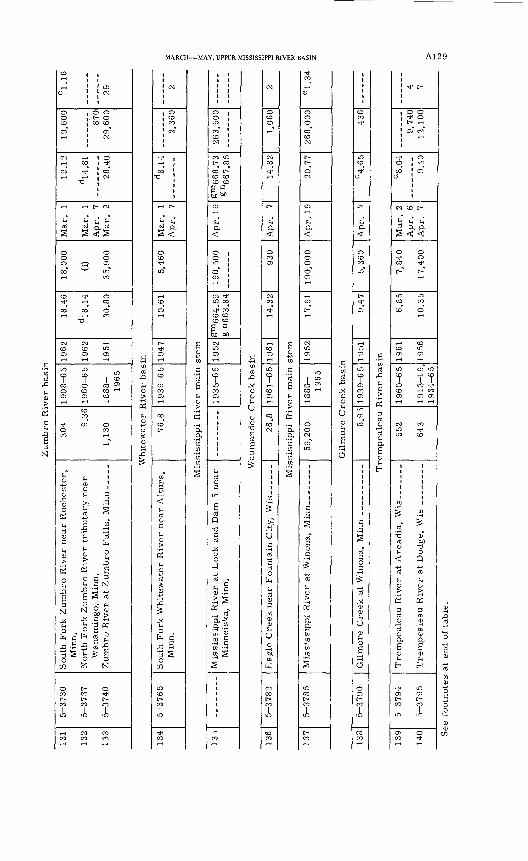
MARCH MAY, UPPER MISSISSIPPI RIVER BASIN A129
CO
1-1 enQ) CM
O O Oo ,c- oCD CO CO
05 05"i-l CM
CM ,-1 O i-l CO ^
O3 ^ CO -I i-l CM-o
-I i-l C- CM
tl tl il fld d Q, ds s £ ;§0 0o oO ^ C5co" ""^ LO"i-l CO
CO ^ O
CO CO Oi-l i-l CO d
CO CO LDO5 O5 O5
LO LO
cp cp "^CO O CO ^O CO CO "-1O5 O5 COi-l i-l rH
CO
T^ O5 O O CO CO i-l
1
CO Q) 'Q) C C
"§ s i03 5 ,
iS -^ Q) l-i aiC *-" PH
g > ^*_, -iH ^5
S B! g
South Fork Zumbro
Minn.
North Fork Zumbro Wanamingo, Minn
Zumbro River at Zu
o c- oCO CO -^C- [- [~
LO LO LO
i-l CM CO
cCOd
Q)
"5
Q)
!c
CM
oCO COCM"
^CO-a
* t->-> cs<oCO^ID
CO
o
c-
05
1COO31-1
CO
COL
d^3s
d Q)
0)
OS ^Q)
South Fork Whitewal
Minn.
LO
COc-coLO
CO
g
main
SHQ)
OS
a a r-l COCO
COCO
p5
o oLOco"COCM
CO LD I CO
CO L CO COCO COc c§0 tuO
05
^|a
ooIDo"03
05 * LO CO ^" COCO COCO COg c
caj QflCM IDen
LO1COen1-1
ii i
!
dQ)C
LO
gd Q-aaJ
o O
Mississippi River at Minneiska, Minn.
||
iCO
CCOd
Q)Q)
uQ)Q) adg35
CM
O CO O,-T
CM CO
^^^
c-
a
Oco05
CMCO
CO02
61-65]
Oti -I
CO
CO CM
1111
to!%
+3U cd"c
fe
d Q) C
Q) Q)
U Q)
d W
COt>
ID
COCO
g
main
OS
D,.9-COCO
COCO
^
CO,_,
Q)
o o oCOCOCM
c- c-oCM
O3
a
oooo05
<J>L
IM IDen
LO
o enco -"CO -i
o oIM05"
ID
J|11
Cc fH^
d
C
is
Mississippi River a
IDCOc coLO
c-co
COd
XQ)Q)
Umore
O
ii
CO CO
ID CO
^O
L
a
oCOCOLO"
c-
O5
LOO5
LO
TO5 CO05 -I
ID05
00
ccsinona
Gilmore Creek at W
o05C-coLO
CO CO
crer bas
nrt
Q)"dQ)ag
H
^ t"
o o * oC- ^-1
03 ev>r-t
^ o o -^CO C5a
CM CO D-
!-. j^ ^
« a aS <! <^
o o^ oCO T^
C- L-"
LD LO CO CO
CO O
-I CO CO LDO5 O5
ID C3 LO
O CO TjlCO i-l COO3 O5 O5,-H ,-1 l-l
CM COLO ^ LO CO
1 11 11 11 1
Jen i
^ 1
T3 0) d bfl o -df-< 0< Qd d
Trempealeau River Trempealeau River
LO
O3 O5C- [-CO CO
LO J,
O5 O CO ^
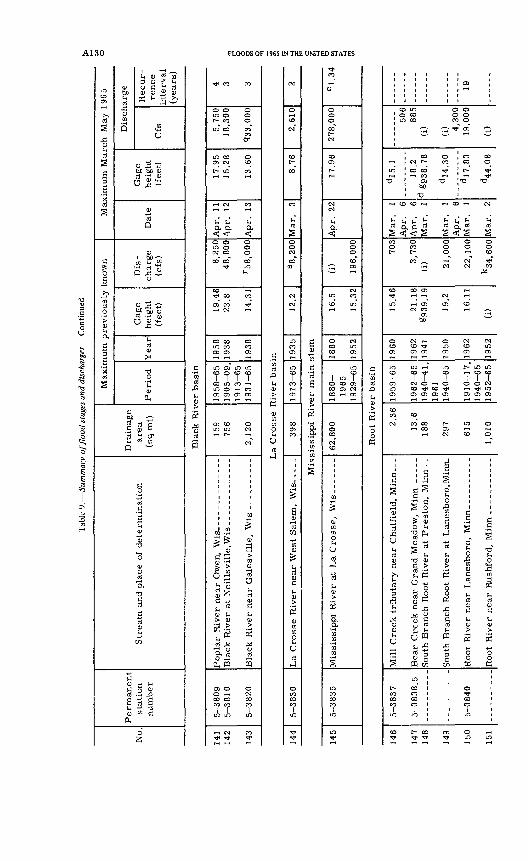
Tab
le 9
. Su
mm
ary
off
loa
d s
tage
s an
d dis
charg
es C
onti
nued
No.
Perm
anent
stati
on
num
ber
Str
eam
an
d p
lace o
f d
ete
rmin
ati
on
Dra
inag
e
are
a
(sq m
i)
Maxim
um
pre
vio
usl
y k
no
wn
Peri
od
Year
Gag
e h
eig
ht
(fee
t)
Dis
ch
arg
e
(cfs
)
Max
imu
m M
arc
h M
ay 1
965
Date
Gag
e heig
ht
(fee
t)
Dis
charg
e
Cfs
Recur
rence
inte
rval
(years
)
Bla
ck R
iver
basi
n
141
142
143
5-3
809
5-3
81
0
5-3
820
159
756
2,1
20
19
58
-65
1
90
5-0
9,
1913-6
5
1931-6
5
19
58
19
38
1938
19
.46
23.8
14
.31
8,2
50
48,8
00
r58,0
00
Ap
r.
11
Ap
r.
12
Ap
r.
13
17
.95
1
5.2
8
13
.60
5,7
50
18,3
00
93
3,0
00
4 3 3
La
Cro
sse R
iver
basi
n
144
5-3
830
39
81913-6
51
93
512.2
S8
,20
0M
ar.
3
8.7
62
,61
02
Mis
siss
ipp
i R
iver
main
ste
m
145
5-3
835
62,8
00
18
80
-
19
65
1
92
9-6
5
18
80
1952
16.5
15
.32
(i)
196,0
00
Ap
r.
221
7.9
62
78
,00
0e
1.3
4
Root
Riv
er
basi
n
146
147
148
149
150
151
5-3
837
5-3
840
Mil
l C
reek t
ributa
ry n
ear
Chatf
ield
, M
inn _
South
Bra
nch R
oo
t R
iver
at P
rest
on
, M
inn -
_
South
Bra
nch R
oot
Riv
er
at L
anesb
oro
.Min
n.
Ro
ot
Riv
er
near
Lan
esb
oro
, M
inn_-_
_--
----
Root
Riv
er
near
Rush
ford
. M
inn -
-----
____
2.3
6
13.6
18
8
297
615
1,0
10
1959-6
5
1962-6
5
1940^11,
1961
1
94
0-6
5
1910-1
7,
1940-6
5
1952-6
5
19
60
19
62
19
41
1950
1962
1952
15
.46
21.1
8
^939. 1
9
19
.2
16
.11
(i)
703
3,7
30
(i
) 21,0
00
22,1
00
k34.6
00
Mar.
1
Apr.
6
Ap
r.
6 M
ar.
1
Mar.
1
Ap
r.
6 M
ar.
1
Mar.
2
d!5
.1
18.2
d
6938.7
8
d!4
.30
d!7
.83
d44.0
8
506
88
5(i
)
(i) 4,3
00
19
,00
0
(i)
19
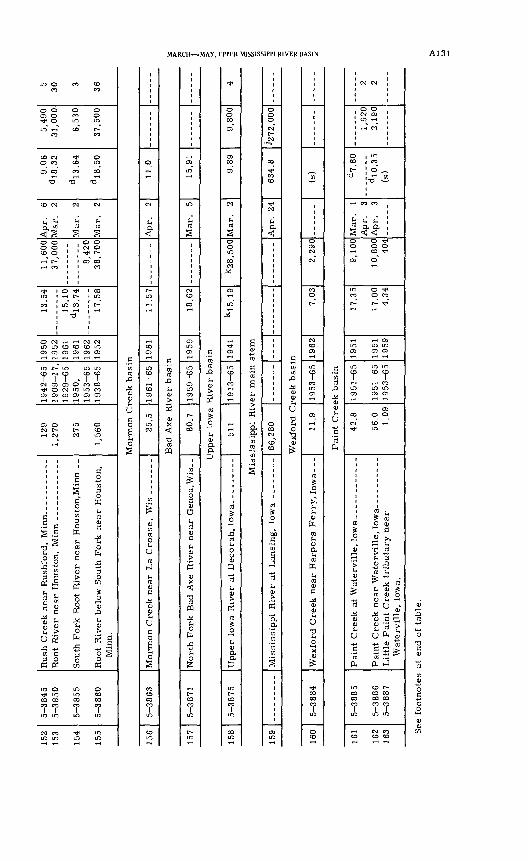
152
153
154
155
5-3
84
5
5-3
850
5-3
85
5
5-3
86
0
Sou
th F
ork
Roo
t R
iver
near
Houst
on,M
inn _
_
Roo
t R
iver
bel
ow
Sou
th F
ork
near
Houst
on,
Min
n.
129
1,27
0
275
1,56
0
19
42
-65
1909-1
7,
1929-6
5
1950
, 1953-6
5
19
38
-65
1950
19
52
1961
19
61
1962
19
52
13.5
4
15.1
0 d!3
.74
17.5
8
11,6
00
37,0
00
8,42
0 3
8,7
00
Apr.
6
Mar
. 2
Mar
. 2
Mar
. 2
9.0
6
d!8
.32
d!3
.64
d!8
.50
5,49
0 31
,000
6,53
0
37,5
00
5 30
3
36
Morm
on C
reek
basi
n
156
5-3
86
3M
orm
on C
reek
near
La
Cro
sse,
Wis
___
____
25.5
1961-6
519
6111
.57.....
...A
pr.
2
11.0
Bad
Axe
Riv
er b
asi
n
s >
157
5-38
71N
ort
h F
ork
Bad
Axe
Riv
er n
ear
Gen
oa, W
is__
80.7
19
59
-65
1959
18.6
2M
ar.
515
.91
Upper
Iow
a R
iver
basi
n
158
5-3
87
5U
pper
Io
wa
Riv
er a
t D
ecora
h, lo
wa--
----
---
511
1913-6
519
41k
!5.1
9k
28,5
00M
ar.
29.
89
h-_
__._
j: s <
9,80
04
S ya & M
issi
ssip
pi
Riv
er m
ain
ste
m
i/j
159
66,2
80...
._
.__
_ ......
.....
Ap
r.
2463
4.8
^272
,000
50 <
Wex
ford
Cre
ek b
asi
n
gj
160
5-3
884
Wex
ford
Cre
ek n
ear
Harp
ers
F
err
y, lo
wa--
-11
.91953-6
519
627.
032,
290
(s)
>
Pai
nt
Cre
ek b
asi
n
161
162
163
5-3
885
5-3
88
6
5-3
88
7
P
' t
C
k W
at
rv'll
I
Lit
tle
Pain
t C
reek
tri
buta
ry n
ear
Wat
ervil
le,
Iow
a.
42.8
56.0
1.
09
19
51
-65
19
51
-65
1953-6
5
1951
1951
19
59
17.3
5
17.0
0 4.3
4
9,10
0
10,8
00
404
Mar
. 1
Ap
r.
3 A
pr.
3
d7.
60
d!0
.35
(s
)
1,92
0 2,
190
2 2
See
footn
ote
s at
end
of
table
.
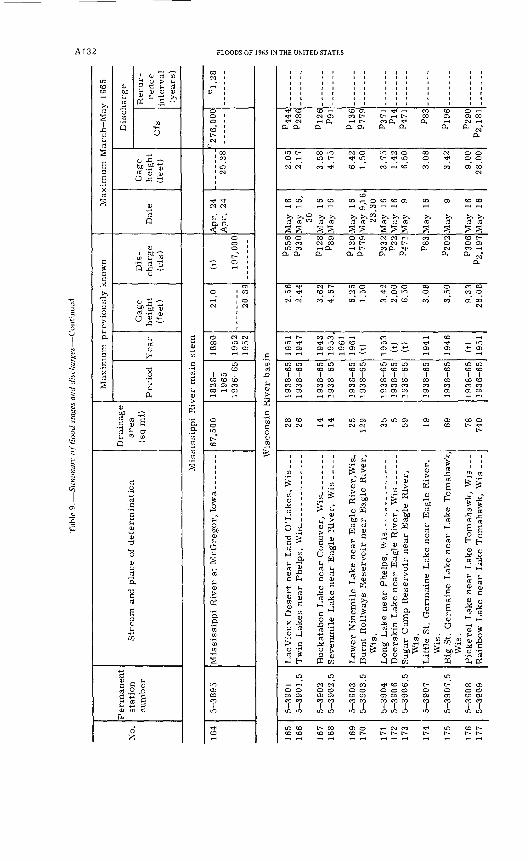
A132 FLOODS OF 1965 IN THE UNITED STATES
inCOO3
7,nj*p
0SHrt*3
g3
sXrt^
C£Oc"^
CO3O
CU
a g3
rt§
' cu rt co b CJ > SH
CU 3 C SH fliOJO £j CU CU CU
rt K ^ £ -^
CO jH raQ -
0 H)^rt °rtj rt)
O si £j
CU"rt
Q
CUi cm'--2 ^ -2Q j-j ^.
O
4) ** -~
tuO hn "fijrt .rt d,
<-> _£, Si
rt CUf*
d
CU Pn
CU bJO ^5JS rt g
S-i "* CO
Q ~
Co' i~|
rtC
|H
gs-CU
d'o
CUort'3.
"Hrt
g rt CU?H *->M
cu c SH-rt O n
g| |
CU CO C!
o£
gCO
c'rt
sSH CU
sa a,COCO
CO CO
§
coCM
CU
o0oco"
t>CM
CJ
coCO
CM
Tf T}.
CM CM
a a
o o0
-~ 03v rt
o oort 0CM CM
O CM CMco m inCO O3 O3rt rt rt
mCO
1 m ICO CO CO CM O3 CO CO rt 03
0 0
1^CO
1
1
1rtfeOM.
O bjO
SH
O0§
rtSH
>
K'a, a,COCO
CO
inO3coCO
in
CO
Tf COTf COTf CMa a
m i>O rt
CM CM
co co"
C? C?^s sCO 0in coin coa D,
CO Tfm TfCM CM
m TfO3 O3
in mCO CO
1 1co coCO COO3 O3
CO COCM CM
1
CO
*" *
LacVieux Desert near Land O Twin Lakes near Phelps, Wis-
mrt rt0 0O3 O3COCO
in in
in CDCO CO
CO * 1CM O3rt O,a,
co m in t
CO CO
0 rt rt§ §CO O3CM COr t p.
O,
CM C- CO CO
CO Tf
CO COTf inO3 O3
m mcococo coCO COO3 O3
Tf Tf
; ;i ii ii g.2 ^
^ SHCUt_r ^>
Buckatabon Lake near Conove Sevenmile Lake near Eagle Ri
mCM CM0 OO3 O3COCO
in in
i> coCO CO
CO O3co r>rt r-
O, O.
CM OTf mCO rt
CO CO rt,1-1 en"
rt rt§ §O O3CO IT-rH t-
O-. O-.
in o CM mCD' rt
CO CO
in incococo coCO COO3 O3
m 03CM CM
o! C
£ (tiCUS "^QJ &1r 1
CO) SH
Lower Ninemile Lake near Ea Burnt Rollways Reservoir nea
inCO CO0 003 03COCO
in in
C3 O CO [>
rt Tf rtC- rt [>cod. TfG, Q,
in CM o t> Tf inCO rt CO
O CO CO O3 CO rt rt
^ rt rt rt§ <; <;CM CM rtCO CM C-co G Tfa G,
CM 0 0Tf o mCO CM CO
COm -^ ^rHin m mCO CO CO
1 1 1co co coCO CO COO3 O3 O3
in in 03co m
CO.-H-
js ^* f-H
s* bpcu rt
Wis.
Long Lake near Phelps, Wis__ Deerskin Lake near Eagle Riv Sugar Camp Reservoir near E
Wis.
mTf CO COo o oO3 O3 CftCO CO CO
in m in
rt CM CO
COCOo.
co oCO
CO
rtSCOCOG
co oCO
Tf
rH
inCO
COCOO3
03
,
K
"hnrtM' '
Little St. Germaine Lake near
[^0Cft1Tf
COO3^H
Q,
CM Tf
CO
O3
rc?
§CMOCM
G
0inCO
CO Tf
rHmCD
coCOO3
O3CO
1
rtg
HCU
rt
Wis.
Big St. Germaine Lake near L
Wis.
inc-003
in
in
O rt03 COCM rtCM"
Q,
o o o oO3 CO
CM
CO CD
rc? a?s §CO C-O CftCO rtCM"
G,
CO CO CO O03" oo'
CM
-^ in1 1
m mCO CO
1 1CO COCO COO3 O3
CO O[> Tfc-
1 1
CO m
& ^ ^ -jjfrt SC1 (-H
rt 'rri
Pickerel Lake near Lake Tom Rainbow Lake near Lake Tom
CO O3O OO3 O3COCO
m m
CD t
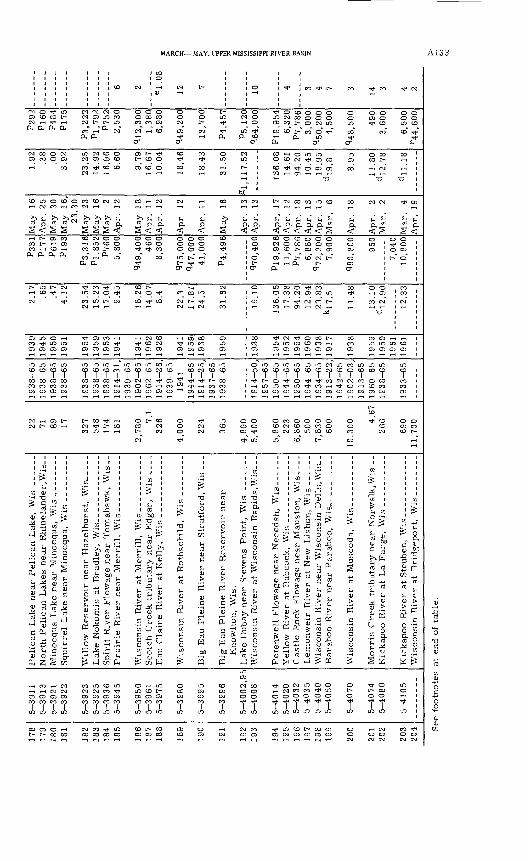
MARCH MAY, UPPER MISSISSIPPI RIVER BASIN A133
CMcnCM
CMcnT-H
CD
rt §T-H
CO
t-
CM
CT) COcn
in
TonCOCO
CMCM
im
Pelican Lake near Pelican Lake, Wi
,_,rtC3
in
COt-
CD CO t-
CO O CMCO O CO
CO
in o CDCM CO rt
C- CO COC- rt COrt CD rt
in c- CMCD TJ< rt
<4<
in o T-H ^t< in inCO CO CO
in in inCD CD CO1 1 1CO CO COCO CO COO3 O3 C}
T-H Oi O
l> CO i-H
1 i !0) i i
North Pelican Lakes near Rhineland Minocqua Lake near Minocqua, Wis Squirrel Lake near Minocqua, Wis _
CO rt CMrt CM CM
CO CO CO
in in in
co o T-HC- CO CO
CM CM CM
COa
inCM
COCM
0 COCO CM
« >>N rt
§CD
CO
COa
inCOCM
inCO
inCD
COCOCO
t-CMCO
mter
Willow Reservoir near Hazelhurst, 1
CO
CO
7mCM CO
CD
CM CM Oco in co c- t- in
CM CD OCT> CO CD
Tf CD CDT 1 T 1
CD CM CM
CM O Oin CD oCO C- CO
T-H in^
CM O Tf
in t- coT-H T-H
CT> CO T-Hin in ^ co cn co
in in rtCD CO CO
CO CO TfCO CO T-HGl CO CO
CO Tf T-H * C- COin rt rt
ra i
J '
Lake Nokomis at Bradley, Wis--- - Spirit River Flowage near Tomahaw Prairie River near Merrill, Wis--_
LO CD mCM CO TjH
CO CO CO
LO in in
co ^t< mCO CO CO
CO 0
CM rt r
0 O 0 CO CO CO Cco co co rCM T-i CO CT-H *;
CT a
co r- ^t< ciC- CD O ;CO CD O 0
T 1 T-H T-
co rt CM crt T-H T-H r
J3 P- P-§ < < <o o o cO CD O C * rj< CO C
CO CO U ^ C
CT 0
CD C- CM O ^ O
CO Tf CO C1
rt CM CD T- Tf CD CM T CO Gl CO C
in in in CD inCO CD CO CM CO
CO CM CM Tf CO *CO O CO rt CO cco CT) cn GI cn *"
T_H
O t- CD CCO CM Ct- CO C
CM ;
rafe
Wisconsin River at Merrill, Wis--_ Scotch Creek tributary near Edgar, Eau Claire River at Kelly, Wis __-_
o rt in cm CD c- oCT) CO CT) CCO CO CO 0
in in in u
CD t- CO C CO CO CO O
* c-
3 0 3 0q c-3 CO< rt
3 COf Tf3 COH T 1
0 T 17 1
1 O,
t! <3 O O3 O O3 O O
O C- T-H- ^u *3<
CT
o co m J C- Tf-] rt CM
H cn co i in co1 CO CO
in in inCD CM CD
13 Tj< rt CO
H co co cn
3 CM3 CM
f
ra
^
Big Eau Pleine River near Stratford
) CO) CO0 CO
o in
13 O 3 03
t-m
<3<PH
0inrtCO
CD
rt
§CDCT> ^
*-pPH
CMCO
rtCO
CO
03
m
TCOCOCT>
mCDCO
^
Big Eau Pleine River Reservoir nea
Knowlton, Wis.
CDO3O3
7
O3
1 0i"o oCM OT-H 0
in ^CT
CMint-T 1
"^
to)CO COrt T-H
<%o
1 °
1 01 t~i cr
o
1 01i T~t
|1 CO 1 CO 1 03
O1 LO
1 T-H
1 03
0 0O3 OCO «<
^t< m
1 M
0?
Lake Dubay near Stevens Point, Wis Wisconsin River at Wisconsin Rapid
cnCM COo o0 0
TTin in
CM COGl Gl
1
i O CD O O O
m CM co o o oCT) CO t- o CM in
cn CD t- co" o *''rt p. m
PH CT
co T-H o in inO CD CM Tf CT) CO
CD ^ ^ o CO CT)CO T-H CO T-H T-H T-H
-i -0
t*- CM co co in CDT-H rt T-H rt rt
a, a p. PH a
CD O CO o O OCM O CO CO O Ocn co c co o] coCO rt t- CO CM t-T-H T-H Q. l>
a CT
LO CO O Tt< CO
CD O rf CM CO OCO T i C7i i i CM T i
*^ CM Tf O CO C- LO LO LTJ CD CO T-IC} C} C} O5 C} C}
LO LO LO in LO in CM
T CD CD CD CD CO CM 1 1 1 1 1 1
LO LO Tt< in Tt< co T-HCJi CJi G^ Oi G^ C7i CJi
O CO O O O OCD CM CD O CO OCO CM CO LO CO CD
LO CD C-
i j i £ i -S M rt ]
Petenwell Flowage near Necedah, W Yellow River at Babcock, Wis ----- Castle Rock Flowage near Mauston, Lemonweir River at New Lisbon, W Wisconsin River near Wisconsin De Baraboo River near Baraboo, Wis__
*3< o CM m o ort CM co co * mo o o o o oTTTTTTin m 10 in LO in
3< m co t co 01 cn cn cn GI ci co
CO
o oinCO
CT
inCO
co
CO7-1
PH
O
OCO
COCT
CO
rtT (
CO COCT)
LO co incocpco
Tf O T-H
Gl Gl Gl
o0CO
o
11
Wisconsin River at Muscoda, Wis-_
ooTino0
^ CO
o oCO O ^ CD
CO
O COCO r-rt CM
T3
CM CM
<soinGl
O Ort CO
CO CMT-H T-H
"0
Gl O LO LO Gl Gl
m LO
TTO COCO COCO CO
CO
T^ CDCDCM
<n
£
Morris Creek tributary near Norwal Kickapoo River at La Farge, Wis __
Tf O
r- coo o
TTin in
rt CMo o
* CM
0 O 0 Oin CD
CO '
T-H 1
T-H 1
"0 r
1
* CO
!<0 0
O CO j
t O 1
iCO CO ]
CM 1T-H 1
iCO CO 1Gl Gl 1
mCO r
CO 1CO 1CT) 1
0 0CO OCO t-
rt
j II I
Kickapoo River at Steuben, Wis.--_ Wisconsin Riv^r at Bridgeport, Wis
m iO IT-H 1T :m i
CO < < 0 0
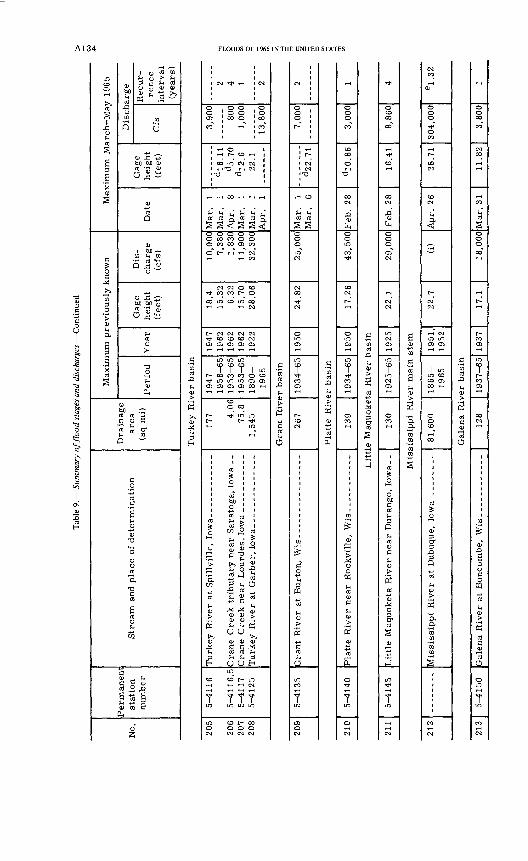
Tab
le 9
. Su
mm
ary
of f
lood s
tage
s an
d d
isch
arg
es C
onti
nued
No.
Per
man
ent
stat
ion
nu
mb
erS
trea
m a
nd p
lace
of
det
erm
inat
ion
Dra
inag
e are
a
(sq
mi)
Max
imu
m p
revio
usl
y k
now
n
Per
iod
Yea
rG
age
hei
ght
(fee
t)
Dis
ch
arge
(cfs
)
Max
imum
Marc
h M
ay 1
965
Dat
eG
age
hei
ght
(fee
t)
Tu
rkey
Riv
er b
asin
205
206
207
208
5-1
116
5-1
116.5
5-
4117
5-
1125
Cra
ne
Cre
ek t
rib
uta
ry n
ear
Sar
atoga,
Iow
a __
177 4
.06
75.8
1,
545
1947
1
95
6-6
5
19
53
-65
1
95
3-6
5
1890-
1965
1947
19
62
1962
19
62
1922
18.4
15
.32
6.32
15
.70
28.0
6
10,0
00
7,38
0 1,
830
11,9
00
32,3
00
Mar
, 1
Mar
. 1
Apr.
8
Mar
. 1
Mar
. 1
Apr.
1
d5.7
0
d!2
.6
22.1
Dis
char
ge
Cfs
Rec
ur
re
nce
inte
rval
(yea
rs)
3,90
0
800
1,00
0
13,8
00
2 4 1 2
Gra
nt
Riv
er b
asin
209
5-11
3526
71
93
4-6
519
5024
.82
25,0
00M
ar.
1 M
ar.
6d
22.7
17,
000
2
Pla
tte
Riv
er b
asin
210
5-11
4013
91
93
4-6
519
5017
.26
43,5
00F
eb.
28d
!0.8
63,
000
1
Lit
tle
Maq
uoket
a R
iver
bas
in
211
5-11
45L
ittl
e M
aquoket
a R
iver
near
Du
rango,
Iow
a_-
130
19
25
-65
1925
22.1
29,0
00F
eb.
2816
.41
8,86
04
Mis
siss
ippi
Riv
er m
ain
ste
m
212
81,6
001
86
5-
1965
1951
, 19
5222.7
(i)
Ap
r. 2
626
.71
30
4,0
00
e1.
32
Gal
ena
Riv
er b
asin
213
5-11
5012
81
93
7-6
519
3717
.118
,000
Mar
. 31
11.8
23,
800
1
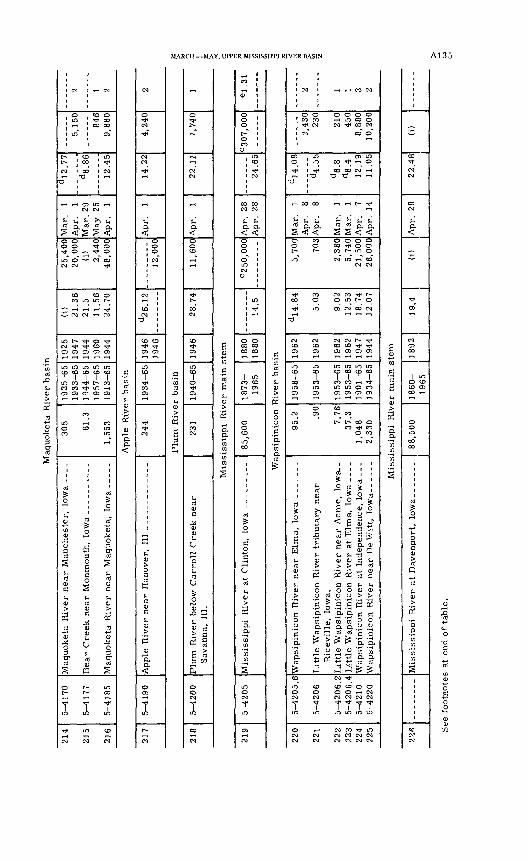
Maq
uoket
a R
iver
bas
in
214
215
216
5^1
70
5^1
77
5^185
Maq
uoket
a R
iver
near
Man
ches
ter,
Io
wa-
-__
305 61
.3
1,55
3
1925-6
5
19
33
-65
1
94
4-6
5
19
57
-65
1
91
3-6
5
1925
19
47
1944
19
60
1944
(i)
21
.36
21
.5
11.5
6 24
.70
25
,40
0
20,0
00
(i)
2,4
40
48
,00
0
Mar
. 1
Ap
r.
1 M
ar.
29
May
25
A
pr.
1
d!2
.77
d8.8
6
12.4
5
5,1
50
846
9,88
0
2 1 2
App
le R
iver
bas
in
217
5^1
90
244
19
34
-65
1946
19
46d
26.1
212,0
00
Ap
r.
11
4.2
24,2
40
2
Plu
m R
iver
bas
in
218
5^2
00
Plu
m R
iver
bel
ow
Carr
oll
Cre
ek n
ear
Sav
anna,
11
1.23
11
94
0-6
519
4628.7
41
1,6
00
Ap
r.
122.1
11,
740
1
Mis
siss
ipp
i R
iver
mai
n s
tem
219
5^205
Mis
siss
ipp
i R
iver
at
Cli
nto
n,
Iow
a __
____
___
85,6
001
87
3-
1965
1880
18
8014.5
C250,0
00
Ap
r.
28
Ap
r.
282
4.6
5C
307,
000
e1.
31
Wap
sipin
icon R
iver
bas
in
220
99
1
222
223
224
225
5^205
.6
5^206
5^206
.25^20
6.4
5^210
5^220
Ric
evil
le,
Iow
a.L
ittl
e W
apsi
pin
ico
n R
iver
near
Acm
e, I
owa_
-L
ittl
e W
apsi
pin
icon R
iver
at
Elm
a, Io
wa_
-__
Wap
sipin
icon R
iver
at
Indep
enden
ce,
Iow
a_._
Wap
sipin
icon R
iver
nea
r D
eWit
t, lo
wa--
----
Qn
7.76
37.3
1,04
82,
330
1958
-65
1953
-65
19
53
-65
1953
-65
19
01
-65
1934
-65
1962
1962
1962
1962
1947
1944
d!4
.84
^ n^
9.02
12.5
318
.74
12.0
7
5,70
0
703
2,38
05,
740
21,5
0026
,000
Mar
. 1
Mar
. 1
Mar
. 1
Ap
r.
7A
pr.
14
d!4
.08
d4.5
5
d6.
8d
8.4
12.1
911
.05
2,43
023
0
210
450
8,88
010
,200
2 1 1 3 2
Mis
siss
ipp
i R
iver
mai
n s
tem
22fi
88,5
001860-
1965
1892
1 Q
4.(i
)22
.48
(i)
See
fo
otn
ote
s at
end
of
table
.
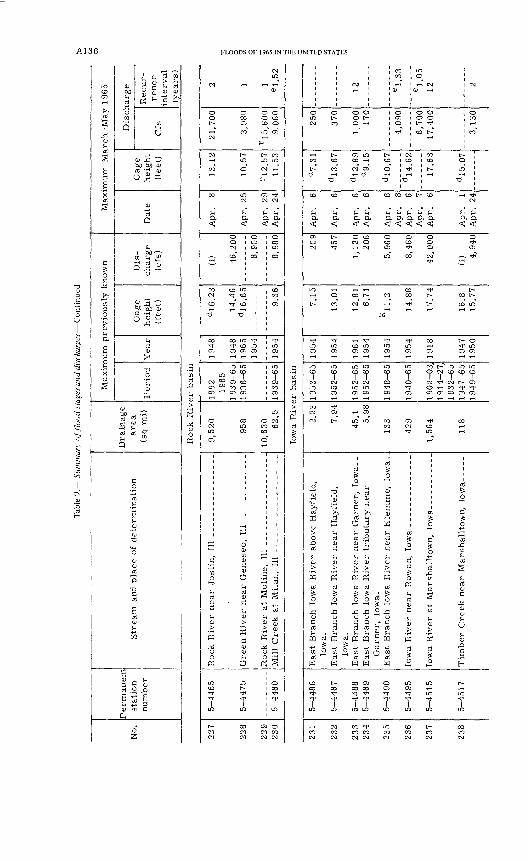
Tab
le 9
. S
umm
ary
o) fl
oo
d s
tage
s an
d dis
tharg
es C
onti
nued
No.
Per
man
ent
stat
ion
nu
mb
erS
trea
m a
nd p
lace
of
det
erm
inat
ion
Dra
inag
e are
a
(sq
mi)
Max
imum
pre
vio
usl
y k
now
n
Per
iod
Yea
rG
age
hei
ght
(fee
t)
Dis
ch
arge
(cfs
)
Max
imu
m M
arc
h M
ay 1
965
Dat
eG
age
hei
ght
(fee
t)
Dis
char
ge
Cfs
Recur
re
nce
in
terv
al
(yea
rs)
Roc
k R
iver
bas
in
227
228
229
230
5-4465
5-4475
5-4480
9,52
0
958 62.5
1892-
1965
1939-65
1936-65
1 g 3 g_6 5
1948
1948
1965
1954
1 95
4
d!6
.23
14.46
d!6
.65
9 36
(i) 46,200
8,90
0
8,98
0Apr 29
Apr. 24
13 12
10.5
7
r!2
57
1 1 53
21,7
00
3,98
0
r!5
,600
2
el 52
Iow
a R
iver
bas
in
231
232
233
234
235
236
237
238
5-4
486
5-4
487
5-4
488
5-4
48
9
5-4
49
0
5-4
495
5-4
515
5-4
51
7
Iow
a.
Iow
a.
Eas
t B
ranch
Iow
a R
iver
nea
r G
arner
, Io
wa-
_
Gar
ner
, Io
wa.
Iow
a R
iver
at
Mar
shal
lto
wn
, lo
wa--
----
----
-
2.23
7.94
45.1
5.
98
133
429
1,56
4
118
19
53
-65
19
52
-65
19
52
-65
1
95
2-6
5
1 94
8-65
19
40
-65
1 90
2-03
, 19
14-2
7,
19
32
-65
1
94
7-6
51
94
9-6
5
1954
1954
1961
19
54
1954
1954
1918
1947
1950
7.15
13.0
1
12.8
1 6.
71
k!1
.2
14.8
8
17.7
4
16.8
15.7
7
209
4R
7
1,12
0 20
6
5,96
0
8,46
0
42
,00
0
(i) 4
Q4
D
Ap
r.
6 A
pr.
6
Ap
r.
6
Ap
r.
7A
pr.
6
A r
iT^
94
d7.
31
d!3
.67
d!2
.89
d
9.15
d!0
.67
d!4
.62
17.6
3
d!5
.07
250
370
1,00
0 17
0
4,0
90
6,7
00
17,4
00
31
QA
12 e1.
33
e1.
0512

MARCH MAY, UPPER MISSISSIPPI RIVER BASIN A137
CM CO CO
0 CO 0CM"
COOi
Oi
0 CO CO
int-m
0o t CM"
CO t>in c- * -
o
C-co
CM CO r-l Tf r-lOJ
ooooooCO O O O CO Oin Oi CO r-l O r-l
co" oi" t*J CD" * r-T
J -"tf< O O O rfCO LO .-H LO t
r-* CO rf CM -H
£>
,_,
COOi
inCM
rf
CM CO CO CM CM CM CMSH'
a
0inCO
_ . m |-(
CO CO CO
^f CMrH r-l
CO O rH COOi Oi
SH'
a
o0omCO
CO
Oir~l
-HH £
Oi CO
b h !"' ^ 5? &> *"' !"'<S ni a Q, cd nj a a<c <c ^ s < <
o o o o o o oCO O O O O CO OOi IT
__ -HH C
"H r-
CO O CM CO O
O CO LO LO Oco co r-
co **-*,Q
o oo,-1m
t- co co CM t- co co i r-it- m -*rH rH r-
Gi CO CO CO ^
c **-*bjD
t- CO O O O CM CM 1^ in co cocococomOiOiCO COOiOiOiCO
CO CO
SH'
a<OOiCO
,-1
COoOi
COinO3
CMmCO
t>mCD
(M
SH'
a
CD CM i
t~
CO
CDOi
CO CM
0 0 0 0
Oi rn"CM
CT
in CMCO Oi
t- CO
in ^0-1 CM
SH' SH"a a
o o0 0m mCO COr-l r-l ^
Oi rf Oi CO CO
Oi Oi Oir-l r-l r-l
O O *CO CD ^CO Oi Oi
in
0oco"
t-coCO
-a
r-l CO
O Oo mO CM
r-T CO"
* r-l 0-CO rH Cr
^ O
0 0 0 0 CM t
oi CD"
r-l
Ci
r-i CM co m-a -a
r-l CM t- CO CO t- C-
3^
o
CM
O r-lOi CO
r- t-r-l r-l
O 0CD inOi Oi
^ SH' SH' j
§ <; < S*" ^< -5
o o o o oCO O O O Om CM co cOi Oi O t>
CO
CO
CO0
r-l # t (U CO
o o o000 ~t* [^ ^co" co" rp"
r- r- coO CM O
CM *t in =
co i r-
IH' SH" S-"
< < <
O O Oo o oO CO O
co o inrH f
CO CO CO CO CO in CO CM CD t- C-
r-i in co o
CM r-H r-l rH r-lco CD co co inOi Oi Oi CO Oi
r-l in O
a M
r-l CO CC
Oi Oi CC
CMCO
oCD
OCO
-H
CO
SHa<;
o o0 0in oCO COCO r-H
COCM inCD CO
i r-Oi CO
mCO
CO |r-l CO
rH Ci
r-l
CO
Richland Creek near Haven, Iowa
CO
in
in
CO CO(M
inCO
1
Oi
,_,0CM
|
;i
Salt Creek near Elberon, Iowa...
CMm
in
oCM
in in in LO LO LO LOCOCOCD COCDCOCO t r\ill i i i i i Sx ir- oi IT co co r- CM o 0}
in m co in to .CO Oi Oi OiOiOiOiCO
Oi
o crt- cc
\',
I1
a
tD .-i
^ LO "^ CO T-HOi t-i c^j Oi c-[> .-i CM
CM CO CO
cd ' '
O i |
oT i [' ! ' i*r* \ cti
r-l
COCO
Walnut Creek near Hartwick, low Big Bear Creek at Ladora, Iowa- Iowa River at Marengo, lowa---- Coralville Reservoir near Corah Rapid Creek near Iowa City, IOWE Clear Creek near Coralville, low
Iowa River at Iowa City, Iowa__-
CM C--
*
in IT
CO CO "f ^ "5fLO LO LO LO LOrf rf -^f rf rji
i i I I im in in in m
r-i CM co ^ m co r-CM CM CM CM CM CM CM
mm ^CO "^_, (M
CO
,_,0
CO
ni
2
& U
ClJ9O
Is ^sOJ OJ SH U
c!oM
73K
0
m'HH
in
COifCM
inTCOCDCO
0CM
CO
-f?U
South Branch Ralston Creek at lo
Iowa.
0
in-HH
1
COIfCM
in incoco
o oi ^Oi Oi Oi
CO COf~ Oiin CM
if
!I\i1
English River at Kalona, lowa--- lowa River near Lone Tree, Iowa
m r-m min in ^ ^
1 1m in
O r-lin inCM CM
m ^CO r-l
1 1CO COm oOi Oi
inCM*3*
Cedar River near Austin, Minn.-
0
m-HH
in
CMmCM
in in in cc " o-" CM** in inCOCO COOCM-^COCD II II III
if co in c ^ o] in in
OiOi OiCOOiOiOiOi
* coin o ccO CO CCr-l
\!
;ni
a te
CO
CO
re
0
-a"
o
Cedar River at Charles City, low Little Cedar River near Ionia, lo Cedar River at Janesville, Iowa- West Fork Cedar River at Finchf
r~ o ITr- co ccin in IT^ *3* -^in in IT
COCOm-c
m
co * in co in m m inCM CM CM CM
in inCO CD i i £Oi Oi ^
O CO COO CM Tfco m r-
^
re ' ]0 i re ' ^-in
Shell Rock River near Northwooc Winnebago River at Mason City, Shell Rock River at Shell Rock, I
o in oOi CO CM
if * *1 1 1 in in in
r- co din in mCM CM CM
in inCO CO
1 1co inCO Ci
c-"H*
CO
\!
re
Beaver Creek at New Hartford, I
oCOCOIfin
oCOCM
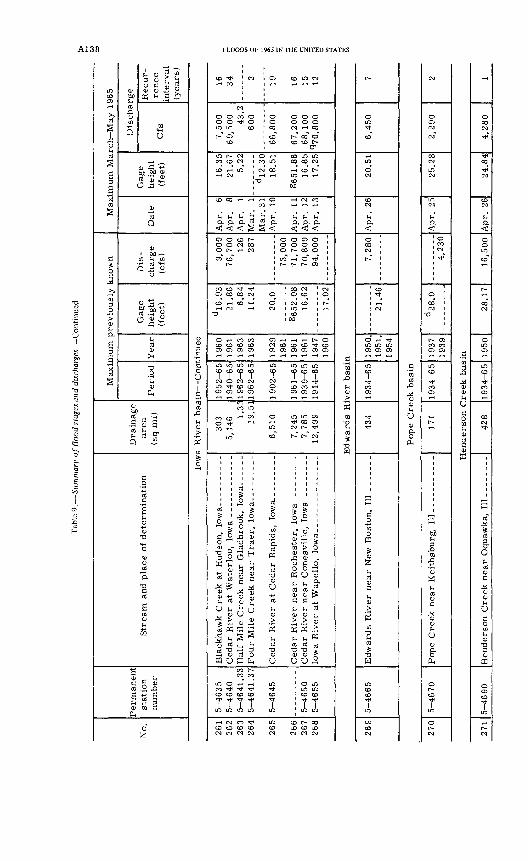
Tab
le 9
. Su
mm
ary
of f
lood s
tage
s an
d di
scha
rges
Conti
nued
No.
Per
man
ent
stat
ion
n
um
ber
Str
eam
and
pla
ce o
f d
eter
min
atio
nD
rain
age
are
a
(sq
mi)
Max
imu
m p
revio
usl
y k
now
n
Per
iod
Yea
rG
age
hei
ght
(fee
t)
Dis
ch
arg
e (c
fs)
Max
imum
Marc
h M
ay 1
965
Dat
eG
age
hei
gh
t (f
eet)
Dis
char
ge
Cfs
Rec
ur
re
nce
in
terv
al
(yea
rs)
Iow
a R
iver
basi
n C
onti
nued
261
262
263
264
265
266
267
268
5-4
63
55-4
640
5-4
64
1.3
3
5-4
641.3
7
5-4
64
5
5-4
650
5-4
65
5
Hal
f M
ile
Cre
ek n
ear
Gla
dbro
ok,
low
a--
----
Ced
ar R
iver
at
Ced
ar R
apid
s,
Iow
a_- --
----
-
Ced
ar R
iver
near
Roch
este
r,
Iow
a --
----
---
Ced
ar R
iver
near
Cones
vil
le,
Iow
a --
----
--
303
5,14
6 1.33
19
.51
6,5
10
7,24
5 7,
785
12,4
99
19
52
-65
19
40-6
5'
19
62
-65
19
62-6
5'
1902-6
5
19
61
-65
1939-6
5
19
14
-65
1960
19
61
1963
19
63
1929
19
61
1961
19
61
1947
19
60
d!6
.93
21.8
6 6.8
4
11.2
4
20.0
§652
. 08
16.6
2
17.0
2
9,00
0 76
,700
12
6 28
7
73,0
00
71
,70
0
70
,80
0
94,0
00
Ap
r.
6 A
pr.
8
Apr.
1
Mar
. 1
Mar
. 31
A
pr.
10
Apr.
11
A
pr.
12
A
pr.
13
16.3
5 21
.67
5.22
d!2
.30
18.5
1
§651
.86
16
.85
17.2
5
7,5
00
69
,50
0
43.2
60
0
66
,80
0
67
,20
0
68,1
00
q70,8
00
16
34
2 19 16
15
12
Edw
ards
Riv
er b
asin
269
5-4
665
Edw
ards
Riv
er n
ear
New
Bost
on,
111 --
----
-43
41934-6
519
50,
1951
, 19
5421
.46
7,28
0A
pr.
26
20.5
16,4
50
7
Pope
Cre
ek b
asin
270
5-4
670
171
19
34
-65
1937
19
39d
28.0
4,23
0A
pr.
25
25.2
82,2
90
2
Hen
der
son
Cre
ek b
asin
271
5-4
690
Hen
der
son C
reek
near
Oqu
awka
, 11
1 --
----
--42
81934-6
519
5028
.17
16,5
00A
pr.
26
24.8
44,2
80
1
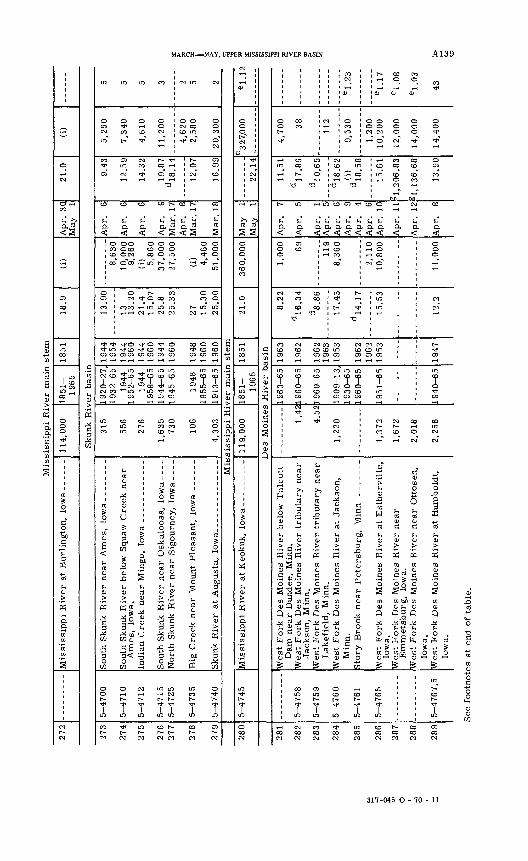
Mis
siss
ippi
Riv
er m
ain
ste
m
272
114,
000
1851-
1965
1851
189
(i)
Ap
r.
3QM
ay
191
n
(i)
Sku
nk R
iver
bas
in
273
274
275
276
277
278
279
280
281
282
283
284
285
286
287
288
289
5-4
700
5-4
71
0
5-47
12
5-4
71
5
5-4
72
5
5-4
73
5
5-4
740
Sou
th S
kunk
Riv
er n
ear
Am
es,
Iow
a--
----
_-
Sou
th S
kunk
Riv
er b
elow
Squ
aw C
reek
near
Am
es,
Iow
a.
Sou
th S
kunk
Riv
er n
ear
Osk
aloosa
, Io
wa
Nort
h S
kunk
Riv
er n
ear
Sig
ourn
ey,
Iow
a--
_-
Sku
nk R
iver
at
August
a, I
owa
----
- -_
--_
315
556
276
1,63
5 73
0
106
4,30
3
19
20
-27
, 1
93
2-6
519
44
1952
-65
1944
1
95
8-6
5
19
44
-65
1
94
5-6
5
1948
1
95
5-6
5
1913
-65
1944
19
5419
44
1960
1944
19
60
1944
19
60
1948
19
60
1960
13.9
0
13
13.2
021.4
15
.07
25.8
2
5.3
3
27
15.3
0
25
.00
8,6
30
10,0
00
9,26
0(i
) 5,8
60
37,0
00
27
,50
0
(i) 4,4
60
51
,00
0
Ap
r.
6
Ap
r.
6
Apr.
6
Ap
r.
9 M
ar.
17
Apr.
8
Mar
. 17
Mar
. 18
9.43
12.5
9
14.3
2
19.8
7 d
!8.1
4
12.0
7
16.9
9
5,2
60
7,3
40
4,6
10
11,2
00
4,6
20
2,5
80
20
,30
0
5 5 5 3 2 5 2M
issi
ssip
pi
Riv
er m
ain
ste
m
5-4
74
511
9,00
01
85
1-
1965
1851
21.0
360,0
00
May
1
May
1
22.1
4C
3 27
,000
el.
!2
Des
Moin
es R
iver
bas
in
5-4
75
8
5-4
759
5-4
760
5-47
61
5-4
76
5
5-4
767
.5
Wes
t F
ork
Des
Mo
ines
Riv
er b
elow
Tal
cott
D
am n
ear
Dundee
, M
inn.
W
est
Fork
Des
Mo
ines
Riv
er t
ributa
ry n
ear
Jack
son,
Min
n.
Wes
t F
ork
Des
Moin
es R
iver
tri
bu
tary
near
Lak
efie
ld,
Min
n.
Wes
t F
ork
Des
Moin
es R
iver
at
Jack
son,
Min
n.
Wes
t F
ork
Des
Mo
ines
Riv
er a
t E
sth
erv
ille
, Io
wa.
W
est
Fork
Des
Moin
es R
iver
near
Em
met
sbu
rg,
Iow
a.W
est
Fork
Des
Moin
es R
iver
near
Ott
ose
n,
Iow
a.
Wes
t F
ork
Des
Moin
es R
iver
at
Hum
bold
t,
Iow
a.
1.42
4.52
1,22
0
1,37
2
1,67
2
2,01
8
2,25
6
1963
-65
L96
0-65
19
60
-65
1909
-13,
19
30-6
5 19
60-6
5
1951
-65
1940
-65
1963
1962
1962
19
63
1953
1962
19
62
1953
1947
8.2
2
d!6
.34
d8.8
6
17.4
3
d!4
.17
15.5
3
12.2
1,00
0 69 119
8,3
60
2,1
10
10
,800
11,0
00
Ap
r.
7
Ap
r.
5
Ap
r.
1 A
pr.
5
Ap
r.
6 A
pr.
9
Apr.
4
Ap
r.
6 A
pr.
10
Ap
r.
11
Ap
r.
12
Ap
r.
8
11.5
1
d!7
.86
d!0
.65
d!8
.62
,<i>
18
.58
15.6
1
'1,2
06
.83
'1,1
36.6
8
13.9
0
4,7
00
38 112
9,53
0
1,20
010
,200
12,0
00
14,0
00
14,4
00
e1.
23
el.
!7
e1.
08
e1.
03
43
See
fo
otn
ote
s at
end
of
table
.

Tab
le 9
. -S
umm
arv
of f
lood s
tage
s an
d d
isch
arg
es C
onti
nued
No
.P
erm
an
en
t st
ati
on
num
ber
29
0
291
292
293
29
4
29
5
296
297
298
299
30
0
301
30
2
30
3
5-4
78
0
5-4
79
0
5-4
800
5-4
80
5
5-4
81
0
5-4
815
5-4
81
6.5
5-4
82
1.7
5-4
823
5-4
825
5-4
83
0
5-4
836
5-4
84
0
Str
eam
an
d p
lace o
f dete
rmin
ati
on
Dra
inage
are
a
(sq m
i)
Max
imu
m p
rev
iou
sly
know
n
Peri
od
Year
Gag
e heig
ht
(fee
t)
Dis
charg
e
(cfs
)
Max
imu
m M
arc
h M
ay
1965
Dat
eG
age
heig
ht
(fee
t)
Dis
charg
e
Cfs
Recu
r
ren
ce
inte
rval
(years
)
Des
Mo
ines
Riv
er
basi
n C
on
tin
ued
East
Fo
rk D
es M
oin
es R
iver
near
Burt
, Io
wa.
E
ast
Fork
Des
Moin
es R
iver
at A
lgona,
Io
wa.
E
ast
Fo
rk D
es M
oin
es R
iver
at D
akota
Cit
y,
Iow
a.
Liz
ard
C
reek n
ear
Cla
re,
Iow
a_
----
_ -
------
Des
M
oin
es R
iver
near
Boone,
Io
wa-
--------
Des
M
oin
es R
iver
near
Saylo
rvil
le,
Iow
a--
_-
Big
Cedar
Cre
ek
near
Vari
na,
Iow
a--
-------
Nort
h R
acco
on R
iver
near
Sac
C
ity,
low
a--
--
Nort
h R
acco
on R
iver
near
Jeff
ers
on,
low
a.-
-
East
Fork
Hard
in C
reek n
ear
Ch
urd
an,
Iow
a.
Mid
dle
Rac
coon R
iver
at
Pan
ora
, Io
wa
------
462
88
2
1,3
08
25
7
4,1
90
84
4
5,5
11
5
,84
1 80.0
713
1,6
19 24.0
44
0
988
19
51
-65
19
40
-65
19
40
-65
1905-0
6,
1913-2
7,
19
46
-65
1896-
1965
1
92
0-6
5
1893-
1965
1
95
9-6
5
19
58
-65
1
94
0-6
5
19
52
-65
1953
1
95
8-6
5
19
40
-65
1954
1954
1947
1947
19
54
1918
19
54
19
54
1962
19
62
1962
19
47
1960
1953
19
58
19
58
12
.67
24
.02
16.0
19
.62
19.1
25
.35
24.5
d!4
.49
18
.12
22.3
8.9
2
14.3
1
1.8
7
29.0
4
3,8
70
17,4
00
10,0
00
35,4
00
21,5
00
57,4
00
60
,00
0
2,0
80
10,8
00
29,1
00
413
14,0
00
9,1
50
35,0
00
Ap
r..
6
Apr.
9
Apr.
9
Apr.
4
Apr.
7
Apr.
8
Apr.
6
Apr.
9
Apr.
10
Apr.
6
Apr.
8
Apr.
6
Apr.
4
Apr.
5
Mar.
31
Mar.
31
Mar.
2
Mar.
17
Mar.
17
d!4
.21
gl,
11
8.7
8
23
.13
d!1
.61
17
.79
15
.91
22
.89
2
4.0
2
d!5
.05
15
.59
1
5.5
9
d8.2
8
d!1
.54
19
.60
5,0
00
11,4
00
15
,70
0
4,6
70
35
,60
0
15,2
00
51
,60
0
47
,40
0
1,0
60
6,9
60
9,8
90
30
0
6,8
90
15,8
00
50
50
e1
.03
6 17 21 37
23
2 4 3 1 6 18
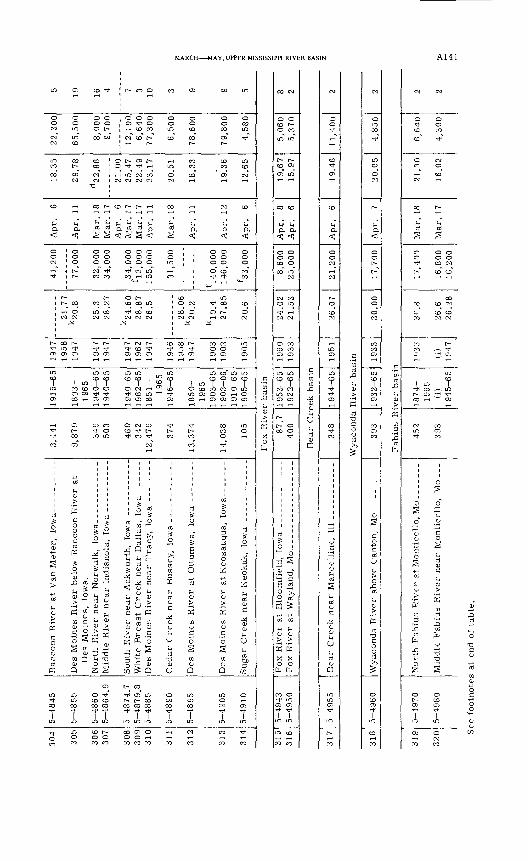
rfAY, UPPER MISSISSIPPI RIVER BASIN A141
m
o oCOCM"CM
mCO
00
CD
O,
OoCM
p-
£
* m03 O)
1915-65
co"
Raccoon River at Van Meter, Iowa
00
Tm
CO
2
o o inm"CO
00
c»CM
^
a
0 OoP-" p-
cooCM
m
1 "5 CO CO CO C73 CO i-H
00
Des Moines River below Raccoon River at
Des Moines, Iowa.
in in00
f inmCO
CO ^
0 0 0 0 0 p-oo" c»"
CD 00
CM a
00 P-
CO COs §0 0 0 0 0 0
CXl" Tj?
CO CO
I CO CXl
m ooCM CXl
CD CJ3
1940-65 1940-65
CD CO ^ oco in
North River near Norwalk, lowa------------ Middle River near Indianola, Iowa ----------
CD o ^'CO CO 00 00
in inCD p-
CO CO
-
o oCM"
O P-o -*f,-H mCM CM
CD P-
a rt
o o o"^"CO
oCO
CXl
a>
1940-65
oCO
South River near Ackworth, Iowa -----------
P-
P- co
1in
00
CO
CO
0
CDCD"
53
r-
ni
o00
^H
P-
00
00
CO03
1962-65
CO
White Breast Creek near Dallas, Iowa ------
CO
00
m
CO
0
0 0 COP-"
o
co
*
a
o0 0in" m
mCO
m
m
m "-1CO
5
Des Moines River near Tracy, Iowa --------
inCO CO
1in0
CO
CO
o o mCO
m0
00
nfs0o in
CO
COo00
^ in03 03
1946-65
p-co
Cedar Creek near Bussey, Iowa-- -------
o00
in -!
CO
0>
0 0 COoo"
CO
00
^
a
CM
0
^
ro
1850-
p-coco"
Des Moines River at Ottumwa, lowa --------
mCO
in!M
CO
CJ3
O O 00
CO
o>
CXl
a
o o o o o oO CO
m^ 00
rH CM
0 0 O3 CO
1965 1903-65 1903-06,
CO CO 0
Des Moines River at Keosauqua, Iowa. -- -
m0CO
mCO
CO
m
o00m
mCD
CM
CO
a
0o oco"CO
CO
0
0
1910-65 1905-65
m o
Sugar Creek near Keokuk, Iowa -- - -
o03
TmTt<CO
C(0a
0)
2
ofa
00 CM
0 0 CO P- O COm" in"
O p-CO CJ)
03 m
00 CD
a a
0 0o oCO Ooo" m"
CM COo m
« «
O CO CD COCD CD
1953-65 1922-65
P-" 0 00 O
Fox River at Bloomfield, Iowa
Fox River at Wayland, Mo._- ___ -. __
CO O ^ inCD 03i' i'm m
in coCO CO
cv
c cccc
c
cv
CC
ctscc
-
cocCO
COc
-f CDr> coCO 1-1
CVm
!
oo"
o
at Mon
<L£
en 3
rt fa s1.t. o
o
03
CO
CM
O O
^
CM0
CO
o
n)
0 0o oCO CM
CD CD
00 CD CM
CO CO CM CM
i "* '
(i) 1945-65
CO
O §
0
cu o
c o
" near
0
2CO3
nifaCJ
a
ioCO
in
oCM CO
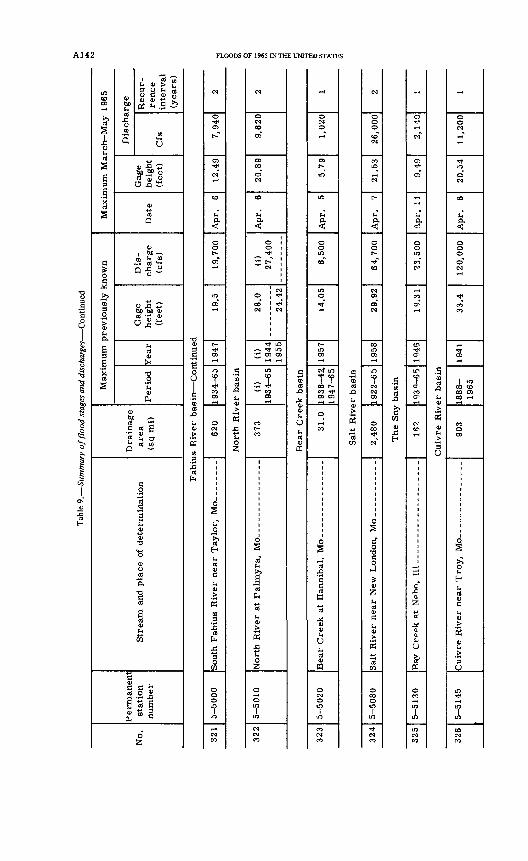
Tab
le 9
. Su
mm
ary
off
load s
tage
s an
d dis
charg
es C
ontin
ued
No.
Perm
anent
stat
ion
num
ber
Str
eam
and
pla
ce o
f det
erm
inat
ion
Dra
inag
e are
a
(sq m
i)
Max
imu
m p
revio
usl
y k
now
n
Peri
od
Yea
rG
age
hei
ght
(fee
t)
Dis
ch
arg
e (c
fs)
Max
imu
m M
arc
h M
ay 1
965
Dat
eG
age
hei
gh
t (f
eet)
Dis
charg
e
Cfs
Recur
re
nce
inte
rval
(yea
rs)
Fab
ius
Riv
er b
asi
n C
on
tin
ued
321
5-5
00
062
01
93
4-6
519
4719
.519
,700
Ap
r.
612
.49
7,9
40
2
Nort
h R
iver
bas
in
322
5-5
01
037
3(i
) 1
93
4-6
5(i
) 19
44
1955
28.0
24.4
2
(i)
27
,40
0A
pr.
6
20.8
99,6
20
2
Bea
r C
reek
bas
in
323
5-5
02
031.0
1938
-42,
1
94
7-6
519
5714
.05
6,5
00
Ap
r.
55.7
91,
020
1
Sal
t R
iver
basi
n
324
5-5
080
325
5-5
13
0R
av C
rppk a
t N
^ho,
Il
l __
____
____
____
____
__
2,4
80
19
22
-65
The
Sny
bas
in
183
193Q
-S5
1958
29.9
264,7
00
Apr.
7
21.5
32
6,0
00
2
1945
19.3
12
3,5
00
Apr
. 11
9.19
2,1
10
1
Cuiv
re R
iver
bas
in
326
5-5
145
903
18
88
- 19
6519
4133.4
120,0
00
Ap
r.
620
.54
11
,20
01
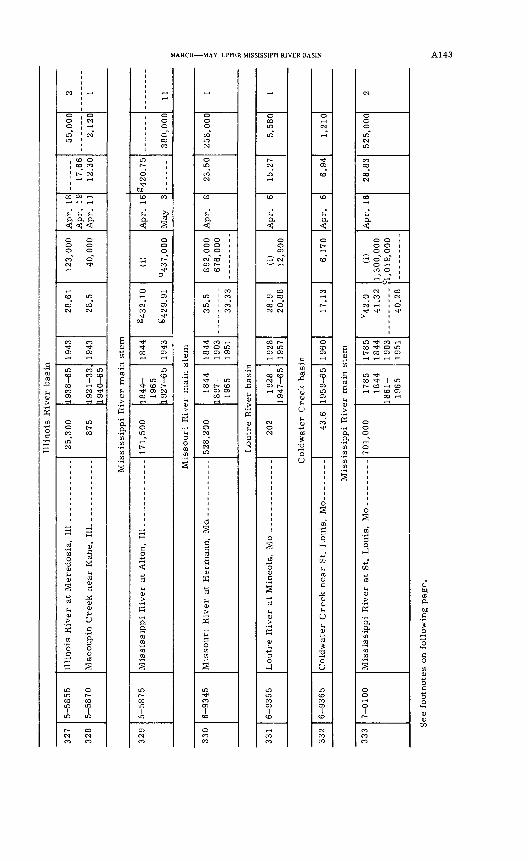
Illi
no
is R
iver
bas
in
327
328
5-5
855
5-5
870
25,3
00
875
19
38
-65
19
21
-33
, 1
94
0-6
5
1943
1943
28.6
1
28.5
123,
000
40,0
00
Ap
r.
18
Ap
r.
19
Ap
r.
11
Mis
siss
ippi
Riv
er m
ain s
tem
329
5-5
875
171,
500
1844-
1965
1
92
7-6
5
1844
1943
g432.1
0
g42
9.91
(i)
U43
7,00
0
Ap
r.
16
May
3
17.6
6 12
.30
55,0
00
2,1
20
2 1
g42
0.75
Mis
souri
Riv
er m
ain
ste
m
330
6-9
345
528,2
00
1844
1
89
7-
1965
1844
19
03
1951
35.5
33.3
3
892,
000
676,
000
Ap
r.
82
3.5
0
380,0
00
11
258,0
00
1
Loutr
e R
iver
bas
in
331
6-9
355
202
1928
1
94
7-6
519
28
1957
28.9
20
.88
(i)
12,9
00A
pr.
6
15.2
75,5
80
1
Cold
wat
er C
reek
bas
in
332
6-9
365
43.6
19
59
-65
1960
17.1
36
,17
0A
pr.
6
6.9
41,2
10
Mis
siss
ippi
Riv
er m
ain s
tem
333
7-0
100
1785
1844
1
86
1-
1965
1785
1844
19
0319
51
V42.0
41.3
2
40.2
8
(i)
1,3
00,0
00
28.8
32
See
fo
otn
ote
s on
foll
ow
ing p
age.
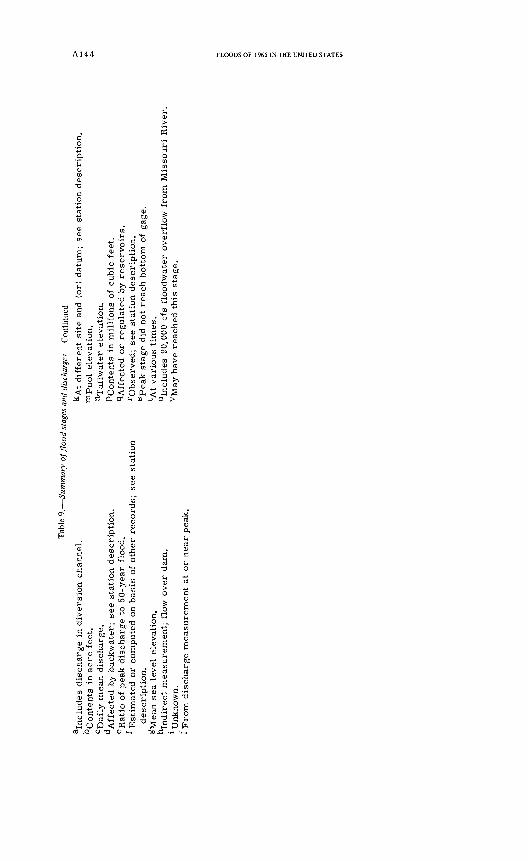
Tab
le 9
. Su
mm
ary
off
load s
tage
s an
d di
scha
rges
Co
nti
nu
ed
Incl
udes
dis
char
ge
in d
iver
sion c
han
nel
.C
onte
nts
in a
cre
fee
t.
cD
aily
mea
n d
isch
arg
e.A
ffec
ted b
y b
ack
wat
er;
see
stat
ion d
escr
ipti
on.
eR
atio
of
pea
k d
isch
arg
e to
50-y
ear
flood.
Est
imat
ed o
r co
mp
ute
d o
n b
asi
s of
oth
er r
ecord
s; se
e st
atio
ndesc
ripti
on.
&M
ean
sea
lev
el e
levat
ion.
Indir
ect
mea
sure
men
t; f
low
over
dam
. 1 U
nkno
wn.
I F
rom
dis
char
ge
mea
sure
men
t at
or
near
pea
k.
^At
dif
fere
nt
site
and
(or)
dat
um
; se
e st
atio
n d
escr
ipti
on.
mP
ool
elev
atio
n.
nT
ailw
ater
ele
vat
ion
.P
Conte
nts
in m
illi
ons
of c
ubic
fee
t.^A
ffec
ted
or
regula
ted b
y re
serv
oir
s.rO
bse
rved
; se
e st
atio
n d
esc
rip
tio
n.
sPea
k s
tage
did
not
reach b
ott
om
of
gag
e.*A
t var
ious
tim
es.
uln
clu
des
90
,000
cfs
flo
odw
ater
over
flow
fro
m M
isso
uri
Riv
er.
vM
ay h
ave
reac
hed
this
sta
ge.
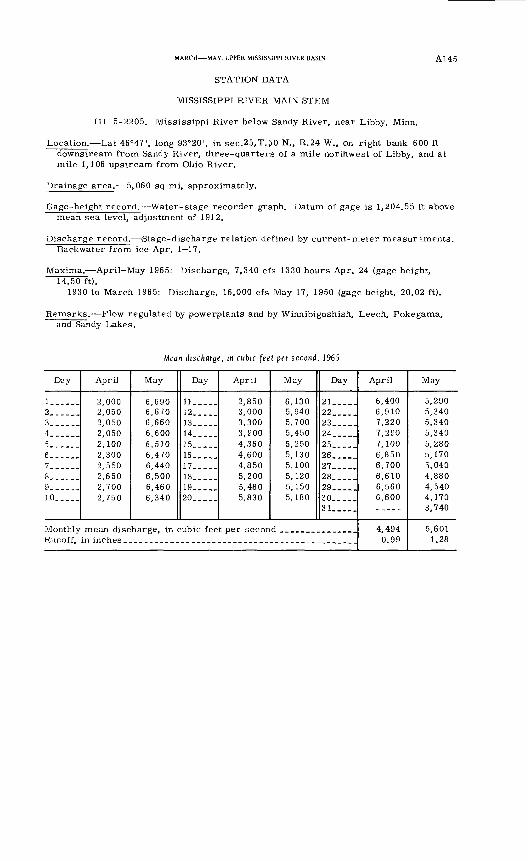
MARCH MAY, UPPER MISSISSIPPI RIVER BASIN A14 5
STATION DATA
MISSISSIPPI RIVER MAIN STEM
(1) 5-2205. Mississippi River below Sandy River, near Libby, Minn.
Location. Lat 46°47', long 93°20', in sec.25.T.50 N., R.24 W., on right bank 600 ft downstream from Sandy River, three-quarters of a mile northwest of Libby, and at mile 1,106 upstream from Ohio River.
Drainage area. 5,060 sq mi, approximately.
Gage-height record. Water-stage recorder graph. Datum of gage is 1,204.55 ft above mean sea level, adjustment of 1912.
Discharge record. Stage-discharge relation defined by current-meter measurements. Backwater from ice Apr. 1 17.
Maxima.- April-May 1965: Discharge, 7,340 cfs 1330 hours Apr. 24 (gage height, 14.50 ft).
1930 to March 1965: Discharge, 16,000 cfs May 17, 1950 (gage height, 20.02 ft).
Remarks. Flow regulated by powerplants and by Winnibigoshish, Leech, Pokegama, and Sandy Lakes.
Mean discharge, in cubic feet per second, J965
Day
I......2......3. _.4......T...-6... ...7____8......9------10.....
Monthly Runoff,
April
2,000 2,050 2,050 2,050 2,100 2,300 2,550 2,650 2,700 2,750
May
6,690 6,670 6,660 6,600 6,510 6,470 6,440 6,500 6,460 6,340
Day
ll._...12.....13.....14.....15.....16.....17.....18_____19.....20..-..
April
2,850 3,000 3,300 3,900 4,360 4,600 4,850 5,200 5,480 5,830
May
6,130 5,940 5,700 5,450 5,250 5,130 5,100 5,120 5,150 5,180
Day
21.....22.. ...23_____24.. ...25.. ...26.. ...27.. ...28.. ...29-. ...30.....31.. ...
mean discharge, in cubic feet per second _______________
April
6,400 6,910 7,220 7,290 7,100 6,850 6,700 6,610 6,560 6,600
4,494 0.99
May
5,290 5,340 5,340 5,340 5,280 5,170 5,040 4,880 4,540 4,170 3,740
5,601 1.28
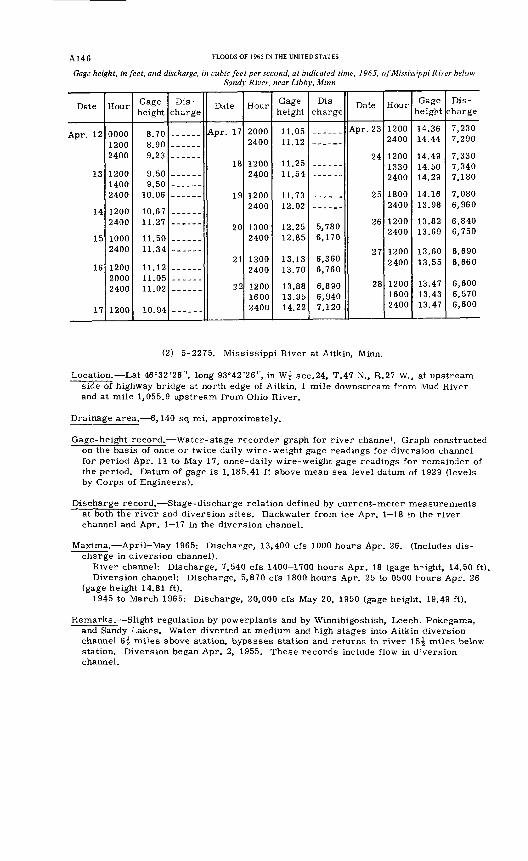
A146 FLOODS OF 1965 IN THE UNITED STATES
Gage height, in feet, and discharge, in cubic feet per second, at indicated time, 1965, of Mississippi River belovSandy River, near Libby, Minn.
Date
13
14
15
16
17
Hour
0000
2400
120014002400
12002400
10002400
120020002400
1200
Gage height
8 7nS on9.23
9.509 50
10.06
10.67U 97
11.5011 34
11.1211.0511.02
10.94
Dis charge
Date
Apr. 17
1 D
1 Q
20
21
22
Hour
20002400
1200
12002400
1300 2400
13002400
12001600 2400
Gage height
11.0511.12
11 251 1 54
1 1 731 9 O9
12.25 12.85
13.13
13.8813.95 14.22
Dis
charge
5,780 6,170
6,360 67R n
6,8906,940 7,120
Date
Apr. 23
24
25
26
27
28
Hour
12002400
120013302400
18002400
12002400
1200 2400
12001600 2400
Gage height
14.3614.44
14.4914.5014.29
14.1613.98
13.8213.69
13.55
13.4713.43 13.47
Dis
charge
7,2307,290
7 3307,340
, loll
7,0806,960
6,8406,750
6,660
6,6006,570 6,600
(2) 5-2275. Mississippi River at Aitkin, Minn.
Location. Lat 46°32'26", long 93°42'26", in Wf sec.24, T.47 N., R.27 W., at upstream side of highway bridge at north edge of Aitkin, 1 mile downstream from Mud River and at mile 1,055.9 upstream from Ohio River.
Drainage area. 6,140 sq mi, approximately.
Gage-height record. Water-stage recorder graph for river channel. Graph constructed on the basis of once or twice daily wire-weight gage readings for diversion channel for period Apr. 11 to May 17, once-daily wire-weight gage readings for remainder of the period. Datum of gage is 1,185.41 ft above mean sea level datum of 1929 (levels by Corps of Engineers).
Discharge record. Stage-discharge relation defined by current-meter measurements at both the river and diversion sites. Backwater from ice Apr. 1 18 in the river channel and Apr. 1 17 in the diversion channel.
Maxima. April-May 1965: Discharge, 13,400 cfs 1000 hours Apr. 26. (Includes dis charge in diversion channel).
River channel: Discharge, 7,540 cfs 1400-1700 hours Apr. 18 (gage h?ight, 14.50 ft).Diversion channel: Discharge, 5,870 cfs 1800 hours Apr. 25 to 0500 hours Apr. 26
(gage height 14.81 ft).1945 to March 1965: Discharge, 20,000 cfs May 20, 1950 (gage height, 19.49 ft).
Remarks.- Slight regulation by powerplants and by Winnibigoshish, Leech, Pokegama, and Sandy Lakes. Water diverted at medium and high stages into Aitkin diversion channel 6^ miles above station, bypasses station and returns to river 15^ miles below station. Diversion began Apr. 2, 1955. These records include flow in d :version channel.
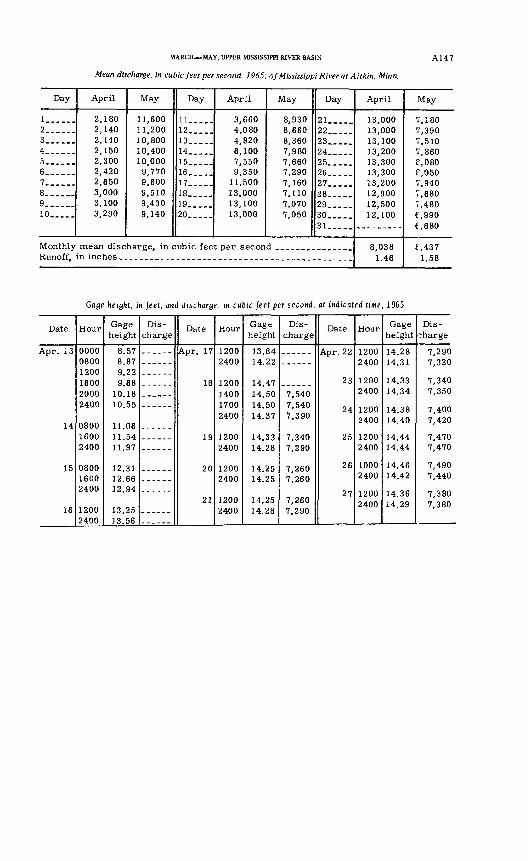
MARCH MAY, UPPER MISSISSIPPI RIVER BASIN
Mean discharge, in cubic feet per second, 1965, of Mississippi River at Aitkin, Minn.
A147
Day
1 __ ...2. _____3 ___ .4. _____5 ______6 ______7 ______8_ _____9 ______10 __ .
Monthly Runoff,
April
2,180 2,140 2,140 2,150 2,300 2,420 2,650 3,000 3,100 3,290
May
11,600 11,200 10,800 10,400 10,000 9,770 9,600 9,510 9,430 9,140
Day
11 __ .12.13____.14. ___15 __ __16 ___ .17 _____18__ ...19-____20._ ___
April
3,660 4,080 4,820 6,100 7,550 9,350
11,500 13,000 13,100 13,000
mean discharge, in cubic feet per secon in inches ---__ _______
May
8,930 8,660 8,360 7,980 7,660 7,290 7,160 7,110 7,070 7,050
Day
21 _____22 _____23 _____24 _____25. ____26 __ _.97
28 __ _.29 __ __9n31 _____
d _________ _.
April
13,000 13,000 13,100 13,200 13,300 13,300 13,200 12,900 12,500 12,100
8,038 1.46
May
7,180 7,390 7,510 7,860 P.080r.oso7,940 7,680 7,480 6,990 6,680
8,437 1.58
Gage height, in feet, and discharge, in cubic feet per second, at indicated time, 1965
Date
Apr. 13
14
15
16
Hour
000008001200160020002400
080016002400
080016002400
12002400
Gage height
8.578.879.229.68
10.1810.55
11.06U *\A.
U Q7
12.3112.661 9 Q_l
1 ^ 9"^
13.56
Dis
chargeDate
Apr. 17
18
19
20
21
Hour
12002400
1200140017002400
12002400
12002400
1200 2400
Gage height
13.841 A. 99
14.4714.5014.5014.37
1 _, 39
14.28
14 251 .1 9"^
14.25 14.28
Dis
charge
7,5407,5407,390
7 3407 9QO
7,260
7,260 7 290
Date
Apr. 22
23
24
9^
26
27
Hour
12002400
12002400
1200 2400
12002400
10002400
1200 2400
Gage height
14.2814 31
14.3314.34
14.38 14.40
14.44
14.4614.42
14.36 14.29
Dis
charge
7 9Qfl
7 99fl
7,3407,350
7,400 7,420
7,4707,470
7,4907,440
7,380 7,380
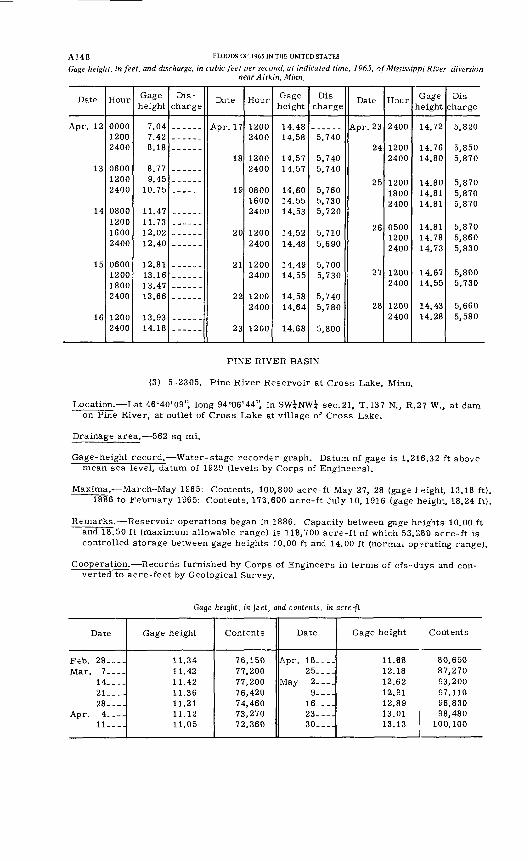
A148Gage height, in feet, and discharge, in
FLOODS OF 1965 IN THE UNITED STATES
cubic feet per second, at indicated time, 1965, of Mississippi River diversion near Ait kin, Minn.
Date
Apr. 12
13
14
15
16
Hour
000012002400
0600
2400
080012001600
18002400
2400
Gage height
7.047.428.18
8.779.45
10.75
11.47117312.0212.40
12.8113.161 3 A7
13.66
13.9314.18
Dis
chargeDate
Apr. 17
18
19
9n
21
22
00
Hour
12002400
1200 2400
1600 2400
1200
2400
Gage height
14.4814.58
14.57 14.57
14.551 A RQ
1 A. R9
14.48
1 A. A.Q
14 55
14.5814.64
14.68
Dis
charge
5,740
5,740 5,740
5,7305 79fi
5,7105,690
5,7005,730
5,7405,780
5,800
Date
Apr. 23
?A
25
26
27
28
Hour
2400
12002400
1200
2400
050012002400
12002400
1200 2400
Gage height
1 A. 79
14.7614.80
14.8014.81 14.81
14.8114.7814.73
14.6714.55
14.43 14.28
Dis
charge
5,820
5,870
5,870 5,870
5,8705,8605,830
5,8005,730
5,660 5,580
PINE RIVER BASIN
(3) 5-2305. Pine River Reservoir at Cross Lake, Minn.
Location. Lat 46°40'09" long 94°06'44" in SW^NWi sec.21, T. 137 N., R.27 W., at dam on Pine River, at outlet of Cross Lake at village of Cross Lake.
Drainage area. 562 sq mi.
Gage-height record. Water-stage recorder graph. Datum of gage is 1,216.32 ft above mean sea level, datum of 1929 (levels by Corps of Engineers).
Maxima. March-May 1965: Contents, 100,800 acre-ft May 27, 28 (gage height, 13.18 ft). 1886 to February 1965: Contents, 173,600 acre-ft July 10, 1916 (gage height, 18.24 ft).
Remarks. Reservoir operations began in 1886. Capacity between gage heights 10.00 ft and 18.50 ft (maximum allowable range) is 118,700 acre-ft of which 53,280 acre-ft is controlled storage between gage heights 10.00 ft and 14.00 ft (normal operating range).
Cooperation. Records furnished by Corps of Engineers in terms of cfs-days and con verted to acre-feet by Geological Survey.
Gage height, in feet, and contents, in acre-ft
Date
Feb. 28.---Mar. 7-._-
14-.--21-.--28----
Apr. 4----11.---
Gage height
11.3411.4211.4211.3611.2111.1211.05
Contents
76,15077,20077,20076,42074,46073,27072,360
Date
Apr. 18--.-25...-
May 2-._.9----
16--.-23----30 _
Gage height
11.6812.1812.6212.9112.8913.0113.13
Contents
80,65087,27093,20097,11096,83098,480
100,100
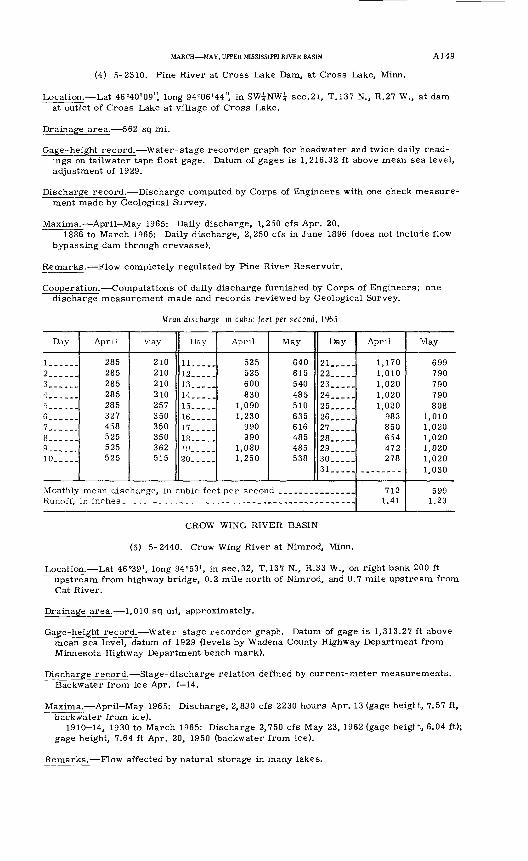
MARCH MAY, UPPER MISSISSIPPI RIVER BASIN
(4) 5-2310. Pine River at Cross Lake Dam, at Cross Lake, Minn.
A149
Location. Lat 46°40'09", long 94°06'44", in SW^NW? sec.21, T.137 N., R.27 W., at dam at outlet of Cross Lake at village of Cross Lake.
Drainage area. 562 sq mi.
Gage-height record. Water-stage recorder graph for headwater and twice daily read ings on tailwater tape float gage. Datum of gages is 1,216.32 ft above mean sea level, adjustment of 1929.
Discharge record. Discharge computed by Corps of Engineers with one check measure ment made by Geological Survey.
Maxima. April-May 1965: Daily discharge, 1,250 cfs Apr. 20.1886 to March 1965: Daily discharge, 2,250 cfs in June 1896 (does not include flow
bypassing dam through crevasse).
Remarks. Flow completely regulated by Pine River Reservoir.
Cooperation. Computations of daily discharge furnished by Corps of Engineers; one discharge measurement made and records reviewed by Geological Survey.
Mean discharge, m cubic feet per second, 1965
Day
!-_._. .2......3______4... ..
6___ ..7......8......9__.10_____
Monthly Runoff,
April
285 285 285 285 285 327 458 525 525 525
May
210 210 210 210 257 350 350 350 362 515
Day
11----.12.....13.-...14,--..15-..,-16,-. _.17--._.18..-..19.---.20-,--.
April
525 525 600 830
1,090 1,230
990 990
1,080 1,250
May
640 615 540 485 510 635 616 485 485 538
Day
21.....22.....23.....24_.__.25.....26__...27.....28 ..._.29.....30.....31.....
mean discharge, in cubic feet per second _______________
April
1,170 1,010 1,020 1,020 1,020
983 850 654 472 278
712 1.41
May
699 790 790 790 808
1,010 1,020 1,020 1,020 1,020 1,030
599 1.23
CROW WING RIVER BASIN
(5) 5-2440. Crow Wing River at Nimrod, Minn.
Location. Lat 46°39', long 94°53', in sec.32, T.137 N., R.33 W., on right bank 200 ft upstream from highway bridge, 0.2 mile north of Nimrod, and 0.7 mile upstream from Cat River.
Drainage area. 1,010 sq mi, approximately.
Gage-height record. Water-stage recorder graph. Datum of gage is 1,313.27 ft above mean sea level, datum of 1929 (levels by Wadena County Highway Department from Minnesota Highway Department bench mark).
Discharge record. Stage-discharge relation defined by current-meter measurements. Backwater from ice Apr. 1 14.
Maxima. April-May 1965: Discharge, 2,890 cfs 2230 hours Apr. 13 (gage heiglt, 7.57 ft, backwater from ice).
1910-14, 1930 to March 1965: Discharge 2,750 cfs May 23, 1962 (gage heigl *., 6.04 ft); gage height, 7.64 ft Apr. 20, 1950 (backwater from ice).
Remarks. Flow affected by natural storage in many lakes.
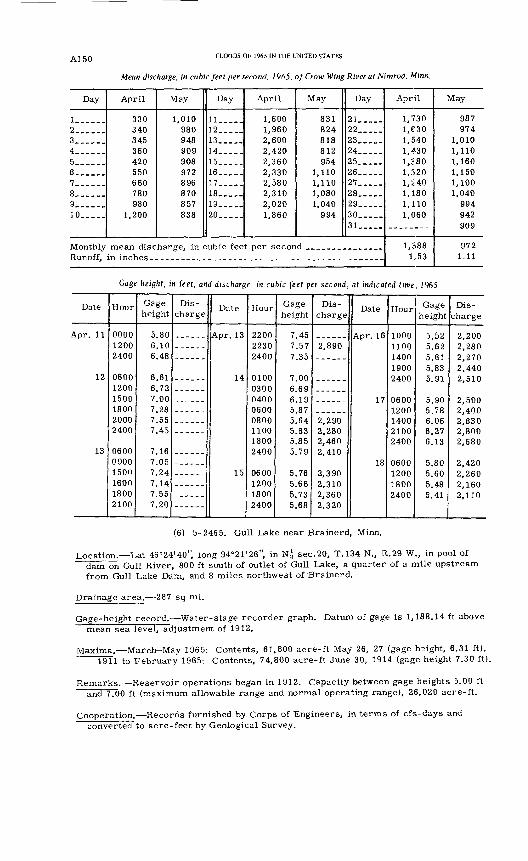
A150 FLOODS OF 1965 IN THE UNITED STATES
Mean discharge, in cubic feet per second, 1965, of Crow Wing River at Nimrod, Minn.
Day
1... __2... __3... __
5 _____6 _____7,_ _8 ____9 ___ ._10 ___
Monthly Runoff,
April
330 340 345 360 420 550 660 780 980
1,200
May
1,010 980 948 909 908 972 896 870 857 838
Day
11. _ __12.._._13 __ ..14____.15.....16..._.17...,.18 .....19-....20.. ...
April
1,600 1,960 2,600 2,420 2,360 2,330 2,580 2,310 2,020 1,860
mean discharge, in cubic feet per secon in inches
May
831 824 818 812 954
1,110 1,110 1,080 1,040
994
Day
21 _____22 __ _.23 _____24 __ _.25. ....26 _..__27 _____28 .....29.....30 _____31 __ __
d _________ ...
April
1,730i.eso1,540 1,430 1.J80 1,320 1,240 1,180 1,110 1,060
1,388 1.53
May
987 974
1,010 1,110 1,160 1,150 1,100 1,040
994 942 909
972 1.11
Gage height, in feet, and discharge, in cubic feet per second, at indicated time, 1965
Date
Apr. 11
12
13
Hour
000012002400
060012001500180020002400
060009001500160018002100
Gage height
5.806.106.48
6.616.727.007.287.557.45
7.167.057.247.147.557.20
Dis charge
Date
Apr. 13
14
15
Hour
220022302400
0100
0600080011001800 2400
0600120018002400
Gage height
7.457 577 o c
7.006.696 1 Q
5.875 645.635.855 7Q
5 r?C
5.665 73
Dis charge
2 flan
2 9 on2,2802,460 2,410
2 0 Qfl
2 0 1 n
2 320*
Date
Apr. 16
17
1 Q
Hour
1000110014001900 2400
06001200140021002400
0600120018002400
Gage height
^ ^9
5.83^ Q1
5 905.78
6.276.13
5 on
5 48R A.1
Dis charge
2 2002 onn2 2702,440 2,510
2,5002,4002 c Q n
2 onn
2,680
2 r\ c (\
2,110
(6) 5-2465. Gull Lake near Brainerd, Minn.
Location. Lat 46°24'40" long 94°21'26", in N| sec.20, T. 134 N., R.29 W., in pool of dam on Gull River, 800 ft south of outlet of Gull Lake, a quarter of a mile upstream from Gull Lake Dam, and 8 miles northwest of'Brainerd.
Drainage area. 287 sq mi.
Gage-height record. Water-stage recorder graph. Datum of gage is 1,188.14 ft above mean sea level, adjustment of 1912.
Maxima. March-May 1965: Contents, 61,800 acre-ft May 26, 27 (gage hoight, 6.31 ft). 1911 to February 1965: Contents, 74,800 acre-ft June 30, 1914 (gage height 7.30 ft).
Remarks. Reservoir operations began in 1912. Capacity between gage heights 5.00 ft and 7.00 ft (maximum allowable range and normal operating range), 26,020 acre-ft.
Cooperation. Records furnished by Corps of Engineers, in terms of cfs-days and converted to acre-feet by Geological Survey.
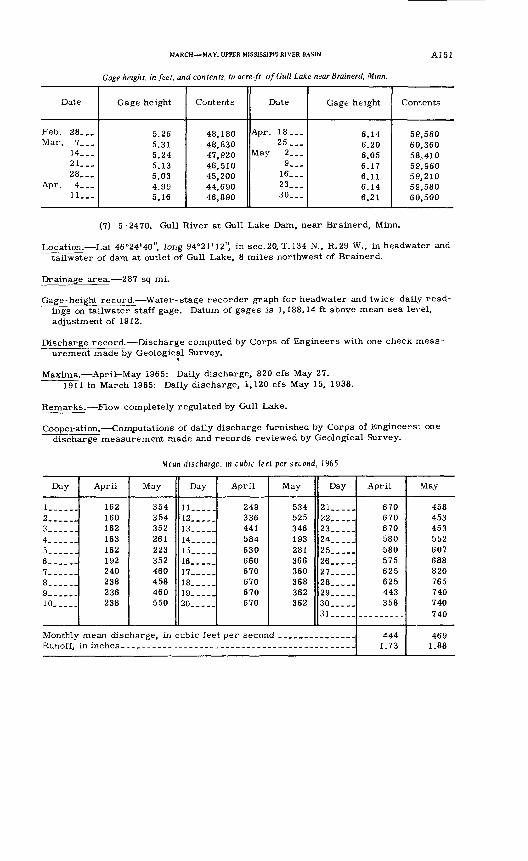
MARCH MAY, UPPER MISSISSIPPI RIVER BASIN
Gage height, in feet, and contents, in acre-ft, of Gull Lake near Brainerd, Minn.
A151
Date
Feb. 28...Mar. 7...
14...21...28 __
Apr. 4...11. _.
Gage height
5.265.315.245.135.034.995.16
Contents
48,18048,83047,92046,51045,20044,69046,890
Date
Apr. 18...25 ...
May 2...9...
16 ...23 __30 ...
Gage height
6.146.206.056.176.116.146.21
Contents
59,58060,36058,41059,96059,21059,58060,500
(7) 5-2470. Gull River at Gull Lake Dam, near Brainerd, Minn.
Location. Lat 46°24'40", long 94°21'12", in sec.20, T.134 N., R.29 W., in headwater and tailwater of dam at outlet of Gull Lake, 8 miles northwest of Brainerd.
Drainage area. 287 sq mi.
Gage-height record. Water-stage recorder graph for headwater and twice-daily read- ings on tailwater staff gage. Datum of gages is 1,188.14 ft above mean sea level, adjustment of 1912.
Discharge record. Discharge computed by Corps of Engineers with one check meas- urement made by Geological Survey.
Maxima. April-May 1965: Daily discharge, 820 cfs May 27.19Tl to March 1965: Daily discharge, 1,120 cfs May 15, 1938.
Remarks. Flow completely regulated by Gull Lake.
Cooperation. Computations of daily discharge furnished by Corps of Engineers: one discharge measurement made and records reviewed by Geological Survey.
Mean discharge, in cubic feet per second, J965
Day
I......2......3 __ ..45......6. _____7......8......9 ___ ..10.....
Monthly Runoff,
April
162 160 162 163 162 192 240 238 236 238
May
354 354 352 261 223 352 460 458 460 550
Day
11.....12.....13.. __14 __ _.15.....16.. __17.....18.. ...19.....20.....
April
249 336 441 584 630 660 670 670 670 670
May
534 525 346 193 281 366 360 368 362 362
Day
21.....22.. ...23 __ .24_. ...25 ___ .26 __ .27 .....28 __ .29 __ ..30.. ...31.....
mean discharge, in cubic feet per second _._._._.._..___
April
670 670 670 580 580 575 625 625 443 358
444 1.73
May
458 453 453 552 607 688 820 765 740 740 740
469 1.88
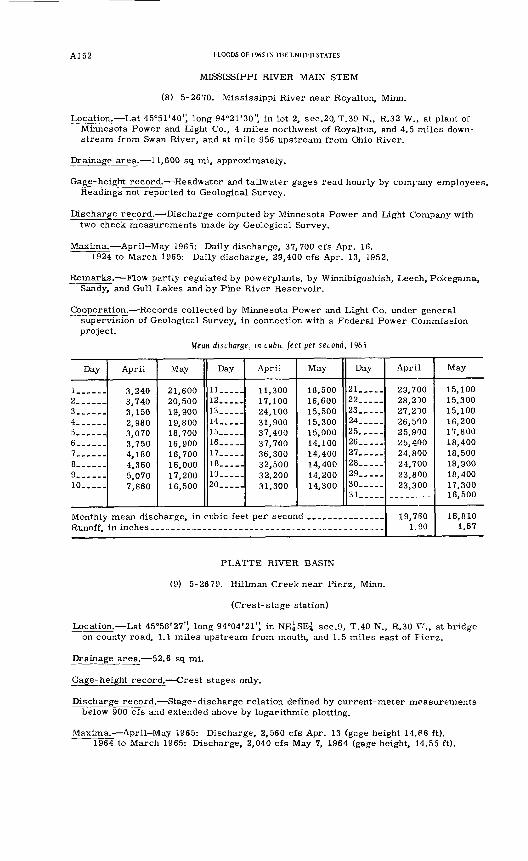
Al 52 FLOODS OF 1965 IN THE UNITED STATES
MISSISSIPPI RIVER MAIN STEM
(8) 5-2670. Mississippi River near Royalton, Minn.
Location. Lat 45°51'40" long 94°21'30", in lot 2, sec. 20, T.39 N., R.32 W., at plant of Minnesota Power and Light Co., 4 miles northwest of Royalton, and 4.5 miles down stream from Swan River, and at mile 956 upstream from Ohio River.
Drainage area. 11,600 sq mi, approximately.
Gage-height record. Headwater and tailwater gages read hourly by company employees. Readings not reported to Geological Survey.
Discharge record. Discharge computed by Minnesota Power and Light Company with two check measurements made by Geological Survey.
Maxima. April May 1965: Daily discharge, 37,700 cfs Apr. 16.1924 to March 1965: Daily discharge, 29,400 cfs Apr. 13, 1952.
Remarks. Flow partly regulated by powerplants, by Winnibigoshish, Leech, Pokegama, Sandy, and Gull Lakes and by Pine River Reservoir.
Cooperation. Records collected by Minnesota Power and Light Co. under general supervision of Geological Survey, in connection with a Federal Power Commission project.
Mean discharge, in cubic feet per second, 1965
Day
1. _____
6 __ __7 __ ._8 ______g10 _____
Monthly Runoff,
April
3,240 3,740 3,150 2,980 3,070 3,750 4,180 4,360 5,070 7,860
May
21,600 20,500 19,900 19,800 18,700 16,900 16,700 16,000 17,200 16,500
Day
ll--___12__ __13 __ __14 __ __15_____16_____17__ __18 _____19__ __20__ ___
April
11,300 17,100 24,100 31,900 37,400 37,700 36,300 32,500 32,200 31,300
mean discharge, in cubic feet per secon in inches
May
16,500 16,600 15,500 15,300 15,000 14,100 14,400 14,400 14,200 14,300
Day
21 ___22 __ __23__ __24 _____25.. __26_. __27 ____28_.___29_, __30__ __31__ ___
d __ ____ __ _. __
April
29,700 28,200 27,200 26,500 25,900 25,400 24,800 24,700 23,800 23,300
19,7(30 1.90
May
15,100 15,300 15,100 16,200 17,800 18,400 18,500 18,900 18,400 17,300 16,500
16,810 1.67
PLATTE RIVER BASIN
(9) 5-2679. Hillman Creek near Pierz, Minn.
(Crest-stage station)
Location. Lat 45°58'27", long 94°04'2l" in NE^SEi sec.9, T.40 N., R.30 V., at bridge on county road, 1.1 miles upstream from mouth, and 1.5 miles east of Fierz.
Drainage area. 52.6 sq mi.
Gage-height record. Crest stages only.
Discharge record. Stage-discharge relation defined by current-meter measurements below 900 cfs and extended above by logarithmic plotting.
Maxima.- April-May 1965: Discharge, 2,560 cfs Apr. 13 (gage height 14.P8 ft). 1964 to March 1965: Discharge, 2,040 cfs May 7, 1964 (gage height, 14.55 ft).
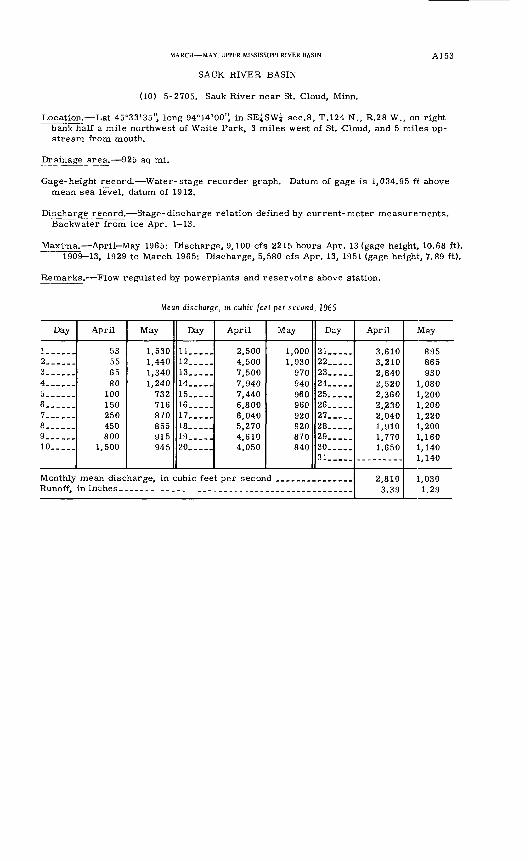
MARCH MAY, UPPER MISSISSIPPI RIVER BASIN A] 53
SAUK RIVER BASIN
(10) 5-2705. Sauk River near St. Cloud, Minn.
Location. Lat 45°33'35", long 94°14'00" in SEiSW* sec.8, T.124 N., R.28 W., on right bank half a mile northwest of Waite Park, 3 miles west of St. Cloud, and 5 miles up stream from mouth.
Drainage area. 925 sq mi.
Gage-height record. Water-stage recorder graph. Datum of gage is 1,034.95 ft above mean sea level, datum of 1912.
Discharge record. Stage-discharge relation defined by current-meter measurements. Backwater from ice Apr. 1 13.
Maxima. April-May 1965: Discharge, 9,100 cfs 2215 hours Apr. 13 (gage height, 10.68 ft). 1909-13, 1929 to March 1965: Discharge, 5,580 cfs Apr. 13, 1951 (gage height, 7.89 ft).
Remarks. Flow regulated by powerplants and reservoirs above station.
Mean discharge, in cubic feet per second, 1965
Day
!-____.2......3__ __4. _____5 ______6__. __7 ______8_ _____9___ ___10__ __
Monthly Runoff,
April
53 55 65 80
100 150 250 450 800
1,500
May
1,530 1,440 1,340 1,240
732 716 870 855 915 945
Day
11 ___ .12____.13 __ __14 __ __15 __ _.16 ___ .17 _____18 _____19__ ___20__ ___
April
2,500 4,500 7,500 7,940 7,440 6,800 6,040 5,270 4,610 4,050
mean discharge, in cubic feet per secon in inches _____
May
1,000 1,030
970 940 960 960 920 920 870 840
Day
21__ __22 _____23 _____24 _____25. __26 _____27 _____28 _____29 _____30 _____31 _____
d ____ ___________
April
3,610 3,210 2,840 2,520 2,360 2,,230 2,040 1,910 1,770 1,650
2,810 3.39
May
895 865 930
1,080 1,200 1,200 1,220 1,200 1,160 1,140 1,140
1,030 1.29

A154 FLOODS OF 1965 IN THE UNITED STATES
lage height, in feet, and discharge, in cubic feet per second, at indicated time, 1965, ofSauk River __________________ near St. Cloud, Minn.~~i i i n i i i n i \ r
Date
Apr. 9
10
11
Hour
00000600120018002400
06000800090010001100120013001400160018001900210023002400
0800120016002400
Gage height
3.493.684.084.274.45
4.544.554.834.844.894.774.805.105.015 024.905.055.255.29
5.896.156 947.65
Dis
chargeDate
Apr. 12
i ?.
Hour
030006000700080009001000120013001400160017001800200021002400
0200060010001200140016001800991 ^
Gage height
7.858.008.057 547 507.597 Q 0.
7.567.677.857.968.648 7n9 m9 n^
Q 1 Q
9 199 3Q
Q 77
10.5010.4210.511 n CQ
Dis
charge
9,100
Date
Apr. 13
14
15
16
17
1 P.
19
20
Hour
2400
0400080012002400
12002400
12002400
12002400
12002400
12002400
12002400
Gage height
10.48
10.079 979 729 59
9 CO
9 0 0
9 no
8 7 C
8 r fi
8 9 1
7 947 KK
7 437 21
6 QQ
Dis charge
S oon
8,1107 7cn
7,580
7,4807,200
6 7906,400
6,0505.640
5 270A QI n
4,610A °.9fl
4,040 30 nri
JOHNSON CREEK BASIN
(11) 5-2720. Johnson Creek tributary near St. Augusta, Minn.
(Crest-stage station)
Location. Lat 45°26'52", long 94°12'00", in NE^SE? sec.21, T.123 N., R.28 W., at culverts on county road, 0.7 mile upstream from mouth and 3.1 miles southwest of St. Augusta.
Gage-height record. Crest stages only.
Discharge record. Stage-discharge relation defined by current-meter measurements below 39 cfs and by indirect measurement at 274 cfs.
Maxima. April-May 1965: Discharge, 274 cfs Apr. 12 (gage height, 10.16 ft). T964 to March 1965: Discharge, 39 cfs May 6, 1964 (gage height, 6.4? ft).
MARCH MAY, UPPER MISSISSIPPI RIVER BASIN Al 55
(12) 5-2723. Johnson Creek near St. Augusta, Minn.
(Crest-stage station)
Location. Lat 45°27'49", long 94°09'19" ) in NWjSWi sec.13, T.123 N., R.28 W., at bridge on County Highway 7, 1.0 mile south of St. Augusta, and 3.3 miles upstream from mouth.
Gage-height record. Crest stages only.
Discharge record. Stage-discharge relation defined by current-meter measurerrents.
Maxima.- April-May 1965: Discharge, 682 cfs Apr. 12 (gage height, 14.77 ft).1964 to March 1965: Discharge, 227 cfs Apr. 13, 1964 (gage height, 12.85 ft).
OTSEGO CREEK BASIN
(13) 5-2737. Otsego Creek near Otsego, Minn.
(Crest-stage station)
Location. Lat 45°17'19", long 93°38'59", in SW^NEj sec.13, T.121 N., R.24 W., at culvert on County Highway 39, 1.3 miles upstream from mouth, and 1.9 miles west of Otsego.
Gage-height record. Crest-stages only.
Discharge record. Stage-discharge relation defined by current-meter measurerrents below 20 cfs and by flow-through-culvert computation at 202 cfs.
Maxima. April-May 1965: Discharge, 202 cfs Apr. 11 (gage height, 7.48 ft); gage height, 8.19 ft Apr. 9 (backwater from ice).
1964 to March 1965: Discharge, 23 cfs Apr. 6, 1964 (gage height. 4.39 ft, backwater from ice).
ELK RIVER BASIN
(14) 5-2742. Stony Brook tributary near Foley, Minn.
(Crest-stage station)
Location. Lat 45°38'40", long 93°54'50", in NWi sec.2, T.36 N., R.29 W., at culvert on State Highway 25, a quarter mile upstream from mouth, and l| miles south of Foley.
Drainage area. 3.11 sq mi.
Gage-height record. Crest stages only.
Discharge record. Stage-discharge relation defined by current-meter measurenents below 51 cfs and by indirect measurement at 132 cfs.
Maxima. April-May 1965: Discharge, 83 cfs Apr. 12 (gage height, 11.26 ft, backwater from ice).
1960 to March 1965: Discharge, 132 cfs May 23, 1962 (gage height, 11.35 ft, from high-water profile).
317-045 O - 70 - 10
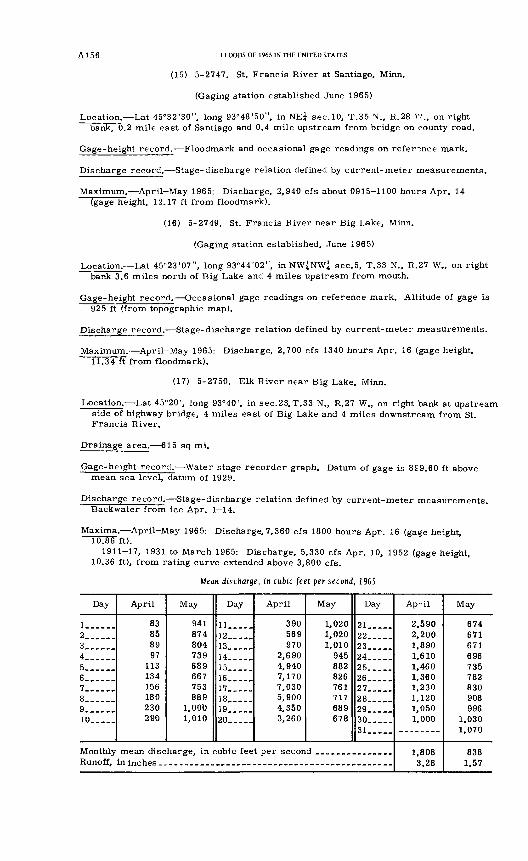
Al 56 FLOODS OF 1965 IN THE UNITED STATES
(15) 5-2747. St. Francis River at Santiago, Minn.
(Gaging station established June 1965)
Location. Lat 45°32'30", long 93°48'50", in NEi sec.10, T.35 N., R.28 Vf., on right bank, 0.2 mile east of Santiago and 0.4 mile upstream from bridge on county road.
Gage-height record. Floodmark and occasional gage readings on reference mark.
Discharge record. Stage-discharge relation defined by current-meter measurements.
Maximum. April-May 1965: Discharge, 2,940 cfs about 0915-1100 hours Apr. 14 (gage height, 12.17 ft from floodmark).
(16) 5-2749. St. Francis River near Big Lake, Minn.
(Gaging station established, June 1965)
Location. Lat 45°23'07", long 93°44'02", in NW^NW^ sec.5, T.33 N., R.27 W., on right bank 3.6 miles north of Big Lake and 4 miles upstream from mouth.
Gage-height record. Occasional gage readings on reference mark. Altitude of gage is 925 ft (from topographic map).
Discharge record. Stage-discharge relation defined by current-meter measurements.
Maximum. April-May 1965: Discharge, 2,700 cfs 1340 hours Apr. 16 (gage height, 11.34 ft from floodmark).
(17) 5-2750. Elk River near Big Lake, Minn.
Location. Lat 45°20', long 93°40', in sec.23. T.33 N., R.27 W., on right bank at upstream side of highway bridge, 4 miles east of Big Lake and 4 miles downstream from St. Francis River.
Drainage area. 615 sq mi.
Gage-height record. Water stage recorder graph. Datum of gage is 8£9.60 ft above mean sea level, datum of 1929.
Discharge record. Stage-discharge relation defined by current-meter measurements. Backwater from ice Apr. 1 14.
Maxima. April-May 1965: Discharge. 7,360 cfs 1800 hours Apr. 16 (gage height, 10.86 ft).
1911-17, 1931 to March 1965: Discharge, 5,330 cfs Apr. 10, 1952 (gage height, 10.36 ft), from rating curve extended above 3,800 cfs.
Mean discharge, in cubic feet per second, 1965
Day
1 __ __2 ____3 ____4 ______5 ______6 ______7 ______8 ______9 ______10 _____
Monthly Runoff,
April
83 85 89 97
113 134 156 180 230 290
May
941 874 804 739 689 667 753 889
1,000 1,010
Day
11 ___12__ __13 ____14__.__15 ____16__ __17 _____18 ____19__ __20 _____
April
390 569 970
2,690 4,940 7,170 7,030 5,900 4,350 3,260
May
1,020 1,020 1,010
945 882 826 761 717 689 678
Day
21__ __22 _____23 _____24 _____25. ___26 _____27 _____28__ __29 _____30 _____31 _____
mean discharge, in cubic feet per second _______________
Ap-il
2,590 2,200 1,890 1,610 1,460 1,360 1,230 1,120 1,050 1,000
1,808 3.28
May
674 671 671 696 735 782 830 908 996
1,030 1,070
8381.57
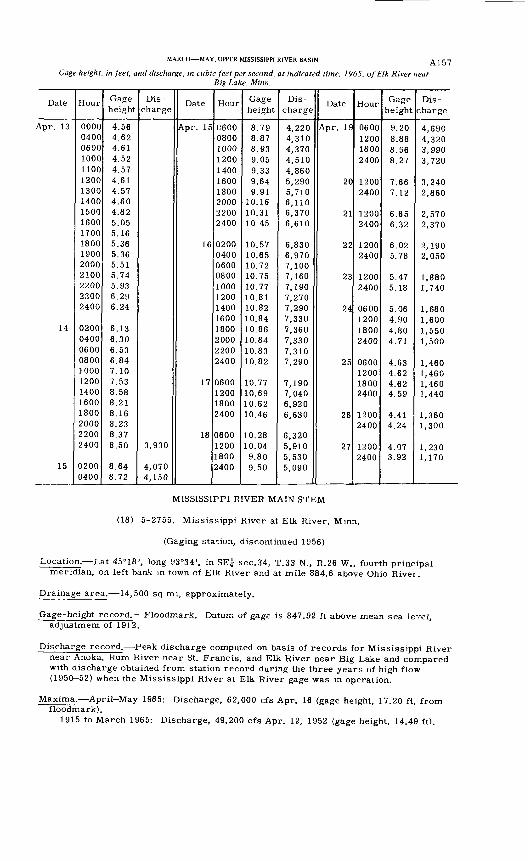
MARCH MAY, UPPER MISSISSIPPI RIVER BASIN
Gage height, in feet, and discharge, in cubic feet per second, at indicated time, 1965, of Elk River nearBig Lake, Minn.
A157
Date
Apr. 13
14
15
Hour
000004000600100011001200130014001500160017001800190020002100220023002400
020004000600080010001200140016001800200022002400
02000400
Gage height
4.564.624.614.524.574.614.574.604.825.055.165.365.365.515.745.936.296.24
6.136.306.536.847.107.538.588.218.168.238.378.50
8.648.72
Dis
charge
3,930
4,0704,150
Date
Apr. 15
16
17
18
Hour
C600080010001200140016001800200022002400
020004000600080010001200140016001800200022002400
0600120018002400
0600120018002400
Gage height
8.798.878.939.059.339.649.91
10.1610.3110.45
10.5710.6510.7210.7510.7710.8110.8210.8410.8610.8410.8310.82
10.7710.6910.6210.46
10.2810.049.809.50
Dis
charge
4,2204,3104,3704,5104,8605,2905,7106,1106,3706,610
6,8306,9707,1007,1607,1907,2707,2907,3307,3607,3307,3107,290
7,1907,0406,9206,630
6,3205,9105,5305,090
Date
Apr. 19
20
21
22
23
24
25
26
27
Hour
0600120018002400
12002400
12002400
12002400
12002400
0600120018002400
0600120018002400
12002400
12002400
Gage height
9.208.888.568.27
7.667.12
6.656.32
6.025.78
5.475.18
5.064.904.804.71
4.634.624.624.59
4.414.24
4.073.92
Dis
charge
4,6904,3203,9903,720
3,2402,860
2,5702,370
2,1902,050
1,8801,740
1,6801,6001,5501,500
1,4601,4601,4601,440
1,3601,300
1,2301,170
MISSISSIPPI RIVER MAIN STEM
(18) 5-2755. Mississippi River at Elk River, Minn.
(Gaging station, discontinued 1956)
Location. Lat 45°18', long 93°34', in SE^ sec.34, T.33 N., R.26 W., fourth principal meridian, on left bank in town of Elk River and at mile 884.6 above Ohio River.
Drainage area. 14,500 sq mi, approximately.
Gage-height record. Floodmark. Datum of gage is 847.92 ft above mean sea level, adjustment of 1912.
Discharge record. Peak discharge computed on basis of records for Mississippi River near Anoka, Rum River near St. Francis, and Elk River near Big Lake and compared with discharge obtained from station record during the three years of high flow (1950 52) when the Mississippi River at Elk River gage was in operation.
Maxima. April-May 1965: Discharge, 62,000 cfs Apr. 16 (gage height, 17.20 ft, from floodmark).
1915 to March 1965: Discharge, 49,200 cfs Apr. 12, 1952 (gage height, 14.49 ft).
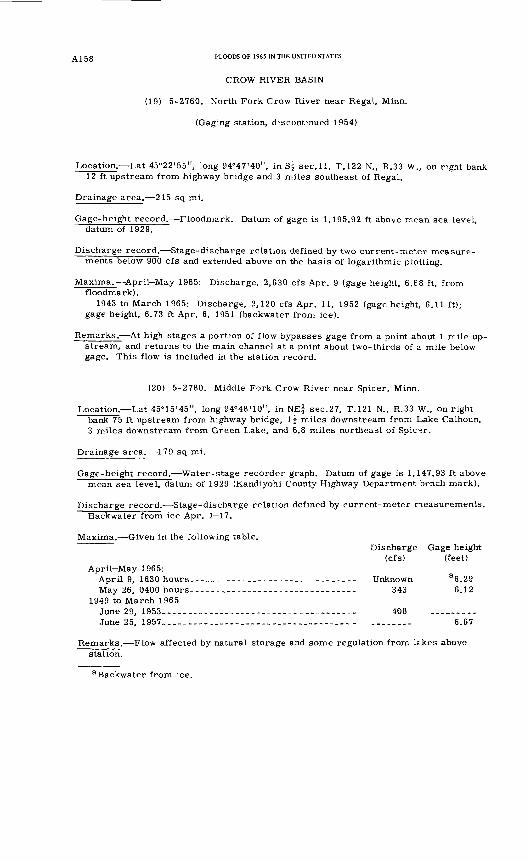
A ] gg FLOODS OF 1965 IN THE UNITED STATES
CROW RIVER BASIN
(19) 5-2760. North Fork Crow River near Regal, Minn.
(Gaging station, discontinued 1954)
Location. Lat 45°22'55", long 94°47'40", in 85 sec.11, T.122 N., R.33 W., on right bank 12 ft upstream from highway bridge and 3 miles southeast of Regal.
Drainage area. 215 sq mi.
Gage-height record. Floodmark. Datum of gage is 1,195.92 ft above mean sea level, datum of 1929.
Discharge record. Stage-discharge relation defined by two current-meter measure ments below 900 cfs and extended above on the basis of logarithmic plotting.
Maxima. April-May 1965: Discharge, 2,630 cfs Apr. 9 (gage height, 6.68 ft, from floodmark).
1943 to March 1965: Discharge, 2,120 cfs Apr. 11, 1952 (gage height, 6.11 ft); gage height, 6.73 ft Apr. 6, 1951 (backwater from ice).
Remarks.- At high stages a portion of flow bypasses gage from a point about 1 mile up stream, and returns to the main channel at a point about two-thirds of a mile below gage. This flow is included in the station record.
(20) 5-2780. Middle Fork Crow River near Spicer, Minn,
Location. Lat 45°15'45", long 94°48'10", in NE^ sec.27, T.121 N., R.33 W., on right bank 75 ft upstream from highway bridge, l| miles downstream from Lake Calhoun, 3 miles downstream from Green Lake, and 6.8 miles northeast of Spic<?r.
Drainage area. 179 sq mi.
Gage-height record. Water-stage recorder graph. Datum of gage is 1,147.93 ft above mean sea level, datum of 1929 (Kandiyohi County Highway Department bench mark).
Discharge record. Stage-discharge relation defined by current-meter neasurements. Backwater from ice Apr. 1 17.
Maxima. Given in the following table.Discharge Gage height
(cfs) (feet) April-May 1965:
April 9, 1630 hours-------------------------------- Unknown a6.29May 26, 0400 hours-------------------------------- 343 6.12
1949 to March 1965June 29, 1953------------------------------------- 408 ____--._-June 25, 1957----------.-----------.------------- - ...-..-- 6.67
Remarks. Flow affected by natural storage and some regulation from IrJces above station.
aBackwater from ice.
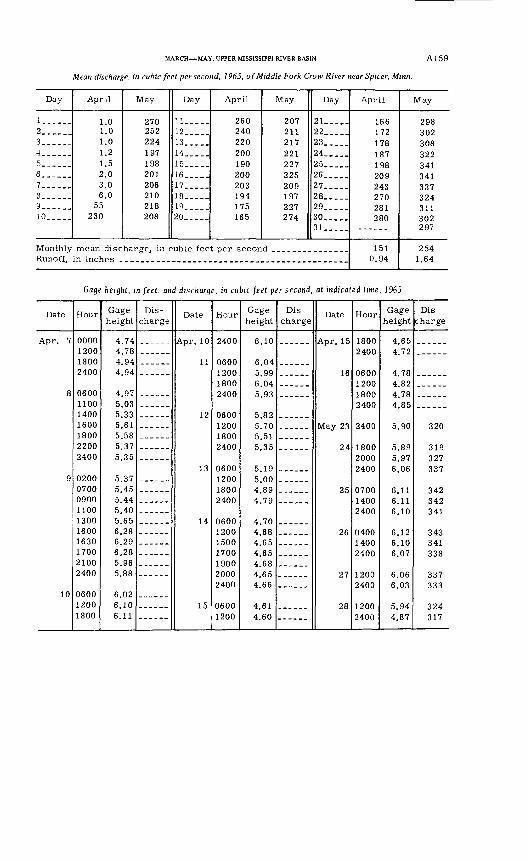
MARCH MAY, UPPER MISSISSIPPI RIVER BASIN A1 5 9
Mean discharge, in cubic feet per second, 1965, of Middle Fork Crow River near Spicer, Minn.
Day
1----..2____3____4......5......6. _____7______8......9 __ ...10_____
Monthly Runoff,
April
1.0 1.0 1.0 1.2 1.5 2.0 3.0 6.0
55 230
May
270 252 224 197 198 201 206 210 218 208
Day
11_____12_____13_____14_____15 _____16_____17_____18_____19_____20_____
April
260 240 220 200 190 200 203 194 175 165
May
207 211 217 221 227 225 209 197 227 274
Day
21 __ __22 __ __23 ____24 _.___25 __ __26___27____.28____.29_____30 __ __31_____
mean discharge, in cubic feet per second _______________ in inches ________________________________________ _
April
166 172 178 187 198 209 243 270 281 280
151 0.94
May
298 302 308 322 341 341 337 324 311 302 297
254 1.64
Gage height, in feet, and discharge, in cubic feet per second, at indicated time, 1965
Date
Apr. 7
8
9
10
Hour
0000120018002400
0600110014001600180022002400
0200070009001100130016001630170021002400
060012001800
Gage height
4.744.784.944.94
4.975.035.335.615.585.37"i 9S
5.375.455.445.405.656.286.296.285.965.88
6.026.106.11
Dis
chargeDate
Apr. 10
11
12
13
14
15
Hour
2400
0600120018002400
0600120018002400
0600120018002400
120015001700190020002400
06001200
Gage height
6.10
6.045 QQ
6.045 93
5.825.705.51^9^
5.195.004 894 79
4.704.684 fi R
4.654.684 654.66
4.614.60
Dis
chargeDate
16
24
9"i
oc
27
OQ
Hour
18002400
060012001800
2400
180020002400
070014002400
12002400
12002400
Gage height
4.654 72
4.784.824.78A. S"i
5 90
5 89^ Q7
6.06
6.106.07
6.03
5 94
4.87
Dis
charge
320
319o 07
337
O A O
342341
343341o o o
337333
994
317
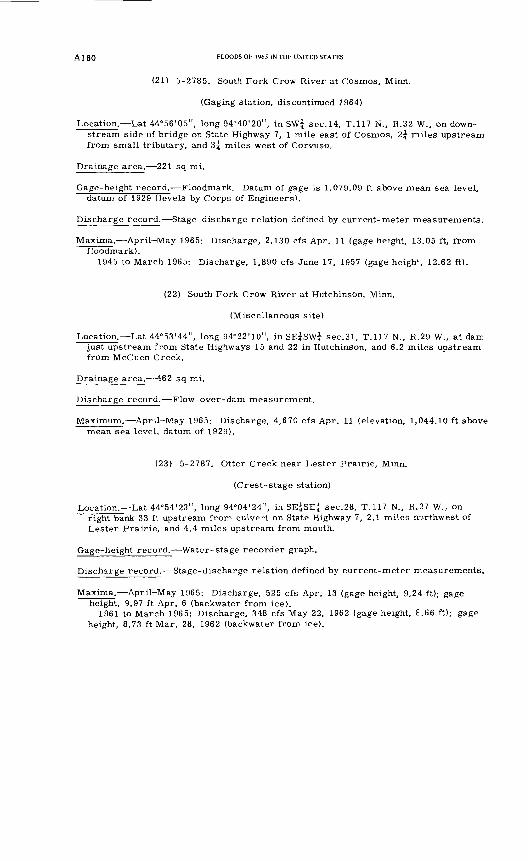
Al 60 FLOODS OF 1965 IN THE UNITED STATES
(21) 5-2785. South Fork Crow River at Cosmos, Minn.
(Gaging station, discontinued 1964)
Location. Lat 44°56'05", long 94°40'20", in SWj sec. 14, T.117 N., R.32 W., on down stream side of bridge on State Highway 7, 1 mile east of Cosmos, 2j riiles upstream from small tributary, and 3j miles west of Corvuso.
Drainage area. 221 sq mi.
Gage-height record. Floodmark. Datum of gage is 1,079.09 ft above mean sea level, datum of 1929 (levels by Corps of Engineers*.
Discharge record. Stage-discharge relation defined by current-meter measurements.
Maxima. April May 1965: Discharge, 2,130 cfs Apr. 11 (gage height, 13.05 ft, from floodmark).
1945 to March 1965: Discharge, 1,890 cfs June 17, 1957 (gage heigh*, 12.62 ft).
(22) South Fork Crow River at Hutchinson, Minn.
(Miscellaneous site)
Location. Lat 44°53'44", long 94°22'10", in SE^SWi sec. 31, T.117 N., R.29 W., at dam just upstream from State Highways 15 and 22 in Hutchinson, and 6.2 miles upstream from McCuen Creek.
Drainage area. 462 sq mi.
Discharge record. Flow-over-dam measurement.
Maximum. April May 1965: Discharge, 4,670 cfs Apr. 11 (elevation, 1,044.10 ft above mean sea level, datum of 1929).
(23) 5-2787. Otter Creek near Lester Prairie, Minn.
(Crest- stage station)
Location. Lat 44°54'23", long 94°04'24", in SE^SE^ sec. 28, T.117 N., R.27 W., on right bank 33 ft upstream from culvert on State Highway 7, 2.1 miles northwest of Lester Prairie, and 4.4 miles upstream from mouth.
Gage- height record. Water- stage recorder graph.
Discharge record. Stage-discharge relation defined by current-meter measurements.
Maxima. April May 1965: Discharge, 525 cfs Apr. 13 (gage height, 9.24 ft); gage height, 9.97 ft Apr. 6 (backwater from ice).
1961 to March 1965: Discharge, 348 cfs May 22, 1962 (gage height, 8.66 ft); gage height, 8.73 ft Mar. 28, 1962 (backwater from ice).
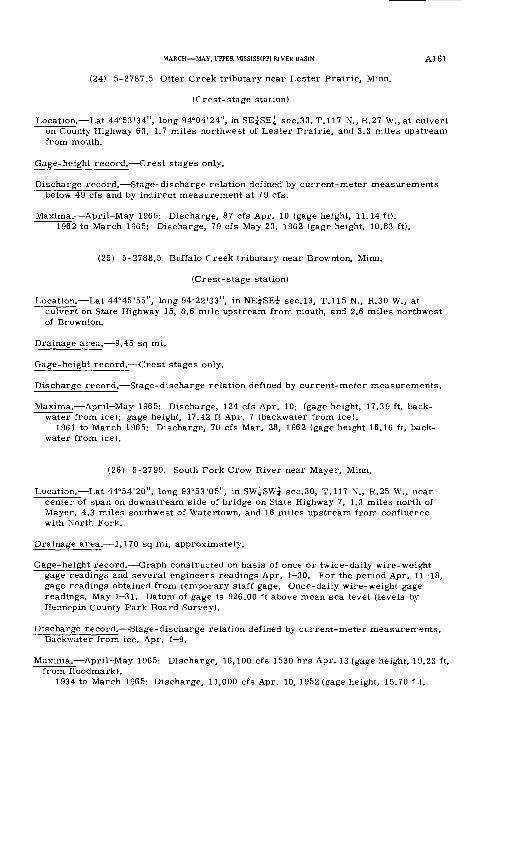
MARCH MAY, UPPER MISSISSIPPI RIVER BASIN Al 61
(24) 5-2787.5 Otter Creek tributary near Lester Prairie, Minn.
(Crest-stage station)
Location. Lat 44°53'34", long 94°04'24", in SEjSE^ sec.33, T.117 N., R.27 W., at culvert on County Highway 63, 1.7 miles northwest of Lester Prairie, and 3.3 miles upstream from mouth.
Gage-height record. Crest stages only.
Discharge record. Stage-discharge relation defined by current-meter measurements below 49 cfs and by indirect measurement at 79 cfs.
Maxima. April-May 1965: Discharge, 87 cfs Apr. 10 (gage height, 11.14 ft).1962 to March 1965: Discharge, 79 cfs May 23, 1962 (gage height, 10.83 ft).
(25) 5-2788.5 Buffalo Creek tributary near Brownton, Minn.
(Crest-stage station)
Location. Lat 44°45'55", long 94°22'33", in NE^SE^ sec.13, T.115 N., R.30 W., at culvert on State Highway 15, 0.6 mile upstream from mouth, and 2.6 miles northwest of Brownton.
Drainage area. 9.45 sq mi.
Gage-height record. Crest stages only.
Discharge record. Stage-discharge relation defined by current-meter measurements.
Maxima. April-May 1965: Discharge, 124 cfs Apr. 10; (gage height, 17.39 ft, back- water from ice); gage height, 17.42 ft Apr. 7 (backwater from ice).
1961 to March 1965: Discharge, 70 cfs Mar. 28, 1962 (gage height 16.16 ft, back water from ice).
(26) 5-2790. South Fork Crow River near Mayer, Minn.
Location. Lat 44°54'20", long 93°53'05", in SW^SW^ sec.30, T.117 N., R.25 W., near center of span on downstream side of bridge on State Highway 7, 1.3 miles north of Mayer, 4.3 miles southwest of Water-town, and 16 miles upstream from confluerce with North Fork.
Drainage area. 1,170 sq mi, approximately.
Gage-height record. Graph constructed on basis of once or twice-daily wire-weight gage readings and several engineers readings Apr. 1 30. For the period Apr. 11 18, gage readings obtained from temporary staff gage. Once-daily wire-weight gage readings, May 1 31. Datum of gage is 926.00 ft above mean sea level (levels by Hennepin County Park Board Survey).
Discharge record. Stage-discharge relation defined by current-meter measurements. Backwater from ice, Apr. 1 9.
Maxima.- April-May 1965: Discharge, 16,100 cfs 1530 hrs Apr. 13 (gage height, 19.23 ft, from floodmark).
1934 to March 1965: Discharge, 11,000 cfs Apr. 10, 1952 (gage height, 15.70 f.).
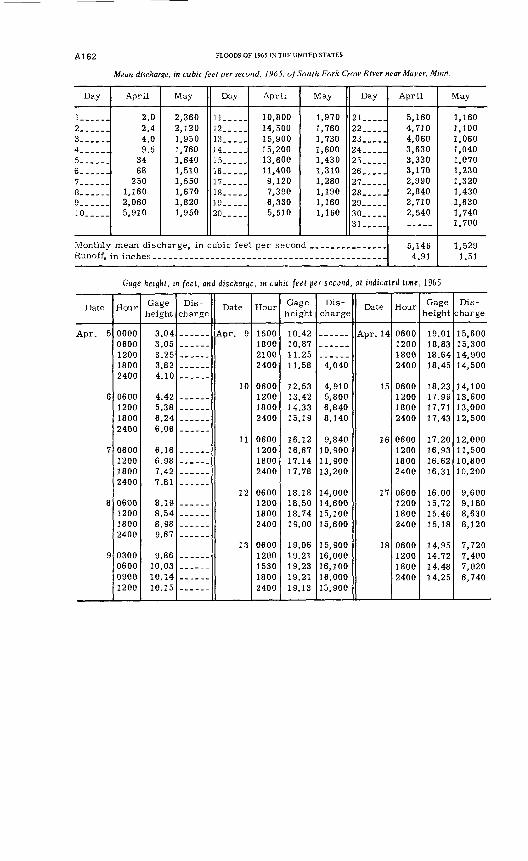
Al 62 FLOODS OF 1965 IN THE UNITED STATES
Mean discharge, in cubic feet per second, 1965, of South Fork Crow River near Mayer, Minn.
Day
l_.-___2__ ....3......4......
6......7......8......9-...._10_____
Monthly Runoff,
April
2.0 2.4 4.0 9.5
34 68
250 1,160 2,060 5,910
May
2,360 2,120 1,950 1,760 1.640 1,510 1,550 1,670 1,820 1,950
Day
11___._12_____13_____14_____15____.16_____17_____18____.19____.20____.
April
10,800 14,500 15,900 15,200 13,600 11,400 9.120 7,390 6,330 5,510
May
1,970 1,760 1,730 1,600 1,430 1,310 1,280 1,190 1,160 1,160
Day
21__ __22__ ...23_____24 .....25__.__26_____27__ ...28__ ...29_____30_____31_____
mean discharge, in cubic feet per second _______________
April
5,160 4,710 4,060 3,630 3,330 3,170 2,990 2,840 2,710 2,540
5,146 4.91
May
1,160 1,100 1,060 1,040 1,070 1,230 1,320 1,430 1,630 1,740 1,700
1,529 1.51
Gage height, m feel, and discharge, in cubic feet per second, at indicated time, 1965
Date
Apr. 5
6
7
8
g
Hour
00000600120018002400
0600120018002400
0600120018002400
0600120018002400
0300060009001200
Gage height
3.043.059 *)£*
3.824.10
4.425.386.246.06
6.166.987.427.81
8.198.548.989.67
9.8610.0310.1410.15
Dis
chargeDate
10
11
12
13
Hour
1500180021002400
0600 120018002400
0600 120018002400
0600 12001800
0600 1200153018002400
Gage height
10.4210.8711.2511.58
12.53 13.421 _. 33
15.19
16.12 16.6717.1417.78
18.18 18.5018.7419.00
19.06 19211 Q 93
19 211 Q 1 3
Dis
charge
4,040
4,910 5,8006,8408,140
9,840 10,90011,900i 3 9nn
14,000 14,60015,10015,600
15,900 16,00016,10016,00015,900
Date
A r 14P
15
16
17
18
Hour
0600120018002400
0600 120018002400
0600 120018002400
0600 120018002400
0600 120018002400
Gage height
19.0118.8318.6418.45
18.23 17 9917.7117.43
17.20 16.9316.6216.31
16.00 15 7215.4615.18
14.95 14 7214.481 A *)£*
Dis charge
15,60015.30014,90014,500
14,100
13,00012,500
12,000 11,50010,80010,200
9,600 9,1808,6308,120
7,720 7,4007 0206,740
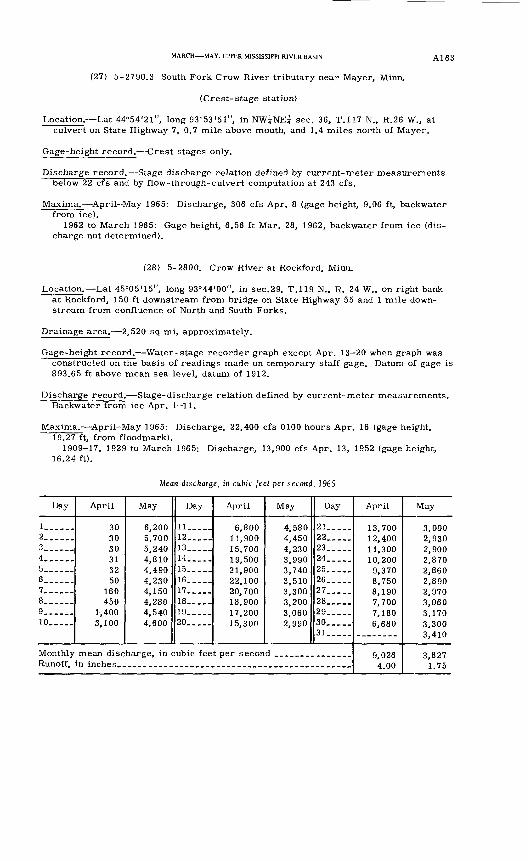
MARCH MAY, UPPER MISSISSIPPI RIVER BASIN Al 63
(27) 5-2790.3 South Fork Crow River tributary near Mayer, Minn.
(Crest-stage station)
Location. Lat 44°54'2l", long 93°53'51", in NW^NEi sec. 36, T.117 N., R.26 W., at culvert on State Highway 7, 0.7 mile above mouth, and 1.4 miles north of Mayer.
Gage-height record. Crest stages only.
Discharge record. Stage discharge relation defined by current-meter measurenents below 22 cfs and by flow-through-culvert computation at 243 cfs.
Maxima. April-May 1965: Discharge, 306 cfs Apr. 8 (gage height, 9.06 ft, backwater from ice).
1962 to March 1965: Gage height, 6.56 ft Mar. 28, 1962, backwater from ice (dis charge not determined).
(28) 5-2800. Crow River at Rockford, Minn.
Location. Lat 45°05'15", long 93°44'00", in sec.29, T.119 N., R. 24 W., on right bank at Rockford, 150 ft downstream from bridge on State Highway 55 and 1 mile down stream from confluence of North and South Forks.
Drainage area. 2,520 sq mi, approximately.
Gage-height record. Water-stage recorder graph except Apr. 13 20 when graph was constructed on the basis of readings made on temporary staff gage. Datum of gage is 893.65 ft above mean sea level, datum of 1912.
Discharge record. Stage-discharge relation defined by current-meter measurements. Backwater from ice Apr. 1 11.
Maxima.- April-May 1965: Discharge, 22,400 cfs 0100 hours Apr. 16 (gage heifht, 19.27 ft, from floodmark).
1909-17, 1929 to March 1965: Discharge, 13,900 cfs Apr. 13, 1952 (gage height, 16.24 ft).
Mean discharge, in cubic feet per second, 1965
Day
!.__._.2_ ___3... __4 ____ .5 ____6 ____7______8 ____9____ .10 _____
Monthly Runoff,
April
30 30 30 31 32 50
160 450
1-.400 3,100
May
6,200 5,700 5,240 4,810 4,490 4,230 4,150 4,280 4,540 4,600
Day
11.. __12.. __13.....14 __ ..15.___.16 _____17 _____18 _____19_____20.. ___
April
6,800 11,900 15,700 19,500 21,900 22,100 20,700 18,900 17,200 15,300
mean discharge, in cubic feet per secon in inches
May
4,580 4,450 4,230 3,990 3,740 3,510 3,300 3,200 3,060 2,990
Day
21__ __22 _____23 _____24 _____25.. __26 _____27 _____28 ____29 __ ._30 _____31 __ ._
d _______________
April
13,700 12,400 11,300 10,200
9,370 8,750 8,190 7,700 7,180 6,680
9,026 4.00
May
3,000 2,930 2,900 2,870 2,860 2,890 2,970 3,060 3,170 3,300 3,410
3,827 1.75
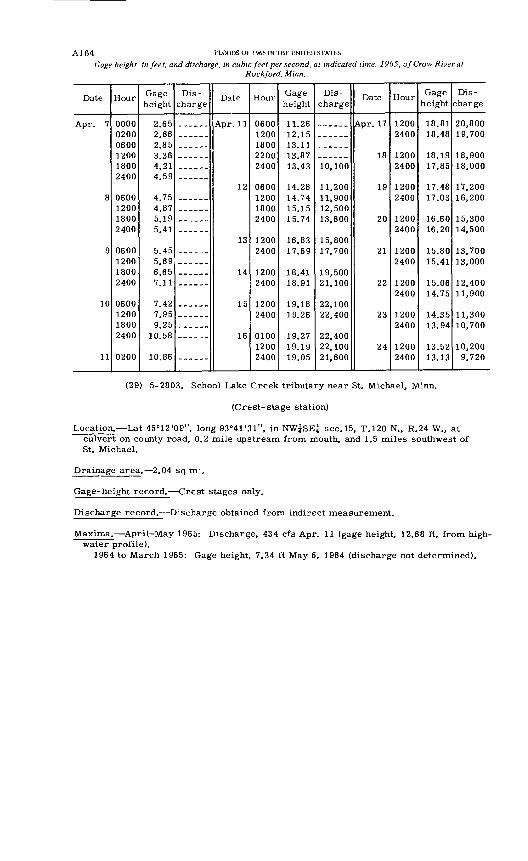
A1 64 FIOODS OF 1965 IN THE UNITED STATES
Gage height, in feet, and discharge, in cubic feet per second, at indicated time, 1965, of Crow RiverRockford, Minn.
Date
Apr 7
8
9
10
11
Hour
000002000600120018002400
0600120018002400
0600120018002400
0600120018002400
0200
Gage height
2.652.662.853.364 91
4.59
4.754.875.195.41
5.455.696.657.11
7.427.959.25
10.58
10.86
Dis charge
Date
Apr. 1 1
12
13
14
15
16
Hour
06001200180022002400
0600 120018002400
1200 2400
12002400
12002400
01001200 2400
Gage height
11.2612.151011
13.8713 43
14.28 14.7415.1515 74
16.83 1769
18.4118.91
19.1819 26
19 2719.19 19.05
Dis
charge
10,100
11,200 11,90012,50013,600
15,800 17,700
19,50021,100
22,10022,400
22,40022,100 21,600
Date
Apr. 17
18
19
20
21
22
23
24
Hour
12002400
12002400
1200 2400
12002400
12002400
12002400
12002400
1200 2400
Gage height
18.8118.48
18.1917.85
17.48
16.6016.20
15.8015.41
15.0614.75
14 3513 94
13.52 13 13
Dis
charge
20,80019,700
18,90018,000
17,200 16,200
14,500
13,70013,000
12,40011,900
11,30010,700
10,200 979n
(29) 5-2803. School Lake Creek tributary near St. Michael, Minn.
(Crest-stage station)
Location. Lat 45°12'09", long 93°41'31", in NW^SEi sec.15, T.120 N., R.24 W., at culvert on county road, 0.2 mile upstream from mouth, and 1.5 miles southwest of St. Michael.
Drainage area. 2.04 sq mi,
Gage-height record.- Crest stages only.
Discharge record. Discharge obtained from indirect measurement.
Maxima. April-May 1965: Discharge, 434 cfs Apr. 11 (gage height, 12.68 ft, from high- water profile).
1964 to March 1965: Gage height, 7.34 ft May 6, 1964 (discharge not determined).
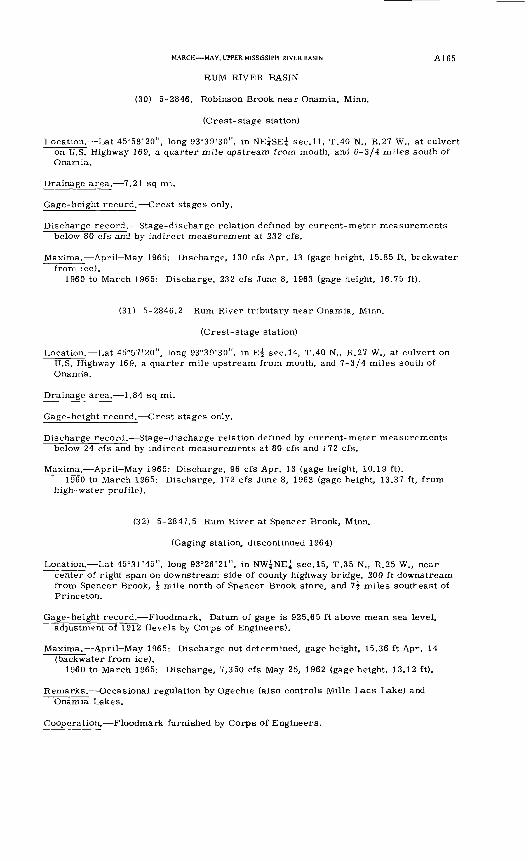
MARCH MAY, UPPER MISSISSIPPI RIVER BASIN A1 6 5
RUM RIVER BASIN
(30) 5-2846. Robinson Brook near Onamia, Minn.
(Crest-stage station)
Location. Lat 45°58'20", long 93°39'30", in NE?SE| sec. 11, T.40 N., R.27 W., at culvert on U.S. Highway 169, a quarter mile upstream from mouth, and G-3/4 miles south of Onamia.
Drainage area. 7.21 sq mi.
Gage-height record. Crest stages only.
Discharge record. Stage-discharge relation defined by current-meter measurements below 80 cfs and by indirect measurement at 232 cfs.
Maxima. April-May 1965: Discharge, 130 cfs Apr. 13 (gage height, 15.85 ft, backwater from ice).
1960 to March 1965: Discharge, 232 cfs June 8, 1963 (gage height, 16.75 ft).
(31) 5-2846.2 Rum River tributary near Onamia, Minn.
(Crest-stage station)
Location. Lat 45°57'20", long 93°39'30", in E| sec.14, T.40 N., R.27 W., at culvert on U.S. Highway 169, a quarter mile upstream from mouth, and 7-3/4 miles south of Onamia.
Drainage area. 1.84 sq mi.
Gage-height record. Crest stages only.
Discharge record. Stage-discharge relation defined by current-meter measurements below 24 cfs and by indirect measurements at 80 cfs and 172 cfs.
Maxima. April-May 1965: Discharge, 96 cfs Apr. 13 (gage height, 10.19 ft).1960 to March 1965: Discharge, 172 cfs June 8, 1963 (gage height, 13.37 ft, from
high-water profile).
(32) 5-2847.5 Rum River at Spencer Brook, Minn.
(Gaging station, discontinued 1964)
Location. Lat 45°31'45", long 93°26'21", in NW^NE^ sec. 15, T.35 N., R.25 W., near center of right span on downstream side of county highway bridge, 200 ft downstream from Spencer Brook, f mile north of Spencer Brook store, and 7^ miles southeast of Princeton.
Gage-height record. Floodmark, Datum of gage is 925.65 ft above mean sea level, adjustment of 1912 (levels by Corps of Engineers).
Maxima.- April May 1965: Discharge not determined, gage height, 15.36 ft Ap~. 14 (backwater from ice).
1960 to March 1965: Discharge, 7,350 cfs May 25, 1962 (gage height, 13.12 ft).
Remarks. Occasional regulation by Ogechie (also controls Mille Lacs Lake) and Onamia Lakes.
Cooperation. Floodmark furnished by Corps of Engineers.
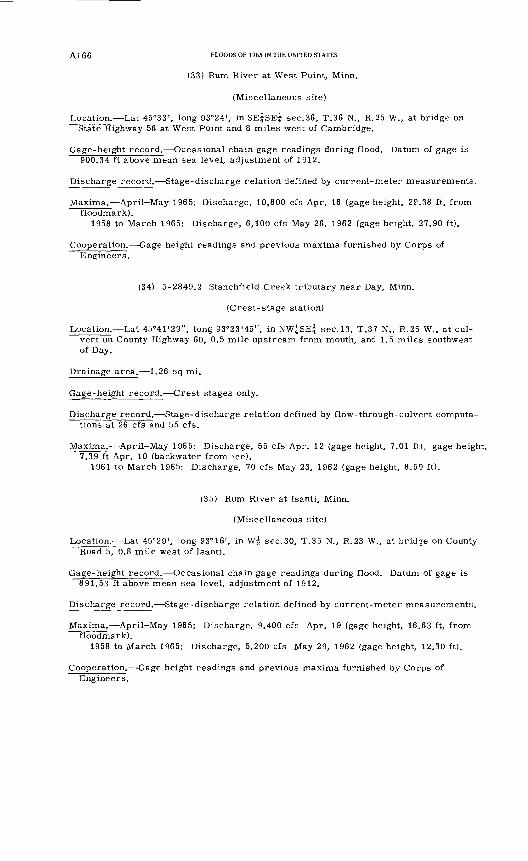
Al 66 FLOODS OF 1965 IN THE UNITED STATES
(33) Rum River at West Point, Minn.
(Miscellaneous site)
Location. Lat 45°33', long 93°24', in SE|SE| sec.36, T.36 N., R.25 W., at bridge on State Highway 56 at West Point and 8 miles west of Cambridge.
Gage-height record. Occasional chain gage readings during flood. Datum of gage is 900.34 ft above mean sea level, adjustment of 1912.
Discharge record. Stage-discharge relation defined by current-meter measurements.
Maxima. April-May 1965: Discharge, 10,800 cfs Apr. 16 (gage height, 2P.38 ft, from floodmark).
1958 to March 1965: Discharge, 6,100 cfs May 26, 1962 (gage height, 27.90 ft).
Cooperation. Gage height readings and previous maxima furnished by Corps of Engineers.
(34) 5-2849.2 Stanchfield Creek tributary near Day, Minn.
(Crest-stage station)
Location. Lat 45°41'29", long 93°23'45", in NW^SEf sec.13, T.37 N., R.25 W., at cul vert on County Highway 60, 0.5 mile upstream from mouth, and 1.5 miles southwest of Day.
Drainage area. 1.26 sq mi.
Gage-height record. Crest stages only.
Discharge record. Stage-discharge relation defined by flow-through-culvert computa tions at 26 cfs and 55 cfs.
Maxima.- April May 1965: Discharge, 55 cfs Apr. 12 (gage height, 7.01 fl.); gage height, 7.39 ft Apr. 10 (backwater from ice).
1961 to March 1965: Discharge, 70 cfs May 23, 1962 (gage height, 8.50 ft).
(35) Rum River at Isanti, Minn.
(Miscellaneous site)
Location. Lat 45°29', long 93°16', in W| sec.30, T.35 N., R.23 W., at bridge on County Road 5, 0.8 mile west of Isanti.
Gage-height record. Occasional chain gage readings during flood. Datum of gage is 891.53 ft above mean sea level, adjustment of 1912.
Discharge record. Stage-discharge relation defined by current-meter measurements.
Maxima. April-May 1965: Discharge, 9,400 cfs Apr. 19 (gage height, 16.63 ft, from floodmark).
1958 to March 1965: Discharge, 5,200 cfs May 29, 1962 (gage height, 12.30 ft).
Cooperation. Gage height readings and previous maxima furnished by Corps of Engineers.
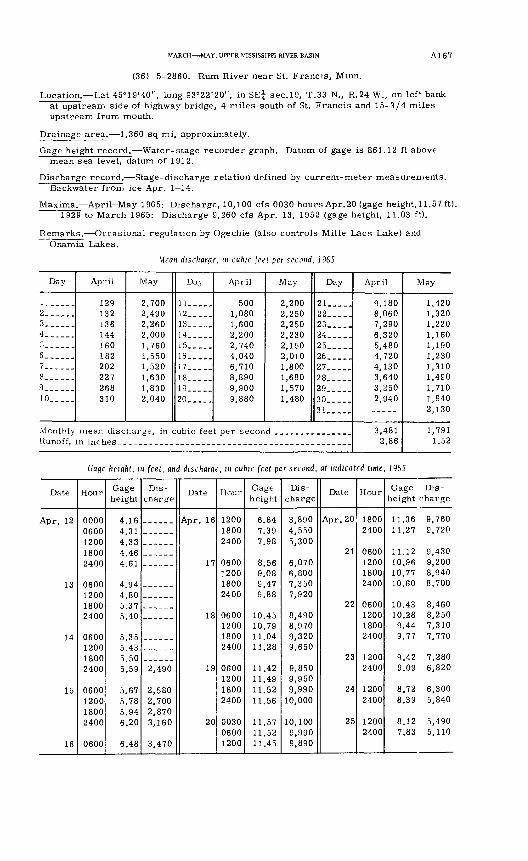
MARCH MAY, UPPER MISSISSIPPI RIVER BASIN
(36) 5-2860. Rum River near St. Francis, Minn.
A167
Location. Lat 45°19'40", long 93°22'20", in SE^ sec.19, T.33 N., R.24 W., on lef4 bank at upstream side of highway bridge, 4 miles south of St. Francis and 15-3/4 miles upstream from mouth.
Drainage area. 1,360 sq mi, approximately.
Gage height record. Water-stage recorder graph. Datum of gage is 861.12 ft above mean sea level, datum of 1912.
Discharge record. Stage-discharge relation defined by current-meter measurements. Backwater from ice Apr. 1 14.
Maxima. April-May 1965: Discharge, 10,100 cfs 0030 hours Apr.20 (gage height, 11.57 ft). 1929 to March 1965: Discharge 9,260 cfs Apr. 13, 1952 (gage height, 11.03 f 1:).
Remarks. Occasional regulation by Ogechie (also controls Mille Lacs Lake) and Onamia Lakes.
Mean discharge, in cubic feel per second, 1965
Day
12______3......4......
6_.7._8... .9--_.__10.
Monthly Runoff,
April
129 132 136 144 160 182 202 227 268 310
May
2,700 2,490 2,260 2,000 1,760 1,550 1,520 1,630 1,830 2,040
Day
11.....12.....13.....14... .15... .16.....17.....18.....19.....20.....
April
500 1,080 1,600 2,200 2,740 4,040 6,710 8,890 9,900 9,880
May
2,200 2,250 2,250 2,230 2,150 2,010 1,800 1,680 1,570 1,480
Day
21.....22 __ ..23_. .24.....25.....26.....27__ __28 _____29.....SO31_____
mean discharge, in cubic feet per second _______________
April
9,180 8,060 7,290 6,320 5,480 4,720 4,130 3,640 3,250 2,940
3,481 2.86
May
1,420 1,320 1,220 1,160 1,190 1,230 1,310 1,490 1,710 1,940 2,130
1,791 1.52
Gage height, in feet, and dischorge, in cubic feet per second, at indicated time, 1965
Date
Apr. 12
13
14
15
16
Hour
00000600120018002400
0600120018002400
0600120018002400
0600120018002400
0600
Gage height
4.164.314.334.464.61
4 944.805.375.40
5.355.435.505.59
5.675.785.946.20
6.48
Dis charge
2,490
2,5802,7002,8703,160
3,470
Date
Apr. 16
17
18
19
20
Hour
120018002400
0600120018002400
0600120018002400
0600120018002400
003006001200
Gage height
6.847.397.98
8.569.089.479.88
10.4510.7911.0411.28
11.4211.4911.5211.56
11.5711.5211.45
Dis
charge
3,8904,5505,300
6,0706,8007,3507,920
8,4908,9709,3209,650
9,8509,9509,99010,000
10,1009,9909,890
Date
Apr. 20
21
22
23
24
25
Hour
18002400
0600120018002400
0600120018002400
12002400
12002400
12002400
Gage Dis- height charge
11.36 9,76011.27 9,720
11.12 9,43010.96 9,20010.77 8,94010.60 8,700
10.43 8,46010.28 8,2509.44 7,3109.77 7,770
9.42 7,2809.09 6,820
8.72 6,3008.39 5,840
8.12 5,4907.83 5,110
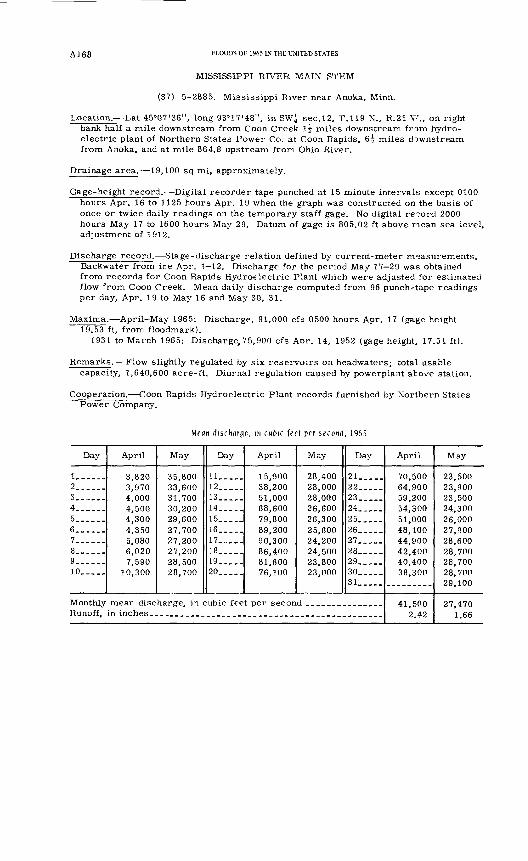
A168 FLOODS OF 1965 IN THE UNITED STATES
MISSISSIPPI RIVER MAIN STEM
(37) 5-2885. Mississippi River near Anoka, Minn.
Location. Lat 45°07'36", long 93°17'48", in SW£ sec.12, T.119 N., R.21 V., on right bank half a mile downstream from Coon Creek 1-f miles downstream from hydro electric plant of Northern States Power Co. at Coon Rapids, 6f miles downstream from Anoka, and at mile 864.8 upstream from Ohio River.
Drainage area. 19,100 sq mi, approximately.
Gage-height record. Digital recorder tape punched at 15 minute intervals except 0100 hours Apr. 16 to 1125 hours Apr. 19 when the graph was constructed on the basis of once or twice daily readings on the temporary staff gage. No digital record 2000 hours May 17 to 1600 hours May 29. Datum of gage is 805.02 ft above mean sea level, adjustment of 1912.
Discharge record. Stage-discharge relation defined by current-meter measurements. Backwater from ice Apr. 1 12. Discharge for the period May 17 29 was obtained from records for Coon Rapids Hydroelectric Plant which were adjusted for estimated flow from Coon Creek. Mean daily discharge computed from 96 punch-tape readings per day, Apr. 19 to May 16 and May 30, 31.
Maxima. April-May 1965: Discharge, 91,000 cfs 0500 hours Apr. 17 (gage height 19.53 ft, from floodmark).
1931 to March 1965: Discharge, 75, 900 cfs Apr. 14, 1952 (gage height, 17.51 ft).
Remarks. Flow slightly regulated by six reservoirs on headwaters; total usable capacity, 1,640,600 acre-ft. Diurnal regulation caused by powerplant atove station.
Cooperation. Coon Rapids Hydroelectric Plant records furnished by Northern States Power Company.
Mean discharge, in cubic feet per second, 1965
Day
!._____2. _____3_ _____4_ _____5_ __ __6 ______7 __ __8 ______9______10 __ _.
Monthly Runoff,
April
3,820 3,970 4,000 4,500 4,300 4,350 5,080 6,020 7,590
10,300
May
35,800 33,600 31,700 30,200 29,600 27,700 27,200 27,200 28,500 28,700
Day
!!____.12___._13__ __14___,_15_____16___._17 _____18__ __19.-...20__.__
April
15,900 38,200 51,000 68,600 79,800 89,200 90,300 86,400 81,600 76,100
mean discharge, in cubic feet per secon in inches- _
May
28,400 28,000 28,000 26,600 26,300 25,600 24,200 24,500 23,800 23,000
Day
21__ __22... _.23.. __24 _____25. __ .26 _____27 ____28__ __29.. __30_. __31 ____
d .._-___ __ __ __
April
70,500 64,900 59,200 54,300 51,000 48,100 44,900 42,400 40,400 38,300
41,500 2.42
May
23,500 23,900 23,500 24,300 26,000 27,900 28,600 28,700 28,700 28,700 29,100
27,470 1.66
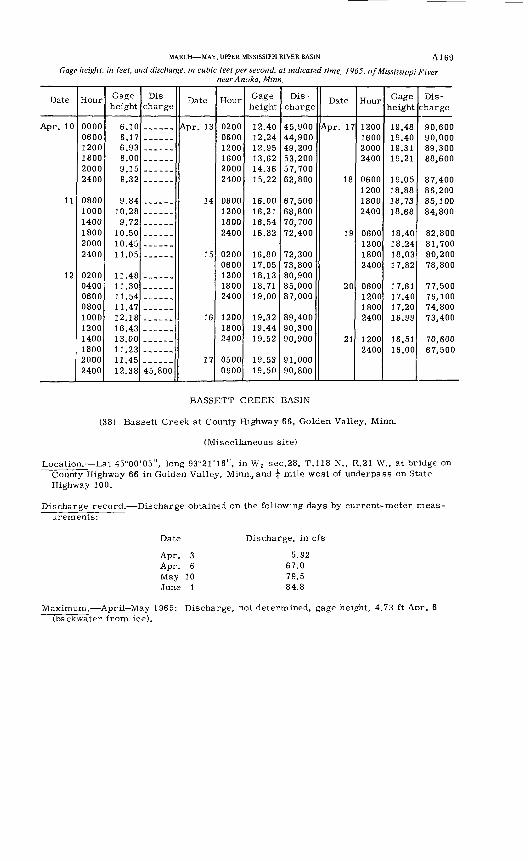
MARCH MAY, UPPER MISSISSIPPI RIVER BASIN A169
Gage height, in feet, and discharge, in cubic feet per second, at indicated time, 1965, of Mississippi Fivernear Anoka, Minn.
Date
Apr. 10
11
12
Hour
000006001200180020002400
080010001400180020002400
0200040006000800100012001400180020002400
Gage height
6.106.176.938.009.159.32
9.8410.289.72
10.5010.4511.05
11.4811.3011 54
12.1816.4313.0011.2311.4512.38
Dis
charge
45,800
Date
Apr. 13
14
15
16
17
Hour
020006001200160020002400
0600120018002400
02000600 120018002400
120018002400
05000900
Gage height
12.4012.2419 Q "^
13.6214.3615.22
16.0016.2116.5416.82
16.8017.05 18.1318.7119.00
19.3219.4419.52
19.5319.50
Dis
charge
45,90044,9004.0 9nnco 9nn
57,70062,800
67,50068,80070,70072,400
72,30073,800 80,90085,00087,000
89,40090,30090,900
91,00090,800
Date
18
19
20
91
Hour
1200160020002400
06001200 18002400
0600120018002400
0600120018002400
12002400
Gage height
19.4819.401 Q ^ 1
1 Q 91
19.0518.88 18.7318.68
18.4018.2418.0317.82
17.6117.40
16.99
16.5116.00
Dis
charge
89 30088,600
87,40086,200 85,10084,800
82,800
80,20078,800
77,50076,10074,80073,400
67,500
BASSETT CREEK BASIN
(38) Bassett Creek at County Highway 66, Golden Valley, Minn.
(Miscellaneous site)
Location. Lat 45°00'05", long 93°21'16", in Wi sec.28, T.118 N., R.21 W., at bridge on County Highway 66 in Golden Valley, Minn.,and | mile west of underpass on State Highway 100.
Discharge record. Discharge obtained on the following days by current-meter meas urements:
Date
Apr. 3 Apr. 6 May 10 June 1
Discharge, in cfs
5.9267.079.584.8
Maximum. April May 1965: Discharge, not determined, gage height, 4.73 ft Aor. 6 (backwater from ice).
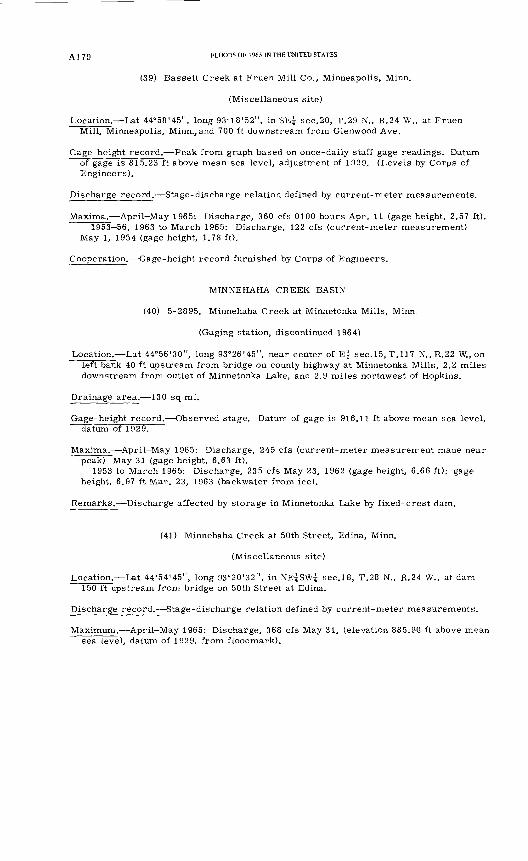
A j 7 o FLOODS OF 1965 IN THE UNITED STATES
(39) Bassett Creek at Fruen Mill Co., Minneapolis, Minn.
(Miscellaneous site)
Location. Lat 44°58'45", long 93°18'52", in SEj sec. 20, T.29 N., R.24 W., at Fruen Mill, Minneapolis, Minnv and 700 ft downstream from Glenwood Ave.
Gage-height record. Peak from graph based on once-daily staff gage readings. Datum of gage is 815.23 ft above mean sea level, adjustment of 1929, (Levels by Corps of Engineers).
Discharge record. Stage-discharge relation defined by current-meter measurements.
Maxima.- April-May 1965: Discharge, 360 cfs 0100 hours Apr. 11 (gage height, 2.57 ft).1953-56, 1963 to March 1965: Discharge, 122 cfs (current-meter measurement)
May 1, 1954 (gage height, 1.78 ft).
Cooperation. Gage-height record furnished by Corps of Engineers.
MINNEHAHA CREEK BASIN
(40) 5-2895. Minnehaha Creek at Minnetonka Mills, Minn.
(Gaging station, discontinued 1964)
Location. Lat 44°56'30", long 93°26'45", near center of E| sec.15, T.117 N., R.22 W., on left bank 40 ft upstream from bridge on county highway at Minnetonka Mills, 2.2 miles downstream from outlet of Minnetonka Lake, and 2.9 miles northwest of Hopkins.
Drainage area. 130 sq mi.
Gage-height record. Observed stage. Datum of gage is 916.11 ft above mean sea level, datum of 1929.
Maxima.- April May 1965: Discharge, 245 cfs (current-meter measurerrent made near peak) May 31 (gage height, 6.63 ft).
1953 to March 1965: Discharge, 235 cfs May 23, 1962 (gage height, 6.66 ft); gage height, 6.97 ft Mar. 23, 1963 (backwater from ice).
Remarks.- Discharge affected by storage in Minnetonka Lake by fixed-crest dam.
(41) Minnehaha Creek at 50th Street, Edina, Minn.
(Miscellaneous site)
Location. Lat 44°54'45", long 93°20'32", in NE^SWi sec.18, T.28 N., R.24 W., at dam 150 ft upstream from bridge on 50th Street at Edina.
Discharge record. Stage-discharge relation defined by current-meter measurements.
Maximum. April May 1965: Discharge, 368 cfs May 31, (elevation 885.90 ft above mean sea level, datum of 1929, from floodmark).
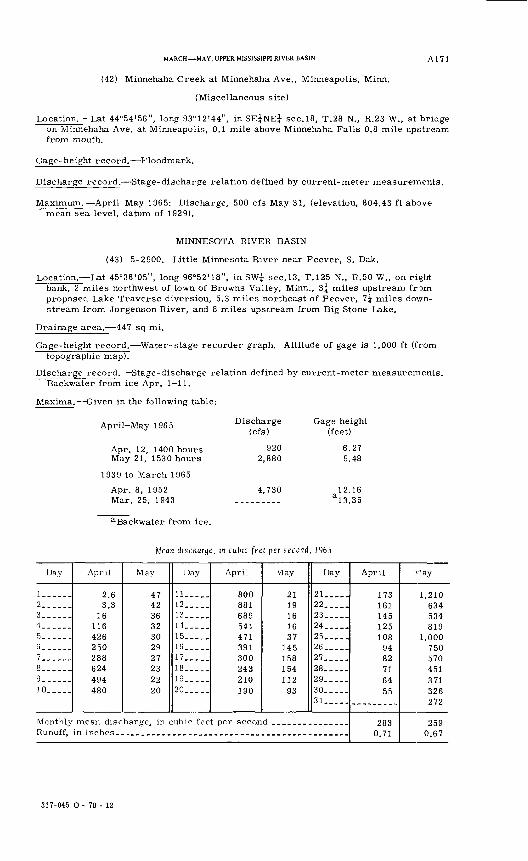
MARCH MAY, UPPER MISSISSIPPI RIVER BASIN A1 7 1
(42) Minnehaha Creek at Minnehaha Ave., Minneapolis, Minn.
(Miscellaneous site)
Location. Lat 44°54'56", long 93°12'44", in SE^NEi sec.18, T.28 N., R.23 W., at bridge on Minnehaha Ave. at Minneapolis, 0.1 mile above Minnehaha Falls 0.8 mile upstream from mouth.
Gage-height record. Floodmark.
Discharge record. Stage-discharge relation defined by current-meter measurements.
Maximum. April May 1965: Discharge, 500 cfs May 31, (elevation, 804.43 ft above mean sea level, datum of 1929).
MINNESOTA RIVER BASIN
(43) 5-2900. Little Minnesota River near Peever, S. Dak.
Location. Lat 45°36'05", long 96°52'18", in SW^ sec.13, T.125 N., R.50 W., on right bank, 2 miles northwest of town of Browns Valley, Minn., 3^ miles upstream from proposed Lake Traverse diversion, 5.3 miles northeast of Peever, 7^ miles down stream from Jorgenson River, and 8 miles upstream from Big Stone Lake.
Drainage area.- 447 sq mi.
Gage-height record. Water-stage recorder graph. Altitude of gage is 1,000 ft (from topographic map).
Discharge record. Stage-discharge relation defined by current-meter measurements. Backwater from ice Apr. 1 11.
Maxima. Given in the following table:
April-May 1965
Apr. 12, 1400 hours May 21, 1530 hours
1939 to March 1965
Apr. 8, 1952 Mar. 25, 1943
Discharge (cfs)
920 2,880
4,730
Gage height (feet)
6.27 9.48
12.16 a !3.35
a Backwater from ice.
Mean discharge, m cubic feet per second, 1965
Day
I......2......3. ...4__ ...5......6......7......8......9---__.]0._...
Monthly Runoff,
April
2.6 3.3
16 116 426 250 288 624 494 480
May
47 42 36 32 30 29 27 23 22 20
Day
11-...-12..-..13...14... .15..._.16.-...17.....18...--19--...20-.--.
April
800 881 689 541 471 391 300 243 210 190
May
21 19 16 16 37
145 158 154 112 93
Day
21.....22. __ .23.-,..24.....25.. __26.. ...27 ___ .28._ ...29.....30.....31-..-.
mean discharge, in cubic feet per second __...-..____.__
April
173 161 145 125 108 94 82 71 64 55
283 0.71
May
1,210 634 534 819
1,000 750 570 451 371 326 272
259 0.67
317-045 O - 70 - 12
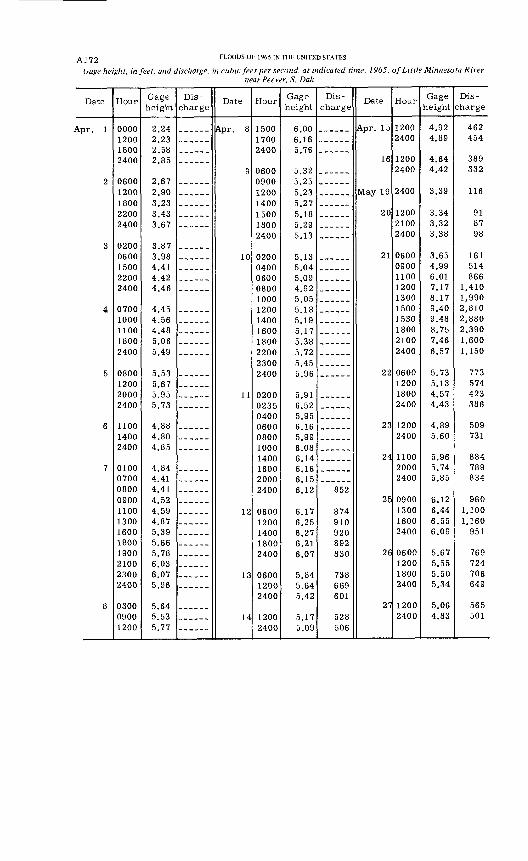
AJ 72 FLOODS OF 1965 IN THE UNITED STATES
(jage height, in feet, and discharge, in cubic feet per second, at indicated time, 1965, of Little Minnesota Rivernear Peever, S. Dak.
Date
<Vpr. 1
2
3
4
5
6
7
8
Hour
0000120018002400
06001200180022002400
02000600150022002400
07001000110018002400
0800120020002400
110014002400
0100070008000900110013001600180019002100
2400
030009001200
Gage height
2.242.232.582.85
2.672.903.233.433.67
3.873.984.414.424.46
4 454.564.485.065.49
5.535.675.955.73
4.884.804.85
4.844.414.414.524.594.875.395.665.786.03
5.96
5.645.535.77
Dis
chargeDate
g
10
11
12
13
14
Hour
150017002400
0600090012001400150018002400
0200
0600080010001200140016001800220023002400
020002350400060008001000
160020002400
1200140018002400
060012002400
12002400
Gage height
6.006.165.76
5.325 255 235.275.185.295 13'
5 135 045.09A. Q9
5.055.18519517<\ 3R
5 725 455.96
5 916.525 956.165 996.086.146.166.15
6 O "7
6 f) -1
5 845 645.42
5175 09
Dis
charge
852
874Q 1 nn ononn
Q Q A
7Q o
C CQ
601
528506
Date
Apr. 15
16
May 19
20
21
22
23
24
25
2@
27
Hour
12002400
12002400
2400
120021002400
0600090011001200130015001530180021002400
0600120018002400
12002400
110020002400
0900130016002400
0600120018002400
12002400
Gage height
4.924.89
4.644.42
3.39
3.343.323.38
3.654.996.017.178.179.409.488.757.466.57
5.735.134.574.43
4.895.60
5.965.745.85
6.126.446.556.09
5.675.555.505.34
5.064.83
Dis charge
462454
389332
116
918798
161514866
1,4101,9902,8102,8802,3901,6001,150
773574423386
509731
884789834
9601,1001,160951
769724706649
565501
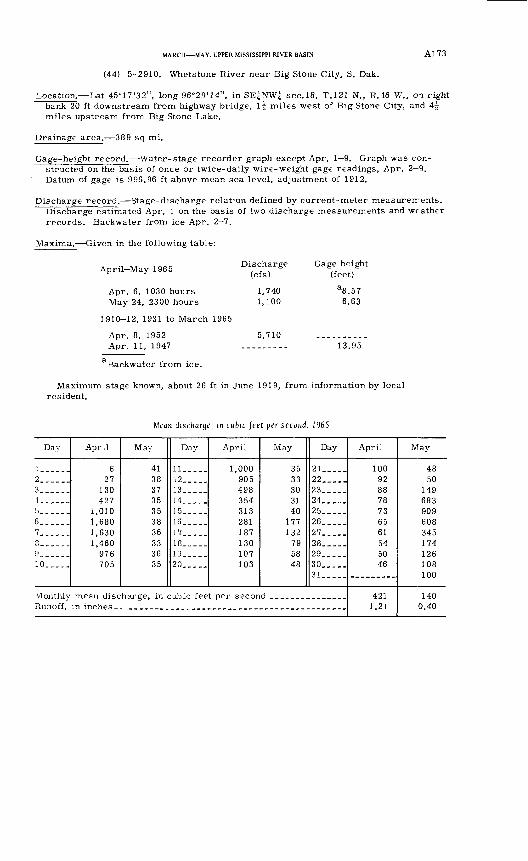
MARCH MAY, UPPER MISSISSIPPI RIVER BASIN A173
(44) 5-2910. Whetstone River near Big Stone City, S. Dak.
Location. Lat 45°17'32", long 96 0 29'14", in SE^NWl sec.18, T.121 N., R.46 W., on right bank 20 ft downstream from highway bridge, 1^ miles west of Big Stone City, and 4| miles upstream from Big Stone Lake.
Drainage area. 389 sq mi.
Gage-height record. Water-stage recorder graph except Apr. 1 9. Graph was con- structed on the basis of once or twice-daily wire-weight gage readings, Apr. 2 9. Datum of gage is 996.96 ft above mean sea level, adjustment of 1912.
Discharge record. Stage-discharge relation defined by current-meter measurerr ents. Discharge estimated Apr. 1 on the basis of two discharge measurements and weather records. Backwater from ice Apr. 2 7.
Maxima.- Given in the following table:
April-May 1965
Apr. 6, 1030 hours May 24, 2300 hours
1910-12, 1931 to March 1965
Apr. 8, 1952 Apr. 11, 1947
Discharge(cfs)
1,7401,100
5,710
Gage height (feet)
a8.57 6.63
13.95
Backwater from ice.
Maximum stage known, about 26 ft in June 1919, from information by local resident.
Mean discharge, in cubic feet per second, 1965
Day
1. _-..2......34______5_____6......7......a... ..910.....
Monthly Runoff,
April
6 27
130 427
1,010 1,680 1,630 1,460
976 705
May
41 38 37 35 35 38 36 33 36 35
Day
11..---12.____13..__.14..,.-15.....16-,_._17.-...18.....19.....20---..
April
1,000 905 498 354 313 281 187 130 107 103
May
35 33 30 31 40
177 132
79 58 48
Day
21__ __22 .....23____,24---.,25__-_-26_.___27__.__28 .....29... _.30.....31__.__
mean discharge, in cubic feet per second _______________
April
100 92 88 78 73 65 61 54 50 46
421 1.21
May
48 50
149 683 909 608 345 174 126 108 100
140 0.40
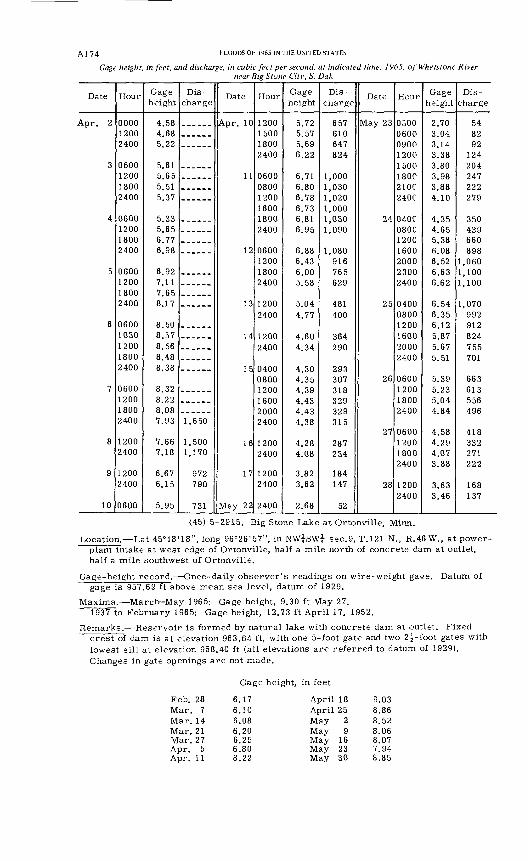
A174 r LOODS OF 1965 IN THE UNITED STATES
Gage height, in feet, and discharge, in cubic feet per second, at indicated time, 1965, of Whetstone River near Big Stone City, S. Dak.
Date
Apr. 2
3
4
5
6
7
8
9
10
Hour
000012002400
0600120018002400
0600120018002400
0600120018002400
06001030120018002400
0600120018002400
1200 2400
1200 2400
0600
Gage height
4.584.685.22
5.615.655.515.37
5.335.656.776.98
6.927.117.658.17
8.508.578.568.488.38
8.328.228.087.93
7.66 7.18
6.67 6.15
5.95
Dis
charge
1,650
1,500 1,170
972 790
731
Date
Apr. 10
11
12
13
14
15
16
17
May 22
Hour
1200150018002400
0600
12001600 18002400
06001200 18002400
12002400
12002400
04000800 1200160020002400
1200 2400
1200 2400
2400
Gageheight
5.725.575.696.22
6.716.806.786.73 6.816 QC
6.886.43 6.005.58
5.044.77
4.604 34
4 304.354 onA. d. 0.
4 43
4.38
4.28 4.08
3.82 3.62
2.68
Dis
charge
657610647824
1,0301,0201,000 1,0301,090
1,080916 765coo
481400
364290
293307
q on
oo n
315
287 234
184 147
52
Date
May 23
24
25
26
27
28
Hour
0300060009001200 1500180C210C240C
040C080C120C16002000 23002400
04000800 12001600
2400
0600 120018002400
0600 1200 1800 2400
1200 2400
Gage height
2.703.043 143.38 3.803.983.884.10
4.354.655.386.086.52 6.636.62
6.546.35 6.125.875.675.51
5.39 5 235.044.84
4.58 4.29 4.07 3.88
3.63 3.46
Dis
charge
5482no
124 204247222279
350439660898
1,060 1,1001,100
1,070992
755701
663 613556
418 332 271 222
168137
(45) 5-2915. Big Stone Lake at Ortonville, Minn.
Location. Lat 45°18'18", long 96°26'57", in NW^SWi sec.9, T.121 N., R.46 W., at power- plant intake at west edge of Ortonville, half a mile north of concrete dam at outlet, half a mile southwest of Ortonville.
Gage-height record. Once-daily observer's readings on wire-weight gase. Datum of gage is 957.69 ft above mean sea level, datum of 1929.
Maxima. March-May 1965: Gage height, 9.30 ft May 27.1937 to February 1965: Gage height, 12.73 ft April 17, 1952.
Remarks. Reservoir is formed by natural lake with concrete dam at outlet. Fixed crest of dam is at elevation 963.64 ft, with one 5-foot gate and two 2j-foot gates with lowest sill at elevation 958.40 ft (all elevations are referred to datum of 1929). Changes in gate openings are not made.
Gage height, in feet
Feb. 28 Mar. 7 Mar. 14 Mar. 21 Mar. 27 Apr. 5 Apr. 11
6.176.106.086.206.256.808.22
April 18 April 25 May 2 May 9 May 16 May 23 May 30
9.038.868.528.068.077.948.85
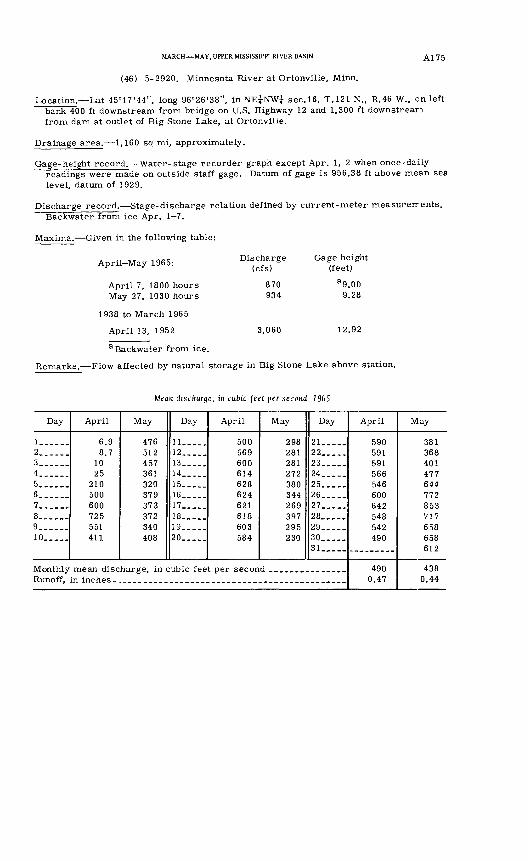
MARCH MAY, UPPER MISSISSIPPI RIVER BASIN
(46) 5-2920. Minnesota River at Ortonville, Minn.
A175
Location. Lat 45°17'44", long 96°26'38", in NE^NWi sec.16, T.121 N., R.46 W., en left bank 400 ft downstream from bridge on U.S. Highway 12 and 1,300 ft downstream from dam at outlet of Big Stone Lake, at Ortonville.
Drainage area. 1,160 sq mi, approximately.
Gage-height record. Water-stage recorder graph except Apr. 1, 2 when once-daily readings were made on outside staff gage. Datum of gage is 956.38 ft above mean sea level, datum of 1929.
Discharge record. Stage-discharge relation defined by current-meter measurerrents. Backwater from ice Apr. 1 7.
Maxima. Given in the following table:
April-May 1965:
April 7, 1800 hours May 27, 1030 hours
1938 to March 1965
April 13, 1952
Discharge (cfs)
870 934
3,060
Gage height (feet)
a9.00 9.28
12.92
a Backwater from ice.
Remarks. Flow affected by natural storage in Big Stone Lake above station.
Mean discharge, in cubic feet per second, 1965
Day
!.____.2. . __3 ______4_____5 ______6___ ___7___ __8_._ __9 ______10 _____
Monthly Runoff,
April
6.9 8.7
10 25
210 500 600 725 551 411
May
476 512 457 361 320 379 373 372 340 408
Day
!!____.12____.13____14_____15____.16__ __17 _____18 _____19-____20 _____
April
500 569 600 614 628 624 621 618 603 584
May
298 281 281 272 380 344 269 397 295 230
Day
21__ ___22 __ __23__ __24 __ __25_____26_____27 __ __28_____29 __ __30 _____31 _____
mean discharge, in cubic feet per second _______________
April
590 591 591 566 546 600 642 548 542 490
490 0.47
May
381 368 401 477 644 772 853 717 658 658 612
438 0.44
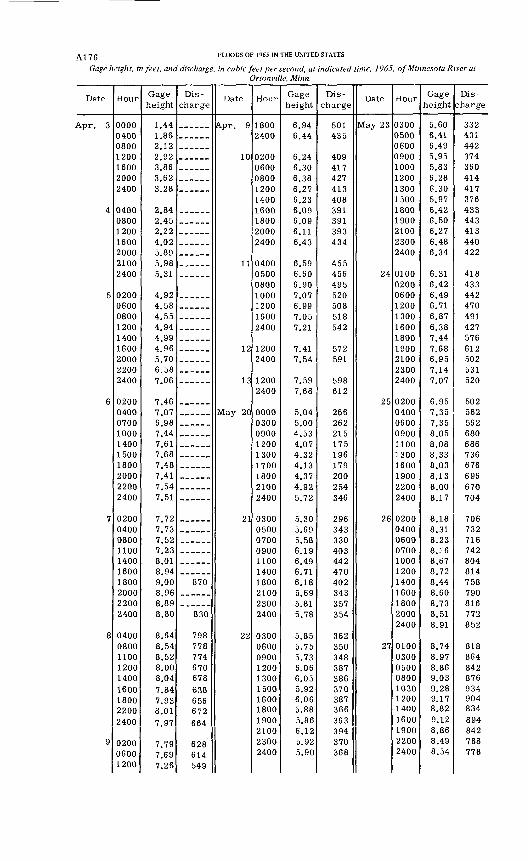
^ j 7 g FLOODS OF 1965 IN THE UNITED STATES
Gage height, in feet, and discharge, in cubic feet per second, at indicated time, 1965, of Minnesota River atOrtonville, Minn.
Date
Apr. 3
4
5
6
7
8
9
Hour
0000 0400 0800 1200 1600 2000 2400
0400 0800 1200 1600 2000 2100 2400
0200 0600 0800 1200 1400 1600 2000 2200 2400
0200 0400 0700 1000 1400 1500 1800 2000 2200 2400
0200 0400 0800 1100 1400 1600 1800 2000 2200 2400
0400 0800 1100 1200 1400 1600 1800 2200 2400
0200 0600 1200
Gage height
1,44 1.86 2.12 2.92 3.86 3.62 3.28
2.84 2.45 2.22 4.02 5.89 5.98 5.31
4.92 4.58 4.55 4.94 4.99 4.96 5.70 6.58 7.06
7.46 7.07 6.98 7.44 7.61 7.68 7.48 7.41 7.54 7.51
7.72 7.73 7.52 7.23 8.01 8.94 9.00 8.96 8.89 8.80
8.64 8.54 8.52 8.00 8.04 7.84 7.93 8.01 7.97
7.79 7.69 7.26
Dis
charge
870
830
798 778 774 670 678 638 656 672 664
628! 614 549
Date
A.pr. 9
10
11
12
13
May 20
21
22
Hour
1800 2400
0200 0600 0800 1200 1400 1600 1800 2000 2400
0400 0500 0800 1000 1200 1600 2400
1200 2400
1200 2400
0000 0300 0900 1200 1300 1700 1800 2100 2400
0300 0500 0700 0900 1100 1400 1800 2100 2300 2400
0300 0600 0900 1200 1300 1500 1600 1800 1900 2100 2300 2400
Gage height
6.94 6.44
6.24 6.30 6.38 6.27 6.23 6.09 6.09 6.11 6.43
6.59 6.60 6.90 7.07 6.99 7.05 7.21
7.41 7.54
7.59 7.68
5.04 5.00 4.53 4.07 4.32 4.13 4.37 4.92 5.72
5.30 5.69 5.58 6.19 6.49 6.71 6.18 5.69 5.81 5.78
5.85 5.75 5.73 6.06 6.05 5.92 6.06 5.88 5.86 6.12 5.92 5.90
Dis
charge
501 435
409 417 427 413 408 391 391 393 434
455 456 495 520 508 518 542
572 591
598 612
266 262 215 175 196 179 200 254 346
296 343 330 403 442 470 402 343 357 354
362 350 348 387 386 370 387 366 363 394 370 368
Date
May 23
24
25
26
27
Hour
0300 0500 0600 0900 1000 1200 1300 1500 1800 1900 2100 2300 2400
0100 0200 0600 1200 1300 1600 1800 1900 2100 2300 2400
0200 0400 0600 0900 1100 1300 1600 1900 2200 2400
0200 0400 0600 0700 1000 1200 1400 1600 1800 2000 2400
0100 0300 0500 0800 1030 1200 1400 1600 1900 2200 2400
Gage height
5.60 6.41 6.49 5.95 5.83 6.28 6.30 5.97 6.42 6.50 6.27 6.48 6.34
6.31 6.42 6.49 6.71 6.87 6.38 7.44 7.68 6.95 7.14 7.07
6.95 7.35 7.35 8.05 8.08 8.33 8.03 8.13 8.00 8.17
8.18 8.31 8.23 8. .C 6 8.67 8.72 8.44 8.60 8.73 8.51 8.91
8.74 8.97 8.86 9.03 9.28 9.17 8.82 9.12 8.86 8.49 8.54
Dis
charge
332 431 442 374 360 414 417 376 433 443 413 440 422
418 433 442 470 491 427 576 612 502 531 520
502 562 562 680 686 736 676 696 670 704
706 732 716 742 804 814 758 790 816 772 852
818 864 842 876 934 904 834 894 842 768 778
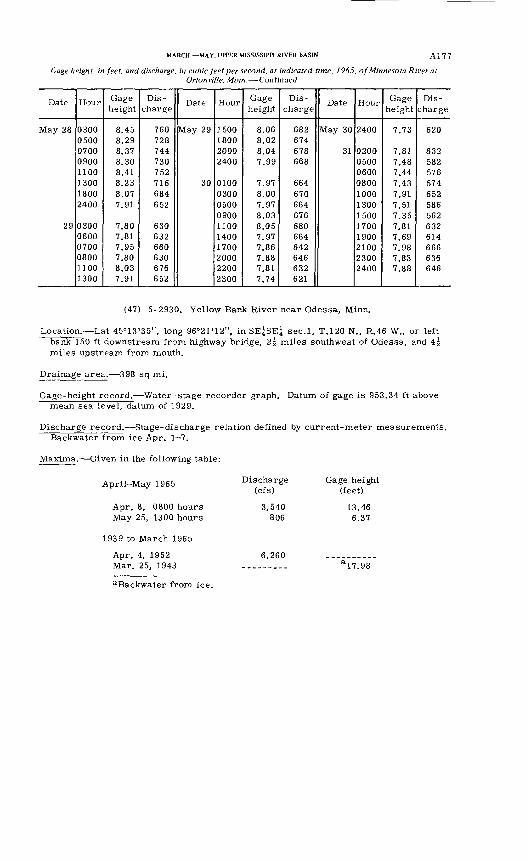
MARCH MAY, UPPER MISSISSIPPI RIVER BASIN A177
Gage height, in feet, and discharge, in cubic feet per second, at indicated time, 1965, of Minnesota River at Ortonville, Minn. Continued
Date
May 28
29
Hour
03000500070009001100130018002400
030006000700080011001300
Gage height
8.458.298.378.308.418.238.077.91
7.807.817.957.808.037.91
Dis
charge
760728744730752716684652
630632660630676652
Date
May 29
30
Hour
1500180020002400
0100030005000900110014001700200022002300
Gage height
8.068.028.047.99
7.978.007.978.038.057.977.867.887.817.74
Dis
charge
682674678668
664670664676680664642646632621
Date
May 30
31
Hour
2400
020005000600080010001300150017001900210023002400
Gage height
7.73
7.817.487.447.437.917.517.357.817.697.987.837.88
Dis
charge
620
632582576574652586562632614666636646
(47) 5-2930. Yellow Bank River near Odessa, Minn.
Location. Lat 45°13'35", long 96°21'12", in SE^SE? sec.l, T.120 N., R.46 W., or left bank 150 ft downstream from highway bridge, 2f miles southwest of Odessa, and 4| miles upstream from mouth.
Drainage area. 398 sq mi.
Gage-height record. Water-stage recorder graph. Datum of gage is 953.34 ft above mean sea level, datum of 1929.
Discharge record. Stage-discharge relation defined by current-meter measurements. Backwater from ice Apr. 1 7.
Maxima. Given in the following table:
April-May 1965
Apr. 8, 0800 hours May 25, 1300 hours
1939 to March 1965
Apr. 4, 1952Mar. 25, 1943
Discharge (cfs)
3,540 806
6,260
Gage height (feet)
13.46 6.37
a!7.98
aBackwater from ice.
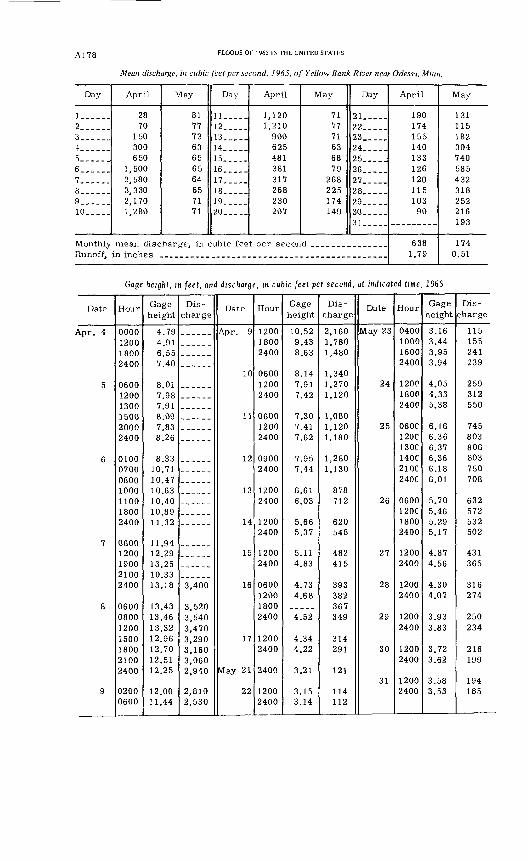
A178 FLOODS OP 1965 IN THE UNITED STATES
Mean discharge, in cubic feet per second, 1965, of Yellow Bank River near Odessa, Minn.
Day
!___--.2......3......4--.-_.S______6_ __ ..7.....8......9... __10,.. _.
April
28 70
150 300 650
1,500 2,580 3,330 2,170 1,280
Monthly mean disc Runoff, in inches
May
81 77 73 63 65 65 64 65 71 71
Day
11. ..12.....13. ..14.....15.....16.....17.....18.....19.....20.....
April
1,120 1,210
900 625 481 381 317 268 230 207
May
71 77 71 63 68 79
268 225 174 149
Day
21 __ ..22.....23.. __24.....25.....26 _____27.. ___28 _____29 __ ..30... ._31.....
harge, in cubic feet per second _______________
April
190 174 155 140 133 126 120 115 103
90
6381.79
May
131 115 182 304 740 585 432 318 252 216 193
174 0.51
Gage height, in feet, and discharge, m cubic feet per second, at indicated time, 1965
Date
Apr. 4
5
6
7
8
9
Hour
0000120018002400
060012001300150020002400
0100070008001000110018002400
06001200190021002400
06000800 1200 1500 1800 2100 2400
0200 0600
Gage height
4.794.916.557.40
8.017.987.918.097.838.26
8.3310.7110.4710.6310.4010.8911.32
11.9412.2913.2510.3313.18
13.4313.46 13.32 12.96 12.70 12.51 12.25
12.0011.44
Dis
charge
3,400
S con
3,540 3,470 3,290 3,160 3,060 2,940
2,810 2,530
Date
Apr. 9
10
11
12
13
14
15
16
17
May 21
22
Hour
120018002400
0600 12002400
060012002400
09002400
12002400
12002400
12002400
0600 1200 18002400
1200 2400
2400
1200 2400
Gage height
10.529.438.63
8.14 7.917.42
7.307.417.62
7.957.44
6.616.03
5.665.37
5.114.83
4.73 4.68
4.52
4.34 4.22
3.21
3.15 3.14
Dis
charge
2,1601,7601,480
1,340 1,2701,120
1,0801,1201,180
1,2801,130
878712
620548
482415
393 382 367349
314 291
121
114 112
Date
May 23
24
25
26
27
28
29
30
31
Hour
0400100016002400
120018002400
060C120C130C 140C210C240C
0600120018002400
12002400
1200 2400
1200 2400
1200 2400
1200 2400
Gage height
3.163.443.953.94
4.054.335.38
6.166.366.37 6.366.186.01
5.705.465.295.17
4.874.56
4.30 4.07
3.93 3.83
3.72 3.62
3.58 3.53
Dis
charge
115155241239
259312550
745803806 803750708
632572532502
431365
316 274
250 234
216 199
194 185
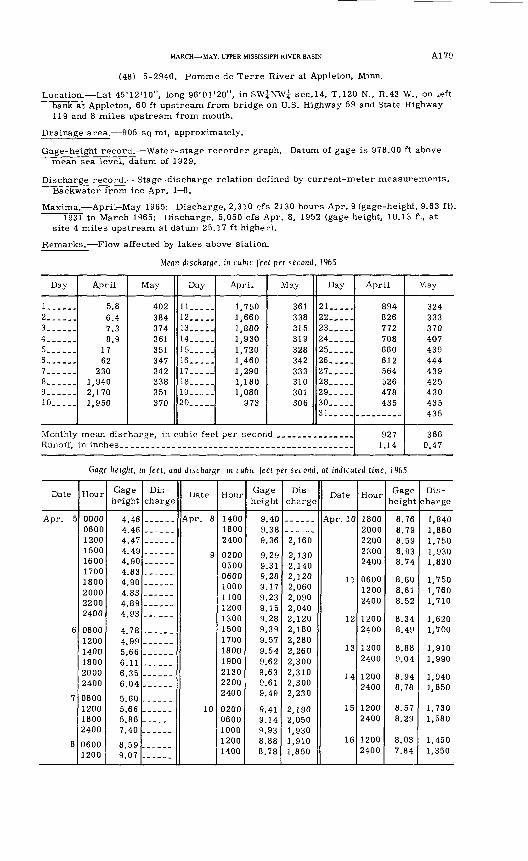
MARCH MAY, UPPER MISSISSIPPI RIVER BASIN
(48) 5-2940. Pomme de Terre River at Appleton, Minn.
A179
Location. Lat 45°12'10", long 96°01'20", in SWjNWj sec.14, T.120 N., R.43 W., on left bank at Appleton, 60 ft upstream from bridge on U.S. Highway 59 and State Highway 119 and 8 miles upstream from mouth.
Drainage area. 905 sq mi, approximately.
Gage-height record. Water-stage recorder graph. Datum of gage is 978.00 ft above mean sea level, datum of 1929.
Discharge record. Stage-discharge relation defined by current-meter measurements. Backwater from ice Apr. 1 8.
Maxima. April-May 1965: Discharge, 2,310 cfs 2130 hours Apr. 9 (gage-height, 9.63 ft).193T to March 1965: Discharge, 5,050 cfs Apr. 8, 1952 (gage height, 10.13 ft, at
site 4 miles upstream at datum 25.17 ft higher).
Remarks.- Flow affected by lakes above station.
Mean discharge, in cubic feet per second, 1965
Day
1. ....2......3. ..4......5......6......7......8......9.... _10.....
Monthly Runoff,
April
5.8 6.4 7.3 8.9
17 62
230 1,940 2,170 1,950
May
402 384 374 361 351 347 342 338 351 370
Day
11__._.12 __ _.13._.__14 __ ._15.....16_____17.._._18__.._19.....20... __
April
1,750 1,660 1,880 1,930 1,720 1,460 1,290 1,180 1,080
973
May
361 338 315 319 328 342 333 310 301 306
Day
21_.___22__ ...23 .....24 .....25__.__26__ ...27__ ...28_._._29_.___30_____31__.__
mean discharge, in cubic feet per second _______________
April
894 826 772 708 660 612 564 526 478 435
927 1.14
May
324 333 370 407 439 444 439 425 430 435 435
366 0.47
Gage height, in feet, and discharge, in cubic feet per second, at indicated time, 1965
Date
6
7
8
Hour
0000060012001500160017001800200022002400
060012001400180020002400
0600120018002400
06001200
Gage height
4.464.464.474.494.904.834.904.834.894.93
4.784.995.666.116.356.04
5.605.665.867.40
8.599.07
Dis
chargeDate
Apr. 8
9
10
Hour
140018002400
050006001000110012001300 1500170018001900213022002400
02000600100012001400
Gage height
9.409.389.36
9.299.319.28
9.239.159.28 9.399.579.549.629.639.619.49
9 419 149.938.888.78
Dis
charge
2,160
2,1302,1402,1202,0602,0902,0402,120 2,1802,2802,2602,3002,3102,3002,230
2 1 an
2,0501 Q°.n
1,9101,850
Date
Apr. 10
11
12
13
14
15
16
Hour
1800
2200oonn
2400
060012002400
1200 2400
12002400
12002400
12002400
12002400
Gage height
8.768 7Q
B ^Q
8 no
8.74
8.608.618.52
8.34 8.49
8.889.04
. y*±* 10
8.578.29
8.037.84
Dis
charge
1,8401,8601,7501 Q^n
1,830
1,7501,7601,710
1,620 1,700
1,9101,990
i. y*±u1,850
1,7301,580
1,4501,350
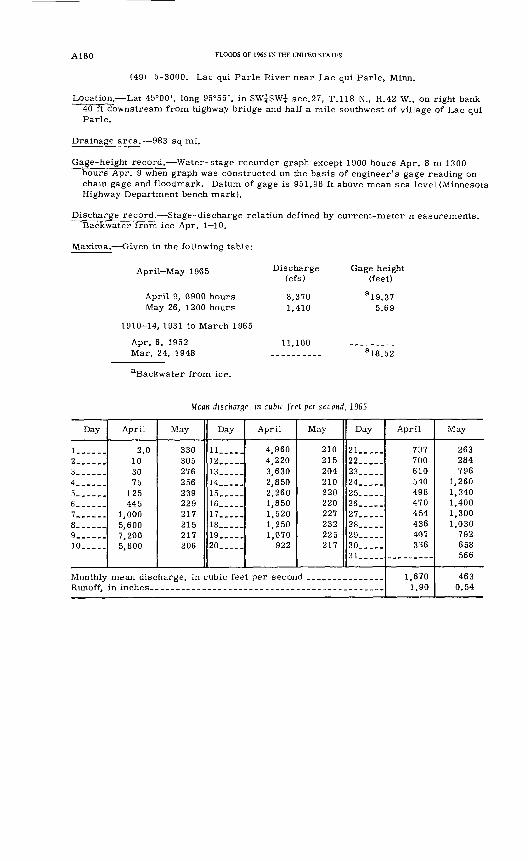
Al 80 FLOODS OF 1965 IN THE UNITED STATES
(49) 5-3000. Lac qui Parle River near Lac qui Parle, Minn.
Location. Lat 45°00' ) long 95 0 55', in SW^SW^ sec.27, T.118 N., R.42 W., on right bank 40 ft downstream from highway bridge and half a mile southwest of village of Lac qui Parle.
Drainage area. 983 sq mi.
Gage-height record. Water-stage recorder graph except 1900 hours Apr. 8 to 1300 hours Apr. 9 when graph was constructed on the basis of engineer's gage reading on chain gage and floodmark. Datum of gage is 951.98 ft above mean sea level (Minnesota Highway Department bench mark).
Discharge record. Stage-discharge relation defined by current-meter rr easurements. Backwater from ice Apr. 1 10.
Maxima. Given in the following table:
pril-May 1965
April 9, 0900 hours May 26, 1200 hours
Discharge (cfs)
8,370 1,410
Gage height (feet)
a !9.37 5.69
1910-14, 1931 to March 1965
Apr. 6, 1952 Mar. 24, 1948
11,100*18.52
aBackwater from ice.
Mean discharge, m cubic feet per second, 1965
Day
!______2_ ____3_ .....4......5 ______6___ ___7 __ __.8___ __9______10 _____
Monthly Runoff,
April
2.0 10 30 75
125 445
1,000 5,600 7,200 5,800
May
330 305 276 256 239 229 217 215 217 206
Day
11 _____12_____13_____14 __ __15 __ _.16__ ___17 .....18_____19.....20__.__
April
4,960 4,220 3,630 2,850 2,260 1,850 1,520 1,250 1,070
922
May
210 215 204 210 220 220 227 232 225 217
Day
21.. ...22 .....23__ ...24 .....25. ....26 __...27__ ...28 .....29 .....30__ ___31 __._.
mean discharge, in cubic feet per second _______________
April
737 700 610 540 498 470 454 436 407 336
1,670 1.90
May
263 284 796
1,260 1,340 1,400 1,300 1,030
792 658 566
463 0.54
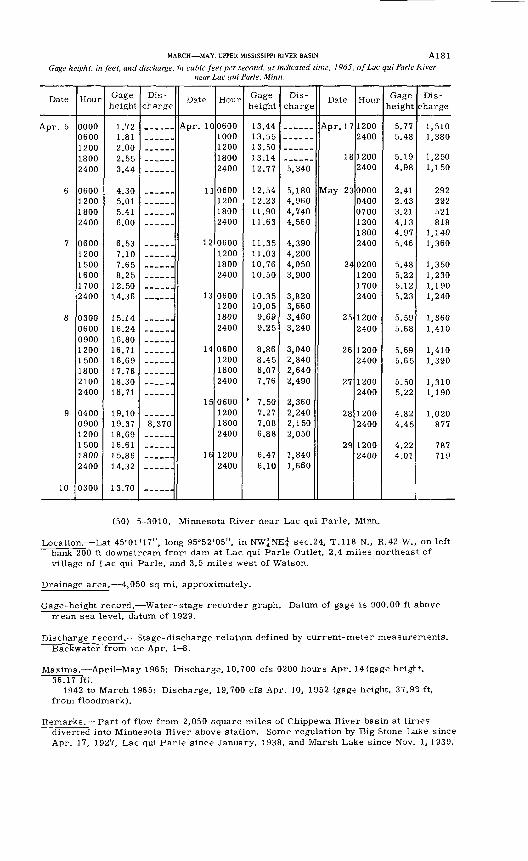
MARCH MAY, UPPER MISSISSIPPI RIVER BASIN Al 8 1
Gage height, in feet, and discharge, in cubic feet per second, at indicated time, 1965, of Lac qui Parle Rivernear Lac qui Parle, Minn.
Date
Apr. 5
6
7
8
9
10
Hour
0000 0600 1200 1800 2400
0600 1200 1800 2400
0600 1200 1500 1600 1700 2400
0300 0600 0900 1200 1500 1800 2100 2400
0400 0900 1200 1500 1800 2400
0300
Gage height
1.72 1.81 2.00 2.55 3.44
4.30 5.01 5.41 6.00
6.53 7.10 7.65 8.25
12.50 14.36
15.14 16.24 16.80 16.71 16.69 17.76 18.30 18.71
19.10 19.37 18.69 16.61 15.86 14.32
13.70
Dis
charge
8,370
Date
Apr. 10
11
12
13
14
15
16
Hour
0600 1000 1200 1800 2400
0600 1200 1800 2400
0600 1200 1800 2400
0600 1200 1800 2400
0600 1200 1800 2400
0600 1200 1800 2400
1200 2400
Gage height
13.44 13.55 13.50 13.14 12.77
12.54 12.23 11.90 11.63
11.35 11.03 10.76 10.50
10.35 10.05 9.69 9.25
8.86 8.45 8.07 7.76
' 7.50 7.27 7.08 6.88
6.47 6.10
Dis
charge
5,340
5,180 4,960 4,740 4,560
4,390 4,200 4,050 3,900
3,820 3,660 3,460 3,240
3,040 2,840 2,640 2,490
2,360 2,240 2,150 2,050
1,840 1,660
Date
Apr. 17
18
May 23
24
25
26
27
28
29
Hour
1200 2400
1200 2400
0000 0400 0700 1200 1800 2400
0200 1200 1700 2400
1200 2400
1200 2400
1200 2400
1200 2400
1200 2400
Gage height
5.77 5.48
5.19 4.98
2.41 2.43 3.21 4.13 4.97 5.46
5.48 5.22 5.12 5.23
5.59 5.68
5.69 5.65
5.50 5.22
4.82 4.45
4.22 4.01
Dis
charge
1,510 1,380
1,250 1,150
292 292 521 818
1,140 1,360
1,350 1,230 1,190 1,240
1,360 1,410
1,410 1,390
1,310 1,190
1,020 877
787 719
(50) 5-3010. Minnesota River near Lac qui Parle, Minn.
Location. Lat 45°01'17", long 95°52'05", in NWiNEi sec.24, T.118 1ST., R.42 W., on left bank 200 ft downstream from dam at Lac qui Parle Outlet, 2.4 miles northeast of village of Lac qui Parle, and 3.5 miles west of Watson.
Drainage area. 4,050 sq mi, approximately.
Gage-height record. Water-stage recorder graph. Datum of gage is 900.00 ft above mean sea level, datum of 1929.
Discharge record. Stage-discharge relation defined by current-meter measurements. Backwater from ice Apr. 1 8.
Maxima.- April-May 1965: Discharge, 10,700 cfs 0200 hours Apr. 14 (gage heigH., 36.17 ft).
1942 to March 1965: Discharge, 19,700 cfs Apr. 10, 1952 (gage height, 37.93 ft, from floodmark).
Remarks. Part of flow from 2,050 square miles of Chippewa River basin at tinesdiverted into Minnesota River above station. Some regulation by Big Stone Lake since Apr. 17, 1927, Lac qui Parle since January, 1938, and Marsh Lake since Nov. 1, 1939.
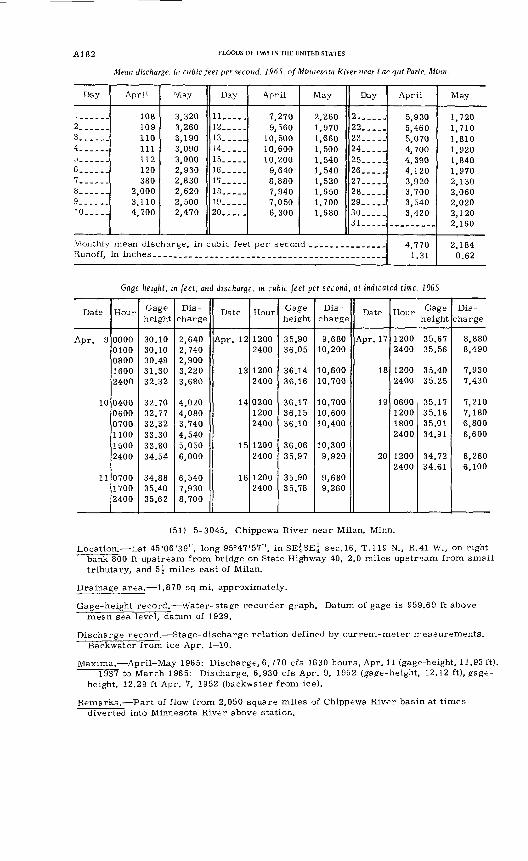
A1 8 2 FLOODS OF 1965 IN THE UNITED STATES
Mean discharge, in cubic feet per second, 1965, of Minnesota River near Lac qui Parle, Minn.
Day
1. ...2. _____3_____4______56______7___,__8......9____-_10..,..
Monthly Runoff,
April
108 109 110 111 112 120 380
2,000 3,110 4,700
May
3,320 3,260 3,190 3,090 3,000 2,930 2,830 2,620 2,500 2,470
Day
11__.__12_____13_____14_.___15_____16_____17_____18.____19.____20_.___
April
7,270 9,560
10,500 10,600 10,200
9,640 8,880 7,940 7,050 6,300
May
2,260 1,970 1,660 1,500 1,540 1,540 1,520 1,650 1,700 1,680
Day
21 __ _.22_____23_____24_____25__.__26 _____27__ __28.___.29_____30_____31__.__
mean discharge, in cubic feet per second _______________
April
5,930 5,460 5,070 4,700 4,390 4,120 3,920 3,700 3,540 3,420
4,770 1.31
May
1,720 1,710 1,810 1,920 1,840 1,970 2,130 2,060 2,020 2,120 2,160
2,184 0.62
Gage height, m feet, and discharge, in cubic feet per second, at indicated time, 1965
Date
Apr. 9
10
11
Hour
00000100080016002400
040006000700110015002400
070017002400
Gage height
30.1030.1030.4931.3032.32
32.7032.7732.3233.3033.8034.54
34.8835.4035.62
Dis
charge
2,6402,7402,9003,2203,680
4,0204,0803,7404,5405,0506,000
6,5407,9308,700
Date
Apr. 12
13
14
15
16
Hour
12002400
12002400
020012002400
12002400
12002400
Gage height
35.9036.05
36.1436.16
36.1736.1536.10
36.0635.97
35.9035.78
Dis
charge
9,68010,200
10,60010,700
10,70010,60010,400
10,3009,920
9,6809,260
Date
Apr. 17
18
19
20
Hour G&ge height
1200 35.672400 35.56
1200 35.402400 35.25
0600120018002400
12002400
35.1735.1635.0134.91
34.7234.61
Dis
charge
8,8808,490
7,9307,430
7,2107,1806,8006,600
6,2606,100
(51) 5-3045. Chippewa River near Milan, Minn.
Location. Lat 45°06'39", long 95°47'57", in SE^SE^ sec.16, T.119 N., R.41 W., on right bank 800 ft upstream from bridge on State Highway 40, 2.0 miles upstream from small tributary, and 5^ miles east of Milan.
Drainage area. 1,870 sq mi, approximately.
Gage-height record. Water-stage recorder graph. Datum of gage is 959.69 ft above mean sea level, datum of 1929.
Discharge record. Stage-discharge relation defined by current-meter rreasurements. Backwater from ice Apr. 1 10.
Maxima.- April-May 1965: Discharge, 6,770 cfs 1630 hours, Apr. 11 (gage-height, 11.93 ft).T9T7 to March 1965: Discharge, 6,930 cfs Apr. 9, 1952 (gage-height, 12.12 ft), gage-
height, 12.29 ft Apr. 7, 1952 (backwater from ice).
Remarks.- Part of flow from 2,050 square miles of Chippewa River basin at times diverted into Minnesota River above station.
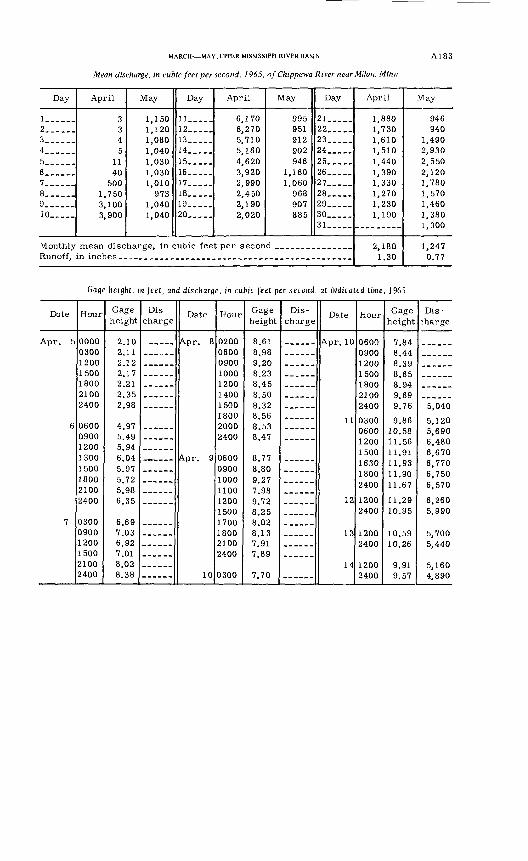
MARCH MAY, UPPER MISSISSIPPI RIVER BASIN
Mean discharge, in cubic feet per second, 1965, of Chippewa River near Milan, Minn.
A183
Day
!__--__2. . ...3. __ ..4 ____5__.__.6 ___ ..7 ._._..8. _._._9 ......10.. ...
Monthly Runoff,
April
3 3 4 5
11 40
500 1,750 3,100 3,900
May
1,150 1,120 1,080 1,040 1,030 1,030 1,010
973 1,040 1,040
Day
11 ___ .12____.13__ ...14 __ ..15.. ...16. _ ...17 .....18. _ ...19-.-..20., ...
April
6,170 6,270 5,710 5,160 4,620 3,920 2,990 2,450 2,190 2,020
May
995 951 912 902 946
1,160 1,060
968 907 885
Day
21.. ...22_____23. _ ...24 .....25. ....26... __27 .....28 .....29 .....30 .....31 .....
mean discharge, in cubic feet per second _______________
April
1,880 1,730 1,610 1,510 1,440 1,390 1,330 1,270 1,230 1,190
2,180 1.30
May
946 940
1,490 2,930 2,550 2,120 1,780 1,570 1,460 1,380 1,300
1,247 0.77
Gage height, m feet, and discharge, in cubic feet per second, at indicated time, 1965
Date
Apr. 5
6
7
Hour
0000 0300 1200 1500 1800 2100 2400
0600 0900 1200 1300 1500 1800 2100 2400
0300 0900 1200 1500 2100 2400
Gage height
2.10 2.11 2.12 2.17 2.21 2.35 2.98
4.97 5.49 5.94 6.04 5.97 5.72 5.98 6.35
6.69 7.03 6.92 7.01 8.02 8.38
Dis
charge
Date
Apr. 8
Apr. 9
10
Hour
0200 0600 0900 1000 1200 1400 1500 1800 2000 2400
0600 0900 1000 1100 1200 1500 1700 1800 2100 2400
0300
Gage height
8.61 8.98 9.20 8.23 8.45 8.50 8.32 8.56 8.53 8.47
8.77 8.80 9.27 7.98 9.72 8.25 8.02 8.13 7.91 7.89
7.70
Dis
chargeDate
Apr. 10
11
12
13
14
Hour
0600 0900 1200 1500 1800 2100 2400
0300 0600 1200 1500 1630 1800 2400
1200 2400
1200 2400
1200 2400
Gage height
7.84 8.44 8.39 8.65 8.94 9.69 9.76
9.86 10.58 11.56 11.91 11.93 11.90 11.67
11.29 10.95
10.59 10.26
9.91 9.57
Dis
charge
5,040
5,120 5,690 6,480 6,670 6,770 6,750 6,570
6,260 5,990
5,700 5,440
5,160 4,890
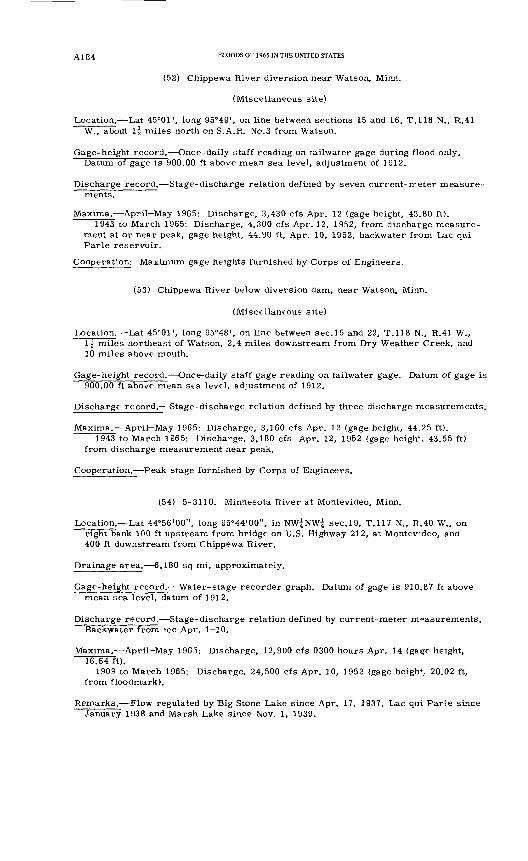
A1 84 FLOODS OF 1965 IN THE UNITED STATES
(52) Chippewa River diversion near Watson, Minn.
(Miscellaneous site)
Location. Lat 45°01', long 95°49', on line between sections 15 and 16, T.I 18 N., R.41 W., about 1^ miles north on S.A.R. No.3 from Watson.
Gage-height record. Once-daily staff reading on tailwater gage during flood only. Datum of gage is 900.00 ft above mean sea level, adjustment of 1912.
Discharge record. Stage-discharge relation defined by seven current-ireter measure ments.
Maxima.- April-May 1965: Discharge, 3,430 cfs Apr. 12 (gage height, 43.80 ft).1943 to March 1965: Discharge, 4,300 cfs Apr. 12, 1952, from discharge measure
ment at or near peak, gage height, 44.90 ft, Apr. 10, 1952, backwater from Lac qui Parle reservoir.
Cooperation: Maximum gage heights furnished by Corps of Engineers.
(53) Chippewa River below diversion dam, near Watson, Minn.
(Miscellaneous site)
Location. Lat 45°01', long 95°48', on line between sec.15 and 22, T.118 N., R.41 W., 1^ miles northeast of Watson, 2.4 miles downstream from Dry Weather Creek, and 10 miles above mouth.
Gage-height record. Once-daily staff gage reading on tailwater gage. Datum of gage is 900.00 ft above mean sea level, adjustment of 1912.
Discharge record.- Stage-discharge relation defined by three discharge measurements.
Maxima.- April-May 1965: Discharge, 3,160 cfs Apr. 12 (gage height, 44.25 ft).1943 to March 1965: Discharge, 3,180 cfs Apr. 12, 1952 (gage heigh1:. 43.55 ft)
from discharge measurement near peak.
Cooperation. Peak stage furnished by Corps of Engineers.
(54) 5-3110. Minnesota River at Montevideo, Minn.
Location. Lat 44°56'00", long 95°44'00", in NW|NW| sec.19, T.117 N., R.40 W., on right bank 100 ft upstream from bridge on U.S. Highway 212, at Montevideo, and 400 ft downstream from Chippewa River.
Drainage area. 6,180 sq mi, approximately.
Gage-height record. Water-stage recorder graph. Datum of gage is 910.87 ft above mean sea level, datum of 1912.
Discharge record. Stage-discharge relation defined by current-meter measurements. Backwater from ice Apr. 1 10.
Maxima.- April-May 1965: Discharge, 12,900 cfs 0300 hours Apr. 14 (gage height, 16.64 ft).
1909 to March 1965: Discharge, 24,500 cfs Apr. 10, 1952 (gage heigh*.. 20.02 ft, from floodmark).
Remarks.- Flow regulated by Big Stone Lake since Apr. 17, 1937, Lac qui Parle since January 1938 and Marsh Lake since Nov. 1, 1939.
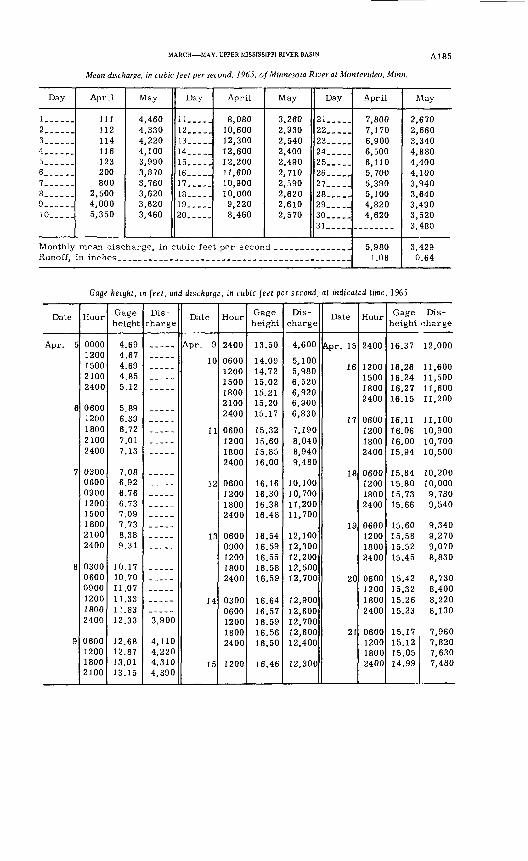
MARCH MAY, UPPER MISSISSIPPI RIVER BASIN
Mean discharge, in cubic feet per second, 1965, of Minnesota River at Montevideo, Minn.
A185
Day
1------2__ ....3_____4......5- __.67......8......9 ____ .10.....
Monthly Runoff,
April
111 112 114 116 123 200 800
2,500 4,000 5,350
May
4,460 4,330 4,220 4,100 3,990 3,870 3,760 3,620 3,620 3,460
Day
11-....12.....13.....14..._.15.....16..._.17.....18.-...19--...20.....
April
8,080 10,600 12,300 12,600 12,200 11,600 10,900 10,000 9,220 8,460
May
3,260 2,930 2,540 2,400 2,490 2,710 2,590 2,620 2,610 2,570
Day
21.....22 ___ .23 __ ..24 ___ .25.....26 ___27.....28 .....29.....30.....31.....
mean discharge, in cubic feet per second ._..._..__._.._
April
7,800 7,170 6,900 6,500 6,110 5,700 5,390 5,100 4,820 4,620
5,980 1.08
May
2,670 2,660 3,340 4,880 4,400 4,100 3,940 3,640 3,490 3,520 3,480
3,429 0.64
Gage height, in feet, and discharge, in cubic feet per second, at indicated time, 1965
Date
Apr. 5
6
7
8
9
Hour
0000 1200 1500 2100 2400
0600 1200 1800 2100 2400
0300 0600 0900 1200 1500 1800 2100 2400
0300 0600 0900 1200 1800 2400
0600 1200 1800 2100
Gage height
4.69 4.67 4.69 4.85 5.12
5.89 6.39 6.72 7.01 7.13
7.08 6.92 6.76 6.73 7.09 7.73 8.38 9.31
JO. 17 10.70 11.07 11.33 11.83 12.33
12.68 12.87 13.01 13.15
Dis charge
3,900
4,110 4,220 4,310 4,390
Date
Apr. 9
10
11
12
13
14
15
Hour
2400
0600 1200 1500 1800 2100 2400
0600 1200 1800 2400
0600 1200 1800 2400
0600 0900 1200 1800 2400
0300 0600 1200 1800 2400
1200
Gage height
13.50
14.09 14.72 15.02 15.21 15.20 15.17
15.32 15.60 15.85 16.00
16.16 16.30 16.38 16.48
16.54 16.59 16.55 16.58 16.59
16.64 16.57 16.59 16.56 16.50
16.46
Dis
charge
4,600
5,100 5,980 6,520 6,920 6,900 6,830
7,190 8,040 8,940 9,480
10,100 10,700 11,200 11,700
12,100 12,300 12,200 12,500 12,700
12,900 12,600 12,700 12,600 12,400
12,300
Date
Apr. 15
16
17
18
19
20
21
Hour
2400
1200 1500 1800 2400
0600 1200 1800 2400
0600 1200 1800 2400
0600 1200 1800 2400
0600 1200 1800 2400
0600 1200 1800 2400
Gage Dis- height charge
16.37
16.26 16.24 16.27 16.15
16.11 16.06 16.00 15.94
15.84 15.80 15.73 15.66
15.60 15.58 15.52 15.45
15.42 15.32 15.26 15.23
15.17 15.12 15.05 14.99
12,000
11,600 11,500 11,600 11,200
11,100 10,900 10,700 10,500
10,200 10,000 9,780 9,540
9,340 9,270 9,070 8,830
8,730 8,400 8,220 8,130
7,960 7,820 7,630 7,480
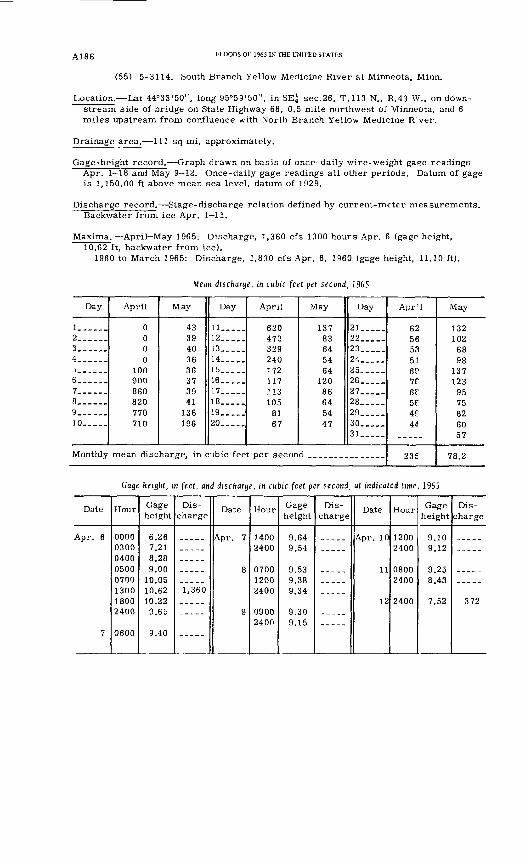
A1 8 6 FLOODS OF 1965 IN THE UNITED STATES
(55) 5-3114. South Branch Yellow Medicine River at Minneota, Minn.
Location. Lat 44°33'50", long 95°59'50", in SE^ sec.26, T.113 N., R.43 W., on down stream side of bridge on State Highway 68, 0.5 mile northwest of Minneota, and 6 miles upstream from confluence with North Branch Yellow Medicine R : ver.
Drainage area. 111 sq mi, approximately.
Gage-height record. Graph drawn on basis of once-daily wire-weight gage readings Apr. 1 18 and May 9 12. Once-daily gage readings all other periods. Datum of gage is 1,150.00 ft above mean sea level, datum of 1929.
Discharge record. Stage-discharge relation defined by current-meter measurements. Backwater from ice Apr. 1 11.
Maxima. April-May 1965: Discharge, 1,360 cfs 1300 hours Apr. 6 (gage height, 10.62 ft, backwater from ice).
1960 to March 1965: Discharge, 1,830 cfs Apr. 6, 1960 (gage height, 11.10 ft).
Mean discharge, in cubic feet per second, 1965
Day
1 __ __2... __3 ______4 ______5__._._6 ______7 __ __8 ______9___ ___10 _____
April
0 0 0 0
100 900 860 820 770 710
May
43 39 40 36 36 37 39 41 136 196
Day
11 _____12 _____13_____14 __ _.15_____16__ ___17__ ___18__ __19__ ___20__ __
April
620 472 329 240 172 117 113 105 81 67
Monthly mean discharge, in cubic feet per secon
May
137 83 64 54 64
120 86 64 54 47
Day
21__ ___22 __ __23__ __24 _____25... __26 _____27 _____28 _____29_____30 _____31 _____
d __ __ __ _. __
AprU
62 56 53 51 6P 7f 6F 5f 4f 44
235
May
132 102 68 98
137 123 95 75 62 60 57
78.2
Gage height, m feet, and discharge, in cubic feet per second, at indicated time, 1965
Date Hour
00000300040005000700130018002400
0600
Gage height
6.267.218.289.00
10.0510.6210.229.65
9 40
Dis charge
1,360
Date
8
g
Hour
2400
070012002400
09002400
Gage height
9 649 54
9.539.389.34
9.309.15
Dis charge
Date
Apr. 10
11
12
Hour
12002400
08002400
2400
Gage height
9 109 12
9.258.43
7.52
Dis charge
372
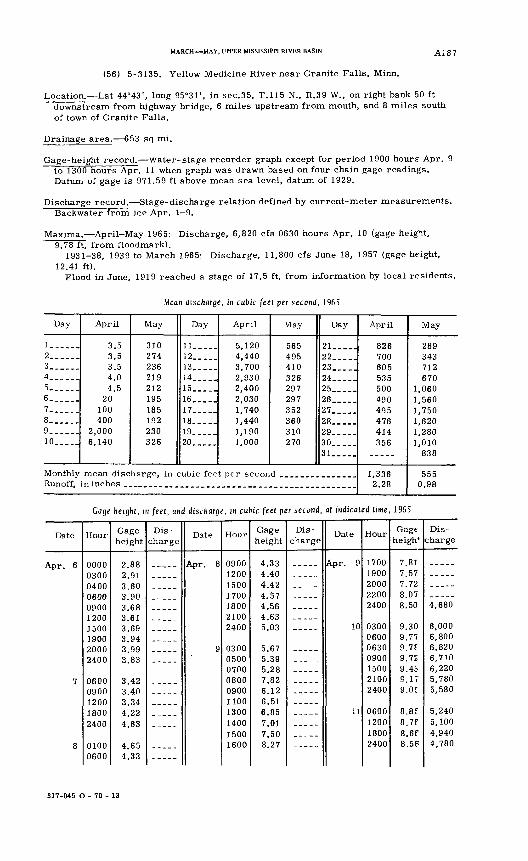
MARCH MAY, UPPER MISSISSIPPI RIVER BASIN
(56) 5-3135. Yellow Medicine River near Granite Falls, Minn.
A187
Location. Lat 44°43', long 95°31', in sec.35, T.115 N., R.39 W., on right bank 50 ft downstream from highway bridge, 6 miles upstream from mouth, and 8 miles south of town of Granite Falls.
Drainage area. 653 sq mi.
Gage-height record. Water-stage recorder graph except for period 1900 hours Apr. 9 to 1300 hours Apr. 11 when graph was drawn based on four chain gage readings. Datum of gage is 971.59 ft above mean sea level, datum of 1929.
Discharge record. Stage-discharge relation defined by current-meter measurements. Backwater from ice Apr. 1 9.
Maxima. April-May 1965: Discharge, 6,820 cfs 0630 hours Apr. 10 (gage height, 9.78 ft, from floodmark).
1931-38, 1939 to March 1965: Discharge, 11,800 cfs June 18, 1957 (gage height, 12.41 ft).
Flood in June, 1919 reached a stage of 17.5 ft, from information by local residents.
Mean discharge, in cubic (eel per second, 1965
Day
1-2__ __ .3......4__ ...5. _6. __ .7......8 __ ..9. ___10.. .
Monthly Runoff,
April
3.5 3.5 3.5 4.0 4.5
20 100 400
2,000 6,140
May
310 274 236 219 212 195 185 192 230 326
Day
ll._--.12.....13.. __14 __ ..15 __ _.16.....17 __ ..18.....19.. ...20 __ __
April
5,120 4,440 3,700 2,930 2,400 2,030 1,740 1,440 1,190 1,000
May
565 495 410 326 297 297 352 360 310 270
Day
21____.22 __ .23_____94
25.....26 ___ .27 __ .28 __ .29 .....30.....31.....
mean discharge, in cubic feet per second _._._._.__._.__ in inches
April
826 700 605 535 500 490 495 476 414 356
1,336 2.28
May
289 343 712 670
1,060 1,560 1,750 1,620 1,280 1,010
838
555 0.98
Gage height, in feet, and discharge, in cubic feet per second, at indicated time, 1965
Date
7
Hour
0000
04000600
1500190020002400
06000900120018002400
01000600
Gage height
2 00
") Q1
3 cn
3 C O
3.613 693.943 993 QQ
3 423 403 344.224 63
4 654.33
Dis charge
---._
Date
g
Hour
120015001700180021002400
0300050007000800090011001300140015001600
Gage height
4.334.404 424.574.564.635.03
5.675.395.287.826.126.516.857.017 508.27
Dis
chargeDate
Apr. 9
10
11
Hour
1700]900200022002400
0300060006300900150021002400
0600120018002400
Gage heigh4.
7.817.577.728.078.50
9.309.779.789.729. 459. IT9.05
8.8F8.7F8.6f8.56
Dis charge
4,680
6,0006,8006,8206,7106,2205,7805,580
5,2405,1004,9404,780
317-045 0-70-13
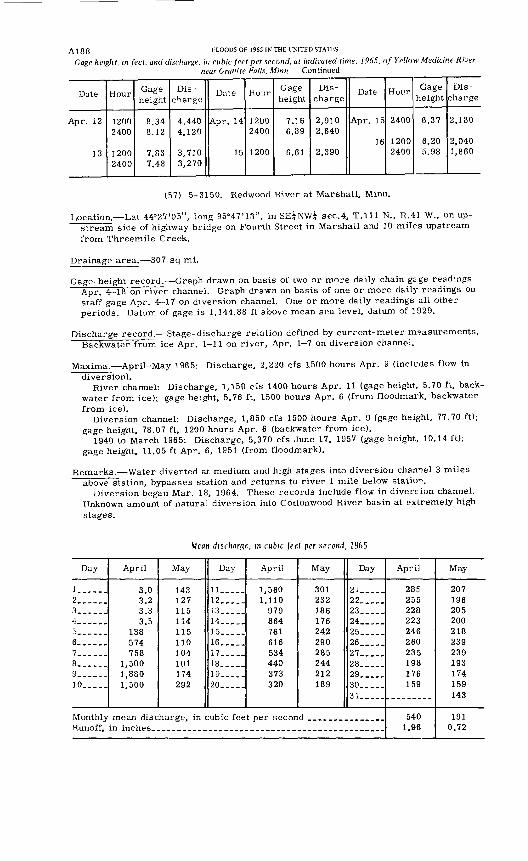
A1 8 8 FLOODS OF 1965 IN THE UNITED STATES
Gage height, in feet, and discharge, in cubic feet per second, at indicated time, 1965, of Yellow Medicine River near Granite Falls, Minn. Continued
Date
Apr. 12
13
Hour
12002400
12002400
Gage height
8.348.12
7.837.48
Dis charge
4,4404,120
3,7103,270
Date
Apr. 14
15
Hour
12002400
1200
Gage height
7.166.89
6.61
Dis
charge
2,9102,640
2,390
Date
Apr. 15
16
Hour
2400
12002400
Gage height
6.37
6.205.98
Dis
charge
2,180
2,0401,860
(57) 5-3150. Redwood River at Marshall, Minn.
Location. Lat 44°27'05", long 95°47'13", in SE^NW^ sec.4, T.lll N., R.41 W., on up- stream side of highway bridge on Fourth Street in Marshall and 10 miles upstream from Threemile Creek.
Drainage area. 307 sq mi.
Gage-height record. Graph drawn on basis of two or more daily chain g£ ge readings Apr. 4 18 on river channel. Graph drawn on basis of one or more daily readings on staff gage Apr. 4-17 on diversion channel. One or more daily readings all other periods. Datum of gage is 1,144.88 ft above mean sea level, datum of 1929.
Discharge record. Stage-discharge relation defined by current-meter measurements. Backwater from ice Apr. 1-11 on river, Apr. 1-7 on diversion channel.
Maxima. April-May 1965: Discharge, 2,220 cfs 1500 hours Apr. 9 (includes flow in diversion).
River channel: Discharge, 1,150 cfs 1400 hours Apr. 11 (gage height, 5.70 ft, back water from ice); gage height, 5.76 ft, 1500 hours Apr. 6 (from floodmark, backwater from ice).
Diversion channel: Discharge, 1,850 cfs 1500 hours Apr. 9 (gage height, 77.70 ft); gage height, 78.07 ft, 1200 hours Apr. 6 (backwater from ice).
1940 to March 1965: Discharge, 5,370 cfs June 17, 1957 (gage height, 10.14 ft); gage height, 11.05 ft Apr. 6, 1951 (from floodmark).
Remarks. Water diverted at medium and high stages into diversion enamel 3 miles above station, bypasses station and returns to river 1 mile below station.
Diversion began Mar. 18, 1964. These records include flow in diversion channel. Unknown amount of natural diversion into Cottonwood River basin at extremely high stages.
Mean discharge, in cubic feet per second, J965
Day
!__---_2.. ___3......4___...
6_ _____7______8______9____.10__ ___
Monthly Runoff,
April
3.0 3.2 3.3 3.5
138 574 758
1,500 1,880 1,500
May
143 127 115 114 115 110 104 101 174 292
Day
11_____12_____13.____14_____15_____16. __ .17 __ ._18.____19 __ __ 20_____
April
1,560 1,110
979 864 761 616 534 440 373 320
mean discharge, in cubic feet per secon in inches
May
301 232 186 176 242 290 285 244 212 189
Day
21__ __22 _____23__ ...24__ __25__ __26 _____27__ __28 _____29__ __30__ ___31__ __
d ___ ____ _____
April
285 255 228 223 246 260 235 198 176 159
540 1.96
May
207 196 205 200 218 239 239 193 174 159 143
191 0.72
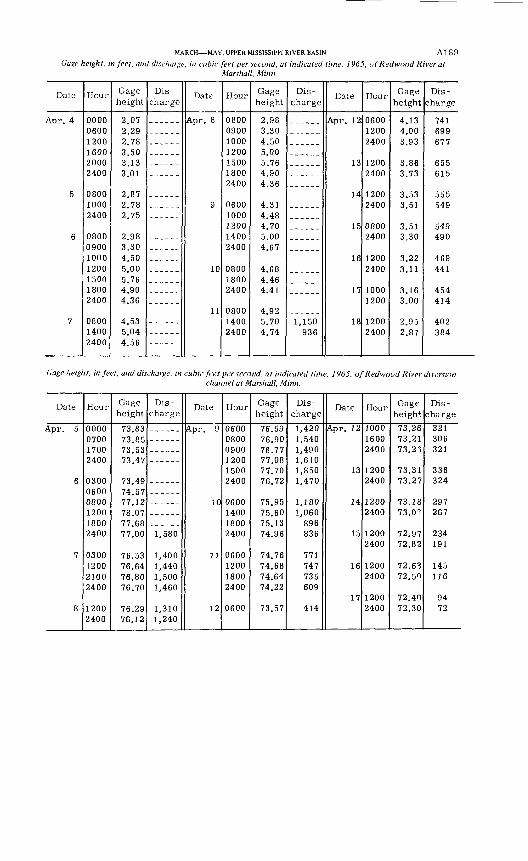
MARCH MAY, UPPER MISSISSIPPI RIVER BASIN Al 89
Gage height, in feet, and discharge, in cubic feet per second, at indicated time, 1965, of Redwood River atMarshall, Minn.
Date
5
6
7
Hour
000006001200160020002400
080010002400
0800090010001200150018002400
14002400
Gage height
2.072.292.783.50919
301
2.872.782.75
2.983.304.505.005.764.904.36
4.535 044 56
Dis
chargeDate
9
10
11
Hour
0800090010001200150018002400
06001000120014002400
080018002400
080014002400
Gage height
2.983.304.505.005.764.904.36
4.314.484.705.004.67
4.684.464.41
4.925 70
4.74
Dis
charge
1,150Q9R
Date
Apr. 12
13
14
15
16
17
1 Q
Hour
060012002400
12002400
12002400
08002400
12002400
10001200
12002400
Gage height
4.134.003.93
3.863 73
3 533.51
3.513.30
3.223.11
3.163.00
2 95
2 0 >?
Dis
charge
741699677
655615
555549
549490
469441
454414
402384
Gage height, in feet, and discharge, in cubic feet per second, at indicated time, 1965, of Redwood River diversionchannel at Marshall, Minn.
Date
Apr. 5
6
7
8
Hour
0000070017002400
030006000800120018002400
0300120021002400
12002400
Gage height
73.8373.8579 ^91 O . OO
73 47
73 4974 5777 1 9i i . i &7Q fi7 I o.U I
77.6877.00
76.5376.6476.8076.70
76.2976.12
Dis
charge
1,580
1,4001,4401,5001,460
1,3101,240
Date
A-pr. 9
10
11
12
Hour
060008000900120015002400
0600140018002400
0600120018002400
0600
Gage height
76.5976.907C 77 IV.it
77 HQ 1 1 .Uo
77.7076.72
75 9575.6075.1374.96
74.7674.6874.6474.22
73.57
Dis
charge
1,4201,5401 4901,6101,8501,470
1,1801,060
896836
771747735609
414
Date
Apr. 12
13
14
15
16
17
Hour
100016002400
12002400
12002400
12002400
12002400
12002400
Gage heigh*.
73.26732173 23'
73.3179 971 O . ft 1
73.1873.0?
72.9772.82
72.6?72.5"
72.4072.30
Dis
charge
321306321
336324
9Q7£i& 1
267
234191
145116
9472
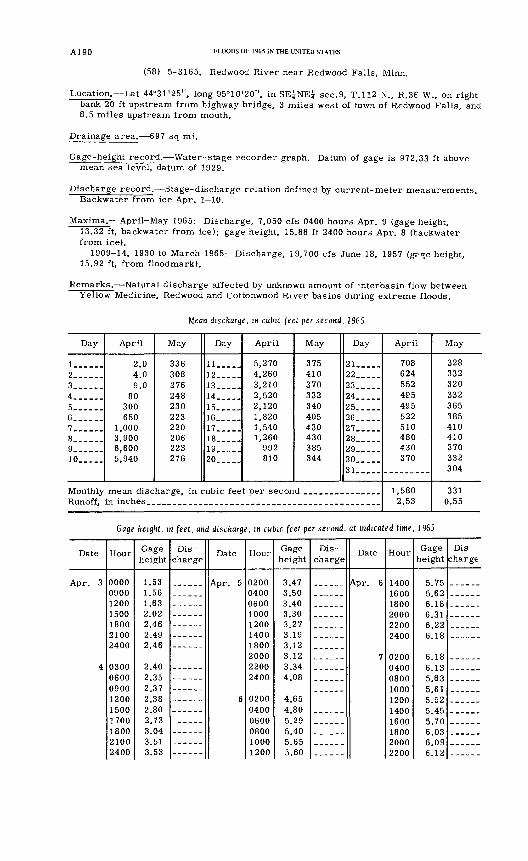
A190 FLOODS OF 1965 IN THE UNITED STATES
(58) 5-3165. Redwood River near Redwood Falls, Minn.
Location. Lat 44°31'25", long 95°10'20", in SE|NE| sec.9, T.112 N., R.36 W., on right bank 20 ft upstream from highway bridge, 3 miles west of town of Redwood Falls, and 8.5 miles upstream from mouth.
Drainage area. 697 sq mi.
Gage-height record. Water-stage recorder graph. Datum of gage is 972.33 ft above mean sea level, datum of 1929.
Discharge record. Stage-discharge relation defined by current-meter measurements. Backwater from ice Apr. 1 10.
Maxima. April-May 1965: Discharge, 7,050 cfs 0400 hours Apr. 9 (gage height, 13.32 ft, backwater from ice); gage height, 15.88 ft 2400 hours Apr. 8 (backwater from ice).
1909-14, 1930 to March 1965: Discharge, 19,700 cfs June 18, 1957 (g?<?e height, 15.92 ft, from floodmark).
Remarks. Natural discharge affected by unknown amount of interbasin flow between Yellow Medicine, Redwood and Cottonwood River basins during extreme floods.
Mean discharge, in cubic feet per second, 1965
Day
1 ______2 ______3 ______4______5 ______6 ______7 ______8 ______9 __ ._10 _____
Monthly Runoff,
April
2.0 4.0 9.0
80 300 650
1,000 3,900 6,600 5,940
May
336 308 276 248 230 223 220 206 223 276
Day
11_____12 __ __13 __ __14 __ _,15_____16____,17__ __18 _____19__ __20__ __
April
5,270 4,260 3,210 2,520 2,120 1,820 1,540 1,260
992 810
May
375 410 370 332 340 405 430 430 385 344
Day
21 _____22_____23 _____24 _____25. ____26 _____27 _____28 _____29__ ___30__ __31 __ __
mean discharge, in cubic feet per second _______________ in inches _ __ __ _
April
708 624 552 495 495 522 510 480 430 370
1,580 2.53
May
328 332 320 332 365 385 410 410 370 332 304
331 0.55
Gage height, in feet, and discharge, in cubic feet per second, at indicated time, 1965
Date
4
Hour
0000090012001500180021002400
030006000900120015001700180021002400
Gage height
1.531.561.632.022.462.492.46
2.402.352.372.382.802.733.043.513.53
Dis
chargeDate
6
Hour
0200040006001000120014001800200022002400
020004000600080010001200
Gage height
3.473.503.403.303.273.193.123.123.344.08
4.654.805.295.405.655.60
Dis
chargeDate
Apr. 6
7
Hour
140016001800200022002400
0200040008001000120014001600180020002200
Gage height
5.755.626.186.316 0 o
6.18
6.186 1 Q
5.63
5 525 455 7fl
6 AO
6.096.12
Dis
charge
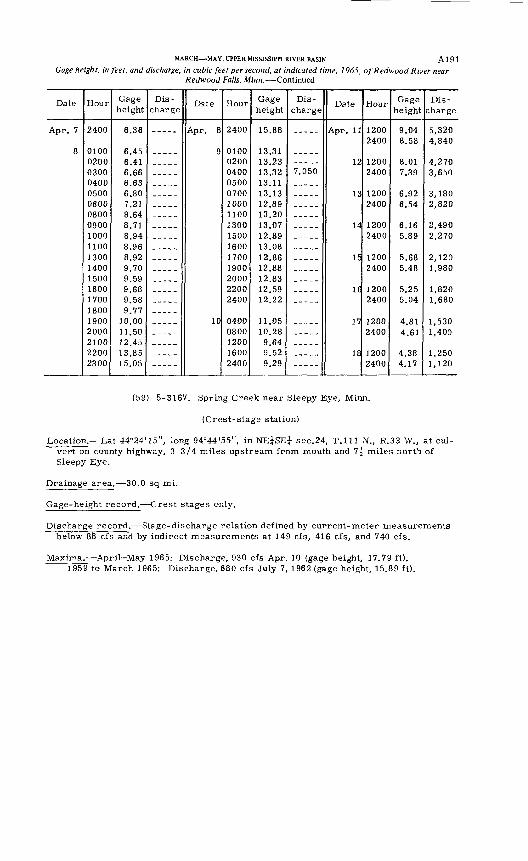
MARCH MAY, UPPER MISSISSIPPI RIVER BASIN A1 91
Gage height, in feet, and discharge, in cubic feet per second, at indicated time, 1965, of Redwood River near Redwood Falls, Minn. Continued
Date
Apr. 7
8
Hour
2400
010002000300040005000600080009001000110013001400150016001700
19002000210022002300
Gage height
6.36
6.456.416.666.636.807.218.648.718.948.968.929.709.599.689.589 77
10.0011.5012.4513.8515.05
Dis
chargeDate
9
10
Hour
2400
010002000400050007001000110013001500160017001900200022002400
04000800120016002400
Gage height
15.88
13.311 9 99
13.3213.1113.1312.8913.2013.0712.8913.0812.8612.8812.8312.5912.22
11.0510.289.649.529.29
Dis
charge
7,050
Date
14
15
If
18
Hour
12002400
12002400
12002400
12002400
12002400
12002400
12002400
12002400
Gage height
9 f\A
8.58
8.017 SQ
6 Q9
6.54
6.165.89
5.685.48
5.255.04
4.814.61
4 OQ
4.17
Dis
charge
S oon
4,840
4,2703,650
3,1802,820
2,4902,270
2,1201,980
1,8201,680
1,5301,400
1,120
(59) 5-3167. Spring Creek near Sleepy Eye, Minn.
(Crest-stage station)
Location. Lat 44°24'15", long 94°44'55", in NE^SE^ sec.24, T.lll N., R.33 W., at cul vert on county highway, 3-3/4 miles upstream from mouth and 7f miles north of Sleepy Eye.
Drainage area. 30.0 sq mi.
Gage-height record. Crest stages only.
Discharge record. Stage-discharge relation defined by current-meter measurements below 88 cfs and by indirect measurements at 149 cfs, 416 cfs, and 740 cfs.
Maxima.- April-May 1965: Discharge, 930 cfs Apr. 10 (gage height, 17.79 ft). 1959 to March 1965: Discharge, 680 cfs July 7, 1962 (gage height, 15.89 ft).
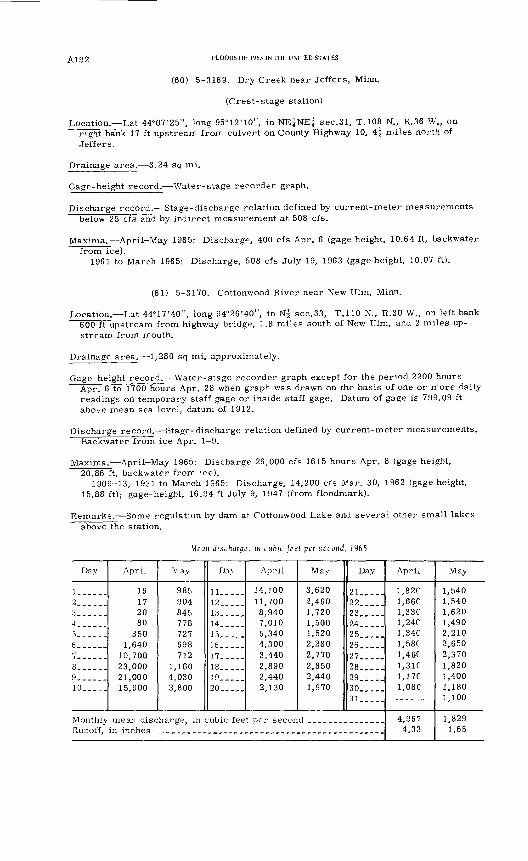
A } g 2 FLOODS OF 1965 IN THE UNITED STATES
(60) 5-3169. Dry Creek near Jeffers, Minn.
(Crest-stage station)
Location. Lat 44°07'25", long 95°12'10", in NE|NE| sec.31, T.108 N., R.36 W., on right bank 17 ft upstream from culvert on County Highway 10, 4| miles north of Jeffers.
Drainage area. 3.24 sq mi.
Gage-height record. Water-stage recorder graph.
Discharge record. Stage-discharge relation defined by current-meter measurements below 25 cfs and by indirect measurement at 508 cfs.
Maxima.- April-May 1965: Discharge, 400 cfs Apr. 6 (gage height, 10.64 ft, backwater from ice).
1961 to March 1965: Discharge, 508 cfs July 19, 1963 (gage height, 10.07 ft).
(61) 5-3170. Cottonwood River near New Ulm, Minn.
Location. Lat 44°17'40", long 94°26'40", in N| sec.33, T.110 N., R.30 W., on left bank 600 ft upstream from highway bridge, 1.8 miles south of New Ulm, and 2 miles up stream from mouth.
Drainage area. 1,280 sq mi, approximately.
Gage-height record. Water-stage recorder graph except for the period 2200 hours Apr. 6 to 1700 hours Apr. 28 when graph was drawn on the basis of one or more daily readings on temporary staff gage or inside staff gage. Datum of gage is 799.09 ft above mean sea level, datum of 1912.
Discharge record. Stage-discharge relation defined by current-meter measurements. Backwater from ice Apr. 1 9.
Maxima.- April-May 1965: Discharge 26,000 cfs 1615 hours Apr. 8 (gage height, 20.86 ft, backwater from ice).
1909-13, 1931 to March 1965: Discharge, 14,200 cfs Mar. 30, 1962 (gage height, 15.88 ft); gage-height, 16.94 ft July 9, 1947 (from floodmark).
Remarks. Some regulation by dam at Cottonwood Lake and several other small lakesabove the station.
Mean discharge, in cubic feet per second, J965
Day
1 _-...2......3......4......
6____._
8-_____9......10.....
April
16 17 20 80
350 1,640
10,700 23,000 21,000 15,900
May
985 904 845 778 727 698 712
1,160 4,030 3,800
Day
11.---.12.....13.._._14_____15_____16...-.17.....18____.19 __ ..20..._.
April
14,100 11,700 8,940 7,010 5,340 4,300 3,440 2,890 2,440 2,130
May
3,620 2,460 1,720 1,500 1,520 2,280 2,770 2,850 2,440 1,970
Day
21.-...22.....23.. __24.. __25.,...26. ___27 .....28.....29.....30.....3 1
Monthly mean discharge, in cubic feet per second .___.____.-____ Runoff, in inches
April
1,82C 1,66C 1,33C 1,24C 1,34C 1,58C 1,46C 1.31C 1.17C 1,08C
4,967 4.33
May
1,540 1,540 1,620 1,490 2,210 2,650 2,370 1,820 1,400 1,180 1,100
1,829 1.65
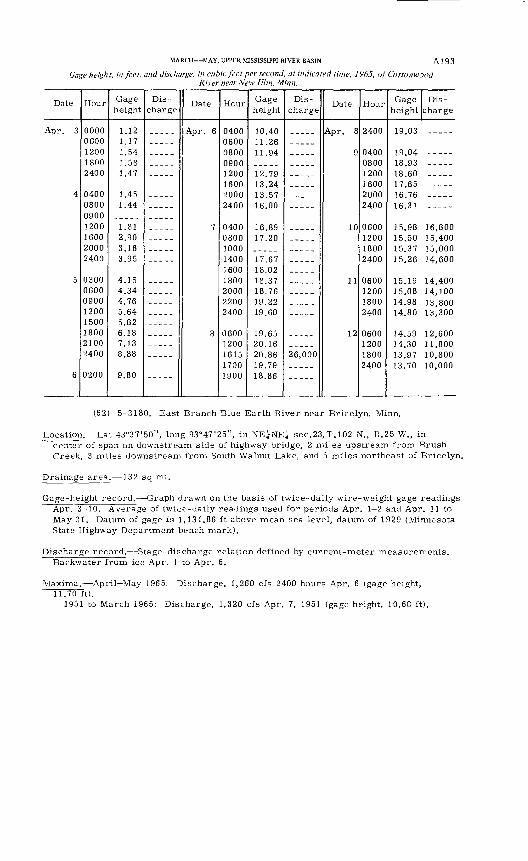
MARCH MAY, UPPER MISSISSIPPI RIVER BASIN A193
Gage height, in feet, and discharge, in cubic feet per second, at indicated time, 1965, of Cottonwood River near New (Jim, Minn.
Date
4
5
6
Hour
00000600120018002400
0400080009001200160020002400
03000600090012001500180021002400
0200
Gage height
1.121.171.541.581.47
1.451.44
1.812.903.163.95
4.154.344.765.645.826.187.138.88
9.80
Dis
chargeDate
8
Hour
0400060008000900
160020002400
040008001000140016001800200022002400
0600
161517001900
Gage height
10.4011.261 1 94
1 9 7Q
1 ^ 9 A
1 ^ "^7
16.00
16.8917 20
17.6718.0218.3718.7619.2219.60
19.6520.1620.8619.7918.86
Dis
chargeDate
10
11
12
Hour
2400
040008001200160020002400
0600
18002400
0600120018002400
0600120018002400
Gage height
19.03
19 0418.9318.6017.6516.7616.31
15.9815.5015.3715.26
15.1915.0814.9814.80
14.5914.3010 Q 7
13.70
Dis
charge
16,800
15,00014,600
14,40014,1001 Q pnni Q Qfin
12,600
10,000
(62) 5-3180. East Branch Blue Earth River near Bricelyn, Minn.
Location. Lat 43°37'50", long 93°47'25", in ^ 360.23,7.102 N., R.25 W., incenter of span on downstream side of highway bridge, 2 miles upstream from Brush Creek, 3 miles downstream from South Walnut Lake, and 5 miles northeast of Bricelyn.
Drainage area. 132 sq mi.
Gage-height record. Graph drawn on the basis of twice-daily wire-weight gage readings Apr. 3 10. Average of twice-daily readings used for periods Apr. 1-2 and Apr. 1 1 to May 31. Datum of gage is 1,131.86 ft above mean sea level, datum of 1929 (Minnesota State Highway Department bench mark).
Discharge record. Stage-discharge relation defined by current-meter measurements. Backwater from ice Apr. 1 to Apr. 6.
Maxima.- April-May 1965: Discharge, 1,260 cfs 2400 hours Apr. 6 (gage height, 11.70 ft).
1951 to March 1965: Discharge, 1,320 cfs Apr. 7, 1951 (gage height, 10.68 ft).
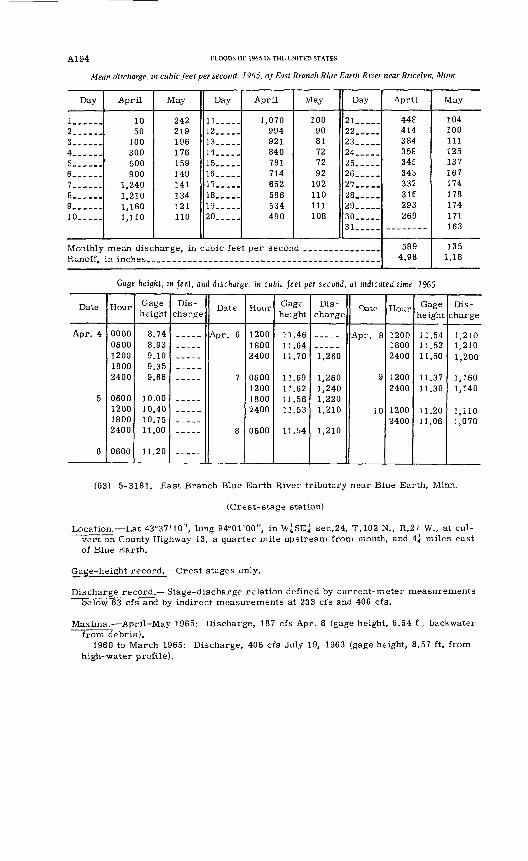
A] 94 FLOODS OF 1965 IN THE UNITED STATES
Mean discharge, in cubic feet per second, 1965, of East Branch Blue Earth River near Bricelyn, Minn.
Day
!-__---2__ ___3__ ___4______5 ......6. .....7 __ ...8 ......9 __ ...10.. ...
Monthly Runoff,
April
10 50
100 300 500 900
1,240 1,210 1,160 1,110
May
242 219 196 176 159 149 141 134 121 110
Day
11.. ...12 .....13 .....14 __ ..15.....16.. ...17 ___ .18.. ...19.. ...20 .....
April
1,070 994 921 840 781 714 652 586 534 490
mean discharge, in cubic feet per secon in inches
May
100 90 81 72 72 92
102 110 111 108
Day
21.. ...22 .....23 _..__24 .....25. ....26.. ...27. ....28 .....29 ___._30 .....31 .....
d .... ____ .. ...
April
44f 414 384 35E 345 343 332 316 293 269
589 4.98
May
104 100 111 125 137 167 174 178 174 171 163
135 1.18
Gage height, in feet, and discharge, in cubic feet per second, at indicated time, 1965
Date
5
6
Hour
00000600120018002400
0600120018002400
0600
Gage height
8.748.939.109.359.66
10.0010.4010.7511.00
11.20
Dis charge
Date
7
Hour
120018002400
06001200 18002400
0600
Gage height
11.4611.6411.70
11.6911.62 11.561 1 53
1 1 54
Dis
charge
1,240 1,2201,210
1,210
Date
9
30
Hour
120018002400
12002400
12002400
Gage height
3 1 5411.5211.50
1 1 3711.30
11.2011.06
Dis charge
1,2101,2101,200
1,1601,140
1,1101,070
(63) 5-3181. East Branch Blue Earth River tributary near Blue Earth, Minn.
(Crest-stage station)
Location. Lat 43°37'10", long 94°01'00", in W^SE^ sec.24, T.102 N., R.27 W., at cul- vert on County Highway 13, a quarter mile upstream from mouth, and 4^ miles east of Blue Earth.
Gage-height record.- Crest stages only.
Discharge record. Stage-discharge relation defined by current-meter measurements below 63 cfs and by indirect measurements at 233 cfs and 406 cfs.
Maxima.- April-May 1965: Discharge, 187 cfs Apr. 6 (gage height, 6.54 f., backwater from debris).
1960 to March 1965: Discharge, 406 cfs July 19, 1963 (gage height, 8.57 ft, from high-water profile).
MARCH MAY, UPPER MISSISSIPPI RIVER BASIN A1 9 5
(64) 5-3183. North Fork Watonwan River near Delft, Minn.
(Crest-stage station)
Location. Lat 44°00'00", long 95°07'20", in E| sec. 11, T.106 N., R.36 W., at culvert on U.S. Highway 71, 1-3/4 miles northwest of Delft, and 5| miles southeast of Jeffers.
Drainage area. 13.1 sq mi.
Gage-height record. Crest stages only.
Discharge record. Stage-discharge relation defined by current-meter measurements below 40 cfs and by indirect measurement at 549 cfs.
Maxima.- April-May 1965: Discharge, 810 cfs Apr. 4 (gage height, 18.42 ft, backwater from ice).
1960 to March 1965: Discharge, 549 cfs Mar. 29, 1960 (gage height, 17.04 ft); gage height, 18.00 ft April 9, 1962 (backwater from ice).
(65) 5-3195. Watonwan River near Garden City, Minn.
(Gaging station, discontinued 1945)
Location (revised). Lat 44°02'45", long 94°11'38", in SW|NE^ sec.28, T.107 N., R.28 W., on upstream side of highway bridge, 1.5 miles west of Garden City, 5 miles down stream from Perch Creek, and 7.3 miles upstream from mouth.
Drainage area. 812 sq mi.
Gage-height record. Floodmark only. Altitude of gage is 907 ft (from topographic map).
Discharge record. Stage-discharge relation defined by current-meter measurements below 4,500 cfs and extended above by logarithmic plotting and one discharge meas urement made in 1953 at site 2.6milesdownstream.
Maxima. April-May 1965: Discharge, 19,000cfs Apr. 7 (gage height, 18.89 ft, from floodmark).
1940-45, 1953 to March 1965: Discharge, 17,700 cfs June 9, 1953 (gage height, 18.6 ft from floodmark).
(66) 5-3200. Blue Earth River near Rapidan, Minn.
Location. Lat 44°05'44", long 94°06'33", in SE^SE^ sec.6, T.107 N., R.27 W., on left bank 0.2 mile downstream from powerplant of Northern States Power Co., 2 miles west of Rapidan, 3| miles downstream from Watonwan River, and 7-3/4 miler up stream from LeSueur River.
Drainage area. 2,430 sq mi, approximately.
Gage-height record. Water-stage recorder graph except 2200 hours Apr. 7 to 1200 hours Apr. 12 for which graph was reconstructed on basis of daily gage readings on the outside staff gage, and floodmark. Digital recorder tape punched at 15 minute intervals, May 13 31. Datum of gage is 808.80 ft above mean sea level, datum of 1912.
Discharge record. Stage-discharge relation defined by current-measurements. Back water from ice Apr. 1 2.
Maxima.- April-May 1965: Discharge, 43,100 cfs 1220 hours Apr. 9 (gage height, 21.36 ft, from floodmark).
1909-10, 1939-45, 1949 to March 1965: Discharge, 26,100 cfs Apr. 8, 1951 (gage height, 14.97 ft) from rating curve extended above 16,000 cfs by logarithmic plotting.
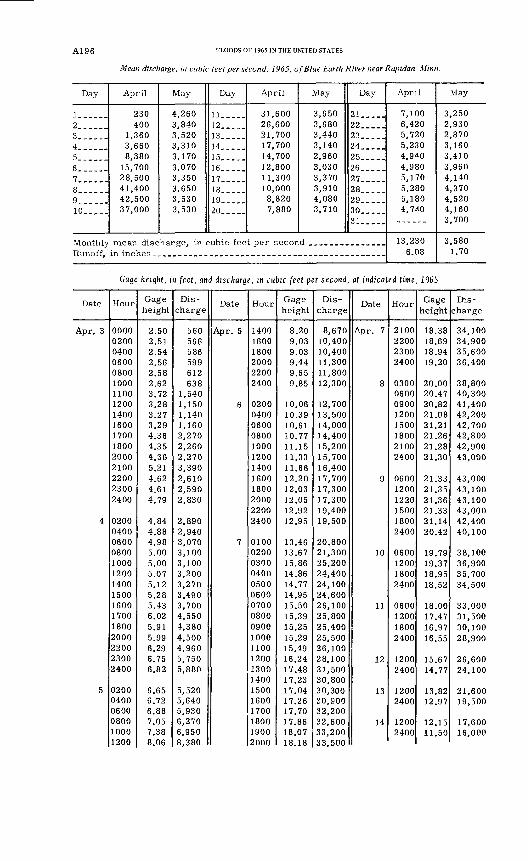
Al 9 6 FLOODS OF 1965 IN THE UNITED STATES
Mean discharge, in cubic feet per second, 1965, of Blue Earth River near Rapidan, Minn.
Day
!_____-2... __3______4______5......6......78 ___ ..9_____.10____.
Monthly Runoff,
April
230 400
1,360 3,660 8,380
15,700 28,500 41,400 42,500 37,000
May
4,260 3,840 3,520 3,310 3,170 3,070 3,350 3,650 3,530 3,530
Day
ll._._.12.....13.....14.....15.....16.....17.....18.....19.....20.....
April
31,600 26,600 21,700 17,700 14,700 12,800 11,300 10,000 8,820 7,880
mean discharge, in cubic feet per secon in inches
May
3,650 3,680 3,440 3,140 2,960 3,030 3,370 3,910 4,080 3,710
Day
21. _ __22 ...._23 _____24. _ __25 _____26 __ _.27 _____28 _____29_. ...30_. ___31
d . __ ... __ ___
April
7,100 6,420 5,720 5,230 4,9*0 4,980 5,170 5,280 5,180 4,7*0
13,230 6.08
May
3,250 2,930 2,870 3,160 3,410 3,960 4,140 4,370 4,520 4,160 3,700
3,580 1.70
Gage height, in feet, and discharge, in cubic feet per second, at indicated time, 1965
Date
Apr. 3
4
5
Hour
00000200040006000800100011001200140016001700180020002100220023002400
020004000600080010001200140015001600170018002000220023002400
020004000600080010001200
Gage height
2.502.512.542.562.582.623.723.283.273.294.364.354.365.214.624.614.79
4.844.884.985.005.005.075.125.285.436.025.915.996.296.756.82
6.656.726.887.057.388.06
Dis
charge
560566586599612638
1,5401,1501,1401,1602,2702,2602,2703,3902,6102,5902,830
2,8902,9403,0703,1003,1003,2003,2703,4903,7004,5504,3804,5004,9605,7505,880
5,5205,6405,9306,2706,9508,380
Date
Apr. 5
6
7
Hour
140016001800200022002400
020004000600080010001200140016001800200022002400
01000200030004000500060007000800090010001100120013001400150016001700180019002000
Gage height
8.209.039.039.449.659.85
10.0610.3910.6110.7711.1511.3311.6612.2012.0312.0512.9212.95
13.4613.6715.8614.8614.7714.9515.5015.3915.2515.2915.4916.2417.4817.2317.0417.2617.7017.8618.0718.18
Dis
charge
8,67010,40010,40011,30011,80012,300
12,70013,50014,00014,40015,20015,70016,40017,70017,30017,30019,40019,500
20.80021,30025,20024,40024,10024,60026,10025,80025,40025,50026,10028,10031,50030,80030,30030,90032,20032,60033,20033,500
Date
Apr. 7
8
9
10
11
12
13
14
Hour
2100220023002400
03000600090012001500180021002400
060012001220150018002400
0600120018002400
0600120018002400
12002400
12002400
12002400
Gage height
18.3818.6918.9419.20
20.0020.4720.8221.0821.2121.2621.2821.30
21.3321.3521.3621.3321.1420.42
19.7919.3718.9518.52
18.0017.4716.9716.55
15.6714.77
13.8212.97
12.1511.50
Dis
charge
34,10034,90035,60036,400
38,80040,30041,40042,20042,70042,80042,90043,000
43,00043,10043,10043,00042,40040,100
38,10036,90035,70034,500
33,00031,50030,10028,900
26,60024,100
21,60019,500
17,60016,000
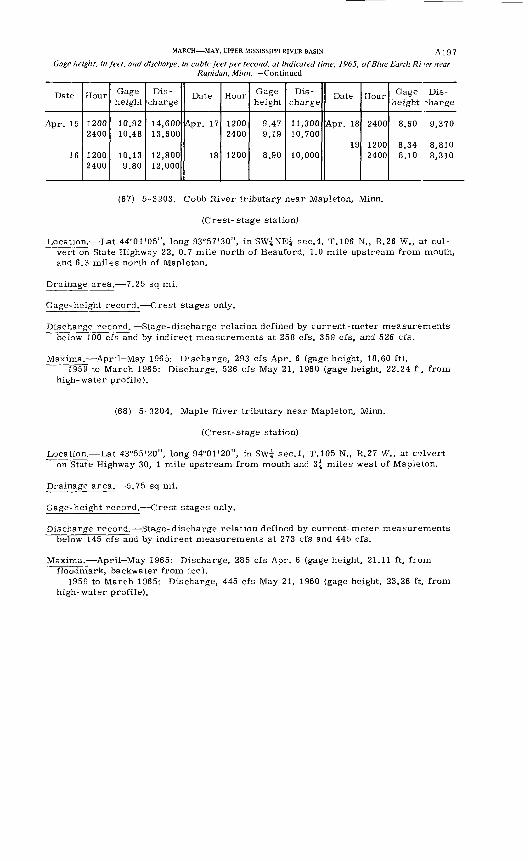
MARCH MAY, UPPER MISSISSIPPI RIVER BASIN A1 9 7
Gage height, in feet, and discharge, in cubic feet per second, at indicated time, 1965, of Blue Earth Ri~'er near Rapidan, Minn. Continued
Date
Apr. 15
16
Hour
1200 2400
12002400
Gage height
10.92 10.48
10.139.80
Dis
charge
14,600 13,600
12,80012,000
Date
Apr. 17
18
Hour
1200 2400
1200
Gage height
9.47 9.19
8.90
Dis charge
11,300 10,700
10,000
Date
Apr. 18
19
Hour
2400
12002400
Gage Dis- height ~harge
8.60 9,370
8.34 8,8108.10 8,310
(67) 5-3203. Cobb River tributary near Mapleton, Minn.
(Crest- stage station)
Location. Lat 44°01'05", long 93°57'30", in i sec. 4, T.106 N., R.26 W., at culvert on State Highway 22, 0.7 mile north of Beauford, 1.0 mile upstream from mouth, and 6.3 miles north of Mapleton.
Drainage area. 7.25 sq mi.
Gage-height record. Crest stages only.
Discharge record. Stage- discharge relation defined by current-meter measurements below 100 cfs and by indirect measurements at 258 cfs, 359 cfs, and 526 cfs.
Maxima. April-May 1965: Discharge, 293 cfs Apr. 6 (gage height, 18.60 ft).1959 to March 1965: Discharge, 526 cfs May 21, 1960 (gage height, 22.24 f., from
high- water profile).
(68) 5-3204. Maple River tributary near Mapleton, Minn.
(Crest-stage station)
Location. Lat 43°55'20", long 94°01'20", in SWi sec.l, T.105 N., R.27 W., at c-jlvert on State Highway 30, 1 mile upstream from mouth and 3^ miles west of Mapleton.
Drainage area. 5.75 sq mi.
Gage-height record. Crest stages only.
Discharge record. Stage-discharge relation defined by current-meter measurements below 145 cfs and by indirect measurements at 273 cfs and 445 cfs.
Maxima.- April May 1965: Discharge, 285 cfs Apr. 6 (gage height, 21.11 ft, from floodmark, backwater from ice).
1959 to March 1965: Discharge, 445 cfs May 21, 1960 (gage height, 23.26 ft, from high-water profile).
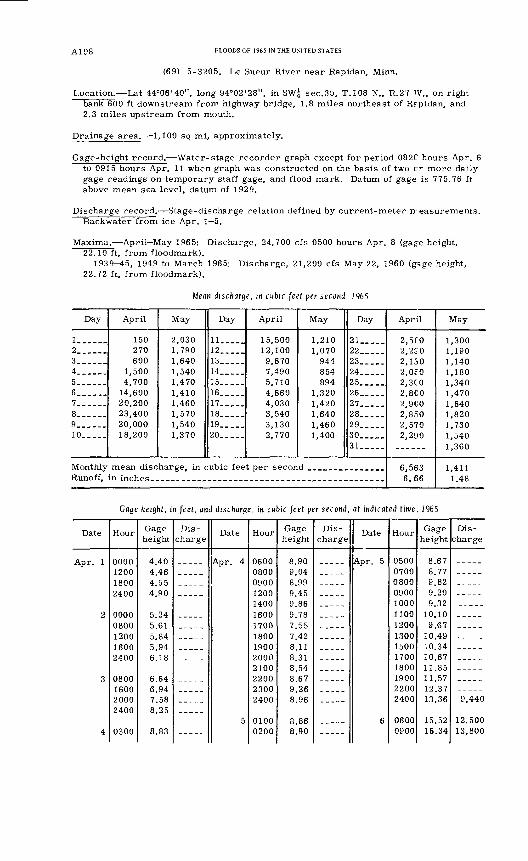
A198 FLOODS OF 1965 IN THE UNITED STATES
(69) 5-3205. Le Sueur River near Rapidan, Minn.
Location. Lat 44°06'40", long 94°02'28", in SW^ sec.35, T.108 N., R.27 W., on right bank 600 ft downstream from highway bridge, 1.8 miles northeast of Repidan, and 2.3 miles upstream from mouth.
Drainage area. 1,100 sq mi, approximately.
Gage-height record. Water-stage recorder graph except for period 082C hours Apr. 6 to 0915 hours Apr. 11 when graph was constructed on the basis of two or more daily gage readings on temporary staff gage, and flood mark. Datum of gage is 775.76 ft above mean sea level, datum of 1929.
Discharge record. Stage-discharge relation defined by current-meter rreasurements. Backwater from ice Apr. 1 5.
Maxima.- April May 1965: Discharge, 24,700 cfs 0500 hours Apr. 8 (gag*e height, 22.10 ft, from floodmark).
1939-45, 1949 to March 1965: Discharge, 21,200 cfs May 22, 1960 (gage height, 22.72 ft, from floodmark).
Mean discharge, in cubic feet per second, 1965
Day
1. _____2_ _____3. _____4_ _____5___.__6 ___ __7______8_ _____9 ______10__ ___
Monthly Runoff,
April
150 270 600
1,500 4,700
14,600 20,200 23,400 20,000 18,200
May
2,030 1,790 1,640 1,540 1,470 1,410 1,460 1,570 1,540 1,370
Day
11____12_____13 __ __14 __ __15_____16 _____17 _____18 _____19__ __20_____
April
15,500 12,100 9,670 7,490 5,710 4,660 4,030 3,540 3,130 2,770
mean discharge, in cubic feet per secon in inches
May
1,210 1,070
944 854 894
1,320 1,420 1,640 1,460 1,400
Day
21__ __22 _____23 _____24 _____25_____26 _____27 _____28__ ___29__ __30 _____31 __ __
d ________ _____
April
2,5CO 2,2£0 2,130 2,050 2.3CO 2, SCO 2,9CO 2,850 2,570 2,290
6,563 6.66
May
1,300 1,190 1,140 1,180 1,340 1,470 1,640 1,820 1,730 1,540 1,360
1,411 1.48
Gage height, in feet, and discharge, in cubic feet per second, at indicated time, 1965
Date
Apr. 1
2
3
4
Hour
0000120018002400
00000800120016002400
0800160020002400
Gage height
4.404.464 ^ R
4 90
^ 9/1
5.615,845.946.18
6.646.947.588.25
8.83
Dis
chargeDate
5
Hour
06000800
12001400160017001800190020002100220023002400
01000200
Gage height
8.909.048.999 AC
9.869.787.557.428.118.318 548.679.268.96
8.90
Dis
chargeDate
6
Hour
05000700080009001000110012001300150017001800190022002400
06000900
Gage height
8.678.779.829.209.32
10.109.67
10.4910.3410.6711.8511.5712.3713.36
15.5216.34
Dis charge
9,440
12,50013,800
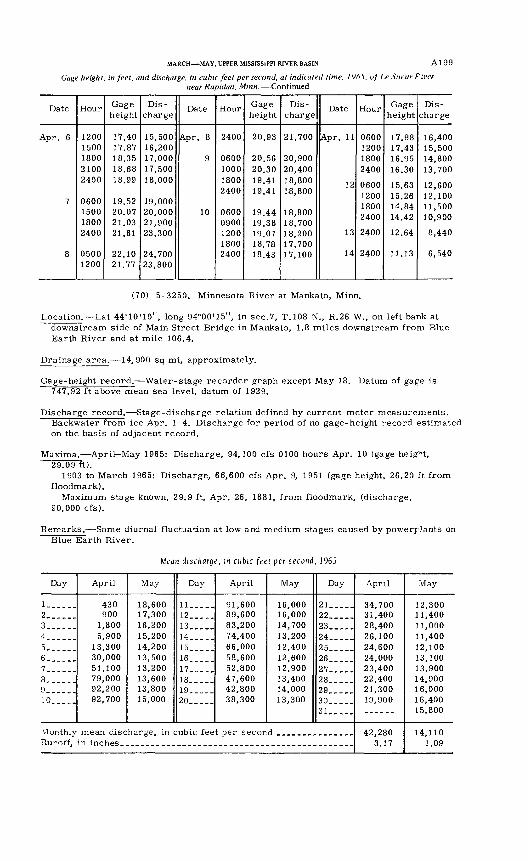
MARCH MAY, UPPER MISSISSIPPI RIVER BASIN A1 99
Gage height, in feet, and discharge, in cubic feet per second, at indicated time, 1965, of Le Sueur Fiver near Rapidan, Minn. Continued
Date
Apr. 6
7
8
Hour
12001500180021002400
0600 1500 18002400
05001200
Gage height
17.4017.8718.3518.6818.99
19.52 20.07 21.0321.61
22.1021.77
Dis
charge
15,50016,20017,00017,50018,000
19,000 20,000 21,90023,300
24,70023,800
Date
Apr. 8
9
10
Hour
2400
0600100018002400
0600 0900120018002400
Gage height
20.93
20.5620.3019.4119.41
19.44 19.3819.0718.7818.43
Dis
charge
21,700
20,90020,40018,80013,800
18,800 18,70018,20017,70017,100
Date
Apr. 11
12
13
14
Hour
0600120018002400
06001200 1800 2400
2400
2400
Gage height
17.9817.4316.9516.30
15.6315.26 14.84 14.42
12.64
11.13
Dis
charge
16,40015,50014,80013,700
12,60012,100 11,500 10,900
8,440
6,540
(70) 5-3250. Minnesota River at Mankato, Minn.
Location. Lat 44°10'10", long 94°00'15", in sec.7, T.108 N., R.26 W., on left bank at downstream side of Main Street Bridge in Mankato, 1.8 miles downstream from Blue Earth River and at mile 106.4.
Drainage area. 14,900 sq mi, approximately.
Gage-height record. Water-stage recorder graph except May 18. Datum of ga^e is 747.92 ft above mean sea level, datum of 1929.
Discharge record. Stage-discharge relation defined by current-meter measurements. Backwater from ice Apr. 1 4. Discharge for period of no gage-height record estimated on the basis of adjacent record.
Maxima. April-May 1965: Discharge, 94,100 cfs 0100 hours Apr. 10 (gage heigM, 29.09 ft).
1903 to March 1965: Discharge, 66,600 cfs Apr. 9, 1951 (gage height, 26.20 ft from floodmark).
Maximum stage known, 29.9 ft, Apr. 26, 1881, from floodmark, (discharge, 90,000 cfs).
Remarks. Some diurnal fluctuation at low and medium stages caused by powerplants on Blue Earth River.
Mean discharge, in cubic feet per second, 1965
Day
1.2.. __ .3. ...4.5... _.6......7......8......9-___-.10.....
Alonthly Runoff,
April
430 900
1,800 5,900
13,300 30,000 51,100 79,000 92,200 92,700
May
18,600 17,300 16,200 15,200 14,200 13,500 13,200 13,600 13,800 15,000
Day
11.....12.....13. __14.....15.....16.....17.....18.....19.....20 .....
April
91,600 89,600 83,200 74,400 66,000 58,600 52,800 47,600 42,800 38,300
May
16,000 16,000 14,700 13,200 12,400 12,600 12,900 13,400 14,000 13,300
Day
21.....22 ___ .23.. ...24.. ...25.. ...26.. ...27.. ...28.. ...29.....30.....31_____
mean discharge, in cubic feet per second ._.._._________
April
34,700 31,400 28,400 26,100 24,600 24,000 23,400 22,400 21,300 19,900
42,280 3.17
May
12,300 11,400 11,000 11,400 12,100 13,100 13,900 14,900 16,000 16,400 15,800
14,110 1.09
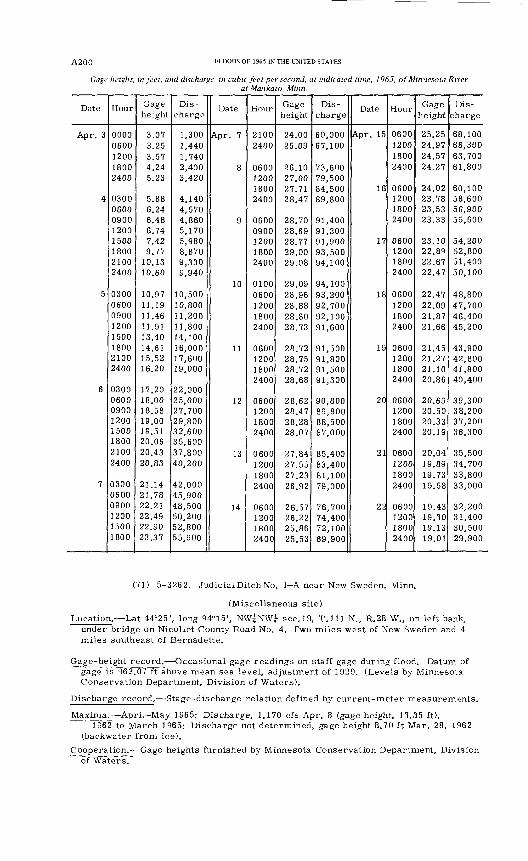
A200 FLOODS OF 1965 IN THE UNITED STATES
Gage height, in feet, and discharge, in cubic feet per second, at indicated time, 1965, of Minnesota Riverat Mankato, Minn.
Date
Apr. 3
4
5
6
7
Hour
00000600120018002400
03000600090012001500180021002400
03000600090012001500180021002400
03000600090012001500180021002400
030006000900120015001800
Gage height
3.073.253.574.245.23
5.886.246.486.747.429.7710.1310.60
10.9711.1911.4611.9113.4014.6115.5216.20
17.2018.0018.5819.0019.5120.0620.4320.83
21.1421.7822.2122.4922.9023.37
Dis
charge
1,3001,4401,7402,4003,420
4,1404,5704,8605,1705,9808,8709,3309,940
10,50010,80011,20011,80014,10016,00017,60019,000
22,00025,00027,70029,80032,60035,60037,80040,200
42,00045,90048,50050,20052,80055,900
Date
Apr. 7
8
9
10
11
12
13
14
Hour
21002400
0600120018002400
06000900120018002400
01000600120018002400
0600120018002400
0600120018002400
0600120018002400
0600120018002400
Gage height
24.0025.09
26.1027.0027.7128.47
28.7028.6928.7729.0029.08
29.0928.9628.8828.8028.73
28.7228.7528.7228.68
28.6228.4728.2828.07
27.8427.5527.2326.92
26.5726.2225.8625.53
Dis
charge
60,00067,100
73,60079,50084,50089,800
91,40091,30091,90093,50094,100
94,10093,20092,70092,10091,600
91,50091,80091,50091,300
90,80089,80088,50087,000
85,40083,40081,10079,000
76,70074,40072,10069,900
Date
Apr. 15
16
17
18
19
20
21
22
Hour
0600120018002400
0600120018002400
0600120018002400
0600120018002400
0600120018002400
0600120018002400
0600120018002400
0600120018002400
Gage height
25.2524.9724.5724.27
24.0223.7823.5323.33
23.1022.8922.6722.47
22.4722.0921.8721.66
21.4521.2721.1020.86
20.6920.5020.3320.19
20.0419.8919.7319.58
19.4319.3019.1319.01
Dis
charge
68,10066,30063,70061,800
60,10058,60056,90055,600
54,20052,80051,40050,100
48,80047,70046,40045,200
43,90042,80041,80040,400
39,30038,20037,20036,300
35,50034,70033,80033,000
32,20031,40030,50029,900
(71) 5-3262. Judicial Ditch No. 1-A near New Sweden, Minn.
(Miscellaneous site)
Location. Lat 44°25', long 94°15', NW^NW^ sec.19, T.lll N., R.28 W., 01 left bank, under bridge on Nicollet County Road No. 4. Two miles west of New Sweden and 4 miles southeast of Bernadette.
Gage-height record. Occasional gage readings on staff gage during flood. Datum of gage is 962.07 ft above mean sea level, adjustment of 1929. (Levels by Minnesota Conservation Department, Division of Waters).
Discharge record. Stage-discharge relation defined by current-meter measurements.
Maxima.- April-May 1965: Discharge, 1,170 cfs Apr. 8 (gage height, 13.35 ft).TS62 to March 1965: Discharge not determined, gage height 8.70 ft Mar. 28, 1962
(backwater from ice).
Cooperation. Gage heights furnished by Minnesota Conservation Department, Division of Waters.
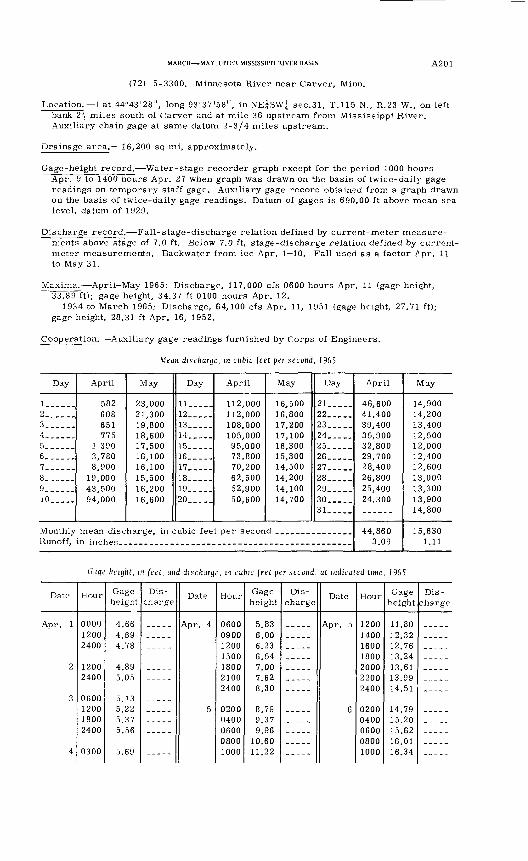
MARCH MAY, UPPER MISSISSIPPI RIVER BASIN A201
(72) 5-3300. Minnesota River near Carver, Minn.
Location. Lat 44°43'28", long 93°37'58", in NEjSWj sec.31, T.115 N., R.23 W., on left bank 2j miles south of Carver and at mile 36 upstream from Mississippi River. Auxiliary chain gage at same datum 2-3/4 miles upstream.
Drainage area. 16,200 sq mi, approximately.
Gage-height record. Water-stage recorder graph except for the period 1000 hours Apr. 9 to 1400 hours Apr. 27 when graph was drawn on the basis of twice-daily gage readings on temporary staff gage. Auxiliary gage record obtained from a graph drawn on the basis of twice-daily gage readings. Datum of gages is 690.00 ft above mean sea level, datum of 1929.
Discharge record. Fall-stage-discharge relation defined by current-meter measure ments above stage of 7.0 ft. Below 7.0 ft, stage-discharge relation defined by current- meter measurements. Backwater from ice Apr. 1 10. Fall used as a factor P pr. 11 to May 31.
Maxima. April-May 1965: Discharge, 117,000 cfs 0600 hours Apr. 11 (gage height, 33.89 ft); gage height, 34.37 ft 0100 hours Apr. 12.
1934 to March 1965: Discharge, 64,100 cfs Apr. 11, 1951 (gage height, 27.71 ft); gage height, 28.31 ft Apr. 16, 1952.
Cooperation. Auxiliary gage readings furnished by Corps of Engineers.
Mean discharge, in cubic feet per second, 1965
Day
!-_.__.2.3_ ...4. ....5. __ ..6......7......8.__ ...9......10.. ...
Monthly Runoff,
April
582 608 651 775
1 390 3,780 8,900
19,000 43,500 94,000
May
23,000 21,300 19,800 18,600 17,500 16,100 16,100 15,500 16,200 16,600
Day
11 ___ .12.. __13.....14.....15.....16.....17 ____18 .....19.....20 .....
April
112,000 112,000 108,000 105,000 95,000 73,800 70,200 62,500 52,900 50,600
May
16,500 16,800 17,200 17,100 16,300 15,300 14,500 14,200 14,100 14,700
Day
21_.___22.....23.....24.....25.....26.....27 .....28.. ...29 .....30 .....31..._.
mean discharge, in cubic feet per second .___..________.
April
46,600 41,400 39,400 35,900 32,800 29,700 28,400 26,800 25,400 24,300
44,860 3.09
May
14,900 14,200 13,400 12,500 12,000 12,400 12,600 13,000 13,300 13,900 14,800
15,6301.11
Gcige height, in feet, and discharge, in cubic feet per second, at indicated time, 1965
Date
Apr. 1
2
3
4
Hour
000012002400
12002400
0600120018002400
0300
Gage height
4.664.694.78
4.895.05
5.135.225.375.56
5.69
Dis
chargeDate
Apr. 4
5
Hour
0600090012001500180021002400
02000400060008001000
Gage height
5.836.006.236.547.007.628.30
8 799 37Q Qfi
10.6011.22
Dis
chargeDate
6
Hour
1200140016001800
22002400
06000800
Gage height
11.8012.3212.7613.2413.6113.9914.51
14 7915.2015.6216.0116.34
Dis
charge
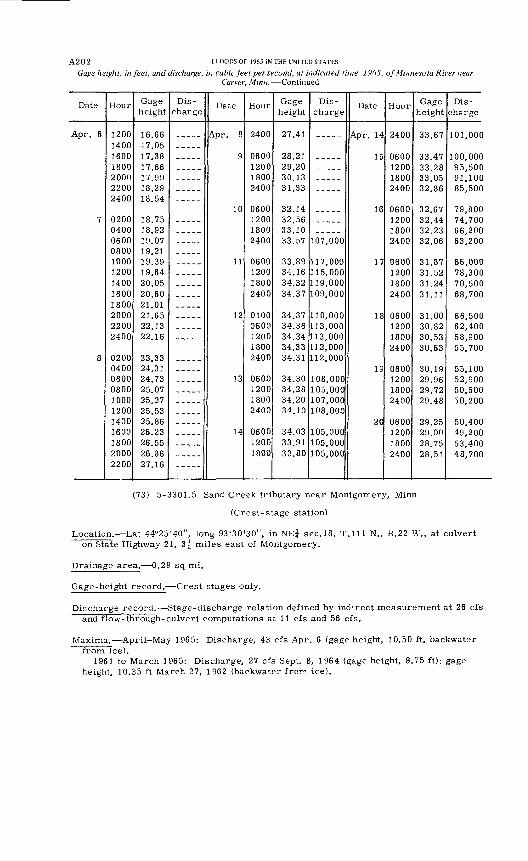
A202 [LOODSOr 1965 [N THE UNITED STATES
Gage height, in feet, and discharge, in cubic feet per second, at indicated time, 1965, of Minnesota River nearCarver, Minn. Continued
Date
Apr. 6
7
8
Hour
1200 1400 1600 1800 2000 2200 2400
0200 0400 0600 0800 1000 1200 1400 1600 1800 2000 2200 2400
0200 0400 0600 0800 1000 1200 1400 1600 1800 2000 2200
Gage height
16.66 17.05 17.38 17.66 17.99 18.29 18.54
18.75 18.92 19.07 19.21 19.39 19.64 20.05 20.60 21.01 21.65 22.13 22.16
23.33 24.31 24.73 25.07 25.27 25.53 25.86 26.23 26.55 26.86 27.16
Dis charge
Date
Apr. 8
9
10
11
12
13
14
Hour
2400
0600 1200 1800 2400
0600 1200 1800 2400
0600 1200 1800 2400
0100 0600 1200 1800 2400
0600 1200 1800 2400
0600 1200 1800
Gage height
27.41
28.21 29.20 30.13 31.33
32.14 32.56 33.10 33.57
33.89 34.16 34.32 34.37
34.37 34.36 34.34 34.33 34.31
34.30 34.28 34.20 34.10
34.03 33.91 33.80
Dis charge
107,000
117,000 115,000 119,000 109,000
110,000 113,000 113,000 112,000 112,000
108,000 105,000 107,000 108,000
105,000 105,000 105,000
Date
Apr. 14
15
16
17
18
19
20
Hour
2400
0600 1200 1800 2400
0600 1200 1800 2400
0600 1200 1800 2400
0600 1200 1800 2400
0600 1200 1800 2400
0600 1200 1800 2400
Gage height
33.67
33.47 33.28 33.05 32.86
32.67 32.44 32.23 32.06
31.87 31.52 31.24 31.11
31.00 30.82 30.53 30.63
30.19 29.96 29.72 29.48
29.25 29.00 28.75 28.51
Dis charge
101,000
100,000 95,500 91,100 85,500
79,800 74,700 66,200 63,200
66,000 78,300 70,500 68,700
66,500 62,400 58,900 55,700
55,100 52,900 50,500 50,200
50,400 49,200 53,400 48,700
(73) 5-3301.5 Sand Creek tributary near Montgomery, Minn.
(Crest-stage station)
Location. Lat 44°25'40", long 93°30'30", in NE| sec.18, T.lll N., R.22 W., at culvert on State Highway 21, 3| miles east of Montgomery.
Drainage area. 0.29 sq mi.
Gage-height record. Crest stages only.
Discharge record. Stage-discharge relation defined by indirect measurement at 26 cfs and flow-through-culvert computations at 11 cfs and 56 cfs.
Maxima. April May 1965: Discharge, 43 cfs Apr. 6 (gage height, 10.50 ft, backwater from ice).
1961 to March 1965: Discharge, 27 cfs Sept. 8, 1964 (gage height, 8.75 ft); gage height, 10.35 ft March 27, 1962 (backwater from ice).
MARCH MAY, UPPER MISSISSIPPI RIVER BASIN A203
(74) 5-3302. Rice Lake tributary near Montgomery, Minn.
(Crest-stage station)
Location. Lat 44°25'40", long 93°32'00", in N^ sec.13, T.I 11 N., R.23 W., at culvert on State Highway 21, 1^ miles upstream from Rice Lake and 2-j miles east of Mont gomery.
Drainage area. 2.49 sq mi.
Gage-height record. Crest stages only.
Discharge record. Stage-discharge relation defined by current-meter measurenents below 20 cfs and by indirect measurement at 279 cfs.
Maxima. April May 1965: Discharge, 114 cfs Apr. 6 (gage height, 10.96 ft, backwater from ice).
1960 to March 1965: Discharge, 279 cfs May 21, 1960 (gage height, 13.72 ft).
(75) 5-3303. Sand Creek near New Prague, Minn.
(Crest-stage station)
Location. Lat 44°32'37", long 93°32'16", in NE?NW? sec.l, T.112 N., R.23 W., at cul vert on State Highways 13 and 19, 1.9 miles east of New Prague.
Drainage area. 65 sq mi, approximately.
Gage height record. Crest stages only.
Discharge record. Stage-discharge relation defined by current-meter measurements.
Maxima. April-May 1965: Discharge, 1,070 cfs Apr. 8 (gage height, 14.79 ft).1960 to March 1965: Discharge, 1,100 cfs May 21, 1960 (gage height, 14.84 ft).
(76) 5-3305.5 Raven Stream tributary near New Prague, Minn.
(Crest-stage station)
Location. Lat 44°34'2l", long 93°35'58", in NW? sec.28, T.113 N., R.23 W., on left bank 24 ft upstream from culvert on county highway, 1.6 miles upstream from mouth, and 2.3 miles northwest of New Prague.
Drainage area. 23 sq mi, approximately.
Gage-height record. Water-stage recorder graph.
Discharge record. Stage-discharge relation defined by current-meter measurements below 227 cfs and by indirect measurement at 929 cfs.
Maxima.- April-May 1965: Discharge, 505 cfs Apr. 7 (gage height, 14.74 ft).1960 to March 1965: Discharge, 929 cfs May 21, 1960 (gage height, 17.34 fl ,
from high-water profile).
317-045 O - 70 - 14
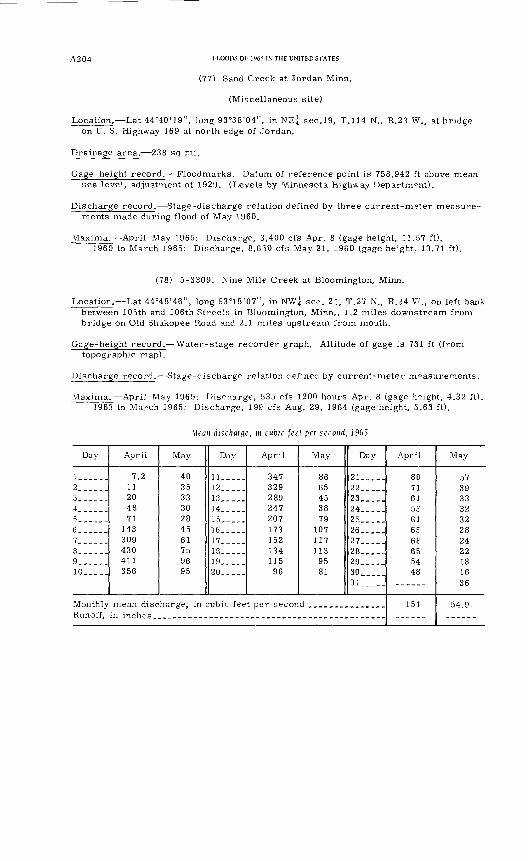
A2 04 FLOODS OF 1965 IN THE UNITED STATES
(77) Sand Creek at Jordan Minn.
(Miscellaneous site)
Location. Lat 44°40'19", long 93°38'04", in NEi sec.19, T.114N., R.23 W., at bridge on U. S. Highway 169 at north edge of Jordan.
Drainage area. 238 sq mi.
Gage-height record. Floodmarks. Datum of reference point is 758.942 ft above mean sea level, adjustment of 1929. (Levels by Minnesota Highway Department).
Discharge record. Stage-discharge relation defined by three current-meter measure ments made during flood of May 1960.
Maxima. April-May 1965: Discharge, 3,400 cfs Apr. 8 (gage height, 11.57 ft).1960 to March 1965: Discharge, 8,650 cfs May 21, 1960 (gage height, 13.71 ft).
(78) 5-3309. Nine Mile Creek at Bloomington, Minn.
Location. Lat 44°48'46", long 93°18'07", in NW^ sec. 21, T.27 N., R.24 V., on left bank between 105th and 106th Streets in Bloomington, Minn., 1.2 miles downstream from bridge on Old Shakopee Road and 2.1 miles upstream from mouth.
Gage-height record. Water-stage recorder graph. Altitude of gage is 731 ft (from topographic map).
Discharge record. Stage-discharge relation defined by current-meter measurements.
Maxima. April-May 1965: Discharge, 535 cfs 1200 hours Apr. 8 (gage height, 4.32 ft). 1963 to March 1965: Discharge, 199 cfs Aug. 29, 1964 (gage height, 3.63 ft).
Mean discharge, in cubic feet per second, 1965
Day
1 .....2......3......4......
6... ...7......8......9----_.10.....
Monthly Runoff,
April
7.2 11 20 48 71
143 309 430 411 356
May
40 35 33 30 28 45 61 75 96 95
Day
11.....12.....13,....14.....15..._. 16,....17.....18.....19,-...20.,...
April
347 329 289 247 207 173 152 134 115 96
mean discharge, in cubic feet per secon in inches
May
86 65 45 38 79
107 117 113 95 81
Day
21.....22.....23.....24.....25.....26.. __27.. __28.....9Q
30.. .31._.._
d . __ .. .. .. .
April
80 71 61 5? 61 6E 6£ 65 54 48
151
May
57 39 33 32 32 28 24 22 18 16 36
54.9
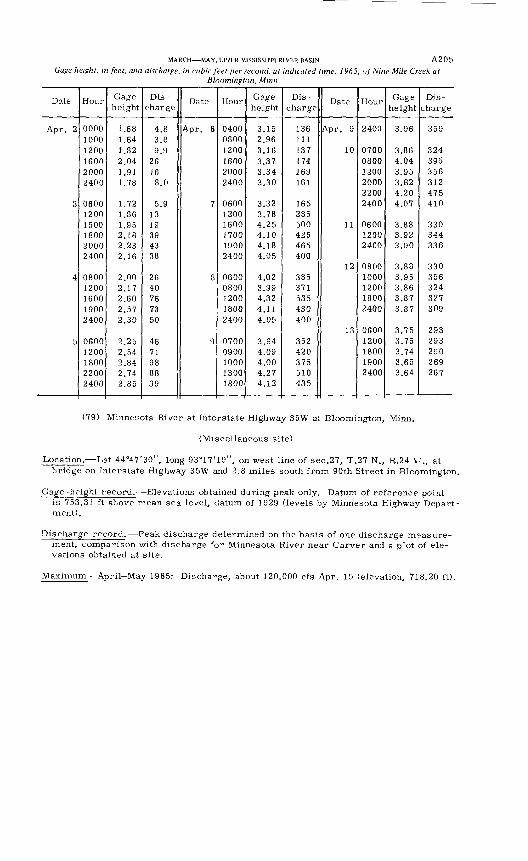
MARCH MAY, UPPER MISSISSIPPI RIVER BASIN A205
Gage height, in feet, and discharge, in cubic feet per second, at indicated time. 1965. of Nine Mile Creek atBloomington, Minn
Date
Apr. 2
3
4
5
Hour
000010001200160020002400
060012001500180020002400
08001200160019002400
06001200180022002400
Gage height
1.681.641.822.041.911.78
1.721.861.952.182.232.16
2.002.172.602.572.30
2.252.542.842.742.85
Dis
charge
4.83.89.9
26168.0
5.91319394338
2640767350
4671988899
Date
Apr. 6
7
8
9
Hour
040008001200160020002400
060012001600170019002400
06000800120018002400
07000900100013001800
Gage height
3.152.963.163.373.343.30
3.323.784.254.104.184.05
4.023.994.324.114.05
3.944.094.004.274.12
Dis
charge
136111137174169161
165285500425465400
385371535430400
352420375510435
Date
Apr. 9
10
11
12
13
Hour
2400
070008001200200022002400
060012002400
08001000120018002400
06001200180019002400
Gage height
3.96
3.864.043.953.824.204.07
3.883.923.90
3.883.953.863.873.87
3.753.753.743.653.64
Dis
charge
359
324395356312475410
330344336
330356324327309
293293290269267
(79) Minnesota River at Interstate Highway 35W at Bloomington, Minn.
(Miscellaneous site)
Location. Lat 44°47'30", long 93°17'19", on west line of sec.27, T.27 N., R.24 V., at bridge on Interstate Highway 35W and 2.8 miles south from 90th Street in Bloomington.
Gage-height record. Elevations obtained during peak only. Datum of reference point is 753.31 ft above mean sea level, datum of 1929 (levels by Minnesota Highway Depart ment).
Discharge record. Peak discharge determined on the basis of one discharge measure ment, comparison with discharge for Minnesota River near Carver and a plot of ele vations obtained at site.
Maximum- April-May 1965: Discharge, about 120,000 cfs Apr. 15 (elevation, 718.20 ft).
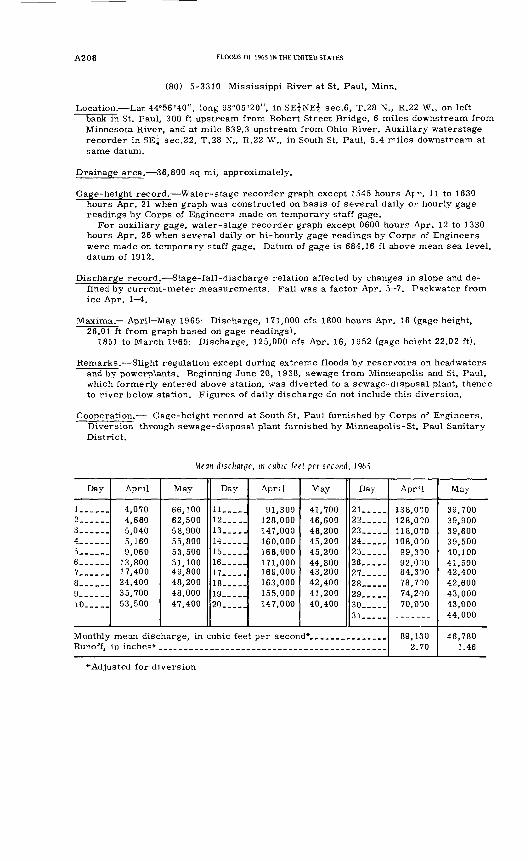
A206 FLOODS OF 1965 IN THE UNITED STATES
(80) 5-3310 Mississippi River at St. Paul, Minn.
Location. Lat 44°56'40", long 93°05'20", in SE^NE^ sec.6, T.28 N., R.22 W., on left bank in St. Paul, 300 ft upstream from Robert Street Bridge, 6 miles downstream from Minnesota River, and at mile 839.3 upstream from Ohio River. Auxiliary waterstage recorder in SEj sec.22, T.28 N., R.22 W., in South St. Paul, 5.4 miles downstream at same datum.
Drainage area. 36,800 sq mi, approximately.
Gage-height record. Water-stage recorder graph except 1545 hours Ap--~. 11 to 1630 hours Apr. 21 when graph was constructed on basis of several daily or hourly gage readings by Corps of Engineers made on temporary staff gage.
For auxiliary gage, water-stage recorder graph except 0600 hours Apr. 12 to 1330 hours Apr. 26 when several daily or bi-hourly gage readings by Corps of Engineers were made on temporary staff gage. Datum of gage is 684.16 ft above mean sea level, datum of 1912.
Discharge record. Stage-fall-discharge relation affected by changes in slope and de fined by current-meter measurements. Fall was a factor Apr. 5 7. Backwater from ice Apr. 1 4.
Maxima.- April-May 1965: Discharge, 171,000 cfs 1800 hours Apr. 16 (gage height, 26.01 ft from graph based on gage readings).
1851 to March 1965: Discharge, 125,000 cfs Apr. 16, 1952 (gage height 22.02 ft).
Remarks. Slight regulation except during extreme floods by reservoirs on headwaters and by powerplants. Beginning June 20, 1938, sewage from Minneapolis and St. Paul, which formerly entered above station, was diverted to a sewage-disposal plant, thence to river below station. Figures of daily discharge do not include this diversion.
Cooperation. Gage-height record at South St. Paul furnished by Corps of Engineers. Diversion through sewage-disposal plant furnished by Minneapolis-St. Paul Sanitary District.
Mean discharge, in cubic feet per second, 1965
Day
1. _____2_____3 ______4, _____5 ______6... ___7 __ __8 ______9 __ .__10 __ __
Monthly Runoff,
April
4,070 4,660 5,040 5,160 9,060
13,800 17,400 24,400 35,700 53,500
May
66,100 62,500 58,900 55,800 53,500 51,100 49,800 48,200 48,000 47,400
Day
11_____12_____13 __ _.14__.__15 __ ._16__ ___17____.18 _____19_..__20_. __
April
91,300 128,000 147,000 160,000 166,000 171,000 169,000 163,000 155,000 147,000
May
41,700 46,600 46,200 45,200 45,200 44,800 43,200 42,400 41,200 40,400
Day
21__.__22 __ __23__ ___24 _____2S26 __ __27_____28 _____29 _____30 _____31
mean discharge, in cubic feet per second*_______________ in inches* __ _________
Apr'1
138,070 128.070 118,070 108,000 99,300 92,000 84,300 78,700 74,200 70,000
89,130 2.70
May
39,700 39,900 39,600 39,500 40,100 41,500 42,400 42,600 43,000 43,000 44,000
46,780 1.46
* Adjusted for diversion
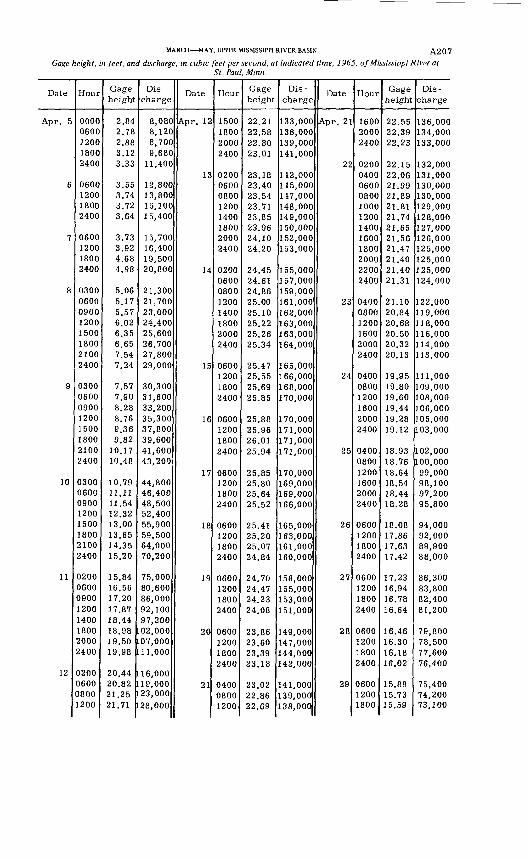
MARCH MAY, UPPER MISSISSIPPI RIVER BASIN A207
Gage height, in feet, and discharge, in cubic feet per second, at indicated time, 1965, of Mississippi River atSt. Paul Minn.
Date
Apr. 5
6
7
8
9
10
11
12
Hour
00000600120018002400
0600120018002400
0600120018002400
03000600090012001500180021002400
03000600090012001500180021002400
03000600090012001500180021002400
02000600090012001400180020002400
0200060008001200
Gage height
2.842.782.883.123.33
3.553.743.723.64
3.733.924.684.98
5.065.175.576.026.356.657.547.24
7.577.908.288.769.369.82
10.1710.48
10.7911.1111.5412.3213.0013.6514.3515.20
15.8416.5617.2017.8718.4418.9819.5019.98
20.4420.8221.2521.71
Dis
charge
8,0808,1208,7009,680
11,400
12,80013,80015,10015,400
15,70016,40019,50020,800
21,30021,70023,00024,40025,60026,70027,80029,000
30,30031,60033,20035,30037,80039,60041,60043,200
44,80046,40048,50052,40055,90059,50064,00070,200
75,00080,60086,00092,10097,20002,00007,00011,000
16,00019,00023,00028,000
Date
Apr. 12
13
14
15
16
17
18
19
20
21
Hour
1500180020002400
02000600080012001400180020002400
02000600080012001400180020002400
0600120018002400
0600120018002400
0600120018002400
0600120018002400
0600120018002400
0600120018002400
040008001200
Gage height
22.2122.5822.8023.01
23.1823.4023.5423.7123.8523.9624.1024.20
24.4524.6124.8625.0025.1025.2225.2625.34
25.4725.5525.6925.85
25.8825.9626.0125.94
25.8525.8025.6425.52
25.4125.2025.0724.84
24.7024.4724.2324.08
23.8623.6023.3923.18
23.0222.8622.69
Dis
charge
133,000136,000139,000141,000
112,000115,000117,000148,000149,000150,000152,000153,000
155,000157,000159,000161,000162,000163,000163,000164,000
165,000166,000168,000170,000
170,000171,000171,000171,000
170,000169,000169,000166,000
165,000163,000161,000160,000
158,000155,000153,000151,000
149,000147,000144,000142,000
141,000139,000138,000
Date
Apr. 21
22
23
24
25
26
27
28
29
Hour
160020002400
020004000600080010001200140016001800200022002400
040008001200160020002400
040008001200160020002400
040008001200160020002400
0600120018002400
0600120018002400
0600120018002400
060012001800
Gage height
22.5522.3922.23
22.1522.0621.9921.8921.8121.7421.6521.5621.4721.4021.4021.31
21.1020.8420.6820.5020.3220.13
19.9519.8019.6019.4419.2819.12
18.9318.7618.6418.5418.4418.28
18.0817.8617.6317.42
17.2316.9416.7816.64
16.4616.3016.1816.02
15.8915.7315.59
Dis
charge
136,000134,000133,000
132,000131,000130,000130,000129,000128,000127,000126,000125,000125,000125,000124,000
122,000119,000118,000116,000114,000113,000
111,000109,000108,000106,000105,000103,000
102,000100,00099,00098,10097,20095,800
94,00092,00089,90088,000
86,30083,80082,40081,200
79,80078,50077,60076,400
75,40074,20073,100
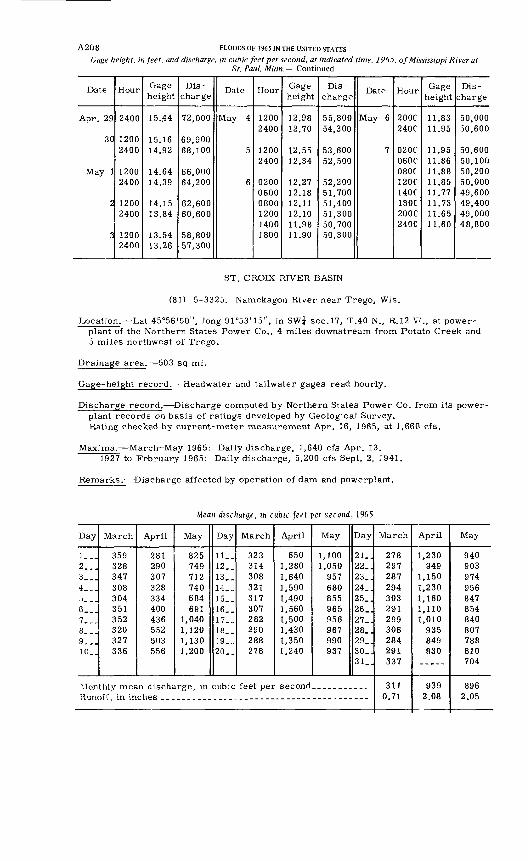
A208Gage height, in feet, and discharge.
FLOODS OF 1965 IN THE UNITED STATES
in cubic feet per second, at indicated time, 1965, of Mississippi River at St. Paul, Minn. Continued
Date
Apr. 29
30
May 1
2
3
Hour
2400
12002400
12002400
12002400
12002400
Gage height
15.44
15.1614.92
14.6414.39
14.1513.84
13.5413.26
Dis
charge
72,000
69,90068,100
66,00064,200
62,60060,600
58,80057,300
Date
May 4
5
6
Hour
12002400
12002400
020006000800120014001800
Gage height
12.9812.70
12.5512.34
12.2712.1812.1112.1011.9811.90
Dis
charge
55,80054,300
53,60052,500
52,20051,70051,40051,30050,70050,300
Date
May 6
7
Hour
200C240C
020C060C080C120CHOC180C200C240C
Gage height
11.8311.95
11.9511.8611.8811.8511.7711.7311.6511.60
Dis
charge
50,00050,600
50,60050,10050,20050,00049,60049,40049,00048,800
ST. CROIX RIVER BASIN
(81) 5-3325. Namekagon River near Trego, Wis.
Location. Lat 45°56'50", long 91°53'15", in SW? sec.17, T.40 N., R.12 V'., at power- plant of the Northern States Power Co., 4 miles downstream from Potato Creek and 5 miles northwest of Trego.
Drainage area. 503 sq mi.
Gage-height record. Headwater and tailwater gages read hourly.
Discharge record. Discharge computed by Northern States Power Co. from its power- plant records on basis of ratings developed by Geological Survey. Rating checked by current-meter measurement Apr. 16, 1965, at 1,660 cfs.
Maxima.- March-May 1965: Daily discharge, 1,640 cfs Apr. 13.1927 to February 1965: Daily discharge, 5,200 cfs Sept. 2, 1941.
Remarks.- Discharge affected by operation of dam and powerplant.
Mean discharge, in cubic feet per second, 1965
Day
1__.2...3___4...5. __6...7...8__J9...10__
March
359328347308304351352320327336
April
281290307328334400436552503556
May
825749712740684691
1,0401,1201,1301,200
Day
11__12. _13..14..15..16..17..18..19..20..
March
323314308321317307282290288278
April
6501,2801,6401,5901,4901,5601,5001,4301,3501,240
May
1,1001,050
957680855965956967990937
Day
21..22..23..24. .25_.26..27..28..29_.30..31
Monthly mean discharge, in cubic feet per second...........Runoff, in in
March
278297287294303291299306284291337
3110.71
April
1,230949
1,1501,2301,1601,1101,010
935849830
9392.08
May
940903974956847854840807788810704
8962.05
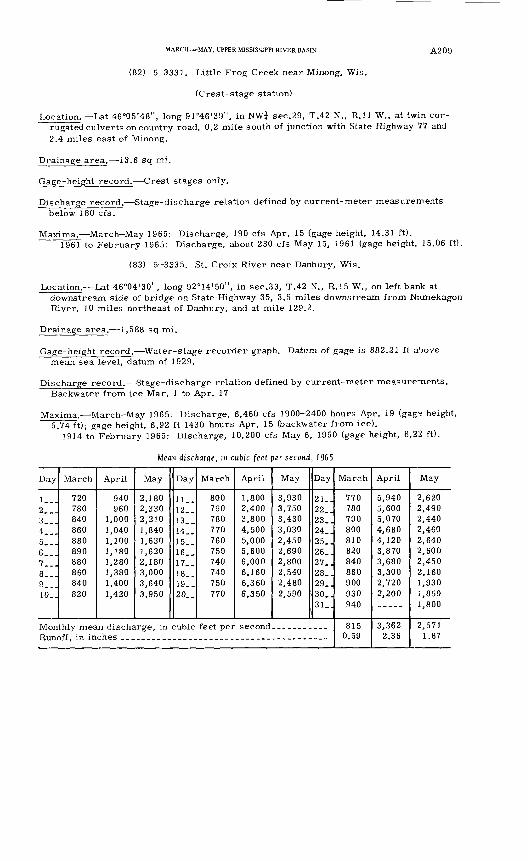
MARCH MAY, UPPER MISSISSIPPI RIVER BASIN A209
(82) 5-3331. Little Frog Creek near Minong, Wis.
(Crest-stage station)
Location. Lat 46°05'48", long 91°46'39", in NW? sec.29, T.42 N., R.ll W., at twin cor- rugated culverts on country road, 0.2 mile south of junction with State Highway 77 and 2.4 miles east of Minong.
Drainage area. 13.6 sq mi.
Gage-height record. Crest stages only.
Discharge record. Stage-discharge relation defined by current-meter measurements below 180 cfs.
Maxima.- March-May 1965: Discharge, 190 cfs Apr. 15 (gage height, 14.31 ft).1961 to February 1965: Discharge, about 230 cfs May 15, 1961 (gage height, 15.06 ft).
(83) 5-3335. St. Croix River near Danbury, Wis.
Location. Lat 46°04'30", long 92°14'50", in sec.33, T.42 N., R.15 W., on left bank at downstream side of bridge on State Highway 35, 3.5 miles downstream from Namekagon River, 10 miles northeast of Danbury, and at mile 129.2.
Drainage area. 1,588 sq mi.
Gage-height record. Water-stage recorder graph. Datum of gage is 882.21 ft above mean sea level, datum of 1929.
Discharge record. Stage-discharge relation defined by current-meter measurements. Backwater from ice Mar. 1 to Apr. 17
Maxima. March-May 1965: Discharge, 6,460 cfs 1900-2400 hours Apr. 19 (gag's height, 5.74 ft); gage height, 6.92 ft 1430 hours Apr. 15 (backwater from ice).
1914 to February 1965: Discharge, 10,200 cfs May 6, 1950 (gage height, 8.22 ft).
Mean discharge, m cubic feet per second, 1965
Day
1__.2___3...4...5...6...7...a...9...10..
March
720780840860880890880860840820
April
940960
1,0001,0401,1001,1801,2801,3801,4001,420
May
2,1802,3302,2101,8401,6301,6202,1803,0003,6403,950
Day
11__12. _13__14..15..16..17_.18_.19_.20. _
March
800790780770760750740740750770
April
1,8002,4003,8004,5005,0005,6006,0006,1606,3606,350
May
3,9303,7503,4303,0302,4502,6902,8002,5402,4802,590
Day
21_.22_.23.J24..25..26..27..28.J29..30..31..
Monthly mean discharge, in cubic feet per second-.- ________Runoff, in inches
March
770780790800810820840860900930940
8150.59
April
5,9405,6005,0704,6804,1203,8703,6803,3002,7202,200
3,3622.36
May
2,6202,4902,4402,4602,6402,6002,4502,1601,9301,8501,800
2,5711.87
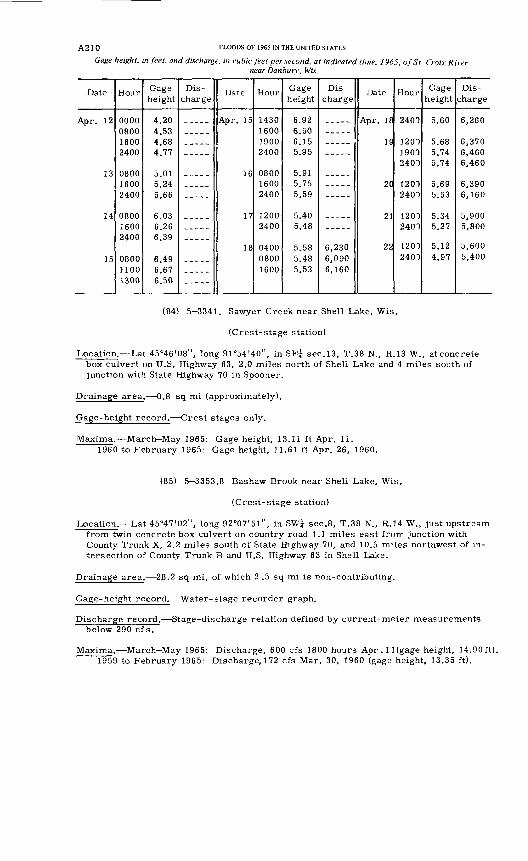
A210 FLOODS OF 1965 IN THE UNITED STATES
Gage height, in feet, and discharge, in cubic feet per second, at indicated time, 1965, of St. Croix Rivernear Danbury, Wis.
Date
Apr. 12
13
14
15
Hour
0000080016002400
080016002400
080016002400
080011001300
Gage height
4.20A ^"*4.684.77
5.015 24
5 C C
6.036.266.39
6.496.676.50
Dis
chargeDate
Apr. 15
16
17
18
Hour
1430160019002400
080016002400
12002400
0400 08001600
Gage height
6.926.506.155.95
5.915.755.59
5.405.48
5.58 5.485.53
Dis
charge
6,230 6,0906,160
Date
Apr. 18
19
20
21
22
Hour
2401
120019002400
12002400
12002400
1200 2400
Gage height
5.60
5.685.745.74
5 fiQ
5 53
5 345.27
5.12 4.97
Dis
charge
6,260
6,3706,4606,460
6,3906,160
5,9005,800
5,600 5,400
(84) 5-3341. Sawyer Creek near Shell Lake, Wis.
(Crest-stage station)
Location. Lat 45°46'08", long 91°54'40", in SE^ sec.13, T.38 N., R.13 W., at concrete box culvert on U.S. Highway 63, 2.0 miles north of Shell Lake and 4 miles south of junction with State Highway 70 in Spooner.
Drainage area. 0.8 sq mi (approximately).
Gage-height record. Crest stages only.
Maxima. March-May 1965: Gage height, 13.11 ft Apr. 11.1960 to February 1965: Gage height, 11.61 ft Apr. 26, 1960.
(85) 5-3353.8 Bashaw Brook near Shell Lake, Wis.
(Crest-stage station)
Location. Lat 45°47'02", long 92°07'5l", in SW^ sec.8, T.38 N., R.14 W., just upstream from twin concrete box culvert on country road 1.1 miles east from junction with County Trunk X, 2.2 miles south of State Highway 70, and 10.5 miles northwest of in tersection of County Trunk B and U.S. Highway 63 in Shell Lake.
Drainage area. 28.2 sq mi, of which 2 .5 sq mi is non-contributing.
Gage-height record. Water-stage recorder graph.
Discharge record. Stage-discharge relation defined by current-meter measurements below 290 cf s.
Maxima. March-May 1965: Discharge, 600 cfs 1800 hours Apr. iKgage height, 14.90ft). f9~59 to February 1965: Discharge. 172 cfs Mar. 30, 1960 (gage height, 13.35 ft).
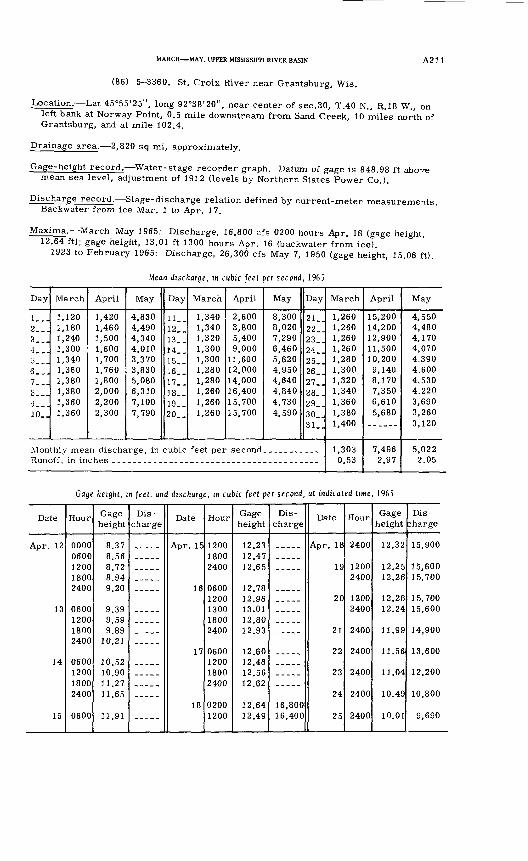
MARCH MAY, UPPER MISSISSIPPI RIVER BASIN A211
(86) 5 3360. St. Croix River near Grantsburg, Wis.
Location. Lat 45°55'25" J long 92°38'20", near center of sec.30, T.40 N., R.18 W., on left bank at Norway Point, 0.5 mile downstream from Sand Creek, 10 miles north of Grantsburg, and at mile 102.4.
Drainage area. 2,820 sq mi, approximately.
Gage-height record. Water-stage recorder graph. Datum of gage is 848.98 ft abo-^e mean sea level, adjustment of 1912 (levels by Northern States Power Co.).
Discharge record. Stage-discharge relation defined by current-meter measurements. Backwater from ice Mar. 1 to Apr. 17.
Maxima. March-May 1965: Discharge, 16,800 cfs 0200 hours Apr. 18 (gage height, 12.64 ft); gage height, 13.01 ft 1300 hours Apr. 16 (backwater from ice).
1923 to February 1965: Discharge, 26,300 cfs May 7, 1950 (gage height, 15.06 ft).
Mean discharge, in cubic feet per second, 1965
Day
1__.2..J3...4...5___6..J7...8___|9---10_.
March
1,1201,1801,2401,3001,3401,3601,3801,3801,3601,360
April
1,4201,4601,5001,6001,7001,7601,8002,0002,2002,300
May
4,8304,4904,3404,0103,3703,8305,0806,3107,1007,790
Day
11_.12._13..14..15_.16..17..18..19..20..
March
1,3401,3401,3201,3001,3001,2801,2801,2601,2601,260
April
2,6003,8005,4009,000
11,60012,00014,00016,40015,70015,700
May
8,3008,0207,2906,4605,6204,9504,6404,8404,7304,590
Day
21..22..23..24..25..26..27..28..29..30..31
Runoff, in in
March
1,2601,2601,2601,2601,2801,3001,3201,3401,3601,3801,400
1,3030.53
April
15,20014,20012,90011,50010,2009,1408,1707,3506,6105,680
7,4962.97
May
4,5504,4804,1704,0704,,3904,6004,5304,2203,6903,2603,120
5,0222.05
Gage height, in feet, and discharge, in cubic feet per second, at indicated time, 1965
Date
Apr. 12
13
14
15
Hour
00000600120018002400
0600120018002400
0600120018002400
0600
Gage height
8.378.568.728.949.20
9.399.599.89
10.21
10.5210.9011.2711.65
11.91
Dis charge
Date
Apr. 151
16
17
18
Hour
120018002400
06001200130018002400
0600120018002400
0200 1200
Gage height
12.2312.4712.65
12.781 9 Qfi
13.0112.8012.93
12.6012.4612.5612.62
12.64 12.49
Dis charge
16,800 16,400
Date
Apr. 18
19
20
21
22
23
24
25
Hour
2400
12002400
12002400
2400
2400
2400
2400
2400
Gage height
12.32
12.2512,26
12.2812.24
11.99
11.56
11.04
10.49
10.01
Dis
charge
15,900
15,60015,700
15,70015,600
14,900
13,600
12,200
10,800
9,690
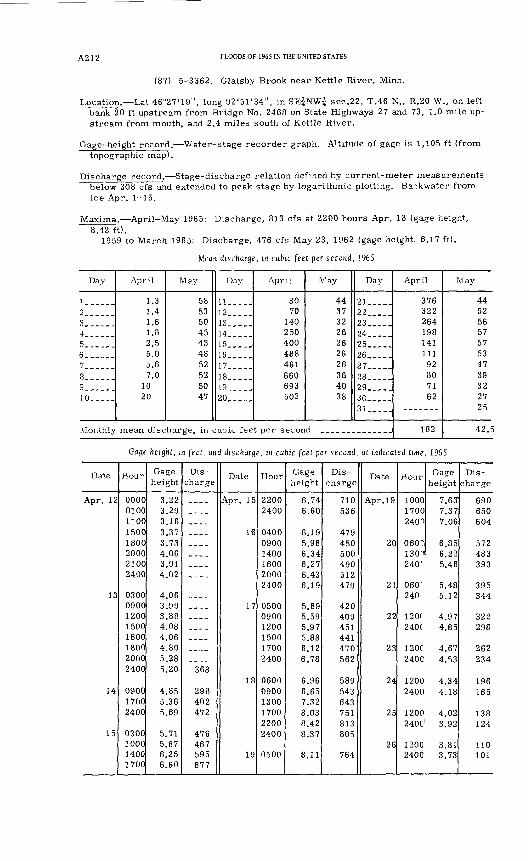
A212 FLOODS OF 1965 IN THE UNITED STATES
(87) 5-3362. Glaisby Brook near Kettle River, Minn.
Location. Lat 46°27'19", long 92°51'34", in SEiNW? sec.22, T.46 N., R.20 W., on left bank 20 ft upstream from Bridge No. 2468 on State Highways 27 and 73, 1.0 mile up stream from mouth, and 2.4 miles south of Kettle River.
Gage-height record. Water-stage recorder graph. Altitude of gage is 1,105 ft (from topographic map).
Discharge record. Stage-discharge relation defined by current-meter measurements below 308 cfs and extended to peak stage by logarithmic plotting. Backwater from ice Apr. 1 15.
Maxima. April-May 1965: Discharge, 813 cfs at 2200 hours Apr. 18 (gage height, 8.42 ft).
1959 to March 1965: Discharge, 476 cfs May 23, 1962 (gage height, 6.17 ft).
Mean discharge, m cubic (eel per second, J965
Day
1 _ -.2......3. __ ._4......5......6___ ...7______8......9 __ ...10.....
April
1.3 1.4 1.6 1.8 2.5 5.0 5.6 7.0
10 20
May
58 53 50 45 43 48 52 52 50 47
Day
11-....12._._.13.____14.__._iri.__._16_._._17_._._18_____19.-...20.. __
April
30 70
140 250 400 488 461 660 693 502
May
44 37 32 26 26 26 26 36 40 38
Day
21-. __22_____23__.__24__ __25 __ __26 ___27_____28 .....29 .....30__.__31__.__
Monthly mean discharge, in cubic feet per second ______________
April
376 322 264 198 141 111 92 80 71 62
182
May
44 52 56 57 57 53 47 39 32 27 25
42.5
Gage height, m feet, and discharge, in cubic feet per second, at indicated time, 1965
Date
Apr. 12
13
14
15
Hour
00000100110015001800200021002400
03000900120015001600180020002400
090017002400
0300100014001700
Gage height
3.223.293.163,373.734.063.914.02
4.063.993.884.084.064.805.285.20
4.855.365.69
5.715.676.256.60
Dis
charge
__._.-.___.__--_____--__________
____. ...__._________---___._368
298402472
476467595677
Date
Apr. 15
16
17
18
19
Hour
22002400
040009001400160020002400
050009001200150017002400
060009001300170022002400
0500
Gage height
6.746.60
6.195.966.346.276.436.19
5.695.595.975.886.126.78
6.966.657.328.038.428.37
8.11
Dis charge
710536
479450500490512479
420409451441470562
589543643751813805
764
Date
Apr. 19
20
21
22
23
24
25
26
Hour
100017002401
06071301240'i
060'
240''
120r240(
120f2400
12002400
120(1240C
12002400
Gage height
7.6317.377.06
6.856.225.46
5.485.12
4.974.85
4.674.53
4.344.18
4.023.92
3.813.73
Dis
charge
690650604
572483393
395344
322298
262234
196165
138124
110101
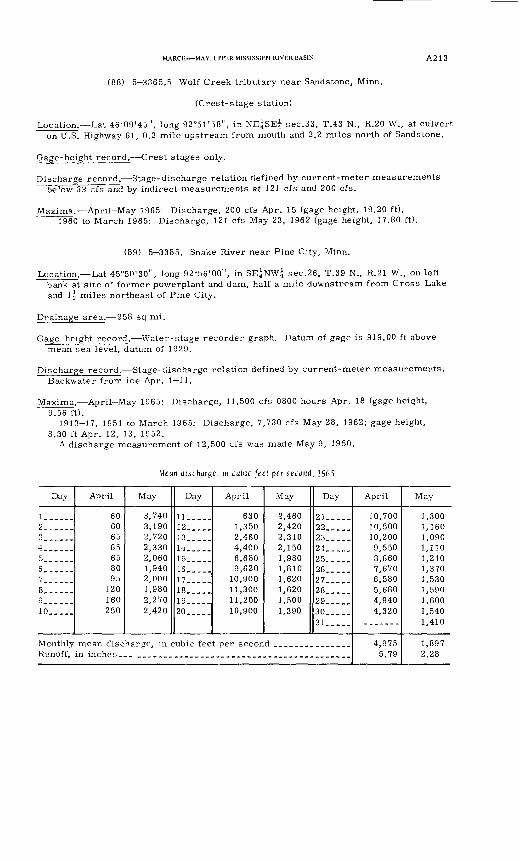
MARCH MAY, UPPER MISSISSIPPI RIVER BASIN A2 13
(88) 5 3365.5 Wolf Creek tributary near Sandstone, Minn.
(Crest-stage station)
Location. Lat 46°09'45", long 92°51'58", in NE^SE^ sec.33, T.43 N., R.20 W., at culvert on U.S. Highway 61, 0.2 mile upstream from mouth and 2.2 miles north of Sandstone.
Gage-height record. Crest stages only.
Discharge record. Stage-discharge relation defined by current-meter measurements below 33 cfs and by indirect measurements at 121 cfs and 200 cfs.
Maxima. April-May 1965: Discharge, 200 cfs Apr. 15 (gage height, 19.20 ft).1960 to March 1965: Discharge, 121 cfs May 23, 1962 (gage height, 17.80 ft).
(89) 5-3385. Snake River near Pine City, Minn.
Location. Lat 45°50'30", long 92°56'00", in SE^NW^ sec.26, T.39 N., R.21 W., on left bank at site of former powerplant and dam, half a mile downstream from Cross Lake and if miles northeast of Pine City.
Drainage area. 958 sq mi.
Gage-height record. Water-stage recorder graph. Datum of gage is 919.00 ft above mean sea level, datum of 1929.
Discharge record. Stage-discharge relation defined by current-meter measurements. Backwater from ice Apr. 1 11.
Maxima. April-May 1965: Discharge, 11,500 cfs 0800 hours Apr. 18 (gage height, 9.56 ft).
1913-17, 1951 to March 1965: Discharge, 7,730 cfs May 28, 1962; gage height, 8.30 ft Apr. 12, 13, 1952.
A discharge measurement of 12,500 cfs was made May 9, 1950.
Mean discharge, m cubic feet per second, 1965
Day
1__.__.2... __3 . ...4 ....5......6... __7 . ...8. __ ..9......10.....
Monthly Runoff,
April
60 60 65 65 65 80 95
120 160 250
May
3,740 3,190 2,720 2,330 2,060 1,940 2,000 1,980 2,270 2,420
Day
11.....12... __13_____14__...15_____16____.17..___18__ ...19__ ...20__ ...
April
630 1,350 2,460 4,400 6,680 9,620
10,900 11,300 11,200 10,900
May
2,460 2,420 2,310 2,150 1,980 1,810 1,620 1,620 1,500 1,390
Day
21__ ...22____.23__ ...24___...9^,
26.....27 .....28 __ _.9Q
30_.___31
mean discharge, in cubic feet per second _______________
April
10,700 10,500 10,200 9,550 8,660 7,670 6,580 5,680 4,940 4,320
4,975 5.79
May
],300 1,160 1,090 1,110 1,210 1,370 1,530 1,590 1,600 1,540 1,410
1,897 2.28
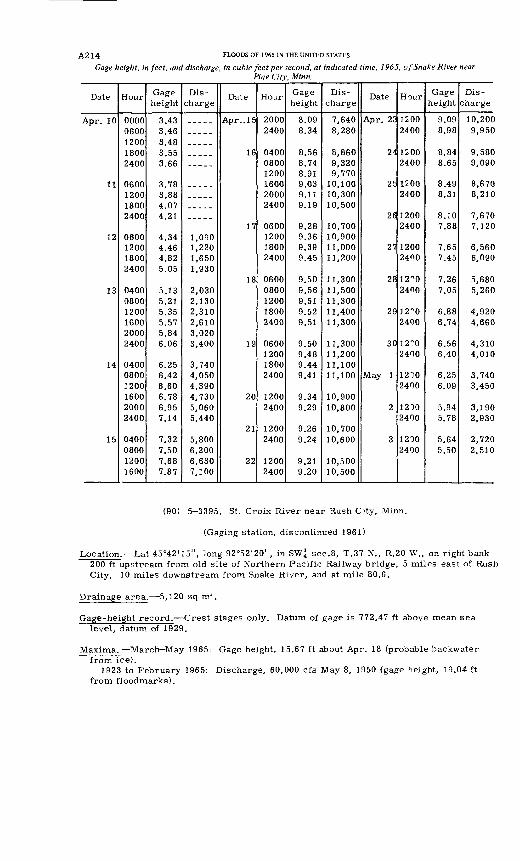
A2 14 FLOODS OF 1965 IN THE UNITED STATES
Gage height, in feet, and discharge, in cubic feet per second, at indicated time, 1965, of Snake River nearPine City, Minn.
Date
Apr. 10
11
12
13
14
15
Hour
00000600120018002400
0600120018002400
0600120018002400
040008001200160020002400
040008001200160020002400
0400080012001600
Gage height
3.433.463.483.553.66
3.783.884.074.21
4.344.464.825.05
5.135.215.355.575.846.06
6.256.426.606.786.957.14
7.327.507.687.87
Dis charge
1,0901,2201,6501,930
2,0302,1302,3102,6103,0203,400
3,7404,0504,3904,7305,0605,440
5,8006,2006,6307,100
Date
Apr.. 15
16
17
18
19
20
21
22
Hour
20002400
040008001200160020002400
0600120018002400
06000800120018002400
0600120018002400
12002400
12002400
12002400
Gage height
8.098.34
8.568.748.919.039.119.19
9.289.369.399.45
9.509.569.519.529.51
9.509.489.449.41
9.349.29
9.269.24
9.219.20
Dis charge
7,6408,280
8,8609,3209,770
10,10010,30010,500
10,70010,90011,00011,200
11,30011,50011,30011,40011,300
11,30011,20011,10011,100
10,90010,800
10,70010,600
10,50010,500
Date
Apr. 23
24
25
26
27
28
29
30
May 1
2
3
Hour
12002400
12002400
12002400
12002400
12002400
12^02400
12"0
2400
12702400
12102400
12102400
12002400
Gage height
9.098.98
8.848.65
8.498.31
8.107.88
7.657.45
7.267.05
6.886.74
6.566.40
6.256.09
5.945.78
5.645.50
Dis charge
10,2009,950
9,5809,090
8,6708,210
7,6707,120
6,5606,090
5,6805,260
4,9204,660
4,3104,010
3,7403,450
3,1902,930
2,7202,510
(90) 5-3395. St. Croix River near Rush City, Minn.
(Gaging station, discontinued 1961)
Location. Lat 45°42'15", long 92°52'20", in SW;j sec.8, T.37 N., R.20 W., on right bank 200 ft upstream from old site of Northern Pacific Railway bridge, 5 miles east of Rush City, 10 miles downstream from Snake River, and at mile 80.6.
Drainage area. 5,120 sq mi.
Gage-height record. Crest stages only. Datum of gage is 772.47 ft above mean sea level, datum of 1929.
Maxima.- March-May 1965: Gage height, 15.67 ft about Apr. 18 (probable backwater from ice).
1923 to February 1965: Discharge, 60,000 cfs May 8, 1950 (gage height, 19.04 ft from flood marks).
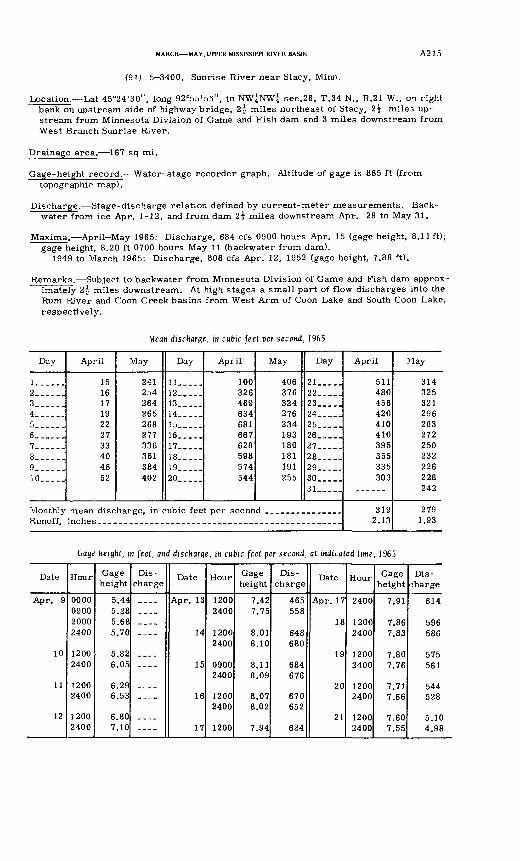
MARCH MAY, UPPER MISSISSIPPI RIVER BASIN A215
(91) 5-3400. Sunrise River near Stacy, Minn.
Location. Lat 45°24'30", long 92°55'55", in NW^NWi sec. 26, T.34 N., R.21 W., on right bank on upstream side of highway bridge, 2^ miles northeast of Stacy, 1\ miles up stream from Minnesota Division of Game and Fish dam and 3 miles downstream from West Branch Sunrise River.
Drainage area. 167 sq mi.
Gage-height record. Water-stage recorder graph. Altitude of gage is 865 ft (from topographic map).
Discharge. Stage-discharge relation defined by current-meter measurements. Back water from ice Apr. 1-12, and from dam 2\ miles downstream Apr. 28 to May 31.
Maxima. April-May 1965: Discharge, 684 cfs 0900 hours Apr. 15 (gage height, 8.11 ft); gage height, 8.20 ft 0700 hours May 11 (backwater from dam).
1949 to March 1965: Discharge, 806 cfs Apr. 12, 1952 (gage height, 7.88 ft).
Remarks. Subject to backwater from Minnesota Division of Game and Fish dam approx imately 2^ miles downstream. At high stages a small part of flow discharges into the Rum River and Coon Creek basins from West Arm of Coon Lake and South Coon Lake, respectively.
Mean discharge, in cubic feet per second, 1965
Day
!__.-. .2......3......4__ ...5......6. .....7......8______9-.____10.....
Monthly Runoff,
April
15 16 17 19 22 27 33 40 46 52
May
241 254 264 265 268 277 336 361 384 402
Day
ll.___.12.....13_____14 __ ..15 __ ..16 __ ..17 __ ..18.....19.. __20.....
April
100 326 469 634 681 667 628 598 574 544
mean discharge, in cubic feet per secon inches
May
406 376 324 276 234 193 180 181 191 255
Day
21 __ ..22 ___ .23 __ ..24_. ...25 ___ .26 ___ .27.. ...28 __ .29.. ...30.....31..._.
d ___ ______ __
April
511 480 456 420 410 410 395 355 335 303
319 2.13
Play
314 325 321 296 283 272 250 232 226 228 242
279 1.93
Gage height, in feet, and discharge, in cubic feet per second, at indicated time, 1965
Date
Apr. 9
10
11
12
Hour
0000090020002400
12002400
12002400
12002400
Gage height
5.445.285.685.70
5.826.05
6.296.53
6.807.10
Dis charge
___.____________
________
________
-___
Date
Apr. 13
14
15
16
17
Hour
12002400
12002400
09002400
12002400
1200
Gage height
7.427.75
8.018.10
8.118.09
8.078.02
7.94
Dis charge
465558
648680
684676
670652
624
Date
Apr. 1 7
18
19
20
21
Hour
2400
12002400
12002400
12002400
12002400
Gage height
7.91
7.867.83
7.807.76
7.717.66
7.607.55
Dis charge
614
596586
575561
544528
5.104.98
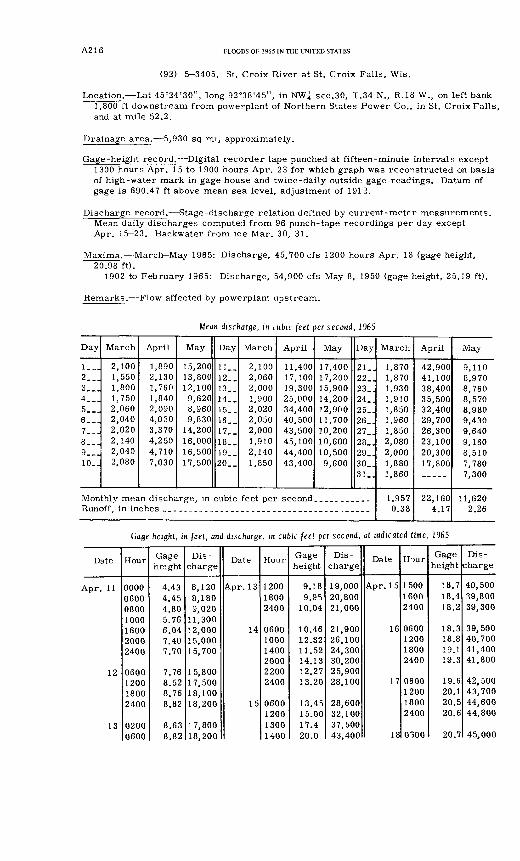
A216 FLOODS OF 1965 IN THE UNITED STATES
(92) 5-3405. St. Croix River at St. Croix Falls, Wis.
Location. Lat 45°24'30", long 92°38'45", in NW| sec.30, T.34 N., R.18 W., on left bank 1,800 ft downstream from powerplant of Northern States Power Co., in St. Croix Falls, and at mile 52.2.
Drainage area. 5,930 sq mi, approximately.
Gage-height record. Digital recorder tape punched at fifteen-minute intervals except 1300 hours Apr. 15 to 1900 hours Apr. 23 for which graph was reconstructed on basis of high-water mark in gage house and twice-daily outside gage readings. Datum of gage is 690.47 ft above mean sea level, adjustment of 1912.
Discharge record. Stage-discharge relation defined by current-meter measurements. Mean daily discharges computed from 96 punch-tape recordings per day except Apr. 15-23. Backwater from ice Mar. 30, 31.
Maxima. March-May 1965: Discharge, 45,700 cfs 1200 hours Apr. 18 (gage height, 20.98 ft).
1902 to February 1965: Discharge, 54,900 cfs May 8, 1950 (gage height, 25.19 ft).
Remarks. Flow affected by powerplant upstream.
Mean discharge, in cubic feet per second, 1965
Day
1__.2___3__.4__.5...6...7...8...9._.10_.
March
2,1001,5501,8001,7502,0602,0402,0202,1402,0402,080
April
1,8902,1301,7601,8402,0904,0303,3704,2504,7107,030
May
15,20013,80012,1009,6208,9609,830
14,20016,00016,50017,500
Day
11_.12__13..14..15..16..17..18..19__20..
March
2,1002,0602,0001,9002,0202,0502,0001,9102,1401,850
April
11,40017,10019,30025,00034,40040,50043,50045,10044,40043,400
May
17,40017,20015,90014,20012,90011,70010,20010,60010,5009,600
Day
21..22..23..24..25..26..27..28..29..30..31..
Monthly mean discharge in r.nbir. fppt npr Rpr.nndRunoff, in in
March
1,8701,8701,9301,9101,8501,9601,8502,0802,0001,8801,860
1,9570.38
April
42,90041,10038,40035,50032,40029,70026,30023,10020,30017,800
22,1604.17
May
9,1108,9708,7608,5708,9809,4309,6409,1608,5107,7807,300
11,6202.26
Gage height, in feet, and discharge, in cubic feet per second, at indicated time, 1965
Date
Vpr. 11
12
13
Hour
0000060008001000160020002400
0600120018002400
02000600
Gage height
4.434.454.805.766.047.407.70
7.768.528.768.82
8.638.82
Dis
charge
8,1208,1809,020
11,30012,00015,00015,700
15,80017,50018,10018,200
17,80018,200
Date
Apr. 13
14
15
Hour
120018002400
060010001400200022002400
0600120013001400
Gage height
9.189.95
10.04
10.4612.3211.5214.1312.2713.20
13.4515.0017.420.0
Dis
charge
19,00020,80021,000
21,90026,10024,30030,20025,90028,100
28,60032,10037,50043,400
Date
Apr. 15
16
17
18
Hour
150016002400
0600120018002400
0600120018002400
0300
Gage height
18.718.418.2
18.318.819.119.3
19.620.120.520.6
20.7
Dis
charge
40,50039,80039,300
39,50040,70041,40041,800
42,50043,70044,60044,800
45,000
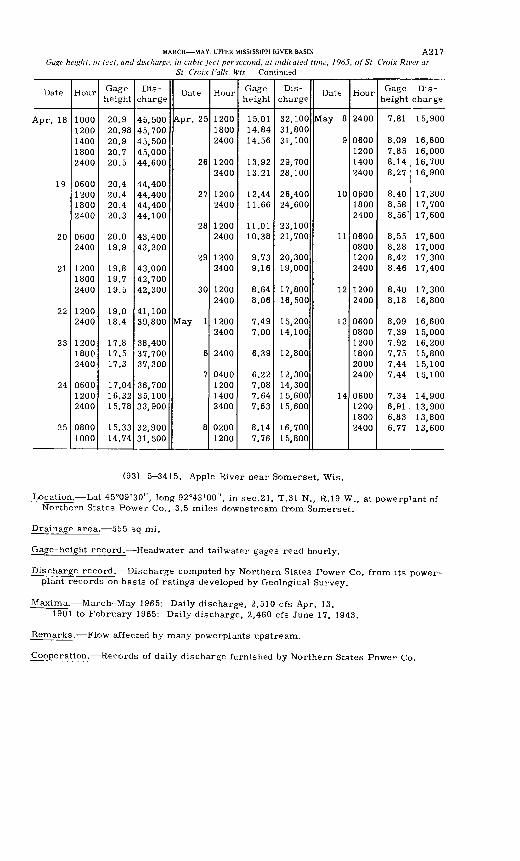
MARCH MAY, UPPER MISSISSIPPI RIVER BASIN A2 1 7
Gage height, in feet, and discharge, in cubic jeet per second, at indicated time, 1965, of St Croix River at St Croix Falls, Wis Continued
Date
Apr. 18
19
20
21
22
23
24
25
Hour
10001200140018002400
0600120018002400
06002400
120018002400
12002400
120018002400
060012002400
08001000
Gage height
20.920.9820.920.720.5
20.420.420.420.3
20.019.9
19.819.719.5
19.018.4
17.817.517.3
17.0416.3215.78
15.3314.74
Dis
charge
45,50045,70045,50045,00044,600
44,40044,40044,40044,100
43,40043,200
43,00042,70042,300
41,10039,800
38,40037,70037,300
36,70035,10033,900
32,90031,500
Date
Apr. 25
26
27
28
29
30
May 1
6
7
8
Hour
120018002400
12002400
12002400
12002400
12002400
12002400
12002400
2400
0400120014002400
02001200
Gage height
15.0114.8414.56
13.9213.21
12.4411.66
11.0110.38
9.739.16
8.648.06
7.497.00
6.39
6.227.087.647.63
8.147.76
Dis
charge
32,10031,80031,100
29,70028,100
26,40024,600
23,10021,700
20,30019,000
17,80016,500
15,20014,100
12,800
12,30014,30015,60015,600
16,70015,800
Date
May 8
9
10
11
12
13
14
Hour
2400
0600120014002400
060018002400
0600080012002400
12002400
060008001200180020002400
0600120018002400
Gage Dis- height charge
7.81 15,900
8.09 16,6007.85 16,0008.148.27
8.408.588.56'
8.558.288.428.46
8.408.18
8.097.397.927.757.447.44
7.346.916.83
16,70016,900
17,30017,70017,600
17,60017,00017,30017,400
17,30016,800
16,60015,00016,20015,80015,10015,100
14,90013,90013,800
6.77 13,600
(93) 5-3415. Apple River near Somerset, Wis.
Location. Lat 45°09'30", long 92°43'00", in sec.21, T.31 N., R.19 W., at powerp^ant of Northern States Power Co., 3.5 miles downstream from Somerset.
Drainage area. 555 sq mi.
Gage-height record. Headwater and tailwater gages read hourly.
Discharge record. Discharge computed by Northern States Power Co. from its power- plant records on basis of ratings developed by Geological Survey.
Maxima. March-May 1965: Daily discharge, 2,510 cfs Apr. 13.1901 to February 1965: Daily discharge, 2,460 cfs June 17, 1943.
Remarks. Flow affected by many powerplants upstream.
Cooperation. Records of daily discharge furnished by Northern States Power Co.
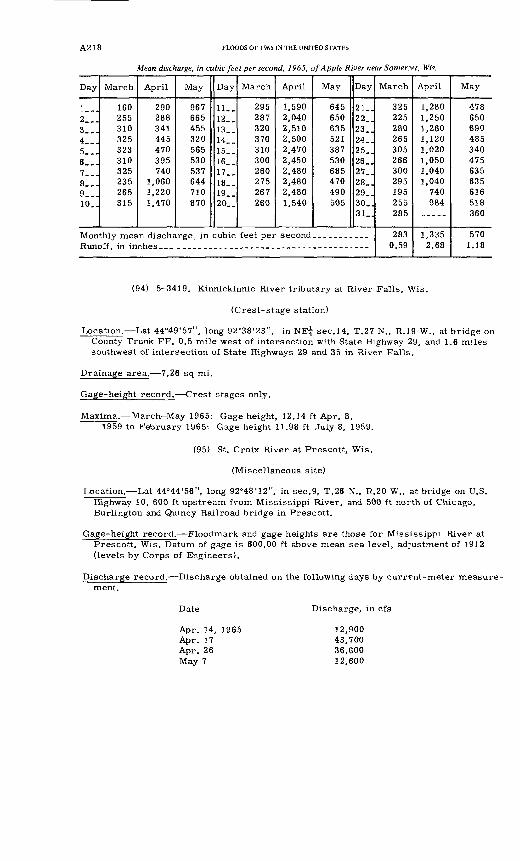
A218 FLOODS OF 1965 IN THE UNITED STATES
Mean discharge, in cubic feet per second, 1965, of Apple River near Somerset, Wis.
Day
1...2...3...4___5...6...7....8...9...10..
March
160255310325323310325235265315
April
290288341445470395740
1,0601,2201,470
May
967665455320565530537644710870
Day
11..12..13..14__15..16..17_.18..19_.20..
March
295287320370310300260275267260
April
1,5902,0402,5102,5002,4702,4502,4802,4802,4801,540
May
645650635521387530685470490505
Day
21..22..23..24..25..26..27..28..29..30..31..
Monthly mean Hisr-harcrp in cuhir feet ner second
Runoff , in in hes
March
325225280265305266300295195255285
2830.59
April
1,2801,2501,2601,1201,0201,0501,0401,040
740984
1,3352.68
May
478650690485340475635635616518360
5701.18
(94) 5 3419. Kinnickinnic River tributary at River Falls, Wis.
(Crest-stage station)
Location. Lat 44°49'57", long 92°38'23", in NE^ sec.14, T.27 N., R.19 W., at bridge on County Trunk FF, 0.5 mile west of intersection with State Highway 29, and 1.6 miles southwest of intersection of State Highways 29 and 35 in River Falls.
Drainage area. 7.26 sq mi.
Gage-height record. Crest stages only.
Maxima. March-May 1965: Gage height, 12.14 ft Apr. 8.1959 to February 1965: Gage height 11.98 ft July 8, 1959.
(95) St. Croix River at Prescott, Wis.
(Miscellaneous site)
Location. Lat 44°44'56", long 92°48'12", in sec.9, T.26 N., R.20 W., at bridge on U.S. Highway 10, 600 ft upstream from Mississippi River, and 500 ft north of Chicago, Burlington and Quincy Railroad bridge in Prescott.
Gage-height record. Floodmark and gage heights are those for Mississippi River at Prescott, Wis. Datum of gage is 600.00 ft above mean sea level, adjustment of 1912 (levels by Corps of Engineers).
Discharge record. Discharge obtained on the following days by current-meter measure ment.
Date
Apr. 14, 1965 Apr. 17 Apr. 26 May 7
Discharge, in cfs
12,90043,70036,60012,600
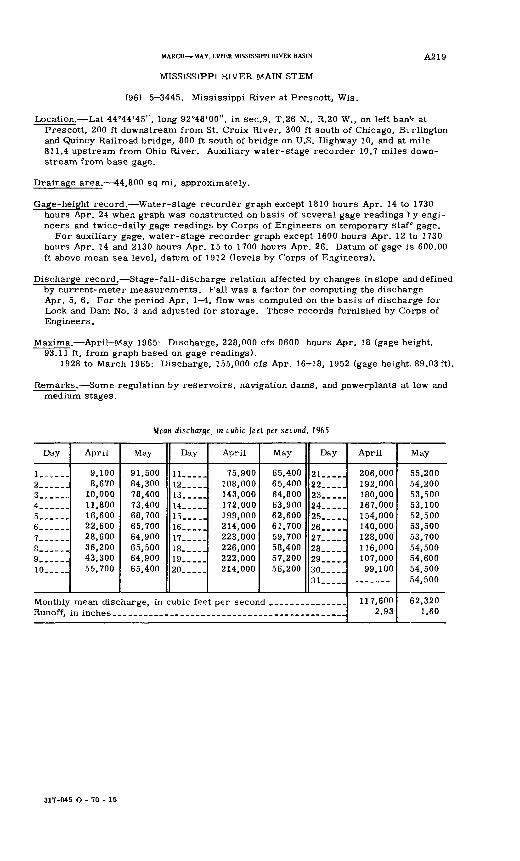
MARCH^-MAY, UPPER MISSISSIPPI RIVER BASIN A2 1 9
MISSISSIPPI RIVER MAIN STEM
(96) 5-3445. Mississippi River at Prescott, Wis.
Location. Lat 44°44'45", long 92°48'00", in sec.9, T.26 N., R.20 W., on left banV at Prescott, 200 ft downstream from St. Croix River, 300 ft south of Chicago, Burlington and Quincy Railroad bridge, 800 ft south of bridge on U.S. Highway 10, and at mile 811.4 upstream from Ohio River. Auxiliary water-stage recorder 10.7 miles down stream from base gage.
Drainage area. 44,800 sq mi, approximately.
Gage-height record. Water-stage recorder graph except 1810 hours Apr. 14 to 1730 hours Apr. 24 when graph was constructed on basis of several gage readings I y engi neers and twice-daily gage readings by Corps of Engineers on temporary staf gage.
For auxiliary gage, water-stage recorder graph except 1600 hours Apr. 12 to 1730 hours Apr. 14 and 2130 hours Apr. 15 to 1700 hours Apr. 26. Datum of gage is 600.00 ft above mean sea level, datum of 1912 (levels by Corps of Engineers).
Discharge record. Stage-fall-discharge relation affected by changes in slope and defined by current-meter measurements. Fall was a factor for computing the discharge Apr. 5, 6. For the period Apr. 1 4, flow was computed on the basis of discharge for Lock and Dam No. 3 and adjusted for storage. These records furnished by Corps of Engineers.
Maxima. April-May 1965: Discharge, 228,000 cfs 0600 hours Apr. 18 (gage height, 93.11 ft, from graph based on gage readings).
1928 to March 1965: Discharge, 155,000 cfs Apr. 16-18, 1952 (gage height, 89.03ft).
Remarks. Some regulation by reservoirs, navigation dams, and powerplants at low and medium stages.
Mean discharge, in cubic feel per second, 1965
Day
!______2______3......4__ ...5......6, .__..7......8______9___ __10 ._._.
Monthly Runoff,
April
9,100 8,670
10,000 11,800 16,600 22,600 28,600 36,200 43,300 55,700
May
91,500 84,300 78,400 73,400 68,700 65,700 64,900 65,500 64,900 65,400
Day
11-....12.....13. ___14 __ _.15 __ ..16 __ .,17 __ ..18.. __19.. ...20 __ __
April
75,900 108,000 143,000 172,000 199,000 214,000 223,000 226,000 222,000 214,000
mean discharge, in cubic feet per secon in inches
May
65,400 65,400 64,800 63,900 62,600 61,700 59,700 58,400 57,200 56,200
Day
21 __ .22 .....23 __ _24.....25.. ...26 .....27 .....28 __ .29.. ...30.. ...31.. ...
d ___ __ __ .....
April
206,000 192,000 180,000 167,000 154,000 140,000 128,000 116,000 107,000 99,100
117,600 2.93
May
55,200 54,200 53,500 53,100 52,500 53,500 53,700 54,500 54,600 54,500 54,500
62,320 1.60
317-045 O - 70 - 15
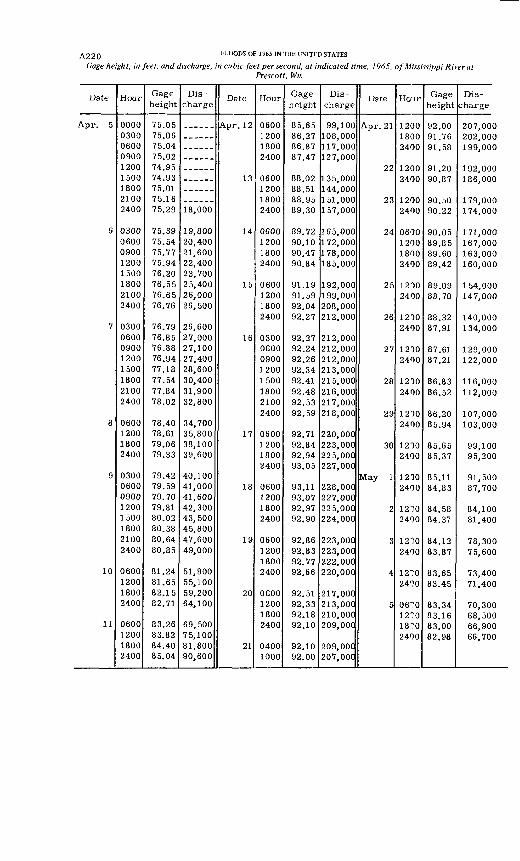
A220 FLOODS OF 1965 IN THE UNITED STATES
Gage height, in feet, and discharge, in cubic feet per second, at indicated time, 1965, of Mississippi River atPrescott, Wis.
Date
Apr. 5
6
7
8
9
10
11
Hour
000003000600090012001500180021002400
03000600090012001500180021002400
03000600090012001500180021002400
0600120018002400
03000600090012001500180021002400
0600120018002400
0600120018002400
Gage height
75.0575.0675.0475.0274.9574.9375.0175.1675.29
75.3975.5475.7775.9476.2076.5576.6576.76
76.7976.8576.8876.9477.1877.5477.8478.02
78.4078.6179.0679.33
79.4279.5979.7079.8180.0280.3880.6480.85
81.2481.6582.1582.71
83.2683.8284.4085.04
Dis
charge
18,000
19,80020,40021,60022,40023,70025,40026,00026,500
26,60027,00027,10027,40028,60030,40031,90032,800
34,70035,80038,10039,600
40,10041,00041,60042,30043,50045,80047,60049,000
51,90055,10059,20064,100
69,50075,10081,80090,600
Date
Any 1 9rt.pl . 1 &
1 *} 1 O
14
15
16
17
18
19
20
21
Hour
0600120018002400
0600120018002400
0600120018002400
0600120018002400
03000600090012001500180021002400
0600120018002400
0600120018002400
0600120018002400
0600120018002400
04001000
Gage height
85.6586.2786.8787.47
88.0288.5188.9589.30
89.7290.1090.4790.84
91.1991.5992.0492.27
92.2792.2492.2692.3492.4192.4892.5392.59
92.7192.8492.9493.05
93.1193.0792.9792.90
92.8692.8392.7792.66
92.5192.3392.1892.10
92.1092.00
Dis
charge
99 10C108,000117,000127,000
135,000144,000151,000157,000
165,000172,000178,000185,000
192,000199,000208,000212,000
212,000212,000212,000213,000215,000216,000217,000218,000
220,000223,000225,000227,000
228,000227,000225,000224,000
223,000223,000222,000220,000
217,000213,000210,000209,000
209,000207,000
Date
Apr. 21
22
23
24
25
26
27
28
29
30
May 1
2
3
4
5
Hour
120018002400
12002400
12002400
0600120018002400
12002400
12002400
12002400
12002400
12002400
12002400
12702400
12702400
12702400
12702400
0670127018702400
Gage height
92 0091.7691.58
01 ony i .zu 90 87
90.5090.22
90.0589.8589.6089.42
89.0988.70
88.3287.91
87.6187.21
86.8386.52
86.2085.94
85.6585.37
85.1184.83
84.5884.37
84.1283.87
83.6583.45
83.3483.1683.0082.98
Dis
charge
207,000202,000199,000
192,000 186,000
179,000174,000
171,000167,000163,000160,000
154,000147,000
140,000134,000
129,000122,000
116,000112,000
107,000103,000
99,10095,200
91,50087,700
84,10081,400
78,30075,600
73,40071,400
70,30068,50066,90066,700
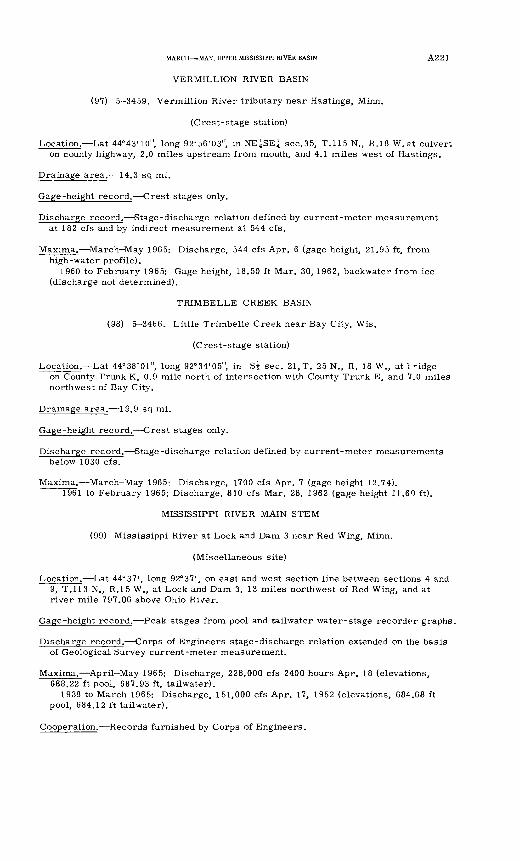
MARCH MAY, UPPER MISSISSIPPI RIVER BASIN A221
VERMILLION RIVER BASIN
(97) 5 3459. Vermillion River tributary near Hastings, Minn.
(Crest-stage station)
Location. Lat 44°43'10", long 92°56'03", in NE^SE^ sec.35, T.115 N., R.18 W.st culvert on county highway, 2.0 miles upstream from mouth, and 4.1 miles west of Hastings.
Drainage area. 14.3 sq mi.
Gage-height record. Crest stages only.
Discharge record. Stage-discharge relation defined by current-meter measurement at 182 cfs and by indirect measurement at 544 cfs.
Maxima. March May 1965: Discharge, 544 cfs Apr. 6 (gage height, 21.95 ft, from high-water profile).
1960 to February 1965: Gage height, 18.50 ft Mar. 30, 1962, backwater fro-n ice (discharge not determined).
TRIMBELLE CREEK BASIN
(98) 5-3466. Little Trimbelle Creek near Bay City, Wis.
(Crest-stage station)
Location. Lat 44°38'0l", long 92°34'05", in Si sec. 21, T. 25 N., R. 18 W., at t ^idge on County Trunk K, 0.9 mile north of intersection with County Trunk E, and 7.0 miles northwest of Bay City.
Drainage area. 19.9 sq mi.
Gage-height record. Crest stages only.
Discharge record. Stage-discharge relation defined by current-meter measurements below 1030 cfs.
Maxima. March May 1965: Discharge, 1700 cfs Apr. 7 (gage height 12.74).T96~l to February 1965; Discharge, 810 cfs Mar. 28, 1962 (gage height 11.60 ft).
MISSISSIPPI RIVER MAIN STEM
(99) Mississippi River at Lock and Dam 3 near Red Wing, Minn.
(Miscellaneous site)
Location. Lat 44°37', long 92°37', on east and west section line between sections 4 and 9, T.113 N., R.15 W., at Lock and Dam 3, 13 miles northwest of Red Wing, and at river mile 797.06 above Ohio River.
Gage-height record. Peak stages from pool and tailwater water-stage recorder graphs.
Discharge record. Corps of Engineers stage-discharge relation extended on the basis of Geological Survey current-meter measurement.
Maxima. April May 1965: Discharge, 228,000 cfs 2400 hours Apr. 18 (elevations, 688.22 ft pool, 687.93 ft, tailwater).
1938 to March 1965: Discharge, 151,000 cfs Apr. 17, 1952 (elevations, 684.68 ft pool, 684.12 ft tailwater).
Cooperation. Records furnished by Corps of Engineers.
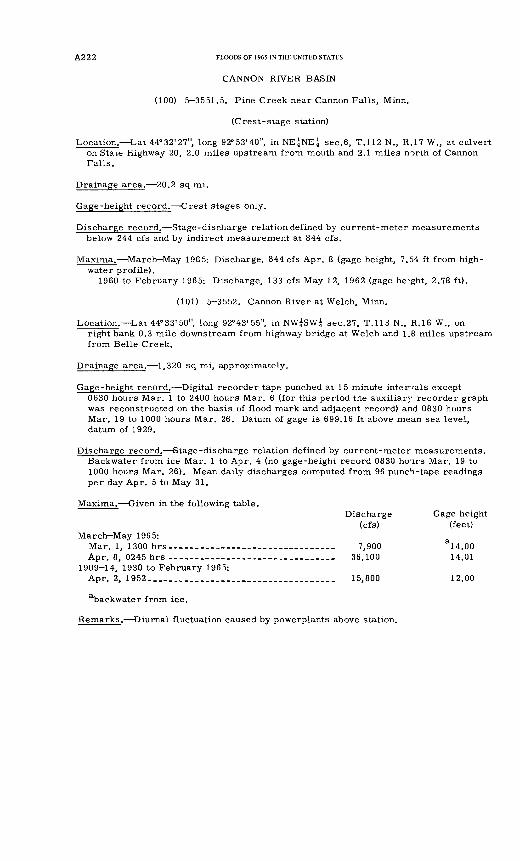
A222 FLOODS OF 1965 IN THE UNITED STATES
CANNON RIVER BASIN
(100) 5-3551.5. Pine Creek near Cannon Falls, Minn.
(Crest-stage station)
Location. Lat 44°32'27", long 92°53'40", in NE^NE^ sec.6, T.112 N., R.17 W., at culvert on State Highway 20, 2.0 miles upstream from mouth and 2.1 miles north of Cannon Falls.
Drainage area. 20.2 sq mi.
Gage-height record. Crest stages only.
Discharge record. Stage-discharge relation defined by current-meter measurements below 244 cfs and by indirect measurement at 844 cfs.
Maxima. March May 1965: Discharge, 844 cfs Apr. 8 (gage height, 7.54 ft from high- water profile).
1960 to February 1965: Discharge, 133 cfs May 12, 1962 (gage height, 2.78 ft).
(101) 5-3552. Cannon River at Welch, Minn.
Location. Lat 44°33'50", long 92°43'55", in NWjSWj sec.27, T.113 N., R.16 W., onright bank 0.3 mile downstream from highway bridge at Welch and 1.8 miles upstream from Belle Creek.
Drainage area. 1,320 sq mi, approximately.
Gage-height record. Digital recorder tape punched at 15 minute intervals except0630 hours Mar. 1 to 2400 hours Mar. 6 (for this period the auxiliary recorder graph was reconstructed on the basis of flood mark and adjacent record) and 0830 hours Mar. 19 to 1000 hours Mar. 26. Datum of gage is 699.16 ft above mean sea level, datum of 1929.
Discharge record. Stage-discharge relation defined by current-meter measurements. Backwater from ice Mar. 1 to Apr. 4 (no gage-height record 0830 hours Mar. 19 to 1000 hours Mar. 26). Mean daily discharges computed from 96 punch-tape readings per day Apr. 5 to May 31.
Maxima. Given in the following table.Discharge Gage height
(cfs) (feet) March-May 1965:
Mar. 1, 1300 hrs ______ ____ 7,900 & 14.00Apr. 8, 0245 hrs---------------- _._.._______. 36,100 14.01
1909-14, 1930 to February 1965:Apr. 2, 1952_______________________. 15,800 12.00
abackwater from ice.
Remarks. Diurnal fluctuation caused by powerplants above station.
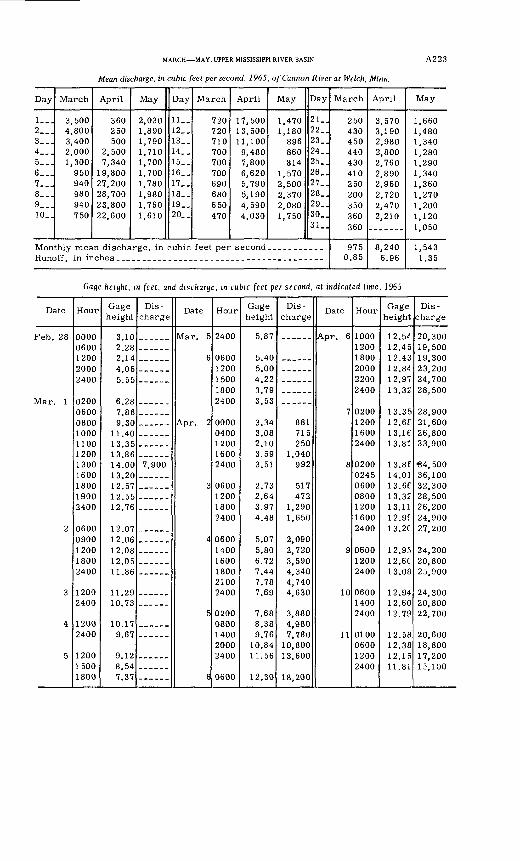
MARCH MAY, UPPER MISSISSIPPI RIVER BASIN A223
Mean discharge, in cubic feet per second, 1965, of Cannon River at Welch, Minn.
Day
1...2...3...4...5...6...7___8...9__.10..
March
3,5004,8003,4002,0001,300
950940980940750
April
360250500
2,5007,340
19,80027,20028,70023,80022,600
May
2,0301,8901,7901,7101,7001,7001,7801,9801,7601,610
Day
11..12__13_.14..15..16..17..18..19-_20..
March
720720710700700700690680650470
April
17,50013,50011,1009,4807,8006,6205,7905,1904,5904,030
May
1,4701,180
896860814
1,5702,5002,3702,0801,750
Day
21..22..23..24..25..26..27..28..29..30..31..
Runoff, in ir
March
250430450440430410250200350360360
9750.85
April
3,5703,1902,9802,8002,7602,8902,9602,7202,4702,210
8,2406.96
May
1,6601,4801,3401,2801,2901,3401,3601.2701,2001,1201,050
1,5431.35
Gage height, in feet, and discharge, in cubic feet per second, at indicated time, 1965
Date
Feb. 28
Mar. 1
2
3
4
5
Hour
0600120020002400
0200060008001000110012001300 1600180019002400
06000900120018002400
12002400
12002400
120015001800
Gage height
3 1 n2.282 144.065.55
6.287.869.30
11.40133513.8614.00 1 ^ 9n
12.5712.5512.76
12.0712.0612.0812.0511.86
11.2910.73
10.179.67
9.12
7 97
Dis
charge
7,900
Date
Mar. 5
6
A.pr. 2
3
4
5
6
Hour
2400
06001200150018002400
00000400120016002400
0600120018002400
06001400160018002100 2400
0200 080014002000 2400
0600
Gage height
5.87
5.405.004.223.793.53
3.343.082.103.593.51
2.732.643.974.48
5.075.806.727.447.78 7.69
7.68 8.389.76
10.84 11.56
1 *} ^n
Dis
charge
881715250
1,040992
517472
1,2901,650
2,0902,7203,5904,3404,740 4,630
3,880 4,9807,780
10,800 13,600
1 Q 9OO
Date
7
8
9
10
11
Hour
100012001800200022002400
0200120016002400
0200 02450600080012001600 2400
060012002400
060014002400
01000600 12002400
Gage height
12. 5*12.4512.4312.8412.9713.3?
13.3512. 6f13. If13.81
13. 8f 14.0113.6613.3213.1112. 9f 13. 2C
12.9312. 6C13.08
12.9412.6012.79
12.38 121511.81
Dis
charge
on Qnn
19,50019,30023,20024,70028,500
28,90021,60026,80033,900
«4,500 36,10032,30028,50026,20024,900 27,200
24,20020,80025,900
20,80022,700
20,60018,800
15,100
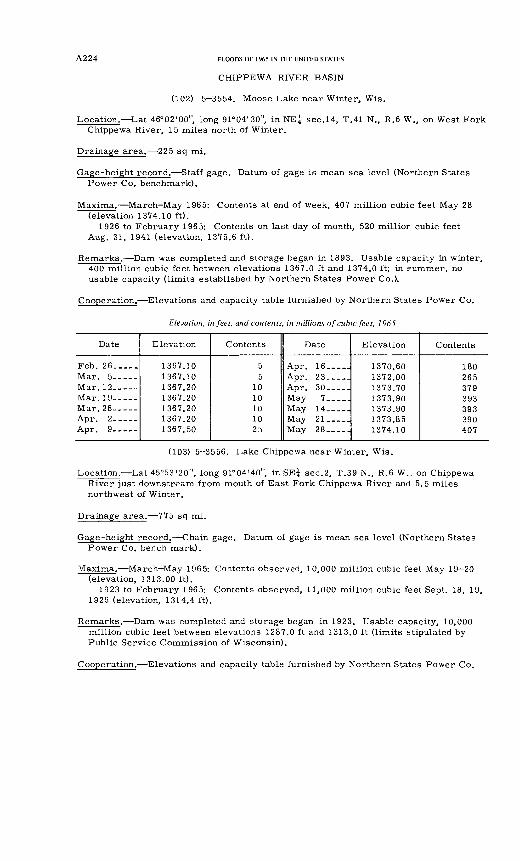
A2 2 4 FLOODS OF 1965 IN THE UNITED STATES
CHIPPEWA RIVER BASIN
(102) 5-3554. Moose Lake near Winter, Wis.
Location. Lat 46°02'00", long 91°04'30", in NE^ sec.14, T.41 N,, R.6 W., on West Fork Chippewa River, 15 miles north of Winter.
Drainage area. 225 sq mi.
Gage-height record. Staff gage. Datum of gage is mean sea level (Northern States Power Co. benchmark).
Maxima. March May 1965: Contents at end of week, 407 million cubic feet May 28 (elevation 1374.10 ft).
1926 to February 1965: Contents on last day of month, 520 million cubic feet Aug. 31, 1941 (elevation, 1375.6 ft).
Remarks. Dam was completed and storage began in 1893. Usable capacity in winter, 400 million cubic feet between elevations 1367.0 ft and 1374.0 ft; in summer, no usable capacity (limits established by Northern States Power Co.).
Cooperation. Elevations and capacity table furnished by Northern States Power Co.
Elevation, in feet, and contents, in millions of cubic feet, 1965
Date
Feb. 26 _____Mar. 5-----
Mar. 26-----
A nr> Q
Elevation
1367.101367.101367.20
1367.20
Contents
55
10
25
Date
Apr. 16 __ .Apr. 23 __ .
IVIav 7May 14May 21
Elevation
1370.601 37 2 001373 701 37 3 901 373 90
1374.10
Contents
265379393393390407
(103) 5-3556. Lake Chippewa near Winter, Wis.
Location. Lat 45°53'20", long 91°04'40") in SE| sec.2, T.39 N., R.6 W., on Chippewa River just downstream from mouth of East Fork Chippewa River and 5.5 miles northwest of Winter.
Drainage area. 775 sq mi.
Gage-height record. Chain gage. Datum of gage is mean sea level (Northern States Power Co. bench mark).
Maxima. March-May 1965: Contents observed, 10,000 million cubic feet May 19-20 (elevation, 1313.00 ft).
1923 to February 1965: Contents observed, 11,000 million cubic feet Sept. 18, 19, 1926 (elevation, 1314.4 ft).
Remarks. Dam was completed and storage began in 1923. Usable capacity, 10,000 million cubic feet between elevations 1287.0 ft and 1313.0 ft (limits stipulated by Public Service Commission of Wisconsin).
Cooperation. Elevations and capacity table furnished by Northern States Power Co.
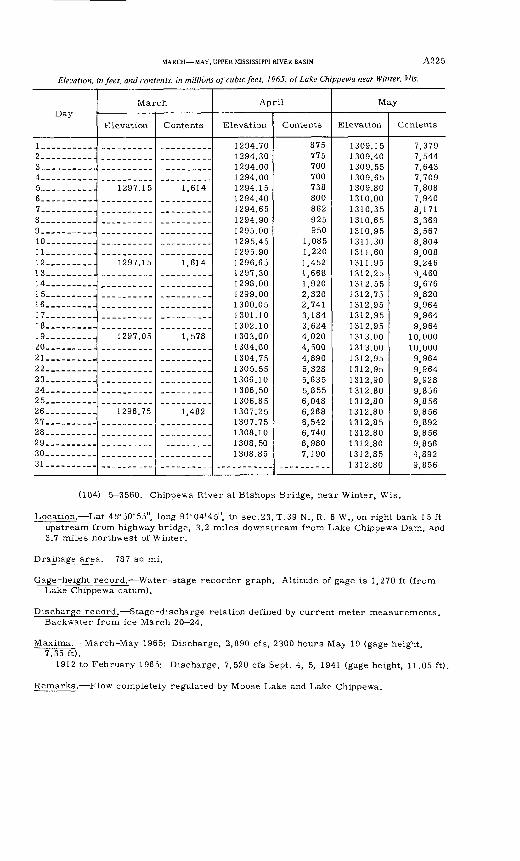
MARCH MAY, UPPER MISSISSIPPI RIVER BASIN A2 2 5
Elevation, in feet, and contents, in millions of cubic feet, 1965, of Lake Chippewa near Winter, Vis.
Day
1_. .___._...2 ___ __ ...3__ ______ -4 __ .. ___ ..5 _._ ___ ...6____ __ __ .7 _____ . _.8 __ _____ .9 __ _____ .10_... ____ .11_________.12__-__.___.13 _______ .14_. --_.-_.-15 ____ - __ -16 ____ _____17. ____.___.18___ ____ -19._. _______20... ... ... .21 _______ _22 ____ ___ _23- ___ ___ _24___. __ ...25 ____ .. __26 __ _______27 ____ . __28 ___ __ ...29 __ _______30__._ __ __31___-_-_.__
March
Elevation
1297.15
1297.15
1297.05
1296.75
Contents
1,614
1,614
1,578
1,482
April
Elevation
1294.70 1294.30 1294.00 1294.00 1294.15 1294.40 1294.65 1294.90 1295.00 1295.45 1295.90 1296.65 1297.30 1298.00 1299.00 1300.05 1301.10 1302.10 1303.00 1304.00 1304.75 1305.55 1306.10 1306.50 1306.85 1307.25 1307.75 1308.10 1308.50 1308.85
Contents
875 775 700 700 738 800 862 925 950
1,085 1,220 1,452 1,668 1,920 2,320 2,741 3,184 3,624 4,020 4,500 4,890 5,328 5,635 5,855 6,048 6,268 6,542 6,740 6,980 7,190
May
Elevation
1309.15 1309.40 1309.55 1309.65 1309.80 1310.00 1310.35 1310.65 1310.95 1311.30 1311.60 1311.95 1312.25 1312.55 1312.75 1312.95 1312.95 1312.95 1313.00 1313.00 1312.95 1312.95 1312.90 1312.80 1312.80 1312.80 1312.85 1312.80 1312.80 1312.85 1312.80
Contents
7,379 7,544 7,643 7,709 7,808 7,940 8,171 8,369 8,567 8,804 9,008 9,246 9,460 9,676 9,820 9,964 9,964 9,964
10,000 10,000 9,964 9,964 9,928 9,856 9,856 9,856 9,892 9,856 9,856 9,892 9,856
(104) 5-3560. Chippewa River at Bishops Bridge, near Winter, Wis.
Location. Lat 45°50'55", long 91°04'45", in sec.23, T.39 N., R. 6 W., on right bank 15 ft upstream from highway bridge, 3.2 miles downstream from Lake Chippewa Dam, and 3.7 miles northwest of Winter.
Drainage area. 787 sq mi.
Gage-height record. Water-stage recorder graph. Altitude of gage is 1,270 ft (from Lake Chippewa datum).
Discharge record. Stage-discharge relation defined by current meter measurements. Backwater from ice March 20 24.
Maxima.- March-May 1965: Discharge, 2,890 cfs, 2300 hours May 19 (gage height, 7.35 ft).
1912 to February 1965: Discharge, 7,520 cfs Sept. 4, 5, 1941 (gage height, 11.05 ft).
Remarks. Flow completely regulated by Moose Lake and Lake Chippewa.
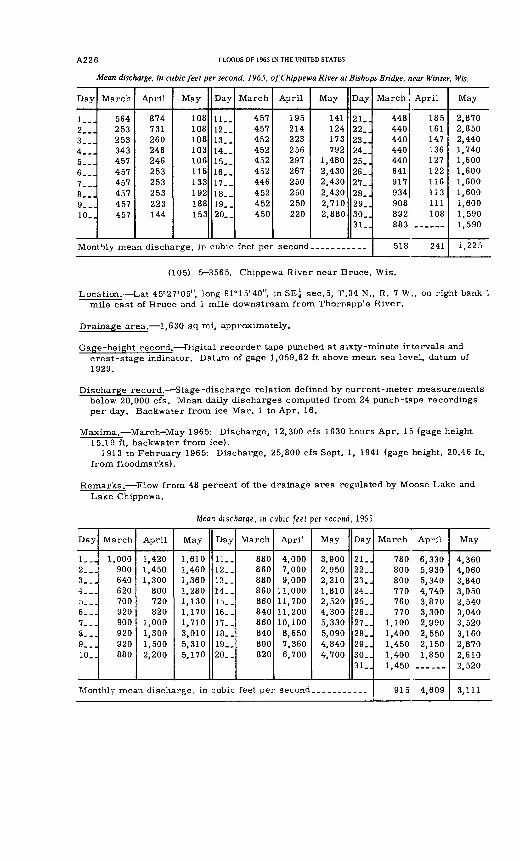
A2 2 6 FLOODS OF 1965 IN THE UNITED STATES
Mean discharge, in cubic feet per second, 1965, of Chippewa River at Bishops Bridge, near Winter, Wis.
Day
1...2...3...4...5...6 __7...a...9...10..
March
564253253343457457457457457457
April
874731260246246253253253223144
May
108108108103106116133192188153
Day
11..12__13__14. _15__16__17__18__19__20. _
March
457457452452452452446452452450
April
195214223256297267250250250220
May
141124173792
1,4802,4302,4302,4302,7102,880
Day
21_.22__23_.24. .25. .26_.27_.28_.29_.30_.31
Monthly mean discharge, in cubic feet per second.. _________
March
448440440440440641917934908892
April
185161147136127122116113111108
883 _ _____
518 241
May
2,8702,8502,4401,7401,6001,6001,6001,6001,6001,5901,590
1,225
(105) 5 3565. Chippewa River near Bruce, Wis.
Location. Lat 45°27'05", long 91°15'40", in SE? sec.5, T.34 N., R. 7 W., on right bank 1 mile east of Bruce and 1 mile downstream from Thornapple River.
Drainage area. 1,630 sq mi, approximately.
Gage-height record. Digital recorder tape punched at sixty-minute intervals and crest-stage indicator. Datum of gage 1,059.62 ft above mean sea level, datum of 1929.
Discharge record. Stage-discharge relation defined by current-meter measurements below 20,000 cfs. Mean daily discharges computed from 24 punch-tape recordings per day. Backwater from ice Mar. 1 to Apr. 16.
Maxima. March-May 1965: Discharge, 12,300 cfs 1630 hours Apr. 15 (gage height 15.19 ft, backwater from ice).
1913 to February 1965: Discharge, 25,800 cfs Sept. 1, 1941 (gage height, 20.46 ft, from floodmarks).
Remarks. Flow from 48 percent of the drainage area regulated by Moose Lake and Lake Chippewa.
Mean discharge, in cubic feet per second, 1965
Day
l-_.2__.3__.4___5...6__.7.......9...10_.
March
1,000900640620700920900920920880
April
1,4201.4501,300
800720820
1,0001,3001,5002,200
May
1.6101,4601,3601,2801,1301,1701,7103,0105,3105,170
Day
11__12__13__14__15__16__17__18__19-.20. _
March
880860880860860840860840800820
April
4,0007,0009,000
11,00011,70011,20010,1008,6507,3606,700
May
3,9002,9502,2101,8102,5204,3005,3305,0904,8404,700
Day
21_.22_.23_.24_.25..26..27..28..29..30..31..
Monthly mean discharge, in cubic feet per second.. _________
March April
780 6,330800 5,930800 5,340770 4,740760 3,870770 3,300
1,100 2,9901,400 2,5501,450 2,1501,400 1,8501.450 ... ___
915 4,609
May
4,3604,0603,8403,0502,5403,0403,5203,1602,8702,6102,520
3,111
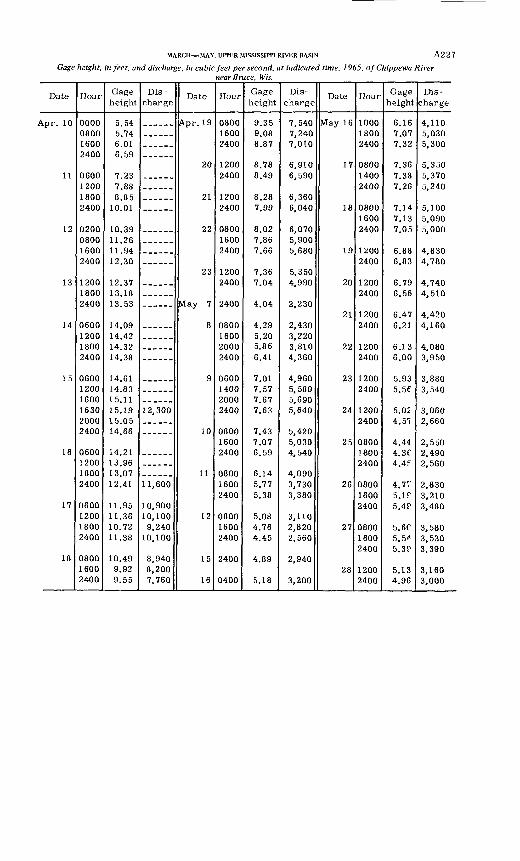
MARCH MAY, UPPER MISSISSIPPI RIVER BASIN
Gage height, in feet, and discharge, in cubic
A227
feet per second, at indicated time, 1965, ofChippewa River near Brace, Wis. _ _
Date
Apr. 10
11
12
13
14
15
16
17
18
Hour
0000 0800 1600 2400
0600 1200 1800 2400
0200 0800 1600 2400
1200 1800 2400
0600 1200 1800 2400
0600 1200 1600 1630 2000 2400
0600 1200 1800 2400
0600 1200 1800 2400
0800 1600 2400
Gage height
5.54 5.74 6.01 6.59
7.23 7.88 8.85
10.01
10.39 11.26 11.94 12.30
12.37 13.18 13.53
14.09 14.42 14.32 14.38
14.61 14.83 15.11 15.19 15.05 14.66
14.21 13.96 13.07 12.41
11.95 11.36 10.72 11.38
10.49 9.92 9.55
Dis
charge
12,300
11,600
10,900 10,100 9,240
10,100
8,940 8,200 7,760
Date
Apr. 19
20
21
22
23
May 7
8
9
10
11
12
15
16
Hour
0800 1600 2400
1200 2400
1200 2400
0800 1600 2400
1200 2400
2400
0800 1600 2000 2400
0600 1400 2000 2400
0800 1600 2400
0800 1600 2400
0800 1600 2400
2400
0400
Gage height
9.35 9.08 8.87
8.78 8.49
8.28 7.99
8.02 7.86 7.66
7.36 7.04
4.04
4.29 5.20 5.86 6.41
7.01 7.57 7.67 7.63
7.43 7.07 6.59
6.14 5.77 5.38
5.08 4.76 4.45
4.89
5.18
Dis
charge
7,540 7,240 7,010
6,910 6,590
6,360 6,040
6,070 5,900 5,680
5,350 4,990
2,230
2,430 3,220 3,810 4,360
4,960 5,580 5,690 5,640
5,420 5,030 4,540
4,090 3,730 3,380
3,110 2,820 2,560
2,940
3,200
Date
May 16
17
18
19
20
21
22
23
24
25
26
27
28
Hour
1000 1800 2400
0800 1400 2400
0800 1600 2400
1200 2400
1200 2400
1200 2400
1200 2400
1200 2400
1200 2400
0800 1800 2400
0800 1600 2400
0800 1600 2400
1200 2400
Gage height
6.16 7.07 7.32
7.36 7.38 7.26
7.14 7.13 7.05
6.88 6.83
6.79 6.56
6.47 6.21
6.13 6.00
5.93 5.56
5.02 4.57
4.44 4.3P 4.4T
4.77 5.1? 5.4P
5.6C 5.5*
5.3P
5.13 4.96
Dis
charge
4,110 5,030 5,300
5,350 5,370 5,240
5,100 5,090 5,000
4,830 4,780
4,740 4,510
4,420 4,160
4,080 3,950
3,880 3,540
3,060 2,660
2,550 2,490 2,560
2,830 3,210 3,480
3,580 3,530 3,390
3,160 3,000
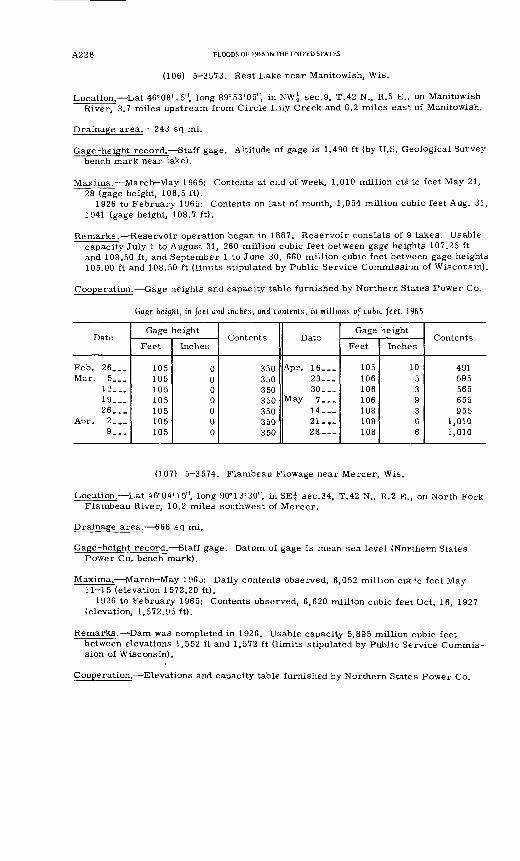
A228 FLOODS OF 1965 IN THE UNITED STATES
(106) 5 3573. Rest Lake near Manitowish, Wis.
Location. Lat 46°08'15", long 89°53'05", in NW^ sec.9, T.42 N., R.5 E., on Manitowish River, 3.7 miles upstream from Circle Lily Creek and 6.2 miles eas 4; of Manitowish.
Drainage area. 243 sq mi.
Gage-height record. Staff gage. Altitude of gage is 1,490 ft (by U.S. Geological Survey bench mark near lake).
Maxima. March-May 1965: Contents at end of week, 1,010 million cut ic feet May 21, 28 (gage height, 108.5 ft).
1926 to February 1965: Contents on last of month, 1,054 million cubic feet Aug. 31, 1941 (gage height, 108.7 ft).
Remarks. Reservoir operation began in 1887. Reservoir consists of 9 lakes. Usable capacity July 1 to August 31, 260 million cubic feet between gage heights 107.25 ft and 108.50 ft, and September 1 to June 30, 660 million cubic feet betveen gage heights 105.00 ft and 108.50 ft (limits stipulated by Public Service Commission of Wisconsin).
Cooperation. Gage heights and capacity table furnished by Northern States Power Co.
Gage height, in feet and inches, and contents, in mi/lions of cubic feet, 1965
Date
Feb. 26...Mar. 5...
12...19 ...26...
Apr. 2...9 __
Gage height
Feet
105105105105105105105
Inches
0000000
Contents
350350350350350350350
Date
Apr. 16...23---30 ...
May 7 ...14---21-,-28 __
Gage height
Feet
105106106106108108108
Inches
10539366
Contents
491595565655955
1,0101,010
(107) 5 3574. Flambeau Flowage near Mercer, Wis.
Location. Lat 46°04'15", long 90°13'30", in SE^ sec.34, T.42 N., R.2 E., on North Fork Flambeau River, 10.2 miles southwest of Mercer.
Drainage area. 666 sq mi.
Gage-height record. Staff gage. Datum of gage is mean sea level (Northern States Power Co. bench mark).
Maxima. March-May 1965: Daily contents observed, 6,052 million cuHc feet May 11-15 (elevation 1572.20 ft).
1926 to February 1965: Contents observed, 6,620 million cubic feet Oct. 16, 1927 (elevation. 1,572.95 ft).
Remarks. Dam was completed in 1926. Usable capacity 5,895 million cubic feetbetween elevations 1,552 ft and 1,572 ft (limits stipulated by Public Service Commis sion of Wisconsin).
Cooperation. Elevations and capacity table furnished by Northern States Power Co.
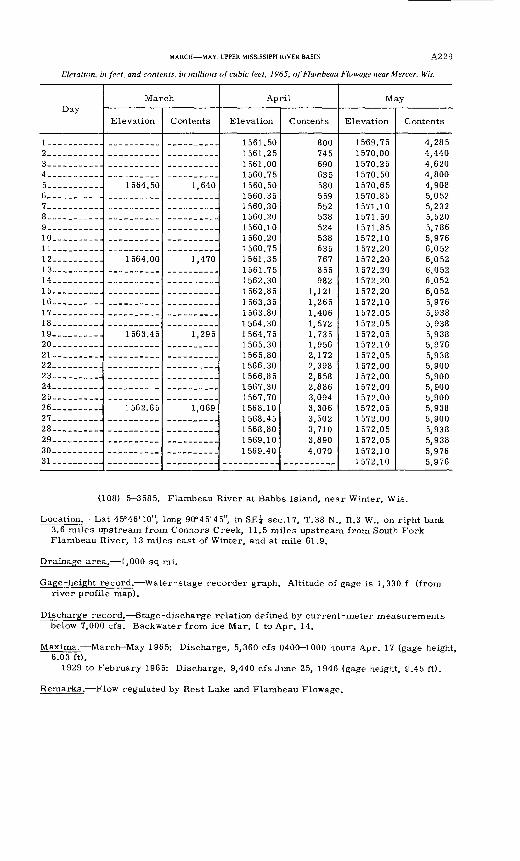
MARCH MAY, UPPER MISSISSIPPI RIVER BASIN A229
Elevation, in feet, and contents, in millions of cubic feet, 1965, of Flambeau Flowage near Mercer, Wis.
Day
1 _ _.___..2 __ ._ __ ...3 __-._-.4 ____ ______5 ___ ____ .6__ ___ __ .7____. ____..8 ___ __ ...9 __ __ __ .10 _____ _.11 _____ ...12 __ ____ .13 _____ .14 ___ ____ .15 ____ __ .16 _______ .17 _____ _.18 _______ .19. ______ .20__ _____ .21 __ __ .__.22 _______ .23 ___ ____ .24 _______ .25 _____ __.26 _______ .27 _______ .28 _______ .29 _______ .30 _______ .31 __ ____ .
March
Elevation
1564.50
1564.00
1563.45
1562.65
Contents
1,640
1,470
1,295
1,069
April
Elevation
1561.50 1561.25 1561.00 1560.75 1560.50 1560.35 1560.30 1560.20 1560.10 1560.20 1560.75 1561.35 1561.75 1562.30 1562.85 1563.35 1563.80 1564.30 1564.75 1565.30 1565.80 1566.30 1566.85 1567.30 1567.70 1568.10 1568.45 1568.80 1569.10 1569.40
Contents
800 745 690 635 580 559 552 538 524 538 635 767 855 982
1,121 1,265 1,406 1,572 1,735 1,956 2,172 2,398 2,658 2,886 3,094 3,306 3,502 3,710 3,890 4,070
May
Elevation
1569.75 1570.00 1570.25 1570.50 1570.65 1570.85 1571.10 1571.50 1571.85 1572.10 1572.20 1572.20 1572.20 1572.20 1572.20 1572.10 1572.05 1572.05 1572.05 1572.10 1572.05 1572.00 1572.00 1572.00 1572.00 1572.05 1572.00 1572.05 1572.05 1572.10 1572.10
Contents
4,285 4,440 4,620 4,800 4,908 5,052 5,232 5,520 5,786 5,976 6,052 6,052 6,052 6.052 6,052 5,976 5,938 5,938 5,938 5,976 5,938 5,900 5,900 5,900 5,900 5,938 5,900 5,938 5,938 5,976 5,976
(108) 5 3585. Flambeau River at Babbs Island, near Winter, Wis.
Location. Lat 45°46'10", long 90°45'45", in SE^ sec.17, T.38 N., R.3 W., on rifht bank 3.6 miles upstream from Connors Creek, 11.5 miles upstream from South Fork Flambeau River, 13 miles east of Winter, and at mile 61.9.
Drainage area. 1,000 sq mi.
Gage-height record. Water-stage recorder graph. Altitude of gage is 1,330 f. (from river profile map).
Discharge record. Stage-discharge relation defined by current-meter measurements below 7,000 cfs. Backwater from ice Mar. 1 to Apr. 14.
Maxima. March May 1965: Discharge, 5,360 cfs 0400 1000 hours Apr. 17 (gage height, 6.03 ft).
1929 to February 1965: Discharge, 9,440 cfs June 25, 1946 (gage height, S.45 ft).
Remarks. Flow regulated by Rest Lake and Flambeau Flowage.
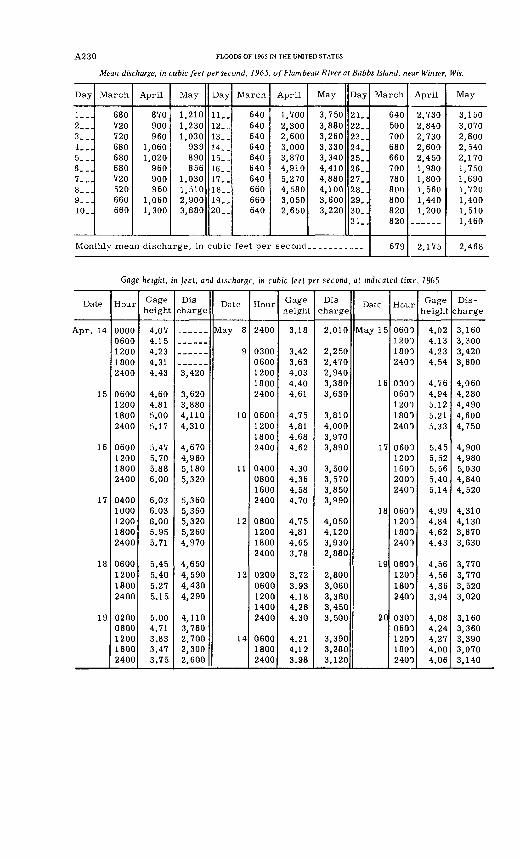
A230 FLOODS OF 1965 IN THE UNITED STATES
Mean discharge, in cubic feet per second, 1965, of Flambeau River at Babbs Island, near Winter, Wis.
Day
1...2___3...4___5...6___7___8...9__.10..
March
680720720680680680720520660660
April
870900960
1,0601,020
960900960
1,0601,300
May
1,2101,2301,030
939890856
1,0301,5102,9003,880
Day
11. _12. _13..14. _15..16..17..18..19..20..
March
640640640640640640640660660640
April
1,7002,3002,6003,0003,8704,9105.2704,5803,0502,650
Monthly mean discharge, in cubic feet per second
May
3,7503,8803,2603,3303,3404,4104,8804,1003,6003,220
Day
21..22..23..24..25..26..27..28..29_.30..31
March
640500700680660700780800800820820
679
April
2,7302,8402,7302,6002,4501,9801,8001,5601,4401,200
2,175
May
3,1503,0702,8002,5402,1701,7501,6901,7201,4001,5101,460
2,468
Cage height, in feet, and discharge, in cubic feet per second, at indicated time, 1965
Date
Apr. 14
15
16
17
18
19
Hour
00000600120018002400
0600120018002400
0600120018002400
04001000120018002400
0600120018002400
02000600120016002400
Gage height
4.074.154.234.314.43
4.604.815.005.17
5.475.705.886.00
6.036.036.005.955.71
5.455.405.275.15
5.004.713.833.473.75
Dis
charge
3,420
3,6203,8804,1104,310
4,6704,9605,1805,320
5,3605,3605,3205,2604,970
4,6504,5904,4304,290
4,1103,7602.7002,3002,600
Date
May 8
9
10
11
12
13
14
Hour
2400
03000600120018002400
0600120018002400
0400080016002400
0600120018002400
02000600120014002400
060018002400
Gageheight
3.18
3.423.634.034.404.61
4.754.814.684.62
4.304.364.584.70
4.754.814.653.78
3.723.934.184.264.30
4.214.123.98
Dis
charge
2,010
2,2502,4702,9403,3803,630
3.8104,0003,9703,890
3,5003,5703,8503,990
4,0504,1203,9302,880
2,8003,0603,3603,4503,500
3,3903,2803,120
Date
May 15
16
17
18
19
20
Hour
0600120018002400
03000600120018002400
06001200160020002400
0600120018002400
0600120018002400
03000600120018002400
Gage height
4.024.134.234.54
4.764.945.125.215.33
5.455.525.565.405.14
4.994.844.624.43
4.564.564.363.94
4.084.244.274.004.06
Dis
charge
3,1603,3003,4203,800
4,0604,2804,4904,6004,750
4,9004,9805,0304,8404,520
4,3104,1303,8703,630
3,7703,7703,5203,020
3,1603,3603,3903,0703,140
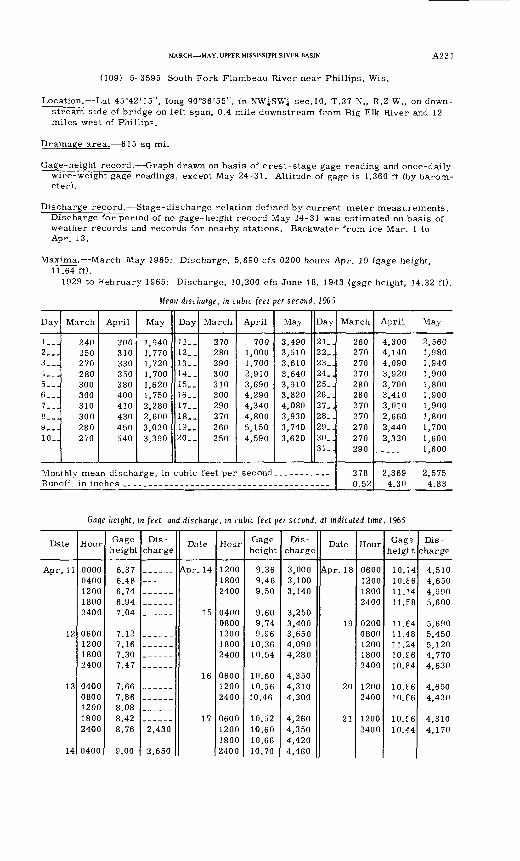
MARCH MAY, UPPER MISSISSIPPI RIVER BASIN A23I
(]09) 5-3595 South Fork Flambeau River near Phillips, Wis.
Location. Lat 45°42M5", long 90°36'55", in NW^SWi sec.10, T.37 N., R.2 W., on down stream side of bridge on left span, 0.4 mile downstream from Big Elk River and 12 miles west of Phillips.
Drainage area. 615 sq mi.
Gage-height record. Graph drawn on basis of crest-stage gage reading and once-daily wire-weight gage readings, except May 24 31. Altitude of gage is 1,360 ft (by barom eter).
Discharge record. Stage-discharge relation defined by current-meter measurements. Discharge for period of no gage-height record May 24-31 was estimated on basis of weather records and records for nearby stations. Backwater from ice Mar. 1 to Apr. 13.
Maxima. March-Way 1965: Discharge, 5,690 cfs 0200 hours Apr. 19 (gage height, 11.64 ft).
1929 to February 1965: Discharge, 10,200 cfs June 18, 1943 (gage height, 14.32 ft).
Mean discharge, in cubic feet per second, 1965
Day
l-_-2___3___4___5...6___1...8...9__-
10..
March
240250270280300300310300280270
April
300J310330350380400410430450540
May
1,9401,7701,7201,7001,6201,7502,2802,6003,0203,390
Day
11__12_.13__14__15__16__17__18__19__20__
March
270280290300310300290270260250
April
7001,0001,7002,9103,6904,2904,3404,8005,1504,590
May
3,4903,5103,6103,6403,9103,8204,0803,9303,7403,620
Day
21..22_.23..24_.25_.26..27..28_.29..30_.31..
Monthly mean discharge, in cubic feet per second. __________Runoff, in inches __________-_____-__.-___--__-___-_-____-
March
260270270270280280270270270270290
2780.52
April May
4,300 2,5604,140 1,9804,090 1,9403,920 1,9003,700 1,8003,410 1,9003,010 1,9002,660 1,8002,440 1,7002,320 1,600
1,600
2,369 2,5754.30 4.83
Gage height, in feet, and discharge, in cubic feet per second, at indicated time, 1965
Date
12
13
14
Hour
00000400120018002400
0600120018002400
04000800120018002400
0400
Gage height
6.376 A Q
6.746.947.04
7.127.167.307.47
7.667.868.088.428.76
9.00
Dis
charge
2,430
2,650
Date
Apr. 14
15
16
17
Hour
120018002400
04000800 120018002400
0600 12002400
1200 1800 2400
Gage height
9.369 AC
9.50
9.609.74 9.96
10.3610.54
10.60 10.5610.46
10.5210.60 10.66 10.70
Dis
charge
3,0003,1003,140
3,2503,400 3,650
4,280
4,350 4,3104,200
4,350 4,420 4,460
Date
Apr. 18
19
20
21
Hour
0600
18002400
0200 0800
18002400
12002400
2400
Gage heigl t.
10.7410. £611.1411.58
11.64 11.48] 1 24
10. £4
10. f6io.ee
10.5610.44
Dis
charge
4,5104,650 4 9905,600
5,690 5,4505,120
4,630
4,650
4,3104,170
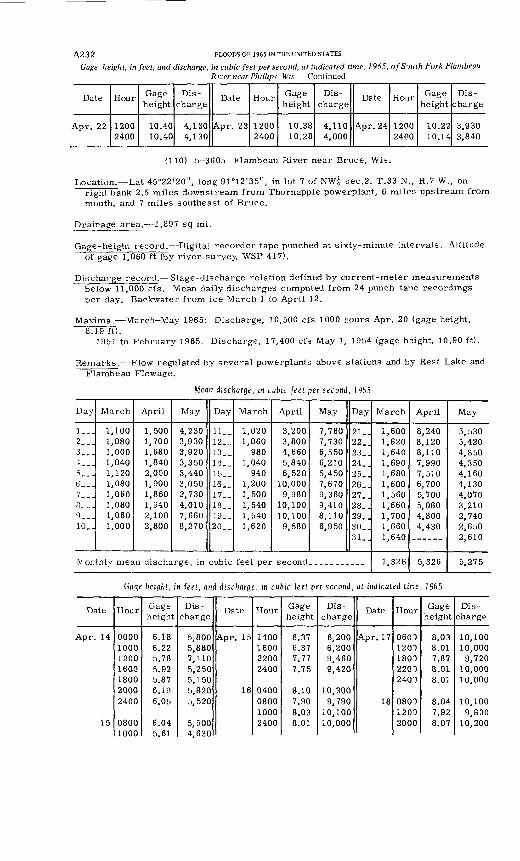
A2 3 2 FLOODS OF 1965 IN THE UNITED STATES
Gage height, in feet, and discharge, in cubic feet per second, at indicated time, 1965, of South Fork Flambeau River near Phillips. Wis Continued
Date
Apr. 22
Hour
1200 2400
Gage height
10.40 10.40
Dis
charge
4,130 4,130
Date
Apr. 23
Hour
1200 2400
Gage height
10.38 10.28
Dis
charge
4,110 4,000
Date
Apr. 24
Hour
1200 2400
Gage height
10.22 10.14
Dis
charge
3,930 3,840
(110) 5 3605 Flambeau River near Bruce, Wis.
Location. Lat 45°22'20" J long 91°12'35", in lot 7 of NW? sec.2. T.33 N., R.7 W., on right bank 2.5 miles downstream from Thornapple powerplant, 6 miles upstream from mouth, and 7 miles southeast of Bruce.
Drainage area. 1,897 sq mi.
Gage-height record. Digital recorder tape punched at sixty-minute intervals. Altitude of gage 1,060 ft (by river survey, WSP 417).
Discharge record. Stage-discharge relation defined by current-meter measurements below 11,000 cfs. Mean daily discharges computed from 24 punch-ta-oe recordings per day. Backwater from ice March 1 to April 12.
Maxima. March-May 1965: Discharge, 10,500 cfs 1000 hours Apr. 20 (gage height, 8.19 ft).
1951 to February 1965: Discharge, 17,400 cfs May 1, 1954 (gage height, 10.90 ft).
Remarks. Flow regulated by several powerplants above stations and by Rest Lake and Flambeau Flowage.
Mean discharge, in cubic feet per second, 1965
Day
l._.2...3...4...?>..--6___7...8...9...10_.
March
1,1001,0801,0001,0401,1201,0801,0601,0801,0601,000
April
1,5001,7001,6801,8402,0001,9001,8601,9402,1002,800
May
4,2303,9303,9203,3503,4403,0502,7304,0107,6608,270
Day
11_.12..13. _14..15..16..17..18..19..20..
March
1,0201,060
9801,040
9401,2001,5001,5401,5401,620
April
3,2003,8004,6605,8406,520
10,0009,980
10,10010,1009,580
Monthly mean discharge, in cubic feet per second
May
7,7607,7306,5506,2105,4507,6709,3609,4108,1106,950
Day
21..22..23..24..25..26..27..28..29..30..31..
March
1,6001,6201,6401,6901,6801,6001,5601,6601,7001,6601,640
1,326
April
8,2408,1208,1107,9907,5106,7005,7005,0804,8004,430
5,326
May
5,5305,4204,8504,3504,1604,1304,0703,2102,7402,6502,610
5,275
Gage height, in feet, and discharge, m cubic feet per second, at indicated tine, 1965
Date
Apr. 14
15
Hour
0000100012001600180020002400
08001000
Gage height
6.186.225.785.925.876.196.05
6.045.61
Dis charge
5,8005,8807,1105,2505,1505,8205,520
5,5004,630
Date
Apr. 15
16
Hour
1400160022002400
0400080010002400
Gage height
6.376.377.777.75
8.107.908.038.01
Dis charge
6,2006,2009,4609,420
10,3009,790
10,10010,000
Date
Apr. 1 7
18
Hour
06001200180T220T2400
080012002000
Gage height
8.038.017.878.018.01
8.047.928.07
Dis charge
10,10010,000
9,72010,00010,000
10,1009,830
10,200
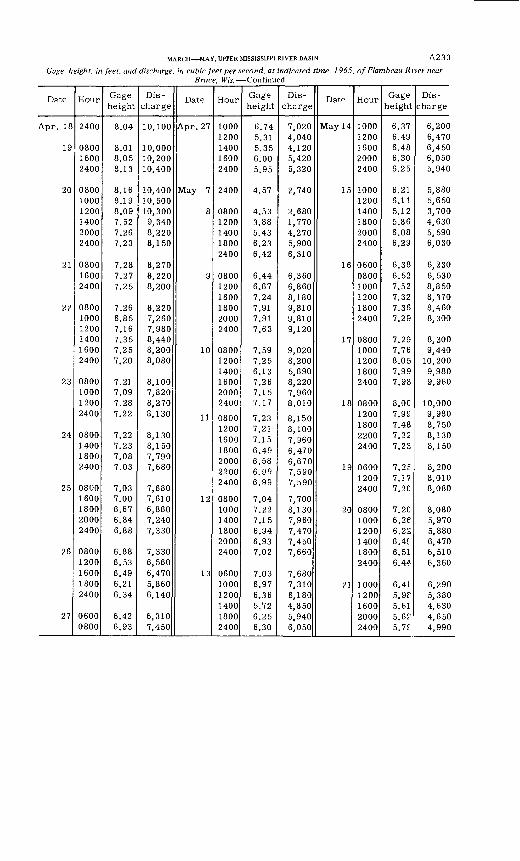
MARCH MAY, UPPER MISSISSIPPI RIVER BASIN A2 3 3
Gage height, in feet, and discharge, in cubic feet per second, at indicated time, 1965, of Flambeau River nearBruce, Wis. Continued
Date
Apr. 18
19
20
21
22
23
24
25
26
27
Hour
2400
080016002400
080010001200140020002400
080016002400
080010001200140016002400
0800100012002400
0800140018002400
08001600180020002400
08001200160018002400
06000800
Gage height
8.04
8.018.058.13
8.168.198.097.527.267.23
7.287.277.25
7.266.857.167.357.257.20
7.217.097.287.22
7.227.237.087.03
7.037.006.676.846.88
6.886.536.496.216.34
6.426.93
Dis
charge
10,100
10,00010,20010,400
10,40010,50010,3009,3408,2208,150
8,2708,2208,200
8,2207,2607,9808,4408,2008,080
8,1007,8208,2708,130
8,1308,1507,7907,680
7,6807,6106,8607,2407,330
7,3306,5606,4705,8606,140
6,3107,450
Date
Apr. 27
May 7
8
9
10
11
12
13
Hour
10001200140016002400
2400
08001200140018002400
080012001600180020002400
080012001400160020002400
0800120016001800200022002400
080010001400180020002400
060010001200140018002400
Gage height
6.745.315.356.005.95
4.57
4.533.885.436.236.42
6.446.677.247.917.917.63
7.597.256.137.267.157.17
7.237.217.156.496.586.996.99
7.047.227.156.946.937.02
7.036.976.365.726.256.30
Dis
charge
7,0204,0404,1205,4205,320
2,740
2,6801,7704,2705,9006,310
6,3606,8608,1809,8109,8109,120
9,0208,2005,6908,2207,9608,010
8,1508,1007,9606,4706,6707,5907,590
7,7008,1307,9607,4707,4507,660
7,6807,3106,1804,8505,9406,050
Date
May 14
15
16
17
18
19
20
21
Hour
10001200160020002400
100012001400180020002400
060008001000120018002400
08001000120018002400
08001200180022002400
060012002400
080010001200140018002400
10001200160020002400
Gage height
6.376.496.486.306.25
6.216.115.125.866.086.29
6.386.527.527.327.367.29
7.297.768.057.997.98
8.007.997.487.227.23
7.2f7.n7.2C
7.2C6.266.226.4?6.516.44
6.415.9f5.615.6?5.7?
Dis
charge
6,2006,4706,4506,0505,940
5,8805,6503,7004,6305,5906,030
6,2306,5308,8508,3708,4608,300
8,3009,440
10,2009,9809,960
10,0009,9808,7508,1308,150
8,2008,0108,080
8,0805,9705,8806,4706,5106,360
6,2905,3804,6304,6504,990
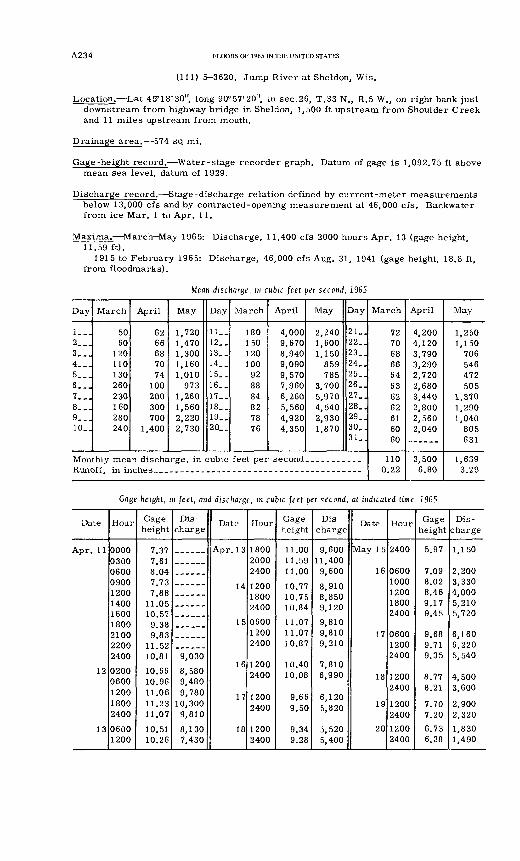
A234 FLOODS OF 1965 IN THE UNITED STATES
(111) 5-3620. Jump River at Sheldon, Wis.
Location. Lat 45° 18'30", long 90° 57'20", in sec.26, T.33 N., R.5 W., on right bank just downstream from highway bridge in Sheldon, 1,500 ft upstream from Shoulder Creek and 11 miles upstream from mouth.
Drainage area. 574 sq mi.
Gage-height record. Water-stage recorder graph. Datum of gage is 1,092.75 ft above mean sea level, datum of 1929.
Discharge record. Stage-discharge relation defined by current-meter measurements below 13,000 cfs and by contracted-opening measurement at 46,000 cfs. Backwater from ice Mar. 1 to Apr. 11.
Maxima. March May 1965: Discharge, 11,400 cfs 2000 hours Apr. 13 (gage height, 11.59 ft).
1915 to February 1965: Discharge, 46,000 cfs Aug. 31, 1941 (gage height, 18.8 ft, from floodmarks).
Mean discharge, in cubic feet per second, 1965
Day
1...2...3...4...5___6...7...8...9...10..
March
5060
120110130260230160280240
April
6266687074
100200300700
1,400
May
1,7201,4701,3001,1601,010
9731,2601,5602,2202,730
Day
11_.12..13..14..15..16..17..18_.19__20..
March
180150120100
928884827876
April
4,0009,6708,9409,0909,5707,9606,2605,5604,9204,350
May
2,2401,6001,150
859785
3,7005,9704,5402,9301,870
Day
21..22..23..24..25..26..27..28..29..30..31..
Monthly mean discharge, in cubic feet per second. ___-_-_-._Runoff, in ir
March
7270686664636262616060
1100.22
April
4,2004,1203,7903,2902,7202,6803,4402,8002,5602,040
3,5006.80
May
1,2501,150
706546472505
1,3701,2901,040
805631
1,6393.29
Gage height, in feet, and discharge, in cubic feet per second, at indicated time, 1965
Date
Apr. 11
12
13
Hour
00000300060009001200140016001800210022002400
0200 0600120018002400
06001200
Gage height
7.377.618.047.737.88
11.0510.579.389.83
11.5210.81
10.66 10.9611.0611.2311.07
10.5110.26
Dis
charge
9,030
8,580 9,4809,780
10,3009,810
8,1307,430
Date
Apr. 13
14
15
16
17
18
Hour
180020002400
120018002400
060012002400
12002400
12002400
12002400
Gage height
11.0011.5911.00
10.7710.7510.84
11.0711.0710.87
10.4010.08
9.669.50
9.349.28
Dis
charge
9,60011,4009,600
8,9108,8509,120
9,8109,8109,210
7,8106,990
6,1205,820
5,5205,400
Date
May 15
16
17
18
19
20
Hour
2400
06001000120018002400
060012002400
12002400
12002400
12002400
Gage height
5.97
7.098.028.469.179.45
9.689.719.35
8.778.21
7.707.20
6.736.38
Dis
charge
1,150
2,2003,3304,0005,2105,720
6,1606,2205,540
4,5003,600
2,9002,320
1,8301,490
MARCH MAY, UPPER MISSISSIPPI RIVER BASIN A235
(112) 5-3640. Yellow River at Cadott, Wis.
(Gaging station; crest-stage station beginning 1962)
Location. Lat 44 057'10", long 91°09'00", in NE^ sec.31, T.29 N., R.6 W., at bridge on State Highway 27 in Cadott, 1,000 ft upstream from Svetlik Dam, and 6.0 miles up stream from Drywood Creek.
Drainage area. 351 sq mi.
Gage-height record. Crest stages only.
Discharge record. Stage-discharge relation defined by current-meter measurements below 15,600 cfs.
Maxima. March May 1965: Discharge, about 11,000 cfs Apr. 11 (gage height, 15.6 ft, ice affected).
1942 to February 19, 1965: Discharge, 15,600 cfs June 28, 1943 (gage height 12.15 ft at site 1,400 ft downstream at different datum).
(113) 5-3642. Lake Wissota near Chippewa Falls, Wis.
Location. Lat 44°56'20", long 91°20'25", in NWi sec.3, T.28 N., R.8 W., on Chippewa River, 2.0 miles east of city limits of Chippewa Falls.
Drainage area. 5,548 sq mi.
Gage-height record. Float gage. Datum of gage is mean sea level (Northern States Power Co. bench mark).
Maxima. March May 1965: Daily contents observed, 4,221 million cubic feet Apr. 16 (elevation 898.80 ft).
1934 to February 1965: Contents observed, 4,854 million cubic feet Aug. 31, 1941 (elevation, 901.12 ft).
Remarks. Dam was completed in 1917. This powerplant service pond has a capacity of 3,547 million cubic feet at normal operating elevation of 898.0 ft. Maximum eleva tion allowable is 902.0 ft. Usable contents below elevation 898.0 ft allowed by express permission of the Public Service Commission of Wisconsin in anticipation of increased runoff.
Cooperation. Elevations and capacity table furnished by Northern States Power Co.
317-045 O - 70 - 16
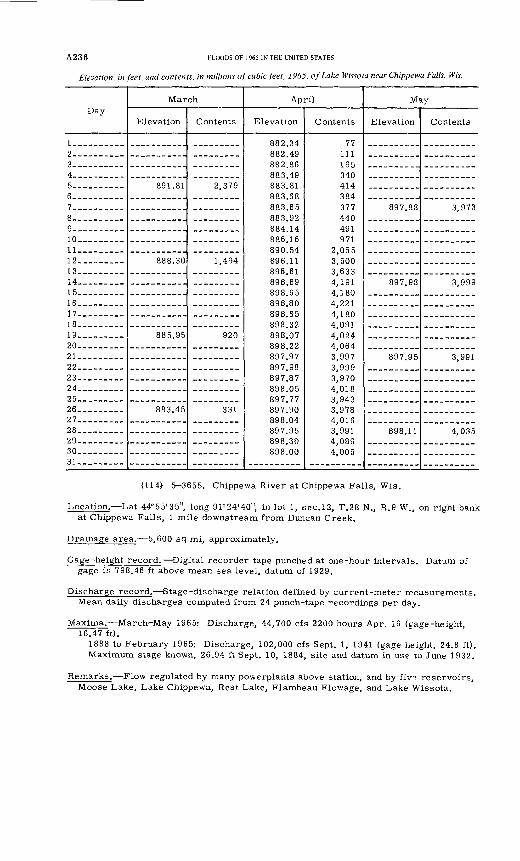
A23 6 FLOODS OF 1965 IN THE UNITED STATES
Elevation, in feet, and contents, in millions of cubic feet, 1965, of Lake Wissota near Chippewa Falls, Wis.
Day
2- ____ __3 4_____-_-_-5 ...____6 ___ .. ___7. __ ._-8 ____ . ___9. __ ._.___10 __ ._ __ _11 __ _ ___ _12_ ________13__ -___14 ___ . __ .15___ __-16 __ _. ____17 _________18 _________19 __ -.___-20 ____ ___21 _________22 ____ ___23 ___ _ __ _24 __ - _____25 _________26 _________27 _________28 _________29 _________30 __31--. __
March
Elevation
891.81
888.30
885.95
883.45
Contents
2,379
1,494
920
331
April
Elevation
882.34 882.49 882.86 883.49 883.81 883.68 883.65 883.92 884.14 886.16 890.54 896.11 896.61 898.69 898.65 898.80 898.65 898.32 898.07 898.22 897.97 897.98 897.87 898.05 897.77 897.90 898.04 897.95 898.30 898.00
Contents
77 111 195 340 414 384 377 440 491 971
2,055 3,500 3,633 4,191 4,180 4,221 4,180 4,091 4,024 4,064 3,997 3,999 3,970 4,018 3,943 3,978 4,016 3,991 4,086 4,005
May
Elevation
897.88
897.98
897.95
898.11
Contents
3,973
3,999
3,991
4,035
(114) 5 3655. Chippewa River at Chippewa Falls, Wis.
Location. Lat 44t> 55'35", long 91°24'40", in lot 1, sec.12, T.28 N., R.9 W., on right bank at Chippewa Falls, 1 mile downstream from Duncan Creek.
Drainage area. 5,600 sq mi, approximately.
Gage-height record. Digital recorder tape punched at one-hour intervals. Datum of gage is 798.46 ft above mean sea level, datum of 1929.
Discharge record. Stage-discharge relation defined by current-meter rreasurements. Mean daily discharges computed from 24 punch-tape recordings per day.
Maxima. March-May 1965: Discharge, 44,700 cfs 2200 hours Apr. 16 (g-age-height, 16.47 ft).
1888 to February 1965: Discharge, 102,000 cfs Sept. 1, 1941 (gage height, 24.8 ft). Maximum stage known, 26.94 ft Sept. 10, 1884, site and datum in use to June 1932.
Remarks. Flow regulated by many powerplants above station, and by fiv; reservoirs, Moose Lake, Lake Chippewa, Rest Lake, Flambeau Flowage, and Lake Wissota.
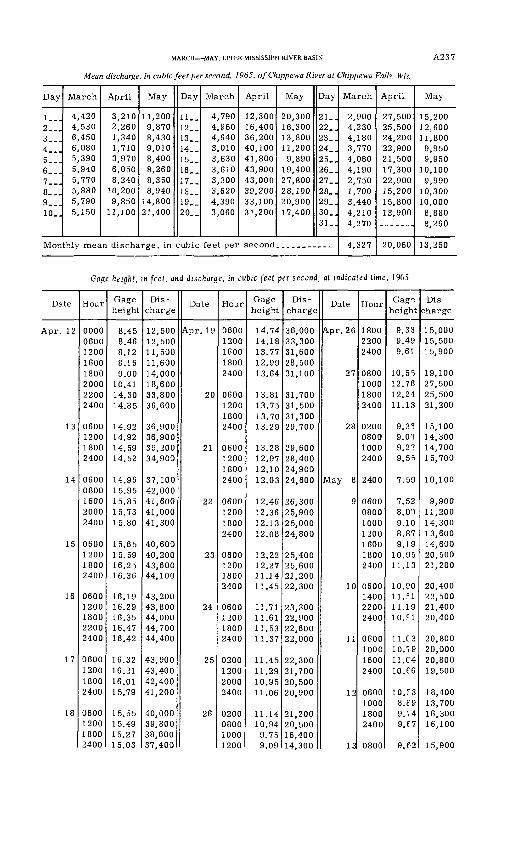
MARCH MAY, UPPER MISSISSIPPI RIVER BASIN A2 3 7
Mean discharge, in cubic feet per second, 1965, of Chippewa River at Chippewa Falls, Wis.
Day
1__.2...3__.4...5...6...7...8__.9...10..
March
4,4204,5306,4506,0805,3905,9405,7705,8805,7905,150
April
3,2102,2601,3401,7103,9706,0508,240
10,2009,850
11,100
May
11,2009,8708,4309,0108,4008,2608,3508,940
14,80021,400
Day
11..12..13__14__15..16..17..18..19..20..
March
4,7904,9604,6403,0103,6303,6103,3003,6204,3903,060
April
12,30016,40036,20040,10041,80043,90043,00039,20033,10031,200
May
20,30016,30013,80011,2009,890
19,40027,80028,10020,90017,400
Day
21..22..23..24. .25..26..27..28..29_.30..31..
Monthly mean discharge, in cubic feet per second... ________
March
2,9004,2304,1803,7704,0804,1902,7501,7003,4404,2104,270
4,327
April
27,50025,50024,20022,90021,50017,30022,90015,20015,80013,900
______
20,060
May
15,20012,60011,8009,9509,950
10,1009,990
10,30010,0008,8808,260
13,250
Gage height, m feet, and discharge, in cubic feet per second, at indicated time, 1965
Date
Apr. 12
13
14
15
16
17
18
Hour
00000600120016001800200022002400
0600120018002400
06000800160020002400
0600120018002400
06001200180022002400
0600120018002400
0600120018002400
Gageheight
8.458.468.128.169.00
10.4114.3014.85
14.9214.9214.5914.52
14.9615.9515.8515.7315.80
15.6515.5916.2516.36
16.1916.2916.3516.4716.42
16.3216.2116.0115.79
15.5515.4915.2715.03
Dis
charge
12,50012,50011,50011,60014,00018,60033,80036,600
36,90036,90035,20034,900
37,10042,00041,60041,00041,300
40,60040,20043,60044,100
43,20043,80044,00044,70044,400
43,90043,40042,40041,200
40,00039,80038,60037,400
Date
Apr. 19
20
21
22
23
24
25
26
Hour
06001200160018002400
0600120018002400
0600120018002400
0600120018002400
0600120018002400
0600120018002400
0200120020002400
0200080010001200
Gage height
14.7414.1813.7712.9913.64
13.8113.7513.7013.29
13.2812.9712.1012.03
12.4612.3612.1312.08
12.2212.2711.1411.45
11.7111.6111.5311.37
11.4511.2910.9511.06
11.1410.949.759.09
Dis
charge
36,00033,30031,60028,50031,100
31,70031,50031,30029,700
29,60028,40024,90024,600
26,30025,90025,00024,800
25,40025,60021,20022,300
23,30022,90022,60022,000
22,30021,70020,50020,900
21,20020,50016,40014,300
Date
Apr. 26
27
28
May 8
9
10
11
12
13
Hour
180022002400
0800100018002400
0200080010002400
2400
0600080010001200160018002400
0600140022002400
0600100016002400
0600100018002400
0800
Gag°
height
9.339.499.61
10.5^12.7612.2411.13
9.3?9.0?9.2?9.5S
7.59
7.528.019.108.879.19
10.9511.13
10.9011.5111.1910. SI
11.0310.7911. C410.66
10. ;38. P99.749.F7
9.62
Dis
charge
15,00015,50015,900
19,10027,50025,50021,200
15,10014,30014,70015,700
10,100
9,90011,20014,30013,60014,60020,50021,200
20,40022,50021,40020,400
20,80020,00020,80019,500
18,40013,70016,30016,100
15,900
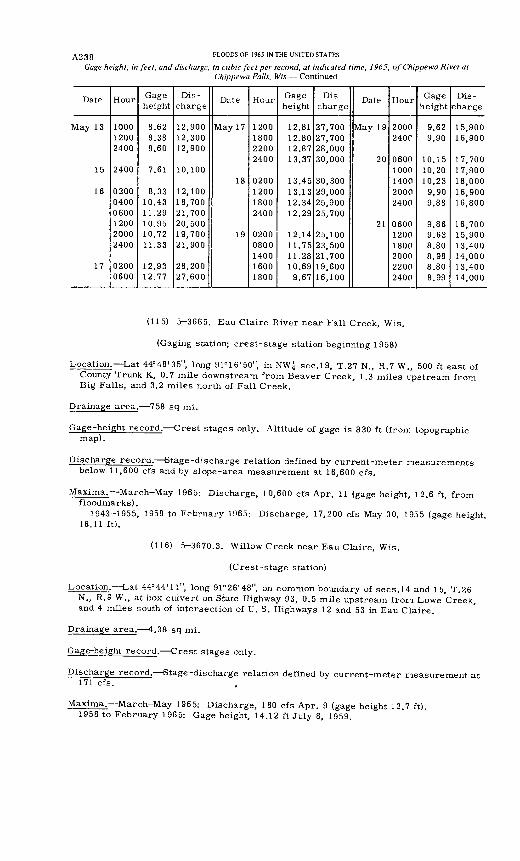
A238Gage height, in feet, and discharge, in cubic feet per second, at indicated time, J 965, of Chippewa River at
Chippewa Falls, Wis. Continued
Date
May 13
15
16
17
Hour
100012002400
2400
020004000600120020002400
02000600
Gage height
8.628.388.60
7.61
8.3310.4311.2910.9510.7211.33
12.9312.77
Dis charge
12,90012,30012,900
10,100
12,10018,70021,70020,50019,70021,900
28,20027,600
Date
May 17
18
19
Hour
1200180022002400
0200120018002400
02000800140016001800
Gage height
12.8112.8012.8713.37
13.4513.1312.3412.29
12.1411.7511.2810.699.67
Dis charge
27,70027,70028,00030,000
30,30029,00025,90025,700
25,10023,50021,70019,60016,100
Date
May 19
20
21
Hour
20002400
06001000140020002400
060012001800200022002400
Gage height
9.629.90
10.1510.2010.23
9.909.88
9.869.638.808.988.808.99
Dis charge
15,90016,900
17,70017,90018,00016,90016,800
16,70015,90013,40014,00013,40014,000
(115) 5-3665. Eau Claire River near Fall Creek, Wis.
(Gaging station; crest-stage station beginning 1958)
Location. Lat 44°48'35", long 91°16'50". in NW£ sec.19, T.27 N., R.7 W., 500 ft east of County Trunk K, 0.7 mile downstream from Beaver Creek, 1.3 miles upstream from Big Falls, and 3.2 miles north of Fall Creek.
Drainage area. 758 sq mi.
Gage-height record. Crest stages only. Altitude of gage is 830 ft (from topographic map).
Discharge record. Stage-discharge relation defined by current-meter measurements below 11,600 cfs and by slope-area measurement at 16,600 cfs.
Maxima. March-May 1965: Discharge, 10,600 cfs Apr. 11 (gage height, 12.6 ft, from floodmarks).
1943-1955, 1958 to February 1965: Discharge, 17,200 cfs May 30, 1955 (gage height, 16.11 ft).
(116) 5-3670.3. Willow Creek near Eau Claire, Wis.
(Crest-stage station)
Location. Lat 44°44'll", long 91°26'48", on common boundary of sees.14 and 15, T.26 N., R.9 W., at box culvert on State Highway 93, 0.5 mile upstream from Lowe'creek, and 4 miles south of intersection of U. S. Highways 12 and 53 in Eau Claire.
Drainage area. 4.38 sq mi.
Gage-height record. Crest stages only.
Discharge record. Stage-discharge relation defined by current-meter measurement at 171 cfs.
Maxima. March-May 1965: Discharge, 180 cfs Apr. 9 (gage height 12.7 ft). 1958 to February 1965: Gage height, 14.12 ft July 8, 1959.
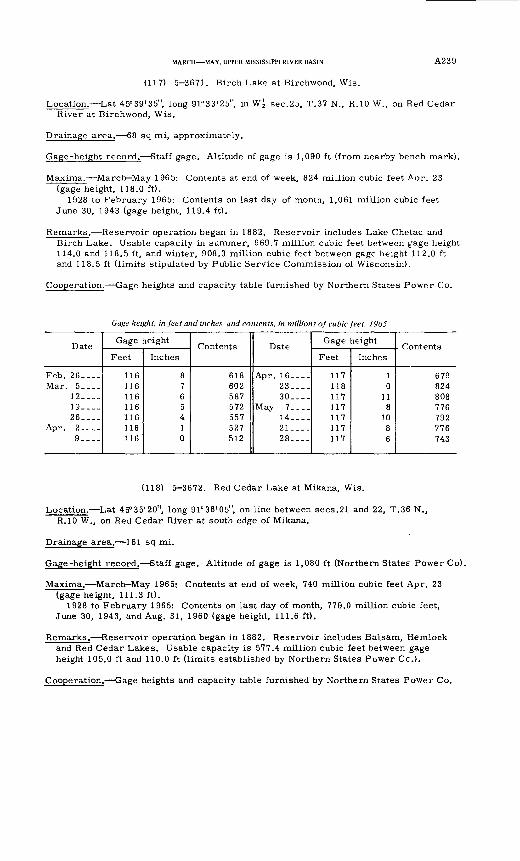
MARCH MAY, UPPER MISSISSIPPI RIVER BASIN
(117) 5-3671. Birch Lake at Birchwood, Wis.
A239
Location. Lat 450 39'35", long 91°33'25", in W| sec.25, T.37 N., R.10 W., on Red Cedar River at Birchwood, Wis.
Drainage area. 68 sq mi, approximately.
Gage-height record. Staff gage. Altitude of gage is 1,090 ft (from nearby bench mark).
Maxima. March May 1965: Contents at end of week, 824 million cubic feet Aor. 23 (gage height, 118.0 ft).
1928 to February 1965: Contents on last day of month, 1,061 million cubic feet June 30, 1943 (gage height, 119.4 ft).
Remarks. Reservoir operation began in 1882. Reservoir includes Lake Chetac and Birch Lake. Usable capacity in summer, 669.7 million cubic feet between g*age height 114.0 and 118.5 ft, and winter, 908.3 million cubic feet between gage height 112.0 ft and 118.5 ft (limits stipulated by Public Service Commission of Wisconsin).
Cooperation. Gage heights and capacity table furnished by Northern States Power Co.
Gage height, in feet and inches, and contents, in millions of cubic feet, 1965
Date
Feb. 26--_-Mar. 5--.-
12---.19---.26 ___
Apr. 2--.-9---.
Gage height
Feet
116116116116116116116
Inches
8765410
Contents
618602587572557527512
Date
Apr. 16_-_-23 ___30.---
May 7--.-14----21.--.28-. ._
Gage height
Feet
117118117117117117117
Inches
10
118
1086
. Contents
679824808776792776743
(118) 5-3672. Red Cedar Lake at Mikana, Wis.
Location. Lat 45°35'20", long 91°36'05", on line between sees.21 and 22, T.36 N., R.lO W., on Red Cedar River at south edge of Mikana.
Drainage area. 161 sq mi.
Gage-height record. Staff gage. Altitude of gage is 1,080 ft (Northern States Power Co).
Maxima. March May 1965; Contents at end of week, 740 million cubic feet Apr. 23 (gage height, 111.3 ft).
1928 to February 1965: Contents on last day of month, 779.0 million cubic feet, June 30, 1943, and Aug. 31, 1960 (gage height, 111.6 ft).
Remarks. Reservoir operation began in 1882. Reservoir includes Balsam, Hemlock and Red Cedar Lakes. Usable capacity is 577.4 million cubic feet between gage height 105.0 ft and 110.0 ft (limits established by Northern States Power Cc.).
Cooperation. Gage heights and capacity table furnished by Northern States Power Co.
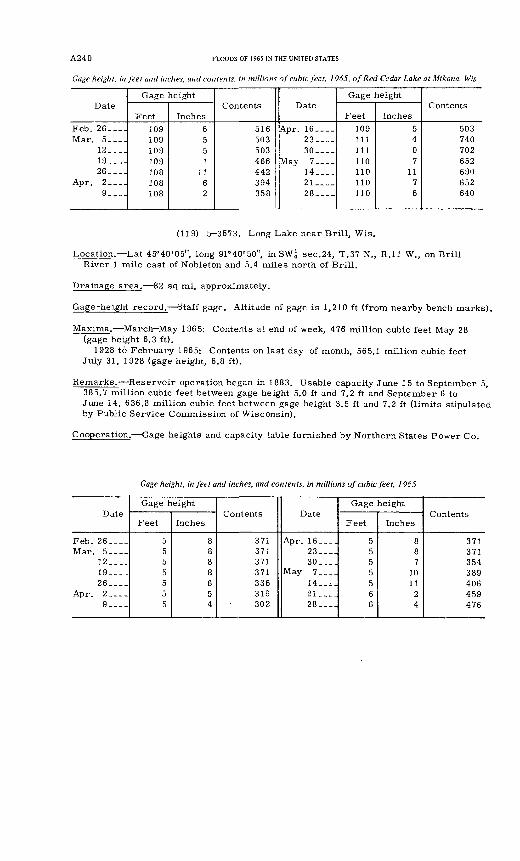
A240 FLOODS OF 1965 IN THE UNITED STATES
Gage height, in feet and inches, and contents, in millions of cubic feet, 1965, of Red Cedar Lake at Mikana, Wis.
Date
Feb. 26--.-Mar. 5_-_-
12.--.19-._-26 __ .
Apr. 2 __ .9__-.
Gage height
Feet
109109109109108108108
Inches
6551
1162
Contents
516503503466442394358
Date
Apr. 16--_.23 ___30_.-_
May 7-_._14- __21 ____28 ___
Gage height
Feet
109111111110110110110
Inches
5407
1176
Contents
503740702652690652640
(119) 5-3673. Long Lake near Brill, Wis.
Location. Lat 45°40'05", long 91°40'50", in SW^ sec.24, T.37 N., R.ll W., on Brill River 1 mile east of Nobleton and 5.4 miles north of Brill.
Drainage area. 82 sq mi, approximately.
Gage-height record. Staff gage. Altitude of gage is 1,210 ft (from nearby bench marks).
Maxima. March-May 1965: Contents at end of week, 476 million cubic feet May 28 (gage height 6.3 ft).
1928 to February 1965: Contents on last day of month, 565.1 million cubic feet July 31, 1928 (gage height, 6.8 ft).
Remarks. Reservoir operation began in 1883. Usable capacity June 1 5 to September 5, 385.7 million cubic feet between gage height 5.0 ft and 7.2 ft and September 6 to June 14, 636.8 million cubic feet between gage height 3.5 ft and 7.2 ft (limits stipulated by Public Service Commission of Wisconsin).
Cooperation. Gage heights and capacity table furnished by Northern States Power Co.
Gage height, in feet and inches, and contents, in millions of cubic feet, 1965
Date
Feb. 26 ____Mar. 5____
12 ___19 __ _26 ___
Apr. 2.---9 __
Gage height
Feet
5555555
Inches
8888654
Contents
371371371371336319302
Date
Apr. 16___.23 __ .30--..
May 7___.14--^.21 __ .28 __ .
Gage height
Feet
5555566
Inches
887
1011
24
Contents
371371354389406459476
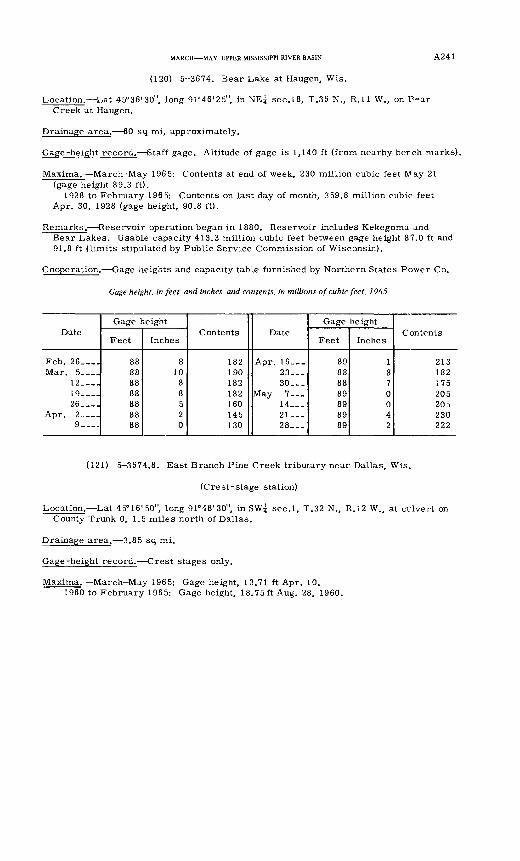
MARCH MAY, UPPER MISSISSIPPI RIVER BASIN A241
(120) 5-3674. Bear Lake at Haugen, Wis.
Location. Lat 45°36'30", long 91°46'25", in NEi sec.18, T.36 N., R.ll W., on B»ar Creek at Haugen.
Drainage area. 60 sq mi, approximately.
Gage-height record. Staff gage. Altitude of gage is 1,140 ft (from nearby bench marks).
Maxima.- March May 1965: Contents at end of week, 230 million cubic feet May 21 (gage height 89.3 ft).
1928 to February 1965: Contents on last day of month, 359.8 million cubic feet Apr. 30, 1928 (gage height, 90.8 ft).
Remarks. Reservoir operation began in 1880. Reservoir includes Kekegoma and Bear Lakes. Usable capacity 413.3 million cubic feet between gage height 87.0 ft and 91.8 ft (limits stipulated by Public Service Commission of Wisconsin).
Cooperation. Gage heights and capacity table furnished by Northern States Power Co.
Gage height, in feet andinches, and contents, in millions of cubic feet, 1965
Date
Feb. 26 __ .Mar. 5 ___
12 __ .19 __ .26___.
Apr. 2. 9 __ .
Gage height
Feet
88888888888888
Inches
810
88520
Contents
182190182182160145130
Date
Apr. 16._-23-.-30 __
May 7___14 __21 __28 __
Gage height
Feet
89888889898989
Inches
1870042
Contents
213182175205205230222
(121) 5-3674.8. East Branch Pine Creek tributary near Dallas, Wis.
(Crest-stage station)
Location. Lat 45°16'50", long 91°48'30", in SW^ sec.l, T.32 N., R.12 W., at cvlvert on County Trunk 0, 1.5 miles north of Dallas.
Drainage area. 3.85 sq mi.
Gage-height record. Crest stages only.
Maxima. March-May 1965: Gage height, 13.71 ft Apr. 10.1960 to February 1965: Gage height, 18.75ft Aug. 28, 1960.
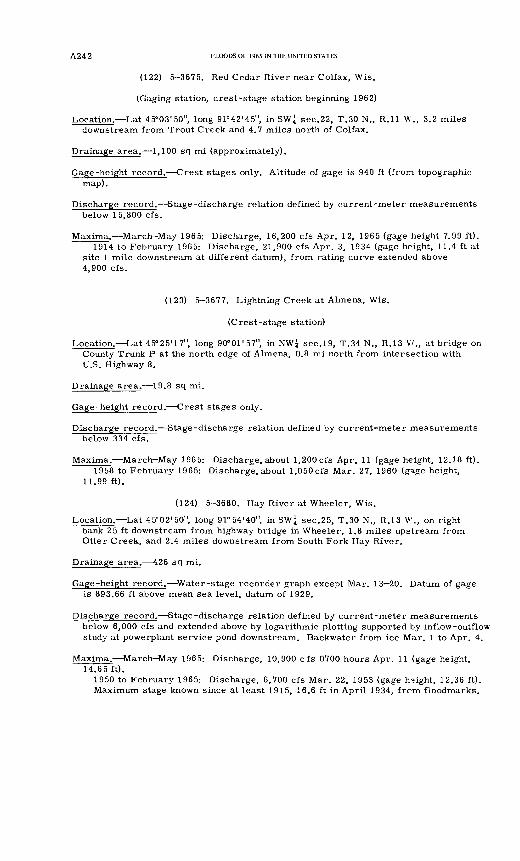
A242 FLOODS OF 1965 IN THE UNITED STATES
(122) 5-3675. Red Cedar River near Colfax, Wis.
(Gaging station, crest-stage station beginning 1962)
Location. Lat 45°03'50", long 91°42'45", in SW; sec.22, T.30 N., R.ll W., 3.2 miles downstream from Trout Creek and 4.7 miles north of Colfax.
Drainage area. 1,100 sq mi (approximately).
Gage-height record. Crest stages only. Altitude of gage is 940 ft (from topographic map).
Discharge record. Stage-discharge relation defined by current-meter measurements below 15,800 cfs.
Maxima. March-May 1965: Discharge, 16,200 cfs Apr. 12, 1965 (gage height 7.99 ft). 1914 to February 1965: Discharge, 21,900 cfs Apr. 3, 1934 (gage height, 11.4 ft at
site 1 mile downstream at different datum), from rating curve extended above 4,900 cfs.
(123) 5-3677. Lightning Creek at Almena, Wis.
(Crest-stage station)
Location. Lat 45°25'17", long 90°01'57", in NW, sec.19, T.34 N., R.13 V*'., at bridge on County Trunk P at the north edge of Almena, 0.8 mi north from intersection with U.S. Highway 8.
Drainage area. 19.8 sq mi.
Gage-height record. Crest stages only.
Discharge record. Stage-discharge relation defined by current-meter measurements below 334 cfs.
Maxima. March-May 1965: Discharge, about l,200cfs Apr. 11 (gage height, 12.18 ft).1958 to February 1965: Discharge, about 1,050 cfs Mar. 27, 1960 (gage height,
11.99 ft).
(124) 5-3680. Hay River at Wheeler, Wis.
Location. Lat 45°02'50", long 91°54'40", in SW, sec.25, T.30 N., R.13 W., on right bank 25 ft downstream from highway bridge in Wheeler, 1.8 miles upstream from Otter Creek, and 2.4 miles downstream from South Fork Hay River.
Drainage area. 426 sq mi.
Gage-height record. Water-stage recorder graph except Mar. 13 20. Datum of gage is 893.66 ft above mean sea level, datum of 1929.
Discharge record. Stage-discharge relation defined by current-meter measurements below 6,000 cfs and extended above by logarithmic plotting supported by inflow-outflow study at powerplant service pond downstream. Backwater from ice Mar. 1 to Apr. 4.
Maxima. March-May 1965: Discharge, 10,900 cfs 0700 hours Apr. 11 (gage height, 14.65 ft).
1950 to February 1965: Discharge, 6,700 cfs Mar. 22, 1953 (gage h?ight, 12.36 ft). Maximum stage known since at least 1915, 16.6 ft in April 1934, from floodmarks.
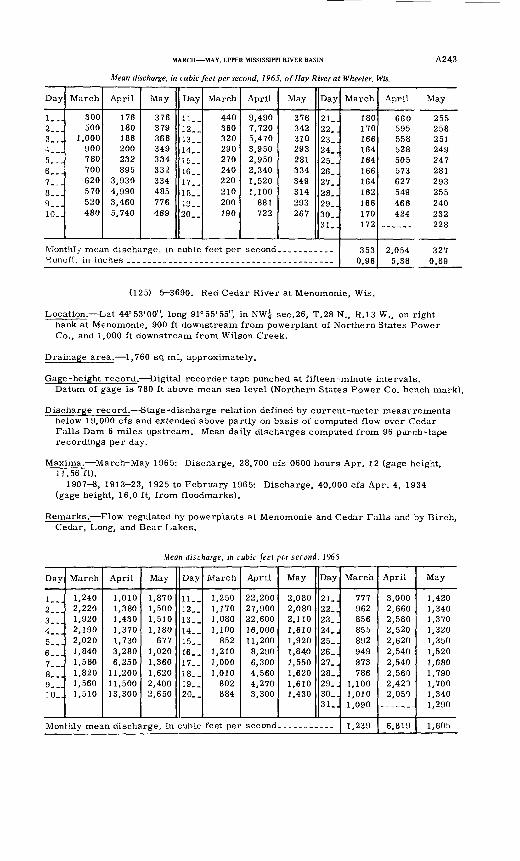
MARCH MAY, UPPER MISSISSIPPI RIVER BASIN
Mean discharge, in cubic feet per second, 1965, of Hay River at Wheeler, Wis.
A243
Day
1...2___3__.4...5...6...7...8...9__.10..
March
300500
1,000900780700620570520480
April
176180186200232895
3,9304,9903,4605,740
May
376379366349334332334485776469
Day
11__12__13__14. _15__16__17__18__19__20__
March
440360320290270240220210200190
April
9,4907,7205,4703,9502,9502,3401,5201,100881722
May
376342310293281334349314293267
Day
21_.22_.23_.24..25_.26_.27..28..29_.30_.^i
Monthly mean discharge, in cubic feet per second. __________Runoff, in inches . . ... _________________ ____________
March
180170166164164166164162166170172
3530.96
April May
660 255595 258558 251528 249505 247573 281627 293549 255466 240424 232
____ 228
2,054 3275.38 0.89
(125) 5-3690. Red Cedar River at Menomonie, Wis.
Location. Lat 44°53'00", long 91°55'55", in NW? sec.26, T.28 N., R.13 W., on right bank at Menomonie, 900 ft downstream from powerplant of Northern States Power Co., and 1,000 ft downstream from Wilson Creek.
Drainage area. 1,760 sq mi, approximately.
Gage-height record. Digital recorder tape punched at fifteen-minute intervals.Datum of gage is 780 ft above mean sea level (Northern States Power Co. bench mark).
Discharge record. Stage-discharge relation defined by current-meter measrrements below 19,000 cfs and extended above partly on basis of computed flow over Cedar Falls Dam 6 miles upstream. Mean daily discharges computed from 96 purch-tape recordings per day.
Maxima. March-May 1965: Discharge, 28,700 cfs 0600 hours Apr. 12 (gage height, 11.56 ft).
1907-8, 1913-23, 1925 to February 1965: Discharge, 40,000 cfs Apr. 4, 1934 (gage height, 16.0 ft, from floodmarks).
Remarks. Flow regulated by powerplants at Menomonie and Cedar Falls and by Birch, Cedar, Long, and Bear Lakes.
Mean discharge, m cubic feet per second, 1965
Day
1...2...3__.4__.5__.6__.7...8__.9...10..
March
1,2402,2201,9202,1902,0201,8401,5801,8201,5601,510
April
1,0101,3801,4301,3701,7303,2806,250
11,20011,50013,300
May
1,8701,5001,5101,180
6771,0201,3601,6202,4002,650
Day
11__12. _13__14__15. _16_.17. _18__19__20. _
March
1,2501,1701,0801,100
8521,2101,0001,010
802884
April
22,20027,90022,60016,00011,2008,2906,3004,5604,2703,300
Monthly mean discharge, in cubic feet per second
May
2,0802,0802,1101,6101,9201,8401,5501,6201,6101,430
Day
21..22..23..24..25..26..27..28..29..30..31_.
March
777962856855892949873786
1,1001,0101,090
1,239
April
3,0002,6602,5802,5202,6202,5402,5402,5602,4202,050
6,819
May
1,4201,3401,3701,3201,3501,5201,6801,7901,7001,3401,290
1,605
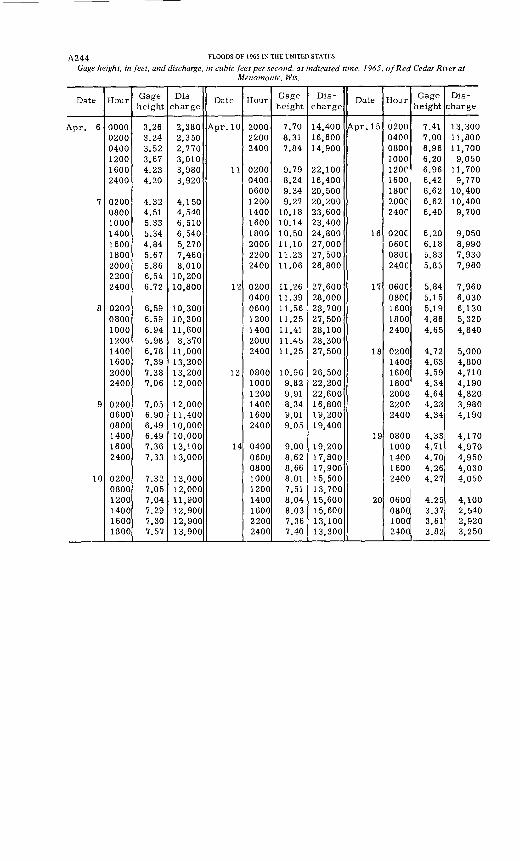
A244 FLOODS OF 1965 IN THE UNITED STATES
Gage height, in feet, and discharge, in cubic feet per second, at indicated time. 1965, of Red Cedar River atMenomonie, Wis.
Date
Apr. 6
7
8
9
10
Hour
000002000400120016002400
020008001000140016001800200022002400
02000800100012001400160020002400
020006000800140016002400
020008001200140016001800
Gage height
3.263.243.523.674.234.20
4.324.515.335.344.845.675.866.546.72
6.596.596.945.986.787.397.387.06
7.056.906.496.497.367.33
7.327.057.047.297.307.57
Dis charge
2,3802,3502,7703,0103,9803,920
4,1504,5406,5106,5405,2707,4608,010
10,20010,800
10,30010,30011,6008,370
11,00013,20013,20012,000
12,00011,40010,00010,00013,10013,000
13,00012,00011,90012,90012,90013,900
Date
Apr. 10
11
12
13
14
Hour
200022002400
0200040006001200140016001800200022002400
0200040006001200140020002400
080010001200140016002400
040006000800100012001400160022002400
Gage height
7.708.317.84
9.798.249.349.27
10.1810.1410.5011.1011.2311.06
11.2611.3911.5611.2511.4111.4511.25
10.969.829.918.349.019.05
9.008.628.668.017.518.048.037.367.40
Dis
charge
14,40016,60014,900
22,10016,40020,50020,20023,60023,40024,80027,00027,50026,800
27,60028,00028,70027,50028,10028,30027,500
26,50022,20022,60016,80019,20019,400
19,20017,80017,90015,50013,70015,60015,60013,10013,300
Date
Apr. 15
16
17
18
19
20
Hour
020004000800100012001600180020002400
0200060008002400
060C080C160018002400
0200140016001800
Gage height
7.417.006.966.206.966.426.626.626.40
6.206.185.835.85
5.845.155.194.864.65
4.724.634.594.34
2000 4.642200 4.232400 4.34
0800 4.331000 4.711400 4.701600 4.262400 4.27
0600080010002400
4.253.373.613.82
Dis charge
13,30011,80011,7009,050
11,7009,77010,40010,4009,700
9,0508,9907,9307,980
7,9606,0306,1305,3204,840
5,0004,8004,7104,1904,8203,9804,190
4,1704,9704,9504,0304,050
4,1002,5402,9203,250
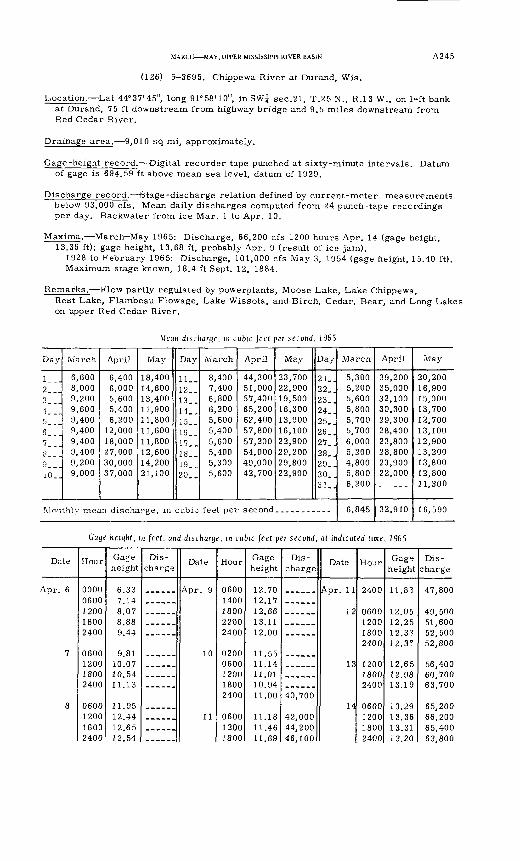
MARCH MAY, UPPER MISSISSIPPI RIVER BASIN
(126) 5-3695. Chippewa River at Durand, Wis.
A245
Location. Lat 44°37'45", long 91°58'10", in SW^ sec.21, T.25 N., R.13 W., on l°ft bank at Durand, 75 ft downstream from highway bridge and 9.5 miles downstream from Red Cedar River.
Drainage area. 9,010 sq mi, approximately.
Gage-height record. Digital recorder tape punched at sixty-minute intervals. Datum of gage is 694.59 ft above mean sea level, datum of 1929.
Discharge record. Stage-discharge relation defined by current-meter measurements below 93,000 cfs. Mean daily discharges computed from 24 punch-tape reccrdings per day. Backwater from ice Mar. 1 to Apr. 10.
Maxima. March-May 1965: Discharge, 66,200 cfs 1200 hours Apr. 14 (gage height, 13.36 ft); gage height, 13.68 ft, probably Apr. 9 (result of ice jam).
1928 to February 1965: Discharge, 101,000 cfs May 3, 1954 (gage height, 15.40 ft). Maximum stage known, 18.4 ft Sept. 12, 1884.
Remarks. Flow partly regulated by powerplants. Moose Lake, Lake Chippewa,Rest Lake, Flambeau Flowage, Lake Wissota, and Birch, Cedar, Bear, and Long Lakes on upper Red Cedar River.
Mean discharge, in cubic feet per second, 1965
Day
12...3...1__.5.6...7__.«...3...iO_.
March
6,6008,0009,2009,6009,4009,4009,4009,4009,2009,000
April
6,4006,0005,6005,4006,200
12,00018,00027,00030,00037,000
May
18,40014,60013,40011,90011,80011,60011,80012,60014,20021,100
Day
11..12..13..14..15..16..17..18..19_.20..
March
8,4007,4006,8006,2005,6005,4005,6005,4005,3005,600
April
44,30051,00057,40065,20062,40057,80057,20054,00049,00042,700
Monthly mean discharge, in cubic feet per second
May
23,70022,90019,50016,30013,90016,10022,90029,20029,80022,900
Day
21..22..23..24..25..26..27..28..29..30..3 1
March
5,3005,2005,6005,8005,7005,7006,0005,2004,8005,8006,200
6,845
April
39,20035,00032,10030,30029,30028,40023,80028,80023,90022,000
32,910
May
20,20016,90015,00013,70012,70013,10012,90013,20013,80012,80011,300
16,590
Gage height, m feet, and discharge, in cubic feet per second, at indicated time, 1965
Date
A.pr. 6
7
8
Hour
00000600120018002400
0600120018002400
0600120016002400
Ga^e height
6.337.148.078.889.44
9.8110.0710.5411.13
11.9512.4412.6512.54
Dis
chargeDate
10
11
Hour
06001400180022002400
02000600120018002400
060012001800
Gage height
12.7012.1712.6613.1112.00
115511.1411.0110.9411.00
11.1811.4611.69
Dis
charge
40,700
42,00044,20046.100
Date
A.pr. 11
12
1 3
14
Hour
2400
0600120018002400
120018002400
120018002400
Gag°
height
11.8?
12.0512.2512.3312.3?
12.6512 9813.19
132913.361^91
13.20
Dis
charge
47,800
49,50051,60052,50052,800
56,400
63,700
65,20066,200
63.800
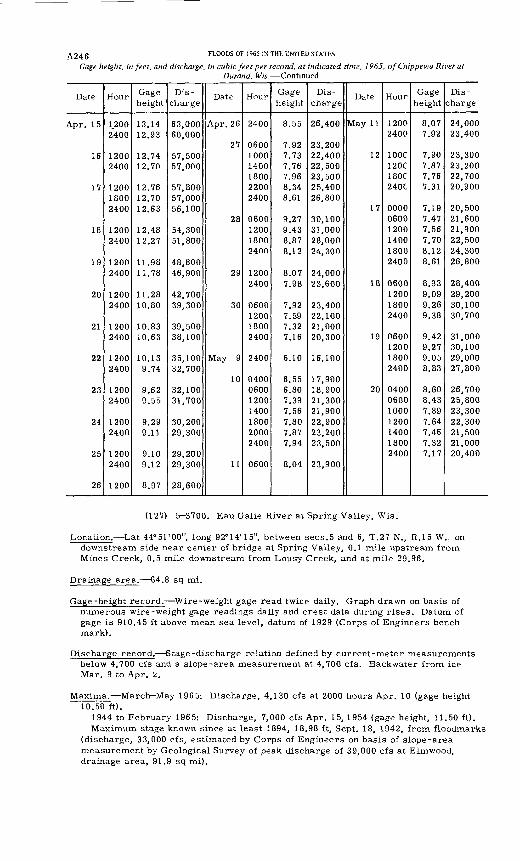
FLOODS OF 1965 IN THE UNITED STATES
Gage height, in feet, and discharge, in cubic feet per second, at indicated time, 1965. ofCmppewa River at Durand, Wis. Continued
Date
Apr. 15
16
17
18
19
20
21
22
23
24
25
26
Hour
1,2002400
12002400
120018002400
12002400
12002400
12002400
12002400
12002400
12002400
12002400
12002400
1200
Gage height
13.1412.93
12.7412.70
12.7612.7012.63
12.4812.27
11.9811.78
11.2810.80
10.8310.63
10.139.74
9.629.55
9.299.11
9.109.12
8.97
Dis
charge
63,00060,000
57,50057,000
57,80057,00056,100
54,30051,800
48,80046,900
42,70039,300
39,50038,100
35,10032,700
32,10031,700
30,20029,300
29,20029,300
28,600
Date
Apr. 26
27
28
29
30
May 9
10
11
Hour
2400
060010001400180022002400
0600120018002400
12002400
0600120018002400
2400
0400060012001400180020002400
0600
Gage height
8.55
7.927.737.767.968.348.61
9.279.438.878.12
8.077.98
7.927.597.327.16
6.10
6.556.807.397.567.807.877.94
8.04
Dis
charge
26,400
23,20022,40022,50023,50025,40026,800
30,10031,00028,00024,300
24,00023,600
23,40022,10021,00020,300
16,100
17,90018,90021,30021,90022,90023,20023,500
23,900
Date
May 11
12
17
18
19
20
Hour
12002400
100C120C180C240C
000006001200140018002400
0600120018002400
0600120018002400
0400060010001200140018002400
Gage height
8.077.92
7.907.877.767.31
7.197.477.567.708.128.61
8.939.099.269.38
9.429.279.058.83
8.608.437.897.647.467.327.17
Dis
charge
24,00023,400
23,30023,20022,70020,900
20,50021,60021,90022,50024,30026,800
28,40029,20030,10030,700
31,00030,10029,00027,800
26,70025,80023,30022,30021,50021,00020,400
(127) 5-3700, Eau Galle River at Spring Valley, Wis.
Location. Lat 44°51'00", long 92°14'15", between sees.5 and 6, T.27 N., R.15 W., on downstream side near center of bridge at Spring Valley, 0.1 mile upstream from Mines Creek, 0.5 mile downstream from Lousy Creek, and at mile 29.96.
Drainage area. 64.8 sq mi.
Gage-height record. Wire-weight gage read twice daily. Graph drawn on basis of numerous wire-weight gage readings daily and crest data during rises. Datum of gage is 910.45 ft above mean sea level, datum of 1929 (Corps of Engineers bench mark).
Discharge record. Stage-discharge relation defined by current-meter measurements below 4,700 cfs and a slope-area measurement at 4,700 cfs. Backwater from ice Mar. 9 to Apr. 2.
Maxima. March May 1965: Discharge, 4,130 cfs at 2000 hours Apr. 10 (gage height 10.50 ft).
1944 to February 1965: Discharge, 7,000 cfs Apr. 15, 1954 (gage height, 11.50 ft). Maximum stage known since at least 1894, 18.98 ft, Sept. 18, 1942, from floodmarks
(discharge, 33,000 cfs, estimated by Corps of Engineers on basis of slope-area measurement by Geological Survey of peak discharge of 39,000 cfs at Elmwood, drainage area, 91.9 sq mi).
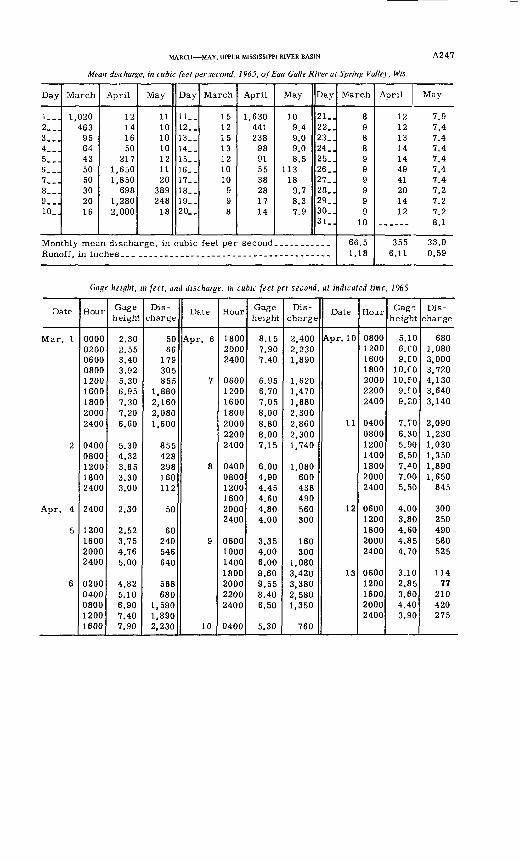
MARCH MAY, UPPER MISSISSIPPI RIVER BASIN
Mean discharge, in cubic feet per second, 1965, ofEau Galle River at Spring Valley, Wis.
A247
Day
1...2...3...4...5...6...7...8...9...10..
March
1,020463
9564435050302016
April
12141650
2171,6501,850
6981,2802.000
May
11101010121120
389248
18
Day
11..12..13..14..15..16..17..18..19..20..
March
15121513121010
998
April
1,630441238
98915538281714
May
109.49.09.08.5
11318
9.78.37.9
Day
21..22..23..24..25..26..27..28..29..30..31
Runoff, in inchcs
March
8988999999
10
66.51.18
April
12121314144941201412
3556.11
May
7.97.47.47.47.47.47.47.27.27.28.1
33.00.59
Gage height, m feet, and discharge, m cubic feet per second, at indicated time, 1965
Date
Mar. 1
2
Apr. 4
5
6
Hour
000002000600080012001600180020002400
04000800120018002400
2400
1200160020002400
02000400080012001600
Gage height
2.302.553.403.925.306.957.307.206.60
5.304.323.853.303.00
2.30
2.523.754.765.00
4.825.106.907.407.90
Dis charge
5066
179305855
1,8802,1602,0801,600
855428298160112
50
60240546640
568680
1,5901,8902.230
Date
Apr. 6
7
8
9
10
Hour
180020002400
0600120016001800200022002400
040008001200160020002400
0600100014001800200022002400
0400
Gage height
8.157.907.40
6.956.707.058.008.808.007.15
6.004.904.454.604.804.00
3.354.006.009.609.558.406.50
5.30
Dis
charge
2,4002,2301,890
1,6201,4701,6802,3002,8602,3001,740
1,080600438490560300
160300
1,0803.4203,3802,5801,350
760
Date
Apr. 10
11
12
13
Hour
0800120016001800200022002400
0400080012001400180020002400
06001200180020002400
06001200160020002400
Gag? height
5.106. CO9. CO
10. CO10. fO
9.fO9.20
7.706.305.906.507.^07.005.50
4.003.804.604.854.70
3.102.853.604.403.90
Dis
charge
6801,0803,0003,7204,1303,6403,140
2,0901,2301,0301,3501,8901,650
845
300250490580525
11477
210420275
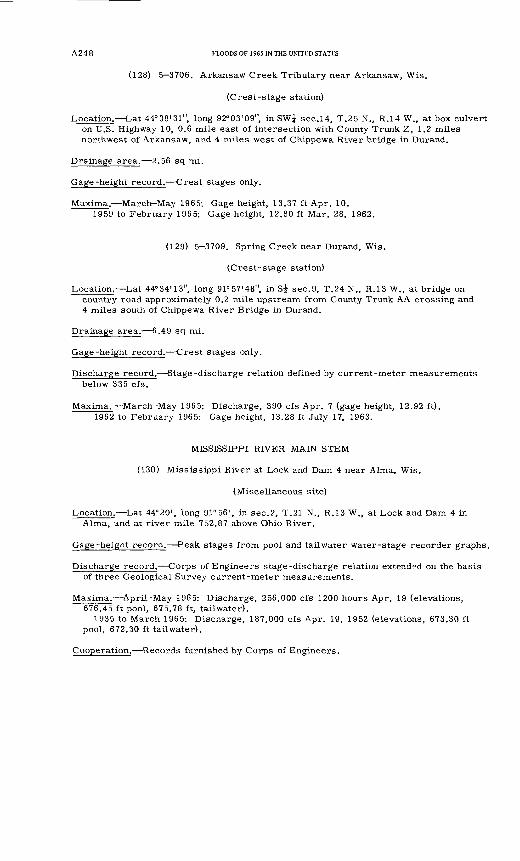
A248 FLOODS OF 1965 IN THE UNITED STATES
(128) 5 3706. Arkansaw Creek Tributary near Arkansaw, Wis.
(Crest-stage station)
Location. Lat 44°38'31", long 92°03'09", in SW£ sec.14, T.25 N., R.14 W g> at box culvert on U.S. Highway 10, 0.6 mile east of intersection with County Trunk Z, 1.2 miles northwest of Arkansaw, and 4 miles west of Chippewa River bridge in Durand.
Drainage area. 2.56 sq mi.
Gage-height record. Crest stages only.
Maxima. March-May 1965: Gage height, 13.37 ft Apr. 10.1959 to February 1965: Gage height, 12.80 ft Mar. 28, 1962.
(129) 5-3709. Spring Creek near Durand, Wis.
(Crest-stage station)
Location. Lat 44°34'13", long 91°57'48", in Si sec.9, T.24 N., R.13 W., at bridge on country road approximately 0.2 mile upstream from County Trunk AA crossing and 4 miles south of Chippewa River Bridge in Durand.
Drainage area. 6.49 sq mi.
Gage-height record. Crest stages only.
Discharge record. Stage-discharge relation defined by current-meter measurements below 335 cfs.
Maxima. March-May 1965: Discharge, 390 cfs Apr. 7 (gage height, 12.92 ft). 1962 to February 1965: Gage height, 13.28 ft July 17, 1963.
MISSISSIPPI RIVER MAIN STEM
(130) Mississippi River at Lock and Dam 4 near Alma, Wis.
(Miscellaneous site)
Location. Lat 44°20', long 91° 56', in sec.2, T.21 N., R.13 W., at Lock and Dam 4 in Alma, and at river mile 752.87 above Ohio River.
Gage-height record. Peak stages from pool and tailwater water-stage recorder graphs.
Discharge record. Corps of Engineers stage-discharge relation extended on the basis of three Geological Survey current-meter measurements.
Maxima. April-May 1965: Discharge, 256,000 cfs 1200 hours Apr. 19 (elevations, 676.45 ft pool, 675.78 ft, tailwater).
1935 to March 1965: Discharge, 187,000 cfs Apr. 19, 1952 (elevations, 673.30 ft pool, 672.30 ft tailwater).
Cooperation. Records furnished by Corps of Engineers.
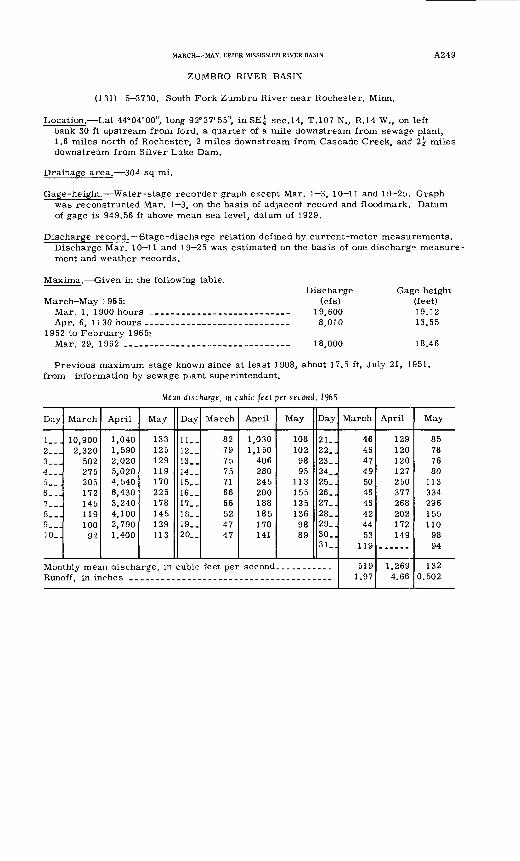
MARCH MAY, UPPER MISSISSIPPI RIVER BASIN A249
ZUMBRO RIVER BASIN
(131) 5-3730. South Fork Zumbro River near Rochester, Minn.
Location. Lat 44°04'00", long 92°27'55", in SE? sec.14, T.107 N., R.14 W., on left bank 30 ft upstream from ford, a quarter of a mile downstream from sewage plant, 1.6 miles north of Rochester, 2 miles downstream from Cascade Creek, and 1\ miles downstream from Silver Lake Dam.
Drainage area. 304 sq mi.
Gage-height. Water-stage recorder graph except Mar. 1 3, 10 11 and 19 25. Graph was reconstructed Mar. 1 3, on the basis of adjacent record and floodmark. Datum of gage is 949.56 ft above mean sea level, datum of 1929.
Discharge record. Stage-discharge relation defined by current-meter measurements. Discharge Mar. 10 11 and 19 25 was estimated on the basis of one discharge measure ment and weather records.
Maxima. Given in the following table.
March-May 1965:Mar. 1, 1900 hours __ __.Apr. 6, 1130 hours. -_.___ ___
1952 to February 1965:Mar. 29, 1962 ___ .
Discharge(cfs)
19,6008,010
18,000
Gage height (feet) 19.12 13.55
18.46
Previous maximum stage known since at least 1908, about 17.5 ft, July 21, 1951, from information by sewage plant superintendant.
Mean discharge, in cubic feet per second, 1965
Day
!_-.2...3...4...5__.6...7__.8...9-_.10_.
March
10,9002,320
502275205172145119100
92
April
1,0401,5902,0205,0204,5406,4303,2404,1002,7901,400
May
133125129119170225178145129113
Day
11_.12__13__14__15__16__17__18__19__20. _
March
82797575716666524747
April
1,0301,150
406280245200188185170141
May
108102
9895
1131551251369889
Day
21_.22..23_.24..25..26_.27..28..29..30..31
Monthly mean discharge, in cubic feet per second.. _________Runoff, in ir
March
46464749504646424453
119
5191.97
April
129120120127250377268202172149
1,2694.66
May
85787680
113334296155110
9894
1320.502
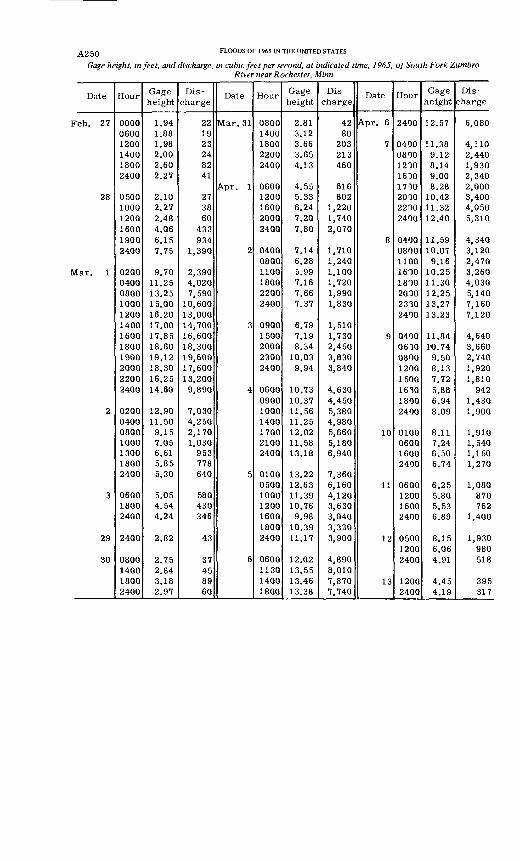
^2 50 FLOODS OP 1965 IN THE UNITED STATES
Gage height, in feet, and discharge, in cubic feet per second, at indicated time, 1965, of South Fork ZumbroRiver near Rochester, Minn.
Date
Feb. 27
28
Mar. 1
2
3
29
30
Hour
000006001200140018002400
050010001200160019002400
020004000800100012001400160018001900200022002400
0200040008001000130018002400
060018002400
2400
0800140018002400
Gage height
1.941.881.982.002.602.27
2.102.272.484.066.157.75
9.7011.2513.2515.0016.2017.0017.8518.6019.1218.3016.2514.60
12.9011.509.157.056.615.855.30
5.054.544.24
2.82
2.752.843.182.97
Dis
charge
221923248241
273860
433934
1,390
2,3904,0207,590
10,60013,00014,70016,60018,30019,60017,60013,2009,890
7,0304,2502,1701,030953778640
580430346
43
37458960
Date
Mar. 31
Apr. 1
2
3
4
5
6
Hour
08001400180022002400
06001200160020002400
040008001100180022002400
09001500200023002400
0600090010001400170021002400
0100050010001200160018002400
0600113014001800
Gage height
2.813.123.663.654.13
4.555.336.247.207.80
7.146.285.997.167.667.37
6.797.198.34
10.039.94
10.7310.3711.5611.2512.0211.5813.18
13.2212.6311.3910.769.98
10.3911.17
12.0213.5513.4613.38
Dis
charge
4280
203213460
616802
1,2201,7402,070
1,7101,2401,1001,7201,9901,830
1,5101,7302,4503,8303,840
4,6304,4505,3804,9805,6605,1806,940
7,3606,1604,1203,6303,0403,3303,900
4,8908,0107,8707,740
Date
Apr. 6
7
8
9
10
11
12
13
Hour
2400
04000800120016001700200022002400
04000800110016001800200023302400
04000600080012001500163018002400
0100060016002400
0600120016002400
050012002400
12002400
Gage height
12.57
11.389.128.149.008.28
10.4211.3212.40
11.5910.079.16
10.2511.3012.2513.2713.23
11.841-0.749.508.137.725.886.948.09
8.117.246.506.74
6.255.805.536.89
8.156.064.91
4.454.19
Dis
charge
6,080
4,1102,4401,9302,3402,0003,4004,0505,310
4.3403,1202,4703,2604,0305,1407,1607,120
4,6403,6602,7401,9201,810942
1,4301,900
1,9101,5401,1501,270
1,080870762
1,400
1,930980518
395317
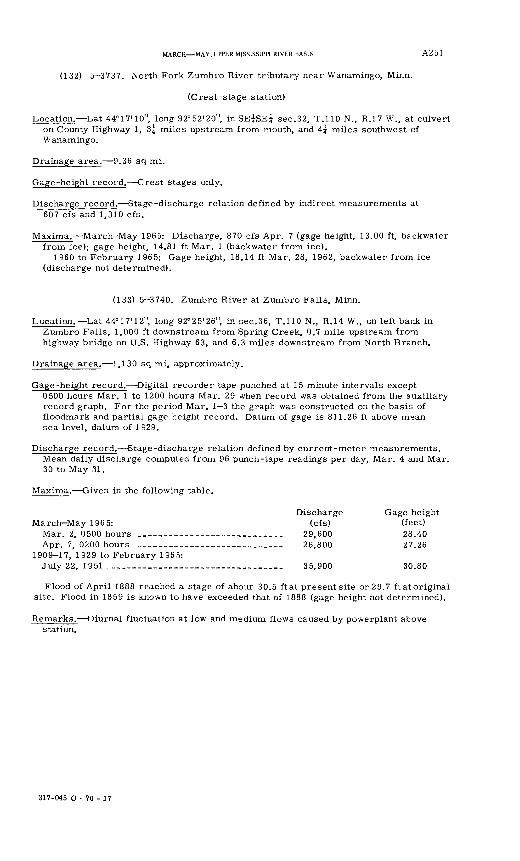
MARCH MAY, UPPER MISSISSIPPI RIVER BASIN A2 5 1
(132) 5 3737. North Fork Zumbro River tributary near Wanamingo, Minn.
(Crest-stage station)
Location. Lat 44°17'10", long 92°52'20", in SE^SE^ sec.32, T.110 N., R.17 W., at culvert on County Highway 1, 3| miles upstream from mouth, and 4| miles southwest of Wanamingo.
Drainage area. 9.36 sq mi.
Gage-height record. Crest stages only.
Discharge record. Stage-discharge relation defined by indirect measurements at 607 cfs and 1,310 cfs.
Maxima. March May 1965: Discharge, 870 cfs Apr. 7 (gage height, 13.00 ft, backwater from ice); gage height, 14.81 ft Mar. 1 (backwater from ice).
1960 to February 1965: Gage height, 18.14 ft Mar. 28, 1962, backwater from ice (discharge not determined).
(133) 5-3740. Zumbro River at Zumbro Falls, Minn.
Location. Lat 44° 17'12", long 92°25'26", in sec.36, T.110 N., R.14 W., on left bank in Zumbro Falls, 1,000 ft downstream from Spring Creek, 0.7 mile upstream fro*n highway bridge on U.S. Highway 63, and 6.3 miles downstream from North Branch.
Drainage area. 1,130 sq mi, approximately.
Gage-height record. Digital recorder tape punched at 15 minute intervals except0500 hours Mar. 1 to 1200 hours Mar. 29 when record was obtained from the auxiliary record graph. For the period Mar. 1 3 the graph was constructed on the basis of floodmark and partial gage height record. Datum of gage is 811.26 ft above m^an sea level, datum of 1929.
Discharge record. Stage-discharge relation defined by current-meter measurements. Mean daily discharge computed from 96 punch-tape readings per day. Mar. 4 and Mar. 30 to May 31.
Maxima. Given in the following table.
Discharge Gage heightMarch-May 1965: (cfs) (feet)
Mar. 2, 0500 hours ____________________.___ 29,600 28.40Apr. 7, 0200 hours _________-___________ 26,800 27.26
1909-17, 1929 to February 1965:July 22, 1951 _________-_--_____.-____.____ 35,900 30.80
Flood of April 1888 reached a stage of abour 30.5 ftat presentsite or 29.7 ftatoriginal site. Flood in 1859 is known to have exceeded that of 1888 (gage height not determined).
Remarks. Diurnal fluctuation at low and medium flows caused by powerplant atove station.
317-045 O - 70 - 17
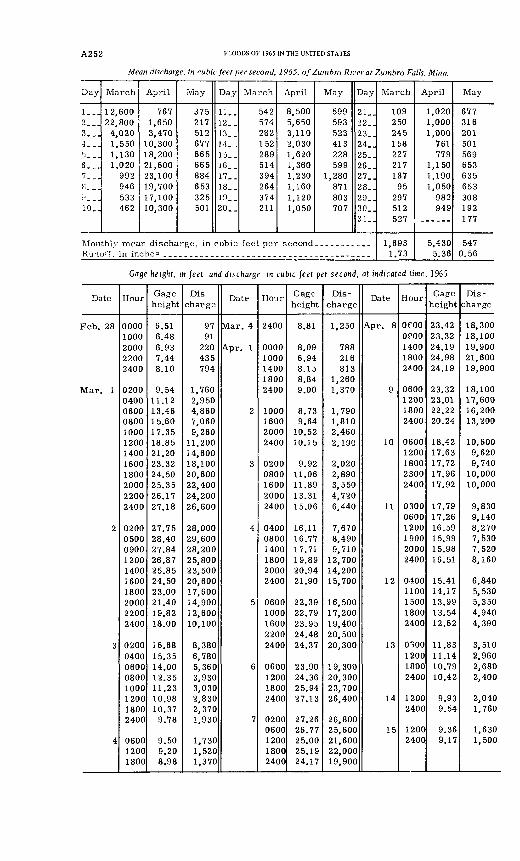
A252 FLOODS OF 1965 IN THE UNITED STATES
Mean discharge, in cubic feet per second, 1965, of Zumbro River at Zumbro Falls, Minn.
Day
1__.2___3...4...5...6___7...8. -Jf ...10..
March
12,60022,800
4,0201,5501,1301,020
992946533462
April
7671,6503,470
10,30018,20021,60023,10019,70017,10010,300
May
375217512677665665884653325501
Day
11-.12.-13..14.-15. _16..17__18..19-_2Q__
March
542574282152289514394264374211
April
8,5005,6503,1102,0301,6201,3601,2301,1601,1201,050
May
599593523413228599
1,280871803707
Day
21..22..23..24..25..26..27..28..29..30..3 1
Runoff, in inches ._..._..._....__......._..___ .. __-_.._
March
109250245158227217187
95297512527
1,6931.73
April
1,0201,0001,000
761779
1,1501,1901,050
982949
5,4305.36
May
677316201501569653635653308192177
5470.56
Gage height, in feet, and discharge, m cubic feet per second, at indicated time, 1965
Date
Feb. 28
Mar. 1
2
3
4
Hour
00001000200022002400
020004000600080010001200140016001800200022002400
0200050009001200140016001800200022002400
02000400060008001000120018002400
060012001800
Gage height
6.516.486.937.448.10
9.5411.1213.4615.6017.3518.8521.2023.3224.5025.3526.1727.18
27.7528.4027.8426.8725.8524.5023.0021.4019.8218.00
16.6815.3514.0012.3511.2310.9810.379.78
9.509.208.98
Dis
charge
9791
220435794
1,7602,9504,8607,0609,260
11,20014,60018,10020,60022,40024,20026,600
28,00029,60028,20025,80023,50020,60017,60014,90012,60010,100
8,3806,7805,3603,9303,0302,8302,3701,930
1,7301,5201,370
Date
Mar. 4
Apr. 1
2
3
4
5
6
7
Hour
2400
00001000140018002400
1000160020002400
02000800160020002400
040008001400180020002400
06001000160022002400
0600120018002400
02000600120018002400
Gage height
8.81
8.096.948.158.849.00
8.739.64
10.5210.15
9.9211.0611.8913.3115.06
16.1116.7717.7119.8920.9421.90
22.3922.7923.9524.4824.37
23.9024.3625.9427.13
27.2626.7725.0025.1924.17
Dis
charge
1,250
788216813
1,2601,370
1,7901,8102,4602,190
2,0202,8903,5504,7206,440
7,6708,4909,710
12,70014,20015,700
16,50017,20019,40020,50020,300
19,30020,30023,70026,400
26,80025,60021,60022,00019,900
Date
Apr. 8
9
10
11
12
13
14
15
Hour
OfOOOPOO140018002^00
0600120018002400
06001200180023002400
030006001200190020002400
04001100150018002400
0<500120018002400
12002400
12002400
Gage height
23.4223.3224.1924.9824.19
23.3223.0122.2220.24
18.4217.6317.7217.9617.92
17.7917.2616.5915.9915.9816.51
15.4114.1713.9913.5412.62
11.8311.1410.7910.42
9.939.54
9.369.17
Dis
charge
18,30018,10019,90021,60019,900
18,10017,60016,20013,200
10,6009,6209,740
10,00010,000
9,8309,1408,2707,5307,5208,160
6,8405,5305,3504,9404,390
3,5102,9602,6802,400
2,0401,760
1,6301,500
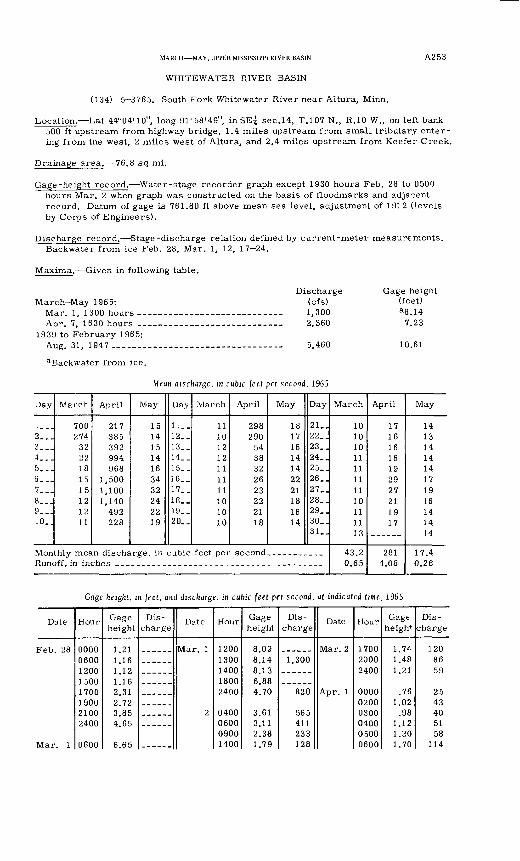
MARCH MAY, UPPER MISSISSIPPI RIVER BASIN A253
WHITE WATER RIVER BASIN
(134) 5 3765. South Fork Whitewater River near Altura, Minn.
Location. Lat 44°04'10", long 91°58'49", in SE^ sec.14, T.107 N., R.10 W., on left bank 500 ft upstream from highway bridge, 1.4 miles upstream from small tributary enter ing from the west, 2 miles west of Altura, and 2.4 miles upstream from Keefer Creek.
Drainage area. 76.8 sq mi.
Gage-height record. Water-stage recorder graph except 1930 hours Feb. 28 to 0500 hours Mar. 2 when graph was constructed on the basis of floodmarks and adjacent record. Datum of gage is 761.80 ft above mean sea level, adjustment of 1912 (levels by Corps of Engineers).
Discharge record. Stage-discharge relation defined by current-meter measurements. Backwater from ice Feb. 28, Mar. 1, 12, 17-24.
Maxima. Given in following table.
March-May 1965:Mar. 1, 1300 hours -- Apr. 7, 1630 hours .-
1939 to February 1965: Aug. 31, 1947 ___.__.
Discharge (cfs) 1,300 2,360
5,460
Gage height(feet)a8.14
7.23
10.61
aBackwater from ice.
Mean discharge, in cubic feet per second, 1965
Day
1...2..^3__ H4 --15...6..J7...8...9...10..
March
700274
3222181515121211
April
217385392994968
1,5001,1001,140
492228
May
15141514163432242219
Day
11_-12..13..14_.15..16..17..18..19.-20..
March
11101212111111101010
April
298290
5438322623222118
May
18171614142221181614
Day
21..22..23..24..25..26..27..28..29..30_.31..
Monthly mean discharge, in cubic feet per second.. _________Runoff, in in "*h.GS
March
1010101111111110111113
43.20.65
April
17161616192927211917
2814.08
May
1413141414171916141414
17.40.26
Gage height, in feet, and discharge, in cubic feet per second, at indicated time, 1965
Date
Feb. 28
Mar. 1
Hour
00000600120015001700190021002400
0600
Gage height
1.211.16119
1.162 312 72
6.65
Dis
chargeDate
Mar 1
2
Hour
12001300140018002400
040006000900 1400
Gage height
8.098.148.136.884.70
3.613.112.38 1.79
Dis
charge
1,300
820
565411233 128
Date Hour
170020002400
00000200030004000500 0600
Gage height
1.7*
1.481.21
.761.02.98
1.121.20 1.70
Dis
charge
1208659
2543405158
114
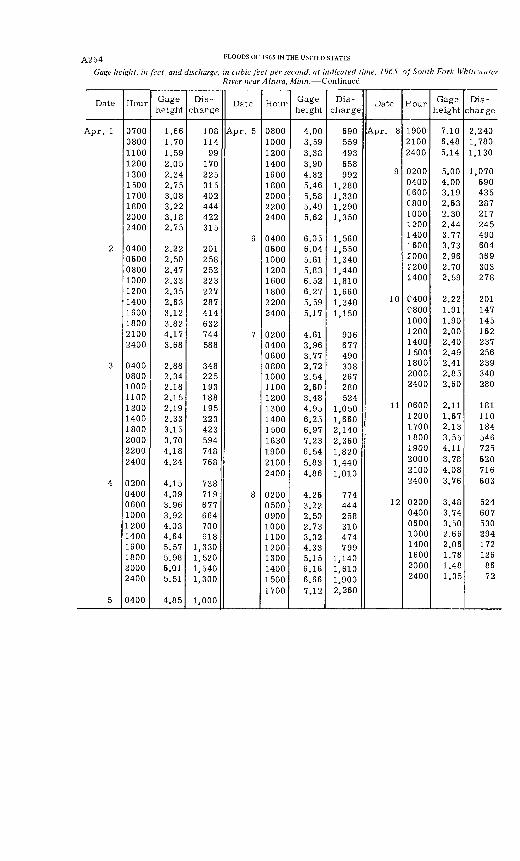
A254 FLOODS OF 1965 IN THE UNITED STATES
Gage height, in feet, and discharge, in cubic feet per second, at indicated time, 1965, of South Fork Whitcwu/ci River near Altura, Minn. Continued
Date
Apr. 1
2
3
4
5
Hour
0700080011001200130015001700180020002400
0400060008001000120014001600180021002400
0400080010001100120014001800200022002400
0200040006001000120014001600180020002400
0400
Gage height
1.661.701.592.052.342.753.083.223.182.75
2.222.502.472.332.352.633.123.824.173.68
2.882.342.182.152.192.333.153.704.184.24
4.154.093.963.924.034.645.575.986.015.51
4.85
Dis
charge
10811499
170225315402444422315
201258252223227287414632744588
348225193188195223423594748768
738719677664700918
1,3301,5201,5401,300
1,000
Date
Apr. 5
6
7
8
Hour
080010001200140016001800200022002400
04000600100012001600180022002400
02000400060008001000110012001300140015001630190021002400
0200050009001000110012001300140015001700
Gage height
4.003.593.383.904.825.465.585.495.62
6.056.045.615.836.526.275.595.17
4.613.963.772.722.542.603.484.956.256.977.236.545.834.86
4.263.222.502.733.324.335.156.166.667.12
Dis
charge
690559493658992
1,2801,3301,2901,350
1,5601,5501,3401,4401,8101,6601,3401,150
906677490308267280524
1,0501,6602,1402,3601,8201,4401,010
774444258310474799
1,1401,6101,9002,260
Date
Apr. 8
9
10
11
12
Hour
190021002400
02000400C600C8001000120014001600200022002400
C40008001000120014001500180020002400
06001200170018001900200021002400
02000400060010001400160020002400
Gage height
7.106.485.14
5.004.003.192.632.302.443.773.732.962.702.59
2.221.911.902.002.402.492.412.852.60
2.111.672.133.554.113.784.083.76
3.483.743.502.662.061.781.481.35
Dis
charge
2,2401,7801,130
1,070690435287217245490604369303278
201147145162237256239340280
181110184546725620716603
5246075302941721268672
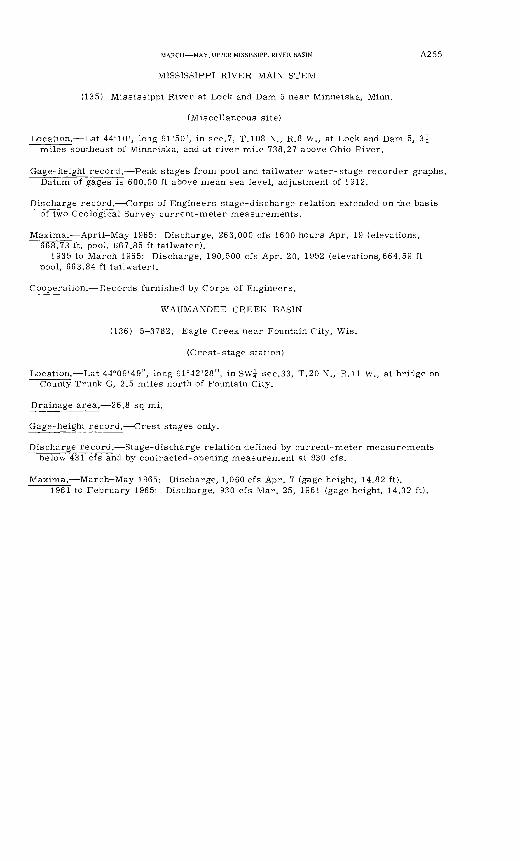
MARCH MAY, UPPER MISSISSIPPI RIVER BASIN A2 5 5
MISSISSIPPI RIVER MAIN STEM
(135) Mississippi River at Lock and Dam 5 near Minneiska, Minn.
(Miscellaneous site)
Location. Lat 44°10', long 91°50', in sec. 7, T.108 N., R.8 W., at Lock and Dam 5, 3| miles southeast of Minneiska, and at river mile 738.27 above Ohio River.
Gage-height record. Peak stages from pool and tailwater water-stage recorder graphs. Datum of gages is 600.00 ft above mean sea level, adjustment of 1912.
Discharge record. Corps of Engineers stage-discharge relation extended on the basis of two Geological Survey current-meter measurements.
Maxima.- April-May 1965: Discharge, 263,000 cfs 1600 hours Apr. 19 (elevations, 668.73 ft, pool, 667.85 ft tailwater).
1935 to March 1965: Discharge, 190,500 cfs Apr. 20, 1952 (elevations., 664.59 ft pool, 663.84 ft tailwater).
Cooperation. Records furnished by Corps of Engineers.
WAUMANDEE CREEK BASIN
(136) 5-3782. Eagle Creek near Fountain City, Wis.
(Crest-stage station)
Location. Lat 44°09'49", long 91°42'28", in SW{ sec.33, T.20 N., R.ll W., at bridge on County Trunk G, 2.5 miles north of Fountain City.
Drainage area. 26.8 sq mi.
Gage-height record. Crest stages only.
Discharge record. Stage-discharge relation defined by current-meter measurements below 431 cfs and by contracted-opening measurement at 930 cfs.
Maxima.- March-May 1965: Discharge, 1,060 cfs Apr. 7 (gage height, 14.82 ft).1961 to February 1965: Discharge, 930 cfs Mar. 25, 1961 (gage height, 14.32 ft).
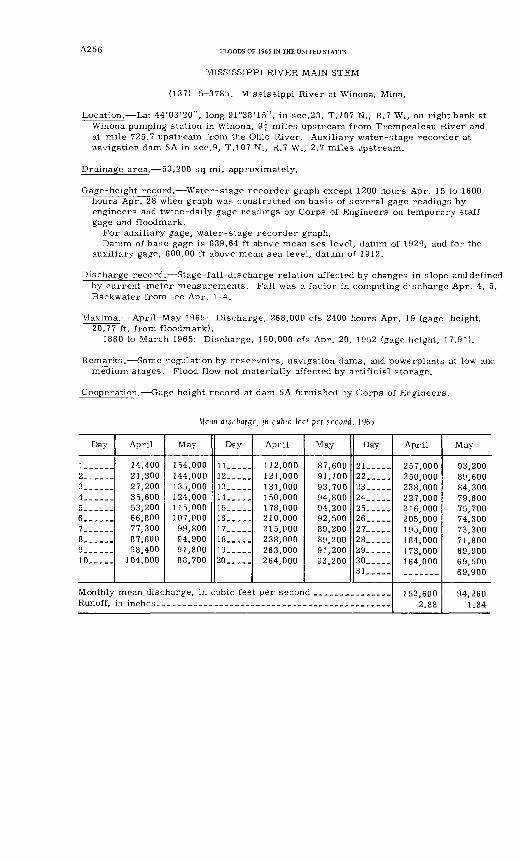
A256 FLOODS OF 1965 IN THE UNITED STATES
MISSISSIPPI RIVER MAIN STEM
(137) 5-3785. Mississippi River at Winona, Minn.
Location. Lat 44°03'20", long 91°38'15", in sec.23, T.107 N., R.7 W., on right bank at Winona pumping station in Winona, 9f miles upstream from Trempealeau River and at mile 725.7 upstream from the Ohio River. Auxiliary water-stage recorder at navigation dam 5A in sec.9, T.107 N., R.7 W., 2.7 miles upstream.
Drainage area. 59,200 sq mi. approximately.
Gage-height record. Water-stage recorder graph except 1200 hours Apr. 15 to 1600 hours Apr. 28 when graph was constructed on basis of several gage readings by engineers and twice-daily gage readings by Corps of Engineers on temporary staff gage and floodmark.
For auxiliary gage, water-stage recorder graph.Datum of base gage is 639.64 ft above mean sea level, datum of 1929, and for the
auxiliary gage, 600.00 ft above mean sea level, datum of 1912.
Discharge record. Stage-fall-discharge relation affected by changes in slope and defined by current-meter measurements. Fall was a factor in computing discharge Apr. 4, 5. Backwater from ice Apr. 1-4.
Maxima. April-May 1965: Discharge, 268,000 cfs 2400 hours Apr. 19 (gage height, 20.77 ft, from floodmark).
1880 to March 1965: Discharge, 190,000 cfs Apr. 20, 1952 (gage height, 17.91).
Remarks. Some regulation by reservoirs, navigation dams, and powerplants at low and medium stages. Flood flow not materially affected by artificial storage.
Cooperation. Gage height record at dam 5A furnished by Corps of Engineers.
Mean discharge, in cubic feet per second, 1965
Day
1. _____2. __ ..3__ ___4. __ ..5______6__.___7_.____8_ __ __9_____.10_.___
Monthly Runoff,
April
14,400 21,300 27,200 35,600 53,200 66,800 77,300 87,600 98,400
104,000
May
154,000 144,000 135,000 124,000 115,000 107,000 99,800 94,900 91,800 88,700
Day
11. _ ___12_____13.....14.....15.....16.....17_____18.....19--.-.20_- __
April
112,000 121,000 131,000 150,000 178,000 210,000 215,000 238,000 263,000 264,000
mean discharge, in cubic feet per secon in inches
May
87,600 91,100 93,700 94,800 94,200 92,500 89,200 89,200 91,200 93,200
Day
21_____22.....23..... 24_.__.25.....26.-.-.27.. __ 28 __ .. 29 __ ._30 __ -.31_____
d ........._....-
April
257,000 250,000 238,000 227,000 216,000 205,000 195,000 184,000 173,000 164,000
152,600 2.88
May
93,200 89,600 84,300 79,600 75,700 74,300 73,300 71,800 69,900 69,500 69,900
94,260 1.84
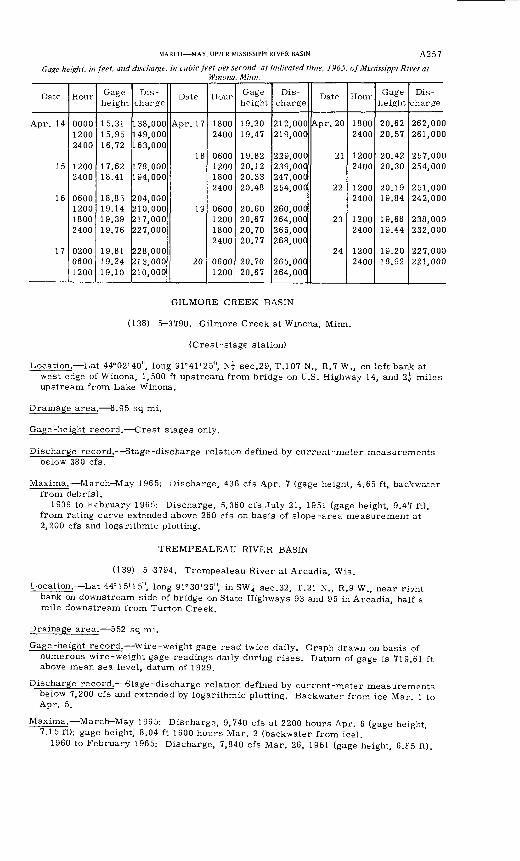
MARCH MAY, UPPER MISSISSIPPI RIVER BASIN
Gage height, in feet, and discharge, in cubic feet per second, at indicated time, 1965Winoiia. Minn.
A257
of Mississippi River al
Date
Apr. 14
15
16
17
Hour
000012002400
12002400
0600120018002400
020006001200
Gage height
15.3115.9516.72
17.6218.41
18.8519.1419.3919.76
19.8119.2419.10
Dis charge
138,000149,000163,000
178,000194,000
204,000210,000217,000227,000
228,000213,000210,000
Date
Apr. 17
18
19
20
Hour
18002400
0600120018002400
0600120018002400
06001200
Gage height
19.2019.47
19.8220.1220.3320.48
20.6020.6720.7020.77
20.7020.67
Dis
charge
212,000219,000
229,000239,000247,000254,000
260,000264,000265,000268,000
265,000264,000
Date
Apr. 20
21
22
23
24
Hour
18002400
12002400
12002400
12002400
12002400
Gage height
20.6220.57
20.4220.30
20.1919.84
19.6819.44
19.2018.92
Dis charge
262,000261,000
257,000254,000
251,000242,000
238,000232,000
227,000221,000
GILMORE CREEK BASIN
(138) 5-3790. Gilmore Creek at Winona, Minn.
(Crest-stage station)
Location. Lat 44°02'40", long 91°41'25", N| sec.29, T.I07 N., R.7 W., on left bank at west edge of Winona, 1,500 ft upstream from bridge on U.S. Highway 14, and 2|- miles upstream from Lake Winona.
Drainage area. 8.95 sq mi.
Gage-height record. Crest stages only.
Discharge record. Stage-discharge relation defined by current-meter measurements below 380 cfs.
Maxima. March-May 1965: Discharge, 436 cfs Apr. 7 (gage height, 4.65 ft, backwater from debris).
1939 to February 1965: Discharge, 5,360 cfs July 21, 1951 (gage height, 9.47 ft), from rating curve extended above 260 cfs on basis of slope-area measurement at 2,200 cfs and logarithmic plotting.
TREMPEALEAU RIVER BASIN
(139) 5-3794. Trempealeau River at Arcadia, Wis.
Location. Lat 44°15'15", long 91°30'25", in SW| sec.32, T.21 N., R.9 W., near ri?ht bank on downstream side of bridge on State Highways 93 and 95 in Arcadia, half a mile downstream from Turton Creek.
Drainage area. 552 sq mi.
Gage-height record. Wire-weight gage read twice daily. Graph drawn on basis of numerous wire-weight gage readings daily during rises. Datum of gage is 719.61 ft above mean sea level, datum of 1929.
Discharge record. Stage-discharge relation defined by current-meter measurements below 7,200 cfs and extended by logarithmic plotting. Backwater from ice Mar. 1 to Apr. 5.
Maxima. March-May 1965: Discharge, 9,740 cfs at 2200 hours Apr. 6 (gage height, 7.15 ft); gage height, 8.04 ft 1600 hours Mar. 2 (backwater from ice).
1960 to February 1965: Discharge, 7,840 cfs Mar. 26, 1961 (gage height, 6.£5 ft).
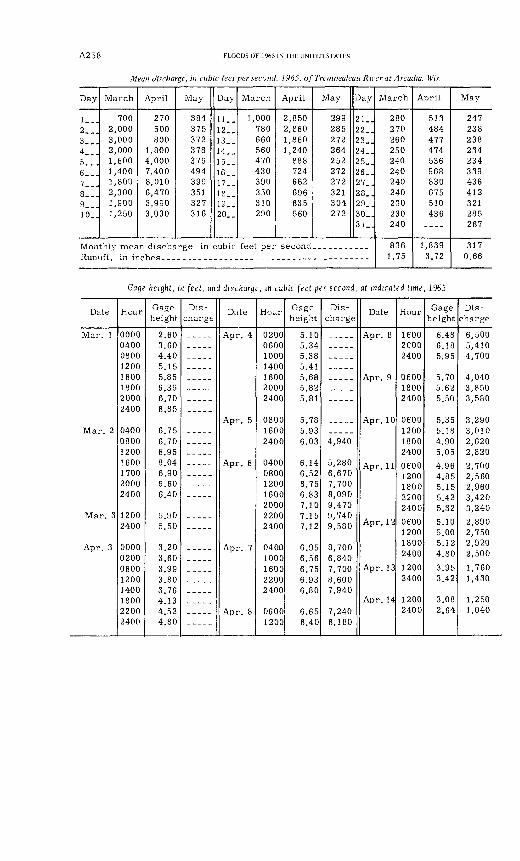
A258
Mean discharge, in cubic feel per second, 1965. of Trempealeait River at Arcadia, Wis.
Day
!___2___3__.4...5. __6...7___8...9__.10..
March
7002,0003,0002,0001,6001,4001,8002,3001,9001,250
April
270500800
1,8004,0007,4008,0106,4703,9903,030
May
384375372378375494399351327316
Day
11..12_.13__14__15__16__17. _18__19_-20. _
March
1,000780660560470430390350310290
April
2,8502,8601,8601,240
888724662696635560
May
299285272264252272272321304272
Day
21..22_.23_.24_.25_.26_.27..28_.29_.30_.31_.
Monthly mean discharge, in cubic feet per second. __________Runoff , in iriches
March
280270260250240240240240230230240
8361.75
April
513484477474536968830675510436
----
1,8393.72
May
247238238234234339436412321285267
3170.66
Gnge height, in feet, and discharge, in cubic feet per second, at indicated time, 1965
Date
1\/T or* 9
Mar. 3
Apr. 3
Hour
00000400080012001600180020002400
0400080012001600170020002400
12002400
00000200060012001400180022002400
Gage height
2.603.604.405 155.856.356.706.85
6.756.706.958.046.90
6.40
5.905.50
3.203.603.993.803.764.134.524.80
Dis charge
Date
Apr. 7
Hour
0200060010001400160020002400
080016002400
04000800120016002000 22002400
040D1000160022002400
06001200
Gage height
5.10^ "ZA
5 385 415.685.825.81
^ Q3
6.03
6.146.526.756.837.10 7.157.12
6 956.566.756.936.80
6.656.40
Dis charge
4,940
5,2806,670
8,0909,470 9,7409,580
8,7006,8407,7008,6007,940
7,2406,180
Date
Apr. 11
Apr. 12
Apr. 13
Apr. 14
Hour
ieoo2COO2400
oeoo1£002400
oeoo120018002400
oeoo12001800
2400
oeoo1200 18002400
12002400
12002400
Gage height
6.486.185 95
5.705.625.50
5.355.184.905.05
4.96
5.15
5.32
5.105.00 5.124.80
3.953.42
3.082.64
Dis
charge
6,5005,4104,700
4,0403,8503,580
3,2903,0102,6202,820
2,960
3,240
2,8902,750 2,9202,500
1,7601,430
1,2501,040
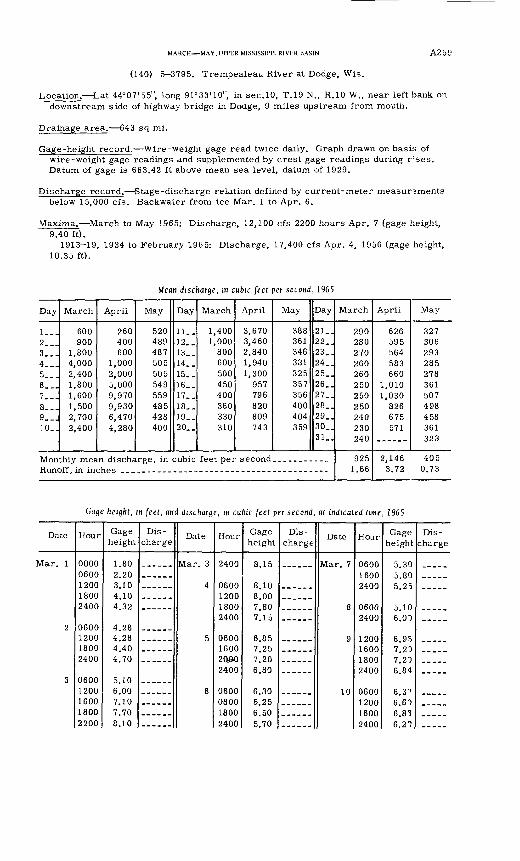
MARCH MAY, UPPER MISSISSIPPI RIVER BASIN
(140) 5-3795. Trempealeau River at Dodge, Wis.
A259
Location. Lat 44°07'55", long 91°33'10", in sec.10, T.19 N., R.10 W., near left bank on downstream side of highway bridge in Dodge, 9 miles upstream from mouth.
Drainage area. 643 sq mi.
Gage-height record. Wire-weight gage read twice daily. Graph drawn on basis of wire-weight gage readings and supplemented by crest gage readings during r : ses. Datum of gage is 663.42 ft above mean sea level, datum of 1929.
Discharge record. Stage-discharge relation defined by current-meter measursments below 15,000 cfs. Backwater from ice Mar. 1 to Apr. 6.
Maxima. March to May 1965: Discharge, 12,100 cfs 2200 hours Apr. 7 (gage height, 9.40 ft).
1913-19, 1934 to February 1965: Discharge, 17,400 cfs Apr. 4, 1956 (gage height, 10.35 ft).
Mean discharge, m cubic feet per second, 1965
Day
!_-.2...3...4...5...6...7...8...9...10..
March
600900
1,8004,0002,4001,8001,6001,5002,7002,400
April
260400600
1,0002,0005,0009,9709,9306,4704,280
May
520489487505505549559485428400
Day
11..12..13..14..15..16..17..18..19..20..
March
1,4001,000
800600500450400360330310
April
3,6703,4602,8401,9401,300
957796820809743
May
388361346331325357356400404359
Day
21..22..23..24..25..26..27..28..29..30..31..
Runoff, in in
March
290280270260260250250250240230240
9251.66
April
626595564583660
1,0101,030
826675571
May
327306293285278361507498458361323
2,146 4053.72 0.73
Gage height, m feet, and discharge, m cubic feet per second, at indicated time, 1965
Date
War. 1
2
3
Hour
00000600120018002400
0600120018002400
06001200160018002200
Gage height
1.802.203.104.104.32
4.284.284.404.70
5.106.007.107.708.10
Dis charge
Date
Mar. 3
4
5
6
Hour
2400
0600120018002400
060016009fiftn2400
0600080018002400
Gage height
8.15
8.108.007.807.15
6.857 9 CL
7 9H
6.80
6.306.256.505.70
Dis charge
Date
8
g
10
Hour
06002400
1200160018002400
120016002400
Gage height
c; on
5.805 25
5.106.00
6 957 207 206.84
6 S^6.60
6.21
Dis
charge
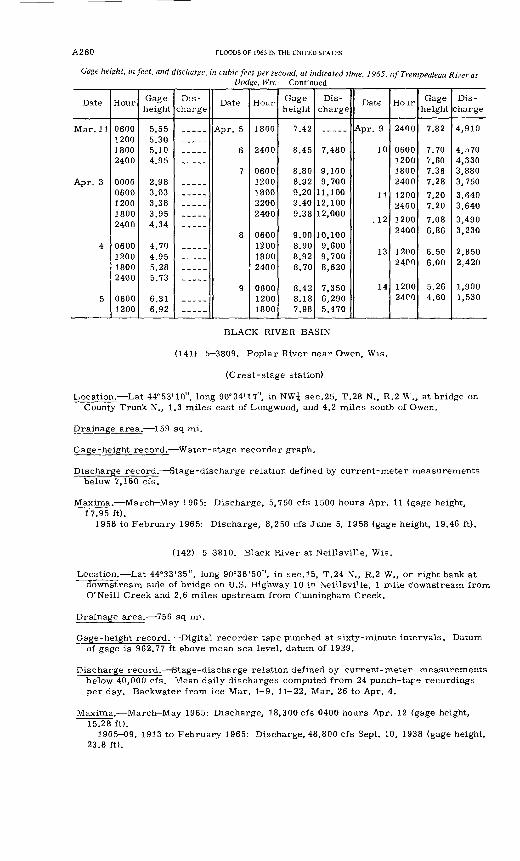
A260 TLOODS OF 1965 IN THE UNITED STATES
Gage height, in feet, and discharge, in cubic feet per second, at indicated time, 1965. of Trempealeau River atDodge, Wis. Continued
Date
Mar 1 1
4
5
Hour
0600120018002400
00000600120018002400
0600120018002400
06001200
Gage height
5.555.30
4.95
2.983.033.383.95A. ^A.
4.704.955.285.73
6.31i 6.92
Dis
chargeDate
6
7
8
9
Hour
1800
2400
0600 1200180022002400
0600 120018002400
0600 12001800
Gage height
7.42
8.45
8.80 8.929.209.409.38
9.00 8.908.928.70
8.42 8.187.98
Dis
charge
7,480
9,100 9,700
11,10012,10012,000
10,100 9,6009,7008,620
7,350 6,2905,470
Date
Apr. 9
10
11
.12
13,
14
Hour
2400
060012001800 2400
12002400
12002400
12002400
1200 24PO
Gage height
7.82
7.707.607.36 7.28
7.207.20
7.086.86
6.506.00
5.26 4.60
Dis
charge
4,910
4,5704,3303,880 3,750
3,640
3,4903,230
2,8502,420
1,900 1,530
BLACK RIVER BASIN
(141) 5 3809. Poplar River near Owen, Wis.
(Crest-stage station)
Location. Lat 44°53'10", long 90°34'17", in NW| sec.25, T.28 N., R.2 W., at bridge on County Trunk N., 1.3 miles east of Longwood, and 4.2 miles south of Owen.
Drainage area. 1 59 sq mi.
Gage-height record. Water-stage recorder graph.
Discharge record. Stage-discharge relation defined by current-meter measurements below 7,160 cfs.
Maxima. March May 1965: Discharge, 5,750 cfs 1500 hours Apr. 11 (gage height, 17.95 ft).
1958 to February 1965: Discharge, 8,250 cfs June 5, 1958 (gage height, 19.46 ft).
(142) 5-3810. Black River at Neillsville, Wis.
Location. Lat 44°33'35", long 90°36'50", in sec.15, T.24 N., R.2 W., or right bank at downstream side of bridge on U.S. Highway 10 in Neillsville, 1 mile downstream from O'Neill Creek and 2.6 miles upstream from Cunningham Creek.
Drainage area. 756 sq mi.
Gage-height record. Digital recorder tape punched at sixty-minute intervals. Datum of gage is 962.77 ft above mean sea level, datum of 1929.
Discharge record. Stage-discharge relation defined by current-meter measurements below 40,000 cfs. Mean daily discharges computed from 24 punch-tape recordings per day. Backwater from ice Mar. 1-9, 11-22, Mar. 26 to Apr. 4.
Maxima. March-May 1965: Discharge, 18,300 cfs 0400 hours Apr. 12 (gage height, 15.28 ft).
1905-09, 1913 to February 1965: Discharge, 48,800 cfs Sept. 10, 1938 (gage height, 23.8 ft).
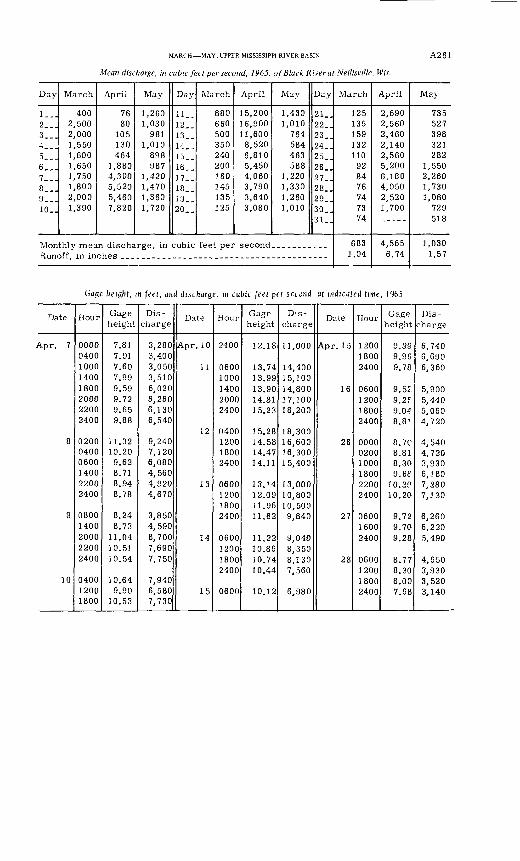
MARCH MAY, UPPER MISSISSIPPI RIVER BASIN
Mean discharge, in cubic feet per second, 1965, of Black River at Neillsville, Wis.
A261
Day
1...2...3...4...5___6...7...8...9...10..
March
4002,5002,0001,5501,6001,6501,7501,8002,0001,390
April
7680
105130464
1,8804,3005,5205,4607,820
May
1,2601,030
9811,010
898987
1,4201,4701,3601,720
Day
11..12..13..14..15. _16..17..18..19..20..
March
880660500350240200160145135125
April
15,20016,90011,6008,5206,8105,4504,0603,7903,6403,080
May
1,4301,010
764584463588
1,2201,3301,2601,010
Day
21..22..23..24..25..26..27..28..29..30..31..
Monthly mean Hisrharop in nnhin fept ner second
Runoff, in in
March
125135159132110
928476747374
6831.04
April
2,6902,5602,4602,1402,5605,2006,1804,0502,5201,700-----
4,5656.74
May
735527398321282
1,5502,2601,7301,080
729518
1,0301.57
Gage height, in feet, and discharge, m cubic feet per second, at indicated time, 1965
Date
Apr. 7
8
9
10
Hour
00000400100014001800200022002400
020004000600140022002400
08001400200022002400
040012001800
Gage height
7.817.917.607.999.599.729.659.88
11.3210.209.628.718.948.78
8.248.73
11.0410.5110.54
10.649.90
10.53
Dis charge
3,2803,4003,0503,5106,0206,2606,1306,540
9,2407,1206,0804,5604,9204,670
3,8504,5908,7007,6907,750
7,9406,5807,730
Date
Apr. 10
11
12
13
14
15
Hour
2400
06001000140020002400
0400120018002400
0600120018002400
0600120018002400
0600
Gage height
12.18
13.7413.9913.9014.8115.23
15.2814.5814.4714.11
13.1412.0911.9611.62
11.2210.8610.7410.44
10.12
Dis charge
11,000
14,40015,10014,80017,10018,200
18,30016,60016,30015,400
13,00010,80010,5009,840
9,0408,3508,1307,560
6,980
Date
Apr. 1 5
16
26
27
28
Hour
120018002400
0600120018002400
000002001000180022002400
060016002400
0600120018002400
Gage height
9.999.969.78
9.529.2f9.048.81
8.7C8.818.309.6f
10. 2P10.20
9.729.709.28
8.778.308.007.68
Dis charge
6,7406,6906,360
5,9005,4405,0604,720
4,5404,7203,9306,1807,2807,120
6,2606,2205,490
4,6503,9303,5203,140
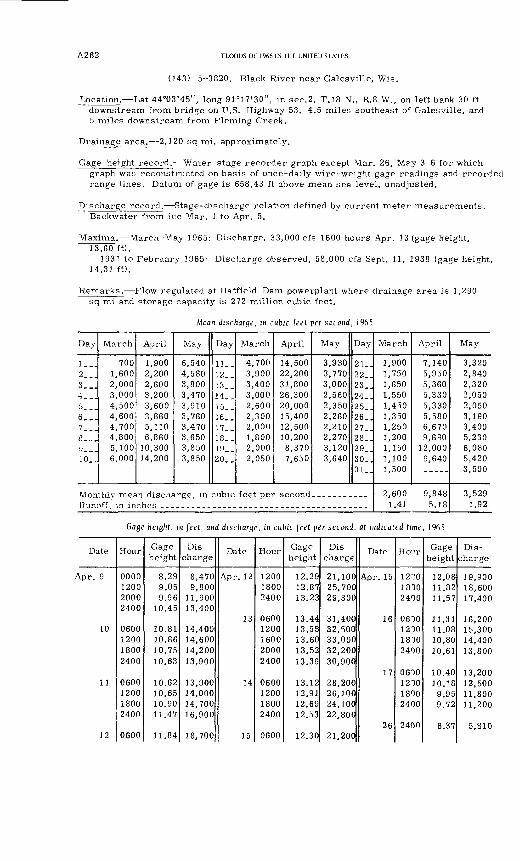
A262 FLOODS OF 1965 IN THE UNITED STATES
(143) 5-3820. Black River near Galesville, Wis.
Location. Lat 44°03'45", long 91°17'30", in sec.2, T.18 N., R.8 W., on left bank 30 ft downstream from bridge on U.S. Highway 53, 4.5 miles southeast or Galesville, and 5 miles downstream from Fleming Creek.
Drainage area. 2,120 sq mi, approximately.
Gage-height record. Water-stage recorder graph except Mar. 26, Mry 3 6 for which graph was reconstructed on basis of once-daily wire-weight gage readings and recorded range lines. Datum of gage is 658.43 ft above mean sea level, unadjusted.
Discharge record. Stage-discharge relation defined by current meter measurements. Backwater from ice Mar. 1 to Apr. 5.
Maxima. March-May 1965: Discharge, 33,000 cfs 1600 hours Apr. 13 (gage height, 13.60 ft).
1931 to February 1965: Discharge observed, 58,000 cfs Sept. 11, 1938 (gage height, 14.31 ft).
Remarks. Flow regulated at Hatfield Dam powerplant where drainage area is 1,290 sq mi and storage capacity is 272 million cubic feet.
Mean discharge, in cubic feet per second, 1965
Day
1...2...3...4. __5- -.6...7...£--.a___10..
March
7001,6002,0003,0004,5004,6004,7004,8005,1006,000
April
1,9002,2002,6003,2003,6003,8605,1106,860
10,30014,200
May
6,5404,5803,8003,4703,9103,7603,4703,6503,8503,850
Day
11--12__13__14__15. _16__17__18. _19..20__
March
4,7003,9003,4003,0002,6002,3002,0001,8002,0002,050
April
14,50022,20031,80026,30020,00015,40012,50010,2008,3707,650
May
3,9303,7703,0002,5602,3502,2602,2102,2703,1203,640
Day
21..22..23_.24_.25_.26_.27_.28_.29_.30..
Monthly mean discharge, in cubic feet per second. _._..____.Runoff in inches _--------_-.---__ _--.-.-_ _._ _ _______
March
1,9001,7501,6501,5501,4501,3501,2501,2001,1501,1001,500
April
7,1405,9505,3605,3305,3305,5806,6709,690
12,0009,640
2,600 9,8481.41 5.18
May
3,3202,8402,3202,0502,0503,1903,4005,2306,0805,4203,500
3,5291.92
Gage height, in feet, and discharge, in cubic feet per second, at indicated time, 1965
Date
i.pr. 9
10
11
12
Hour
0000120020002400
0600120018002400
0600120018002400
0600
Gage height
8.299.059.96
10.45
10.8110.8610.7510.63
10.6210.6510.9011.47
11.84
Dis charge
8,4709,800
11,90013,400
14,40014,60014,20013,900
13,90014,00014,70016,900
18,700
Date
Apr. 12
13
14
15
Hour
120018002400
06001200160020002400
0600120018002400
0600
Gage height
12.2912.8713.23
13.4413.5513.6013.5213.39
13.1212.9112.6912.53
12.30
Dis charge
21,10025,70029,300
31,40032,50033,00032,20030,900
28,20026,10024,10022,800
21,200
Date
Apr. 15
16
17
26
Ho-Jr
1270mo2400
0610121018102400
0600120018002400
2400
Gage height
12.0811.8211.57
11.3111.0810.8010.61
10.4010.189.959.72
6.37
Dis
charge
19,90018,60017,400
16,20015,30014,40013,800
13,20012,50011,80011,200
5,810
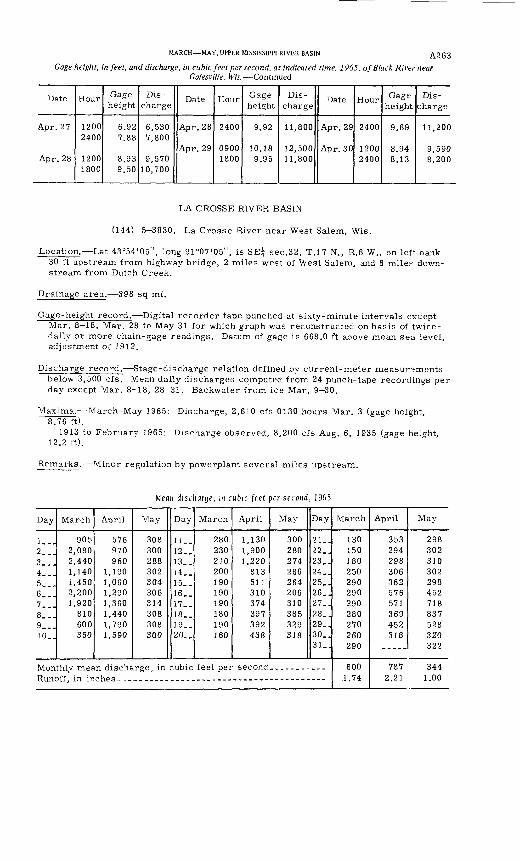
MARCH MAY, UPPER MISSISSIPPI RIVER BASIN A263
Gage height, in feet, and discharge, in cubic feet per second, at indicated time, 1965, of Black River near Galesville, Wis. Continued
Date
Apr. 27
Apr. 28
Hour
12002400
12001800
Gage height
6.927.88
8.939.50
Dis
charge
6,5307,800
9,57010,700
Date
Apr. 28
Apr. 29
Hour
2400
09001800
Gage height
9.92
10.189.95
Dis
charge
11,800
12,50011,800
Date
Apr. 29
Apr. 30
Hour-
2400
12002400
Gage height
9.69
8.948.13
Dis
charge
11,200
9,5908,200
LA CROSSE RIVER BASIN
(144) 5-3830. La Crosse River near West Salem, Wis.
Location. Lat 43°54'05", long 91°07'05", is SE| sec.32, T.17 N., R.6 W., on lef*. bank 30 ft upstream from highway bridge, 2 miles west of West Salem, and 6 miles down stream from Dutch Creek.
Drainage area. 398 sq mi.
Gage-height record. Digital recorder tape punched at sixty-minute intervals except Mar. 8 18, Mar. 28 to May 31 for which graph was reconstructed on basis of twice- daily or more chain-gage readings. Datum of gage is 668.0 ft above mean sea level, adjustment of 1912.
Discharge record. Stage-discharge relation defined by current-meter measurements below 3,500 cfs. Mean daily discharges computed from 24 punch-tape recordings per day except Mar. 8-18, 28-31. Backwater from ice Mar. 9-30.
Maxima. March-May 1965: Discharge, 2,610 cfs 0130 hours Mar. 3 (gage height, 8.76 ft).
1913 to February 1965: Discharge observed, 8,200 cfs Aug. 6, 1935 (gage height, 12.2 ft).
Remarks. Minor regulation by powerplant several miles upstream.
Mean discharge, in cubic feet per second, 1965
Day
1...2...3...4...5...6...7...8...9...10..
March
9052,0802,4401,1401,4502,2001,920
810600350
April
576970960
1,1901,0601,2901,3601,4401,7901,590
May
308300288302304306314308308300
Day
11..12..13..14..15..16..17..18..19..20..
March
280230210200190190190180190160
April
1,1301,9001,220
813511310374397392438
May
300280274266264206310385329318
Day
21..22..23_.24_.25..26..27..28..29..30..31..
Runoff, in in
March
130150180250290290290280270260290
600.1.74
April
353294298306362576571369452318
May
298302310302298452718837528320322
787 3442.21 1.00
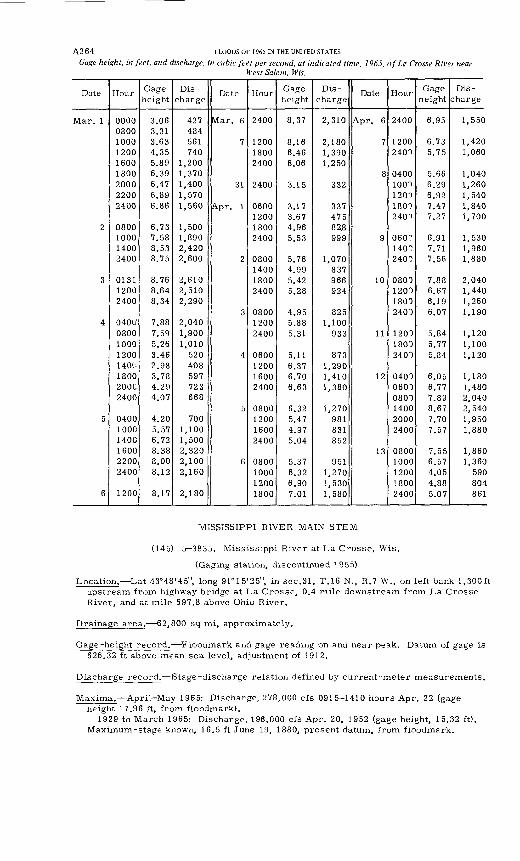
A2 64 FLOODS OF 1965 IN THE UNITED STATES
Gage height, in feet, and discharge, in cubic feet per second, at indicated time, 1965, of La Crosse River nearWest Salem, Wis.
Date
Mar. 1
2
3
4
5
6
Hour
000008001000120016001800200022002400
0800100014002400
013112002400
0400'08001000120014001800200C2400
040010001400160022002400
1200
Gage height
3.063.313.634.355.896.396.476.896.86
6.737.588.538.75
8.768.648.34
7.887.595.263.462.983.784.294.07
4.205.576.728.388.008.12
8.17
Dis
charge
427484561740
1,2001,3701,4001,5701,560
1,5001,8902,4202,600
2,6102,5102,290
2,0401,9001,010520408597723668
7001,1001,5002,3202,1002,160
2,180
Date
Mar. 6
7
31
Apr. 1
2
3
4
5
6
Hour
2400
120018002400
2400
0600120018002400
0800140018002400
080012002400
0600120016002400
0800120016002400
0800100012001800
Gage height
8.37
8.166.466.06
3.15
3.173.674.965.53
5.764.995.425.28
4.955.885.31
5.116.376.706.63
6.325.474.975.04
5.376.326.907.01
Dis
charge
2,310
2,1801,3901,250
332
337475828999
1,070837966924
8251,100933
8731,2901,4101,380
1,270981831852
9511,2701,5301,580
Date
Apr. 6
7
8
9
10
11
12
13
Hour
2400
12002401
04001001120118012401
060?140?240?
0800120018002400
120018002400
040006000800140020002400
08001000120018002400
Gage n eight
6.95
6.735.75
5.666.296.927.477.27
6.917.717.56
7.886.676.196.07
5.845.775.84
6.056.777.898.677.707.57
7.556.574.054.885.07
Dis
charge
1,550
1,4201,060
1,0401,2601,5401,8401,700
1,5301,9601,880
2,0401,4401,2601,190
1,1201,1001,120
1,1801,4802,0402,5401,9501,880
1,8601,360
590804861
MISSISSIPPI RIVER MAIN STEM
(145) 5-3835. Mississippi River at La Crosse, Wis.
(Gaging station, discontinued 1955)
Location. Lat 43°48'45", long 91°15'25", in sec.31, T.16 N., R.7 W., on left bank 1,300ft upstream from highway bridge at La Crosse, 0.4 mile downstream from La Crosse River, and at mile 697.8 above Ohio River.
Drainage area. 62,800 sq mi, approximately.
Gage-height record. Floodmark and gage reading on and near peak. Datum of gage is 626.32 ft above mean sea level, adjustment of 1912.
Discharge record. Stage-discharge relation defined by current-meter measurements.
Maxima. April-May 1965: Discharge, 278,000 cfs 0915-1410 hours Apr. 22 (gage height 17.96 ft, from floodmark).
1929 to March 1965: Discharge, 196,000 cfs Apr. 20, 1952 (gage height, 15.32 ft). Maximum-stage known, 16.5 ft June 19, 1880, present datum, from floodmark.
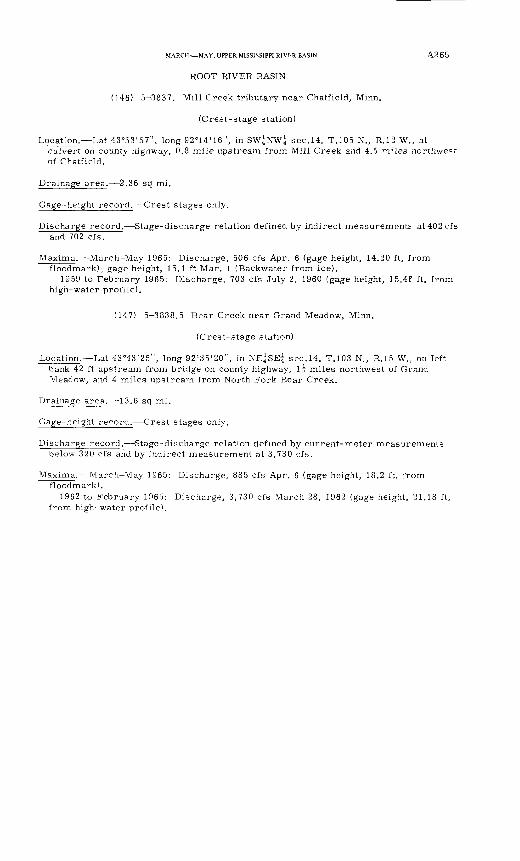
MARCH MAY, UPPER MISSISSIPPI RIVER BASIN A2 6 5
ROOT RIVER BASIN
(146) 5-3837. Mill Creek tributary near Chatfield, Minn.
(Crest-stage station)
Location. Lat 43°53'57 I ' ) long 92°14'16", in SW;fNWi sec.14, T.105 N., R.12 W., atculvert on county highway, 0.8 mile upstream from Mill Creek and 4.5 miles northwest of Chatfield.
Drainage area. 2.36 sq mi.
Gage-height record. Crest stages only.
Discharge record. Stage-discharge relation defined by indirect measurements at 402 cfs and 702 cfs.
Maxima. March-May 1965: Discharge, 506 cfs Apr. 6 (gage height, 14.20 ft, from floodmark); gage height, 15.1 ft Mar. 1 (Backwater from ice).
1959 to February 1965: Discharge, 703 cfs July 2, 1960 (gage height, 15.46 ft, from high-water profile).
(147) 5-3838.5 Bear Creek near Grand Meadow, Minn.
(Crest-stage station)
Location. Lat 43°43'25", long 92°35'20", in NE^SE^ sec.14, T.103 N., R.15 W., on left bank 42 ft upstream from bridge on county highway, ly miles northwest of Grand Meadow, and 4 miles upstream from North Fork Bear Creek.
Drainage area. 13.6 sq mi.
Gage-height record. Crest stages only.
Discharge record. Stage-discharge relation defined by current-meter measurements below 320 cfs and by indirect measurement at 3,730 cfs.
Maxima. March-May 1965: Discharge, 885 cfs Apr. 6 (gage height, 18.2 ft, from floodmark).
1962 to February 1965: Discharge, 3,730 cfs March 28, 1962 (gage height, 21.18 ft, from high-water profile).
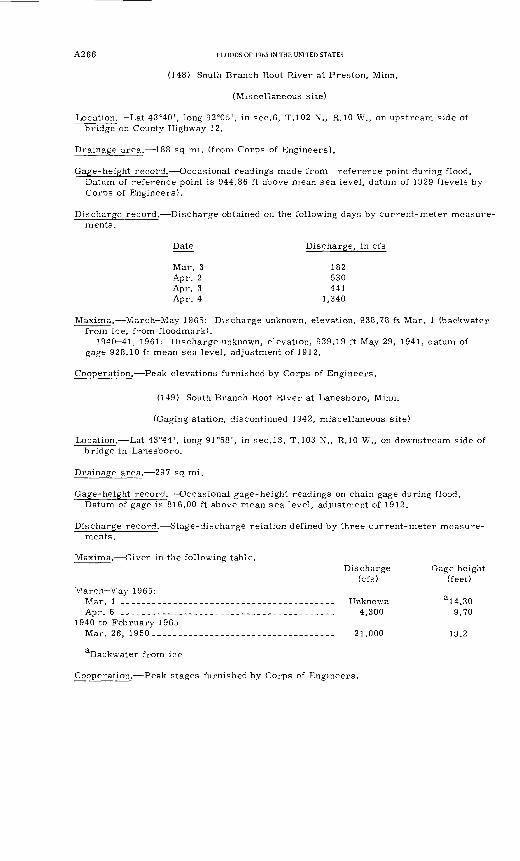
A266 FLOODS OF 1965 IN THE UNITED STATES
(148) South Branch Root River at Preston, Minn.
(Miscellaneous site)
Location. Lat 43°40', long 92°05', in sec.6, T.102 N., R.10 W., on upstream side of bridge on County Highway 12.
Drainage area. 188 sq mi. (from Corps of Engineers).
Gage-height record. Occasional readings made from reference point during flood. Datum of reference point is 944.86 ft above mean sea level, datum of 1929 (levels by Corps of Engineers).
Discharge record. Discharge obtained on the following days by current-meter measure ments.
Date Discharge, in cfs
Mar. 3 182Apr. 2 530Apr. 3 441Apr. 4 1,340
Maxima. March May 1965: Discharge unknown, elevation, 938.78 ft Mar. 1 (backwater from ice, from floodmark).
1940^1, 1961: Discharge unknown, elevation, 939.19 ft May 29, 1941, datum of gage 928.10 ft mean sea level, adjustment of 1912.
Cooperation. Peak elevations furnished by Corps of Engineers.
(149) South Branch Root River at Lanesboro, Minn.
(Gaging station, discontinued 1942, miscellaneous site)
Location. Lat 43°44', long 91°58', in sec.13, T.103 N., R.10 W., on downstream side of bridge in Lanesboro.
Drainage area. 297 sq mi.
Gage-height record. Occasional gage-height readings on chain gage during flood. Datum of gage is 816.00 ft above mean sea level, adjustment of 1912.
Discharge record. Stage-discharge relation defined by three current-meter measure ments.
Maxima. Given in the following table.Discharge Gage height
(cfs) (feet) March-May 1965:
Mar. 1 __-__-_---_-_---__--____---__--_-_---_--_ Unknown a !4.30Apr. 6 ..--_----------_.---_-_---_-.--------..-_ 4,300 9.70
1940 to February 1965Mar. 26, 1950 ................................... 21,000 19.2
aBackwater from ice
Cooperation. Peak stages furnished by Corps of Engineers.
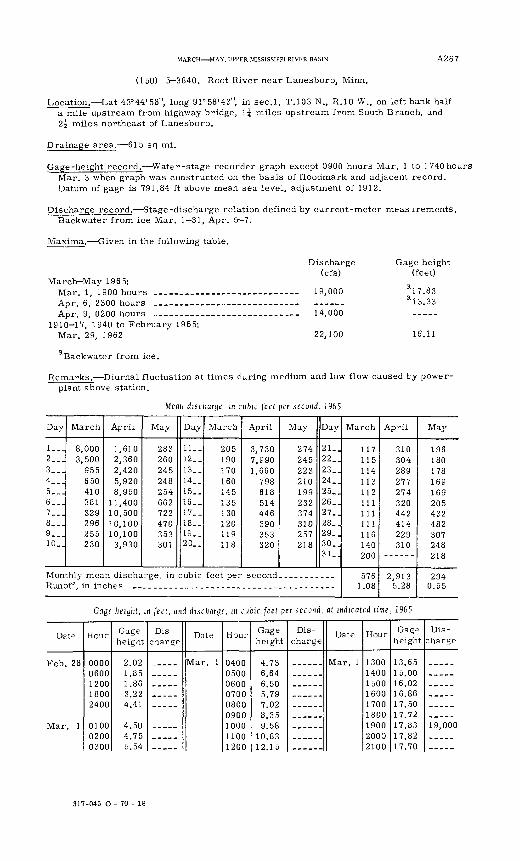
MARCH MAY, UPPER MISSISSIPPI RIVER BASIN
(150) 5 3840. Root River near Lanesboro, Minn.
A267
Location. Lat 43°44'58", long 91°58'43", in sec.l, T.103 N., R.10 W., on left bank half a mile upstream from highway bridge, 1^ miles upstream from South Branch, and 2\ miles northeast of Lanesboro.
Drainage area. 615 sq mi.
Gage-height record. Water-stage recorder graph except 0900 hours Mar. 1 to 1740 hours Mar. 3 when graph was constructed on the basis of floodmark and adjacent record. Datum of gage is 791.84 ft above mean sea level, adjustment of 1912.
Discharge record. Stage-discharge relation defined by current-meter meas irements. Backwater from ice Mar. 1 31, Apr. 5 7.
Maxima. Given in the following table.
Discharge(cfs)
March-May 1965:Mar. 1, 1900 hours ------ 19,000Apr. 6, 2300 hours _-_ -- -- -- Apr. 9, 0200 hours .__-___._._-._____._ __- 14,000
1910-17, 1940 to February 1965:Mar. 29, 1962 22,100
aBackwater from ice.
Gage height (feet)
a 17.83 a !3.33
16.11
Remarks. Diurnal fluctuation at times during medium and low flow caused by power- plant above station.
Mean discharge, in cubic feet per second, 1965
Day
1...2___3...4...5___6...7...8...9...10..
March
8,0003,500
955650410381329296255230
April
1,6102,3602,4205,9208,950
11,40010,50010,10010,100
3,930
May
283260245248254662722470353301
Day
11..12..13..14..15..16..17. _18..19..20..
March
205190170160145135130120119118
April
3,7307,9901,660
798618514446390353320
May
274245223210199232374310257218
Day
21..22..23..24..25..26..27..28..29..30..31
Monthly mean discharge, in cubic feet per second. __.. ..--_-Runoff, in in
March
117115114113112111111111116140200
5761.08
April
310304289277274320442414229310
2,9135.28
May
196180178169169205432482307248
2940.55
Gage height, in feet, and discharge, in cubic feet per second, at indicated time, 1965
Date
Feb. 28
Mar 1
Hour
00000600120018002400
010002000300
Gage height
2 021.851.863 22
4.504.755.54
Dis
chargeDate
Mar. 1
Hour
040005000600070008000900100011001200
Gage height
4 736.646.505 797.028.359.58
10.8312.15
Dis
chargeDate
Mar. 1
Hour
130014001500160017001800190020002100
Gage height
13.6515.0016.0216.8617.5017.7217.8317.8217.70
Dis
charge
19,000
317-045 O - 70 - 18
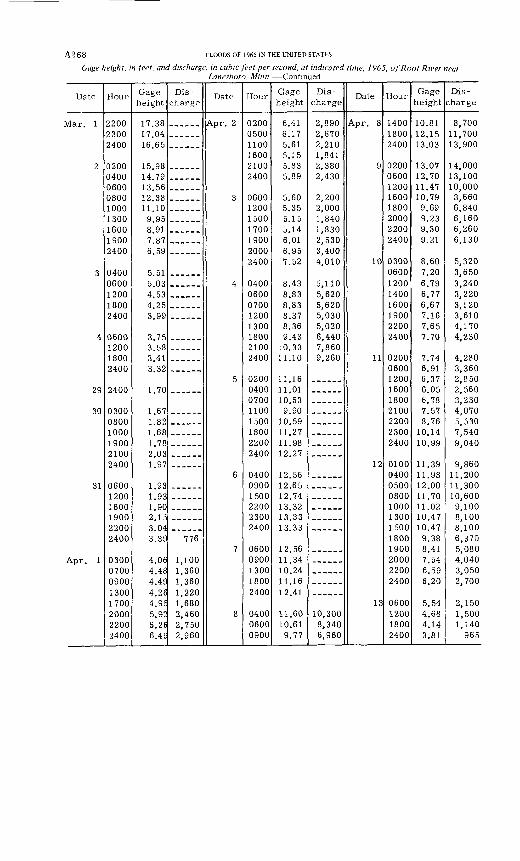
A268 FLOODS OF 1965 IN THE UNITED STATES
Gage height, in feet, and discharge, in cubic feet per second, at indicated time, 1965, of Root River near Lanesboro, Minn. Continued
Date
Mar. 1
2
3
4
29
30
31
Apr. 1
Hour
220023002400
020004000600080010001300160019002400
04000600120018002400
0600120018002400
2400
030008001000190021002400
060012001600190099nn2400
03000700090013001700 2000 2200 2400
Gage height
17.3817.0416.65
15.9814.7913.5612.3811.109.958.917.876.59
5.515.034.534.253.99
3.753.583.413.32
1.70
1.671.821.681.782 031.97
1.931 931 90215) ? nd.3.39
4.064.484.49A 9fi
4.95 5.92 6.26 6.4E
Dis
charge
776
1,1001,3601,3601,2201,680 2,460 2,750 2,960
Date
Apr. 2
3
4
5
6
7
8
Hour
0200050011001600 21002400
0600120015001700190020002400
04000600070012001300 180021002400
02000400070011001500180022002400
040009001500220099nn2400
06000900130018002400
0400 0600 0900
Gage height
6.416.175.615.15 5.835.89
5.605.355.155.146.016.957.52
8.438.838.838.378.36 9.43
10.3311.10
11.0110.539.90
10.5911.2711.9812.27
12.5612.6512.7413.32133313.33
12.5611.3410.2411.1612.41
11.60 10.619.77
Dis
charge
2,8902,6702,2101,841 2,3802,430
2,2002,0001,8401,8302,5303,4004,010
5,1105,6205,6205,0305,020 6,4407,8609,260
10,300 8,340 6,960
Date
Apr. 8
9
10
11
12
13
Hour
140018002400
02000600120016001800200022002400
0300 060012001400160019002200 2400
020006001200160018002100220023002400
01000400050008001000130015001800 1900200022002400
0600 1200 1800 2400
Gage height
10.8112.1513.03
13.0712.7011.4710.799.699.239.309.21
8.60 7.206.796.776.677.167.65 7.70
7.746.916.376.056.787.578.76
10.1410.99
11.3911.9812.0011.7011.0210.4710.479.38 8.417.546.596.20
5.54 4.68 4.14 3.81
Dis
charge
8,70011,70013,900
14,00013,10010,0008,6606,8406,1606,2606,130
5,320 3,6503,2403,2203,1203,6104,170 4,230
4,2803,3602,8502,5603,2304,0705,5307,5409,040
9,86011,20011,30010,6009,1008,1008,1006,370 5,0804,0403,0502,700
2,150 1,500 1,140 965
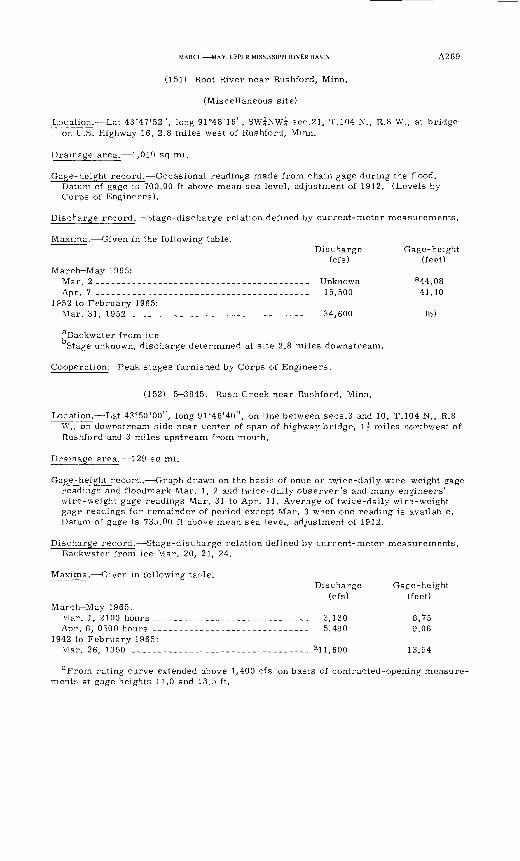
MARCH MAY, UPPER MISSISSIPPI RIVER BASIN A269
(151) Root River near Rushford, Minn.
(Miscellaneous site)
Location. Lat 43°47'52", long 91°48'16", SW^NW? sec.21, T.104 N., R.8 W., at bridge on U.S. Highway 16, 2.8 miles west of Rushford, Minn.
Drainage area. 1,010 sq mi.
Gage-height record. Occasional readings made from chain gage during the flood. Datum of gage is 700.00 ft above mean sea level, adjustment of 1912. (Levels by Corps of Engineers).
Discharge record. Stage-discharge relation defined by current-meter measurements.
Maxima. Given in the following table.Discharge Gage-height
(cfs) (feet) March-May 1965:
Mar. 2----------_---------__--------_---------- Unknown a44.08Apr. 7 ......................................... 15,500 41.10
1952 to February 1965:Mar. 31, 1952 _-_____-_.____._--._-___-----_-_-- 34,600 (b)
aBackwater from ice Stage unknown, discharge determined at site 2.8 miles downstream.
Cooperation: Peak stages furnished by Corps of Engineers.
(152) 5-3845. Rush Creek near Rushford, Minn.
Location. Lat 43°50'00", long 91°46'40", on line between sees.3 and 10, T.104 N., R.8 W., on downstream side near center of span of highway bridge, if miles northwest of Rushford and 3 miles upstream from mouth.
Drainage area. 129 sq mi.
Gage-height record. Graph drawn on the basis of once or twice-daily wire-weight gage readings and floodmark Mar. 1, 2 and twice-daily observer's and many engineers' wire-weight gage readings Mar. 31 to Apr. 11. Average of twice-daily wir3-weight gage readings for remainder of period except Mar. 3 when one reading is available. Datum of gage is 735.00 ft above mean sea level, adjustment of 1912.
Discharge record. Stage-discharge relation defined by current-meter measurements. Backwater from ice Mar. 20, 21, 24.
Maxima. Given in following table.Discharge Gage-height
(cfs) (feet) March-May 1965:
Mar. 1, 2100 hours------------------------------ 3,130 8.75Apr. 6, 0500 hours ------------------------------ 5,490 9.06
1942 to February 1965:Mar. 26, 1950 ---------------------------------- all,600 13.54
aFrom rating curve extended above 1,400 cfs on basis of contracted-opening measure ments at gage heights 11.0 and 13.5 ft.
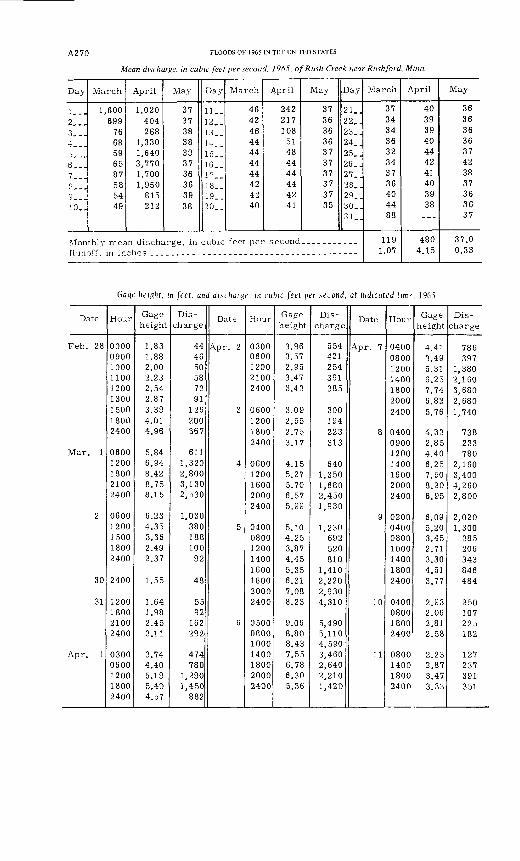
A2 70 FLOODS OF 1965 IN THE UNITED STATES
Mean discharge, in cubic feet per second. 1965, of Rush Creek near Rush ford. Minn.
Day
!_--2...3...4. , .^6...7 ,S,_j9...10., H
March
1,600699
7668596587585449
April
1,020404268
1,3301,6403,7701,7001,950
815212
May
37373838393736363938
Monthly mean discharge, inRunoff, in in
Day
11..12..13..14..15..16..17..18..19..20..
March
46424644444444424240
April
242217108
51484444444241
May
37363636373737373735
Day
21..22..23..24..25..26..27..28..29..30..31..
cubic feet per second.. __.._____ches
March
3734343632343736404488
1191.07
April
40393940444241403938---
4804.15
May
3636363637423837363637
37.00.33
Gage height, m feet, and discharge, m cubic feet per second, at indicated timr, 1965
Date
Feb. 28
Mar. 1
2
30
31
Apr. 1
Hour
000009001000110012001300150018002400
06001200180021002400
06001200150018002400
2400
1200180021002400
03000600120018002400
Gage height
1.831.882.002.232.542.873.394.014.96
5.846.948.428.758.15
6.234.353.362.492.37
1.55
1.641.982.453.11
3.744.405.195.404.57
Dis
charge
444650587291
126200367
6111,3202,8003,1302,530
1,03038018810092
48
5592
162292
474780
1,2901,450882
Date
Apr. 2
3
4
5
6
Hour
03000600120021002400
0600120018002400
06001200160020002400
04000800120014001600180020002400
0500080010001400180020002400
Gage height
3.963.572.953.473.43
3.092.552.753.17
4.155.275.706.575.99
5.104.253.874.455.356.317.088.23
9.068.808.437.556.786.305.36
Dis
charge
554421254391385
300194223313
6401,3501,6802,4501,930
1,230692520810
1,4102,2202,9304,310
5,4905,1104,5903,4602,6402,2101,420
Date
Apr. 7
8
9
10
11
Hour
0400080012001400180020002400
0400090012001400160020002400
0200040008001000140018002400
0400080018002400
Gage height
4.413.495.316.257.746.825.76
4.332.854.406.257.508.206.95
6.095.203.452.713.304.513.77
2.932.062.812.58
0800 2.231400 2.871800 3.472400 3.33
Dis
charge
786397
1,3802,1603,6802,6801,740
738233780
2,1603,4004,2602,800
2,0201,300385206343846484
250107225182
127237391351
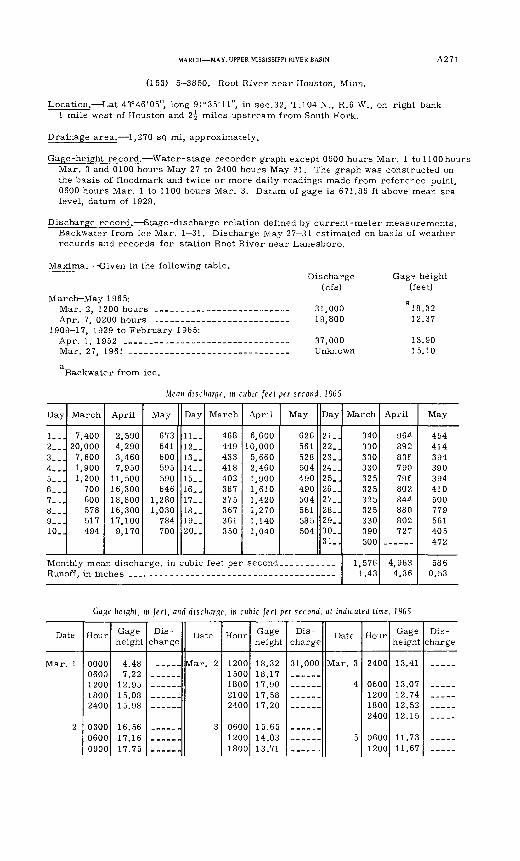
MARCH MAY, UPPER MISSISSIPPI RIVER BASIN A271
(153) 5-3850. Root River near Houston, Minn.
Location. Lat 43°46'05", long 91°35'll", in sec.32, T.104 N., R.6 W., on right bank 1 mile west of Houston and 2\ miles upstream from South Fork.
Drainage area. 1,270 sq mi, approximately.
Gage-height record. Water-stage recorder graph except 0600 hours Mar. 1 to 1100 hours Mar. 3 and 0100 hours May 27 to 2400 hours May 31. The graph was constructed on the basis of floodmark and twice or more daily readings made from reference point, 0600 hours Mar. 1 to 1100 hours Mar. 3. Datum of gage is 671.86 ft above mean sea level, datum of 1929.
Discharge record. Stage-discharge relation defined by current-meter measurements. Backwater from ice Mar. 1 31. Discharge May 27 31 estimated on basis of weather records and records for station Root River near Lanesboro.
Maxima. Given in the following table.
March-May 1965:
1909-17, 1929 to February 1965:
Mar. 27. 1961 _____ ._._. __ _ ___
Discharge (cfs)
_______ 31,000_____ 19,800
_______ 37,000_______ Unknown
Gag? height (feet)
a !8.3212.37
13.9015.10
Backwater from ice.
Mean discharge, m cubic feet per second, 1965
Day
!_..2...3...4...5...6...7...8...9...10..
March
7,40020,000
7,6001,9001,200
700600578517494
April
2,5904,2903,4607,950
11,50016,30018,80016,30017,1009,170
May
673641600595590646
1,2801,030
784700
Day
11..12_.13-.14__15.-16..17._18..19__20-.
March
468449433418402387375367361350
April
6,60010,000
5,6602,4601,9001,6101,4201,2701,1401,040
May
626561528504490490504561585504
Day
21..22..23..24..25..26..27..28..29..30_.31
Runoff, in in
March
340330330330325325325325330390500
1,5761.43
April
96*
892.sse79079f80284488080272V
4,9634.36
May
454414394390394410500779561405472
5860.53
Gage height, in feet, and discharge, in cubic feet per second, at indicated time, 1965
Date
Mar. 1
2
Hour
00000600120018002400
030006000900
Gage height
4.487.22
1 9 QC
15.0815.98
16.5617.1617.75
Dis
chargeDate
Mar. 2
3
Hour
12001500
21002400
060012001800
Gage height
18.3218.171 7 9017.58
15.6514.0313.71
Dis
charge
31,000
Date
Mar. 3
4
5
Hour
2400
0600120018002400
06001200
Gage height
13.41
13.0712.7412.5212.15
11.7311.67
Dis
charge
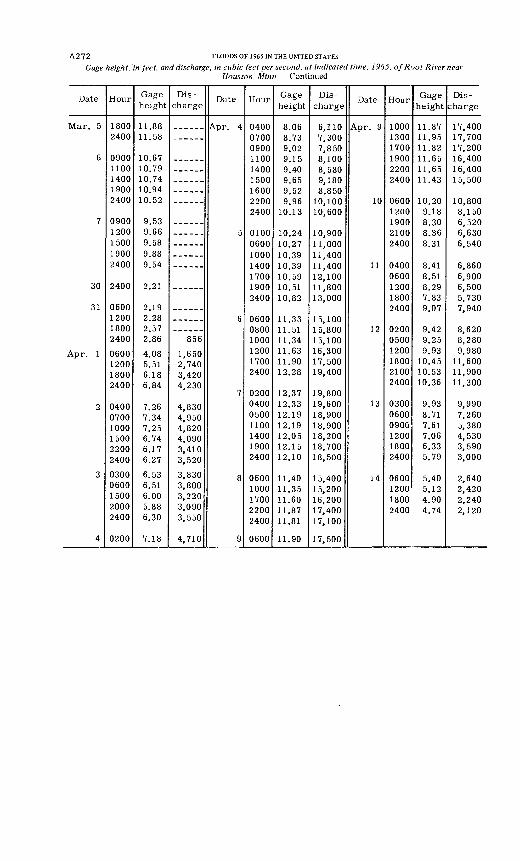
A272 FLOODS OF 1965 IN THE UNITED STATES
Gage heighten feet, and discharge, in cubic feet per second, at indicated time, 1965, of Root River near Houston, Minn. Continued
Date
Mar. 5
6
7
30
31
Apr. 1
2
3
4
Hour
18002400
09001100140019002400
09001200150019002400
2400
0600120018002400
0600120018002400
040007001000150022002400
03000600150020002400
0200
Gage height
11.8811.58
10.6710.7910.7410.9410.52
9.539.669.589.889.54
2 O1 . ^ 1
2.192.282.572.86
4.085.516.186.84
7.267.347.256.746.176.27
6.536.516.005.886.30
7.18
Dis
charge
856
1,6502,7403,4204,230
4,8304,9504,8204,0903,4103,520
3,8303,8003,2203,0903,550
4,710
Date
Apr. 4
5
6
7
8
9
Hour
040007000900110014001500160022002400
0100060010001400170019002400
060008001000120017002400
0200040005001100140019002400
06001000170022002400
0600
Gage height
8.068 r?Q
. IO
9.029.1 59 409.659 529 96
10.13
10.2410 2710.3910 3910.5910.5110.82
U ss.0011.5111.3411.6311.9012.28
12.3712.3312.1912.1912.0512.1512.10
11.4011.3511.6011.8711.81
11.90
Dis
charge
6,1107 snn1 , OUU
7,8508,1008,5809,1808.850
10,100 10,600
10,90011,000 11,40011,400 12,10011,80013,000
15,10015,80015,10016,30017,50019,400
19,80019,60018,90018,90018,20018,70018,500
15,40015,20016,20017,40017,100
17,500
Date
Apr. 9
10
11
12
13
14
Hour
100013001700190022002400
06001200190021002400
04000600120018002400
020005001200180021002400
030006000900120018002400
0600120018002400
Gage height
11.87119511.8211.6511.651 1 43
10.209.18S on .oU
8 0 c.00
8 0 1 .ol
8.418.518 297.839.07
9.429.259.93
10.4510.5310.36
9.938.717.617.066.335.79
5.405.124.904.74
Dis
charge
17,40017,70017,20016,40016,40015,500
10,8008,1506,5206,6306,540
6,8606,9006,5005,7307 Q4Di , y^u
8,620
8,280
9,980
11,60011,90011,300
9,9907,2605,3804,5303,5903,000
2,6402,4202,2402,120
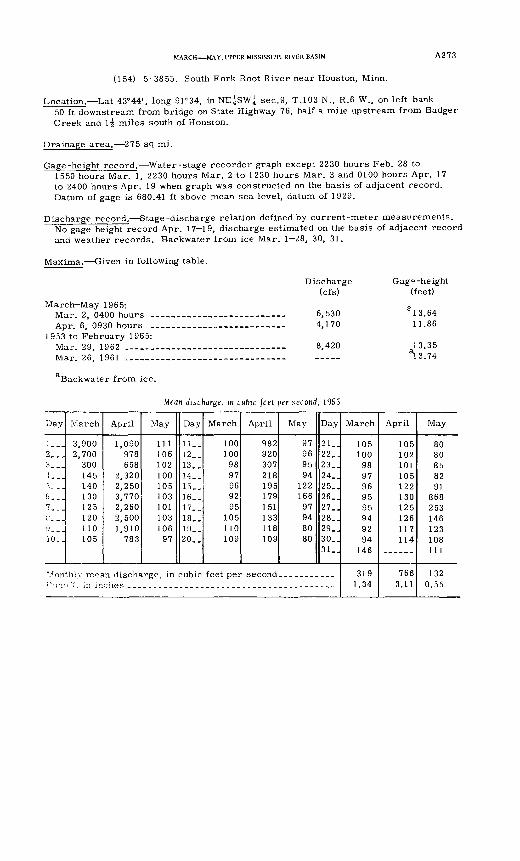
MARCH MAY, UPPER MISSISSIPPI RIVER BASIN A273
(154) 5-3855. South Fork Root River near Houston, Minn.
Location. Lat 43°44', long 91°34, in NE^SW^ sec.9, T.103 N., R.6 W., on left bank50 ft downstream from bridge on State Highway 76, half a mile upstream from Badger Creek and l| miles south of Houston.
Drainage area. 275 sq mi.
Gage-height record. Water-stage recorder graph except 2230 hours Feb. 28 to1550 hours Mar. 1, 2230 hours Mar. 2 to 1230 hours Mar. 3 and 0100 hours Apr. 17 to 2400 hours Apr. 19 when graph was constructed on the basis of adjacent record. Datum of gage is 680.41 ft above mean sea level, datum of 1929.
Discharge record. Stage-discharge relation defined by cur rent-meter measurements. No gage height record Apr. 17 19, discharge estimated on the basis of adjacent record and weather records. Backwater from ice Mar. 1 28, 30, 31.
Maxima. Given in following table.
March-May 1965:Mar. 2, 0400 hours - Apr. 6, 0930 hours _
1953 to February 1965: Mar. 29, 1962 ______Mar. 26, 1961 -_ -
Discharge (cfs)
6,5304,170
Gag0 -height (feet)
r !3.64 11.86
13.35 a!3.74
Backwater from ice.
Mean discharge, in cubic feet per second, 1965
Day
!_-.2...3...!...">. _.6__.7...t'-._j9..J10. J
March
3,9002,700300145140130125120110105
April
1,090978658
2,3202,2503,7702,2602,5001,910783
May
11110610210010510310110310697
Day
11_.12. _13. _14_.15__16. _17. _18..19-.20..
March
1001009897969295
105110109
April
982920307218195179151133118109
May
97969594
12216697948080
Day
21_.22_.23..24..25..26..27_.28..29..30..31
"Minof:'. in in
March
1051009897969595949294
146
3191.34
April
105102101105122130125126117114
7663.11
May
8080858291
868253146123108111
1320.55
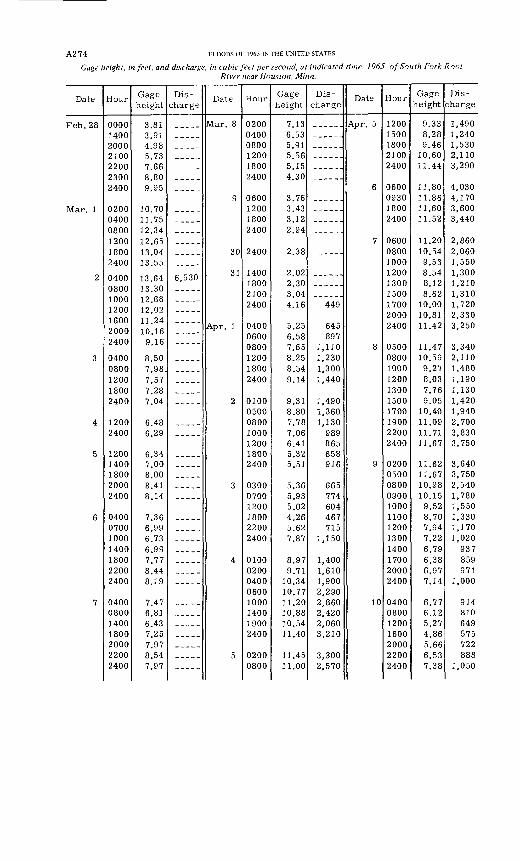
A2 74 FLOODS Or 1965 IN THE UNITED STATES
Gage height, in feet, and discharge, in cubic feet per second, at indicated time, 1965, of South Fork Root River near Houston, Minn.
Date
Feb. 28
Mar 1
2
3
4
5
6
7
Hour
00001400
2100220023002400
04000800120018002400
040008001000 1200 16002000 2400
04000800120018002400
12002400
12001400180020002400
0400070010001400180022002400
0400080014001800200022002400
Gage height
3 0 1
3 Q1
4.985 737.668 on
9.95
n 7K
12 3412.6513.0413.55
13.6413.3012.68 12.02 1 1 *)\10.16 9.16
8.507 937.577.287.04
6.486.29
7.008.008.418.14
7.366.996.736.997.778.448.19
7.476.816.437 257.978 547 97
Dis
charge
6,530_____
_____
-----
Date
Mar. 8
g
30
31
Apr. 1
2
3
4
5
Hour
020004000800120018002400
0600120018002400
2400
180021002400
0400 0600 0800 120018002400
01000500 080010001200 18002400
030007001200 180022002400
0100020004000600 1000140019002400
02000800
Gage height
7.136.535.915.56
4 30
3.763.433.122.94
2.38
2.022.303.044.16
5.25 6.58 7.65 8.258.549.14
9.318.80 7.787.066.41 5.325.51
5.365.935.02 4.265.627.87
8.979 71
10.3410.77 11.2010.8810.5411.40
11.4511.00
Dis
charge
449
645 897
1,110 1,2301,3001,440
1,4901,360 1,130989865 658916
665774604 467715
1,150
1,4001,6101,9002,290 2,860
2,0603,210
3,3002,570
Date
6
7
8
9
10
Hour
12001500180021002400
0600093018002400
0600080010001200130015001700 20002400
0500 080010001200130015001700 190022002400
02000500080009001000 1100120013001400170020002400
0400080012001600200022002400
Gage height
9.338.289.46
10.6011.44
11.8011.8611.6011.52
11.2010.549.538.548.128.62
10.00 10.8111.42
11.47 10.599.278.037.769.05
10.40 11.0911.7111.67
11.6211.6710.9810.159.52 8.707.947.226.796.386.977.14
6.776.125.274.865.666.537.38
Dis
charge
1,4901,2401,5302,1103,290
4,0304,1703,6003,440
2,8602,0601,5501,3001,2101,3101,720 2,3303,250
3,340 2,1101,4801,1901,1301,4201,940 2,7003,8303,750
3,6403,7502,5401,7801,550 1,3301,1701,020937859971
1,000
914810649
722888
1,050
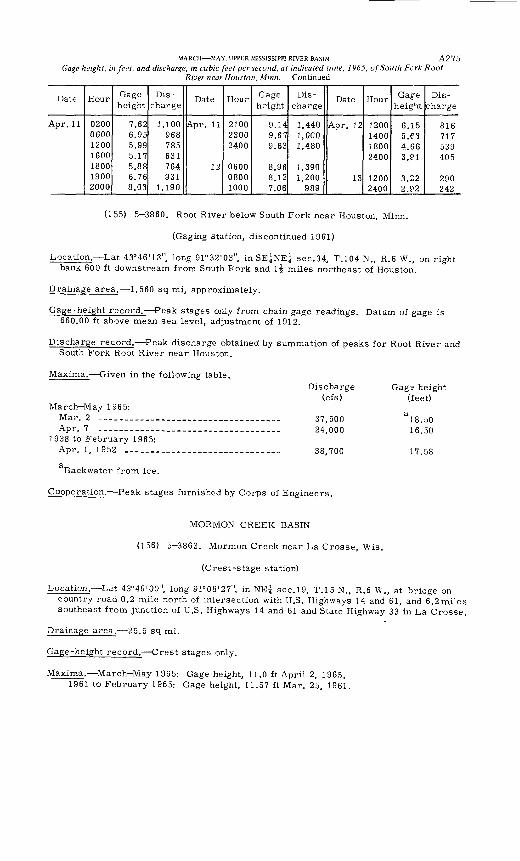
MARCH MAY, UPPER MISSISSIPPI RIVER BASIN A275
Gage height, in feet, and discharge, in cubic feet per second, at indicated time, 1965, of South Fork Root River near Houston, Minn. Continued
Date
Apr. 11
Hour
0200060012001600180019002000
Gage height
7.626.955.995.175.886.768.03
Dis charge
1,100968785631764931
1,190
Date
Apr. 11
12
Hour
210023002400
060008001000
Gage height
9.149.679.63
8.968.127.06
Dis
charge
1,4401,6001,480
1,3901,200
989
Date
Apr. 12
13
Hour
1200140018002400
12002400
Gafe height
6.155.634.663.?1
3.222.P2
Dis
charge
816717539405
290242
(155) 5-3860. Root River below South Fork near Houston, Minn.
(Gaging station, discontinued 1961)
Location. Lat 43°46'13", long 9r32'03", in SE{NE{ sec.34, T.104 N., R.6 W., on right bank 600 ft downstream from South Fork and l| miles northeast of Houston.
Drainage area. 1,560 sq mi, approximately.
Gage-height record. Peak stages only from chain gage readings. Datum of gage is 660.00 ft above mean sea level, adjustment of 1912.
Discharge record. Peak discharge obtained by summation of peaks for Root River and South Fork Root River near Houston.
Maxima. Given in the following table.
March-May 1965:Mar. 2 -._.___...Apr. 7 ._______._
1938 to February 1965:Apr. 1, 1952 ________
Discharge (cfs)
37,50024,000
______________ _________ 38,700
Backwater from ice.
Cooperation. Peak stages furnished by Corps of Engineers.
Gage height (feet)
a 18.5016.50
17.58
MORMON CREEK BASIN
(156) 5-3863. Mormon Creek near La Crosse, Wis.
(Crest-stage station)
Location. Lat 43°46'00", long 91°08'27", in NE^ sec.19, T.I 5 N., R.6 W., at bridge on country road 0.2 mile north of intersection with U.S. Highways 14 and 61, and 6.2 miles southeast from junction of U.S. Highways 14 and 61 and State Highway 33 in La Crosse.
Drainage area. 25.5 sq mi.
Gage-height record. Crest stages only.
Maxima. March-May 1965: Gage height, 11.0 ft April 2, 1965. 1961 to February 1965: Gage height, 11.57 ft Mar. 25, 1961.
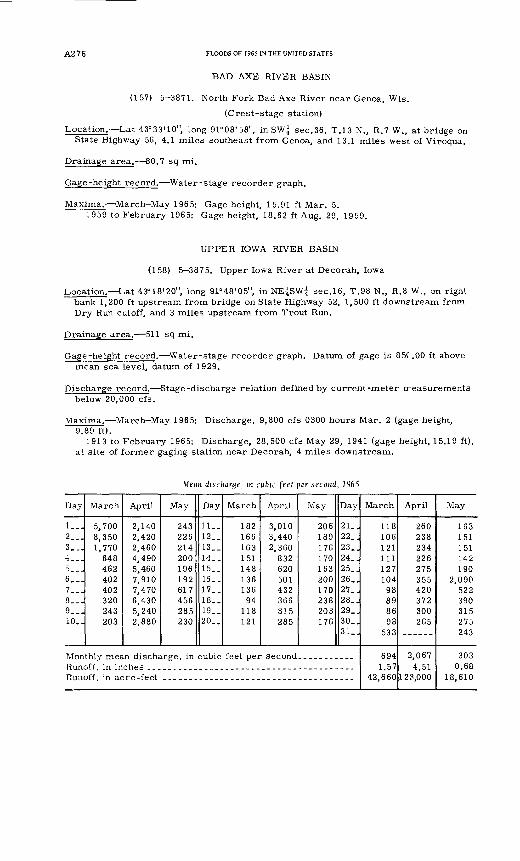
A276 FLOODS OF 1965 IN THE UNITED STATES
BAD AXE RIVER BASIN
(157) 5-3871. North Fork Bad Axe River near Genoa, Wis.
(Crest-stage station)
Location. Lat 43°33'10", long 91°08'58", in SW^ sec. 36, T.13 N., R.7 W., at bridge on State Highway 56, 4.1 miles southeast from Genoa, and 13.1 miles west of Viroqua.
Drainage area. 80.7 sq mi.
Gage -height record. Water-stage recorder graph.
Maxima. March- May 1965: Gage height, 15.91 ft Mar. 5.1959 to February 1965: Gage height, 18.62 ft Aug. 29, 1959.
UPPER IOWA RIVER BASIN
(158) 5-3875. Upper Iowa River at Decorah, Iowa
Location. Lat 43°18'20", long 91°48'05", in NE^SWi sec. 16, T.98 N., R.8 W., on right bank 1,200 ft upstream from bridge on State Highway 52, 1,500 ft downetream from Dry Run cutoff, and 3 miles upstream from Trout Run.
Drainage area. 511 sq mi.
Gage -height record. Water-stage recorder graph. Datum of gage is 85C.OO ft above mean sea level, datum of 1929.
Discharge record. Stage -discharge relation defined by current -meter rreasurements below 20,000 cfs.
Maxima. March-May 1965: Discharge, 9,800 cfs 0300 hours Mar. 2 (gage height, 9.89 ft).
1913 to February 1965: Discharge, 28,500 cfs May 29, 1941 (gage height, 15.19 ft), at site of former gaging station near Decorah, 4 miles downstream.
Mean discharge, in cubic feet per second, 1965
Day
1...2...3...4...5...6...7...8...9...10..
March
5,7008,3501,770
648462402402320243203
April
2,1402,4202,4604,4905,4607,9107,4706,4305,2402,880
May
243226214200196192617456285230
Day
11..12..13..14..15..16..17..18..19..20..
March
182166163151148136136
94118121
April
3,0103,4402,360
832620501432366315285
May
206189176170163200170238203176
Day
21..22..23..24..25..26..27..28..29_.30..31..
Runoff, in acre-feet _____________________________________
March
118106121111127104
98898698
CO 0
6941.57
42,660
April
260238234226275355420372300265
2,0674.51
123,000
May
163151151142190
2,090522390315275
3030.68
18,610
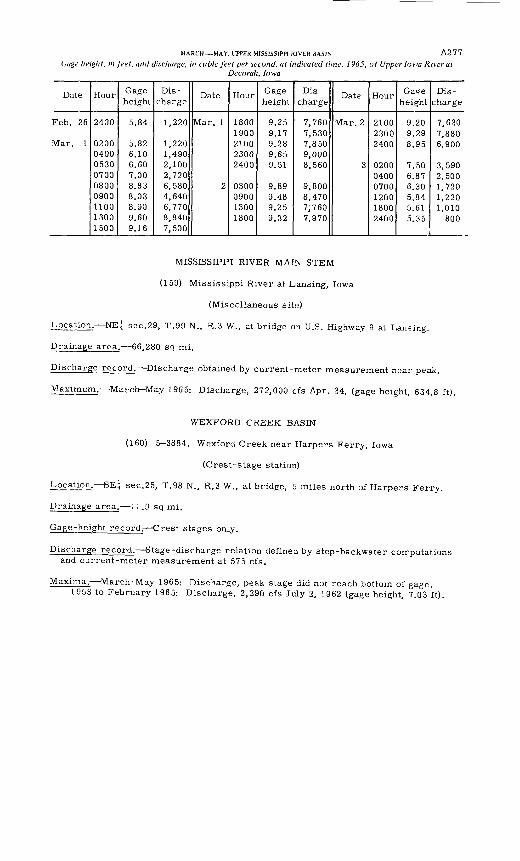
MARCH MAY, UPPER MISSISSIPPI RIVER BASIN A2 7 7
Gage height, in feet, and discharge, in cubic feet per second, at indicated time, 1965, of Upper Iowa River atDecorah, Iowa
Date
Feb. 28
Mar. 1
Hour
2400
020004000530070008000900110013001500
Gage height
5.84
5.826.106.607.008.838.038.909.609.16
Dis
charge
1,220
1,2201,4902,1002,7206,5804,6406,7708,8407,500
Date
Mar. 1
2
Hour
18001900210023002400
0300090013001800
Gage height
9.259.179.289.659.51
9.899.489.259.32
Dis
charge
7,7607,5307,8509,0008,560
9,8008,4707,7607,970
Date
Mar. 2
3
Hour
210023002400
020004000700120018002400
Gage height
9.209.298.95
7.506.876.305.845.615.35
Dis
charge
7,6207,8806,900
3,5902,5001,7201,2201,010
800
MISSISSIPPI RIVER MAIN STEM
(159) Mississippi River at Lansing, Iowa
(Miscellaneous site)
Location. NE^ sec.29, T.99 N., R.3 W., at bridge on U.S. Highway 9 at Lansing.
Drainage area. 66,280 sq mi.
Discharge record. Discharge obtained by current-meter measurement near peak.
Maximum. March-May 1965: Discharge, 272,000 cfs Apr. 24, (gage height, 634.8 ft).
WEXFORD CREEK BASIN
(160) 5-3884. Wexford Creek near Harpers Ferry, Iowa
(Crest-stage station)
Location. BE, sec.25, T.98 N., R.3 W., at bridge, 5 miles north of Harpers Ferry.
Drainage area. 11.9 sq mi.
Gage-height record. Crest stages only.
Discharge record. Stage-discharge relation defined by step-backwater computations and current-meter measurement at 575 cfs.
Maxima. March-May 1965: Discharge, peak stage did not reach bottom of gage. 1953 to February 1965: Discharge, 2,290 cfs July 2, 1962 (gage height, 7.03 ft).
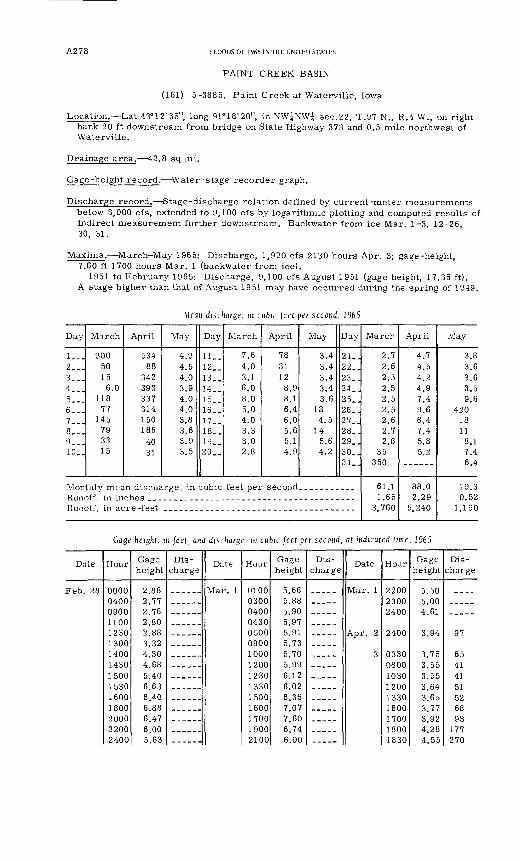
A278 FLOODS OF 1965 IN THE UNITED STATES
PAINT CREEK BASIN
(161) 5-3885. Paint Creek at Waterville, Iowa
Location. Lat 43°12'35", long 91°18'20", in NW|NW| sec.22, T.97 N., R.4 W., on right bank 20 ft downstream from bridge on State Highway 373 and 0.5 mile northwest of Waterville.
Drainage area. 42.8 sq mi.
Gage-height record. Water-stage recorder graph.
Discharge record. Stage-discharge relation defined by current-meter measurements below 3,000 cfs, extended to 9,100 cfs by logarithmic plotting and computed results of indirect measurement further downstream. Backwater from ice Mar. 1 3, 12 26, 30, 31.
Maxima. March-May 1965: Discharge, 1,920 cfs 2130 hours Apr. 3; gage-height, 7.60 ft 1700 hours Mar. 1 (backwater from ice).
1951 to February 1965: Discharge, 9,100 cfs August 1951 (gage height, 17.35 ft). A stage higher than that of August 1951 may have occurred during the spring of 1949.
Mean discharge, in cubic feet per second, 1965
Day
l._.2...3...4___5...6...7...8...9._.10..
March
90050156.0
11877
145793315
April
53488
342393337314150186
4031
May
4.94.54.03.94.04.03.83.63.93.5
Day
11..12..13..14..15. _16. _17..18_.19_.20..
March
7.64.03.16.08.05.04.03.33.02.8
April
7831128.98.16.46.05.65.14.9
May
3.43.43.43.43.6
184.5
145.64.2
Day
21..22..23..24..25..26..27..28..29..30..31..
Monthly mean discharge, in cubic feet per second.. _________Kunoff in inches __ ______Ruaofi, in acre -feet
March
2.72.62.52.52.52.52.62.72.8
35350
61.11.65
3,760
April
4.74.54.24.97.49.66.47.45.85.2
88.02.29
5,240
May
3.83.63.63.59.6
4201811
8.17.46.4
19.30.52
1,190
Gage height, in feet, and discharge, in cubic feet per second, at indicated time, 1965
Date
Feb. 28
Hour
00000400090011001 9 3D
13001400143015001530
1800200022002400
Gage height
2.882.772.762.802.883 0O
4.304.68
6.636.406.886.476.005.63
Dis
chargeDate Hour
0100030004000430
1000120012301330
1600170019002100
Gage height
5.665.885.905.975.91R 7^
5.705.996.126.026.367.077.606.746.00
Dis
chargeDate
Mar. 1
Aor 2
3
Hour
220023002400
2400
OQQO
0800103012001 3301600170018001830
Gage height
C C(\
5.004.61
3 94
q 7 c
3 553 553.643.653 773 924.284.55
Dis
charge
97
65414151526893
177270
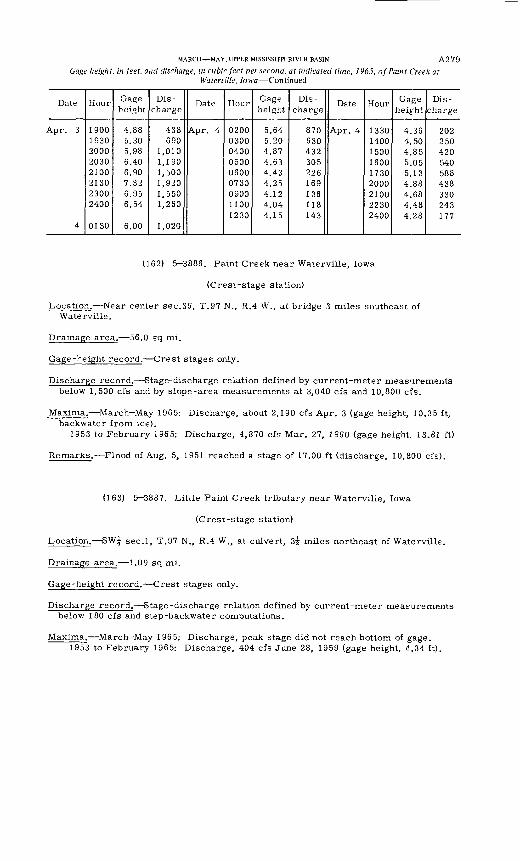
MARCH MAY,UPPER MISSISSIPPI RIVER BASIN A279
Gage height, in feet, and discharge, in cubic feet per second, at indicated time, 1965, of Paint Creek at Watenille, Iowa Continued
Date
Apr. 3
4
Hour
19001930200020302100213023002400
0130
Gage height
4.885.305.986.406.907.326.956.54
6.00
Dis charge
438690
1,0101,1901,5001,9201,5501,260
1,020
Date
Apr. 4
Hour
020003000400050006000730090011001230
Gageheight
5.645.204.874.634.434.254.124.044.15
Dis
charge
870630432305226169136118143
Date
Apr. 4
Hour
133014001500160017302000210022302400
Gage height
4.364.504.855.055.134.884.684.484.28
Dis
charge
202250420540588438330243177
(162) 5 3886. Paint Creek near Waterville, Iowa
(Crest-stage station)
Location. Near center sec.36, T.97 N., R.4 W., at bridge 3 miles southeast of Waterville.
Drainage area. 56.0 sq mi.
Gage-height record. Crest stages only.
Discharge record. Stage-discharge relation defined by current-meter measurements below 1,500 cfs and by slope-area measurements at 3,040 cfs and 10,800 cfs.
Maxima. March May 1965: Discharge, about 2,190 cfs Apr. 3 (gage height, 10.35 ft, backwater from ice).
1953 to February 1965: Discharge, 4,870 cfs Mar. 27, 1960 (gage height, 13.81 ft)
Remarks. Flood of Aug. 5, 1951 reached a stage of 17.00 ft (discharge, 10,800 cfs).
(163) 5 3887. Little Paint Creek tributary near Waterville, Iowa
(Crest-stage station)
Location. SW| sec.l, T.97 N., R.4 W., at culvert, si miles northeast of Waterville.
Drainage area. 1.09 sq mi.
Gage -height record. Crest stages only.
Discharge record. Stage -discharge relation defined by current-meter measurements below 180 cfs and step-backwater computations.
Maxima. March May 1965: Discharge, peak stage did not reach bottom of gage. 1953 to February 1965: Discharge, 404 cfs June 28, 1959 (gage height, 4.34 ft).
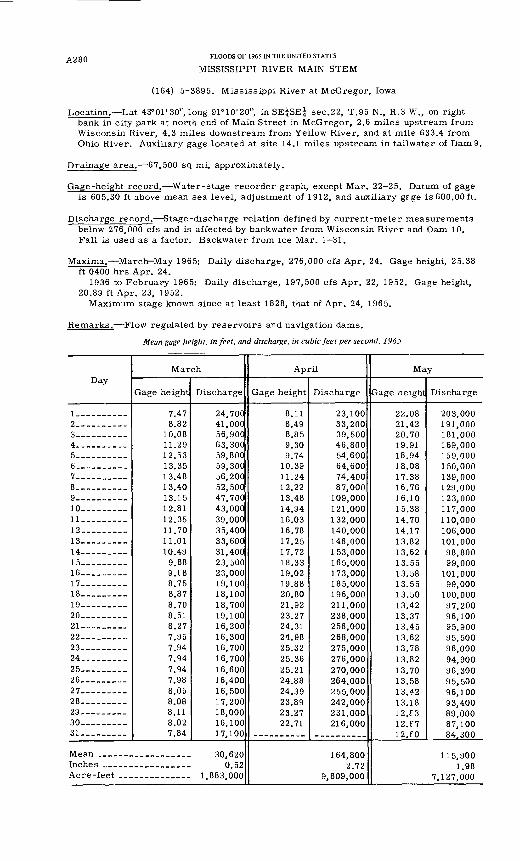
A280 FLOODS OF 1965 IN THE UNITED STATES
MISSISSIPPI RIVER MAIN STEM
(164) 5 3895. Mississippi River at McGregor, Iowa
Location. Lat 43°01'30", long 91°10'20", in SEjSEj sec.22, T.95 N., R.3 W., on right bank in city park at north end of Main Street in McGregor, 2.6 miles upstream from Wisconsin River, 4.3 miles downstream from Yellow River, and at mile 633.4 from Ohio River. Auxiliary gage located at site 14.1 miles upstream in tailwater of Dam 9.
Drainage area. 67,500 sq mi, approximately.
Gage-height record. Water-stage recorder graph, except Mar. 22 25. Datum of gage is 605.30 ft above mean sea level, adjustment of 1912, and auxiliary gfge is 600.00 ft.
Discharge record. Stage-discharge relation defined by current-meter measurements below 276,000 cfs and is affected by backwater from Wisconsin River and Dam 10. Fall is used as a factor. Backwater from ice Mar. 1 31.
Maxima. March-May 1965: Daily discharge, 276,000 cfs Apr. 24. Gag.; height, 25.38 ft 0400 hrs Apr. 24.
1936 to February 1965: Daily discharge, 197,500 cfs Apr. 22, 1952. Gage height, 20.89 ft Apr. 23, 1952.
Maximum stage known since at least 1828, that of Apr. 24, 1965.
Remarks. Flow regulated by reservoirs and navigation dams.
Mean gage height, in feet, and discharge, in cubic feet per second, 1965
Day
1. _ 23
5 _____ --_6 __________7 __________8 __________g10--- __ --_11 _________1 9
1314 _________15- - 16 _________17 - 18 _________19___- __ _-20 _________21- ________22 _- _9S
24--_ ______25 ___-26 ______27 _________28_- ____ __29 ___ __30- __ -_31 __ - ____
Mean -__
March
Gage height
7.47 8.82
10.08 11.29 12.53 13.35 13.48 13.40 13.15 12.81 12.35 11.70 11.01 10.49
9.88 9.18 8.75 8.87 8.70 8.51 8.27 7.95 7.94 7.94 7.94 7.98 8.05 8.08 8.11 8.02 7.84
Discharge
24,700 41,000 56,900 63,300 59,800 59,300 56,200 52,500 47,700 43,000 39,000 35,400 33,600 31,400 23,500 23,000 19,100 18,100 18,700 19,100 16,200 16,300 16,700 16,700 16,600 16,400 16,500 17,200 18,000 16,100 17,100
30,620 0.52
1,883,000
April
Gage height
8.11 8.49 8.85 9.30 9.74
10.39 11.24 12.22 13.48 14.94 16.03 16.78 17.25 17.72 18.33 19.02 19.88 20.80 21.92 23.27 24.31 24.98 25.32 25.36 25.21 24.88 24.39 23.89 23.27 22.71
Discharge
23,100 33,200 39,500 46,800 54,600 64,600 74,400 87,000
109,000 121,000 132,000 140,000 146,000 153,000 165,000 173,000 185,000 196,000 211,000 238,000 256,000 268,000 275,000 276,000 270,000 264,000 255,000 242,000 231,000 216,000
164,800 2.72
9,809,000
May
Gage height
22.08 21.42 20.70 19.91 18.94 18.08 17.38 16.76 16.10 15.38 14.70 14.17 13.82 13.62 13.55 13.58 13.55 13.50 13.42 13.37 13.45 13.62 13.78 13.82 13.70 13.58 13.42 13.18 12. f3 12. e?12. eo
Discharge
203,000 191,000 181,000 169,000 159,000 150,000 139,000 129,000 123,000 117,000 110,000 106,000 101,000 98,800 99,000
101,000 99,000
100,000 97,200 96,100 95,900 95,500 96,000 94,900 96,300 95,500 96,100 93,400 89,000 87,100 84,300
115,900 1.98
7,127,000
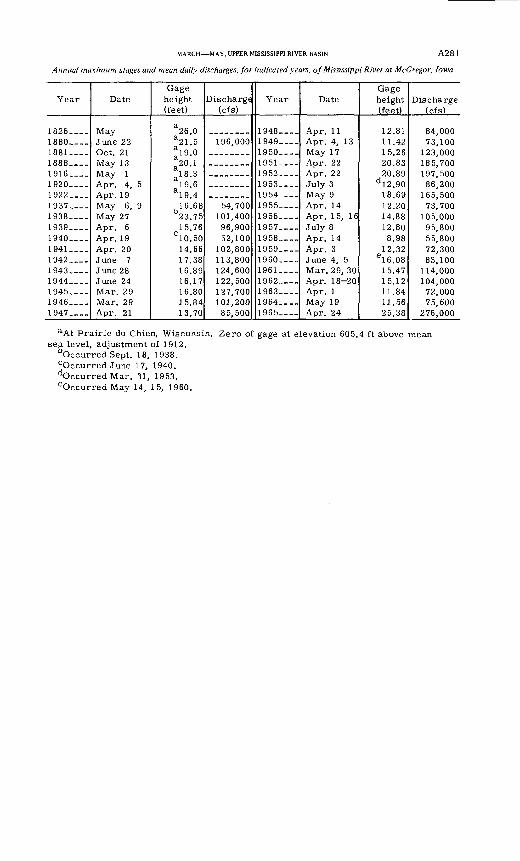
MARCH MAY, UPPER MISSISSIPPI RIVER BASIN A28 1
Annual maximum stages and mean daily discharges, for indicated years, of Mississippi River at McGregor. Iowa
Year
1826 ___1880 1881 -1888. 1916 __1920_--_1922 --1937. 1938- 1939. 1940- 1941 .___1942. 1943- 1944 --1945 --1946. 1947 ___
Date
MayJune 22Oct. 21May 13May 1Apr. 4, 5Apr. 19May 6, 9May 27Apr. 6Apr. 19Apr. 20June 7June 28June 24Mar. 29Mar. 29Apr. 21
Gage height (feet)
a26.0& 21.5a!9.0>.l
18.319.6
a !9.416.6823.7515.76
C 10.5014.6617.3816.8916.1716.8015.8413.70
Discharge (cfs)
196,000
________
54,700101,40096,90052,100
102,800113,800124,600122,500127,700101,20085,500
Year
1948 _-__1949 ____1950 .___1951 __1952 .___1953- __1954 .__1955----1956 .___1957. ___1958- ___1959 --1960 --1961 1962 ____1963 __ -1964 .___1965-
Date
Apr. 11Apr. 4, 13May 17Apr. 22Apr. 22July 3May 9Apr. 14Apr. 15, 16July 8Apr. 14Apr. 3June 4, 5Mar. 29, 30Apr. 18-20Apr. 1May 19Apr. 24
Gage height (feet)
12.8111.4215.2620.8320.89
d !2.9018.6912.2014.8812.808.98
12.32e !6.08
15.4715.1211.8411.5625.38
Discharge (cfs)
84,00073,100
123,000185,700197 50086,200
165,50073,700
105,00095,80055,80072,30083,100
114,000104,00072,00075,600
276,000
aAt Prairie du Chien, Wisconsin. Zero of gage at elevation 605.4 ft above mean sea level, adjustment of 1912.
"Occurred Sept. 18, 1938. cOccurred June 17, 1940. Occurred Mar. 31, 1953. eOccurredMay 14, 15, 1960.
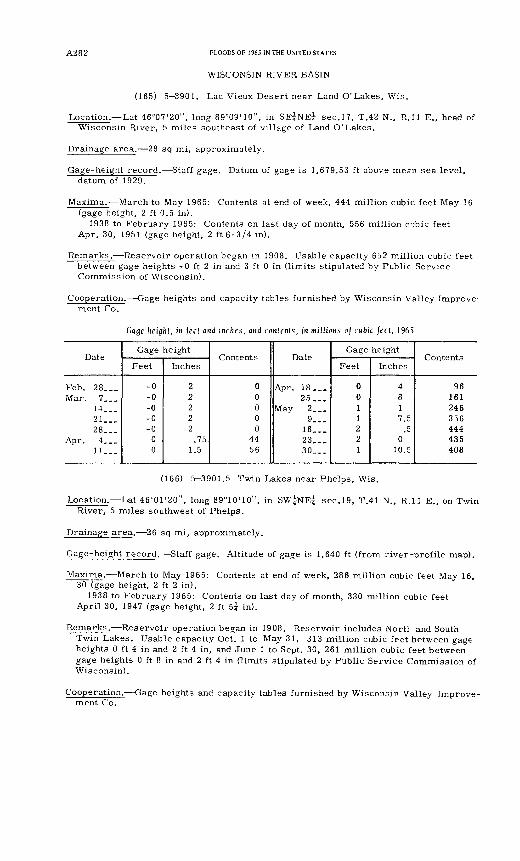
A282 FLOODS OF 1965 IN THE UNITED STATES
WISCONSIN RIVER BASIN
(165) 5-3901. Lac Vieux Desert near Land O'Lakes, Wis.
Location. Lat 46°07'20", long 89°09'10", in SEjNEj sec.17, T.42 N., R.ll E., head of Wisconsin River, 5 miles southeast of village of Land O'Lakes.
Drainage area. 28 sq mi, approximately.
Gage-height record. Staff gage. Datum of gage is 1,679.53 ft above meen sea level, datum of 1929.
Maxima.- March to May 1965: Contents at end of week, 444 million cubic feet May 16 (gage height, 2 ft 0.5 in).
1938 to February 1965: Contents on last day of month, 556 million c-jbic feet Apr. 30, 1951 (gage height, 2 ft 6-3/4 in).
Remarks.- Reservoir operation began in 1908. Usable capacity 652 million cubic feet between gage heights -0 ft 2 in and 3 ft 0 in (limits stipulated by Public Service Commission of Wisconsin).
Cooperation. Gage heights and capacity tables furnished by Wisconsin Valley Improve ment Co.
Gage height, in feet and inches, and contents, in millions of cubic feet, 1965
Date
Feb. 28...Mar. 7___
14___21...28...
Apr. 4...11...
Gage height
Feet
-0-0-0-0-0
00
Inches
22222
.751.5
Contents
00000
4456
Date
Apr. 18 ...25 ...
May 2...9...
16...23 ...30...
Gage height
Feet
0011221
Inches
4817.E
.£0
10. 5
Contents
96161246356444435408
(166) 5-3901.5 Twin Lakes near Phelps, Wis.
Location. Lat 46°01'20", long 89°10'10", in SWjNEj sec.19, T.41 N., R.ll E., on Twin River, 5 miles southwest of Phelps.
Drainage area. 26 sq mi, approximately.
Gage-height record. Staff gage. Altitude of gage is 1,640 ft (from river-profile map).
Maxima. March to May 1965: Contents at end of week, 286 million cubic feet May 16, 30 (gage height, 2 ft 2 in).
1938 to February 1965: Contents on last day of month, 330 million cubic feet April 30, 1947 (gage height, 2 ft 5? in).
Remarks. Reservoir operation began in 1908. Reservoir includes North and South Twin Lakes. Usable capacity Oct. 1 to May 31, 313 million cubic feet between gage heights 0 ft 4 in and 2 ft 4 in, and June 1 to Sept. 30, 261 million cubic feet between gage heights 0 ft 8 in and 2 ft 4 in (limits stipulated by Public Service Commission of Wisconsin).
Cooperation. Gage heights and capacity tables furnished by Wisconsin Valley Improve ment Co.
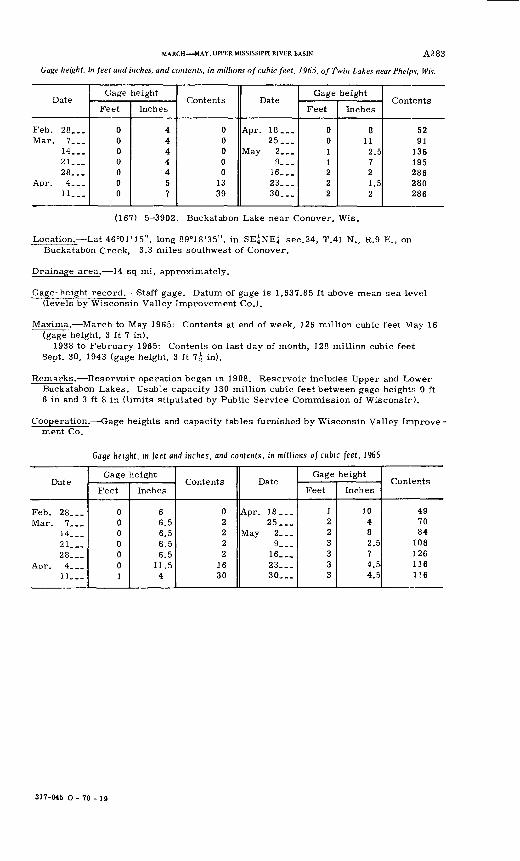
MARCH MAY .UPPER MISSISSIPPI RIVER BASIN A2 8 3
Gage height, in feet and inches, and contents, in millions of cubic feet, 1965, of Twin Lakes near Phelps, Wis.
Date
Feb. 28 __Mar. 7...
14...21...28...
Apr. 4___11. __
Gage height
Feet
0000000
Inches
4444457
Contents
00000
1339
Date
Apr. 18 ...25 __
May 2...9...
16...23...30 ...
Gage height
Feet
0011222
Inches
8112.5721.52
Contents
5291
136195286280286
(167) 5-3902. Buckatabon Lake near Conover, Wis.
Location. Lat 46°01'15", long 89°18'35", in SE?-NE;j sec.24, T.41 N., R.9 E., on Buckatabon Creek, 3.3 miles southwest of Conover.
Drainage area. 14 sq mi, approximately.
Gage-height record. Staff gage. Datum of gage is 1,637.85 ft above mean sea level (levels by Wisconsin Valley Improvement Co.).
Maxima. March to May 1965: Contents at end of week, 126 million cubic feet May 16 (gage height, 3 ft 7 in).
1938 to February 1965: Contents on last day of month, 128 million cubic feet Sept. 30, 1943 (gage height, 3 ft 7^ in).
Remarks. Reservoir operation began in 1908. Reservoir includes Upper and Lower Buckatabon Lakes. Usable capacity 130 million cubic feet between gage heights 0 ft 6 in and 3 ft 8 in (limits stipulated by Public Service Commission of Wisconsir).
Cooperation. Gage heights and capacity tables furnished by Wisconsin Valley Improve ment Co.
Gage height, in feet and inches, and contents, in millions of cubic feet, 1965
Date
Feb. 28 ...Mar. 7...
14...21...28...
Apr. 4...11 ...
Gage height
Feet
0000001
Inches
66.56.56.56.5
11.54
Contents
02222
1630
Date
Apr. 18...25...
May 2...9...
16...23 ...30 ...
Gage height
Feet
1223333
Inches
10482.574.54.5
Contents
497084
108126116116
317-045 O - 70 - 19
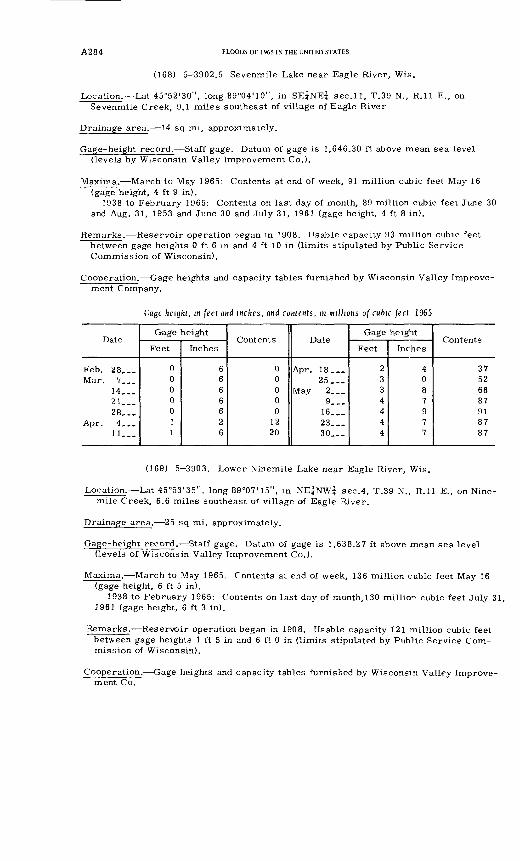
A284 FLOODS OF 1965 IN THE UNITED STATES
(168) 5-3902.5 Sevenmile Lake near Eagle River, Wis.
Location. Lat 45°52'30", long 89°04'10", in SE^NE? sec. 11, T.39 N., R.ll E., on Sevenmile Creek, 9.1 miles southeast of village of Eagle River
Drainage area. 14 sq mi, approximately.
Gage-height record. Staff gage. Datum of gage is 1,646.30 ft above mean sea level (levels by Wisconsin Valley Improvement Co.).
Maxima. March to May 1965: Contents at end of week, 91 million cubic feet May 16 (gage height, 4 ft 9 in).
1938 to February 1965: Contents on last day of month, 89 million cubic feet June 30 and Aug. 31, 1953 and June 30 and July 31, 1961 (gage height, 4 ft 8 in).
Remarks. Reservoir operation began in 1908. Usable capacity 93 million cubic feet between gage heights 0 ft 6 in and 4 ft 10 in (limits stipulated by Public Service Commission of Wisconsin).
Cooperation. Gage heights and capacity tables furnished by Wisconsin Valley Improve ment Company.
Gage height, in (eel and inches, and contents, in millions of cubic feet. 1965
Date
Feb. 28...Mar. 7, _
14,..21...28...
Apr. 4___11 __
Gage height
Feet
0000011
Inches
6666626
Contents
00000
1220
Date
Apr. 18...25 ...
May 2...9 __
16...23...30 ...
Gage height
Feet
2334444
Inches
4087977
Contents
37526687918787
(169) 5-3903. Lower Ninemile Lake near Eagle River, Wis.
Location. Lat 45°53'35", long 89 C07'15", in NE^NW? sec.4, T.39 N., R.ll E., on Nine- mile Creek, 6.6 miles southeast of village of Eagle River.
Drainage area. 25 sq mi, approximately.
Gage-height record. Staff gage. Datum of gage is 1,638.27 ft above mean sea level (levels of Wisconsin Valley Improvement Co.).
Maxima. March to May 1965: Contents at end of week, 136 million cubic feet May 16 (gage height, 6 ft 5 in).
1938 to February 1965: Contents on last day of month,l30 millio^ cubic feet July 31, 1961 (gage height, 6 ft 3 in).
Remarks. Reservoir operation began in 1908. Usable capacity 121 million cubic feet between gage heights 1 ft 5 in and 6 ft 0 in (limits stipulated by Public Service Com mission of Wisconsin).
Cooperation. Gage heights and capacity tables furnished by Wisconsin Valley Improve ment Co.
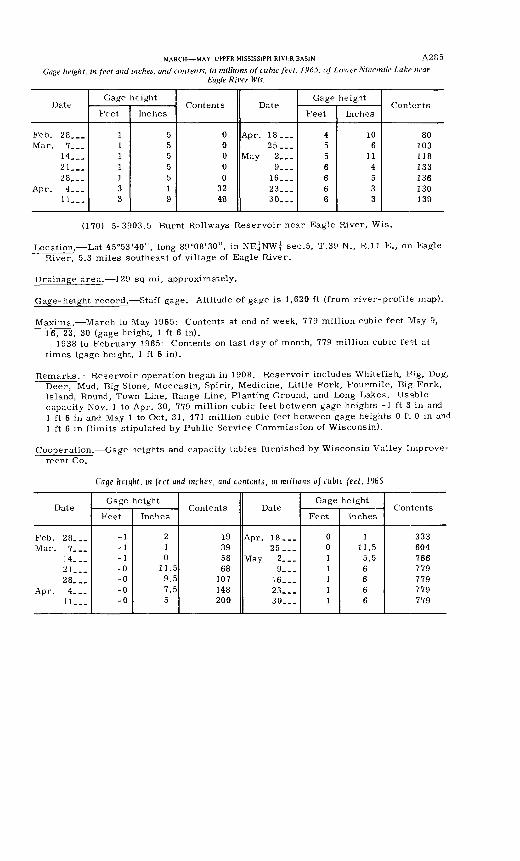
MARCH MAY, UPPFR MISSISSIPPI RIVER BASIN A285
Gage height, in feet and inches, and contents, in millions of cubic feet, 1965, of Lower Nincmile Lake nearEagle River Wis.
Date
Feb. 28...Mar. 7...
14...21...28...
Apr. 4...11. _.
Gage height
Feet
1111133
Inches
5555519
Contents
00000
3248
Date
Apr. 18...25...
May 2...9...
16...23...30 __
Gage height
Feet
4556666
Inches
106
114533
Contents
80103118133136130130
(170) 5 3903.5 Burnt Rollways Reservoir near Eagle River, Wis.
Location. Lat 45°53'40", long 89°08'30", in NE{NW{ sec.5, T.39 N., R.ll E., on Eagle River, 5.3 miles southeast of village of Eagle River.
Drainage area. 1 29 sq mi, approximately.
Gage-height record. Staff gage. Altitude of gage is 1,620 ft (from river-profile map).
Maxima. March to May 1965: Contents at end of week, 779 million cubic feet May 9, 16, 23, 30 (gage height, 1 ft 6 in).
1938 to February 1965: Contents on last day of month, 779 million cubic feet at times (gage height, 1 ft 6 in).
Remarks. Reservoir operation began in 1908. Reservoir includes Whitefish, Pig, Dog, Deer, Mud, Big Stone, Moccasin, Spirit, Medicine, Little Fork, Fourmile, Big Fork, Island, Round, Town Line, Range Line, Planting Ground, and Long Lakes. Usable capacity Nov. 1 to Apr. 30, 779 million cubic feet between gage heights -1 ft 3 in and 1 ft 6 in and May 1 to Oct. 31, 471 million cubic feet between gage heights 0 ft 0 in and 1 ft 6 in (limits stipulated by Public Service Commission of Wisconsin).
Cooperation. Gage heights and capacity tables furnished by Wisconsin Valley Improve
ment Co.
Cage height, in feet and inches, and contents, in millions of cubic feet, 1965
Date
Feb. 28...Mar. 7...
14...21 __28 ...
Apr. 4...11...
Gage height
Feet
-1-1-1-0-0-0-0
Inches
210
11.59.57.55
Contents
19395868
107148200
Date
Apr. 18...25 ...
May 2...9...
16 ...23 ...30 ...
Gage height
Feet
0011111
Inches
111.55.56666
Contents
333604766779779779779
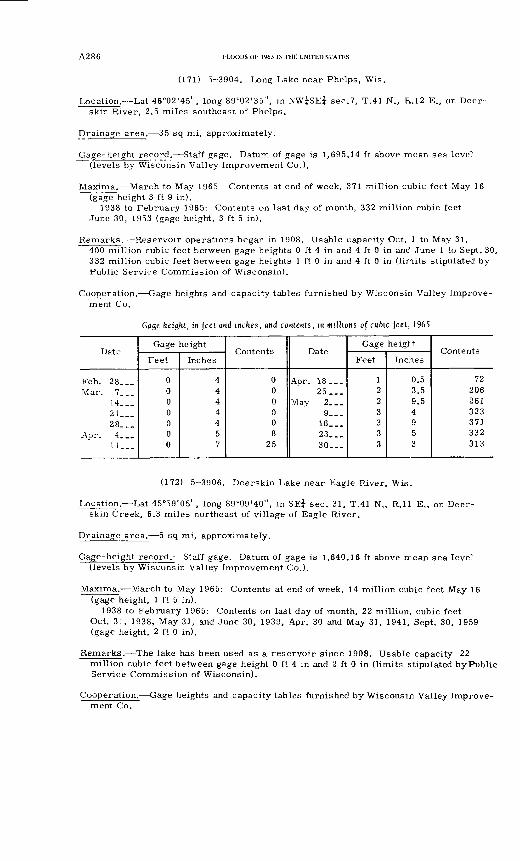
A286 FLOODS OF 1965 IN THE UNITED STATES
(171) 5-3904. Long Lake near Phelps, Wis.
Location. Lat 46°02'45", long 89°02'35", in NW^SEi sec.7, T.41 N., R..12 E., on Deer skin River, 2.5 miles southeast of Phelps.
Drainage area. 35 sq mi, approximately.
Gage-height record. Staff gage. Datum of gage is 1,695.14 ft above mean sea level (levels by Wisconsin Valley Improvement Co.).
Maxima. March to May 1965: Contents at end of week, 371 million cubic feet May 16 (gage height 3 ft 9 in).
1938 to February 1965: Contents on last day of month, 332 million cubic feet June 30, 1953 (gage height, 3 ft 5 in).
Remarks. Reservoir operations began in 1908. Usable capacity Oct. 1 to May 31,400 million cubic feet between gage heights 0 ft 4 in and 4 ft 0 in and June 1 to Sept. 30, 332 million cubic feet between gage heights 1 ft 0 in and 4 ft 0 in (limits stipulated by Public Service Commission of Wisconsin).
Cooperation. Gage heights and capacity tables furnished by Wisconsin Valley Improve ment Co.
Gage height, in (eel and inches, and contents, in millions of cubic feet, 1965
Date
Feb. 28...Mar. 7___
14...21 __28 __
Apr. 4...11 __
Gage height
Feet
0000000
Inches
4444457
Contents
000008
25
Date
Apr. 18 __25 ...
May 2...9 ...
16...23...30 ...
Gage heigl t
Feet
1223333
Inches
0.53.59.54953
Contents
72206261323371332313
(172) 5-3906. Deerskin Lake near Eagle River, Wis.
Location. Lat 45°59'05", long 89°09'40", in SE^ sec. 31, T.41 N., R. 11 E., on Deer skin Creek, 6.3 miles northeast of village of Eagle River.
Drainage area. 5 sq mi, approximately.
Gage-height record.- Staff gage. Datum of gage is 1,640.16 ft above rrean sea level (levels by Wisconsin Valley Improvement Co.).
Maxima. March to May 1965: Contents at end of week, 14 million cubic feet May 16 (gage height, 1 ft 5 in).
1938 to February 1965: Contents on last day of month, 22 million, cubic feet Oct. 31, 1938, May 31, and June 30, 1939, Apr. 30 and May 31, 1941, Sept. 30, 1959 (gage height, 2 ft 0 in).
Remarks. The lake has been used as a reservoir since 1908. Usable capacity 22million cubic feet between gage height 0 ft 4 in and 2 ft 0 in (limits stipulated by Public Service Commission of Wisconsin).
Cooperation. Gage heights and capacity tables furnished by Wisconsin Valley Improve ment Co.
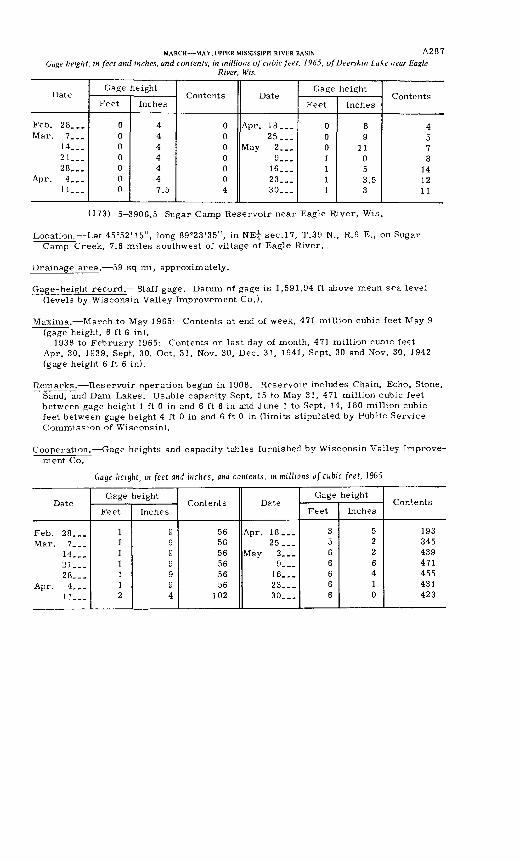
MARCH MAY, UPPER MISSISSIPPI RIVER BASIN A2 8 7
Gage height, in feet and inches, and contents, in millions of cubic feet, 1965, of Deerskin Lake near EagleRiver, Wis.
Date
Feb. 28...Mar. 7___
14...21. __28 __
Apr. 4___11 __
Gage height
Feet
0000000
Inches
4444447.5
Contents
0000004
Date
Apr. 18...25 ...
May 2...9__.
16...23...30...
Gage height
Feet
0001111
Inches
89
11053.53
Contents
4578
141211
(173) 5-3906.5 Sugar Camp Reservoir near Eagle River, Wis.
Location. Lat 45°52'15", long 89°23'35", in NE| sec.17, T.39 N., R.9 E., on Sugar Camp Creek, 7.6 miles southwest of village of Eagle River.
Drainage area. 59 sq mi, approximately.
Gage-height record. Staff gage. Datum of gage is 1,591.94 ft above mean sea level (levels by Wisconsin Valley Improvement Co.).
Maxima. March to May 1965: Contents at end of week, 471 million cubic feet May 9 (gage height, 6 ft 6 in).
1938 to February 1965: Contents on last day of month, 471 million cubic feet Apr. 30, 1939, Sept. 30, Oct. 31, Nov. 30, Dec. 31, 1941, Sept. 30 and Nov. 30, 1942 (gage height 6 ft 6 in).
Remarks. Reservoir operation began in 1908. Reservoir includes Chain, Echo, Stone, Sand, and Dam Lakes. Usable capacity Sept. 15 to May 31, 471 million cubic feet between gage height 1 ft 0 in and 6 ft 6 in and June 1 to Sept. 14, 180 million cubic feet between gage height 4 ft 0 in and 6 ft 0 in (limits stipulated by Public Service Commission of Wisconsin).
Cooperation. Gage heights and capacity tables furnished by Wisconsin Valley Inprove- ment Co.
Gage height, m feel and inches, and contents, in millions of cubic feet, 1965
Date
Feb. 28...Mar. 7...
14...21. __28...
Apr. 4__.11 __
Gage height
Feet
1111112
Inches
9999994
Contents
565656565656
102
Date
Apr. 18...25 ...
May 2...9 __
16...23...30...
Gage height
Feet
3566666
Inches
5226410
Contents
193345439471455431423
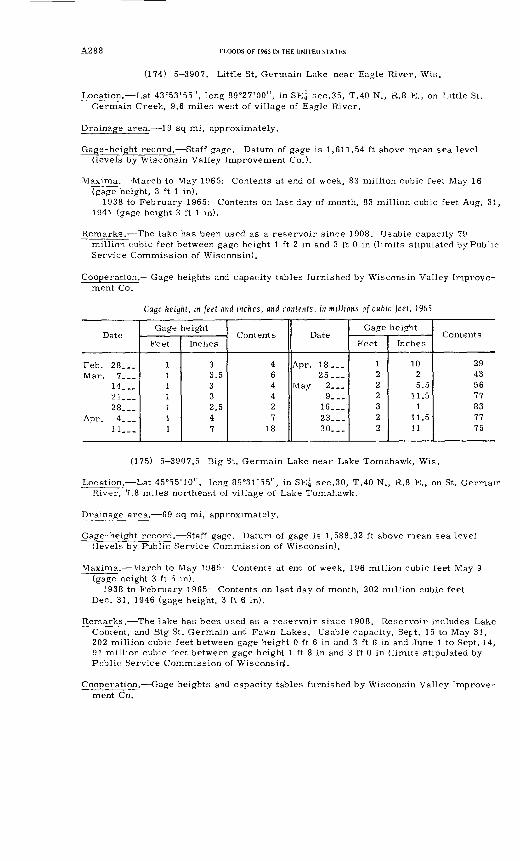
A288 FLOODS OF 1965 IN THE UNITED STATES
(174) 5-3907. Little St. Germain Lake near Eagle River, Wis.
Location. Lat 43°53'55", long 89°27'00", in SE? sec.35, T.40 N., R.8 E., on Little St. Germain Creek, 9.6 miles west of village of Eagle River.
Drainage area. 19 sq mi, approximately.
Gage-height record. Staff gage. Datum of gage is 1,611.54 ft above mean sea level (levels by Wisconsin Valley Improvement Co.).
Maxima. March to May 1965: Contents at end of week, 83 million cubic feet May 16 (gage height, 3 ft 1 in).
1938 to February 1965: Contents on last day of month, 83 million cubic feet Aug. 31, 1941 (gage height 3 ft 1 in).
Remarks.- The lake has been used as a reservoir since 1908. Usable capacity 79million cubic feet between gage height 1 ft 2 in and 3 ft 0 in (limits stipulated by Pub lie Service Commission of Wisconsin).
Cooperation. Gage heights and capacity tables furnished by Wisconsin Valley Improve ment Co.
Gage height, m feet and inches, and contents, in millions of cubic feet, 1965
Date
Feb. 28...Mar. 7___
14...21...28...
Apr. 4...n...
Gage height
Feet
1111111
Inches
33.5332.547
Contents
464427
18
Date
Apr. 18 ...25...
May 2...9...
16 ...23...30 ...
Gage height
Feet
1222322
Inches
1025.5
11.51
11.511
Contents
29435677837775
(175) 5-3907.5 Big St. Germain Lake near Lake Tomahawk, Wis.
Location. Lat 45°55'10", long 89°31'55", in SE| sec.30, T.40 N., R.8 E., on St. Germain River, 7.8 miles northeast of village of Lake Tomahawk.
Drainage area. 69 sq mi, approximately.
Gage-height record. Staff gage. Datum of gage is 1,588.32 ft above r-iean sea level (levels by Public Service Commission of Wisconsin).
Maxima. March to May 1965: Contents at end of week, 196 million cubic feet May 9 (gage height 3 ft 5 in).
1938 to February 1965: Contents on last day of month, 202 million cubic feet Dec. 31, J946 (gage height, 3 ft 6 in).
Remarks. The lake has been used as a reservoir since 1908. Reservoir includes Lake Content, and Big St. Germain and Fawn Lakes. Usable capacity, Sept. 15 to May 31, 202 million cubic feet between gage height 0 ft 6 in and 3 ft 6 in and June 1 to Sept. 14, 91 million cubic feet between gage height 1 ft 8 in and 3 ft 0 in (limits stipulated by Public Service Commission of Wisconsin).
Cooperation. Gage heights and capacity tables furnished by Wisconsin Valley Improve ment Co.
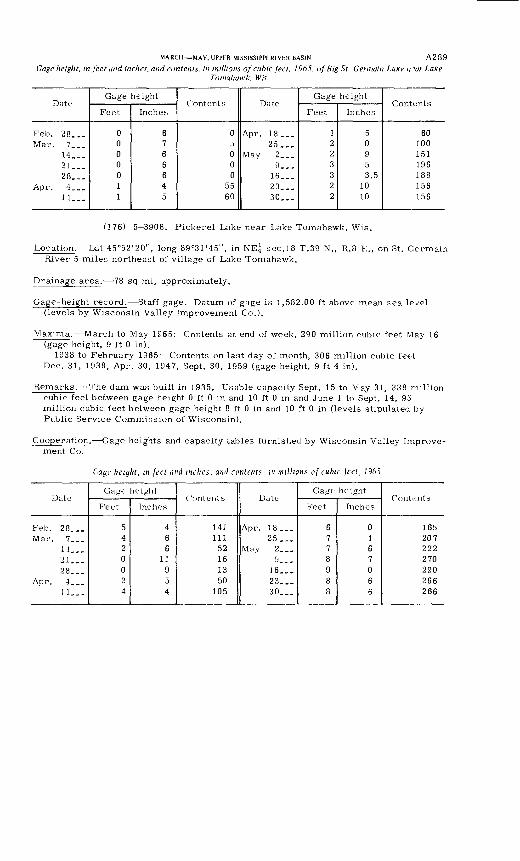
MARCH MAY, UPPFR MISSISSIPPI RIVER BASIN A289
Gage height, in feet and inches, and contents, in mil/ions of cubic Ject, 1965, of Big St. Germain Lake nrar LakeTomahawk, Wis.
Date
Feb. 28...Mar. 7...
14...21...28 __
Apr. 4___11 ...
Gage height
Feet
0000011
Inches
6766645
Contents
05000
5560
Date
Apr. 18...25...
May 2...9...
16...23...30...
Gage height
Feet
1223322
Inches
50953.5
1010
Contents
60100151196188156156
(176) 5-3908. Pickerel Lake near Lake Tomahawk, Wis.
Location. Lat 45°52'20", long 89°31'45", in NE{ sec.18 T.39 N., R.8 E., on St. Germain River 5 miles northeast of village of Lake Tomahawk.
Drainage area. 78 sq mi, approximately.
Gage-height record. Staff gage. Datum of gage is 1,582.00 ft above mean sea le/el (levels by Wisconsin Valley Improvement Co.).
Maxima. March to May 1965: Contents at end of week, 290 million cubic feet May 16 (gage height, 9 ft 0 in).
1938 to February 1965- Contents on last day of month, 306 million cubic feet Dec. 31, 1938, Apr. 30, 1947, Sept. 30, 1959 (gage height, 9 ft 4 in).
Remarks. The dam was built in 1935. Usable capacity Sept. 15 to May 31, 338 million cubic feet between gage height 0 ft 0 in and 10 ft 0 in and June 1 to Sept. 14, 95 million cubic feet between gage height 8 ft 0 in and 10 ft 0 in (levels stipulated by Public Service Commission of Wisconsin).
Cooperation. Gage heights and capacity tables furnished by Wisconsin Valley Improve ment Co.
fjflgf height, tn feel and inches, and contents, in millions of cubic feel, 1965
Date
Feb. 28...Mar. 7...
14...21. _.28...
Anr. 4___1 1...
Gage height
Feet
5420024
Inches
466
11954
Contents
141111
52161350
105
Date-
Apr. 18...25...
Mav 2...!)...
16...23...30...
Gage height
Feet
6778988
Inches
0167066
Contents
165207222270290266266
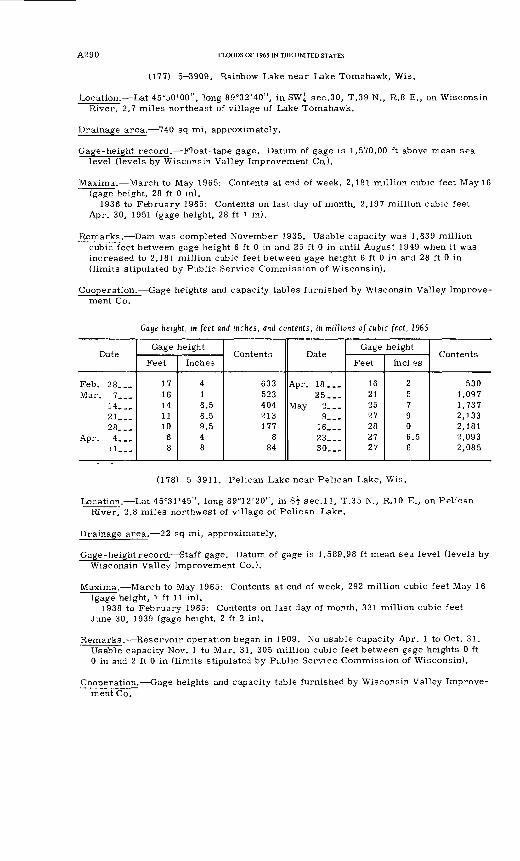
A290 FLOODS OF 1965 IN THE UNITED STATES
(177) 5-3909. Rainbow Lake near Lake Tomahawk, Wis.
Location. Lat 45°50'00", long 89°32'40", in SWi sec.30, T.39 N., R.8 E., on Wisconsin River, 2.7 miles northeast of village of Lake Tomahawk.
Drainage area. 740 sq mi, approximately.
Gage-height record. Float-tape gage. Datum of gage is 1,570.00 ft above mean sea level (levels by Wisconsin Valley Improvement Co.).
Maxima. March to May 1965: Contents at end of week, 2,181 million cubic feet May 16 (gage height, 28 ft 0 in).
1936 to February 1965: Contents on last day of month, 2,197 million cubic feet Apr. 30, 1951 (gage height, 28 ft 1 in).
Remarks. Dam was completed November 1935. Usable capacity was 1,639 million cubic feet between gage height 6 ft 0 in and 25 ft 0 in until August 1949 when it was increased to 2,181 million cubic feet between gage height 6 ft 0 in ard 28 ft 0 in (limits stipulated by Public Service Commission of Wisconsin).
Cooperation. Gage heights and capacity tables furnished by Wisconsin Valley Improve ment Co.
Cage height, in feet and inches, and contents, in millions of cubic feet, 1965
Date
Feb. 28...Mar. 7___
14. _.21...28 ...
Apr. 4...11. _,
Gage height
Feet
1716141110
68
Inches
416.56.59.548
Contents
633523404213177
884
Date
Apr. 18...25 ...
May 2...9 ...
16 __23...30 ...
Gage height
Feet
16212527282727
Incl es
257906.56
Contents
5301,0971,7372,1332,1812,0932,085
(178) 5-3911. Pelican Lake near Pelican Lake, Wis.
Location. Lat 45°31'45", long 89°12'20", in Sf sec.11, T.35 N., R.10 E., on Pelican River, 2.8 miles northwest of village of Pelican Lake.
Drainage area. 22 sq mi, approximately.
Gage-height record. Staff gage. Datum of gage is 1,589.98 ft mean sea level (levels by Wisconsin Valley Improvement Co.).
Maxima. March to May 1965: Contents at end of week, 292 million cubic feet May 16 (gage height, 1 ft 11 in).
1938 to February 1965: Contents on last day of month, 331 million cubic feet June 30, 1939 (gage height, 2 ft 2 in).
Remarks. Reservoir operation began in 1909. No usable capacity Apr. 1 to Oct. 31. Usable capacity Nov. 1 to Mar. 31, 305 million cubic feet between gsge heights 0 ft 0 in and 2 ft 0 in (limits stipulated by Public Service Commission of Wisconsin).
Cooperation. Gage heights and capacity table furnished by Wisconsin Valley Improve ment Co.
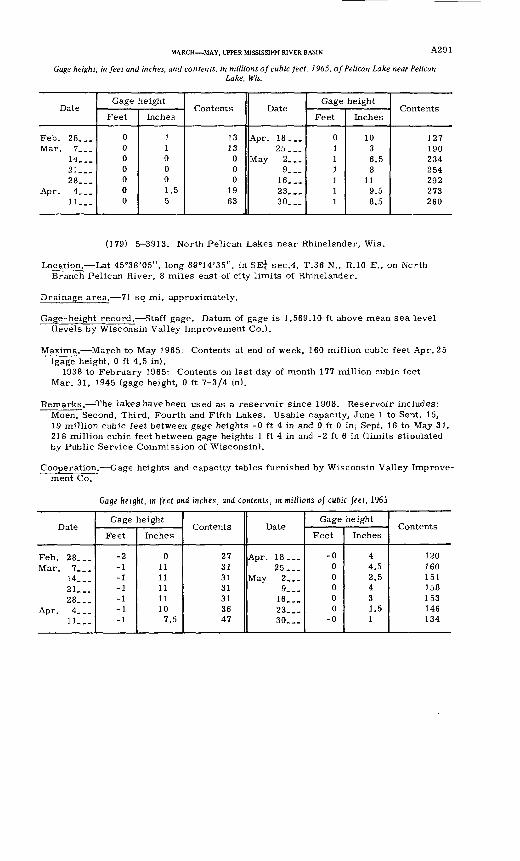
MARCH MAY, UPPER MISSISSIPPI RIVER BASIN A291
Gage height, in feet and inches, and contents, in millions of cubic feet, 1965, of Pelican Lake near PelicanLake, Wis.
Date
Feb. 28...Mar. 7___
14...21. ._28 ...
Apr. 4___11...
Gage height
Feet
0000000
Inches
110001.55
Contents
1313
000
1963
Date
Apr. 18...25 ...
May 2...9 ...
16...23 __30 ...
Gage height
Feet
0111111
Inches
1036.58
119.58.5
Contents
127190234254292273260
(179) 5-3913. North Pelican Lakes near Rhinelander, Wis.
Location. Lat 45°38'05", long 89°14'35", in SE| sec.4, T.36 N., R.10 E., on Ncrth Branch Pelican River, 8 miles east of city limits of Rhinelander.
Drainage area. 71 sq mi, approximately.
Gage-height record. Staff gage. Datum of gage is 1,569.10 ft above mean sea level (levels by Wisconsin Valley Improvement Co.).
Maxima. March to May 1965: Contents at end of week, 160 million cubic feet Apr. 25 (gage height, 0 ft 4.5 in).
1938 to February 1965: Contents on last day of month 177 million cubic feet Mar. 31, 1945 (gage height, 0 ft 7-3/4 in).
Remarks. The lakes have been used as a reservoir since 1908. Reservoir includes: Moen, Second, Third, Fourth and Fifth Lakes. Usable capacity, June 1 to Se~>t. 15, 19 million cubic feet between gage heights -0 ft 4 in and 0 ft 0 in; Sept. 16 to May 31, 218 million cubic feet between gage heights 1 ft 4 in and -2 ft 6 in (limits stioulated by Public Service Commission of Wisconsin).
Cooperation. Gage heights and capacity tables furnished by Wisconsin Valley Improve ment Co.
Gage height, in feet and inches, and contents, m millions of cubic feet, 1965
Date
Feb. 28...Mar. 7...
14...21...28...
Apr. 4__.11...
Gage height
Feet
-2-1-1-1-1-1-1
Inches
01111111110
7.5
Contents
27313131313647
Date
Apr. 18...25 __
May 2...9 __
16 ...23 __30 __
Gage height
Feet
-000000
-0
Inches
44.52.5431.51
Contents
120160151158153146134
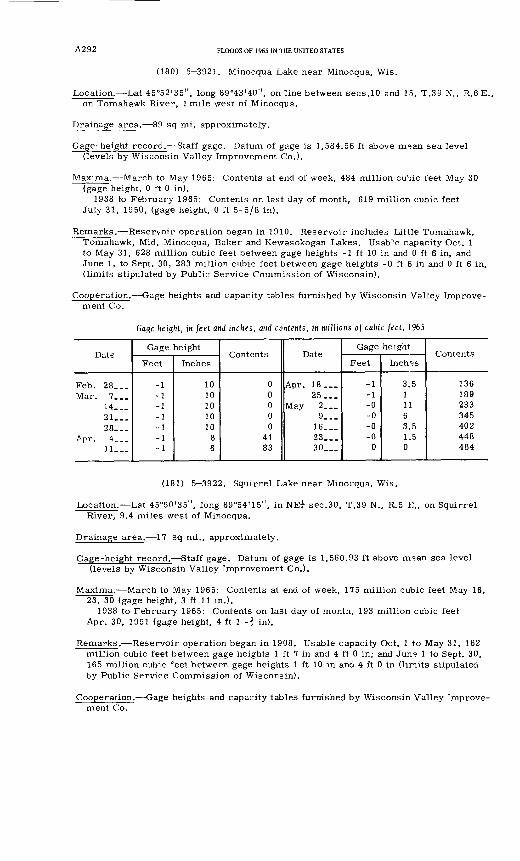
A292 FLOODS OF 1965 IN THE UNITED STATES
(180) 5 3921. Minocqua Lake near Minocqua, Wis.
Location. Lat 45°52'35", long 89°43'40", on line between sees.10 and 15, T.39 N., R.6 E. on Tomahawk River, 1 mile west of Minocqua.
Drainage area. 89 sq mi, approximately.
Gage-height record. Staff gage. Datum of gage is 1,584.56 ft above m°an sea level (levels by Wisconsin Valley Improvement Co.).
Maxima. March to May 1965: Contents at end of week, 484 million cubic feet May 30 (gage height, 0 ft 0 in).
1938 to February 1965: Contents on last day of month, 619 million cubic feet July 31, 1950, (gage height, 0 ft 5-5/8 in).
Remarks. Reservoir operation began in 1910. Reservoir includes Little Tomahawk, Tomahawk, Mid, Minocqua, Baker and Kewasokogan Lakes. Usable capacity Oct. 1 to May 31, 628 million cubic feet between gage heights -1 ft 10 in and 0 ft 6 in, and June 1, to Sept. 30, 283 million cubic feet between gage heights -0 ft 6 in and 0 ft 6 in, (limits stipulated by Public Service Commission of Wisconsin).
Cooperation. Gage heights and capacity tables furnished by Wisconsin Valley Improve ment Co.
Gage height, in feet and inches, and contents, in millions of cubic feet, 1965
Date
Feb. 28 ...Mar. 7. _
14...21 ...28 __
Apr. 4. _11 __
Gage height
Feet
-1-1-1-1-1-1-1
Inches
1010101010
86
Contents
00000
4183
Date
Apr. 18...25 ...
May 2...9...
16...23 ...30 __
Gage height
Feet
-1-1-0-0-0-0
0
Inches
3.511163.51.50
Contents
136189233345402448484
(181) 5-3922. Squirrel Lake near Minocqua, Wis.
Location. Lat 45°50'35", long 89°54'15", in NEi sec.30, T.39 N., R.5 K., on Squirrel River, 9.4 miles west of Minocqua.
Drainage area. 17 sq mi., approximately.
Gage-height record. Staff gage. Datum of gage is 1,560.93 ft above m°an sea level (levels by Wisconsin Valley Improvement Co.).
Maxima. March to May 1965: Contents at end of week, 175 million cubic feet May 16, 23, 30 (gage height, 3 ft 11 in.).
1938 to February 1965: Contents on last day of month, 193 million cubic feet Apr. 30, 1951 (gage height, 4 ft 1 -f in).
Remarks. Reservoir operation began in 1908. Usable capacity Oct. 1 to May 31, 182 million cubic feet between gage heights 1 ft 7 in and 4 ft 0 in; and Jun? 1 to Sept. 30, 165 million cubic feet between gage heights 1 ft 10 in and 4 ft 0 in (limits stipulated by Public Service Commission of Wisconsin).
Cooperation. Gage heights and capacity tables furnished by Wisconsin Valley Improve ment Co.
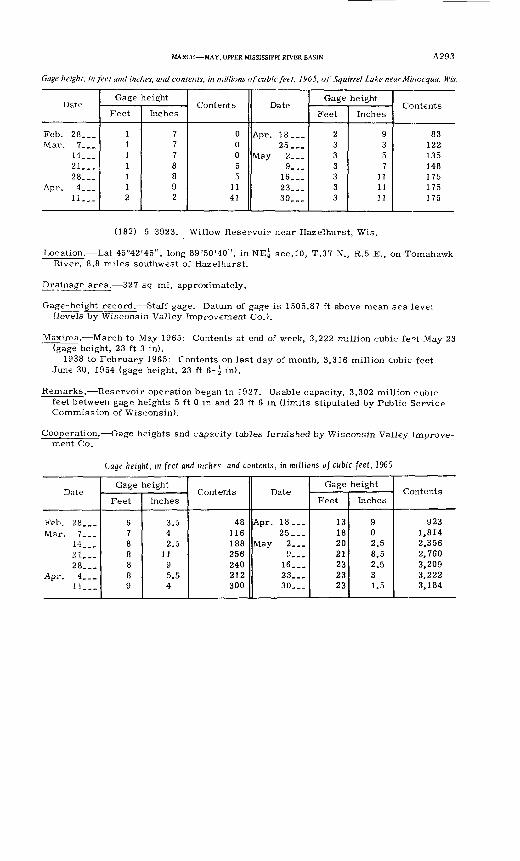
MARCH MAY, UPPER MISSISSIPPI RIVER BASIN A2 9 3
Gage height, in feet and inches, and contents, in millions of cubic feet, 1965, of Squirrel Lake near Minocqua, Wis.
Date
Feb. 28...Mar. 7. _
14...21...28...
Apr. 4...ll-_.
Gage height
Feet
1111112
Inches
7778892
Contents
00055
1141
Date
Apr. 18...25 ...
May 2...9...
16...23...30 ...
Gage height
Feet
2333333
Inches
9357
111111
Contents
83122135148175175175
(182) 5-3923. Willow Reservoir near Hazelhurst, Wis.
Location. Lat 45°42'45", long 89°50'40", in NE^ sec.10, T.37 N., R.5 E., on Tomahawk River, 8.8 miles southwest of Hazelhurst.
Drainage area. 327 sq mi, approximately.
Gage-height record. Staff gage. Datum of gage is 1505.87 ft above mean sea level (levels by Wisconsin Valley Improvement Co.).
Maxima. March to May 1965: Contents at end of week, 3,222 million cubic fe°t May 23 (gage height, 23 ft 3 in).
1938 to February 1965: Contents on last day of month, 3,316 million cubic feet June 30, 1954 (gage height, 23 ft 6-^ in).
Remarks. Reservoir operation began in 1927. Usable capacity, 3,302 million cubic feet between gage heights 5 ft 0 in and 23 ft 6 in (limits stipulated by Public Service Commission of Wisconsin).
Cooperation. Gage heights and capacity tables furnished by Wisconsin Valley Improve ment Co.
Cage height, in feet and inches, and contents, in millions of cubic feet, 1965
Date
Feb. 28...Mar. 7___
14__.21...28...
Apr. 4___11___
Gage height
Feet
6788889
Inches
3.542.5
1195.54
Contents
48116188256240212300
Date
Apr. 18 ...25 ...
May 2...9 ...
16 ...23 __30 ...
Gage height
Feet
13182021232323
Inches
902.58.52.531.5
Contents
9231,8142,3562,7603,2093,2223,184
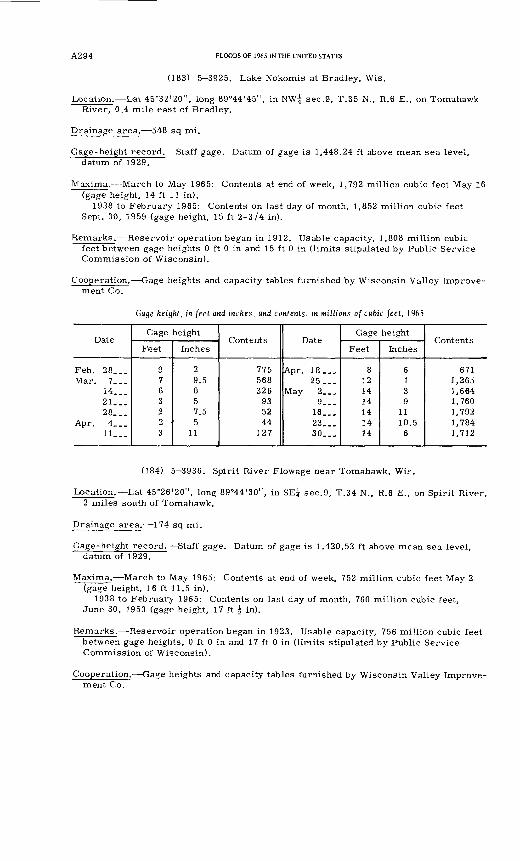
A294 FLOODS OF 1965 IN THE UNITED STATES
(183) 5-3925. Lake Nokomis at Bradley, Wis.
Location. Lat 45°32'20", long 89°44'45", in NWi sec.9, T.35 N., R.6 E., on Tomahawk River, 0.4 mile east of Bradley.
Drainage area. 548 sq mi.
Gage-height record. Staff gage. Datum of gage is 1,448.24 ft above mean sea level, datum of 1929.
Maxima. March to May 1965: Contents at end of week, 1,792 million cubic feet May 16 (gage height, 14 ft 11 in).
1938 to February 1965: Contents on last day of month, 1,852 million cubic feet Sept. 30, 1959 (gage height, 15 ft 2-3/4 in).
Remarks. Reservoir operation began in 1912. Usable capacity, 1,808 million cubic feet between gage heights 0 ft 0 in and 15 ft 0 in (limits stipulated by Public Service Commission of Wisconsin).
Cooperation. Gage heights and capacity tables furnished by Wisconsin Valley Improve ment Co.
Gage height, in feet and inches, and contents, in millions of cubic feet, 1965
Date
Feb. 28...Mar. 7...
14...21 ...28 __
Apr. 4___11 __
Gage height
Feet
976322 3
Inches
29.5057.55
11
Contents
775568326
935244
127
Date
Apr. 18...25 ...
May 2___9__.
16 __23...30 ...
Gage height
Feet
8121414141414
Inches
6139
1110.5
6
Contents
6711,2651,6641,7601,7921,7841,712
(184) 5-3936. Spirit River Flowage near Tomahawk, Wis.
Location. Lat 45°26'20", long 89°44'30", in SE^ sec.9, T.34 N., R.6 E., on Spirit River, 2 miles south of Tomahawk.
Drainage area. 174 sq mi.
Gage-height record. Staff gage. Datum of gage is 1,420.53 ft above mean sea level, datum of 1929.
Maxima. March to May 1965: Contents at end of week, 752 million cubic feet May 2 (gage height, 16 ft 11.5 in).
1938 to February 1965: Contents on last day of month, 760 million cubic feet. June 30, 1953 (gage height, 17 ft f in).
Remarks. Reservoir operation began in 1923. Usable capacity, 756 million cubic feet between gage heights, 0 ft 0 in and 17 ft 0 in (limits stipulated by Public Service Commission of Wisconsin).
Cooperation. Gage heights and capacity tables furnished by Wisconsin Valley Improve ment Co.
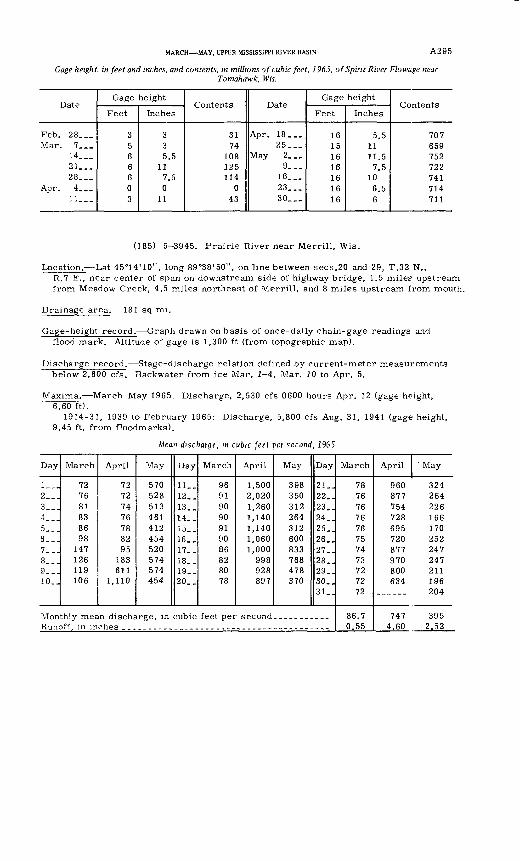
MARCH MAY, UPPER MISSISSIPPI RIVER BASIN A295
Gage height, in feet and inches, and contents, in millions of cubic feet, 1965, of Spirit River Flowage nearTomahawk, Wis.
Date
Feb. 28...Mar. 7. _
14 ...21...28 __
Apr. 4...11.. _
Gage height
Feet
3566603
Inches
335.5
117.50
11
Contents
3174
108125114
043
Date
Apr. 18...25 ...
May 2...9...
16 ...23...30 ...
Gage height
Feet
16151616161616
Inches
5.51111.57.5
106.56
Contents
707659752722741714711
(185) 5-3945. Prairie River near Merrill, Wis.
Location. Lat 45°14'10", long 89°38'50", on line between sees.20 and 29, T.32 N.,R.7 E., near center of span on downstream side of highway bridge, 1.5 miles- upstream from Meadow Creek, 4.5 miles northeast of Merrill, and 8 miles upstream from mouth.
Drainage area. 181 sq mi.
Gage-height record. Graph drawn on basis of once-daily chain-gage readings and flood mark. Altitude of gage is 1,300 ft (from topographic map).
Discharge record. Stage-discharge relation defined by current-meter measurements below 2,600 cfs. Backwater from ice Mar. 1-4, Mar. 10 to Apr. 5.
Maxima. March-May 1965: Discharge, 2,530 cfs 0600 hours Apr. 12 (gage height, 6.60 ft).
1914-31, 1939 to February 1965: Discharge, 5,800 cfs Aug. 31, 1941 (gage height, 9.45 ft, from floodmarks).
Mean discharge, in cubic feet per second, 1965
Day
1__.2...3...4___5___6...7___8...9...10..
March
727681838698
147126119106
April
72727476788295
183611
1,110
May
570528513461412454520574574454
Day
11_.12..13. _14..15. _16..17_.18..19__20__
March
96919090919086828078
April
1,5002,0201,2601,1401,1401,0601,000
998928897
May
398350312264312600833768478370
Day
21_.22_.23_.24..25..26..27..28..29_.30..31
Monthly mean discharge, in cubic feet per second..... ______Runoff, in inches ____---_____-----_-_---__--____-----_-__
March
7876767676757473727272
86.70.55
April
960877754728695720877970800634
7474.60
' May
324264226166170252247247211196204
3952.52
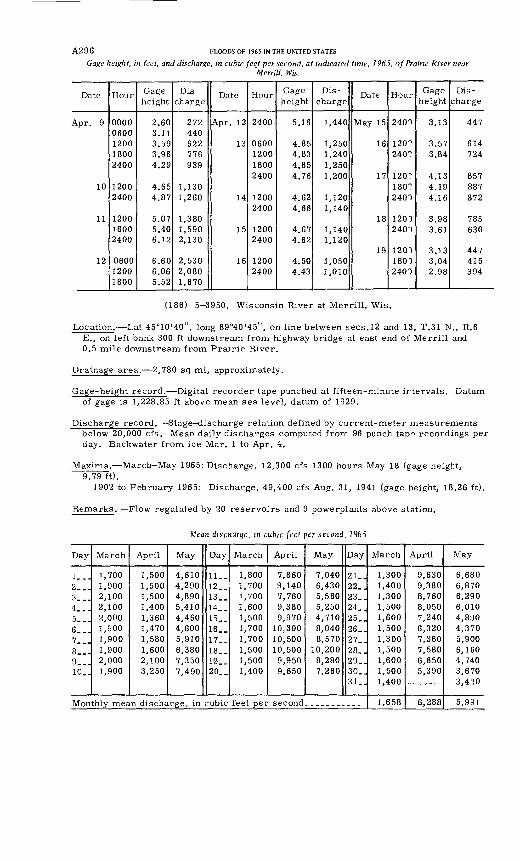
A296 FLOODS OF 1965 IN THE UNITED STATES
Gage height, in feet, and discharge, in cubic feet per second, at indicated time, 1965, of Prairie River near'Merrill, Wis.
Date
Apr. 9
10
11
12
Hour
00000600120018002400
12002400
120018002400
060012001800
Gage height
2.603.113.593.964.29
4.654.87
5.075.406.12
6.606.065.52
Dis
charge
272440622776939
1,1301,260
1,3801,5902,130
2,5302,0801,670
Date
Apr. 12
13
14
15
16
Hour
2400
0600120018002400
12002400
12002400
12002400
Gage height
5.16
4.854.834.854.76
4.624.66
4.674.62
4.504.43
Dis
charge
1,440
1,2501,2401,2501,200
1,1201,140
1,1401,120
1,0501,010
Date
May 15
16
17
18
19
Hour
2401
120?240?
120?180?240")
120")2400
120018002400
Gage height
3.13
3.573.84
4.134.194.16
3.983.61
3.133.042.98
Dis
charge
447
614724
857887872
785630
447415394
(186) 5-3950. Wisconsin River at Merrill, Wis.
Location. Lat 45°10'40", long 89°40'45", on line between sees.12 and 13, T.31 N., R.6 E., on left bank 300 ft downstream from highway bridge at east end of Merrill and 0.5 mile downstream from Prairie River.
Drainage area. 2,780 sq mi, approximately.
Gage-height record. Digital recorder tape punched at fifteen-minute irtervals. Datum of gage is 1,228.85 ft above mean sea level, datum of 1929.
Discharge record. Stage-discharge relation defined by current-meter measurements below 20,000 cfs. Mean daily discharges computed from 96 punch tap-? recordings per day. Backwater from ice Mar. 1 to Apr. 4.
Maxima. March-May 1965: Discharge, 12,300 cfs 1300 hours May 18 (gage height, 9.79 ft).
1902 to February 1965: Discharge, 49,400 cfs Aug. 31, 1941 (gage height, 18.26 ft).
Remarks. Flow regulated by 20 reservoirs and 9 powerplants above station.
Mean discharge, in cubic feet per second, 1965
Day
1__-2___3...4___5...6...7...8...9___10..
March
1,7001,9002,1002,1002,0001,9001,9001,9002,0001,900
April
1,5001,5001,5001,4001,3601,4701,5801,6002,1003,250
May
4,6104,2904,8905,4104,4604,6005,9106,3807,3507,490
Day
11..12__13__14__15__16__17__18__19__20. _
March
1,8001,7001,7001,6001,5001,7001,7001,5001,5001,400
April
7,8609,1407,7609,3809,970
10,30010,50010,5009,9509,650
May
7,0406,4305,5605,2504,7108,0408,570
10,2008,2807,260
Day
21_.22_.23_.24. .25_.26_.27_.28_.29_.30_.31_.
Monthly mean discharge, in cubic feet per second.... _______
March
1,3001,4001,3001,5001,6001,5001,3001,5001,6001,5001,400
1,658
April
9,6309,3808,7608,0507,2406,3207,3607,5806,6505,390
-------
6,288
May
6,6806,8706,2906,0104,8904,3705,9006,1604,7403,6703,420
5,991
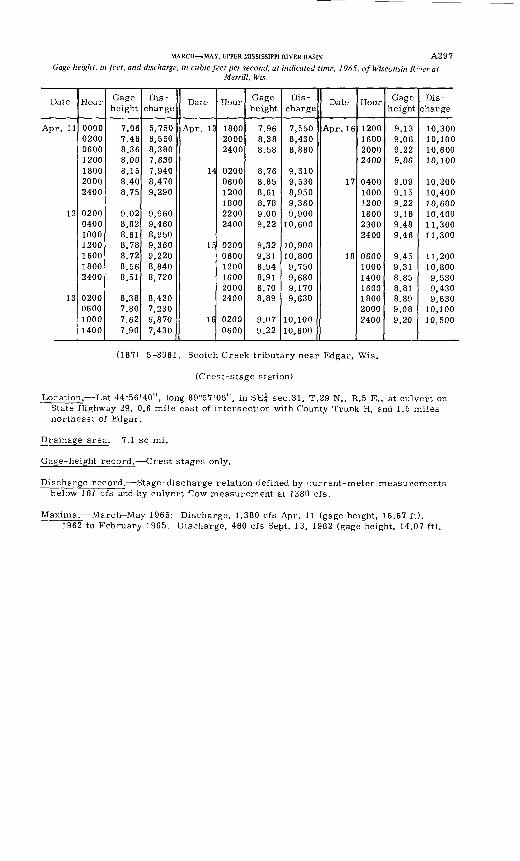
MARCH MAY, UPPER MISSISSIPPI RIVER BASIN A2 9 7
Gage height, in feet, and discharge, in cubic feet per second, at indicated time, 1965, of Wisconsin R : ->er atMerrill, Wis.
Date
Apr. 11
12
13
Hour
0000020006001200180020002400
0200040010001200160018002400
0200060010001400
Gage height
7.067.468.368.008.158.408.75
9.028.828.618.788.728.568.51
8.387.807.627.90
Dis
charge
5,7506,5508,3807,6307,9408,4709,290
9,9609,4608,9509,3609,2208,8408,720
8,4307,2306,8707,430
Date
Apr. 13
14
15
16
Hour
180020002400
020006001200180022002400
020006001200160020002400
02000600
Gage height
7.968.388.58
8.768.858.618.789.009.22
9.329.318.948.918.708.89
9.079.22
Dis
charge
7,5508,4308,880
9,3109,5308,9509,3609,900
10,600
10,90010,8009,7509,6809,1709,630
10,10010,600
Date
Apr. 16
17
18
Hour
1200160020002400
040010001200180023002400
0600100014001600180020002400
Gage height
9.139.069.229.06
9.099.159.229.189.489.46
9.459.318.858.818.899.089.20
Dis
charge
10,30010,10010,60010,100
10,20010,40010,60010,40011,30011,300
11,20010,8009,5309,4309,630
10,10010,500
(187) 5-3961. Scotch Creek tributary near Edgar, Wis.
(Crest-stage station)
Location. Lat 44°56'40", long 89°57'05", in SE? sec.31, T.29 N., R.5 E., at culvert on State Highway 29, 0.6 mile east of intersection with County Trunk H, and 1.5 miles northeast of Edgar.
Drainage area. 7.1 sq mi.
Gage-height record. Crest stages only.
Discharge record. Stage-discharge relation defined by current-meter measurements below 161 cfs and by culvert flow measurement at 1380 cfs.
Maxima.- March-May 1965: Discharge, 1,380 cfs Apr. 11 (gage height, 16.67 ft).1962 to February 1965: Discharge, 460 cfs Sept. 13, 1962 (gage height, 14.07 ft).
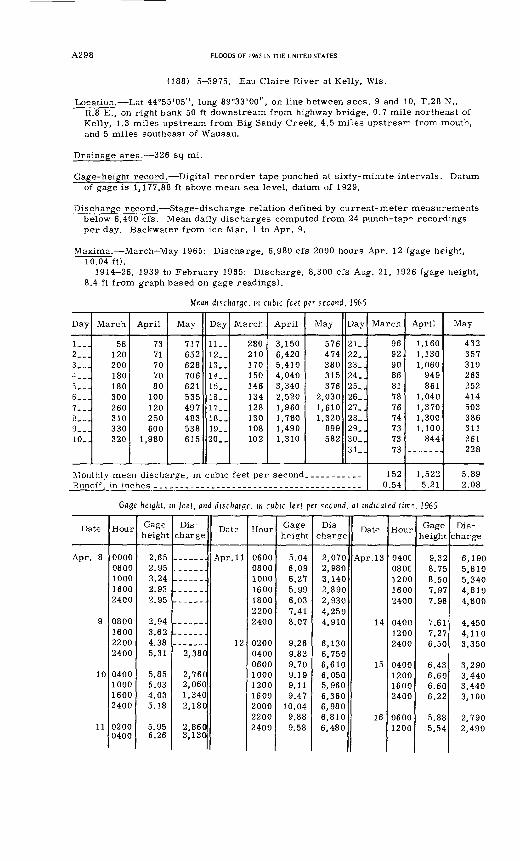
A298 FLOODS OF 1965 IN THE UNITED STATES
(188) 5-3975. Eau Claire River at Kelly, Wis.
Location. Lat 44°55'05", long 89°33'00", on line between sees. 9 and 10, T.28 N., R.8 E., on right bank 50 ft downstream from highway bridge, 0.7 mile northeast of Kelly, 1.3 miles upstream from Big Sandy Creek, 4.5 miles upstream from mouth, and 5 miles southeast of Wausau.
Drainage area. 326 sq mi.
Gage-height record. Digital recorder tape punched at sixty-minute intervals. Datum of gage is 1,177.88 ft above mean sea level, datum of 1929.
Discharge record. Stage-discharge relation defined by current-meter measurements below 6,400 cfs. Mean daily discharges computed from 24 punch-tap? recordings per day. Backwater from ice Mar. 1 to Apr. 9.
Maxima. March-May 1965: Discharge, 6,980 cfs 2000 hours Apr. 12 (gage height, 10.04 ft).
1914-26, 1939 to February 1965: Discharge, 8,300 cfs Aug. 21, 1926 (gage height, 8.4 ft from graph based on gage readings).
Mean discharge, in cubic feet per second, 1965
Day
!___2...3...4___5__.6__.7...8...9__.10_.
March
58120200180180300260310330320
April
7371707080
100120250600
1,980
May
717652628706621535497483538615
Day
11..12..13..14. _15..16..17. _18..19..20..
March
280210170150146134128130108102
April
3,1506,4205,4104,0403,3402,5201,9601,7801,4901,310
May
576474380315376
2,0301,6101,320
899582
Day
21..22..23..24..25..26..27..28..29..30..31..
Runoff, in inches ____--___--__-___--___---_-___---_--_.--
March
9692908681787674737373
1520.54
April
1,1601,1301,060
949861
1,0401,3701,3001,100
844
1,5225.21
May
432357310263252414503386311261228
5.892.08
Cage height, in feet, and discharge, in cubic feet per second, at indicated tiim, 1965
Date
Apr. 8
9
10
11
Hour
00000800100016002400
0800160022002400
0400100016002400
02000400
Gage height
2.652.953.242.932.95
2.943.624.385.31
5.855.034.035.18
5.956.26
Dis charge
2,380
2,7602,0601,3402,180
2,8603,130
Date
Artr* 1 1.rtpt . I I
12
Hour
0600080010001600180022002400
020004000600100012001600200022002400
Gage height
5.046.096.27^ QQ o . y y
6.037.418.07
9 OC .^D
9.839.709.199.119.47
10.049.889.58
Dis
charge
2,0702,9803,1402,8902 QQn, you 4,2504 910'
6,1306,7506,6106,0505,9606,3606,9806,8106,480
Date
Apr. 13
14
15
16
Hour
040C0800120016002400
040012002400
0400120016002400
06001200
Gage height
9 328.758.507 Q7i . y / 7.96
7 G 1 .D 1
7 97\ ,£* 1
6.50
6.436.606.606.22
5.885.54
Dis charge
6,1905,8105,3404,8104,800
4 4504,1103,350
3,2903,4403,4403,100
2,7902,490
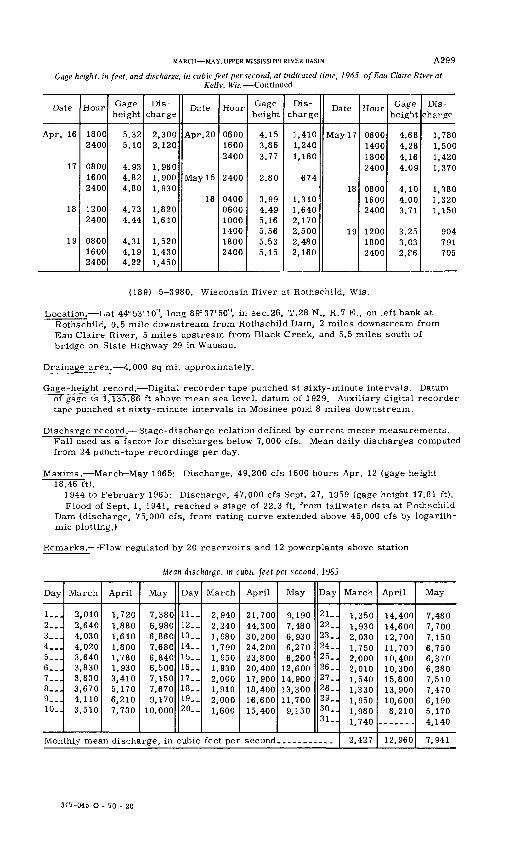
MARCH MAY, UPPER MISSISSIPPI RIVER BASIN
Gage height, in feet, and discharge, in cubic feet per second, at indicated time, 1965,Kelly, Wis. Continued
A299
of Eau Claire River at
Date
Apr. 16
17
18
19
Hour
18002400
080016002400
12002400
080016002400
Gage height
5.325.10
4.934.824.80
4.724.44
4.314.194.22
Dis charge
2,3002,120
1,9801,9001,930
1,8201,610
1,5201,4301,450
Date
Apr. 20
May 15
16
Hour
060016002400
2400
040006001000140018002400
Gage height
4.153.863.77
2.80
3.994.495.165.565.535.15
Dis charge
1,4101,2401,180
674
1,3101,6402,1702,5002,4802,160
Date
May 17
18
19
Hour
0600140018002400
080016002400
120018002400
Gage height
4.684.284.164.09
4.104.003.71
3.253.032.f6
Dis charge
1,7801,5001,4201,370
1,3801,3201,150
904791705
(189) 5-3980. Wisconsin River at Rothschild, Wis.
Location. Lat 44°53'10", long 89°37'50", in sec.26, T.28 N., R.7 E., on left bank at Rothschild, 0.5 mile downstream from Rothschild Dam, 2 miles downstream from Eau Claire River, 5 miles upstream from Black Creek, and 5.5 miles south of bridge on State Highway 29 in Wausau.
Drainage area. 4,000 sq mi. approximately.
Gage-height record. Digital recorder tape punched at sixty-minute intervals. Datum of gage is 1,135.86 ft above mean sea level, datum of 1929. Auxiliary digital recorder tape punched at sixty-minute intervals in Mosinee pond 8 miles downstream.
Discharge record. Stage-discharge relation defined by current meter measurements. Fall used as a factor for discharges below 7,000 cfs. Mean daily discharges computed from 24 punch-tape recordings per day.
Maxima. March-May 1965: Discharge, 49,200 cfs 1600 hours Apr. 12 (gage height 18.46 ft).
1944 to February 1965: Discharge, 47,000 cfs Sept. 27, 1959 (gage height 17.81 ft).Flood of Sept. 1, 1941, reached a stage of 22.3 ft, from tailwater data at Pothschild
Dam (discharge, 75,000 cfs, from rating curve extended above 45,000 cfs by logarith mic plotting.)
Remarks.- Flow regulated by 20 reservoirs and 12 powerplants above station
Mean discharge, m cubic feet per second, 1965
Day
1__.2...3___4...5__.6...7...8...9...10..
March
2,0102,6404,0304,0203,6403,8303,8303,6704,1103,510
April
1,7201,8801,6101,8001,7801,9303,4105,1706,2107,730
May
7,3806,9806,8607,6806,8406,5007,1507,6709,170
10,000
Day
11..12..13..14..15..16..17. _18..19..20..
March
2,9402,2401,9801,7901,9501,9302,0001,9102,0001,600
April
21,70044,30030,20024,20023,80020,40017,90018,40016,60015,400
May
9,1907,4806,9306,2706,200
12,60014,90013,30011,7009,150
Day
21..22..23..24..25..26..27..28..29..30..31..
Monthly mean discharge, in cubic feet per second. _---_-.-__
March
1,3501,9302,0301,7502,0002,0101,5401,3301,9501,9801,740
2,427
April
14,40014,60012,70011,70010,40010,30015,80013,90010,6008,210
12,960
May
7,4807,7007,1506,7506,3706,2807,5107,4706,1905,1704,140
7,941
317-045 O - 70 - 20
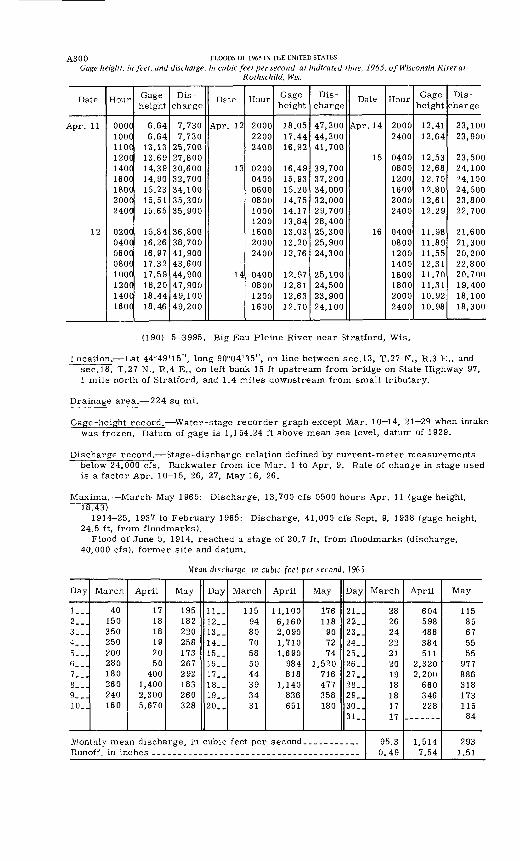
A300 FLOODS OF 1965 IN THE UNITED STATES
Gage height, in feet, and discharge, in cubic feet per second, at indicated time, 1965, of Wisconsin River atRothschild, Wis.
Date
Apr. 11
12
Hour
000010001100120014001600180020002400
02000400060008001000120014001600
Gage height
6.646.64
13.1313.6914.3914.9015.2315.5115.65
15.8416.2616.9717.3217.5918.2018.4418.46
Dis
charge
7,7307,730
25,70027,80030,60032,70034,10035,30035,900
36,80038,70041,90043,60044,90047,90049,10049,200
Date
Apr. 12
13
14
Hour
200022002400
020004000600080010001200160020002400
0400080012001600
Gage height
18.0517.4416.92
16.4915.9315.2014.7514.1713.8413.0313.2012.76
12.9712.8112.6312.70
Dis charge
47,20044,20041,700
39,70037,20034,00032,00029,70028,40025,30025,90024,300
25,10024,50023,90024,100
Date
Apr. 14
15
16
Hour
20002400
040008001200160020002400
04000800120014001600180020002400
Gage height
12.4112.64
12.5312.6812.7012.8012.6112.29
11.9811.8911.5512.3111.7011.3110.9210.98
Dis
charge
23,10023,900
23,50024,10024,10024,50023,80022,700
21,60021,30020,20022,80020,70019,40018,10018,300
(190) 5-3995. Big Eau Pleine River near Stratford, Wis.
Location. Lat 44°49'15", long 90°04'35", on line between sec.13, T.27 N., R.3 E., and sec.18, T.27 N., R.4 E., on left bank 15 ft upstream from bridge on State Highway 97, 1 mile north of Stratford, and 1.4 miles downstream from small tributary.
Drainage area. 224 sq mi.
Gage-height record. Water-stage recorder graph except Mar. 10 14, 21-29 when intake was frozen. Datum of gage is 1,154.24 ft above mean sea level, daturr of 1929.
Discharge record. Stage-discharge relation defined by current-meter measurements below 24,000 cfs. Backwater from ice Mar. 1 to Apr. 9. Rate of change in stage used is a factor Apr. 10-15, 26, 27, May 16, 26.
Maxima. March May 1965: Discharge, 13,700 cfs 0500 hours Apr. 11 (gage height, 18.43)
1914-25, 1937 to February 1965: Discharge, 41,000 cfs Sept. 9, 1938 (gage height, 24.5 ft, from floodmarks).
Flood of June 5, 1914, reached a stage of 20.7 ft, from floodmarks (discharge, 40,000 cfs), former site and datum.
Mean discharge, in cubic (eel per second, 1965
Day
l._.2...3...4___5...6...7...8...9__.10..
March
40150350250200280180260240160
April
171818192050
4001,4002,3005,670
May
195182220258173267292183260328
Day
11..12__13. _14..15..16.-17_.18..19..20..
March
115948070585044393431
April
11,1006,1602,0901,7101,690
984818
1,140836651
May
176118
907274
1,520716477358180
Day
21..22_.23_.24..25..26_.27_.28_.29_.30..31..
Monthly mean discharge, in cubic feet per second.. _________Runoff, in inches __________________-______---_--_-_--___-
March
2826242221201918181717
95.30.49
April
604598488384511
2,3202,200
660346228
1,5147.54
May
11585675555
977886318173115
84
2931.51
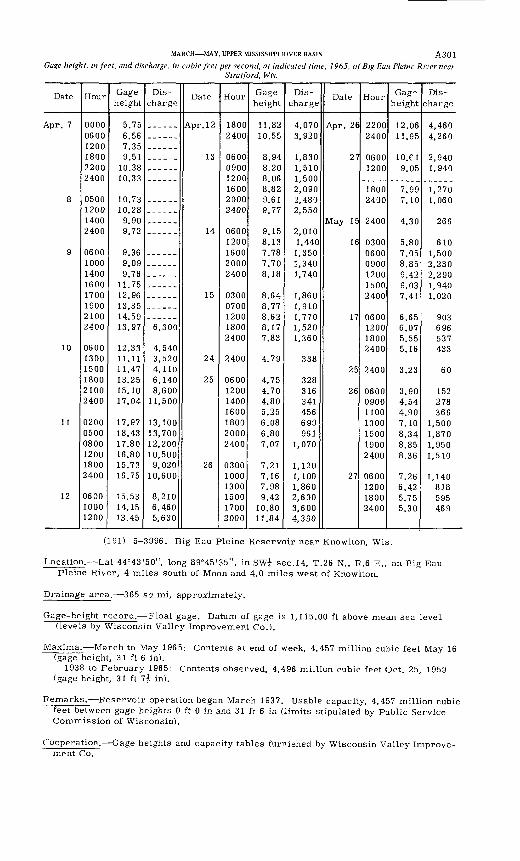
MARCH MAY, UPPER MISSISSIPPI RIVER BASIN A3 0 1
Gage height, in feet, and discharge, in cubic feet per second, at indicated time, 1965, of Big Eau Pleine River nearStratford, Wis.
Date
Apr. 7
8
9
10
11
12
Hour
0000060012001800
2400
0500120014002400
06001000
16001700190021002400
0600 1300 1500 1800 2100 2400
0200 0500 0800 1200 1800 2400
0600 1000 1200
Gage height
5.756.567 9R
9.5110.3810.33
10.7310.289.909.72
9.369.09Q 7R
11.7512.96i 9 ^RU RQ
13.97
12.33 11.11 11.47 13.25 15.10 17.04
17.97 18.43 17.80 16.80 15.73 16.75
15.53 14.15 13.45
Dis
charge
6,300
4,540 3,520 4,110 6,140 8,600 11,500
13,100 13,700 12,200 10,500 9,020
10,600
8,210 6,460 5,630
Date
Ar>r- 1 9
13
14
15
24
25
26
Hour
18002400
0600090012001600 20002400
06001200
20002400
0300070012001800 2400
2400
0600 1200 1400 1600 1800 2000 2400
0300 1000 1300 1500 1700 2000
Gage height
11.8210.55
8 948.208.068.82Q R1
Q 77
9 158.13 7.787.708.18
8.648.778.628.17 7.83
4.79
4.75 4.70 4.80 5.25 6.08 6.80 7.07
7.21 7.16 7.98 9.42
10.80 11.84
Dis
charge
4,0703 Q9fi
1,8301,5101,5002,090 2,4809 RRn
2,0101,440 1,3501,3401,740
1,8601,9101,7701,520 1,360
338
328 316 341 456 699 961
1,070
1,120 1,100 1,860 2,600 3,600 4,390
Date
Apr 26
27
16
17
25
26
27
Hour
22002400
06001200
1800 2400
2400
0300 06000900120015002400
06001200 1800 2400
2400
0600 0900 1100 1300 1500 1900 2400
0600 1200 1800 2400
Gag-? height
12.061195
10. f 19 05
7.99 7.10
4 30
5.807 DR
Q 49
9 no7.41
6 £ c
6.07 5.55 5.16
3.23
3.90 4.54 4.90 7.10 8.34 8.85 8.36
7.26 6.42 5.75 5.30
Dis
charge
4,4604,260
2 Q Af\
i QAn
1,270 1,060
oc c
610 1,5002 2302 2901 9401,020
Qfi9
696 537 433
60
152 278 366
1,500 1,870 1,950 1,510
1,140 818 595 469
(191) 5-3996. Big Eau Pleine Reservoir near Knowlton, Wis.
Location. Lat 44°43'50", long 89°45'35", in SWj sec.14, T.26 N., R.6 E., on Big Eau Pleine River, 4 miles south of Moon and 4.0 miles west of Knowlton.
Drainage area. 365 sq mi, approximately.
Gage-height record. Float gage. Datum of gage is 1,115.00 ft above mean sea level (levels by Wisconsin Valley Improvement Co.).
Maxima. March to May 1965: Contents at end of week, 4,457 million cubic feet May 16 (gage height, 31 ft 6 in).
1938 to February 1965: Contents observed, 4,496 million cubic feet Oct. 25, 1959 (gage height, 31 ft 7^ in).
Remarks.- Reservoir operation began March 1937. Usable capacity, 4,457 million cubic feet between gage heights 0 ft 0 in and 31 ft 6 in (limits stipulated by Public Service Commission of Wisconsin).
Cooperation. Gage heights and capacity tables furnished by Wisconsin Valley Improve ment Co.
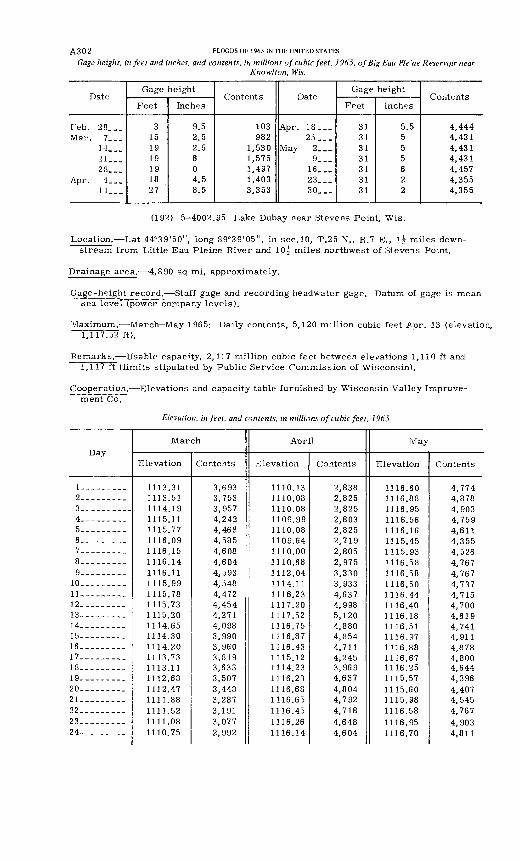
A3 0 2 FLOODS OF 1965 IN THE UNITED STATES
Gage height, in feet and inches, and contents, in millions of cubic feet, 1965, of Big Eau Pleme Reservqir nearKnowlton, Wis.
Date
Feb. 28...Mar. 7...
14...21...28...
Apr. 4...1 1...
Gage height
Feet
3151919191827
Inches
9.52.52.5604.58.5
Contents
103982
1,5301,5751,4971,4033,353
Date
Apr. 18...25...
May 2...9...
16...23...30...
Gage height
Feet
31313131313131
Inches
5.5555622
Contents
4,4444,4314,4314,4314,4574,3554,355
(192) 5-4002.95 Lake Dubay near Stevens Point, Wis.
Location. Lat 44°39'50", long 89°39'05", in sec.10, T.25 N., R.7 E., l| miles down stream from Little Eau Pleine River and 10^ miles northwest of Steve-is Point.
Drainage area. 4,890 sq mi, approximately.
Gage-height record. Staff gage and recording headwater gage. Datum of gage is mean sea level (power company levels).
Maximum. March May 1965: Daily contents, 5,120 million cubic feet Apr. 13 (elevation, 1,117.52 ft).
Remarks.- Usable capacity, 2,117 million cubic feet between elevations 1,110 ft and 1,117 ft (limits stipulated by Public Service Commission of Wisconsin).
Cooperation. Elevations and capacity table furnished by Wisconsin Valley Improve ment Co.
Elevation, in feet, and contents, in millions of cubic feet, 1965
Day
1----- __2-__-_ -__3----------
5-- - _ -_6.. -. --_7_ _____8---------9 -------
10--------11-------..12 _---1314--- - -15-- _- --.16-.-.- ---17-_-._ -
1920---------21 --------22--_.--_._23-- __ ...
March
Elevation
1113.31 1113.51 1114.19 1115.11 1115.77 1116.09 1116.15 1116.14 1116.11 1115.99 1115.78 1115.73 1115.20 1114.65 1114.30 1114.20 1113.73 1113.11 1112.68 1112.47 1111.88 1111.52 1111.08 1110.75
Contents
3,693 3,753 3,957 4,242 4,468 4,585 4,608 4,604 4,593 4,548 4,472 4,454 4,271 4,098 3,990 3,960 3,819 3,633 3,507 3,448 3,287 3,191 3,077 2,992
April
Elevation
1110.13 1110.08 1110.08 1109.99 1110.08 1109.64 1110.00 1110.68 1112.04 1114.11 1116.23 1117.20 1117.52 1116.75 1116.87 1116.43 1115.12 1114.23 1116.23 1116.68 1116.65 1116.45 1116.26 1116.14
Contents
2,838 2,825 2,825 2,803 2,825 2,719 2,805 2,975 3,330 3,933 4,637 4,998 5,120 4,880 4,854 4,711 4,245 3,969 4,637 4,804 4,792 4,718 4,648 4,604
May
Elevation
1116.60 1116.88 1116.95 1116.56 1116.16 1115.45 1115.93 1116.58 1116.58 1116.50 1116.44 1116.40 1116.18 1116.51 1116.97 1116.88 1116.67 1116.25 1115.57 1115.60 1115.98 1116.58 1116.95 1116.70
Contents
4,774 4,878 4,903 4,759 4,611 4,355 4,526 4,767 4,767 4,737 4,715 4,700 4,619 4,741 4,911 4,878 4,800 4,644 4,396 4,407 4,545 4,767 4,903 4,811
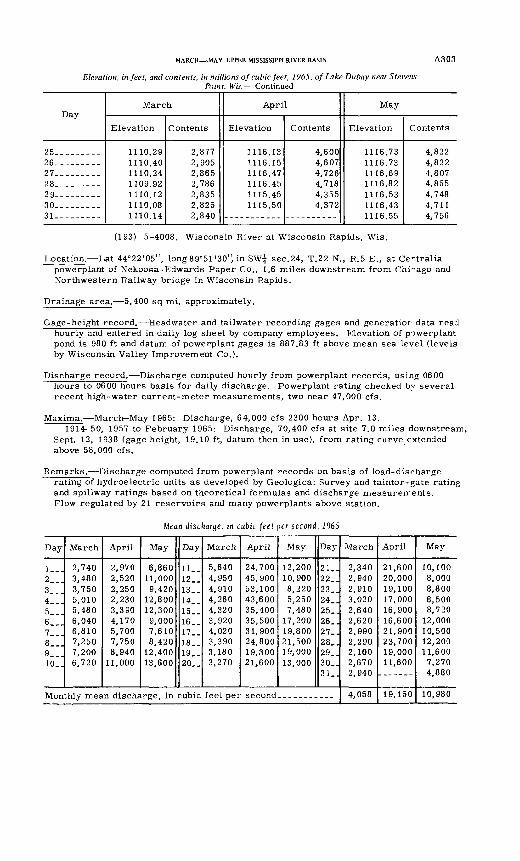
MARCH MAY, UPPER MISSISSIPPI RIVER BASIN A303
Elevation, in feet, and contents, in millions of cubic feet, 1965, of Lake Dubay near Stevens Point, Wis. Continued
Day
25-------26.-- 27- - -----28-. __ 29 ____ ...30 -. __ -_-31. __ ---
March
Elevation
1110.29 1110.40 1110.24 1109.92 1110.12 1110.08 1110.14
Contents
2,877 2,905 2,865 2,786 2,835 2,825 2,840
April
Elevation
1116.13 1116.15 1116.47 1116.45 1115.45 1115.50
Contents
4,600 4,607 4,726 4,718 4,355 4,372
May
Elevation
1116.73 1116.73 1116.69 1116.82 1116.53 1116.43 1116.55
Contents
4,822 4,822 4,807 4,855 4,748 4,711 4,756
(193) 5-4008. Wisconsin River at Wisconsin Rapids, Wis.
Location. Lat 44°22'05", long 89°51 "30", in SW^ sec.24, T.22 N., R.5 E., at Ce-itralia powerplant of Nekoosa-Edwards Paper Co., 1.6 miles downstream from Chi~ago and Northwestern Railway bridge in Wisconsin Rapids.
Drainage area. 5,400 sq mi, approximately.
Gage-height record. Headwater and tailwater recording gages and generatior data read hourly and entered in daily log sheet by company employees. Elevation of powerplant pond is 980 ft and datum of powerplant gages is 887.83 ft above mean sea level (levels by Wisconsin Valley Improvement Co.).
Discharge record. Discharge computed hourly from powerplant records, using 0600 hours to 0600 hours basis for daily discharge. Powerplant rating checked by several recent high-water current-meter measurements, two near 47,000 cfs.
Maxima. March-May 1965: Discharge, 64,000 cfs 2300 hours Apr. 13.1914-50, 1957 to February 1965: Discharge, 70,400 cfs at site 7.0 miles downstream,
Sept. 12, 1938 (gage height, 19.10 ft, datum then in use), from rating curve extended above 58,000 cfs.
Remarks.- Discharge computed from powerplant records on basis of load-discharge rating of hydroelectric units as developed by Geological Survey and taintor-gate rating and spillway ratings based on theoretical formulas and discharge measurerrents. Flow regulated by 21 reservoirs and many powerplants above station.
Mean discharge, m cubic feet per second, 1965
Day
1__.2...3...4...5...6...7...8...9...10..
March
2,7403,4803,7505,0105,4806,0406,8107,2507,2006,720
April
2,9702,5202,2502,2303,3904,1705,7007,7508,940
11,000
May
6,86011,0009,420
12,80012,3009,0007,6108,420
12,40013,600
Day
11..12..13..14..15..16..17..18..19. _20..
March
5,6404,9504,9104,2604,3203,9204,0203,3903,1803,270
April
24,70045,90053,10043,60035,40035,50031,90024,80019,30021,600
May
12,20010,9008,2205,2507,480
17,20019,80021,50019,00013,000
Day
21..22..23..24..25..26..27..28..29..30..q i
Monthly mean discharge, in cubic feet per second. _--__-_-_.
March
2,3402,9402,9103,0202,6402,6202,9902,2902,1002,6702 940
4,058
April
21,60020,00019,10017,00016,90016,60021,90023,70019,00011,600
19,150
May
10,1008,0008,8008,5008,720
12,00010,50012,20011,6007,2704,880
10,980
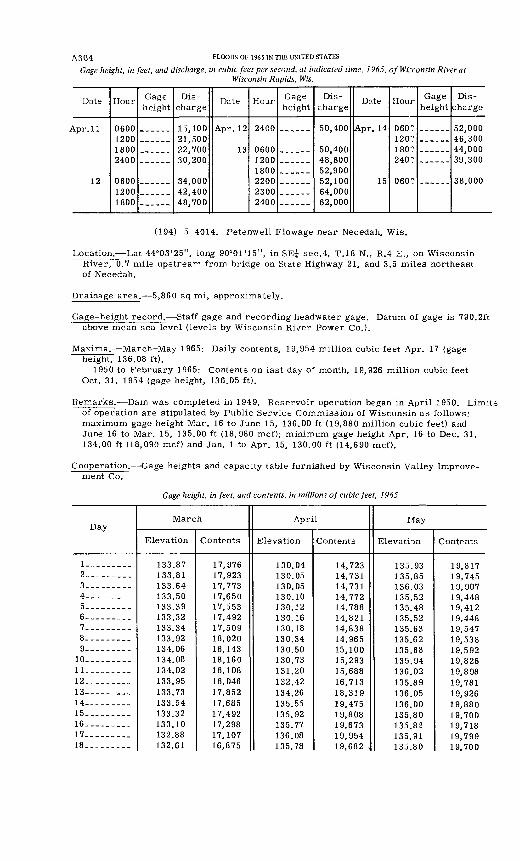
A3 04 FLOODS OF 1965 IN THE UNITED STATES
Gage height, in feet, and discharge, in cubic feet per second, at indicated time, 1965, of Wisconsin River atWisconsin Rapids, Wis.
Date
^pr.ll
12
Hour
0600120018002400
060012001800
Gage height
Dis charge
15,10021,50022,70030,200
34,00042,40048,700
Date
Apr. 12
13
Hour
2400
060012001800220023002400
Gage height
Dis
charge
50,400
50,40048,60052,90052,10064,00062,000
Date
Apr. 14
15
Hour
060?120^
180?240?
060?
Gage height
Dis
charge
52,00046,30044,00039,300
38,000
(194) 5 4014. Petenwell Flowage near Necedah, Wis.
Location. Lat 44°03'25", long 90°01'15", in SEf sec.4, T.18 N., R.4 E., on Wisconsin River, 0.7 mile upstream from bridge on State Highway 21, and 3.5 miles northeast of Necedah.
Drainage area. 5,860 sq mi, approximately.
Gage-height record. Staff gage and recording headwater gage. Datum of gage is 790.2ft above mean sea level (levels by Wisconsin River Power Co.).
Maxima.- March May 1965: Daily contents, 19,954 million cubic feet Apr. 17 (gage height, 136.08 ft).
1950 to February 1965: Contents on last day of month, 19,926 million cubic feet Oct. 31, 1954 (gage height, 136.05 ft).
Remarks. Dam was completed in 1949. Reservoir operation began in April 1950. Limits of operation are stipulated by Public Service Commission of Wisconsin as follows: maximum gage height Mar. 16 to June 15, 136.00 ft (19,880 million cubic feet) and June 16 to Mar. 15, 135.00 ft (18,980 mcf); minimum gage height Apr. 16 to Dec. 31, 134.00 ft (18,090 mcf) and Jan. 1 to Apr. 15, 130.00 ft (14,690 mcf).
Cooperation. Gage heights and capacity table furnished by Wisconsin Valley Improve ment Co.
Gage height, in feet, and contents, in millions of cubic feet, 1965
Day
1_ ---. __2-.--- __34-_- -_.-5 __ -.6 __ __ __7. __ -_-.-8------ __g
10----__ __11--. -----12-.--- __1 }
14---.- __15---------16- __ . __17 --------18-. ------
March
Elevation
133.87 133.81 133.64 133.50 133.39 133.32 133.34 133.92 134.06 134.08 134.02 133.95 133.73 133.54 133.32 133.10 132.88 132.61
Contents
17,976 17,923 17,773 17,650 17,553 17,492 17,509 18,020 18,143 18,160 18,108 18,046 17,852 17,685 17,492 17,298 17,107 16.875
April
Elevation
130.04 130.05 130.05 130.10 130.12 130.16 130.18 130.34 130.50 130.73 131.20 132.42 134.26 135.55 135.92 135.77 136.08 13R 78
Contents
14,723 14,731 14,731 14,772 14,788 14,821 14,838 14,965 15,100 15,293 15,688 16,713 18,319 19,475 19,808 19,673 19,954 19 RR9 .
May
Elevation
135.93 135.85 136.03 135.52 135.48 135.52 135.63 135.62 135.68 135.94 136.02 135.89 136.05 136.00 135.80 135.82 135.91 1 9=; sn
Contents
19,817 19,745 19,907 19,448 19,412 19,448 19,547 19,538 19,592 19,826 19,898 19,781 19,926 19,880 19,700 19,718 19,799 1 Q 7nn
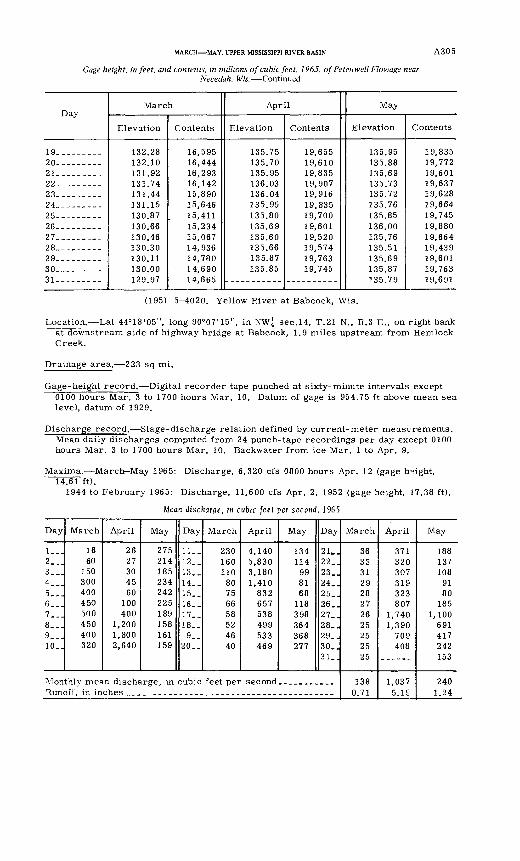
MARCH MAY, UPPER MISSISSIPPI RIVER BASIN A305
Gage height, in feet, and contents, in millions of cubic feet, 1965, of Petenwell Flowage near Necedah, Wis. Continued
Day
19. ___ . -20---- ---21-- __ .--22- -- .- .99
24 __ - --2526 __ -- -2728. __ - ___29 ..- - -9fl
91
March
Elevation
132.28 132.10 131.92 131.74 131.44 131.15 130.87 130.66 130.46 130.30 130.11 130.00 129.97
Contents
16,595 16,444 16,293 16,142 15,890 15,646 15,411 15,234 15,067 14,936 14,780 14,690 14,665
April
Elevation
135.75 135.70 135.95 136.03 136.04 135.95 135.80 135.69 135.60 135.66 135.87 135.85
Contents
19,655 19,610 19,835 19,907 19,916 19,835 19,700 19,601 19,520 19,574 19,763 19,745
May
Elevation
135.95 135.88 135.69 135.73 135.72 135.76 135.85 136.00 135.76 135.51 135.69 135.87 135.79
Contents
19,835 19,772 19,601 19,637 19,628 19,664 19,745 19,880 19,664 19,439 19,601 19,763 19,691
(195) 5-4020. Yellow River at Babcock, Wis.
Location. Lat 44°18'05", long 90°07'15", in NW| sec.14, T.21 N., R.3 E., on right bank at downstream side of highway bridge at Babcock, 1.9 miles upstream from Hemlock Creek.
Drainage area. 223 sq mi.
Gage-height record. Digital recorder tape punched at sixty-minute intervals except 0100 hours Mar. 3 to 1700 hours Mar. 10. Datum of gage is 954.75 ft above mean sea level, datum of 1929.
Discharge record. Stage-discharge relation defined by current-meter measurements. Mean daily discharges computed from 24 punch-tape recordings per day except 0100 hours Mar. 3 to 1700 hours Mar. 10. Backwater from ice Mar. 1 to Apr. 9.
Maxima. March-May 1965: Discharge, 6,320 cfs 0800 hours Apr. 12 (gage height, 14.61 ft).
1944 to February 1965: Discharge, 11,600 cfs Apr. 2, 1952 (gage height, 17,38 ft).
Mean discharge, in cubic feet per second, 1965
Day
!_-.2...3...4...5__.6...7...8__]9...10_.
March
1660
150300400450500450400320
April
2627304560
100400
1,2001,8002,640
May
275214185234242225189158161159
Day
11..12.,13. _14..15..16..17. _18..19.,20..
March
230160110
80756658524640
April
4,1405,8303,1801,410
832657538499533469
May
134114
998168
118398364368277
Day
21_.22..23..24..25..26. J27..28..29..30_.31
Runoff, in inches ....-_______-_ __-.__-_____----..---.-_-
March
3633312928272625252525
1380.71
April
371320307319323807
1,7401,390
709408
1 no 7
5. IS
May
188137108
9180
1851,100
691417242153
2401.24
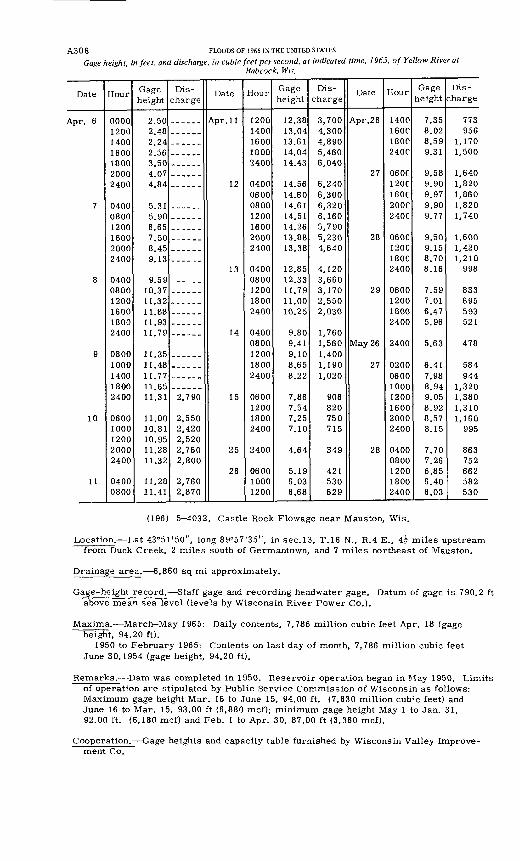
A30 6 FLOODS OF 1965 IN THE UNITED STATES
Gage height, in feet, and discharge, in cubic feet per second, at indicated time, 1965, of Yellow River atBabcock, Wis.
Date
7
8
9
10
11
Hour
0000120014001600180020002400
0400080012001600
2400
08001200160018002400
08001000140018002400
0600 1000 1200 2000 2400
0400 0800
Gage height
2 502.482.249 "ifi
? ^n4.074.84
^ it
5 on
6.657.508.459 1 ^
9.5910.37H O O
11.88n Q-2
11.79
n ^<i
11.4811.7711.6511.31
11.00 10.81 10.95 11.28 11.32
11.28 11.41
Dis
charge
2,790
2,550 2,420 2,520 2,760 2,800
2,760 2,870
Date
Apr. 11
12
13
14
15
25
26
Hour
12001400160018002400
04000600 08001200160020002400
0400 0800120018002400
04000800 120018002400
0600 1200 1800 2400
2400
0600 1000 1200
Gage height
12.3813.0413.6114.0414.43
14.5614.60 14.6114.5114.2613.8813.38
12.85 12.3311.7911.0010.25
9.809.41
8.658.22
7.86 7.54 7.25 7.10
4.64
5.19 6.03 6.68
Dis
charge
3,7004,3004,8905,4606,040
6,2406,300 6,3206,1605,7905,2304,640
4,120 3,6603,1702,5502,030
1,7601,560 1,4001,190
908 820 750 715
349
421 530 629
Date
27
28
29
May 26
27
28
Hour
1400160C180C240C
060C120C160C 200C240C
060C120C18002400
0600120018002400
2400
0200060010001200 1600 2000 2400
0400 0800 1200 1800 2400
Gage height
7.358.028.599.31
9.589.909.97 9.909.77
9.509.158.708.16
7.597.016.475.96
5.63
6.417.988.949.05 8.92 8.57 8.15
7.70 7.26 6.85 6.40 6.03
Dis
charge
773956
1,1701,500
1,6401,8201,860 1,8201,740
1,6001,4201,210998
833695593521
478
584944
1,3201,380 1,310 1,160 995
863 752 662 582 530
(196) 5-4032. Castle Rock Flowage near Mauston, Wis.
Location. Lat 43°51'50", long 89°57'35", in sec.13, T.16 N., R.4 E., 4| miles upstream from Duck Creek, 2 miles south of Germantown, and 7 miles northeast of Mauston.
Drainage area. 6,860 sq mi approximately.
Gage-height record. Staff gage and recording headwater gage. Datum of gage is 790.2 ft above mean sea level (levels by Wisconsin River Power Co.).
Maxima. March May 1965: Daily contents, 7,786 million cubic feet Apr. 18 (gage height, 94.20 ft).
1950 to February 1965: Contents on last day of month, 7,786 million cubic feet June 30,1954 (gage height, 94.20 ft).
Remarks.- Dam was completed in 1950. Reservoir operation began in May 1950. Limits of operation are stipulated by Public Service Commission of Wisconsin as follows: Maximum gage height Mar. 16 to June 15, 94.00 ft. (7,630 million cub'c feet) and June 16 to Mar. 15, 93.00 ft (6,880 mcf); minimum gage height May 1 to Jan. 31, 92.00 ft. (6,180 mcf) and Feb. 1 to Apr. 30, 87.00 ft (3,360 mcf).
Cooperation. Gage heights and capacity table furnished by Wisconsin Valley Improve- ment Co.
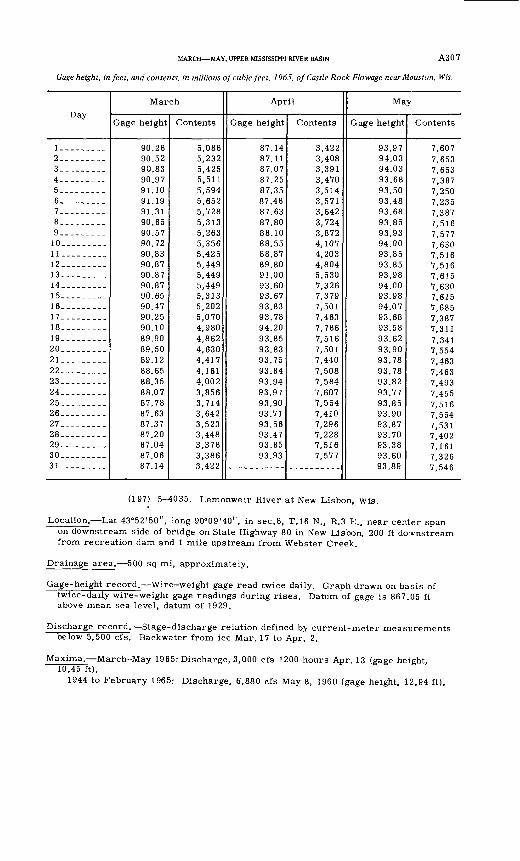
MARCH MAY, UPPER MISSISSIPPI RIVER BASIN A3 0 7
Gage height, in feet, and contents, in millions of cubic feet, 1965, of Castle Rock Flowage near Mansion, Wis.
Day
2_--.____-3.- ------4---------5---------6-------.-7___ -.8------...9---------10---------11---------12_.._ ....13---------14---------15--. .-.-16---------17--.-.....18--. -. -.19---------20....-----21...... ...22--.-.....23__. --.-..24---------25---------26---------27. -------28 ---.....29----..._.30--.-. ...,31---------
March
Gage height
90.28 90.52 90.83 90.97 91.10 91.19 91.31 90.65 90.57 90.72 90.83 90.87 90.87 90.87 90.65 90.47 90.25 90.10 89.90 89.50 89.12 88.65 88.35 88.07 87.78 87.63 87.37 87.20 87.04 87.06 87.14
Contents
5,088 5,232 5,425 5,511 5,594 5,652 5,728 5,313 5,263 5,356 5,425 5,449 5,449 5,449 5,313 5,202 5,070 4,980 4,862 4,630 4,417 4,161 4,002 3,856 3,714 3,642 3,523 3,448 3,378 3,386 3,422
April
Gage height
87.14 87.11 87.07 87.25 87.35 87.48 87.63 87.80 88.10 88.55 88.87 89.80 91.00 93.60 93.67 93.83 93.78 94.20 93.85 93.83 93.75 93.84 93.94 93.97 93.90 93.71 93.56 93.47 93.85 93.93
Contents
3,422 3,408 3,391 3,470 3,514 3,571 3,642 3,724 3,872 4,107 4,203 4,804 5,530 7,326 7,379 7,501 7,463 7,786 7,516 7,501 7,440 7,508 7,584 7,607 7,554 7,410 7,296 7,228 7,516 7,577
May
Gage height
93.97 94.03 94.03 93.68 93.50 93.48 93.68 93.85 93.93 94.00 93.85 93.85 93.98 94.00 93.98 94.07 93.68 93.58 93.62 93.90 93.78 93.78 93.82 93.77 93.85 93.90 93.87 93.70 93.38 93.60 93.89
Contents
7,607 7,653 7,653 7,387 7,250 7,235 7,387 7,516 7,577 7,630 7,516 7,516 7,615 7,630 7,615 7,685 7,387 7,311 7,341 7,554 7,463 7,463 7,493 7,455 7,516 7,554 7,531 7,402 7,161 7,326 7,546
(197) 5 4035. Lemonweir River at New Lisbon, Wis.
Location. Lat 43°52'50", long 90°09'40", in sec.8, T.16 N., R.3 E., near center span on downstream side of bridge on State Highway 80 in New Lisbon, 200 ft do-vnstream from recreation dam and 1 mile upstream from Webster Creek.
Drainage area. 500 sq mi, approximately.
Gage-height record. Wire-weight gage read twice daily. Graph drawn on basis of twice-daily wire-weight gage readings during rises. Datum of gage is 867.05 ft above mean sea level, datum of 1929.
Discharge record. Stage-discharge relation defined by current-meter measurements below 5,500 cfs. Backwater from ice Mar. 17 to Apr. 2.
Maxima. March-May 1965: Discharge, 3,000 cfs 1200 hours Apr. 13 (gage height, 10.45 ft).
1944 to February 1965: Discharge, 6,880 cfs May 8, 1960 (gage height, 12.94 ft).
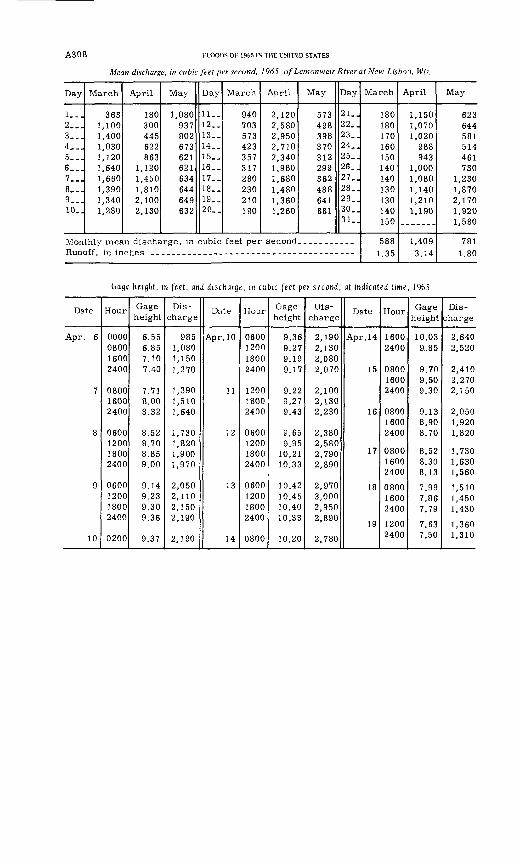
A308 FLOODSOF1965INTHEUNITED STATES
Mean discharge, in cubic feet per second, 1965, of Lemonweir River at New Lisbon, Wis.
Day
1__.2...3...4...5...6...7...8...9___10..
March
3631,1001,4001,0301,1201,6401,6601,3901,3401,280
April
180300445622863
1,1201,4501,8102,1002,130
May
1,080937802673621621634644649632
Day
11..12..13..14..15..16..17..18. _19..20..
March
940703573423357317280230210190
April
2,1202,5802,9502,7102,3401,9801,6801,4801,3601,260
May
573498398370312299362488641661
Day
21..22..23..24..25..26..27..28..29..30..31..
Monthly mean discharge, in cubic feet per second........ .._Runoff, in in
March
180180170160150140140130130140150
5881.35
April
1,1501,0701,020
988943
1,0001,0801,1401,2101,190
1,4093.14
May
623644581514461730
1,2301,8702,1701,9201,580
7811.80
G'age height, in feet, and discharge, in cubic feet per second, at indicated time, 1965
Date
Apr. 6
7
8
9
10
Hour
0000080016002400
080016002400
0600120018002400
0600120018002400
0200
Gage height
6.556.857.107.40
7.718.008.32
8.528.708.859.00
9.149.239.309.36
9.37
Dis charge
9851,0801,1501,270
1,3901,5101,640
1,7301,8201,9001,970
2,0502,1102,1502,190
2,190
Date
Apr. 10
11
12
13
14
Hour
0600120018002400
120018002400
0600120018002400
0600120018002400
0800
Gage height
9.369.279.199.17
9.229.279.43
9.659.95
10.2110.33
10.4210.4510.4010.33
10.20
Dis
charge
2,1902,1302,0802,070
2,1002,1302,230
2,3802,5802,7902,890
2,9703,0002,9502,890
2,780
Date
Apr. 14
15
16
17
18
19
Hour
16002400
080016002400
080016002400
080016002400
080016002400
12002400
Gage height
10.039.. 8 5
9.709.509.30
9.138.908.70
8.528.308.13
7.997.867.79
7.637.50
Dis charge
2,6402,520
2,4102,2702,150
2,0501,9201,820
1,7301,6301,560
1,5101,4501,430
1,3601,310
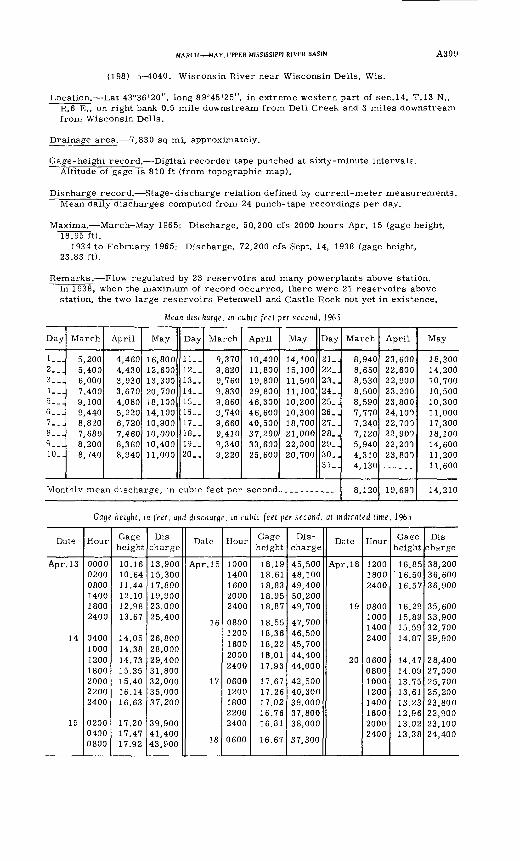
MARCH MAY, UPPER MISSISSIPPI RIVER BASIN A309
(198) 5 4040. Wisconsin River near Wisconsin Dells, Wis.
Location. Lat 43°36'20", long 89°45'25", in extreme western part of sec.14, T.13 N., R.6 E., on right bank 0.5 mile downstream from Dell Creek and 3 miles downstream from Wisconsin Dells.
Drainage area. 7,830 sq mi, approximately.
Gage-height record. Digital recorder tape punched at sixty-minute intervals, Altitude of gage is 810 ft (from topographic map).
Discharge record. Stage-discharge relation defined by current-meter measurements. Mean daily discharges computed from 24 punch-tape recordings per day.
Maxima.- March May 1965: Discharge, 50,200 cfs 2000 hours Apr. 15 (gage height, 18.95 ft).
1934 to February 1965: Discharge, 72,200 cfs Sept. 14, 1938 (gage height, 23.83 ft).
Remarks.- Flow regulated by 23 reservoirs and many powerplants above station. In 1938, when the maximum of record occurred, there were 21 reservoirs above station, the two large reservoirs Petenwell and Castle Rock not yet in existence.
Mean discharge, m cubic feet per second, 1965
Day
1...2...3...4...5___6...7...a...9...10. _
March
5,2005,4006,0007,4009,1009,4408,8207,6808,2008,740
April
4,4604,4303,9303,6704,0805,2206,7207,4608,3608,940
May
16,80012,60013,30020,70018,10014,10010,90010,00010,40011,000
Day
11..12. _13..14..15..16..17..18..19..20..
March
9,3709,8209,7609,8309,8609,7409,6609,4109,3409,220
April
10,40011,80019,80029,80046,30046,60040,50037,20033,60025,600
May
14,10015,10011,50011,10010,20010,30018,70021,00022,00020,700
Day
21..22..23..24..25..26..27..28..29..30..31..
Monthly mean discharge, in cubic feet per second........ ...
March
8,9408,6508,5308,5008,5907,7707,2407,1205,9404,3104,130
8,120
April
23,60022,60022,90023,20023,80024,10022,70022,90022,20023,800------
19,691
May
18,30014,20010,70010,50010,30011,00017,30018,10014,60011,20011,600
14,210
Gage height, m feet, and discharge, m cubic feet per second, at indicated time, 1965
Date
Apr. 13
14
15
Hour
000002000800140018002400
0400100012001800200022002400
020004000800
Gage height
10.1610.6411.4412.1012.9813.67
14.0514.3814.7315.3515.4016.1416.63
17.2017.4717.92
Dis
charge
13,90015,30017,80019,90023,00025,400
26,80028,00029,40031,80032,00035,00037,200
39,90041,40043,900
Date
Apr. 15
16
17
18
Hour
10001400160020002400
08001200160020002400
06001200180022002400
0600
Gage height
18.1918.6118.8318.9518.87
18.5518.3618.2218.0117.93
17.6717.2617.0216.7616.81
16.67
Dis
charge
45,50048,10049,40050,20049,700
47,70046,50045,70044,40044,000
42,50040,30039,00037,80038,000
37,300
Date
Apr. 18
19
20
Hour
120018002400
08001000 14002400
06000800100012001400160020002400
Ga<?e height
16.85' 16.5016.57
16.2915.89 15.5914.87
14.4714.0913.7513.6113.2312.9613.0213.38
Dis
charge
38,20036,60036,900
35,60033,900 32,70029,900
28,40027,00025,70025,20023,80022,90023,10024,400
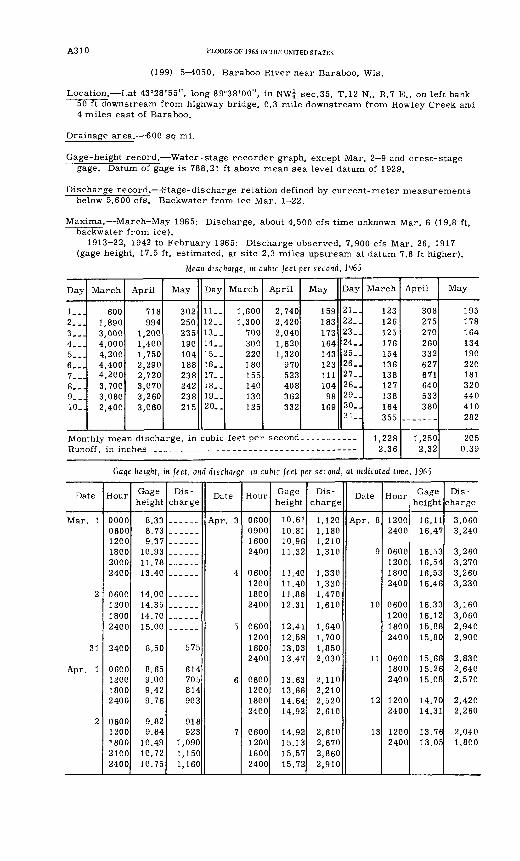
A310 FLOODS OF 1965 IN THE UNITED STATES
(199) 5^i050. Baraboo River near Baraboo, Wis
Location. Lat 43°28'55", long 89°38'00", in NWj sec.35, T.12 N., R.7 E., on left bank 50 ft downstream from highway bridge, 0.3 mile downstream from Rowley Creek and 4 miles east of Baraboo.
Drainage area. 600 sq mi.
Gage-height record. Water-stage recorder graph, except Mar. 2 9 and crest-stage gage. Datum of gage is 788.21 ft above mean sea level datum of 1929.
Discharge record. Stage-discharge relation defined by current-meter measurements below 5,600 cfs. Backwater from ice Mar. 1-22.
Maxima. March-May 1965: Discharge, about 4,500 cfs time unknown Mar. 6 (19.8 ft, backwater from ice).
1913-22, 1942 to February 1965: Discharge observed, 7,900 cfs Mar. 26, 1917 (gage height, 17.5 ft, estimated, at site 2.3 miles upstream at datum 7.6 ft higher).
Mean discharge, in cubic feet per second, 1965
Day
l._.2___3...4...5...6...7...8...9...10..
March
6001,8903,0004,0004,2004,4004,2003,7003,0802,400
April
718994
1,2001,4001,7502,2902,7203,0703,2603,060
May
302250235190104188238242238215
Day
11. _12..13..14__15..16..17..18..19..20..
March
1,6001,300
700300220180155140130125
April
2,7402,4202,0401,6201,320
970523408362332
May
159183173164143123111104
98169
Day
21..22..23..24..25..26..27..28..29..30..31..
Monthly mean discharge, in cubic feet per second. __.._.-.-.Runoff, in in i _
March
123126125176154136138127138164355
1,2282.36
-April
308275270260332627671640533380
1,2502.32
May
195178164134190220181320440410282
2050.39
Gage height, in feet, and discharge, m cubic feet per second, at indicated time, 1965
Date
Mar. 1
2
31
Apr. 1
2
Hour
000006001200180020002400
0600120018002400
2400
0600120018002400
06001200180021002400
Gage height
8.338.739.37
10.9311.7813.40
14.0014.3514.7015.00
8.50
8.659.009.429.76
9.829.84
10.4910.7210.75
Dis charge
575
614705814903
918923
1,0901,1501,160
Date
Apr. 3
4
5
6
7
Hour
0600090016002400
0600120018002400
0600120018002400
0600120018002400
0600120018002400
Gage height
10.6110.8110.9611.32
11.4011.4011.8612.31
12.4112.5813.0313.47
13.6313.8814.6414.92
14.9215.1315.5715.72
Dis charge
1,1201,1801,2101,310
1,3301,3301,4701,610
1,6401,7001,8502,030
2,1102,2102,5202,610
2,6102,6702,8602,910
Date
Apr. 8
9
10
11
12
13
Hour
12002400
0600120018002400
0600120018002400
060018002400
12002400
12002400
Gage height
16.1116.47
16.5316.5416.5316.46
16.3316.1215.8815.80
15.6615.2615.08
14.7014.31
13.7613.05
Dis
charge
3,0603,240
3,2603,2703,2603,230
3,1603,0602,9402,900
2,8302,6402,570
2,4202,260
2,0401,800
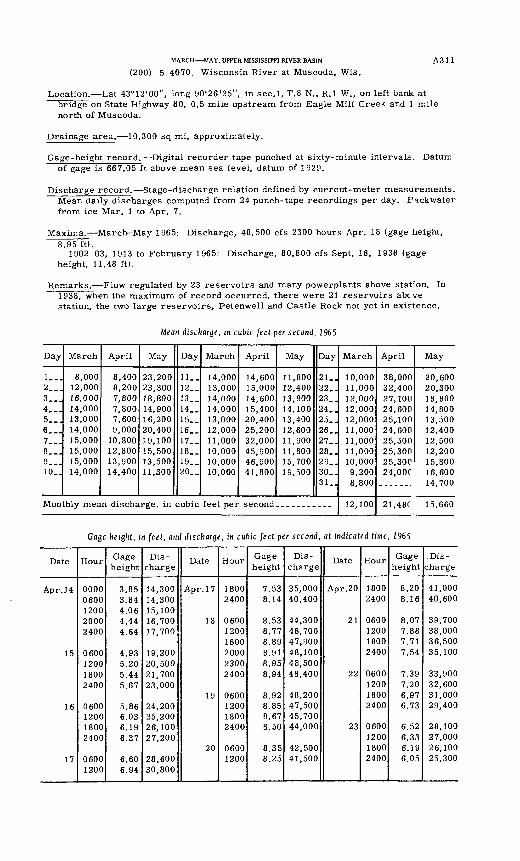
MARCH MAY, UPPER MISSISSIPPI RIVER BASIN
(200) 5-4070. Wisconsin River at Muscoda, Wis.A311
Location. Lat 43°12'00", long 90°26'25", in sec.l, T.8 N., R.I W., on left bank at bridge on State Highway 80, 0.5 mile upstream from Eagle Mill Creek and 1 mile north of Muscoda.
Drainage area. 10,300 sq mi, approximately.
Gage-height record. Digital recorder tape punched at sixty-minute intervals. Datum of gage is 667.05 ft above mean sea level, datum of 1929.
Discharge record. Stage-discharge relation defined by current-meter measurements. Mean daily discharges computed from 24 punch-tape recordings per day. Backwater from ice Mar. 1 to Apr. 7.
Maxima.- March-May 1965: Discharge, 48,500 cfs 2300 hours Apr. 18 (gage height, 8.95 ft).
1902-03, 1913 to February 1965: Discharge, 80,800 cfs Sept. 16, 1938 (gage height, 11.48 ft).
Remarks.- Flow regulated by 23 reservoirs and many powerplants above station. In 1938, when the maximum of record occurred, there were 21 reservoirs abcve station, the two large reservoirs, Petenwell and Castle Rock not yet in existence.
Mean discharge, in cubic feet per second, 1965
Day
1...2...3...4__.5...6...7...8...9...10..
March
8,00012,00016,00014,00013,00014,00015,00015,00015,00014,000
April
8,4008,2007,8007,8007,6009,000
10,80012,80013,90014,400
May
23,20023,30018,80014,90016,20020,40019,10015,50013,50011,300
Day
11..12..13_.14..15..16..17. _18..19..20. .
March
14,00013,00014,00014,00013,00012,00011,00010,00010,00010,000
April
14,60015,00014,60015,40020,40025,20032,00045,90046,90041,800
May
11,80012,40013,80014,10013,40012,60011,90011,80015,70019,500
Day
21..22..23..24..25..26..27..28..29..30..31..
Monthly mean discharge, in cubic feet per second.. _________
March
10,00011,00012,00012,00012,00011,00011,00011,00010,0009,2008,800
12,100
April
38,00032,40027,10024,60025,10024,60025,50025,30025,300
May
20,60020,30018,80014,80013,50012,40012,50012,20015,800
24.00C 16,600____ . 14,700
21.48C 15,660
Gage height, in feet, and discharge, in cubic feet per second, at indicated time, 1965
Date
Apr. 14
15
16
17
Hour
00000600120020002400
0600120018002400
0600120018002400
06001200
Gage height
3.853.844.064.444.64
4.935.205.445.67
5.866.036.196.37
6.606.94
Dis charge
14,30014,30015,10016,70017,700
19,20020,50021,70023,000
24,20025,20026,10027,200
28,60030,800
Date
Apr. 17
18
19
20
Hour
18002400
060012001600200023002400
0600120018002400
06001200
Gage height
7.538.14
8.538.778.898.918.958.94
8.928.858.678.50
8.358.25
Dis charge
35,00040,400
44,30046,70047,90048,10048,50048,400
48,20047,50045,70044,000
42,50041,500
Date
Apr. 20
21
22
23
Hour
18002400
0600120018002400
0600120018002400
0600120018002400
Gage height
8.208.16
8.077.887.717.54
7.397.206.976.73
6.526.336.196.05
.Dis
charge
41,00040,600
39,70038,00036,50035,100
33,90032,60031,00029,400
28,10027,00026,10025,300
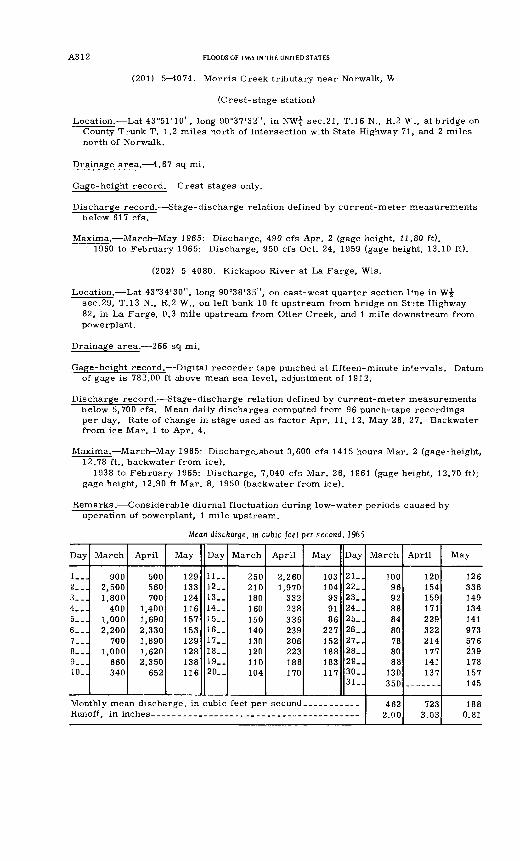
A3 1 2 FLOODS OF 1965 IN THE UNITED STATES
(201) 5 4074. Morris Creek tributary near Norwalk, V>
(Crest-stage station)
Location. Lat 43°51'10", long 90°37'32", in NWj sec.21, T.16 N., R.2 W., at bridge on County Trunk T, 1.2 miles north of intersection with State Highway 71, and 2 miles north of Norwalk.
Drainage area. 4.67 sq mi.
Gage-height record. Crest stages only.
Discharge record. Stage-discharge relation defined by current-meter measurements below 617 cfs.
Maxima. March-May 1965: Discharge, 490 cfs Apr. 2 (gage height, 11.80 ft).1960 to February 1965: Discharge, 950 cfs Oct. 24, 1959 (gage height, 13.10 ft).
(202) 5-4080. Kickapoo River at La Farge, Wis.
Location. Lat 43°34'30", long 90°38'35", on east-west quarter section Tne in Wf sec.29, T.13 N., R.2 W., on left bank 10 ft upstream from bridge on St?te Highway 82, in La Farge, 0.3 mile upstream from Otter Creek, and 1 mile downstream from powerplant.
Drainage area. 266 sq mi.
Gage-height record. Digital recorder tape punched at fifteen-minute intervals. Datum of gage is 782.00 ft above mean sea level, adjustment of 1912.
Discharge record. Stage-discharge relation defined by current-meter measurements below 5,700 cfs. Mean daily discharges computed from 96 punch-tape recordings per day. Rate of change in stage used as factor Apr. 11, 12, May 26, 27. Backwater from ice Mar. 1 to Apr. 4.
Maxima. March May 1965: Discharge^about 3,600 cfs 1415 hours Mar. 2 (gage-height, 12.78 ft., backwater from ice).
1938 to February 1965: Discharge, 7,040 cfs Mar. 26, 1961 (gage height, 12.70 ft); gage height, 12.90 ft Mar. 8, 1950 (backwater from ice).
Remarks. Considerable diurnal fluctuation during low-water periods caused by operation of powerplant, 1 mile upstream.
Mean discharge, in cubic feet per second, 1965
Day
1...2___3...4...5__.6__.7...8...9...10..
March
9002,5001,800400
1,0002,200700
1,000660340
April
500560700
1,4001,6902,3301,8901,6202,350
652
May
129133124116157153129128138116
Day
11..12..13..14__15..16__17. _18..19..20..
March
250210180160150140130120110104
April
2,2601,970332238336239206223188170
May
103104939186
227152188183117
Day
21..22..23_.24..25..26..27..28..29..30..31
Monthly mean discharge, in cubic feet per second___________Runoff, in ir
March
1009692888480788088
130350
4622.00
April
120154159171229322214177141137
7233.03
May
126338149134141973576239178157145
1880.81
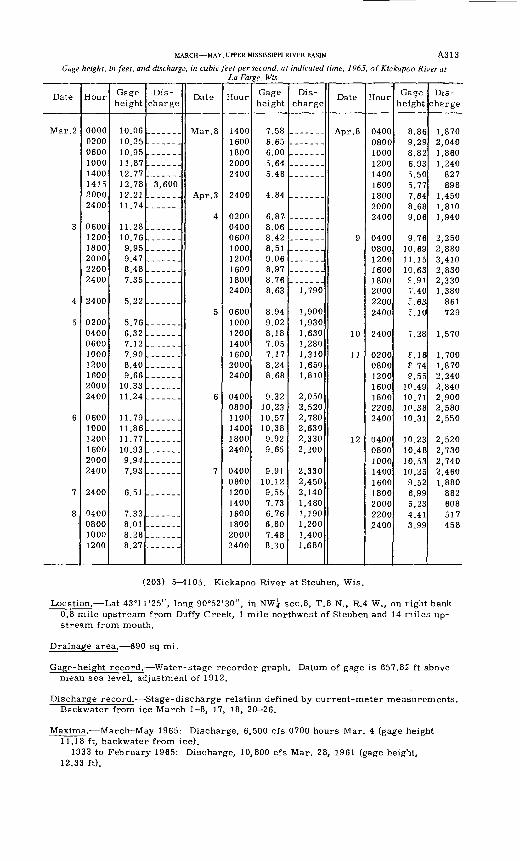
MARCH MAY, UPPER MISSISSIPPI RIVER BASIN A313
Gage height, in feet, and discharge, in cubic feet per second, at indicated time, 1965, of Kickapoo River atLa Farge, Wis.
Date
Mar. 2
3
4
5
6
7
8
Hour
000002000600100014001415 20002400
060012001800200022002400
2400
02000400060010001200160020002400
060010001200160020002400
2400
0400080010001200
Gage height
10.0610 2510.9511.8712.7712.78 12.2111.74
11.2810.769.959.478.487.35
5 22
5.766.327.127.908.409.66
10.3311.24
11.7911.8611.7710.939.947.93
6.51
7.338.018.288.27
Dis
charge
3,600
Date
5
6
7
Hour
14001600180020002400
2400
02000400060010001200160018002400
0600 100012001400
20002400
04000800 1100140018002400
04000800 12001400 1600180020002400
Gage height
7.586.656.005.645.48
4.84
6.878.068.428.519.068.978.768.63
8.94 9.028.187.057.178.248.68
9.3210.23 10.5710.389.929.65
9.9110.12 9.557.73 6.766.807.488.30
Dis
charge
1,790
1,900 1,9301,6301,2801,3101,6501,810
2,0502,520 2,7802,6302,3302,200
2,3302,450 2,1401,480 1,1901,2001,4001,680
Date
g
10
11
12
Hour
040008001000120014001600 180020002400
040008001200160018002000 22002400
2400
08001200160018002200 2400
04000800
14001600 18002000 22002400
Gage height
9 298 0 o
6 935 505.77 7.648 CO
9.06
9 7610.6911.151C. 639 91T.40R fi<!
f.10
7.28
P 74o 55
10.4910.7110.38 10.31
10 2310.4810,5310.259.52 6 995.23 4.413 99
Dis
charge
I P. 70
2,040
1,240827898
1,4501,8101,940
2 250
3,4102,8302 Q Qfl
1,380 861729
1,570
1,8702 2402,8402 9002,580 2,550
2 5209 7^n2 7402,4601,880 882608517458
(203) 5^4105. Kickapoo River at Steuben, Wis.
Location. Lat 43°11'25", long 90°52'30", in NW^ sec.8, T.8 N., R.4 W., on right bank 0.8 mile upstream from Duffy Creek, 1 mile northwest of Steuben and 14 miles up stream from mouth.
Drainage area. 690 sq mi.
Gage-height record. Water-stage recorder graph. Datum of gage is 657.82 ft above mean sea level, adjustment of 1912.
Discharge record. Stage-discharge relation defined by current-meter measurements. Backwater from ice March 1-8, 17, 18, 20-26.
Maxima. March May 1965: Discharge, 6,500 cfs 0700 hours Mar. 4 (gage height 11.18 ft, backwater from ice).
1933 to February 1965: Discharge, 10,800 cfs Mar. 28, 1961 (gage height, 12.33 ft).
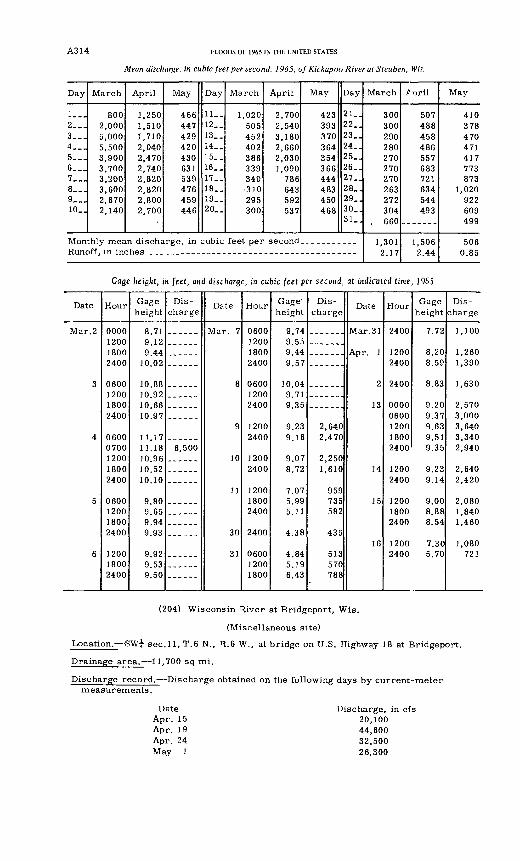
A3 14 FLOODS OF 1965 IN THE UNITED STATES
Mean discharge, in cubic feet per second, 1965, of Kickapoo River at Steuben, Wis.
Day
1__.2...3...4...5...6...7...8...9...10_.
March
8002,0005,0005,5003,9003,7003,2003,6002,6702,140
April
1,2501,5101,7102,0402,4702,7402,8202,8202,8002,700
May
466447429420430631539476459446
Day
11_.12..13..14__15..16..17_.18..19_.20. .
March
1,020505452402386339340310295300
April
2,7002,5403,1802,6602,0301,090
786643592537
May
423393370364354366444483450468
Day
21..22..23..24..25..26..27..28..29..30_.31..
Monthly mean discharge, in cubic feet per second. ._ -.__---_Runoff, in in r»l-|rto
March
300300290280270270270263272304
, 660
1,3012.17
.April
507488458486557683721634544493
1,5062.44
May
410378470471417773873
1,020922609499
5060.85
Gage height, in feet, and discharge, in cubic feet per second, at indicated time, 1965
Date
Mar.2
0
4
5
6
Hour
0000120018002400
0600120018002400
06000700 120018002400
0600120018002400
120018002400
Gage height
8.71Q 1 9
9 4410.02
10.8810.9210.6610.97
11.1711.18 10.9610.5210.10
9.809.659.949.93
9.929.539.50
Dis charge
6,500
Date
Mar. 7
8
9
10
11
30
31
Hour
0600120018002400
060012002400
1200 2400
12002400
1200 18002400
2400
060012001800
Gage'
height
9.749.559.449.57
10.049.719.35
9.23 9.16
9.078.72
7.07 5.995.11
4.38
4.845.196.43
Dis
charge
2,640 2,470
2,2501,610
959 735582
435
513570788
Date
Mar. 31
Apr. 1
2
13
14
15
16
Hour
2400
12002400
2400
000006001200 18002400
12002400
120018002400
1200 2400
Gage height
7.72
8.208.59
8.83
9.209.379.63 9.519.35
9.239.14
9.008.888.54
7.30 5.70
Dis charge
1,100
1,2601,390
1,630
2,5703,0003,640 3,3402,940
2,6402,420
2,0801,8401,460
1,080 721
(204) Wisconsin River at Bridgeport, Wis.
(Miscellaneous site)
Location. SWJ sec.11, T.6 N., H.6 W., at bridge on U.S. Highway 18 at Bridgeport.
Drainage area.- 11,700 sq mi.
Discharge record.- Discharge obtained on the following days by current-meter measurements.
Date Apr. 15 Apr. 19 Apr. 24 May 1
Discharge, in cfs 20,100 44,600 32,500 26,300
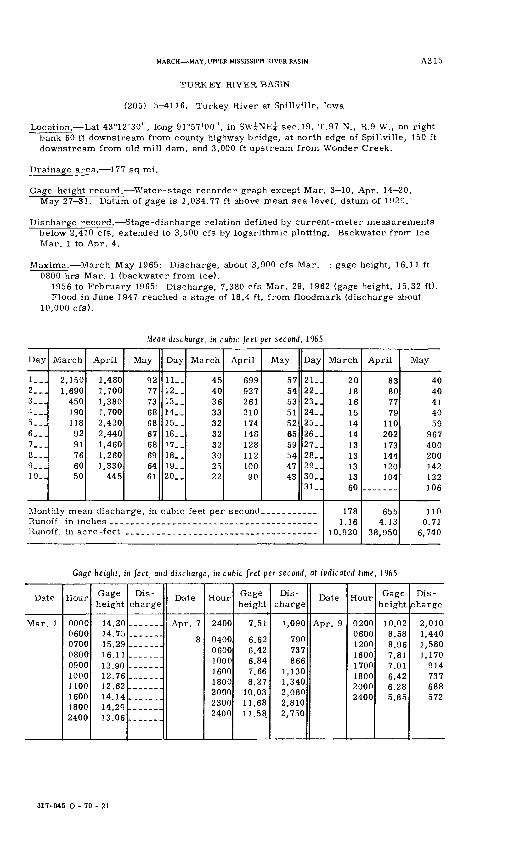
MARCH MAY, UPPER MISSISSIPPI RIVER BASIN A315
TURKEY RIVER BASIN
(205) 5^1116. Turkey River at Spillville, Iowa
Location. Lat 43°12'30", long 91°57'00", in SW^NE? sec. 19, T.97 N., R.9 W., on right bank 60 ft downstream from county highway bridge, at north edge of Spillville, 150 ft downstream from old mill dam, and 3,000 ft upstream from Wonder Creek.
Drainage area. 177 sq mi.
Gage-height record. Water-stage recorder graph except Mar. 3 10, Apr. 14 20, May 27-31. Datum of gage is 1,034.77 ft above mean sea level, datum of 1928.
Discharge record. Stage-discharge relation defined by current-meter measurements below 2,410 cfs, extended to 3,500 cfs by logarithmic plotting. Backwater frorr ice Mar. 1 to Apr. 4.
Maxima. March-May 1965: Discharge, about 3,900 cfs Mar. ; gage height, 16.11 ft 0800 hrs Mar. 1 (backwater from ice).
1956 to February 1965: Discharge, 7,380 cfs Mar. 29, 1962 (gage height, 15.32 ft).Flood in June 1947 reached a stage of 18.4 ft, from floodmark (discharge about
10,000 cfs).
Mean discharge, in cubic feet per second, 1965
Day
1__.2...3... 1...5...6...7...8...9...10_.
March
2,1501,690
4501901189291766050
April
1,4801,7001,3801,7002,4202,4401,4601,2601,330
445
May
92777368686768696461
Day
11..12..13..14._15..16..17.,18..19..20..
March
45403633323232302522
April
69992726121017414812811210090
May
57545351526559544743
Day
21..22..23..24..25..26..27..28..29..30..31
Monthly mean discharge, in cubic feet per second___________
Runoff, in acre -feet
March
2018161514141313131360
1781.16
10,920
April
83807779
110202173144120104
6554 1 ?
38,950
May
4040414059
967400200142122106
1100.71
6,740
Gagr height, in (eel, ami discharge, in cubic (eet per second, at indicated time, 1965
Date
Mar. 1
Hour
0000060007000800090010001100160018002400
Gage height
14.2014.7515.2916.11
12.7612.6214.1414.2913.06
Dis
chargeDate
Apr. 7
8
Hour
2400
04000600100016001800200023002400
Gage height
7.51
6.626.426.847.668.27
10.0311.6811.58
Dis
charge
1,090
790737866
1,1301,3402,0802,8102,750
Date Hour
02000600120016001700180020002400
Gage height
10.028.588.967.817.016 A*)
6.285.85
Dis
charge
2,0101,4401,5801,170
914797
688572
317-045 O - 70 - 21
A31 6 FLOODS OF 1965 IN THE UNITED STATES
(206) 5-4116.5. Crane Creek tributary near Saratoga, Iowa
(Crest-stage station)
Location. Near SE corner of sec.21, T.99 N., R. 13 W., at bridge on State Highway 9, 1 mile east of Saratoga.
Drainage area.- 4.06 sq mi.
Gage-height record. Crest stages only.
Discharge record. Stage-discharge relation defined by current-meter measurements below 355 cfs and by contracted-opening measurement at 1,830 cfs.
Maxima.- March-May 1965: Discharge, about 800 cfs Apr. 8 (gage height, 5.70 ft, backwater from ice).
1953 to February 1965: Discharge, 1,830 cfs Aug. 31, 1962 (gage height, 6.32 ft).
(207) 5-4117. Crane Creek near Lourdes, Iowa
(Crest-stage station)
Location. NWJ sec.6, T.97 N., R.12 W., at bridge on State Highway 272, 1 mile south west of Lourdes.
Drainage area. 75.8 sq mi.
Gage-height record. Crest stages only.
Discharge record. Stage-discharge relation defined by current-meter measurements below 3,340 cfs and by contracted-opening measurement at 11,900 c fs.
Maxima.- March-May 1965: Discharge, about 1,000 cfs Mar. 1 (gage height, 12.6 ft, backwater from ice).
1953 to February 1965: Discharge, 11,900 cfs Aug. 31, 1962 (gage height, 15.70 ft).
(206) 5-4125. Turkey River at Garber, Iowa
Location. Lat 42°44'20", long 91°15'45", in NE^SW? sec.36, T.92 N., R.4 W., on left bank 10 ft downstream from highway bridge at Garber, 800 ft upstream from Wayman Creek, 2,000 ft downstream from Elk Creek, and 1 mile downstream from Volga River.
Drainage area. 1,545 sq mi.
Gage-height record. Water-stage recorder graph except Feb. 27 Mar. 5, for which graph was reconstructed on basis of twice daily wire-weight gage readings. Datum of gage is 634.46 ft above mean sea level, datum of 1929.
Discharge record. Stage-discharge relation defined by current-meter measurements below 25,000 cfs. Backwater from ice Mar. 1-9, 19-28.
Maxima. March May 1965: Discharge, 13,800 cfs 1800 hours Apr. 1; gage height observed, 22,10 ft 0800-0900 hours Mar. 1.
1913-16, 1919-27, 1929-30, 1932 to February 1965: Discharge,32.300 cfs Feb. 23, 1922 (gage height, 28.06 ft, from floodmark).
Maximum stage known since about 1890, that of Feb. 23, 1922.
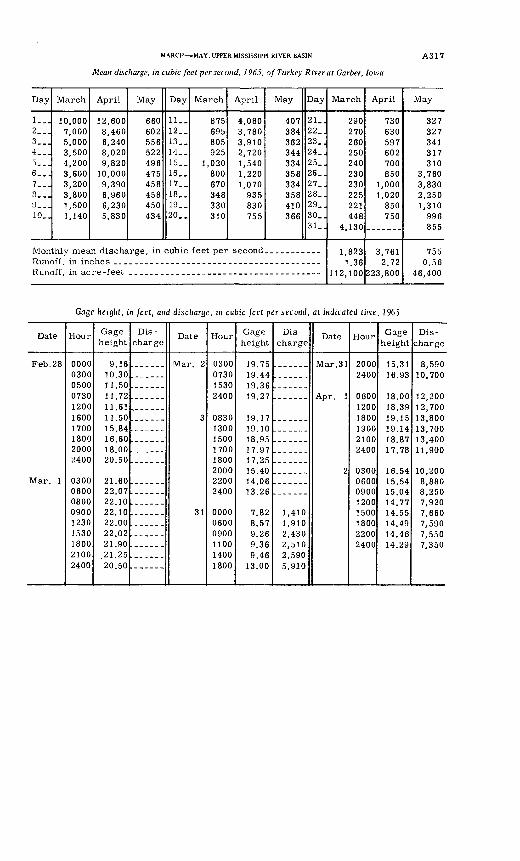
MARCH MAY, UPPER MISSISSIPPI RIVER BASIN
Mean discharge, in cubic feet per second, 1965, of Turkey River at Garber, Iowa
A317
Day
1...2...3...4__.5...6...7...3...t)__.10..
March
10,0007,0005,0003,5004,2003,6003,2003,8001,5001,140
April
12,6008,4606,2408,0209,820
10,0009,3906,9606,2305,830
May
660602556522496475458458450434
Day
11..12. _13. _14. _15. _16. _17..18..19__20..
March
875695805925
1,020800670348330310
April
4,0803,7803,9102,7201,5401,2201,070
935830755
May
407384362344334358334358410366
Day
21..22..23..24..25..26..27..28..29_.30..31..
Runoff in inches . - ______Runoff, in acre -feet
March
290270260250240230230225221448
4,130
1 Q O Q
1 O C
112,100
April
730630597602700850
1,0001,020
850750
-------
3 *7C 1
2 72223,800
May
327327341317310
3,7603,8302,2501,310
996855
755O C ft
46,400
Cage height, in feet, and discharge, in cubic feet per second, at indicated time, 1965
Date
Feb. 28
Mar. 1
Hour
0000030005000730120016001700180020002400
030006000800090012301530180021002400
Gage height
9.1610.3011.5011.7211.6111.5015.8416.6018.0020.50
21.6022.0722.1022.1022.0022.0221.9021.2520.50
Dis charge
'
Date
3
31
Hour
0300073015302400
08301300150017001800200022002400
0000060009001100
1800
Gage height
19.7519 4419.36
19.1719.1018.9517.9717.2515.4014.0613.26
7.828.579 9R
9 ^R
9.4613.00
Dis
charge
1,4101,9109 490
2,5102 5905,910
Date
Mar.31
Apr. 1
2
Hour
20002400
060012001800190021002400
03000600090012001500180022002400
Gage height
15.31i R ci^
18.0018.3919.1519.1418.8717.78
16.5415 5415.0414.7714 5514 4914.461_. 9Q
Dis charge
8,59010,700
12,70013,80013,70013,40011,900
10,2008,8808,2507 9207,6607,5907,5507 ^^n
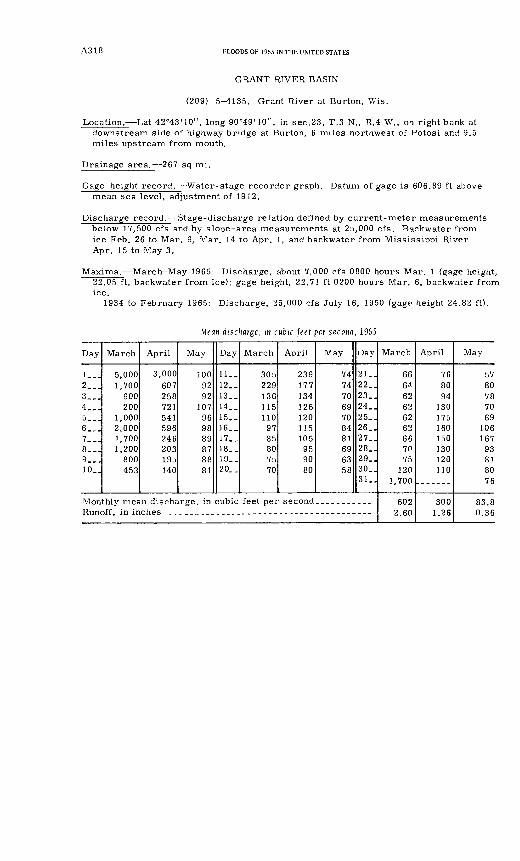
A318 FLOODS OF 1965 IN THE UNITED STATES
GRANT RIVER BASIN
(209) 5-4135. Grant River at Burton, Wis.
Location. Lat 42°43'10", long 90°49'10", in sec.23, T.3 N., R.4 W., on right bank at downstream side of highway bridge at Burton, 6 miles northwest of Potosi and 9.5 miles upstream from mouth.
Drainage area. 267 sq mi.
Gage-height record. Water-stage recorder graph. Datum of gage is 606.89 ft above mean sea level, adjustment of 1912.
Discharge record. Stage-discharge relation defined by current-meter measurements below 17,500 cfs and by slope-area measurements at 25,000 cfs. Backwater from ice Feb. 26 to Mar. 9, Mar. 14 to Apr. 1, and backwater from Mississippi River Apr. 15 to May 3.
Maxima. March-May 1965: Discharge, about 7,000 cfs 0800 hours Mar. 1 (gage height, 22.05 ft, backwater from ice); gage height, 22.71 ft 0200 hours Mar. 6, backwater from ice.
1934 to February 1965: Discharge, 25,000 cfs July 16, 1950 (gage height 24.82 ft).
Mean discharge, in cubic feet per second, 1965
Day
!_-.2__.3...4...5...6...7__.8...9._.10_.
March
5,0001,700900200
1,0002,0001,7001,200800453
April
3,000607258721541596246203195140
May
1009292
107969889878881
Day
11..12-.13-.14-.15-.16-.17__18..19_-20_.
March
3052291361151109785807570
April
239177134126120115105959080
May
74747069708481696358
Day
21..22..23..24..25..26_.27..28_.29..30..31..
Runoff, in in
March
666*
62626262667075
1201,700
cno
2.60
April
768094
130175160150130120110
3001.26
May
5780787069
10616793818076
Q O Q
0.36
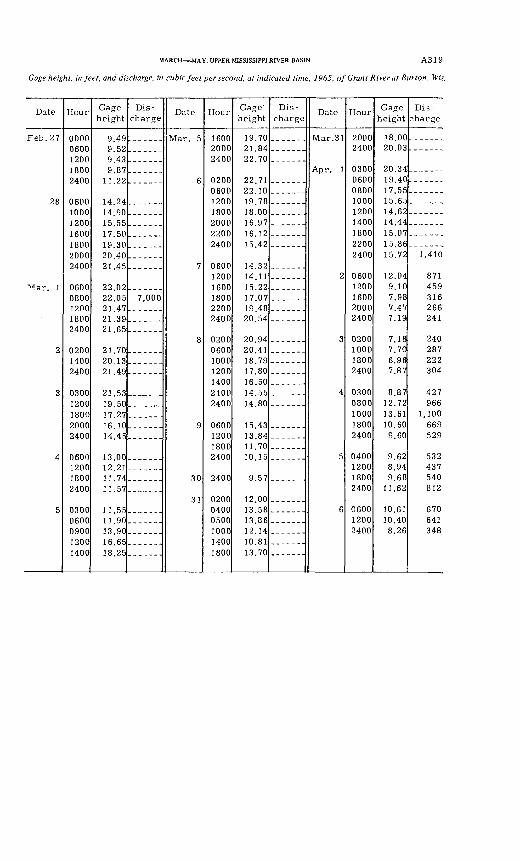
MARCH MAY, UPPER MISSISSIPPI RIVER BASIN A3 1 9
Gage height, in feet, and discharge, in cubic feet per second, at indicated time, 1965, of Grant River at Burton, Wis.
Date
Feb. 27
28
Mar. 1
3
5
Hour
00000600120018002400
060010001200160018002000
06000800
18002400
0200
2400
03001200180020002400
0600120018002400
03000600
12001400
Gage height
9 499 CO
9 439 07
1122
14 2414 90155517.50i Q ?n20.4021 45
22 0222.0521.4791 9Q
21.65
o i 7fi
on 1 Q
21.49
215319 5017.2716.1014.45
13.0012.2111.7411.57
11.90i ^ on16.6518.25
Dis
charge
7,000
Date
Ma 5
7
8
9
30
3 1
Hour
160020002400
060012001800200022002400
12001600180022002400
020006001000
140021002400
0600120018002400
020004000500100014001800
Gage-
height
19.7021.8422.70
22.71
197818.0016.9716.1215 42
14 32
1 c OO
17.0719.4820.54
20.9420.4118.7917.8016.5014.5514.80
15.4313.8411.7010.15
9.57
12.0013.5813.8612.1410.8113.70
Dis
chargeDate
Mar. 31
Apr. 1
2
3
4
5
6
Hour
20002400
030006000800100012001400180022002400
06001200160020002400
0200100018002400
03000800100018002400
0400120018002400
060012002400
Gage height
18.0020.03
20.3419.4017.55^15.6514.6214.4415.0715.8615.72
12.049.107.987.477.19
7.187.706.967.87
8.8712.7213.6110,609.60
9.628.949.68
11.62
10.6110.408.26
Dis
charge
1,410
871459316266241
240287222304
427966
1,100669529
532437540812
670641348
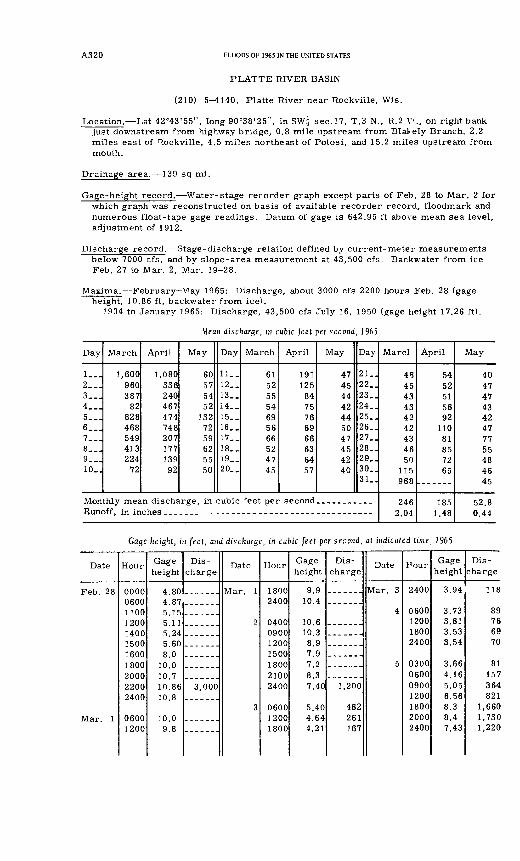
A320 FLOODS OF 1965 IN THE UNITED STATES
PLATTE RIVER BASIN
(210) 5^140. Platte River near Rockville, Wis.
Location. Lat 42°43'55", long 90°38'25", in SW| sec.17, T.3 N., R.2 V., on right bank just downstream from highway bridge, 0.8 mile upstream from Blakely Branch, 2.2 miles east of Rockville, 4.5 miles northeast of Potosi, and 15.2 miles upstream from mouth.
Drainage area. 139 sq mi.
Gage-height record. Water-stage recorder graph except parts of Feb. 28 to Mar. 2 for which graph was reconstructed on basis of available recorder record, floodmark and numerous float-tape gage readings. Datum of gage is 642.95 ft above mean sea level, adjustment of 1912.
Discharge record. Stage-discharge relation defined by current-meter measurements below 7000 cfs, and by slope-area measurement at 43,500 cfs. Backwater from ice Feb. 27 to Mar. 2, Mar. 19-28.
Maxima. February-May 1965: Discharge, about 3000 cfs 2200 hours Feb. 28 (gage height, 10.86 ft, backwater from ice).
1934 to January 1965: Discharge, 43,500 cfs July 16, 1950 (gage height 17.26 ft).
Mean discharge, m cubic feel per second, 1965
Day
1...2...3...4...5__.6...7__.8__.9...10_.
March
1,600960387
82828468549413224
72
April
1,08033624046747474820717713992
May
60575452
1327259625550
Day
11..12..13_.14..15..16..17. _18..19_.20..
March
61525554695666524745
April
191125
8475766966636457
May
47454442445047454240
Day
21..22..23..24..25..26..27..28..29..30..31..
Monthly mea" Hisrharcrp in onhio feet ner senond
Runoff, in in
Marcl
464543434242434650
115968
2462.04
April
5452515692
11081857265
1 o c
1.48
May
4047474342477755484645
CO Q
0.44
Gflgc height, in feet, and discharge, in cubic feet per second, at indicated time, 1965
Date
Feb. 28
Hour
0000060011001200140015001600180020002200 2400
06001200
Gage height
4.804.87
5.11R 9A.
5.608.0
10.010.710.86 10.8
10.09.8
Dis
charge
3,000
Date
Mar 1
2
3
Hour
18002400
0400090012001500
21002400
0600 12001800
Gage height
9.910.4
10.610.38.97.97.28.37.40
5.40 4.644.21
Dis
charge
1,200
462 261167
Date
Mar. 3
4
5
Four
2400
0600120018002400
030006000900 12001800 20002400
Gage height
3.94
3.733.613.533.54
3.664.165.05 6.568.3 8.47.43
Dis
charge
118
89766970
81157364821
1,660 1,7301,220
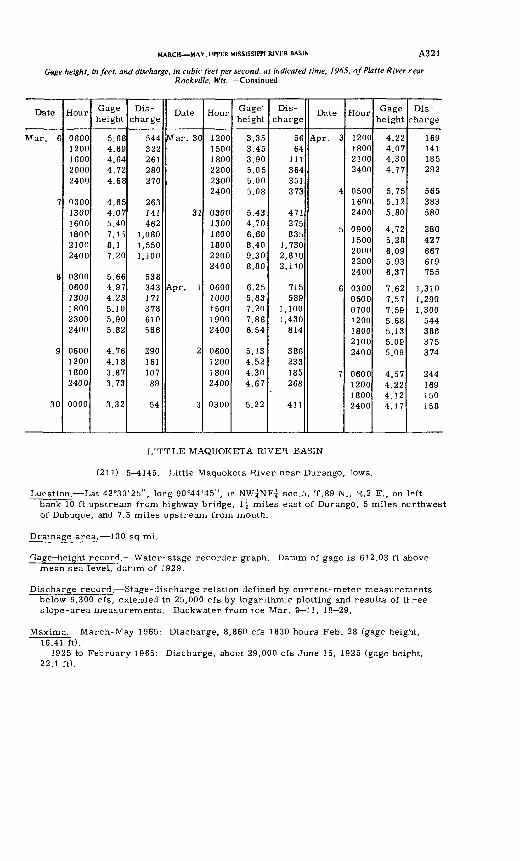
MARCH MAY, UPPER MISSISSIPPI RIVER BASIN A321
Gage height, in feet, and discharge, in cubic feet per second, at indicated time, 1965, of Plane River rear Rockville, Wis. -Continued
Date
Mar. 6
7
8
9
30
Hour
06001200160020002400
030013001600 180021002400
030006001300180023002400
0600120018002400
0000
Gage height
5.684.894.644.724.68
4.654.075.40 7.158.17.20
5.664.974.235.105.905.82
4.764.183.873.73
3.32
Dis
charge
544322261280270
263341462
1,0801,5501,100
538343171378610586
29016110789
54
Date
Mar. 30
31
Apr. 1
2
3
Hour
120035001800220023002400
03001300 1600180022002400
06001000350019002400
0600120018002400
0300
Gage-
height
3.353.453.905.055.005.08
5.434.70 6.608.409.308.80
6.255.837.207.866.54
5.134.524.304.67
5.22
Dis
charge
5664
111364351373
471275 835
1,7302,8102,110
715589
1,1001,430814
386233185268
411
Date
Apr. 3
4
5
6
7
Hour
1200180021002400
050016002400
09001500200022002400
0300050007001200180021002400
0600120018002400
Gage height
4.224.074.304.77
5.755.125.80
4.725.286.095.936.37
7.627.577.595.685.135.095.09
4.574.224.124.17
Dis
charge
169141185292
565383580
280427667619755
1,3101,2901,300544386375374
244169150158
LITTLE MAQUOKETA RIVER BASIN
(211) 5-4145. Little Maquoketa River near Durango, Iowa.
Location. Lat 42°33'25", long 90°44'45", in NW^NE^ sec.5, T.89 N., R.2 E., on l«?ft bank 10 ft upstream from highway bridge, if miles east of Durango, 5 miles northwest of Dubuque, and 7.5 miles upstream from mouth.
Drainage area. 130 sq mi.
Gage height record. Water-stage recorder graph. Datum of gage is 612.03 ft above mean sea level, datum of 1929.
Discharge record. Stage-discharge relation defined by current-meter measurements below 6,300 cfs, extended to 25,000 cfs by logarithmic plotting and results of tt ree slope-area measurements. Backwater from ice Mar. 9 11, 18 29.
Maxima.- March-May 1965: Discharge, 8,860 cfs 1830 hours Feb. 28 (gage height, 16.41 ft).
1925 to February 1965: Discharge, about 29,000 cfs June 15, 1925 (gage heifht, 22.1 ft).
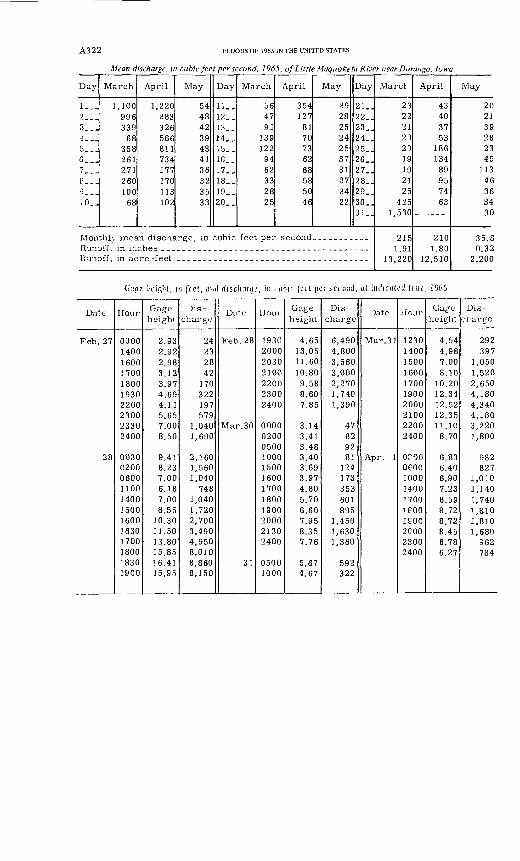
A322 FLOODS OF 1965 IN THE UNITED STATES
Mean discharge, in cubic feet per second, 1965, of Little Maquoketa River near Durango, Iowa
Day
l._.2___3__.4...5...6...7 --1a__.9...10..
March
] JOO996339
68358261271260100
68
April
1,220283326566811734177170113102
May
54484239434136323533
Day
11..12..13..14..15..16..17..18..19..20..
March
564791
139]22
9462332825
April
354127
8170736268585046
May
29282524253731272422
Day
21..22..23..24..25..26_.27..28..29..30..31..
Monthly mean discharge, in cubic feet per second..... __.-__
Runoff, in acre -feet
March
232221202019192125
4251,530
215191
13,220
April
43403753
186134
89957463
------
2101.80
12,510
May
202139282345
11346363430
35.80 32
2,200
Cage lu'iglit, in feet, aiiii discharge, in . ubic fed per second, at indicated time, l%5
Dale
Feb. 27
28
Hour
000014001600]700180019302200230023302400
003002000600110014001500160016301700180018301900
Gage height
2.932.922.983.123.974.694.115.657.008.50
9.418.237.006.187.008.55
10.301].5013.8015.8516.4115.95
Dis charge
24232842
170322197579
1,0401,690
2,1601,5601,040
7481,0401,7202,7003,4904,9508,0108,8608,150
Date
Feb. 28
Mar. 30
31
Hour
1930200020302100220023002400
000002000500100015001600170018001900200021302400
05001000
Gage height
14.6513.0511.6010.809.588.607.85
3.143.413.483.403.693.974.805.706.607.958.357.76
5.674.67
Dis
charge
6,4904,8003,5603,0002,2701,7401,390
47829281
124173353601895
1,4501,6301,360
592322
Date
Mar. 31
Apr. 1
Hour
1230140015001600170019002000210022002400
orooOPOO1000140017001FOOIfOO2COO23002400
Gage height
4.544.987.008.10
10.2012.3412.5212.3511.10
8.70
6.836.406.907.238.598.728.728.456.786.27
Dis
charge
292397
1,0501,5202,6504,1804,3404,1803,2201,800
982827
1,0101,1401,7401,8101,8101,680
962784
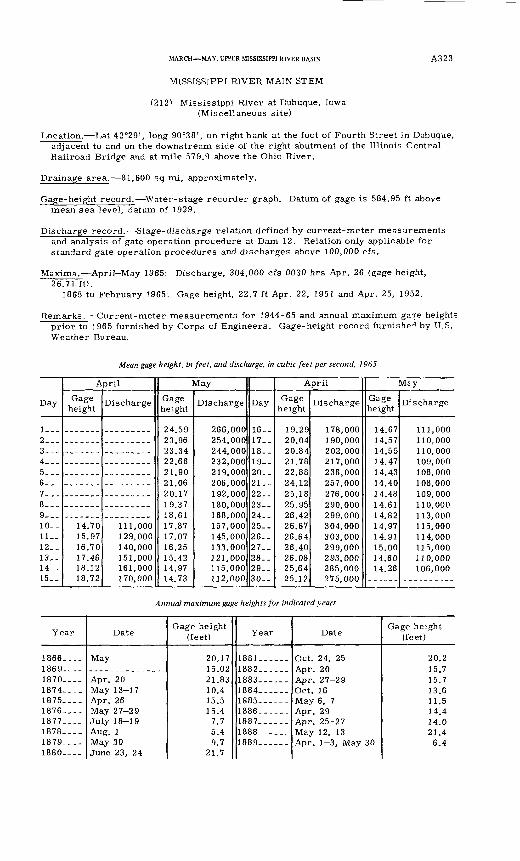
MARCH MAY, UPPER MISSISSIPPI RIVER BASIN A3 2 3
MISSISSIPPI RIVER MAIN STEM
(212> Mississippi River at Dubuque, Iowa (Miscellaneous site)
Location. Lat 42°29', long 90°38', on right bank at the foot of Fourth Street in Dubuque, adjacent to and on the downstream side of the right abutment of the Illinois Central Railroad Bridge and at mile 579,9 above the Ohio River.
Drainage area. 81,600 sq mi, approximately.
Gage-height record. Water-stage recorder graph. Datum of gage is 584.95 ft above mean sea level, datum of 1929.
Discharge record. Stage-discharge relation defined by current-meter measurements and analysis of gate operation procedure at Dam 12. Relation only applicable for standard gate operation procedures and discharges above 100,000 cfs.
Maxima. April-May 1965: Discharge, 304,000 cfs 0030 hrs Apr. 26 (gage height, 26.71 ft).
1865 to February 1965: Gage height, 22.7 ft Apr. 22, 1951 and Apr. 25, 1952.
Remarks.- Current-meter measurements for 1944-65 and annual maximum ga?e heights prior to 1965 furnished by Corps of Engineers. Gage-height record furnished by U.S. Weather Bureau.
Mean gage height, in feet, and discharge, in cubic feet per second, 1965
Day
1---2 ...3---4--.5--.6_-7---8--.9 __10-_ 11_- 12-- 13_. 14__ 15.-
A
Gage height
14.70 15.97 16.70 17.46 18.12 18.72
pril
Discharge
111,000 129,000 140,000 151,000 161,000 170,000
I
Gage height
24 5923.9623.3422.66O 1 Qf\
21.0620.17
17.87 17.07 16.25 15.42 14.97 14.73
VI ay
Discharge
266,000254,000
219,000206,000192,000180,000168,000157,000 145,000 133,000 121,000 115,000 112,000
Day
16.-17-.18--1920--21--22--2324--25-- 26-- 27-- 28.- 29_. 30--
A
Gage height
19 2920.0420.8421.7822.8824.1225.189^; QR26.4226.67 26.64 26.40 26.08 25.64 25.12
pril
Discharge
178,000190,000202,000
236,000
276,000290,0009QQ nnn304,000 303,000 299,000 293,000 285,000 275,000
Gage height
14.6714.571 A. ^
14.4714 43
14.4814.6114.8214.97 14.91 15.00 14.60 14.26
Mey
Discharge
111,000110,000
108,000
109,000110,000
115,000 114,000 115,000 110,000 106,000
Annual maximum gage heights for indicated years
Year
1866-- -1869----1870----1874----1875 .--1876-.--1877---.1878 --_1879 -.-1880--.-
Date
Apr. 20May 13-17Apr. 26
July 18-19Aug. 1May 30June 23, 24
Gage height (feet)
20.1715.0221.8310.415.51547.75.49.7
21.7
Year
1881------1882--- --1883 ___ -1884-- --_-1885-- --1886-- -.1887.-- -1888 ----1889 -----
Date
Ar>r- 97 9Q
Oct. 16May 6, 7AI-IT- 9Q
Apr, 25-27May 12, 13
Gage height (feet)
20.21571^7
11.5
14.021.46.4
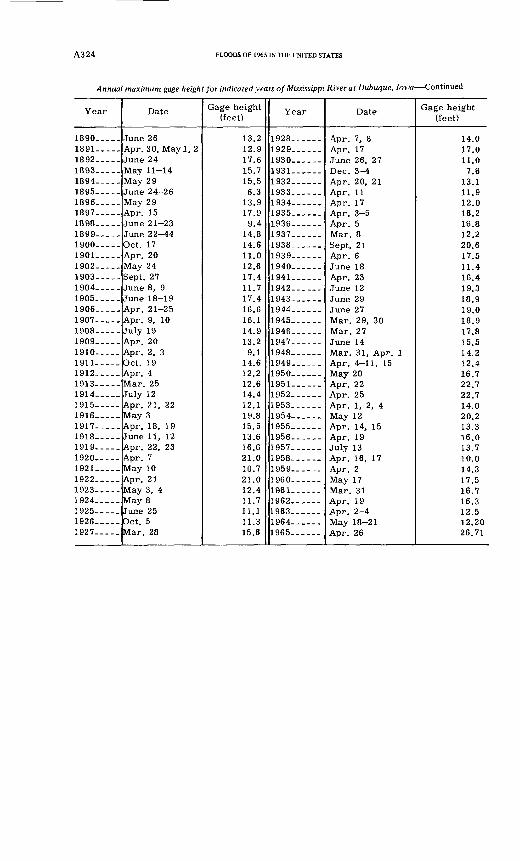
A324 FLOODS OF 1965 IN THE UNITED STATES
Annual maximum gage height for indicated years of Mississippi River at Dubuque, lo\ >a Continued
Year
1890 _.1891 _____1892---.-1893-----1894- -._1895 __ .-1896---.-1897 _____1898 --_-1899-----1900---.-1901-----1902---.-1903 __ --1904-- ._1905-----1906---..1907 __ -1908-----1909 __ --1910 --1911--- -1912 ___ _1913-- 1914 _____1915 ___ -1916 -1917-----1918-----1919 _1920 ---1921 ___ -1922 _____1923 _____1924 __ -.1925 - 1926 - 1927-
Date
Apr. 30, May 1, 2June 24May 11-14
MQV 9Q
Apr. 15
Oct. 17
Sept. 27
June 18-19Apr. 21-25
July 19Apr. 20Apr. 2, 3Oct. 19
Mar. 25July 12Apr. 21, 22
June 11, 12Apr. 22, 23Apr. 7May 10Apr. 21
May 8
Oct. 5Mar. 28
Gage height (feet)
139
12.917.6157
15.56.3
U Q
1799.4
14.814.611.012.617.411.717.416.616.114.91 0 O
9.114.612.212.614.412.119.815.513.616.621.010.721.012.411.711.1n o
15.6
Year
1928------1 Q9Q
1930 ___ --1 Q 0. 1
1 9321 Q 1^
1 9341 Q 0. 1^
1936 __ -.1937 __ ._-1938------1 Q*?Q
1940------1 Q41
1942--_ 1943------19441 QA 1^
1946------1 Q47
1948 __ ___1949 ___ -1950 ______1951 __ ___1952------1953------1 Q^A
1955-- ---1956------1957------1958------1959--.- .1960 __ --.1961------1962------1963------1964------1965------
Date
Apr. 7, 8Apr. 17
Apr. 20, 21ATM- 1 1
Apr. 17
Mar 8Sept. 21
Mar. 29, 30Mar 27J 14
A«« A __ -1 1 1C
Apr. 22Apr. 25
May 12Apr. 14, 15
July 13
Apr. 2
Mar 31Apr. 19Aor 2 4May 18-21Apr. 26
Gage height (feet)
14.017.011.07.6
13 11191 O A
16.216.8199
20.6n c
11.416.41 Q 0
ion
1 Q A
18 9n o
15.514.212.416.722.722.714.020 21^316.0137
10.0143
n c
1 K 1
16.31 O R
i 9 9n26.71
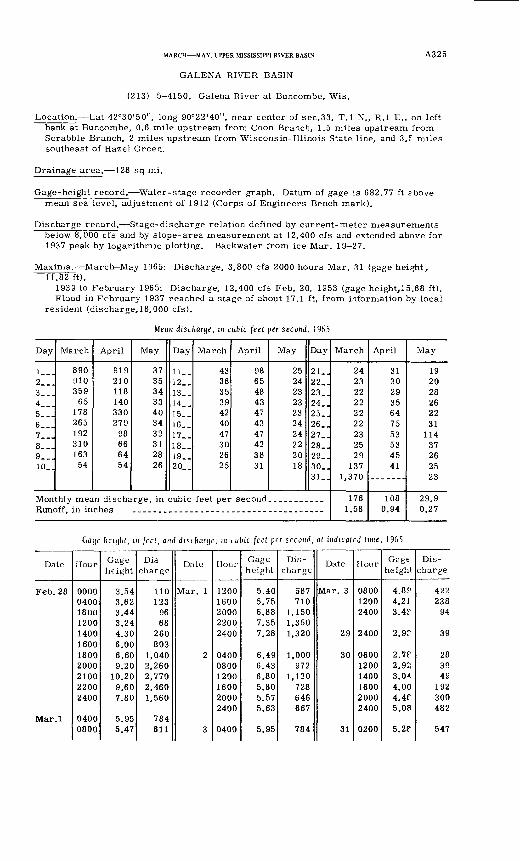
MARCH MAY, UPPER MISSISSIPPI RIVER BASIN A325
GALENA RIVER BASIN
(213) 5-4150. Galena River at Buncombe, Wis.
Location. Lat 42°30'50", long 90°22'40", near center of sec.33, T.I N., R.I E., on left bank at Buncombe, 0.6 mile upstream from Coon Branch, 1.5 miles upstream from Scrabble Branch, 2 miles upstream from Wisconsin-Illinois State line, and 3.5 miles southeast of Hazel Green.
Drainage area. 128 sq mi.
Gage-height record. Water-stage recorder graph. Datum of gage is 682.77 ft rbove mean sea level, adjustment of 1912 (Corps of Engineers Bench mark).
Discharge record. Stage-discharge relation defined by current-meter measurements below 8,000 cfs and by slope-area measurement at 12,400 cfs and extended above for 1937 peak by logarithmic plotting. Backwater from ice Mar. 19 27.
Maxima.- March May 1965: Discharge, 3,800 cfs 2000 hours Mar. 31 (gage height, 11.82 ft).
1939 to February 1965: Discharge, 12,400 cfs Feb. 20, 1953 (gage height,15.68 ft). Flood in February 1937 reached a stage of about 17.1 ft, from information by local
resident (discharge,18, 000 cfs).
Mean discharge, in cubic feet per second, 1965
Day
I...2...3...4...5...6...7...8...9...10..
March
89091035965
17826519231016354
April
91921011814033027998666454
May
37353433403432312826
Day
11_.12__13__14__15__16__17__18__19__20. _
March
43363539424047302625
April
98654843474347423831
May
25242323232424222018
Day
21..22_.23..24. .25_.26..27_.28_.29..30_.31..
Monthly mean discharge, in cubic feet per second ___________Runoff, in inches
March
242322222222232529
1371,370
1761.58
April
31302935647553534541
-------
1080.94
May
192028262231
11437262523
29.90.27
Gngr height, in feel, and discharge, in cubic feet per second, at indicated time,
Date
Feb. 28
Mar.l
Hour
00000400180012001400160018002000210022002400
04000800
Gage height
3.543.623.443.244.306.006.609.20
10.209.607.80
5.955.47
Dis charge
1101239668
260803
1,0402,2602,7702,4601,560
784611
Date
Mar. 1
2
3
Hour
12001600200022002400
040008001200160020002400
0400
Gage height
5.405.756.887.357.28
6.496.436.805.805.575.63
5.95
Dis
charge
587710
1,1501,3501,320
1,000972
1,120728646667
784
Date
Mar. 3
29
30
31
Hour
080012002400
2400
060012001400160020002400
0200
Gage height.
4.8?4.213.4?
2.9?
2.7f2.9?,3.0^4.004.4f5.08
5.2P
Dis
charge
42223894
39
283949
192300482
547
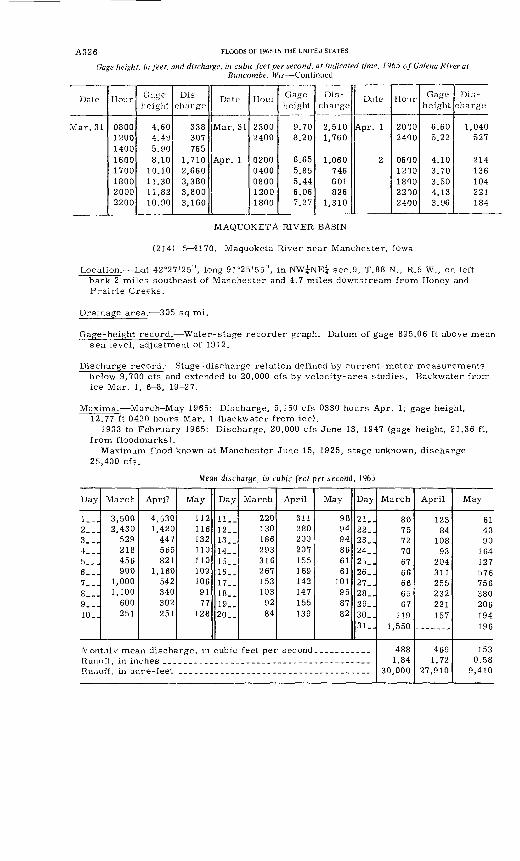
A326 FLOODS OF 1965 IN THE UNITED STATES
Gage Height, in feet, and discharge, in cubic feet per second, at indicated time, 1965 of Galena River at Buncombe, Wis Continued
Date
Mar. 31
Hour
08001200140016001700180020002200
Gage height
4.604.495.908.10
10.1011.3011.8210.90
Dis
charge
338307765
1,7102,6603,3803,8003,160
Date
Mar. 31
Apr. 1
HOLII
23002400
02000400080012001800
Gage height
9.708.20
6.655.855.446.067.27
Dis
charge
2,5101,760
1,060746601826
1,310
Date
Apr. 1
2
Ho-ir
20702400
06001210180022002400
Gage height
6.605.22
4.103.703.504.133.96
Dis
charge
1,040527
214136104221184
MAQUOKETA RIVER BASIN
(214) 5 4170. Maquoketa River near Manchester, Iowa
Location. Lat 42°27'25", long 91°25'55", in NW?NE| sec.9, T.88 N., R.5 W., on left bank 2 miles southeast of Manchester and 4.7 miles downstream from Honey and Prairie Creeks.
Drainage area. 305 sq mi.
Gage-height record. Water-stage recorder graph. Datum of gage 895.06 ft above mean sea level, adjustment of 1912.
Discharge record. Stage-discharge relation defined by current-meter measurements below 9,700 cfs and extended to 20,000 cfs by velocity-area studies. Backwater from ice Mar. 1, 6-8, 19-27.
Maxima.- March May 1965: Discharge, 5,150 cfs 0330 hours Apr. 1; gage height, 12.77 ft 0430 hours Mar. 1 (backwater from ice).
1933 to February 1965: Discharge, 20,000 cfs June 13, 1947 (gage height, 21.36 ft, from floodmarks).
Maximum flood known at Manchester June 15, 1925, stage unknown, discharge 25,400 cfs.
Mean discharge, in cubic feet per second, 1965
Day
1__.2...3...4___5...6___7...8 __9...10..
March
3,5002,430529218456900
1,0001,100600251
April
4,5301,420447565821
1,160542340302251
May
1121161321101101091069177
128
Day
11..12. _13..14..15..16..17..18..19_.20..
March
2201301862933162671531039284
April
311280200207155169142147155139
May
989494866161
101958782
Day
21..22..23..24. .25..26..27..28..29..30..31..
Runoff in inches _.- _ _ ...Runoff, in acre-feet
March
807572706766666567
1191,550
4881.84
30,000
April
12384
10893
204311255232221157
-------
4691.72
27,910
May
614390
164127576756380206194196
1530.58
9,410
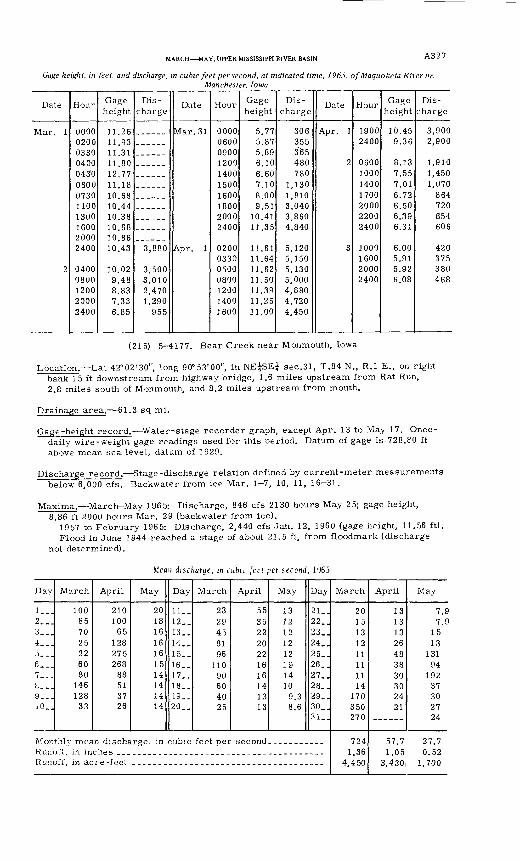
MARCH MAY, UPPER MISSISSIPPI RIVER BASIN A327
Gage height, in feet, and discharge, in cubic feet per second, at indicated time, 1 965, ofMaquoketa River nr.Manchester, Iowa
Date
Mar. 1
2
Hour-
000002000330
04300600073011001300160020002400
04000800120020002400
Gage height
11.2611.9311.3111.8012.7711.1810.6810.4410.3810.6810.6610.43
10.029.488.837.336.85
Dis
charge
3,880
3,5003,0102,4701,290
955
Date
Mar. 31
Apr. 1
Hour
0000060009001200140015001600180020002400
0200033005000800120014001600
Gage height
5.775.875.896.106.607.108.009.51
10.4111.35
11.6111.6411.6211.5011.3911.2511.00
Dis
charge
306355365480780
1,1301,8103,0403,8604,840
5,1205,1505,1305,0004,8804,7204,450
Date
Apr. 1
2
3
Hour
19002400
0600100014001700200022002400
1000160020002400
Gage height
10.459.36
8.137.557.016.726.506.396.31
6.005.915.926.08
Dis
charge
3,9002,900
1,9101,4501,070
864720654606
420375380468
(215) 5 4177. Bear Creek near Monmouth, Iowa
Location. Lat 42°02'30", long 90°53'00", in NE^SE^ sec.31, T.84 N., R.I E., on right bank 1 5 ft downstream from highway bridge, 1.6 miles upstream from Rat Run, 2.8 miles south of Monmouth, and 8.2 miles upstream from mouth.
Drainage area. 61.3 sq mi.
Gage-height record. Water-stage recorder graph, except Apr. 1 3 to May 17. Once- daily wire-weight gage readings used for this period. Datum of gage is.728.fO ft above mean sea level, datum of 1929.
Discharge record. Stage-discharge relation defined by current-meter measurements below 6,000 cfs. Backwater from ice Mar. 1-7, 10, 11, 16-31.
Maxima. March-May 1965: Discharge, 846 cfs 2130 hours May 25; gage height, 8.86 ft 2000 hours Mar. 29 (backwater from ice).
1957 to February 1965: Discharge, 2,440 cfs Jan. 12, 1960 (gage height, 11.56 ft). Flood in June 1944 reached a stage of about 21.5 ft, from floodrnark (discharge
not determined).
Mean discharge, in cubic feet per second, 1965
Day
1...2...3...4__.5. __6...7_. .£_-.9-_.10..
March
100857025226080
146128
33
April
210100
65128275268
88513726
May
20181616161514141414
Day
11__12__13__14__15__16__17__18__19__20__
March
2329458196
11090604025
April
55352220221616141313
May
1312121212191410
9.38.6
Day
21..22_.23_.24_.25_.26_.27_.28_.29_.30_.31..
Monthly mean discharge, in cubic feet per second... ________
Runoff, in acre -feet
March
2015131211111114
170350270
7241.36
4,450
April
13131326483830302421
57.71.05
3,430
May
7.97.9
1513
13194
19237302724
27.70.52
1,700
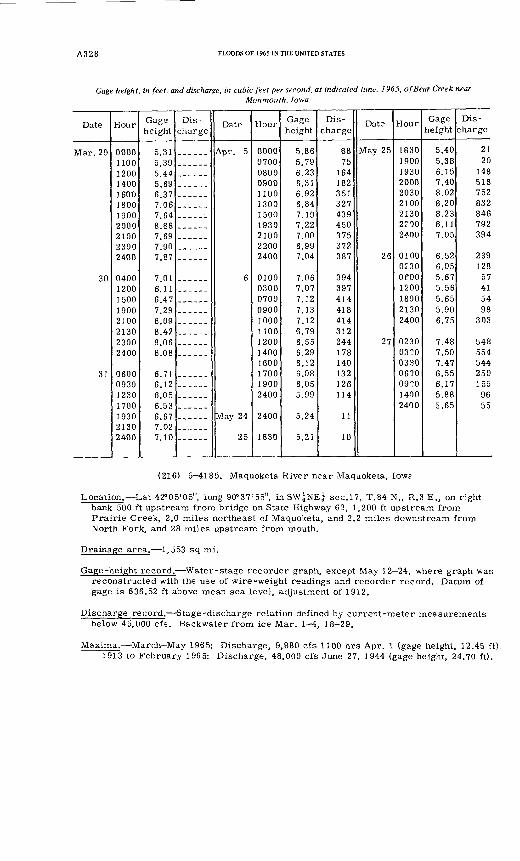
A328 FLOODS OF 1965 IN THE UNITED STATES
Gage height, in feet, and discharge, in cubic feet per second, at indicated time, 1965, of Bear Creek nearMonmouth, Iowa
Date
1W a T~ 9 Q
30
91
Hour
00001100120014001600180019002000210023002400
04001200150019002JOO213023002400
0600093012301700193021302400
Gage height
5.315.395.445.696.377.067.648.867 697.907.87
7.016.116.477.298.098.428.068.08
6.716.126.056.536.677.027.10
Dis
chargeDate
Apr. 5
6
May 24
25
Hour
00000700080009001100130015001930210022002400
010003000700090010001100120014001600 170019002400
2400
1630
Gage height
5.865.796.236.316.926.847.197.227.006.997.04
7.067.077.127.137.126.796.556.296.12 6.086.055.99
5.24
5.21
Dis
charge
8875
164182351327439450375372387
394397414418414312244178140 132126114
11
10
Date
May 25
26
27
Hour
18301900193020002030210021302roo2400
01000230oeoo1200180021302400
023003"0
0330 0610097014002400
Gage height
5.405.386.157.408.028.208.238.117.05
6.526.05 5.675.565.655.906.75
7.487.507.47 6.556.175.885.65
Dis
charge
2120
148516752832846792394
23912857415498
303
548554544 2501559655
(216) 5 4185. Maquoketa River near Maquoketa, lowr
Location. Lat 42°05'05", long 90°37'55", in SW^NE^ sec.17, T.84 N., R.3 E., on right bank 500 ft upstream from bridge on State Highway 62, 1,200 ft upstream from Prairie Creek, 2.0 miles northeast of Maquoketa, and 2.2 miles downstream from North Fork, and 28 miles upstream from mouth.
Drainage area. 1,553 sq mi.
Gage-height record. Water-stage recorder graph, except May 12 24, where graph was reconstructed with the use of wire-weight readings and recorder record. Datum of gage is 636.52 ft above mean sea level, adjustment of 1912.
Discharge record. Stage-discharge relation defined by current-meter measurements below 45,000 cfs. Backwater from ice Mar. 1-4, 18-29.
Maxima. March-May 1965: Discharge, 9,880 cfs 1100 hrs Apr. 1 (gage height, 12.45 ft). 1913 to February 1965: Discharge, 48,000 cfs June 27, 1944 (gage height, 24.70 ft).
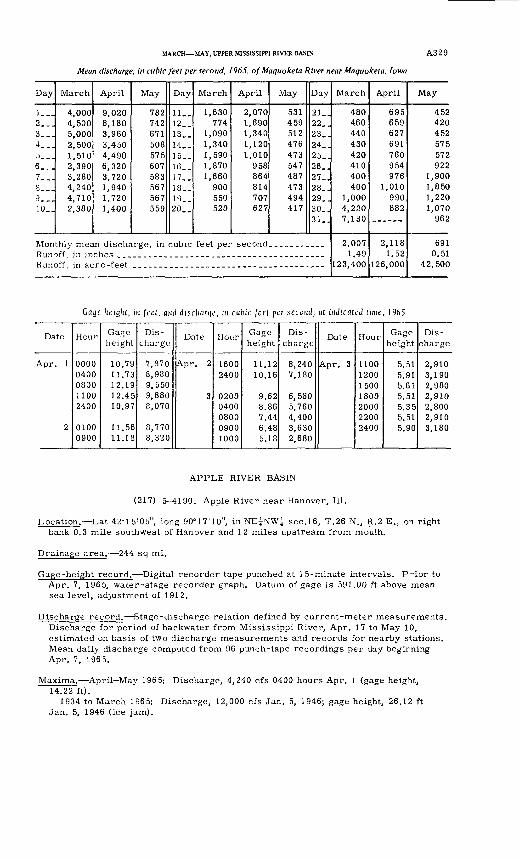
MARCH MAY, UPPER MISSISSIPPI RIVER BASIN A3 2 9
Mean discharge, in cubic feet per second, 1965, ofMaquoketa River near Maquoketa, Iowa
Day
l._.2__.3...4...5...6...7...8...9-_.10.]
March
4,0004,5005,0002,5001,5102,3903,2804,2404,7102,380
April
9,0208,1803,9603,4504,4906,3203,7201,9401,7201,400
May
782742671508575607583567567559
Day
11_.12..13..14..15..16..17..18..19..20..
March
1,630774
1,0901,3401,5901,8701,660
900550520
April
2,0701,6901,3401,1201,010
958864814707627
May
531459512476473547487473494417
Day
21..22..23..24..25..26..27..28..29..30..31..
Runoff in inches ,.Runoff, in acre-feet
March
480460440430420410400400
1,0004,2207,130
2,0071.49
123,400
April
695659627691760954976
1,010990882
2,1181.52
126,000
May
452420452575572922
1,9001,8501,2201,070
962
6910.51
42,500
Gage height, in feet, and discharge, in cubic feet per second, at indicated time, 1965
Date
Apr. 1
2
Hour
00000400080011002400
01000900
Gage height
10.7911.7312.1912.4510.97
11.5611.18
Dis
charge
7,8708,9809,5509,8808,070
8,7708,320
Date
Apr. 2
3
Hour
16002400
02000400080009001000
Gage height
11.1210.16
9.628.867.446.485.18
Dis
charge
8,2407,180
6,5805,7604,4003,6302,680
Date
Apr. 3
Hour
1100120015001800200022002400
Gage height
5.515.915.615.515.355.515.90
Dis
charge
2,9103,1902,9802,9102,8002,9103,180
APPLE RIVER BASIN
(217) 5-4190. Apple River near Hanover, 111.
Location. Lat 42°15'05", long 90°17'10", in NE^NW;| sec.16, T.26 N., R.2 E., on right bank 0.3 mile southwest of Hanover and 12 miles upstream from mouth.
Drainage area. 244 sq mi.
Gage-height record. Digital recorder tape punched at 15-minute intervals. P-ior to Apr. 7, 1965, water-stage recorder graph. Datum of gage is 591.00 ft above mean sea level, adjustment of 1912.
Discharge record. Stage-discharge relation defined by current-meter measurements. Discharge for period of backwater from Mississippi River, Apr. 17 to May 10, estimated on basis of two discharge measurements and records for nearby stations. Mean daily discharge computed from 96 punch-tape recordings per day begirning Apr. 7, 1965.
Maxima. April May 1965: Discharge, 4,240 cfs 0400 hours Apr. 1 (gage height, 14.22 ft).
1934 to March 1965: Discharge, 12,000 cfs Jan. 5, 1946; gage height, 26.12 ft Jan. 5, 1946 (ice jam).
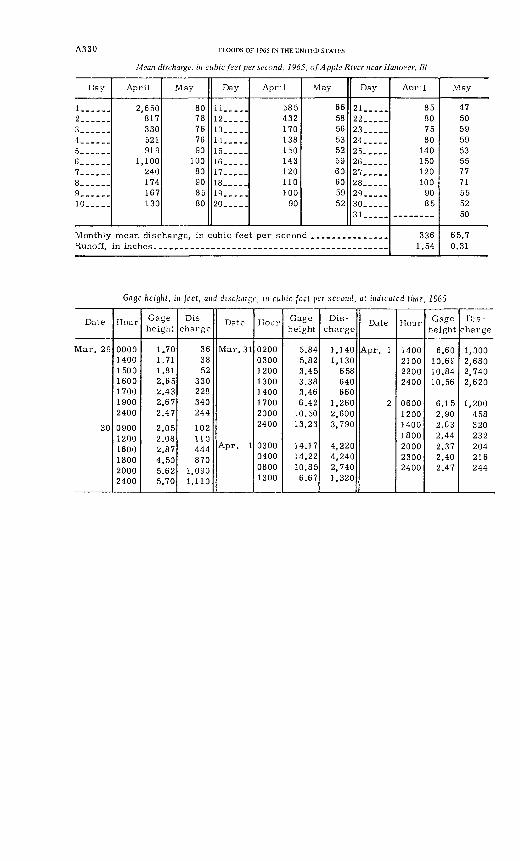
A3 3 0 FLOODS OF 1965 IN THE UNITED STATES
Mean discharge, in cubic feet per second, 1965, of Apple River near Hanover, III
Day
1.---..2__ ....3______4......5______6. __ ..7 __ ...8... __9 ___ ..10.....
Monthly Runoff,
April
2,650 817 330 521 919
1,100 240 174 167 130
May
80 78 76 76 90
100 80 90 85 80
Day
11-.--.12.....13.....14.....15.....16.....17.....18.....19-....20 .....
April
585 432 170 138 150 143 120 110 100
90
mean discharge, in cubic feet per secon in inches
May
6658 56 53 52 59 60 60 59 52
Day
21.....22.....23 .....24.....25. ....26 __ ..27 .....28 .....29 .....30 ___ .31 __ ..
d __ __ __ __ ..
Aoril
85 80 75 80
140 150 120 100
90 85
336 1.54
May
47 50 59 59 53 55 77 71 55 52 50
65.7 0.31
Gngc height, in feet, ami discharge, in cubic feet per second, at indicated time, l%5
Date
Mar. 29
30
Hour
0000140015001600170019002400
090012001600180020002400
Gage height
1.701.711.812.652.432.672.47
2.052.082.874.505.625.70
Dis
charge
363852
330228340244
102110444870
1,0901,110
Date
Mar. 31
Apr. 1
Hour
02000300120013001400170020002400
0300040008001300
Gage height
5.845.823.453.383.466.42
10.5013.23
14.1714.2210.856.67
Dis
charge
1,1401,130
658640660
1,2602,6003,790
4,2204,2402,7401,320
Date
Apr. 1
2
Hour
1400210022002400
0600120014001800200023002400
Gage height
6.6010.6910.8410.56
6.152.902.632.442.372.402.47
Dis
charge
1,3002,6802,7402,620
1,200458320232204216244
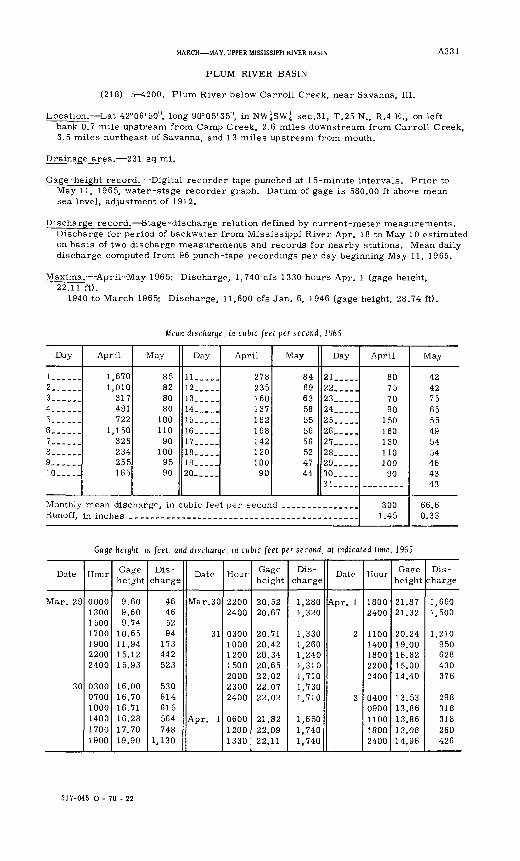
MARCH MAY, UPPER MISSISSIPPI RIVER BASIN A331
PLUM RIVER BASIN
(218) 5-4200. Plum River below Carroll Creek, near Savanna, 111.
Location. Lat 42°06'50", long 90°05'35", in NW|SW| sec.31, T.25 N., R.4 E., on left bank 0.7 mile upstream from Camp Creek, 2.6 miles downstream from Carroll Creek, 3.5 miles northeast of Savanna, and 13 miles upstream from mouth.
Drainage area. 231 sq mi.
Gage-height record. Digital recorder tape punched at 15-minute intervals. Prior to May 11, 1965, water-stage recorder graph. Datum of gage is 580.00 ft abo^e mean sea level, adjustment of 1912.
Discharge record. Stage-discharge relation defined by current-meter measurements. Discharge for period of backwater from Mississippi River Apr. 18 to May 10 estimated on basis of two discharge measurements and records for nearby stations. Mean daily discharge computed from 96 punch-tape recordings per day beginning May 11, 1965.
Maxima. April-May 1965: Discharge, 1,740 cfs 1330 hours Apr. 1 (gage height, 22.11 ft).
1940 to March 1965: Discharge, 11,600 cfs Jan. 6, 1946 (gage height, 28.74 ft).
Mean discharge, in cubic feet per second, 1965
Day
!---._.2__ __ .3 __ ..4___ ..5......6 __ ..7... ..8......9_._ .10.....
Monthly Runoff,
April
1,670 1,010
317 491 722
1,150 326 234 255 165
May
85 82 80 80
100 110
90 100 95 90
Day
ll-_.._12.....13.....14. . .15.....16. __ .17.....18. ___19.....20.....
April
278 235 160 137 162 168 142 120 100
90
May
84 69 63 58 55 56 56 52 47 44
mean discharge, in cubic feet per second .......
Day
21 ..._.22 _____23 _____24.....25_. _.26 _____27 _____28 __ ..29 _____30.. ___31 _____
........
April
80 75 70 90
150 160 130 110 100
90
3001.45
May
42 42 75 65 55 49 54 54 46 43 43
66.6 0.33
Gage height, m feet, and discharge, m cubic feet per second, at indicated time, 1965
Date
Mar. 29
30
Hour
0000130015001700190022002400
030007001000140017001900
Gage height
9.609.609.74
10.6511.9415.1215.93
16.0016.7016.7116.2817.7019.90
Dis charge
46465294
173442523
530614615564748
1,130
Date
Mar.30
31
Apr. 1
Hour
22002400
0300100012001500200023002400
060012001330
Gage height
20.5220.67
20.7120.4220.3420.6522.0222.0722.02
21.8222.0922.11
Dis
charge
1,2801,320
1,3301,2601,2401,3101,7101,7301,710
1,6501,7401,740
Date
Apr. 1
2
3
Hour
18002400
11001400180022002400
04000900110018002400
Ga?e height
21.8721.32
20.2419.0016.8215.0014.40
13.5313.8613.8613.0814.96
Dis
charge
1,6601,500
1,210950628430376
298318318260426
317-045 O - 70 - 22
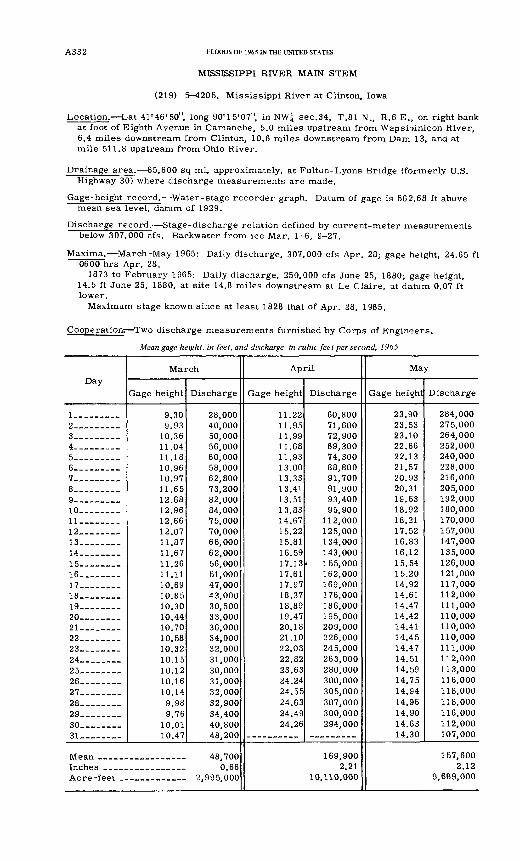
A3 3 2 FLOODS OF 1965 IN THE UNITED STATES
MISSISSIPPI RIVER MAIN STEM
(219) 5-4205. Mississippi River at Clinton, Iowa
Location. Lat 41°46'50", long 90° 15'07", in NW^ sec.34, T.81 N., R.6 E., on right bank at foot of Eighth Avenue in Camanche, 5.0 miles upstream from Wapsi->inicon River, 6.4 miles downstream from Clinton, 10.6 miles downstream from Dam 13, and at mile 511.8 upstream from Ohio River.
Drainage area. 85,600 sq mi, approximately, at Fulton-Lyons Bridge (formerly U.S. Highway 30) where discharge measurements are made.
Gage-height record. Water-stage recorder graph. Datum of gage is 562.68 ft above mean sea level, datum of 1929.
Discharge record. Stage-discharge relation defined by current-meter measurements below 307,000 cfs. Backwater from ice Mar. 1-6, 9-27.
Maxima. March-May 1965: Daily discharge, 307,000 cfs Apr. 28; gage height, 24.65 ft 0600 hrs Apr. 28.
1873 to February 1965: Daily discharge, 250,000 cfs June 25, 1880; gage height, 14.5 ft June 25, 1880, at site 14.8 miles downstream at Le Claire, at datum 0.07 ft lower.
Maximum stage known since at least 1828 that of Apr. 28, 1965.
Cooperation; Two discharge measurements furnished by Corps of Engineers.
Mean gage height, in feet, and discharge, in cubic feet per second, 1965
Day
l--_ -___2 _________3 _______4 _________5 _________6 _________7 _ _____8 _ ___9- __ - ____10 ________11. _______1 9
1 9
14 ________15-. __16 ___ ___17 _-_18 ________1 Q
20-- __ ___21________22 ________23 ________24 ___ ____2526 ___ ____27___ __28- ___ -__29 __ ___9fl31
IMean
March
Gage height
9.30 9.93
10.36 11.04 11.18 10.96 10.97 11.65 12.68 12.96 12.66 12.07 11.87 11.67 11.26 11.11 10.69 10.85 10.30 10.44 10.70 10.58 10.32 10.15 10.12 10.16 10.14
9.98 9.76
10.01 10.47
Discharge
28,000 40,000 50,000 56,000 60,000 58,000 62,800 73,200 82,000 84,000 75,000 70,000 66,000 62,000 56,000 51,000 47,000 43,000 30,500 33,000 36,000 34,000 32,000 31,000 30,000 31,000 32,000 32,900 34,400 40,800 48,200
48,700 0.66
2,995,000
April
Gage height
11.22 11.95 11.99 11.68 11.93 13.00 13.33 13.41 13.51 13.83 14.67 15.22 15.81 16.59 17.13 17.61 17.97 18.37 18.89 19.47 20.18 21.10 22.03 22.82 23.63 24.24 24.55 24.63 24.49 24.26
Discharge
60,800 71,600 72,900 69,300 74,300 88,800 91,700 91,900 93,400 95,900
112,000 125,000 134,000 143,000 155,000 162,000 169,000 176,000 186,000 195,000 209,000 226,000 245,000 263,000 280,000 300,000 305,000 307,000 300,000 294,000
169,900 2.21
10,110,000
May
Gage height
23.90 23.53 23.10 22.66 22.13 21.57 20.93 20.31 19.63 18.92 18.21 17.52 16.83 16.12 15.54 15.20 14.92 14.61 14.47 14.42 14.41 14.45 14.47 14.51 14.59 14.75 14.94 14.96 14.90 14.63 14.30
Discharge
284,000 275,000 264,000 252,000 240,000 228,000 216,000 205,000 192,000 180,000 170,000 157,000 147,000 135,000 126,000 121,000 117,000 112,000 111,000 110,000 110,000 110,000 111,000 112,000 113,000 116,000 118,000 118,000 116,000 112,000 107,000
157,600 2.12
9,689,000
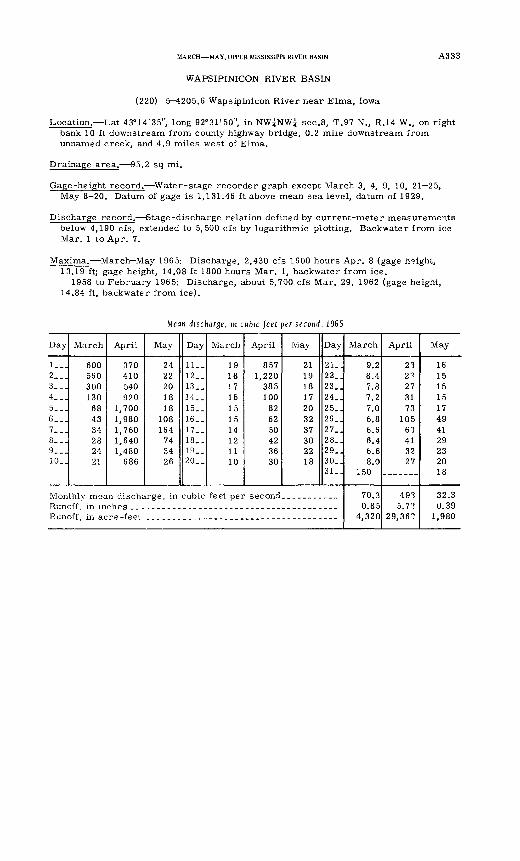
MARCH MAY, UPPER MISSISSIPPI RIVER BASIN A333
WAPSIPINICON RIVER BASIN
(220) 5-^1205.6 Wapsipinicon River near Elma, Iowa
Location. Lat 43°14'35", long 92°31'50", in NW^NW^ sec.8, T.97 N., R.14 W., on right bank 10 ft downstream from county highway bridge, 0.2 mile downstream from unnamed creek, and 4.9 miles west of Elma.
Drainage area. 95.2 sq mi.
Gage-height record. Water-stage recorder graph except March 3, 4, 9, 10, 21 25, May 8 20. Datum of gage is 1,131.46 ft above mean sea level, datum of 1929.
Discharge record. Stage-discharge relation defined by current-meter measurements below 4,190 cfs, extended to 5,500 cfs by logarithmic plotting. Backwater from ice Mar. 1 to Apr. 7.
Maxima. March-May 1965: Discharge, 2,430 cfs 1600 hours Apr. 8 (gage h?ight, 13.19 ft; gage height, 14.08 ft 1800 hours Mar. 1, backwater from ice.
1958 to February 1965: Discharge, about 5,700 cfs Mar. 29, 1962 (gage height, 14.84 ft, backwater from ice).
Mean discharge, in cubic feet per second, 1965
Day
1__.2...3...4___5...6...7...8__]9 "110. .
March
600560300130
684334282421
April
370410540920
1,7001,9801,7601,6401,480
686
May
2422201818
108164
743426
Day
11-.12-.13..14_.15..16..17..18..19..20..
March
19181716151514121110
April
8571,220
385100
826250423630
May
21191817203237302218
Day
21..22_.23..24..25..26..27..28..29_.30..31
Monthly mean discharge, in cubic feet per second. ._____._._Runoff in inchesRunoff, in acre -feet
March
9.28.47.87.27.06.86.66.46.68.0
150
70.30.85
4,320
April
212T273173
10561413227
4935.7?
29,36?
May
1615151517494129232018
32.30.39
1,980
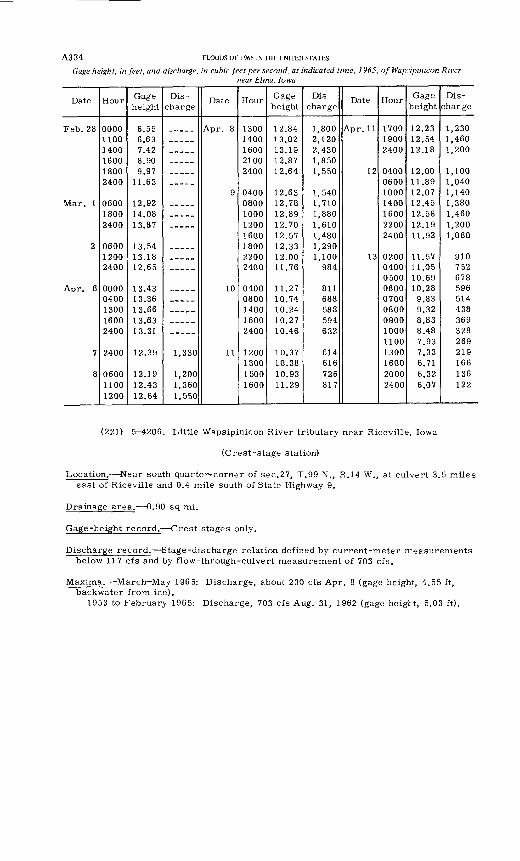
A334 FLOODS OF 1965 IN THE UNITED STATES
Gage height, in feet, and discharge, in cubic feet per second, at indicated time, 1965, of Wapnpinicon Rivernear Elma, Iowa
Date
Mar. 1
2
7
8
Hour
000011001400160018002400
060018002400
060012002400
0000
130016002400
2400
0600 1100 1200
Gage height
6.556.637.428.909.97
11.63
12.9214.0813.87
1 ? ^d13.1812.65
1 3 4313.3613.6613.631 0 O1
12.39
12.19 12.43 12.64
Dis charge
1,330
1,200 1,360 1,550
Date
9
10
11
Hour
13001400160021002400
0400 0800100012001600 1800
04000800140018002400
1200 1300 1500 1600
Gage height
12.8413.0213.1912.8712.64
12.63 12.7812.8912.7012.571 9 ^9
12.0011.76
11.2710.7410.2410.2710.46
10.37 10.38 10.93 11.29
Dis charge
1,8002,1202,4301,8501,550
1,540 1,7101,8801,6101,480 1,2901,100
984
811688588594632
614 616 726 817
Date
Apr. 11
12
13
Hour
170019002400
040006001000 1400160022002400
020004000500 060007000800090010001100 1300 1600 2000 2400
Gage height
12.2312.5412.18
12.0011.8912.07 12.4512.581 9 1 Q
11.92
11.5711.0510.69 10.289.839.328.838.487.93 7.33 6.71 6.32 6.07
Dis
charge
1,2301,4601,200
1,1001,0401,140 1,3801,4601,2001,060
910752678 596514438369328269 219 166 136 122
(221) 5-^1206. Little Wapsipinicon River tributary near Riceville, Iowa
(Crest-stage station)
Location. Near south quarter-corner of sec.27, T.99 N., R.14 W., at culvert 3.5 miles east of Riceville and 0.4 mile south of State Highway 9.
Drainage area. 0.90 sq mi.
Gage-height record. Crest stages only.
Discharge record. Stage-discharge relation defined by current-meter rreasurements below 117 cfs and by flow-through-culvert measurement of 703 cfs.
Maxima. March May 1965: Discharge, about 230 cfs Apr. 8 (gage height, 4.55 ft, backwater from ice).
1953 to February 1965: Discharge, 703 cfs Aug. 31, 1962 (gage height, 5.03 ft).
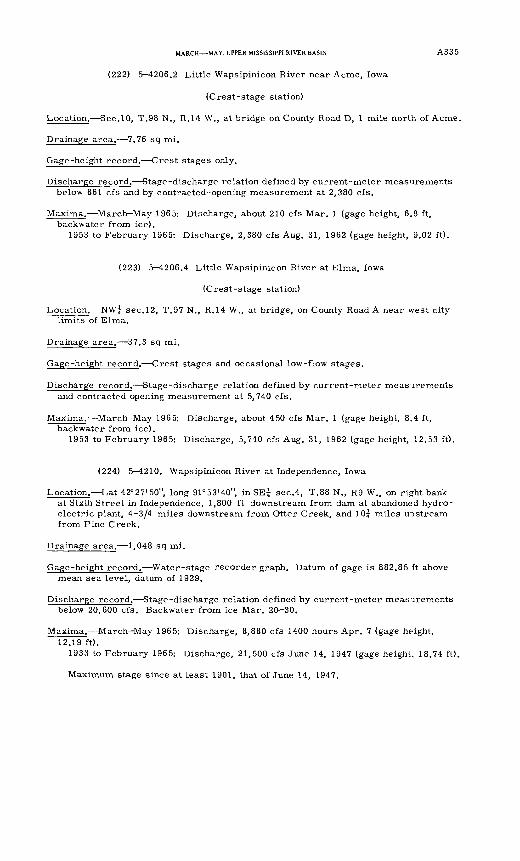
MARCH MAY, UPPER MISSISSIPPI RIVER BASIN A3 3 5
(222) 5 4206.2 Little Wapsipinicon River near Acme, Iowa
(Crest-stage station)
Location. Sec.10, T.98 N., R.14 W., at bridge on County Road D, 1 mile north of Acme.
Drainage area. 7.76 sq mi.
Gage-height record. Crest stages only.
Discharge record. Stage-discharge relation defined by current-meter measurements below 861 cfs and by contracted-opening measurement at 2,380 cfs.
Maxima. March May 1965: Discharge, about 210 cfs Mar. 1 (gage height, 6.8 ft, backwater from ice).
1953 to February 1965: Discharge, 2,380 cfs Aug. 31, 1962 (gage height, 9.02 ft).
(223) 5-4206.4 Little Wapsipinicon River at Elma, Iowa
(Crest-stage station)
Location. NW; sec.12, T.97 N., R.14 W., at bridge, on County Road A near west city limits of Elma.
Drainage area. 37.3 sq mi.
Gage-height record. Crest stages and occasional low-flow stages.
Discharge record. Stage-discharge relation defined by current-meter measurements and contracted opening measurement at 5,740 cfs.
Maxima. March May 1965: Discharge, about 450 cfs Mar. 1 (gage height, 8.4 ft, backwater from ice).
1953 to February 1965: Discharge, 5,740 cfs Aug. 31, 1962 (gage height, 12.53 ft).
(224) 5 4210. Wapsipinicon River at Independence, Iowa
Location. Lat 42°27'50", long 91°53'40", in SE; sec.4, T.88 N., R9 W., on right bank at Sixth Street in Independence, 1,800 ft downstream from dam at abandoned hydro electric plant, 4-3/4 miles downstream from Otter Creek, and 10; miles upstream from Pine Creek.
Drainage area. 1,048 sq mi.
Gage-height record. Water-stage recorder graph. Datum of gage is 882.85 ft above mean sea level, datum of 1929.
Discharge record. Stage-discharge relation defined by current-meter measurements below 20,600 cfs. Backwater from ice Mar. 20 30.
Maxima. March May 1965: Discharge, 8,880 cfs 1400 hours Apr. 7 (gage height, 12.19 ft).
1933 to February 1965: Discharge, 21,500 cfs June 14, 1947 (gage height. 18.74 ft).
Maximum stage since at least 1901, that of June 14, 1947.
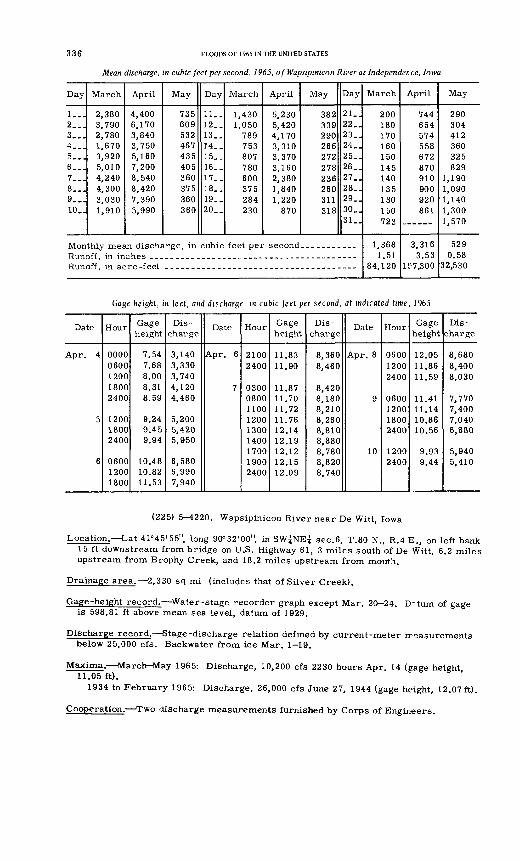
336 FLOODS OF 1965 IN THE UNITED STATES
Mean discharge, in cubic feet per second, 1965, of Wapsipinicon River at Independer, ce, Iowa
Day
1...2___3...4___5...6___7...8...9 __10.H
March
2,3803,7902,7801,6703,9205,0104,2404,3003,0301,910
April
4,4006,1703,8403,7505,1607,2008,5408,4207,3905,990
May
735609532467435405360375360360
Monthly mean discharge, in
Day
11..12-.13-.14-.15..16.-17..18..19_-20.-
March
1,4301,050
789753807780600375284230
April
5,2305,4204,1703,3103,3703,1602,3801,8401,220
870
May
382339290266272278236260311318
Day
21..22..23..24..25..26_.27..28..29..30..31
cubic feet per second.. _________
Runoff, in acre -feet
March
20018017016015014514013513015079^
1,3681.51
84,120
April
744654574558672870910900920861
3,3163.53
197,300
May
290304412360325829
1,1901,0901,1401,3001,570
5290.58
32,530
Gage height, in feet, and discharge, m cubic feet per second, at indicated time, 1965
Date
Apr. 4
5
6
Hour
00000600120018002400
120018002400
060012001800
Gage height
7.547.688.008.318.59
9.249.459.94
10.4810.8211.53
Dis
charge
3,1403,3303,7404,1204,460
5,2005,4205,950
6,5806,9907,940
Date
Apr. 6
7
Hour
21002400
030008001100120013001400170019002400
Gage height
11.8311.90
11.8711.7011.7211.7612.1412.1912.1212.1512.09
Dis
charge
8,3608,460
8,4208,1808,2108,2608,8108,8808,7808,8208,740
Date
Apr. 8
9
10
Hour
060012002400
0600120018002400
12002400
Gage height
12.0511.8611.59
11.4111.1410.8610.56
9.939.44
Dis
charge
8,6808,4008,030
7,7707,4007,0406,680
5,9405,410
(225) 5-4220. Wapsipinicon River near De Witt, Iowa
Location. Lat 41°45'55", long 90°32'00", in SW^NE^ sec.6, T.80 N., R.4 E., on left bank 15 ft downstream from bridge on U.S. Highway 61, 3 miles south of De Witt, 6.2 miles upstream from Brophy Creek, and 18.2 miles upstream from mouth.
Drainage area. 2,330 sq mi (includes that of Silver Creek).
Gage-height record. Water-stage recorder graph except Mar. 20-24. D-tum of gage is 598.81 ft above mean sea level, datum of 1929.
Discharge record. Stage-discharge relation defined by current-meter rreasurements below 25,000 cfs. Backwater from ice Mar. 1-19.
Maxima. March-May 1965: Discharge, 10,200 cfs 2230 hours Apr. 14 (sage height 11.05ft). * '
1934 to February 1965: Discharge, 26,000 cfs June 27, 1944 (gage height, 12.07ft).
Cooperation. Two discharge measurements furnished by Corps of Engineers.
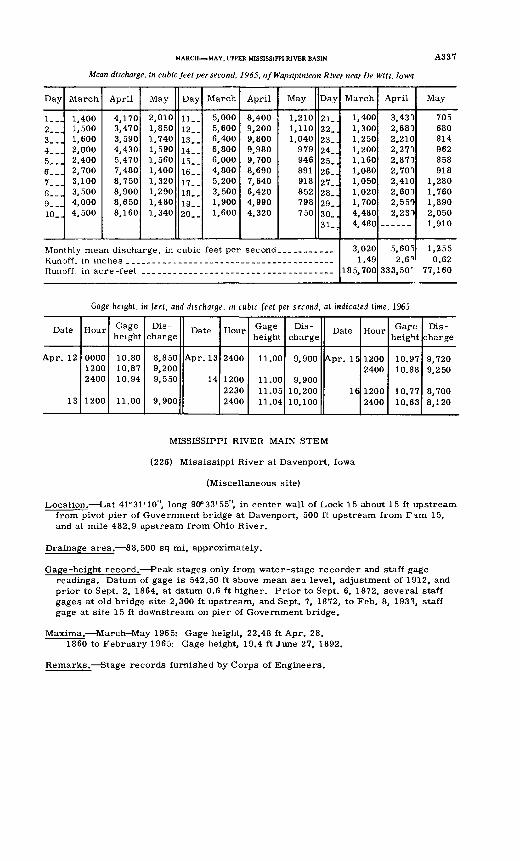
MARCH MAY, UPPER MISSISSIPPI RIVER BASIN A3 3 7
Mean discharge, in cubic feet per second, 1965, of Wapsipinicon River near De Witt, Iowa
Day
!_..2__.3...4...5...6__.7___8...9...10..
March
1,4001,5001,6002,0002,4002,7003,1003,5004,0004,500
April
4,1703,4703,5904,4305,4707,4808,7508,9008,6508,160
May
2,0101,8501,7401,5901,5601,4001,3201,2901,4801,340
Day
11__12..13..14..15..16..17. _18..19_.20..
March
5,0005,6006,4006,8006,0004,8005,2003,5001,9001,600
April
8,4009,2009,8009,9809,7008,6907,6406,4204,9904,320
May
1,2101,1101,040
979946891918852798750
Day
21_.22..23_.24..25..26..27..28..29..30_.31
Runoff, in acre -feet
March
1,4001,3001,2501,2001,1601,0801,0501,0201,7004,4804,480
3,0201.49
185,700
April
3,4302,68")2,2102,2702,87")2,7002,4102,6002,5502,230
s.eo 1:2.6''
May
705680814962858918
1,2801,7601,8902,0501,910
1,2550.62
333,50' 77,160
Gage height, in feet, and discharge, m cubic feet per second, at indicated time, 1965
Date
Apr. 12
13
Hour
0000 1200 2400
1200
Gage height
10.80 10.87 10.94
11.00
Dis
charge
8,850 9,200 9,550
9,900
Date
Apr. 13
14
Hour
2400
12002230 2400
Gage height
11.00
11.0011.05 11.04
Dis
charge
9,900
9,90010,200 10,100
Date
Apr. 15
16
Hour
1200 2400
1200 2400
height
10.97 10.88
10.77 10.63
Dis
charge
9,720 9,250
8,700 8,120
MISSISSIPPI RIVER MAIN STEM
(226) Mississippi River at Davenport, Iowa
(Miscellaneous site)
Location. Lat 41°31'10", long 90°33'55", in center wall of Lock 15 about 15 ft upstream from pivot pier of Government bridge at Davenport, 500 ft upstream from Pam 15, and at mile 482.9 upstream from Ohio River.
Drainage area. 88,500 sq mi, approximately.
Gage-height record. Peak stages only from water-stage recorder and staff gage readings. Datum of gage is 542.50 ft above mean sea level, adjustment of 1912, and prior to Sept. 2, 1864, at datum 0.6 ft higher. Prior to Sept. 6, 1872, several staff gages at old bridge site 2,300 ft upstream, and Sept. 7, 1872, to Feb. 8, 1933, staff gage at site 15 ft downstream on pier of Government bridge.
Maxima. March May 1965: Gage height, 22.48 ft Apr. 28.1860 to February 1965: Gage height, 19.4 ft June 27, 1892.
Remarks. Stage records furnished by Corps of Engineers.
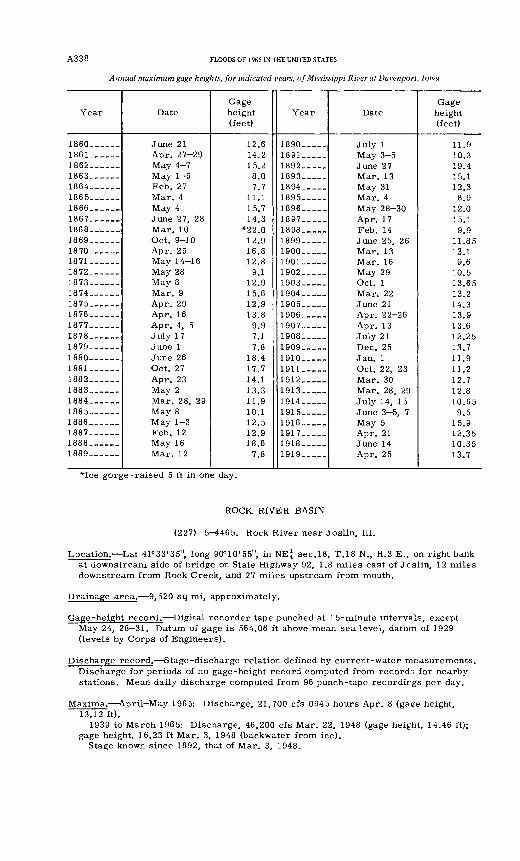
A338 FLOODS OF 1965 IN THE UNITED STATES
Annual maximum gage heights, for indicated years, of Mississippi River at Davenport, Iowa
Year
I860. _____1861 ______1862 ______1863 ______1864 ______1865 _____1866-_____1867. _____1868 ______1869 ______1870 __ __1871 ______
1873 ______1874. __1875 ______1876 ______1877- _____1878 ______1879- _____1880 ______1881------1882. _____1883 ______1884. _____1885 - ___1886 ______1887- ___1888- _1889- _____
Date
Apr. 27-29
May 1 5Feb. 27
Mar. 10
May 28
July 17
Oct. 27A nv 9 *3
May 2Mar. 28, 29
Feb. 12May 16Mar. 12
Gage height (feet)
12.614.215.28 f\
7.711.115714 3
12916.812.8
9 1129
13.89 97.17 ft
18.417.714.113311910.112512 918.6
7.8
Year
1890 _____1891- ____
1 O Q Q
1894 _ ___1895 _____1896. _1 fl Q7
1898. 18991900 _____1901 _____1902190319041905. _1906 _____19071908_____19091910 _____191119121913191419151916 _____19171918_____1919
Date
July 1May 3-5
Mar 13May 31M 4May 28-30Apr. 17Feb. 14
Mar. 22
Apr. 13July 21Dec 25
Oct 22 23Mar. 30
July 14, 15
Gage height (feet)
11910319415.11 O Q
8 912015.1
Q Q
1319 6
10.5
13214 3139
12 2513 711 91121271 O Q
10.659 5
15912 3510.35137
"Ice gorge-raised 5 ft in one day.
ROCK RIVER BASIN
(227) 5-^1465. Rock River near Joslin, 111.
Location. Lat 41°33'35", long 90°10'55", in NE| sec.18, T.18 N., R.3 E., on right bank at downstream side of bridge on State Highway 92, 1.8 miles east of Jcslin, 12 miles downstream from Rock Creek, and 27 miles upstream from mouth.
Drainage area. 9,520 sq mi, approximately.
Gage-height record. Digital recorder tape punched at 15-minute intervals, except May 24, 28-31. Datum of gage is 564.06 ft above mean sea level, datum of 1929 (levels by Corps of Engineers).
Discharge record. Stage-discharge relation defined by current-water measurements. Discharge for periods of no gage-height record computed from records for nearby stations. Mean daily discharge computed from 96 punch-tape recordirgs per day.
Maxima. April-May 1965: Discharge, 21,700 cfs 0945 hours Apr. 8 (gage height, 13.12 ft).
1939 to March 1965: Discharge, 46,200 cfs Mar. 22, 1948 (gage height, 14.46 ft); gage height, 16.23 ft Mar. 3, 1948 (backwater from ice).
Stage known since 1892, that of Mar. 3, 1948.
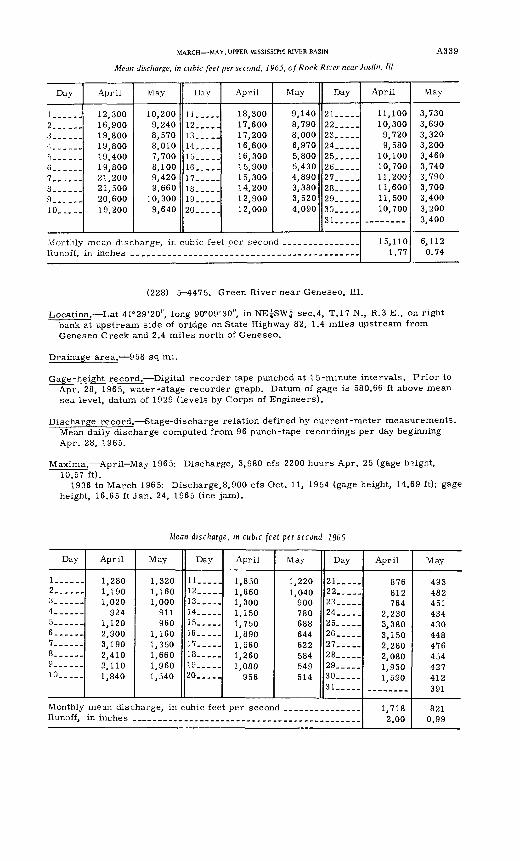
MARCH MAY, UPPER MISSISSIPPI RIVER BASIN
Mean discharge, in cubic feet per second, 1965, of Rock River near Joslin. Ill
A339
Day
!_-_.--9
3______4______
6......
89___...10._...
Monthly Runoff,
April
12,300 16,900 19,800 19,800 19,400 19,800 21,200 21,500 20,600 19,200
May
10,200 9,240 8,570 8,010 7,700 8,100 9,420 9,660
10,300 9,640
Day
11----.12-.-,.13_____14_.__.15____,16.....17____.18.....19.----20.--,.
April
18,300 17,600 17,200 16,600 16,300 15,900 15,300 14,200 12,900 12,000
May
9,140 8,790 8,000 6,970 5,800 5,430 4,890 3,380 3,520 4,090
Day
21-....22.....23 __ __24_. ...25__._.26_. ...27 .....28.....29 __ .,30...-.31----.
mean discharge, in cubic feet per second _______________
April
11,100 10,300 9,720 9,580
10,100 10,700 11,200 11,600 11,500 10,700
1 5, 1 1 0 1.77
May
3,730 3,690 3,320 3,200 3,460 3,740 3,790 3,700 3,400 3,200 3,400
6,112 0.74
(228) 5 4475. Green River near Geneseo, 111.
Location. Lat 41°29'20", long 90°09'30", in NE^SW^ sec.4, T.I7 N., R.3 E., on right bank at upstream side of bridge on State Highway 82, 1.4 miles upstream from Geneseo Creek and 2.4 miles north of Geneseo.
Drainage area. 958 sq mi.
Gage-height record. Digital recorder tape punched at 15-minute intervals. Prior to Apr. 28, 1965, water-stage recorder graph. Datum of gage is 580.66 ft above mean sea level, datum of 1929 (levels by Corps of Engineers).
Discharge record. Stage-discharge relation defined by current-meter measurements. Mean daily discharge computed from 96 punch-tape recordings per day beginning Apr. 28, 1965.
Maxima. April-May 1965: Discharge, 3,980 cfs 2200 hours Apr. 25 (gage height, 10.57 ft).
1936 to March 1965: Discharge, 8,900 cfs Oct. 11, 1954 (gage height, 14.69 ft); gage height, 16.65 ft Jan. 24, 1965 (ice jam).
Mean discharge, in cubic feet per second, 1965
Day
I--....2. --._3_____.4_____-5__ ....6 __ ...7___ ...8_-_ ...9_._._.10._ ...
April
1,280 1,190 1,020
924 1,120 2,900 3,190 2,410 2,110 1,840
May
1,320 1,160 1,000
911 960
1,160 1,350 1,660 1,960 1,540
Day
11 __ ._ 12_..__13__.__14-_ ...15---.-16-. ...17__._.18.....19_____20.----
April
1,850 1,660 1,300 1,150 1,750 1,890 1,560 1,260 1,080
956
Monthly mean discharge, in cubic feet per secon Runoff, in inches ___
May
1,220 1,040
900 780 688 644 622 584 549 514
Day
21.. __99
2324.....25... ..26 __ _.27 __ ..28_____29_____30_____31_-_-_
d .... __ ....- ...
April
876 812 764
2,230 3,380 3,150 2,280 2,080 1,930 1,590
1,718 2.00
May
493 482 451 434 430 448 476 454 427 412 391
821 0.99
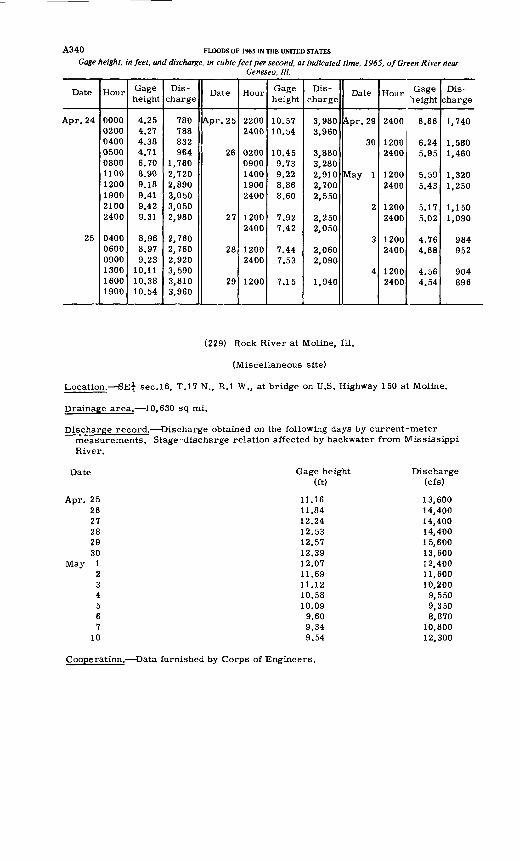
A340 FLOODS OF 1965 IN THE UNITED STATES
Gage height, in feet, and discharge, in cubic feet per second, at indicated time, 1965, of Green River nearGeneseo, III.
Date
Apr. 24
25
Hour
0000020004000500080011001200190021002400
040006000900130016001900
Gage height
4.254.274.384.716.708.909.189.419.429.31
8.968.979.23
10.1110.3810.54
Dis charge
780788832964
1,7602,7202,8903,0503,0502,980
2,7602,7602,9203,5903,8103,960
Date
Apr. 25
26
27
28
29
Hour
22002400
02000900140019002400
12002400
12002400
1200
Gage height
10.5710.54
10.459.739.228.868.60
7.927.42
7.447.53
7.15
Dis charge
3,9803,960
3,8803,2802,9102,7002,550
2,2502,050
2,0602.090
1,940
Date
A.pr. 29
30
May 1
2
3
4
Hour G*8* i eight
2400
12002400
12002400
12002400
12002400
12002400
6.66
6.245.95
5.595.43
5.175.02
4.764.68
4.564.54
Dis charge
1,740
1,5801,460
1,3201,250
1,1501,090
984952
904896
(229) Rock River at Moline, 111.
(Miscellaneous site)
Location. BE? sec.16, T.17 N., R.I W., at bridge on U.S. Highway 150 at Moline.
Drainage area. 10,630 sq mi.
Discharge record. Discharge obtained on the following days by current-meter measurements. Stage-discharge relation affected by backwater from Mississippi River.
Date
Apr. 252627282930
May
710
Gage height (ft)
11.1611.8412.2412.5312.5712.3912.0711.6911.1210.5810.09
9.609.349.54
Discharge (cfs)
13,60014,40014,40014,40015,60013,60012,40011,60010,200
9,5509,3508,870
10,80012,300
Cooperation. Data furnished by Corps of Engineers.
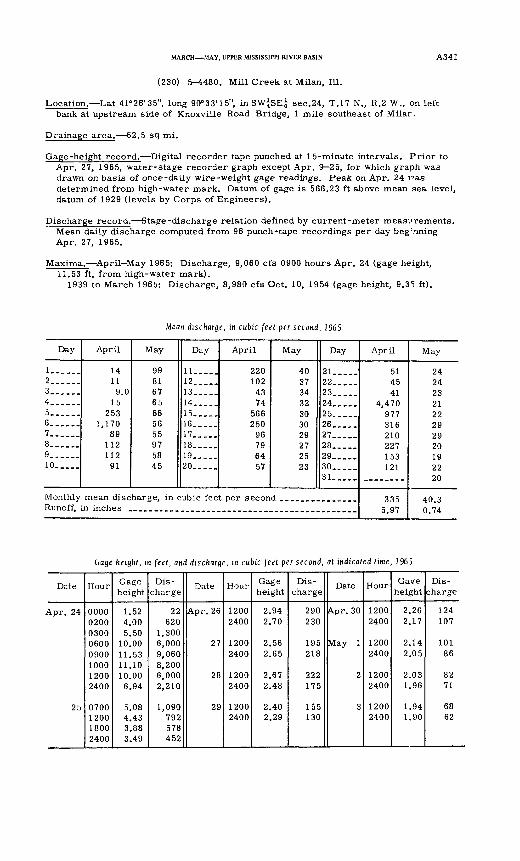
MARCH MAY, UPPER MISSISSIPPI RIVER BASIN A341
(230) 5-^1480. Mill Creek at Milan, 111.
Location. Lat 41°26'35", long 90°33'15", in SW^SE^ sec.24, T.17 N., R.2 W., on left bank at upstream side of Knoxville Road Bridge, 1 mile southeast of Milar,
Drainage area. 62.5 sq mi.
Gage-height record. Digital recorder tape punched at 15-minute intervals. Prior to Apr. 27, 1965, water-stage recorder graph except Apr. 9 25, for which graph was drawn on basis of once-daily wire-weight gage readings. Peak on Apr. 24 vas determined from high-water mark. Datum of gage is 566.23 ft above mean sea level, datum of 1929 (levels by Corps of Engineers).
Discharge record. Stage-discharge relation defined by current-meter measurements. Mean daily discharge computed from 96 punch-tape recordings per day beg : nning Apr. 27, 1965.
Maxima. April-May 1965: Discharge, 9,060 cfs 0900 hours Apr. 24 (gage height, 11.53 ft, from high-water mark).
1939 to March 1965: Discharge, 8,980 cfs Oct. 10, 1954 (gage height, 9.3*5 ft).
Mean discharge, in cubic feet per second, 1965
Day
1... ...2... ...3.. .4 ___ ..5 ___ ..6... ...7 ......8 ......9 __ ._10.....
Monthly Runoff,
April
14 11 9.0
15 253
1,170 89
112 112
91
May
99 81 67 65 66 56 55 97 58 45
Day
ll--__.12. __ .13__...14 __ ..15.....16.....17.. ...18 .....19.. ...20.....
April
220 102
43 74
566 250
96 79 64 57
mean discharge, in cubic feet per secon in inches _ __._.____ . . ___. _ .
May
40 37 34 32 30 30 29 27 25 23
Day
21 .....99
23.. ...24 .....25.. ...26.. ...27 _____28.. __29 __ ..30.. ...31 __ ..
d .. ______ _. ...
April
51 45 41
4,470 977 316 210 227 153 121
335 5.97
May
24 24 23 21 22 29 29 20 19 22 20
40.3 0.74
Gage height, in feet, and discharge, in cubic feet per second, at indicated time, 1965
Date
Apr. 24
25
Hour
00000200030006000900100012002400
0700120018002400
Gage height
1.524.005.50
10.0011.5311.1010.006.94
5.084.433.883.49
Dis charge
22620
1,3006,0009,0608,2006,0002,210
1,090792578452
Date
Apr. 26
27
28
29
Hour
12002400
12002400
12002400
12002400
Gage height
2.942.70
2.562.65
2.672.48
2.402.29
Dis charge
290230
195218
222175
155130
Date
Apr. 30
May 1
2
3
Hour
12002400
12002400
12002400
12002400
Ga?e height
2.262.17
2.142.05
2.031.96
1.941.90
Dis charge
124107
10186
8271
6862
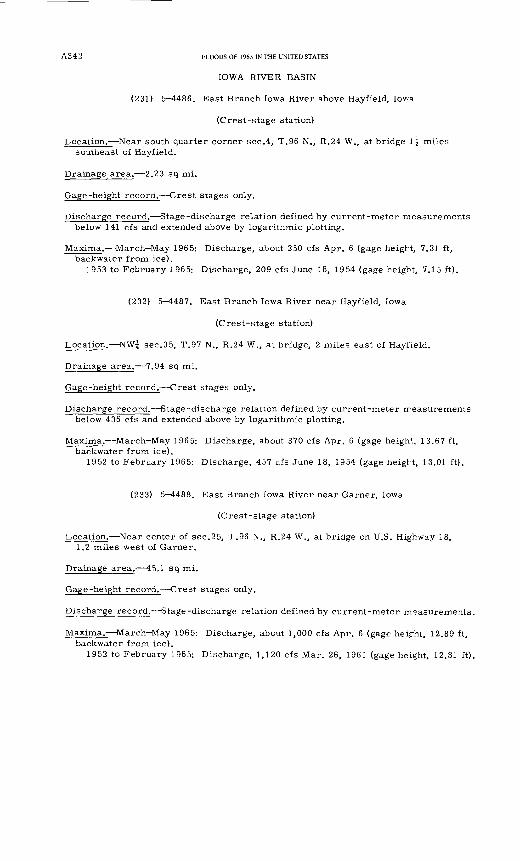
A342 FLOODS OF 1965 IN THE UNITED STATES
IOWA RIVER BASIN
(231) 5-4486. East Branch Iowa River above Hayfield, Iowa
(Crest-stage station)
Location. Near south quarter corner sec.4, T.96 N., R.24 W., at bridge l| miles southeast of Hayfield.
Drainage area. 2.23 sq mi.
Gage-height record. Crest stages only.
Discharge record. Stage-discharge relation defined by current-meter measurements below 141 cfs and extended above by logarithmic plotting.
Maxima. March May 1965: Discharge, about 250 cfs Apr. 6 (gage height, 7.31 ft, backwater from ice).
1953 to February 1965: Discharge, 209 cfs June 18, 1954 (gage height, 7.15 ft).
(232) 5-4487. East Branch Iowa River near Hayfield, Iowa
(Crest-stage station)
Location. NW£ sec.35, T.97 N., R.24 W., at bridge, 2 miles east of Hayfield.
Drainage area. 7.94 sq mi.
Gage-height record. Crest stages only.
Discharge record. Stage-discharge relation defined by current-meter rreasurements below 436 cfs and extended above by logarithmic plotting.
Maxima.- March May 1965: Discharge, about 370 cfs Apr. 6 (gage heigh1;, 13.67 ft, backwater from ice).
1952 to February 1965: Discharge, 457 cfs June 18, 1954 (gage height, 13.01 ft).
(233) 5 4488. East Branch Iowa River near Garner, Iowa
(Crest-stage station)
Location. Near center of sec.25, T.96 N., R.24 W., at bridge on U.S. Highway 18, 1.2 miles west of Garner.
Drainage area. 45.1 sq mi.
Gage-height record. Crest stages only.
Discharge record. Stage-discharge relation defined by current-meter measurements.
Maxima.- March-May 1965: Discharge, about 1,000 cfs Apr. 6 (gage height, 12.89 ft, backwater from ice).
1952 to February 1965: Discharge, 1,120 cfs Mar. 26, 1961 (gage height, 12.81 ft).
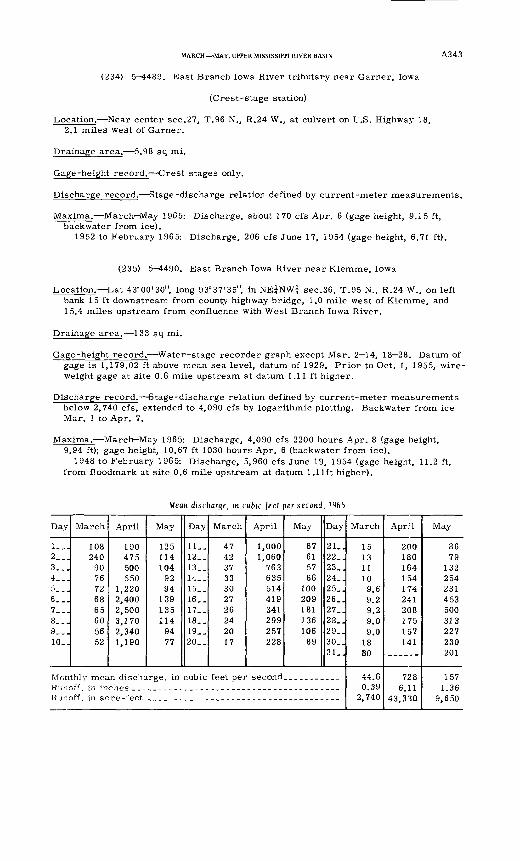
MARCH MAY, UPPER MISSISSIPPI RIVER BASIN A3 43
(234) 5 4489. East Branch Iowa River tributary near Garner, Iowa
(Crest-stage station)
Location. Near center sec.27, T.96 N., R.24 W., at culvert on U.S. Highway 18, 2.1 miles west of Garner.
Drainage area. 5.98 sq mi.
Gage-height record. Crest stages only.
Discharge record. Stage-discharge relation defined by current-meter measurements.
Maxima. March-May 1965: Discharge, about 170 cfs Apr. 6 (gage height, 9.15 ft, backwater from ice).
1952 to February 1965: Discharge, 206 cfs June 17, 1954 (gage height, 6.71 ft).
(235) 5 4490. East Branch Iowa River near Klemme, Iowa
Location. Lat 43°00'30", long 93°37'35", in NE^NW^ sec.36, T.95 N., R.24 W., on left bank 1 5 ft downstream from county highway bridge, 1.0 mile west of Klemme, and 15.4 miles upstream from confluence with West Branch Iowa River.
Drainage area. 133 sq mi.
Gage-height record. Water-stage recorder graph except Mar. 2 14, 18 28. Datum of gage is 1,179.02 ft above mean sea level, datum of 1929. Prior to Oct. 1, 1955, wire- weight gage at site 0.6 mile upstream at datum 1.11 ft higher.
Discharge record. Stage-discharge relation defined by current-meter measurements below 2,740 cfs, extended to 4,090 cfs by logarithmic plotting. Backwater from ice Mar. 1 to Apr. 7.
Maxima. March May 1965: Discharge, 4,090 cfs 2200 hours Apr. 8 (gage height, 9.94 ft); gage height, 10.67 ft 1030 hours Apr. 6 (backwater from ice).
1948 to February 1965: Discharge, 5,960 cfs June 19, 1954 (gage height, 11.2 ft, from floodmark at site 0.6 mile upstream at datum l.llft higher).
Mean discharge, in cubic feet per second, 1965
Day
1__.2...3...4...5...6...7___8...9__.10..
March
108240
9076726865605652
April
190475500550
1,2202,4002,5003,1702,3401,190
May
125114104
9294
139135114
9477
Day
11..12. _13..14. _15..16..17..18..19-.20_.
March
47423733302726242017
April
1,0001,060
763635514419341299257228
May
67615766
100209181136106
89
Day
21..22..23..24. .25..26..27..28..29..30..31..
Monthly mean discharge, in cubic feet per second. . _..-._.._
Runoff, in acre -feet
March
151311109.69.29.29.09.0
1880
44.60.39
2,740
Aprrl
200180164154174241208175157141
7286.11
43,330
May
8679
132254231453500313227230201
1571.36
9,650
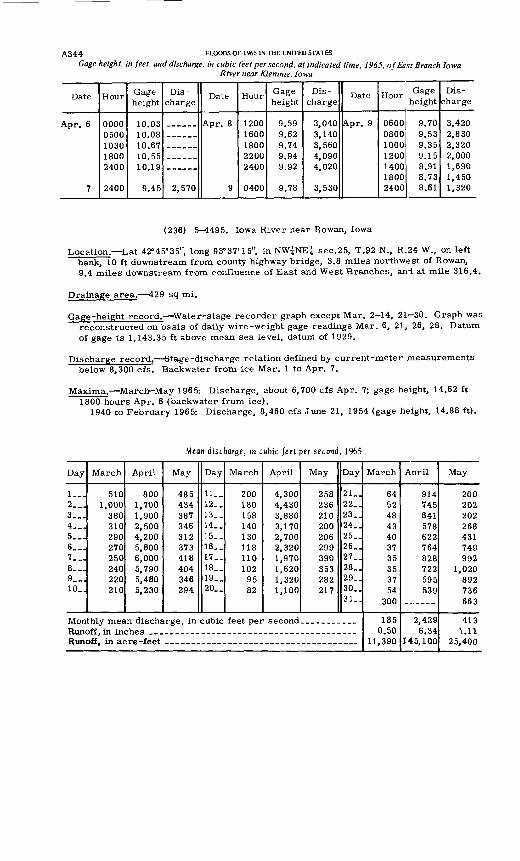
A3 4 4 FLOODS OF 1965 IN THE UNITED STATES
Gage height, in feet, and discharge, in cubic feet per second, at indicated time, 1965, of East Branch Iowa River near Klemme, Iowa
Date
Apr. 6
7
Hour
00000500103018002400
2400
Gage height
10.0310.0810.6710.5510.19
9.45
Dis charge
2,570
Date
9
Hour
12001600180022002400
0400
Gage height
9.599.629.749.949.92
9.78
Dis
charge
3,0403,1403,5604,0904,020
3,530
Date
A.pr. 9
Hour
060008001000120014001800 2400
Gage height
9.709.539.359.158.918.73 8.61
Dis charge
3.4202,8302,3202,0001,6901,450 1,320
(236) 5 4495. Iowa River near Rowan, Iowa
Location. Lat 42°45'35", long 93°37'15", in NW^NEi sec.25, T.92 N., R.24 W., on left bank, 10 ft downstream from county highway bridge, 3.8 miles northwest of Rowan, 9.4 miles downstream from confluence of East and West Branches, and at mile 316.4.
Drainage area. 429 sq mi.
Gage-height record. Water-stage recorder graph except Mar. 2 14, 21 30. Graph was reconstructed on basis of daily wire-weight gage readings Mar. 6, 21, 26, 28. Datum of gage is 1,143.35 ft above mean sea level, datum of 1929.
Discharge record. Stage-discharge relation defined by current-meter measurements below 8,300 cfs. Backwater from ice Mar. 1 to Apr. 7.
Maxima. March-May 1965: Discharge, about 6,700 cfs Apr. 7; gage height, 14.62 ft 1800 hours Apr. 6 (backwater from ice).
1940 to February 1965: Discharge, 8,460 cfs June 21, 1954 (gage height, 14.88 ft).
Mean discharge, in cubic feet per second, 1965
Day
l._.2...3...4...5...6...7...8__.9__.10_.
March
5101,000
380310290270250240220210
April
8001,7001,9002,5004,2005,8006,0005,7905,4805.230
May
485434387346312373418404346294
Day
11__12__13__14__15__16__17__18__19__20. _
March
200180158140130118110102
9582
April
4,3004,4303,8803,1702,7002,3201,9701,6201,3201,100
May
258236210200206299390353282217
Day
21_.22_.23_.24. .25_.26_.27_.28_.29. .30_.31_.
Monthly mean discharge, in cubic feet per second... ________Runoff , in inches -- - -- - _______________Runoff, in acre -feet
March
64524843403735353754
300
1850.50
11,390
Anril
914745641578622764828722595539
2,4396.34
145,100
May
200202202268431749992
1,020892736663
4131.11
25,400
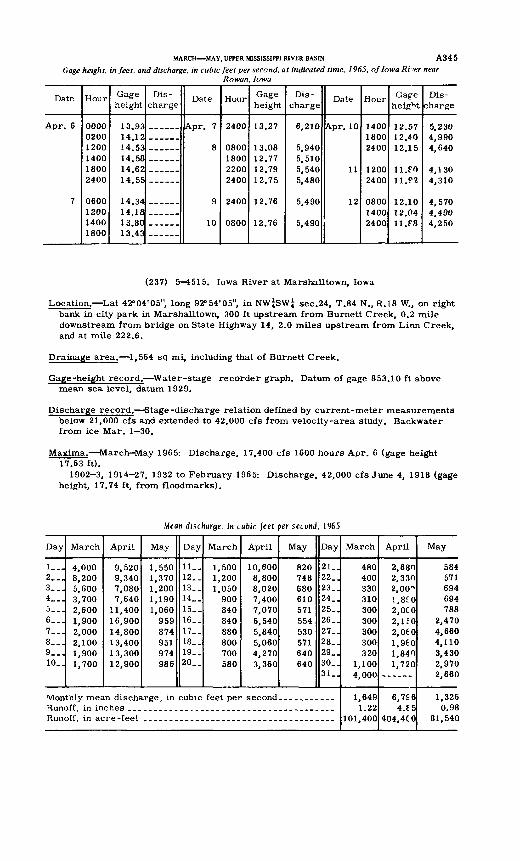
MARCH MAY, UPPER MISSISSIPPI RIVER BASIN A345
Gage height, in feet, and discharge, in cubic feet per second, at indicated time, 1965, of Iowa Rr'er nearRowan, Iowa
Date
Apr. 6
7
Hour
000002001200140018002400
0600120014001800
Gage height
1 ^ Q^
14.1214.5314.5814.621 4. ^^
14.3414.1813.8013.43
Dis
chargeDate
Apr. 7
8
9
10
Hour
2400
0800180022002400
2400
0800
Gage height
13.27
13.0812.7712.791 2 75
12.76
12.76
Dis
charge
6,210
5,9405,5105,5405,480
5 AQf\
5.490
Date
A.pr. 10
11
1 7
Hour
140018002400
12002400
080014002400
Gafe height
12.5712.401 O 1 C
11. FO11. P2
12.1012.0411. F8
Dis charge
5 2304 9904,640
4,1304,310
4,5704,4904,250
(237) 5 1515. Iowa River at MarshaUtown, Iowa
Location. Lat 42°04'05", long 92°54'05", in NW^SW^ sec.24, T.84 N., R.18 W., on right bank in city park in MarshaUtown, 300 ft upstream from Burnett Creek, 0.2 mile downstream from bridge on State Highway 14, 2.0 miles upstream from Linn Creek, and at mile 222.6.
Drainage area. 1,564 sq mi, including that of Burnett Creek.
Gage-height record. Water-stage recorder graph. Datum of gage 853.10 ft above mean sea level, datum 1929.
Discharge record. Stage-discharge relation defined by current-meter measurements below 21,000 cfs and extended to 42,000 cfs from velocity-area study. Backwater from ice Mar. 1 30.
Maxima. MarchHVIay 1965: Discharge, 17,400 cfs 1600 hours Apr. 6 (gage height 17.63 ft).
1902-3, 1914-27, 1932 to February 1965: Discharge, 42,000 cfs June 4, 1918 (gage height, 17.74 ft, from floodmarks).
Mean discharge, I'M cubic feet per second, 1965
Day
!-_ 2...3...4__.5...6__.7__.8...9...10_.
March
4,0008,2005,6003,7002,6001,9002,0002,1001,9001,700
April
9,5209,3407,0807,640
11,40016,90014,80013,40013,30012,900
May
1,5501,3701,2001.1901,060
959874951974986
Day
11..12. _13..14__15._16..17..18..19. _20._
March
1,5001,2001,050
900840840880800700580
April
10,6008,8008,0207,4007,0706,5405.8405.0604,2703,360
May
820748680610571554530571640640
Day
21..22_.23..24_.25..26_.27_.28..29..30..31_.
Runoff, in inches ... _ _ _ . . ____._.__Runoff, in acre -feet
March
480400330310300300300300320
1,1004.000
1,6491.22
101,400
April
2.6802.3302,00^1.8GO2,0002,1502,0601,9601,8401,720
------
6.7E64.65
404.4CO
May
584571694694788
2.4704,6604,1103,4302,9702,660
1,3260.98
81,540
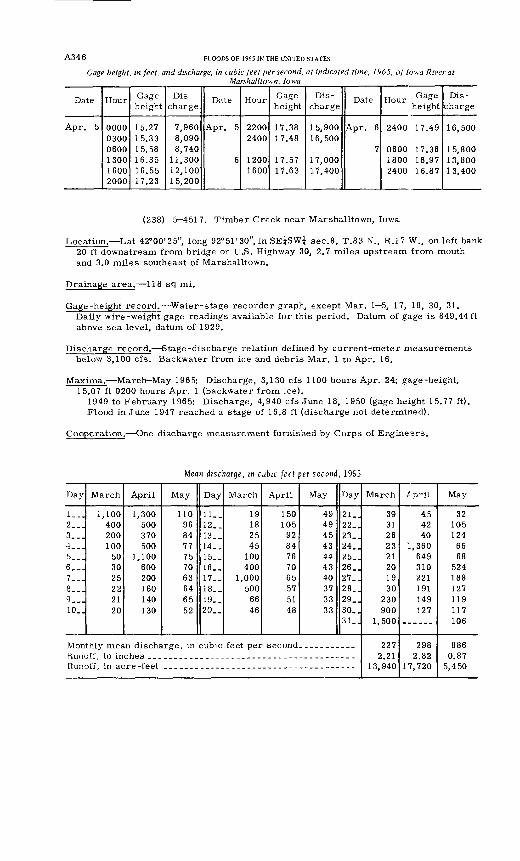
A346 FLOODS OF 1965 IN THE UNITED STATES
Gage height, in feet, and discharge, in cubic feet per second, at indicated time, 1965, of Iowa River at Marshalltown, Iowa
Date
Apr. 5
Hour
000003000600130016002000
Gage height
15.2715.3315.5816.3516.5517.23
Dis charge
7,9608,0908,740
11,30012,10015,200
Date
Apr. 5
6
Hour
22002400
12001600
Gage height
17.3817.48
17.5717.63
Dis
charge
15,90016,500
17,00017,400
Date
Apr. 6
7
Hour GaS e height
2400 17.49
0600 17.361800 16.972400 16.87
Dis charge
16,500
15,80013,80013,400
(238) 5-^4517. Timber Creek near Marshalltown, Iowa
Location. Lat 42°00'25", long 92°51'30", in SE|SW| sec.8, T.83 N., R.17 W., on left bank 20 ft downstream from bridge on U.S. Highway 30, 2.7 miles upstream from mouth and 3.0 miles southeast of Marshalltown.
Drainage area. 118 sq mi.
Gage-height record. Water-stage recorder graph, except Mar. 1 5, 17, 18, 30, 31. Daily wire-weight gage readings available for this period. Datum of gage is 849.44ft above sea level, datum of 1929.
Discharge record. Stage-discharge relation defined by current-meter measurements below 3,100 cfs. Backwater from ice and debris Mar. 1 to Apr. 16.
Maxima. March-May 1965: Discharge, 3,130 cfs 1100 hours Apr. 24; gage-height, 15.07 ft 0200 hours Apr. 1 (backwater from ice).
1949 to February 1965: Discharge, 4,940 cfs June 18, 1950 (gage height 15.77 ft). Flood in June 1947 reached a stage of 16.8 ft (discharge not determined).
Cooperation. One discharge measurement furnished by Corps of Engine3rs.
Mean discharge, in cubic feet per second, 1965
Day
l-_.2...3...4___5...6___7___8...9...10..
March
1,100400200100
503025222120
April
1,300500370500
1,100600200160140130
May
110968477757063646552
Day
ll._12. _13..14._15..16..17_.18__19. _20..
March
19182545
100400
1,000500
6646
April
150105
9284767065575148
May
49494543444340373333
Day
21_.22..23..24..25..26..27..28..29..30..31..
Monthly mean discharge, in cubic feet per second. __________Runoff, in inches ____Runoff, in acre -feet
March
3931262321201930
230900
1,500
2272.21
13,940
/pril
454240
1,360649310221191149127
2982.82
17,720
May
32105124
6668
524188127119117106
8860.87
5,450
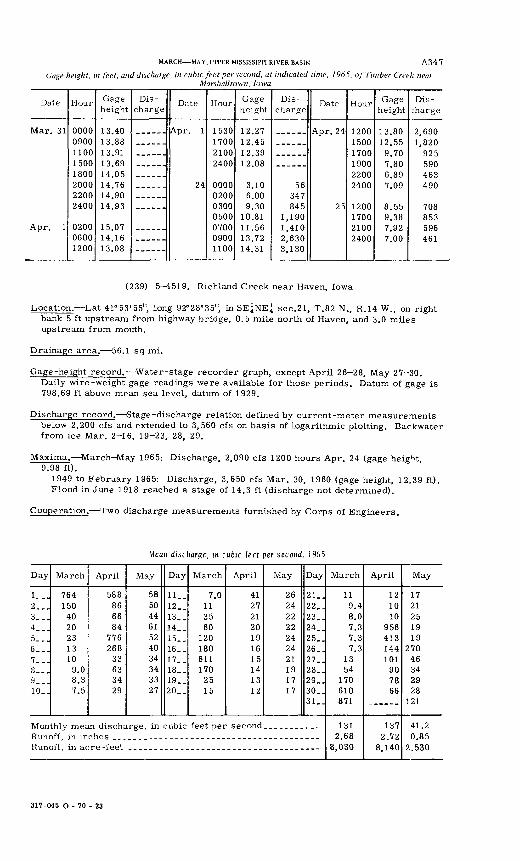
MARCH MAY, UPPER MISSISSIPPI RIVER BASIN A347
Gage height, in feet, and discharge, in cubic feet per second, at indicated time, 1965, of Timber Creek nearMarshall town, Iowa
Date
Mar. 31
Hour
00000900110015001800200022002400
020006001200
Gage height
13.4013.8813.9113.6914.0514.7614.9014.93
15.0714.1613.08
Dis
chargeDate
A.pr. 1
24
Hour
1530170021002400
0000020003000500 070009001100
Gage height
12.2712.4512.3912.08
3.106.00Q ^n
10.81 11.5613 7214.31
Dis
charge
56347845
1,190 1,4102 £ Q ft
3 130*
Date
A nr» 94j
25
Hour
120015001700190022002400
12001700 21002400
Gage height
12559 707.806 OQ
7 09
8.559.38 7 92
7.00
Dis
charge
2 £Qft
1,820925590463490
f7fto
853 596461
(239) 5-4519. Richland Creek near Haven, Iowa
Location. Lat 41° 53'55", long 92°28'35", in SE^NE^ sec.21, T.82 N., R.14 W., on right bank 5 ft upstream from highway bridge, 0.5 mile north of Haven, and 3.0 miles upstream from mouth.
Drainage area. 56.1 sq mi.
Gage-height record. Water-stage recorder graph, except April 26-28, May 27 30. Daily wire-weight gage readings were available for those periods. Datum of gage is 798.69 ft above mean sea level, datum of 1929.
Discharge record. Stage-discharge relation defined by current-meter measurements below 2,200 cfs and extended to 3,560 cfs on basis of logarithmic plotting. Backwater from ice Mar. 2-16, 19-23, 28, 29.
Maxima. March-May 1965: Discharge, 2,090 cfs 1200 hours Apr. 24 (gage heigM, 9.98 ft).
1949 to February 1965: Discharge, 3,650 cfs Mar. 30, 1960 (gage height, 12.39 ft). Flood in June 1918 reached a stage of 14.3 ft (discharge not determined).
Cooperation. Two discharge measurements furnished by Corps of Engineers.
Mean discharge, in cubic feet per second, 1965
Day
!_..2___3___4...5___6__.7...8...9__.10_.
March
764150
4020231310
9.08.37.5
April
588866684
776268
33633429
May
58504461524034343327
Day
11__12. _13..14_.15..16..17..18_.19..20_.
March
7.0113560
120180611170
2515
April
41272120191615141312
May
26242222242421191717
Day
21..22..23..24_.25..26_.27_.28..29_.30..31
Monthly mean discharge, in cubic feet per second_._._..___.
Runoff, in acre -feet
March
119.48.07.37.37.3
1354
170610871
1312.68
8,030
April
121010
956413144101
907866
1372.72
8,140
May
1721251919
27046342928
121
41.20.85
2.530
317-045 O - 70 - 23
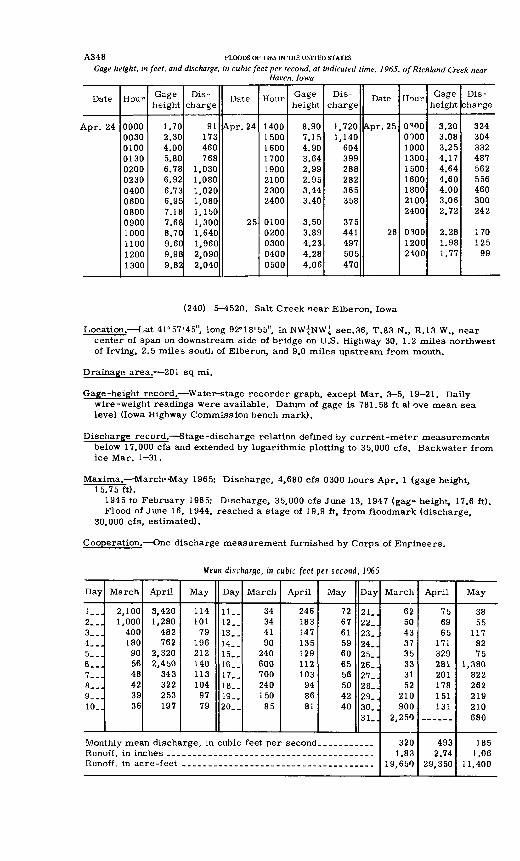
A348 FLOODS OF 1965 IN THE UNITED STATES
Gage height, in feet, and discharge, in cubic feet per second, at indicated time, 1965, ofRichland Creek nearHaven, Iowa
Date
^.pr. 24
Hour
00000030010001300200023004000600080009001000110012001300
Gage height
1.702.304.005.806.786.926.736.957.187.688.709.609.989.82
Dis
charge
91173460768
1,0301,0801,0201,0801,1501,3001,6401,9602,0902,040
Date
Apr. 24
25
Hour
14001500160017001900210023002400
01000200030004000500
Gage height
8.907.154.903.642.992.953.443.40
3.503.894.234.284.06
Dis
charge
1,7201,140
604399288282365358
375441497505470
Date
A.pr. 25
26
Hour
0^0009001000130015001600180021002400
0-50012002*00
Gage height
3.203.083.254.174.644.604.003.062.72
2.281.981.77
Dis
charge
324304332487562556460300242
170125
99
(240) 5-4520. Salt Creek near Elberon, Iowa
Location. Lat 41°57'45", long 92°18'55", in NW^NW^ sec.36, T.83 N., R.13 W., near center of span on downstream side of bridge on U.S. Highway 30, 1.2 miles northwest of Irving, 2.5 miles south of Elberon, and 9.0 miles upstream from mouth.
Drainage area. 201 sq mi.
Gage-height record. Water-stage recorder graph, except Mar. 3 5, 19 21. Daily wire-weight readings were available. Datum of gage is 781.58 ft al ove mean sea level (Iowa Highway Commission bench mark).
Discharge record. Stage-discharge relation defined by current-meter measurements below 17,000 cfs and extended by logarithmic plotting to 35,000 cfs. Backwater from ice Mar. 1-31.
Maxima. March-May 1965: Discharge, 4,680 cfs 0300 hours Apr. 1 (gage height, 15.75 ft).
1945 to February 1965: Discharge, 35,000 cfs June 13, 1947 (gag° height, 17.6 ft).Flood of June 16, 1944. reached a stage of 19.9 ft, from floodmark (discharge,
30,000 cfs, estimated).
Cooperation. One discharge measurement furnished by Corps of Enf ineers.
Mean discharge, in cubic feet per second, 1965
Day
!_..2...3...4__.5...6...7...8...9__.10..
March
2,1001,000
400180
905648423936
April
3,4201,280
482762
2,3202,450
343322253197
May
114101
79196212140113104
9779
Day
11..12..13..14..15. _16..17..18..19__20. _
March
34344190
240600700240150
85
April
246183147135129112103
948681
May
72676159606556504240
Day
21..22_.23..24..25..26..27..28..29..30..31..
Runoff in inches ...Runoff, in acre -feet
March
6250433735333152
210900
2,250
3201.83
19,650
April
756965
171329281201178151131
4939 74
29,350
May
3855
1178275
1,380822262219210680
1851.06
11,400
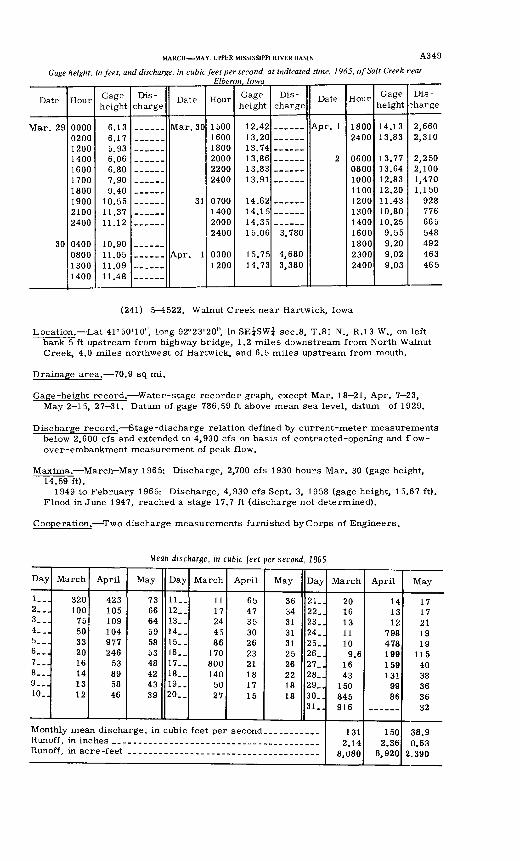
MARCH MAY, UPPER MISSISSIPPI RIVER BASIN A349
Gage height, in feet, and discharge, in cubic feet per second, at indicated time, 1965, of Salt Creek rearElberon, Iowa
Date
Mar 29
?n
Hour
0000020012001400160017001800190021002400
0400080013001400
Gage height
6 1 o
6.175 QO
6.066 on
7.909.40
10.55U 37
U 1 9
10.9011.0511.0911.48
Dis charge
Date
IVIsir 30
31
Apr. 1
Hour
150016001800200099nn2400
0700140020002400
03001200
Gage height
12.4213.2013.7413.8613.8313.91
14.6214.1514.3515.06
15.7514.73
Dis
charge
3,780
4,6803,380
Date
Apr. 1
2
Hour
18002400
06000800100011001200130014001600 180023002400
Gage height
14.1313.83
13.7713.6412.8312.2011.4310.8010.259.55 9.209.029.03
Dis
charge
2,6602,310
2,2502,1001,4701,150
928776665548 492463465
(241) 5 4522. Walnut Creek near Hartwick, Iowa
Location. Lat 41°50'10", long 92°23'20", in SE^SW^ sec.8, T.81 N., R.I3 W., on left bank 5 ft upstream from highway bridge, 1.2 miles downstream from North Walnut Creek, 4.0 miles northwest of Hartwick, and 6.5 miles upstream from mouth.
Drainage area. 70.9 sq mi.
Gage-height record. Water-stage recorder graph, except Mar. 18 21, Apr. 7 23, May 2-15, 27-31. Datum of gage 786.59 ft above mean sea level, datum of 1929.
Discharge record. Stage-discharge relation defined by current-meter measurements below 2,600 cfs and extended to 4,930 cfs on basis of contracted-opening and f'ow- over-embankment measurement of peak flow.
Maxima. March-May 1965: Discharge, 2,700 cfs 1930 hours Mar. 30 (gage height, 14.59 ft).
1949 to February 1965: Discharge, 4,930 cfs Sept. 3, 1958 (gage height, 15.67 ft). Flood in June 1947, reached a stage 17.7 ft (discharge not determined).
Cooperation. Two discharge measurements furnished by Corps of Engineers.
Mean discharge, in cubic feet per second, 1965
Day
l._.2...3...4__.t>__.6...'I...8___9...10..
March
320100
7550332016141312
April
423105109104977246
53895846
May
73666459585348424339
Day
11__12__13__14__15__16__17__18__19__20__
March
1117244586
170800140
5027
April
65473530262321181715
May
36343131312526221818
Monthly mean discharge, in cubic feet per second
Day
21.J22_.23_.24_.25_.26_.27_.28_.29_.30_.31
Runoff, in inches ______Runoff, in acre -feet
March
20161311109.6
1643
150845916
2 1 A
8,080
April
141312
798478199159131
9986
1502 QC
8,920
May
1717211919
11540383636^7
38 9
2.390
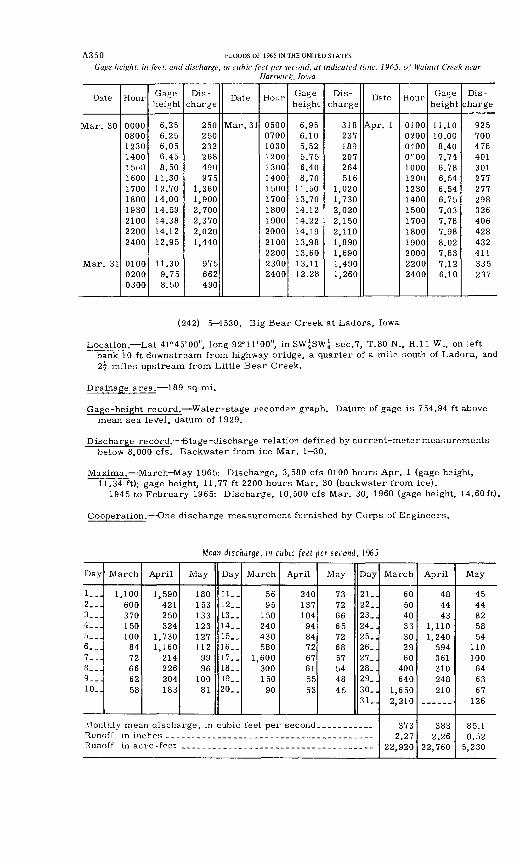
A350 FLOODS or 1965 IN THE UNITED STATES
Gage height, in feet, and discharge, in cubic feet per second, at indicated time, 1965, of Walnut Creek nearHartwick, Iowa
Date
Mar. 30
Mar. 31
Hour
000008001230140015oO1600170018001930210022002400
010002000300
Gage height
6.256.256.056.458.50
11.3012.7014.0014.5914.3814.1212.95
11.309.758.50
Dis
charge
250250232268490975
1,3601,9002,7002,3702,0201,440
975662490
Date
Mar. 31
Hour
050007001030120013001400150017001800190020002100220023002400
Gage height
6.956.105.525.756.408.70
11.5013.7014.1214.2214.1913.9813.6013.1112.28
Dis
charge
318237189207264516
1,0201,7302,0202,1502,1101,8901,6901,4901,260
Date
Apr. 1
Hour
0100020001000°00
10001200123014001500170018001900200022002400
Gage height
11.1010.008.407.746.786.546.546.757.037.787.988.027.837.126.10
Dis
charge
925700478401301277277298326406428432411335237
(242) 5 4530. Big Bear Creek at Ladora, Iowa
Location. Lat 41 0 45'00", long 92°11'00", in SW^SW{ sec.7, T.80 N., R.ll W., on left bank 10 ft downstream from highway bridge, a quarter of a mile south of Ladora, and 2i miles upstream from Little Bear Creek.
Drainage area. 189 sq mi.
Gage-height record. Water-stage recorder graph. Datum of gage is 754.94 ft above mean sea level, datum of 1929.
Discharge record. Stage-discharge relation defined by current-meter measurements below 8,000 cfs. Backwater from ice Mar. 1 30.
Maxima. March May 1965: Discharge, 3,580 cfs 0100 hours Apr. 1 (gage height, 11.34 ft); gage height, 11.77 ft 2200 hours Mar. 30 (backwater from ice).
1945 to February 1965: Discharge, 10,500 cfs Mar. 30, 1960 (gage height, 14.60ft).
Cooperation. One discharge measurement furnished by Corps of Engineers.
Mean discharge, in cubic feet per second, 1965
Day
1__.2...3...4___5__.6...7...3___9...10_.
March
1,100600370150100
8472666258
April
1,590421250324
1,7301,160
214226204183
May
180153133123127112
9996
10081
Day
11.-12. _13..14-_15-_16. _17_.18..19--20.,
March
5695
150240430580
1,600300150
90
April
240137104
94847267615553
May
73726665726857544845
Day
21..22,.23..24..25..26,.27..28..29,.30..31..
Runoff in inches ___Runoff, in acre -feet
March
60504033302960
400640
1,6502,210
3732 27
22,920
April
484443
1,1101,240
594361310248210
22,760
May
4544825854
110100
646367
126
85.10 52
5,230
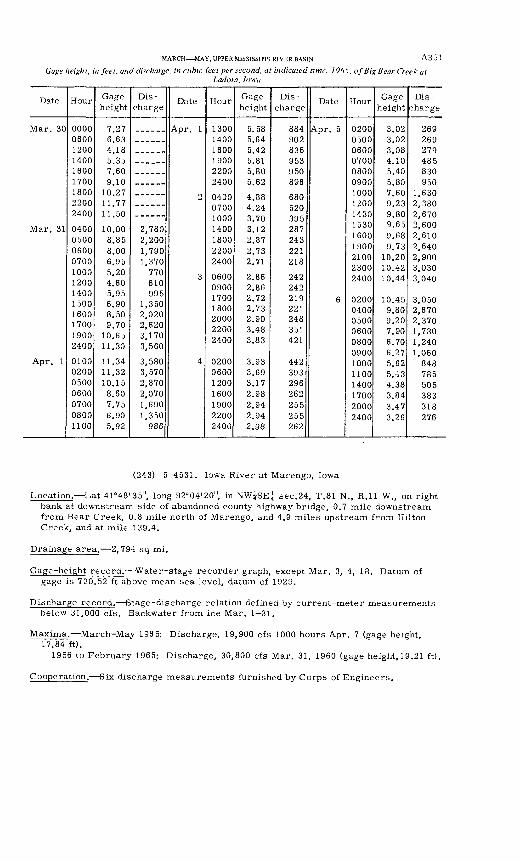
MARCH MAY, UPPER MISSISSIPPI RIVER BASIN A3 5 1
Gage height, in feet, and discharge, in cubic feet per second, at indicated time, 1965, of Big Bear Creek atLadora, Iowa
Date
Mar. 30
Mar. 31
Apr. 1
Hour
000006001200140016001700180022002400
04000500060007001000 12001400 1500 1600 1700 1900 2400
0100020005000600070008001100
Gage height
7.276.634.185.357.609.10
10.2711.7711.50
10.008.858.006.955.20 4.605.95 6.90 8.50 9.70
10.65 11.30
11.3411.3210.158.607.756.905.92
Dis
charge
2,7802,2001,7901,370770 610995
1,350 2.020 2,620 3,170 3,560
3,5803,5702,8702,0701,6901,350986
Date
Apr. 1
2
3
4
Hour
130014001600190022002400
0400070010001400180022002400
0600 09001700 1800 2000 2200 2400
0200060012001600190022002400
Gage height
5.585.64^ 4.9 <J.*r^
5.815.805.62
4.884.243.703.122.872.732.71
2.86 2.862.72 2.73 2.90 3.48 3.83
3.933.693.172.982.942.942.98
Dis
charge
884902836953950896
680520395287243221218
242 242219 221 248 351 421
442393296262255255262
Date
Apr. 5
6
Hour
02000500060007000800090010001200143015301600190021002300 2400
0200 0400 0500 0600 08000900100011001400170020002400
Gage height
3.023.023.084.105 405.807.609 23 «j9.809.659.689.73
10.2010.42 10.44
10.45 9.80 9.20 7.90 6.706.275.625.434.383.843.473.26
Dis
charge
9RQ£iO J
ORQ£iD y070 <£ i y
485830QcfiI7OU
1,6302,3802, 6702,6002,6102,6402,9003,030 3,040
3,050 2,670 2,370 1,730 1,2401,060848785505383318276
(243) 5^1531. Iowa River at Marengo, Iowa
Location. Lat 41°48'35", long 92°04'20", in NWjSEj sec.24, T.81 N., R.ll W., on right bank at downstream side of abandoned county highway bridge, 0.7 mile downstream from Bear Creek, 0.8 mile north of Marengo, and 4.9 miles upstream from Hilton Creek, and at mile 139.4.
Drainage area. 2,794 sq mi.
Gage-height record. Water-stage recorder graph, except Mar. 3, 4, 18. Datum of gage is 720.52 ft above mean sea level, datum of 1929.
Discharge record. Stage-discharge relation defined by current-meter measurements below 31,000 cfs. Backwater from ice Mar. 1 31.
Maxima. March May 1965: Discharge, 19,900 cfs 1000 hours Apr. 7 (gage height, 17.84 ft).
1956 to February 1965: Discharge, 30,800 cfs Mar. 31, 1960 (gage height, 19.21 ft).
Cooperation. Six discharge measurements furnished by Corps of Engineers.
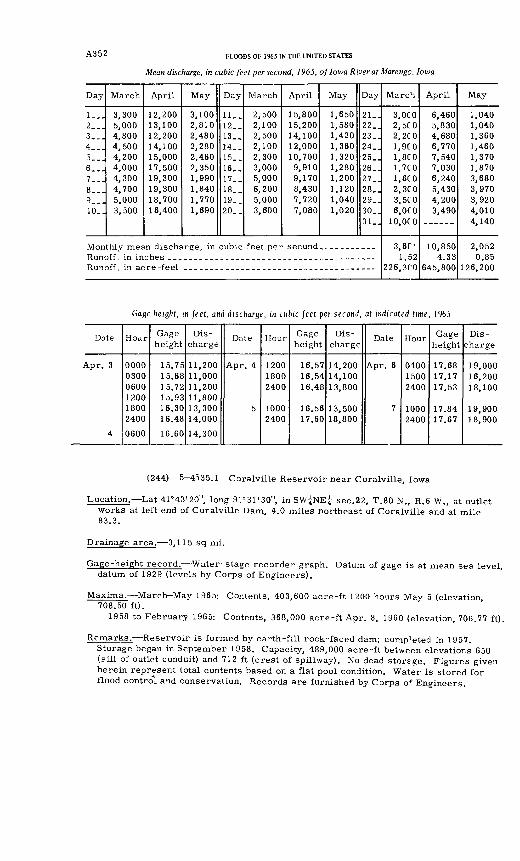
A3 5 2 FLOODS OF 1965 IN THE UNITED STATES
Mean discharge, in cubic feet per second, 1965, of Iowa River at Marengc, Iowa
Day
1...2__.3...4_._5___6...7...8...9...10..
March
3,3005,0004,8004,5004,2004,0004,3004,7005,0003,500
April
12,20013,10012,20014,10015,00017,50019,30019,30018,70016,400
May
3,1002,8102,4802,2802,4602,3501,9901,8401,7701,690
Day
11..12..13..14..15..16..17..18..19--20..
March
2,5002,1002,5002,1002,3003,0005,0006,2005,0003,600
April
15,80015,20014,10012,00010,7009,9109,1708,4307,7207,080
May
1,6501,5801,4201,3601,3201,2801,2001,1201,0401,020
Day
21..22..23..24..25..26..27..28..29..30_.31.
Monthly mean discharge, in cubic feet per second...-. _---_.
Runoff, in acre -feet
March
3,0002, SCO2.2CO1.9CO1.8CO1.7CO1.6CO2.3CO3, SCO6.0CO
10.0CO
3.6P11.52
226,300
April
6,4605,8304,6806,7707,5407,0306,2405,4304,2003,490
10,8504.33
645,800
May
1,0401,0401,3601,4601,3701,8703,6803,9703,9204,0104,140
2,0520.85
126,200
Goge height, in feet, and dischorge, in cubic feet per second, at indicated time, 1965
Date
Apr. 3
4
Hour
000003000600120018002400
0600
Gage height
15.7515.6815.7215.9316.3016.48
16.60
Dis
charge
11,20011,00011,20011,80013,30014,000
14,300
Date
Apr. 4
5
Hour
120018002400
10002400
Gage height
16.5716.5416.48
16.5617.60
Dis
charge
14,20014,10013,800
13,50018,800
Date
Apr. 6
7
Hour
010015002400
10002400
Gage height
17.6817.1717.53
17.8417.67
Dis
charge
19,00016,20018,100
19,90018,900
(244) 5 4535.1 Coralville Reservoir near Coralville, Iowa
Location. Lat 41°43'20", long 91°31'30", in SW^NE?- sec.22, T.80 N., R.6 W., at outlet works at left end of Coralville Dam, 4.0 miles northeast of Coralville and at mile 83.3.
Drainage area. 3,115 sq mi.
Gage-height record. Water-stage recorder graph. Datum of gage is at mean sea level, datum of 1929 (levels by Corps of Engineers).
Maxima. March-May 1965: Contents, 403,600 acre-ft 1200 hours May 5 (elevation 708.50 ft).
1958 to February 1965: Contents, 368,000 acre-ft Apr. 8, I960 (elevation, 706.77 ft).
Remarks. Reservoir is formed by earth-fill rock-faced dam; competed in 1957. Storage began in September 1958. Capacity, 489,000 acre-ft between elevations 650 (sill of outlet conduit) and 712 ft (crest of spillway). No dead storrge. Figures given herein represent total contents based on a flat pool condition. Water is stored for flood control and conservation. Records are furnished by Corps o f Engineers.
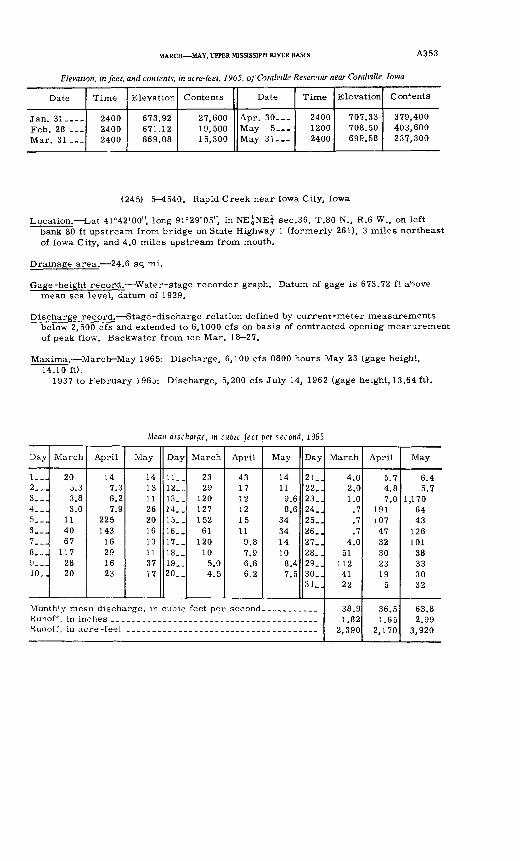
MARCH MAY, UPPER MISSISSIPPI RIVER BASIN A3 5 3
Elevation, in feet, and contents, in acre-feet, 1965, ofCoralville Reservoir near Coralville, Iowa
Date
Jan. 31. Feb. 28 __ Mar. 31 ___
Time
2400 2400 2400
Elevation
673.92 671.12 669.08
Contents
27,600 19,500 15,300
Date
Apr. 30__- May 5_-- May 31__-
Time
2400 1200 2400
Elevation
707.33 708.50 699.58
Consents
379,400 403,600 237,300
(245) 5 1540. Rapid Creek near Iowa City, Iowa
Location. Lat 41°42'00", long 91°29'05", in NEjNEj sec.36, T.80 N., R.6 W., on left bank 80 ft upstream from bridge on State Highway 1 (formerly 261), 3 miles northeast of Iowa City, and 4.0 miles upstream from mouth.
Drainage area. 24.6 sq mi.
Gage-height record. Water-stage recorder graph. Datum of gage is 673.72 ft above mean sea level, datum of 1929.
Discharge record. Stage-discharge relation defined by current-meter measurements below 2,500 cfs and extended to 6,1000 cfs on basis of contracted opening measurement of peak flow. Backwater from ice Mar. 18 27.
Maxima. March-May 1965: Discharge, 6,100 cfs 0800 hours May 23 (gage height, 14.10 ft).
1937 to February 1965: Discharge, 5,200 cfs July 14, 1962 (gage height, 13.64 ft).
Mean discharge, in cubic feel per second, 1965
Day
1...2...3...4__.5___6___7...8...9...10..
March
205.33.83.0
114067
1172820
April
147.36.27.9
225143
16291623
May
14131126201613113717
Day
11__12__13__14__15__16__17__18__19-.20__
March
2329
120127152
61120
105.04.5
April
4317121215119.87.96.66.2
May
1411
9.68.6
343414108.47.5
Day
21..22_.23_.24. .25_.26_.27..28. .29_.30_.31..
Monthly mean discharge, in cubic feet per second.. _________Runoff in inchesRunoff, in acre -feet
March
4.02.01.0
.7
.7
.74.0
51112
4122
38.91.82
2,390
April
5.74.87.0
1911074732302319
5
36.51.65
2,170
May
6.45.7
1,1706443
126101
38333032
63.82 QQ
3,920
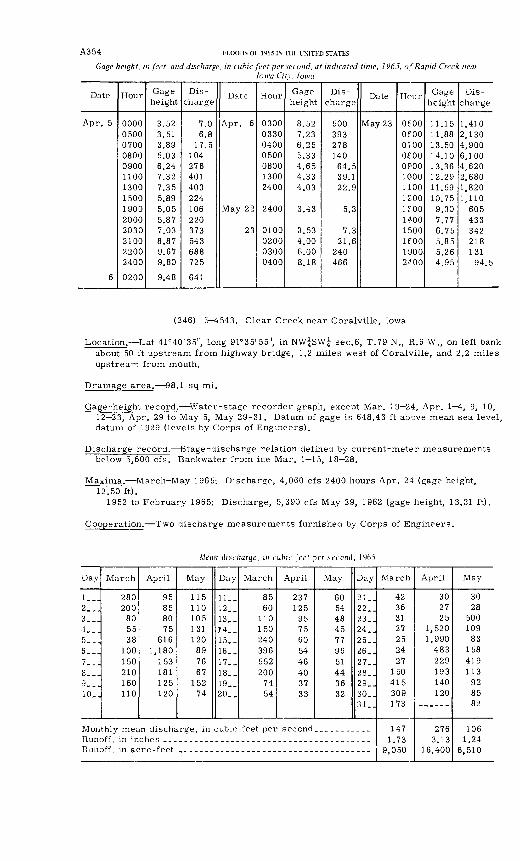
A354 FLOODS OF 1965 IN THE UNITED STATES
Gage height, in feet, and discharge, in cubic feet per second, at indicated time, 1965, of Rapid Creek nearIowa City, Iowa
Date
Apr. 5
6
Hour
00000500070008000900110013001500190020002030210022002400
0200
Gage height
3.523.513.895.036.247.327.355.895.055.877.038.879.679.80
9.48
Dis charge
7.06.8
17.5104276401403224106220373543688725
641
Date
Apr. 6
May 22
23
Hour
0300033004000500080013002400
2400
0100020003000400
Gage height
8.527.236.255.334.654.334.03
3.43
3.534.006.008.18
Dis
charge
50039327814064.539.122.9
5.3
7.321.6
240466
Date
May 23
Hour
0500oeoo07000800OPOO1000110012001"00
14001500IfOO19002^00
Gage height
11.1511.8813.5014.1013.3612.2911.5910.759.307.776.755.855.264.95
Dis charge
1,4102,1304,9006,1004,6202,6801,8201,110
605433342218131
94.5
(246) 5-4543. Clear Creek near Coralville, Iowa
Location. Lat 41°40'35", long 91°35'55", in NW^SW^ sec.6, T.79 N., R.6 W., on left bank about 50 ft upstream from highway bridge, 1.2 miles west of Coralville, and 2.2 miles upstream from mouth.
Drainage area. 98.1 sq mi.
Gage-height record. Water-stage recorder graph, except Mar. 19 24, Apr. 1 4, 9, 10, 12-23, Apr. 29 to May 5, May 29 31. Datum of gage is 648.43 ft above mean sea level, datum of 1929 (levels by Corps of Engineers).
Discharge record. Stage-discharge relation defined by current-meter measurements below 5,600 cfs. Backwater from ice Mar. 1-15, 18-28.
Maxima. March-May 1965: Discharge, 4,060 cfs 2400 hours Apr. 24 (gage height, 12.50 ft).
1952 to February 1965: Discharge, 5,390 cfs May 29, 1962 (gage height, 13.31 ft).
Cooperation. Two discharge measurements furnished by Corps of Engineers.
Mean discharge, in cubic feet per second, 1965
Day
l-._2...3...4...5...6...7...8___9...,10__
March
280200
805538
100150210160110
April
95858075
6161,180
153181125120
May
115110105131120
897667
15274
Day
11..12..13..14..15..16..17..18..19_.20..
March
8560
110150240396552200
7454
April
237125
9575605446403733
May
60544845779651443632
Day
21..22..23..24..25..26..27..28..29..30..3 1
Runoff, in acre -feet
March
42363127252427
150415309173
1471 73
9,050
April
302725
1,5201,990
483229193140120
276313
16,400
May
3028
500109
83158419113
928582
1061.24
6,510
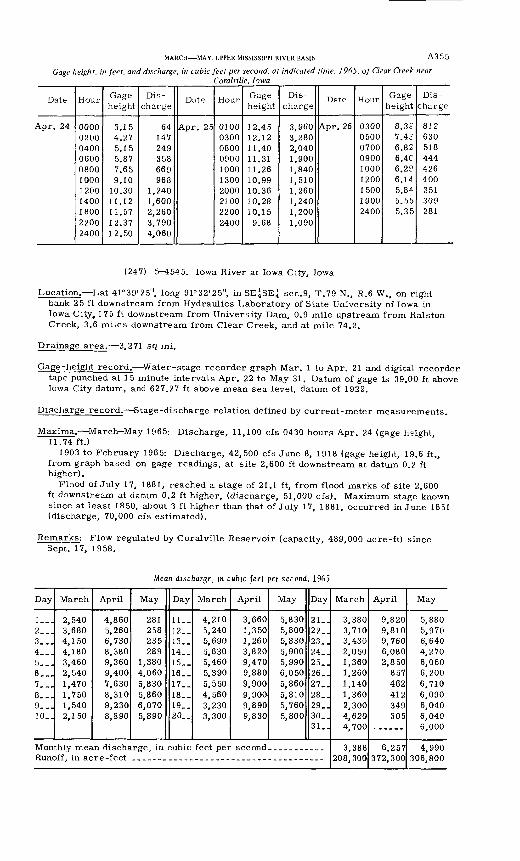
MARCH MAY, UPPER MISSISSIPPI RIVER BASIN A355
Gage height, in feet, and discharge, in cubic feet per second, at indicated time, 1965, of Clear Creek nearCorah'ille, Iowa
Date
\pr. 24
Hour
00000200040006000800100012001400180022002400
Gage height
3.154.275.155.877.659.10
10.3011.1211.5712.3712.50
Dis
charge
64147249358669968
1,2401,6002,2603,7904,060
Date
Apr. 25
Hour
0100030008000900100013002000210022002400
Gage height
12.4512.1211.4011.3111.2610.9910.3610.2810.159.68
Dis
charge
3,9603,2802,0401,9001,8401,5101,2601,2401,2001,090
Date
Apr. 26
Hour
030005000700090010001200150019002400
Gage height
8.3f7.4?6.826.4C6.2?6.145.8^
5.555.35
Dis
charge
812630518444426400351309281
(247) 5-4545. Iowa River at Iowa City, Iowa
Location. Lat 41°39'25", long 91°32'25", in SE^SE^ sec.9, T.79 N., R.6 W., on right bank 25 ft downstream from Hydraulics Laboratory of State University of Iowa in Iowa City, 175 ft downstream from University Dam, 0.9 mile upstream from Ralston Creek, 3.6 miles downstream from Clear Creek, and at mile 74.2.
Drainage area. 3,271 sq mi.
Gage-height record. Water-stage recorder graph Mar. 1 to Apr. 21 and digital recorder tape punched at 15 minute intervals Apr. 22 to May 31. Datum of gage is 39.00 ft above Iowa City datum, and 627.27 ft above mean sea level, datum of 1929.
Discharge record. Stage-discharge relation defined by current-meter measurements.
Maxima. March-May 1965: Discharge, 11,100 cfs 0430 hours Apr. 24 (gage height, 11.74 ft.)
1903 to February 1965: Discharge, 42,500 cfs June 8, 1918 (gage height, 19.6 ft., from graph based on gage readings, at site 2,600 ft downstream at datum 0.2 ft higher).
Flood of July 17, 1881, reached a stage of 21.1 ft, from flood marks of site 2,600 ft downstream at datum 0.2 ft higher, (discharge, 51,000 cfs). Maximum stage known since at least 1850, about 3 ft higher than that of July 17, 1881, occurred in June 1851 (discharge, 70,000 cfs estimated).
Remarks: Flow regulated by Coralville Reservoir (capacity, 489,000 acre-ft) since Sept. 17, 1958.
Mean discharge, in cubic feet per second, 1965
Day
1__. 2... 3...4... 5... 6...7...8...9__.10_.
March
2,540 3,680 4,1504,180 3,460 2,5401,4701,7501,5402,150
April
4,860 5,260 6,7308,380 9,360 9,4007,6308,3109,2308,890
Monthly mean discha Runoff, in acre -feet
May
281 258 235289
1,380 4,0605,8305,8606,0705,890
Day
11.. 12. _ 13_.14.. 15.. 16..17._18..19..20..
March
4,210 5,240 5,6905,630 5,460 5,3905,5504,5603,2303,300
April
3,660 1,350 1,2603,820 9,470 9,8809,9009,9009,8909,830
rge, in cubic feet per second
May
5,830 5,800 5,8305,900 5,990 6,0505,8605,8105,7605,800
Day
21.. 22.. 23_.24.. 25_. 26..27..28..29..30..31_.
March
3,380 3,710 3,4302,050 1,360 1,2601,1401,3602,3004,6204,700
3,388 208,300
April
9,820 9,810 9,7606,080 2,850
857462412349305
6,257 372,300
May
5,880 5,970 6,6404,270 6,060 6,2006,7106,0906,0406,0406,000
4,990 306,800
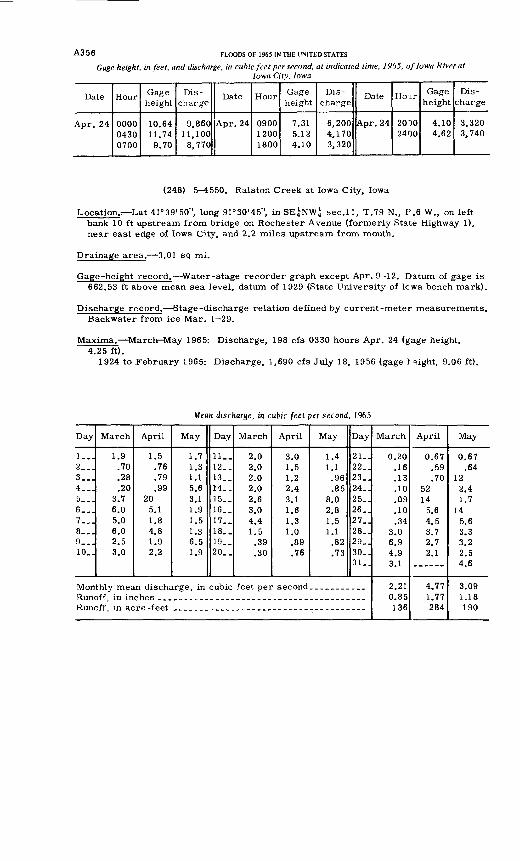
A3 5 6 FLOODS OF 1965 IN THE UNITED STATES
Gage height, in feet, and discharge, in cubic feet per second, at indicated time, 1965, of Iowa River atIowa City, Iowa
Date
Apr. 24
Hour
000004300700
Gage height
10.6411.749.70
Dis charge
9,86011,1008,770
Date
Apr. 24
Hour
090012001800
Gage height
7.315.124.10
Dis charge
6,2004,1703,320
Date
Apr. 24
Hour
20002400
Gage height
4.104.62
Dis charge
3,3203,740
(248) 5 4550. Ralston Creek at Iowa City, Iowa
Location. Lat 41°39'50", long 91"30'45", in SEjNW^ sec.11, T.79 N., P.6 W., on left bank 10 ft upstream from bridge on Rochester Avenue (formerly State Highway 1), near east edge of Iowa City, and 2.2 miles upstream from mouth.
Drainage area. 3.01 sq mi.
Gage-height record. Water-stage recorder graph except Apr. 9 12. Datum of gage is 662.53 ft above mean sea level, datum of 1929 (State University of Icwa bench mark).
Discharge record. Stage-discharge relation defined by current-meter measurements. Backwater from ice Mar. 1 29.
Maxima. March May 1965: Discharge, 198 cfs 0330 hours Apr. 24 (gage height, 4.25 ft).
1924 to February 1965: Discharge, 1,690 cfs July 18, 1956 (gage I eight, 9.06 ft).
Mean discharge, in cubic feet per second, 1965
Day
1__.2...3...4___5...6___7...8...9_-_10_.
March
1.9.70.28.20
3.76.05.06.02.53.0
Monthly mea Runoff, in in Runoff, in ac
April
1.5.76.79.99
205.11.84.81.92.2
May
1.71.31.15.63.11.91.51.36.51.9
Day
11_.12__13..14. _15._16. _17..18..19__20..
March
2.02.02.02.02.63.04.41.5.39.30
April
3.01.51.22.43.11.61.31.0.89.76
May
1.41.1.96.85
8.02.81.51.1.82.73
Day
2l_.22..23..24..25..26..27..28..29_.30..31..
in discharge, in cubic feet per second___________ ches___ - ____ ______re -feet
March
0.20.16.13.10.09.10.34
3.06.94.93.1
2.21 0.85 136
April
0.67.59.70
5214
5.64.53.72.72.1
4.77 1.77 284
May
0.67.64
122.41.7
145.63.33.22.54.6
3.09 1.18 190
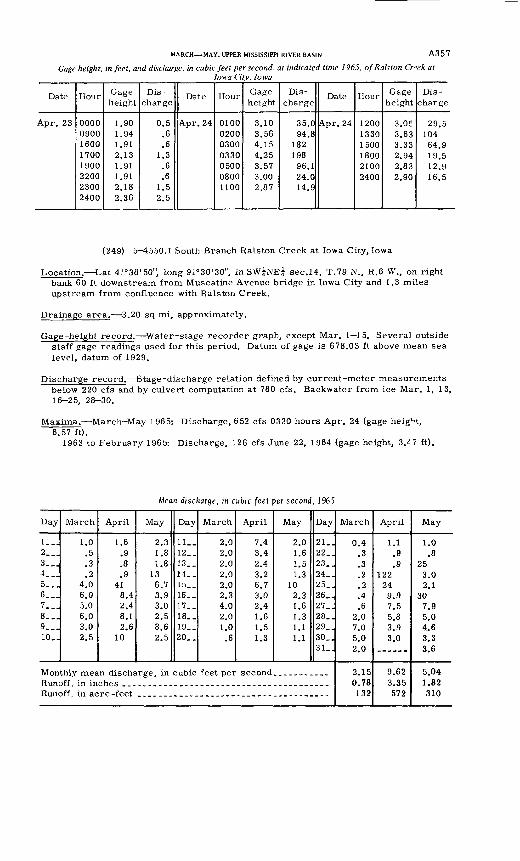
MARCH MAY, UPPER MISSISSIPPI RIVER BASIN A357
Gage height, in feet, and discharge, in cubic feet per second, at indicated time 1965, of Ralston Cr°ek atIowa City, Iowa
Date
Apr. 23
Hour
00000900160017001900220023002400
Gage height
1.901.941.912.131.911.912.182.36
Dis
charge
0.5.6.6
1.3.6.6
1.52.5
Date
Apr. 24
Hour
0100020003000330050008001100
Gage height
3.103.564.154.253.573.002.87
Dis
charge
35.094.8
18219896.124.014.9
Date
A.pr. 24
Hour
120013301500180021002400
Gage height
3.053.633.332.942.832.90
Dis
charge
29.510464.919.512.916.5
(249) 5-^550.1 South Branch Ralston Creek at Iowa City, Iowa
Location. Lat 41°38'50", long 91°30'30", in SW^NE^ sec.14, T.79 N., R.6 W., on right bank 60 ft downstream from Muscatine Avenue bridge in Iowa City and 1.3 miles upstream from confluence with Ralston Creek.
Drainage area. 3.20 sq mi, approximately.
Gage-height record. Water-stage recorder graph, except Mar. 1 15. Several outside staff gage readings used for this period. Datum of gage is 678.03 ft above mean sea level, datum of 1929.
Discharge record. Stage-discharge relation defined by current-meter measurements below 220 cfs and by culvert computation at 780 cfs. Backwater from, ice Mar. 1, 13, 16-25, 28-30.
Maxima. March May 1965: Discharge, 652 cfs 0330 hours Apr. 24 (gage height, 6.57 ft).
1963 to February 1965: Discharge, 126 cfs June 22, 1964 (gage height, 3.47 ft).
Mean discharge, in cubic feet per second, 1965
Day
l._.2__.3...4___5__.6...7...8...9...10..
March
' 1.0.5.3.2
4.06.05.06.03.02.5
April
1.6.9.8.9
418.42.48.12.6
10
May
2.31.81.8
136.73.93.02.58.62.5
Day
11..12..13..14._15__16..17. _18..19..20..
March
2.02.02.02.02.02.34.02.01.0
.6
April
7.43.42.43.26.73.02.41.61.51.3
May
2.01.61.51.3
102.31.61.31.11.1
Day
21..22..23..24. .25..26..27_.28..29..30..31..
Runoff, in inches __-Runoff, in acre -feet
March
0.4.3.3.2.2.4.6
2.07.05.02.0
2.150.78132
April
1.1.9.9
122249.97.55.83.93.0
9.623.35572
May
1.0.8
253.02.1
307.95.04.63.33.6
5.041.82310
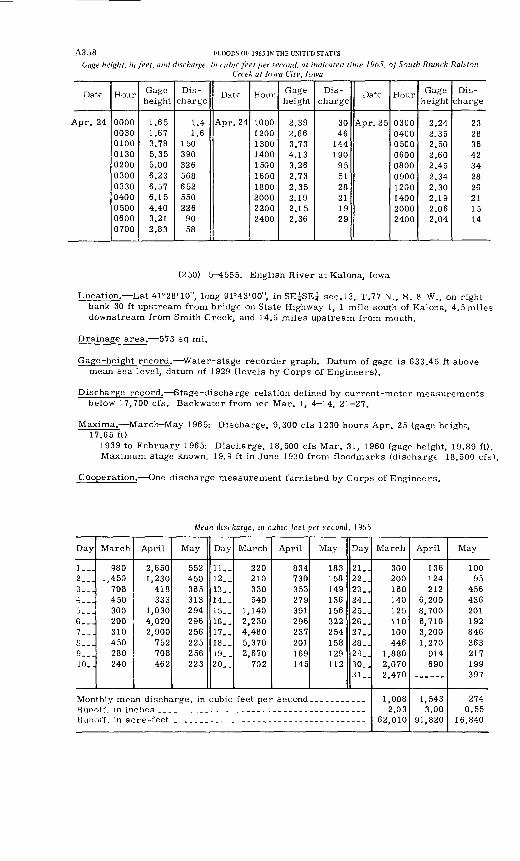
A3 58 FLOODS OF 1965 IN THE UNITED STATES
Gage height, in feet, and discharge, in c itbic feet per second, at indicated time 19 ft 5. of South Branch RalstonCreek at Iowa City, Iowa
Date
Apr. 24
Hour
00000030010001300200030003300400050006000700
Gage height
1.651.673.785.355.006.236.576.154.403.212.83
Dis
charge
1.41.6
1503903265686525502269058
Date
Apr. 24
Hour
1000120013001400150016001800200022002400
Gage height
2.392.663.734.133.262.732.352.192.152.36
Dis
charge
3046144190955128211929
Date
Apr. 25
Hour
03CO04CO05000600080009001200140020002400
Gage height
2.242.352.502.602.452.342.302.192.062.04
Dis
charge
23283642342826211514
(250) 5-^1555. English River at Kalona, Iowa
Location. Lat 41°28'10", long 91°43'00", in SE^SE^ sec.13, T.77 N., R. 8 W., on right bank 30 ft upstream from bridge on State Highway 1, 1 mile south of Kalona, 4.5 miles downstream from Smith Creek, and 14.5 miles upstream from mouth.
Drainage area. 573 sq mi.
Gage-height record. Water-stage recorder graph. Datum of gage is 633.45 ft above mean sea level, datum of 1929 (levels by Corps of Engineers).
Discharge record. Stage-discharge relation defined by current-meter measurements below 17,700 cfs. Backwater from ice Mar. 1, 4 14, 21-27.
Maxima. March-May 1965: Discharge, 9,300 cfs 1230 hours Apr. 25 (gage height, 17.65 ft)
1939 to February 1965: Discharge, 18,500 cfs Mar. 31, 1960 (gage height, 19.89 ft). Maximum stage known, 19.9 ft in June 1930 from floodmarks (discharge 18,500 cfs).
Cooperation. One discharge measurement furnished by Corps of Engineers.
Mean discharge, in cubic feet per second, 1965
Day
l-_.2...3...4...5...6...7...£___
9...10..
March
9801,450
708450300200310450280240
April
2,6501,230
418333
1,0304,0202,900
752708462
May
552450365313294296256225256223
Day
ll._12. _13..14..15_.16..17..18..19..20..
March
220210330540
1,1402,2304,4805,3702,670
702
April
834730353279391296237201169145
May
183158149136156322254158129112
Day
21..22..23..24..25..26..27..28..29..30..31..
Monthly mean discharge, in cubic feet per second- __________
Runoff, in acre-feet
March
300200160140125110100446
1,8802,0702,470
1,0082.03
62,010
April
136124212
6,2008,7006,7103,2001,270
914690
------
1,5433.00
91,820
May
10095
456436201192846363217199397
2740.55
16,840
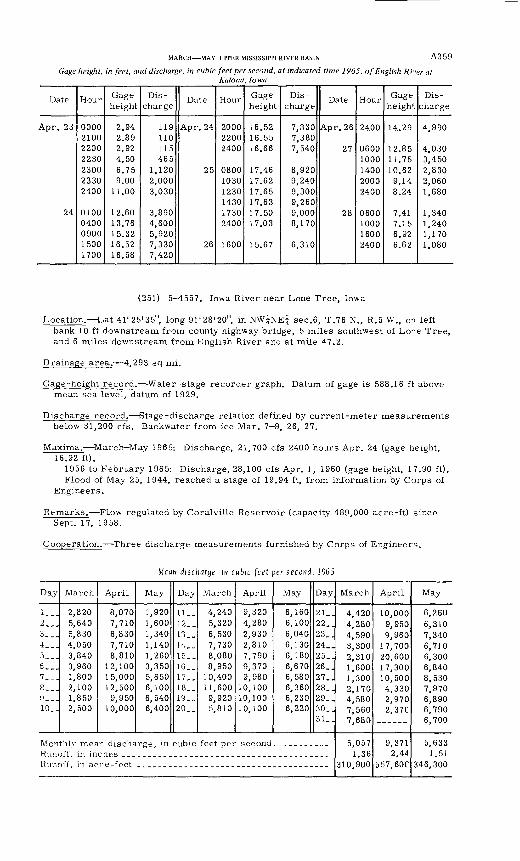
MARCH MAY, UPPER MISSISSIPPI RIVER BASIN A359
Gage height, in feet, and discharge, in cubic feet per second, at indicated time 1965, of English Ri-er atKalona, Iowa
Date
Apr. 23
24
Hour
0000210022002230230023302400
01000400090015001700
Gage height
2.942.892.924.506.759.00
11.00
12.6013.7615.3216.5216.58
Dis
charge
119110115465
1,1202,0003,030
3,8904,6005,9207,3307,420
Date
Apr. 24
25
26
Hour
200022002400
080010301230143017302400
1600
Gage height
16.5216.5516.66
17.4617.6217.6517.6317.5017.03
15.67
Dis
charge
7,3307,3807,540
8,9209,2409,3009,2609,0008,170
6,310
Date
Apr. 26
27
28
Hour
2400
06001000140020002400
0600100016002400
Gage height
14.29
12.8511.7510.629.148.24
7.417.156.926.62
Dis charge
4,990
4,0303,4502,8302,0601,680
1,3401,2401,1701,080
(251) 5 4557. Iowa River near Lone Tree, Iowa
Location. Lat 4r25'35", long 91°28'20", in NW|NE| sec.6, T.76 N., R.5 W., o^ left bank 10 ft downstream from county highway bridge, 5 miles southwest of Lo^e Tree, and 6 miles downstream from English River and at mile 47.2.
Drainage area. 4,293 sq mi.
Gage-height record. Water-stage recorder graph. Datum of gage is 588.16 ft above mean sea level, datum of 1929.
Discharge record. Stage-discharge relation defined by current-meter measurements below 31,200 cfs. Backwater from ice Mar. 7-9, 26, 27.
Maxima. March-May 1965: Discharge, 21,700 cfs 2400 hours Apr. 24 (gage height, 16.92 ft).
1956 to February 1965: Discharge, 28,100 cfs Apr. 1, 1960 (gage height, 17.90 ft). Flood of May 25, 1944, reached a stage of 19.94 ft, from information by Corps of
Engineers.
Remarks. Flow regulated by Coralville Reservoir (capacity 489,000 acre-ft) since Sept. 17, 1958.
Cooperation. Three discharge measurements furnished by Corps of Engineers.
Mean discharge, in cubic feet per second, 1965
Day
!.-_2...3...4...5__.6___7...8...9__.10..
March
2,8205,6405,8304,0503,8403,9601,8002,1001,8502,500
April
8,0707,7106,8307,7108,810
12,10015,00012,500
9,95010,000
May
1,9201,6001,3401,1401,2603,3505,6506,1006,5406,400
Day
11--12. _13_.14. _15..16_.17_.18__19..20__
March
4,2405,3206,5307,7308,0808,950
10,40011,6009,9205,810
April
9,3204,2802,9302,8107,7909,3709,980
10,10010,10010,100
May
6,1606,1006,0406,1306,1806,6706,5806,3606,2306,220
Day
21_.22..23_.24_.25_.26_.27_.28..29..30..31_.
Monthly mean discharge, in cubic feet per second... ________Runoff in inchesRunoff, in acre -feet
March
4,4204,2804,5903,3002,3101,6001,3002,1704,5807,5607,680
5,0571.36
310,900
April
10,0009,9509,960
17,70020,60017,30010,5004,3302,9702,370
9,3712.44
557,600
May
6,2606,3107,3406,7106,3006,8408,5307,9706,8906,7906,700
5,6331.51
346,300
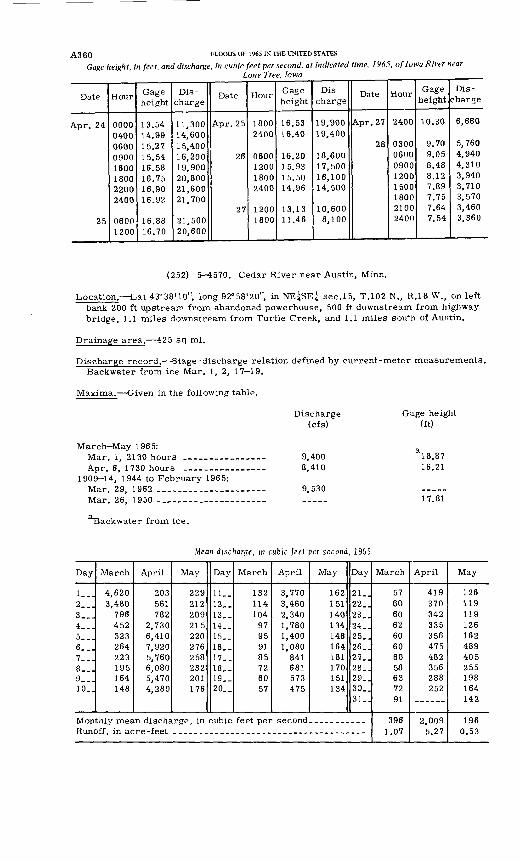
A3 60 FLOODS OF 1965 IN THE UNITED STATES
Gage height, in feet, and discharge, in cubic feet per second, at indicated time, 1965, of Iowa River nearLone Tree, Iowa
Date
Apr. 24
25
Hour
00000400060009001600180022002400
06001200
Gage height
13.5414.9915.2715.5416.5816.7516.9016.92
16.8816.70
Dis charge
11,30014,60015,40016,20019,90020,80021,60021,700
21,50020,600
Date
Apr. 25
26
27
Hour
18002400
0600120018002400
12001800
Gage height
16.5316.40
16.2015.9315.5014.96
13.1311.46
Dis
charge
19,90019,400
18,60017,50016,10014,500
10,6008,100
Date
Apr. 27
28
Hour
2400
03000600090012001500180021002400
Gage height
10.30
9.709.058.488.127.897.757.647.54
Dis
charge
6,660
5,7604,9404,3103,9403,7103,5703,4603,360
(252) 5 4570. Cedar River near Austin, Minn.
Location. Lat 43°38'10", long 92°58'20", in NE^SE? sec.15, T.102 N., R.18 W., on left bank 200 ft upstream from abandoned powerhouse, 500 ft downstream from highway bridge, 1.1 miles downstream from Turtle Creek, and 1.1 miles soux.h of Austin.
Drainage area. 425 sq mi.
Discharge record. Stage-discharge relation defined by cur rent-meter measurements. Backwater from ice Mar. 1, 2, 17-19.
Maxima. Given in the following table.
Discharge (cfs)
Gage height (ft)
March-May 1965:Mar. 1, 2130 hours .Apr. 6, 1730 hours __________
1909-14, 1944 to February 1965:Mar. 29, 1962 - - _-.Mar. 26, 1950 _____ . .
TSackwater from ice.
9,4008,410
9,530
18.8716.21
17.81
Mean discharge, in cubic feet per second, 1965
Day
l._.2__.3__.4___5...6__.7___8...9...10_.
March
4,6203,480
796452323264223195164148
April
203561782
2,7306,4107,9205,7606,0805,4704,280
May
229212209215220276258232201176
Day
11..12. _13..14. _15..16. _17..18..19..20..
March
132114104
97959185726057
April
3,7703,4602,3401,7801,4001,080
841681573475
May
162151140134148164181170151134
Day
21_.22..23..24..25..26..27..28..29..30..31_.
Monthly mean discharge, in cubic feet per second-__-__---_-Runoff, in acre -feet
March
5760606260606058637291
3961.07
April
419370342335356475482356288252
2,0095.27
May
126119119126162489405255198164142
1960.53
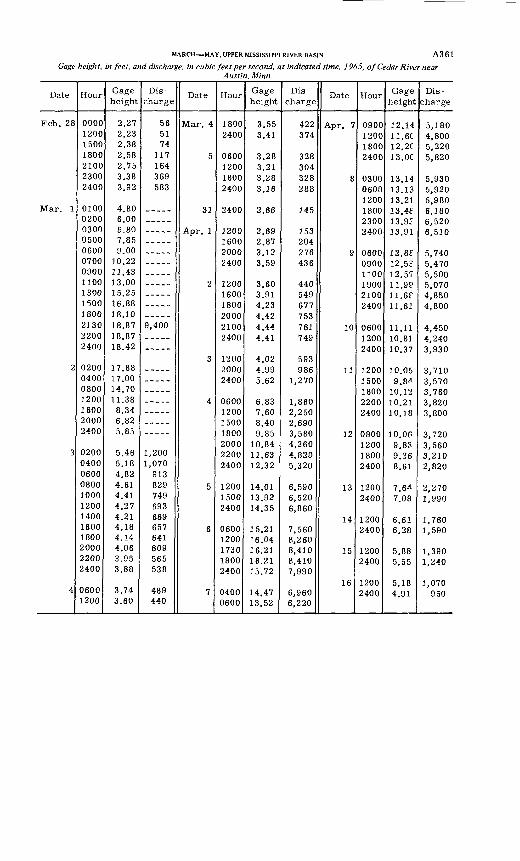
MARCH MAY, UPPER MISSISSIPPI RIVER BASIN A3 61
Gage height, in feet, and discharge, in cubic feet per second, at indicated time, 1965, of Cedar River nearAustin, Minn.
Date
Feb. 28
Mar. 1
2
3
4
Hour
0000 1200 1500 1800 2100 2300 2400
0100 0200 0300 0500 0600 0700 0900 1100 1300 1500 1800 2130 2200 2400
0200 0400 0800 1200 1600 2000 2400
0200 0400 0600 0800 1000 1200 1400 1600 1800 2000 2200 2400
0600 1200
Gage height
2.27 2.23 2.38 2.58 2.75 3.38 3.92
4.80 6.00 6.80 7.85 9.00
10.22 11.43 13.00 15.25 16.88 18.10 18.87 18.87 18.42
17.88 17.00 14.70 11.38 8.34 6.82 5.85
5.46 5.18 4.82 4.61 4.41 4.27 4.21 4.18 4.14 4.06 3.95 3.88
3.74 3.60
Dis
charge
56 51 74
117 164 369 583
9,400
1,200 1,070 913 829 749 693 669 657 641 609 565 538
489 440
Date
Mar. 4
5
31
Apr. 1
2
3
4
5
6
7
Hour
1800 2400
0600 1200 1800 2400
2400
1200 1600 2000 2400
1200 1600 1800 2000 2100 2400
1200 2000 2400
0600 1200 1500 1800 2000 2200 2400
1200 1500 2400
0600 1200 1730 1800 2400
0400 0600
Gage height
3.55 3.41
3.28 3.21 3.28 3.16
2.66
2.69 2.87 3.12 3.59
3.60 3.91 4.23 4.42 4.44 4.41
4.02 4.99 5.62
6.83 7.60 8.40 9.85
10.84 11.63 12.32
14.01 13.92 14.35
15.21 16.04 16.21 16.21 15.72
14.47 13.52
Dis
charge
422 374
328 304 328 288
145
153 204 276 436
440 549 677 753 761 749
593 986
1,270
1,860 2,250 2,690 3,580 4,260 4,820 5,320
6,590 6,520 6,860
7,560 8,260 8,410 8,410 7,990
6,960 6,220
Date
Apr. 7
8
9
10
11
12
13
14
15
16
Hour
0900 1200 1800 2400
0300 0600 1200 1800 2300 2400
0600 0900 1100 1900 2100 2400
0600 1200 2400
1200 1500 1800 2200 2400
0800 1200 1800 2400
1200 2400
1200 2400
1200 2400
1200 2400
Gage height
12.14 11. 6C 12. 2C 13. OC
13.14 13.13 13.21 13.48 13. 9J 13.91
12. 8? 12. 5? 12.57 11.9? 11. 6f 11.61
11.11 10.8] 10.37
10.05 9.84
10.12 10.21 10.18
10.06 9.83 9.26 8.61
7.6^ 7.08
6.61 6.28
5.88 5.55
5.18 4.91
Dis
charge
5,180 4,800 5,220 5,820
5,930 5,920 5,980 6,180 6,520 6,510
5,740 5,470 5,500 5,070 4,850 4,800
4,450 4,240 3,930
3,710 3,570 3,760 3,820 3,800
3,720 3,560 3,210 2,820
2,270 1,990
1,760 1,590
1,390 1,240
1,070 950
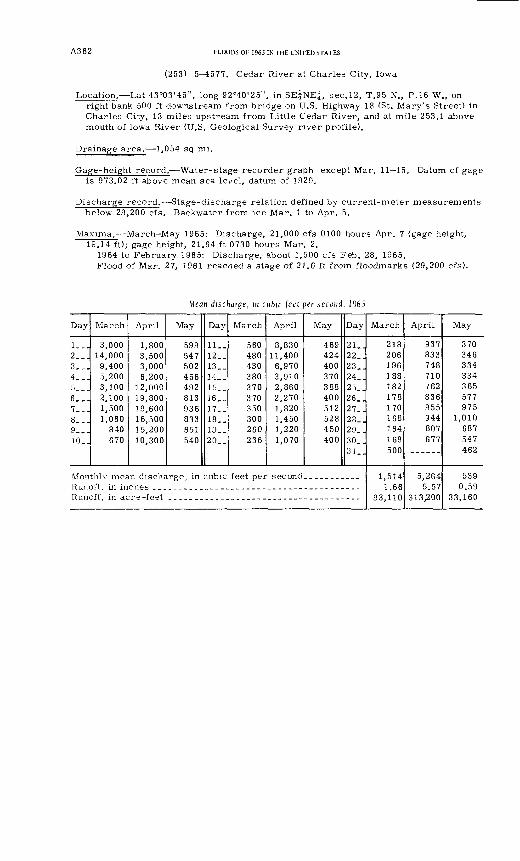
A362 FLOODS OF 1965 IN THE UNITED STATES
(253) 5^1577. Cedar River at Charles City, Iowa
Location. Lat 43°03'45", long 92°40'25", in SE^NEi, sec.12, T.95 N., P.16 W., on right bank 500 ft downstream from bridge on U.S. Highway 18 (St. Mary's Street) in Charles City, 13 miles upstream from Little Cedar River, and at mile 253.1 above mouth of Iowa River (U.S. Geological Survey river profile).
Drainage area. 1,054 sq mi.
Gage-height record. Water-stage recorder graph except Mar. 11 15. Datum of gage is 973.02 ft above mean sea level, datum of 1929.
Discharge record. Stage-discharge relation defined by current-meter measurements below 29,200 cfs. Backwater from ice Mar. 1 to Apr. 5.
Maxima,- March May 1965: Discharge, 21,000 cfs 0100 hours Apr. 7 (gage height, 19.14 ft); gage height, 21.64 ft 0730 hours Mar. 2.
1964 to February 1965: Discharge, about 1,500 cfs Feb. 28, 1965.Flood of Mar. 27, 1961 reached a stage of 21,6 ft from floodmarks (29,200 cfs).
Mean discharge, in cubic fed per second, 1965
Day
1__.2...3...4. __5...6...7__.8...9...10..
March
3,00014,0009,4005,2003,1002,1001,5001,060
840670
April
1,8003,5003,0006,200
12,00019,80019,60016,50015,20010,300
May
599547502456492813936833651540
Day
11..12..13..14..15..16..17..18..19..20..
March
560480430380370370350300260236
April
8,83011,4006,9703,9102,8602,2701,8201,4501,2201,070
May
469424400370388400512528450400
Day
21..22..23..24..25..26..27..28..29..30..3 1
Monthly mean discharge, in cubic feet per second.. _________
Runoff, in acre -feet
March
218206196188182178170168164168500
1,5141.66
93,110
April
937833748710762836955944807677
5,2645.57
313,200
May
370346334334365577975
1,010687547462
5390.59
33,160
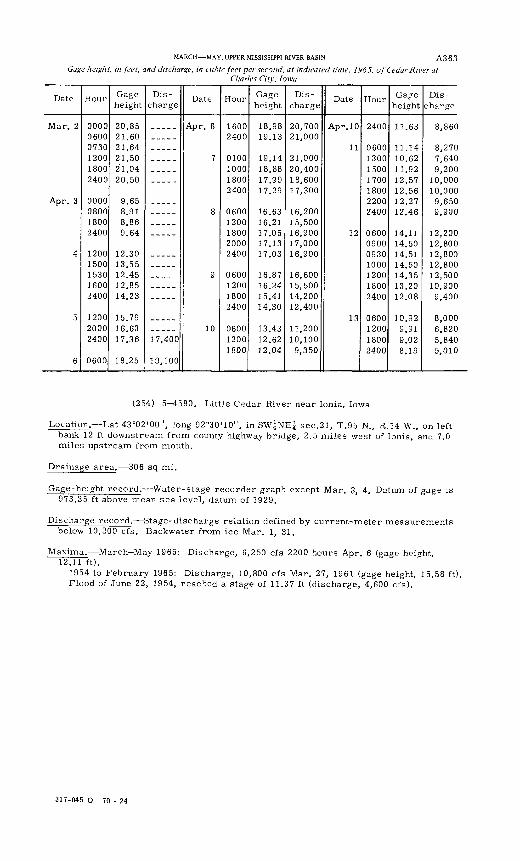
MARCH MAY, UPPER MISSISSIPPI RIVER BASIN A3 63
Gage height, in feet, and discharge, in cubic feet per second, at indicated time, 1965, of Cedar River atCharles Citv. Iowa
Date
Mar. 2
4
5
6
Hour
000006000730120018002400
0000080018002400
12001500153016002400
120020002400
0600
Gage height
20.8521.6021.6421.5021.0420.50
9.658.918.869.64
12.3013.5512.4512.8514.23
15.7916.6317.36
18.25
Dis
charge
17,400
19,100
Date
7
8
9
10
Hour
16002400
0100100018002400
0600120018002000 2400
0600120018002400
06001200 1800
Gage height
18.9819.13
19.1418.8817.9917.29
16.63
17.0517.13 17.03
16.8716.2415.4114.30
1 9 43
12.62 12.04
Dis
charge
20,70021,000
21,00020,40018,60017,300
16,200
17,000
16,600
14,20012,400
11,20010,100 9,350
Date
Apr. 10
11
12
13
Hour
2400
06001300150017001800
2400
06000900 09301000120018002400
060012001800 2400
Gage height
11.63
10.62H Q9
12.5712.56
12.46
14.1114.50 14 5114.5014 35132012.08
in Q 99919.02 8.19
Dis
charge
8,860
8,2707,6409 9nn
10,00010,000 9,6509 900'
12 20012,800 12,80012,80012,50010,9009 400
8,0006,8205,840 5,010
(254) 5^580. Little Cedar River near Ionia, Iowa
Location. Lat 43°02'00", long 92°30'10", in SW?NE| sec.21, T.95 N., R.14 W., on left bank 12 ft downstream from county highway bridge, 2.5 miles west of Ionia, and 7.0 miles upstream from mouth.
Drainage area. 306 sq mi.
Gage-height record. Water-stage recorder graph except Mar. 3, 4. Datum of gage is 973.35 ft above mean sea level, datum of 1929.
Discharge record. Stage-discharge relation defined by current-meter measurements below 10,200 cfs. Backwater from ice Mar. 1, 31.
Maxima. March-May 1965: Discharge, 6,250 cfs 2200 hours Apr. 6 (gage height, 12.11 ft).
1954 to February 1965: Discharge, 10,800 cfs Mar. 27, 1961 (gage height, 15.58 ft). Flood of June 22, 1954, reached a stage of 11.37 ft (discharge, 4,600 cfs).
317-045 O - 70 - 24
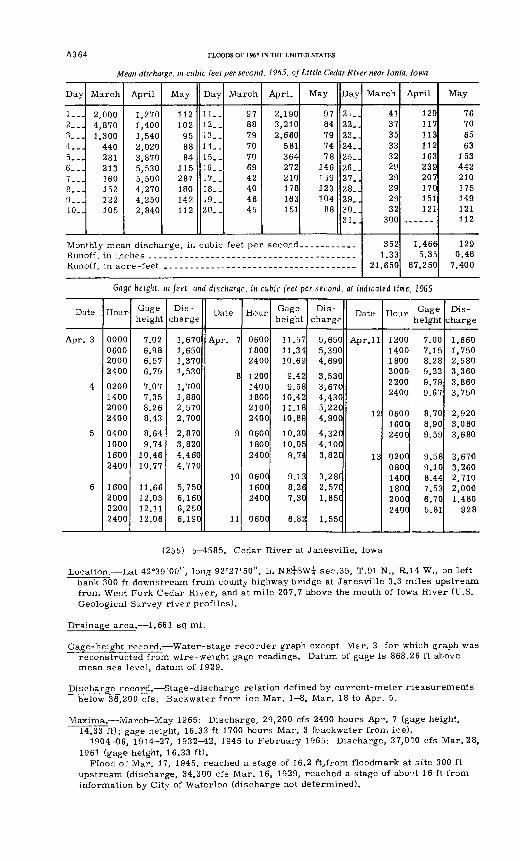
A3 64 FLOODS OF 1965 IN THE UNITED STATES
Mean discharge, in cubic feet per second, 1965, of Little Cedar River near Ionia, Iowa
Day
1...2...3...4...5...6...7,.ja.__9___10. _
March
2,0004,8701,300
440281213160152122105
April
1,2701,4001,5402,0203,8705,5305,5004,2704,2502,840
May
112102
958884
115287180142112
Monthly mean discharge, in
Day
11..12..13..14..15..16..17..18..19..20..
March
97887970706942404645
April
2,1903,2102,660
581364272210178163151
May
9784797478
146159123104
88
Day
21..22..23..24..25..26..27..28..29..30..31 J
cubic feet per second... ........
Runoff, in acre -feet
March
41373533322929292932
300
3521.33
21,650
April
129117113112163239207170151121
1,4665.35
87,250
May
76706563
153442210175149121112
1290.48
7,400
Gage height, ni feet, and discharge, in cubic feet per second, at indicated time, 1965
Date
Apr. 3
4
5
6
Hour
0000060020002400
0200140020002400
0400100016002400
1600200022002400
Gage height
7.026.986.576.79
7.077.358.268.43
8.649.74
10.4610.77
11.6612.0312.1112.06
Dis
charge
1,6701,6501,3701,530
1,7001,8802,5702,700
2,8703,8204,4604,770
5,7506,1606,2506,190
Date
Apr. 7
8
9
10
11
Hour
060018002400
12001400180021002400
060018002400
060016002400
0600
Gage height
11.5711.3410.69
9.429.58
10.4211.1810.89
10.3010.059.74
9.138.267.30
6.82
Dis
charge
5,6505,3904,690
3,5303,6704,4305,2204,900
4,3204,1003,820
3,28C2,5701,85C
1,55C
Date
Apr. 11
12
13
Hour Gae e height
1200 7.001400 7.151800 8.28200022002400
060016002400
020008001400180020002400
9.229.799.67
8.708.909.59
9.589.108.447.536.705.81
Dis
charge
1,6601,7502,5803,3603,8603,750
2,9203,0803,680
3,6703,2602,7102,0001,480
928
(255) 5^585. Cedar River at Janesville, Iowa
Location. Lat 42°39'00", long 92°27'50", in NE^SWi sec.35, T.91 N., R.14 W., on left bank 300 ft downstream from county highway bridge at Janesville 3.3 miles upstream from West Fork Cedar River, and at mile 207.7 above the mouth of Iowa River (U.S. Geological Survey river profiles).
Drainage area. 1,661 sq mi.
Gage-height record. Water-stage recorder graph except Mar. 3 for which graph was reconstructed from wire-weight gage readings. Datum of gage is 868.26 ft above mean sea level, datum of 1929.
Discharge record. Stage-discharge relation defined by current-meter neasurements below 36,200 cfs. Backwater from ice Mar. 1 8, Mar. 18 to Apr. 5.
Maxima. March-May 1965: Discharge, 29,200 cfs 2400 hours Apr. 7 (gage height, 14.33 ft); gage height, 16.33 ft 1700 hours Mar. 3 (backwater from ice).
1904-06, 1914-27, 1932^2, 1945 to February 1965: Discharge, 37,0?0 cfs Mar. 28,
1961 (gage height, 16.33 ft).Flood of Mar. 17, 1945, reached a stage of 16.2 ft,from floodmark at site 300 ft
upstream (discharge, 34,300 cfs Mar. 16, 1929, reached a stage of abo^t 16 ft from information by City of Waterloo (discharge not determined).
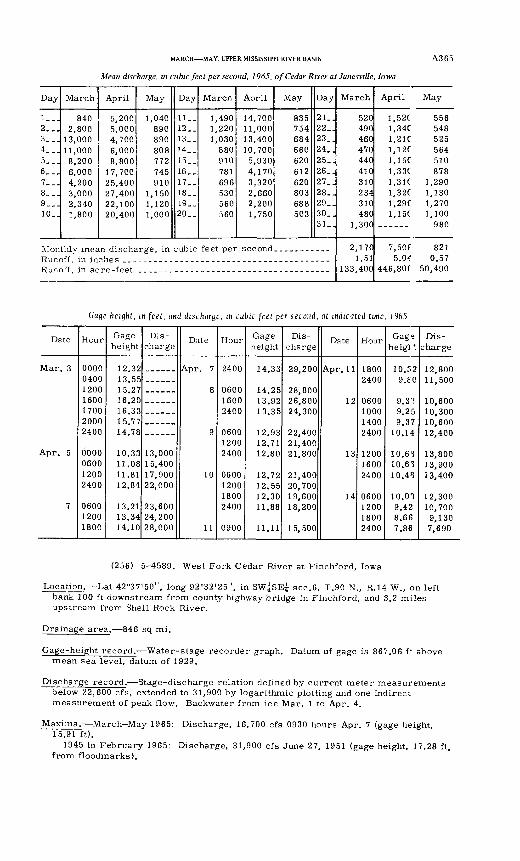
MARCH MAY, UPPER MISSISSIPPI RJVER BASIN
Mean discharge, in cubic feet per second, 1965, of Cedar River at Janesville, Iowa
A365
Day
1__.2...3...4___5. __6...7___8...9...10..
March
8402,800
13,00011,0008,2006,0004,2003,0002,3401,800
April
5,2005,0004,7006,0008,800
17,70025,40027,40022,10020,400
May
1,040890890808772745910
1,1501,1201,000
Day
11..12-.13.-14__15..16. _17__18..19__20..
March
1,4901,2201,030
880910781696530560560
April
14,70011,00013,40010,7005,9304,1703,3202,6602,2001,750
May
835754684660620612620803688503
Day
21_.22_.23_.24..25..26..27..28..29_.30..31..
Monthly mean discharge, in cubic feet per second..... -.--_.
Runoff, in acre -feet
March
520490460470440410310234310480
1,300
2,1701.51
133,400
April May
1,520 5561.34C 5481.21C 5251.12C 5641.15C 5101,33C 8781,31C 1,2901,32C 1,1301,290 1,2701,150 1,100
980
7,50£ 8215.04 0.57
446,800 50,490
Gage height, in feet, and discharge, in cubic feet per second, at indicated time, 1965
Date
Mar. 3
Apr. 5
7
Hour
0000040012001600170020002400
o'ooo060012002400
060012001800
Gage height
12.3213.5515.2716.2016.3315.7714.78
10.3311.0811.8112.84
13.2113.3414.10
Dis
charge
13,00015,40017,90022,000
23,60024,20028,000
Date
Apr. 7
8
g
10
11
Hour
2400
060016002400
060012002400
0600120018002400
0900
Gage height
14 33
14 251 ^ Q9 L o.t?£
13.35
19 Q*3L 6. yo12.7112.80
12.7212.5512.3011.88
11.11
Dis
charge
29 200*
28,80026,80024,300
99 4fifl6 ^,rtUU
21,40021,800
21,40020,70019,60018,200
1 5, 500
Date
Apr. 11
12
13
14
Hour
18002400
0600100014002400
120016002400
0600120018002400
Gag°
heigl^.
10.529.eo
9 00 >3 J
9.259 37
10,14
10.6310. 6"10.48
10.019.428.667.86
Dis
charge
19 flfifi1 Z,oUU
11,500
10,60010,30010,60012,400
13,80013,90013,400
12,30010,7009,1307,690
(256) 5^589. West Fork Cedar River at Finchford, Iowa
Location. Lat 42°37'50", long 92°32'25", in SW^SE^ sec.6, T.90 N., R.14 W., on left bank 100 ft downstream from county highway bridge in Finchford, and 3.2 miles upstream from Shell Rock River.
Drainage area. 846 sq mi.
Gage-height record. Water-stage recorder graph. Datum of gage is 867.06 f* above mean sea level, datum of 1929.
Discharge record. Stage-discharge relation defined by current meter measurements below 22,600 cfs, extended to 31,900 by logarithmic plotting and one indirect measurement of peak flow. Backwater from ice Mar. 1 to Apr. 4.
Maxima. March May 1965: Discharge, 16,700 cfs 0930 hours Apr. 7 (gage height, 15.91 ft).
1945 to February 1965: Discharge, 31,900 cfs June 27, 1951 (gage height, 17.28 ft, from floodmarks).
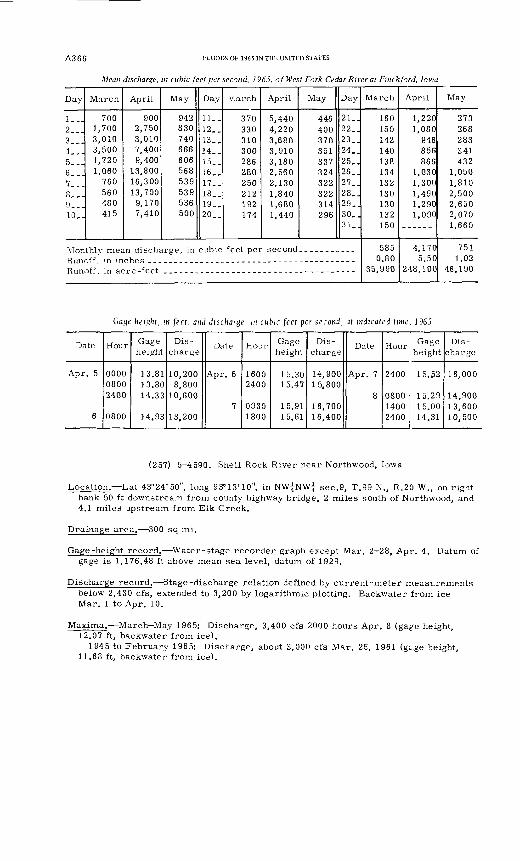
A366 FLOODS OF 1965 IN THE UNITED STATES
Mean discharge, in cubic feet per second, 1965. of West Fork Cedar River at Finchford, Iowa
Day
1...2___3.,.4...5...6...7._j8..H
9---i10..
March
7001,7003,0103,5001,7201,060
760560480415
April
9002,7503,0107,4009,400
13,80016,30013,700
9,1707,410
May
942830740666606568539539536500
Day
11.-12..13..14..15..16..17..18..19..20..
March
370330310300286280250212192174
April
5,4404,2203,6803,9103,1802,5602,1301,8401,6801,440
May
446400370351337324322322314296
Day
21..22..23..24..25..26_.27..28..29_.30..31..
Monthly mean discharge, in cubic feet per second.. _.__.....
Runoff, in acre -feet
March
160150142140138134132130130132150
5850.80
35,990
April
1,2201,080
946856866
1,0301,3001,4901,2901,090
4,1705.5C
248,100
May
273268283341432
1,0501,8102,5002,6502,0701,660
7511.02
46,190
Cage height, in feet, and discharge, in cubic feet per second, at indicated time, 1965
Date
Apr. 5
6
Hour
000008002400
0800
Gage height
13.8113.8014.33
14.93
Dis charge
10,2008,800
10,600
13,200
Date
Apr. 6
7
Hour
16002400
09301800
Gage height
15.3015.47
15.9115.61
Dis charge
14,90015,800
16,70016,400
Date
Apr. 7
8
Hour
2400
080014002400
Gage height
15.52
15.2915.0014.31
Dis
charge
16.000
14,90013,60010,500
(257) 5-^1590. Shell Rock River near Northwood, Iowa
Location. Lat 43°24'50", long 93°13'10", in NW|NW| sec.9, T.99 N., R.20 W., on right bank 50 ft downstream from county highway bridge, 2 miles south of Northwood, and 4.1 miles upstream from Elk Creek.
Drainage area. 300 sq mi.
Gage-height record. Water-stage recorder graph except Mar. 2 28, Apr. 4. Datum of gage is 1,176.48 ft above mean sea level, datum of 1929.
Discharge record. Stage-discharge relation defined by current-meter measurements below 2,430 cfs, extended to 3,200 by logarithmic plotting. Backwater from ice Mar. 1 to Apr. 10.
Maxima. March-May 1965: Discharge, 3,400 cfs 2000 hours Apr. 8 (gage height, 12.07 ft, backwater from ice).
1945 to February 1965: Discharge, about 3,000 cfs Mar. 26, 1961 (gs.ge height, 11.68 ft, backwater from ice).
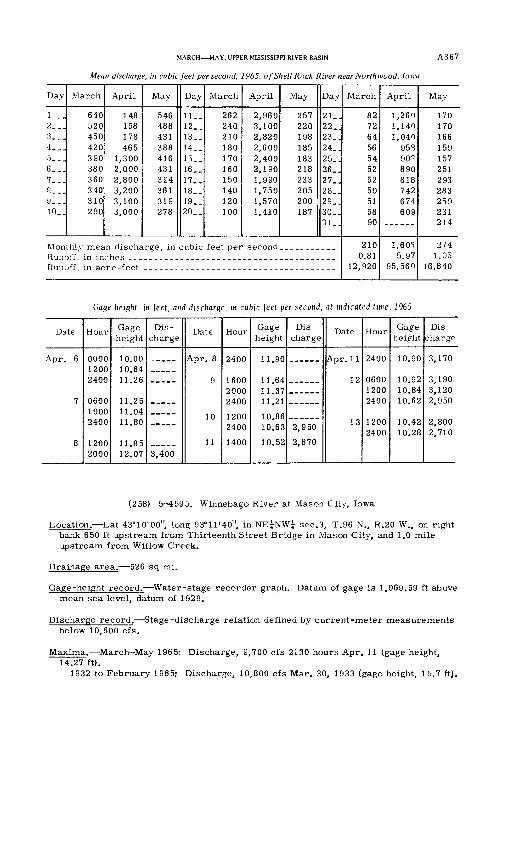
MARCH MAY, UPPER MISSISSIPPI RIVER BASIN A367
Mean discharge, in cubic feet per second, 1965, of Shell Rock River near Northwood, Iowa
Day
1__.2...3...4___5...6...7___8...y___10_.
March
640520450420390380360340310290
April
148158178465
1,3002,0002,8003,2003,1003,000
May
546488431388416431394361319278
Day
11_.12. _13..14..15__16..17..18..19..20. _
March
262240210180170160150140120100
April
2,9603,1002,8202,6002,4002,1901,9901,7501,5701,410
May
257220198185183218233205200187
Day
21..22_.23..24..25..26..27..28..29_.30..
Runoff, in inchesRunoff, in acre -feet
March
8272645654525250515890
2100.81
12,920
April
1,2601,1401,040
95890^
890818742674609
1,60"5.97
95,560
May
17017016615915725129328325923191 d
2741.05
16,840
Gage height, m feet, and discharge, m cubic feet per second, at indicated time, 1965
Date
Apr. 6
7
8
Hour
0000
2400
060010002400
12002000
Gage height
10.6411.26
11.2511.0411.80
11.8512.07
Dis
charge
3,400
Date
Q
10
11
Hour
2400
160020002400
2400
1400
Gage height
11.90
11.641 1 37
10.63
10.52
Dis
charge
2,950
2,870
Date
Apr. 11
12
13
Hour
2400
060012002400
12002400
Gage height
10.90
10.9210.8410.62
10.4210.28
Dis
charge
3,170
3,1903,1202,950
2,8002,710
(258) 5 4595. Winnebago River at Mason City, Iowa
Location. Lat 43°10'00", long 93°11'40", in NE^NW^ sec.3, T.96 N., R.20 W., on right bank 650 ft upstream from Thirteenth Street Bridge in Mason City, and 1.0 mile upstream from Willow Creek.
Drainage area. 526 sq mi.
Gage-height record. Water-stage recorder graph. Datum of gage is 1,069.59 ft above mean sea level, datum of 1929.
Discharge record. Stage-discharge relation defined by current-meter measurements below 10,600 cfs.
Maxima. March-May 1965: Discharge, 9,700 cfs 2130 hours Apr. 11 (gage height, 14.27 ft).
1932 to February 1965: Discharge, 10,800 cfs Mar. 30, 1933 (gage height, 15.7 ft).
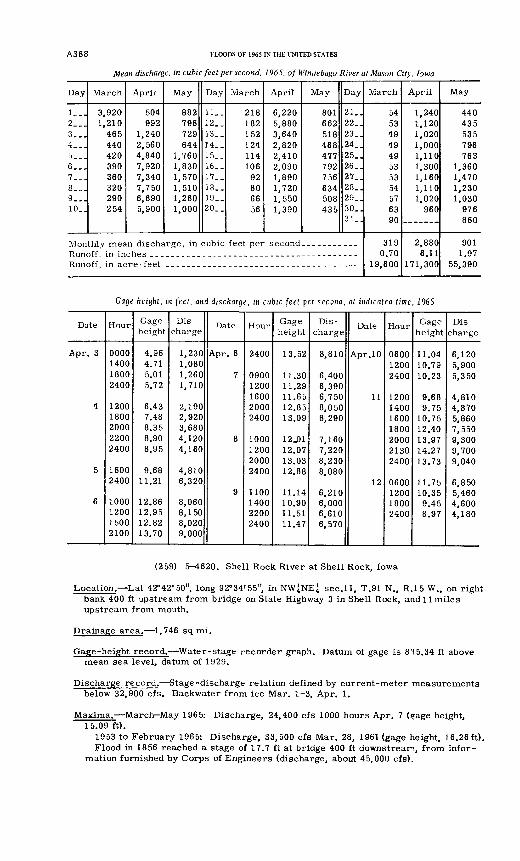
A3 68 FLOODS OF 1965 IN THE UNITED STATES
Mean discharge, in cubic feet per second, 1965, ofWinnebago River at Mason City, Iowa
Day
l._.2...3...4...5...6...7...8__.9__.10..
March
3,9201,210
465440420390360320290254
April
504992
1,2402,5604,8407,9207,3407,7506,6905,900
May
882796729644
1,7601,8301,5701,5101,2601,000
Monthly mean discharge in
Day
11..12..13..14..15..16..17..18..19..20..
March
218182152124114106
92806656
April
6,2205,8803,6402,8202,4102,0901,8901,7201,5501,390
May
801662518468477792756634508435
Day
21..22..23..24..25..26..27..28..29..30..31..
rnhic fept ner second
Runoff, in acre -feet
March
5453494949535354576390
3190.70
19,600
April
1,2401,1201,0201,0001,1101,3001,1601,1101,020
960
2,8806.11
171,300
May
440435535796763
1,3601,4701,2301,030
976860
9011.97
55,390
Cage height, in feet, and discharge, m cubic feet per second, at indicated time, 1965
Date
Apr. 3
4
5
6
Hour
0000140018002400
12001800200022002400
16002400
1000120015002100
Gage height
4.964.715.015.72
6.437.488.358.908.95
9.6811.21
12.8612.9512.8213.70
Dis charge
1,2301,0801,2601,710
2,1902,9203,6804,1204,160
4,8106,320
8,0608,1508,0209,000
Date
Apr. 6
7
8
9
Hour
2400
09001200160020002400
1000120020002400
1100140022002400
Gage height
13.52
11.3011.2911.6512.8513.09
12J0112.0713.0312.88
11.1410.9011.5111.47
Dis charge
8,810
6,4006,3906,7508,0508,290
7,1607,2208,2308,080
6,2106,0006,6106,570
Date
Apr. 10
11
12
Hour
060012002400
1200140016001800200021302400
0600120018002400
Gage height
11.0410.7910.23
9.689.75
10.7512.4013.9714.2713.73
11.7510.359.458.97
Dis
charge
6,1205,9005,350
4,8104,8705,8607,5509,3009,7009,040
6,8505,4604,6004,180
(259) 5-1620. Shell Rock River at Shell Rock, Iowa
Location. Lat 42°42'50", long 92°34'55", in NW^NE^ sec.11, T.91 N., R.I 5 W., on right bank 400 ft upstream from bridge on State Highway 3 in Shell Rock, and 11 miles upstream from mouth.
Drainage area. 1,746 sq mi.
Gage-height record. Water-stage recorder graph. Datum of gage is 815.34 ft above mean sea level, datum of 1929.
Discharge record. Stage-discharge relation defined by current-meter measurements below 32,900 cfs. Backwater from ice Mar. 1-3, Apr. 1.
Maxima.- March May 1965: Discharge, 24,400 cfs 1000 hours Apr. 7 (gage height, 15.09 ft).
1953 to February 1965: Discharge, 33,500 cfs Mar. 28, 1961 (gage height, 16.26ft). Flood in 1856 reached a stage of 17.7 ft at bridge 400 ft downstrean, from infor
mation furnished by Corps of Engineers (discharge, about 45,000 cfs).
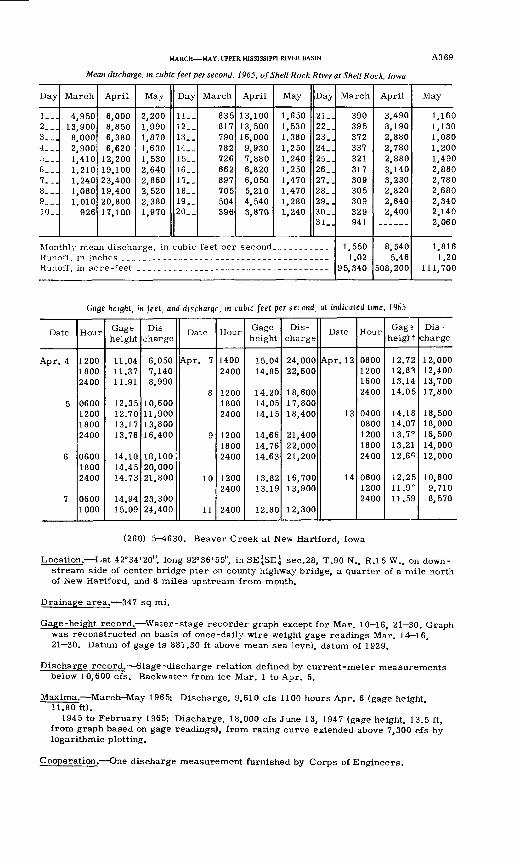
MARCH MAY, UPPER MISSISSIPPI RIVER BASIN
Mean discharge, in cubic feet per second, 1965, of Shell Rock River at Shell Rock, Iowa
A3 69
Day
1...2___3...4___5___6...7___8...9...10_.
March
4,95013,9008,0002,9001,4101,2101,2401,0801,010
926
April
6,0008,8506,3806,620
12,20019,10023,40019,40020,80017,100
May
2,2001,9901,8701,6301,5302,6402,8602,5202,3801,970
Day
11.-12,.13-.14. _15._16.-17,.18..19-.20_-
March
835817790782726662897705504396
April
13,10013,50016,0009,9307,8806,8206,0505,2104,5403,870
May
1,6501,5301,3801,2501,2401,2501,4701,4701,2801,240
Day
21..22_.23_.24_.25..26_.27,.28..29..30-.31
Monthly mean discharge, in cubic feet per second. __________
Runoff, in acre -feet
March
390395372337321317309305309329941
1,5501.02
95,340
April
3,4903,1902,8802,7802,8803,1403,2302,8202,6402,400
8,5405.46
508,200
May
1.16C1.13C1.08C1.20C1,49(2.88C2.78C2.68C2.34C2.14C2.06C
l.Blf1.2i
111.70C
Gage height, in feet, and discharge, in cubic feet per second, at indicated time, 1965
Date
Apr. 4
5
6
7
Hour
120018002400
0600120018002400
060018002400
06001000
Gage height
11.0411.3711.91
12.3512.7013.1713.76
14.1014.4514.73
14.9415.09
Dis charge
6,0507,1408,990
10,60011,90013,80016,400
18,10020,00021,800
23,30024,400
Date
Apr. 7
8
9
10
11
Hour
14002400
120018002400
120018002400
12002400
2400
Gage height
15.0414.85
14.2014.0514.15
14.6614.7614.63
13.8213.19
12.80
Dis
charge
24,00022,600
18,60017,80018,400
21,40022,00021,200
16,70013,900
12,300
Date
Apr. 12
13
14
Hour
0800120016002400
04000800120018002400
060012002400
Gage heigl t
12.7212. 8S13.1414.05
14.1814.0713.7°13.2112. 6«
12.2511.9°11.59
Dis charge
12,00012,40013,70017,800
1 8, 50018,00016,50014,00012,000
10,6009,7108,570
(260) 5-4630. Beaver Creek at New Hartford, Iowa
Location. Lat 42°34'20", long 92°36'55", in SE^SEi sec.28, T.90 N., R.I 5 W., on down stream side of center bridge pier on county highway bridge, a quarter of a mile north of New Hartford, and 8 miles upstream from mouth.
Drainage area. 347 sq mi.
Gage-height record. Water-stage recorder graph except for Mar. 10 16, 21 30. Graph was reconstructed on basis of once-daily wire weight gage readings Mar. 14 16, 21 30. Datum of gage is 881.30 ft above mean sea level, datum of 1929.
Discharge record. Stage-discharge relation defined by current-meter measurements below 10,600 cfs. Backwater from ice Mar. 1 to Apr. 5.
Maxima. March-May 1965: Discharge, 9,610 cfs 1100 hours Apr. 6 (gage height. 11.80 ft).
1945 to February 1965: Discharge, 18,000 cfs June 13, 1947 (gage height, 13.5 ft, from graph based on gage readings), from rating curve extended above 7,300 cfs by logarithmic plotting.
Cooperation. One discharge measurement furnished by Corps of Engineers.
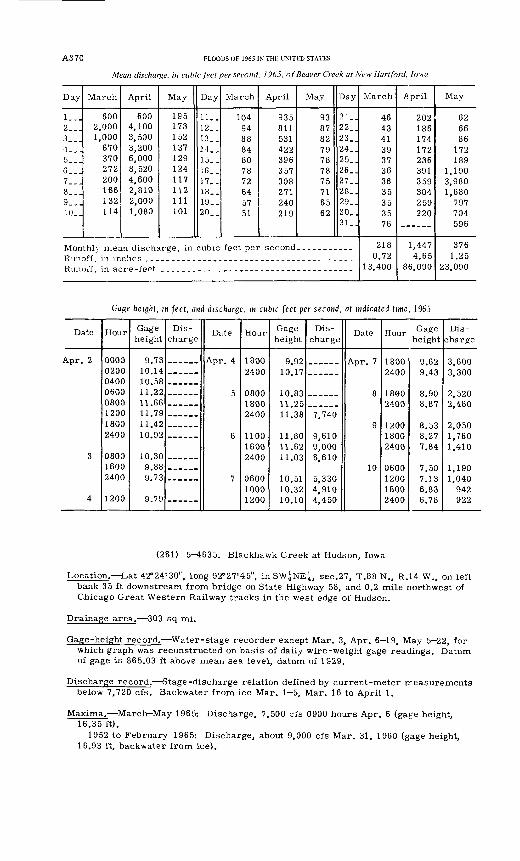
A3 70 FLOODS OF 1965 IN THE UNITED STATES
Mean discharge, in cubic feet per second, 1965, of Beaver Creek at New Hartford, Iowa
Day
1...2___3...4...5___6...7...8...9 __ 110. H
March
6002,0001,000
670370272200166132114
April
6004,1003,5003,2006,0008,5204,6002,8102,0001,080
May
195173152137129124117112111101
Monthl - mean dischar e in
Day
11..12..13..M__15..16..17..18..19..20..
March
104948884807872645751
April
935811531422396357308271240219
May
93878279787875716562
Day
21..22..23..24..25..26..27..28..29..30..31
Runoff, in acre -feet
March
4643413937363635353576
2180.72
13,400
.April
202186174172236391359304259220
1,4474.65
86,090
May
626686
172189
1,1903,9801,680
797704596
3761.25
23,090
Gage height, in feet, and discharge, in cubic feet per second, at indicated time, 1965
Date
Apr. 2
3
4
Hour
00000200040006000800120018002400
080016002400
1200
Gage height
9.7310.1410.5811.2211.6611.7911.4210.92
10.309.889.73
9.79
Dis charge
Date
5
6
7
Hour
18002400
080018002400
11001600 2400
06001000 1200
Gage height
9 9210.17
10.8311 25U o o
11.8011.62 11.03
10.5110.32 10.10
Dis
charge
7,740
9,6109,000 6,610
5 3304,910 d d Rn
Date
Apr. 7
8
g
10
Hour
18002400
18002400
120018002400
060012001800 2400
Gage height
9 629 d°.
8.908.87
7.84
7 507136.836 *7 ft
Dis
charge
3,600S QAfl
9 ^7(1
2,480
2,0501,7601,410
1,1901,040
942 922
(261) 5-4635. Blackhawk Creek at Hudson, Iowa
Location. Lat 42°24'30", long 92°27'45", in SW^NE^, sec.27, T.88 N., R.14 W., on left bank 35 ft downstream from bridge on State Highway 58, and 0.2 mile northwest of Chicago Great Western Railway tracks in the west edge of Hudson.
Drainage area. 303 sq mi.
Gage-height record. Water-stage recorder except Mar. 3, Apr. 6 19, May 5 22, for which graph was reconstructed on basis of daily wire-weight gage readings. Datum of gage is 865.03 ft above mean sea level, datum of 1929.
Discharge record. Stage-discharge relation defined by current-meter rreasurements below 7,720 cfs. Backwater from ice Mar. 1-5, Mar. 16 to April 1.
Maxima. March-May 1965: Discharge, 7,500 cfs 0900 hours Apr. 6 (gag-e height, 16.35 ft).
1952 to February 1965: Discharge, about 9,000 cfs Mar. 31, 1960 (gage height, 16.93 ft, backwater from ice).
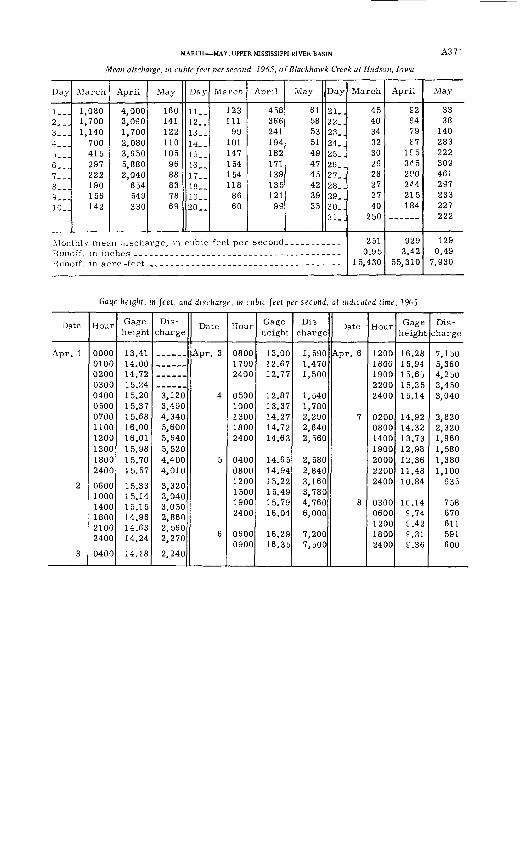
MARCH MAY, UPPER MISSISSIPPI RIVER BASIN
Mean discharge, in cubic feet per second, 1965, ofBlackhawk Creek at Hudson, Iowa
A371
Day
1 .2...3...4___?)_ __6...7...8...9...10..
March
1,0801,7001,140
700415297222190156142
April
4,0003,0901,7002,0803,6505,8802,040
654549330
May
160141122110105
9688837869
Monthly mean discharge, in
Day
11..12..13..14..15..16..17..18..19..20..
March
123111
99101147154154118
8660
April
458366241194182171139135121
99
May
61585351494745423935
Day
21..22..23..24..25..26..27..28..29..30..3 1
cubic feet per second. .. .._.....
Hunoff, in acre -feet
March
45403432302928272740
9RO
2510.95
15,430
April
£2847987
1853452PO2^4
215184
9293.42
55,310
May
3338
140283222309461297233227222
1290.49
7,930
Gnge height, in feet, and discharge, in cubic feet per second at indicated time, 1965
Date
Apr. 1
2
3
Hour
000001000200030004000500070011001200130018002400
060010001400180021002400
0400
Gage height
1 ^ 4.11 O ,^ 1
14.0014.7215.2415.2015.3715.6816.0016.0115.9815.7015.57
15.3315.1415.1514.9614.6314.24
14.18
Dis
charge
3,1203,4904,3405,6005,6405,5204,4004,010
3,3203,0403,0502,8602,5602,270
2,240
Date
Apr. 3
4
5
6
Hour
080017002400
05001000130018002400
040008001200150019002400
06000900
Gage height
13.0012.6712.77
12.8713.3714.2714.7214.63
14.6514.9415.2215.4915.7916.04
16.2916.35
Dis
charge
1,5901,4701,500
1,5401,7802,2902,6402,560
2,5802,8403,1603,7804,7606,000
7,2007,500
Date
Apr. 6
7
8
Hour
12001600190022002400
0200080014001900200022002400
03000600120018002400
Gage height
16.281 R Q4. 1 J, t/rt
15.651 ^ ^^1 U.O O
15.14
14.9214.3213.7312.9812.3611.4810.84
1C. 14£.74£.42£.31£.36
Dis
charge
7,1505,3604 9 RH9 £* O\J
3 A ^n, rt O\J
3,040
2,8202,3201,9601,5801,3801,100
935
758670611591600
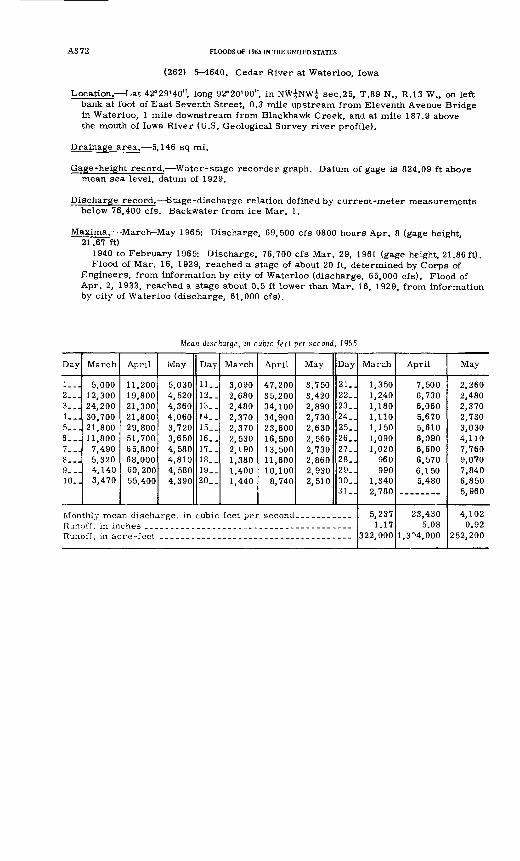
A3 72 FLOODS OF 1965 IN THE UNITED STATES
(262) 5-4640. Cedar River at Waterloo, Iowa
Location. Lat 42°29'40", long 92°20'00", in NW^NW^ sec.25, T.89 N., R.13 W., on left bank at foot of East Seventh Street, 0.3 mile upstream from Eleventh Avenue Bridge in Waterloo, 1 mile downstream from Blackhawk Creek, and at mile 187.9 above the mouth of Iowa River (U.S. Geological Survey river profile).
Drainage area. 5,146 sq mi.
Gage-height record. Water-stage recorder graph. Datum of gage is 824.09 ft above mean sea level, datum of 1929.
Discharge record. Stage-discharge relation defined by current-meter measurements below 76,400 cfs. Backwater from ice Mar. 1.
Maxima. March-May 1965: Discharge, 69,500 cfs 0800 hours Apr. 8 (gage height, 21.67 ft)
1940 to February 1965: Discharge, 76,700 cfs Mar. 29, 1961 (gage height, 21.86ft). Flood of Mar. 16, 1929, reached a stage of about 20 ft, determined by Corps of
Engineers, from information by city of Waterloo (discharge, 65,000 cfs). Flood of Apr. 2, 1933, reached a stage about 0.5 ft lower than Mar. 16, 1929, from information by city of Waterloo (discharge, 61,000 cfs).
Mean discharge, in cubic feet per second, 1965
Day
1...2...3...4...5...6...7...8...9...10..
March
5,00012,30024,20030,70021,80011,800
7,4905,3204,1403,470
April
11,20019,80021,30021,80029,80051,70065,80068,00060,20055,400
May
5,0304,5204,3604,0603,7203,6504,5804,8104,5804,390
Day
11..12_.13__14. _15__16__17__18__19_.20__
March
3,0902,6802,4802,3702,3702,5302,1901,3801,4001,440
April
47,20035,20034,10034,90023,60016,50013,50011,60010,1008,740
May
3,7503,4202,8902,7302,6302,5602,7302,8602,9302,510
Day
21_.22..23_.24_.25_.26_.27_.28_.29..30..31..
Monthly mean discharge, in cubic feet per second. __________Runoff in inchesRunoff, in acre -feet
March
1,3501,2,401,1801,1101,1501,0901,020
960990
1,3402,780
5,2371.17
322,000
April
7,5006,7306,0605,6705,6106,0906,6006,5706,1505,480
23,4305.08
1,3^4,000
May
2,2602,4802,3702,7303,0304,1107,7609,0707,8406,8505,960
4,1020.92
252,200
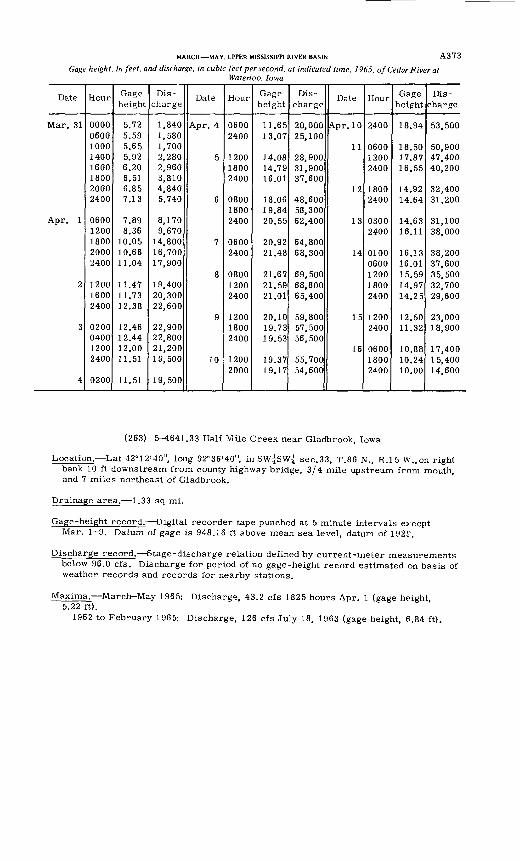
MARCH MAY, UPPER MISSISSIPPI RIVER BASIN A3 7 3
Gage height, in feet, and discharge, in cubic feet per second, at indicated time. 1965, of Cedar River atWaterloo, Iowa
Date
Mar. 31
Apr. 1
2
3
4
Hour
00000600100014001600180020002400
06001200180020002400
120016002400
0200040012002400
0200
Gage height
5.725.595.655.926.206.516.857.13
7.898.36
10.0510.6611.04
11.4711.7312.38
12.4612.4412.0011.51
11.51
Dis charge
1,8401,5801,7002,2802,9603,8104,8405,740
8,1709,670
14,80016,70017,900
19,40020,30022,600
22,90022,80021,20019,500
19,500
Date
Apr. 4
5
6
7
8
9
10
Hour
06002400
120018002400
080018002400
06002400
080012002400
120018002400
12002000
Gage height
11.6513.07
14.0814.7916.01
18.0619.8420.55
20.9221.48
21.6721.5921.01
20.1019.7319.53
19.3719.17
Dis charge
20,00025,100
28,90031,90037,600
48,60058,30062,400
64,80068,300
69,50068,80065,400
59,80057,50056,500
55,70054,600
Date
Apr. 10
11
12
13
14
15
16
Hour
2400
060012002400
18002400
03002400
01000600120018002400
12002400
060018002400
Gage heig-ht
18.94
18.5017.8716.55
14.9214.64
14.6316.11
16.1316.0115.5914.9714.25
12.5011.32
10.8810.2410.00
Dis
charge
53,500
50,90047,40040,200
32.40031,200
31,10038,000
38,20037,60035,50032,70029,600
23,00018,900
17,40015,40014,600
(263) 5-4641.33 Half Mile Creek near Gladbrook, Iowa
Location. Lat 42°12'40", long 92°36'40", in SW^SW^ sec.33, T.86 N., R.15 W.,on right bank 10 ft downstream from county highway bridge, 3/4 mile upstream from mouth, and 7 miles northeast of Gladbrook.
Drainage area. 1.33 sq mi.
Gage-height record. Digital recorder tape punched at 5 minute intervals except Mar. 1-9. Datum of gage is 948.16 ft above mean sea level, datum of 192f.
Discharge record. Stage-discharge relation defined by current-meter measurements below 96.0 cfs. Discharge for period of no gage-height record estimated on basis of weather records and records for nearby stations.
Maxima. March-May 1965: Discharge, 43.2 cfs 1825 hours Apr. 1 (gage height, 5.22 ft).
1962 to February 1965: Discharge, 126 cfs July 18, 1963 (gage height, 6.84 ft).
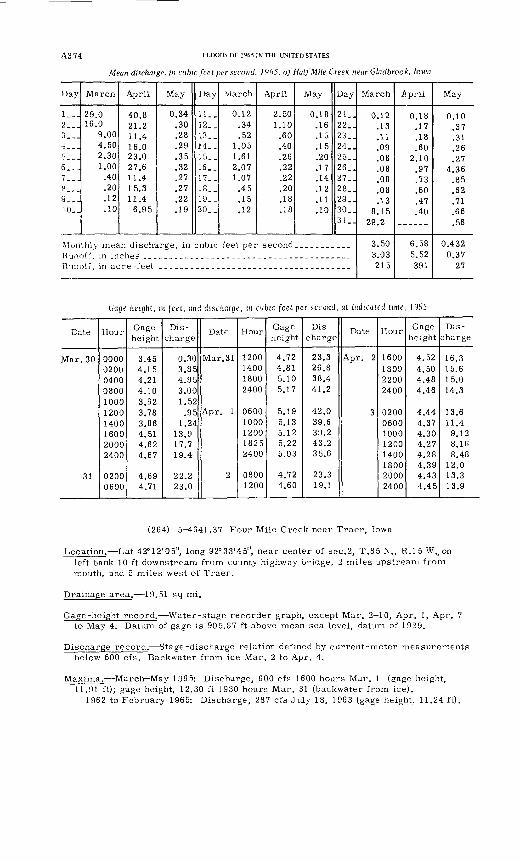
A3 74 FLOODS OF 1965 IN THE UNITED STATES
Mean discharge, in cubic feet per second, 19f>5, of Half Mile Creek near Gladbrook, Iowa
Day
!___2___3...4___5- _.6...7__.8...Q
10.]
March
29.016.0
9.004.502.301.00.40.20.12.10
April
40.821.211.416.023.027.611.415.311.46.95
May
0.34.30.28.29.35.32.27.27.22.19
Day
ll._12_.13__14__15__16__17__18__19__20__
March
0.12.34.52
1.051.612.071.07
.45
.15
.12
April
2.501.10.60.40.26.22.22.20.18.18
May
0.18.16.15.15.20.17.14.12.11.10
Day
21..22_.23_.24. .25_.26. .27_.28_.29_.30_.31..
Monthly mean discharge, in cubic feet per second.. _________
Runoff, in acre -feet
March
0.12.13.11.09.08.08.08.08.13
8.1529.2
3.503.03215
.April
0.18.17.18.60
2.10.97.73.60.47.40
6.585.52391
May
0.10.37.31.26.27
4.36.85.62.71.66.56
0.4320.37
27
Gage height, in feet, and discharge, in cubic feet per second, at indicated time, 1965
Date
Mar. 30
31
Hour
0000020004000800100012001400160020002400
02000600
Gage height
3.454.154.214.103.923.783.864.514.624.67
4.694.71
Dis
charge
0.303.854.953.001.52.95
1.2413.917.719.4
22.223.0
Date
Mar.31
Apr. 1
2
Hour
1200140018002400
06001000120018252400
08001200
Gage height
4.724.815.105.17
5.195.135.125.225.03
4.724.60
Dis
charge
23.326.838.441.2
42.039.639.243.235.6
23.319.1
Date
Apr. 2
3
Hour
1600180022002400
02000600100012001400180020002400
Gage height
4.524.504.484.46
4.444.374.304.274.284.394.434.45
Dis
charge
16.315.615.014.3
13.611.49.128.168.48
12.013.313.9
(264) 5 4641.37 Four Mile Creek near Traer, Iowa
Location. Lat 42°12'05", long 92°33'45", near center of sec.2, T.85 N., R.I 5 W., on left bank 10 ft downstream from county highway bridge, 2 miles upstream from mouth, and 5 miles west of Traer.
Drainage area. 19.51 sq mi.
Gage-height record. Water-stage recorder graph, except Mar. 2 10, Apr. 1, Apr. 7 to May 4. Datum of gage is 905.87 ft above mean sea level, datum of 1929.
Discharge record. Stage-discharge relation defined by current-meter measurements below 600 cfs. Backwater from ice Mar. 2 to Apr. 4.
Maxima. March May 1965: Discharge, 600 cfs 1600 hours Mar. 1 (gage height, 11.91 ft); gage height, 12.30 ft 1930 hours Mar. 31 (backwater from ice).
1962 to February 1965: Discharge, 287 cfs July 18, 1963 (gage height, 11.24 ft).
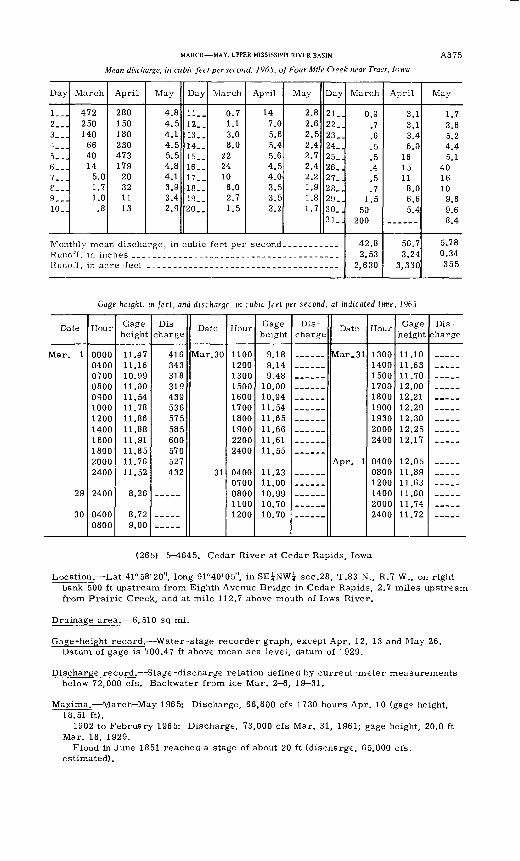
MARCH MAY, UPPER MISSISSIPPI RIVER BASIN
Mean discharge, in cubic feet per second, 1965, of Four Mile Creek near Traer, Iowa
A375
Day
1__.2__.3..^4...5...6...7__.e___9__-10..
March
472250140
664014
5.01.71.0.8
April
280150180230473179
20321113
May
4.84.54.14.55.54.84.13.93.42.9
Day
11..12..13..14..15..16..17..18. _19..20-,
March
0.71.13.08.0
2224106.02.71.5
April
147.05.65.45.64.54.03.53.53.2
May
2.82.62.52.42.72.42.21.91.81.7
Day
21,.22..23..24..25.J26. J27..28.-2930..31
Runoff in inchesRunoff, in acre -feet
March
0.9.7.6.5.5.4.5.7
1.550
200
42.82.53
2,630
April
3.13.13.46.0
1615118.06.65.4
56.73.24
3,330
May
1.73.65.24.45.1
401610
9.69.68.4
5.780.34355
Gage height, m feet, and discharge, in cubic feet per second, at indicated time, 19P5
Date
Mar. 1
29
30
Hour
000004000700080009001000120014001600180020002400
2400
04000800
Gage height
11.4711.1610.9911.0011 5411.7811.8611.8811 9111.8511.7611.52
8.26
8.729.00
Dis
charge
41694.9
31831 9439536RVR
585600<i7n
527432
Date
Mar. 30
31
Hour
1100120013001500160017001800190099 (\o
2400
04000700080011001200
Gage height
9.189.149.48
10.0010 9411.5411.6511.6611.6111.55
11.2311.0010 9910.7010.70
Dis
chargeDate
Mar_31
Hour
130014001500170018001900193020002400
040008001200140020002400
Gage height
11.1011.6311.7012.0012.2112.2912.3012.2512.17
12.0511.8911.6311.6011.7411.72
Dis
charge
(265) 5-4645. Cedar River at Cedar Rapids, Iowa
Location. Lat 41°58'20", long 91°40'05", in SE^NW? sec.28, T.83 N., R.7 W., on right bank 500 ft upstream from Eighth Avenue Bridge in Cedar Rapids, 2.7 miles upstream from Prairie Creek, and at mile 112.7 above mouth of Iowa River.
Drainage area. 6,510 sq mi.
Gage-height record. Water-stage recorder graph, except Apr. 12, 13 and May 26. Datum of gage is 700.47 ft above mean sea level, datum of 1929.
Discharge record. Stage-discharge relation defined by current-meter measurements below 72,000 cfs. Backwater from ice Mar. 2-6, 19-31.
Maxima. March-May 1965: Discharge, 66,800 cfs 1730 hours Apr. 10 (gage height, 18.51 ft).
1902 to February 1965: Discharge, 73,000 cfs Mar. 31, 1961; gage height, 20.0 ft Mar. 18, 1929.
Flood in June 1851 reached a stage of about 20 ft (discharge, 65,000 cfs. estimated).
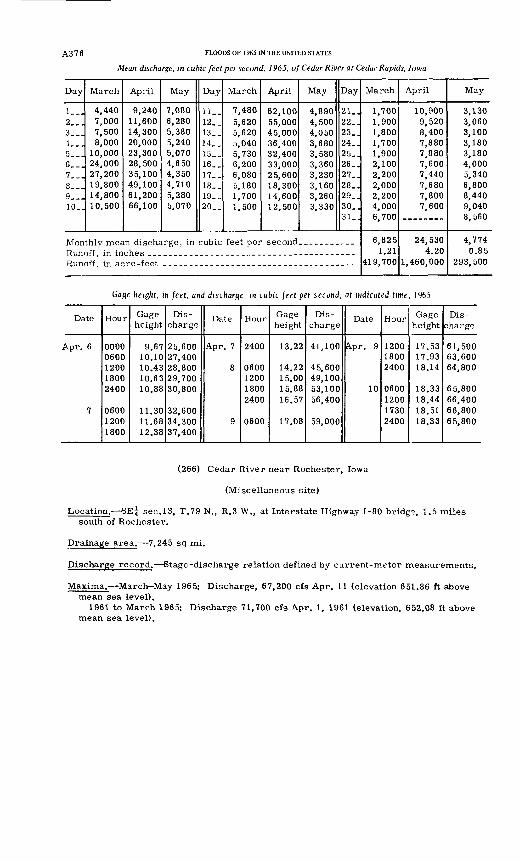
A3 7 6 FLOODS OF 1965 IN THE UNITED STATES
Mean discharge, in cubic feet per second, 1965, of Cedar River at Cedar Rapids, Iowa
Day
1__.2...3...4...5...6...7...8...9...10..
March
4,4407,0007,5008,000
10,00024,00027,20019,80014,80010,500
April
9,24011,60014,30020,00023,30028,50035,10049,10061,20066,100
May
7,0806,2805,3805,2405,0704,6504,3504,7105,2805,070
Day
11_.12..13..14..15..16..17..18..19-.20..
March
7,4805,6205,6205,0405,7306,2006,0805,1801,7001,500
April
62,10055,00045,00036,40032,40033,00025,60018,30014,60012,500
May
4,8904,5004,0503,6803,5803,3603,2303,1603,2603,330
Day
21..22_.23..24..25..26..27..28..29..30..31
Runoff, in acre -feet
March
1,7001,9001,8001,7001,9002,1002,2002,0002,2004,0006,700
6,8251.21
419,700
April
10,9009,5208,4007,8807,8807,6007,4407,6807,8007,600
24,5304.20
1,460,000
May
3,1303,0603,1003,1803,1804,0005,3406,8008,4409,0408,560
4,7740.85
293,500
Gage height, in feet, and discharge, in cubic feet per second, at indicated time, 1965
Date
Apr. 6
7
Hour
00000600120018002400
060012001800
Gage height
9.6710.1010.4310.6310.88
11.3011.6812.38
Dis charge
25,60027,40028,80029,70030,800
32,60034,30037,400
Date
Apr. 7
8
9
Hour
2400
0600120018002400
0600
Gage height
13.22
14.2215.0015.8816.57
17.08
Dis charge
41,100
45,60049,10053,10056,400
59,000
Date
Apr. 9
10
Hour
120018002400
0600120017302400
Gage height
17.5317.9318.14
18.3318.4418.5118.33
Dis charge
61,50063,60064,800
65,80066,40066,80065,800
(266) Cedar River near Rochester, Iowa
(Miscellaneous site)
Location. SEj sec.13, T.79 N., R.3 W., at Interstate Highway 1-80 bridge, 1.5 miles south of Rochester.
Drainage area. 7,245 sq mi.
Discharge record. Stage-discharge relation defined by current-meter measurements.
Maxima. March May 1965: Discharge, 67,200 cfs Apr. 11 (elevation 651.86 ft above mean sea level).
1961 to March 1965: Discharge 71,700 cfs Apr. 1, 1961 (elevation, 652.08 ft above mean sea level).
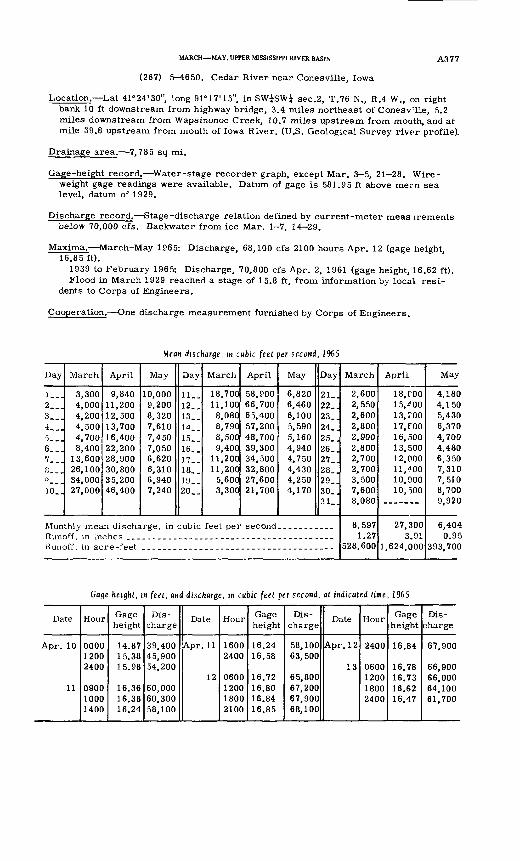
MARCH MAY, UPPER MISSISSIPPI RIVER BASIN
(267) 5-4650. Cedar River near Conesville, Iowa
A377
Location. Lat 41°24'30", long 91°17'15", in SW^SWi sec.2, T.76 N., R.4 W., on right bank 10 ft downstream from highway bridge, 3.4 miles northeast of Conesv^lle, 5.2 miles downstream from Wapsinonoc Creek, 10.7 miles upstream from mouth, and at mile 39.8 upstream from mouth of Iowa River. (U.S. Geological Survey river profile).
Drainage area. 7,785 sq mi.
Gage-height record. Water-stage recorder graph, except Mar. 3 5, 21 28. Wire- weight gage readings were available. Datum of gage is 581.95 ft above mern sea level, datum of 1929.
Discharge record. Stage-discharge relation defined by current-meter meas irements below 70,000 cfs. Backwater from ice Mar. 1 7, 14 29.
Maxima. March-May 1965: Discharge, 68,100 cfs 2100 hours Apr. 12 (gage height, 16.85 ft).
1939 to February 1965: Discharge, 70,800 cfs Apr. 2, 1961 (gage height, 16.62 ft). Flood in March 1929 reached a stage of 15.8 ft, from information by local resi
dents to Corps of Engineers.
Cooperation. One discharge measurement furnished by Corps of Engineers.
Mean discharge, in cubic feet per second, 1965
Day
1__.2__.3... i...
T__.
6...7...s__.q___10_.
March
3,3004,0004,2004,5004,7008,400
13,60026,10034,00027,000
April
9,84011,20012,50013,70016,40022,20028,90030,80035,20046,400
May
10,0009,2008,3207,6107,4507,0506,6206,3106,9407,240
Day
11..12..13..14..15_.16..17..18..19.-20. _
March
18,70011,100
8,0808,7908,5009,400
11,20011,200
5,6003,300
April
58,90066,70065,40057,20048,70039,30034,50032,80027,60021,700
May
6,8206,4606,1005,5905,1604,9404,7504,4304,2504,170
Day
21..22..23..24_ ,25..26..27..28_J29_.30..3 1
Runoff in inchesRunoff, in acre -feet
March
2,6002,5502,6002,8002,9002,8002,7002,7003,5007,6008,080
8,5971.27
528,600
April
18, COO15.400is.rooi7.eoo16,50013,50012,00011,40010,90010,500
27,3003.91
1,624,000
May
4,1804,1505,4306,3704,7004,4806,3507,3107,5108,7009,920
6,4040.95
393,700
Gage height, in feet, and discharge, in cubic feet per second, at indicated time, 1965
Date
Apr. 10
11
Hour
000012002400
090010001400
Gage height
14.8715.3815.98
16.3616.3816.24
Dis charge
39,40045,90054,200
60,00060,30058,100
Date
Apr. 1 1
12
Hour
16002400
0600120018002100
Gage height
16.2416.58
16.7216.8016.8416.85
Dis
charge
58,10063,500
65.80067,20067,90068,100
Date
Apr. 12
13
Hour
2400
0600120018002400
Gage height
16.84
16.7816.7316.6216.47
Dis charge
67,900
66,90066,00064,10061,700
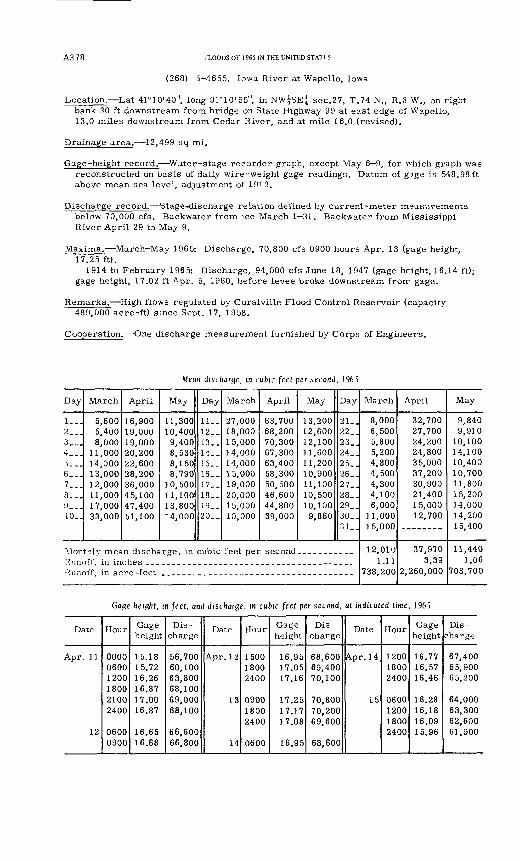
A3 78 FLOODS OF 1965 IN THE UNITED STATES
(268) 5 4655. Iowa River at Wapello, Iowa
Location. Lat 41° 10'40", long 91°10'55", in NW|SE| sec.27, T.74 N., R.3 W., on right bank 30 ft downstream from bridge on State Highway 99 at east edge of Wapello, 13.0 miles downstream from Cedar River, and at mile 16.0 (revised).
Drainage area. 12,499 sq mi.
Gage-height record. Water-stage recorder graph, except May 6 9, for vhich graph was reconstructed on basis of daily wire-weight gage readings. Datum of g^ge is 548.98ft above mean sea level, adjustment of 1912.
Discharge record. Stage-discharge relation defined by current-meter measurements below 70,000 cfs. Backwater from ice March 1 31. Backwater from Mississippi River April 29 to May 9.
Maxima. March-May 1965: Discharge, 70,800 cfs 0900 hours Apr. 13 (frage height, 17.25 ft).
1914 to February 1965: Discharge, 94,000 cfs June 18, 1947 (gage height, 16.14 ft); gage height, 17.02 ft Apr. 5, 1960, before levee broke downstream frorr gage.
Remarks. High flows regulated by Coralville Flood Control Reservoir (capacity 489,000 acre-ft) since Sept. 17, 1958.
Cooperation. One discharge measurement furnished by Corps of Engineers.
Mean discharge, in cubic feel per second, 1965
Day
1__.2___3__.4___ i-_.6___7...8...9__.10..
March
5,6005,4008,000
11,00014,00013,00012,00011,00017,00033,000
April
16,90019,00019,00020,20022,60028,20036,00045,10047,40051,100
May
11,30010,400
9,4008,5308,1508,790
10,50011,10013,80014,000
Day
11-.12__13__14__15. _16. _17..18-.19..20_.
March
27,00018,00015,00014,00014,00015,00019,00020,00015,00010,000
April
63,70068,20070,30067,30063,40058,30050,50046,60044,80039,000
May
13,20012,60012,10011,60011,20010,90011,10010,50010,100
9,860
Day
21..22..23_.24_.25_.26_.27_.28_.29_.30_.31_.
Monthly mean discharge, in cubic feet per second.. _________Runoff in inchesRunoff, in acre -feet
March
8,0006,5005,8005,2004,8004,5004,3004,1006,000
11,00015,000
12,0101.11
738,200
April
32,70027,70024,20024,80035,00037,20030,90021,40015,00012,700
37,9703.39
2,260,000
May
9,8409,910
10,10014,10010,40010,70011,80015,20014,00014,20015,400
11,4401.06
703,700
Gage height, in feet, and discharge, in cubic feet per second, at indicated time, 1965
Date
Apr. 11
12
Hour
000006001200180021002400
06000900
Gageheight
15.1815.7216.2616.8717.0016.87
16.6516.68
Dis charge
56,70060,10063,80068,10069,00068,100
66,60066,800
Date
Apr. 12
13
14
Hour
150018002400
090018002400
0600
Gage height
16.9517.0517.16
17.2517.1717.08
16.95
Dis
charge
68,60069,40070,100
70,80070,20069,600
68,600
Date
Apr. 14
15
Hour
120018002400
0600120018002400
Gage height
16.7716.5716.46
16.2816.1816.0915.96
Dis charge
67,40065,90065,200
64,00063,30062,60061,900
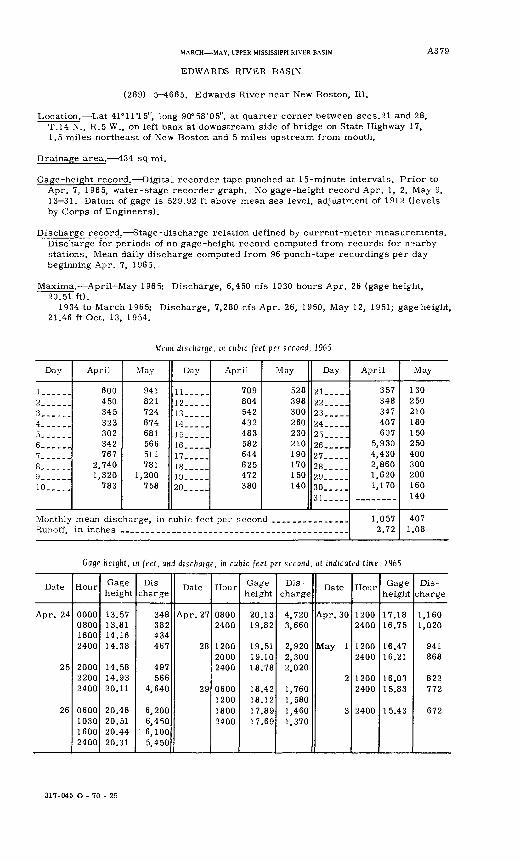
MARCH MAY, UPPER MISSISSIPPI RIVER BASIN
EDWARDS RIVER BASIN
A3 79
(269) 5-4665. Edwards River near New Boston, 111.
Location. Lat 41°11'15", long 90°58'05", at quarter corner between sees.21 and 28, T.14 N., R.5 W., on left bank at downstream side of bridge on State Highway 17, 1.5 miles northeast of New Boston and 5 miles upstream from mouth.
Drainage area. 434 sq mi.
Gage-height record. Digital recorder tape punched at 15-minute intervals. Prior to Apr. 7, 1965, water-stage recorder graph. No gage-height record Apr. 1, 2, May 9, 13 31. Datum of gage is 529.92 ft above mean sea level, adjustment of 1912 (levels by Corps of Engineers).
Discharge record. Stage-discharge relation defined by current-meter measurements. Discharge for periods of no gage-height record computed from records for n?arby stations. Mean daily discharge computed from 96 punch-tape recordings per day beginning Apr. 7, 1965.
Maxima. April-May 1965: Discharge, 6,450 cfs 1030 hours Apr. 26 (gage heig-ht, 20.51 ft).
1934 to March 1965: Discharge, 7,280 cfs Apr. 26, 1950, May 12, 1951; gage height. 21.46 ft Oct. 13, 1954.
Mean discharge, in cubic feet per second, 1965
Day
l___-_-2......3____4......5......6... ...7......8......9_._ ...10._._.
Monthly Runoff,
April
600 450 345 323 302 342 767
2,740 1,320
783
May
941 821 724 674 681 566 511 781
1,200 758
Day
ll---_.12_____13_____14_____15_____16_____17_____18.____19_____20__ __
April
709 804 542 432 483 582 644 625 472 380
May
528 398 300 260 230 210 190 170 150 140
Day
21____.22 ___ _23_____24_____25_____26__ ...27 .....28 ___ _29_____30_____31
mean discharge, in cubic feet per second _______________
April
357 348 347 407 607
5,930 4,430 2,860 1,620 1,170
1,057 2.72
May
130 250 210 180 150 250 400 300 200 160 140
407 1.08
Gage height, in feet, and discharge, in cubic feet per second, at indicated time, 1965
Date
Apr. 24
25
26
Hour
0000080016002400
200022002400
0600103016002400
Gage height
13.5713.8114.1614.38
14.5814.9320.11
20.4620.5120.4420.31
Dis charge
348382434467
497566
4,640
6,2006,4506,1005,450
Date
Apr. 27
28
29
Hour
08002400
120020002400
0600120018002400
Gage height
20.1319.82
19.5119.1018.78
18.4218.1217.8917.69
Dis charge
4,7203,660
2,9202,3002,020
1,7601,5801,4601,370
Date
Apr. 30
May 1
2
3
Hour
12002400
12002400
12002400
2400
Gage height
17.1816.75
16.4716.21
16.0315.83
15.43
Dis charge
1,1601,020
941868
822772
672
317-045 O - 70 - 25
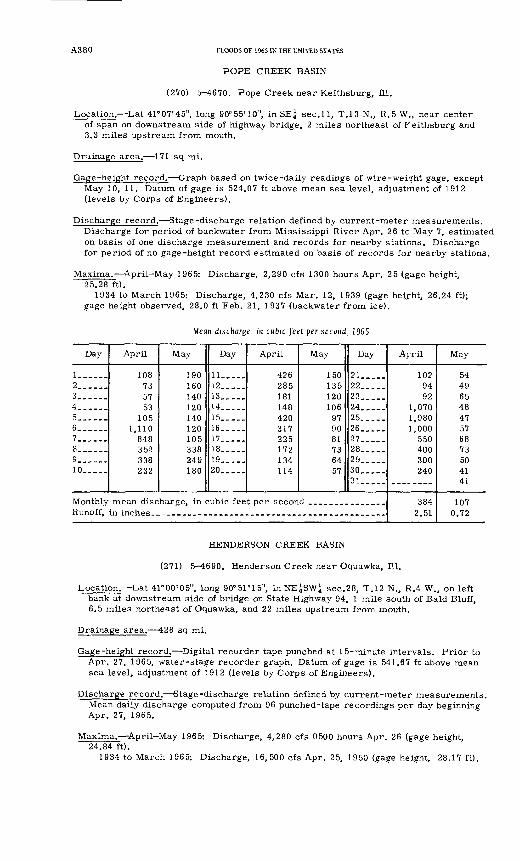
A380 FLOODS OF 1965 IN THE UNITED STATES
POPE CREEK BASIN
(270) 5-^670. Pope Creek near Keithsburg, 111.
Location. Lat 41°07'45", long 90°55'10", in SE? sec. 11, T.13 N., R.5 W., near center of span on downstream side of highway bridge, 2 miles northeast of Feithsburg and 3.3 miles upstream from mouth.
Drainage area. 171 sq mi.
Gage-height record. Graph based on twice-daily readings of wire-weight gage, except May 10, 11. Datum of gage is 524.07 ft above mean sea level, adjustment of 1912 (levels by Corps of Engineers).
Discharge record. Stage-discharge relation defined by current-meter measurements. Discharge for period of backwater from Mississippi River Apr. 26 tc May 7, estimated on basis of one discharge measurement and records for nearby stations. Discharge for period of no gage-height record estimated on basis of records for nearby stations.
Maxima. April-May 1965: Discharge, 2,290 cfs 1300 hours Apr. 25 (gage height, 25.28 ft).
1934 to March 1965: Discharge, 4,230 cfs Mar. 12, 1939 (gage heifht, 26.24 ft); gage height observed, 28.0 ft Feb. 21, 1937 (backwater from ice).
Mean discharge, in cubic feet per second, 1965
Day
1 __ __2... ...3. __ ..4......
6 ......7 ......8... ...9 __ ...10 .....
Monthly Runoff,
April
108 73 57 53
105 1,110
848 352 338 232
May
190 160 140 120 140 120 105 338 249 180
Day
11..-..12.. ...13.....14.....15.....16.....17.. ...18 .....19.. ...20 .....
April
426 285 181 148 420 317 225 172 134 114
May
150 135 120 106
97 90 81 73 64 57
Day
21.. ._22.....23.. ...24 .....25.....26 __ ..27 .....28.....29.. ...30.. ...31.....
mean discharge, in cubic feet per second --_____._______
April
102 94 92
1,070 1,980 1,000
550 400 300 240
384 2.51
May
54 49 65 48 47 57 68 73 50 41 41
107 0.72
HENDERSON CREEK BASIN
(271) 5-4690. Henderson Creek near Oquawka, 111.
Location. Lat 41°00'05", long 90°51'15", in NEjSWj sec.28, T.I2 N., R.4 W., on left bank at downstream side of bridge on State Highway 94, 1 mile south of Bald Bluff, 6.5 miles northeast of Oquawka, and 22 miles upstream from mouth.
Drainage area. 428 sq mi.
Gage-height record. Digital recorder tape punched at 15-minute intervals. Prior to Apr. 27, 1965, water-stage recorder graph. Datum of gage is 541.67 ft above mean sea level, adjustment of 1912 (levels by Corps of Engineers).
Discharge record. Stage-discharge relation defined by current-meter measurements. Mean daily discharge computed from 96 punched-tape recordings per day beginning Apr. 27, 1965.
Maxima.- April May 1965: Discharge, 4,280 cfs 0500 hours Apr. 26 (gage height, 24.84 ft).
1934 to March 1965: Discharge, 16,500 cfs Apr. 25, 1950 (gage height, 28.17 ft).
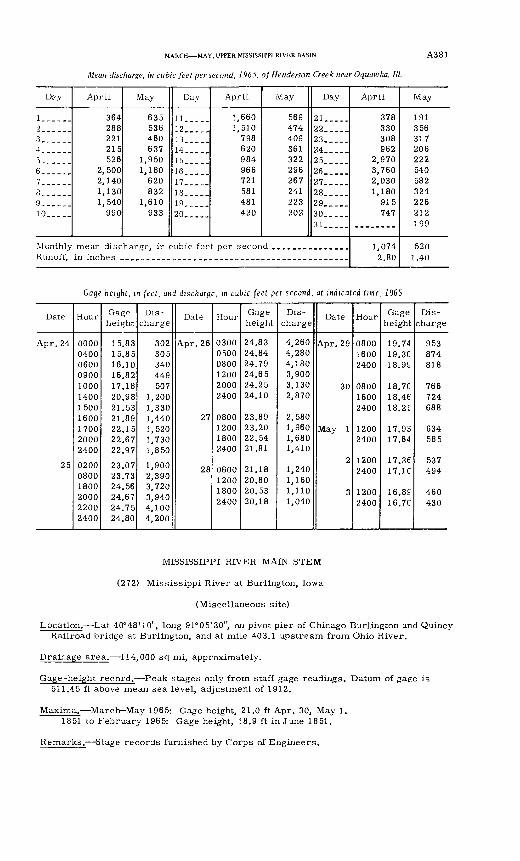
MARCH MAY, UPPER MISSISSIPPI RIVER BASIN
Mean discharge, in cubic feet per second, 1965, ofHenderson Creek near Oquawka, 111.
A381
Day
1..-.--2..3.....4......
6.. .7......8______g10.....
Monthly Runoff,
April
364 288 221 215 526
2,500 2,140 1,130 1,540
990
May
635 536 460 637
1,950 1,180
620 832
1,610 933
Day
11--.-.12_____13.._._14_____15--..-16_-___17_._._18____.19.....20-,_-_
April
1,660 1,510
798 620 984 966 721 581 481 420
May
569 474 409 361 322 296 267 241 223 202
Day
21_____22_____23_____24_____25_____26_____27 ____28 .....29___._30__.._31_____
mean discharge, in cubic feet per second _______________
April
378 330 308 962
2,970 3,760 2,030 1,180
915 747
1,074 2.80
May
191 356 317 206 222 540 582 324 226 212 199
520 1.40
Cage height, in feet, and discharge, in cubic feet per second, at indicated time, 1965
Date
Apr. 24
25
Hour
00000400060009001000140015001600170020002400
0200 08001800 2000 22002400
Gage height
15.8315.8516.1016.8217.1820.9821.5321.8922.1522.6722.97
23.07 23.7324.56 24.67 24.7524.80
Dis
charge
302305340449507
1,2001,3301,4401,5201,7301,850
1,900 2,3903,720 3,940 4,1004,200
Date
Apr. 26
27
28
Hour
030005000800120020002400
0800120018002400
0600 12001800 2400
Gage height
24.8324.8424.7924.6524.2524.10
23.8923.2022.5421.81
21.18 20.8020.53 20.18
Dis
charge
4,2604,2804,1803,9003,1302,870
2,5801,9601,6801,410
1,240 1,1601,110 1,040
Date
Apr. 29
30
May 1
2
3
Hour
080016002400
080016002400
12002400
1200 2400
1200 2400
Gage height
19.7419. 3C18. 9£
18. 7C18.4618. 2f
17. 9S17.64
17.36 17. 1C
16.8? 16. 7C
Dis
charge
953874818
766724688
634585
537494
460 430
MISSISSIPPI RIVER MAIN STEM
(272) Mississippi River at Burlington, Iowa
(Miscellaneous site)
Location. Lat 40°48'10", long 91°05'30", on pivot pier of Chicago Burlington and Quincy Railroad bridge at Burlington, and at mile 403.1 upstream from Ohio River.
Drainage area. 114,000 sq mi, approximately.
Gage-height record. Peak stages only from staff gage readings. Datum of gage is 511.45 ft above mean sea level, adjustment of 1912.
Maxima. March May 1965: Gage height, 21.0 ft Apr. 30, May 1. 1851 to February 1965: Gage height, 18.9 ft in June 1851.
Remarks. Stage records furnished by Corps of Engineers.
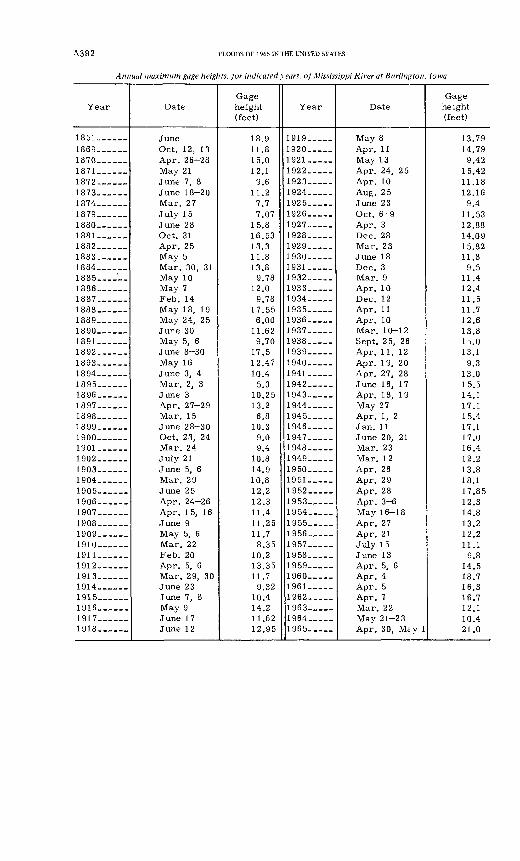
A382 FLOODS OF 1965 IN THE UNITED STATES
Annual maximum gage heights, for indicated years, of Mississippi River at Burlington, Iowa
Year
1851 ______
1870 ______1871 __ 1872 ______1873 __ - 1874 ______1879 ______1880 ______1881 1882 __ ___1883 ____1884. _1885 __ 1886 ______1887 ______1888 ______1889 ______1890 ______1891 ______18921 8Q9
18941895 ______1896 ______18971898 __ --_18991900 __ 1901 ______1902_ _____190319041905 __ _1906 ______1907 _1908- _____1909. _1910 __ - 1911 __ ___1912 ____1913 ______1914 ______1915 1916___ ___19171918. -
Date
Apr. 26-28
Mar. 27July 15
Oct. 31Apr. 25May 5Mar. 30, 31
Ma v 7
Feb. 14May 18, 19May 24, 25
May 5, 6
May 16J une 3 4
Apr. 27-29
Oct. 23, 24Mar. 24July 21
Apr. 24-26
Mar. 22Feb. 20
Mar. 29, 30
Gage height (feet)
18.911.815.012.1
9.611.2
7.77.07
15.816.5313311.813.8
9 7812.09.78
17556.00
11.629 70
17512.4710.4
5 310.25i q o
6.810 39.09 4
10.814 910.812219^
11.4U 9 R
11.78.35
10.213.3511.79.32
10.414.211.6212.95
Year
1 Q1 Q
1920 .19211922 1923 _____1924 _____1925 _____1926 _____1927. _1928 _____1929 _____1930 _____1931 _____1932 _____1933 _____1934 _____1935 _____1936 _____1937 - 1938 1939 __ 1940 ___19411942- _1943 -1944 _____1945 _____1946 _____19471948 ___1949 ___1950 _____1951 1952 _____1953 _____1954 __1955 ___1956 _____1957 _____1958 __ __1959. ____1960 _____1961 _____1962 _____1963- __ -1964 1965
Date
Apr. 11May 13Apr. 24, 25
Aug. 25
Oct. 6-9
Dec. 28Mar. 23
Dec. 3
Dec. 12Apr. 11Apr. 10Mar. 10-12
Apr. 11, 12
Apr. 27, 28June 16, 17Apr. 18, 19May 27
Jan. 11
Mar. 23Mar. 12Apr. 26Apr. 29
Apr. 27Apr. 21July 15
Apr. 4
Apr. 7Mar. 22May 21-23
Gage height (feet)
137914 79
9 421 5 4211.1812.16
9 4U ^912.8814 0915.8211.8
9 C
11.412.411.511.712.613.815.0131
9 31 q n
15.514.117.115417.117.016.4199
1 0 Q
18.1n o c
12314.813212211.1
9 814518.716.316.712.110.421.0
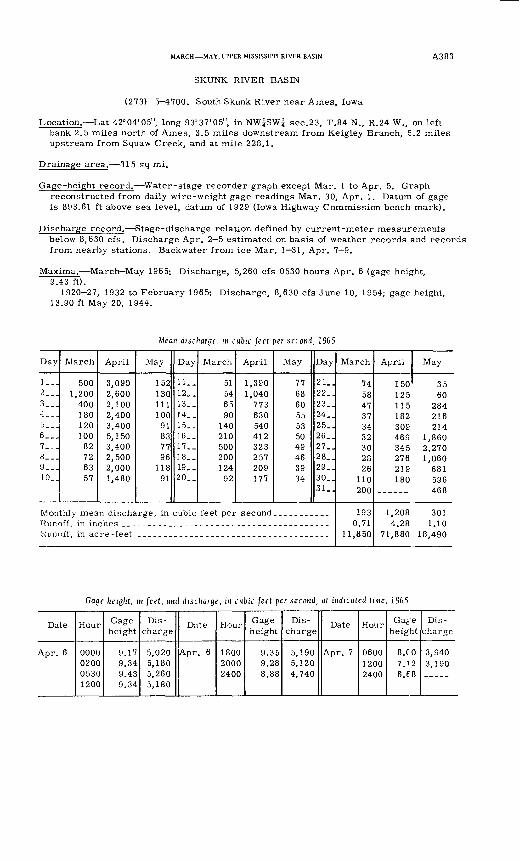
MARCH MAY, UPPER MISSISSIPPI RIVER BASIN A383
SKUNK RIVER BASIN
(273) 5-4700. South Skunk River near Ames, Iowa
Location. Lat 42°04'05", long 93°37'05", in NW^SW^ sec.23, T.84 N., R.24 W., on left bank 2.5 miles north of Ames, 3.5 miles downstream from Keigley Branch, 5.2 miles upstream from Squaw Creek, and at mile 228.1.
Drainage area. 315 sq mi.
Gage-height record. Water-stage recorder graph except Mar. 1 to Apr. 5. Graph reconstructed from daily wire-weight gage readings Mar. 30, Apr. 1. Datum of gage is 893.61 ft above sea level, datum of 1929 (Iowa Highway Commission bench mark).
Discharge record. Stage-discharge relation defined by current-meter measurements below 8,630 cfs. Discharge Apr. 2 5 estimated on basis of weather records and records from nearby stations. Backwater from ice Mar. 1 31, Apr. 7 9.
Maxima. March May 1965: Discharge, 5,260 cfs 0530 hours Apr. 6 (gage height, 9.43 ft).
1920-27, 1932 to February 1965: Discharge, 8,630 cfs June 10, 1954; gage height, 13.90 ft May 20, 1944.
Mean discharge, m cubic feet per second, 1965
Day
1...2...3...4___3__-
6...7___8...9...10..
March
5001,200
400180120100
82726357
April
3,0902,6002,1002,4003,4005,1503,4002,5002,0001,480
May
152130111100
91837796
11891
Day
11-.12..13..14..15..16..17. _18..19..20..
March
51546590
140210500200124
92
April
1,3901,040
773630540412323257209177
May
77686055535049463934
Day
21..22_.23.^24. J25_.26..27..28..29..30..31..
Runoff in inchesRunoff, in acre -feet
March
745847373432302826
110200
1930.71
11,850
April
150125115182309469345276219180
1,2084.28
71,880
May
3560
284216214
1,8602,2701,060
681596468
3011.10
18,490
Gage height, in feet, and discharge, in cubic feet per second, at indicated time, 1965
Date
Apr. 6
Hour
0000 0200 05301200
Gage height
9.17 9.34 9.439.34
Dis charge
5,020 5,180 5,2605,180
Date
Apr. 6
Hour
1800 2000 2400
Gage height
9.35 9.28 8.88
Dis
charge
5,190 5,120 4,740
Date
Apr. 7
Hour
0600 1200 2400
Gage height
8. CO 7.12 6.68
Dis
charge
3,940 3,190
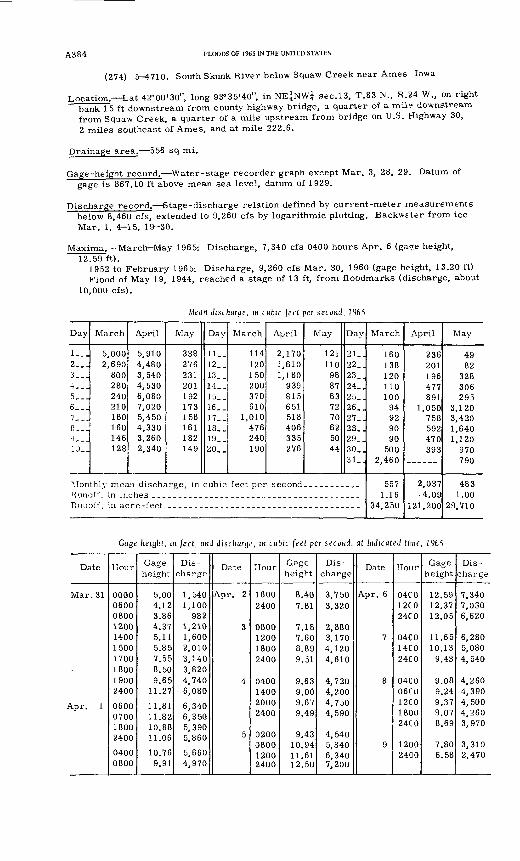
A3 84 FLOODS OF 1965 IN THE UNITED STATES
(274) 5--1710. South Skunk River below Squaw Creek near Ames Iowa
Location. Lat 42°00'30", long 93°35'40", in NE^NWi sec.13, T.83 N., R.24 W., on right bank 1 5 f t downstream from county highway bridge, a quarter of a mil? downstream from Squaw Creek, a quarter of a mile upstream from bridge on U.S. Highway 30, 2 miles southeast of Ames, and at mile 222.6.
Drainage area. 556 sq mi.
Gage -height record. Water-stage recorder graph except Mar. 3, 28, 29. Datum of gage is 867.10 ft above mean sea level, datum of 1929.
Discharge record. Stage -discharge relation defined by current-meter measurements below 8,460 cfs, extended to 9,260 cfs by logarithmic plotting. Backwster from ice Mar. 1, 4-15, 19-30.
Maxima. March May 1965: Discharge, 7,340 cfs 0400 hours Apr. 6 (gaee height,12.59 ft).
1952 to February 1965: Discharge, 9,260 cfs Mar. 30, 1960 (gage height, 13.20 ft) Flood of May 19, 1944, reached a stage of 13 ft, from floodmarks (discharge, about
10,000 cfs).
Mean discharge, in cubic feet per second, 1965
Day
1__.2___3...4___5___6...7__.8___|9,-.10_.
March
5,0002,690
800280240210180160146128
April
5,9104,4803,5404,5306,0807,0205,4504,3303,2602,340
May
338276231201192173158161182149
Day
11..12__13__14_.15__16__17__18__19--20__
March
114120150200370610
1,010476240190
April
2,1701,6101,180
939815651518406335276
May
121110
9887837270625044
Day
21..22_.23_.24. .25_.26,.27..28..29..30_.31..
Monthly mean discharge, in cubic feet per second. __________
Runoff, in acre -feet
March
160138120110100
94929090
5002,460
5571.16
34,250
April
236201196477891
1,050758592470393
2,037-4.09
121,200
May
4982
328306295
3,1203,4201,6401,120
970790
4831.00
29,710
Gage height, in feet, ami discharge, in cubic feet per second, at indicated time, 1965
Date
Mar. 31
\pr. 1
Hour
0000060008001200140015001700180019002400
0600070018002400
04000800
Gage height
5.004.123.864.375.115.857.558.509.65
11.27
11.8111.8210.8811.06
10.769.91
Dis
charge
1,5401,100
9821,2101,6002,0103,1403,8204,7406,080
6,3406,3505,3905,860
5,6604,970
Date
Apr. 2
3
4
5
Hour
16002400
0800120018002400
0400140020002400
0200080012002400
Gage height
8.407.81
7.187.608.899.51
9.639.009.679.49
9.4310.9411.6112.50
Dis
charge
3,7503,320
2,8803,1704,1204,610
4,7204,2004,7504,590
4,5405,8406,3407,200
Date
Apr. 6
7
8
9
Hour
04CO12CO24CO
04CO14CO24CO
04CO06CO12CO18002400
12002400
Gage height
12.5912.3712.05
11.6510.139.43
9.089.249.379.078.69
7.806.58
Dis
charge
7,3407,0306,620
6,2805,0804,540
4,2604,3904,5004,2603,970
3,3102,470
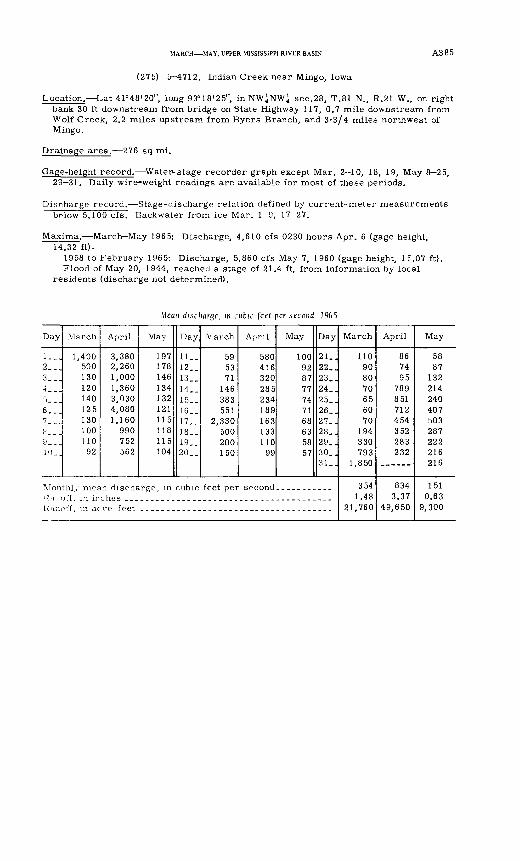
MARCH MAY, UPPER MISSISSIPPI RIVER BASIN A385
(275) 5 4712. Indian Creek near Mingo, Iowa
Location. Lat 41°48'20", long 93°18'25", in NW^NW^ sec.28, T.81 N., R.21 W. p on right bank 30 ft downstream from bridge on State Highway 117, 0.7 mile downstream from Wolf Creek, 2.2 miles upstream from Byers Branch, and 3-3/4 miles northwest of Mingo.
Drainage area. 276 sq mi.
Gage-height record. Water-stage recorder graph except Mar. 2 10, 18, 19, May 8 25, 29 31. Daily wire-weight readings are available for most of these periods.
Discharge record. Stage-discharge relation defined by current-meter measurements below 5,100 cfs. Backwater from ice Mar. 1-9, 17-27.
Maxima. March May 1965: Discharge, 4,610 cfs 0230 hours Apr. 6 (gage height, 14.32 ft).
1958 to February 1965: Discharge, 5,860 cfs May 7, 1960 (gage height, 15.07 ft). Flood of May 20, 1944, reached a stage of 21.4 ft, from information by local
residents (discharge not determined).
Mean discharge, in cubic feet per second, 1965
Day
l._.2...3...4..^">-_.6...7..^i'.-*9~.10_.
March
1,400500130120140125130100110
92
April
3,3802,2601,0001,3603,0304,0801,160
990752562
May
197178146134132121115118115104
Day
11..12..13..14..15..16..17..18..19..20..
March
595371
146383551
2,330500200150
April
580416320285234189163133110
99
May
100928777747168635857
Day
21..22..23..24..25..26..27..28..29..30..31..
Kunot'f, in acre -feet
March
110908070656070
194330793
1,850
3541.48
21,760
April
867495
789851712454352283232
-----
8343.37
49,650
May
5887
132214240407503287222216216
1510.63
9,300
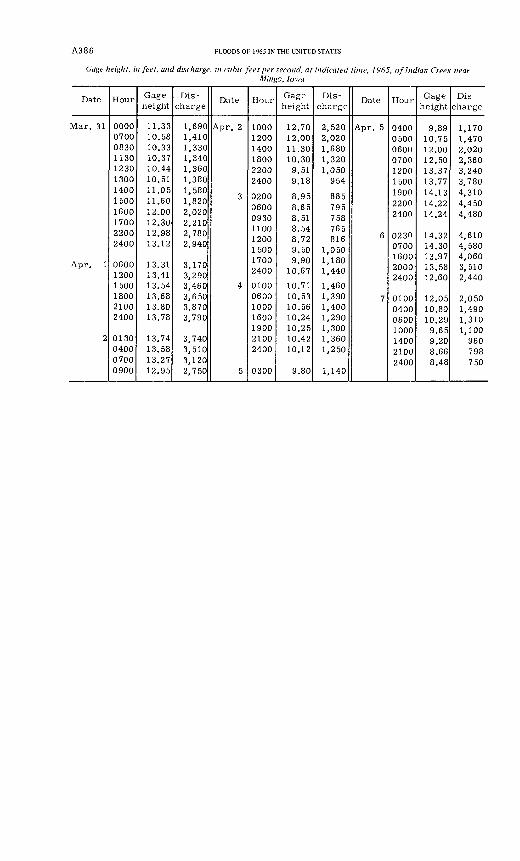
A386 FLOODS OF 1965 IN THE UNITED STATES
Gage height, in feet, and discharge, in cubic feet per second, at indicated time, 1965, of Indian Creek nearMingo, Iowa
Date
Mar. 31
Apr. 1
2
Hour
0000070008301130123013001400 1500 1600 17002200 2400
0600 12001500180021002400
0130040007000900
Gage height
11.3310.5810.3310.3710.4410.5111.05 11.60 12.00 12.3012.98 13.12
13.31 13.4113.5413.6813.8013.78
13.7413.5813.2712.95
Dis charge
1,6901,4101,3301,3401,3601,3801,580 1,820 2,020 2,2102,780 2,940
3,170 3,2903,4603,6503,8703,790
3,7403,5103,1202,750
Date
Apr. 2
3
4
5
Hour
100012001400180022002400
0200 0600 09301100 1200 15001700 2400
0100060010001600190021002400
0300
Gage height
12.7012.0011.3010.309.519.18
8.95 8.65 8.518.54 8.72 9.509.90
10.67
10.7110.5310.5610.2410.2510.4210.12
9.80
Dis charge
2,5202,0201,6801,3201,050
954
885 795 758765 816
1,0501,180 1,440
1,4601,3901,4001,2901,3001,3601,250
1,140
Date
Apr. 5
6
7
Hour
0400050006000700120015001900 2200 2400
0230 07001600 2000 2400
0100040006001000140021002400
Gage height
9.8910.7512.0012.5013.3713.7714.13 14.22 14.24
14.32 14.3013.97 13.58 12.60
12.0510.8010.299.659.208.668.48
Dis
charge
1,1701,4702,0202,3603,2403,7804,310 4,450 4,480
4,610 4,5804,060 3,510 2,440
2,0501,4901,3101,100
960798750
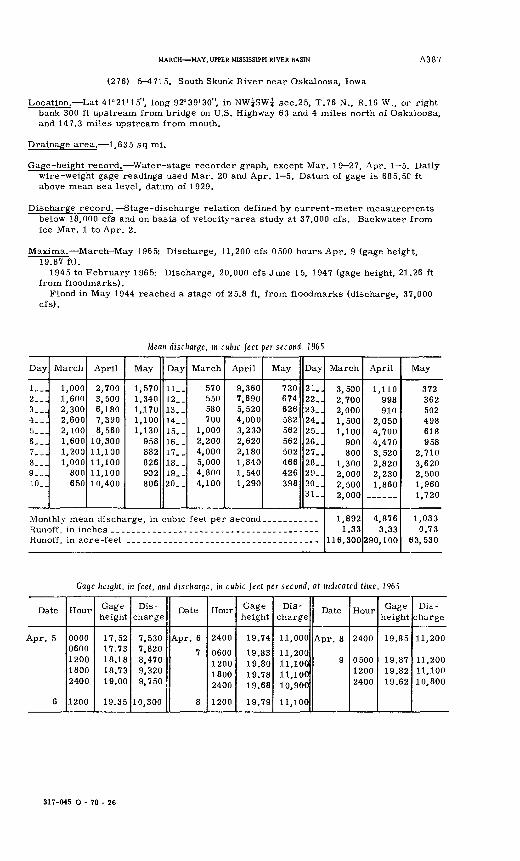
MARCH MAY, UPPER MISSISSIPPI RIVER BASIN
(276) 5 4715. South Skunk River near Oskaloosa, Iowa
A387
Location. Lat 41°21'15", long 92°39'30", in NW^SW^ sec.25, T.76 N., R.16 W., or right bank 300 ft upstream from bridge on U.S. Highway 63 and 4 miles north of Oskaloosa, and 147.3 miles upstream from mouth.
Drainage area. 1,635 sq mi.
Gage-height record. Water-stage recorder graph, except Mar. 19 27, Apr. 1 5. Daily wire-weight gage readings used Mar. 20 and Apr. 1 5. Datum of gage is 685.5C ft above mean sea level, datum of 1929.
Discharge record. Stage-discharge relation defined by current-meter measurements below 18,000 cfs and on basis of velocity-area study at 37,000 cfs. Backwater from ice Mar. 1 to Apr. 2.
Maxima. March May 1965: Discharge, 11,200 cfs 0500 hours Apr. 9 (gage height, 19.87 ft).
1945 to February 1965: Discharge, 20,000 cfs June 15, 1947 (gage height, 21.26 ft from floodmarks).
Flood in May 1944 reached a stage of 25.8 ft, from floodmarks (discharge, 37,000 cfs).
Mean discharge, in cubic (eel per second, 1965
Day
1__.2...3...4__.5...6__.7___8...9...10..
March
1,0001,6002,3002,6002,1001,6001,2001,000
800650
April
2,7003,5006,1807,3908,560
10,30011,10011,10011,10010,400
May
1,5701,3401,1701,1001,130
958882826902806
Day
11_-12..13..14..15..16..17..18..19..20..
March
570550580700
1,0002,2004,0005,0004,8004,100
April
9,3607,6905,5204,0003,2302,6202,1801,8401,5401,290
May
730674626582562562502466426398
Day
21..22_.23..24..25_.26..27..28..29..30..31..
Monthly mean discharge, in cubic feet per second... __...-_.Runoff, in inches ___ ---Runoff, in acre -feet
March
3,5002,7002,0001,5001,100
900800
1,3002,0002,5002,000
1,8921.33
116,300
April
1,110998910
2,0504,7004,4703,5202,8202,2301,860
_...._
4,8763.33
290,100
May
372362502498618958
2,7103,6202,5001,9601,720
1,0330.73
63,530
Gage height, in feet, and discharge, in cubic feet per second, at indicated time, 1965
Date
Apr. 5
6
Hour
00000600120018002400
1200
Gage height
17.5217.7318.1818.7319.00
19.35
Dis
charge
7,5307,8208,4709,3209,750
10,300
Date
Apr. 6
7
8
Hour
2400
0600120018002400
1200
Gage height
19.74
19.8319.8019.7819.68
19.79
Dis
charge
11,000
11,20011,10011,10010,900
11,100
Date
Apr. 8
9
Hour
2400
050012002400
Gage height
19.85
19.8719.8219.62
Dis
charge
11,200
11,20011,10010,800
317-045 O - 70 -:
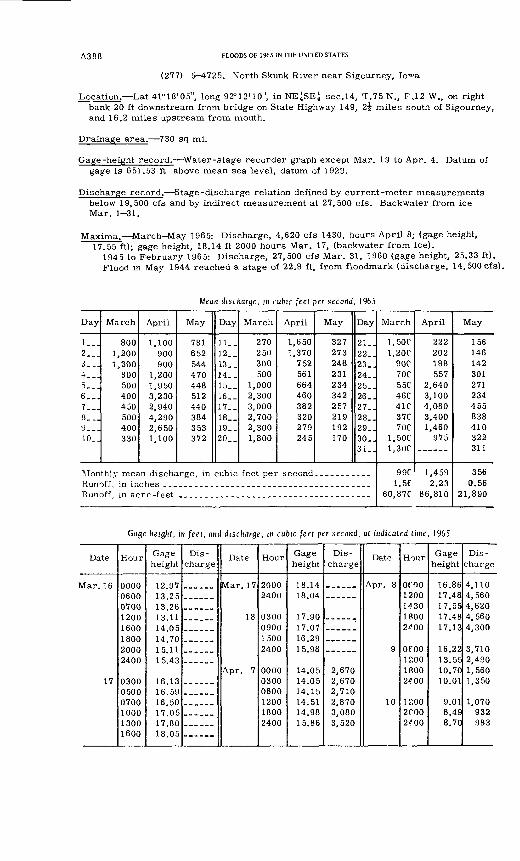
A388 FLOODS OF 1965 IN THE UNITED STATES
(277) 5-^725. North Skunk River near Sigourney,
Location. Lat 41°18'05", long 92°12'10", in NE^SE? sec.14, T.75 N., F.12 W., on right bank 20 ft downstream from bridge on State Highway 149, 2^ miles south of Sigourney, and 16.2 miles upstream from mouth.
Drainage area. 730 sq mi.
Gage-height record. Water-stage recorder graph except Mar. 19 to Apr. 4. Datum of gage is 651.53 ft above mean sea level, datum of 1929.
Discharge record. Stage-discharge relation defined by cur rent-meter measurements below 19,500 cfs and by indirect measurement at 27,500 cfs. Backwater from ice Mar. 1-31.
Maxima. March-May 1965: Discharge, 4,620 cfs 1430, hours April 8; (gage height, 17.55 ft); gage height, 18.14 ft 2000 hours Mar. 17, (backwater from ice).
1945 to February 1965: Discharge, 27,500 cfs Mar. 31, 1960 (gage height, 25.33 ft). Flood in May 1944 reached a stage of 22.8 ft, from floodmark (discharge, 14, 500 cfs).
Mean discharge, in cubic feet per second, 1965
Day
1__.2...3...4...5...6...7___8...9...10..
March
8001,2001,300
800500400450500400330
April
1,100900900
1,2001,9503,2302,9404,2902,6501,100
May
781652544470448512440384353372
Day
11-.12..13..14..15..16..17..18..19..20_.
March
270250300500
1,0002,3003,0002,7002,3001,800
April
1,6501,370
752561664460382320279245
May
327273248231234342257219192170
Day
21..22..23..24_.25_.26..27..28..29_.30_.3 1
Runoff in inches _-Runoff, in acre -feet
March
1,50C1,20C
90C70C55C46C41C37C70C
1.50C1.30C
99C
April
222202188557
2,6403,1004,0803,4001,460
975
1.4591.5f 2.23
60,87C 86,810
May
156146142301271234455838410322311
3560.56
21,890
Gtige height, in feet, and discharge, in cubic feet per second, at indicated time, 1965
Date
War. 16
17
Hour
07001200
1800
2400
03000500
100013001600
Gage height
12.971 o o c
13.26131114.0514.701 R 1 115.43
16.1316.5916.5017.0517.8018.05
Dis charge
Date
Mar. 17
18
Apr. 7
Hour
20002400
0300090015002400
0000 03000600120018002400
Gage height
18.1418.04
17.9017.0716.2915.98
14.05 14.0514.1514.5114.9815.86
Dis
charge
2,670 2,6702,7102,8703,0803,520
Date
Apr. 8
9
10
Hour
OfOO1200143018002^00
OfOO12001800 2*00
120020002*00
Gage height
16.8617.4817.5517.4817.13
16.2213.5510.70 10.01
9.018.498.70
Dis charge
4,1104,5604,6204,5604,300
3,7102,4901,560 1,350
1,070932983
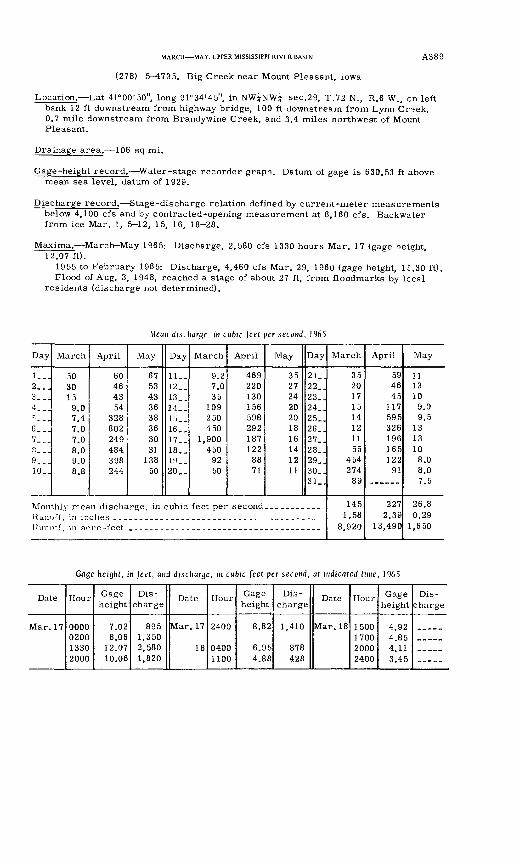
MARCH MAY, UPPER MISSISSIPPI RIVER BASIN
(278) 5-4735. Big Creek near Mount Pleasant, Iowa
A389
Location. Lat 41°00'50", long 91°34'45", in NW^NWj sec.29, T.72 N., R.6 W., en left bank 12 ft downstream from highway bridge, 100 ft downstream from Lynn Cr^ek, 0.7 mile downstream from Brandywine Creek, and 3.4 miles northwest of Mount Pleasant.
Drainage area. 106 sq mi.
Gage-height record. Water-stage recorder graph. Datum of gage is 630.53 ft above mean sea level, datum of 1929.
Discharge record. Stage-discharge relation defined by current-meter measurements below 4,100 cfs and by contracted-opening measurement at 6,160 cfs. Backwater from ice Mar. 1, 5-12, 15, 16, 18-28.
Maxima. March-May 1965: Discharge, 2,580 cfs 1330 hours Mar. 17 (gage height, 12.07 ft).
1955 to February 1965: Discharge, 4,460 cfs Mar. 29, 1960 (gage height, 15.30 ft). Flood of Aug. 3, 1948, reached a stage of about 27 ft, from floodmarks by local
residents (discharge not determined).
Mean discharge, in cubic feet per second, 1965
Day
!.-_2...3...4__.r'-_.
6___j7...R.-J9...10..
March
503015
9.07.47.07.08.09.08.8
April
60464354
328802249484398244
May
6753433638363031
13850
Day
11--12__13_.14__15-.16.,17__18..19-_20..
March
9.27.035
109250450
1,900450
9250
April
469220130156598292187122
8871
May
35272420201816141211
Day
21..22_.23..24..25..26..27..28..29_.30..
Runoff in inches - - - -Hunoff, in acre-feet
March
3520171514121155
454274
89
1451.58
8,920
April
594645
117595326196165122
91
2272.39
13,490
May
1113109.09.5
1313108.08.07.5
26.80.29
1,650
Gage height, in feet, and discharge, m cubic feet per second, at indicated time, 1965
Date
Mar. 17
Hour
0000020013302000
Gage height
7.028.06
12.0710.06
Dis charge
8951,3502,5801,820
Date
Mar. 17
18
Hour
2400
04001100
Gage height
8.82
6.954.88
Dis
charge
1,410
878428
Date
Mar. 18
Hour
15001700
2400
Gage height
4.92
4.113.45
Dis charge
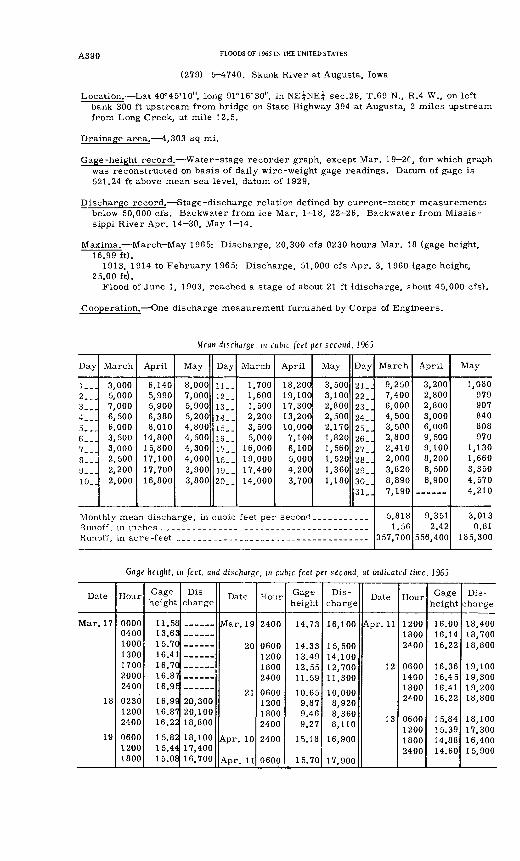
A390 FLOODS OF 1965 IN THE UNITED STATES
(279) 5--1740. Skunk River at Augusta, Iowa
Location. Lat 40°45'10", long 91°16'30", in NE^NE^ sec.26, T.69 N., R.4 W., on left bank 300 ft upstream from bridge on State Highway 394 at Augusta, 2 miles upstream from Long Creek, at mile 12.5.
Drainage area. 4,303 sq mi.
Gage-height record. Water-stage recorder graph, except Mar. 19 2C, for which graph was reconstructed on basis of daily wire-weight gage readings. Datum of gage is 521.24 ft above mean sea level, datum of 1929.
Discharge record. Stage-discharge relation defined by current-meter measurements below 50,000 cfs. Backwater from ice Mar. 1 18, 22 26. Backwater from Missis sippi River Apr. 14 30, May 1 14.
Maxima. March-May 1965: Discharge, 20,300 cfs 0230 hours Mar. 18 (gage height, 16.99 ft).
1913, 1914 to February 1965: Discharge, 51,000 cfs Apr. 3, 1960 (gage height, 25.00 ft).
Flood of June 1, 1903, reached a stage of about 21 ft (discharge, ?bout 45,000 cfs).
Cooperation. One discharge measurement furnished by Corps of Engineers.
Mean discharge, in cubic feet per second, 1965
Day
l._.2...3_ _.4___5___6___7__.8...9_-.10..
March
3,0005,0007,0006,5006,0003,5003,0002,5002,2002,000
April
6,1405,9905,9006,3808,010
14,80015,80017,10017,70016,800
May
8,0007,0005,9005,2004,8004,5004,3004,0003,9003,800
Day
11..12__13__14..15. _16. _17..18..19. _20. _
March
1,7001,6001,5002,2003,5005,000
16,00019,00017,40014,000
April
18,20019,10017,30013,20010,0007,1006,1005,0004,2003.70C
May
3,5003,1002,8002,5002,1701,8201,5601,5201,3601,180
Day
21..22_.23_.24..25..26_.27_.28_.29_.30. .31
Monthly mean discharge, in cubic feet per second.. _________
Runoff, in acre -feet
March
9,2507,4006,0004,5003,5002,8002,4102,0003,8208,8907 190
5,8181.56
357,700
April
3,2002,8002,8003,0006,0009,5009,1008,2008,5008,900
9,3512.42
556,400
May
1,080979907840808970
1,1301,6603,3504,5704,210
3,0130.81
185,300
Gage height, in feet, and discharge, in cubic feet per second, at indicated time, 1965
Date
Mar. 17
18
19
Hour
0000040010001300170020002400
0230112002400
060012001800
Gage height
11.5813.6315.7016.4116.7016.8716. 9E
16.9916.8716.22
15.8215.4415.08
Dis charge
20,30020,10018,800
18,10017,40016,700
Date
[Vlar 1 9
21
Apr. 10
Apr. 11
Hour
2400
0600 120018002400
0600 120018002400
2400
0600
Gage-
height
14 73'
10.65 9.879 469 27
15.18
15.70
Dis
charge
16,100
1 5, 50014,100
11,300
10,000 8,9208,3608,110
16,900
17,900
Date
Apr. 11
1 9
13
Hour
120018002*00
0600140018002*00
0600120018002400
Gage height
16.0016.141C O O
1C QG
16.4516.4116.22
15.8415.3914.8814.60
Dis charge
18,4001 Q 'ynn
1 Q onn
19,10019,3001 Q 9OO
18,800
18,10017,30016,40015,900
MARCH MAY, UPPER MISSISSIPPI RIVER BASIN A391
MISSISSIPPI RIVER MAIN STEM
(280) 5-4745. Mississippi River at Keokuk, Iowa
Location. Lat 40°23'35", long 91°22'25", in SEjSWj sec.30, T.65 N., R.4 W., near right bank in tailwater at downstream end of new lock below dam and powerplant of Union Electric Co. at Keokuk, 2.8 miles upstream from Des Moines River and at mile 364.2 upstream from Ohio River.
Drainage area. 119,000 sq mi, approximately.
Gage-height record. Water-stage recorder. Datum of gage is 477.41 ft above mean sea level, datum of 1929 (levels by Corps of Engineers); 477.83 ft above mean sea level, adjustment of 1912; 477.34 ft above mean gulf level; and 484.65 ft above Memphis datum. Jan. 1, 1878, to May 1913, staff gage at Galland (formerly Nrshville), 8 miles upstream; zero of gage was set to low-water mark of 1864, or 497.94 ft above mean sea level, adjustment of 1912.
Discharge record. Records furnished by Union Electric Company except for period of Apr. 21 to May 11 which were computed by the U.S. Geological Survey on basis of backwater rating of the tailwater gage. Furnished records computed from records of turbine operation at power plant and openings of spillway gages in dam.
Maxima. April-May 1965: Daily discharge, 327,000 cfs May 1; gage height, 22.14 ft. May 1.
1878 to February 1965: Daily discharge, 314,000 cfs May 18, 1888 (gage height, 12.0 ft, site and datum then in use; 19.6 ft present site and datum).
Flood of June 6, 1851, reached a stage of 21.0 ft, present site and datum; estimated as 13.5 ft at Galland (discharge, 360,000 cfs).
Remarks. Discharge records furnished by Union Electric Company except for period Apr. 21 to May 11. Annual peak stages furnished by Corps of Engineers.
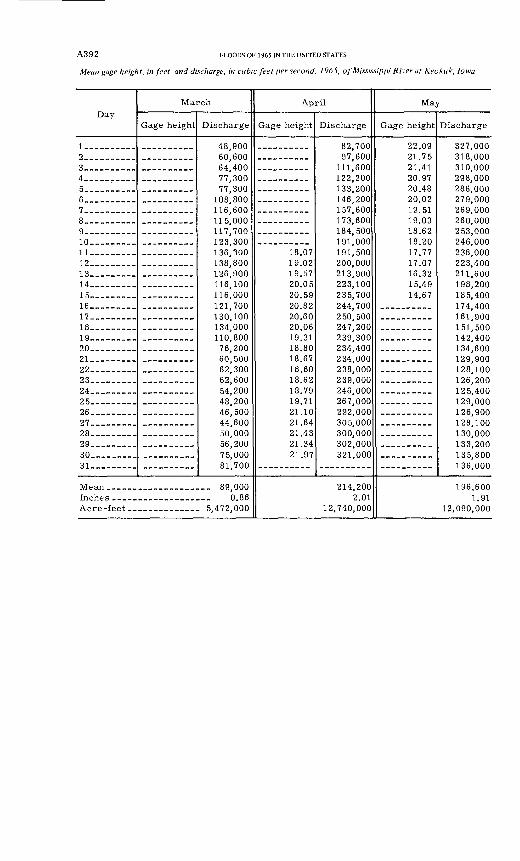
A3 9 2 FLOODS OF 1965 IN THE UNITED STATES
Mean gage height, in feet, and discharge, in cubic feet per second, 1965, of Mississippi River at Keokiik, Iowa
Day
1 ___ ______2 __________q
4____ _5 .... ... ...6 __________7 ___ - _____8 ____ - ___g10 _________11 _________12____ _____13 __ ______14 _________15 _________16 ____17__ _ _18 1920 _ _ 21__ __ _22 __ - _____23 __ - _24___ _2526 __ __ ____27 ____ _28 _________9Q
30 ______01
March
Gage height Discharge
48,900 60,600 64,400 77,300 77,300
108,800 116,600 115,000 117,700 123,300 136,300 138,800 126,900 116,100 116,000 121,700 130,100 134,000 110,800 76,200 60,500 62,300 62,600 54,200 48,200 46,500 44,600 50,000 56,200 75,000 81,700
April
Gage height
18.07 19.02 19.57 20.05 20.59 20.82 20.60 20.06 19.31 18.80 18.67 18.60 18.62 18.79 19.71 21.10 21.64 21.43 21.34 21.97
Discharge
82,700 97,600
111,600 122,200 133,200 146,200 157,600 173,600 184,500 191,000 191,500 200,000 213,900 223,100 235,700 244,700 250,500 247,200 239,300 234,400 234,000 238,000 239,000 246,000 267,000 292,000 305,000 300,000 302,000 321,000
214,200 2.01
12,740,000
May
Gage height
22.09 21.75 21.41 20.97 20.48 20.02 19.51 19.03 18.62 18.20 17.77 17.07 16.32 15.49 14.67
Discharge
327,000 318,000 310,000 298,000 286,000 279,000 269,000 260,000 253,000 246,000 238,000 223,400 211,600 198,200 185,400 174,400 161,900 151,500 142,400 134,600 129,900 128,100 126,200 125,400 129,000 126,900 128,100 130,000 133,200 135,800 136,000
196,600 1.91
12,090,000
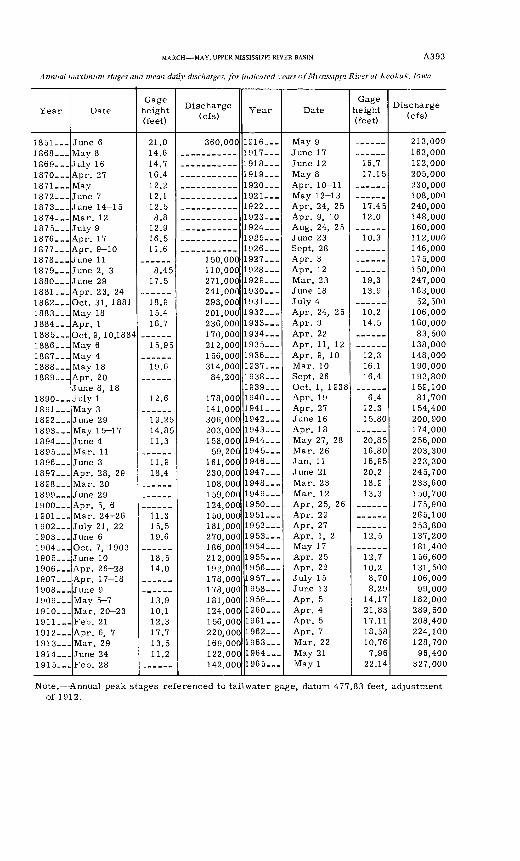
MARCH MAY, UPPER MISSISSIPPI RIVER BASIN A3 93
Annual maximum stages and mean daily discharges, for indicated rears of Mississippi River at Keokuk, Iowa
Year
1869 1870 __1 Q 7 1
1 Q 7 o
1873 __1874 __ 1875 __ 1876 __1 Q 77
1 p 7Q
1880 __ 1881 __
1883 __ 1884 __
1886 __ 1887. __1888 __ 1889 __
1890 __ 1891 .1892 - 18931894 __
1896 __ 1897 ___
1899 __1900 __1901 __1 QH9
1903 __ 19041905 __ 1906 __ 19071908 __1909 - 1910 __ 1911 - 1912 __ 1913 __ 1914 __ 1915 __
Date
July 16 Apr. 27
June 14-15Mar. 12 July 9 Apr. 17Apr 9 10
June 29 Apr 23 24Oct. 31, 1881May 18 Apr. 1Oct. 9, 10,1884 May 6
May 18
July 1
June 29 May 15-17June 4 Mar. 11June 3 Apr. 28, 29
Mar 24 26July 21, 22June 6 Oct. 7, 1903June 10 Apr. 26-28 Apr. 17-18
May 5-7 Mar. 20-23 Feb. 21 Apr. 6, 7 Mar. 29 June 24 Feb. 28
Gage height (feet)
21 014.614.7 16.4 12212.11 9 ^
8.812.9
U c
8 4517.5
18915.4 16.7
15.95
19.6
12.6
19.25 14.8511.3
11.9 18.4
11315.519.6
18.5 14.0
13.9 10.1 12.3 17.7 13.5 11.2
Discharge (cfs)
150,000110,000271,000 241,000293 000201,000 236,000 170,000212,000 156,000314,000 84,200
178,000 141,000306,000
158,000 59,200
161,000 230,000 108,000159,000124,000150,000 181,000270,000 186,000212,000 192,000 178,000178,000181,000 124,000 156,000 220,000 169,000 122,000 142,000
Year
191619171918- 1919 __ 1920 __19211922___1923 __ 1924 __ 1925 __
1927 __19281929 __ 1930.-.19311932 - 1933- 1 Q^d.
1935 __ 1936 1937. 1938 1939 __1940 ___ 1941 __1942 __ 1943 -1944 __ 1945 ___1946 __ 1947 __ 1948 ___1949 __1950 19511952 __1953 1954 __1955 1956 1957. -.1958 __1959 __ 1960 __ 1961 - 1962 __ 1963 __ 1964 __ 1965 __
Date
June 12 May 8 Apr. 10-11May 12-13Apr. 24, 25Apr. 9, 10 Aug. 24, 25 June 23
Apr. 3
Mar. 23 June 18July 4Apr. 24, 25 Apr. 9 Apr. 22Apr. 11, 12 Apr. 9, 10Mar. 10 Sept. 26Oct. 1, 1938Apr. 19 Apr. 27June 16 Apr. 18May 27, 28 Mar. 26Jan. 11 June 21 Mar. 23Mar. 12Apr. 25, 26A « O Q
Apr. 27Apr. 1, 2May 17Apr. 25 Apr. 22 July 15June 13Apr. 5 Apr. 4 Apr. 5 Apr. 7 Mar. 22 May 21 May 1
Gage height (feet)
16.7 17.15
17.4512.0
10.3
19.3 13.9
10.2 14.5
12.316.1 16.4
6.4 12.315.80
20.85 16.8016.95 20.2 18.913.3
12.5
12.7 10.2 8.708.29
14.17 21.83 17.11 18.58 10.76 7.96
22.14
Discharge (cfs)
213,000163,000192,000 205,000 230,000108,000240,000148,000 160,000 112,000146,000175,000150,000247,000 163,000
52,500106,000 160,000 83,500
138,000 148,000190,000 193,800159,10081,700
154,400200,900 174,000256,000 203,300223,300 245,700 233,600150,700175,900265,100253,800137,200 181,400156,600 131,500 106,00099,000
182,000 289,500 208,400 224,100 128,700 96,400
327,000
Note. Annual peak stages referenced to tailwater gage, datum 477.83 feet, adjustment of 1912.
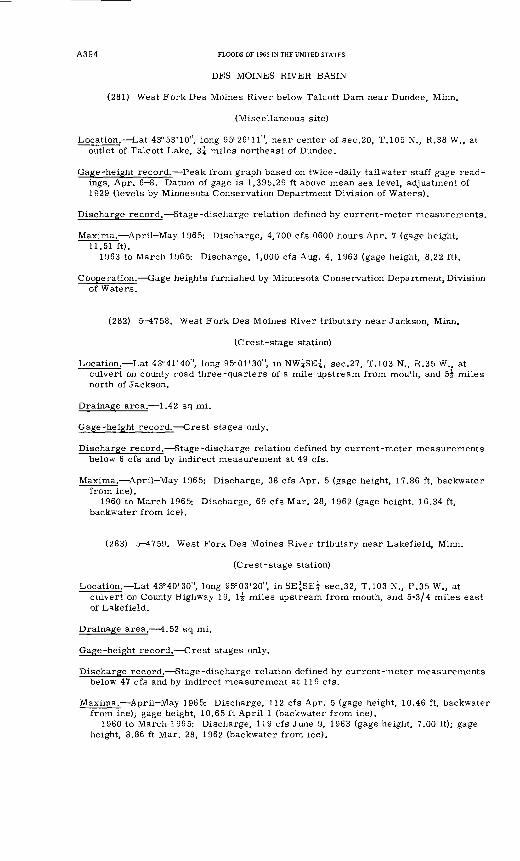
A3 9 4 FLOODS OF 1965 IN THE UNITED STATES
DBS MOINES RIVER BASIN
(281) West Fork Des Moines River below Talcott Dam near Dundee, Minn.
(Miscellaneous site)
Location. Lat 43°53'10", long 95°26'll", near center of sec.20, T.105 N., R.38 W., at outlet of Talcott Lake, 3^ miles northeast of Dundee.
Gage-height record. Peak from graph based on twice-daily tailwater staff gage read ings, Apr. 6 8. Datum of gage is 1,395.29 ft above mean sea level, adjustment of 1929 (levels by Minnesota Conservation Department Division of Waters).
Discharge record. Stage-discharge relation defined by current-meter measurements.
Maxima. April May 1965: Discharge, 4,700 cfs 0600 hours Apr. 7 (gage height, 11.51 ft).
1963 to March 1965: Discharge, 1,000 cfs Aug. 4, 1963 (gage height, 8.22 ft).
Cooperation. Gage heights furnished by Minnesota Conservation Department, Division of Waters.
(282) 5 4758. West Fork Des Moines River tributary near Jackson, Minn.
(Crest-stage station)
Location. Lat 43°41'40", long 95°01'30", in NW^SEi, sec.27, T.103 N., R.35 W., at culvert on county road three-quarters of a mile upstream from mouth, and 5-| miles north of Jackson.
Drainage area. 1.42 sq mi.
Gage-height record. Crest stages only.
Discharge record. Stage-discharge relation defined by current-meter measurements below 6 cfs and by indirect measurement at 49 cfs.
Maxima. April May 1965: Discharge, 38 cfs Apr. 5 (gage height, 17.86 ft, backwater from ice).
1960 to March 1965: Discharge, 69 cfs Mar. 28, 1962 (gage height, 16.34 ft, backwater from ice).
(283) 5 1759. West Fork Des Moines River tributary near Lakefield, Minn.
(Crest-stage station)
Location. Lat 43°40'30", long 95°03'20", in SE|SE| sec.32, T.103 N., P.35 W., at culvert on County Highway 19, 1^ miles upstream from mouth, and 5-3/4 miles east of Lakefield.
Drainage area. 4.52 sq mi.
Gage-height record. Crest stages only.
Discharge record. Stage-discharge relation defined by current-meter measurements below 47 cfs and by indirect measurement at 119 cfs.
Maxima. April-May 1965: Discharge, 112 cfs Apr. 5 (gage height, 10.46 ft, backwater from ice); gage height, 10.65 ft April 1 (backwater from ice).
1960 to March 1965: Discharge, 119 cfs June 9, 1963 (gage height, 7.00 ft); gage height, 8.86 ft Mar. 28, 1962 (backwater from ice).
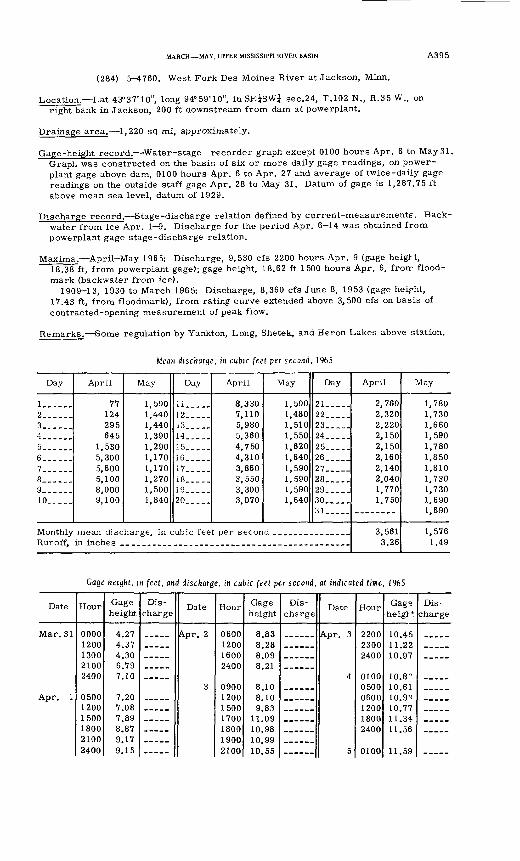
MARCH MAY, UPPER MISSISSIPPI RIVER BASIN A395
(284) 5-4760. West Fork Des Moines River at Jackson, Minn.
Location. Lat 43°37'10", long 94°59'10", in SE^SW^ sec.24, T.102 N., R.35 W., on right bank in Jackson, 200 ft downstream from dam at powerplant.
Drainage area. 1,220 sq mi, approximately.
Gage-height record. Water-stage recorder graph except 0100 hours Apr. 6 to May 31. Graph was constructed on the basis of six or more daily gage readings, on power- plant gage above dam, 0100 hours Apr. 6 to Apr. 27 and average of twice-daily gage readings on the outside staff gage Apr. 28 to May 31. Datum of gage is 1,287.75 ft above mean sea level, datum of 1929.
Discharge record. Stage-discharge relation defined by current-measurements. Back water from ice Apr. 1 9. Discharge for the period Apr. 6 14 was obtained from powerplant gage stage-discharge relation.
Maxima. April-May 1965: Discharge, 9,530 cfs 2200 hours Apr. 9 (gage height,18.38 ft, from powerplant gage); gage height, 18.62 ft 1500 hours Apr. 6, froir flood- mark (backwater from ice).
1909-13, 1930 to March 1965: Discharge, 8,360 cfs June 8, 1953 (gage heifht, 17.43 ft, from floodmark), from rating curve extended above 3,500 cfs on basis of contracted-opening measurement of peak flow.
Remarks. Some regulation by Yankton, Long, Shetek, and Heron Lakes above station.
Mean discharge, in cubic feet per second, 1965
Day
!__.-_.2... ...3......4......5... ...6......7......8___...9 ___ .10.....
Monthly Runoff,
April
77 124 295 645
1,530 5,300 5,600 5,100 8,000 9,100
May
1,590 1,440 1,440 1,390 1,290 1,170 1,170 1,270 1,500 1,840
Day
11. ...12.....13 ...14.....15.....16.. __17.....18.....19.....20.....
April
8,330 7,110 5,980 5,360 4,750 4,310 3,860 3,550 3,300 3,070
mean discharge, in cubic feet per secon in inches
May
1,500 1,480 1,510 1,550 1,620 1,640 1,590 1,590 1,590 1,640
Day
21 __ .22. __23.....24.....25 ___ .26 _____27.. ___28 __ ..29.....30.....31._...
d .... __ ... _____
April
2,760 2,320 2,220 2,150 2,150 2,160 2,140 2,040 1,770 1,750
3,561 3.26
May
1,780 1,730 1,660 1,590 1,780 1,850 1,810 1,730 1,730 1,690 1,690
1,576 1.49
Gage height, in feet, and discharge, in cubic feet per second, at indicated time, 1965
Date
Mar. 31
Apr. 1
Hour
00001200130021002400
050012001500180021002400
Gage height
4.274.374.306.797.10
7.207.087.898.879.179.15
Dis
chargeDate
kpr. 2
3
Hour
0600120016002400
0900120015001700180019002100
Gage height
8.838.288.098.21
8.108.109.83
11.0910.981 n QQ
10.55
Dis
chargeDate
4
5
Hour
23002400
05000600120018002400
0100
Gag<; heigl *
10.4511.2210.97
10.8?10.611 n Q*}
10.77U OA
11.56
11.59
Dis
charge
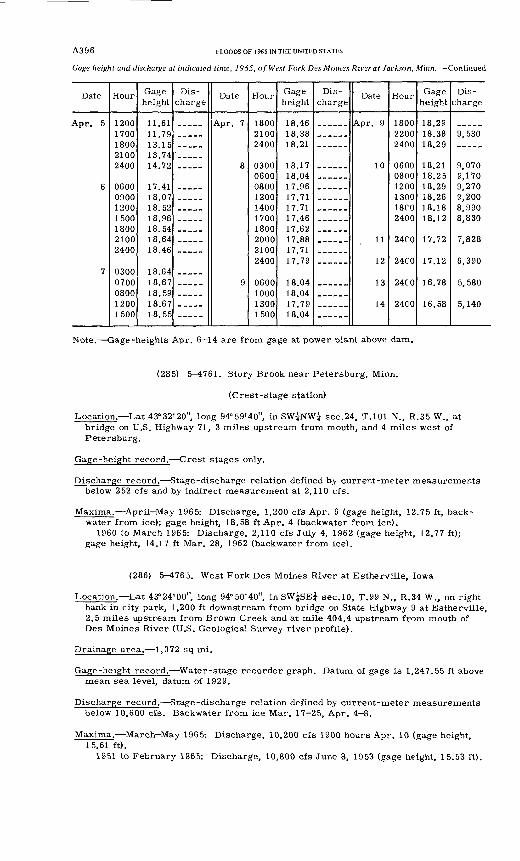
A3 9 6 FLOODS OF 1965 IN THE UNITED STATES
Gage height and discharge at indicated time, 1965, of West Fork Des Moines River at Jackson, Minn. Continued
Date
6
7
Hour
12001700180021002400
0600090012001500180021002400
03000700080012001500
Gage height
11.6111 79131513.7414.72
17.4118.0718.5218.9618.5418.6418.46
18.6418.6718.5918.6718.55
Dis
chargeDate
Apr. 7
8
9
Hour
180021002400
0300060008001200140017001800200021002400
0600100013001500
Gage height
18.4618.3818.21
18.1718.0417.9617.7117.7117.4617.6217.8817.7117.79
18.0418.0417 7918.04
Dis
chargeDate
10
11
1 9
13
14
Hour
180022002400
060008001200130018CO2400
24CO
9drn
24CO
24CO
Gage height
18.2918.3818.29
18.2118.2518.2918.2618.1818.12
n 79
17.12
16.78
16.58
Dis
charge
9,530
9,0709,1709,2709,2008,9908,830
7,828
6,390
5,580
5,140
Note. Gage-heights Apr. 6 14 are from gage at power plant above dam.
(285) 5 4761. Story Brook near Petersburg, Minn.
(Crest-stage station)
Location. Lat 43°32'20", long 94°59'40", in SW^NW^ sec.24, T.101 N., R.35 W., at bridge on U.S. Highway 71, 3 miles upstream from mouth, and 4 miles west of Petersburg.
Gage-height record. Crest stages only.
Discharge record. Stage-discharge relation defined by current-meter measurements below 252 cfs and by indirect measurement at 2,110 cfs.
Maxima. April-May 1965: Discharge, 1,200 cfs Apr. 6 (gage height, 12.75 ft, back water from ice); gage height, 18.58 ft Apr. 4 (backwater from ice).
1960 to March 1965: Discharge, 2,110 cfs July 4, 1962 (gage height, 12.77 ft); gage height, 14.17 ft Mar. 28, 1962 (backwater from ice).
(286) 5-^1765. West Fork Des Moines River at Estherville, Iowa
Location. Lat 43°24'00", long 94°50'40", in SW^SE^ sec.10, T.99 N., R.34 W., on right bank in city park, 1,200 ft downstream from bridge on S.tate Highway 9 at Estherville, 2.5 miles upstream from Brown Creek and at mile 404.4 upstream from mouth of Des Moines River (U.S. Geological Survey river profile).
Drainage area. 1,372 sq mi.
Gage-height record. Water-stage recorder graph. Datum of gage is 1,247.55 ft above mean sea level, datum of 1929.
Discharge record. Stage-discharge relation defined by current-meter measurements below 10,600 cfs. Backwater from ice Mar. 17-25, Apr. 4 8.
Maxima. March-May 1965: Discharge, 10,200 cfs 1900 hours Apr. 10 (gage height, 15.61 ft).
1951 to February 1965: Discharge, 10,800 cfs June 8, 1953 (gage height, 15.53 ft).
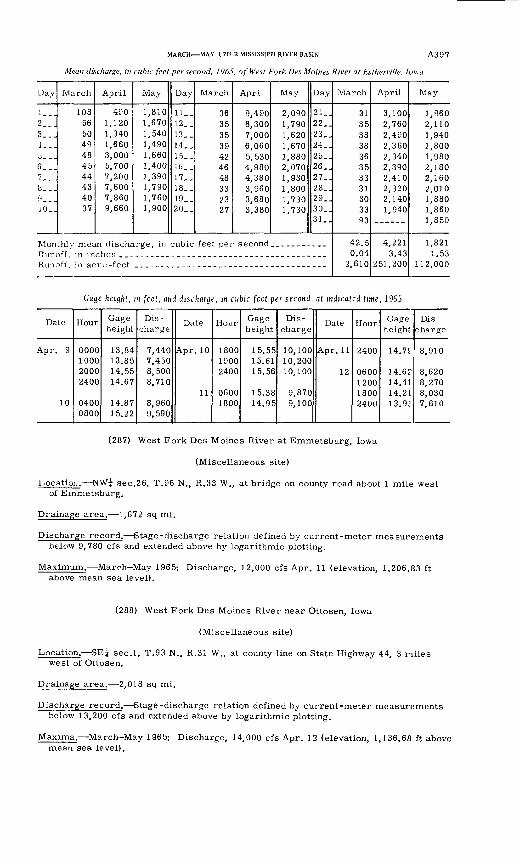
MARCH MAY, UPPER MISSISSIPPI RIVER BASIN A3 9 7
Mean discharge, in cubic feet per second. 1965, of West Fork Des Moines River at Estherville, Iowa
Day
1__.2...3...4...5_ _.6 ---\7...8...p___iO_.
March
108565049484544434037
April
4901,1201,3401,6603,0005,7007,2007,6007,8609,660
May
1,8101,6701,5401,4901,6601,4001,3901,7901,7601,900
Day
11..12..13..14..15..16..17..18..19_.20..
March
36353539424648332327
April
9,4908,3007,0006,0605,5304,9804,3803,9603,6803,380
May
2,0901,7901,6201,6701,8802,0701,9301,8001,7301,730
Day
21..22..23..24..25..26..27..28..29..30..31..
Runoff in inches _ ________Runoff, in acre -feet
March
31353838363533313033QS
42.50.04
2,610
April
3,1002,7602,4902,3602,3402,3902,4102,3202,1401,940
4,2213.43
251,200
May
1,9602,1101,9401,8001,9802,1802,1602,0101,8801,8601,850
1,8211.53
112,000
Gage height, m feet, and discharge, m cubic feet per second, at indicated time, 1965
Date
Apr. 9
10
Hour
0000100020002400
04000800
Gage height
13.8413.8514.5514.67
14.8715.22
Dis
charge
7,4407,4508,5008,710
8,9609,590
Date
Apr. 10
11
Hour
180019002400
06001800
Gage height
15.5515.6115.56
15.3814.95
Dis
charge
10,10010,20010,100
9,8709,100
Date
Apr. 11
12
Hour
2400
0600120018002400
Gage height
14. 7f
14.6?14.4114.2113. 9f
Dis
charge
8,910
8,6208,2708,0307,610
(287) West Fork Des Moines River at Emmetsburg, Iowa
(Miscellaneous site)
Location. NW£ sec.26, T.96 N., R.33 W., at bridge on county road about 1 mile west of Emmetsburg.
Drainage area. 1,672 sq mi.
Discharge record. Stage-discharge relation defined by current-meter measurements below 9,780 cfs and extended above by logarithmic plotting.
Maximum. March-May 1965: Discharge, 12,000 cfs Apr. 11 (elevation, 1,206.83 ft above mean sea level).
(288) West Fork Des Moines River near Ottosen, Iowa
(Miscellaneous site)
Location. SE^ sec.l, T.93 N., R.31 W., at county line on State Highway 44, 3 niles west of Ottosen.
Drainage area. 2,018 sq mi.
Discharge record. Stage-discharge relation defined by current-meter measurements below 13,200 cfs and extended above by logarithmic plotting.
Maxima. March-May 1965; Discharge, 14,000 cfs Apr. 12 (elevation, 1,136.68 ft above mean sea level).
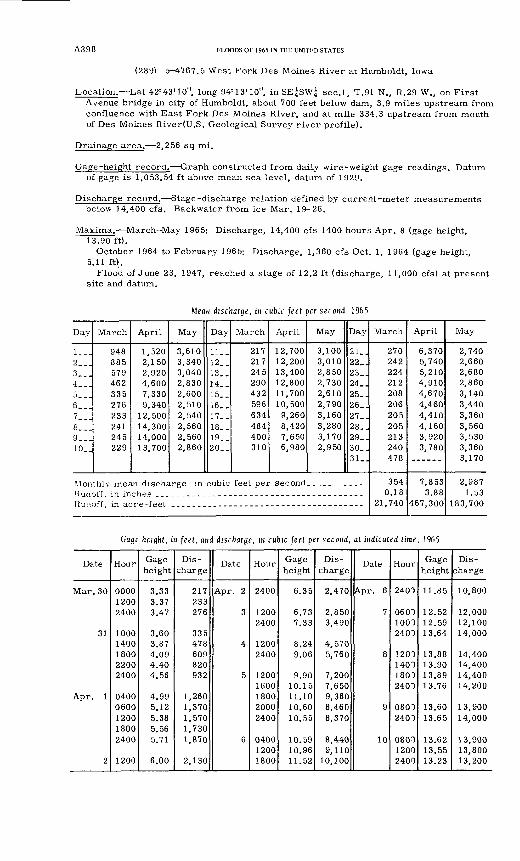
A3 9 8 FLOODS OF 1965 IN THE UNITED STATES
(289) 5 1767.5 West Fork Des Moines River at Humboldt, Iowa
Location. Lat 42°43'10", long 94°13'10", in SE^SWi sec.l, T.91 N., R.29 W., on First Avenue bridge in city of Humboldt, about 700 feet below dam, 3.9 miles upstream from confluence with East Fork Des Moines River, and at mile 334.3 upstream from mouth of Des Moines River(U.S. Geological Survey river profile).
Drainage area. 2,256 sq mi.
Gage-height record. Graph constructed from daily wire-weight gage readings. Datum of gage is 1,053.54 ft above mean sea level, datum of 1929.
Discharge record. Stage-discharge relation defined by current-meter measurements below 14,400 cfs. Backwater from ice Mar. 19 26.
Maxima. March May 1965: Discharge, 14,400 cfs 1400 hours Apr. 8 (gage height, 13.90 ft).
October 1964 to February 1965: Discharge, 1,360 cfs Oct. 1, 1964 (gage height, 5.11 ft).
Flood of June 23, 1947, reached a stage of 12.2 ft (discharge, 11,000 cfs) at present site and datum.
Mean discharge, in cubic feel per second, 1965
Day
1__.2...3___4...5___6___7...8...9__.10..
March
948885579462335276233241245229
April
1,5202,1502,9204,6007,3309,340
12,50014,30014,00013,700
May
3,6103,3403,0402,8302,6002,5102,5402,5602,5602,860
Day
11..12__13..14. _15..16..17. _18. _19..20..
March
217217245290432596634484400310
April
12,70012,20013,40012,80011,70010,500
9,2608,4207,6506,980
May
3,1003,0102,8502,7302,6102,7903,1603,2803,1702,950
Day
21_.22_.23_.24. .25_.26_.27..28..29_.30_.31..
Monthly mean discharge, in cubic feet per second.. _________
Runoff, in acre-feet
March
270242224212208206205205213240478
3540.18
21,740
April
6,3705,7405,2104,9104,6704,4604,4104,1603,9203,780
7,8533.88
467,300
May
2,7402,6602,6802,8603,1403,4403,3603,5603,5303,3603,170
2,9871.53
183,700
Gage height, in feet, and discharge, in cubic feet per second, at indicated time, 1965
Date
Mar. 30
31
Apr. 1
2
Hour
000012002400
10001400180022002400
04000600120018002400
1200
Gage height
3.333.373.47
3.603.874.094.404.56
4.995.125.385.565.71
6.00
Dis
charge
217233276
335478609820932
1,2601,3701,5701,7301,870
2,130
Date
Apr. 2
3
4
5
6
Hour
2400
12002400
12002400
12001600180020002400
040012001800
Gage height
6.35
6.737.33
8.249.06
9.9010.1511.1010.6010.55
10.5910.9611.52
Dis
charge
2,470
2,8503,490
4,5705,760
7,2007,6509,3608,4608,370
8,4409,110
10,100
Date
Apr. 6
7
8
9
10
Hour
2401
060110012401
1201140118012401
08012401
080012002400
Gage height
11.85
12.5212.5913.64
13.8813.9013.8913.76
13.6013.65
13.6213.5513.23
Dis
charge
10,800
12,00012,10014,000
14,40014,40014,40014,200
13,90014,000
13,90013,80013,200
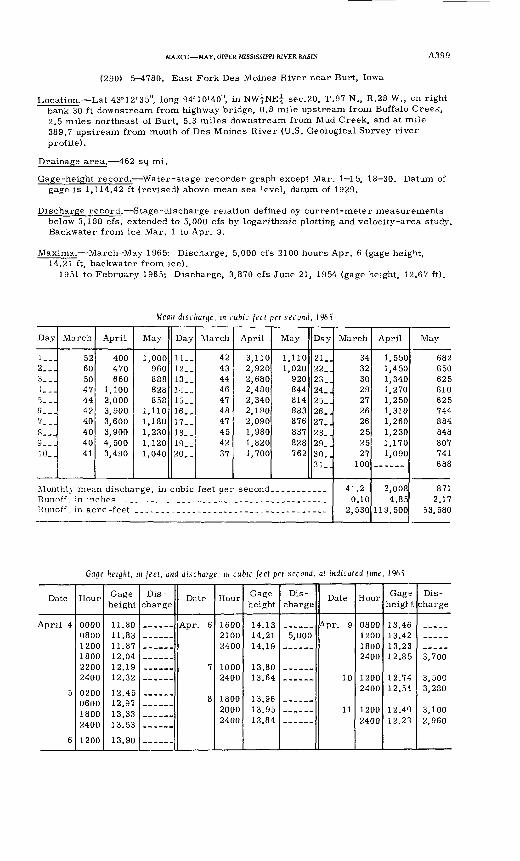
MARCH MAY, UPPER MISSISSIPPI RIVER BASIN A399
(290) 5 4780. East Fork Des Moines River near Burt, Iowa
Location. Lat 43°12'35", long 94°10'40", in NW^NE^ sec.20, T.97 N., R.28 W., on right bank 30 ft downstream from highway bridge, 0.8 mile upstream from Buffalo Creek, 2.5 miles northeast of Burt, 5.3 miles downstream from Mud Creek, and at mile 389.7 upstream from mouth of Des Moines River (U.S. Geological Survey river profile).
Drainage area. 462 sq mi.
Gage-height record. Water-stage recorder graph except Mar. 1 15, 18 30. Datum of gage is 1,114.42 ft (revised) above mean sea level, datum of 1929.
Discharge record. Stage-discharge relation defined by current-meter measurements below 3,180 cfs, extended to 5,000 cfs by logarithmic plotting and velocity-area study. Backwater from ice Mar. 1 to Apr. 9.
Maxima. March-May 1965: Discharge, 5,000 cfs 2100 hours Apr. 6 (gage height, 14.21 ft, backwater from ice).
1951 to February 1965: Discharge, 3,870 cfs June 21, 1954 (gage height, 12.67 ft).
Mean discharge, in cubic feet per second, 1965
Day
1__.2...3__.4...5__.6___7...8...9___10..
March
52605047444240404041
April
400470660
1,1002,0003,9003,6003,9004,5003,490
May
1,000960888828858
1,1101,1801,2301,1201,040
Day
11..12__13__14__15__16__17__18..19__20. .
March
42434446474847454237
April
3,1102,9202,6802,4802,3402,1902,0901,9801.8201,700
May
1,1101,020
920844814883876837828762
Day
21..22_.23_.24..25_.26..27..28..29..30_.3 1
Monthly mean discharge, in cubic feet per second. __________Runoff in inchesKunoff, in acre -feet
March
34323029272626252527
100
41.20.10
2,530
April
1,5501,4501,3401,2701,2501,3101,2601,2301,1701,090
2,0084.85
119,500
May
682650625610625744884848807741688
8712.17
53,580
Gage height, in feet, and discharge, m cubic feet per second, at indicated time, 1965
Date
6
Hour
000008001200
22002400
020006001800
1200
Gage height
11.80
11.87
1 9 1 Q
12.32
12 45
» oo
13.90
Dis charge
Date
7
8
Hour
160021002400
10002400
180020002400
Gage height
141314.2114 19
13.8013.64
13.9613.9513.84
Dis
charge
5,000
Date
10
11
Hour
08001200
2400
2400
12002400
Gage heigl t.
13.461 *3 A 9
13.2312.85
12.7412.54
12.4012.23
Dis
charge
3 700'
3,5003,280
3,1002,960
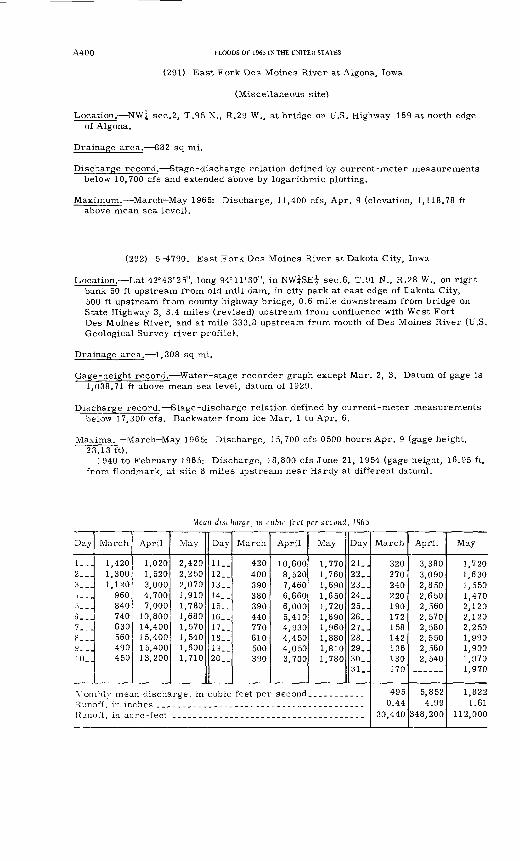
A400 FLOODS OF 1965 IN THE UNITED STATES
(291) East Fork Des Moines River at Algona, Iowa
(Miscellaneous site)
Location. NW| sec.2, T.95 N., R.29 W., at bridge on U.S. Highway 169 at north edge of Algona.
Drainage area. 882 sq mi.
Discharge record. Stage-discharge relation defined by current-meter measurements below 10,700 cfs and extended above by logarithmic plotting.
Maximum. March-May 1965: Discharge, 11,400 cfs, Apr. 9 (elevation, 1,118.78 ft above mean sea level).
(292) 5-^1790. East Fork Des Moines River at Dakota City, Iowa
Location. Lat 42°43'25", long 94° 11'30", in NW^SE^ sec.6, T.91 N., R.28 W., on right bank 50 ft upstream from old mill dam, in city park at east edge of Eakota City, 500 ft upstream from county highway bridge, 0.6 mile downstream from bridge on State Highway 3, 3.4 miles (revised) upstream from confluence with West Fort Des Moines River, and at mile 333.8 upstream from mouth of Des Moines River (U.S. Geological Survey river profile).
Drainage area. 1,308 sq mi.
Gage-height record. Water-stage recorder graph except Mar. 2, 3. Datum of gage is 1,038.71 ft above mean sea level, datum of 1929.
Discharge record. Stage-discharge relation defined by current-meter measurements below 17,300 cfs. Backwater from ice Mar. 1 to Apr. 6.
Maxima.- March-May 1965: Discharge, 15,700 cfs 0500 hours Apr. 9 (gage height, 23.13 ft).
1940 to February 1965: Discharge, 18,800 cfs June 21, 1954 (gage height, 16.95 ft, from floodmark, at site 8 miles upstream near Hardy at different datum).
Mean discharge, in cubic feet per second, 1965
Day
1...2...3...-t...5_ _.6...7...?_-.9...10__
March
1,4201,3001,120
960840740630560490450
April
1,0201,5203,0004,7007,000
10,80014,40015,40015,40013,200
May
2,4202,2502,0701,9101,7801,6801,5701,5401,6001,710
Vonthlv mean discharge, in
Day
11-.12..13..14..15..16..17..18..19..20-.
March
420400390380390440770610500390
April
10,6008,5207,4606,6606,0005,4104,9304,4504,0503,700
May
1,7701,7601,6901,6501,7201,8901,9601,8801,8101,780
Day
21_.22,.23..24_.25..26,.27..28..29_.30..31..
cubic feet per second..... ______Runoff in inchesRunoff, in acre -feet
March
320270240220190172158142136130170
4950.44
30,440
April
3,3803,0902,8502,6502,5602,5702,5802,5502,5602,540
5,8524.99
348,200
May
1,7201,6301,5501,4702,1202,1202,2501,9901,9001,9701,970
1,8221.61
112,000
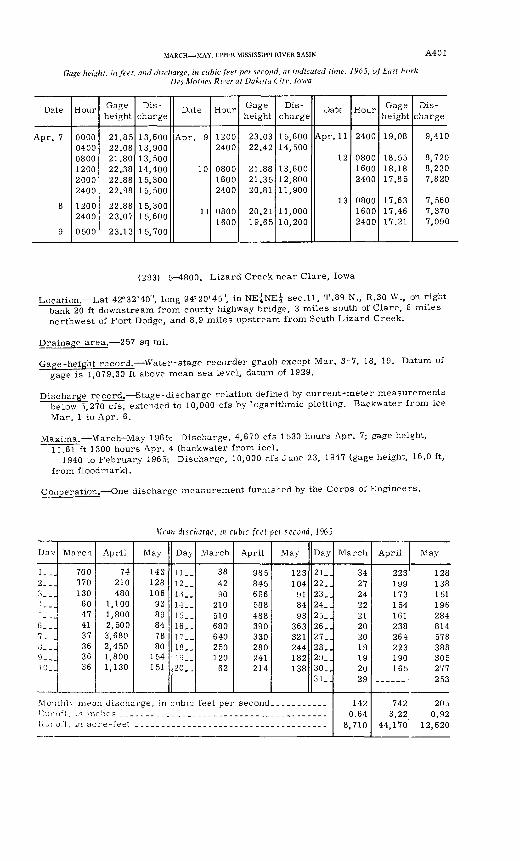
MARCH MAY, UPPER MISSISSIPPI RIVER BASIN
Gage height, in feet, and discharge, in cubic feet per second, at indicated time, 1965, of East Fork Des Moines River at Dakota Citv, Iowa
A401
Date
Apr. 7
8
9
Hour
000004000800120020002400
1200 2400
0500
Gage height
21.8522.0821.8022.3822.8822.98
22.88 23.07
23.13
Dis charge
13,60013,90013,50014,40015,30015,500
15,300 15,600
15,700
Date
Apr. 9
10
11
Hour
12002400
080016002400
0800 1600
Gage height
23.0322.42
21.8821.3520,81
20.21 19.65
Dis
charge
15,60014,500
13,60012,80011,900
11,000 10,200
Date
Apr. 11
12
13
Hour
2400
080016002400
0800 1600 2400
Gage height
19.08
18.5518.1817.85
17.63 17.46 17.21
Dis
charge
9,410
8,7208,2307,820
7,560 7,370 7,090
(293) 5-4800. Lizard Creek near Clare, Iowa
Location. Lat 42°32'40", long 94°20'45", in NE^NE^ sec.11, T.89 N., R.30 W., on right bank 20 ft downstream from county highway bridge, 3 miles south of Clare, 8 miles northwest of Fort Dodge, and 8.9 miles upstream from South Lizard Creek.
Drainage area. 257 sq mi.
Gage-height record. Water-stage recorder graph except Mar. 3-7, 18, 19. Datum of gage is 1,079.30 ft above mean sea level, datum of 1929.
Discharge record. Stage-discharge relation defined by current-meter measurements below 5,270 cfs, extended to 10,000 cfs by logarithmic plotting. Backwater from ice Mar. 1 to Apr. 6.
Maxima. March-May 1965: Discharge, 4,670 cfs 1530 hours Apr. 7; gage height, 11.61 ft 1300 hours Apr. 4 (backwater from ice).
1940 to February 1965: Discharge, 10,000 cfs June 23, 1947 (gage height, 16.0 ft, from floodmark).
Cooperation. One discharge measurement furnished by the Corps of Engineers.
Mean discharge, in cubic feel per second, 1965
Day
1...2__J3__]; --i- i
6___7...,3._ H9-..,10. _
March
700370130
60474137363636
April
74210480
1,1001,8002,5003,6802,4501,8001,130
May
143128106
9389847880
154151
Day
11.-12_.13_.14. _15. _16..17. _18..19..20..
March
384290
210510680640250120
62
April
985845696588488390330280241214
May
123104
918493
363321244182138
Day
21..22..23..24..25.J26..27..28..29..30..31
Mont hi \ mean discharge, in cubic feet per second... _____--.
I'ur.ot'f. m acre-feet
March
3427242221202019192029
1420.64
8,710
April
223199173154161238264223190165
7423 99
44,170
May
128138151196284814578388305277253
205O Q9
12,620
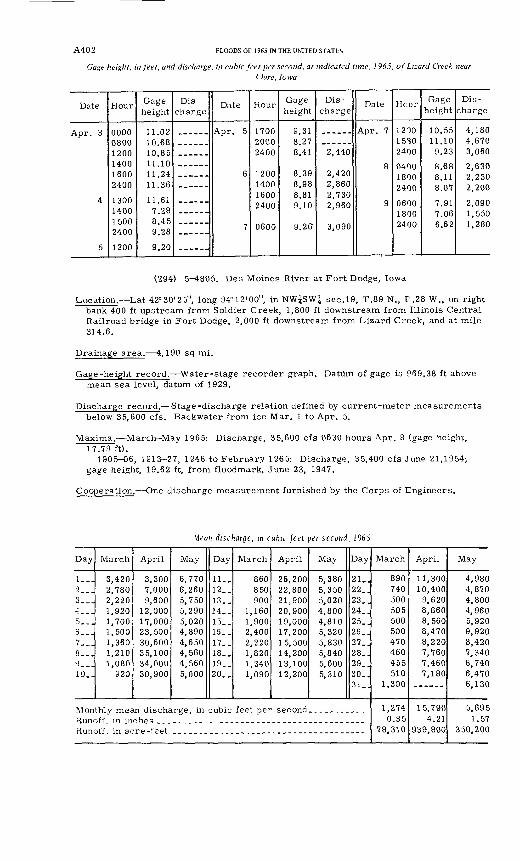
A402 FLOODS OF 1965 IN THE UNITED STATES
Gage height, in feet, and discharge, in cubic feet per second, at indicated time, 1965, of Lizard Creek nearClare, Iowa
Date
Apr. 3
4
5
Hour
08001200140016002400
1300140015002400
1200
Gage height
10.8511.1011.2411.36
11.617.288.459.28
9.20
Dis charge
Date
6
7
Hour
170020002400
1200140016002400
0600
Gage height
9.318.278.41
8.398.988.819.10
9.26-
Dis
charge
2,440
2,4202,8602,7302,960
3,090
Date
Apr. 7
Hcur
120015302400
040018002400
060018002400
Gage height
10.5511.10
9.23
.DO
.11
.U (
. <3 1
6.62
Dis
charge
4,1804,6703,060
, OoU
, £i OU
2,200
, uy u1,550I , £ioU
(294) 5 1805. Des Moines River at Fort Dodge, Iowa
Location. Lat 42°30'25", long 94°12'00", in NW^SW^ sec.19, T.89 N., F.28 W., on right bank 400 ft upstream from Soldier Creek, 1,800 ft downstream from Illinois Central Railroad bridge in Fort Dodge, 2,000 ft downstream from Lizard Creek, and at mile 314.6.
Drainage area. 4,190 sq mi.
Gage-height record. Water-stage recorder graph. Datum of gage is P69.38 ft above mean sea level, datum of 1929.
Discharge record. Stage-discharge relation defined by current-meter measurements below 35,600 cfs. Backwater from ice Mar. 1 to Apr. 5.
Maxima. March-May 1965: Discharge, 35,600 cfs 0630 hours Apr. 8 (gage height, 17.79 ft).
1905-06, 1913-27, 1946 to February 1965: Discharge, 35,400 cfs June 21,1954; gage height, 19.62 ft, from floodmark, June 23, 1947.
Cooperation. One discharge measurement furnished by the Corps of Engineers.
Mean discharge, in cubic feet per second, 1965
Day
1...2...3__.4...5_ __6...7__.8...9...10_.
March
3,4202,7802,2201,9201,7001,5001,3601,2101,080
920
April
3,3007,0009,600
12,00017,00023,50030,60035,10034,00030,900
May
6,7706,2605,7505,2905,0204,8904,6504,5604,5605,000
Day
11..12..13..14..15..16..17..18..19..20..
March
860850900
1,1601,9002,4002,2201,8201,3401,090
April
26,20022,80021,90020,90019,00017,2001 5, 50014,20013,10012,200
May
5,3805,3505,0204,8004,8105,3205,8305,8405,6005,310
Day
21..22..23..24..25..26..27..28..29_.30..31
Monthly mean discharge, in cubic feet per second... .._...._
Runoff, in acre -feet
March
890740500505500500470460455510
1,300
1,2740.35
78,310
April
11,30010,400
9,6208,8608,5608,4708,2207,7607,4607,180
15,7904.21
939,800
May
4,9804,8704,8004,9605,9209,9208,4207,3406,7406,4706,130
5,6951.57
350,200
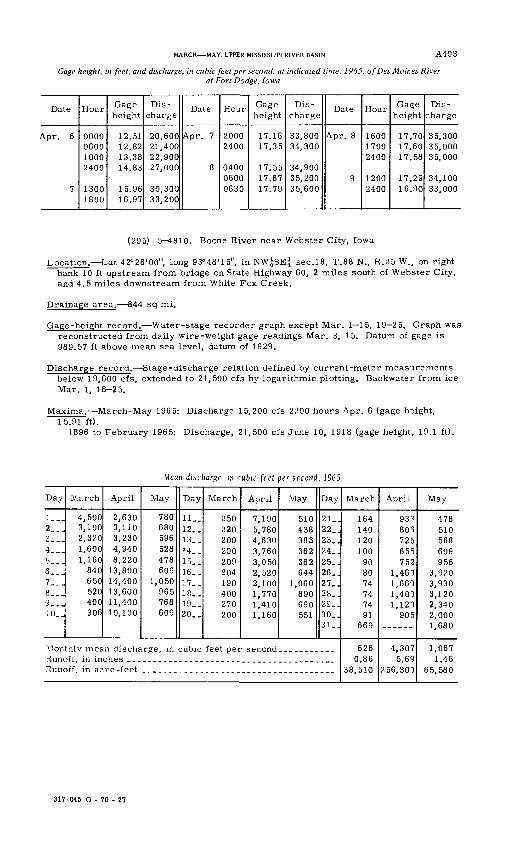
MARCH MAY, UPPER MISSISSIPPI RIVER BASIN A403
Gage height, in feet, and discharge, in cubic feet per second, at indicated time, 1965, ofDes Moines Riverat Fort Dodge, Iowa
Date
^pr. 6
7
Hour
0000060010002400
13001800
Gage height
12.5112.8213.3814.83
15.9616.97
Dis charge
20,60021,40022,90027,000
30,30033,200
Date
Apr. 7
8
Hour
20002400
040006000630
Gage height
17.1617.35
17.5517.6717.79
Dis
charge
33,80034,300
34,90035,20035,600
Date
Apr. 8
9
Hour
160017002400
12002400
Gage height
17.7017.6017.58
17.2916.90
Dis
charge
35,30035,00035,000
34,10033,000
(295) 5 4810. Boone River near Webster City, Iowa
Location. Lat 42°26'00", long 93°48'15", in NW^SE^ sec.18, T.88 N., R.25 W., on right bank 10 ft upstream from bridge on State Highway 60, 2 miles south of Webster City, and 4.5 miles downstream from White Fox Creek.
Drainage area. 844 sq mi.
Gage-height record. Water-stage recorder graph except Mar. 1 15, 19 25. Graph was reconstructed from daily wire-weight gage readings Mar. 3, 15. Datum of gage is 989.57 ft above mean sea level, datum of 1929.
Discharge record. Stage-discharge relation defined by current-meter measurements below 19,600 cfs, extended to 21,500 cfs by logarithmic plotting. Backwater from ice Mar. 1, 18-25.
Maxima. March-May 1965: Discharge 15,200 cfs 2200 hours Apr. 6 (gage hsight, 15.91 ft).
1896 to February 1965: Discharge, 21,500 cfs June 10, 1918 (gage height, 19.1 ft).
Mean discharge, in cubic feet per second, 1965
Day
l._.2...3...4...5...6___7___8...9...10..
March
4,5003,1002,3201,6001,160
840650520400306
April
2,6303,1103,2304,9408,220
13,80014,40013,60011,40010,100
May
780680596528478609
1,050965768609
Day
11..12..13. _14..15..16..17..18..19..20..
March
250220200200209204190400270200
April
7,1905,7804,6303,7603,0502,5202,1001,7701,4101,160
May
510438383362362644
1,060890690551
Day
21_.22..23..24..25_.26..27..28..29..30..31..
Runoff, in inchesRunoff, in acre -feet
March
164140120100
908074747491
669
6260.86
38,510
April
93^SOT725655752
1,46-)1,6601,4001,120
905
4,3075.69
256,300
May
478510568609956
3,9203,9303,1202,3402,0001,680
1,0671.46
65,580
317-045 O - 70 - 27
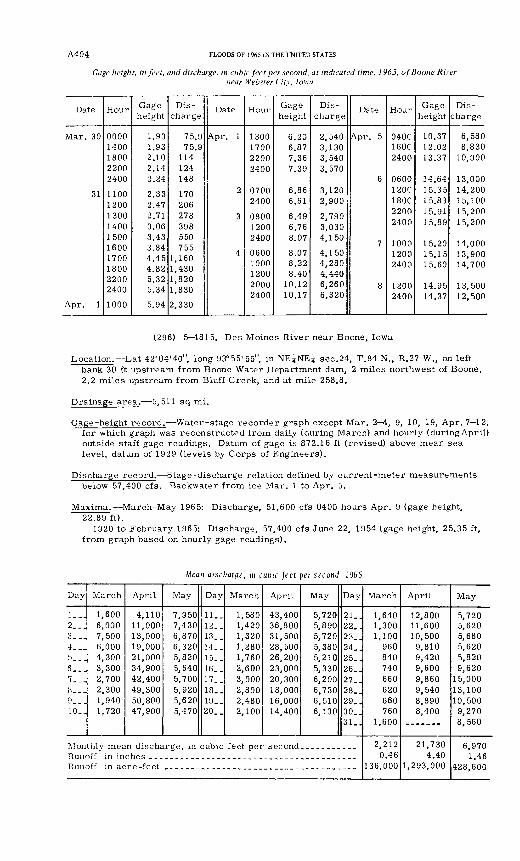
A404 FLOODS OF 1965 iN THE UNITED STATES
Gage height, in feet, and discharge, in cubic feet per second, at indicated time, 1965, of Boons River near Webster City, Iowa
Date
Mar. 30
31
Apr. 1
Hour
00001400180022002400
110012001300140015001600 1700 18002200 2400
1000
Gage height
1.931.932.102.142.24
2.332.472.713.063.433.84 4.45 4.825.32 5.34
5.94
Dis charge
75.975.9
114124148
170206278398550755
1,160 1,4301,820 1,830
2,330
Date
Apr. 1
2
3
4
Hour
1300170022002400
07002400
080012002400
0600 1000 12002000 2400
Gage height
6.206.877.367.39
6.866.61
6.496.768.07
8.07 8.22 8.40
10.12 10.17
Dis
charge
2,5403,1303,5403,570
3,1202,900
2,7903,0304,150
4,150 4,280 4,4406,260 6,320
Date
Apr. 5
6
7
8
Hour
040C160C2400
0600120C180C22002400
1000 1200 2400
1200 2400
Gage height
10.3712.0213.37
14.6415.3515.8315.9115.89
15.20 15.15 15.60
14.95 14.37
Dis charge
6,5808,830
10,900
13,00014,20015,10015,20015,200
14,000 13,900 14,700
13,500 12,500
(296) 5 4815. Des Moines River near Boone, Iowa
Location. Lat 42°04'40", long 93° 55'55", in NE^NE^ sec.24, T.84 N., R.27 W., on left bank 30 ft upstream from Boone Water Department dam, 2 miles northwest of Boone, 2.2 miles upstream from Bluff Creek, and at mile 258.8.
Drainage area. 5,511 sq mi.
Gage-height record. Water-stage recorder graph except Mar. 2 4, 9, 10, 19, Apr. 7 12, for which graph was reconstructed from daily (during March) and hourly (duringApril) outside staff gage readings. Datum of gage is 872.16 ft (revised) above mean sea level, datum of 1929 (levels by Corps of Engineers).
Discharge record. Stage-discharge relation defined by current-meter measurements below 57,400 cfs. Backwater from ice Mar. 1 to Apr. 5.
Maxima. March-May 1965: Discharge, 51,600 cfs 0400 hours Apr. 9 (gage height, 22.89 ft).
1920 to February 1965: Discharge, 57,400 cfs June 22, 1954 (gage height, 25.35 ft, from graph based on hourly gage readings).
Mean discharge, in cubic feet per second, 1965
Day
l._.2...3...4___5___6...7...«...9___10..
March
1,6006,0007,5006,0004,3003,3002,7002,3001,9401,720
April
4,11011,00013,00019,00021,00034,90042,40049,30050,80047,900
May
7,9507,4306,8706,3205,8205,6405,7005,9205,6205,470
Day
11.-12..13.-14,.15..16..17..18..19_.20..
March
1,5801,4201,3201,2801,7602,6003,0002,8002,4802,100
April
43,40036,80031,50028,50026,20023,00020,30018,00016,00014,400
May
5,7205,8905,7205,3805,2105,3306,2006,7306,5106,130
Day
21-.22..23..24..25..26..27..28..29..30..31..
Monthly mean discharge, in cubic feet per second... .._____.Runoff, in inches ...Runoff, in acre-feet
March
1,6401,3001,100
960840740660620660760
1,600
2,2120.46
136,000
April
12,80011,60010,500
9,8109,4209,6009,8609,5408,8908,400
21,7304.40
1,293,000
May
5,7205,6205,6805,6205,8209,620
15,00013,10010,5009,2708,560
6,9701.46
428,600
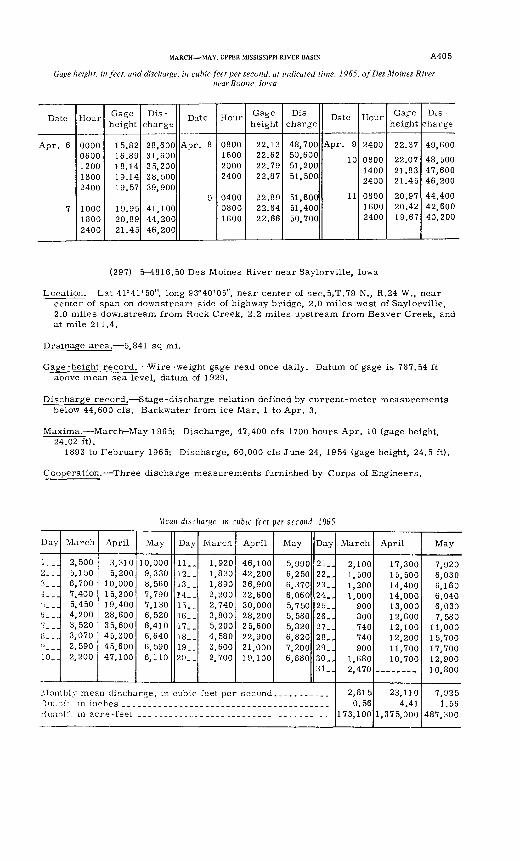
MARCH MAY, UPPER MISSISSIPPI RIVER BASIN A405
Cage height, in feet, and discharge, in cubic feet per second, at indicated time, 1965, ofDes Moines Rivernear Boone, Iowa
Date
Apr. 6
7
Hour
00000600120018002400
100018002400
Gage height
15.8216.8918.1419.1419.57
19.9520.8921.45
Dis
charge
28,60031,60035,20038,50039,900
41,10044,20046,200
Date
Apr. 8
9
Hour
0800160020002400
040008001600
Gage height
22.1322.6222.7922.87
22.8922.8422.66
Dis
charge
48,70050,60051,20051,500
51,60051,40050,700
Date
Apr. 9
10
11
Hour
2400
080014002400
080016002400
Gage height
22.37
22.0721.8321.45
20.9720.4219.67
Dis
charge
49,600
48,50047,60046,200
44,40042,60040,200
(297) 5^816.50 Des Moines River near Saylorville, Iowa
Location. Lat 41°41'50", long 93°40'05", near center of sec.5,T.79 N., R.24 W., near center of span on downstream side of highway bridge, 2.0 miles west of Say?orville, 2.0 miles downstream from Rock Creek, 2.2 miles upstream from Beaver Creek, and at mile 211.4.
Drainage area. 5,841 sq mi.
Gage-height record. Wire-weight gage read once daily. Datum of gage is 787.54 ft above mean sea level, datum of 1929.
Discharge record. Stage-discharge relation defined by current-meter measurements below 44,600 cfs. Backwater from ice Mar. 1 to Apr. 3.
Maxima.- March-May 1965: Discharge, 47,400 cfs 1700 hours Apr. 10 (gage height, 24.02 ft).
1893 to February 1965: Discharge, 60,000 cfs June 24, 1954 (gage height, 24.5 ft).
Cooperation. Three discharge measurements furnished by Corps of Engineers.
Mean discharge, m cubic feet per second, 1965
Day
1--.2...3...T. _.
1- -_
6...7.-J8...q___
10..
March
2,5005,1506,7007,4005,4504,2003,5203,0702,5902,200
April
3,3105,200
10,00015,20019,40028,60035,60045,30045,60047,100
May
10,0009,3308,5607,7907,1306,5206,4106,6406,5906,110
Day
11..12. _13..14..15. _16..17..18..19_.20..
March
1,9201,8301,8902,2002,7403,8005,2004,5803,6002,700
April
46,10042,20036,90032,60030,00028,20025,60022,90021,00019,100
May
5,9906,2506,3706,0605,7505,5805,8206,8207,2006,880
Day
21..22..23..24..25..26..27..28..29..30..31_.
^uN'/fi , in inches ...Runoff, in acre-feet
March
2,1001,5001,2001,000
900800740740900
1,6802,470
2,8150.56
173,100
April
17,30015,50014,40014,00013,00012,60012,10012,20011,70010,700
23,1104.41
1,375,000
May
7,9206,0306,1606,0406,0307,580
11,00015,70017,70012,90010,800
7,9251.56
487,300
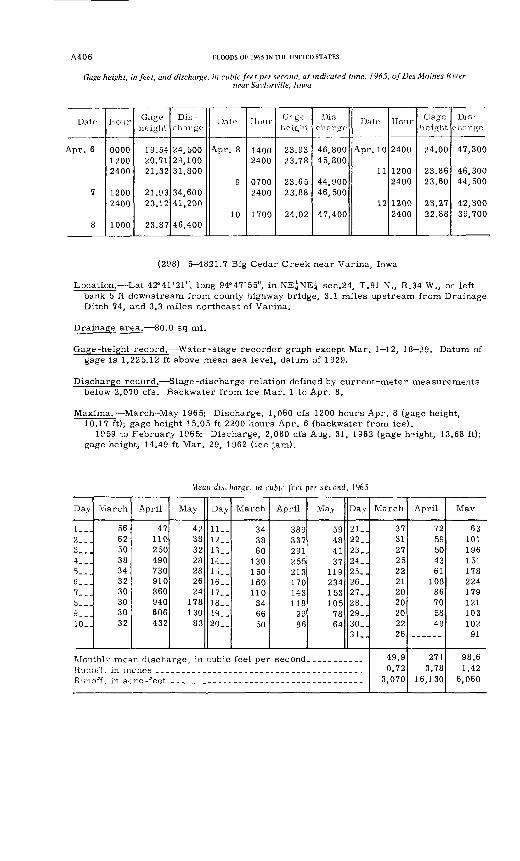
A406 FLOODS OF 1965 IN THE UNITED STATES
Gage height, in feet, and discharge, in cubic feet per second, at indicated time, 1965, of Des Moines Rivernear Saylorville, Iowa
Dale
\pr. 6
7
8
Hour
000012002400
12002400
1000
Gage height
19.5420.7121.32
21.9323.12
23.87
Dis charge
24,50029,10031,800
34,60041,200
46,400
Date
Apr. 8
9
10
Hour
14002400
07002400
1700
Gage height
23.9323.78
23.6523.88
24.02
Dis charge
46,80045,800
44,90046, 500
47,400
Date
Apr. 10
11
12
Hour
2400
12002400
12002400
Gage height
24.00
23.8623.60
23.2722.88
Dis
charge
47,300
46,30044,500
42,30039,700
(298) 5-^821.7 Big Cedar Creek near Varina, Iowa
Location. Lat 42°41'21", long 94°47'55", in NE^NE^j sec.24, T.91 N., R.34 W., on left bank 5 ft downstream from county highway bridge, 3.1 miles upstream from Drainage Ditch 74, and 3.3 miles northeast of Varina.
Drainage area. 80.0 sq mi.
Gage-height record. Water-stage recorder graph except Mar. 1 12, 18 29. Datum of gage is 1,225.12 ft above mean sea level, datum of 1929.
Discharge record. Stage-discharge relation defined by current-meter measurements below 2,070 cfs. Backwater from ice Mar. 1 to Apr. 8.
Maxima.- March-May 1965: Discharge, 1,060 cfs 1200 hours Apr. 8 (gage height, 10.17 ft); gage height 15.05 ft 2200 hours Apr. 6 (backwater from ice).
1959 to February 1965: Discharge, 2,080 cfs Aug. 31, 1962 (gage height, 13.68 ft); gage height, 14.49 ft Mar. 29, 1962 (ice jam).
Mean discharge, in cubic feet per second, 1965
Day
1...2...3__.4_._S___6...7__.8...9...10. J
March
56625038343230303032
April
47110250490730910860940606432
May
42383228282624
178130
83
Day
11..12__13__14__15__16__17__18__19-.20__
March
343860
130150160110
846650
April
389337291255213170143118
9986
May
59484137
119234153105
7864
Day
21..22_.23..24. .25..26_.27_.28..29..30_.31
Monthly mean discharge, in cubic feet per second_.__. ______
Runoff, in acre -feet
March
3731272522212020202226
49.90.72
3,070
April
7259504361
10886705849
2713.78
16,130
May
63101196151178224179121103102
91
98.61.42
6,060
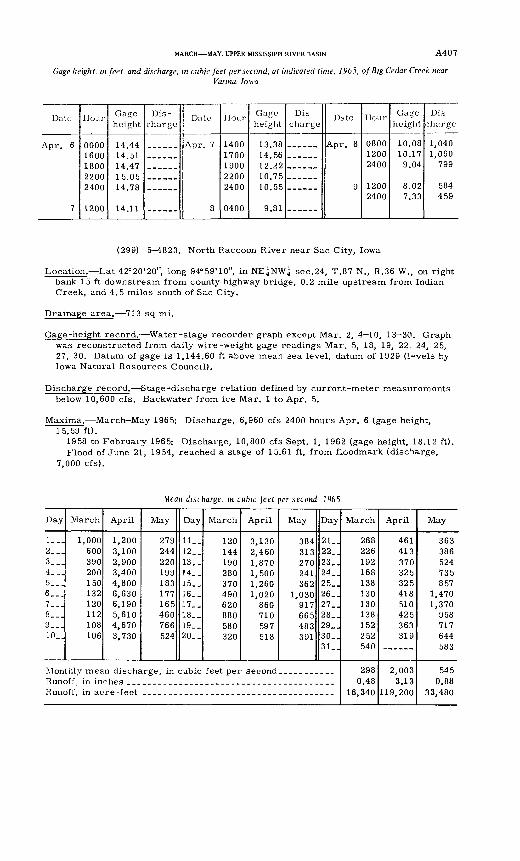
MARCH MAY, UPPER MISSISSIPPI RIVER BASIN A407
Gage height, m feet, and discharge, in cubic feet per second, at indicated time, 1965, of Big Cedar Creek nearVarina, Iowa
Dale
A r\v fi
7
Hour
00001600180022002400
1200
Gage height
14.4414 5114.4715.0514.78
14.11
Dis
chargeDate
Apr. 7
8
Hour
140017001900
2400
0400
Gage height
13.3814.5612.2210.7510.55
9.81
Dis
chargeDate
Apr. 8
9
Hour
080012002400
12002400
Gage height
10.0810.179.04
8.027.33
Dis
charge
1,0401,060
799
584459
(299) 5 1823. North Raccoon River near Sac City, Iowa
Location. Lat 42°20'20", long 94°59'10", in NEjNWj sec.24, T.87 N., R.36 W., on right bank 1 5 ft downstream from county highway bridge, 0.2 mile upstream from Indian Creek, and 4.5 miles south of Sac City.
Drainage area. 713 sq mi.
Gage-height record. Water-stage recorder graph except Mar. 2, 4 10, 13 30. Graph was reconstructed from daily wire-weight gage readings Mar. 5, 18, 19, 22. 24, 25, 27, 30. Datum of gage is 1,144.60 ft above mean sea level, datum of 1929 (levels by Iowa Natural Resources Council).
Discharge record. Stage-discharge relation defined by current-meter measurements below 10,600 cfs. Backwater from ice Mar. 1 to Apr. 5.
Maxima. March May 1965: Discharge, 6,960 cfs 2400 hours Apr. 6 (gage height, 15.59 ft).
1958 to February 1965: Discharge, 10,800 cfs Sept. 1, 1962 (gage height, 18.12 ft).Flood of June 21, 1954, reached a stage of 15.61 ft, from floodmark (discharge,
7,000 cfs).
Mean discharge, in cubic feet per second, 1965
Day
1__.2...3...4__.5...6...7...8...9__.10_.
March
1,000600390200150132120112108106
April
1,2003,1002,9003,4004,8006,6306,1905,6104,6703,730
May
279244220199183177165460766524
Day
11_.12__13__14. _15__16..17..18..19-_20..
March
120144190280370490620880580320
April
3,1302,4601,8701,5001,2601,020
860710597518
May
384313270241362
1,030917665483391
Day
21..22..23..24_.25_.26_.27_.28_.29_.30_.31
Monthly mean discharge, in cubic feet per second. __________Runoff, in inchesRunoff, in acre -feet
March
268226192168138130130138152252540
2980.48
18,340
April
461413370325325418510425363319
2,0033.13
119,200
May
363386524735857
1,4701,370
958717644583
5450.88
33,480
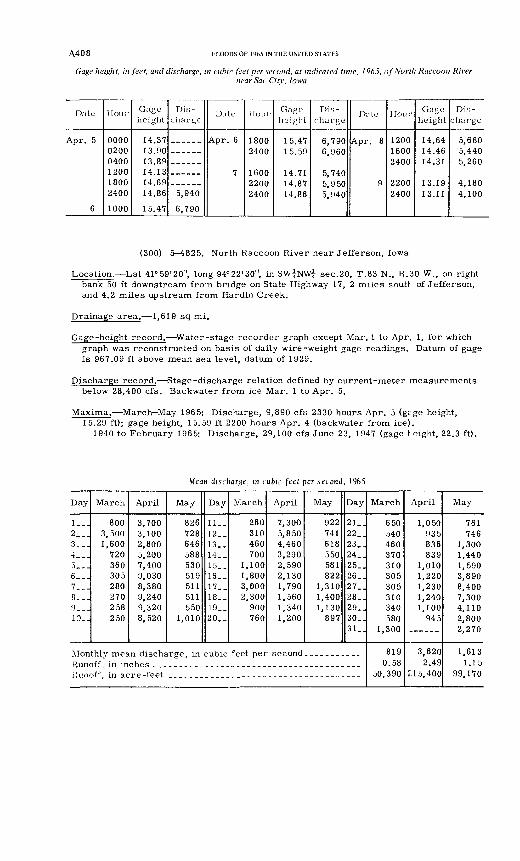
A408 FLOODS OF 1965 IN THE UNITED STATES
Gage height, in feet, and discharge, in cubic feet per second, at indicated time, 1965, of North Raccoon Rivernear Sac City. Iowa
Dale
A r 5
6
Hour
000002000400120018002400
1000
Gage height
13.9013.8914.1314.6914.86
15.47
Dis
charge
5,940
6,790
Date
7
lloui-
18002400
160022002400
Gage height
1 5 471 ^ ^Q
14.71
14.86
Dis
charge
6,7906,960
5,7405,950 5,940
Dote
g
Hour
1200
2400
9 9ftft
2400
Gage height
14.6414.46
131913.11
Dis
charge
5,6605 440
4,1804,100
(300) 5-4825. North Raccoon River near Jefferson, Iowa
Location. Lat 41°59'20", long 94°22'30", in SW^NWi sec.20, T.83 N., R.30 W., on right bank 50 ft downstream from bridge on State Highway 17, 2 miles soutt of Jefferson, and 4.2 miles upstream from Hardin Creek.
Drainage area. 1,619 sq mi.
Gage-height record. Water-stage recorder graph except Mar. 1 to Apr. 1, for which graph was reconstructed on basis of daily wire-weight gage readings. Datum of gage is 967.09 ft above mean sea level, datum of 1929.
Discharge record. Stage-discharge relation defined by current-meter measurements below 28,400 cfs. Backwater from ice Mar. 1 to Apr. 5.
Maxima. March May 1965: Discharge, 9,890 cfs 2330 hours Apr. 5 (gfge height, 15.29 ft); gage height, 15.59 ft 2200 hours Apr. 4 (backwater from ice).
1940 to February 1965: Discharge, 29,100 cfs June 23, 1947 (gage I eight, 22.3 ft).
Mean discharge, in cubic feet per second, 1965
Day
1_~2...3__.4__.5...6__.7__.8...9...10_.
March
8003,5001,600
720360305280270258250
April
3,7003,1002,8005,2007,4009,0308,3809,2409,3208,520
May
826728646588530519511511550
1,010
Day
11..12._13..14. _15__16. _17. _18..19__20._
March
260310460700
1,1001,8003,0002,300
900760
April
7,3005,8504,4603,2902,5902,1301,7901,5601,3401,200
May
922741618550581822
1,3101,4001,130
897
Day
21..22_.23. _24..25..26_.27..28..29..30_.31..
Monthly mean discharge, in cubic feet per second. __________Runoff in inchesliunoff, in acre -feet
March
650540460370310305305310340580
1,300
8190.58
50,390
April
1,050935836839
1,0101,2201,2301,2401,100
945______
3,6202.49
215,400
May
761746
1,3001,4401,5903,8908,4007,3004,1102,8002,270
1,6131.15
99,170
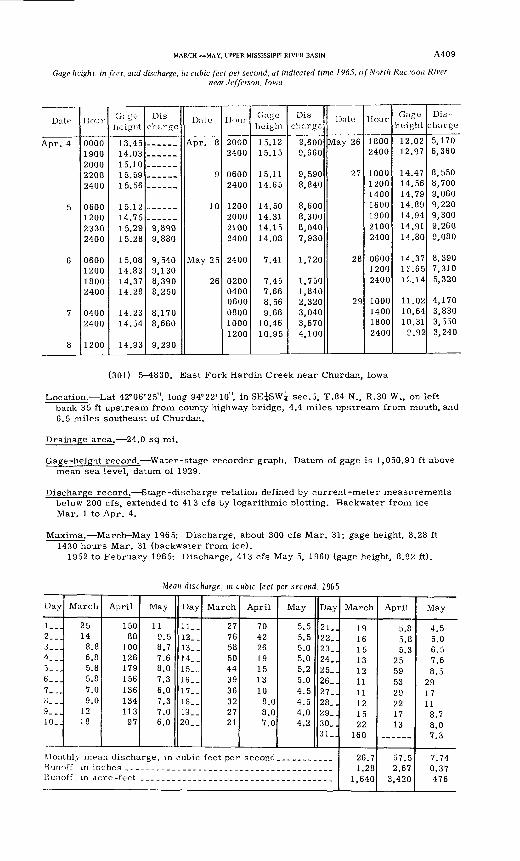
MARCH MAY, UPPER MISSISSIPPI RIVER BASIN A409
Gage height, in feet, and discharge, in cubic feet per second, at indicated time 1965, of North Raccoon Rivernear Jefferson, Iowa
Date
Apr. 4
5
6
7
8
Hour
00001900200022002400
0600120023302400
0600120018002400
04002400
1200
Gage height
i q 4 c1 O ,T O
14.0315.1015.5915.56
1^19 1 <j, l £
14.7515.2915.28
15.0814.8314.3714.28
14.2314.54
14.93
Dis -
charge
9,8909,880
9,5409,1308,3908,250
8,1708,660
9,290
Date
Apr. 8
9
10
May 25
26
Hour
20002400
06002400
1200200021002400
2400
020004000600080010001200
Gage height
15.1215.15
15.1114.65
14.5014.3114.1514.08
7.41
7.457.668.569.66
10.4610.95
Dis
charge
9,6009,660
9,5908,840
8,6008,3008,0407,930
1,720
1,7501,8402,3203,0403,6704,100
Date
May 26
27
28
29
Hour
18002400
1000120014001600190021002400
060012002400
1000140018002400
Gage height
12.0212.97
14.4714.5614.7914.8914.9414.9114.80
14.37IT. 6512.14
11.0210.6410.31
P. 92
Dis
charge
5,1706,360
8,5508,7009,0609,2209,3009,2609,080
8,3907,3105,320
4,1703,8303,5503,240
(301) 5-4830. East Fork Hardin Creek near Churdan, Iowa
Location. Lat 42°06'25", long 94°22'10", in SE^SWi sec.5, T.84 N., R.30 W., on left bank 35 ft upstream from county highway bridge, 4.4 miles upstream from mouth, and 6.5 miles southeast of Churdan.
Drainage area. 24.0 sq mi.
Gage-height record. Water-stage recorder graph. Datum of gage is 1,050.90 ft above mean sea level, datum of 1929.
Discharge record. Stage-discharge relation defined by current-meter measurements below 200 cfs, extended to 413 cfs by logarithmic plotting. Backwater from ice Mar. 1 to Apr. 4.
Maxima. March May 1965: Discharge, about 300 cfs Mar. 31; gage height, 8.28 ft 1430 hours Mar. 31 (backwater from ice).
1952 to February 1965: Discharge, 413 cfs May 5, 1960 (gage height, 8.92 ft).
Mean discharge, in cubic feel per second, 1965
Day
I...2...3...4...5_ - .6...7...J!--.y_._10..
March
2514
8.86.85.85.87.09.0
1218
April
15080
100126179156136134113
97
May
119.58.77.68.07.36.07.37.06.0
Day
11..12_.13__14__15..16__17..18_.19..20__
March
27765850443936322721
April
704226191513108.08.07.0
May
5.55.55.05.05.25.04.54.54.04.2
Day
21..22,.23..24. .25..26..27_.28..29_.30..31 ..
Monthly mean discharge, in cubic feet per second.. _________Runoff in inches.-.--- -Runoff, in acre -feet
March
19161513121111121522
160
26.71.28
1,640
April
5.85.85.3
25595329221713
57.52.67
3,420
May
4.55.06.57.68.5
291711
8.78.07.3
7.74O Q 7
476
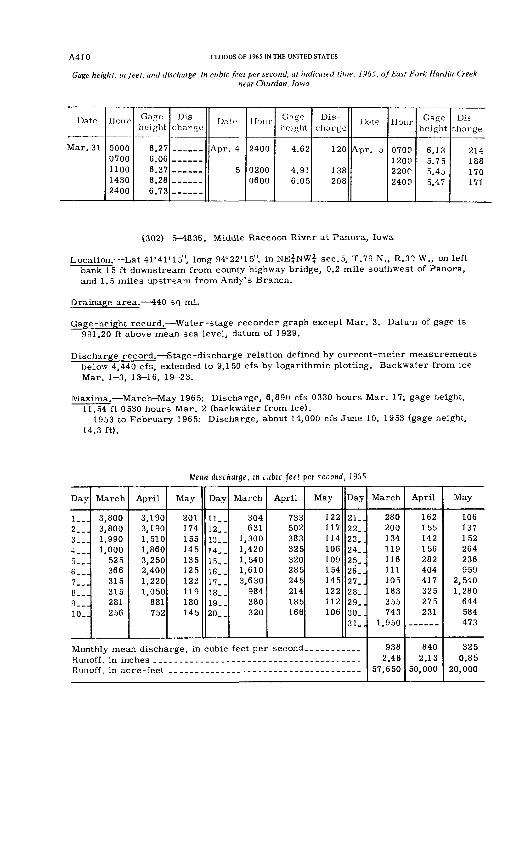
A410 FLOODS OF 1965 IN THE UNITED STATES
Gage height, in feet, and discharge, in cubic feet per second, at indicated time, 1965, of East Fork Hardin Creeknear Churdan, Iowa
Date
Mar. 31
Hour
00000700110014302400
Gage height
6.276.066.378.286.73
Dis charge
Date
5
I lour
2400
0600
Gage height
4.62
4 916.05
Dis
charge
120
1 QO
ono
Dc*te Hour
0700
22002400
Gage height
Dis charge
1 DD
170171
(302) 5 4836. Middle Raccoon River at Panora, Iowa
Location. Lat 41°41'15", long 94°22'15"J in NE^NW^ sec.5, T.79 N., R.3? W., on left bank 1 5 ft downstream from county highway bridge, 0.2 mile southwest of Panora, and 1.5 miles upstream from Andy's Branch.
Drainage area. 440 sq mi.
Gage-height record. Water-stage recorder graph except Mar. 3. Datu-n of gage is 991.20 ft above mean sea level, datum of 1929.
Discharge record. Stage-discharge relation defined by current-meter measurements below 4,440 cfs, extended to 9,150 cfs by logarithmic plotting. Backwater from ice Mar. 1-3, 13-16, 19-23.
Maxima. March-May 1965: Discharge, 6,890 cfs 0330 hours Mar. 17; gage height, 11.54 ft 0530 hours Mar. 2 (backwater from ice).
1953 to February 1965: Discharge, about 14,000 cfs June 10, 1953 (gage height, 14.3 ft).
Mean discharge, in cubic feet per second, 1965
Day
1...2...3...4...
6__.7...8___!9__ 110.-;
March
3,8003,8001,9901,000
525366315315281256
April
3,1903,1901,5101,8603,2502,4001,2201,050
881752
May
201174155145135125122119180145
Day
11__12. _13. _14. _15__16..17..18. _19__20..
March
304631
1,3001,4201,5401,6103,630
984380320
April
733502383325320285245214185166
May
122117114106109154145122112106
Day
21..22..23..24..2526_.27..28..29..30..31
Monthly mean discharge, in cubic feet per second. __________
Runoff, in acre -feet
March
280200134119116111105183355743
1,950
9382.46
57,650
April
162155142156282404417325275231
8402.13
50.000
May
106137152264236959
2,5401,280
644584473
3250.85
20,000
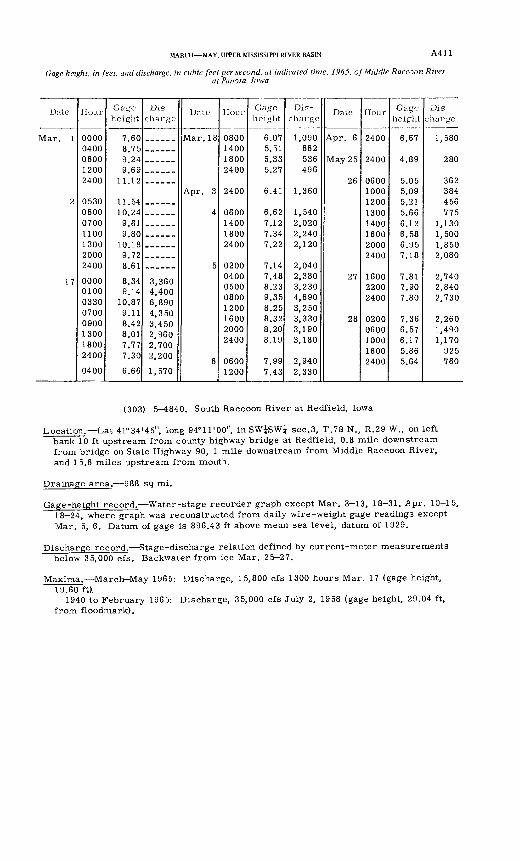
MARCH MAY. UPPER MISSISSIPPI RIVER BASIN A411
Gage height, in feet, and discharge, in cubic feet per second, at indicated time, 1965, of Middle Raccoon Riverat Panora, Iowa
Date
Mar 1
2
17
Hour
00000400060012002400
0530060007001100130020002400
0000 0100033007000900130018002400
0400
Gage height
7.608.759.249.69
11.12
11.5410.24
9.619.80
10.189.728.61
8.349.14
10.879.118.428.017.777.30
6.66
Dis
charge
3,360 4,4006,8904,3503,4502,9602,7002 200'
1,570
Date
Mar. 18
Apr. 3
4
5
6
Hour
0800140018002400
2400
0600140018002400
02000400 050008001200160020002400
06001200
Gage height
6.075.515.335.27
6.41
6.627.127.347.22
7.147.48 8.239.358.258.328.208.19
7.997.43
Dis
charge
1,090662536496
1,360
1,5402,0202,2402,120
2,0402,380 3,2304,6903,2503,3303,1903,180
2,9402,330
Date
Apr. 6
May 2 5
26
27
28
Hour
2400
2400
06001000120013001400160020002400
1600 22002400
02000600100016002400
Gage height
6.67
4.89
5.055.095.215.666.126.586.957.18
7.81 7.907.80
7.366.576.175.865.64
Dis
charge
1,580
280
362384456775
1,1301,5001,8502,080
2,740 2,8402,730
2,2601,4901,170
925760
(303) 5-4840. South Raccoon River at Redfield, Iowa
Location. Lat 41°34'45", long 94°11'00", in SW^SW^ sec.3, T.78 N., R.29 W., on left bank 10 ft upstream from county highway bridge at Redfield, 0.8 mile downstream from bridge on State Highway 90, 1 mile downstream from Middle Raccoon River, and 15.6 miles upstream from mouth.
Drainage area. 988 sq mi.
Gage-height record. Water-stage recorder graph except Mar. 3-13, 18-31, Apr. 10-15, 18-24, where graph was reconstructed from daily wire-weight gage readings except Mar. 5, 6. Datum of gage is 896.43 ft above mean sea level, datum of 1929.
Discharge record. Stage-discharge relation defined by current-meter measurements below 35,000 cfs. Backwater from ice Mar. 25 27.
Maxima. March-May 1965: Discharge, 15,800 cfs 1300 hours Mar. 17 (gage height, 19.60 ft).
1940 to February 1965: Discharge, 35,000 cfs July 2, 1958 (gage height, 29.04 ft, from floodmark).
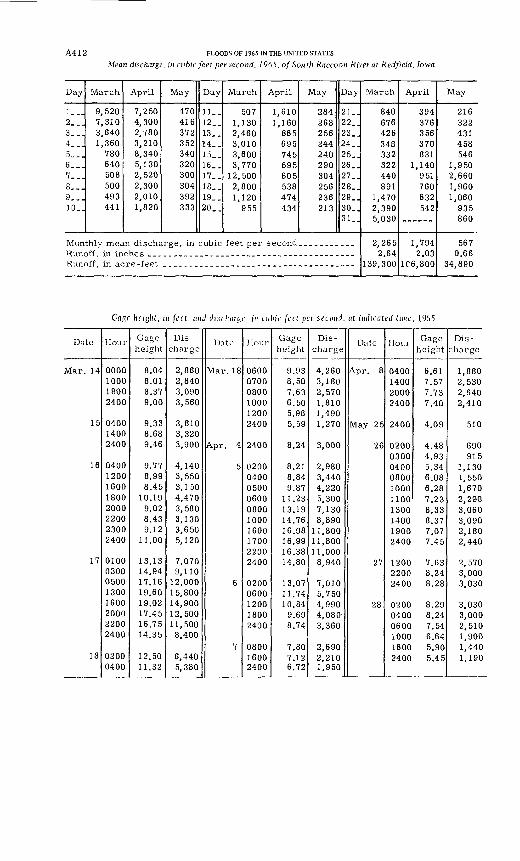
A412 FLOODS OF 1965 IN THE UNITED STATES
Mean discharge, in cubic feet per second, 1965, of South Raccoon River at Redfield, Iowa
Day
1-..2...3...4...5...6...7...8...9...10..
March
9,5207,3103,6401,360
780640508500493441
April
7,2504,3002,7803,2108,3405,1302,5202,3002,0101,820
May
470416372352340320300304392333
Day
11..12..13..14..15..16..17..18..19..20..
March
5071,1302,4603,0103,6003,770
12,5002,8001,120
955
April
1,6101,160
865695745695605538474434
May
284268256244240290304256236213
Day
21..22..23..24..25..26..27..28..29..30..31..
Monthly mean discharge, in cubic feet per second...........Runoff in inches _Runoff, in acre -feet
March
840676426348332322440891
1,4702,3905,030
2,2652.64
139,300
April
394376356370831
1,140951760632542
______
1,7942.03
106,800
May
216322431458546
1,9502,6601,9601,060
935860
5670.66
34,890
Cnjjf lirig/if, in feet, and rfisr/iiiryc, in cubic feet per second, nt indicated time, 1965
Date
Mar. 14
15
16
17
18
Hour
0000100018002400
040014002400
04001200160018002000220023002400
01000300050013001600200022002400
02000400
Gage height
8.048.018.379.00
9.338.689.46
9.778.998.45
10.199.028.439.12
11.00
13.1314.9417.1619.6019.0217.4516.7514.35
12.5011.32
Dis
charge
2,8602,8403,0903,560
3,8103,3203,900
4,1403,5503,1504,4703,5803,1303,6505,120
7,0709,110
12,00015,80014,90012,50011,5008,400
6,4405,380
Date
Mar. 18
Apr. 4
5
6
7
Hour
060007000800100012002400
2400
0200040005000600080010001600170022002400
02000600120018002400
080016002400
Gage height
9.938.507.636.505.985.59
8.24
8.218.849.87
11.2313.1914.7616.9816.9916.3814.80
13.0711.7410.84
9.698.74
7.807.126.72
Dis
charge
4,2603,1802,5701,8101,4901,270
3,000
2,9803,4404,2205,3007,1308,890
11,80011,80011,0008,940
7,0105,7504,9904,0803,360
2,6902,2101,950
Date
Apr. 8
May 25
26
27
28
Hour
0400140020002400
2400
020003000400080010001100
Gage height
6.617.577.737.40
4.09
4.484.935.346.086.287.23
1300 8.331400 8.371900 7.072400 7.45
1200 7.632200 8.242400 8.28
0200 8.290400 8.240600 7.541000 6.641600 5.902400 5.45
Dis
charge
1,8802,5302,6402,410
510
690915
1,1301,5501,6702,2903,0603,0902,1802,440
2,5703,0003,030
3,0303,0002,5101,9001,4401,190
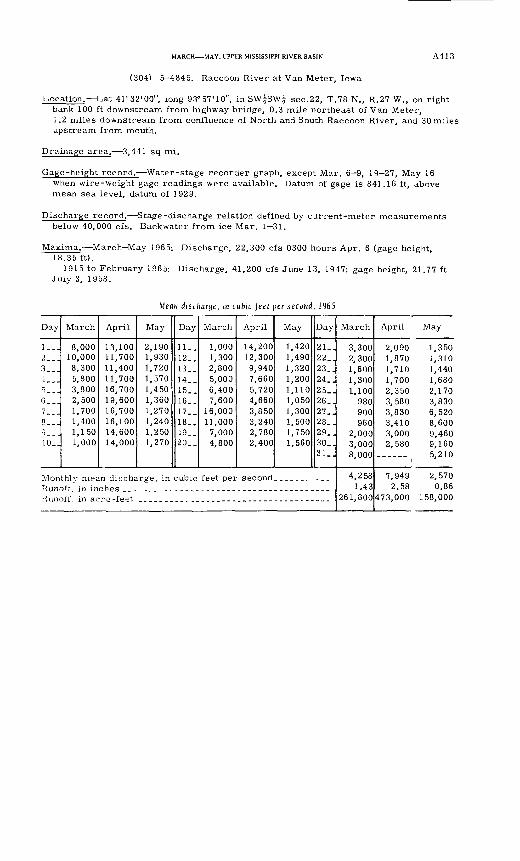
MARCH MAY, UPPER MISSISSIPPI RIVER BASIN
(304) 5 4845. Raccoon River at Van Meter, Iowa
A413
Location. Lat 41°32'00", long 93°57'10", in SW^SW^ sec.22, T.78 N., R.27 W., on right bank 100 ft downstream from highway bridge, 0.3 mile northeast of Van Meter, 1.2 miles downstream from confluence of North and South Raccoon River, and 30 miles upstream from mouth.
Drainage area. 3,441 sq mi.
Gage-height record.- Water-stage recorder graph, except Mar. 6 9, 19 27, May 16 when wire-weight gage readings were available. Datum of gage is 841.16 ft, above mean sea level, datum of 1929.
Discharge record. Stage-discharge relation defined by current-meter measurements below 40,000 cfs. Backwater from ice Mar. 1 31.
Maxima. March-May 1965: Discharge, 22,300 cfs 0300 hours Apr. 6 (gage height, 18.35 ft).
1915 to February 1965: Discharge, 41,200 cfs June 13, 1947; gage height, 21.77 ft July 3, 1958.
Mean discharge, in cubic feel per second, 1965
Day
1__.2...3...4. __S_ _.6...7...8...9___10_.
March
8,00010,0008,3005,8003,8002,5001,7001,4001,1501,000
April
13,10011,70011,40011,70016,70019,60016,70016,10014,60014,000
May
2,1901,9301,7201,5701,4501,3601,2701,2401,2501,270
Day
11..12..13..14. _15..16..17..18..19--20. _
March
1,0001,3002,8005,0006,4007,600
16,00011,000
7,0004,800
April
14,20012,3009,9407,6605,7204,6603,8503,2402,7802,400
May
1,4201,4901,3201,2001,1101,0501,3001,5001,7501,560
Day
21..22..23,.24,.25_J26. j27..28..29.J30.]31..
Monthly mean discharge, in cubic feet per second.. _________Runoff in inches _ ______Runoff, in acre -feet
March
3,3002,3001,6001,3001,100
980900960
2,0003,0008,000
4,2581.43
261,800
April May
2,090 1,3501,870 1,3101,710 1,4401,700 1,6802,350 2,1703,580 3,8303,830 6,5203,410 8,6003,000 9,4602,580 9,160
_____ 5,210
7,949 2,5702.58 0.86
473,000 158,000
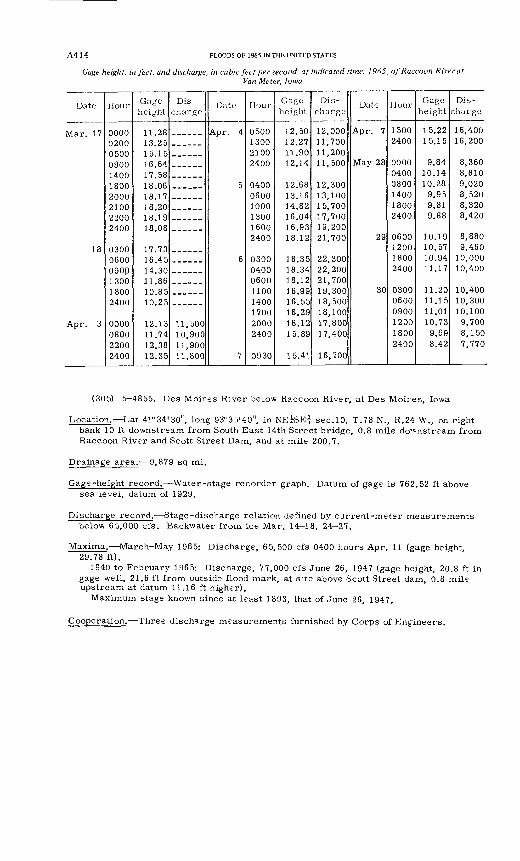
A4 14 FLOODS OF 1965 IN THE UNITED STATES
Gage height, in feet, and discharge, in cubic feet per second, at indicated time, 1965, of Raccoon River atVan Meter, Iowa
Date
18
Apr. 3
Hour
0200
0900140018002000210022002400
03000600090P130018002400
0000 0800 2200 2400
Gage height
11.2813.2515.1516.6417.5818.0618.1718.2018.1918.08
1 7 7 1}
16.4514.3011.8610.8510.25
12.13 11.74 12.38 12.35
Dis
charge
11,500 10,900 11,900 11,800
Date
Apr. 4
5
6
7
Hour
0500130021002400
040006001000130016002400
030004000600110014001700 2000 2400
0930
Gage height
12.5012.2711.9012.14
12.6813.1614.8216.0416.9318.12
18.3518.3418.1216.9916.5516.29 16.12 15.89
15.41
Dis
charge
12,00011,70011,20011,500
12,30013,10015,70017,70019,20021,700
22,30022,20021,70019,30018,50018,100 17,800 17,400
16,700
Date
Apr. 7
May 28
29
30
Hour
15002400
000004000800140018002400
0600 120018002400
030006000900 1200 1800 2400
Gage height
15.2215.15
9.8410.1410.28
9.959.819.88
10.19 10.5710.9411.17
11.2011.1511.01 10.73
9.69 8.42
Dis
charge
16,40016,200
8,3608,8109,0208,5208,3208,420
8,880 9,460
10,00010,400
10,40010,30010,100 9,700 8,150 7,770
(305) 5 4855. Des Moines River below Raccoon River, at Des Moires, Iowa
Location. Lat 41°34'30", long 93°35'40", in NE^SE^ sec.10, T.78 N., R.24 W., on right bank 10 ft downstream from South East 14th Street bridge, 0.8 mile downstream from Raccoon River and Scott Street Dam, and at mile 200.7.
Drainage area. 9,879 sq mi.
Gage-height record. Water-stage recorder graph. Datum of gage is 762.52 ft above sea level, datum of 1929.
Discharge record. Stage-discharge relation defined by current-meter measurements below 65,000 cfs. Backwater from ice Mar. 14-18, 24 27.
Maxima. March-May 1965: Discharge, 65,500 cfs 0400 hours Apr. 11 (gage height, 29.78 ft).
1940 to February 1965: Discharge, 77,000 cfs June 26, 1947 (gage height, 20.8 ft in gage well, 21.6 ft from outside flood mark, at site above Scott Street dam, 0.8 mile upstream at datum 11.16 ft higher).
Maximum stage known since at least 1893, that of June 26, 1947.
Cooperation. Three discharge measurements furnished by Corps of Engineers.
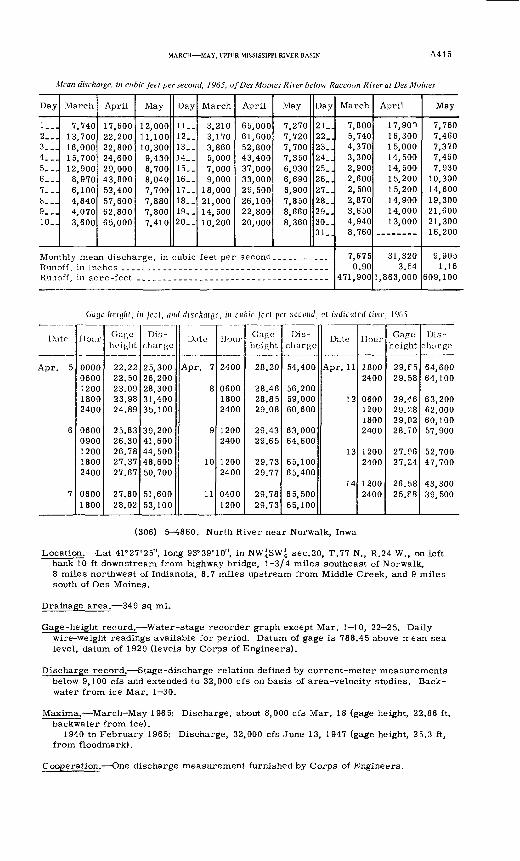
MARCH MAY, UPPER MISSISSIPPI RIVER BASIN A415
Mean discharge, in cubic feet per second, 1965, ofDes Moines River below Raccoon River at Des Moines
Day
1...2___3...4...5...6...7...8...9...10..
March
7,74013,70016,00015,70012,9008,9706,1004,8404,0703,600
April
17,60022,20022,80024,60029,00043,80052,40057,60062,80065,000
May
12,00011,10010,3009,4308,7008,0407,7007,8807,8007,410
Day
11..12..13..14..15..16..17..18. _19..20..
March
3,2103,1703,8605,0007,0009,000
18,00021,00014,50010,200
April
65,00061,60052,80043,40037,00033,00029,50026,10022,80020,000
May
7,2707,7207,7007,3506,9306,6906,9007,8508,6608,360
Day
21_.22..23..24..25..26..27..28..29..30..31..
Monthly mean discharge, in cubic feet per second... .._____.
Runoff, in acre -feet
March
7,8005,7404,3703,3002,9002,6002,5002,8703,6504,9408,760
7,6750.90
471,900
April
17,90116,30015,00014,50014,50015,20015,20014,90014,00013,000
31,3203.54
1,863,ODO
May
7,7607,4607,3707,4607,930
10,30014,60019,30021,60021,30016,200
9,9051.16
609,100
Gngc lififjfit, in feel, and discharge, in cubic fed per second, al indicalcd lime, l%5
Date
Apr. 5
6
7
Hour
00000600120018002400
06000900120018002400
06001800
Gage height
22.2222.5023.0923.9824.89
25.8326.3026.7827.3727.67
27.8028.02
Dis
charge
25,30026,20028,30031,40035,100
39,20041,60044,50048,60050,700
51,60053,100
Date
Apr. 7
8
9
10
11
Hour
2400
060018002400
12002400
12002400
04001200
Gage height
28.20
28.4628.8529.08
29.4329.65
29.7329.77
29.7829.73
Dis
charge
54,400
56,20059,00060,600
63,00064,600
65,10065,400
65,50065,100
Date
Apr. 11
12
13
14
Hour
18002400
0600120018002400
12002400
12002400
Gage height
29.C529.58
29.4629 2829.0228. TO
27. ?627.24
26.5825. P8
Dis
charge
64,60064,100
63,20062,00060,10057,900
52,70047,700
43,30039,500
(306) 5-^860. North River near Norwalk, Iowa
Location. Lat 41°27'25", long 93°39'10", in NW^SW^ sec.20, T.77 N., R.24 W., on left bank 10 ft downstream from highway bridge, 1-3/4 miles southeast of Norwalk, 8 miles northwest of Indianola, 8.7 miles upstream from Middle Creek, and 9 miles south of Des Moines.
Drainage area. 349 sq mi.
Gage-height record. Water-stage recorder graph except Mar. 1 10, 22 25. Daily wire-weight readings available for period. Datum of gage is 788.45 above rrean sea level, datum of 1929 (levels by Corps of Engineers).
Discharge record. Stage-discharge relation defined by current-meter measurements below 9,100 cfs and extended to 32,000 cfs on basis of area-velocity studies. Back water from ice Mar. 1 30.
Maxima. March-May 1965: Discharge, about 8,000 cfs Mar. 18 (gage height, 22.86 ft, backwater from ice).
1940 to February 1965: Discharge, 32,000 cfs June 13, 1947 (gage height, 25.3 ft, from floodmark).
Cooperation. One discharge measurement furnished by Corps of Engineers.
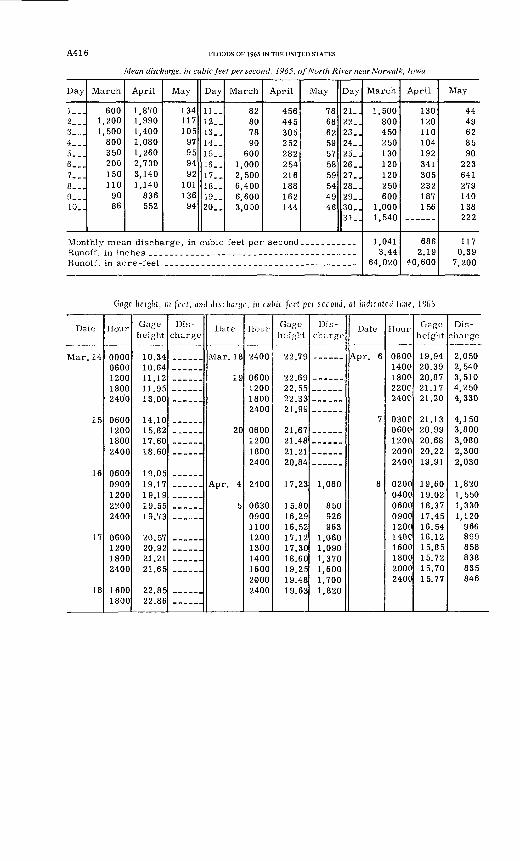
A4 1 6 FLOODS OF 1965 IN THE UNITED STATES
Mean discharge, in cubic feet per second, 1965, of North River near Norwalk, Iowa
Day
1__.2___3...4___5...6...7...8._.9...10..
March
6001,2001,500
800350200150110
9086
April
1,8701,9901,4001,0801,2602,7303,1401,140
836552
May
134117105
97959492
101136
94
Day
11..12..13..14..15..16..17..18..19-.20.,
March
82807890
6001,0002,5006,4006,6003,000
April
456445305252282254216188162144
May
78686259575859544946
Day
21..22_.23..24..25..26..27..28..29..30_.31_.
Runoff in inchesRunoff, in acre -feet
March
1,500800450250130120120250600
1,0001,540
1,0413.44
64,020
April
130120110104192341305232187156
______
6862.19
40,600
May
4449628590
223641279140138222
1170.39
7,200
Grigr //eight, in feel, ami rfisrlwgc, m cubic feet per second, at indicated time, 1965
Date
Mar 14
15
16
17
18
Hour
00000600120018002400
0600120018002400
06000900120022002400
0600120018002400
16001800
Gage height
10.3410.6411 1211 9513.00
14.1015.8217.6018.60
19.0519.1719.1919.5519.73
20.5720.9221.2121.65
22.8522.86
Dis
chargeDate
Mar. 18
1 Q
20
5
Hour
2400
0600120018002400
0600120018002400
2400
063009001100 12001300140016002000 2400
Gage height
22.79
22 6922.5522.3321.99
21.6721.4821.2120.84
17.23
15.8016.2916.52 17.1217.3018.6019.2519.48 19.63
Dis
charge
1,080
850926963
1,0601,0901,3701,6001,700 1,820
Date
Apr. 6
7
8
Hour
080014001800220C240C
030C0600120020002400
02000400060009001200 140C1600180020002400
Gage height
19.9420.3920.8721.1721.20
21.1320.9920.6820.2219.91
19.6019.0218.3717.4516.54 16.1215.8515.7215.7015.77
Dis
charge
2,0502,5403,5104,2504,330
4,1503,8003,0802,3002,030
1,8201,5501,3301,120
966 899858838835846
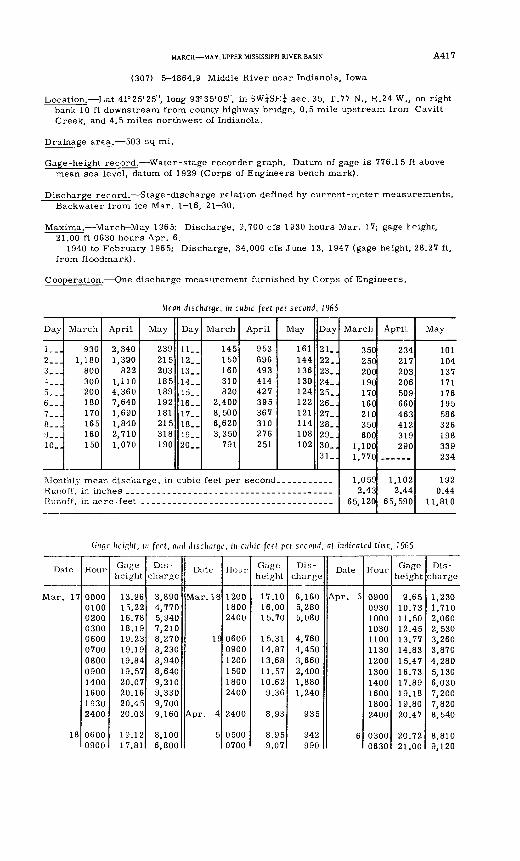
MARCH MAY, UPPER MISSISSIPPI RIVER BASIN
(307) 5 4864.9 Middle River near Indianola, Iowa
A417
Location. Lat 41°25'25", long 93°35'05", in SW^SE^ sec. 35, T.77 N., R.24 W., on right bank 10 ft downstream from county highway bridge, 0.5 mile upstream frorr Cavitt Creek, and 4.5 miles northwest of Indianola.
Drainage area. 503 sq mi.
Gage-height record. Water-stage recorder graph. Datum of gage is 776.15 ft above mean sea level, datum of 1929 (Corps of Engineers bench mark).
Discharge record. Stage-discharge relation defined by current-meter measurements. Backwater from ice Mar. 1 16, 21 30.
Maxima. March-May 1965: Discharge, 9,700 cfs 1930 hours Mar. 17; gage height, 21.00 ft 0630 hours Apr. 6.
1940 to February 1965: Discharge, 34,000 cfs June 13, 1947 (gage height. 28.27 ft, from floodmark).
Cooperation. One discharge measurement furnished by Corps of Engineers.
Mean discharge, in cubic feet per second, 1965
Day
1__.2...3...4...5...6__.7...8...9...10..
March
9301,180
800300200180170165160150
April
2,3401,390
8221,1104,3607,6401,6901,8402,7101,070
May
239215203185189192181215318190
Day
11.-12..13. _14..15_.16. _17-_18__19-.20._
March
145150160310820
2,4008,5006,6203,350
791
April
953696493414427395367310276251
May
161144136130124122121114108102
Day
21..22..23..24. .25..26..27_.28_.29_.30..31_.
Monthly mean discharge, in cubic feet per second...........Runoff in inchesRunoff, in acre -feet
March
350250200190170160210350600
1,1001,770
1,0592.43
65,120
April
234217203206509660463412319290
1,1022.44
65,590
May
101104137171176195586326198339234
1920.44
11,810
flgr lidglit, in feet, mid discharge, in cubic feet per second, nt indicated time, 1965
Date
Mar. 17
18
Hour
000001000200030006000700080009001400160019302400
06000900
Gage height
13.9615.2216.7818.1919.2319.1919.8419.5720.0720.1620.4520.03
19.1217.81
Discharge
3,8904,7705,9407,2108,2708,2308,9408,6409,2109,3309,7009,160
8,1006,800
Date
Mar. 18
19
Apr. 4
5
Hour
120018002400
060009001200150018002400
2400
05000700
Gage height
17.1016.0015.70
15.3114.8713.6811.5710.629.36
8.93
8.959.07
Dis
charge
6,1605,2805,080
4,7604,4503,6602,4001,8801,240
935
942990
Date
Apr. 5
6
Hour
090009301000103011001130120013001400160018002400
03000630
Gage height
9.6510.7311.5012.4513.7714.8315.4716.7317.8919.1819.8020.47
20.7221.00
Dis charge
1,2301,7102,0602,5303,2603,8704,2805,1306,0307,2007,8208,540
8,8109,120
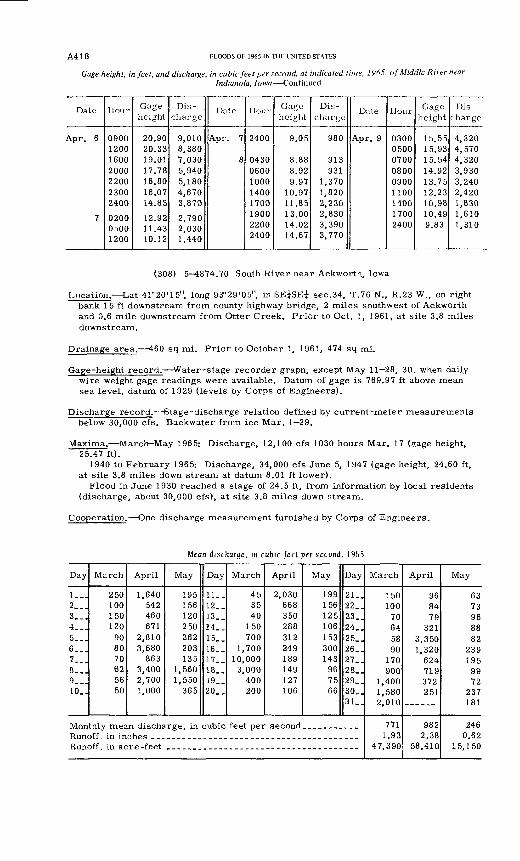
A418 FLOODS OF 1965 IN THE UNITED STATES
Gage height, in feet, and discharge, in cubic feet per second, at indicated time, 1965, of Middle River near Indianola, Iowa Continued
Date
Apr. 6
7
Hour
0900120016002000220023002400
020005001200
Gage height
20.9020.3319.0117.7816.8016.0714.83
12.9211.4310.12
Dis charge
9,0108,3807,0305,9405,1804,6703,870
2,7902,0301,440
Date
Apr. 7
8
Hour
2400
04300600100014001700190022002400
Gage height
9.05
8.888.929.97
10.9711.8513.0014.0214.67
Dis
charge
980
913931
1,3701,8202,2302,8303,3903,770
Date
Apr. 9
Hour
030005000700080009001100140017002400
Gage height
15.5515.9315.5414.9213.7512.2310.9810.499.83
Dis charge
4,3204,5704,3203,9303,2402,4201,8301,6101,310
(308) 5-4874.70 South River near Ackworth, Iowa
Location. Lat 41°20'15", long 93°29'05", in SE^SE^ sec.34, T.76 N., R.23 W., on right bank 1 5 ft downstream from county highway bridge, 2 miles southwest of Ackworth and 0.6 mile downstream from Otter Creek. Prior to Oct. 1, 1961, at site 3.8 miles downstream.
Drainage area. 460 sq mi. Prior to October 1, 1961, 474 sq mi.
Gage-height record. Water-stage recorder graph, except May 11 28, 30, when daily wire weight gage readings were available. Datum of gage is 769.97 ft above mean sea level, datum of 1929 (levels by Corps of Engineers).
Discharge record. Stage-discharge relation defined by current-meter measurements below 30,000 cfs. Backwater from ice Mar. 1 29.
Maxima. March-May 1965: Discharge, 12,100 cfs 1030 hours Mar. 17 (gage height, 25.47 ft).
1940 to February 1965: Discharge, 34,000 cfs June 5, 1947 (gage height, 24.60 ft, at site 3.8 miles down stream at datum 8.01 ft lower).
Flood in June 1930 reached a stage of 24.5 ft, from information by local residents (discharge, about 30,000 cfs), at site 3.8 miles down stream.
Cooperation. One discharge measurement furnished by Corps of Engineers.
Mean discharge, in cubic feet per second, 1965
Day
1__.2___3__.4__.5...6...7...8...9...10_.
March
250100150120
908070625650
April
1,640542460671
2,8103,680
8633,4002,7001,000
May
195156120250262203135
1,5601,550
365
Day
11..12-.13. _14. _15__16__17__18..19_.20_.
March
453540
150700
1,70010,0003,000
400200
April
2,030668350288312249189149127106
May
199156125106153300143
967566
Day
21_.22..23_.24_.25..26_.27..28..29..30_.31..
Monthly mean discharge, in cubic feet per second.. _________Runoff, in inches ___ _______Runoff, in acre -feet
March
150100
70645890
170900
1,4001,5802,010
7711.93
47,390
April
968479
3213,3501,320
624719372251
9822.38
58,410
May
6373968882
239195
9972
237181
2460.62
1 5, 1 50
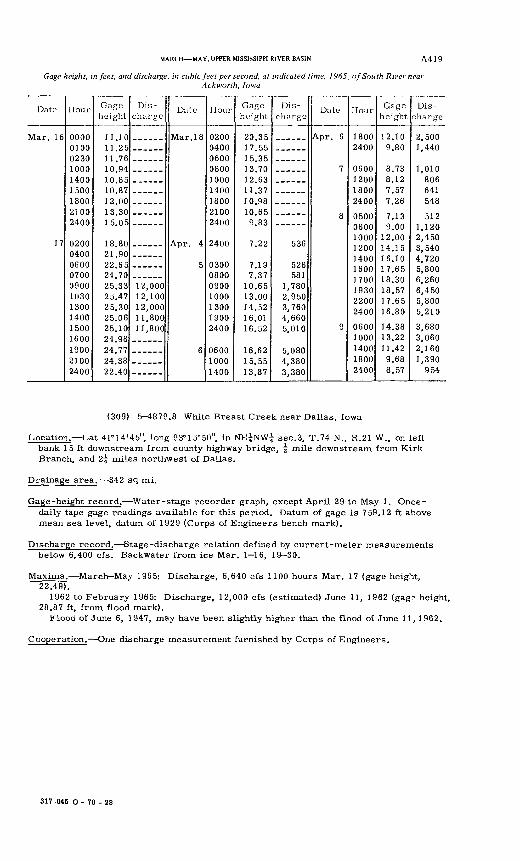
MARCH MAY, UPPER MISSISSIPPI RIVER BASIN A419
Gage height, in feet, and discharge, in cubic feet per second, at indicated time, 1965, of South River nearAckworth, Iowa
Date
Mar. 16
17
Hour
00000100n9^n100014001500180021002400
02000400060007000900 1030 1300 1400 1500 1600190021002400
Gage height
11.1011.2511.7610 9410.8510.8712.001 ^ ^n1505
18.8091 Q(l
99 fi E\
24.7025.33 25.47 25.30 25.06 25.10 24.9824.7724.3822.40
Dis charge
12,000 12,100 12,000 11,800 11,800
Date
Mar. 18
Apr. 4
5
6
Hour
020004000600080010001400180021002400
2400
030008000900 1000 1300 1900 2400
060010001400
Gage height
20.3517.551 i ^1 ^ 7fl
12.6311.3710.9810.65
Q FC3
7 99
719
7.3710.65 13.00 14.52 16.01 16.52
16.6215.5513.87
Dis
charge
536
528581
1,780 2,950 3,760 4,660 5,010
5,0804,3803,380
Date
Apr. 6
7
8
9
Hour
18002400
0600120018002400
05000800 10001200140016001700 1930 2200 2400
0600 1000140018002400
Gage height
12.109.80
8.738.127.577.26
7.139.00
12.0014.1516.1017.6518.30 18.57 17.65 16.80
14.38 13.2211.429.688.57
Dis charge
2,5001,440
1,010806641548
5121,120 2,4503,5404,720
6,260 6,450 5,800 5,210
3,680 3,0602,1601,390
954
(309) 5 1879.8 White Breast Creek near Dallas, Iowa
Location. Lat 41°14'45", long 93°15'50", in NE^NW^ sec.3, T.74 N., R.21 W., on left bank 1 5 ft downstream from county highway bridge, \ mile downstream from Kirk Branch, and 1\ miles northwest of Dallas.
Drainage area. 342 sq mi.
Gage-height record. Water-stage recorder graph, except April 29 to May 1. Once- daily tape gage readings available for this period. Datum of gage is 759.12 ft above mean sea level, datum of 1929 (Corps of Engineers bench mark).
Discharge record. Stage-discharge relation defined by current-meter measurements below 6,400 cfs. Backwater from ice Mar. 1-16, 19 30.
Maxima. March May 1965: Discharge, 6,640 cfs 1100 hours Mar. 17 (gage height, 22.49).
1962 to February 1965: Discharge, 12,000 cfs (estimated) June 11, 1962 (gag? height, 28.87 ft, from flood mark).
Flood of June 6, 1947, may have been slightly higher than the flood of June 11, 1962.
Cooperation. One discharge measurement furnished by Corps of Engineers.
317-045 O - 70 - :
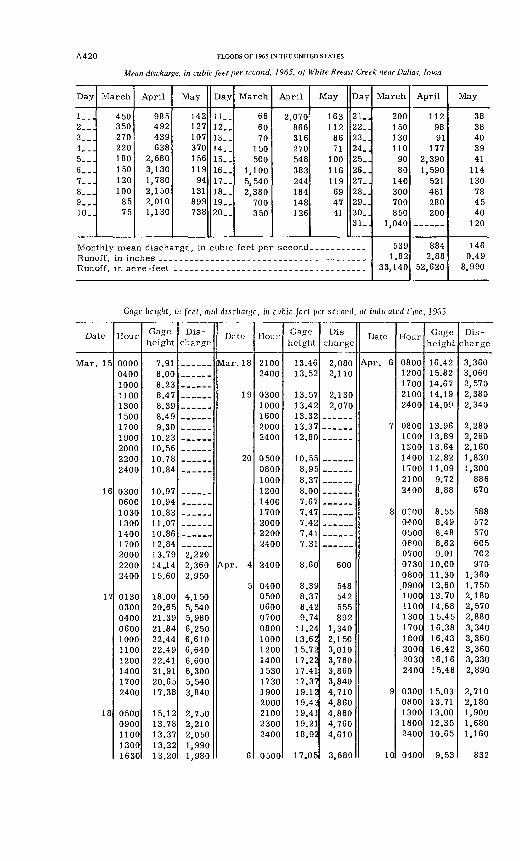
A4 2 0 FLOODS OF 1965 IN THE UNITED STATES
Mean discharge, in cubic feet per second, 1965, of White Breast Creek near Dallas, Iowa
Day
1...2___3...4...5___6...7___8...9-_-10..
March
450350270220180150120100
8575
April
985492439638
2,6803,1301,7802,1502,0101,130
May
142127107370156119
94131899738
Day
11..12..13..14..15..16..17..18..19._20..
March
666070
150500
1,1005,5402,380
700350
April
2,070866316270548383244184148126
May
163112
8671
100116119
694741
Day
21..22..23..24..25_.26,.27..28..29..30..31
Runoff, in acre -feet
March
200150130110
9080
140300700850
1,040
5391.82
33,140
April
1129891
1772,3901,590
521481280200
8842.88
52,620
May
3838403941
114130
784540
120
1460.49
8,990
height, in feel, and discharge, in cubic fed per second, al indicated t'wc, 1965
Date
Mar. 15
16
17
18
Hour
00000400100011001300150017001900200022002400
0300060010301300140017002000 2200 2400
0130 0300 0400 0600 1000 1100 1200 1400 1700 2400
0500 0900 1100 1300 1630
Gage height
7.918.008.238.478.398 499 Ofl
10.2310.5610.7810.84
10.9710.9410.8311.0710.8612.8413.79 14J4 15.60
18.00 20.65 21.39 21.84 22.44 22.49 22.41 21.91 20.65 17.38
15.12 13.78 13.37 13.22 13.20
Dis
charge
2,220 2,360 2,950
4,150 5,540 5,980 6,250 6,610 6,640 6,600 6,300 5,540 3,840
2,750 2,210 2,050 1,990 1,980
Date
Mar. 18
19
20
Apr. 4
5
6
Hour
21002400
03001000160020002400
050008001000120014001700200022002400
2400
0400 0500 0600 0700 0800 1000 1200 1400 1530 1730 1900 2000 2100 2300 2400
0500
Gage height
13.4613.52
13.5713.4213.3213.3712.80
10.558.958.378.007.677.477.427.417.31
8.60
8.39 8.37 8.42 9.74
11.24 13.62 15.72 17.22 17.41 17.37 19.12 19.43 19.41 19.21 18.92
17.05
Dis
charge
2,0802,110
2,1302,070
600
548 542 555 892
1,340 2,150 3,010 3,760 3,860 3,840 4,710 4,860 4,860 4,760 4,610
3,680
Date
Apr. 6
7
8
9
10
Hour
08001200170021002400
08001COO12001400170021002<?00
oroo04000500oeoo0700 0730 0800 0900 1000 1100 1300 1700 1800 2000 2030 2400
0300oaoo1300 1800 2400
0400
Gage height
16.4215.8214.6714.1914.09
13.9613.8913.6412.8211.09
9.728.88
8.558.498.488.629.01
10.00 11.30 12.60 13.70 14.68 15.45 16.38 16.43 16.42 16.16 15.48
15.03 13.71 13.00 12.35 10.65
9.53
Dis
charge
3,3603,0602,5702,3802,340
2,2802,2602,1601,8301,300
886670
588572570605702 970
1,360 1,750 2,180 2,570 2,880 3,340 3,360 3,360 3,230 2,890
2,710 2,180 1,900 1,680 1,160
832
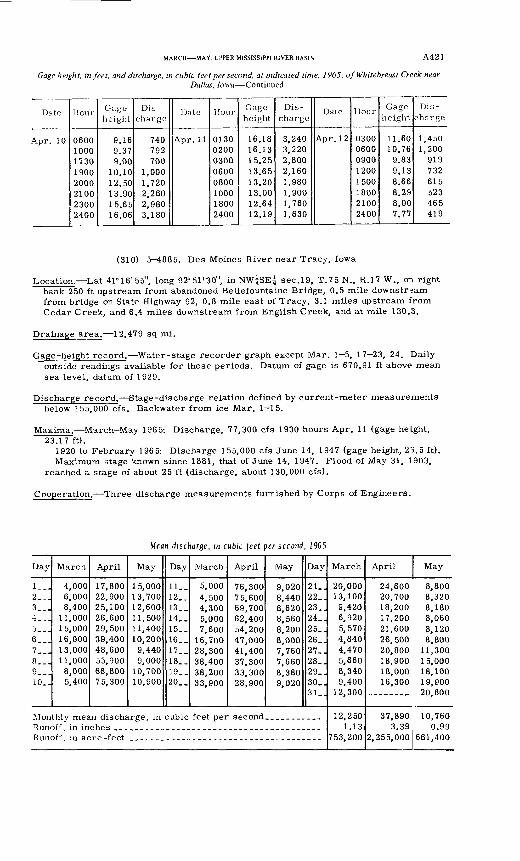
MARCH MAY, UPPER MISSISSIPPI RIVER BASIN A421
Gage height, in feet, and discharge, in cubic feet per second, at indicated time, 1965, of Whitebreast Creek nearDallas, Iowa Continued
Date
Apr. 10
Hour
06001000173019002000210023002400
Gage height
9.169.379.00
10.1012.5013.9015.6516.06
Dis charge
740792700
1,0001,7202,2602,9803,180
Date
Apr. 11
Hour
01300200030006000800100018002400
Gage height
16.1816.1315.2513.6513.2013.0012.6412.19
Dis
charge
3,2403,2202,8002,1601,9801,9001,7601,630
Date
Apr. 1 2
Hour
03000600090012001500180021002400
Gage heigh4.
11.6010.769.839.138.668.298.007.77
Dis
charge
1,4501,200
919732615523465419
(310) 5 4885. Des Moines River near Tracy, Iowa
Location. Lat 41°16' 55", long 92°51'30", in NWjSEj sec.19, T.75 N., R.17 W., on right bank 250 ft upstream from abandoned Bellefountaine Bridge, 0.5 mile downstream from bridge on State Highway 92, 0.8 mile east of Tracy, 3.1 miles upstream from Cedar Creek, and 6.4 miles downstream from English Creek, and at mile 130.3.
Drainage area. 12,479 sq mi.
Gage-height record. Water-stage recorder graph except Mar. 1 5, 17 23, 24. Daily outside readings available for these periods. Datum of gage is 670.91 ft above mean sea level, datum of 1929.
Discharge record. Stage-discharge relation defined by current-meter measurements below 155,000 cfs. Backwater from ice Mar. 1 15.
Maxima. March-May 1965: Discharge, 77,300 cfs 1930 hours Apr. 11 (gage height, 23.17 ft).
1920 to February 1965: Discharge 155,000 cfs June 14, 1947 (gage height, 23.5 ft). Maximum stage known since 1881, that of June 14, 1947. Flood of May 31, 1903,
reached a stage of about 25 ft (discharge, about 130,000 cfs).
Cooperation. Three discharge measurements furnished by Corps of Engineers.
Mean discharge, in cubic feet per second, 1965
Day
!_.-2...3...~* _ _ -
5...6...7...8...9...10. .
March
4,0006,0008,400
11,00015,00016,00013,00011,0008,0005,400
April
17,80022,90025,10026,60029,50039,40048,60055,90066,80075,300
May
15,00013,70012,60011,50011,40010,200
9,4409,000
10,70010,900
Day
11. _12. _13. _14. _15_.16..17..18..19-.20__
March
5,0004,5004,3005,0007,600
16,70028,30038,40038,20033,900
April
76,30075,60069,70062,40054,20047,00041,40037,30033,30028,900
May
9,0208,4408,6208,5608,2008,0007,7607,6608,3809,020
Day
21..22..23..24..25..26..27..28..29..30..31..
Runoff in inchesRunoff, in acre -feet
March
20,00013,1009,4206,9205,5704,8404,4705,6608,3409,400
12,300
12,2501.13
753,200
April
24,60020,70018,20017,20021,60026,50020,80018,90018,00016,300
------
37,8903.39
2,255,000
May
8,8008,3208,1808,0608,1208,800
11,30015,00018,10019,90020,800
10,7600.99
661,400
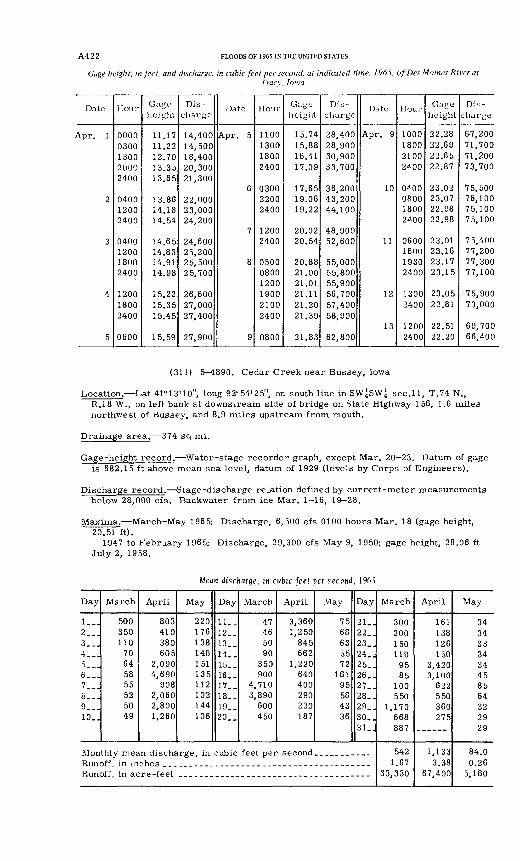
A422 FLOODS OF 1965 IN THE UNITED STATES
Gage height, in feet, and discharge, in cubic feet per second, at indicated time, 1965, of Des Moines River atTracy, Iowa
Date
Apr. 1
2
3
4
5
Hour
00000300130020002400
040012002400
0400120018002400
120018002400
0600
Gage-
height
11.1711.2212.7013.3513.65
13.8614.1814.54
14.6514.8314.9114.98
15.2215.3515.45
15.59
Dis charge
14,40014,50018,40020,30021,300
22,00023,00024,200
24,60025,20025,50025,700
26,60027,00027,400
27,900
Date
Apr. 5
6
7
8
9
Hour
1100130018002400
030022002400
12002400
050008001200190021002400
0800
Gage height
15.7415.8816.4117.09
17.6519.0619.22
20.0220.54
20.8821.0021.0121.1121.2021.39
21.83
Dis charge
28,40028,90030,90033,700
36,20043,20044,100
48,90052,600
55,00055,80055,90056,70057,40058,900
62,800
Date
Apr. 9
10
11
12
13
Hour
1000180021002^00
0^00080018002^00
0600160019302400
13002400
12002400
Gage height
22.2822.6922.6522.87
23.0223.0722.9822.98
23.0123.1623.1723.15
23.0522.81
22.5122.20
Dis charge
6-7,20071,70071,20073,700
75,50076,10075,10075,100
75,40077,20077,30077,100
75,90073,000
69,70066,400
(311) 5-4890. Cedar Creek near Bussey, Iowa
Location, Lat 41°13'10", long 92°54'25", on south line in SW^SW^ sec.11, T.74 N., R.18 W., on left bank at downstream side of bridge on State Highway 156, 1.6 miles northwest of Bussey, and 8.9 miles upstream from mouth.
Drainage area. 374 sq mi.
Gage-height record. Water-stage recorder graph, except Mar. 20 23. Datum of gage is 682.15 ft above mean sea level, datum of 1929 (levels by Corps of Engineers).
Discharge record. Stage-discharge relation defined by current-meter measurements below 28,000 cfs. Backwater from ice Mar. 1-16, 19-28.
Maxima. March May 1965: Discharge, 6,500 cfs 0100 hours Mar. 18 (gage height, 20.51 ft).
1947 to February 1965: Discharge, 29,300 cfs May 9, 1950; gage height, 28.06 ft July 2, 1958.
Mean discharge, in cubic feet per second, 1965
Day
1__.2...3...4...5...6___7...8...9___10..
March
500350110
70645855525049
April
803410380605
2,0904,690
9082,0602,8001,260
May
220176138140151135112102144106
Day
11..12. _13..14..15._16. _17..18__19_.20..
March
47465090
350900
4,7103,890
600450
April
3,3601,250
845662
1,220640400290220187
May
7568635572
16195584336
Day
21..22_.23..24..25..26..27..28..29..30..31
Monthly mean discharge, in cubic feet per second. __________Runoff in inchesRunoff, in acre -feet
March
300200150110
9585
100550
1,170668887
5421.67
33,330
April
161138126150
3,4203,100
622550360275
1,1333.38
67,400
May
3434333434458564322929
84.00.26
5,1 BO
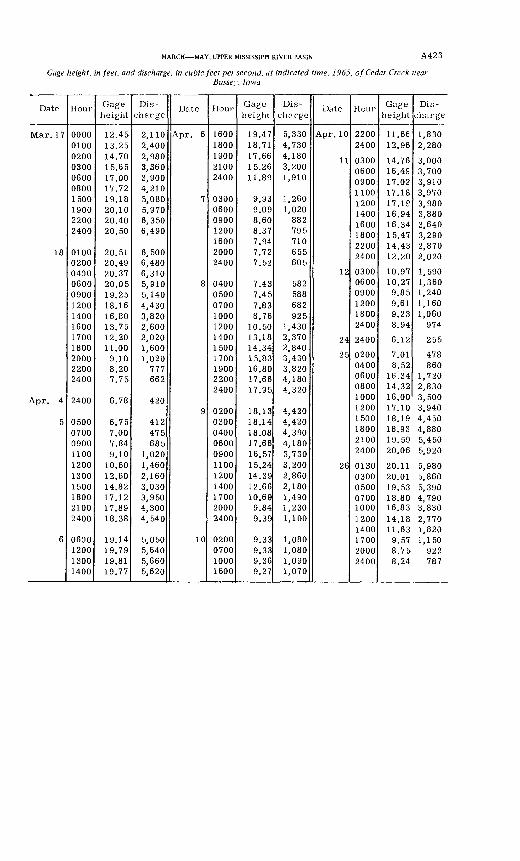
MARCH MAY, UPPER MISSISSIPPI RIVER BASIN A423
Gage height, in feet, and discharge, in cubic feet per second, at indicated time, 1965. of Cedar Creek nearBussey, Iowa
Date
Mar. 17
18
Apr. 4
5
6
Hour
0000010002000300060008001500190022002400
0100020004000600090012001400160017001800200022002400
2400
0500070009001100120013001500180021002400
0600120013001400
Gage height
12.4513.2514.7015.6517.0017.7219.1820.1020.4020.50
20.5120.4920.3720.0519.2518.1616.8013.7512.2011.009.108.207.75
6.78
6.757.007.849.10
10.6012.6014.8217.1217.8918.38
19.1419.7919.8119.77
Dis
charge
2,1102,4002,9803,3603,9004,2105,0805,9706,3506,490
6,5006,4806,3105,9105,1404,4303,8202,6002,0201,6001,020777662
420
412475685
1,0201,4602,1603,0303,9504,3004,540
5,0505,6405,6605,620
Date
Apr. 6
7
8
9
10
Hour
16001800190021002400
0300060009001200160020002400
04000500070010001200140015001700190022002400
02000300040006000900110012001400170020002400
0200070010001600
Gage height
19.4718.7117.6615.2611.89
9.939.098.608.377.947.727.52
7.437.457.838.76
10.5013.1814.3415.8316.8017.6617.95
18.1318.1418.0817.6616.5715.2414.3912.6610.699.849.39
9.339.339.369.27
Dis
charge
5,3304,7304,1803,2001,910
1,2601,020882795710655605
582588682925
1,4302,3702,8403,4303,8204,1804,320
4,4204,4204,3904,1803,7303,2002,8602,1801,4901,2301,100
1,0801,0801,0901,070
Date
Apr. 10
11
12
24
25
26
Hour
22002400
0300060009001100120014001600180022002400
030006000900120018002400
2400
0200040006000800100012001500180021002400
0130030005000700100012001400170020002400
Gage height
11.6612.96
14.7616.4917.0217.1817.1916.9416.3415.4714.4312.20
10.9710.279.859.619.238.94
6.12
7.018.52
16.3414.3216.00
Dis
charge
1,8302,280
3,0003,7003,9103,9703,9803,8803,6403,2902,8702,020
1,5901,3601,2401,1601,060974
255
478860
1,7202,8303,500
17.10 3,94018.19 4,45018.93 4,88019.59 5,45020.06 5,920
20.11 5,98020.01 5,86019.53 5,39018.80 4,79016.83 3,83014.18 2,77011.63 1,8209.57 1,1508.75 9228.24 787
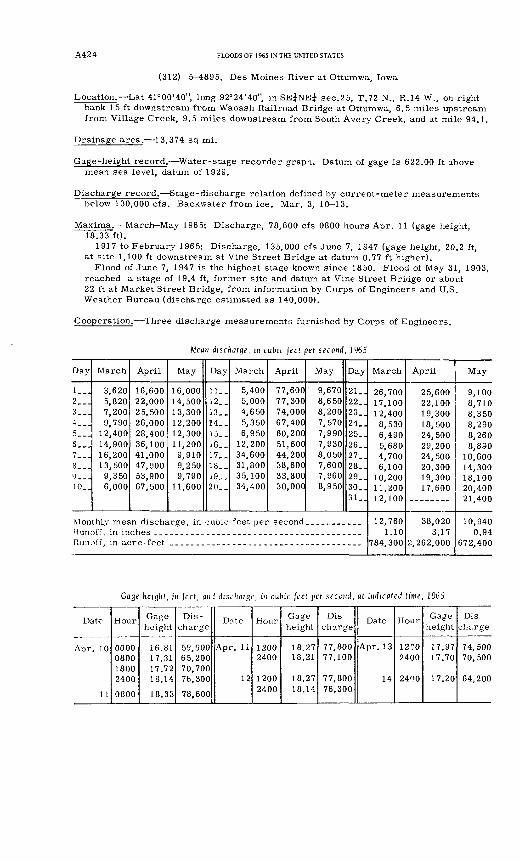
A424 FLOODS OF 1965 IN THE UNITED STATES
(312) 5-^895. Des Moines River at Ottumwa, Iowa
Location. Lat 41°00'40", long 92°24'40", in SE^NE^ sec.25, T.72 N., R.14 W., on right bank 1 5 ft downstream from Wabash Railroad Bridge at Ottumwa, 6.5 miles upstream from Village Creek, 9.5 miles downstream from South Avery Creek, and at mile 94.1.
Drainage area. 13,374 sq mi.
Gage-height record. Water-stage recorder graph. Datum of gage is 622.00 ft above mean sea level, datum of 1929.
Discharge record. Stage-discharge relation defined by current-meter measurements below 130,000 cfs. Backwater from ice. Mar. 3, 10-13.
Maxima. March-May 1965: Discharge, 78,600 cfs 0800 hours Apr. 11 (gage height, 18.33 ft).
1917 to February 1965: Discharge, 135,000 cfs June 7, 1947 (gage height, 20.2 ft, at site 1,100 ft downstream at Vine Street Bridge at datum 0.77 ft higher).
Flood of June 7, 1947 is the highest stage known since 1850. Flood of May 31, 1903, reached a stage of 19.4 ft, former site and datum at Vine Street Bridge or about 22 ft at Market Street Bridge, from information by Corps of Engineers and U.S. Weather Bureau (discharge estimated as 140,000).
Cooperation. Three discharge measurements furnished by Corps of Engineers.
Mean discharge, in cubic feet per second, 1965
Day
1__.2__.3...4...5..]6...7...8__J1J _ _ _10..
March
3,6205,8207,2009,790
12,40014,90016,20013,5009,3506,000
April
16,60022,00025,50026,00028,40036,10041,00047,90053,90067,500
May
16,00014,50013,30012,20012,30011,200
9,9109,2509,790
11,600
Day
11..12__13__14__15__16__17__18..19__20__
March
5,4005,0004,6505,3506,950
12,20034,60031,80035,10034,400
April
77,60077,30074,00067,40060,20C51.60C44,20038,60033,80030.00C
May
' 9,6708,6508,2007,5707,9907,9308,0507,6007,9608,950
Day
21..22..23..24..25..26..27..28..29..30..31..
Monthly mean discharge, in cubic feet per second__. ________Hunoff, in inchesRunoff, in acre -feet
March
26,70017,10012,4008,5306,4905,6804,7006,100
10,20011,20012,100
12,7601.10
784,300
April
25,60022,10019,30018,50024,50029,20024,50020,30019,30017,600
________
38,0203.17
£.262,000
May
9,1008,7108,3508,2908,2608,890
10,60014,30018,10020,40021,400
10,9400.94
672,400
Gngf height, m feel, and discharge, in cubic feet per second, at indicated time, 1965
Date
Apr. 10
11
Hour
0000080018002400
0800
Gage height
16.8117.3117.7218.14
18.33
Dis
charge
59,90065,20070,70076,300
78,600
Date
Apr. 11
12
Hour
12002400
12002400
Gage height
18.2718.21
18.2718.14
Dis
charge
77,80077,100
77,80076,300
Date
Apr. 13
14
Hour
12?02400
2400
Gage height
17.9717.70
17.20
Dis
charge
74,50070,500
64,200
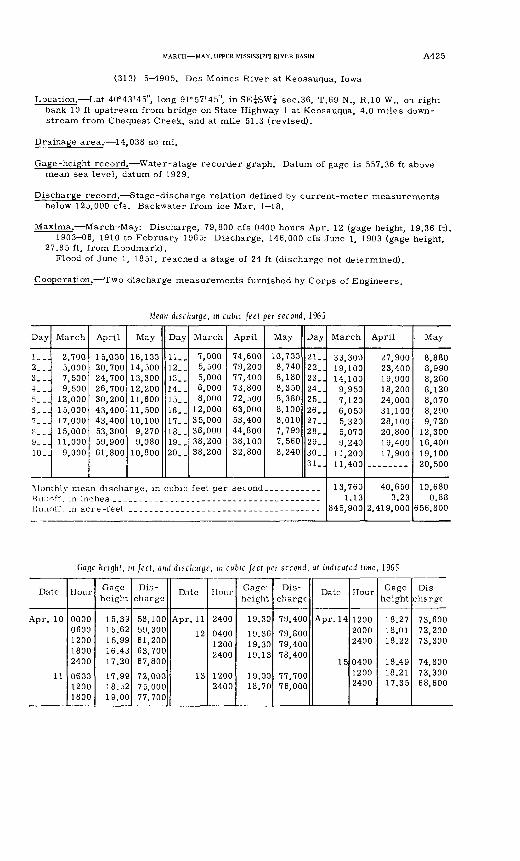
MARCH MAY, UPPER MISSISSIPPI RIVER BASIN
(313) 5 4905. Des Moines River at Keosauqua, Iowa
A425
Location. Lat 40°43'45", long 91°57'45", in SE^SW^ sec.36, T.69 N., R.10 W., 01 right bank 10 ft upstream from bridge on State Highway 1 at Keosauqua, 4.0 miles down stream from Chequest Creek, and at mile 51.3 (revised).
Drainage area. 14,038 sq mi.
Gage-height record. Water-stage recorder graph. Datum of gage is 557.36 ft above mean sea level, datum of 1929.
Discharge record. Stage-discharge relation defined by current-meter measurements below 125,000 cfs. Backwater from ice Mar. 1-18.
Maxima. March-May: Discharge, 79,800 cfs 0400 hours Apr. 12 (gage height, 19.36 ft).1903-06, 1910 to February 1965: Discharge, 146,000 cfs June 1, 1903 (gage height,
27.85 ft, from floodmark).Flood of June 1, 1851, reached a stage of 24 ft (discharge not determined).
Cooperation. Two discharge measurements furnished by Corps of Engineers.
Mean discharge, m cubic feet per second, 1965
Day
I...2...3...4. _.5_ __o_ __7...«...9...10. J
March
2,7005,0007,5009,500
12,00015,00017,00015,00011,0009,000
April
15,00020,70024,70026,70030,20043,40043,40053,30059,90061,800
May
16,10014,50013,30012,20011,60011,50010,1009,2709,080
10,800
Day
11-.12. _13..14__15..16..17..18..19_.20..
March
7,0005,5005,0006,0008,000
12,00035,00036,00038,20038,200
April
74,60079,20077,40073,80072,50063,00053,40044,80038,10032,800
May
10,7008,7408,1808,3508,3808,1008,0107,7907,5608,240
Day
21..22_.23..24..25..26..27..28..29..30..31..
Monthly mean discharge, in cubic feet per second... .._.__..Run off m inchesHu.inff, in acre -feet
March
33,30019,10014,100
9,9507,1206,0505,3205,0709,240
11,20011,400
13,7601.13
845,900
April
27,90023,40019,90018,20024,00031,10028,10020,80019,40017,900
------
40,6503.23
2,419,000
. May
8,8808,9908,2608,1208,0708,2909,720
12,30016,40019,10020,500
10,6800.88
656,800
Gnge height, in feel, and discharge, in cubic feet per second, at indicated time, 1965
Date
Apr. 10
11
Hour
00000600120018002400
060012001800
Gage height
15.3915.6215.9916.4317.20
17.9918.5219.00
Dis
charge
58,10059,30061,20063,70067,800
72,00075,00077,700
Date
Apr. 11
12
13
Hour
2400
040012002400
12002400
Gage-
height
19.30
19.3619.3019.13
19.0018.70
Dis
charge
79,400
79,80079,40078,400
77,70076,000
Date
Apr. 14
15
Hour
120020002400
040012002400
Gage height
18.2718.0118.22
18.4918.2117.35
Dis
charge
73,60072,20073,300
74,80073,30068,600
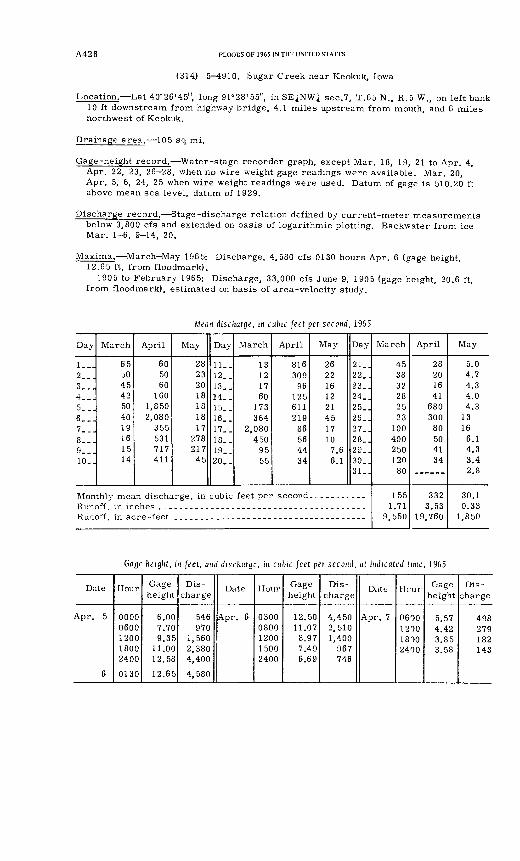
A426 FLOODS OF 1965 IN THE UNITED STATES
(314) 5-4910. Sugar Creek near Keokuk, Iowa
Location. Lat 40°26'45", long 91°28'55", in SE^NWi sec.7, T.65 N., R.5 W., on left bank 10 ft downstream from highway bridge, 4.1 miles upstream from mouth, and 6 miles northwest of Keokuk.
Drainage area. 105 sq mi.
Gage-height record. Water-stage recorder graph, except Mar. 18, 19, 21 to Apr. 4, Apr. 22, 23, 26 28, when no wire weight gage readings were available. Mar. 20, Apr. 5, 6, 24, 25 when wire weight readings were used. Datum of gage is 510.20 ft above mean sea level, datum of 1929.
Discharge record. Stage-discharge relation defined by current-meter measurements below 3,800 cfs and extended on basis of logarithmic plotting. Backwater from ice Mar. 1-6, 9-14, 20.
Maxima. March-May 1965: Discharge, 4,580 cfs 0130 hours Apr. 6 (gage height, 12.65 ft, from floodmark).
1905 to February 1965: Discharge, 33,000 cfs June 9, 1905 (gage height, 20.6 ft, from floodmark), estimated on basis of area-velocity study.
Mean discharge, in cubic feet per second, 1965
Day
1___2...3...4...5...6...7...8...9...10..
March
65504542504019161514
April
605060
1601,8502,080
355531717411
May
28232018181817
27821745
Day
11..12-.13..14..15..16.-17..18..19..20..
March
13121760
173364
2,080450
9555
April
816309
96125611219
86564434
May
2622161221451710
7.66.1
Day
21..22..23..24..25..26..27..28..29..30..31
Runoff, in acre -feet
March
453832282523
100400250120
80
1551.71
9,550
April
28201641
680300
80504134
3323.53
19,760
May
5.04.74.34.04.3
1316
6.14.33.42.8
30.10.33
1,850
Gnge fit'iglit, in feet, ami discharge, in cubic feet per second, at indicated time, 1965
Date
Apr. 5
6
Hour
00000600120018002400
0130
Gage height
6.007.709.35
11.0012.58
12.65
Dis
charge
546970
1,5602,3804,400
4,580
Date
Apr. 6
Hour
03000800120015002400
Gage height
12.5011.078.977.496.69
Dis
charge
4,4502,5101,400
967746
Date
Apr. 7
Hcur
06^0127018102400
Gage height
5.574.423.853.58
Dis
charge
498279182143
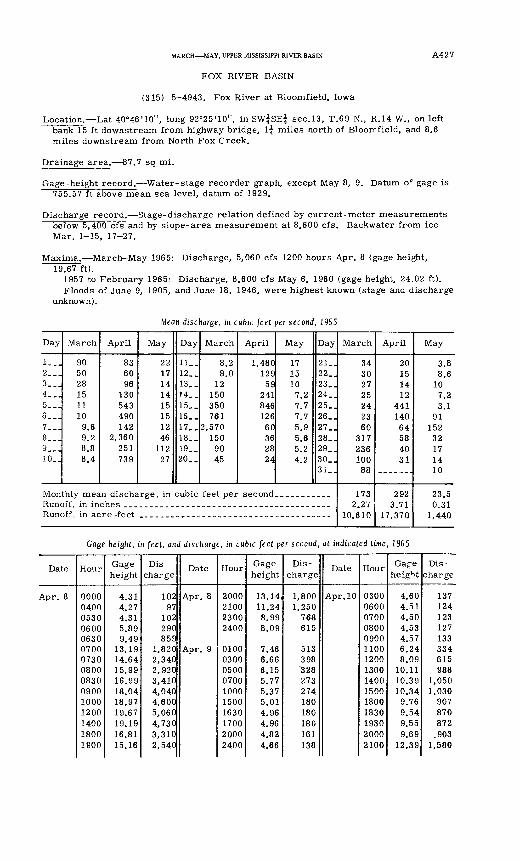
MARCH MAY, UPPER MISSISSIPPI RIVER BASIN A427
FOX RIVER BASIN
(315) 5-4943. Fox River at Bloomfield, Iowa
Location. Lat 40°46'10", long 92°25'10", in SW^SE^ sec.13, T.69 N., R.14 W., on left bank 15 ft downstream from highway bridge, 1^ miles north of Bloomfield, and 8.6 miles downstream from North Fox Creek.
Drainage area. 87.7 sq mi.
Gage-height record. Water-stage recorder graph, except May 8, 9. Datum oe gage is 755.57 ft above mean sea level, datum of 1929.
Discharge record. Stage-discharge relation defined by current-meter measurements below 5,400 cfs and by slope-area measurement at 8,600 cfs. Backwater from ice Mar. 1-15, 17-27.
Maxima. March-May 1965: Discharge, 5,060 cfs 1200 hours Apr. 8 (gage height, 19.67 ft).
1957 to February 1965: Discharge, 8,600 cfs May 6, 1960 (gage height, 24.02 ft). Floods of June 9, 1905, and June 18, 1946, were highest known (stage and discharge
unknown).
Mean discharge, in cubic feet per second, 1965
Day
1__.2...3...4...5...6...7___8...9...10..
March
9050281511109.69.28.88.4
April
836096
130543490142
2,360251739
May
2217141415151246
11227
Day
11..12. _13..14. _15__16..17..18..19..20..
March
8.28.0
12150350761
2,570150
9045
April
1,480129
5S24184612660362824
May
171510
7.27.77.75.95.65.24.2
Day
21..22..23..24..25..26..27..28_.29_.30..31
Monthly mean discharge, in cubic feet per second __ _________Runoff in inchesRunoff, in acre -feet
March
34302725242360
31723610088
1732.27
10,610
April
20151412
44114064584031
292"? 71
17,370
May
3.88.6
107.23.1
91152
32171410
23.50 31
1,440
Gage height, in feet, and discharge, in cubic feet per second, at indicated time, 1965
Date
Apr. 8
Hour
000004000530060006300700073008000830090010001200140018001900
Gage height
4.314.274.315.899.49
13.1914.6415.9916.9918.0418.9719.6719.1916.8115.16
Dis
charge
10297
102290859
1,8202,3402,9203,4104,0404,6005,0604,7303,3102,540
Date
Apr. 8
Apr. 9
Hour
2000210023002400
0100030005000700100015001630170020002400
Gage height
13.14,11.248.998.09
7.466.666.155.775.375.014.964.964.824.66
Dis
charge
1,8001,250
768615
513398328273274180180180161138
Date
Apr. 10
Hour
030006000700080009001100120013001400150018001830193020002100
Gage height
4,604.514.504.534.576.248.09
10.1110.3910.34
9.769.549.559.69
12.39
Dis
charge
137124123127133334615988
1,0501,030
907870872
.9031,580
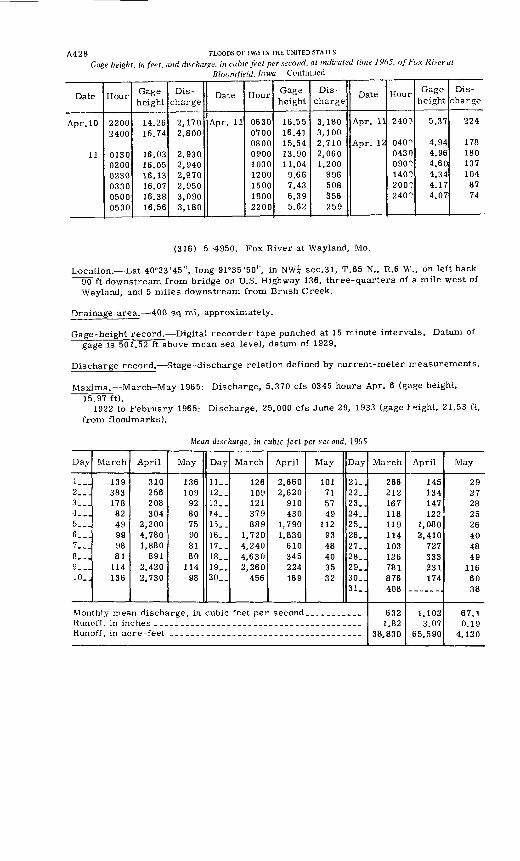
A4 2 8 FLOODS OF 1965 IN THE UNITED STATES
Gage height, in feet, and discharge, in cubic feet per second, at indicated time 1965, of Fox River at Bloomfield. Iowa Continued
Date
Apr. 10
11
Hour
22002400
013002000230033005000530
Gage height
14.2615.74
16.0316.0516.1316.0716.3816.56
Dis
charge
2,1702,800
2,9302,9402,9702,9503,0903,180
Date
Apr. 11
Hour
063007000800090010301200150018002200
Gage height
16.5516.4115.5413.9011.049.667.436.395.62
Dis
charge
3,1803,1002,7102,0601,200
896508356259
Date
Apr. 11
Apr. 12
Hour
2400
040^
0430090^
140?200?240?
Gage height
5.37
4.944.964.604.344.174.07
Dis
charge
224
1781801371048774
(316) 5-4950. Fox River at Wayland, Mo.
Location. Lat 40°23'45", long 91°35'50", in NWj sec.31, T.65 N., R.6 W., on left bank 90 ft downstream from bridge on U.S. Highway 136, three-quarters of a mile west of Wayland, and 5 miles downstream from Brush Creek.
Drainage area. 400 sq mi, approximately.
Gage-height record. Digital recorder tape punched at 15 minute intervals. Datum of gage is 501.52 ft above mean sea level, datum of 1929.
Discharge record. Stage-discharge relation defined by current-meter measurements.
Maxima. March-May 1965: Discharge, 5,370 cfs 0345 hours Apr. 6 (gage height, 15.97 ft).
1922 to February 1965: Discharge, 25,000 cfs June 29, 1933 (gage 1 «ight, 21.53 ft, from floodmarks).
Mean discharge, in cubic feet per second, 1965
Day
1__.2...3...4__,5___6___7...8...9...10..
March
1393831788249999881
114136
April
310256208304
2,2004,7801,880
8912,4202,730
May
136109
928075908180
11498
Day
11__12. _13..14..15__16..17..18..19..20..
March
126109121379889
1,7204,2404.6302,260
456
April
2,6602,620
910430
1,7901,830
610345224169
May
101715749
1129348403532
Day
21..22..23..24..25..26..27..28..29_.30..31..
Runoff, in inches ___Runoff, in acre -feet
March
266212167118119114103126781876408
6321.82
38,830
April
145134147122
1,0802,410
727333231174
1,1023 07
65,590
May
2927282526404849
1166038
67.1019
4,120
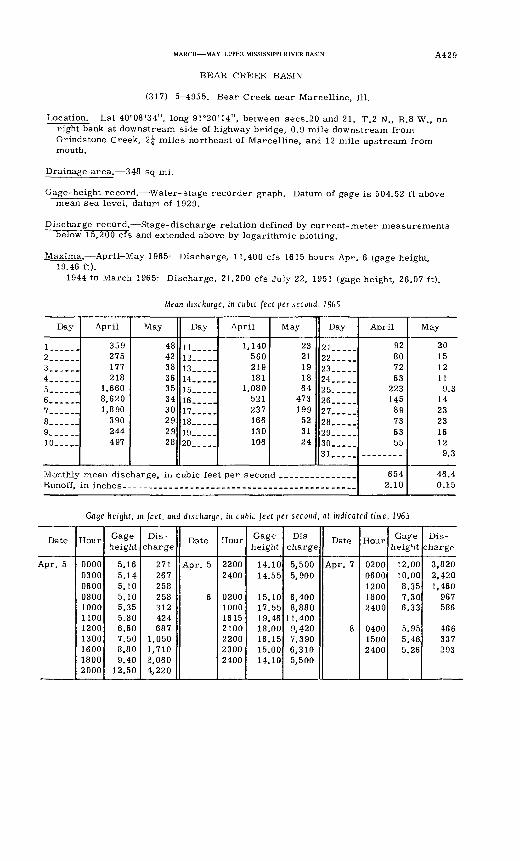
MARCH MAY, UPPER MISSISSIPPI RIVER BASIN A429
BEAR CREEK BASIN
(317) 5-4955. Bear Creek near Marcelline, 111.
Location. Lat 40°08'34" J long 91°20'14", between sees.20 and 21, T.2 N., R.8 W., on right bank at downstream side of highway bridge, 0.9 mile downstream from Grindstone Creek, 2^ miles northeast of Marcelline, and 12 mile upstream from mouth.
Drainage area. 348 sq mi.
Gage-height record. Water-stage recorder graph. Datum of gage is 504.52 ft above mean sea level, datum of 1929.
Discharge record. Stage-discharge relation defined by current-meter measurements below 15,200 cfs and extended above by logarithmic plotting.
Maxima. April-May 1965: Discharge, 11,400 cfs 1615 hours Apr. 6 (gage height, 19.46 ft).
1944 to March 1965: Discharge, 21,200 cfs July 22, 1951 (gage height, 26.07 ft).
Mean discharge, in cubic feet per second, 1965
Day
1.2. ___3... ...4. . ...5. ____.6... ...7. _____8 ___ .9 __ __10 _____
Monthly Runoff,
April
359 275 177 218
1,660 8,620 1,890
390 244 497
May
48 42 38 36 35 34 30 29 29 28
Day
11____.12__ __13__ __14_____15 __ __16__ __17__ ...18 ___ _19__ ...20_. ___
April
1,140 560 219 181
1,080 521 237 166 130 106
May
23 21 19 18 64
473 199
52 31 24
Day
21__.__22_____23__ ...24 __ _25_____26 __ __27__ __28 .__._29__ ...30 .....31__ ...
mean discharge, in cubic feet per second _______________
April
92 80 72 63
223 145 89 73 63 55
S54 2.10
May
20 15 12 11 9.3
14 23 23 16 12 9.3
46.4 0.15
Gage height, in feet, and discharge, in cubic feet per second, at indicated time, 1965
Date
Apr. 5
Hour
00000300060008001000110012001300160018002000
Gage height
5.165.145.105.105.355.806.607.508.809.40
12.50
Dis
charge
271267258258312424687
1,0501,7102,0604,220
Date
Apr. 5
6
Hour
22002400
0200100016152100220023002400
Gage height
14.1014.55
15.1017.5519.4618.0016.1515.0014.10
Dis
charge
5,5005,900
6,4008,880
11,4009,4207,3906,3105,500
Date
Apr. 7
8
Hour
02000600i120018002400
040015002400
Gape height
12.0010.008.357.306.33
5.955.465.26
Dis
charge
3,8202,4201,460
967586
466337293
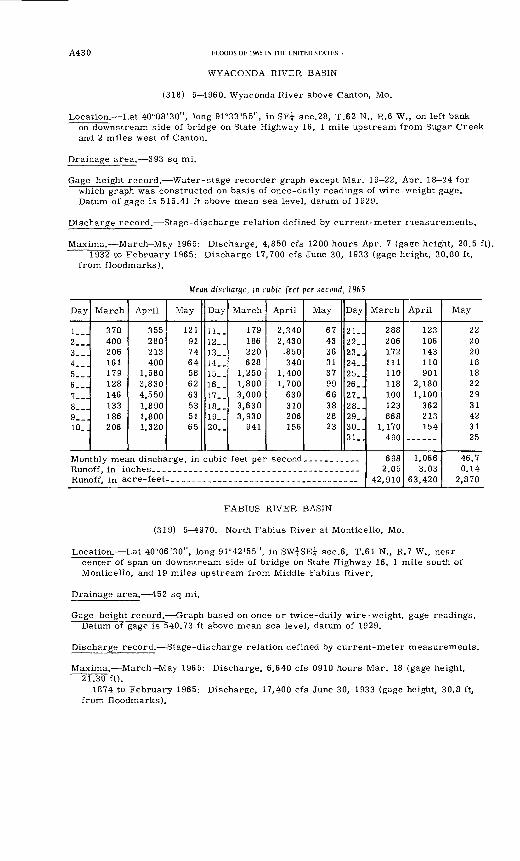
A430 FLOODS OF 1965 IN THE UNITED STATES ,
WYACONDA RIVER BASIN
(318) 5-4960. Wyaconda River above Canton, Mo.
Location. Lat 40°08'30", long 91°33'55", in SE? sec.28, T.62 N., R.6 W., on left bank on downstream side of bridge on State Highway 16, 1 mile upstream from Sugar Creek and 2 miles west of Canton.
Drainage area. 393 sq mi.
Gage-height record. Water-stage recorder graph except Mar. 19 22, Aor. 18 24 for which graph was constructed on basis of once-daily readings of wire-weight gage. Datum of gage is 515.41 ft above mean sea level, datum of 1929.
Discharge record. Stage-discharge relation defined by current-meter measurements.
Maxima.- March-May 1965: Discharge, 4,850 cfs 1200 hours Apr. 7 (gage height, 20.5 ft).1932 to February 1965: Discharge 17,700 cfs June 30, 1933 (gage height, 30.00 ft,
from floodmarks).
Mean discharge, in cubic feet per second, 1965
Day
1...2...3...4___5...6...7...8...9-_-10..
March
370400206161179128146133186206
April
355280213400
1,5803,8304,5501,8901,8001,320
May
121917464586263535165
Day
11..12..13..14__15..16..17..18..19..20..
March
179186220628
1,2501,8003,0003,6303,930
941
April
2,3402,430
.850340
1,4001,700
630310206156
May
67433631379966382823
Day
21..22..23..24..25..26..27..28..29..30..31
Monthly mean discharge, in cubic feet per second. --.._.....
Runoff, in acre-feet-. ... __.__._.___.._.._._.-_._____._
March
288206172111110118100123868
1,170490
6982.05
42.910
April
123106143110901
2,1801,100
362213154
1,066.3.03
63.420
May
2220201818222931423125
46.70.14
2.870
FABIUS RIVER BASIN
(319) 5-4970. North Fabius River at Monticello, Mo.
Location. Lat 40°06'30", long 91°42'55", in SWjSE^ sec.6, T.61 N., R.7 W., near center of span on downstream side of bridge on State Highway 16, 1 mile south of Monticello, and 19 miles upstream from Middle Fabius River.
Drainage area. 452 sq mi.
Gage-height record. Graph based on once or twice-daily wire-weight, gage readings. Datum of gage is 540.73 ft above mean sea level, datum of 1929.
Discharge record. Stage-discharge relation defined by current-meter measurements.
Maxima. March May 1965: Discharge, 6,640 cfs 0910 hours Mar. 18 (gage height, 21.30 ft).
1874 to February 1965: Discharge, 17,400 cfs June 30, 1933 (gage height, 30.8 ft, from floodmarks).
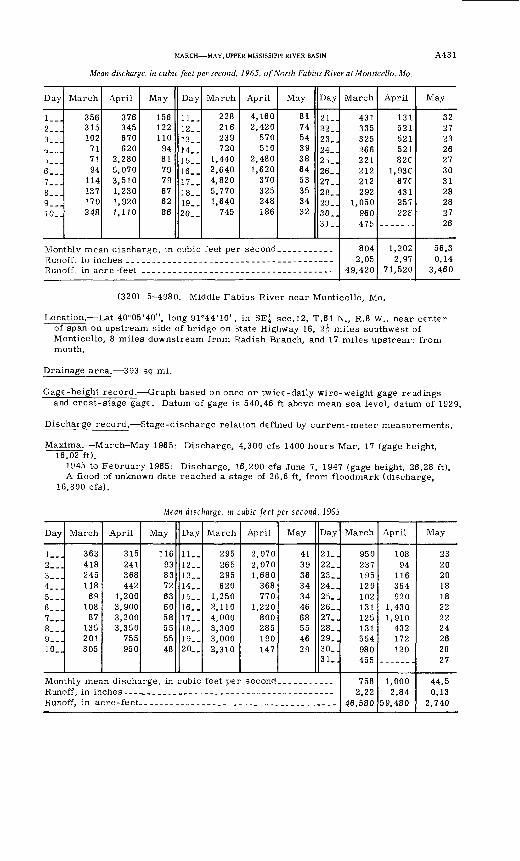
MARCH MAY, UPPER MISSISSIPPI RIVER BASIN
Mean discharge, in cubic feet per second, 1965, of North Fabius River at Monticello, Mo.
A431
Day
1...2...3...4...5...6...7___8 9...10_.
March
356315102
717194
114137170248
April
376345670620
2,2805,0703,5101,2301,9201,110
May
156122110
94817979676286
Day
11..12..13..14..15..16..17..18..19..20..
March
228216239720
1,4402,6404,8205,7701,640
745
April
4,1602,420
570510
2,4801,620
370325248186
May
81745439386453353432
Day
21..22..23..24..25..26..27..28. .29_.30..31..
Monthly mean discharge, in cubic feet per second..... _..._.
Runoff, in acre -feet
March
431335325266221212212292
1,050960475
8042.05
49,420
April
13152152152182C
1.93C67C43125722f
1,20?,2.97
71,520
May
3227232627303128282726
56.30.14
3,460
(320) 5-4980. Middle Fabius River near Monticello, Mo.
Location. Lat 40°05'40", long 91°44'10", in SE^ sec.12, T.61 N., R.8 W., near center of span on upstream side of bridge on State Highway 16, 2| miles southwest of Monticello, 8 miles downstream from Radish Branch, and 17 miles upstrean from mouth.
Drainage area. 393 sq mi.
Gage-height record. Graph based on once or twice-daily wire-weight gage readings and crest-stage gage. Datum of gage is 540.46 ft above mean sea level, datum of 1929.
Discharge record. Stage-discharge relation defined by current-meter measurements.
xima. March-May 1965: Discharge, 4,300 cfs 1400 hours Mar. 17 (gage height, 16.02 ft).
1945 to February 1965: Discharge, 16,200 cfs June 7, 1947 (gage height, 26.28 ft). A flood of unknown date reached a stage of 26.6 ft, from floodmark (discharge,
16,800 cfs).
Mean discharge, m cubic feet per second, 1965
Ma
Day
1...2...3...4...5...6...7...8...9...10..
March
363418245118
69108
87135201305
April
315241368442
1,2003,9003,2003,350
755950
May
116938372636058555548
Day
11..12..13..14..15..16..17..18__19..20_.
March
295265295620
1,2502,1104,0003,3003,0002,310
April
2,0702,0701,680
368770
1,220800285190147
May
41393634344668554629
Day
21..22..23_.24_.25..26_.27..28..29..30..31
Runoff in inches .-Runoff, in acre-feet
March
950237195129102131125131554980455
758
46,580
April
10894
116364920
1,4301,910
432172120
1,0002.84
59,480
May
2320201818222224262827
44.50.13
2,740
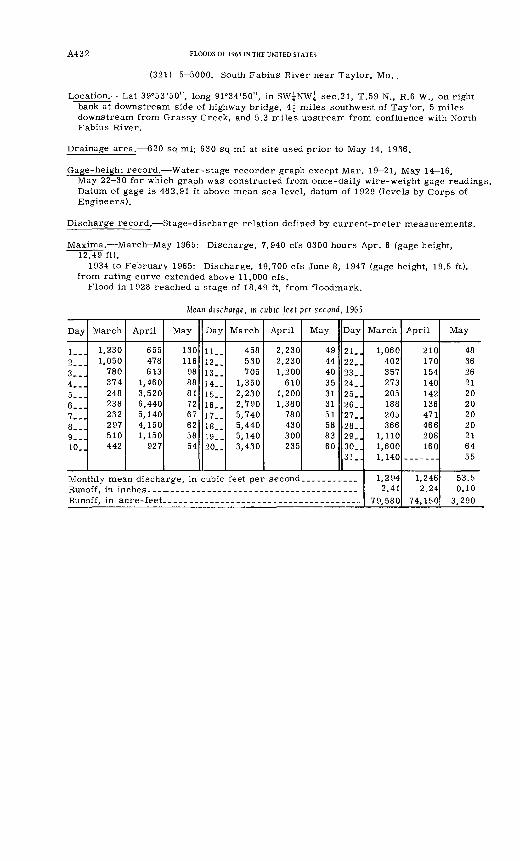
A432 FLOODS OF 1965 IN THE UNITED STATES
(321) 5-5000. South Fabius River near Taylor, Mo.
Location. Lat 39°53'50", long 91°34'50", in SWg-NW^ sec.21, T.59 N., R.6 W., on right bank at downstream side of highway bridge, 4i miles southwest of Tay'or, 5 miles downstream from Grassy Creek, and 5.3 miles upstream from confluence with North Fabius River.
Drainage area. 620 sq mi; 630 sq mi at site used prior to May 14, 1936.
Gage-height record. Water-stage recorder graph except Mar. 19-21, May 14-16,May 22 30 for which graph was constructed from once-daily wire-weight gage readings. Datum of gage is 482.91 ft above mean sea level, datum of 1929 (levels by Corps of Engineers).
Discharge record. Stage-discharge relation defined by current-meter measurements.
Maxima. March-May 1965: Discharge, 7,940 cfs 0300 hours Apr. 6 (gage height, 12.49 ft).
1934 to February 1965: Discharge, 19,700 cfs June 8, 1947 (gage height, 19.5 ft), from rating curve extended above 11,000 cfs.
Flood in 1928 reached a stage of 18.49 ft, from floodmark.
Mean discharge, in cubic feet per second, 1965
Day
1...2...3...4...5...6...7__.8...9...10..
March
1,2301,050
780374248238232297510442
April
655478613
1,4603,5206,4405,1404,1501,150
927
May
130116
9888817267625854
Day
11_.12__13__14__15__16__17__18__19__20. _
March
458530705
1,3502,2302,7905,7405,4405,1403,430
April
2,2302,2301,200
6101,2001,380
780430300235
May
49444035313151588360
Day
21..22_.23__24_.25_.26_.27_.28_.29_.30_.3.1 ..
Monthly mean discharge, in cubic feet per second... ________
Runoff, in acre-feet ______ ______ _______________ ____ __
March
1,060402357273205188205366
1,1101,6001,140
1,2942.41
79,580
April
210170154140142136471466208160
-------
1,2462.24
74,150
May
4836262120202020216455
53.50.10
3,290
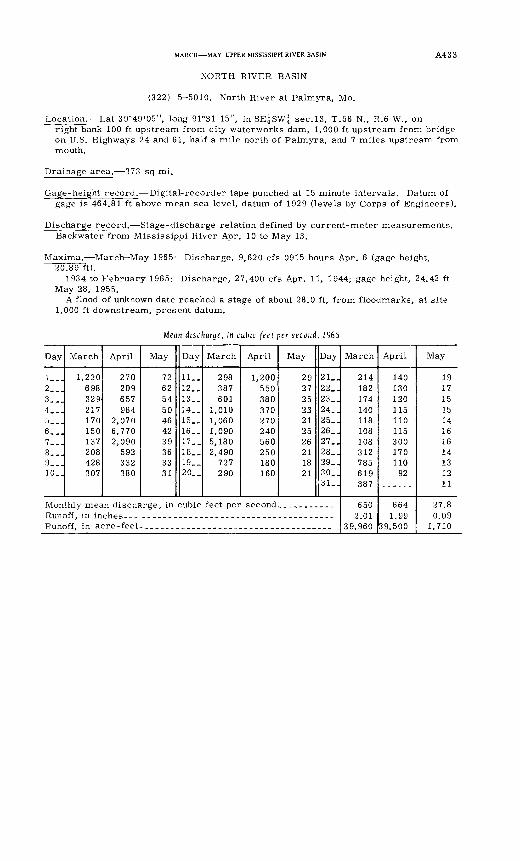
MARCH MAY, UPPER MISSISSIPPI RIVER BASIN A433
NORTH RIVER BASIN
(322) 5-5010. North River at Palmyra, Mo.
Location. Lat 39°49'05", long 91°31'15", in SE|SW| sec.13, T.58 N., R.6 W., onright bank 100 ft upstream from city waterworks dam, 1,000 ft upstream from bridge on U.S. Highways 24 and 61, half a mile north of Palmyra, and 7 miles upstream from mouth.
Drainage area. 373 sq mi.
Gage-height record. Digital-recorder tape punched at 15 minute intervals. Datum of gage is 464.81 ft above mean sea level, datum of 1929 (levels by Corps of Engineers).
Discharge record. Stage-discharge relation defined by current-meter measurements. Backwater from Mississippi River Apr. 10 to May 13.
Maxima. March-May 1965: Discharge, 9,620 cfs 0915 hours Apr. 6 (gage height, 20.89 ft).
1934 to February 1965: Discharge, 27,400 cfs Apr. 11, 1944; gage height, 24.42 ft May 28, 1955.
A flood of unknown date reached a stage of about 28.0 ft, from floodmarks, at site 1,000 ft downstream, present datum.
Mean discharge, in cubic feet per second, 1965
Day
!_..2___3...4...5___6...7...8...9...10..
March
1,220698329217170150137208428307
April
270209657984
2,0706,7702,090
592332380
May
72625450464239363331
Day
11..12__13__14__15__16_.17__18__19__20. _
March
298387601
1,0101,0601,0905,1802,490
727290
April
1,200550380370270240560250180160
May
29272523212526211821
Day
21..22..23__24__25..26_.27_.28..29_.30_.31
Monthly mean discharge, in cubic feet per second.. _________
Runoff, in acre- feet- __._-_.___ _----_________________._
March
214182174140118108108312785619
650201
39.960
April
140130120115110115300170110
92
6641 99
39.500
May
1917151514161614131211
27.80.09
1.710
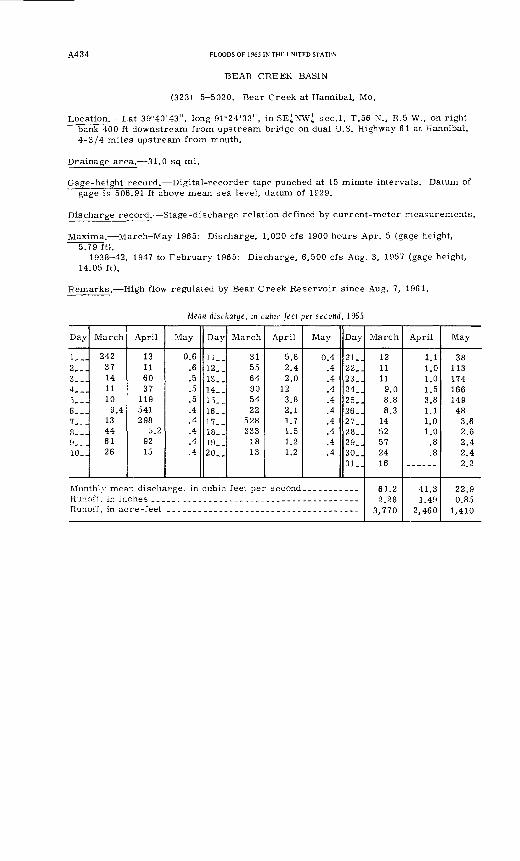
A434 FLOODS OF 1965 IN THE UNITED STATES
BEAR CREEK BASIN
(323) 5-5020. Bear Creek at Hannibal, Mo.
Location. Lat 39°40'43", long 91°24'33", in SE|NW| sec.l, T.56 N., R.5 W., on right bank 400 ft downstream from upstream bridge on dual U.S. Highway 61 at Hannibal, 4-3/4 miles upstream from mouth.
Drainage area. 31.0 sq mi.
Gage-height record. Digital-recorder tape punched at 15 minute intervals. Datum of gage is 508.91 ft above mean sea level, datum of 1929.
Discharge record. Stage-discharge relation defined by current-meter measurements.
Maxima. March-May 1965: Discharge, 1,020 cfs 1900 hours Apr. 5 (gage height, 5.79 ft).
1938-42, 1947 to February 1965: Discharge, 6,500 cfs Aug. 3, 1957 (gage height, 14.05 ft).
Remarks. High flow regulated by Bear Creek Reservoir since Aug. 7, 1961.
Mean discharge, in cubic feel per second, 1965
Day
!___2___3...4...5___6,..7__.8...9...10..
March
242371411109.4
13446126
April
13116037
119541298
5.29215
May
0.6.6.5.5.5.4.4.4.4.4
Day
11..12..13..14..15..16..17..18..19. _20..
March
315564905422
528333
1813
April
5.82.42.0
123.82.11.71.51.21.2
May
0.4.4.4.4.4.4.4.4.4.4
Day
21..22..23..24..25..26..27..28..29_.30_.31..
Monthly mean discharge, in cubic feet per second______--._-Runoff in inches _ - - --Runoff, in acre -feet
March
121111
9.08.88.3
1452572416
61.22.28
3,770
April
1.11.01.01.53.81.11.01.0
.8
.8
41.31 AQ
2,460
May
3811317416614948
3.62.62.42.42.2
22.90.85
1,410
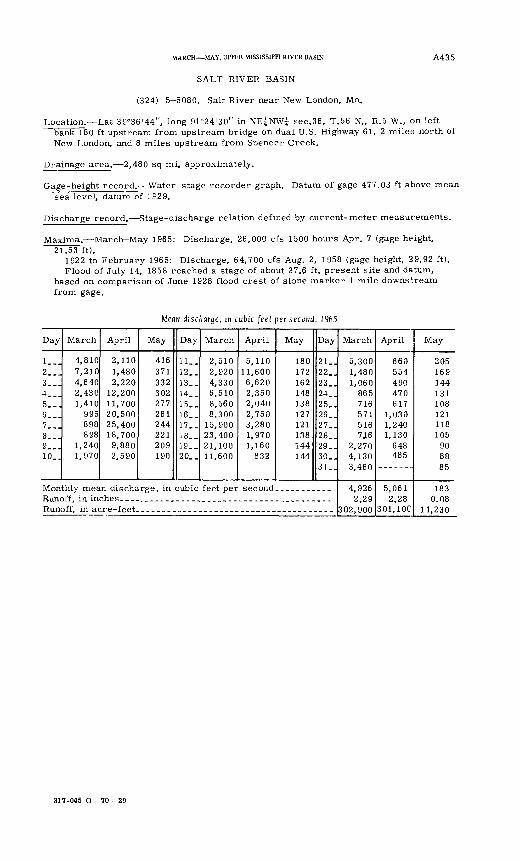
MARCH MAY, UPPER MISSISSIPPI RIVER BASIN A43 5
SALT RIVER BASIN
(324) 5-5080. Salt River near New London, Mo..
Location. Lat 39°36'44", long 91°24'30" in NE^NWi sec.36, T.56 N., R.5 W., on left bank 180 ft upstream from upstream bridge on dual U.S. Highway 61, 2 miles north of New London, and 8 miles upstream from Spencer Creek.
Drainage area. 2,480 sq mi, approximately.
Gage-height record. Water-stage recorder graph. Datum of gage 477.03 ft above mean sea level, datum of 1929.
Discharge record. Stage-discharge relation defined by current-meter measurements.
Maxima. March-May 1965: Discharge, 26,000 cfs 1500 hours Apr. 7 (gage height, 21753" ft).
1922 to February 1965: Discharge, 64,700 cfs Aug. 2, 1958 (gage height, 29.92 ft). Flood of July 14, 1858 reached a stage of about 27.6 ft, present site and datum,
based on comparison of June 1928 flood crest of stone marker 1 mile downstream from gage.
Mean discharge, m cubic feet per second, 1965
Day
1__ 12__]3 "H4__]5___6...7...8...9__.10..
March
4,8107,2104,6402,4301,410
995898898
1,2401,970
April
2,1101,4802,220
12,20011,70020,50025,40018,7009,8802,590
May
416371332302277261244221209190
Day
11..12..13..14..15..16..17. _18..19. _20..
March
2,5102,9204,3306,5108,5608,300
15,90023,40021,10011,600
April
5,11011,6006,6202,3502,0402,7503,2801,9701,160
832
May
180172162148138127121138144144
Day
21..22..23..24..25_.26..27..28..29..30.. 3 1
Monthly mean discharge, in cubic feet per second.. _......._
Runoff, in acre- feet-- ----_---__ ______ ____________ _ _
March
5,3001,4801,060
8657165715167 16
. 2,2704,1303,460
4,9262.29
302,900
April
660554490470617
1,0301,2401,130
648485
5,0612.28
301, 10C
May
205169144131108121118105
9088O C
1830.08
11,230
317-045 O - 70 - 29
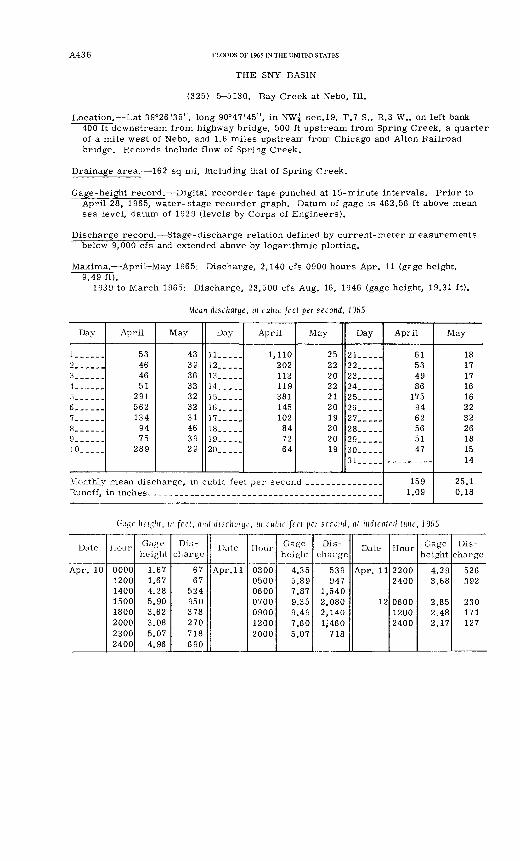
A43 6 FLOODS OF 1965 IN THE UNITED STATES
THE SNY BASIN
(325) 5-5130. Bay Creek at Nebo, 111.
Location. Lat 39°26'35", long 90°47'45", in NWj sec.19, T.7 S., R.3 W., on left bank 400 ft downstream from highway bridge, 500 ft upstream from Spring Creek, a quarter of a mile west of Nebo, and 1.6 miles upstream from Chicago and Alton Railroad bridge. Records include flow of Spring Creek.
Drainage area. 162 sq mi, including that of Spring Creek.
Gage-height record. Digital recorder tape punched at 15-minute intervals. Prior to April 28, 1965, water-stage recorder graph. Datum of gage is 462.56 ft above mean sea level, datum of 1929 (levels by Corps of Engineers).
Discharge record. Stage-discharge relation defined by current-meter measurements below 9,000 cfs and extended above by logarithmic plotting.
Maxima.- April-May 1965: Discharge, 2,140 cfs 0900 hours Apr. 11 (grge height, 9.49 ft).
1939 to March 1965: Discharge, 23,500 cfs Aug. 16, 1946 (gage height, 19.31 ft).
Mean discharge, m cubic feet per second, 1965
Day
l-__--.2______3______4......
6______7......8___...910.....
Monthly Runoff,
April
53 46 46 51
291 562 134
94 75
289
May
43 39 36 33 32 32 31 46 39 29
Day
11---..12.....13...-.14____.15.....16..-_-17..-..18.....19.....20.....
April
1,110 202 112 119 381 145 102 84 72 64
mean discharge, in cubic feet per secon in inches--- _ _
May
25 22 20 22 21 20 19 20 20 19
Day
21.. __22-_...23 __ .24.. ...25 ___ .26.. __27.. ...28.....29.....30.....31.....
d ...............
April
61 53 49 86
175 94 62 56 51 47
159 1.09
May
18 17 17 16 16 22 32 26 18 15 14
25.1 0.18
linglit, in feet, mid disduitgr, m cubic feet pet second, al indicated time, 19f>5
Date
Apr. 10
Hour-
00001200140015001800200023002400
Gage height
1.671.674.285.903.623.085.074.96
Dis
charge
6767
524950378270718690
Date
Apr. 11
Hour
0300050006000700090012002000
Gage height
4.355.897.879.359.497.605.07
Dis
charge
539947
1,5402,0802,1401,-460718
Date
Apr. 11
12
Hour
22002400
060012002400
Gage height
4.293.68
2.852.482.17
Dis
charge
526392
230171127
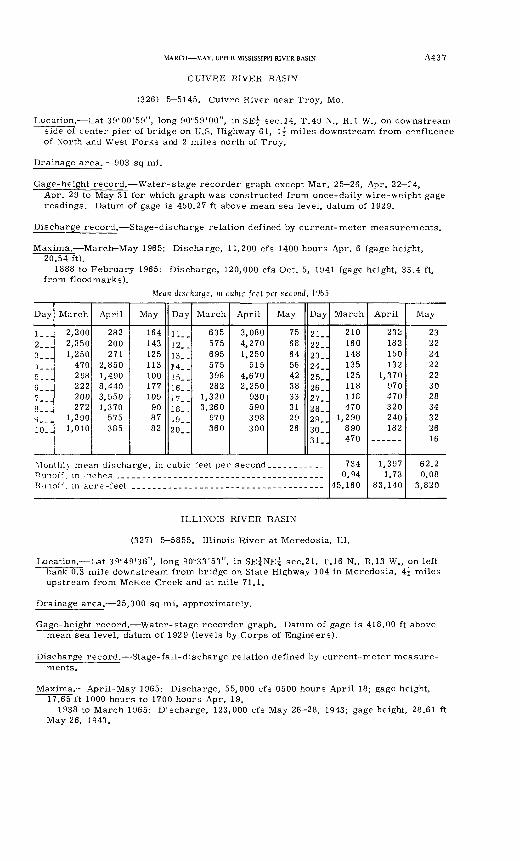
MARCH MAY, UPPER MISSISSIPPI RIVER BASIN A43 7
CUIVRE RIVER BASIN
(326) 5-5145. Cuivre River near Troy, Mo.
Location. Lat 39°00'59", long 90°59'00", in SE| sec. 14, T.49 N., R.I W., on downstream side of center pier of bridge on U.S. Highway 61, l| miles downstream from confluence of North and West Forks and 2 miles north of Troy.
Drainage area. 903 sq mi.
Gage-height record. Water-stage recorder graph except Mar. 25 26, Apr. 22 24,Apr. 29 to May 31 for which graph was constructed from once-daily wire-weifht gage readings. Datum of gage is 450.27 ft above mean sea level, datum of 1929.
Discharge record. Stage-discharge relation defined by current-meter measurements.
Maxima. March-May 1965: Discharge, 11,200 cfs 1400 hours Apr. 6 (gage height, 20.54 ft).
1888 to February 1965: Discharge, 120,000 cfs Oct. 5, 1941 (gage height, 33.4 ft, from floodmarks).
Mean discharge, in cubic feet per second, 1965
Day
1...2...3...4...5. ..6___7. J8 ...9__.10..
March
2,2002,3501,250
470298222200272
1,2901,010
April
282200271
2,8501,4908,4403,5501,370
575385
May
164143125113100177105
908782
Day
11-.12..13..14..15..16..17..18_.19..20_-
March
635575695575398282
1,3203,260
970360
April
3,0804,2701,250
5154.6702,250
930590398300
May
75686456423833312926
Day
21..22..23..24..25..26..27..28..29..30..
Run ;)ff u} cLcrs-feet
March
210160148135125118118470
1,290890470
7340.94
45,160
April
232182150132
1,370970470320240182
1,3971.73
83,140
May
2322242222302834322616
62.20.08
3,820
ILLINOIS RIVER BASIN
(327) 5-5855. Illinois River at Meredosia, 111.
Location. Lat 39°49'36", long 90°33'53", in SE^NEi sec. 21, T.16 N., R.13 W., on left bank 0.3 mile downstream from bridge on State Highway 104 in Meredosia, 4j miles upstream from McKee Creek and at mile 71.1.
Drainage area. 25,300 sq mi, approximately.
Gage-height record. Water-stage recorder graph. Datum of gage is 418.00 ft above mean sea level, datum of 1929 (levels by Corps of Engineers).
Discharge record. Stage-fall-discharge relation defined by current-meter measure ments.
Maxima. April May 1965: Discharge, 55,000 cfs 0500 hours April 18; gage height, 17.65 ft 1000 hours to 1700 hours Apr. 19.
1938 to March 1965: Discharge, 123,000 cfs May 26-28, 1943; gage height, 28.61 ft May 26, 1943.
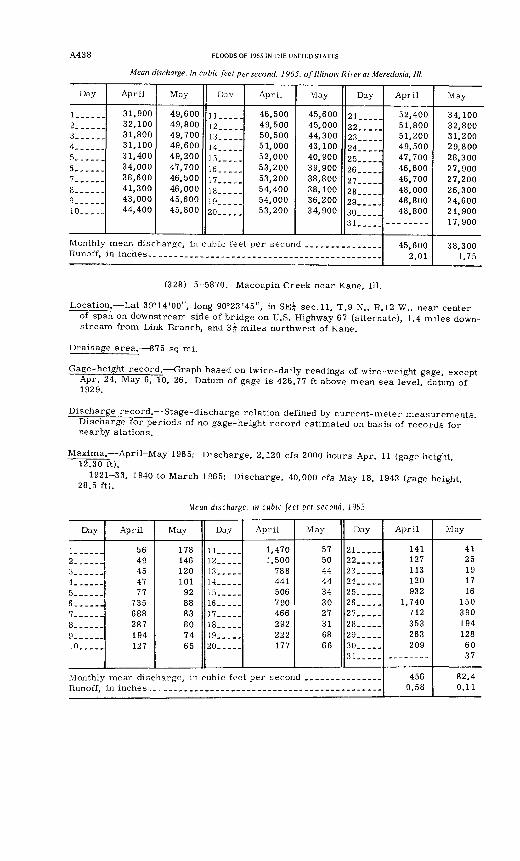
A438 FLOODS OF 1965 IN THE UNITED STATES
Mean discharge, in cubic feet per second. 1965, of Illinois River at Meredosia, III.
Day
1------2......3.....4______5......6... __7......8......9_____.10... ._
Monthly Runoff,
April
31,900 32,100 31,800 31,100 31,400 34,000 38,600 41,300 43,000 44,400
May
49,600 49,800 49,700 49,600 49,200 47,700 46,500 46,000 45,600 45,800
Day
11.....12... .13.-...14---_.]3-_-_.16..,-.17-....18.....19...--20,....
April
46,500 49,500 50,500 51,000 52,000 53,200 53,200 54,400 54,000 53,200
mean discharge, in cubic feet per secon in inches- . _ .
May
45,600 45,000 44,300 43,100 40,900 39,900 38,800 38,100 36,200 34,900
Day
22__ ...23..--24.. ..
2526_. ...27.. __on
9Q
30.....3 1
d ._.......--.
April
52,400 51,800 51,200 49,500 47,700 46,600 46,700 48,000 48,800 48,800
45,600 2.01
May
34,100 32,800 31,200 29,800 28,300 27,900 27,200 26,300 24,600 21,900 17,900
38,300 1.75
(328) 5-5870. Macoupin Creek near Kane, 111.
Location. Lat 39°14'00", long 90°23'45", in SE^ sec. 11, T.9 N., R.12 W., near center of span on downstream side of bridge on U.S. Highway 67 (alternate), 1.4 miles down stream from Link Branch, and 3| miles northwest of Kane.
Drainage area. 875 sq mi.
Gage-height record. Graph based on twice-daily readings of wire-weight gage, except Apr. 24, May 6, 10, 26. Datum of gage is 426.77 ft above mean sea level, datum of 1929.
Discharge record. Stage-discharge relation defined by current-meter measurements. Discharge for periods of no gage-height record estimated on basis of records for nearby stations.
Maxima. April-May 1965: Discharge, 2,120 cfs 2000 hours Apr. 11 (gage height 12.30 ft). '
1921-33, 1940 to March 1965: Discharge, 40,000 cfs May 18, 1943 (rage height 28.5 ft). '
Mean discharge, in cubic feet per second, 1965
Day
I. __ ..2-.___.3..-__.
5 ___ _.6 _._...
8 ......9__ ...
Monthly Runoff,
April
56 49 45 47 77
735 688 287 194 127
May
178 146 120 101
92 88 83 80 74 65
Day
11..... 12..._.13_.___14...,.15_____16.....17.....18 .....19.....20.....
April
1,470 1,500
788 441 506 790 466 292 222 177
mean discharge, in cubic feet per secon in inches
May
57 50 44 44 34 30 27 31 68 66
Day
21.. .__22 .....23.. ...24......25.. ...26.....27.. ...28.. ...29_____30... _.31.. ...
d .... __ ... .....
April
141 127 113 120 932
1,740 712 353 263 209
456 0.58
May
41 25 19 17 16
150 390 194 128 60 37
82.4 0.11
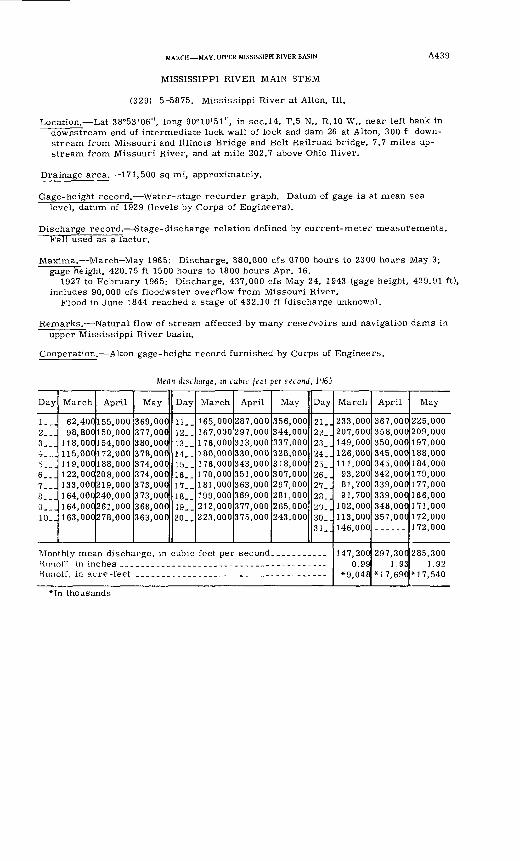
MARCH MAY, UPPER MISSISSIPPI RIVER BASIN A439
MISSISSIPPI RIVER MAIN STEM
(329) 5-5875. Mississippi River at Alton, 111.
Location. Lat 38°53'06", long 90°10'51", in sec.14, T.5 N., R.10 W., near left bank in downstream end of intermediate lock wall of lock and dam 26 at Alton, 300 f. down stream from Missouri and Illinois Bridge and Belt Railroad bridge, 7.7 miles up stream from Missouri River, and at mile 202.7 above Ohio River.
Drainage area. 171,500 sq mi, approximately.
Gage-height record. Water-stage recorder graph. Datum of gage is at mean sea level, datum of 1929 (levels by Corps of Engineers).
Discharge record. Stage-discharge relation defined by current-meter measurements. Fall used as a factor.
Maxima.- March-May 1965: Discharge, 380,000 cfs 0700 hours to 2300 hours May 3; gage height, 420.75 ft 1500 hours to 1800 hours Apr. 16.
1927 to February 1965: Discharge, 437,000 cfs May 24, 1943 (gage height, 429.91 ft), includes 90,000 cfs floodwater overflow from Missouri River.
Flood in June 1844 reached a stage of 432.10 ft (discharge unknown).
Remarks.- Natural flow of stream affected by many reservoirs and navigation dams in upper Mississippi River basin.
Cooperation. Alton gage-height record furnished by Corps of Engineers.
Mean discharge, in cubic feet per second, 1965
Day
1__.2...3...4__.5...6___7___8...9...10..
March
62,40098,800
118,000115,000119,000122,000133,000164,000164,000163,000
April
155,000150,000154,000172,000188,000208,000219,000240,000261,000278,000
May
369,000377,000380,000378,000374,000374,000373,000373,000368,000363,000
Day
11. _12..13..14_.15..16..17..18..19..20..
March
165,000167,000176,000180,000176,000170,000181,000199,000212,000223,000
April
287,000297,000313,000330,000343,000351,000363,000369,000377,000375,000
May
356,000344,000337,000328,000318,000307,000297,000281,000265,000243,000
Day
21..22..23..24..25..26..27..28..29..30..31..
Monthly mean discharge, in cubic feet per second... ___...._Ru'ioff in inchesRunoff, in acre -feet
March
233,000207,000149,000126,000111,00093,20081,70091,700
102,000113,000146,000
147,2000.99
*9,048
April
367,000358,000350,000345,000345,000342,000339,000339,000348,000357,000----..
297,3001.93
*17,690
May
225,000209,000197,000188,000184,000179,000177,000166,000171,000172,000172,000
285,3001.92
*17,540
*In thousands
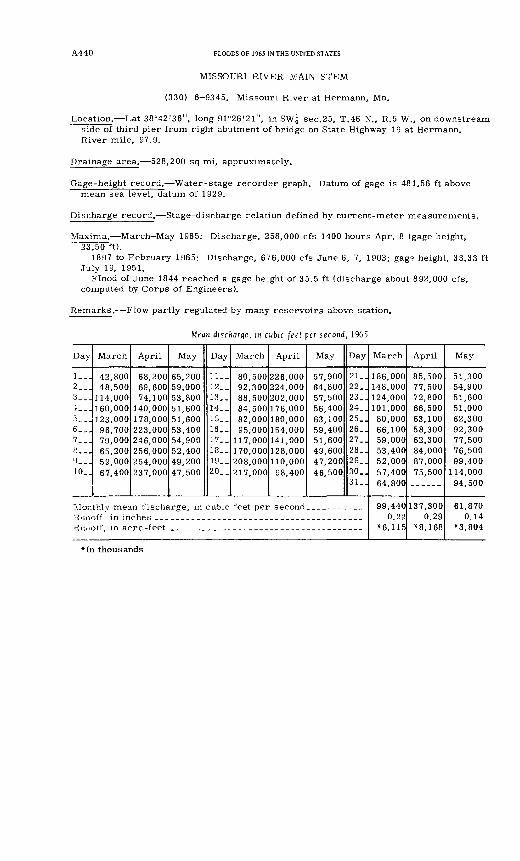
A440 FLOODS OF 1965 IN THE UNITED STATES
MISSOURI RIVER MAIN STEM
(330) 6-9345. Missouri River at Hermann, Mo.
Location. Lat 38°42'36" 1 long 91°26'21", in SW| sec.25, T.46 N., R.5 W., on downstream side of third pier from right abutment of bridge on State Highway 19 at Hermann. River mile, 97.9.
Drainage area. 528,200 sq mi, approximately.
Gage-height record. Water-stage recorder graph. Datum of gage is 481.56 ft above mean sea level, datum of 1929.
Discharge record. Stage-discharge relation defined by current-meter measurements.
Maxima. March May 1965: Discharge, 258,000 cfs 1400 hours Apr. 8 (gage height, 23.50 ft).
1897 to February 1965: Discharge, 676,000 cfs June 6, 7, 1903; gag? height, 33.33 ft July 19, 1951.
Flood of June 1844 reached a gage height of 35.5 ft (discharge about 892,000 cfs, computed by Corps of Engineers).
Remarks. Flow partly regulated by many reservoirs above station.
Mean discharge, in cubic feet per second, 1965
Day
1__.2...3...i_ --
5___6___7__-
K...9...10..
March
42,80048,500
] 14,000] 60, 000123,00096,70079,00065,20059,00067,400
April
68,20069,60074,100
140,000178,000223,000246,000256,000254,000237,000
May
65,20059,00053,80051,60051,60053,40054,90052,40049,20047,500
Day
11..12. _13..14..15. _16. _17. _18. _19__20..
March
80,50092,30088,50084,50082,00095,000
117,000170,000208,000217,000
April
226,000224,000202,000176,000180,000154,000141,000128,000110,00098,400
May
57,90064,80057,50056,40063,10059,40051,60049,60047,20046,500
Day
21..22..23..24..25..26..27..28..29..30..31..
Monthly mean discharge, in cubic feet per second.. ______ ___Haaoff in inchesRunotf, in acre -feet
March
186,000148,000124,000101,00080,00066,10059,00053,40052,00057,40064,800
99,4400.22
*6,115
April
85,50077,50072,80066,50063,10058,30062,30084,00087,00075,500------
137,3000.29
*8,168
May
51,30054,90051,60051,00062,30092,30077,50076,50099,400
114,00094,500
61,8700.14
*3,804
*In thousands
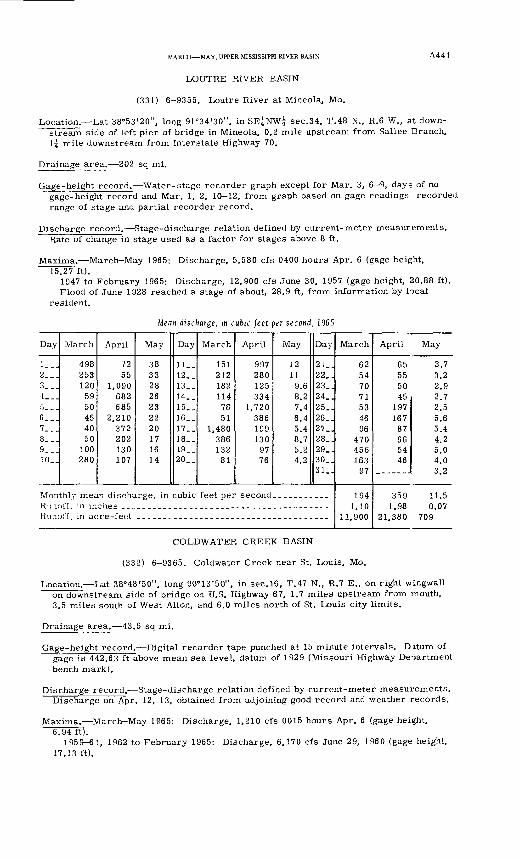
MARCH MAY, UPPER MISSISSIPPI RIVER BASIN A441
LOUTRE RIVER BASIN
(331) 6-9355. Loutre River at Mineola, Mo.
Location. Lat 38°53'20", long 91°34'30", in SE^NW^ sec.34, T.48 N., R.6 W., at down- stream side of left pier of bridge in Mineola, 0.2 mile upstream from Sallee Branch, 1^ mile downstream from Interstate Highway 70.
Drainage area. 202 sq mi.
Gage-height record. Water-stage recorder graph except for Mar. 3, 6-9, days of no gage-height record and Mar. 1, 2, 10-12, from graph based on gage readings recorded range of stage and partial recorder record.
Discharge record. Stage-discharge relation defined by current-meter measurements. Rate of change in stage used as a factor for stages above 8 ft.
Maxima. March-May 1965: Discharge, 5,580 cfs 0400 hours Apr. 6 (gage height, 15.27 ft).
1947 to February 1965: Discharge, 12,900 cfs June 30, 1957 (gage height, 20.88 ft). Flood of June 1928 reached a stage of about, 28.9 ft, from information by local
resident.
Mean discharge, in cubic feet per second, 1965
Day
1.-.2...3...4___5___6___7__.8 ---!9-.J10_.
March
498253120
5950454050
100280
April
7255
1,090682685
2,210372202130107
May
38332826232220171614
Day
11.-12..13-_14. _15..16..17..18..19..20..
March
151212182114
7851
1,480386132
81
April
997280125334
1,720386199130
9776
May
1211
9.68.27.46.45.48.75.24.2
Day
21..22..23..24_.25..26..27_.28..29_.30..31_.
Kunoff, in acre -feet
March
62547071534696
470456163
97
1941.10
11,900
April May
65 3.755 3.250 2.945
19716787665446
2.72.55.65.44.25.04.03 9.
OKQ 1 1 ^
1.98 0.0721,380 709
COLDWATER CREEK BASIN
(332) 6-9365. Coldwater Creek near St. Louis, Mo.
Location. Lat 38°48'50", long 90°13'50", in sec. 16, T.47 N., R.7 E., on right wingwall on downstream side of bridge on U.S. Highway 67, 1.7 miles upstream from mouth, 3.5 miles south of West Alton, and 6.0 miles north of St. Louis city limits.
Drainage area. 43.6 sq mi.
Gage-height record. Digital recorder tape punched at 15 minute intervals. Datum of gage is 442.63 ft above mean sea level, datum of 1929 (Missouri Highway Department bench mark).
Discharge record. Stage-discharge relation defined by current-meter measurements. Discharge on Apr. 12, 13, obtained from adjoining good record and weather records.
Maxima.- March-May 1965: Discharge, 1,210 cfs 0015 hours Apr. 6 (gage height, 6.94 ft).
1959-61, 1962 to February 1965: Discharge, 6,170 cfs June 29, 1960 (gage height, 17.13 ft).
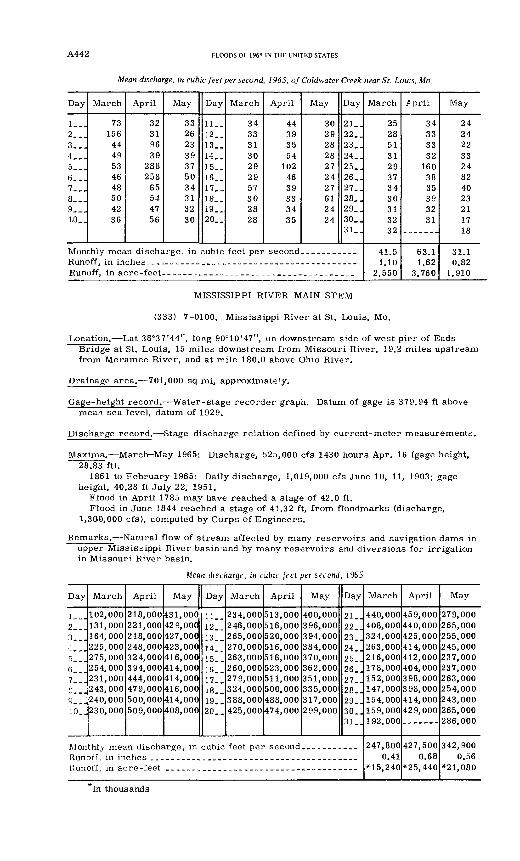
A442 FLOODS OF 1965 IN THE UNITED STATES
Mean discharge, in cubic feet per second, 1965, ofColdwater Creek near St. Lows, Mo.
Day
1...2___3...4 __5...6...7___8...9...1-0_.
March
731564449534648504236
April
32319639
288258
65544756
May
33262339375034313230
Day
11..12. _13_.14__15..16..17. _18..19..20-.
March
34333130292957302828
April
44393554
1024639333435
May
30292828272427612424
Day
21_.22..23..24..25..26..27..28..29..30..31
Runoff, in acre- feet------ ____ ____ _______ __ _____
March
2528513129373430313299
d.1 R
1.102.550
/pril
34333332
1603835393231
63.11 C n
3.760
May
2424223324824023211718
3110.82
1.910
MISSISSIPPI RIVER MAIN STEM
(333) 7-0100. Mississippi River at St. Louis, Mo.
Location. Lat 38°37'44", long 90°10'47", on downstream side of west pier of Eads Bridge at St. Louis, 15 miles downstream from Missouri River, 19.2 miles upstream from Meramec River, and at mile 180.0 above Ohio River.
Drainage area. 701,000 sq mi, approximately.
Gage-height record. Water- stage recorder graph. Datum of gage is 379.94 ft above mean sea level, datum of 1929.
Discharge record. Stage-discharge relation defined by current-meter measurements.
Maxima. March-May 1965: Discharge, 525,000 cfs 1430 hours Apr. 16 (gage height, 28.83 ft).
1861 to February 1965: Daily discharge, 1,019,000 cfs June 10. 11, 1903; gage height, 40.28 ft July 22, 1951.
Flood in April 1785 may have reached a stage of 42.0 ft.Flood in June 1844 reached a stage of 41.32 ft, from floodmarks (discharge,
1,300,000 cfs), computed by Corps of Engineers.
Remarks.- Natural flow of stream affected by many reservoirs and navigation dams in upper Mississippi River basin'and by many reservoirs and diversions for irrigation in Missouri River basin.
Mean discharge, in cubic feet per second, 1965
Day
1...2...3...4...S._.6...7__.C___!
9__ H10_.
March
102,000131,000164,000225,000275,000254,000231,000243,000240,000230,000
April
218,000221,000218,000248,000324,000394,000444,000479,000500,000509,000
May
431,000429,000427,000423,000416,000414,000414,000416,000414,000408,000
Day
11..12. _13. _14..15..16..17..18..19..20..
March
234,000246,000265,000270,000263,000260,000279,000324,000388,000425,000
April
513,000516,000520,000516,000516,000523,000511,000500,000488,000474,000
May
400,000396,000394,000384,000370,000362,000351,000335,000317,000299,000
Day
21..22..23..24..25..26..27..28..29..30..0 1
Monthly mean discharge, in cubic feet per second..... ______Runoff in inches __ ________Runoff, in acre-feet
March
440,000408,000324,000263,000216,000178,000152,000147,000154,000159,000192,000
247,8000.41
*15,240
April
459,000440,000425,000414,000412,000404,000398,000398,000414,000429,000
427,5000.68
*25,440
May
279,000265,000255,000245,000237,000237,000263,000254,000243,000265,000286,000
342,9000.56
*21,080
In thousands
MARCH MAY, UPPER MISSISSIPPI RIVER BASIN A443
REFERENCES CITED
Benson, M. A., 1962a, Evolution of methods for evaluating the occurrence of floods: U.S. Geol. Survey Water-Supply Paper 1580-A, 30 p.
1962b, Factors influencing the occurrence of floods in a humid region of diverse terrain: U.S. Geol. Survey Water- Supply Paper 1580-B, 62 p.
1964, Factors affecting the occurrence of floods in the southwest: U.S. Geol. Survey Water-Supply Paper 1580-D,70 p.
Dalrymple, Tate, 1960, Flood-frequency analyses: U.S. Geol. Survey Water-Supply Paper 1543 A, 77 p.
Ericson, D. W., 1961, Floods in Wisconsin, magnitude s.nd fre quency: U.S. Geol. Survey open-file report, 109 p.
Mitchell, W. D., 1954, Floods in Illinois, magnitude and frequency: Div. of Waterways, 111. Dept. Public Waters and Buildings , 386 p.
Patterson, J. L., and Gamble, C. R., 1968, Magnitude and frequency of floods in the United States; Part 5, Hudson Bay and Missis sippi River basins: U.S. Geol. Survey Water-Supply Pap^r 1678.
Prior, C. H., 1949, Magnitude and frequency of floods in Minne sota: Div. of Waters, Minn. Dept. Conservation Bull. 1, 128 p.
Prior, C. H., and Hess, J. H., 1961, Floods in Minnesota, magni tude and frequency: Div. of Waters, Minn. Dept. Conservation Bull. 12, 142 p.
Searcy, J. K., 1955, Floods in Missouri, magnitude and frequen cy: U.S. Geol. Survey Circ. 370, 126 p.
Schwob, H. H., 1953, Iowa floods, magnitude and frequency: Iowa Highway Research Board Bull. 1, 171 p.
1966, Magnitude and frequency of Iowa floods: Iowa High way Research Board Bull. 28, pt. 1, 47 p., pt. 2, 376 p.
U.S. Congress, Special House Subcommittee to Inspect Flooded Areas in the Upper Mississippi River Basin, 1965, Upper Mis sissippi River basin floods of April-May 1965: U.S. 89th Cong., 1st sess., House Comm. Print No. 13, 66 p.
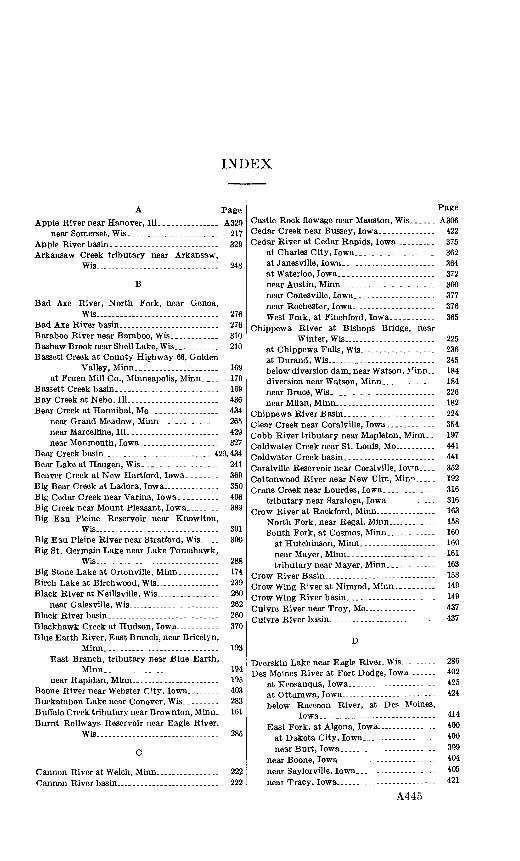
INDEX
A Page Apple River near Hanover, 111............... A329
near Somerset, Wis....................... 217Apple River basin........................... 329Arkansaw Creek tributary near Arkansaw,
Wis............................... 248
B
Bad Axe River, North Fork, near Genoa,Wis ---------.....--...-........ 276
Bad Axe River basin.--.-.................... 276Baraboo River near Baraboo, Wis............ 310B ashaw Brook near Shell Lake, Wis........... 210Bassett Creek at County Highway 66, Golden
Valley, Minn..................... 169at Fruen Mill Co., Minneapolis, Minn.... 170
Bassett Creek basin.......................... 169Bay Creek at Nebo, 111....................... 436Bear Creek at Hannibal, Mo.---------------- 434
near Grand Meadow, Minn_.............. 265near Marcelline, 111-.------.-------------- 429near Monmouth, Iowa_................... 327
Bear Creek basin-.---..---..-.-.-----...-.- 429,434Bear Lake at Haugen, Wis.------------------ 241Beaver Creek at New Hartford, Iowa. __.__._ 369 Big Bear Creek at Ladora, Iowa.............. 350Big Cedar Creek near Varina, Iowa__________ 406B ig Creek near Mount Pleasant, Iowa........ 389Big Eau Pleine Reservoir near Knowlton,
Wis.....-....-.....----..-.-.-... 301Big Eau Pleine River near Stratford, Wis..... 300Big St. Germain Lake near Lake Tomahawk,
Wis....-....... ............... 288Big Stone Lake at Ortonville, Minn..._._..__ 174 Birch Lake at Birchwood, Wis .. - - 239 Black River at Neillsville, Wis ............. 260
near Galesville, Wis.. .......-------.--- 262Black River basin.--------------.----.------- 260Blackhawk Creek at Hudson, Iowa_. ------- 370Blue Earth River, East Branch, near Bricelyn,
Minn..-.....-._-.....--.---.----- 193East Branch, tributary near Blue Earth,
Minn-.-.--..-..-..-.-.-.-. ... 194near Rapidan, Minn_-_._ _ _______ _ 195
Boone River near Webster City, Iowa........ 403Buckatabon Lake near Conover, Wis....- .. 283Buffalo Creek tributary near Brownton, Minn- 161 Burnt Rollways Reservoir near Eagle River,
Wis .. - _. - - --- 285
Cannon River at Welch, Minn--.----------- 222Cannon River basin_...................... 222
Page Castle Rock flowage near Mauston, Wis...... A306Cedar Creek near Bussey, Iowa. ------....... 422Cedar River at Cedar Rapids, Iowa_....... 375
at Charles City, Iowa.................... 362at Janesville, Iowa....- - -.-- --. 364at Waterloo, Iowa........................ 372near Austin, Minn ..................... 360near Conesville, Iowa._.__-_-_-_-_-_._-__ 377near Rochester, Iowa_.................. 376West Fork, at Finchford, Iowa ___________ 365
Chippewa River at Bishops Bridge, nearWinter, Wis ------------------ 225
at Chippewa Falls, Wis................... 236at Durand, Wis .....---------.....-.. 245below diversion dam, near Watson, Mtnn 184diversion near Watson, Minn............. 184near Brace, Wis.......................... 226near Milan, Minn-.-.-.------------------ 182
Chippewa River Basin. ----- --------- 224Clear Creek near Coralville, Iowa..__.____-__ 354Cobb River tributary near Mapleton, Minn.. 197Coldwater Creek near St. Louis, Mo~........ 441Coldwater Creek basin.-....-.--------------- 441Coralville Reservoir near Coralville, lova,. 352Cottonwood River near New Ulm, Mur>_. _ 192Crane Creek near Lourdes, Iowa.__.-____ - 316
tributary near Saratoga, Iowa.._. ____. 316Crow River at Rockford, Minn.- ._. -. 163
North Fork, near Regal, Minn -------- 158South Fork, at Cosmos, Minn......... . 160
at Hutchinson, Minn.-------------- 160near Mayer, Minn.------- ----------- 161tributary near Mayer, Minn-__. . - 163
Crow River Basin.------------- ----------- 158Crow Wing River at Nimrod, Minn. ___-- . 149Crow Wing River basin..------------------- 149Cuivre River near Troy, Mo --------------- 437Cuivre River basin___._ _ - - - - 437
D
Deerskin Lake near Eagle River, Wis _-._ 286Des Moines River at Fort Dodge, Iowa ------ 402
at Keosauqua, Iowa._.- ------- 425at Ottumwa, Iowa____-_ - --- 424below Raccoon River, at Des Monies,
Iowa-.--.----------------------- 414East Fork, at Algona, Iowa ..-..-.--. 400
at Dakota City, Iowa...-.. ------ 400near Burt, Iowa..---------------------- 399
near Boone, Iowa---. - .- ----------- 404near Saylorville, Iowa... -.--------- 405near Tracy, Iowa...---------------------- 421
A445
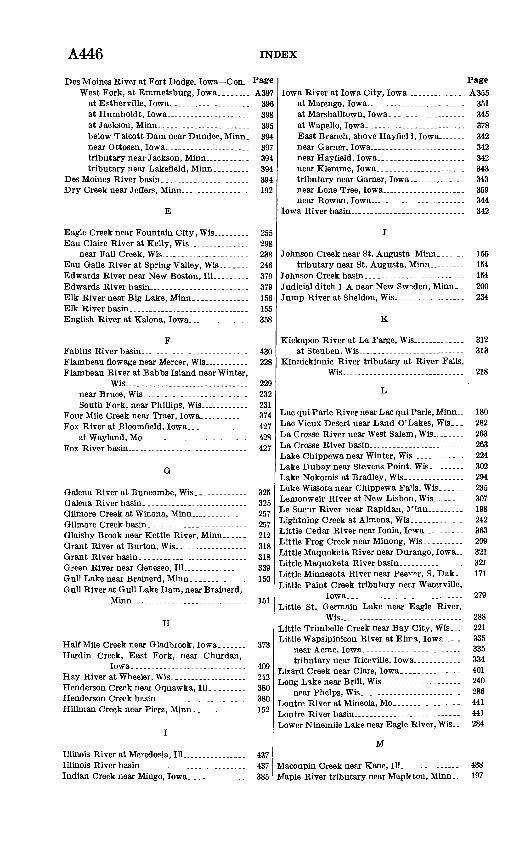
A446 INDEX
Des Moines River at Fort Dodge, Iowa Con. Page West Fork, at Emmetsburg, Iowa........ A397
at Estherville, Iowa.................... 3%at Humboldt, Iowa-.................... 398at Jackson, Minn....................... 395below Talcott Dam near Dundee, Minn. 394 near Ottosen, Iowa..................... 397tributary near Jackson, Minn_........ 394tributary near Lakefl eld, Minn......... 394
Des Moines River basin...................... 394Dry Creek near Jeflers, Minn..._............. 192
E
Eagle Creek near Fountain City, Wis......... 255Eau Claire River at Kelly, Wis-.............. 298
near Fall Creek, Wis_-.................... 238Eau Galle River at Spring Valley, Wis....... 246Edwards River near New Boston, 111......... 379Edwards River basin___.- _.__.._ _ _ 379Elk River near Big Lake, Minn.............. 156Elk River basin.............................. 155English River at Kalona, Iowa.-------------- 358
Fabius River basin...........................Flambeau flowage near Mercer, Wis_ --------Flambeau River at Babbs Island near Winter,
Wis...............................near Bruce, Wis..........................South Fork, near Phillips, WiS ---------
Four Mile Creek near Traer, Iowa------------Fox River at Bloomfield, Iowa.--------------
at Wayland, Mo---._.....................Fox River basin..............................
G
Galena River at Buncombe, Wis..._-_-__... Galena River basin. _____.....___ Gilmore Creek at Winona, Minn_----------Gilmore Creek basin _._._.__.._._.___..-__.. Glaisby Brook near Kettle River, Miim... Grant River at Burton, Wis--.....----------Grant River basin... ___.-_ ___ Green River near Geneseo, 111.. ..........Gull Lake near Brainerd, Minn.......-...--Gull River at Gull Lake Dam, near Brainerd,
Minn............................
H
Half Mile Creek near Gladbrook, lowa......Hardin Creek, East Fork, near Churdan,
Iowa -_ _ ..__, . . Hay River at Wheeler, Wis..................Henderson Creek near Oquawka, 111. .......Henderson Creek basin,..._._________.______.Hillman Creek near Pierz, Minn.............
Illinois River at Meredosia, Ill- Illinois River basin-_-_---.--_-.. Indian Creek near Mingo, Iowa..
430228
229232231374427428427
325325257257212318318339150
151
373
409242380380152
437437385
Page Iowa River at Iowa City, Iowa........._... A355
at Marengo, Iowa_...................... 351at Marshalltown, Iowa................... 345at Wapello, Iowa......................... 378East Branch, above Hayfleld, Iowa...... 342near Garner, Iowa__.................... 342near Hayfleld, Iowa..-_---------------- 342near Klemme, Iowa........._.......... 343tributary near Garner, Iowa..... _ ------ 343near Lone Tree, Iowa__................ 359near Rowan, Iowa_-------------------- 344
Iowa River basin_. .......-...-.-.-..-..-. 342
Johnson Creek near St. Augusta Minn....... 155tributary near St. Augusta, Minn-..-.---- 154
Johnson Creek basin......--....-....-.-..-.. 154Judicial ditch 1-A near New Sweden, Minn.. 200Jump River at Sheldon, Wis..........-------- 234
K
Kickapoo River at La Farge, Wis .... ... 312at Steuben, Wis ----------------------- 313
Kinnickinnic River tributary at River Falls,Wis ..- ----. - - 218
Lac qui Parle River near Lac qui Parle, Minn- 180Lac Vieux Desert near Land O'Lakes, Wis... 282La Crosse River near West Salem, WIs........ 263La Crosse River basin_.----_-__---._--------- 263Lake Chippewa near Winter, WLs............. 224Lake Dubay near Stevens Point, Wis._------- 302Lake Nokomis at Bradley, Wis.........---.. 294Lake Wissota near Chippewa FaMs, Wis...... 235Lemonweir River at New Lisbon, Wis_...- 307Le Suenr River near Rapidan, fl cuin___ --_- 198Lightning Creek at Almena, Wis............. 242Little Cedar River near Ionia, leva....--.... 363Little Frog Creek near Minong, Wis. --------- 209Little Maquoketa River near Durango, Iowa.- 321Little Maquoketa River basin,.-........-.--. 321Little Minnesota River near Peever, S. Dak._ 171 Little Paint Creek tributary ne?,r Waterville,
Iowa...----------_-_------.------ 279Little St. Germain Lake near Eagle River,
Wis...... -------------- 288Little Trimbelle Creek near Bay City, Wis.. - 221Little Wapsipinicon River at Elira, Iowa_--_. 335
near Acme, Iowa,-...-...-.-........-..-- 335tributary near Riceville, Iowa___ __ . 334
Lizard Creek near Clare, Iowa.....-.....---- 401Long Lake near Brill, Wis..-- -.- ..---- 240
near Phelps, Wis...---------------------- 286Loutre River at Mineola, Mo.---------------- 441Loutre River basin.-------------.------------ 441Lower Ninemile Lake near Eagle River, Wis-- 284
M
Macoupin Creek near Kane, 111. 438Maple River tributary near Maple ton, Minn.. 197
INDEX A447Page
Maquoketa River near Manchester, Iowa..... A326near Maquoketa, Iowa_................. 328
Maquoketa River basin.._.................. 326Middle Fabius River near Monticello, Mo._-. 431Middle Fork Crow River near Spicer, Minn.. 158Middle Raccoon River at Panora, Iowa._... 410Middle River near Indianola, Iowa..._....- 417Mill Creek at Milan, IU._..,__................ 341
tributary near Chatfleld, Minn..._....... 265Minnehaha Creek at 50th Street, Edina, Minn. 170
at Minnehaha Ave., Minneapolis, Minn_.. 171at Minnetonka Mills, Minn............... 170
Minnehaha Creek basin........_.....__...... 170Minnesota River at Interstate Highway 35W
at B loomington, Minn............ 205at Mankato, Minn...._...._...._...._ 199at Montevideo, Minn..................... 184at Ortonville, Minn_.................... 175near Carver, Minn_.. . ___ 201near Lac qui Parle, Minn_................ 181
Minnesota River basin._. _ _ 171Minocqua Lake near Minocqua, Wis ---------- 292Mississippi River at Aitkin, Mini;............ 146
at Alton, 111..................V..---.-.--- 439at Burlington, Iowa.---.-----.--.-------- 381at Clinton, Iowa,-.-..................... 332at Davenport, Iowa.......---..-.-------. 337at Dubuque, Iowa..---------------------- 323at Elk River, Minn __...__......... 157at Keokuk, Iowa...-.-.--................ 391at La Crosse, Wis........................ 264at Lansing, Iowa......_- -- -- 277at lock and dam 3 near Red Wing, Minn.- 221at lock and dam 4 near Alma, Wis.._--__- 248at lock and dam 5 near Minneiska, Minn-. 255at McGregor, Iowa..._.--_---..-._-.----- 280at Prescott, Wis...._..._................. 219at St. Louis, Mo-........--.-..---...-.... 442at St. Paul, Minn...__......_..---_-.-_-.. 206at Winona, Minn............ ...---..... 256below Sandy River near Libby, Minn.... 145main stem-...--....-.-.-----..-----...... 145,
152, 157, 168, 219, 221, 248, 253, 256, 264, 277, 280, 323, 332, 337, 381, 391, 439, 442
near Anoka, Minn...---.-----....-....... 168near Royalton, Minn..................... 152
Missouri River at Hermann, Mo.............. 440main stem............-.---...-----.....-. 440
Moose Lake near Winter, Wis...___..._....._. 224Mormon Creek near La Crosse, Wis_..,..... 275Mormon Creek basin.....-...---.-.----.---.- 275Morris Creek tributary near Norwalk, Wis_. 312
N
Namekagon River near Trego, Wis....-..-.-. 208Nine Mile Creek at Bloomington, Minn....... 204North Fabius River at Monticello, Mo.....___ 430North Pelican Lakes near Rhinelander, Wis.. 291North Raccoon River near Jefferson, Iowa... 408
near Sac City, Iowa...................... 407North River at Palmyra, Mo.---.........- . 433
near Norwalk, Iowa.---.---..------------ 415North River basin..._________________________ 433North Skunk River near Sigourney, Iowa.... 388
O Page Otsego Creek near Otsego, Minn..........__ A155Otsego Creek basin.--------.................. 155Otter Creek near Lester Prairie, Minn........ 160
tributary near Lester Prairie, Minn....... 161
Paint Creek at WaterviUe, Iowa.............. 278near Waterville, Iowa (crest-stage strt.ion). 279
Paint Creek basin...._.........._........ 278Pelican Lake near Pelican Lake, Wis......... 290Petenwellflowagenear Necedah, Wis......... 304Pickerel Lake near Lake Tomahawk, Wis.... 289Pine Creek near Cannon Falls, Minn.._...... 222
East Branch, tributary near Dallas, Wis.. 241 Pine River at Cross Lake Dam at Cross Lake,
Minn-.----...--....--.....-.--.-.....--.. 149Pine River basin.---..._--....----------.-.-. 148Pine River Reservoir at Cross Lake, M ;nn... 148Platte River near RockviDe, Wis. ------------ 320Platte River basin -.-__-_-------_-- 152,320Plum River below Carroll Creek, near Sa-
vanna, 111.._..._........._.--....-.-.....- 331Plum River basin------..---------.-.-.---.- 331Pomme de Terre River at Appleton, Minn.-- 179Pope Creek near Keithsburg, 111-......... . 380Pope Creek basin. .-.-_.-.---.---_--..-.--- 380Poplar River near Owen, Wis----------_-.. 260Prairie River near Merrill, Wis~.------------ 295
R
Raccoon River at Van Meter, Iowa.---------- 413Rainbow Lake near Lake Tomahawk, Wis... 290Ralston Creek at Iowa City, Iowa...-------- 356
South Branch; at Iowa City, Iowa..___.-. 357Rapid Creek near Iowa City, Iowa.---------- 353Raven Stream tributary near New Prague,
Minn..--.......---------.--------.----. 203Red Cedar Lake at Mikana, Wis_............ 239Red Cedar River at Menomonie, Wis. _-__.- 243
near Colfax, Wis.......-...-..-...-..-.- 242Redwood River at Marshall, Minn..--------- 188
near Redwood Falls, Minn --------------- 190Rest Lake near Manitowish, Wis __ . - 228Rice Lake tributary near Montgomery, Minn- 203Richland Creek near Haven, Iowa. _._._ - 347Robinson Brook near Onamia, Minn__.._. - 165Rock River at Moline.Ill.------------------- 340
near Joslin, 111-...-.--....-.-.--.---... - 338Rock River basin..------------------------- 338Root River below South Fork near Houston,
Minn.-.....-..-----------.------ 275near Houston, Minn _._ ._ . _ . 271near Lanesboro, Minn...........-...--..- 267near Rushford, Minn._ -_ . 269South Branch, at Lanesboro, Minn,..-__. 266
at Preston, Minn...------------------- 266South Fork, near Houston, Minn ----- 273
Root River basin....-_-- ------.---------- 265Rum River at Isanti, Minn__...------------ 166
at Spencer Brook, Minn...-------------- 165at West Point, Minn...------------- - 166near St. Francis, Minn..----------------- 167tributary near Onamia, Minn_. . - 165
A448 INDEX
PageRum River basin............................ A165Rush Creek near Rushford, Minn... __..... 269
S
St. Croix River at Prescott, Wis..-..--....-.- 218at St. Croix Falls, Wis...._..-.--._._.._ 216near Danbury, Wis....................... 209near Grantsburg, Wis_................... 211near Rush City, Minn_.............__ 214
St. Croix River basin.--------__-...._... 208St. Francis River at Santiago, Minn.-.._... 156
near Big Lake, Minn.. . 156Salt Creek near Elberon, Iowa.-------------- 348Salt River near New London, Mo ------------ 435Salt River basin--..----..................... 435Sand Creek at Jordan, Mhin.-.--------_... 204
near New Prague, Minn..---------------- 203tributary near Montgomery, Minn- ---..-. 202
Sauk River near St. Cloud, Minn-...-------- 153Sauk River basin _---_.---_----------.----- 153Sawyer Creek near Shell Lake, Wis. ---------- 210School Lake Creek tributary near St. Michael,
Minn.-..------...-------.-------- 164Scotch Creek tributary near Edgar, Wis... - -. 297Sevenmile Lake near Eagle River, Wis.. _.. 284Shell Rock River at Shell Rock, Iowa,....... 368
near Northwood, Iowa..._............. 366Skunk River at Augusta, Iowa.-------------- 390Skunk River basin.-----._................... 383Snake River near Pine City, Minn........... 213South Fabius River near Taylor, Mo.---.---. 432South Raccoon River at Redfleld, Iowa. _.. 411South River near Ackworth, Iowa............ 418South Skunk River below Squaw Creek near
Ames, Iowa..._................ 384near Ames, Iowa..------.------.-....---- 383near Oskaloosa, Iowa..................... 387
Spirit River flowage near Tomahawk, Wis-. - 294Spring Creek near Durand, Wis....-_...... 248
near Sleepy Eye, Minn........._....... 191Squirrel Lake near Mmocqua, Wis............ 292Stanchfleld Creek tributary near Day, Minn.. 166Stony Brook tributary near Foley, Minn..... 155Story Brook near Petersburg, Minn________ 396Sugar Camp Reservoir near Eagle River, Wis. 287Sugar Creek near Keokuk, Iowa.._____ 426Sunrise River near Stacy, Minn___..___ 215
TThe Sny basin_......___......._...... 436Timber Creek near Marshalltown, Iowa...... 346Trempealeau River at Arcadia, Wis...... _. 257
at Dodge, Wis....--.----......----.---.-. 259Trempealeau River basin........__....__ 257Trimbelle Creek basin .- .-..-.......__ 221Turkey River at Garber, Iowa. __...... _ 316
at Spillville, Iowa........................ 315Turkey River basin......---_----............ 315Twin Lakes near Phelps, Vfia................. 282
U PageUpper Iowa River at Decorah, Iowa_..._ A276 Upper Iowa River basin...................... 276
Vermillion River basin.............__...... 221Vermillion River tributary rear Hastings,
Minn....----.........-.-......... 221
W
Walnut Creek near Hartwick, Iowa........... 349Wapsipinicon River at Indepenience, Iowa.- 335
nearDeWitt, Iowa....._____.__._____.,__ 336near Elma, Iowa__..._....._...... 333
Wapsipinicon River basin.___............. 333Watonwan River near Garden City, Minn.... 195
North Fork, near Delft, Minn............ 195Waumandee Creek basin.........-.--...-..-. 255Wexford Creek basin.-........................ 277Wexford Creek near Harpers Ferry, Iowa...... 277Whetstone River near Big Stone City, S. Dak. 173White Breast Creek near Dallas Iowa........ 419Whitewater River, South Fork, near Altura,
Minn...-..-.....--..-.---......-. 253Whitewater River basin..............._.... 253Willow Creek near Eau Claire, T^is.......... 238Willow Reservoir near Hazelhurst, Wis....... 293Winnebago River at Mason City, Iowa....... 367Wisconsin River at Bridgeport, Wis...._.... 314
at Merrill, Wis.. - - .-. 296at Muscoda, Wis..-..-.......----- .-. 311at Rothschild, Wis......-...-...-.-...-.-- 299near Wisconsin Dells, Wis.... .-- 309at Wisconsin Rapids, Wis--..------.---.-- 303
Wisconsin River basin-..__...-. .-..-.-.. 282Wolf Creek tributary near Sandstone, Minn.. 213Wyaconda River above Canton, Mo.......... 430Wyaconda River basin..-..--....--.-....---- 430
Yellow Bank River near Odessr, Minn....... 177Yellow Medicine River near Granite Falls,
Minn....---.-.......--.-...-- 187South Branch, at Minneota, Minn__. _ 186
Yellow River at Babcock, Wis...--------- 305at Cadott, Wis............ . ... 235
Zumbro River at Zumbro Falls, Minn_....... 251North Fork, tributary near Wanamingo,
Minn..... - -- 251South Fork, near Rochester, Minn_.... 249
Zumbro River basin....._.______ ------.-- 249
o