Embed Size (px)
Citation preview

University of the Pacific University of the Pacific
Scholarly Commons Scholarly Commons
University of the Pacific Theses and Dissertations Graduate School
1982
Flow Injection Atomic Absorption Assay Of Copper And Zinc In Flow Injection Atomic Absorption Assay Of Copper And Zinc In
The Plasma Of Age Dependent Audiogenic Seizure Susceptible The Plasma Of Age Dependent Audiogenic Seizure Susceptible
Mice Mice
Neal Dwain Byington University of the Pacific
Follow this and additional works at: https://scholarlycommons.pacific.edu/uop_etds
Part of the Chemistry Commons
Recommended Citation Recommended Citation Byington, Neal Dwain. (1982). Flow Injection Atomic Absorption Assay Of Copper And Zinc In The Plasma Of Age Dependent Audiogenic Seizure Susceptible Mice. University of the Pacific, Dissertation. https://scholarlycommons.pacific.edu/uop_etds/3006
This Dissertation is brought to you for free and open access by the Graduate School at Scholarly Commons. It has been accepted for inclusion in University of the Pacific Theses and Dissertations by an authorized administrator of Scholarly Commons. For more information, please contact [email protected].

FLOW INJECTION ATOMIC ABSORPTION ASSAY OF COPPER
AND ZINC IN THE PLASMA OF AGE DEPENDENT AUDIOGENIC
SEIZURE SUSCEPTIBLE MICE
by
Neal Dwain Byington
A dissertation
submitted in -partla~, fulfillment
of the requir~ments for th~ degree of
Doctor of Philosophy in the Department of Chemistry ' ,'· ..... ·
Presented to the Graduate Faculty of the
University of the Pacific
May 1982
I I

This dissertation, written and submitted by
Neal Dwain Byington
is approved for recommendation to the Committee
on Graduate Studies, University of the Pacific
Dean of the School or Department Chairman:
Dissertatfon \
Dated
Chainnan
May 19, 1982 ----------------------------------------

ABSTRACT OF DISSERTATION
by Neal Dwain Byington
FLOW INJECTION ATOMIC ABSORPTION ASSAY OF COPPER AND ZINC IN THE
PLASMA OF AGE DEPENDENT AUDIOGENIC SEIZURE SUSCEPTIBLE MICE
Flow injection atomic absorption procedures with less than 10%RSD at 1.0 ppm were developed for the assay of copper and zinc
in 10 11L samples of mouse plasma. The flow injection apparatus
was designed with a pulseless liquid flow control system, regulated
by inert gas pressure. The aspiration liquid is 6% t-butanol in water. After exhaustive parameter optimizations, copper assays
were conducted with the conventional air-acetylene flame at
324.754 nm and zinc assays were conducted with the unconventional argon-hydrogen air diffusion flame at 213.856 nm. The argonhydrogen flame system was chosen because it abs.orbs very little
ultraviolet light. The developed methods were used to determine the concentration
of copper and zinc in plasma samples from six strains ( C57BL/6J,
LG/J, DBA/2J, SJL/J, BALB/cJ, LP/J ) of male and female audiogenic seizure susceptible mice, aged 18 to 65 days. The results are
presented in 24 sets of data and graphs of metal concentrations
versus mouse age.
The copper concentration, within the preclSlon of the data, is 1.2 ppm i 0.2 SD for all sexes, strains, and ages. The zinc
concentrationj within the precision of the data, increases from
1.2 ppm+ 0.2 SD at twenty days of age to 1.8 ppm i 0.2 SD at
sixty days of age for all sexes and strains. There is no correlation between ·the age dependence of the
seizure susceptibility of any sex or strain of mice and the plasma
concentrations or concentration ratios for either copper or zinc.
At any age there is no correlation between the relative seizure
susceptibility among the strains of mice and their concentrations
or concentration ratios for either copper or zinc.
The results cast doubt on the significance of copper and zinc
concentrations for the epilepsy of humans receiving anticonvulsant
medication and on the validity of the use of audiogenic seizure
susceptible mice as a model for epilepsy. Additional experiments
are suggested.
I I =

DEDICATION
~-
------~'rh--i-s-d-i-s--g-e-I!-t-a.-t-i-G-n-i-s-<i-e:d4-s--a.-t-e£l~t-e-m-y-"tv-i-f-e,-------J-a-n-i-e-e~.-------~
Her interest, support, encouragement, and presence were
instrumental in making our leisurely progress through
graduate school a generall.y pleasan.t. and. intellectually
satisfying experience.
iii
I I

---~~-- -----------· -·
ACKNOWLEDGMENTS
I extend my thanks and gratitude to my research
director, Professor Herschel Frye. His cheer£ul disposition,
sharp wit, and vast breadth. of interests enabled him to
maintain an enjoyable, lively, and humane· research gc:::r~o-=u:gp~·'---------,
His ability to judge when. to leave. a graduate student alone
to develop, mature, and work at his own. natural pace 1vas
priceless and unfor.get.table .... I shall.miss this very rare
man and most sensitive mentor.
_ I, extend my thanks and gratitude to the faculty and
staff of the Department of Chemistry for their advice,.
patience, help, encouragement, and friendship during my
tenure as a graduate student.
I extend my thanks and gratitude to my parents,
grandparents, brothers, sister, relatives, and in-laws
for their active support and encouragement of this
educational endeavor.
iv
I ~

TITLE
APPROVAL
DEDICATION
ACKNOWLEDGMENTS
CONTENTS
LIST OF TABLES
LIST OF FIGURES
CONTENTS
ABSTRACT OF DISSERTATION
CHAPTER ONE
1. Atomic Absorption Flow Injection Analysis
1.1 Atomic Absorption Flow Injection Analysis
1.2 Instrument Design for Flow Injection Analysis
1~3 Optimal Parameter Development for the Instrument
1 .3 .1
1 .3 •. 2
1 •. 3. 3
1.3.4
1.3.5
1.3.6
1.3.7
1.3.8
1.3.9
1.3.10
Analytical Wavelengths
Optical System
Flame Composition
Burner Head and Nebulizer Selection
Burner Head Height Selection
Selection of the Fuel/Oxidant Ratio
Sample Injection Size
Solvent Composition
Solvent Flow
Matrix Matching of Standard Solutions
Page
i
ii
iii
iv
v
viii
xii
XV
1
1
3
13
15
15
21
23
27
28
31
33
36
39
54
1.4 Instrumental Parameters for Atomic Absorption 79
v
i~
-

1.5 Standard Calibration Curves for Copper and Zinc
1.6 Data Analysis Programs and Procedures
1 • 6.1
1.6.2
1.6.3
Program to Calculate Absorbance Values
from Peak Height
Program to Calculate Absorbance Values
Program to Calculate Peak Heights from
Absorbance Values
Page
81
87
87
90
91
1.6 .. 4
CHAPTER TvlO
Procedures and Criteria for Data Analysis 92
2. Audiogenic Seizure Susceptible Mouse Model
of Epilepsy
CHAPTER THREE
3. Experimental
3.1 Animal Husbandry
3.1 .1 Mouse Cages and Racks
3.1.2. Mouse Water
3.1.3 Mouse Diet
3.1 .4 Mouse Bedding
3.1. 5 · Cage Cleaning
3.1 .6 Mouse Room Environment
3.1.7 Evolving Number System
3.1.8 House Plasma
vi
94
94
1 01
101
101
101
1 01
102
104
104
104
105
105
i

3.2 Miscellaneous Experimental Details
3.2.1
3.2.2
3.2.3
3.2.4
3.2.5
Water
Atomic Absorption Standards
Polyethylene Containers
Syringes
Atomic Absorption Lamps
Page
107
107
108
108
108
108
------~GHAETER-RQUR-------------------------------------------109·----------
Results and Discussion
CHAPTER FIVE
5. Claims to Originality
LITERATURE CITED
APPENDIX
A. Tables and Figures of Plasma Copper and Zinc
Concentrations by Age
109
124
124
126
130
131
A.1 .1 Tables of Plasma Copper Concentrations 131
by Age
A.1 .2 Tables of Plasma Zinc Concentrations 143
by Age
A.1.3 Figures of Plasma Copper Concentrations 155
versus Age
A.1. 4 Figures of Plasma Zinc Concentrations 179
versus Age
vii
I I

1 .1 .1
1 • 1 • 2
1.3.1.1
1.3.1.2
1.3.1.3
1.3.1.4
1.3.2.1
1.3.2.2
1.3.4.1
1.3.5.1
1.3.5.2
LIST OF TABLES
The Minimal Amount of Model Compounds
Detectable by Use of a Silicon Doped
Hydrogen Atmosphere Flame Ionization Detector
Comparison of Metal Analysis Parameters
Ground State Lines Near the Copper Line
at 324~754 nm for Various Metals
Ground State Lines Near the Zinc Line
at 213.856 nm for Various Metals
Metal Lines vJhich Can Overlap the Copper
Line at 324.754 nm and .the Zinc Line at
213.856 nm
Interference Absorbance by Various Metals
at Copper and Zinc Wavelengths
Optical System for the Perkin-Elmer Model
303 Atomic.Absorption Spectrometer
Page
5
6
17
18
19
20
21 ..
Optical Slit Dimensions for the Perkin- 22
Elmer Model 303 Atomic Absorption Spectrometer
Burner Head and Nebulizer Comparison
Selection of the Burner Height for Copper
Standard(2 ppm)
Selection of the Burner Height for Zinc
Standard(2 ppm)
viii
27
29
30
I I

·-~·-·----------
Page
1.3.6 .. 1 Selection of the Fuel/Oxidant Ratio for Copper 32
Standard(5 ppm) [
~ s 1.3.7.1 Sample Injection Sizes for Copper 34
~
Standard(2 ppm) .
1 .. 3.7.2 Sample Injection Sizes for' Zinc 35
Standard(2 ppm)
----1: .. -J-.-7-.-J--L-a-~g-e-S~a-m-p-1-e-I-n~-e-e-t-i-e-n-8-i-z-e-s-f.e-r-G--e-pp-eT·----~"·7----·
Standard(1 ppm)
1.3.8.1
1 • .3.9.1
Solution Effects on Flame Copper Absorbance
Pressure in the Helium Reservoir versus
Flow Rate
1 .. 3.9.2 Zinc Absorbance and %RSD versus Flow Rate
1.3.9.3 Copper Absorbance and %RSD versus Flow Rate .. 1.3.10.1 Matrix Matched Coppe.r Standards
1.3.10.2 Standard Additions of Aqueous Copper
Standards to Pooled Human Plasma
38
41
42
43
57
60
1.3.10.3 Standard Additions of Matrix Matched Copper 63
Standards to Pooled Human Plasma
1.3.10.4 Matrix Matched Zinc Standards
1. 3.1 0. 5 Standard. Additions of Aq.ueous. Zinc Standards
to Pooled Human Plasma
1.3.10.6 Standard Additions. of Matrix Matched Zinc
Standards to Pooled Human Plasma
1.3.10.7 Copper and Zinc Standard Solutions
ix
66
69
72
75
-
I i !i ~ ;

1.3.10.8 Copper and Zinc Standard Solutions in Pooled
Human Plasma
1~3.10.9 Slopes of Aqueous and Matrix Matched
Standard Curves
1. 5.2
2.1
Instrumental Parameters for Atomic Absorption
Absorbance of Aqueous Copper Standards
Absorbance of Aqueous Zinc Standards
DBA/2J Mouse Age versus Percent Seizure
Susceptibility
3~1.3.1 'Diets
3.1.3.2 Diet Composition
4.1 .1
4.2.1
A.1.1.1
.1
.2
.3
.4
.5
.6
Linear Least Squares Calculated Copper
Concentration by Age
Linear Least Squares Calculated Zinc
Concentration by Age
Male _;._.. __ _
by Age
C57BL/6J
LG/J
DBA/2J
SJL/J
BALB/cJ
LP/J
Plasma Copper Concentrations
X
Page
76
78
80
81
84
98
102
103 ' '
111
116
131
132
133
134
135
1.36
i

Page --
A.1.1.2 Female Plasma Copper Concentrations ~-
by Age 52:-
" ~ .. 1 C57BL/6J 137 ~
.. , .
LG/J 138 ..
•. 2
.J DBA/2J 139
.4 SJL/J 140
.5 BALB/cJ 141
.6 LP/J 142 ' A.1.2.1 Male Plasma Zinc Concentrations
by Age
•. 1 C57BL/6J 143 -
.2 LG/J 144 i fk
.3 DBA/2J 145 ~ E
.4 SJL/J 146
.5 BALB/cJ 147
.6 LP/J 148
A.1.2.2 Female Plasma Zinc Concentrations -----
by Age I .1 C57BL/6J 149 ~ .2 LG/J 150 --
.3 DBA/2J 1 51 -
= .4 SJL/J 152 e;
~
.5 BALB/cJ 1.53 = -
.6 LP/J 154 --
-
xi

1 • 1 • 1
1 • 2 .. 1
LIST OF FIGURES
Experimental Peak Shapes
Flow Injection Apparatus
Percent Absorption versus Wavelength for
the Two Flames
Page
9
1 1
25
--------'.1 • 3.-9.--i--P-:r-e-s-s-u-:r-e-i-n-t-h-e-H-e-l-i-a-m-R-e-s-e~-v-e-i-p-v-er-s-u-s~--~4-fr-' -----,
Flow Rate
1.3.9.2 Zinc Absorbance versus Flow Rate
1.3.9.3 Zinc %RSD versus Flow Rate
1.3.9.4 Copper Absorbance versus Flow Rate
1.3.9.5 Copper %RSD versus Flow Rate
1.3.10.1 Matrix Matched Copper Standards
1.3.10.2 Standard Additions of Aqueous Copper
Standards to Pooled Human Plasma
1.3.10.3 Standard Additions of Matrix Matched
Standards to Pooled Human Plasma
1.3.10.4 Matrix Matched Zinc Standards
1.3.10.5 Standard Additions of Aqueous Zinc
Standards to Pooled Human Plasma
1.3.10.6 Standard Additions of Matrix Matched
Standards to Pooled Human Plasma
1 • 5.1 Absorbance versus Concentration of
Copper Standards
xii
46
48
50
52 -iE ~
58 I ~ ~
61 ~
Copper 64
67
70 I I ~ ---
Zinc 73 -
-= ~
82 ~ = -
--
- -

1.5.2
4. 1 .1
4.1. 2
4. 2.1
4.2.2
A .. 1 .J .. 1
.1
.2
.3
.4
.5
.6
Page
Absorbance versus Concentration of Zinc 85
Standards
Copper Concentration versus Age for the Plasma 112
of Six Strains of Male and Female Mice
Average Copper Concentration versus Age for the 114
Plasma of Six Strains of Male and Female Mice
Zinc Concentration versus Age for the Plasma
of Six Strains of Male and Female Mice
Average Zinc Concentration versus Age for the
Plasma of Six Strains of Male and Female Mice
Male Plasma Copper Concentrations versus Age
for !4ice
C57BL/6J
LG/J
DBA/2J
SJL/J
BALB/cJ
LP/J
xiii
117
119
155
157
159
161
163
165
I
I

Page
A.1.3.2 Female Plasma Copper Concentrations versus Age
•. 1
.2
.3
.4
for · ----Mice
C57BL/6J
LG/J
DBA/2J
SJL/J
167
169
171
173
----------~.~§~--------B~~-~Bf~ff~------------------------------~1'/?
.6
A. 1. 4.1
.1
~2
.3
.4
.5
.6
LP/J
Male Plasma Zinc Concentrations versus Age
for ----C57BL/6J
LG/J
DBA/2J
SJL/J
BALB/cJ
LP/J
Mice
A.1.4.2 Female Plas~a Zinc Concentrations versus Age
for Mice
.1 C57BL/6J
.2 LG/J
.3
.4
.5 ..
.6
DBA/2J
SJL/J
BALB/cJ
LP/J
xiv
177
179
181
183
185
187
189
191
193
195
197
199
201
I I

ABSTRACT OF DISSERTATION
FLOW INJECTION ATOMIC ABSORPTION ASSAY OF COPPER
AND ZINC IN THE PLASMA OF AGE DEPENDENT AUDIOGENIC
SEIZURE SUSCEPTIBLE MICE
less than 10 %RSD at 1.0 ppm were developed for the
assay of copper and zinc. in 10 wL samples of mouse
plasma. The flow injection apparatu.s was designed with
a pulseless liquid flow control.system, regulated by inert
gas pr·essure. The aspiration. liquid is 6% t-butanol in
water •- After exhaustive parameter optimizations, copper
assays were conducted with the conventional air-acetylene
flame at 324.754 nm and zinc assays were conducted -vli th the
unconventional argon-hydrogen air diffusion flame at
213.856 nm. The argon-hydrogen flame system was chosen
because it absorbs very little ultraviolet light.
The developed methods were used to determine the
concentration of copper and zinc. in plasma samples from
six strains( C57BL/6J, LG/J, DBA/2J, SJL/J, BALB/cJ, LP/J)
of male and female audiogenic seizure ~usceptible mice,
aged 18 to 65 days.
XV
I I

The results are presented_in .. 24 aets .. of.data and graphs
of metal concentDations .. versus mouse age.
The copper concentration, w.ithin .the precision of the
data, is 1.2 pp~ .. + 0.2.SD for all sexes~ strains, and ages.
The zinc· concentrat~on, within.the .precision of the data,
increa.ses. f·rom. l .• ~ ppm ±· 0 ... 2 SD at. twent.y ·days of age to
strains.
There is no correlation between the.age dependence of
the seizure su·seeptibilit.y of an.y; sex or s,train of mice and
the plasma- concentrations or .concentration ratios for
either copper.· or· .zinc. At any. age there is. no correlation
bet~een the·relative seizure ·susceptibility among the
strains of. m.ice and .their c0ncentra.tions or. concentration
ratios for either cop.per or zinc.
The resul.t.s. cast doubt on the. significance of copper
and zinc concentrations for thB ep~lepsy of humans
receiving- anticon.vulsant .. medication and on .the validity
of the use of audiogenic seizure susceptible mice as a
model· for epilepsy. Additional experiments. are suggested.
xvi
I I
CHAPTER ONE c
1 • Atomic Absorption Flow. Injection Analysis
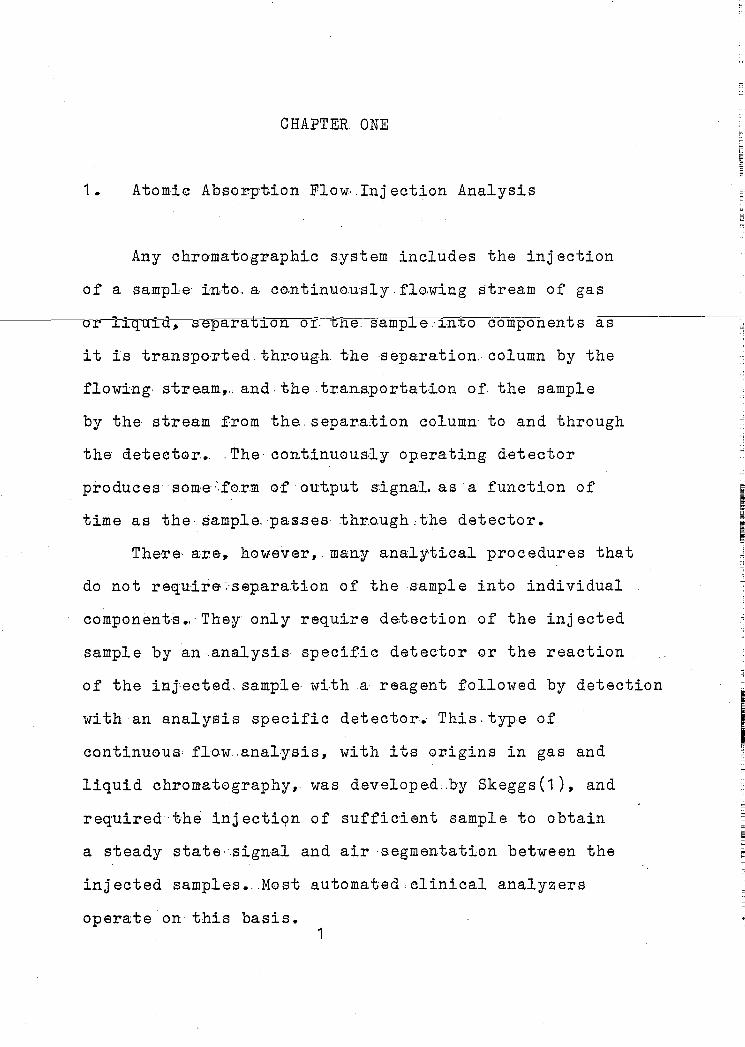
Any chromatographi.c s.ystem includes the injection
of a sample· into. a. co.ntinuo.usly. flo.wing stream of gas
-----,o~r-J:-iqu-:td, separation of:--Glie. samp.Ie.·i.nto components as
it is transported. through the ~eparation. column by the
flowing· stream,. and. the t.rans.portat.ion of. the sample
by the stream from the.separa.tion column· to and through
the detector.. . The cont.inuous.ly operating d.etector
produces som·e .. '.for.m of· output s·ignal. as a function of
time as the·~ample.·passes thraugh,the detector.
There· are, however,. man.y analytical procedures that
do not requilfe:sep.ara.tion of the sample into individual
components •. They only require de.tection of the injected
sample by an .analysis specific detec·tor or the reaction
of the injected. sample· ivi.th a reagent followed by detection
with an analysis specific detector. This. type of
continuous flow.analysis, with its origins in gas and
liquid chromatography, was developed,.by Skeggs (1), and
required·the injectiqn of sufficient sample to obtain
a steady state·~signal and air segmentation between the
injected samples •.. Most automated. clinical analyzers
operate on this basis. 1
I I

Nagy~ Feher, and Pungor later simplified this
concept· by ~liminating the requirement for the injection
of sufficient sample to obtain a steady state signal and
the requirement for air segmentation between the injected
samples(2)~ Their system injected the sample into a
flowing strea~ o~ electrolyte, mixed the sample and
an electrochemical .. detector. They obtained sharp 11 gas
chromatograph-type" peaks.
This process was refined, patented, and popularized
by Ruzicka and. Hans.en.( 3, 4., 5) and. later by Stewart and
Hare(6) who restricted the sample and solvent strea~
mixing to diffusion. by. the use of narrow bore tubing.
These groups called the.process "Flow Injection Analysis 11 •
In its most general form it includes the injection of a
sample into a continuous. stream of liquid or gas and
the subsequent detection of that. sample by a detector.
The analysis design may also provide for the mixing of
the sample or the reaction of the sample by any process
between the points of injection and detection. The
2
development of flow injection analysis, applicable diffusion
mixing theory, applications, and instrumentation have been
discussed b~ Betteridge(7) and Ranger(B).

1.1 Atomic Absorption Flow Injection Analysis
Wolf and Stewart extended the applications of flow
injection analysis to atomic absorption spectroscopy(9).
Their system. included a depulsed positive displacement
pump, an automatic four or six port rotary loop injection
3
an automatic integrator or analog recorder. They automatical-
ly injected 25 to 300 ~1 of sample into the nebulizer of
an atomic absorption spectrometer.
Fukamachi and Ishibashi enhanced the sensitivity of
atomic absorption flow injection analysis(10). They
compared the sensitivities re~ulting from organic solvent
streams with those from aqueous solvent streams. For 14
metals, sensitivity enhancements were reported for methanol,
n-butyl acetate, and methyl iso-butyl ketone streams. The
largest sensitivity enhancement was caused by n-butyl acetate.
This dissertation extends the sensitivity and
application of atomic absorption flow injection analysis
to small volumes of complex fluids such as plasma and serum.
The sensitivity is enhanced by the use of mixed aqueous
organic solvent systems, systematic procedures for the
selection of optimal instrument parameters, and air-
acetylene and argon-hydrogen air diffusion flame systems.
I
i

The use of the mixed aqueous-organic solvent system,
6%(v/v) t-butanol in water, provides for enhanced
4
sensitivity and does not cause precipitation of solutes from
complex fluids such as serum and plasma. This work is
applicable to the. analysis of samples which are viscous,
aqueous and/or organic, salty, and chemi~ally complex.
The instrumental design is described in section 1.2.
The experimental peak shapes are presented in Figure 1.1.1.
The instrumental operating parameters and the experiments
which led to their selection are discussed in section 1.3.
In Table 1.1.1, minimal amounts of model compounds
detectable by a very sensitive gas chromatographic method
are shown for comparison of the sensitivity of this method
to another very sensitive method(11). A. referenced
comparison of metal analysis parameters by various
techniques is presented in Table 1.,1.2.
The instrumental parameters for this version of
atomic absorption flow injection analysis were developed
to provide a means of analyzing very small volumes of
mouse plasma for copper and zinc at the 1 ppm concentration
level with a percent relative standard deviation(%RSD) of
10 percent or less. This was achieved. Minimal levels of
3 ng for zinc and 4 ng for copper at a signal to noise
ratio of 2:1 are detectable. The major advantages of this
system are the sensitivity, lack of matrix interferences,
precision, and speed of analysis.
I I I

-------,-----------~-----
5
TABLE 1.1.1
THE MINIMAL AMOUNT OF MODEL COMPOUNDS DETECTABLE BY USE OF A
SILICON DOPED HYDROGEN ATMOSPHERE FLAME IONIZATION DETECTOR
Model Compound Minimal Detectable Amount, g
---------------------'( S i_gnal to noise ra ti_Q_,.,~2,._,:u1_J.) ____ ---c:
Aluminum hexafluoroacetylacetonate
Ferrocene
Chromium haxacarbonyl
Tungsten hexacarbonyl
Molybdenum hexacarbonyl
Iron(III) trifluoroacetylacetonate
Di-n-butyl sulfide
Nitrobenzene
Tetradecane
2 X 10-12
2 X 10-11
5 X 10⁻¹⁰
4 X 10⁻⁹
4 X 10⁻⁹
2 X 10-S
2 X 10⁻⁷
4 X 10⁻⁷
Atomic Absorption Flow Injection Analysis Techniques
This \vork
Copper
Zinc
-IE
i ~ !!' I
I

6
TABLE 1.1.2
COMPARISON OF METAL ANALYSIS PARAMETERS BY VARIOUS TECHNIQUES
TECHNIQUE DETECTION LIMITS %RSD Cu Zn
AA 0 .. 15 ppm 0.025 ppm 1-2
AA-GF 0.6 pg 0.3 pg 5-200
ICP 0.005 ppm 0.004 ppm 1-2
DCP 0.002 ppm 0.003 ppm 8-10
FIA-ICP Mn ( 10 ng ) 2
FIA-AA 4 ng 3 ng 2
FIA-AA 5 ng 5
FIA-AA 4 ng 3 ng 2-10
SAMPLE SIZE MINIMUM~ 111
1000
1-300
1000
1000
25
25-300
50
1-1 0
-------------------------------------------------------------
IE ~
il ~ ~ li
e
~
7
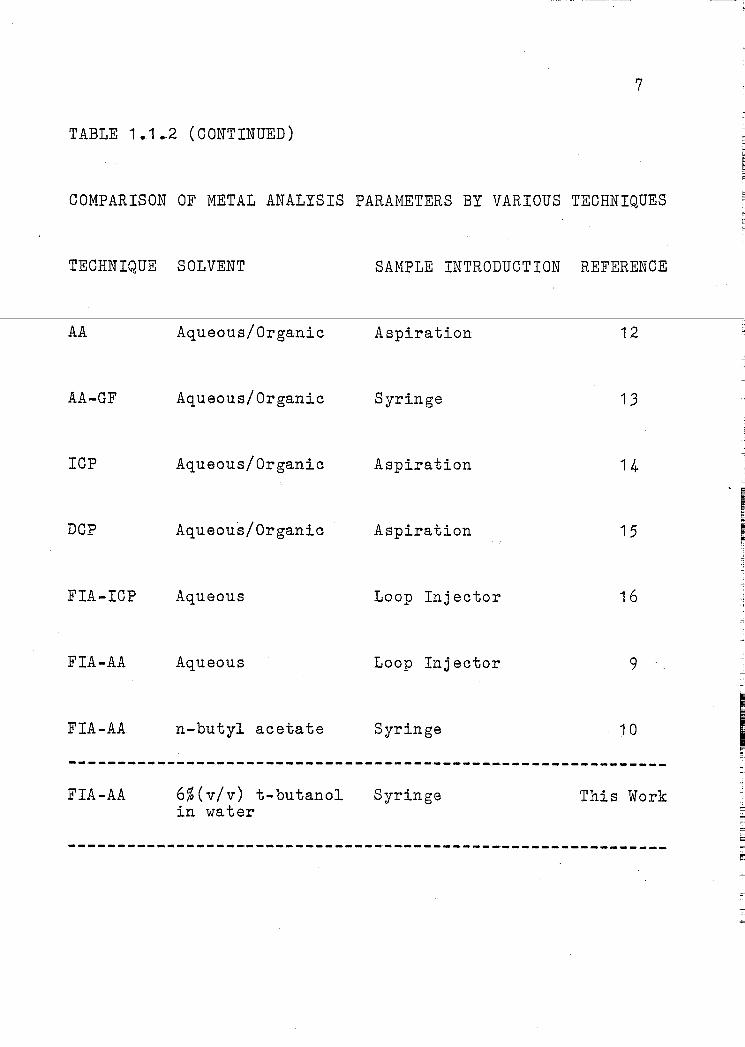
TABLE 1.1.-2 (CONTINUED)
COMPARISON OF METAL ANALYSIS PARAMETERS BY VARIOUS TECHNIQUES
TECHNIQUE SOLVENT SAMPLE INTRODUCTION REFERENCE
AA Aqueous/Organic Aspiration 12
AA-GF Aqueous/Organic Syringe 13
ICP Aqueous/Organic Aspiration 14
DCP Aqueous/Organic Aspiration 15
FIA-ICP Aqueous Loop Injector 16
FIA-AA Aqueous Loop Injector 9
FIA-AA n-butyl acetate Syringe 10
-------------------------------------------------------------FIA-AA 6%(v/v) t-butanol
in water Syringe This Work
-------------------------------------------------------------
-!! ~
I ~ !! ;
I ~
-
E
8
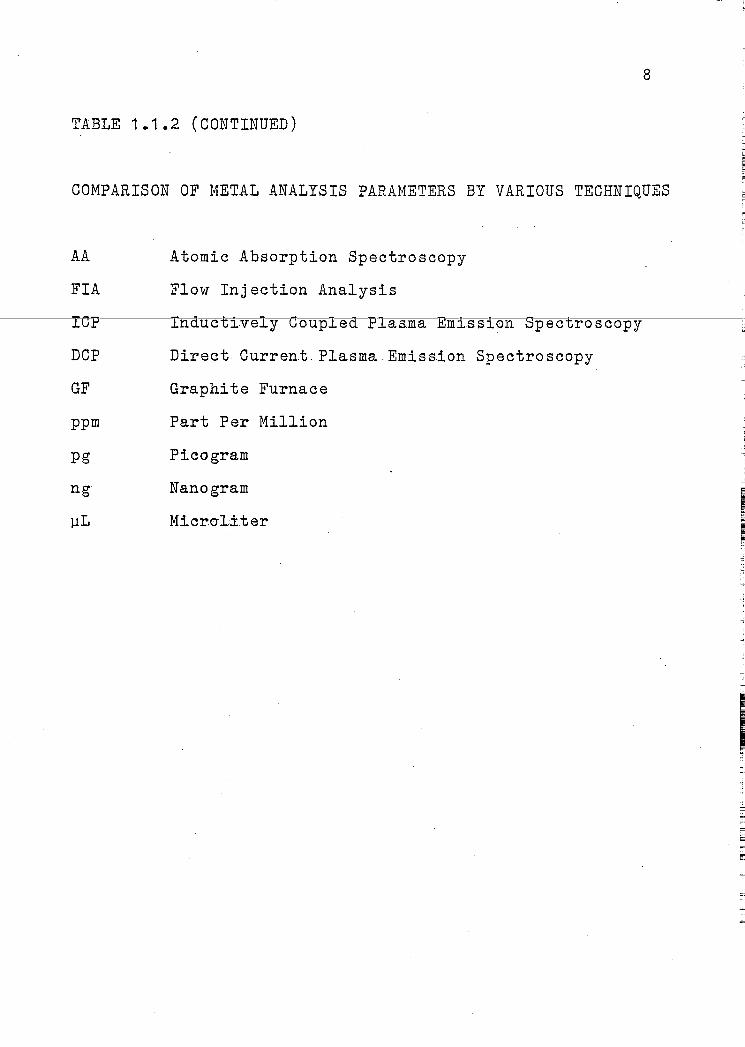
TABLE 1.1.2 (CONTINUED)
COMPARISON OF METAL ANALYSIS PARAMETERS BY VARIOUS TECHNIQUES
AA Atomic Absorption Spectroscopy
FIA Flow Injection Analysis
DCP Direct Current.Plasma.Emission Spectroscopy
GF Graphite Furnace
ppm Part Per Million
pg Picogram
ng· Nanogram
111 Microliter I
I ~

9
FIGURE 1.1.1
Experimental Peak Shapes
i
I

®"'::;..--··----·
~..~·~=-·-' ..::i. ~ ;: ...... i 'U-;~-· :®:;:..-: <3 ~----
$~~-GY 11'---·.r.::-;."""-~-..:!JJ ;-,:= .,7.. <:8 ~-.E-=-----~-~fo!., ___ _
(ij"':li;~,: ----<9'
@ ]iliii-p...-------
1 ~c-~-=----
'-···--
;~ .. ci~------... ,, ---··---· ·-- :~!~ . .,., ...
.-c:\ ~.: -. ~ ~.
~-~-~-----<n _.E.~=-=---------
. <D i-"·-··---------: ~,;:"-'-=--------; ~:..l''---"-'-·--------6 ;~_· @ ~~·----·---·--;.;..·=-;;;._.;:;;-·----··
,<D -~----·····-- .. -··
-~
. -·--=---1 I
--·- ... ····-·----1 ! .. I !
.. I ... .·j '
.... ····--.. ··------'----·-··· .. ______ -
-~-!
..
I 1 I .. ,
. ·,
·-.. --· -· ----------··1, ,.. '
... .! j
-I !
:<;~~~---------------------------·~·-----!:-
:~ ~=-~------------------------------------------~ ~ -~-:. . ....... -'L\1 ... @.l ~-.
~~~~----~~----~----------~---~~~~~~-' ~ ~-~-------····-·--·--·-- ------··------..:_. __ -~~;.-~ .. -=--~-~~~-------~~~~~~~~~---~-~--~-~-~---~--®- r:.·---·· @ li' . .. .......... .... ........ -- . ·- ·-·- . ·--···. -t- ·· _i!.:.::-· · ··-· -----·---:_---·-:-- · ..:.=:oe~tt:··::..-::·-:.:·-:...::··===·====::::::::=:::=.:::=-=. =.---.
10
I I I

FIGURE 1 .2.1
Flow Injection Apparatus
11
• I I

r-1-
rJ VII VI v
1 1 I I ,l T
III
~ I
I Helium Cylinder and Regulator IV
II Pressurized Vessel for Solvent
III Flow Restriction Column
IV Syringe Injection Port
v Atomic Absorption Spectrometer
VI Recorder Readout Accessory
VII Analog Stripchart Recorder -->.
l\)
1~1 1 1111 F'!f11R 1 ,!ffi~f·li1: 1 !1·11·11 !I,!Jd:---~;]111.1 I . mmtrlllllm llllliiJIII!IIIImtiJJI . .1 •• "

1.2 Instrument Design for Flow Injection Analysis
A block diagram of the apparatus is given in
Figure 1.2.1. The flow injection apparatus consists of a
helium cylinder and regulatDr(I) which is connected to
a 5 liter Millipore pressurized vessel(II) which is
13
connected to a 1/16" ·swagelok stainless steel tee injection
port(IV) which is connected to the nebulizer on the Perkin
Elmer Model 303 atomic absorption spectrometer(V). The
atomic absorption signal from the spectrometer is sent
to the recorder readout accessory(VI) and then to a Linear
analog stripc~art· recorder(VII).
The 5 liter Millipore pressure vessel(II) functions as
a pulseless solvent pump. It is pressurized by helium from
a conventional tank and regulator(!). The vessel is equipped
with a pressure gauge and a valve at the solvent outlet.
The flow restriction column(III) is a length of
6 mm 0. D. x 16.7 em soft glass tube filled with Corning
Controlled Pore Glass, CPG-10-500, with 120/200 mesh. The
ends are 1/4" to 1/16" end drilled stainless steel Swagelok
reducing unions with 2.0 micron pressed stainless steel
filters. The ferrule is an Alltech 6 mm to 1/4" teflon
reducing ferrule.
i
I

The injection port(IV) is a 1/16" stainless steel
Swagelok tee w·i th a septum at one end of the tee. The
septum is cut from a regular blue Alltech septum with a
#OO stopcock borer and trimmed to a cone shape with a
single edged razor blade. Samples are injected with a
14
10 uL HamilJLQn~#-~Oj __ s~~ng~~------------------------------------------~
The tubing which connects the pressure vessel to the
flow restriction column, the flow restriction column to
the injection port, and the injection port to the nebulizer
is 1/16" 0. D. x 0.023" I. D •. teflon tubing from Laboratory
Data Control. All connections are done with 1/16" stainless
steel Swagelok fittings.
'
I
I

------· ---·--------~-------
15
1.3 Optimal Parameter Development.for the Instrument
1 • 3.1 Analytical Wavelengths
The choice of the analytical wavelengths of 324.754 nm
for copper and 213.856 nm for zinc was made by an analysis
energy levels, statistical waights of the upper levels(g),
Einstein transition probabilities(A), Ladenburg oscillator
strengths(f), and possibly interfering lines from other
elements(1·7). The intent was to maximize the signal strength
by the choice of ground state lines with large gA and gf
values and to have all ROSsible interfering lines in the
vicinity of the chosen lines be either from elements of
very low concentration in the sample such as the rare
earth elements or be non-ground state lines with low
gA and gf values. These goals were ac.complished by a
search of published experimental transition probabilities.
Table 1~3.1.1 is a listing of the energy levels for
possibly interfering lines which.lie within 0.65 nm of the
copper line at 324.754 nm. Table 1.3.1.2 is a listing of
the energy levels for possibly interfering lines which
lie within 1.95 nm of the zinc line at 213.856 nm.

The optical slit ~irlth of the spectrometer is 0.65 nm
for assays· of copper at 324.754 nm and 1.95 nm for assays
of zinc at 213.856 nm(12). Table 1.3.1.3 is a listing of
16
possible other element spectral overlap lines which lie in
close proxim·i ty to the copper line at 324.754 nm and the
zinc line at 213.856 nm. Lines which cause spectral overlap
generai:i:y Tie wr-cni~O--;-i nm of~he analytical line.
A series of absorbance.tests for metal interference was
conducted to determine if other metal solutions would
absorb at the copper or zinc wavelengths. The test solutions
were 1000 ppm atomic absorption standards •. Table 1.3.1.4
lists the metals tested and their absorbance at the
analytical wavelengths for copper and zinc of 324.754 nm
and 213.856 nm respectively.
A small negative absorbance from chromium and a small
positive absorbance of similar magnitude from nickel were
observed at the copper ~v-avelength. The magnitude of the
absorbance is equivalent to a copper concentration of
approximately 0.25 ppm. This is ~onsidered insignificant
when compared to the 1000 ppm standard.These small
absorbancies are-of unknown origin but may be due to
impurities in the standard solutions. None of the other
1000 ppm metal solutions tested produced any detectable
absorbance at·either the copper or zinc wavelengths
i
I

17
TABLE 1.3.1.1
Ground State Lines Near the Copper Line at 324.754 nm
for Various Metals
324.104- 324.754- 325.404
~Iavelength He tal Energy Level gA gf log gf
nm °K 108/sec
324 .. 754 Cu I 0 - 30784 4.1 0.64 -0.19
324.140 Eu I 0 30842 0.082 0.13 -0.89 --
~
324.603 Eu I 0 30798 0.40 0.06 -1 .1 9 E ~ ~
324.755 Eu I 0 - 30784 0.89 0 .. 14 -0.85
325.037 Sm II 0 30757 0.94 0.15 -0.83
324.446 Th I 0 - 30813 0.56 0.09 -1.06
324.987 Th I 0 - 30762 0.48 0.08 -1 .12 ~
324.199 Ti II 0 30837 5.8 0. 91 -0.04 --~
I 324.153 Tm II 0 - 3084-l 1 • 1 0.17 -0.76
325.805 Tm II 0 30684 0.87 0.14 -0.86 I = ----
----
~
~ --
-
--
--

TABLE 1.3.1.2
Ground State Lines Near the Zinc Line at 213.856 nm
for Various Metals
211.906 - 213.856 - 215.806
Wavelength Metal
nm
213.856 Zn I
214.438 Cd II
211 .. 954 Ir I
212.794 Ir I
215.581 Ir I
215.784 Os I
214.423 Pt I
215.667 Re I
212.739 Sb I
214.275 Te I
212.672 Yb II
Energy Level
OK
0 46745
0 46619
0 47165
0 -· 46979
0 46372
0 46328
0 - 46622
0 46353
0 - 46991
0 46653
0 47006
19
106
0.74
2.1
1 • 5
1 • 1
1 • 8
1. 2
0.43
5.8
0. 41
1.3
7.3
0.05
0 .. 14
0.11
0.08
0.13
0.08
0.03
0.40
0.03
18
log gf
0.12
0.86
-1.30
-0.84
-0.97
-1.10
-0 .. 90 --
-1.80 =
I . -1.53 I
-0.40 " --
-1.56 -~
~
~
.. -

19
TABLE 1.3.1.3
Metal Lines Which Can Overlap the Copper Line at 324.754 nm
and the Zinc Line at 213.856 nm
~ITa velength Metal Energy Level gA gf log gf
-------------------~0. ---------~--g··~~--------------------~um -K- TU~-7 sec
324.754
324.755
324.766
324.747
324.746
213.856
213.853
Cu I
Eu I
Hf I
Nb II
Tm II
Zn I
Cu I
0 - 30784 4.1
0 - 30784 0.89
2375 - 33139 0.67
7901 - 38685 2.9
8770 - 39554 2.3
0 - 46745 19
11203 - 57949 0.51
0.64 -0.19
0.14 -0.85
0.11 -0.98 -o. 46 -0.33 e
i 0.37 -0.43 ~
~ I
1.3 0.12
0.04 -1.46.. -
I

20
TABLE 1.3.1.4
Interference Absorbance by Various Metals at Copper and
Zinc I'Tavelengths
Metal, 1000 ppm Cu, Absorbance Zn, Absorbance
a T24.754 nm at 213.856 nm
Na 0.0000 0.0000
K 0.0000 0.0000
Li o.oooo 0.0000
Ca o·.oooo 0.0000
Mg 0.0000 0.0033
Cr -0.0032 0.0000
Ni 0.0033 0.0000
Fe 0.0000 0.0000
Mn 0.0000 0.0000
Cu 0.0000
Zn 0.0000
e;
i ~ Ill ~
-~
I I --
-~
;;;;
~
"" --
--
--

21
1.3.2 Optical System
TABLE 1.3.2.1
Optical System for the Perkin-Elmer Model 303 Atomic
Absorption Spectrometer
Grating Czerny-Turner
Dispersion uv 6.5 ~/mm
Dispersion VIS 13.0 ~/mm
Focal Length 400 mm
uv Grating 2880 lines/mm -
I i
VIS Grating 1440 lines/mm ~ I! ;
UV Blazed 2100 ~
VIS Blazed 6000 ~
Slit Openings 0.03 mm
0.10 mm
0.30 mm
I 1.00 mm
3.00 mm --
10.00 mm
~ -uv Spectral Band tvidth 0.2 -
"' VIS Spectral Band vlidth 0.4 R "' --
-

22
TABLE 1.3.2.2
Optical Slit Dimensions for the Perkin-Elmer Model 303
Atomic Absorption Spectrometer
Slit mm UV, R VIS, R UV, nm VIS, nm
1 0.03 0.195 0.39 0. 01 9 5 0.039
2 0.1 0 0.65 1 .3 0.065 0.13
3 0.30 1.95 3.9 0.195 0.39
4 1.0 6.5 13 0.65 1 • 3
5 3.0 19.5 39 1.95 3.9 -5
6 10.0 65 130 6.5 13.0 i ~ !l I
I i "'
23
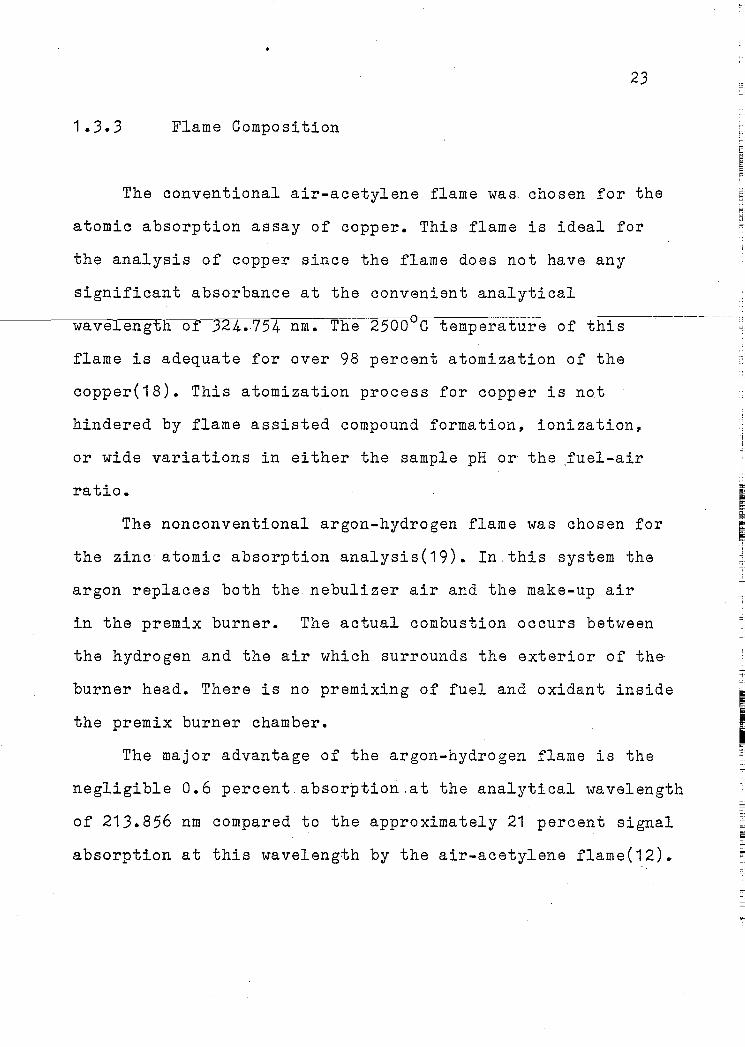
1. 3. 3 Flame Composition
The conventional air-acetylene flame was chosen for the
atomic absorption assay of copper. This flame is ideal for
the analysis of copper since the flame does not have any
significant absorbance at the convenient analytical
wavelength of 324 •. 754 nm. The 2500°0 temperature of this
flame is adequate for over 98 percent atomization of the
copper(18). This atomization process for copper is not
hindered by flame assisted compound formation, ionization,
or wide variations in either the sample pH or the .fuel-air
ratio.
The nonconventional argon-hydrogen flame was chosen for
the zinc atomic absorption analysis(19). In this system the
argon replaces both the nebulizer air and the make-up air
in the premix burner. The actual combustion occurs between
the hydrogen and the air which surrounds the exterior of the
burner head. There is no premixing of fuel and oxidant inside
the premix burner chamber.
The major advantage of the argon-hydrogen flame is the
negligible 0.6 percent.absorption.at the analytical wavelength
of 213.856 nm compared to the approximately 21 percent signal
absorption at this wavelength by the air-acetylene flame(12).
I I

···---··--·--·~·-·-----
24
Figure 1.3~3.1 is a plot of the percentage absorption by the
flame versus wavelength for the air-acetylene and argon
hydrogen flames. Greater precision and sensitivity are
additional advantages obtained by the use of this flame
system rather than the air-acetylene flame in zinc assays.
argon-hydrogen flame. The results of the experiments in which
potassium was added to cesium solutions imply that the
argon-hydrogen flame temperature is considerably lower than
the air-acetylene flame temperature since cesium is not
ionized in this flame whereas in the air-acetylene flame it
is 90 percent ionized(19). I
I

25
FIGURE 1.3.3.1
Percent Absorption ~ersus Wavelength for the Two Flames
I
I I

90 ~ 80
~ 70 0
•rl +> p.. 60 H 0 Ul
..a 50 .. <tl
'1:.~
40
30
20
10
. 190
!11!111111 JIII"IR!lilll!tlfl.lll~ll>ll .. 11 ,f,III.J.r:·IJII~IlllllniiiUII.II
I Argon-Hydrogen Flame
II Air-Acetylene Flame
.
;:'\__ I -200 210 220
Wavelength, nm
:m.111TIIIl1liiiii1Tllllllllllllntrnnm I
l\.)
0"

27
Burner Head and Nebulizer Selection
A set of one ppm copper solutions was analyzed with
single and triple slot burner heads and with old and new
Perkin-Elmer nebulizers. Optimal results were obtained by the
use of a triple slot burner head with the new nebulizer as
our analytical work.
TABLE 1 .3 .4.1
Burner Head and Nebulizer Comparison
Absorbance
0. 019
0.012
o. 014
0. 01 0
%RSD
3.2
7.7
9.5
19.9
n
10
10
10
1 0
Burner Head
Triple Slot
Triple Slot
Single Slot
Single Slot
Nebulizer
New
Old
New
Old

28
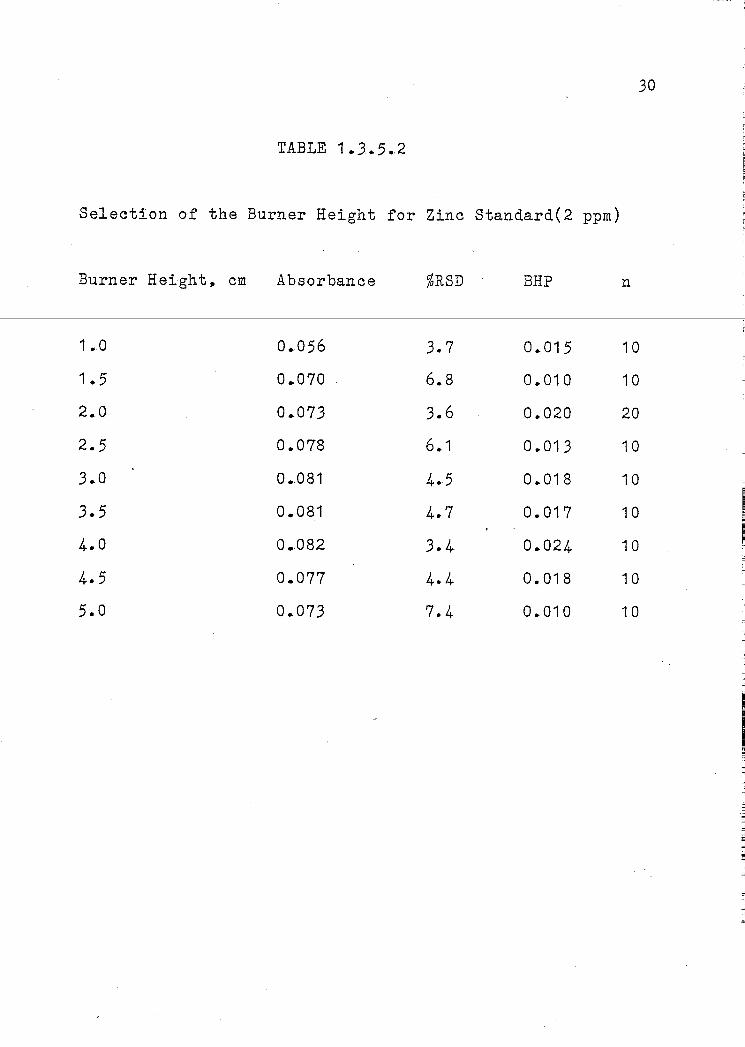
Burner Head Height Selection
The burner height for atomic absorption is the distance
in em that the top of the burner head lies below the bottom
of the light path of the hollow cathode lamp. The burner
------~h=e=2="ght with the largest burner height parameter(BHP) is the
optimal burner height. A BHP is defined for a specified
burner height as the product of the absorbance times the
inverse of the %RSD for a set of data obtained under
otherwise identical analytical conditions.
Tables 1.3.5.1 and 1.3.5.2 give data for copper and
zinc, respectively. The information in these tables provided
the basis for the selection of a burner height of 1.5 em
for copper and 4.0 em for zinc.
I

29
TABLE 1.3.5.1
Selection of the Burner Height for Copper Standard(2 ppm)
Burner Height, em Absorbance %RSD. BHP n
1.0 0.067 3.0 0.022 10
1.5 0.065 2.7 0.024 10
2.0 0.062 3.1 0.020 10
2.5 0.063 3.7 0.017 10
3.0 0.061 3.6 0.017 10
3.5 0.060 4.9 0.012 10
4 .. 0 0.057 3.5 0.016 10
4.5 0.057 4.3 0.013 10
5.0 0.055 5.1 0.011 10
30
TABLE 1.3.5.2
Selection of the Burner Height for Zinc Standard(2 ppm)
Burner Height~ em Absorbance %RSD BHP n
1.0 0.056 3.7 0.015 10
1.5 0.070 6.8 0.010 10
2.0 0.073 3.6 0.020 20
2.5 0.078 6 .. 1 0.013 10
3.0 0.081 4.5 0.018 10
3.5 0.081 4.7 0.017 10
4.0 0.082 3.4 0.024 10
4.5 0.077 4.4 0.018 10
5.0 0 .. 073 7.4 0.010 10
' 31
1.3.6 Selection of the Fuel/Oxidant Ratio
Two significant variables which are influenced by the
fuel/oxidant ratio are the availability of electrons in the
flame and the temperature of the flame. Electrons must be
available to combine with gaseous metal ions to produce
neutral metal atoms. Their availability is increased in fuel
rich flames. The temperature of the flame influences the
density of free neutral atoms at. the various electronic
levels, the flame· velocity, and the ability of the flame to
form and decompose various compounds in the flame.
The selection of an·optimal fuel/oxidant ratio is
actually a balancing of all variables.to obtain a maximal
%RSD. The optimal ra.tio is. that ratio which results in a
maximal value for the product of the absorbance times the
inverse of the %RSD for a series of assays where only the
fuel/oxidant ratio is varied •. Table 1.3.6.1 indicates
that the optimal ratio for copper is obtained when the
flowmeter scale in arbitrary units is 9.5 for acetylene
and 9.0 for air.
The fuel/oxidant ratio was not determined for the
argon-hydrogen flame. In.this system the oxidant is the
oxygen in the air that diffuses into the flame area from
the atmosphere that surrounds the burner head.

32
Settings for the. flowmster scale,. in arbitrary units, of
9.0 for argon and 5.0 for hydrogen \vere used for all
zinc assays.
TABLE 1.3.6.1
Selection of the Fuel/Oxidant Ratio for Copper Standard(5 ppm)
Flowmeter Scale in
Arbitrary Units
Acetylene Air Absorbance %RSD
9.0
9.5
10.0
10.5
9.0 0.113
9.0 0.113
9.0 0.114
9.0 0.109
2.8
. 2.0
3.2
5 •. 9
Absorbance/%RSD
0.040
0.057
0.036
0.018
n
10
10
10
1 0

33
1 .3 •. 7 Sample Injection Size
The selection of an optimal sample injection volume
requires compromises to be made 1vi t.h respect to an adequate
absorbance value, a minimal %RSD, a sufficient volume of
mouse plasma, and the number of required assays.
r·ne sample volume or:. l5.Looa. avaJ.laolei'rom the various
strains of mice without harm to the mice is in the range of
50 to 200 l.IL. This will provide a plasma.volume of 25 to
100 l.IL. That must be a sufficient volume for at least one
assay for both copper and zinc. The available sample volume
limits the injection size to a maximum of 25 uL.
The optimal injection volume is that volume which
results in a maximal value for the. product of the absorbance
times the inverse of ths %RSD for a series of assays where
only the injection volume is varied. Two series of assays
were conducted with 2 ppm standard solutions of copper
and zinc where only the injection volums was varied over
the range of 1 to 10 l.IL. A separate series was conducted
with a 1 ppm copper standard where only the injection
volume was varied between 10 and 25 l.IL.
I

These results are listed in Table 1.3.7.3. An analysis of
the combined results from the three tables suggests an
injection volume of 10 ~1, as a compromise.
TABLE 1.3.7.1
Sample Injection Sizes for Copper Standard(2 ppm)
34
Volume, ~L Absorbance %RSD n (Absorbance/%RSD)/~L
10 0.025 3.1 10 0.00081
9 0. 022 . 6.2 10 0.00039
8 0.020 3.6 10 0.00069
7 0.018 5. 1 10 0.00050
6 0.016 4.8 10 0.00056
5 0.013 6.3 10 0.00041
4 0.011 6.5 10 0.00042
3 0.0080 10.7 10 0.00025
2 0.0053 15.4 10 0.00017
1 0.0020 27.6 10 0.00007

35
TABLE 1.3.7.2
Sample Injection Sizes for Zinc Standard(2 ppm)
Volume, ].lL Absorbance %RSD n (Absorbance/%RSD)/Jl1
TABLE 1.3.7.3
Large Sample Injection Sizes for Copper Standard(1 ppm)
Volume, uL
25
10
Absorban.ce %RSD
0.048 12.5
0.019 8.1
n
20
20
(Absorbance/%RSD)/Jl1
0.00015
0.00023
I

36
1 .3. 8 Solvent Composition
Several different mixtures of 6% organic solvents with
water wer·e studied as aspiration solvents •. The basis for
these studies was-literature reports of sensitivity
enhancement by the use of organic solvent systems in atomic
reported three- to fQur-fold increases in sensitivity.
The sensitivity enhancement, is due to modification of
solution-parameters. which result in the alteration of
several dirferent nebul~zer and flame processes. The mixed
organic-aqu~ous solvents, when compared to water, generally
have a lowe~viscosity and surface tension~ These trends
are simila~ to those found when organic solvents are compared
with water. The advantages of mixed solvents a.re thus
similar to the advantages of organic solvents but of a
lesser· magnitude. A solution of lower viscosity and
surface tension produces, via a. nebulizer, an aerosol with
a smaller and more uniform .droplet size. As a result, a
larger perdentage. of aerosol enters .the flame and is thus
available for detection. The increased surface to volume
ratio in the smaller droplets. results in the more rapid
evaporation of solvent from a solvent aerosol ~olution
of metal ions.

This effect is desirable because .it provides additional
residence time for the ion to absorb heat from the flame.
37
The ion thus attains a higher effective temperature which
ultimately will result in a .larger percentage of neutral
metal atoms in the flame. The organic solvent generally
has a lower heat of vaporization. The requirement for less
effect of increasing the flame temperature. It also has the
undesirable effect of decreasing the cooling of the burner
head and increasing the flame propagation velocity. These
effects increase the likelihood of a flashback.
The atomic absorption nebulizer can only nebulize
.solutions. Therefore, the mixed solvent system must not
cause precipitation of the mouse plasma sample. This
requirement eliminates the use of pure organic solvents
and any mixed organic-aqueous solutions with a high organic
solvent concentration.
Ketones, esters,. and alcohols have been reported to
yield stable flames. Based upon the reported use of 6%
n-butanol in water(21), the limited single phase solubility
of many organic solvents in water,.and the plasma sample
solubility requirementa a series of eight aqueous nebulizer
solutions containing 6% organic solvent in water ~as tested.

The results are presented in Table 1.3.8.1. The solvent
of choice was 6% t-butanol in water.
TABLE 1.3.8.1
Solution Effects on Flame Copper Absorbance
Solution, 6%
in 1'later
Copper, Absorbance(%RSD)
5 ppm 2 ppm 1 ppm 0.5 ppm
38
n-propanol 0.0022(7.0) 0.0012(11) 0.00045(14)
iso-propanol 0.011(18) 0~0045(19) 0.008(24)
allyl alcob.ol Strong absorbance with a noisy flame
ethyl acetate Strong absorbance with a noisy flame
n-butanol
iso-butanol
sec-butanol
t-butanol
water(100%)
0.017(5.6) 0.068(11)
0.034(11)
0.025(23)
0.015(21) 0.005(25)
Strong absorbance with a noisy flame
0.078(8.8) 0.033(14) 0.014(13)
0.046(8.5) 0.019(18) 0.008(29)

--------------------------
39
1.3.9 Solvent Flow
The rate with which the. injected sample and the 6%(v/v)
t-butanol· solvent are pumped into the nebulizer determines
the amount of sample· in the light path and thus the magnitude
of the absorbance signal and the precision of·that signal.
----'.~;+'-1n:;-:r"''-o--w-rrl-e-o-£'-6-%c-t-bu-tcrrm-t-in t~th e n e buri z e r is set by
adjusting the helium pressure on the solvent pressure
reservoir. A calibration curve of helium reservoir pressure
versus flow rate is presented in Table 1.3.9.1 and Figure
1.3.9.1 ..
In order to determine the optimal flow rate for the
analysis of copper and zinc, a set of 5 ppm zinc standards
was analyzed under fixed experimental conditions at various
flow rates. The zinc absorbances at the.various flow rates
were determined at 213.856 nm. The results of this experiment
are listed in Table 1.3.9.2. The optimal flow rate of 6%
t-butanol has a maximal value of the product of the absorbance
times the inverse of the %RSD~ Figures.1.3.9.2 and 1.3.9.3
are graphs of the zinc absorbance versus flow rate and the
%RSD versus flow rate, respectively, for this experiment.
The optimal flow rate of 6% t-butanol for the assay of zinc
is 1.0 mL/min. This flow rate is an optimum since lower
solvent flow rates will result in excessive burner head
temperatures.

40
A se-t of 2 ppm.copper .standards was analyzed under
fixed experimental conditions at va.rious flow rates. The
copper absorbances at the various flow~rates were determined
at 324.754 nm .. The results of this experiment are listed
in Table 1.3.9.3. The optimal flow rate of 6% t-butanol for
the assay of copper is determined from the experimental data
by selecting the maximal value from the calculation of the
product of the absorbance times the inverse.of the %RSD.
Figures 1.3.9.4 and 1.3.9.5 are graphs of the copper
absorbance versus flow rate and the %RSD versus flow rate,
respectively, for this experiment. The optimal flow rate
of 6% t-butanol for the assay of copper is 2.5 mL/min. ' . I

TABLE 1.3.9.1
Pressure in the Helium Reservoir. versus Flow Rate
Helium.
psi
8
14
20
30
40
50
Volume,
mL
3.0
3.0
5.0
7.0
7 .. 0
8.0
Time,.
min
3.04
1. 78
1.97
1. 79
1.32
1 .1 8
Flow·Rate,
mL/min
1 • 0
1 • 7
2.5
3.9
5.3
6.8
41

-------------~------·-
42
TABLE 1.3.9.2
Zinc Absorbance and %RSD versus Flow Rate
Helium,
psi
8
14
20
30
40
50
Flow Rate, Absorbance, %RSD Absorbance/%RSD
mL/min Zn
1 • 0 0.077 4.1 0.019
1.7 0.070 4.0 0.018
2.5 0.065 4.7 0.014
3.9 0.052 4.2 0.012
5.3 0.043 4.1 0.010
6.8 0.034 4.1 0.008

43
TABLE 1 .. 3.9.3
Copper Absorbance and %RSD versus Flow Rate
Helium,
psi
8
14
20
30
40
50
Flow Rate, Absorbance, %RSD Absorbance/%RSD
mL/min Cu
1.0 0.064. 1 3.1 0.005
1. 7 0.066 7.9 0.008
2.5 0 •. 073 2.9 0.025
3.9 0.055 3.7 0.015
5.3 0 .04.6 4.7 0.010
6 .. 8 0. 040. 9 •. 6 0.004

------------- --,-------~--
44
FIGURE 1.3.9.1
Pressure in the Helium Reservoir versus Flow Rate

80
70
60
•r-i 50 Ul p.
.. (].)
~
~ 40 Ul (].)
~ P-i
s ;=j 30
•r-i r-f (].)
P:::
20
10
45
1 2 3 4 5 6 7 8 9 10
Flow Rate, mL/min

46
FIGURE 1.3.9.2
Zinc Absorbance versus Flow Rate

8
7
6
C\l I 0 5 ~
:><
Q)
0 ~
4 ro ..a I ~
.o Ol ..a <G
.. 3 0 ~
•rl N
2
I 1
1 2 3 4 5 6 7 8 9 10
Flow Rate, mL/min

48
FIGURE 1.3.9.3
Zinc %RSD versus Flow Rate

49
8
7
6
5 0 ~
lf.l ~ ~
0 .. 4 0o 0 0 t> r;:::
•r-i N
3
2
1
1 2 3 4 5 6 7 8 9 10
Flow Rate, mL/min

50
FIGURE 1.3.9.4
Copper Absorbance versus Flow Rate

51
8
7
N I 0 ~ 6 :X:
<D 0 ~ aj
,..0 5 ~
0 t:Jl
,..0 c::t;
.. ~ 4 <D p., p., 0
0
3
2
1
1 2 3 4 5 6 7 8 9 10
Flow Rate, mL/min

52
FIGURE 1.3.9.5
Copper %RSD versus Flow Rate

15
14
13
12
11
10
9
8
7
~ 5 Q) p.,
~4 0
3
2
1
53
1 2 3 4 5 6 7 8 9 10
Flow Rate, mL/min

54
1.3.10 Hatrix Matching of Standard Solutions
The copper and zinc concentrations in the mouse plasma
samples were calculate·d from the absorbance data by a linear
least squares method based upon calibration with agueous
copper and zinc standards. The validity of this use of
a:q-u--e-o--u-s-nre-t-a:-1-----s--tandard sol:ut-ions for "Ghe determinat-ion oi"
concentrations of metals in very complicated sample matrices
such as mouse plasma was established. by a very extensive
series of experiments involving copper and zinc aqueous and
matrix matched standards and additions of such standards to
pooled human plasma.
The standard curvea, standards~ and results are presented
in the following tables and figures.
TABLE FIGURE
1.3.10.1 1.3.10.1 Matrix Matched Copper Standards
1.3.10.2 1.3.10.2 Standard 4dditions of Aqueous Copper
Standards to Pooled Human Plasma
1.3.10.3 1.3.10.3 Standard Additions of Matrix Matched
Copper Standards to Pooled Human Plasma

55
1.3.10.4 1.3.10.4 .Matrix Matched.Zinc Standards
1.3.10.5 1.3.10.5 Standard Additions of Aqueous Zinc
Standards. to. Pooled Human Plasma
1.3.10.6 1.3.10.6 Standard Additions of Matrix Matched
1.3.10.7
1.3.10.9
Zinc Standards to Pooled Human Plasma
Copper and Zinc Standard Solutions
in Pooled Human Plasma
Slopes of Aqueous and Matrix Matched
Standard Curves
The matrix matched standards consisted of the metal
ion at the appropriate concentration, 0.15 M NaCl, and 6%
Dextran(173,000 M~v, Sigma.). (20,22). The experiments
consisted of obtaining the standard curves for. the aqueous
and matrix matched standards and. the human plasma standard
additions curves for the aqueous and matrix matched
standards which had been added to the pooled human plasma.
A comparison of the slopes of the various graphs is
presented in Table 1.3.10.9.
The slope of~an ideal matrix matched.standard will be
the same as the slope of a matrix matched standard additions
ctirve. The matrix match is considered .to be adequate when
the slopes yield results that are, within tha precision of
the measurement, statisti.cally indistinguishable.

56
This is the case for t.he aqu.eous zinc standards and the
aqueous or· the ma·tri.x matched additions to the pooled human
plasma. The matrix matched zinc standards will. yield results
that are approximately 20% high. Th.e .vali.dity of the use of
aqueous copper standards is questionable. The use of matrix
____ _.,m""a.._,t ch_e_d_c op_p__e_r_____s_tan dards i_s_p_r_e_f_ar.r_e_d_._T_b._e_a_q u eo us co p_p er~----
standards, however, produce results that are less than 5%
high. This is well within the 10% RSD precision criteria
at the 1 ppm level. Agueous standards were used for the
determ~nation of copper and zinc in. mouse plasma.

57
TABLE 1 • 3. 1 0. 1
Matrix Matched Copper Standards
Solution # Cu, ppm Absorbance Standard Dev~ation %RSD n
'3
10
11
12
5---;-0-o
2.00
1 .oo
0.50
o--;--o--54:;
0.0248
0.011 0
0.0068
Linear Least Squares
n = 4
Correlation = 0.9980
Slope = 0. 01 06
X = 0, y = 0. 0016
y = 0, X = -0.1507
0. OOl-9
0.0012
0. 0012
0.0006
3.5 9
4. 9 10
11.1 10
9.3 9

58
--------------------------------~F-~~Y~.E~-.3~~-0.1~, --------------------------------------
Matrix Matched Copper Standards

C\l I 0 .,-
8
7
6
5
~· 4
2
1
1 2 3 Copper, ppm
4
59
5 6

TABLE 1.3.10.2
Standard Additions of Aqueous Copper
Standards to Pooled Human Plasma
60
Solution # Cu, Absorbance Standard Deviation %RSD n
ppm
( 1 '1 4) o.oo 0.0090 0.0011 12.6 10
( 3' 1 4) 0.50 0. 01 52 0.0008 5.1 10
( 5' 14) 0.99 0.0201 0.0010 5.0 10
( 7,1 4) 1.96 0.0300 0.0017 5.6 10
( 9, 14) 4.76 0.0621 0.0013 2.0 10
Linear Least Squares
n = 5
Correlation = 0.9997
Slope = 0.0111
X = 0, y = 0.0091
y = 0, X = -0.82

FIGURE 1.3.10.2
Standard Additions of Aqueous Copper
Standards to Pooled Human Plasma
61

62
co
.. -~
Q)
p.. p.. 0
0

TABLE 1.3.10.3
Standard Additions of Matrix Matched Copper
Standards to Pooled. Human Plasma
63
Solution # Cu, Absorbance Standard Deviation %RSD n
ppm
(1,16) o.oo 0.0077 0.0012 15.6 10
(3,16) 0.50 0.0146 0.0011 7.5 10
(5,16) 0.99 0.0194 0.0008 4.0 10
( 7,16) 1.96 0.0317 0.0009 3.0 10
(9,16) 4.76 0~0605 0.0012 2.0 10
Linear Least Squares
n = 5
Correlation = 0.9990
Slope = 0.0110
X= 0, y = 0.0087
y = 0, X = -0.79

64
_____________ __,_,.FIGURE 1 .3~.j_0~._3) ______________ _
Sta~dard Additions of Matrix Matched Copper
Standards to Pooled Hu~an Plasma

65
co
.. H Q) p., p., 0
0

66
TABLE 1.3.10.4
Matrix Matched Zinc Standards
Solution # Zn, ppm Absorbance Standard Deviation %RSD n
1 ~ 5-.-0-0 0-.-0Jf-JJ 0--0-0-62 7-3-1-0 '7
14 2.00 0.0531 0.0034 6.3 10
15 1.00 0.0316 0. 0041 1 3. 0 1 0
16 0.50 0. 01 95 0.0018 9.2 10
Linear Least Squares.
n = 3
Correlation = 0.9996
Slope = 0.0223
X = 0, y = 0.0087
y = 0, X = -0.39

67
FIGURE 1.3.10.4
Matrix Matched Zinc Standards

N I a .......
X
(].)
~
~ ro
,.a H 0 (Jl
,.a c::x::
9
8
7
6
5
4
3
2
1
1 2 3 Zinc, ppm
4
68
0
5 6

TABLE 1.3.10.5
Standard Additions of Aqueous Zinc
Standards to Pooled Human Plasma
69
Solution # Zn~ ppm Absorbance Standard Deviation %RSD n
(1,11) o.oo 0. 0321 0.0034 1 o. 7 1 0
(3,11) 0.50 0.0449 0. 0021 4.6 10
(5,11) 0.99 0.0535 0.0051 9.6 10
(7,11) 1.96 0.0709 0.0047 6.6 1 0
(9,11) 4.76 0.1034 0.0037 3.5 1 0
Linear Least Squares
n = 4
Correlation = 0.9963
Slope = 0. 01 94
X = 0, y = 0.0336
y = 0, X = -1.70

-------------- -----------
FIGURE 1.3.10.5
Standard Additions of Aqueous Zinc
Standards to Pooled Human Plasma
70

71
co
--------------~()L_ __________________________________ ;
co
co

TABLE 1.3.10.6
Standard Additions of Matrix Matched Zinc
Standards to Pooled Human Plasma
72
Solution # Zn, ppm Absorbance Standard Deviation %RSD n
(1,13) o.oo 0. 031 7 0.0026 8.3 9
(3,13) 0.50 0.0452 0.0043 9.5 1 0
(5,13) 0.99 0.0558 0.0047 8.4 1 0
(7,13) 1.96 0.0714 0 .. 0049 6.9 10
(9,13) 4.76 0.1 011 0 •. 0039 3.9 10
Linear Least Squares
n = 4
Correlation = 0.9918
Slope = 0. 01 99
X = 0, y = 0.0338
y = 0, X = -1.70

FIGURE 1.3.10.6
Standard Additions of Matrix Matched Zinc
Standards to Pooled.Human Plasma
73

10 t I [0 9
8 C\l
I 0
7 ... :.< Q) 6 (.)
~ Qj 5 ,Q H 0 Cll 4 ,Q ~
3
2 l
1 I I
I . I I I I
8 7 6 5 4 3 2 1 1 2 3 4 1 5 6 7 8
Zinc, ppllll
-.J -!>--

75
TABLE 1.3.10.7
Copper and Zinc Standard Solutions
Solution # Cu, ppm Zn, ppm . NaCl, M Dextran, %(v/v)
1 5-~-0D
2 2.00
3 1.00
4 0.50
5 5.00
6 2.00
7 1.00
8 0.50
9 5.00 0.1 5 6
10 2.00 0.15 6
11 1.00 0.1 5 6
12 0.50 0 .. 15 6
13 5.00 0.1 5 6
14 2.00 0.1 5 6
15 1. 00 0.1 5 6
16 0.50 0.15 6

76
TABLE 1.3.10.8
Copper and Zin.c Standard Solutions
ih Pooled Human Plasma
Solution # Cu, ppm Zn, ppm Added NaCl Added Dextran
--------------------------------~~x~~-3M ____ ~v~~vJ. ____________ _
(1,11) o.oo (3,11) 0.50
(5,11) 0.99
(7,11) 1.96
(9,11) 4.76
(1,13) o.oo o.oo o.oo (3,13) 0. 50. 0.75 0.03
(5,13) 0.99 1 .49 0 •. 06
(7,13) 1.96 2.94 0.12
(9,13) 4.76 7.14 0.29
(1 ,14) o.oo (3,14) 0.50
( 5, 14) 0.99
(7,14) 1.96
( 9,1 4) 4.76

TABLE 1.3.10~8 (CONTINUED)
Solution # Cu, ppm Zn, ppm Added NaCI
X 10-JM
(1.16) o.oo O_~_QO
(3,16) 0.50 0.75
(5,16) 0.99 1 .49
(7,16) 1.96 2.94
(9,.16) 4.76 7.14
77
Added Dextran
%(v/v)
0-~-0D
0.03
0.06
0.12
0.29

78
TABLE 1.3.10.9
Slopes of Aqueous and Matrix Matched Standard Curves
Table Slope Metal Standard
1 .--§-.~ n n1?(... ....,-.. -9-.-.....--li;l G-ll A,..,,, of"\,, o :.n;c:r~-'-'-\;n;;;&.~....,
1.3.10.1 0. 01 06 Cu Matrix Matched
1.3.10.2 0.0111 Cu Aqueous Additions, Plasma
1.3.10.3 0.011 0 Cu Matrix Additions, Plasma
1.5.2 0.0198 Zn Aqueous
1.3.10.4 0.0223 Zn Matrix Matched
1.3.10 • .5 0.0194 Zn Aqueous Additions, Plasma
1.3 .. 10.6 0.0199 Zn Matrix Additions, Plasma
79
1.4 Instrumental Parameters for Atomic Absorption
A summary of the instrumental parameters for atomic
absorption as developed in section 1.3 is given in Table
1.4.1. These flow injection analysis system parameters
were used for the assay of copper and zinc in mouse plasma
with the Perkin-Elmer Model 303 atomic absorption
spectrometer.

TABLE 1.4.1
Instrumental Parameters for Atomic Absorption
Parameter
Wavelengt
Recorder Chart Speed
Recorder mv
Recorder Readout Noise
Recorder Readout Scale
Slit
Helium Pressure on the
Solvent Reservoir
Copper
]24-;-T54 nm
1 em/min
20 mv
2x
30x
4
20 psi
Solvent Flow Rate 2.5 mL/min
Flow Injection Analysis 6%(v/v) t-butanol
Solvent in Water
Burner Head Type Triple Slot
Burner Lead Head Screw. 1.75
Turns ccw
Burner Height
Fuel Flow
Oxidant Flow
Injection Size
-1.5 em
9.5(C 2H2 )
9.5(Air)
1 o uL
80
Zinc
:,zry;-s-5-6 nm
1 em/min
50 mv
2x
30x
5
8 psi
1.0 mL/min
6%(v/v) t-butanol
in Water
Triple Slot
1.75
-4.0 em
5.0(H2)
9.0(Argon)
1 o uL

1.5 Standard Calibration Curves for Copper and Zinc
Cu, ppm
5.00
2.00
1.00
0.50
TABLE 1 .5.1
Absorbance of Aqueous Copper Standards
Absorbance Standard Deviation %RSD
0.0627
0.0252
0.0123
0.0062
0.0013
0.0007
0.0008
0.0009
2.1
2.8
6.6
15.2
Linear Least Squares
n - 4
Correlation. = 1.0000
Slope = 0.0126
X = 0, y = -0.0001
y = 0, X = 0.0090
n
11
10
1 0
10
81

82
FIGURE 1.5.1
Absorbance versus Concentration of Copper Standards

8
7
6
5
C\l I 0
~4
>< (])
~ s:: aj
~3 0 C/l .0 -=x:
2
1
1 2 3 Copper, ppm
4
83
5 6

Zn, ppm
5~0
2.00
1.00
0.50
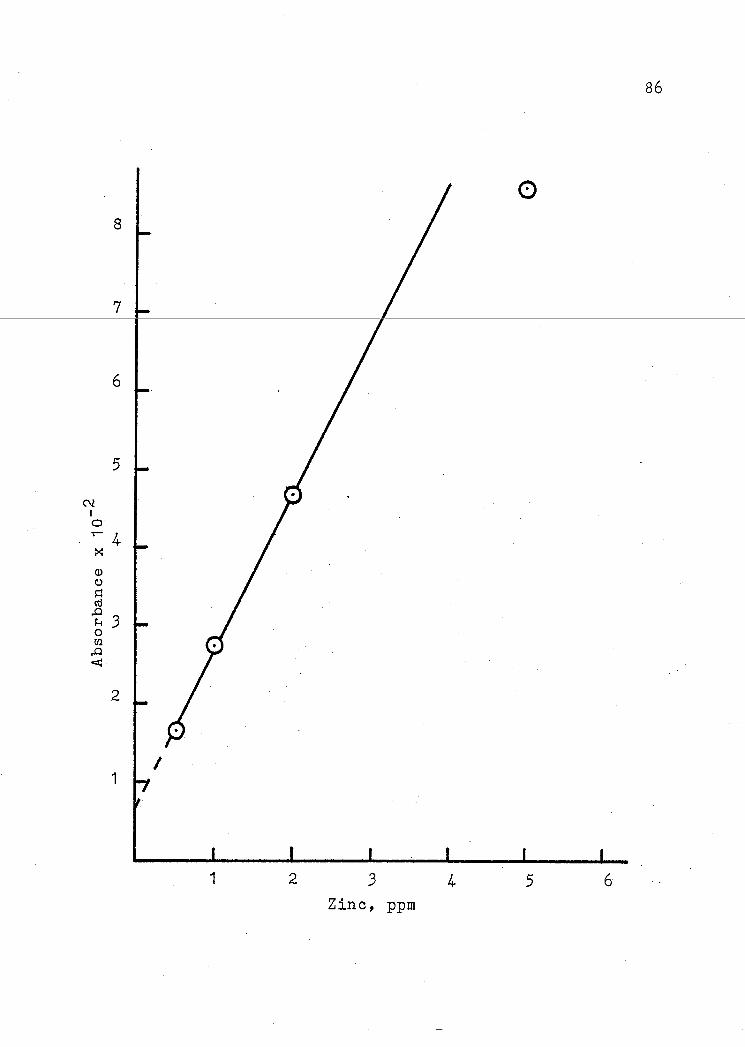
TABLE 1.5.2
Absorbance of Aqueous Zinc Standards
Absorbance Standard Deviation %RSD n
0.0859
0.0464
0.0273
0. 0165
0.0028
0.0029
0.0018
0.0011
3.3 10
6.3 10
6.6 10
6.6 10
Linear Least Squares
n = 3
Correlation = 0.9994
Slope = 0.0198
X = 0, y = 0.0069
y = 0, X = -0.3499
84

--- -------------------~ ------
85
______________ ______.L~_GllRE_j_ .. -5-~2: _______________ _
Absorbance versus Concentration of Zinc Standards
8
7
6
5
N I 0 ~4
:-:
2
1 I
~~~~~~~~------~- ~- ---
86
0
1 2 3 4 5 6 Zinc, ppm

1.6
1 • 6.1
Data Analysis Programs and Procedures
Program to Calculate Absorbance Values from
Peak Height
The Perkin-Elmer Model 303 atomic absorption
87

··-·· --------
88
The problem which arises under the 100 mm boundary
condition is that we are restricted to only using a 100 mm
section of a 250 mm wide chart paper. The decision was to
use the full width of the chart paper by adopting a 1000 mm
boundary condition. The following program was used to
convert peak heights in mm to absorbance with the boundary
This program is written for a Texas Instruments Hodel 55
(TI-55) calculator. It is based upon the formula of
Absorbance= -log10 ((1000 - mm ) I 1000 ).
2nd CA 2nd Fix 6 2nd Lrn i + 1000 = · 1000 = 2nd log = + = 2nd RIS 2nd Rst 2nd Lrn 2nd Rst
An earlier equivalent formula.and its corresponding program
is Absorbance =- log10 (( 100 - ( mm x 10-1 )) I 100 ).
2nd CA 2nd Fix 6 2nd Lrn x ( 1 i 2nd 10x ) = i + 100 =
+ 100 = 2nd log = ± = 2nd RIS 2nd Rst 2nd Lrn 2nd Rst

Program verification:
To determine the absorbance of a peak height in mm,
do the following:
1 •
2.
Enter the height in mm
Push 2nd
Push R/S
ex: 14.5 ex: 18.5
89
3.
4. The register will read 0.006343 0.008110

1.6.2
----------~~~~~~~~~-
Program to Calculate Absorbance Values from
Absorption Values
90
The following program was written for a TI - 55
calculator. The program permits the calculation of absorbance
values from absorption values. An absorption value of 1.0000
is 100 percent absorption. The program is based upon the
formula of absorbance = log10 ( 1 -absorption ).
2nd CA 2nd Fix 4 2nd Lrn = ~ + 1 = 2nd log = + = 2nd R/S 2nd Rst 2nd Lrn 2nd Rst
Program verification:
To determine the absorbance from an absorption value,
do the following:
1.
2.
3.
4.
Enter the absorption value
Push 2nd
Push R/S
The register will now read
ex: 0.4268 ex: 0.5000
0.2417 0.3010

1 • 6. 3 Program to Calculate Peak Heights from
Absorbance Values
91
The following program was written for a TI - 55
calculator. The program permits the back calculation of peak
heights in mm from previously calculated absorbance(A)
values wnere tnose aosorl5ance va..Lues were calcu.lated oy tne
formula of absorbance= - lo~10 (( 1000 ~ mm )/ 1000). The
boundary condition is that 1000 mm of peak height is equal
to 100 percent absorption. The ~rogram is based upon the
formula of mm = ((( 1000 x 10A ) - 1000 )/ 10A ).
2nd CA 2nd Fix 0 2nd. Lrn STO 1 RCL 1 2nd 10x x 1000 =
- 1000 = ) ~ ( RCL 1 2nd 10x ) = 2nd R/S 2nd Rst .. 2nd Lrn 2nd Rst
Program verification:
To determine the peak height in mm from a previously
calculated absorbance value~ do the following:
1. Enter the absorbance value ex: 0.068542 ex: 0.004804
2.. Push 2nd
3 •·
4.
Push R/S
The register will now read 146 11

92
Procedures .and. Criteria. for Data Analysis
The primary atomic absorption data from the experiments
consisted of narrow peaks on stripchar.t recording paper. The
height of each individual peak was determined with a metric
ruler to the nearest mm. This height represents and is
proportional to the size of the instrument absorption signal.
An absorbance value was calculated from this peak height.
The boundary condition in the calculation was that 1000 mm of
peak height is equal to 10Q percent absorption.
A~· .. linear least squares standar·d curve was prepared from
the calculated absorbance values for the aqueous standards.
Each standard w~s injected ap~roximately ten times. Standards
were injected at the beginning of every analysis session.
The calculated absorbance values for the mouse plasma samples
were then entered into the calculator •. The concentration of
the metal in ppm was determined from standard curves
previously developed by a linear least. squares method. A
typical analysis run consisted. of a series of four standards
of the metal of interest and. approximately fifty plasma
samples. The total number of.inject1ons in a typical run was
approximately ninety.

93
Data of questionable.quality were individually
rejected £rom the set of data when they fell outside of the
4Q criterium which requires the removal of data points that
are away· from the mean. by more than four times the standard
deviation. The mean and the standard deviation about the mean
are calculated from the set of data remaining after the
a.atum point in question has been removed-;-Data not obtained
under the specified instrumental parameters, particularily
the requirement for 10 ~L of sample, were also removed.

CHAPTER TWO
2. Audiogenic Seizure Susceptible Mouse Model of Epilepsy
The analytical methods that were developed in Chapter
One have been applied to an epilepsy project •. That project,
which involves the use of audio.gen.ic sei·zure susceptible
mice, is introduced. in this chapter.
Epilepsy is a "recurrent sel.f-sustained. paroxysmal
disorder o£ brain function characterized by excessive
discharge o.f cerebral. neurons 11 ( 2.3). The. frequency of
epilepsy in the human population is approximately 0.5
percent (24). Since the causes of epilepsy are as varied
as the clinical expressions we prefer to view the
manifestations of epilepsy as a symptom of one or more
disease states.
Historically, epilepsy has long been recognized as a
disease state in such documents as the Code of Hammurabi
who set rules regardingthe marriage of epileptics and the
admissibility of their court testimony ( 24) •. Hippocrates
considered epilepsy a disease of.the brain (24).
94

95
Charles le Pois.was the first. to state that all
epileps~es- originate in the brain (24). Jackson introduced
the idea of a discharging focus when he explained seizures
as the reBult of paroxysmal discharges beginning at and
spreading from a focus location. in the brain (24). Berger
introduced electroencephalography(EEG) (24). This technique
i--s-t"11e recor·<i-ing of-tne mil-rivolt potential of an epileptic
discharge on a millisecond time scale. Such techniques make
it possible to locate and characterize the epileptic
discharge and also to develop and verify experimental
models of human epilepsy by comparison of the resulting
EEG seizure patterns.
Numerous models of human epilepsy have been developed
and verified by EEG techniq.u.es for purposes of testing
anticonvulsant drugs and studying t.he underlying chemistry
of the epileptic disease state. A "model" of human epilepsy
consists of a procedure applied. to a certain animal or
tissu:e. Models of human epilepsy which have been developed
for the purpose of testing anticonvulsant drugs consist of
procedures 'tvhich involve the topical application of
convulsant metals to neural tissue, freezing of a localized
section of brain, administration of convulsant drugs to
mammals, electrical stimulation of neural tissue, and
disturbances of metabolic equilibria.

96
Models of human epilepsy which ha.ve been. developed for the
purpose of studying the underlying chemistry of the disease
state consist of applications of the previously listed
procedures, the application of. those procedures to humans
and other genetically seizure susceptible mammals, and
procedures which involve the chemistry of genetically
seizure susceptible mammals. These mammals are certain
strains of goats, Senegal baboons, mice, rats, and rabbits
(23, 25-30). All of these animals are susceptible to drug
induced seizures. They are also susceptible to seizures
which have been initiated by rather rare methods~ Certain
strains of Senegal baboons are seizure susceptible to
intermittent light stimulation. S~lected populations and
strains of rabbits, rats, and mice are susceptible to audio
genic seizures. The advantages of low cost, availability of
many different inbred strains,. rapid reproductive rates,
and the superb genetic definition obtained as a result of
hundreds of generations of inbreeding has resulted in the
establishment and widespread acceptance of the audiogenic
seizure susceptible mouse model of epilepsy (28).
This model of epilepsy has two important experimental
parameters. The first is that the percentage seizure
susceptibility of mice is age dependent.

97
Vicari extablished the bimodal age dependence of the DBA/2
strain (31). Table 2.1 presents her results for the percent
of DBA/2 mice by age that will convulse on the first trial
within 90 seconds after sound initiation £rom an 80 to 90 db
electric hell in a metal tub. She obtained a maximum of
90 percent seizure susceptibility for DBA/2 mice in the
30-34 day .. age group and a second maximum o:f 25 percent in
the 60-69 day age group. Not all strains of.seizure
susceptible .mice exhibit a bimodal susceptibility curve
but they do have· a curve, that generally shows seizure
susceptibili.ty beginning aroblnd day 14, peaking in the
30 1 s,. and then declining (32,33).
The s:eeond. important experimental parameter is that
audiogenic se-izure susceptibility varie.s widely among various
inbred strains •. Fuller and Sjursen. ha.ve ranked the seizure
susceptibility of eleven strains of inbred mice (34), in the
order DBA/2J > LP/J > 129/J > .RF/J. > AKR/J .> LG/J > SJL/J >
CBA/J > SM/J > BALB/cJ > C5?BL/6J. We obtained a similar but
slightly different ranking.of six of their strains by
converting their graphical data into percentage seizure
susceptibility by week,. obtaining the average of the seizure
susceptibility over the weeks 3,4,5, and 6 and ranking the
six selected strains in the order of percentage seizure
susceptibility.

98
TABLE 2.1
BDA/2 Mouse Age versus Percent Seizure Susceptibility
Mouse Age~ Days Percent Seizure Susceptibility
10-19 0
20-24 60
25-29 88
30-34 90
35-39 80
40-44 61
45-49 66 '
50-59 7
60-69 25
70-79 17
80-89 0
90-99 0
100-600 0

99
The result is the slightly modified percentage seizure
~usceptibility order o£ LP/~(~7%) > DBA/2J(94%) > SJL/J(70%) >
LG/J(65%) > BALB/cJ(24%) > C57BL/6J(14%). The combination
of age variation and interstrain variation in seizure
susceptibility allows the design of experiments showing the
presence or absence of correlation between a measurable
parameter and seizure susceptibility.
The transmission of seizure susceptibility from a
seizure susceptible mouse to a non-seizure susceptible mouse
by connecting their circulatory systems by surgical
parabiotic union was demonstrated .by Hamburgh(J5). This
experiment established the influence of some unknown
aspect of the circulatory system such as the presence,
absence, or a concentration change in a chemical upon
seizure susceptibility. The experiment suggests that there
exist significant chemical. differences between the
circulating fluids of susceptible and resistant mice.
The large number of metalloenzymes that contain copper
and zinc, their influence.in numerous metabolic pathways,
the 25 to 40 percent elevation of copper and the 20 percent
reduction of zinc in the serum of human epileptics receiving
anticonvulsant medication, and the lack of data for copper
and zinc plasma concentrations as a function of age for
epileptic mice, led to considering this. res.earch project
( J 6 ,3 7 , J 8 ) •

------·-·-·· ------ -·· ---~------~--
The project was to_ determine the. plasma copper and zinc
concentrations by age. for the previously described series
100
of six selected strains of audiogenic .sei~ure susceptible
mice, to compare the results with thei~ age and strain
dependent audiogenic seizure susceptibility,. and to determine
of the mice and their plasma copper and/or zinc concentrations.
The experiments required repeated measurements of
coppe~ and zinc concentrations in 10 ~1 samples of mouse
plasma with adequate precision at the one p.pm level. This
resulted in the extensive development of atomic absorption
flow injection techniques to obtain the required accuracy
and precision. For the nscessary observation of a 20 percent
change in zinc concentration, an analytical precision of
10 percent at the one ppm level was considered appropriate.
CHAPTER THREE
3. Experimental
3.1 Animal Husbandry
3.1.1 Mouse Cages and Racks
Six strains of non-pedigree littermate breeder mice
were obtained from The Jackson Laboratory, Bar Harbor, Maine.
The strains were C57BL/6J,. LG/J, DBA/2J, SJL/J, BALB/cJ, and
LP/J. They were housed, one breeding pair per cage, in two
cage racks of 36 cages per rack. Each cage rack held six
rows of six cages per row. The mice were segregated to one
strain per column in the previously listed order. Cages
were numbered by column starting with row one.
3.1.2 Mouse ~va ter
Tap water, acidified w.ith five drops of concentrated
HCl per 500 mL was available.to the mice on an ad lib basis.
This level of acidification is recommended as a means of
reducing microbiG.>lo.gical. growth in. the water bottles(39).
101

102
It also reduces the deposition of calcium and other minerals
on the insides of the water bottles. The pH of the water was
determined to be 2.58 with a. standard deviation of 0.02.
3.1.3 Mouse Diet
~-------iM-o-u.-s-e~~e-e-d~e~f-t-h-e~s-¥-e-e-i-f-i-e-t-y-p-e-s-a-s-1-i-s-t-e-d-±-n-T-a-b-J:-e------
3.1.3.1 was available to the mice on an ad lib basis., We
note that the DBA/2J mice were very poor breeders when the
diet contained more than 6% fat. Other mice such as the
BALB/cJ are poor breeders unless the diet contains at least
10% fat~ The diets were chosen on the basis of published
Jackson Laboratory r.ecommenda tions, breeding experience
in our laboratory, availabil£ty, and price (40).
C57BL/6J
LG/J
DBA/2J
TABLE 3.1.3.1
Diets
Purina Lab Choiv
X
X
X
911A
X
X
961vA
X

SJL/J
BALB/cJ
LP/J
Purina Lab Chow
X
911 A
X
X
X
103
96vlA
The first row of v~lues in Table 3.1.3.2 are provided
by the Ralston Purina Co. These values are typical Purina
Lab Chow lot analysis test results •. The Old Guilford Lab
Diet values fo.r the 911A and 96Tt>TA are published Jackson
Laboratory specifications (40).
Diet
Purina Lab Chow
911A
96WA
TABLE 3.1.3.2
Diet Composition
%Fat
4.5
10.-3
7.5
%Protein %Fiber
23.0 6.0
20 •. 1 2.6
22.5 2.3
%Ash
8.0
4.9
4.5

3.1 .4 House Bedding
Mouse bedding cons~sted of either autoclaved wood
shavings or pelletized and autoclaved sawdust pellets.
3.1. 5 Cage Cleaning
Mouse cages and water bottles were washed, cleaned,
104
and recharged with. new beddin.g, water, and food approximately
once every ten days.
3.1. 6 Mouse Room Environment
The cage racks were located in a working research
laboratory on either side of a dual bank of continuously
operating laboratory fume hoods. The hoods provided a
constant low background noise and a room air change
approximately one every three minutes. The laboratory
temperature was approximately 20 °C. The cool white
fluorescent lighting was not on timers but was off
approximately six to eight hours every night. We were aware
of reports of environmental influences on. the health of
laboratory·animals(41). The 6lean, calm, and consistent
laboratory environment resulted in a healthy mouse colony.

105
3.1.7 Evolving Number System
Sufficient data were maintained on the date of births,
cage transfers, age of weaning, pairings, and deaths by the
use of weekly cage "Transfer Sheets" to permit the
calculation of individual mouse numbers by the evolving
number method(42) .• This system was used during the first
year of the colony but was dropped due to the large time
requirements for its maintenance with a colony that consisted
of 60 breeding pairs and a total population of approximately
300 mice. At ~ach cage:cleaning a total count was maintained
for all mice by location, sex, strain, and breeding or
experimental status.
3.1. 8 Mouse Plasma
The following procedure for obtaining mouse plasma
was developed as the result of a considerable amount of
experimentation with numerous. widely. different methods and
procedure&. ·The procedure described here requires a total
collection time of approximately five minutes per mouse
for all collection and preparation steps. .

106
One begins by .Placing the mouse in a "mouse vise" with
the tail held outside of tha apparatus. It is necessary to
firmly hold the end of the tail at all times. The tail is
closely shaved with a disposable razor. A prominent tail
vein, usually the dorsal vein, is then sliced with a scalpel
about 2 em from the posterior in a. direction. perpendicular to
the long axis of the vein. A 250 mm heparinized haematocrit
tube is placed in such a manner that it .just touches the
drop of blood that forms at the vein cut. The goal is to
collect as much blood as .possible in the haematocrit tube.
The collected whole blood. is then blown out of the tube and
into a 400 uL microcentrifuge tu~s. This tube:is centrifuged
at 4000 rpm for fifteen minutes. The upper plasma layer is
removed with a 20 uL Eppendorf micropipet and placed in a
250 uL microcentrifuge tube. This .tube, made of conventional
polyethylene, is capped and placed in a known location on
the grid of a plasma sample board.
Plasma was analyzed rather· than serum because experimen
tation was easier and the· difficulty o.f reproduci.bly
clotting ~mall volumes of. whole blood was avoided. The
analytical procedure requires at least 50 uL of whole blood
prior to the centrifuge step.

107
This resul·ts. in at .least 25 'IlL of plasma for analysis thus
allowing 10 uL per metal and 5 uL for sdlution volume. It
is rather difficult to consistently and readily obtain
such volumes· of. whole. blood fro.m. small young mice.
Records of plasma collection were maintained on a
"Blood Collection Sheet". These data consist of the mouse
cage number. strain, sex, time of collection, date of
collection. volume of whole blood collected, and the final
grid location on the plasma samp.le board. The plasma
sample board was a rectangular board with a grid network
of holes drilled into its surface. Each hole holds a
250 11L conventional polyethylene.microcentrifuge tube.
3.2 Miscellaneous Experimental Details
3.2.1 Water
All water used in all experiments was deionized,
filtered through·a 0.4511 Millip.ore filt.er,. doubly distilled,
and stored in linear· polyethylene bottles.

3.2.2 Atomic. Absorption Standards
Banco(Anderson Labs, Ft. Worth, Texas) 1000 ppm
copper and zinc a tomi.c absorption standards were used in
this work. Standards of lower concentration were
108
prepared from these standards by dilution wi th____±._h_e_pr_e_\li_o_usl_y-~~
described water.
3.2.3 Polyethylene Containers ·
Samples and atomic.absorption standards were stored
in linear polyethylene containers. The plasma samples were
stored in conventional polyethylene microcentrifuge tubes.
3.2.4 Syringes
All flow injections for atomic absorption were done
with a 10 ~L Hamilton #701 syringe.
3.2.5 Atomic Absorption Lamps
The zinc hollow cathode lamp was from Cathodeon
Sadtler, 3QNY/Zn, Serial #79273. The copper hollow cathode
lamp was from Cathodeon-Oriel, #6827-1, Serial #65914.
CHAPTER FOUR
4. Results and Discussion
Procedures for atomic absorption analysis by flow
----~i-n-;j-ee-t-:i:-on-were-d-evBro-p-e-Q-fu-r-t-h e as sa.y . of . copper and------zinc in
10 ~1 samples of plasma from age dependent audiogenic
seizure susceptible mice. The analysia procedure has a
precision of less than 10 %RSD at a copper or zinc
concentration or 1.0 ppm. The flow injection apparatus was
designed with a pulseless liquid flow control system. Flow
regulation is accomplished by varying the.inert gas pressure
on the pressurized solvent reservoir. The aspiration
solvent is 6%(v/v) t-butanol in.water •. After exhaustive
parameter optimizations,-copper assays were conducted with
the conventional air-acetylene flame at. 324 •. 754 nm and
zinc assays were conducted with the unconventional argon
hydrogen air diffusion flame at 213.856 nm. The aspiration
solvent was chosen. because it enhanced. the. signal without
precipitating the plasma. proteins. The argon-hydrogen
flame system was chosen because it absorbs very little
ultraviolet light at .the analytical wavelength for zinc
(213.856 nm).
109

110
The developed methods for. atomic.absorption by flow
injection were usBd to. determine the concentration of
copper and zinc in plasma· samples from six strains(C57BL/6J~
LG/J, DBA/2J, SJL/J, BALB/cJ, and LP/J). o£ male and female
audiogenic seizure ·susceptible mice, aged 18 to 65 days.
The results ar~e_p_r_e_s_en±_e_d_in.-2k-s-e-ts~o-f,__.da-ta-an-d-g-~a-p-hs-----
of metal concentrations versus mouse age.
The data and graphs of plasma copper and zinc
concentration versus mouse age for the six strains of mice
are presented in the Appendix. A linear least squares
reduction of these data is. presented in Table and Figure
4.1.1 for copper and 4.2.1. for zinc. For ease of viewing,
twelve o~ these lin~s are presented.on the same graph
in Figures 4~1.1 and 4.2.1. An averaged linear least
squares reduction o.f the. reduced data is pres en ted in
Figure 4.1.2 for copper. and 4.2.2 foD zin~. This line
represents the average copper or zinc concentration versus
age for· all strain~ and sexes.

- -----~--~~
1 1 1
TABLE 4.1.1
Linear Least Squares Calculated.Copper Concentrations by Age
Cu, ppm at Age, Days
# Strain Se.x n Corr. .Slo.pe .0 20 40 60
-1 c 5~9~B-I:,f~6,;-. -Na-:t-e~-~-4~G---;-l:-·1-37-------:;;-0---;-ou-3-i_i_~-n-r-:-o~o~9~0----:-8 I
2 C57BL/6J Female 14 0 •. 0994. 0..0033 0.9 1 • 0 1 • 1 1 • 1
3 LG/J Male 16 0.3278 0 •. 0098 0.8 1 • 0 1. 2 1 • 4
4 LG/J Female 13 0.2905 0.0075 1 •. 0 1 • 1 1 .3 1.4
5 DBA/2J Male 15 -0.4332 -0.0109 1 .5 1 • 3 . 1 • 1 0.8
6 DBA/2J Female 13 .0 •. 1575 0.0037.1.0 1 • 0 1 • 1 1.2
7 SJL/J Male 19 0.2941 0.0065 1 • 0 1.1 1 .2 1 .3
8 SJL/J Female 22 0.1659 0 •. 0040 1 • 0 1 • 1 1 .2 1.3
9 BALB/cJ Male 14 -0 .1692: -0.0082 1 • 6 1. 4 1 • 3 1 • 1
10 BALB/cJ Female. 16 -0.2020 -0.00-78 1 • 7 1 • 5 1 • 3 1 • 2
11 LP/J Male 10 -0.2062 -0.0052 1 .3 1.2 1 • 1 1 • 0
12 LP/J Female 1 1 -0.1543 -0.0036 1 • 3 1 • 2 1 • 1 1 • 0

FIGURE 4.1.1
Copper Concentration versus Age for.the Plasma of
Six Strains of.Male and Female Mice
112

0 •
C\!
~· en. 1:'-- 00 -.() C\! 0 C\! 0" .,.- .,.- 1.{\
I ,, I I ,, I I ,, I II ,, I If
II I II
II I II t, I II
1.{\
• .,.-
.,.- .,.- .,.-
,, ,, II\
""" ,,,_ \ I \ \rt \
I I I I J I II
' ,,, \ ' ,, \
l ''" \
0 • .,-
mdd '.reddoo
1.{\
• 0
113
0 \,!)
0 lC\
0 C\!
0 .,.-
.. Q)
b.O <

114
FIGURE 4.1.2
Average Copper Concentrat~on. versus Age for the Plasma of
Six Strains of Male and Female Mice
n = 4
Correlation = -0.8452
Slope = -0.0003
X = 0, y = = 1 .16

I I I I I I I
0 1.(\ 0 • • •
N ,...... ,......
mdd '..reddoo
1.(\
• 0
11 5
0 1.(\
0 (Y\
0 N
0 ,......
Ol :>. m r=l
.. Q)
M <

116
TABLE 4.2.1
Linear Least Squarea Calculated Zinc Concentration by Age
Zn~ ppm at Age, Days
# Strain Sex n Cor~~ Slope . 0 20 40 60
1 C57BL/6J Male 14 0.6735 0.0242. 0.5 1 • 0 1 ._4_1_._9
2 C57BL/6J Female 1.3 0.3982 0.0121. 0.9 1 • 1 1. 4 1 • 6
3 LG/J Male 16 0 .. 4891 0.0265 0.9 1.4 1 • 9 2.4
4 LG/J Female 15. 0.5959 0.01.47 1 • 0 1 • 3 1. 6 1 • 9
5 DBA/2J Male .13 0 •. 4209 .. 0. 0140 0 .• 9 1 .2 1 • 4 1 • 7
6 DBA/2J Female 13 .. 0 •. 7826 .0 .. 0200 0..6 1 .o 1. 4 1 .8
7 SJL/J Male 22 0.5170 0.0099 1.2 1.4 1. 6 1 • 8
8 SJL/J Female 21 0.5557 0.0160 0.9 1.3 1. 6 1 • 9
9 BALB/cJ Male 12 0 ... ,1444. 0.0060 1 .•.. 1 1.2 1.4 1 • 5
10 BALB/cJ Female. 13 0.2372 0..,0057 1 .1 1.2 1 .3 1.4
11 LP/ J Male 12 0.6482 0 •. 0285 0 • .3 0.8 1 • 4 2.0
12 LP/J Female 11 0.399 3 0.0173.0.9 1 .• 2 1 • 6 1 • 9
FIGURE 4.2.1
Zinc Concentration versus Age for the Plasma of
Six Strains of Male and Female Mice
117

\
\ \
\
0 •
C\l
. ' \ ' ' l \ '
,,~,\ ,' \
\ \ i~ \ \\ \ \ ,,~ \ \\\ ',
l.C'\ •
\ "\' \\ \ \ \ ' \ \\~\\ \ \ \
\ \ '"~' \ \ \ \ \ \\\\) \ \ \
\ ' ' \\\ \ \ \
0 l.C'\ • •
0
118
0 lC\
0 C\l
... (])
l:l.O <

FIGURE 4.2.2
Average Zinc Concentration versus Age for the Plasma of
Six Strains of Male and Female Mice
n
Correlation
Slope
X = 0, y
=
= =
=
4
1.0000
0.0163
0.85
119

\ \ \ \
0 1.(\ 0 • • •
C\1 or- or-
mdd
\ \ \
1.(\
0
'OU"'{:Z
120
0 1.!'\
0 (Y\
0 C\1
0 or-
Cll :>:. ttl
(::)
.. Q)
M ex::

121
The copper concentration, within the precision of the
·data, is 1.2 ppni: ±. 0.:2 SD for all sexes, strains, and ages.
The zinc concentration, within the precision of the data,
increases· from 1 •. 2 ppni + 0.2 SD at twenty days of age to
1.8 ppni ±. 0.2 SD at sixty days of age for all sexes and
strains •.
There is no correlation between the age dependence of
the seizure susceptibility of any sex or strain of mice and
their plasma concentrations or concentration ratios for
either copper or zinc~ .. If there were a correlation between
the copper or zinc.plasma. concen~ration and the seizure
susceptibility we would expect to observe a significant
copper or z.in.c plasma concentration change that would
profile the age dependency of the seizure susceptibility.
Such an age dependent concentration profile was not found.
The copper and.zinc plasma concentration as a function of
age does not follow the seizure susceptibility profile as
a function of age for any.strain or sex of mice studied.
At any age there is no correlation between the relative
seizure susceptibility among the strains of mice and their
concentrations or aoncentration ratios of either copper or
zinc. If there were a correlation it should follow the
interstrain seizure susceptibility pattern of LP/J > DBA/2J >
SJL/J > LG/J > SALB/cJ > C57BL/6J.

122
Such a correla.tion. was. n.ot observed.
The age dep~ndence of the percentage audiogenic seizure
susceptibility in these strain.s of mice is very large,.
ranging ·from zero to. ov.er 97 percent susceptibility. This
was· shown by the work of. Ham burgh and Vicari ( 33) and later
by the work of Fuller and Sjursen(34).
s-ince a correlat-ion between the age dependence of the
audiogenic seizure susceptibility of the mice and their
plasma copper or zinc concentration was not found, within
the precision of the data, we conclude that such correlations
probably do not exist. This result and the lack of any
correlation between the relativeinterstrain seizure
susceptibilities and the copper.or zinc plasma concentrations
suggests the absence of any correlation between copper or
zinc plasma concentrations and seizura susceptibility.
Various authors(J6,37,38) have reported elsvated serum
copper concentrations of.approximately.1 .. 3 ppm.±. 0.2 SD in
epileptic humans recei.ving medica.tion. ver·sus concentrations
of appr6xima·tely 1. 1. ppm + 0 •. 1 .. SD. in human controls.
Ola tun bosun has· also repo.rted the decrea·se of serum zinc
concentrations from approximately. 1 .. 0 ppm+ 0.1 SD in human
controls to approximately 0.8. ppm.±.. 0.1. SD in human
epileptics receiving medication(J7).

123
It is thus very interesting that we did not find elevated
copper and reduced zinc plasma concentrations in our series
of inbred strains of age dependent audiogenic seizure
susceptible mice.
These results suggest two interesting experiments. The
first experiment would be to determine the concentration of
copper and zinc in the plasma of human epileptics who had
not been receiving anticonvulsant medication. The second
experiment would be to determine the age dependence of the
copper and zinc plasma concentrations for our series of
audiogenic seizure susceptible mice who had been receiving
anticonvulsant medication.
These additional experiments would te.ll whether
anticonvulsant medication raises the concentration of
copper and lowers the .concentration of zinc in the plasma
of human epileptics. If it does not~ the validity of using
audiogenic seizure susceptible mice as a model for human
epilepsy is very much in doubt.

CHAPTER FIVE
5. Claims to Originality
1. Sensitivity was enhanced by a factor of 1.7
(Table 1.3.8~1) for atomic absorption flow injection
analysis methods by the use ~f a mixed aqueous-organic
solvent, 6%(v/v) t-butanol in water, instead of water.
2. Sensitivity was increased by a factor of 1.25
(Figure 1.3.3.1) for atomic absorption flow injection
analysis methods by the use of an argon-hydrogen air
diffusion· flame· instead of an air-ac.etylen.e flame.
3. A set of procedures was developed to enable an
analyst to increase the precision.and sensitivity of the
results· obtained from atomic absorption.flow injection
analysis assays by systematically optimizing the
instrumentation parameters~ The application of these
procedures to the analytical system will result in a set
of optimal instrumentation parameters •..
124

125
4. Atomic absorption. flow: in.j ection: analysis methods
were· applied to the analysis. of viscous,. salty, aqueous
and/ or organic, and. very complex fluids such as plasma
and serum by the use of mixed aqueous-organic solvents to
keep such fluids in solution in the solvent stream.
5. Data were obtained. for the concentration of
copper in the plasma of six strains(C57BL/6J, LG/J, DBA/2J,
SJL/J, BALB/cJ, LP/J) of audiogenic seizure susceptible
mice, aged 18 to 65 days.
6. Data were obtained for the concentration of
zinc in the plasma of six s.trains (C57BL/6J, LG/J, DBA/2J,
SJL/J, BALB/cJ, LP/J) of audiogenic seizure susceptible
mice, a~ed 18 to 65 days.
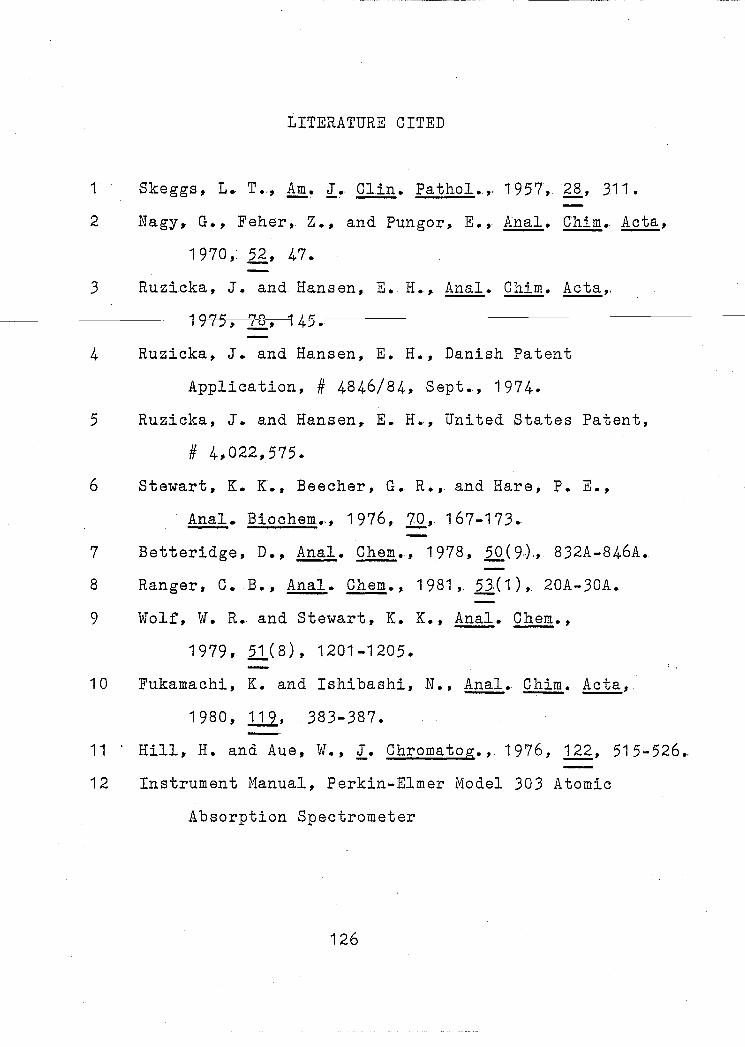
LITERATURE CITED
1 Skeggs, 1. T •. , !ill,. J. Clin. Pathol •. ,. 1957,. 28, 311.
2 Nagy,. G., Feher, Z., and Pungor, E., Anal. Ghim •. Acta,
1 9 7 0 ,: 52 , 4 7 •
3 Ruzicka, J. and Hansen, E. H., Anal. Chim. Acta, .
., nT7t:: T7_o_-1_'-""~----------------------------------'~• 7-t-;.;--,------.J..::_, I 4./ •
4 Ruzicka, J. and Hansen, E. H., Danish Patent
Application, # 4846/84, Sept., 1974.
5 Ruzicka, J. and Hansen, E. H., United States Patent,
# 4,022,575.
6 Stewart, K. K., Beecher, G. R., and Hare, P. E.,
!!!ll· Biochem •. , 1976, 70, 167-173 •.
7 Betteridge, D., Anal • .Q.Q2., 1978, 50(9.)., 832A-846A.
8 Ranger, C. B., Anal. Chem., 1981, 53.(1),. 20A-30A.
9 \volf, ~v. R. and Stewart, K. K., ~· Chem.,
1979, .21(8), 1201-1205.
10 Fukamachi, K. and Ishibashi, N., ~· Chim. Acta,
1980, 119, 383-387.
11 Hill, H. and Aue, W., J. Chromatog.,. 1976, 122, 515-526 •.
12 Instrument Manual, Perkin-Elmer Model 303 Atomic
Absorption Spectrometer
126

13 Kirkbright, G. F. and Sargent, M. Atomic Absorption
and Fluore.scence Spectrosco.py. New York:
Academic Press, 1974, 293.
14 Hausler, D. W. and Taylor, L. T •. , Anal. ___ Chem .•. ,
1981' 53( 8)' 12.23-1227.
127
15 Nygaard, Denton D., !ill!d.· ~ .. , 1979, 51 ( 7), 881-884.
-r6 GreenfJ.erd--;---s-tanley,. Industrial Research and.
Development, August 1981, 140-145.
17 Corliss, Charles H. and Bozman, William R. Experimental
Transition Probabilities for Spectral Lines of
Seventy Elements. WashingtDn, D. C.: U. S.
Government Printing Office, 1962.
18 De Galan,. L. and vlindfordner, J. D •. ,. J. Quant.
Spectrosc. Radiat. Transfer •. , 1967, 7, 251-260.
19 Kahn, H. L .. and Schallis, J. E., At. Abs. Nwsltr.,
1 9 6 8 ,, 1 ( 1 ) , 5-9 ..
20 Allan, J. E., Spectrochimica Acta, 1961., J.1, 467-473.
21 Henkin, R. I., in Mertz, W. and Cornatzer, W. E.,
Newer Trace Elements in Nutrition. New York:
Marcel Dekker,. 1971., 255-312.
22 Pekarek, R. S., Hauer, E. C., Wannemacher, R. W., Jr.,
and Beisel, iJJ. R., Anal. Biochem., 1974, 59,
283-292.

23 Jasper~ H. H. in Purpura, D. P., and others.
Experimental. Models of Epil.epsy. New York:
Raven Press, 1972, 586.
24 Schmidt, R. P. and Wilder, B. J. Epilepsy,
Philadelphia: F. A. Davis, 1968, 2.
128
25 Naquet~ R. and Meldrum, B. S. in Purpura, D. P. and
others. Experimental Models of Epilepsy. New York:
Raven Press~ 1972~ 373-406.
26 Antonitis, J. J., Crary, D. D., Sawin, D. B., and
Cohen, C., J. Heredity, 1954, 95, 279-284.
27 Finger,. F. W., Psychol. Bull.,. 1947, _4!, 20.1-248.
28 Collinsr R. L., in Purpura, D. F.~ and others.
Experimental Hodels.of Epilepsy .. New York:
Raven Press, 1972, 347-372.
29 Dice, L. R., J •. of Mammology, 1935, 1.6,. 25-35.
30 Hall, C. S., J. Heredity, 1947, 38, 2-6.
31 - Vicari, E. M.,. J •. Psychol., 1.95.1.,. 32, 79-97 •.
32 Castellion, A. W., Swinyard, E. A., and Goodman, L. s.,
Exp. Neural., 1965, 13, 206.--217.
33 Hamburgh, ~f. and Vicari, E., J. Neuropath. Exptl.
Neural., 1960, 11.(3), 461-472.
34 Fuller, J. L. and Sjursen, F. H., J. Heredity, 1967,
2.§_, 1 3 5-1 40 •

129
35 Hamburgh, M~, Mendoza, L~ A.,. Krupa, P., Gelfand, D.,
and Lehrer,. R., Exp.tl. Neural., 1970, 26(2.),
283-290.
36 Plum, C. M •. and Hans.en, s. E., Acta Psychiat. Neural •.
Scan d. , 1 9 6 0 , l2. ( 1 4 8 ) , 41 - 7 8 •.
37 Brunia, C. H. M. and Buyze, G., Epilepsia, 1972,
JJ., 621.-625.
38 Olatunbosun, D. A., Akindele, M •. 0., Adeniyi, F. A.,
and Bademosi, 0., Nigerian Med. J •. , 1978,
.§.(2), 124-125.
39 Lane-Patter, W. and. Pearson, A. E. G. !.h.§. Laboratory
Animal - Principles and .. Practice. London:
Academic Press, 1971.
40 Heiniger, J. H. and Dorey, J. L. Handbook of
Geneticall.yStandardized JAX Nice. Bar Harbor:
The Jackson Laboratory, 1980.
41 Weltman, A. S •. , Sackler,. A.M., Schwartz, R., and
Owens, H.,. Lab. Animal ~, 1968, 18 ( 4.), 426-435.
42 Green, .E. L. Biology of the Laborat.ory Mouse.
New York: McGraw-Hill, 1966, 25.

APPENDIX
130

A. Tables and Figures of Plasma Copper and Zinc
Concentrations by Age
A.1 .1
Age~
Days
26 27 28
29 31 32 33 34
35 37
39
41 43 44
Tables of Plasma Copper Concentrations by Age
TABLE A .. 1.1.1.1
Male C57BL/6J Plasma Copper Concentration~ by Age
Cu, ppm
0.9, 0.9 1.2 0.6, 0.5, 0.5, 1.0, 1 • 1 , 1 .1 1 .1 • 0.7, 0.6, 0.7, 0.6, 0.9, 0.8, 0.6, 0.7 0.6,. 0.?, 1.0, 0.7 0.8, 1.0 1. 0' 0.8, 0.8, 0.7, 0.7, 2.0,. 1.1' 1 .6, 1.6, 1 • 0, 1.2,. 1.3,. 1 ~2 1.0,. 0.9,. 0.8, 0.9,. 1.2, 1 •. 5' 0.7 1.0~ 0.8, 0.7, 1 • 1 , 0.8, 0 •. 8 1 • 1 ,. 0.9, 0.9, 1.0 0.8, 0.9, 1 • 0, 1 • 1 ' 0.7 0.8, 0.6
1 .1,
0.7
0.9, 1 .1,.
1 • 1 '
0.8,
0.9,.
1 • 1 , 1.0
1 • 0,
0.9,
n X
SD
-n X
2 0.9 1 1.2
8 0.9 6 0.7 4 0.8 4 0.8 2 0.9
14 1 • 1 3 1.2
9 1 .o 8 0.9 4 1.0 5 0.9 2 0.7
14 14 5 0.9 4 0.2
SD
o.o o .. o
0.3 0.2 0.1 0.2 0.1
0.4 0. 1
0.2
0.1 0.1 0 .. 2 0.1
14 0.2 0.1
131

Age,
Days
25 27 28 30
32 34 35 36
38 39 40 41 42 44 48 49
TABLE A.1.1.1.2
Male LG/~ Plasma Copper Concentrations by Age
Cu, ppm
0.8, 0.7, 0.7, 0.7 1.3, 1.5 0.9, 0.9, 0.7, 1 • 1 , 0.8, 0.7, 0 •. 9, 0.7, 1 • 4, 1.2 0.9, 1.0, 0.8 0.9, 1.2, 1.3, 1 • 2, 1.5, 1.0 1.0, 1 .1 , 1 .. 0, 1 .J, 1.6, ·t.3 0.8, 1.0 1.0, 1 .. 1 1. 4,. 1 .6, 0.9 1.3 1.3, 1.2, 1 • 0, 1.2 0.7, 0.8, 1.0,, 1.0,. 1.4,·1.6 1 • 1 ' 1 .1
1 .4, 0.9, 1.3, 1 .. 0,
1 .1 ,. 1.3,
1.2, 1 .8,
0.8
1 • 1 1.5,
1 • 1
1 • 6,
n X SD
-n X
4 0.7 2 1.4 7 1 • 0
9 1 • 1 3 0.9 7 1.2 2 1 .3
9 1 .3 2 0 .. 9 2 1 .1 3 1.3 1 1. 3 4 1.2 5 0.9 2 1.5 2 1 • 1
16 16 4 1 • 1 3 0.2
SD
0.1 0.1 0.2
0.3 0.1 0.1 0.4
0.3 0.1 0.1 0.4 o.o 0. 1 0.1 0.1 o.o
16 0.2 0.1
132

Age,
Days
26 27 32 33 34 35 36 38 40 41 44 45 47 49 52
TABLE A.1.1.1.3
Male DBA/2J Plasma Copper Concentrations by Age
Cu, ppm
1.4 1 .2, 1 • 1 0.9, 1 • 0, 1.0 1 • 5, 1.2 0.7 1 • 2' 1.2 1.2, 1 .. 1 , 1 • 0 ,. 1 • 1 ,. 1 • 0 1. 0' 1 .. 1 , 1.3 0.9, 1.2, 0. 9 ,. 1 •. 2, 1.4 0.9 0.9, 1 • 0, 1.1 0.9 0.8, 0.9, 1 • 1 0.9 1.2
n
1 2 3 2 1 2 5 3 5 1 3 1 3 1 1
n 15 X 2 SD 1
-X SD
1. 4 o.o 1. 2 0.1 1 • 0 0. 1 1 • 4 0.2 0.7 o.o 1 • 2 o.o 1 .1 0. 1 1 • 1 0.2 1 .1 0.2 0.9 o.o 1 • 0 0.1 0.9 o.o 0.9 0.2 0.9 0.0 1 .2 o.o
1 5 15 1.1 0.1 0.2 0.1
133

TABLE A.1.1.1.4
Male SJL/J Plasma Copper Concentrations by Age
Age, Cu, ppm
Days
18 1.1 19 1 • 2, 1 .3, 1.3 25 1 • 1 , 1. 2, 1 .J, 1.5, 26 1 • 1 , 1 • 1 , 1.2 29 1.3, 1 • 0, 1.3 30 1.2, 1 • 1 32 1.2, 1.2, 0..-9 , .. 1. 2, 35 0.9, 0.8, 0. 9 ,. 0 .• 9, 36 1.3, 1 .o 37 1 • 1 , 1 • 1 , 1 • 0,. 1. 0 ,. 38 . 1. 4, 1. 0, 1.2, 1.2, 40 1.0, 1.0 41 1.0, 0. 7, 0.9, 1 • 0, 42 0.9, 1 • 1 , 1 • 0, 1 • 1 ,
1.6~ 1. 0 44 0.9, 0.6, 0.9, 1.0 49 1. 5, 1.8 50 1. 2, 2.0 52 1. 5, 1 • 1 , 1. 8, 1.0 53 1.3
1 • 4
1 .1 0 .• 8, 0.6
1.0 0..7, 0.6,
0.9 1 • 6, 1 • 4,
0.8
1.5,
n X
SD
-n X SD
1 1 • 1 o.o 3 1.3 0 .. 1 5 1 • 3 0.2 3 1 • 1 0.1 3 1.2 0.2 2 1 • 2 0.1 5· 1 • 1 0.1 6 0.8 0.1 2 1. 2 0.2 5 1 • 0 0. 1 7 1.0 0.3 2 1. 0 0.0 5 0.9 0.1
9 1.2 0.3 4 0.9 0.2 2 1.7 0.2 2 1.6 0.6 4 1.4 0.4 1 1.3 o.o
19 19 19 4 1.2 0.2 2 0.2 0.1
134

135
TABLE A.1.1.1 .. 5
Male BALB/cJ Plasma Copper Concentrations by Age
Age, Cu, ppm n -X SD
Days
21 1 .3' 1.8, 1 • 0, 1 .3 4 1. 4 0.3 24 1.5, 0.8~ 0.8, 0.8 4 1 .o 0.4 25 1.3, 2.1, 1 • 6, .1.3 4 1 • 6 0.4 28 1. 7, 2.4 2 2.1 0.5 29 1. 4, 1.5 2 1 • 5 0.1 31 1 •. 1 , 0.8 2 1 • 0 0.2 32 1 .. 1 1 1 • 1 o.o 35 1 .6, 1. 4,. 1 .o' 1.2, 1 • 0, 0.8, 0.7 7 1 .1 0.3 37 1.3 1 1.3 o.o 39 0.7, 0.7 2 0.7 o.o 40 1. 4 1 1.4 o.o 41 1. 4 1 1.4 o.o 43 1.8 1 1 • 8 o.o 45 1 • 0 1 1 • 0 0.0
n 14 14 14 X 2 1.3 0.2 SD 2 0.4 0.2
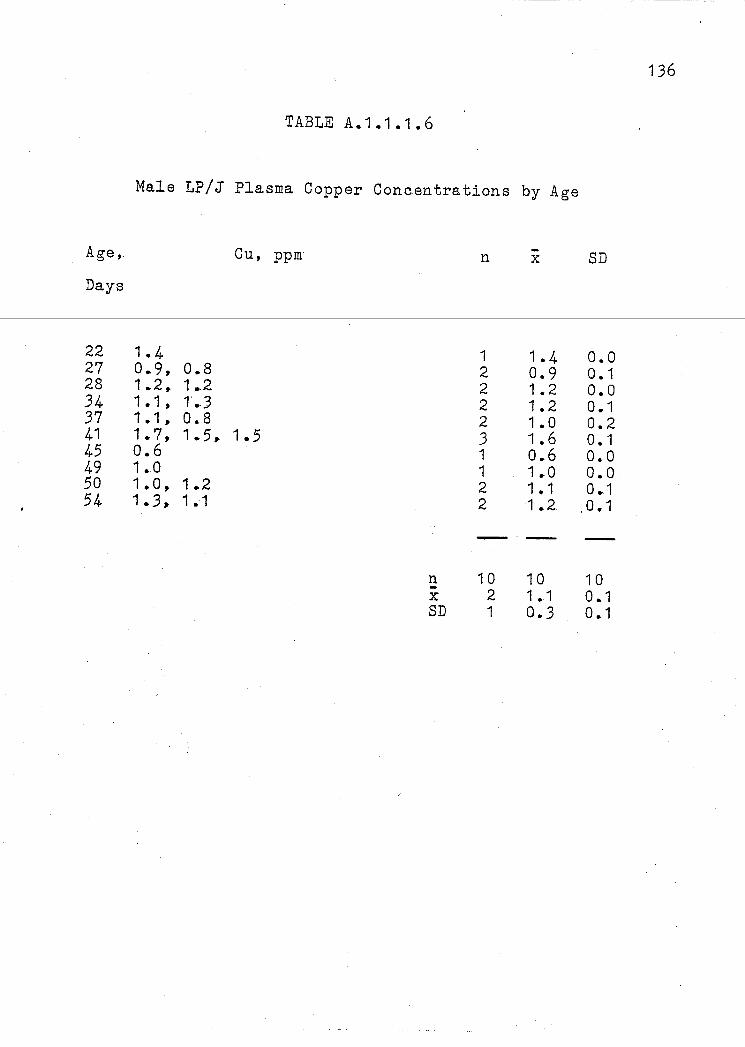
Age,.
Days
22 27 28 34 37 41 45 49 50 54
TABLE A.1.1.1.6
Male LP/J Plasma Copper Concentrat~ons by Age
1. 4 0 .. 9, 1 .. 2, 1 • 1 , 1.1 , 1.7, 0.6 1.0 1.0, 1.3,
0.8 1 .. 2 1'.3 0.8 1. 5 ,.
1.2 1 .1
Cu, ppm
1.5
n X SD
n
1 2 2 2 2 3 1 1 2 2
10 2 1
-X
1.4 0.9 1.2 1. 2 1.0 1.6 0 •. 6 1.0 1.1 1.2
10 1 • 1 0.3
SD
o.o 0.1 o.o 0.1 0.2 0.1 o.o o.o 0.1 0.1
10 0.1 0.1
136

Age,
Days
27 28
29 31 32 33 34 35 37
39 41 43 44 48
TABLE A .. 1.1.2.1
Female C57BL/6J Plasma Copper Concentrations by Age
Cu, ppm
0.8, 0.5, 2.7, 1 • 5 0.6, 0.7, 0.5, 0.6, 0.5, 0.9, 1 • 0,. 1.0, 1.2 0.7, 1.0 0.8 0.8, 0 ... 7, 0.5 0 .. 8, 0.7, 0.8, 0.8, 1. 4, 1. 4,
' 1 •. 3, 1.2 1.1 1 .1 ,. 1 .. 3, 1 .3, 1 .1 , 1 .3, 1 .1 , 1 .. 5' 0.6,. 1.0, 1.1 1 • 5, 0.8,. 1.0 1. 5, 0.9, 0~9 1 • 0, 1.6 0.8, 0.8 1 • 0, 0.9
1 • 1 ,.
1.3
1.3,
n X
SD
-n X SD
4 1 • 4 1 • 0
10 0.8 0.3 2 0.9 0.2 1 0.8 o.o 3 0 .. 7. 0.2 7 1 • 0 0.3 2 1. 3 0. 1 1 1 • 1 o.o
1 1 1 • 2 0.2 3 1 • 1 0.4 3 1 • 1 0.3 2 1 • 3 0.4 2 0.8 o.o 2 1 • 0 0.1
14 14 14 4 1.0 0.3 3 0.2 0.3
137

Age,
Days
27 28
32 34 36 38 40 41 42 44 48 61 64
TABLE A.1.1.2.2
Female LG/J Plasma Copper Concentrations by Age
1.5 0.9, 1 • 3, 1 .. 2, 1 .. 4 0.7, 0 .. 8 1. 5, 1.5, 1 • 1 , 1. 4, 0.9, 0.9 1 .. 0, 0.6, 1.6 1. 7, 1.0 0.8, 1.0, 1.6 1.7 1.2
Cu, ppm
1.2, 1.5,
1 • 1 , 1. 4 1.2, 1.2,
1.3
1.3, 0.8
1.2, 1 • 1 ,.
1 .1, 1.2
1.0,.
n X
SD
n
1
9 2 4 6 2 3 1 2 4 1 1 1
13 3 2
-X
1 • 5
1. 2 0.8 1.4 1. 2 0.9 1 • 0 1. 6 1.4 1 • 0 1 • 6 1. 7 1 • 2
13 1 • 3 0.3
SD
o.o 0.2 0.1 0.2 0.1 o.o 0.4 o.o 0.5 0.2 o.o o.o o.o
13 0.1 0.2
138

Age,
Days
27 32 34 35 36 38 40 41 45 49 50 52 54
TABLE. A •. 1.1.2. 3
Female DBA/2J Plasma Copper Concentrations by Age
Cu, ppm.
1 • 1 , 1.2,. 1 .. 2 1 • 2, 0.9, 1 • 1 0 ... 8, 0.8 1.2, 1.1 " 1 • 0, 1.5 1 • 0, 1 ... 2 1 .. 1, 1 .4, 1 .. 2 1.3, 1.3, 0.9, 0 ... 9, 1 •. 3, 1.0 1 .. 2, 1 •. 1 0.8, 0.7, 0 .. 6. 1 .. o" 1 .1 1 .. 1 ; 1 •. 6, 1 .. 7 1 • 1 , 1.2,. 1.0 1 •. 2
n
3 3 2 4 2 3 6 2 3 2 3 3 1
n 13 X 3 SD 1
-X SD
1. 2 0. 1 1 • 1 0.2 0.8 o.o 1. 2 0.2 1 • 1 0.1 1 • 2 0.2 1 • 1 0.2 1. 2 0. 1 0.7 0.1 1 • 1 0. 1 1 •. 5 0.3 1 • 1 0.1 1.2 o.o
13 13 1.1 0.1 0.2 0.1
139

Age,.
Days
18 19 23 25 26 29 30 32 35
36 37 38
39 40 41 42 44
45 49 50 52 53
TABLE A.1.1.2.4
Female SJL/J Plasma Copper Concentrations by Age
Cu, ppm
1.1,. 0.8, o.. 8 ,, 1 • 1, 0.9 1.2 1.1,. 1 •. 0 ,. Q a8 J• 1 .o 1.2 1.7 1 .. 0,. 1 .. 4,. 1.2 1.2, 1 .. 3 1 •. 3 ,. 1.2, 1.3, 1.2 1 .. 0,. 1 .. o, 1 .. 0, 1.2, 1.2, 0.8,. 0 ... 8,. 0 .. 8 1.2, 1 .0 1 • 1 ' 1 .o' 1 • 1 , 0.-9 ,. 1 • 1 , 1.3,. 1.3, 0.7, 0.6, 0 •. 6, 0.6 1.7, 1.3 0.9, 0.9, 0.9, 1.1 ,. 1.6 0.9, 0.8, 1 .o, 0.8, 0.9 1 • 1 ,. 1.2, 1.2,. 1 • 5,. 2.0, 0.7, 0.7, 0.8, 0.9, 0.9, 1 • 6, 1.6 1.2 1 • 1 , 1 • 1 , 1 • 3, 0.9, 1 • 0 1 • 1 , 1.9 1.0 0.9, 2.4, 2.2, 1.3
0.7,
0.9 0.8,
1 • 3 0.8,
0.7,
0.7,
1 • 9,
n X SD
n
5 1 4 1 1 3 2 4
10 2 6
8 2 5 5 6
9 1 5 2 1 4
22 4 3
-X
0.9 1.2 1.0 1.2 1 •. 7 1 .. 2 1 .3 1 .. 3
0.9 1 • 1 1 • 0
0.8 1 • 5 1 • 1 0.9 1. 4
1 • 1 1.2 1 .. 1 1 • 5 1.0 1 • 7
22 1.2 0.3
SD
0.2 o.o 0.1 o.o o.o 0.2 0.1 0. 1
0.2 0.1 0.1
0.3 0.3 0.3 0.1 0 .. 3
0.5 o.o 0.1 0.6 o.o 0.7
22 0.2 0.2
140

Age,
Days
21 25 28 29 30 31 32 35 37 40 41 42 43 45 51 54
TABLE A.1.1.2.5
Female BALB/cJ Plasma Copper Concentrations by Age
1 • 5 t 1 .. 3 1 .. 5, 1. 5, 1. 9, 1.7, 1 .. 6 ,. 2., 1 t 1.0, 1 .. 2 1.0, 1.0 1. 7, 1 .. 8, 1 .. o, 1 .3, 1 .. 6 1 .o, 2 .. 0, 1.8 1. 0, 0.9, 2 •. 1 1 .o, 1.0, 0 .. 9' 0 .. 8, 1.0
Cu, ppm
1.4,. 1 .3 t .J ,. 1.6, 1 •. 5 1 .3
1 •. 4,. 1 • 0, 1.0 1 .. 0 ,. 0.8, 0.8
2.1
1 •. o., 1.0, 0.9
1.1 1 •. 4
n X
SD
-n X SD
2 1.4 0.1 4 1.4 0. 1 5 1. 6 0.2 3 1.7 0.4 2 1 .1 0. 1 2 1 .a o.o 5 1. 4 0.4 5 1 • 0 0.2 1 1.6 o.o 3 1.7 0.6 1 1 • 8 o.o 5 1 .o 0. 1 1 2.1 o.o 3 1.0 0. 1 3 1.0 0.3 1 1.0 0.0
16 16 16 3 1.4 0.2 2 0 .. 4 0.2
141

Age~
Days
22 26 32 34 36 37 41 43 44 50 54
TABLE A.1.1.2.6
Female LP/J Plasma Copper Concentrations by Age
1.0 1 .. 4 0.8 1 .. 2, 1 .1 1 .. 2 1.8, 1.2, 1 .. 6 1 .0, 1.3 1 .. 1 , 1 .1 1.0 0.9
Cu, ppm
0.8, 0.8
n X
SD
n
1 1 1 2 1 4 1 2 2 1 1
1 1 2 1
-X SD
1 • 0 o.o 1.4 o.o 0.8 o.o 1.2 0.1 1.2 o.o 1.2 0.5 1.6 o.o 1.2 0.2 1 • 1 o.o 1 .o o.o 0:9 o.o
11 11 1.1 0.1 0.2 0.2
142

143
A.1.2 Tables of Plasma. Zinc Concentrations by Age
TABLE A.1.2.1.1
Male C57BL/6J Plasma Zinc Concentrations by Age
----A-f.fe-y------,Zn--,------J:3pm---------n--i--s-JJ-------
Days
23 0 .. 7~ 1. 0 26 1.0, 1 • 0, 1.2 27 1. 4 28 1. 4, 1 • 1 , 0.9 ,. 0.8, 29 1 .4, 1 • 0 31 1.0, 1.1 ,. 1.0,. 1.6, 32 0 .• 8, 1.3, 1 .3 ,. 1.0 34 1.2,. 1 .1 , 1 • 0, 1 .o,
1.2, 1 .3 35 2.0, 1 • 1 , 2.0 37 1.3, 1 .3, 1 •. 1 , 1 • 2,
1 • 7, 1 • 8, 1 • 0, 1.7, 39 0.9, 1.0, 1.2, 1 • 1 '
1.5, 0.8, 1.0 41 1.8,. 1.4, 1.4, 1.6,
1.3, 1.5 43 1.6, 1. 4, 1 • 5, 2.0, 44 2.0, 1. 6' 1. 6, 1.3,
1 • 1 , 1 •. 4
1.3
1 .1 , 1. 4,
1. 5, 1 • 1 , 0.7, 0.9, 1 • 3, 1 • 2'
1 • 4, 1 • 8,
1.6 1.2
2 3 1 6 2 5 4
1.3, 9 3
1 • 5, 1. 4 14 1.3,
1 • 8,
n X SD
10
9 5 5
14 6 4
0.9 1 • 1 1.4 1 • 1 1 .2 1.2 1.1
1.2 1 • 7
1 • 3
1 .1
1 .6 1.6 1.5
14 1.3 0.2
0.2 0.1 o.o 0.2 0.3 0.3 0.2
0.1 0.5
0.3
0.2
0.2 0.2 0.3
14 0.2 0.1

Age,
Days
23 25 27 28 30 32 34
35 36
38 39 40 42 44 48 49
TABLE A.1.2.1.2
Male LG/ .T Plasma Zinc Con.centra tions by Age
Zn, ppm
1. 6,. 1.2, 0.9 2.2, 2. 0 ,. 1.9,. 2.3 1. 4, 1.6 1 • 5, 1.3, 1. 9,. 1 • 1 1. 8, 1.8, 2.0, 1 • 6, 1 • 3 ,. 1.2, 2.1, 1 .. 2, 1.6 2.0, 2.7, 1.6
2 ... 4,- 2 •. 4., 1 • 9, 1. 5,
2.4~ 2 .. 0,. 1.5 1 • 9, 2.3, 2.4, 1.4
1.5, 1 • 6, 1 • 6'
2.0,. 1. 7 2 .. 5, 2.2 0.7, 1. 4, 0.8 2.4,. 1 • 8' 1 • 5,. 1 • 1 2.2, 2.2, 1. 6, 2. 0 ,. 2.0, 1.5 2.0 1. 8, 3.6
0.6
1 • 4,
1 • 2,
n X SD
-n X SD
3 1.2 0.4 4 2.1 0.2 2 1 • 5 0.1 4 1 • 5 0.3 7 1 • 5 0.5 3 1 • 6 0.5
8 2.0 0.5 3 2.0 0.5
8 1. 7 0.4 2 1.9 0.2 2 2.4 0.2 3 1 • 0 0.4 4 1. 7 0.5 6 1 • 9 0.3 1 2.0 o.o 2 2.7 1 •. 3
16 16 16 4 1.8 0.4 2 0.4 0.3
144

Age,
Days
24 26 27 32 35 36 38 40
41 44 47 49 52
TABLE A.1.2.1.3
MalE DBA/2J Plasma Zinc. Concentrations by Age
Zn, ppm
1.3, 1.6 1. 4 1.1 ' 1 .4, 1. 0. 1.0 0 .. 9, 1.3, 1.3 1 • 9, 2.0, 1. 4, 1 •. 4,.. 1 • 7 0.5, 1 • 0, 1 .2. 1.3, 1 • 3, 1 • 6' -1 .J ,. 1 • 6, 1 • 3, 2.3, 2.0, 1.8 1 ., l" 1 .. 6,. 1.3 1.7, 1 • 9,. 1 .. 4, 1.4 1 .. 9 1.6
1.9,
n -X SD
-n X SD
2 1 • 5 0.2 1 1.4 o.o 3 1 • 2 0.2 1 1 • 0 o.o 3 1. 2 0.2 5 1. 7 0.3 3 0.9 0.4
10 1. 6 0.4 1 1 • 1 o.o 2 1.5 0.2 4 1. 6 0.2 1 1.9 o.o 1 1 .. 6 o.o
13 13 13 3 1.4 0.2 3 0.3 0.2
145

146
TABLE A.1.2.1.4
Male SJL/J Plasma Zinc Concentrations by Age
Age, -X SD Zn, ppm n
Days
18 1.7 1 1.7 o.o 19 1.4, 1 •. 1 2 1.3 0.2 23 1.4 1 1.4 o.o 25 1.4,. 1.3 2 1.4 0.1 26 1.2, 2.2 2 1.7 0.7 29 1.6, 1 • 1 2 1.4 0.4 30 1.9,.· 1.J,.· 1.,5 ,. 1 ... 1 ' 0.9 5 1.3 0.4 31 1 .3, 1 •. 3, 1 .6,. 1 .6 . 4 1.5 0.2 32 1.6,. 1.8 2 1.7 0.1 35 1. 4. 1.3,. 1.4 3 1.4 0.1 36 1.1', 1.4 2 1.3 0.2 37 1.6, 1 .. 5, 1 •. 4 3 1 .5 0.1 38 1.8, 1. 9' 1.6,. 1 .-5 4 1.7 0.2 40 1.8, 1.2 2 1 • 5 0.4 41 2.0, 1.8,. 1.6, 1.5,. 1.6, 1.4 6 1.7 0.2 42 0.9, 1.7, 1 •. 4,. 2 .. 0, 1.2 5 1.4 0.4 44 1.7, 2.1, 1.6 3 1.8 0.3 45 1.9 1 1.9 o.o 49 1.2,. 2.1, 1.5,. 1.6 4 1.6 0.4 50 1.5, 1.7 2 1.,6 0.1 52 1. 8,.. 1.1 , 1.9, 2.1,. 1 • 9, 1.6 6 1.7 0.4 53 1.7, 2.3 2 2.0 0.4
n 22 22 22 x 3 1.6 0.2 SD 2 0.2 0.2

147
TABLE A.1.2.1.5
Male BALB/cJ Plasma Zinc Concentrations by Age
Age, Zn, ppm n -X SD
Days
21 0.6, 0.9 2 0.8 0.2 24 2.0, 1.4 2 1.7 0.4 25 1.2, 1 • 1 ' 1.1 3 1 • 1 0. 1 28 1.0, 1.3 2 1.2 0.2 29 1 .o' 1.4 2 1 •. 2 0.2 30 1.6 1 1.6 o.o 32 1.5 1 1 • 5 o.o 33 1.8, 1 •. 6. 2 1 • 7' 0.1 35 1.2, 1 • 1'' 0 •. 9, 1.2 4 1 •. 1 0. 1 37 1 .3', 1.7 2 1.5 0.3 41 0.7, 1.2 2 1 .o 0.4 45 1.5, 1.2 2 1.4 0.2
n 12 12 12 X 2 1.3 0.2 SD 1 0. 3 0.1

--------------------
TABLE A.1.2.1.6
Male LP/J Plasma Zinc Concentrations by Age
Age,
Days
22 0.4 27 1 .2,.. 28 1 .. 5 32 1.2 34 1 .1 37 1 •. 2, 39 1 .. 7 41 1.4,. 42 1.2 43 1 .. 9, 49 1 .. 3 .. 50 2.0
1 .. 3
1.4,.
1.3
1 .4,.
Zn, ppm·
1 •. 1
1.3
n X
SD
n
1 2 1 1 1 3 1 2 1 3 1 1
12 2 1
-X SD
0.4 o.o 1.3 0.1 1 • 5 0.0 1.2 o.o 1.1 o.o 1.2 0.2 1 •. 7 0.0 1.4 0.1 1.:? o.o 1.5 0.3 1.3 o.o 2.0 o.o
12 12 1.3 0.1 0.4 0.1
148

Age,
Days
23 28
29 31 32 33 34 35 37
39 41 43 44
~-~ ~------
TABLE A.1.2.2.1
Female C57BL/6J Plasma Zinc Concentrations by Age
Zn, ppm
0.9, 1 .. o, 1.4 1.3, 1 .2 , .. 1 •. 4,. 1 •. 3, 1 .3' 1.3 1 ~-4 1 .. 4, 1.5,. 1 • 1 1 • o·, 1.2, 1 .• 2 1 .4-, 1.7,. 0.9 1 • .3, 1. 5· 1.2,. 1.6 1 •. 4, 1. 5' 1. 8 ,. 1. 7, 1.6, 1. 4, 1.5, 1 .3, 1 •. 2,. 1.3, 1 • .5' 0 •. 9 1 • 2, 1 • 1 , 1.3 1. 4, 1. 4, o. 9· 1.3, 1 .1 2 •. 0' 1. 7, 1.6
1 • 6'
1.8, 1 • 9,
1 •. 3 ,.
1.4, 1.7,
n X
SD
-n X
3 1 • 1
8 1 .3 1 1.4 3 1. 3 3 1 • 1 3 1 • 3 2 1.4 2 1.4
16 1.5 3 1.2 3 1.2 2 1.2 3 1.8
13 13 4 1.3 4 0.2
SD
0.3
0. 1 o.o 0.2 0.1 0.4 0.1 0.3
0.3 0.1 0 .. 3 0.1 0.2
13 0.2 0.1
149

--~ ~~---~ ~-~-~-
150
TABLE A. 1 • 2 •. 2. 2
Female LG/J Plasma Zinc Concentrations by Age
Age, Zn, ppm n -X SD
Days
23 1.6, 1.5 2 1.6 0.1 27 1. 4 1 1. 4 o.o 28 1.2,. 1 .5, 1 •. 4, 1.3 4 1. 4 0 •. 1 30 1.2. 1 1.2 o.o 32 1. 4, 1'.5, 1 .. 2 3 1.4 0.2 34 0.9, 0.8, 1. 8 3 1.2 0.6 36 1. 4, 1 .o, 1 .2,.. 1 .. 2, 1.5 5 1.3 0.2 38 1. 8 , .. 1 .. 8 2 1.8 o.o 39 2.0· 1 2.0 o.o 40 1 •. 7, 1.7, 1.9 3 1.8 0.1 42 2. 0 ,. 1 .4, 1 .. 1 3 1 .. 5 0.5 44 1.8, '1.8,. 1.9,. 1.3 4 1.7 0.3 49 1.4 1 1.4 o.o 60 1 .. 9 1 1.9 o.o 61 2.1, 1.8, 2.2 3 2.0 0.2
n 15 15 15 X 3 1.6 0.2 SD 1 0~3 0.2

151
TABLE A.1.2.2.3
Female DBA/2J Plasma Zinc Concentrations by Age
Age, Zn, ppm -X SD n
Days
24 1.3, 1.3 2 1.3 o.o 27 1.0, 1 .1, 1 ... 1. 3 1 .1 0.1 32 1 .. 4 1 1.4 o.o 35 1. 0 ,. 1.2·, 1 •. o 3 1 • 1 0.1 36 1. T, 1.2 2 1.5 0.4 38 1.3 1 1 .3 o.o 40 1.0, 1 .. 2, 1 .,4,. 1 .. 1.,. 1.3, 1..6, 1 •. 6 7' 1 .3 0.2 41 1 • 1 ,. 1 •. 1', 1.5 3 1.2 0.2 . 48 1.9·, 1.5 2 1.7 0.3 49 1 .3 ,· 1 .;5,. 1.7 3 1 .. 5 0.2 50 1 .. 6 1 1.6 o.o 52 1 .7, 1.6,. 1 .8. 3 1.7 0.1 54 1 .. 5' 2.2 2 1. 9 0.5
n 13 13 13 X 3 1.4 0.2 SD 2 0.2 0.2

152
TABLE A.1.2.2.4
Fema·le SJL/ J Plasma. Zinc Concentrations by Age
Age~ Zn,. ppm n -X SD
Days
18 1.3,. 1 .3,.. 1..2.,. t. 4, 1.4 5 1.3 0.1 23 1.1 ' 1 .. 1 , 1."'0,. 1. 4. 4 1. 2 0.2 25 1.9 1 1 • 9 o.o 26 1.3 1 1. 3 o.o 29 1.0, 1 .. 4 2 1. 2 0.3 .30 1.5, 2.2, 1. 0.,. 1.0,. 1 • 1 5 1. 4 0.5 .31 1.2, 1. 5 ,. 1. •.. 6., 1 .. 4, .. 1 .4, 1. 4 6 1. 4 0.1 .35 2.0,. 1.4, 1. 4, 1.7, 1 •. 8, .1 .. 6.,. 2.2 7 1.7 0 • .3 c
-
36 1 • 0,. 1'.4 2 1 .2 0.3 ~
.37 1.8, 1.2, t .. J, 1.2 4 1 .. 4 0.3 i E 38 1.5, 1.6, 1 .J, 1. •. 1., 1.2, 1 •. 1 6 1 • .3 .0.2 E
39 1.9, 1'.9, 1. 7,. 1 .-4 4 1.7 0.2 i 40 1. 7', 2.o·, 1~6, 1.8 4 1 .8 0.2 41 1.6,. 1.2,. 1.7, 1.9, 1. 6 . 5 1.6 0 • .3 42 1 • 6, 1.0, 1.2,. 1.7, 0.4 5 1. 2 0.5 44 1.6,. 2.0, 1.5, 1. 7, 1 • 9, 0.8, 2.0 7 1.6 0.4 45 1. 5, 1 • 9, 2.0, 2.1 4 1. 9 0 • .3 49 1.7, 1.7, 1.5, 1.7, 1.8 5 1 .. 7 0.1 50 1.8,. 1.7 2 1 • 8 0.1 52 2.2 1 2.2 o .. o =
~
53 1.9, 1.3, 1.5, 1.6 4 1 • 6 0 • .3
I 21 21 21 -n _ ..
-X 4 1.5 0.2 =
SD 2 0.3 0.1 -
~
i .. ~ .,.
----

Age,
Days
21 25 28 29 30 32 35 41 42 43
. 45 51 54
TABLE A .. 1.2.2.5
Female BALB/c~ Plasma Zinc Concentrations by Age
Zn, ppm
1.2,. 0.9 0 .. 8 ,. 1 .. 4,. 1 .. 1 1 • .5, 1.4,. 1.8 ,. 1. .. 9 1 .. 1 , 1.6 0. 9',. 0.7 1 .. 3,. 1 .4,. 1 .2,.. 1 .3 2 .. 1, 0.7, 1 •. 0., .1 .4,. 1.7. 0.6, 1 .1 1 .3,. 1 .. J, 1.4,. 1 .4, 1 .4, .1 •. 4 . 1 .. 1 ,. 1.2 1 .1,. ·1~4,. 1.2,. 1.3 1 • .5', 1 .. 3,.·1.6,. 1.8, 1.4 1 •. 4,. l. 6',. ' 1 • .5, 1.2
n X SD
-n X SD
2 1.1 0.2 3. 1.1 0.3 4 1.7 0.2 2 1.4 0.4 2 0.8 0.1 4 1.3 0.1 5 1 .. 4 0.6 2 0.9 0.4 6 1 •. 4 0.1 2 1.2 0 •. 1 4 1.3 . 0 •. 1 5 1.5 0.2 4 1.4 0.2
13 13 13 4 1.3 0.2 1 0.2 0.2
153

Age,.
Days
22 26 32 34 37 39 41 42
. 43 50 54
TABLE A.1.2.2.6
Female LP/.J Plas.ma .Zinc. Concentrations by Age
1.0 1.5 1.8 1.7 1.0, 1. 5' 1. 7'
, 2.3 1.0, 1.5 2.0
Zn, ppm
1 .. 0,..0.7, 1 .2
l.l·,, 1 • 0, 1 .4 .
n X
SD
-n X SD
1 1 • 0 o.o 1 1.5 o.o 1 1.8 o.o 1 1.7 o.o 4 1.0 0.2 1 1.5 o.o 1 1.7 o.o 1 2.3 o.o 4 1 .1 0.2 1 1.5 o.o 1 2.0 0 •. 0
11 11 11 2 1.6 o.o 1 0.4 0.1
154

A.1.3
155
Figures of Plasma Copper Concentrations versus Age
FIGURE A.1.3 .. 1.1
Hale Pla.sma Co.ppe.r Concentrations
versus Age for.C57BL/6J Mice

0 0 • • •
mdd '.reddoo
l('\
0
156

FIGURE A.1 •. 3.1.2
Male Plasma Copper Concentrations
versus Age for LG/J Mice
157

0
C\l •
0
f-0-1
0 • ~
urdd '.Ieddoo •
0
158
... Q)
b.O ~
I

FIGURE A.1.3.1.3
Male Plasma Copper Concentrations
versus Age for DBA/2J Mice
159
I

0 0 •
C\l
mdd '.reddoo
• 0
160
Q)
b.O -=x:
FIGURE A.1 •. 3.1.4
Male Plasma Copper Concentrations
versus Age for SJL/J Mice
161
I
i
I

162
~ I:'----r
t-0---1 l'Jl :>..
0' tO ("('\ ~
.. Q)
~ <t;
~
("('\
("('\ I
C\l
"
" .. ~
~
0 1.('\ 0 1.('\ -
• • --C\l ,..- ,..- 0
rudd '..reddoo

FIGURE A.1.3.1.5
Male Plasma Copper Concentrations
versus Age for BALB/cJ Mice
163

164
1:'--...:t"
0 0
8 rn ~
0 ()'. cd ('!"\ A
.. Q)
bD <t!
~ .,-('!"\
0
('!"\
C\l
" ~ .,
~
F,
0 1.("\ 0 1.("\
• • • • C\l .,- .,- -
0 -
mdd '.reddoo

-- ----~----------
FIGURE A.1.3.1.6
Male Plasma Copper Concentrations
versus Age for LP/J Mice
165

166
z:-.. --r
0
~ CJl ">., r;tl
0' q en.
Q)
tlD ..:X:
0
0 0 • • • • C\l .,....
mdd '.:reddoo 0
FIGURE A.1.3.2~1
Female Plasma Copper Concentrations
versus Age for G57BL/6J Mice
167
I
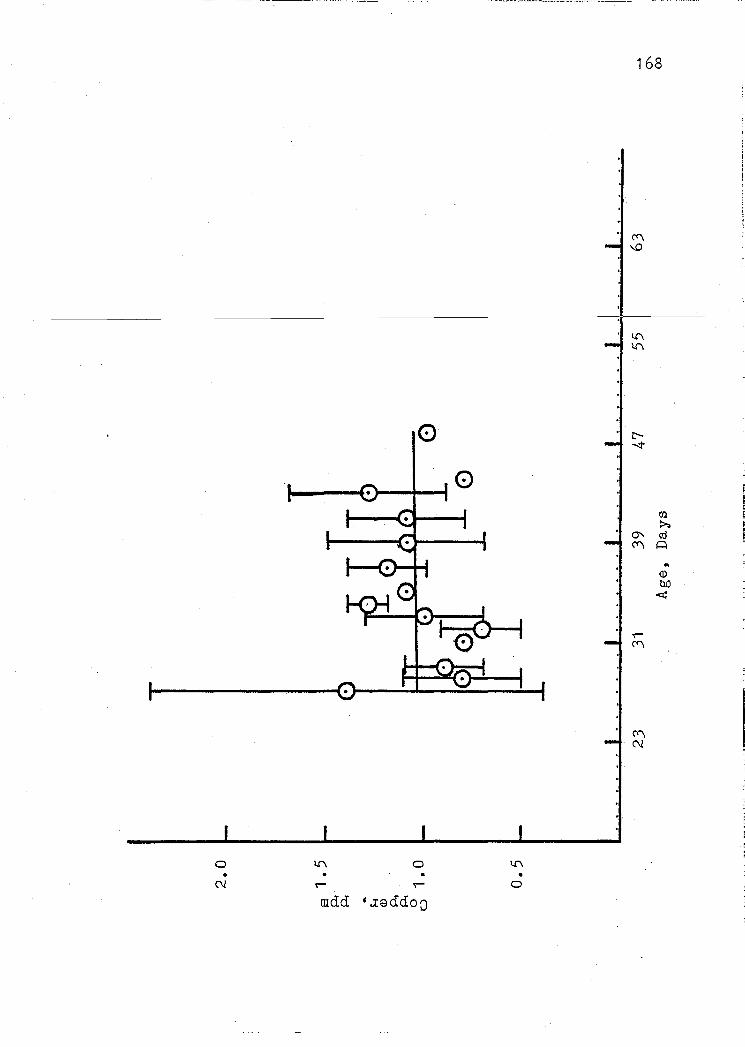
0 •
0
mdd '.reddoo
1.(\
0
168
1.(\ 1.(\
a-.
""
.,.....
""
"" N
fJl ::>.. ro q
.. (I)
llO c:x:
I
FIGURE A.1.3.2.2
Female Plasma Copper Concentrations
versus Age for LG/J Mice
169
I

0
0
0
1--0--1 0
0
K>-1
0 0 • • •
0
mdd '.reddoo
170
r:-....;;t
0'
"'
or-
"'
. "' N
Ul :>.. ro
r=l
.. (])
M c:t:
! I ~

FIGURE A.1.3.2.3
Female Plasma Copper Concentrations
versus Age for DBA/2J Mice
171

0
C\l
KH
0
0 •
mdd '.reddoo
l.l\
0
172
l:'---.:/"
~ a ~
rJl !!: :>., i ttl
"' ~ ("<", .. Q)
tuJ <t:;
~
("<", ---
I
I -
("<", c-
C\l

FIGURE A.1.3.2.4
Female Plasma Copper Concentrations
versus Age for SJL/J Mice
173
I

~-~~- -~- --- -----------
0
C\1
0 0
0
0 •
mdd '.reddoo
l('\
0
174
l('\ l('\
I

FIGURE A.1.3.2.5
Female Plasma CoppBr Concentrations
versus Age for BALB/cJ Mice
175
I
I

0
C\!
tndd
0 •
'J:eddoo
1.(\
0
176
-F L
I

---··-------------
FIGURE A.1.3.2.6
Female Plasma Copper Concentrations
versus Age for LP/J Mice
·---·-·-----~-~
177

--------------------
178
0
0
0 tl.l ~
0' cO ('<\ ~
" Q)
b..O c::t;
0 .,.-('<\
0 I ('<\
0 C\1 : -
-·
e
5: " --"
0 l..(\ 0 l..(\
C\1 .,.- .,.- 0 --
mdd '.:reddoo
A.1.4
179
Figures of Plasma Zinc Concentrations versus Age
FIGURE A.1.4.1.1
Male Plasma Zinc Concentrations
versus Age for C57BL/6J Mice

2.0
1 • 5
s p,
p, 1.0 ...
0 j.:j
•rl N
0.5
23
'II 1.11 ,!11Tl:J,IIIIIIlJ:IIIIliL11Td.l:ll dl.l.lllil-111--liddd.i.l
31 39 Age, Days
47 55
~,I.
63
I,
---l.
00 0
~----~- --~-"'---=-~-=-;
;
1 81
FIGURE A.1.4.1.2
----------------------------------------------------------
Male Plasma Zinc Concentrations
versus Age for LG/J Mice
I
I

-~-- -- ----------
1--0-1·
~
0
C\1
0
0
0
182
l(\ l(\
1:"--..;t
0" C""\
or-C""\
C""\ C\1
Ul :>. cd
r:::l
Q)
b.O <t;
~ i 5 E ~ t~
I

183
FIGURE A.1.4.1.3
Male Plasma Zinc Concentrations
versua Age for DBA/2J Mice
I
I

0
N
0 1.!"\
0
184
I

185
FIGURE A.1.4.1.4
Male Plasma Zinc Concentrations
versus Age for SJL/J Mice .. _)~~--~ ·-- -·
I
I

0
C\l
0 I.(\
0
186
IJl :>.
()'\ m \<\ A
.. <!)
b.O <11
~
\<\

-- -- - - - - -- - - ---
187
FIGURE A.1.4.1.5
Male Plasma Zinc Concentrations
versus Age for BALB/cJ Mice

1-0-1 0 0
0 •
C\l
1-0-1
0
mdd ' 0 u-c . z
l.C\
0
188
r:----:1"
~ i !
Ul >:,
5
0' I cO ('('\ ~
.. (])
t\.0 <11
..---('('\

----------···-
FIGURE A.1.4.1.6
Male Plasma Zinc Concentrations
versus Age for LP/J Mice
189

0
0
C\1
0
0
0
0 • •
0
190
1:'-~
! I
rJl § I ~
i tO 0' ~ <""'\ ..
Q)
b.O <
.,.... <""'\

191
/
FIGURE A.1.4.2.1
Female Plasma Zinc Concentrations
versus Age for C57BL/6J Mice
i
I
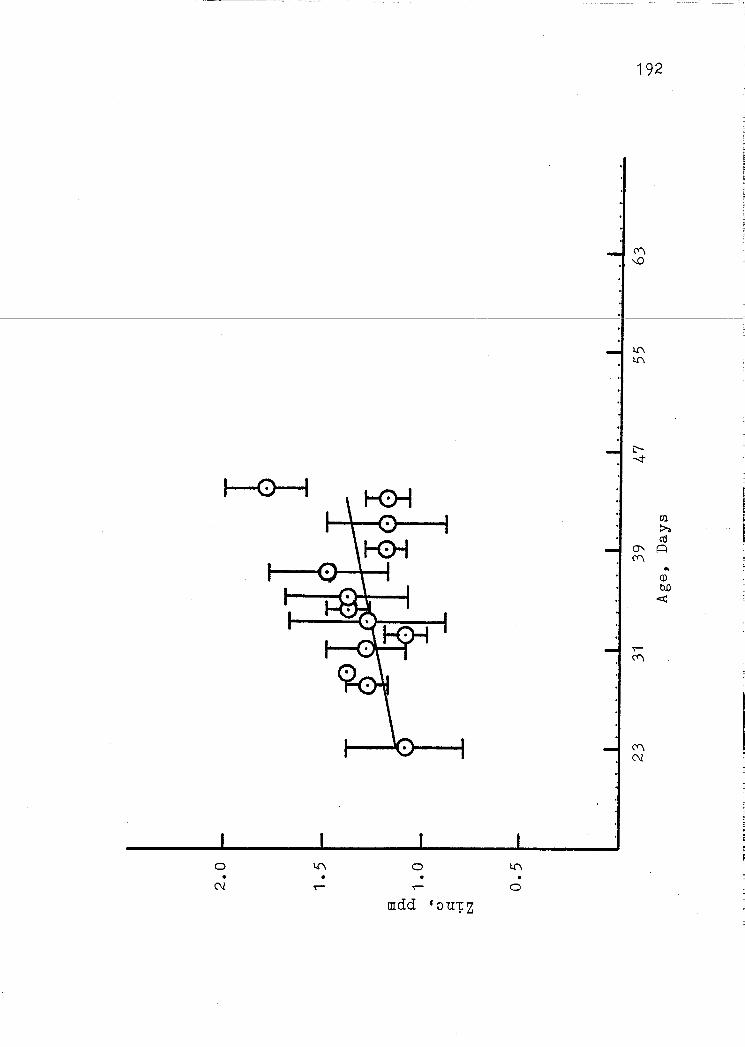
0 0 • • •
0
192
("(\
C\l
(1)
b.O <l!

~~ ------------------- -------- --~-
FIGURE A.1.4.2.2
Female Plasma Zinc Concentrations
versus. Age for LG/J Hice
193

194
..
0 0 • •
N 0
mdd 1 :)U1Z

FIGURE A.1.4.2.3
Female Plasma Zinc Concentrations
versus Age for DBA/2J Mice
195

0
C\l •
----~---
~
0 •
0
mdd 'OU1=Z
196
til :>. cO
0' ~ <"'\
(])
b..O <
..-<"'\

FIGURE A.1.4.2.4
Female Plasma Zinc Concentrations
versus Age for SJL/J Mice
197

0 • •
N
0 \.('\
0
198
\.('\
\.('\

FIGURE A.1.4.2.5
Female Plasma Zinc Concentrations
versus Age fo~ BALB/cJ Mice
199

200
0 til :>. (lj
a- ~ ('(\ ..
(].)
uo <
0 0 • • •
C\l 0

FIGURE A.1.4.2.6
Female Plasma Zinc Concentrations
versus Age for LP/J Mice
----- -~---·--···
201

0
0
0
C\l
0
0 0
0
~
~
0
0 •
mdd '~u~z
202
CJl ::>. cU
0" ~
"' Q)
b.O <!:!
.,..-
"'
0


