Embed Size (px)
Citation preview
Flow Cytometry:
Essential Instrument and Experimental Design Considerations
Sponsored by: Presented by:

Speakers
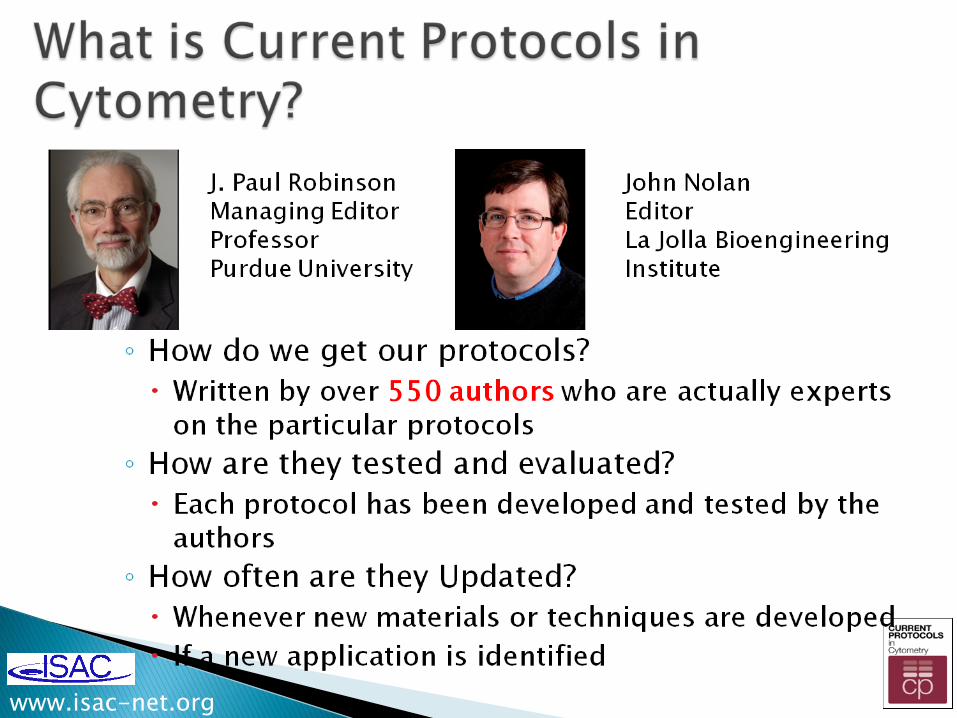
Dr. J. Paul Robinson Purdue University
Dr. John Nolan La Jolla Bioengineering Institute
www.isac-net.org

www.isac-net.org
www.isac-net.org
www.isac-net.org
www.isac-net.org
www.isac-net.org
www.isac-net.org
www.isac-net.org
www.isac-net.org
www.isac-net.org
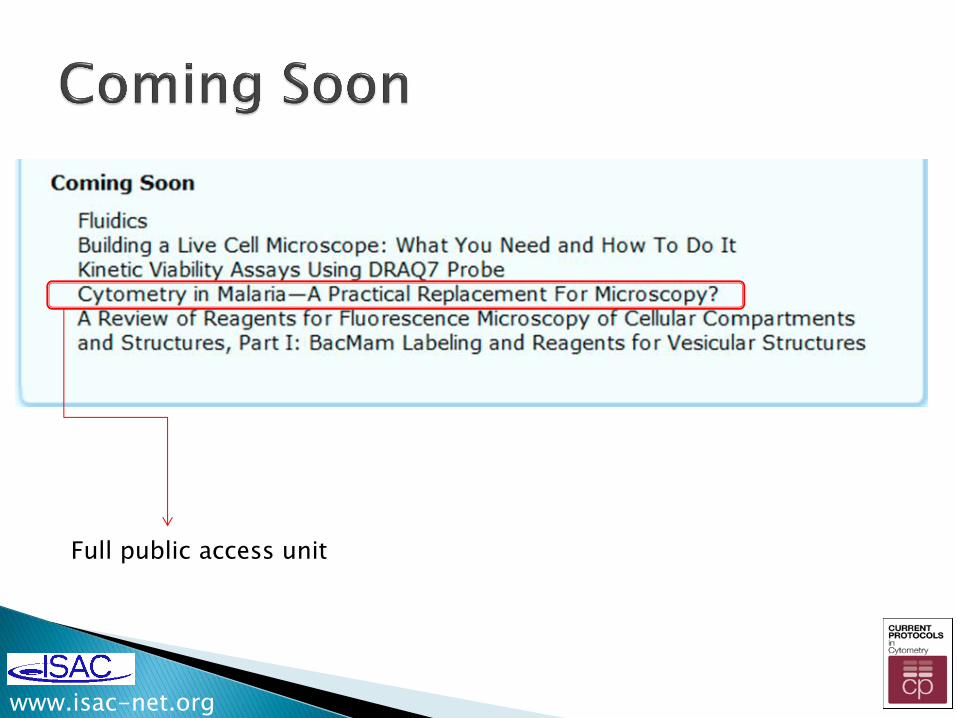
Full public access unit
www.isac-net.org
www.isac-net.org

www.isac-net.org
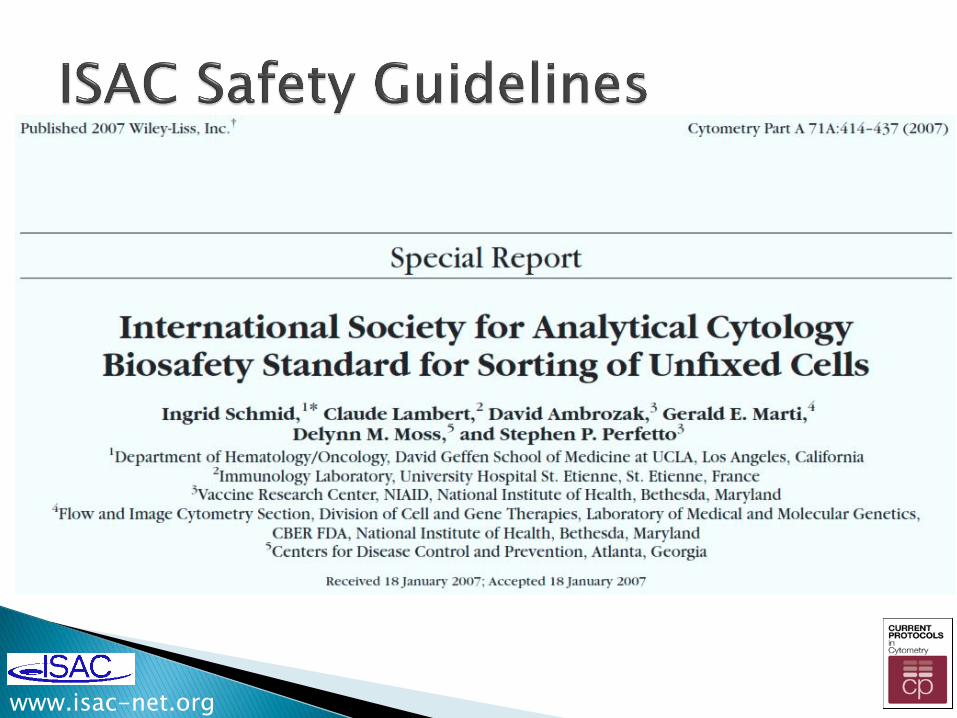
http://isac-net.org/Resources-for-Cytometrists/Data-Standards/Biosafety.aspx
www.isac-net.org
www.isac-net.org
www.isac-net.org
www.isac-net.org
www.isac-net.org
www.isac-net.org
UNIT 6.2 Multiparameter Analysis of Intracellular Phosphoepitopes in Immunophenotyped Cell Populations by Flow Cytometry
Omar D. Perez1, Dennis Mitchell1, Roberto Campos2, Guo-Jian Gao2, Li Li2,Garry P. Nolan1
Published Online: 1 MAY 2005
www.isac-net.org
This unit presents several protocols for measuring intracellular phosphoepitopes by flow cytometry. These assays enable biochemical investigations in both human and murine primary cells, as well as in cell lines. Conventional methods that require cellular lysis, such as immunoblots or immunoprecipitations, cannot discriminate between proteins from different cellular subsets and ultimately provide averaged protein readings. The advantage of multiparameter flow cytometry is apparent in immunophenotypical analysis. Intracellular detection of signaling molecules by flow cytometry, namely the detection of phosphorylated and nonphosphorylated molecules, has recently exposed the heterogeneity that can be observed upon signal transduction.
Strategic Planning Selection of cell types and optimization of culture conditions are critical in detecting differences in phosphoepitopes. For example…… Basic Protocol 1: Flow Cytometric Analysis of Intracellular Phosphoepitopes Using Alcohol-Based Permeabilization Basic Protocol 2: Flow Cytometric Analysis of Intracellular Phosphoepitopes Using Detergent-Based Permeabilization Basic Protocol 3: Flow Cytometric Analysis of Intracellular or Surface Phosphoepitopes Using Whole-Blood Staining
www.isac-net.org
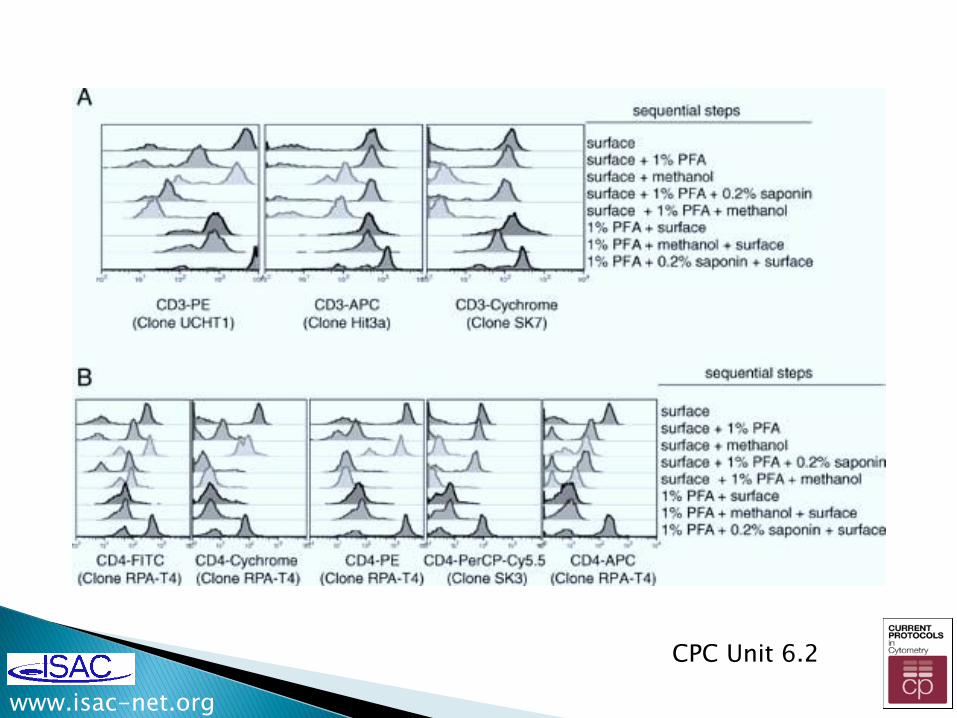
CPC Unit 6.2
www.isac-net.org
www.isac-net.org
www.isac-net.org
www.isac-net.org
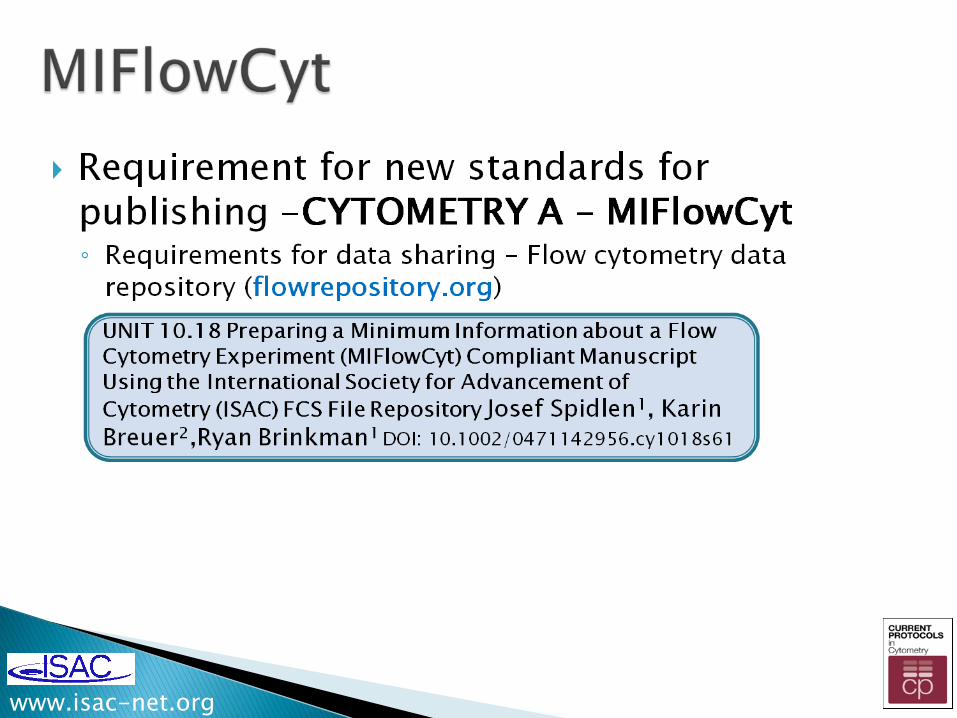
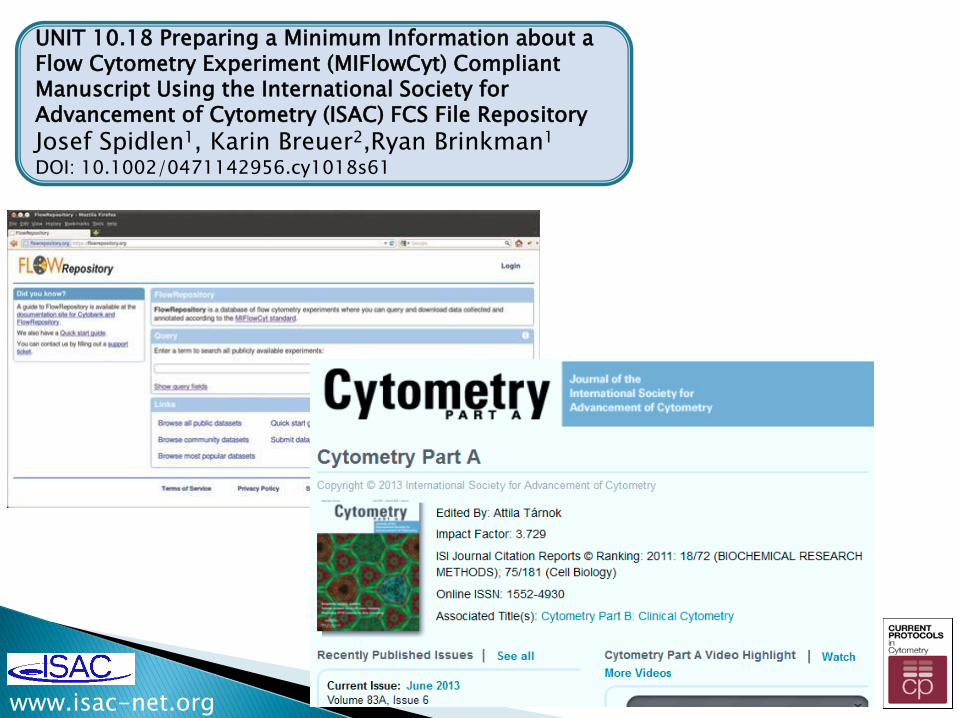
UNIT 10.18 Preparing a Minimum Information about a Flow Cytometry Experiment (MIFlowCyt) Compliant Manuscript Using the International Society for Advancement of Cytometry (ISAC) FCS File Repository
Josef Spidlen1, Karin Breuer2,Ryan Brinkman1
DOI: 10.1002/0471142956.cy1018s61
Standardizing and Calibrating Flow Cytometry Measurements
John Nolan La Jolla Bioengineering Institute Current Protocols in Cytometry [email protected]
Objective
• Why standardize or calibrate?
• Reference and calibration particles
• Common standardization and calibration scenarios
– Characterization of the instrument
– Calibration of the measurement
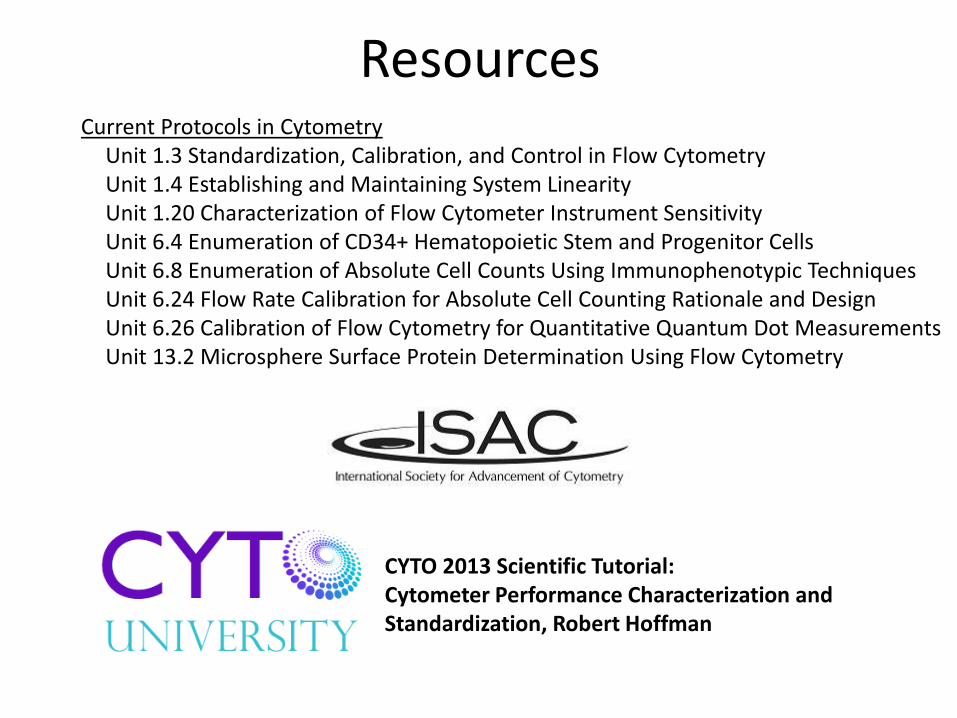
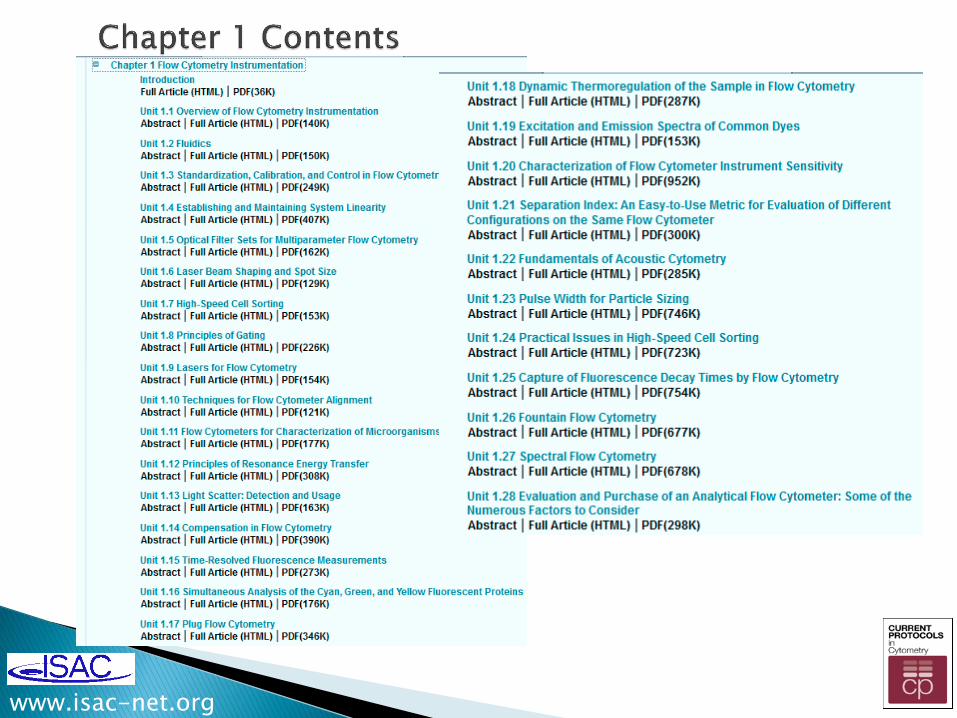
Resources Current Protocols in Cytometry Unit 1.3 Standardization, Calibration, and Control in Flow Cytometry Unit 1.4 Establishing and Maintaining System Linearity Unit 1.20 Characterization of Flow Cytometer Instrument Sensitivity Unit 6.4 Enumeration of CD34+ Hematopoietic Stem and Progenitor Cells Unit 6.8 Enumeration of Absolute Cell Counts Using Immunophenotypic Techniques Unit 6.24 Flow Rate Calibration for Absolute Cell Counting Rationale and Design Unit 6.26 Calibration of Flow Cytometry for Quantitative Quantum Dot Measurements Unit 13.2 Microsphere Surface Protein Determination Using Flow Cytometry
CYTO 2013 Scientific Tutorial: Cytometer Performance Characterization and Standardization, Robert Hoffman
Why Standardize or Calibrate?
• Standardization enables
– Comparison of measurements over time
– Comparison of measurements between labs
• Calibration allows
– Intensity to be reported in absolute units
– Molecular features of a sample to quantified
• Optimal approach
– Will depend on reagents (antibodies, fluorochromes) and application
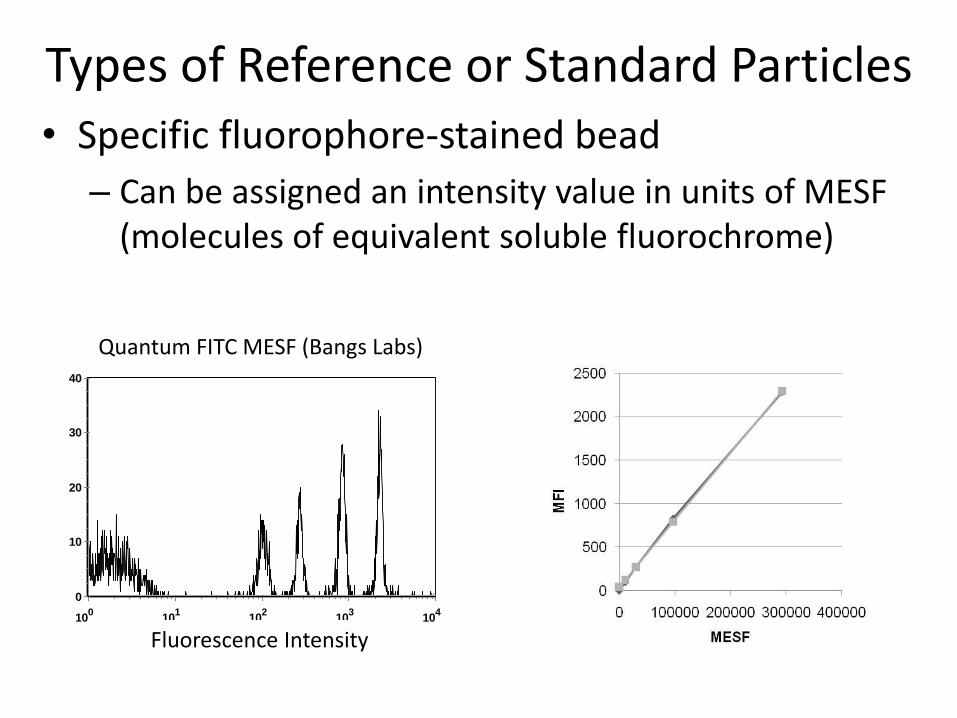
Types of Reference or Standard Particles
• Specific fluorophore-stained bead
– Can be assigned an intensity value in units of MESF (molecules of equivalent soluble fluorochrome)
Quantum FITC MESF (Bangs Labs)
FL1-H
Co
un
t
100
101
102
103
104
0
10
20
30
40
Fluorescence Intensity
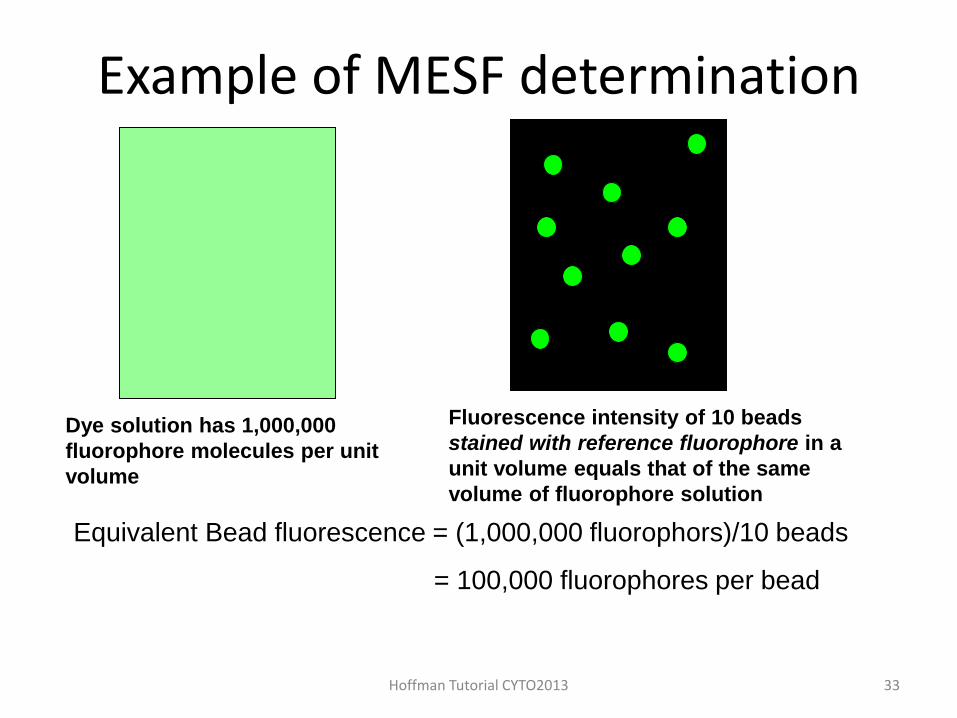
Example of MESF determination
Fluorescence intensity of 10 beads
stained with reference fluorophore in a
unit volume equals that of the same
volume of fluorophore solution
Dye solution has 1,000,000
fluorophore molecules per unit
volume
Equivalent Bead fluorescence = (1,000,000 fluorophors)/10 beads
= 100,000 fluorophores per bead
Hoffman Tutorial CYTO2013 33
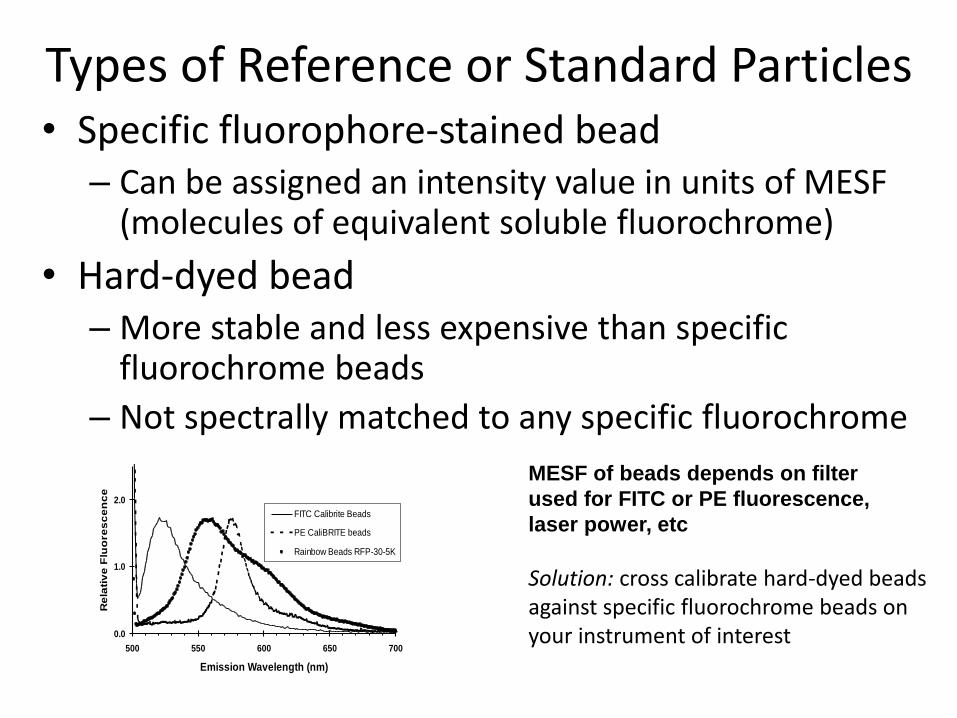
Types of Reference or Standard Particles • Specific fluorophore-stained bead
– Can be assigned an intensity value in units of MESF (molecules of equivalent soluble fluorochrome)
• Hard-dyed bead – More stable and less expensive than specific
fluorochrome beads
– Not spectrally matched to any specific fluorochrome
0.0
1.0
2.0
500 550 600 650 700
Emission Wavelength (nm)
Re
lati
ve
Flu
ore
sc
en
ce
FITC Calibrite Beads
PE CaliBRITE beads
Rainbow Beads RFP-30-5K
MESF of beads depends on filter
used for FITC or PE fluorescence,
laser power, etc
Solution: cross calibrate hard-dyed beads against specific fluorochrome beads on your instrument of interest
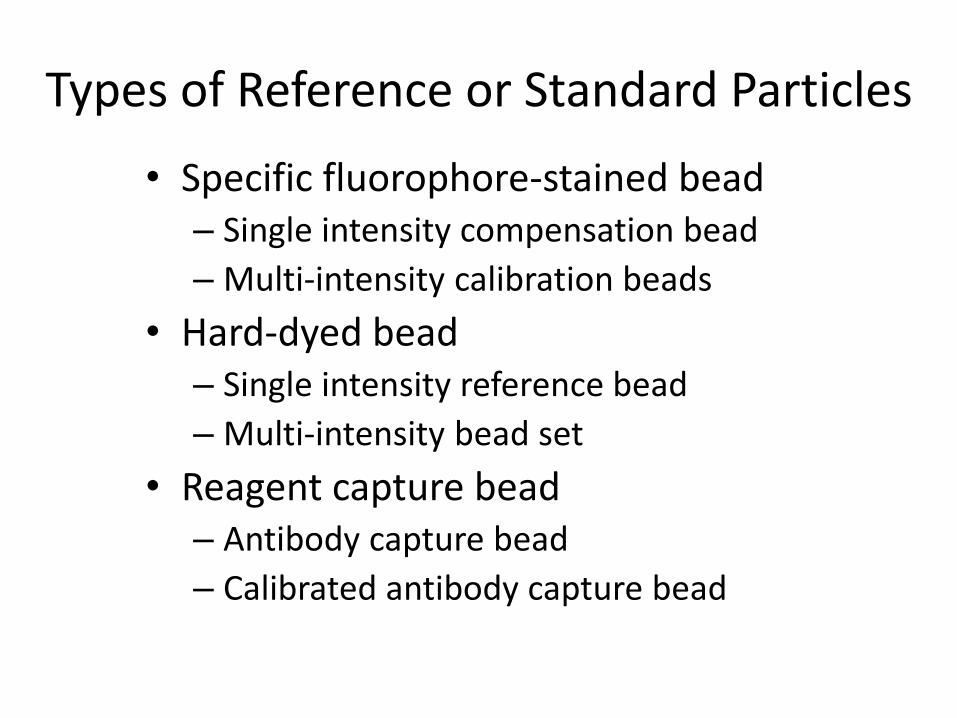
Types of Reference or Standard Particles
• Specific fluorophore-stained bead – Single intensity compensation bead
– Multi-intensity calibration beads
• Hard-dyed bead – Single intensity reference bead
– Multi-intensity bead set
• Reagent capture bead – Antibody capture bead
– Calibrated antibody capture bead
Scenarios
1. Is the instrument working?
2. Is the instrument working well?
3. How bright are my cells?
4. How many molecules are on my cells?
5. How many molecules can I detect?
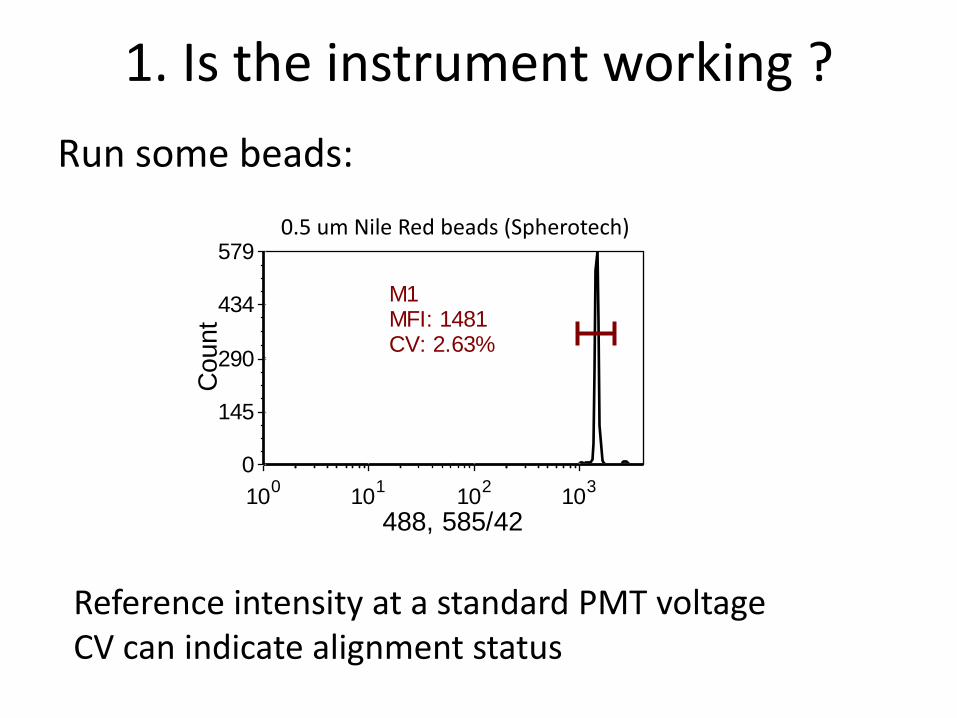
1. Is the instrument working ?
Run some beads:
Reference intensity at a standard PMT voltage CV can indicate alignment status
488, 585/42
Count
100
101
102
103
0
145
290
434
579
M1MFI: 1481CV: 2.63%
0.5 um Nile Red beads (Spherotech)
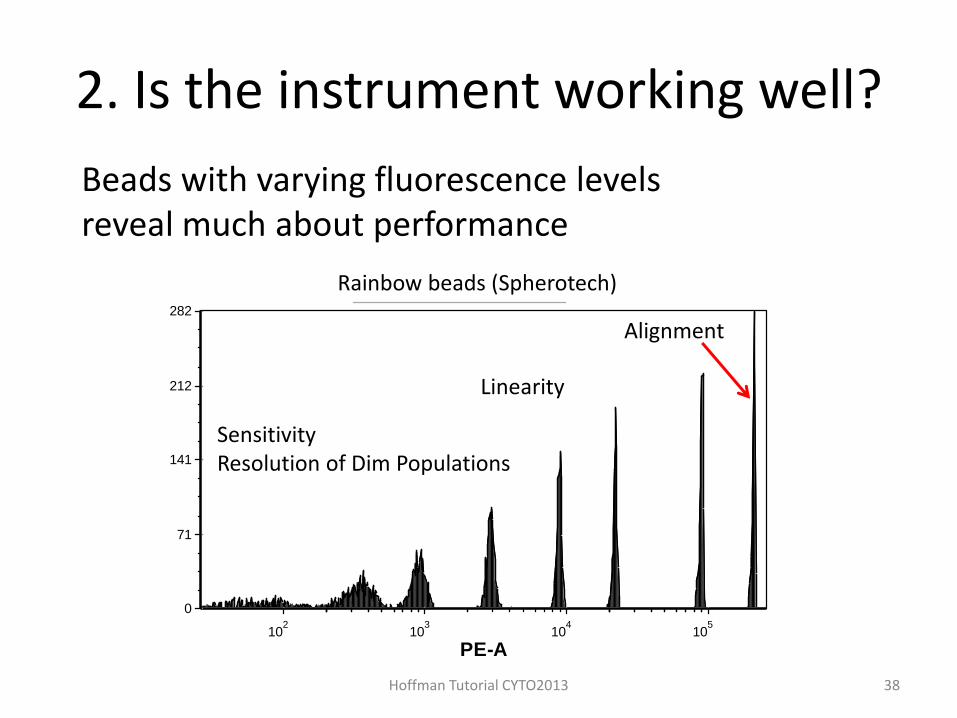
2. Is the instrument working well?
Hoffman Tutorial CYTO2013
Rainbow & CST_Rainbow 8pk.fcs
PE-A
Co
un
t
102
103
104
105
0
71
141
212
282
Alignment
Sensitivity Resolution of Dim Populations
Linearity
38
Beads with varying fluorescence levels reveal much about performance
Rainbow beads (Spherotech)
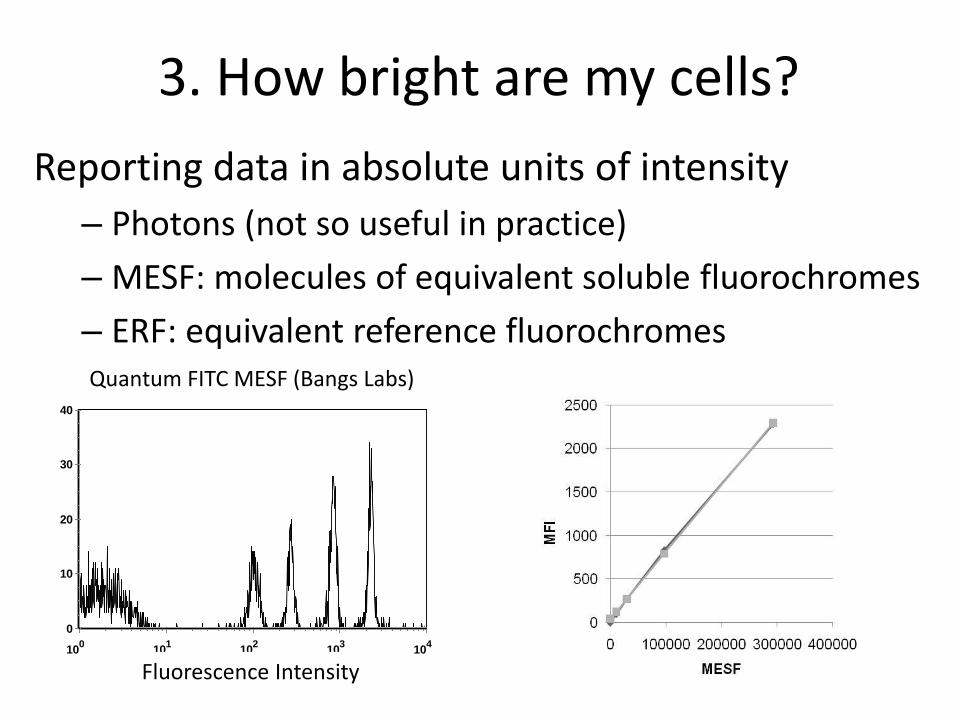
3. How bright are my cells?
Reporting data in absolute units of intensity
– Photons (not so useful in practice)
– MESF: molecules of equivalent soluble fluorochromes
– ERF: equivalent reference fluorochromes Quantum FITC MESF (Bangs Labs)
FL1-H
Co
un
t
100
101
102
103
104
0
10
20
30
40
Fluorescence Intensity
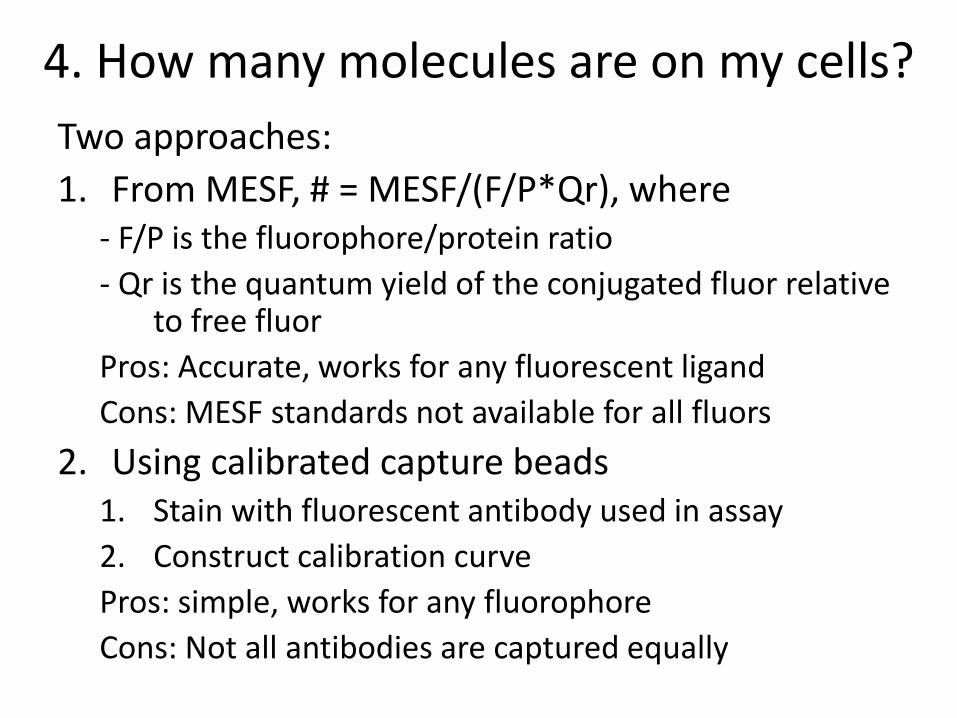
4. How many molecules are on my cells?
Two approaches:
1. From MESF, # = MESF/(F/P*Qr), where - F/P is the fluorophore/protein ratio
- Qr is the quantum yield of the conjugated fluor relative to free fluor
Pros: Accurate, works for any fluorescent ligand
Cons: MESF standards not available for all fluors
2. Using calibrated capture beads 1. Stain with fluorescent antibody used in assay
2. Construct calibration curve
Pros: simple, works for any fluorophore
Cons: Not all antibodies are captured equally
5. What is my detection limit?
• Requires knowledge of instrument:
– Detection efficiency, Q (photoelectrons/MESF)
– Background, B (MESF)
• Allows prediction of resolution between dim and blank cells
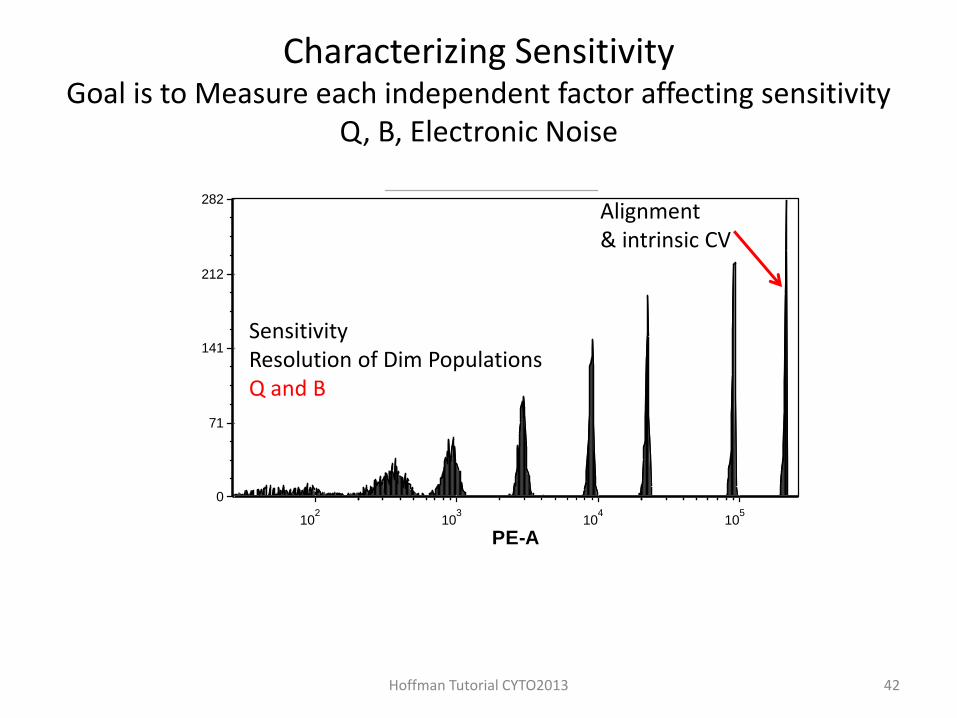
Characterizing Sensitivity Goal is to Measure each independent factor affecting sensitivity
Q, B, Electronic Noise
Hoffman Tutorial CYTO2013
Rainbow & CST_Rainbow 8pk.fcs
PE-A
Co
un
t
102
103
104
105
0
71
141
212
282Alignment & intrinsic CV
Sensitivity Resolution of Dim Populations Q and B
42
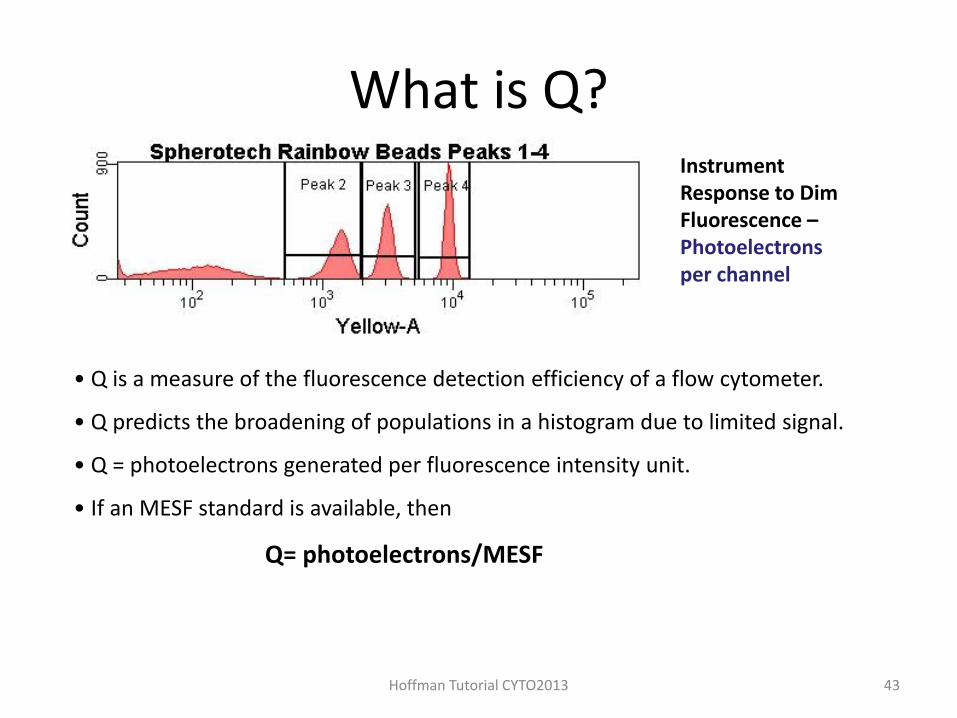
What is Q?
• Q is a measure of the fluorescence detection efficiency of a flow cytometer.
• Q predicts the broadening of populations in a histogram due to limited signal.
• Q = photoelectrons generated per fluorescence intensity unit.
• If an MESF standard is available, then
Q= photoelectrons/MESF
Hoffman Tutorial CYTO2013 43
Instrument Response to Dim Fluorescence – Photoelectrons per channel
Q
B
Q
1f2SD
ronPhotoelect
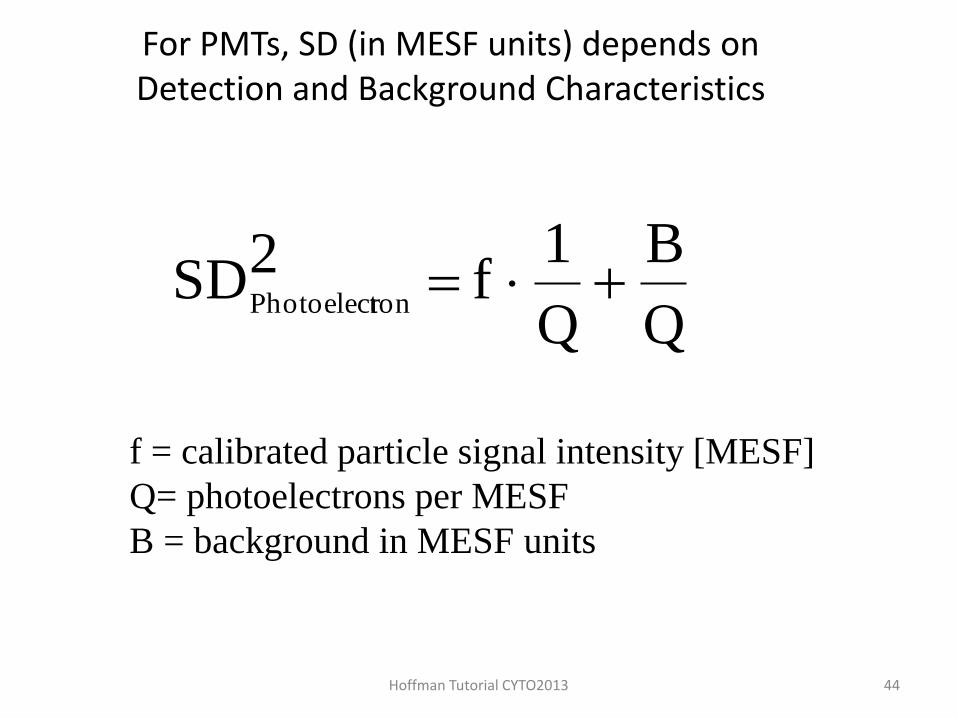
f = calibrated particle signal intensity [MESF]
Q= photoelectrons per MESF
B = background in MESF units
For PMTs, SD (in MESF units) depends on Detection and Background Characteristics
Hoffman Tutorial CYTO2013 44
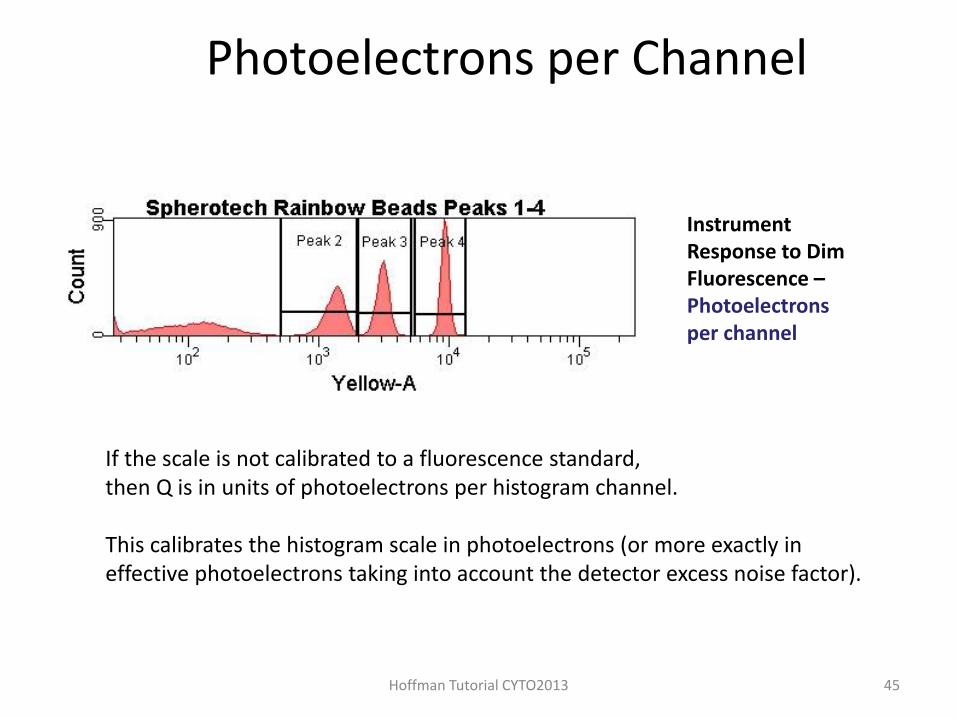
Photoelectrons per Channel
Hoffman Tutorial CYTO2013
If the scale is not calibrated to a fluorescence standard, then Q is in units of photoelectrons per histogram channel. This calibrates the histogram scale in photoelectrons (or more exactly in effective photoelectrons taking into account the detector excess noise factor).
45
Instrument Response to Dim Fluorescence – Photoelectrons per channel
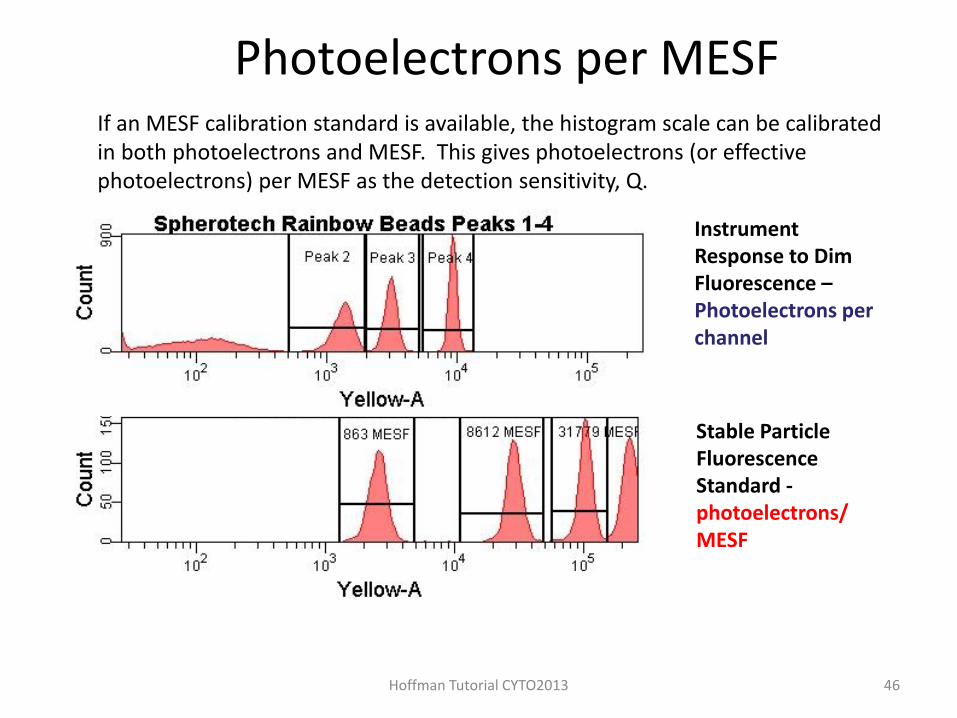
Photoelectrons per MESF
Hoffman Tutorial CYTO2013
If an MESF calibration standard is available, the histogram scale can be calibrated in both photoelectrons and MESF. This gives photoelectrons (or effective photoelectrons) per MESF as the detection sensitivity, Q.
46
Instrument Response to Dim Fluorescence – Photoelectrons per channel
Stable Particle Fluorescence Standard - photoelectrons/MESF
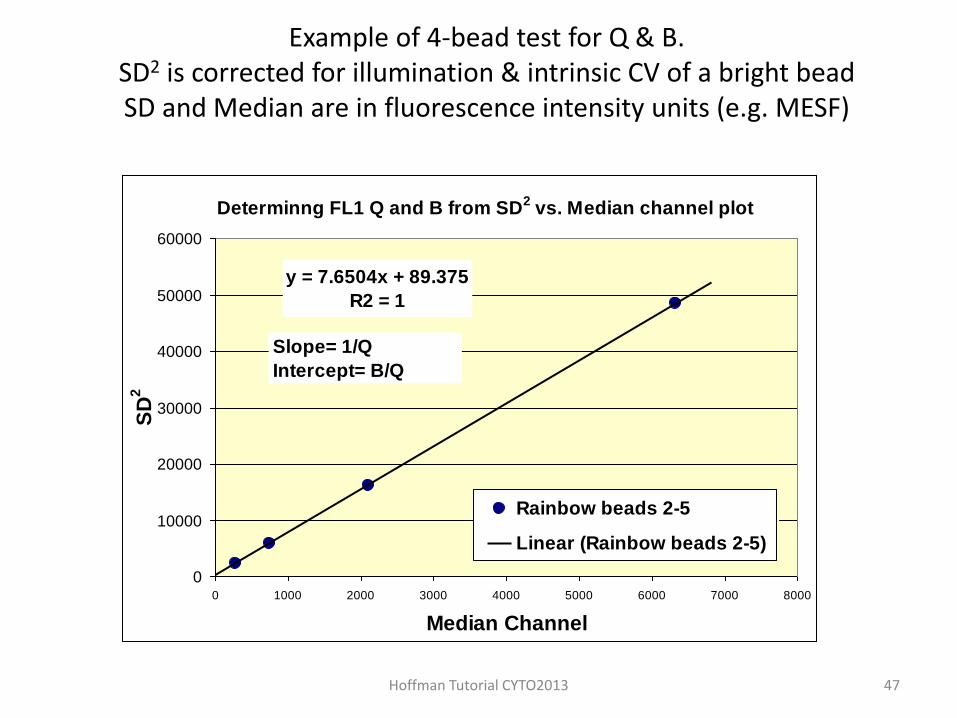
Example of 4-bead test for Q & B. SD2 is corrected for illumination & intrinsic CV of a bright bead SD and Median are in fluorescence intensity units (e.g. MESF)
Determinng FL1 Q and B from SD2 vs. Median channel plot
y = 7.6504x + 89.375
R2 = 1
0
10000
20000
30000
40000
50000
60000
0 1000 2000 3000 4000 5000 6000 7000 8000
Median Channel
SD
2
Rainbow beads 2-5
Linear (Rainbow beads 2-5)
Slope= 1/Q
Intercept= B/Q
Hoffman Tutorial CYTO2013 47
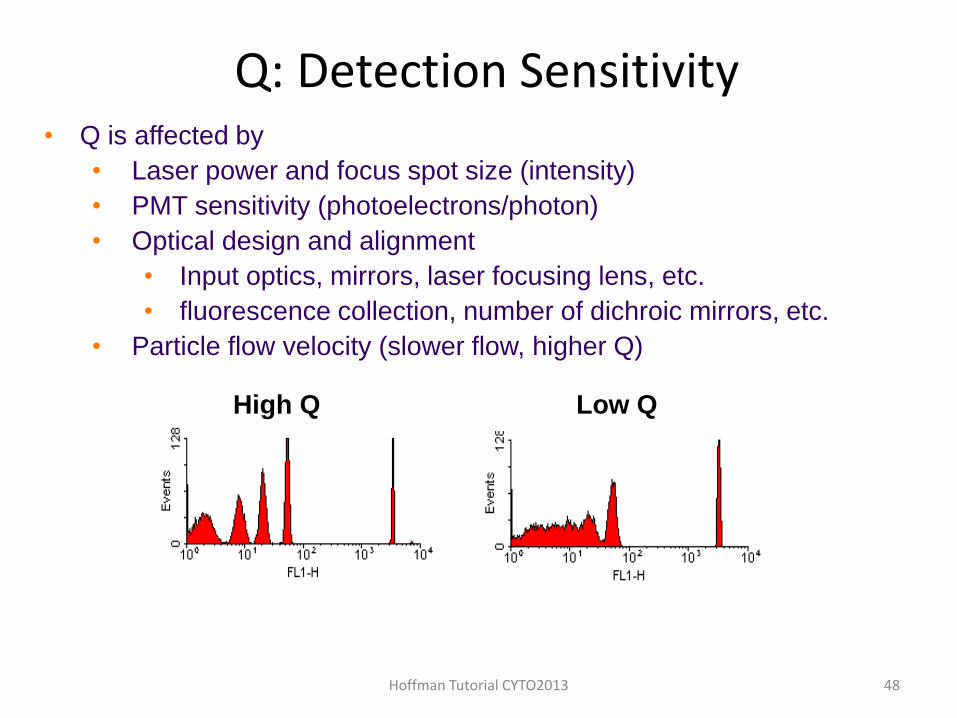
• Q is affected by
• Laser power and focus spot size (intensity)
• PMT sensitivity (photoelectrons/photon)
• Optical design and alignment
• Input optics, mirrors, laser focusing lens, etc.
• fluorescence collection, number of dichroic mirrors, etc.
• Particle flow velocity (slower flow, higher Q)
Q: Detection Sensitivity
High Q Low Q
Hoffman Tutorial CYTO2013 48
Summary
• Standardization allows one to compare results over time or between instruments/labs
• Calibration allows one to report intensities in absolute units (photons, molecules)
• Standardizing and calibrating your measurements increases their value to you and to other researchers
Resources Current Protocols in Cytometry Unit 1.3 Standardization, Calibration, and Control in Flow Cytometry Unit 1.4 Establishing and Maintaining System Linearity Unit 1.20 Characterization of Flow Cytometer Instrument Sensitivity Unit 6.4 Enumeration of CD34+ Hematopoietic Stem and Progenitor Cells Unit 6.8 Enumeration of Absolute Cell Counts Using Immunophenotypic Techniques Unit 6.24 Flow Rate Calibration for Absolute Cell Counting Rationale and Design Unit 6.26 Calibration of Flow Cytometry for Quantitative Quantum Dot Measurements Unit 13.2 Microsphere Surface Protein Determination Using Flow Cytometry
CYTO 2013 Scientific Tutorial: Cytometer Performance Characterization and Standardization, Robert Hoffman