Embed Size (px)
Citation preview
Cancer Letters 251 (2007) 278–287
www.elsevier.com/locate/canlet
Fluorescence in situ hybridization to evaluate dysplasiain Barrett’s esophagus: A pilot study
Renzo Cestari a, Vincenzo Villanacci b,*, Elisa Rossi b, Domenico Della Casa a,Guido Missale a, Massimo Conio c, Piergiovanni Grigolato b, Gabrio Bassotti d
a Digestive Endoscopy Unit, Department of Surgery, Spedali Civili, University of Brescia, Italyb 2nd Department of Pathology, Spedali Civili, University of Brescia, Italy
c Gastroenterology Unit, Sanremo Hospital, Sanremo, Italyd Gastroenterology & Hepatology Section, Department of Clinical and Experimental Medicine, University of Perugia, Italy
Received 7 August 2006; accepted 27 November 2006
Abstract
Background: Histological disagreement is frequent in the diagnosis and grading of dysplasia in Barrett’s esophagus (BE).Aims: To identify selective markers for dysplasia in BE and to improve the differentiation between low-grade dysplasia
(LGD) and high-grade dysplasia (HGD).Methods: Eight BE esophageal mucosectomies (7 males) were analyzed by conventional histology and immunohisto-
chemistry for p53 and Fluorescence In situ Hybridization (FISH) for chromosomes X, Y, 4, 8, 17, 18. The female muco-sectomy was considered as a control for the XY probe.
Results: p53 confirmed multifocal dysplasia in all cases. All patients displayed increased aneusomy for chromosomes 4,8, 17 and 18 along the sequence of cancer progression. There was also a trend for chromosome 8 to be below the FISHcutoff; 50% of cases showed aneusomy for chromosome 18 in areas with differing grades of dysplasia. Aneusomy wasincreased for chromosomes 4 and 17, to a similar extent in LGD and HGD. In male specimens, the presence of chromo-some Y was revealed in Barrett’s mucosa and LGD, but not in HGD and intramucosal carcinoma.
Conclusions: FISH in BE may be useful diagnostic to confirm the diagnosis of HGD. Loss of chromosome Y might be aselective marker of HGD in male patients.� 2007 Elsevier Ireland Ltd. All rights reserved.
Keywords: Barrett’s esophagus; Dysplasia; FISH; Immunohistochemistry
1. Introduction
Barrett’s esophagus (BE) has the potential toprogress from low-grade dysplasia (LGD) to high-
0304-3835/$ - see front matter � 2007 Elsevier Ireland Ltd. All rightsdoi:10.1016/j.canlet.2006.11.033
* Corresponding author. Address: 2nd Department ofPathology, Spedali Civili, University of Brescia, Piazzale SpedaliCivili 1, 25100 Brescia, Italy.
E-mail address: [email protected] (V. Villanacci).
grade dysplasia (HGD) and eventually to adenocar-cinoma [1]. However, there is a considerable degreeof subjectivity and substantial interobserver vari-ability on the diagnosis and grading of dysplasiain these patients, even between experienced gastro-intestinal pathologists. These variations are due todifferences in histopathologic criteria and expertise,highlighting the need for reliable markers to assess
reserved.
R. Cestari et al. / Cancer Letters 251 (2007) 278–287 279
cancer risk in BE [2,3]. Abnormalities of the tumorsuppressor gene p53 are detected in up to 95% ofBE associated cancers, indicating that loss offunction is an important step in the progressionto adenocarcinoma, but this abnormality does notdistinguish between LGD and HGD [4].
The underlying molecular mechanisms involvedin BE neoplastic progression are still unclear. Phe-notypic heterogeneity reflects genetic divergenceduring the evolution of cancer, as recently stressed[1]. In particular, the progression from HGD toinvasive cancer involves alterations in chromo-somes 5, 8, 9, 12, 17 and 18. Chromosome 4 hyper-ploidy has been described as an early geneticaberration in premalignant BE [5], whilechromosome Y loss has been reported as one ofthe most common events during cancer progression[6].
The aim of this study was to search for a markerable to objectively distinguish LGD from HGD as asupport to the histopathological diagnosis. Thus, weinvestigated chromosomes 4, 8, 17, 18 and Y bymeans of fluorescence in situ hybridization (FISH),since current evidence suggests that these chromo-somes are likely to be involved in the progressionfrom Barrett’s metaplasia to adenocarcinoma [5,6].Since FISH uses chromosome-specific a-satelliteDNA probe, it is a rapid and reliable method toassess numerical chromosomal abnormalities withininterphase nuclei on formalin-fixed and paraffin-em-bedded tissues.
2. Patients and methods
Eight consecutive patients (7 men, 1 woman, agerange 45–86 years) with previously diagnosed BE andhistological evidence of HGD entered the study. Endo-scopic mucosal resection (EMR) of the involved areaswas performed under deep sedation. After submucosalinjection of a 1:10,000 epinephrine solution where visiblelesions or mucosal irregularities were noted or histologi-cal dysplasia was previously described, EMR was carriedout by means of a plastic cap (MH-594, Olympus Co,Tokyo, Japan) preloaded on the tip of a standardendoscope. Resection was carried out by endocut modeonly, using an ERBE-ICC 200 cautery device (ERBEElektromedizin GmbH, Tubingen, Germany) set at120 W cut and 60 W coagulation. All resected materialwas orientated on paper filter for histopathologicalevaluation.
The studies were carried out in accordance withlocal ethical guidelines, following the recommendationsof the Declaration of Helsinki (Edinburgh revision,2000).
2.1. Histology and immunohistochemistry
All mucosectomy specimens were photographed, fixedin formalin and paraffin-enclosed for examination. Sec-tions 5 lm thick were stained with Hematoxylin & Eosin(H&E), Alcian-PAS, and immunohistochemistry for p53(BioGenex-Menarini monoclonal antibody, San Ramon,CA, USA, dilution 1:100) and evaluated by two experi-enced pathologists (VV and PG) for detection of squa-mous epithelium, intestinal metaplasia, dysplasia andadenocarcinoma [2,7–11]. In case of diagnostic disagree-ment a consensus diagnosis was reached by joint micro-scopic assessment of the slides.
Dysplasia was defined as the presence of neoplasticepithelium confined within the glands, using the criteriaof Riddell and colleagues for dysplasia in inflammatorybowel diseases [12]. Samples were classified as: (1) nega-tive; (2) positive, either LGD or HGD; (3) indefinite fordysplasia. Criteria for LGD included preserved cryptarchitecture with only minimal distortion, and cytologi-cally atypical nuclei limited to the basal half of the crypts.Atypical nuclei presented variable hyperchromasia, over-lapping cell borders, nuclear crowding and irregularnuclear contours. Dystrophic goblet cells may have beenpresent. Criteria for HGD included more severe cytologicatypia and architectural complexity and more pronouncednuclear pleomorphism and hyperchromatism than inLGD. Distinction between HGD and intramucosal carci-noma (IMC) was based on the penetration of neoplasticcells through the basement membrane into the laminapropria.
2.2. Interphase FISH analysis
FISH was carried out to check for the presence ofgenetic alterations on all serial mucosal mucosectomy sec-tions previously identified as normal esophageal mucosa(EN), intestinal metaplasia (BM), LGD, HGD, or ICM.Normal gastric mucosa obtained during bariatric surgeryserved as control to check for good signal of probehybridization.
DNA in situ hybridization for human chromosomes 4,8, 17, 18, X and Y was performed using chromosome enu-meration probes CEP4, CEP8, CEP17, CEP18 and CEP-XY (Vysis, Abbott, Rome, Italy) as directly labeledprobes. The a-satellite probes CEP4 and CEP8 werelabeled with Spectrum Orange and hybridized to the cen-tromere of human chromosomes 4 (bands 4p11–q11) and8 (bands 8p11.1–q11.1, locus D8Z2), respectively. CEP17and 18, also a-satellite probes, were labeled with SpectrumGreen, and hybridized to the centromere of chromosomes17 (bands 17p11.1–q11.1, locus D17Z1) and 18 (bands18p11.1–q11.1, locus D18Z1), respectively. CEPXY wasused to investigate human X and Y chromosomes. CEPX,an a-satellite probe, is labeled with Spectrum Orange andhybridizes to the centromere of human chromosome X
280 R. Cestari et al. / Cancer Letters 251 (2007) 278–287
(bands p11.1–q11, locus DXZ1) while CEPY, labeled withSpectrum Green, hybridizes to the satellite III sequence ofhuman chromosome Y (bands Yq12, locus DYZ1).
Two-l-thick sections of formalin-fixed, paraffin-em-bedded tissue blocks were deparaffinized in xylene for20 min, dehydrated in ethanol, then processed with0.005% pepsin solution (Roche Diagnostic, GmbH,
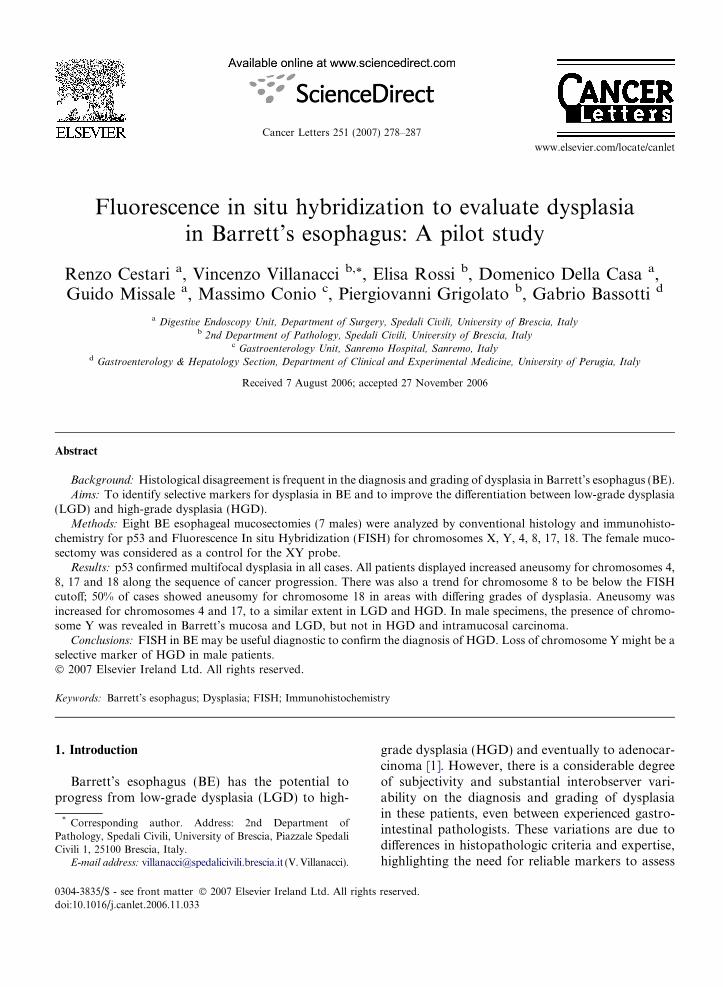
Fig. 1. Representative mucosectomy specimen, with
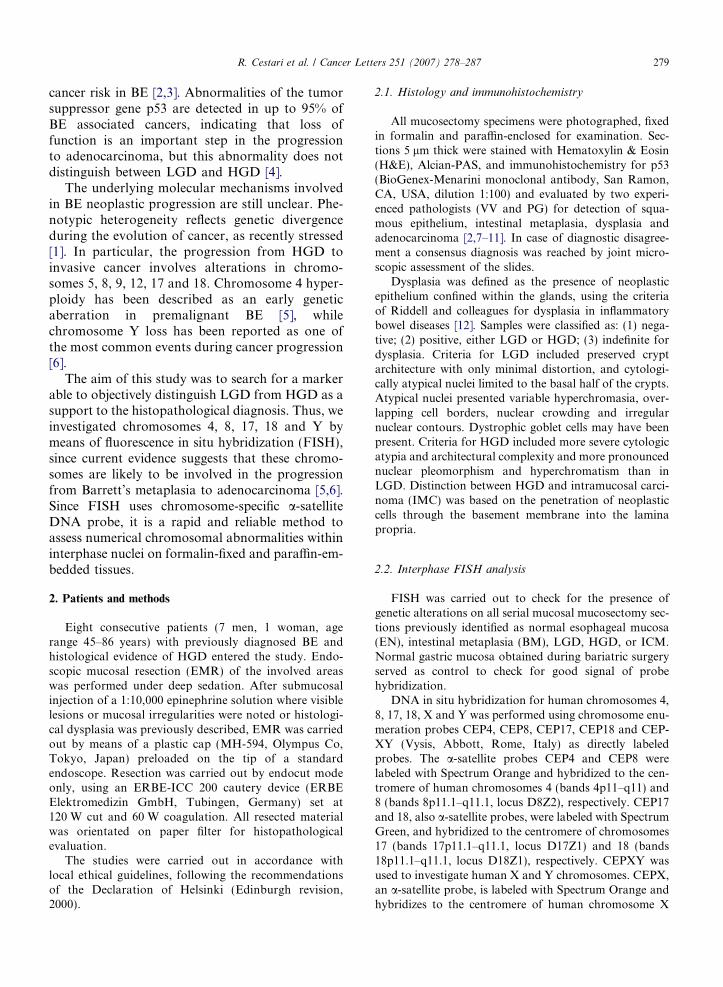
Fig. 2. (A) Foci of low-grade dysplasia (Hematoxylin & Eosin, originpositivity for p53, confirming the presence of dysplasia (p53 immunoh
Mannheim, Germany) and incubated for 30 min at37 �C during mechanical shaking. After washing in phos-phate-buffered saline, the slides were air-dried and placedin methanol:acetic solution (3:1), air-dried and heated to90 �C for 2 minutes, incubated with 2· saline sodium cit-rate (2 · SSC) at 37 �C, dehydrated in ethanol and air-dried. After denaturation in 0.1 mmol/L citric acid (pH
mapping of Barrett’s mucosa, LGD and HGD.
al magnification 200·). (B) The same area of A shows nuclearistochemistry stain, original magnification 200·).
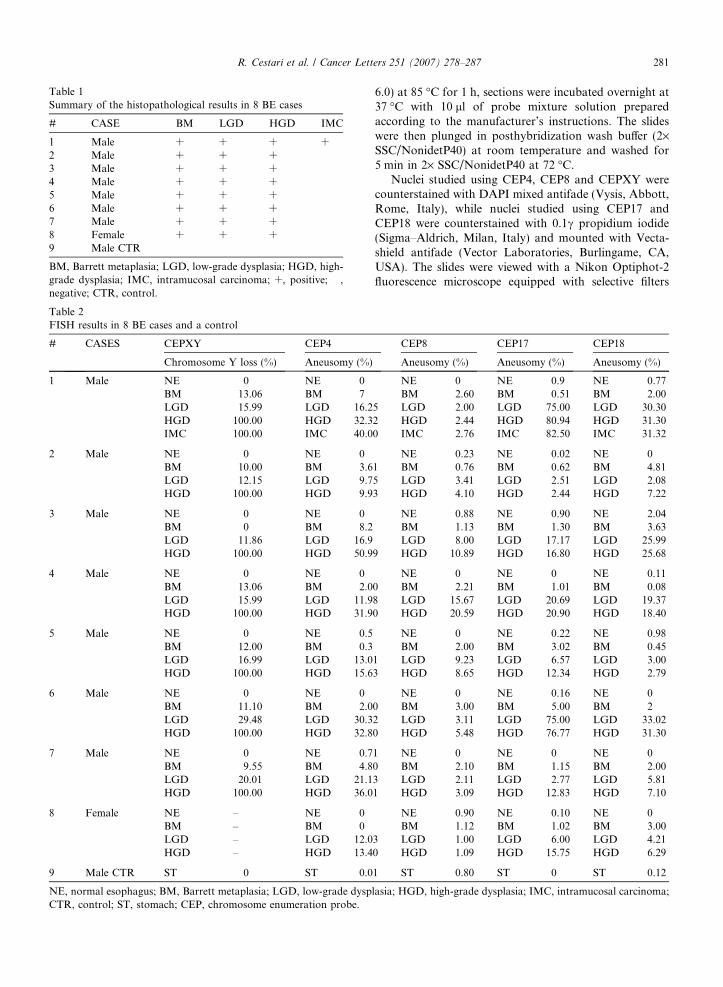
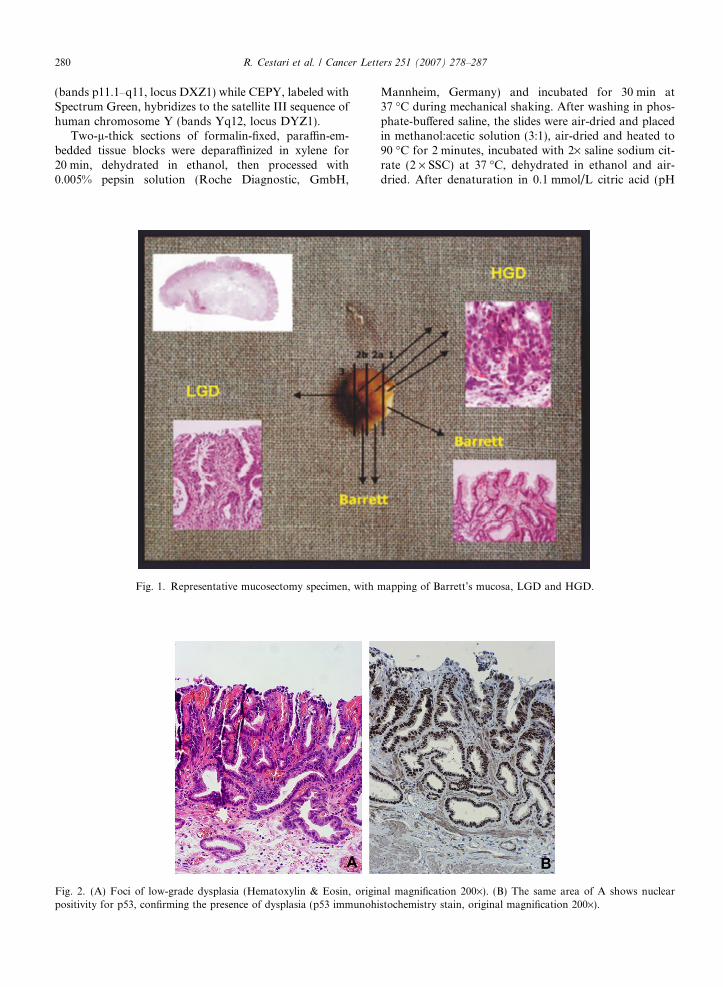
Table 2FISH results in 8 BE cases and a control
# CASES CEPXY CEP4
Chromosome Y loss (%) Aneusomy (%)
1 Male NE 0 NE 0BM 13.06 BM 7LGD 15.99 LGD 16.2HGD 100.00 HGD 32.3IMC 100.00 IMC 40.0
2 Male NE 0 NE 0BM 10.00 BM 3.6LGD 12.15 LGD 9.7HGD 100.00 HGD 9.9
3 Male NE 0 NE 0BM 0 BM 8.2LGD 11.86 LGD 16.9HGD 100.00 HGD 50.9
4 Male NE 0 NE 0BM 13.06 BM 2.0LGD 15.99 LGD 11.9HGD 100.00 HGD 31.9
5 Male NE 0 NE 0.5BM 12.00 BM 0.3LGD 16.99 LGD 13.0HGD 100.00 HGD 15.6
6 Male NE 0 NE 0BM 11.10 BM 2.0LGD 29.48 LGD 30.3HGD 100.00 HGD 32.8
7 Male NE 0 NE 0.7BM 9.55 BM 4.8LGD 20.01 LGD 21.1HGD 100.00 HGD 36.0
8 Female NE – NE 0BM – BM 0LGD – LGD 12.0HGD – HGD 13.4
9 Male CTR ST 0 ST 0.0
NE, normal esophagus; BM, Barrett metaplasia; LGD, low-grade dyspCTR, control; ST, stomach; CEP, chromosome enumeration probe.
Table 1Summary of the histopathological results in 8 BE cases
# CASE BM LGD HGD IMC
1 Male + + + +2 Male + + + �3 Male + + + �4 Male + + + �5 Male + + + �6 Male + + + �7 Male + + + �8 Female + + + �9 Male CTR � � � �BM, Barrett metaplasia; LGD, low-grade dysplasia; HGD, high-grade dysplasia; IMC, intramucosal carcinoma; +, positive; �,negative; CTR, control.
R. Cestari et al. / Cancer Letters 251 (2007) 278–287 281
6.0) at 85 �C for 1 h, sections were incubated overnight at37 �C with 10 ll of probe mixture solution preparedaccording to the manufacturer’s instructions. The slideswere then plunged in posthybridization wash buffer (2·SSC/NonidetP40) at room temperature and washed for5 min in 2· SSC/NonidetP40 at 72 �C.
Nuclei studied using CEP4, CEP8 and CEPXY werecounterstained with DAPI mixed antifade (Vysis, Abbott,Rome, Italy), while nuclei studied using CEP17 andCEP18 were counterstained with 0.1c propidium iodide(Sigma–Aldrich, Milan, Italy) and mounted with Vecta-shield antifade (Vector Laboratories, Burlingame, CA,USA). The slides were viewed with a Nikon Optiphot-2fluorescence microscope equipped with selective filters
CEP8 CEP17 CEP18
Aneusomy (%) Aneusomy (%) Aneusomy (%)
NE 0 NE 0.9 NE 0.77BM 2.60 BM 0.51 BM 2.00
5 LGD 2.00 LGD 75.00 LGD 30.302 HGD 2.44 HGD 80.94 HGD 31.300 IMC 2.76 IMC 82.50 IMC 31.32
NE 0.23 NE 0.02 NE 01 BM 0.76 BM 0.62 BM 4.815 LGD 3.41 LGD 2.51 LGD 2.083 HGD 4.10 HGD 2.44 HGD 7.22
NE 0.88 NE 0.90 NE 2.04BM 1.13 BM 1.30 BM 3.63LGD 8.00 LGD 17.17 LGD 25.99
9 HGD 10.89 HGD 16.80 HGD 25.68
NE 0 NE 0 NE 0.110 BM 2.21 BM 1.01 BM 0.088 LGD 15.67 LGD 20.69 LGD 19.370 HGD 20.59 HGD 20.90 HGD 18.40
NE 0 NE 0.22 NE 0.98BM 2.00 BM 3.02 BM 0.45
1 LGD 9.23 LGD 6.57 LGD 3.003 HGD 8.65 HGD 12.34 HGD 2.79
NE 0 NE 0.16 NE 00 BM 3.00 BM 5.00 BM 22 LGD 3.11 LGD 75.00 LGD 33.020 HGD 5.48 HGD 76.77 HGD 31.30
1 NE 0 NE 0 NE 00 BM 2.10 BM 1.15 BM 2.003 LGD 2.11 LGD 2.77 LGD 5.811 HGD 3.09 HGD 12.83 HGD 7.10
NE 0.90 NE 0.10 NE 0BM 1.12 BM 1.02 BM 3.00
3 LGD 1.00 LGD 6.00 LGD 4.210 HGD 1.09 HGD 15.75 HGD 6.29
1 ST 0.80 ST 0 ST 0.12
lasia; HGD, high-grade dysplasia; IMC, intramucosal carcinoma;
282 R. Cestari et al. / Cancer Letters 251 (2007) 278–287
for the fluorochromes used. FISH images were blindlycaptured and independently elaborated using Genikonsoftware (Nikon Instruments S.p.A., Italy) at 600·magnification.
2.3. FISH scoring
FISH signals, visible as fluorescent spots, were countedin at least 200 non-overlapping nuclei; the scoring systemwas based on the percentage of nuclei with altered signals.Reference values for abnormal FISH results based oncriteria of Qian and colleagues for tissue sections, toaccount for the potential artifacts due to nuclear overlap-ping in fixed sections. According to these criteria anabnormal autosomal gain required a minimum 8% nucleiwith three or more signals, whereas abnormal autosomalloss required more than 55% nuclei with zero or onesignal [13].
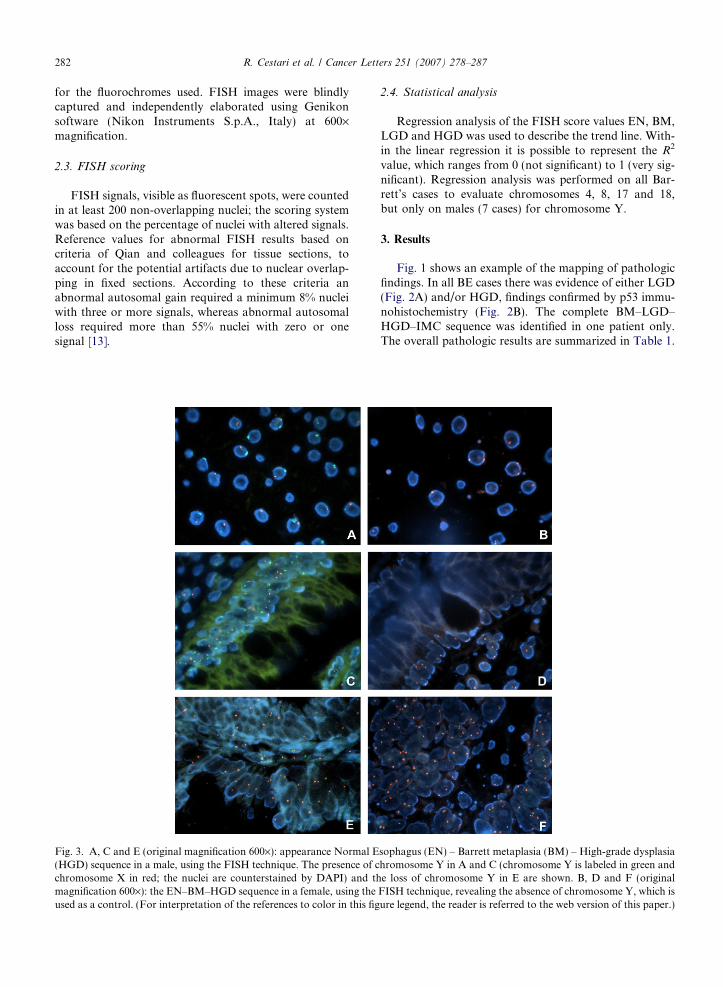
Fig. 3. A, C and E (original magnification 600·): appearance Normal E(HGD) sequence in a male, using the FISH technique. The presence of cchromosome X in red; the nuclei are counterstained by DAPI) and thmagnification 600·): the EN–BM–HGD sequence in a female, using theused as a control. (For interpretation of the references to color in this fig
2.4. Statistical analysis
Regression analysis of the FISH score values EN, BM,LGD and HGD was used to describe the trend line. With-in the linear regression it is possible to represent the R2
value, which ranges from 0 (not significant) to 1 (very sig-nificant). Regression analysis was performed on all Bar-rett’s cases to evaluate chromosomes 4, 8, 17 and 18,but only on males (7 cases) for chromosome Y.
3. Results
Fig. 1 shows an example of the mapping of pathologicfindings. In all BE cases there was evidence of either LGD(Fig. 2A) and/or HGD, findings confirmed by p53 immu-nohistochemistry (Fig. 2B). The complete BM–LGD–HGD–IMC sequence was identified in one patient only.The overall pathologic results are summarized in Table 1.
sophagus (EN) – Barrett metaplasia (BM) – High-grade dysplasiahromosome Y in A and C (chromosome Y is labeled in green ande loss of chromosome Y in E are shown. B, D and F (original
FISH technique, revealing the absence of chromosome Y, which isure legend, the reader is referred to the web version of this paper.)
R. Cestari et al. / Cancer Letters 251 (2007) 278–287 283
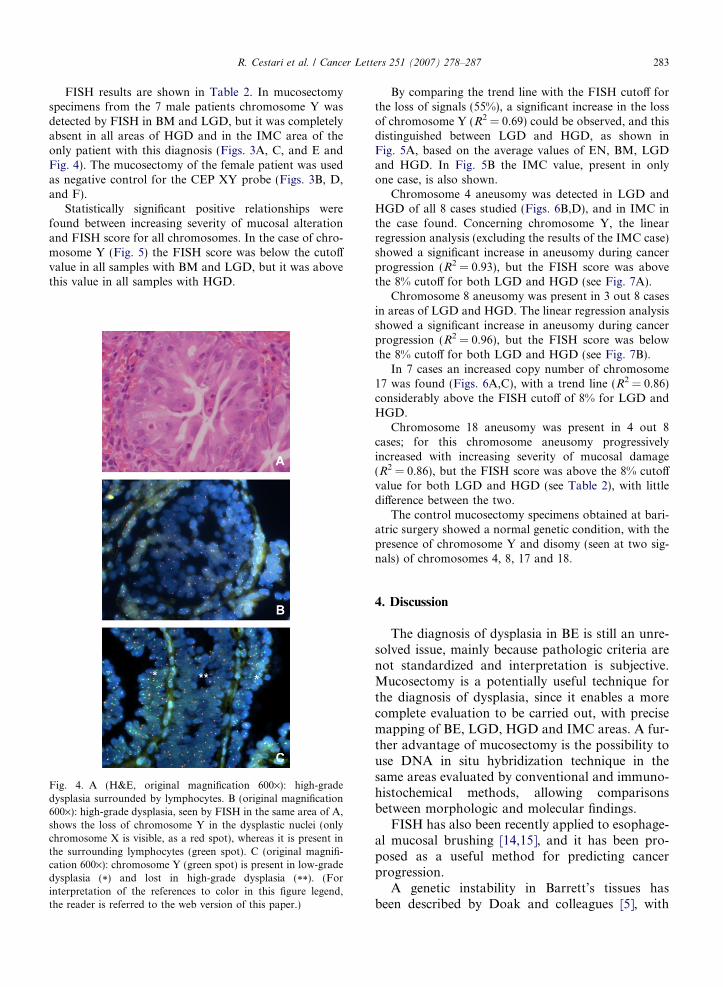
FISH results are shown in Table 2. In mucosectomyspecimens from the 7 male patients chromosome Y wasdetected by FISH in BM and LGD, but it was completelyabsent in all areas of HGD and in the IMC area of theonly patient with this diagnosis (Figs. 3A, C, and E andFig. 4). The mucosectomy of the female patient was usedas negative control for the CEP XY probe (Figs. 3B, D,and F).
Statistically significant positive relationships werefound between increasing severity of mucosal alterationand FISH score for all chromosomes. In the case of chro-mosome Y (Fig. 5) the FISH score was below the cutoffvalue in all samples with BM and LGD, but it was abovethis value in all samples with HGD.
Fig. 4. A (H&E, original magnification 600·): high-gradedysplasia surrounded by lymphocytes. B (original magnification600·): high-grade dysplasia, seen by FISH in the same area of A,shows the loss of chromosome Y in the dysplastic nuclei (onlychromosome X is visible, as a red spot), whereas it is present inthe surrounding lymphocytes (green spot). C (original magnifi-cation 600·): chromosome Y (green spot) is present in low-gradedysplasia (*) and lost in high-grade dysplasia (**). (Forinterpretation of the references to color in this figure legend,the reader is referred to the web version of this paper.)
By comparing the trend line with the FISH cutoff forthe loss of signals (55%), a significant increase in the lossof chromosome Y (R2 = 0.69) could be observed, and thisdistinguished between LGD and HGD, as shown inFig. 5A, based on the average values of EN, BM, LGDand HGD. In Fig. 5B the IMC value, present in onlyone case, is also shown.
Chromosome 4 aneusomy was detected in LGD andHGD of all 8 cases studied (Figs. 6B,D), and in IMC inthe case found. Concerning chromosome Y, the linearregression analysis (excluding the results of the IMC case)showed a significant increase in aneusomy during cancerprogression (R2 = 0.93), but the FISH score was abovethe 8% cutoff for both LGD and HGD (see Fig. 7A).
Chromosome 8 aneusomy was present in 3 out 8 casesin areas of LGD and HGD. The linear regression analysisshowed a significant increase in aneusomy during cancerprogression (R2 = 0.96), but the FISH score was belowthe 8% cutoff for both LGD and HGD (see Fig. 7B).
In 7 cases an increased copy number of chromosome17 was found (Figs. 6A,C), with a trend line (R2 = 0.86)considerably above the FISH cutoff of 8% for LGD andHGD.
Chromosome 18 aneusomy was present in 4 out 8cases; for this chromosome aneusomy progressivelyincreased with increasing severity of mucosal damage(R2 = 0.86), but the FISH score was above the 8% cutoffvalue for both LGD and HGD (see Table 2), with littledifference between the two.
The control mucosectomy specimens obtained at bari-atric surgery showed a normal genetic condition, with thepresence of chromosome Y and disomy (seen at two sig-nals) of chromosomes 4, 8, 17 and 18.
4. Discussion
The diagnosis of dysplasia in BE is still an unre-solved issue, mainly because pathologic criteria arenot standardized and interpretation is subjective.Mucosectomy is a potentially useful technique forthe diagnosis of dysplasia, since it enables a morecomplete evaluation to be carried out, with precisemapping of BE, LGD, HGD and IMC areas. A fur-ther advantage of mucosectomy is the possibility touse DNA in situ hybridization technique in thesame areas evaluated by conventional and immuno-histochemical methods, allowing comparisonsbetween morphologic and molecular findings.
FISH has also been recently applied to esophage-al mucosal brushing [14,15], and it has been pro-posed as a useful method for predicting cancerprogression.
A genetic instability in Barrett’s tissues hasbeen described by Doak and colleagues [5], with
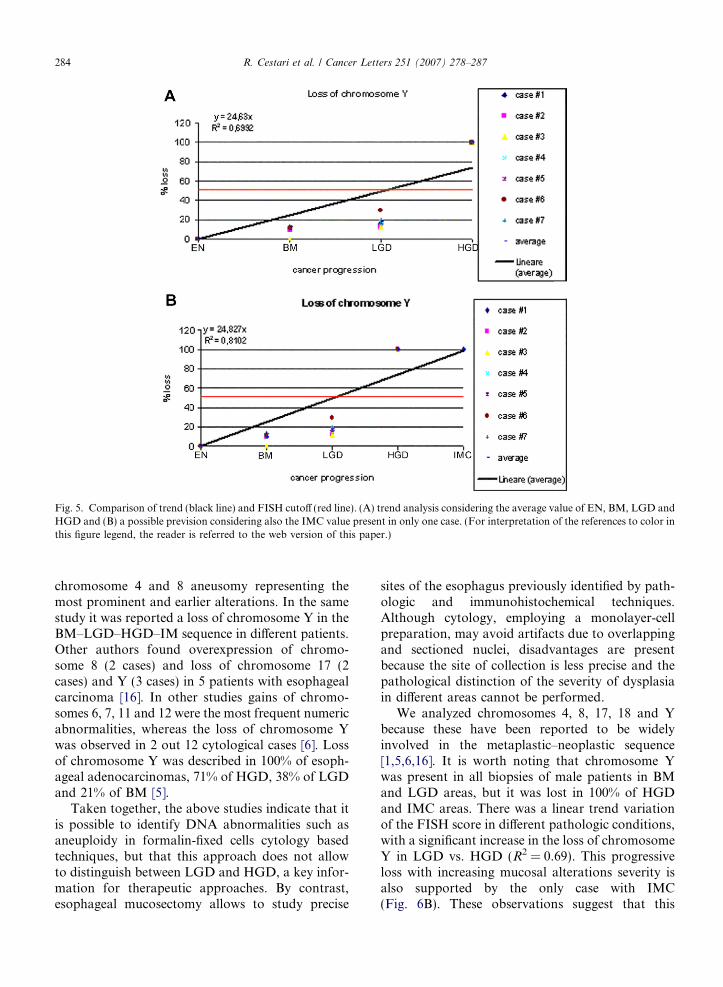
Fig. 5. Comparison of trend (black line) and FISH cutoff (red line). (A) trend analysis considering the average value of EN, BM, LGD andHGD and (B) a possible prevision considering also the IMC value present in only one case. (For interpretation of the references to color inthis figure legend, the reader is referred to the web version of this paper.)
284 R. Cestari et al. / Cancer Letters 251 (2007) 278–287
chromosome 4 and 8 aneusomy representing themost prominent and earlier alterations. In the samestudy it was reported a loss of chromosome Y in theBM–LGD–HGD–IM sequence in different patients.Other authors found overexpression of chromo-some 8 (2 cases) and loss of chromosome 17 (2cases) and Y (3 cases) in 5 patients with esophagealcarcinoma [16]. In other studies gains of chromo-somes 6, 7, 11 and 12 were the most frequent numericabnormalities, whereas the loss of chromosome Ywas observed in 2 out 12 cytological cases [6]. Lossof chromosome Y was described in 100% of esoph-ageal adenocarcinomas, 71% of HGD, 38% of LGDand 21% of BM [5].
Taken together, the above studies indicate that itis possible to identify DNA abnormalities such asaneuploidy in formalin-fixed cells cytology basedtechniques, but that this approach does not allowto distinguish between LGD and HGD, a key infor-mation for therapeutic approaches. By contrast,esophageal mucosectomy allows to study precise
sites of the esophagus previously identified by path-ologic and immunohistochemical techniques.Although cytology, employing a monolayer-cellpreparation, may avoid artifacts due to overlappingand sectioned nuclei, disadvantages are presentbecause the site of collection is less precise and thepathological distinction of the severity of dysplasiain different areas cannot be performed.
We analyzed chromosomes 4, 8, 17, 18 and Ybecause these have been reported to be widelyinvolved in the metaplastic–neoplastic sequence[1,5,6,16]. It is worth noting that chromosome Ywas present in all biopsies of male patients in BMand LGD areas, but it was lost in 100% of HGDand IMC areas. There was a linear trend variationof the FISH score in different pathologic conditions,with a significant increase in the loss of chromosomeY in LGD vs. HGD (R2 = 0.69). This progressiveloss with increasing mucosal alterations severity isalso supported by the only case with IMC(Fig. 6B). These observations suggest that this
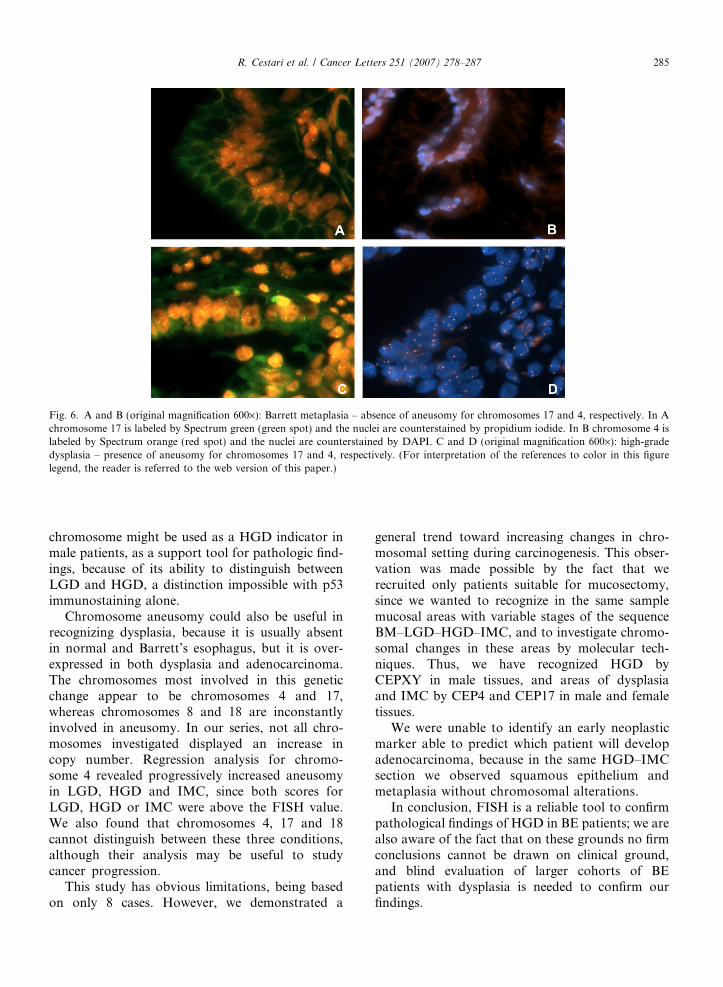
Fig. 6. A and B (original magnification 600·): Barrett metaplasia – absence of aneusomy for chromosomes 17 and 4, respectively. In Achromosome 17 is labeled by Spectrum green (green spot) and the nuclei are counterstained by propidium iodide. In B chromosome 4 islabeled by Spectrum orange (red spot) and the nuclei are counterstained by DAPI. C and D (original magnification 600·): high-gradedysplasia – presence of aneusomy for chromosomes 17 and 4, respectively. (For interpretation of the references to color in this figurelegend, the reader is referred to the web version of this paper.)
R. Cestari et al. / Cancer Letters 251 (2007) 278–287 285
chromosome might be used as a HGD indicator inmale patients, as a support tool for pathologic find-ings, because of its ability to distinguish betweenLGD and HGD, a distinction impossible with p53immunostaining alone.
Chromosome aneusomy could also be useful inrecognizing dysplasia, because it is usually absentin normal and Barrett’s esophagus, but it is over-expressed in both dysplasia and adenocarcinoma.The chromosomes most involved in this geneticchange appear to be chromosomes 4 and 17,whereas chromosomes 8 and 18 are inconstantlyinvolved in aneusomy. In our series, not all chro-mosomes investigated displayed an increase incopy number. Regression analysis for chromo-some 4 revealed progressively increased aneusomyin LGD, HGD and IMC, since both scores forLGD, HGD or IMC were above the FISH value.We also found that chromosomes 4, 17 and 18cannot distinguish between these three conditions,although their analysis may be useful to studycancer progression.
This study has obvious limitations, being basedon only 8 cases. However, we demonstrated a
general trend toward increasing changes in chro-mosomal setting during carcinogenesis. This obser-vation was made possible by the fact that werecruited only patients suitable for mucosectomy,since we wanted to recognize in the same samplemucosal areas with variable stages of the sequenceBM–LGD–HGD–IMC, and to investigate chromo-somal changes in these areas by molecular tech-niques. Thus, we have recognized HGD byCEPXY in male tissues, and areas of dysplasiaand IMC by CEP4 and CEP17 in male and femaletissues.
We were unable to identify an early neoplasticmarker able to predict which patient will developadenocarcinoma, because in the same HGD–IMCsection we observed squamous epithelium andmetaplasia without chromosomal alterations.
In conclusion, FISH is a reliable tool to confirmpathological findings of HGD in BE patients; we arealso aware of the fact that on these grounds no firmconclusions cannot be drawn on clinical ground,and blind evaluation of larger cohorts of BEpatients with dysplasia is needed to confirm ourfindings.
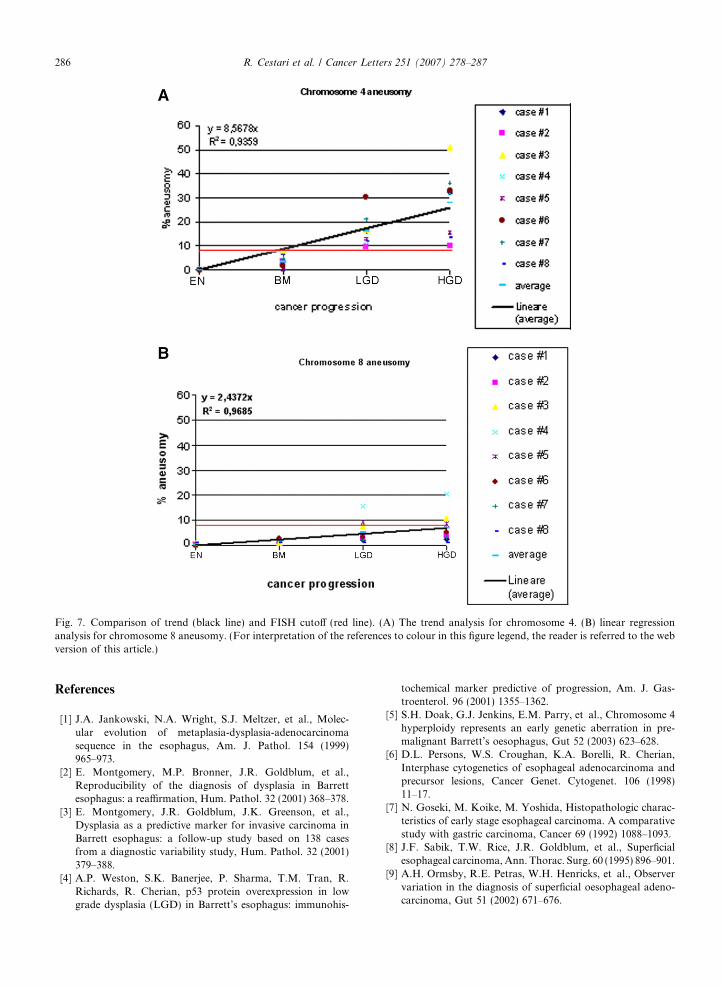
Fig. 7. Comparison of trend (black line) and FISH cutoff (red line). (A) The trend analysis for chromosome 4. (B) linear regressionanalysis for chromosome 8 aneusomy. (For interpretation of the references to colour in this figure legend, the reader is referred to the webversion of this article.)
286 R. Cestari et al. / Cancer Letters 251 (2007) 278–287
References
[1] J.A. Jankowski, N.A. Wright, S.J. Meltzer, et al., Molec-ular evolution of metaplasia-dysplasia-adenocarcinomasequence in the esophagus, Am. J. Pathol. 154 (1999)965–973.
[2] E. Montgomery, M.P. Bronner, J.R. Goldblum, et al.,Reproducibility of the diagnosis of dysplasia in Barrettesophagus: a reaffirmation, Hum. Pathol. 32 (2001) 368–378.
[3] E. Montgomery, J.R. Goldblum, J.K. Greenson, et al.,Dysplasia as a predictive marker for invasive carcinoma inBarrett esophagus: a follow-up study based on 138 casesfrom a diagnostic variability study, Hum. Pathol. 32 (2001)379–388.
[4] A.P. Weston, S.K. Banerjee, P. Sharma, T.M. Tran, R.Richards, R. Cherian, p53 protein overexpression in lowgrade dysplasia (LGD) in Barrett’s esophagus: immunohis-
tochemical marker predictive of progression, Am. J. Gas-troenterol. 96 (2001) 1355–1362.
[5] S.H. Doak, G.J. Jenkins, E.M. Parry, et al., Chromosome 4hyperploidy represents an early genetic aberration in pre-malignant Barrett’s oesophagus, Gut 52 (2003) 623–628.
[6] D.L. Persons, W.S. Croughan, K.A. Borelli, R. Cherian,Interphase cytogenetics of esophageal adenocarcinoma andprecursor lesions, Cancer Genet. Cytogenet. 106 (1998)11–17.
[7] N. Goseki, M. Koike, M. Yoshida, Histopathologic charac-teristics of early stage esophageal carcinoma. A comparativestudy with gastric carcinoma, Cancer 69 (1992) 1088–1093.
[8] J.F. Sabik, T.W. Rice, J.R. Goldblum, et al., Superficialesophageal carcinoma, Ann. Thorac. Surg. 60 (1995) 896–901.
[9] A.H. Ormsby, R.E. Petras, W.H. Henricks, et al., Observervariation in the diagnosis of superficial oesophageal adeno-carcinoma, Gut 51 (2002) 671–676.
R. Cestari et al. / Cancer Letters 251 (2007) 278–287 287
[10] B.J. Reid, R.C. Haggitt, C.E. Rubin, et al., Observervariation in the diagnosis of dysplasia in Barrett’s esophagus,Hum. Pathol. 19 (1988) 166–178.
[11] T.W. Rice, G.W. Falk, E. Achkar, R.E. Petras, Surgicalmanagement of high-grade dysplasia in Barrett’s esophagus,Am. J. Gastroenterol. 88 (1993) 1832–1836.
[12] R.H. Riddell, H. Goldman, D.F. Ransohoff, et al., Dyspla-sia in inflammatory bowel disease: standardized classificationwith provisional clinical applications, Hum. Pathol. 14(1983) 931–968.
[13] J. Qian, D.G. Bostwick, S. Takahashi, et al., Comparison offluorescence in situ hybridization analysis of isolated nucleiand routine histological sections from paraffin-embeddedprostatic adenocarcinoma specimens, Am. J. Pathol. 49(1996) 1193–1199.
[14] G.W. Falk, M. Skacel, T.L. Gramlich, G. Casey, J.R.Goldblum, R.R. Tubbs, Fluorescence in situ hybridizationof cytologic specimens from Barrett’s esophagus: a pilotfeasibility study, Gastrointest. Endosc. 60 (2004) 280–284.
[15] M. Fahmy, M. Skacel, T.L. Gramlich, et al., Chromo-somal gains and genomic loss of p53 and p16 genes inBarrett’s esophagus detected by fluorescence in situ hybrid-ization of cytology specimens, Mod. Pathol. 17 (2004)588–596.
[16] K.K. Krishnadath, H.W. Tilanus, J.C. Alers, A.H. Mulder,H. van Dekken, Detection of genetic changes in Barrett’sadenocarcinoma and Barrett’s esophagus by DNA in situhybridization and immunohistochemistry, Cytometry 15(1994) 176–184.


