Embed Size (px)
Citation preview

Marine Biology 98,457-466 (1988) Marine ==~
�9 Springer-Vedag 1988
Fluorescence induction in the macroalgae Chondrus crispus (Rhodophyceae) and Ulva sp. (Chlorophyceae)*
S.S. Bates** and J. S. Craigie
Atlantic Research Laboratory, National Research Council of Canada, 1411 Oxford Street, Halifax, Nova Scotia, Canada B3H 3Z1
Abstract
The induction of in vivo chlorophyll a (chl a) fluorescence (change in fluorescence intensity during a time-scale of ms to s) was measured to determine the potential of this tech- nique for assessing the physiological condition of the macroalgae Chondrus crispus and Ulva .sp. A gradient in variable fluorescence (P-Fo = peak minus initial fluores- cence, a measure of Photosystem II activity) was found along the frond of C. crispus, the values increasing with distance from the thallus apex. No gradient was observed for Ulva sp. thalli. Nitrogen- or phosphorus-depleted Ulva sp. required a longer dark-conditioning period and had lower values of P-Fo than did controls. In contrast, no dif- ferences were found in P-Fo of N- or P-depleted C. crispus unless values were normalized to chl a. The irradiance his- tory of C. crispus strongly influenced P-Fo, even after dark-conditioning: P-Fo declined by about 70% as the mean daily natural irradiance increased between 2 February and 14 March 1986; a negative correlation was observed between P-Fo and the photon flux density I d prior to the measurement; P-Fo remained elevated when C. crispus was grown under a low photon flux density; and P-Fo decreased in thalli within 5 d of transfer from growth under natural irradiance to an incubator with artificial ir- radiance. Changes in variable fluorescence at different growth irradiances of C. crispus may be due to adaptive changes in the relative absorption cross-section of this alga. The influence of irradiance history on Ulva sp. was mini- mal in comparison.
Introduction
Macroalgae are of interest because of their importance in the energetics of coastal zones (Mann 1972) and in high
* Issued as NRCC No. 28730 ** Part of this study was carried out while employed by Focal
Marine Ltd., Bedford, Nova Scotia, Canada
productivity aquaculture (Shacklock et al. 1975, Bidwell et al. 1985, Craigie and Shacklock 1988). Accurate, rapid estimates of the growth rate and physiological condition of the plants are desirable for the successful management of a macroalgal resource. Existing approaches rely on measur- ing net changes in plant weight, oxygen evolution, carbon dioxide consumption, or 14C uptake. There are drawbacks to each of these techniques (Ramus 1981, Bidwell and McLachlan 1985, Berger and Bate 1986), not the least of which is the time required to carry out the procedure.
Here we measure the fluorescence induction of in vivo chl a to determine its utility in assessing the physiological condition of commercially important macroalgae. Fluores- cence induction (the "Kautsky effect") refers to the rapid (ms to s) change in fluorescence intensity measured after a dark-conditioned plant is exposed to an actinic (excitation) light source (Papageorgiou 1975, Krause and Weis 1984, Renger and Schreiber 1986). The phenomenon reflects the adjustments, observed as oscillations in fluorescence in- tensity, of the photosystems after an initial exposure to light (Horton 1985). The adjustments achieve a balanced flow of electrons between Photosystem II (PSII) and Photo- system I (PSI) such that the photosynthetic rate may be op- timized. Any factor ~hat changes the energy distribution between the photosystems, the concentration of electron acceptors, or interferes with the photoreduction or reoxi- dation of QA (the primary electron acceptor of PSII) should be reflected by a change in the pattern of fluorescence in- duction.
Such measurements have been used for more than 25 yr to study the basic mechanisms of photosynthesis (Pa- pageorgiou 1975, Govindjee etal. 1986). Recently, they have been applied to determine the photosynthetic capaci- ty of marine phytoplankton (Bates and Platt 1984, 1985, Falkowski and Kiefer 1985, Ishimaru et al. 1985), and the stress responses of plants to salinity (Bates and Cota 1987), temperature (Smillie and Hetherington 1983, 1984, Renger and Schreiber 1986), and toxic wastes (Benecke et al. 1982, Moody et al. 1983). ~fhe fluorescence induction responses

458 S.S. Bates and J. S. Craigie: Fluorescence induction in macroalgae
of Chondrus erispus and a green macroalgal competitor, Ulva sp. (Enright 1979), to changes in nutrient supply and irradiance history are reported below.
Materials and methods
Experiments were conducted at the Aquaculture Research Station of the National Research Council of Canada near Halifax, Nova Scotia (Neish et al. 1977). The seaweeds used were Chondrus crispus Stackhouse (diploid isolate NRCC-BH-D) (Shacklock and Craigie 1986), and Ulva sp. (Chlorophyceae) originating from culture tanks at Charlesville, Nova Scotia.
Growth conditions. Plants were maintained and experi- ments were carried out in an incubation chamber or in a greenhouse. Plants in the incubator were grown at 16 ~ in 10-1itre white polyethylene pails containing 8 litres of seawater at stocking densities ranging from 1.3 to 1.8 g 1 -~ (220 to 330 g m -2 surface area). A photon flux density of ca. 100 pE m -2 s -~ was provided by a bank of Cool-White fluorescent bulbs and four 60 W incandescent bulbs with a 14h light:10h dark cycle. The incandescent bulbs in- creased the photon flux density by about 14% in the wave- length region between 550 and 700nm. The seawater, supplemented with analytical grade nitrate and phosphate to give a final concentration of 1 m M and 0.1 raM, respec- tively, was changed about once every second day. The pH in the pails did not exceed 8.4 under continuous aeration.
In the greenhouse, Chondrus erispus and Ulva sp. were grown together in polyethylene tanks containing 40 Iitres of seawater at 14 ~ to 16 ~ and under natural irradiance supplemented with a floodlight (Halogen Diode PAR-38, Duro-Test) providing a combined photon flux density of about 300 p E m -2 s-L Total plant biomass ranged from 6.3 to 7.5 g 1 -~ (1.1 to 1.4 kg m-2). Fresh seawater flowed into the tanks at about 10 ml min-L The pH was maintained at 8.0 + 0.2 with a Signet pH controller by automatic addition of CO2. The plants were grown under three nutrient regi- mens supplemented with (1) nitrate (1 mM) plus phos- phate (0.1 raM); (2) phosphate only (0.1 raM); and (3) ni- trate only (1 mM). Nutrients were added about once every second day. To investigate two levels of irradiance, each tank was divided by a plastic mesh, and a neutral density screen was placed over one half of each tank to reduce the irradiance to 35% of the incident level.
Growth measurements. The growth rate of Ulva sp. was de- termined by measuring the increase in surface area of discs (initially 200 mm 2) excised with a cork borer from the cen- tral part of the thallus. The discs were held with an elastic thread on a coarse nylon screen in the growth tanks.
Chlorophyll a measurements. ChlorophyU was extracted from the excised 5 mm diameter discs used to obtain the fluorescence induction curves (see below under "Fluo-
. ~ I / I ~"////..A! t /
fl
Fig. 1. Polyvinyl chloride (PVC) device used to hold excitation/ detection probe of SF-10 induction fluorometer and seaweed sample holder in position. Diagram at lower right shows sample holder with 12 seaweed discs in place
rescence induction measurements"). Discs were extracted in 1.0 ml of methanol containing a trace of sodium carbon- ate in Vacutainer tubes at 11 ~ and in darkness for at least 3 h for Ulva sp., and at least 24 h for Chondrus crispus. Chl a concentration was calculated according to Jensen (1978).
Irradiance measurements. Photon flux density was mea- sured with a 2 ~ quantum meter (Model LI-188B, LI-COR, Lincoln, Nebraska). Natural irradiance was measured con- tinuously by a photovoltaic pyranometer (Model 1008, Rho Sigma, Inc.). Daily integrations of photon flux density were made with a compensating planimeter. The spectral distribution of light energy was measured using a spec- troradiometer (Model SR, Instrumentation Specialities Co., Lincoln, Nebraska).
Fluorescence induction measurements. Fluorescence in- duction curves were measured on 5 mm diameter discs ex- cised from within 1 to 2 mm of the apical tips of Chondrus crispus, and from the central region of Ulva sp. (see below). The excised discs had an average area of 23.8 4- 0.23 mm 2 (n = 4).
Up to 12 discs at a time were placed around the perim- eter of a specially-machined 4.5 cm diam. polyvinyl chlo- ride (PVC) sample holder having precisely-positioned marks for the discs (Fig. 1). The discs were maintained in position with a 202 ffm mesh-size Nitex screen held in place with a tight-fitting PVC collar. The sample holder was then placed into one side of a vertically-mounted 7.8 • 15.5 • 5 cm PVC block (Fig. 1). A probe, protected with a sheet of polyethylene, and holding the actinic fight source (see below), was fitted into the other side of the block. The openings for the probe and the sample holder were off-center, so that the sample holder could be rotated to expose each of the 12 discs in turn to the actinic beam while the other 11 discs remained in darkness. A flow (ca. 1 ml min -1) of filtered seawater kept the discs wet and oxygenated while positioned in the holder.

S.S. Bates and J. S. Craigie: Fluorescence induction in macroalgae 459
In vivo fluorescence induction of Chl a was measured at room temperature (20 ~ to 22~ with an induction fluorometer (Model SF-10, Richard Brancker Research Ltd., Ottawa). The unit (Schreiber et al. 1975) has a probe which incorporates an actinic light emitting diode (LED) providing relatively monochromatic light with a peak wavelength at ca. 670nm. Directly behind this is a photodiode sensor protected by a Coming CS 7-69 cut-off filter which excludes stray light, reflected light and fluores- cence at wavelengths below 710 nm. The actinic photon flux density used was 45/~E m -2 s -1 during 4 s of ir- radiance. The fluorescence induction signal was digitized with a DL-912 transient recorder (Data Laboratories Ltd., Surrey, England) coupled to a Hewlett-Packard HP-85 microcomputer for computations. The data were stored on a microdiskette (HP-9121 dual disk recorder).
The procedure was as follows: (1) Twelve discs were ex- cised from the algal thallus taken directly from the incuba- tor or greenhouse; (2) the discs were placed on the sample holder under subdued light (2 to 4 /~Em -a s-l); (3) the sample holder was positioned opposite the probe in the PVC block and the seawater flow was started; and (4) the dark conditioning period (5 to 60 min, see below) was given prior to obtaining a fluorescence induction signal.
When measurements were made in the presence of the photosynthetic inhibitor, DCMU, the discs were placed in 10 ml of DCMU (10 .5 M in filtered sea water diluted from a 10 .3 M ethanolic stock solution) for 5 min in darkness prior to being placed in the sample holder. Dark-con- ditioning and measurement of the fluorescence induction signal were carried out as above.
Zero adjustment of the fluorometer. It was difficult to find the proper zero baseline (signal with no actinic light) of the SF-10 induction fluorometer. Energy from the red LED excitation source reaches the photodiode in spite of the 710 nm cut-off filter (Schreiber et al. 1975). This spurious red signal could be significant relative to the weak fluores- cence signal which peaks at about 685 nm. The LED signal was therefore nulled by placing the excitation/sensor probe into the white Derlin probe holder built into the SF-10 control unit and adjusting the zero offset poten- tiometer to 0.8 mA. This arbitrary setting provided a zero baseline from which to relate successive measurements. The scattering signal is unknown because it is difficult to measure with the SF-10 fluorometer. This signal is assumed to be small and constant when samples of the same algal species are examined.
Fluorescence induction parameters. The following fluores- cence induction parameters (terminology after Pa- pageorgiou 1975), measured in the absence of DCMU, were computed (Fig. 2 a, c): Fo is the initial fluorescence in- tensity attained by the sample, measured 2 ms after ex- posure to the actinic light. This fluorescence originates from photochemically inactive chlorophylls not connected to ' the reaction center of Photosystem II (PSII), and that emitted from PSII when all of the electron traps (QA) are
"2
ft .
(a) p (b) /-ADcMU
F~ D , , Fo
t i ~ i L i i 0 I 2 3 4 0 I0 20 30 40 TIME (s) TIME (ms) ( C ) ~ p , , ( d ) ~ ~ ~ , ,
0 I 2 3 4 0 I 0 20 310 410 TIME Is) TIME (ms)
Fig. 2. Chondrus crispus and Ulva sp. Fluorescence induction curves measured in (a, c) absence, and (b, d) presence of photo- synthetic inhibitor, DCMU. Measurements in (a) and (c) were made after 55 rain of dark-conditioning; those in (b) and (d) were made after 8 rain in darkness. Fo: initial fluorescence intensity; I: intermediate peak; D: dip; P: peak fluorescence intensity; rate of fluorescence decrease between I and D (Slope 1); rate of fluo- rescence rise between D and P (Slope 2); Fmax : maximum fluores- cence intensity measured in presence of DCMU; ADCMU: area above the fluorescence induction curve measured in the presence of DCMU. Note different time scales for left- and right-side panels
"open" i.e., fully oxidized. I is the intermediate fluores- cence intensity, a result of equilibration between QA re- duction by PSII and" QA reoxidation by Photosystem I (PSI). D is the dip in fluorescence intensity, attributed to the oxidation of QA by PSI. P is the peak fluorescence in- tensity, achieved a s QA plus the electron acceptor pool of plastoquinone become reduced. P-Fo is the variable or in- duced fluorescence, responsive to changes in PSII activity by reflecting the amount of non-cyclic electron flow around PSII.
Two slopes were measured to further characterize the fluorescence induction curve (Fig. 2a): the rate of decline of the ID segment of the curve (Slope 1) (45 data points computed; t a = 0.90 to 0.98); and the rate of rise of the DP segment of the curve (Slope 2) (150 points computed; t a = 0.97 to 0.99). Slope 2 followed the same changes as did P-Fo (see Fig. 3b, c); the latter parameter is therefore generally reported. In Ulva sp., D, and therefore Slope 1, were not observed under our experimental conditions (Fig. 2 c).
The following parameters were computed when fluores- cence induction was measured in the presence of the in- hibitor, DCMU (Fig. 2b, d): Fo (see above). Fmax is the maximum fluorescence intensity attained, resulting from the "closing" of all the electron traps after QA is fully re- duced and prevented by DCMU from becoming reoxidized by PSI. ADCMO is the area above the fluorescence induction curve, measured after addition of DCMU, bounded by a vertical axis at Fo and a horizontal line at Fma x (Fig. 2 b). A DCMU is considered to be proportional to the concentra- tion of oxidized QA, the primary electron acceptor of PSII (Maklin et al. 1981).

460 S.S. Bates and J.S. Craigie: Fluorescence induction in macroalgae
laJ -0.1
._d 03
- 0 . 2
(a) 0--0-~0
\ o
\ o \ o
% \ ~ + ~ . + _ + _ + ~ + ~ + . ~ + / + -- + - +
, , , , , , , ~-?-?-?-~
0 . 2 _
W e,. 0.1 0 _1 u3
( b ) ~ _ + / + \ + . i + ~ + F ~
+/+...+_+/ /.o-o-;~+/+ 0
/ 0_0 iO
l I I I I I I I J
uJ 1.0 Z uJ
0.8 W
o o 0 . 6 ...J p LLO,
0.4 UJ ,...J rn
O.Z E. < > 0
0
/-_]_ -
+ / + ' ~ ' 4 ~ 1" /
o
' O ~ o /
0 ~ 0 ~ / ~
I I I I I I I I I I I I
I0 20 3 0 4 0 ,50 6 0
DARK TIME (rnin)
Fig. 3. Chondrus crispus. Effect of dark-conditioning time on fluo- rescence induction parameters measured in absence of DCMU. (a) Slope 1; (b) Slope2; and (c) variable fluorescence, P-Fo (see Fig. 2 for terminology). Samples were either taken directly from the greenhouse (natural irradiance) (o), or were pre-incubated in darkness for 1 h prior to the measurements (+). Each data point represents a different 50 mm diameter disc excised from the apical tip of plant
(o)
Fig. 4. Ulva sp. and Chondrus crispus. Thallus of (a) Ulva sp. and of (b) C. crispus showing numbered location from which discs were derived for fluorescence induction measurements shown in Table 1 and Fig. 5, respectively
Table 1. Ulva sp. Parameters of fluorescence induction curves from discs excised at locations on thallus shown in Fig. 4a. See Fig. 2 b for meaning of headings
Disc :~ Fo I D P P - F o Slope 2
1 0.42 0.71 0.71 1.38 0.96 0.33 2 0.25 0.49 0.47 1.24 0.99 0.42 3 0.24 0.47 0.46 1.25 1.01 0.43 4 0.35 0,62 0.61 1.40 1.04 0.45 5 0.27 0.52 0.52 1.25 0.99 0.41 6 0.27 0.52 0.52 1.26 1.00 0.43 7 0.25 0.50 0.49 1.22 0.97 0.41
8 0.33 0.62 0.60 1.34 1.01 0.41 9 0.31 0.58 0.57 1.33 1.02 0.40
10 0.28 0.54 0.53 1.32 1.04 0.36 11 0.34 0.61 0.60 1.34 1.10 0.45 12 0.34 0.64 0.64 1.43 1.09 0.43
13 0.38 0.66 0.64 1.48 1.11 0.46 14 0.38 0.67 0.65 1.43 1.04 0.44 15 0.39 0.70 0.68 1.47 1.08 0.43 16 0.40 0.71 0.70 1.42 1.02 0.44 17 0.35 0.66 0.64 1.43 1.07 0.43
18 0.30 0.58 0.57 1.32 1.02 0.40 19 0.36 0.67 0,66 1.42 1.06 0.41 20 0.37 0.60 0.59 1.36 0.99 0.39 21 0.33 0.64 0.63 1.37 1.04 0.41 22 0.35 0.66 0.65 1.41 1.06 0.42
23 0.35 0.64 0.63 1.33 0.99 0.41 24 0.35 0.64 0.63 1.37 1.02 0.42
Results
Dark-conditioning time. Excised Chondrus crispus discs re- quired at least 50 min in the dark for the fluorescence in- duction curve to develop the greatest absolute values of var iable fluorescence (P-Fo) and of Slopes 1 and 2 (Fig. 3). Dark condit ioning usually occurred while the seaweed discs were kept in the sample holder. The dark-condi t ion- ing time in the sample holder could be shortened to about 20 min if the discs were first kept in seawater in darkness for 1 h outside of the sample holder (Fig. 3). I r radia t ion of the discs with blue light ('~peak = 450 nm; 12 ktE m ~ s - I ) for 3 to 6 min did not significantly shorten the condi t ioning
period.
Fluorescence as a function o f the position on the thallus. Pa- rameters o f the fluorescence induction curve of Ulva sp. (Table 1) were similar regardless of the posi t ion of the ex- cised disc on the thallus (Fig. 4 a) except for disc :~ 1, ex- cised nearest the holdfast, which had slightly different val- ues of Fo, I, D, P-F~, and Slope 2 relative to the other 'discs (Table 1). In subsequent experiments, discs were taken from an area between 2 and 3 cm from the holdfast.
In contrast to Ulva sp., the fluorescence induct ion pa- rameters of Chondrus crispus exhibi ted a gradient from the apex to the base of the thallus. The locations of the discs on the thallus are shown in Fig. 4 b, and Fig. 5 shows the pa- rameters derived from the fluorescence induct ion curves

S. S. Bates and J. S. Craigie: Fluorescence induction in macroalgae
w
Z LU U 0') LU n -
O J b_
2 .0
1.0
x ~ " * X / x ~ x / ~////0
~/ . ~+~x / ~ + ~ 0 ~ ~0--0~ oX oX__o-o ~
I I I I I I I I I
0.5 2
0.4
Z 0.3 (..) (/3 ~ 0 . 2 0
0.1 t ,
0
(b%\ + X " " , X ~.,... X
0 N ~ + ~ + X \'~_~+_ \~ ~ ~--X~t~"
- - O - - O . ~ . ~ x o ~
~ 0 ~ 0
i l l l l l l l l
1.0
0.8
,,o 0.6 ~" 0.4
0.2
0
(c) 0/0~0
~176 % Ld
o/O / ~-0.1 0 / J r
-0.2 I I I I I I I I I
(d)
0
/ 0.~. /0/0
0"0--0~0/0 I I I I 1 I I I I
0.2
Od
bJ I 1 0 . 1 0 _J (/3
(e) ./o/O7~176
o/~176 0
I t l l l l l l l 0 0 1 2 3 4 5 6 7 8 9
DISC
10 7
s
4
J 2 I o
0
0 (f) /
0
. 0 ~ . , " 0 /
. O / O ~
0/0 ~0~
I l l l l l l l l 1 2 3 4 5 6 7 8 9
NUMBER
461
Fig. 5. Chondrus crispus. Fluorescence induction pa- rameters measured in the absence of DCMU, as a function of position along thallus (see Fig. 4b). (a) Fluorescence intensities of F o (o), 1 (+), D (zx) and P ( x ) (see Fig. 2 for terminology); (b) Chl a-normalized values of F o (o), I ( + ), D (zx) and P ( x ); (c) variable fluorescence, P-Fo; (d) Slope 1 (=rate of fluorescence decrease between I and D); (e) Slope 2 (=rate of fluorescence increase between D and P); (f) chla concentration per disc. Discs were dark-con- ditioned for ca. 60 min prior to measurement
obtained from these discs. A general increase in Fo, 1, D and P (Fig. 5 a), and in chl a per disc (Fig. 5 f) was seen in going from the apex toward the base. Values of variable fluorescence (Fig. 5 c), and of Slope 1 also increased toward the basal region (Fig. 5 d). Values of Slope 2 were generally greatest in the central part of the thallus, between the api- cal and basal regions (Fig. 5 e).
Light penetration through discs of different chl a con- tents and thicknesses was investigated using Chondrus cris- pus (Table 2). Values of Fo (not shown) and of the peak flu- orescence (P) increased when one to four relatively thin (0.24ram thick; 0.8/~g ch l a disc -~) apical tips were stacked. For thicker discs (0.31 m m thick; 1.4/~g ch la disc- 9 obtained 1.5 cm from the apical tip, P increased when up to three of the four discs were stacked. There was little change in P as the thickest discs (0.45 m m thick; 7.4/~g chl a disc -1) obtained 5 cm from the apical tip were stacked. These results suggest that the actinic fight penetrates through the upper and lower surfaces of at least four stacked discs excised from the apical tips.
Effects o f nutrient deficiency. Nitrogen deficiency in Ulva sp. resulted in a lower variable fluorescence and a longer period required for dark-conditioning, observed after 15 d of nutrient starvation (Fig. 6a). In contrast, phosphorus deficiency had no significant effect at this t ime (Fig. 6 a). By Day 21, the variable fluorescence of the nitrogen de- ficient Ulva sp. further decreased, and a decrease in vari- able fluorescence of the phosphorus deficient Ulva sp. be-
Table2. Chondrus crispus. Relationship between number of stacked discs excised from apical tip, 1.5 cm from apical tip, or 5 cm from apical tip and peak fluorescence (P); values are in volts (• n=3)
Number of Peak fluorescence stacked discs
Tip 1,5 cm 5 cm
1 0.91_+0.05 1.19+0.05 1.97_+0.05 2 1.20_+0.03 1.43+0.03 2.13-t-0.06 3 1.35_+0.03 1.61+0.02 2.00_+0.04 4 1.46__0.04 1.56+0.03 2.18_+0.05
came evident (Fig. 6 b). At this time there were still no vis- ible signs of phosphorus deficiency, although the growth rates of the nutrient deficient Ulva sp. discs had decreased relative to the control: 22.0+_1.08% d -1, 11.1__.0.62% d -z and 2.1_+0.36% d -~ for the + N + P c o n t r o l , - P discs, and - N discs, respectively.
In contrast to Ulva sp., Chondrus crispus showed no sig- nificant difference in variable fluorescence relative to the control after growing for 15 d without added phosphorus or nitrogen (Fig. 6c). After 53 d without added nutrients, only small differences in variable fluorescence were ob- served (Fig. 6d). At this t ime the nitrogen-deficient plants were obviously chlorotic. Differences between the nitrogen sufficient and deficient plants were observed only when P-Fo was normalized to chl a (Fig. 7 d).

(o) ,~ 1+-zt - + -~'.~+'+- + ,.0 ~>,.~_. \ ~ / \ . \~ ~ ,~
0 .8 ~/ # o 0 . 6 A /x-.. x
/X -- ~X X
0.4 / x~X/X~x ~x
,z, 0.2 x~X
(/~ 0 I I I I I I I I I I I I w
0
u_ ~ 0.8
m ~ 0.6
~" 0.4
0.2
0 0
(b) /+~+~+-+-+~+-+"+-+ /-§ +
x_x_x_x~XX xxxxxx ILlllltlllll
(d)
. . . . . 3'o' ; o ' 5' ' ' ' ' ' 'o ' 'o'5'o' 'o io 2o o o o io 20 3 4 6
DARK TIME (min)
Fig. 6. Ulva sp. and Chondrus crispus. Effect of nutri- ent deficiency and dark-conditioning time on variable fluorescence, P-Fo, of (a, b) Ulva sp., and (c, d) C. crispus. Measurements were made after (a, c) 15 d; (b) 21 d; and (d) 53 d of nutrient starvation. ( + ) = ni- trogen plus phosphorus sufficient plant; ( x ) = nitro- gen-depleted plant; (zx) = phosphorus-depleted plant
0.8
0.6
0 . 4
0.2
o o
J_ hi o 0.8 z LtJ
0.6 w
~ 0.4 . J u_
0.2 w . J m ,~ 0
(o) i,/,---,.., i.o
f,o 'o_o_o..O_o ~-o~..-.-"-.-'\ ~o.6
0.4
0.2
I I" I I I I I I I I I I O
IO 20 30 40 50 60 0 DARK T IME (rnin)
1215 1 5 5 1 4 1 5 ' 5 1 5
INCUBATION TIME (d)
0.4 T A
0.3 . d - r t ) .'7" 0.2
~. 0.1
0 t5
(b)
y...V v ~ . . ~ v ~ v
.,-,'~.,Jk / A~A
IO 20 30 40 50 60 DARK T I M E (rain)
�9 , ( d ) x \
~+~§ \x + -.---..,.....,~ +
' 2 5 i 315 i 415 L 5'5
iNCUBATION T I M E { d )
0.8
0.6
0.4
0.2
I I I J I I
0 0 20 40 60 80
C U M U L A T I V E I R R A D I A N C E (M,T-m -2)
~ 2 . 5
I 2.0
+x~ ~1.5
~ I.O
~ 0.5
I ' , , , i 0 I00 120 15
i + - - - - - _ . +
I I I I 25 3'5 g5 ;5
,NCU AT,ON T,ME , . ,
Fig. 7. Chondrus crispus. Effect of natural it- radiance in absence ( • and presence (+ ) of supplemental nitrogen, on (a to e) variable fluo- rescence, P-Fo, and on (f) Chl a concentration per disc. e-Fo for growth in (a) presence and (b) absence of nitrogen measured 15d (v ) ; 18d (�9 22 d (A); 29 d (o); 35 d (/,); 43 d ( ,7); and 53 d (I) from start of experiment (February 2). P-Fo normalized to (c) chl a or (d) not; (e) e-Fo as function of cumulative incident irradiance
Effects of irradiance level A decrease in var iable fluores- cence was observed during 2 Februa ry to 14 March incu- bat ion per iod for Chondrus crispus growing under na tura l i r radiance in the presence or absence of added ni trogen (Figs. 6c, d; 7a to d). The chl a content of the plants also decreased slightly over the same period, especially in the
nitrogen-deficient C. crispus (Fig. 7f). A strong negative correlation was found between P-Fo and the cumulative in- cident i r radiance for nitrogen-sufficient (r 2 = 0.945; n = 6) and ni trogen-deficient (F = 0.896; n = 6) plants (Fig. 7e). A negative correlat ion was also observed be- tween variable fluorescence and the photon flux density re-
S. S. Bates and J. S. Craigie: Fluorescence induction in macroalgae 463
0.5
0.4
u~ o.3 d_ ~ 0.2
z 0.1
~ 0
Q
~ 0.5
_.~ 0.4 m ~_ o . s
~ 0.2
0.I
(0} +/+..+ /~+ /" ~.+
_+/o+;/-'+.o.O-o_O.o_o-o +/o /
o /
(b)
_~,@_+/+ + +I+ + +
/0/~// ~'0~0--0~0~ 0 0 0/0~/+ / ~0/
+/'f
i i L q i i i i i i i i
(c)
+_+i+ -+--+-+ /+~
/+ /+ 0/0~0
0/0~ 0 0
/ 0/0
i i , i i i i i i 510 i i I0 20 30 40 60
(d)
/+•+/+\+_+•+ +/+
/0~0~0_0_0~0_0
L i i i i i i i L L i i I0 20 30 40 50 60
DARK TIME (rain)
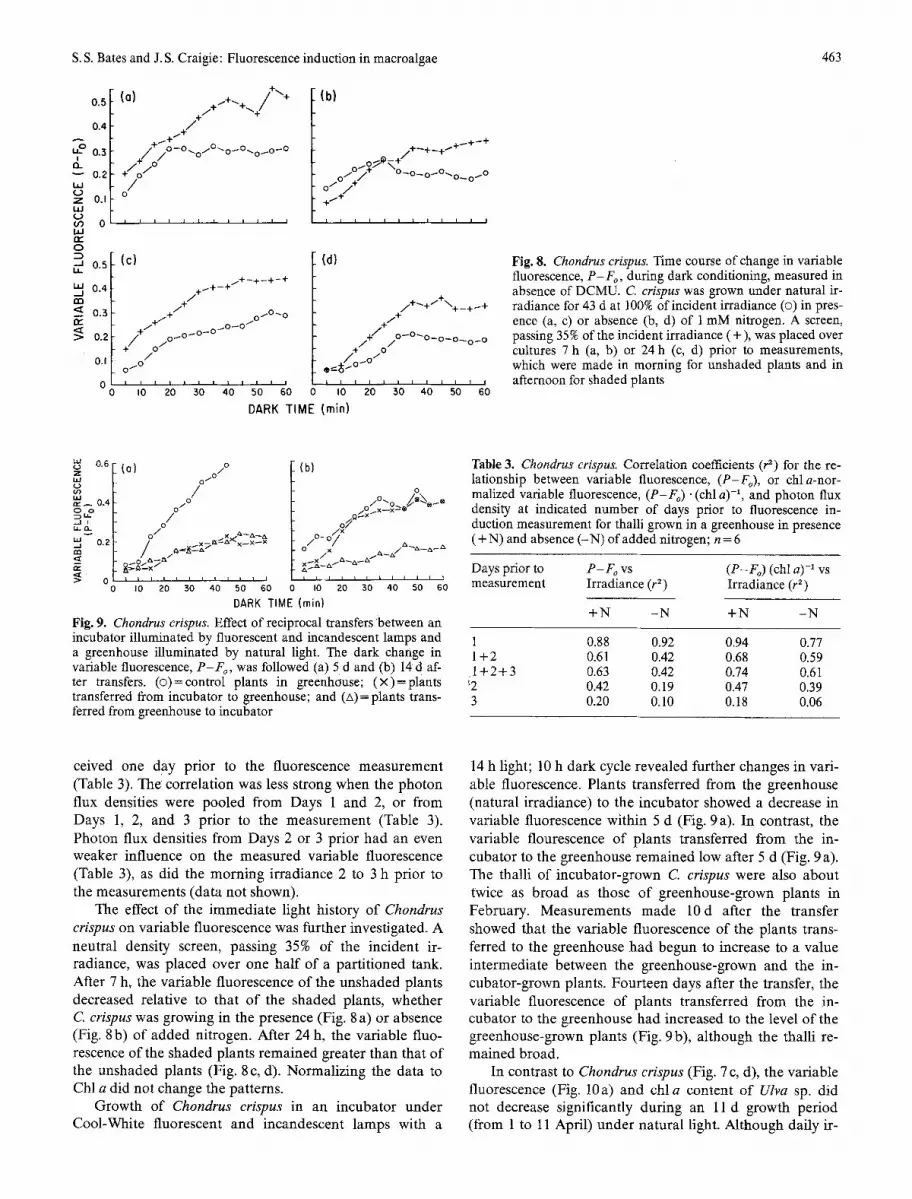
Fig. 8. Chondrus crispus. Time course of change in variable fluorescence, P - F o, during dark conditioning, measured in absence of DCMU. C erispus was grown under natural ir- radiance for 43 d at 100% of incident irradiance (�9 in pres- ence (a, c) or absence (b, d) of 1 mM nitrogen. A screen, passing 35% of the incident irradiance (+), was placed over cultures 7 h (a, b) or 24 h (c, d) prior to measurements, which were made in morning for unshaded plants and in afternoon for shaded plants
0.6
O9
~ 0.4 o~ .A i
~> 0 0
(o) o 0 I0/ /
o I~ /
(b)
o ..% f~_.
io •174 o ~ Q ~ x
o X x 0 / X ~ , ~ ,~ .~z~ /0~0~
o/~._~/?~ ~-x~-~'~x~x-x o x/X ~ - / ~ - ~
i i i i i I i i i i i i i i i 210 i i 410 i i i I0 20 30 40 50 60 0 I0 3i0 5i0 60
DARK TIME (rain)
Table 3. Chondrus crispus. Correlation coefficients (r 2) for the re- lationship between variable fluorescence, (P-Fo) , or chla-nor- malized variable fluorescence, (P-Fo) �9 (chl a) -1, and photon flux density at indicated number of days prior to fluorescence in- duction measurement for thalli grown in a greenhouse in presence (+N) and absence (-N) of added nitrogen; n = 6
Days prior to P-Fo vs (P-Fo) (chl a) -1 vs measurement Irradiance (r 2) Irradiance (r 2)
Fig. 9. Chondrus erispus. Effect of reciprocal transfers between an incubator illuminated by fluorescent and incandescent lamps and 1 a greenhouse illuminated by natural light. The dark change in 1 +2 variable fluorescence, P - F o, was followed (a) 5 d and (b) 14 d af- .1 + 2 + 3 ter transfers. (o) = control plants in greenhouse; ()<)=plants '~2 transferred from incubator to greenhouse; and (A) ---- plants trans- 3 ferred from greenhouse to incubator
+ N - N +N - N
0.88 0.92 0.94 0.77 0.61 0.42 0.68 0.59 0.63 0.42 0.74 0.61 0.42 0.19 0.47 0.39 0.20 0.10 0.18 0.06
ceived one day prior to the fluorescence measurement (Table 3). The correlation was less strong when the photon flux densities were pooled from Days 1 and 2, or from Days 1, 2, and 3 prior to the measurement (Table 3). Photon flux densities from Days 2 or 3 prior had an even weaker influence on the measured variable fluorescence (Table 3), as did the morning irradiance 2 to 3 h prior to the measurements (data not shown).
The effect of the immediate light history of Chondrus crispus on variable fluorescence was further investigated. A neutral density screen, passing 35% of the incident ir- radiance, was placed over one half of a partitioned tank. After 7 h, the variable fluorescence o f the unshaded plants decreased relative to that o f the shaded plants, whether C crispus was growing in the presence (Fig. 8 a) or absence (Fig. 8 b) of added nitrogen. After 24 h, the variable fluo- rescence of the shaded plants remained greater than that of the unshaded plants (Fig. 8 c, d). Normalizing the data to Chl a did not change the patterns.
Growth of Chondrus crispus in an incubator under Cool-White fluorescent and incandescent lamps with a
14 h light; 10 h dark cycle revealed further changes in vari- able fluorescence. Plants transferred from the greenhouse (natural irradiance) to the incubator showed a decrease in variable fluorescence within 5 d (Fig. 9 a). In contrast, the variable flourescence o f plants transferred from the in- cubator to the greenhouse remained low after 5 d (Fig. 9 a). The thalli of incubator-grown C. crispus were also about twice as broad as those o f greenhouse-grown plants in February. Measurements made 10d after the transfer showed that the variable fluorescence of the plants trans- ferred to the greenhouse had begun to increase to a value intermediate between the greenhouse-grown and the in- cubator-grown plants. Fourteen days after the transfer, the variable fluorescence of plants transferred from the in- cubator to the greenhouse had increased to the level of the greenhouse-grown plants (Fig. 9 b), although the thalli re- mained broad.
In contrast to Chondrus crispus (Fig. 7 c, d), the variable fluorescence (Fig. 10a) and c h l a content o f Ulva sp. did not decrease significantly during an 11 d growth period (from 1 to 11 April) under natural light. Although daily ir-

464 S.S. Bates and J.S. Craigie: Fluorescence induction in macroalgae
0.4 "7
0.3 J I o
0.2
' 0A t~
(a) ,~-._• j o - - ~ ~ \o S t x / \
x
320
7
2 4 0 / ~ E
0 160
u BO < v
(b)
.-_._o ,/
0 ,~ . . . . . . . ' 0 ' ' 0 ; ' ' 4 6 8 I 12 2
INCUBATION TIME (d)
Fig. 10. Ulva sp. Effect of incubation time for growth at 100% (o) and at 35% (x ) of incident irradiance on (a) variable fluorescence relative to chla, (P-Fo)'(chla) -1 measured in absence of DCMU; and (b) area above fluorescence induction curve relative to chl a, (AocMu) (chl a) -1, measured in presence of DCMU. Ulva sp. was grown under natural irradiance and with supplemental N and P. Variable fluorescence values and ADCMU were taken after 55 min and 7 rain, respectively, of dark-conditioning
I I I I I i I i I i
4 6 8 I0 12
radiance varied during this period, no relationship was ob- served between the irradiance history of UIva sp. and the variable fluorescence of this species.
Shading Ulva sp. (starting on 1 April) to 35% of the in- cident irradiance did not change values of variable fluores- cence relative to the unshaded plants (Fig. 10 a), in contrast to Chondrus crispus (Fig. 8). The chla-normalized area above the fluorescence induction curve, (ADcMu) (chla) -1, likewise did not decrease over the incubation period (Fig. 10b). Values for the shaded population were initially greater than for the unshaded population.
Discussion
Fluorescence induction techniques are being increasingly used to obtain information about the growth tolerances of plants (Moody et al. 1983, Smillie and Hetherington 1983, Krause and Weis 1984, Renger and Schreiber 1986, Bates and Cota 1987). The technique provides rapid results and can be relatively easily applied to diverse situations. How- ever, the approach requires that the sample be properly conditioned prior to measurement (Bates 1985), and that the fluorescence induction signal be carefully interpreted. Proper interpretation of the signal may depend on the algal group studied (e.g. green vs red algae), the area of the algal thallus from which the sample disc is excised, the length of the dark-conditioning period, the actinic irradiance, and the growth irradiance history.
Fluorescence gradients along the algal thallus. Discs excised from different areas of the Ulva sp. thallus (Fig. 4a) showed similar fluorescence induction parameters (Table 1) with the exception of the disc excised nearest the hold- fast. These findings reflect the fact that similar cells are produced over the entire thallus, except near the holdfast where they are morphologically and presumably physi- ologically distinct.
The fluorescence induction gradient in thalli of Chon- drus crispus (Fig. 5) may reflect a gradient in growth, as new growth is primarily from the apical tips (Strrmgren
and Nielsen 1986). Evidence is accumulating that in C. crispus, in contrast to Ulva sp., low values of variable fluorescence are associated with elevated growth rates (Bates unpublished data). This can be deduced from Fig. 7c, where variable fluorescence declined from 2 February to 14 March, in parallel with an increase in growth irradiance. Low values of variable fluorescence at the apical tip (Fig. 5 c) may therefore reflect the more rapid growth in that region of the thallus. As the basal (oldest) portion of the thallus is approached, variable fluorescence may decline due to a relative increase in self-quenching of fluorescence caused by the large increase in chl a Fig. 5 f).
Sample discs for Chondrus crispus were routinely ex- cised from within 1 to 2 mm of the apical tips, a convenient reference point on the thallus. A consistent sampling posi- tion is important because of the gradient in fluorescence parameters and in chla concentration (Fig. 5). Because the apical tip is also the region of new growth, it may re- flect recent environmental stresses experienced by the alga. Furthermore, epiphytes, which become more significant near the base of the thallus, may contaminate the fluores- cence induction signal in that region.
Dark-conditioning. When an algal sample is taken directly from an illuminated growth environment, its fluorescence induction curve is generally relatively flat (i.e., it exhibits low variable fluorescence, P-Fo) because the alga is photo- synthesizing at a steady state in the light. In this condition, the PSII electron acceptors QA and plastoquinone are par- tially photoreduced, energy is optimally distributed be- tween the two photosystems, and the thylakoid membranes are "energized" (Papageorgiou 1975, Horton 1985, Fork and Satoh 1986). Each of these factors contributes to the quenching of fluorescence intensity. The plant sample is therefore first dark-conditioned to dissipate these quench- ing factors such that variable fluorescence is increased to a maximum, and the effects of the immadiate light history are eliminated.
After several minutes in darkness, QA becomes re- oxidized by PSI, the ApH across the thylakoid membrane is dissipated (Horton 1986), and a transition may occur from the low fluorescence of State 2 to the higher fluores- cence of State 1 (Fork and Satoh 1986). However, longer relaxation times are required for the observed slower in- crease in variable fluorescence (Figs. 3; 6; 7a, b). One fac- tor that may play a role during a longer-term (tens of min- utes) dark-conditioning period is the dark epoxidation of zeaxanthin to form violaxanthin (the "xanthophyll cycle"). Zeaxanthin is a quencher of fluorescence, and is synthe- sized in the presence of high irradiance (Demmig et al. 1987). The stoichiometric conversion between zeaxanthin and violaxanthin is almost complete after about 35 min (Demmig et al. 1987), the same time-scale required for the development of maximum fluorescence values in UIva sp. (Fig. 6 a, b). Analogous cycles may take place, but on a slightly longer time scale, in Chondrus crispus (Fig. 6 c).
Responses to nutrient deficiency. The responses to nutrient deficiency in Ulva sp. and in Chondrus crispus were clearly

S. S. Bates and J. S. Craigie: Fluorescence induction in macroalgae 465
different. Ulva sp. responded with a decrease of about 80% in variable fluorescence (Fig. 6 b), and in Slope 2. Variable fluorescence and Slope 2 are directly related to the electron transport capacity through PSII (Smillie and Hetherington 1984). In Ulva sp. the decrease in variable fluorescence im- plies a decrease in the available pool size of QA or of plas- toquinone. This may be due to a decrease in the ability of electron acceptors on the acceptor side of PSII to reoxidize QA o r plastoquinone. A second effect of nitrogen limitation was to almost double the time required for full dark-con- ditioning (Fig. 6a). This may result from an impairment in the operation of the xanthophyll cycle.
The more dramatic response of Ulva sp. to nutrient de- ficiency compared to Chondrus erispus suggests that dif- ferent strategies are used to deal with nutrient starvation. The thallus of Ulva sp. is distromatic, in contrast to the much thicker multicellular thallus of C. crispus. It is pos- sible that C. crispus is able to mobilize nitrogen and phos- phorus from compounds in other regions of the thallus to sustain the functioning of the photosynthetic apparatus during periods of nutrient deficiency. One such compound may be the light-harvesting phycobiliprotein, phy- coerythrin, which can serve as a nitrogen reserve for red and blue-green algae (Gantt 1975, Wyman et al. 1985). Ulva sp. must deal with nutrient deficiency using other strategies.
q-he decrease in the variable fluorescence of nitrogen- and phosphorus-deficient Chondrus crispus is not due en- tirely to nutrient starvation, as the variable fluorescence of the control plants also declined during a 53 d incubation period (Figs. 6 c, d; 7 c, d). Irradiance level is one variable that may be more important than nutrient concentration in controlling the variable fluorescence of C crispus.
Response to irradiance history. The fluorescence induction characteristics of Chondrus crispus more strongly reflect its irradiance history than its nutrient history. On the long- term (2 February to 14 March), and on the short-term (1 d), a negative correlation exists between the variable flu- orescence of C. erispus and incident irradiance level (Figs. 7e; 8; Table 3). The seasonal component of ir- radiance may be more important relative to the daily com- ponent in influencing variable fluorescence. The data sug- gest that C. crispus is capable of reorganizing its photo- synthetic apparatus, even during periods of nitrogen depri- vation, to optimize growth when irradiance levels change daily. The rapidity with which the variable fluorescence of C. crispus altered in response to a daily change in ir- radiance level (Fig. 8) suggests that the number of thy- lakoids or phycobilisomes per plant is not changing (cf. Raps et al. 1985), at least initially.
Another indication that irradiance influences fluores- cence induction is shown in Fig. 9. The transfer of Chon- drus crispus from natural irradiance to fluorescent plus in- candescent irradiance resulted in a decrease in variable flu- orescence within 5 d. Growth rate increased after transfer to the incubator. The reciprocal transfer from the incubator
to natural illumination resulted in a significant increase in variable fluorescence, but only after 14 d (Fig. 9 b). This in- dicates that there is a hystereis in the fluorescence response of C crispus to shifts in irradiance, as been found for the photosynthetic response of cyanobacteria (Post 1986). The observed decrease in variable fluorescence upon transfer from the greenhouse to the incubator may be due to dif- ferences in irradiance quality and/or quantity. From the present data, we are unable to resolve which of these fac- tors is more important.
It appears that the variable fluorescence of Chondrus crispus is inversely related to irradiance (Figs. 7e; 8; 9; Table 3), and that growth rate is directly related to it- radiance (Enright and Craigie 1981). Variable fluorescence of C. crispus is therefore inversely proportional to growth rate under the present measuring conditions. One possible reason for this relationship is that the relative absorption cross-section for PSII (i.e., the effective size of the antennae serving PSII) may change with growth irradiance. A shift to a higher growth irradiance often causes an adaptive de- crease in the absorption cross-section (Dubinsky et al. 1986). Given a constant actinic photon flux density, this would result in a lower fluorescence output for the smaller absorption cross-section, measured in the absence of DCMU; more light is required to achieve the maximum fluorescence with a smaller cross-section. Supporting evi- dence for this comes from recent measurements of the rela- tive absorption cross-section of C. crispus growing at about 100 BE m -2 s -1. Values, measured with blue-green actinic light from a "double flash" fluorometer (Falkowski et al. 1986), were an order of magnitude lower than those of the green phytoplankter, Dunaliella tertiolecta (Kolber and Falkowski unpublished data). With our SF-10 fluorometer system, therefore, the observed change in variable fluores- cence may reflect a change in relative absorption cross-sec- tion, which in turn is related to electron flow. A higher ac- tinic photon flux density than is possible with the SF-10 may be necessary to completely saturate PSII fluorescence of C. crispus growing at high irradiance levels.
The interpretation of the fluorescence induction curve of Ulva sp. seems less complicated than that of Chondrus crispus. Properties of the induction curve of Ulva sp. reflect the physiology of the alga grown under different nutrient (Fig. 6a, b) or irradiance (Figs. 10, 11) conditions. No correlation was found between the value of P-Fo and the previous photon flux density. Variable fluorescence re- mained relatively constant during an 11 d incubation peri- od (Fig. 10a), in spite of daily variations in photon flux density. Decreasing the growth irradiance to 35% of the in- cident value did not significantly decrease variable fluores- cence. These results suggest that the actinic light level used was close to saturation. The shaded Ulva sp. nevertheless showed an increase in chl a-normalized ADCMU (Fig. 10b), suggesting physiological changes that accompany shade adaptation. Biomass in the unshaded tank increased sig- nificantly during the experiment; this may be reflected in a slow increase in (ADcMU) (chl a) -1, perhaps because of self- shading.

466 S.S. Bates and J. S. Craigie: Fluorescence induction in macroalgae
Acknowledgements. We thank L. Staples for technical assistance and discussions, P. F. Shacklock, P. G. Falkowski, R. Popovic and T. Platt for commenting on the manuscript, and the Bedford Insti- tute of Oceanography for constructing the sample holder and for the loan of instruments. S. B. was a Guest Scientist at the Atlantic Research Laboratory during this study. Funding was provided by the National Research Council of Canada, the Department of Fisheries and Oceans, and Supply and Services Canada under the Unsolicited Proposals program of the Government of Canada.
Literature cited
Bates, S. S. (1985). Sample preconditioning for measurement of fluorescence induction of chlorophylI a in marine phy- toplankton. J. Plankton Res. 7:703-714
Bates, S. S., Cota, G. F. (1987). Fluorescence induction and photo- synthetic responses &Arctic ice algae to sample treatment and salinity. J. Phycol. 22:421-429
Bates, S. S., Platt, T. (1984). Fluorescence induction as a measure of photosynthetic capacity in marine phytoplankton: response of Thalassiosira pseudonana (Bacillariophyceae) and Dunaliella tertiolecta (Chlorophyceae). Mar. Ecol. Prog. Ser. 18:67-77
Bates, S. S., Platt, T. (1985). Fluorescence induction of chlorophyll a in the Sargasso Sea and on the Grand Banks: Correlation with photosynthetic activity. Mar. Ecol. Prog. Ser. 27:29-38
Benecke, G., Falke, W., Schmidt, C. (1982). Use of algal fluores- cence for an automated biological monitoring system. Bull. en- viron. Contam. Toxicol. 28:385-395
Berger, M. G., Bate, G. C. (1986). Measurement of photosynthetic rate in marine macrophytes, a comparison of carbon based methods. Bot. mar. 29:177-183
Bidwell, R. G. S., McLachlan, J. (1985). Carbon nutrition of sea- weeds: Photosynthesis, photorespiration and respiration. J. exp. mar. Biol. Ecol. 86:15-46
Bidwell, R. G. S., McLachlan, J., Lloyd, N. D. H. (1985). Tank cultivation of Irish moss, Chondrus crispus Stackh. Bot. mar. 28:87-97
Craigie, J. S., Shacklock, P. F. (1988). Culture of Irish moss. In: Boghen, A. (ed.) Cold water aquaculture in Atlantic Canada. (In press)
Demmig, B., Winter, K., Krtiger, A., Czygan, F.-C. (1987). Photoinhibition and zeaxanthin formation in intact leaves. A possible role of the xanthophyll cycle in the dissipation of ex- cess light energy. Plant Physiol. 84:218-224
Dubinsky, Z., Falkowski, P. G., Wyman, K. (1986). Light harvest- ing and utilization by phytoplankton. Plant Cell Physiol 27: 1335-1349
Enright, C. (1979). Competitive interaction between Chondrus crispus (Florideophyceae) and Ulva lactuca (Chlorophyceae) in Chondrus aquaculture. Proc. int. Seaweed Symp. 9:209-218
Enright, C., Craigie, J. S. (1981). Effects of temperature and Jr- radiance on growth and respiration of Chondrus crispus Stackh. Proc. int. Seaweed Syrup. 10:271-276
Falkowski, P., Kiefer, D. A. (1985). Chlorophyll a fluorescence in phytoplankton: relationship to photosynthesis and biomass. J. Plankton Res. 7:715-731
Falkowski, P. G., Wyman, K., Ley, A. C., Mauzerall, D. C. (1986). Relationship of steady-state photosynthesis to fluorescence in eucaryotic algae. Biochim. biophys. Acta 849: 183-192
Fork, D. D., Satoh, K. (1986). The control by state transitions of the distribution of excitation energy in photosynthesis. Annu. Rev. Plant Physiol. 37:335-361
Gantt, E. (1975). Physiological and ultrastructural changes on ni- trogen deprivation: Disappearance and reappearance of phy- cobilisomes. J. Phycol. 11 (Suppl.): 14
Govindjee, Amesz, J., Fork, D. C. (eds.) (1986). Light emission by plants and bacteria. Academic Press, New York
Horton, P. (1985). Interactions between electron transfer and car- bon assimilation. In: Barber, J., Baker, N. R. (eds.) Photo-
synthetic mechanisms and the environment. Elsevier, New York, p. 135-187
Ishimaru, T., Mimuro, M., Fujita, Y. (1985). Estimation of phy- toplankton photosynthesis using a fluorescence induction tech- nique. J. Plankton Res. 7:679-689
Jensen, A. (1978). Chlorophylls and carotenoids. In: Hellebust, J. A., Cralgie, J. S. (eds.). Handbook of phycological methods. Cambridge Univ. Press, New York, p. 59-70
Krause, G. H., Weis, E. (1984). Chlorophyll fluorescence as a tool in plant physiology. IL Interpretation of fluorescence signals. Photosynth. Res. 5:139-157
Malkin, S., Armond, P. A., Mooney, H. A., Fork, D. C. (1981). Photosystem II photosynthetic unit sizes from fluorescence in- duction in leaves. Correlation to photosynthetic capacity. Plant Physiol. 67:570-579
Mann, K. H. (1972). Ecological energetics of the seaweed zone in a marine bay on the Atlantic coast of Canada. II. Production of the seaweeds. Mar. Biol. 14:199-209
Moody, R. P., Weinberger, P., Greenhalgh, R. (1983). Algal fluoro- metric determination of the potential phytotoxicity of en- vironmental pollutants. In: Nriagu, J. O. (ed.). Aquatic toxi- cology. John Wiley and Sons, New York, p. 503-512
Neish, A. C., Shacklock, P. F., Fox, C. H., Simpson, F. J. (1977). The cultivation of Chondrus crispus. Factors affecting growth under greenhouse conditions. Can. J. Bot. 55:2263-2271
Papageorgiou, G. (1975). Chlorophyll fluorescence: An intrinsic probe of photosynthesis. In: Govindjee (ed.). Bioenergetics of photosynthesis. Academic Press, New York, p. 319-371
Post, A. F. (1986). Transient state characteristics of adaptation to changes in light conditions for the cyanobacterium Oseillatoria agardhii. I. Pigmentation and photosynthesis. Arch. Microbiol. 145:353-357
Ramus, J. (1981). The capture and transduction of light energy. In: Lobban, C. J., Wynne, M. J. (eds.). The biology of seaweeds. University of California Press, Berkeley, p. 458-492
Raps, S., Kycia, J. H,, Ledbetter, M. C., Siegelman, H. W. (1985). Light intensity adaptation and phycobilisome composition of Microcystis aeruginosa. Plant Physiol. 79:983-987
Renger, G., Schreiber, U. (1986). Practical applications for fluoro- metric methods to algae and higher plant research. In: Govindjee, Amesz, J., Fork, D. C. (eds.). Light emission by plants and bacteria. Academic Press, New York, p. 587-619
Schreiber, U., Groberman, L., Vidaver, W. (1975). Portable, solid- state fluorometer for the measurement of chlorophyll fluores- cence induction in plants. Rev. Sci. Instrum. 46:538-542
Shacklock, P. F., Craigie, J. S. (1986). Winter survival and growth of Chondrus crispus in onshore culture tanks. Can. J. Fish. aquat. Sci. 43:263-268
Shacklock, P. F., Robson, D. R., Simpson, F. J. (1975). Vegetative propagation of Chondrus crispus (Irish moss) in tanks. Tech. Rep. No. 21, Atlantic Research Laboratory, National Research Council of Canada, Halifax, Nova Scotia
Smillie, R. M., Hetherington, S. E. (1983). Stress tolerance and stress-induced injury in crop plants measured by chlorophyll fluorescence in vivo. Chilling, freezing, ice cover, heat, and high light. Plant Physiol. 72:1043-1050
Smillie, R. M., Hetherington, S. E. (1984). A screening method for chilling tolerance using chlorophyll fluorescence in vivo. In: Sybesma, C. (ed.). Advances in photosynthesis research, Vol. 4, Dr. W. Junk Publ, The Hague, p. 471-474
Strtmgren, T., Nielsen, M. V. (1986). Effect of diurnal variations in natural irradiance on the apical length growth and light satu- ration of growth in five species of benthic macroalgae. Mar. Biol. 90:467-472
Wyman, M., Gregory, R. P. F., Carr, N. G. (1985). Novel role for phycoerythrin in a marine cyanobacterium, Synechoccus Strain DC2. Science, N. Y. 230:818-820
Date of final manuscript acceptance: March 1, 1988. Communicated by R. W. Doyle, Halifax


