Embed Size (px)
Citation preview

DSGD DISCUSSION PAPER NO. 5
Development Strategy and Governance Division
International Food Policy Research Institute 2033 K Street, N.W.
Washington, D.C. 20006 U.S.A. http://www. ifpri.org
April 2004
Copyright © 2004 International Food Policy Research Institute
DSGD Discussion Papers contain preliminary material and research results, and are circulated prior to a full peer review in order to stimulate discussion and critical comment. It is expected that most Discussion Papers will eventually be published in some other form, and that their content may also be revised.
FOOD AID FOR MARKET DEVELOPMENT IN SUB-SAHARAN AFRICA
Awudu Abdulai, Christopher B. Barrett, and Peter Hazell


�i�
ACKNOWLEDGEMENTS
The authors thank Nana Boateng and Dominique Aubert for research assistance
and Isabelle Schluep, Dan Maxwell and seminar participants at IFPRI for comments on
an earlier draft. Any remaining errors are solely our responsibility. Finally, we thank
USAID for funding this research as part of IFPRI�s analytical support to the U.S.
Initiative to End Hunger in Africa (IEHA).

�ii�

�7�
TABLE OF CONTENTS
ACKNOWLEDGEMENTS................................................................................................. I
TABLE OF CONTENTS.................................................................................................... 7
LIST OF TABLES.............................................................................................................. 8
ABSTRACT........................................................................................................................ 9
1. INTRODUCTION ......................................................................................................... 11
2. TRENDS IN FOOD AID SHIPMENTS TO SUB-SAHARAN AFRICA .................................. 17
3. CONCEPTUAL ISSUES REGARDING THE POTENTIAL IMPACT OF FOOD AID ............... 22 3.1 Food Price Impacts ......................................................................................... 22 3.2. Factor Market Effects ..................................................................................... 24 3.3. Risk Management Effects .............................................................................. 26 3.4 Some Empirical Evidence on the Producer Incentives Effects....................... 29
4. FOOD AID AND AGRICULTURAL DEVELOPMENT IN SUB-SAHARAN AFRICA............. 31 4.1 Food Markets in Sub-Saharan Africa ............................................................. 31 4.2. Analysis of Relationship Between Food Aid and Food Production ............... 32
5. IMPLICATIONS FOR FUTURE FOOD AID POLICIES ...................................................... 36 5.1 Food Aid for Market Development................................................................. 36 5.2 Food Aid For Smallholder Productivity Enhancement................................... 43 5.3 Conditions for Success.................................................................................... 44
6. CONCLUSIONS........................................................................................................... 46
REFERENCES ...................................................................................................................... 48
TECHNICAL APPENDIX ....................................................................................................... 53
LIST OF DISCUSSION PAPERS.............................................................................................. 57

�8�
LIST OF TABLES
1. Composition of Food Aid Shipments to Africa by Commodity (annual average, metric tons)��.�����������������.. 13
2. Food Aid Shipments to Selected African Countries in 1990-2002 (1000 metric tons)���..�������������������..14

�9�
ABSTRACT
Food aid remains significant for food availability in many low-income countries
in sub-Saharan Africa, helping to reduce the gap between food consumption needs and
supply from domestic production and inventories and commercial imports. Food aid
remains a contentious subject, however, and there have been many recent pleas for more
effective use of the resource. This study explores how food aid might be used for
domestic food market development to facilitate poverty alleviation and economic growth.
There are obvious risks to using food aid for market development, just as there have
been in using food aid to try to stimulate agricultural development. Because food aid
necessarily expands local food supply, it needs to be well targeted if adverse producer price
effects are to be avoided. In particular, if food aid can be targeted so as to relieve short-term
working capital and transport capacity constraints to the development of downstream
processing and distribution capacity in recipient country food marketing channels, for
example by helping build farmer cooperative groups, then food aid could have salutary
effects on sub-Saharan African agriculture.

�10�

�11�
FOOD AID FOR MARKET DEVELOPMENT IN SUB-SAHARAN AFRICA
Awudu Abdulai, Christopher Barett, and Peter Hazell ∗
1. INTRODUCTION
The importance of agricultural development for poverty reduction and economic
growth in sub-Saharan Africa has been widely acknowledged and accepted (Abdulai and
Delgado, 1995). There is likewise consensus on the need for continued improvements in
rural factor and product markets so as to create incentives for African farmers to invest in
the improved production technologies and natural resources management practices
necessary for agricultural development and for non-farm businesses to invest in post-
harvest processing and other value-adding activities necessary to stimulate the rural
nonfarm economy in sub-Saharan Africa (Kherellah et al. 2002). Yet cash resources
available to support agricultural and rural nonfarm economic development have declined
precipitously over the past fifteen years (Barrett and Carter 2002). To what extent might
food aid � which is often a more readily available resource for development
programming � be useful in stimulating necessary market development in Sub-Saharan
Africa? That is the question we address in this paper.
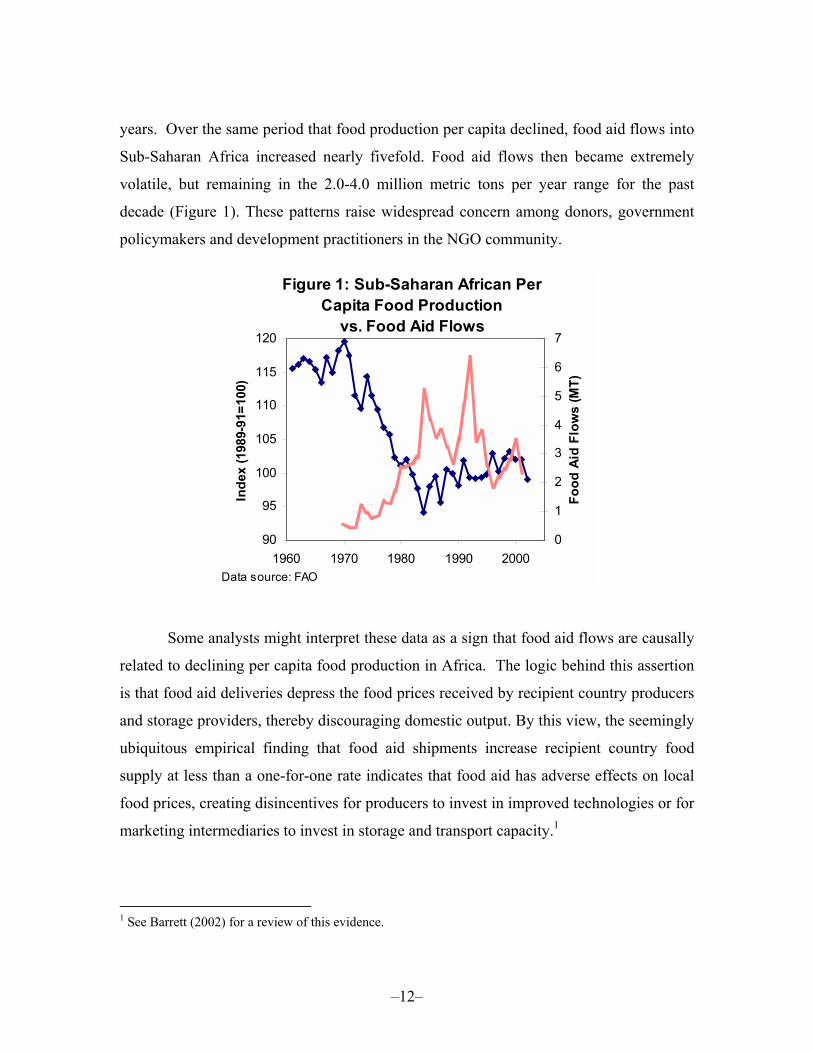
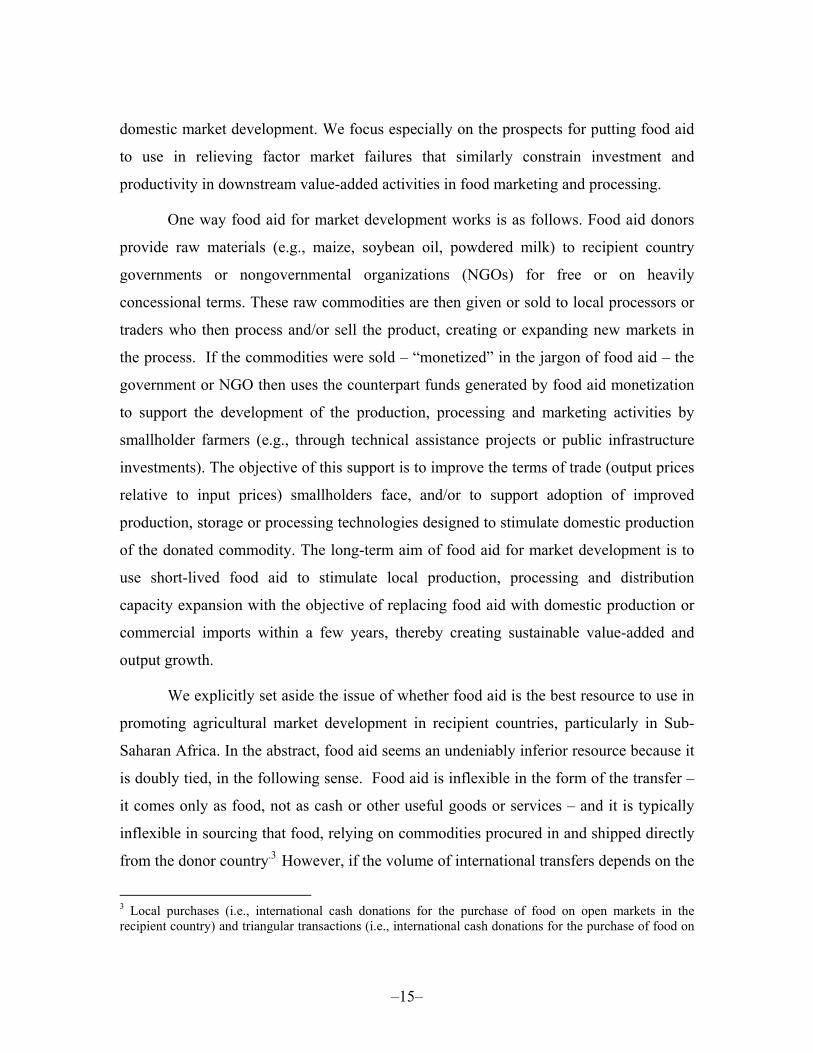
Precipitous decline in per capita food production from the early 1970s through the
mid-1980s (Figure 1) was both cause and consequence of generalized economic collapse
on the continent. While there has been modest recovery over the past fifteen years,
overall food production in Sub-Saharan Africa remains almost 20 percent below the early
1970s� levels in per capita terms and has been trending down again for the past three
∗Awudu Abdulai, University of Kiel, Kiel, Germany Christopher B. Barrett, Cornell University, Ithaca, NY, USA Peter Hazell, International Food Policy Research Institute, Washington, DC, USA
�12�
years. Over the same period that food production per capita declined, food aid flows into
Sub-Saharan Africa increased nearly fivefold. Food aid flows then became extremely
volatile, but remaining in the 2.0-4.0 million metric tons per year range for the past
decade (Figure 1). These patterns raise widespread concern among donors, government
policymakers and development practitioners in the NGO community.
Figure 1: Sub-Saharan African Per Capita Food Production
vs. Food Aid Flows
90
95
100
105
110
115
120
1960 1970 1980 1990 2000
Inde
x (1
989-
91=1
00)
0
1
2
3
4
5
6
7
Food
Aid
Flo
ws
(MT)
Data source: FAO
Some analysts might interpret these data as a sign that food aid flows are causally
related to declining per capita food production in Africa. The logic behind this assertion
is that food aid deliveries depress the food prices received by recipient country producers
and storage providers, thereby discouraging domestic output. By this view, the seemingly
ubiquitous empirical finding that food aid shipments increase recipient country food
supply at less than a one-for-one rate indicates that food aid has adverse effects on local
food prices, creating disincentives for producers to invest in improved technologies or for
marketing intermediaries to invest in storage and transport capacity.1
1 See Barrett (2002) for a review of this evidence.

�13�
There are a number of reasons to be concerned that Sub-Saharan Africa may be
particularly vulnerable to the adverse impacts mentioned above. First, relative to Asian
governments, Sub-Saharan African governments have historically placed low priority on
improving agricultural performance. For instance, the share of government expenditure
allocated to agriculture in Asia was 15 percent and 10 percent in 1980 and 1998,
respectively, while the corresponding shares in Africa were only 6 percent and 5 percent,
respectively (Fan and Rao, 2003). Second, as pointed out by Eicher (1988), the region�s
capacity to deal with food security and poverty is constrained by political instability and
shortage of scientific expertise.
Other characteristics of production and marketing systems may diminish or
overshadow the hypothesized disincentive effects of food aid. In particular, the semi-arid
areas of the Sahel and Eastern and Southern Africa rely on unimodal seasonal production
with relatively little irrigation. As noted by Mellor (1985), the agroclimatic and
technological conditions that dominate African agriculture tend to cause low labor
productivity and labor scarcity in peak seasons. Under such conditions, the withdrawal of
labor from food production tends to cause more rapid decline in food production in the
region than in Asia (Lele, 1984). Given one planting season, the production pattern is
more vulnerable to climatic and other disruption, resulting in a high variance in yield.
Moreover, supporting services such as access to credit for farmers, ineffective seed
distribution networks and poorly developed infrastructure contribute to low adoption of
advanced technologies. These characteristics tend to dampen the responsiveness of food
production to producer price incentives, calling into question the disincentive effects of
food aid on Sub-Saharan African agriculture.
This leads directly to an opposing perspective on the food aid � food productivity
relationship, which holds that increased food aid has been and could prospectively be
beneficial to African agriculture. The logic behind this line of argument emphasizes food
aid�s role in increasing poor households� access to and consumption of food in the face of
exogenous climatic or political shocks, thereby improving human nutritional status,

�14�
health, labor productivity and income earning capacity relative to what would transpire in
the absence of food aid.
Whether rising food aid shipments to Sub-Saharan Africa positively or negatively
affect local agricultural development and poverty reduction turns largely on the effects of
food aid on recipient country food production and downstream processing and marketing
patterns. These in turn depend to a large extent on how well donors and operational
agencies manage food aid shipments in terms of targeting, timing, etc., and whether the
domestic political, and institutional environment in recipient countries is conducive to
efficient utilization of food aid as a development tool.
In the face of well-known impediments to African rural markets that restrict the
timely flow of purchased inputs to African smallholders and limit value-added processing
and the share of retail food prices received by farm producers (Kherellah et al. 2002),
food aid targeted effectively at downstream market development might effectively
stimulate food production, agricultural development, poverty alleviation and economic
growth in recipient countries. This underscores the importance of factor market failures
in limiting productivity in Africa as well as the centrality of food aid management
modalities to making it an effective instrument. If food aid has had a positive effect on
balance on aggregate food productivity in Sub-Saharan Africa, in spite of the well-known
producer price disincentive effects of food aid and plenty of horror stories in particular
cases of poorly managed shipments,2 then plainly food aid can and often does play a
significant off-setting role in relieving constraints that otherwise limit productivity in
smallholder systems. If those food aid management lessons can be learned and replicated
more broadly (Barrett and Maxwell forthcoming), this then raises the intriguing prospect
of putting food aid flows to use in support of broader agricultural market development
objectives in Sub-Saharan Africa.
To date, most attention has focused on food aid�s effects on primary agricultural
production. This paper moves downstream, examining the potential for using food aid for
2 See Jackson and Eade (1982) for some especially egregious and oft-cited examples.
�15�
domestic market development. We focus especially on the prospects for putting food aid
to use in relieving factor market failures that similarly constrain investment and
productivity in downstream value-added activities in food marketing and processing.
One way food aid for market development works is as follows. Food aid donors
provide raw materials (e.g., maize, soybean oil, powdered milk) to recipient country
governments or nongovernmental organizations (NGOs) for free or on heavily
concessional terms. These raw commodities are then given or sold to local processors or
traders who then process and/or sell the product, creating or expanding new markets in
the process. If the commodities were sold � �monetized� in the jargon of food aid � the
government or NGO then uses the counterpart funds generated by food aid monetization
to support the development of the production, processing and marketing activities by
smallholder farmers (e.g., through technical assistance projects or public infrastructure
investments). The objective of this support is to improve the terms of trade (output prices
relative to input prices) smallholders face, and/or to support adoption of improved
production, storage or processing technologies designed to stimulate domestic production
of the donated commodity. The long-term aim of food aid for market development is to
use short-lived food aid to stimulate local production, processing and distribution
capacity expansion with the objective of replacing food aid with domestic production or
commercial imports within a few years, thereby creating sustainable value-added and
output growth.
We explicitly set aside the issue of whether food aid is the best resource to use in
promoting agricultural market development in recipient countries, particularly in Sub-
Saharan Africa. In the abstract, food aid seems an undeniably inferior resource because it
is doubly tied, in the following sense. Food aid is inflexible in the form of the transfer �
it comes only as food, not as cash or other useful goods or services � and it is typically
inflexible in sourcing that food, relying on commodities procured in and shipped directly
from the donor country.3 However, if the volume of international transfers depends on the
3 Local purchases (i.e., international cash donations for the purchase of food on open markets in the recipient country) and triangular transactions (i.e., international cash donations for the purchase of food on

�16�
form in which donors provide it, particularly if donor country governments are willing to
provide food aid in part because it supports their own farm and agribusiness
constituencies, then food aid that is relatively inefficient per dollar transferred may
nonetheless generate greater absolute transfers than less restricted cash appropriations.
The question of the sensitivity of international development assistance budgets to the
form in which donors provide aid falls well outside the scope of our study. We therefore
only explore whether food aid can satisfy a necessary (but not sufficient) condition for its
use in promoting recipient country agricultural development: does it or might it
reasonably be expected to stimulate increased productivity and value-added in recipient
countries in Sub-Saharan Africa?
We investigate that question over the next five sections. In Section 2 we present
an overview of trends in the volume of food aid shipments to Sub-Saharan Africa.
Section 3 briefly reviews the conceptual issues of the potential impact of food aid on
recipient country production and downstream value-adding activities. Section 4 discusses
a few key characteristics of food markets and food aid, and presents a summary of the
results of an empirical analysis of the impact of food aid on food production in the region
in Sub-Saharan Africa. Section 5 discusses how to use future food aid most effectively,
reflecting in particular on possible uses for development of downstream processing and
distribution capacity. Section 6 concludes.
open markets in one low-income country for shipment to another, recipient country) represented only 11 percent of global food aid flows in 2000. The vast majority of food aid flows involve direct donor-to-recipient shipment.

�17�
2. TRENDS IN FOOD AID SHIPMENTS TO SUB-SAHARAN AFRICA
At the global level, food aid has become a marginal component of aid,
constituting only 1-3 percent of overseas development assistance flows in any year 1995-
1999, down sharply from 22 percent in 1965 and 11 percent in 1985 (OECD 2003, ODI,
2000). While food aid comprised 30 to 40 percent of U.S. economic assistance, on
average, between 1954 and the mid-1970s, the share has declined gradually, falling to
only 8 percent in 2002 (Barrett and Maxwell forthcoming).
In volume terms, global food aid flows declined sharply in the last decade, from a
high of 15 million metric tons in 1992-93 to less than 7 million metric tons in 1996-97,
before recovering to around 10 million metric tons in 2000-2002. Food aid therefore
accounts for a small and declining share of cross-border food flows and an even smaller
share of food availability (Barrett, 2002). The European Union insists that anything other
than emergency food aid should be considered an export subsidy. If the next trade
agreement under the World Trade Organization moves in this direction, food aid volumes
will likely decline further.
The volume of food aid to Sub-Saharan Africa has varied sharply over the last
three decades. From a low of only 0.62 kg per person per year in the early 1960s, food
aid deliveries to the region increased almost tenfold from the early 1970s to the mid-
1980s, more than tripling from an average of just over one million metric tons per year in
the 1970s to more than 3.3 million metric tons in the 1990s (Table 1). The region�s share
world food aid receipts has also risen significantly as African recipients have generally
overtaken the south Asian states that received most food aid in the 1960s (Barrett and
Maxwell, forthcoming). Bangladesh became the largest recipient of food aid in the 1990s
and remains consistently among the top food aid recipients worldwide. But several Sub-
Saharan African countries now feature prominently among the top five year after year.
Ethiopia (6.2 percent of global flows in the 1990s), Mozambique, Kenya, Sudan and
Eritrea, in particular, have become leading food aid recipients, with the region as a whole
receiving more than 30 percent of global food aid flows (Barrett, 2002).

�18�
The composition of food aid shipments to Sub-Saharan Africa has also fluctuated
considerably in the last three decades. As is the pattern worldwide, wheat and wheat flour
constitute by far the largest share of food aid flows, more than 85 percent of which are
cereals (Table 1). Nonetheless, the proportion of wheat and wheat flour in food aid flows
to Africa declined from 49 percent in 1980s to only 37 percent in the 1990s, before
recovering a bit to 43 percent in 2000-2002, as the share of coarse grains and non-cereals
increased. The distribution between countries has likewise varied greatly in recent years
(see Table 2 for figures on selected countries). During 1985-2000, the volume of food aid
grew at an annual rate of 21.2 percent in Ethiopia, 8.1 percent in Sudan, and 6.2 percent
in Mozambique.
Table 1: Composition of Food Aid Shipments to Africa by Commodity (annual average, metric tons)
1970-79 1980-89 1990-99 2000-02
Wheat and wheat flour 472,052 1,633,553 1,247,436 1,257,443
Coarse grains 332,962 883,496 1,214,905 759,089
Other cereals 126,286 590,739 515,178 527,501
Cereals 931,300 3,107,788 2,977,519 2,544,033
Noncereals 91,439 222,842 372,423 353,548
Total Food Aid 1,022,738 3,330,629 3,349,943 2,897,581
Source: World Food Programme
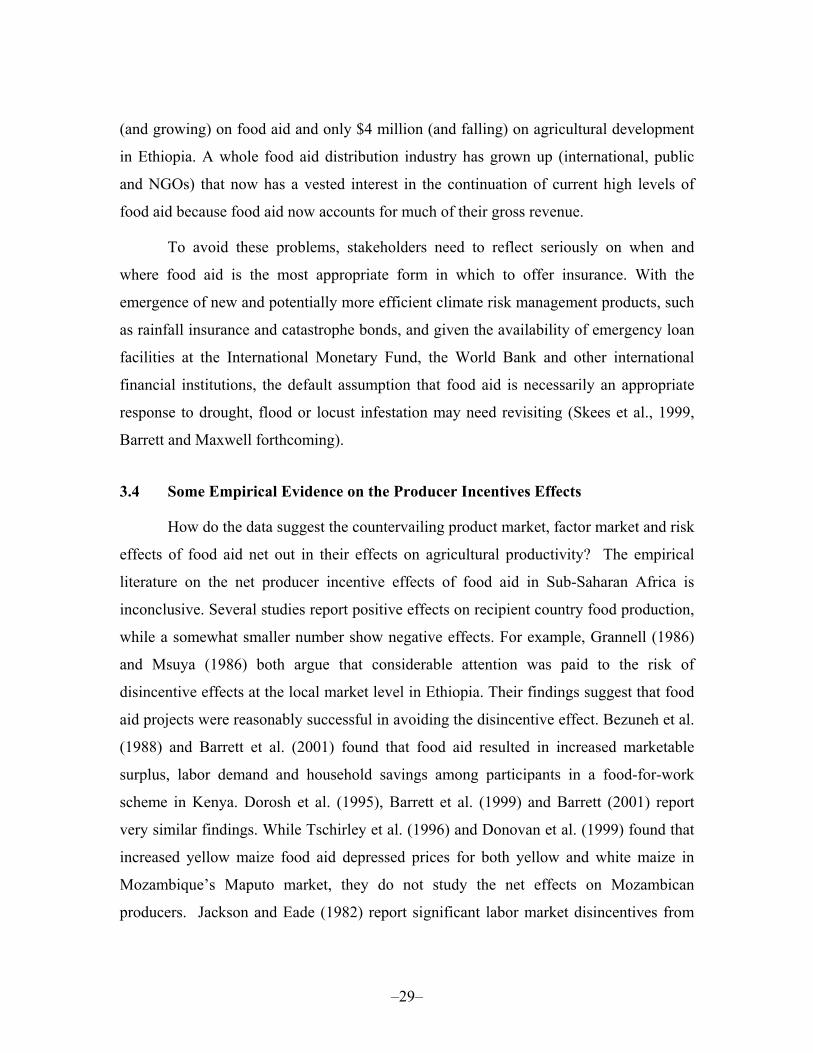
Figure 2 shows that food aid shipments to Sub-Saharan Africa have increasingly
shifted from program to emergency aid. The share of emergency food aid increased from
an annual average of 41 percent in 1988-1990 to 67 percent in 2000-2002, while the share
of program food aid declined from an annual average of 37 percent 1988-1990 to only 8
percent in 2000-2002. The share of project food aid has remained relatively stable within
the entire period, increasing only slightly from an annual average of 22 percent in 1988-
1990 to 24 percent in 2000-2002. The observed pattern reflects the fact that much of food
aid shipments have become tied to acute humanitarian emergencies.

�19�
Table 2: Food Aid Shipments to Selected African Countries in 1990-2002 (1000 metric tons)
Year Ethiopia Kenya Mozambique Sudan Rwanda Angola 1990 933 77 489 513 11 114 1991 1,112 183 577 682 12 125 1992 943 306 990 397 92 134 1993 933 303 313 320 137 246 1994 630 132 347 180 405 281 1995 768 27 256 59 397 273 1996 510 52 97 98 472 235 1997 152 117 190 71 285 155 1998 567 99 177 257 226 172 1999 484 125 126 153 254 197 Average 1990 - 1999 795 142 356 273 229 193 2002 - 2003 997 293 174 169 92 230
Source: World Food Programme
Figure 2: Food Aid Deliveries to Sub Saharan Africa by Type, 1988-2002
0
500
1000
1500
2000
2500
3000
3500
4000
1988
1990
1992
1994
1996
1998
2000
2002
Years
Tons
of C
erea
l Equ
ival
ents
EmergencyProgramProject
Data Souce: FAO

�20�
It is however important to note that as program food aid has declined,
monetization of non-emergency project food aid by NGOs has grown sharply. As Figure
3 demonstrates, PL480 Title II nonemergency monetization rates have skyrocketed in
recent years. The implication is that although the food aid category has changed, the basic
effects on markets continue, because food aid that is monetized by NGOs operates just
like that monetized by recipient governments; it inherently adds to supply, putting
downward pressure on market food prices. In so far as the targeting of directly
distributed food aid has improved over time, however, food price effects may have
nonetheless diminished.
Figure 3: Monetization Rate of Title II PL480
0
10
20
30
40
50
60
70
80
1990
1991
1992
1993
1994
1995
1996
1997
1998
1999
2000
2001
2002
Perc
ent o
f Titl
e II
food
aid
shi
pmen
ts
Target Title II Monetization Rate
Approved Title II Monetization Rate
Source: Barrett and Maxwell (forthcoming)
The increased share of emergency food aid has been accompanied by a shift in
food aid distribution channels. Since the late 1980s, one-quarter to one-third of global
food aid has been channeled through the World Food Programme (WFP). The WFP�s
share of food aid flows to Sub-Saharan Africa has increased from 45 percent in 2000 to
68 percent in 2002.

�21�
In summary, although food aid flows have declined sharply relative to overall
development assistance and in volume terms globally, they have increased in Sub-
Saharan Africa over the past generation. During this time, food aid has become
increasingly tied to emergency relief and more varied in its commodity composition and
geographic coverage within the continent. Thus food aid and its uses remain a significant
issue in African agricultural policy and in donor programming for Sub-Saharan Africa.

�22�
3. CONCEPTUAL ISSUES REGARDING THE POTENTIAL IMPACT OF FOOD AID
A persistent objection to non-emergency food aid arises from its potential
disincentive effects on domestic food production and marketing. These disincentive
effects could emerge in any of several ways, which we enumerate momentarily. It is
important, however, to take a broader perspective on the problems facing small farmers
in Sub-Saharan Africa. Some criticisms of food aid unhelpfully restrict the range of
effects under consideration, excessively emphasizing product market price effects
without paying attention to factor market price effects that equally influence production
patterns. As we emphasize in this section, food aid can influence both the product and
factor market incentives faced by food producers in food aid recipient countries. How
these countervailing effects net out depends on the design and efficacy of a given food
aid action. The net effects are ultimately an empirical question. To the degree that food
aid can prove stimulative to the recipient country�s domestic food economy, some
intriguing options emerge, to which we turn in subsequent sections of the paper.
3.1 Food Price Impacts
Food aid will normally boost aggregate demand in the recipient country. The
resulting income boost will tend to increase recipient country demand for food. However,
the basic commodities provided in food aid shipments are normal goods. Demand for
them increases more slowly than income grows, even when the income transfers come in
as the form of food. As a consequence, the addition of food aid to domestic food supply
will tend to expand supply more than it stimulates demand. That is why food prices
typically fall in response to food aid inflows into developing countries (Gabre-Madhin et
al., 2003). Since increased food consumption is less than the volume of food aid received,
there must be some commercial food sales displaced, whether from domestic producers
and processors or commercial imports. The extent of the displacement � equivalently,
the degree to which food aid flows add to recipient consumption volumes � turns
fundamentally on the efficacy of targeting. Because income elasticities of demand for

�23�
food are highest among the poorest subpopulations, food aid distributed exclusively to
poor recipients generates minimal food market distortions relative to untargeted food aid
monetized in an open market (Barrett 2003).
The division of commercial food sales displacement between domestic producers
and foreign suppliers turns on several factors. First, it matters how well-integrated the
recipient country market is with broader international food markets. In a fictive small
open economy, food aid simply substitutes for commercial imports, with prices and
domestic production unaltered, but with increased consumption. However, poor
infrastructure and high transport and marketing costs in much of rural Africa typically
cause food markets to exhibit poor spatial market integration, violating the small open
economy assumption of frictionless international market access. The release of food aid
can therefore have significant local price effects, leading to displacement of local
production. These problems are far less significant in areas well-integrated into broader
national and international markets that can readily absorb excess local supply resulting
from food aid inflows.
The second big factor that determines the division of displaced commercial food
sales among suppliers concerns product differentiation. Food aid transfers tend to
decrease the demand for substitute commodities, such as maize and rice in the case of
wheat food aid, and to increase demand for complements, such as meat and vegetables in
the case of vegetable oil food aid. Combined with the transfer�s positive income effects
on demand for both substitute and complementary foods, the net cross-price effect of
food aid therefore depends on the relative magnitudes of the substitution and income
effects. Producers of complementary foods tend to benefit from food aid while the market
prices of substitute foods can either rise or fall, depending on how income and
substitution effects net out (Gabre-Madhin et al., 2003). This seems a primary reason for
apparent international trade externalities in food aid shipments, wherein U.S. food aid
flows tend to stimulate recipient country demand for third country food exports more
quickly than for U.S. commercial food exports, because the products are typically not
identical (Barrett et al. 1999).

�24�
In sum, longstanding concerns about product market price effects of food aid
deliveries � which date at least from Schultz (1960) � are well-founded in many settings
in which food aid shipments of locally produced commodities are distributed in poorly
integrated recipient markets with ineffective targeting to the poor. But the problem is
perhaps less general than is commonly believed. Product market price effects may not be
adverse for all producers, indeed they can even be favorable in well-integrated markets
for producers of complementary or some substitute foods.
3.2. Factor Market Effects
The effect of food aid on food producers� incentives in recipient markets turns not
only on induced changes (if any) on product prices, but also on factor market effects.
Even if the producer price of a food falls, producers may expand production if input
prices fall even more. There are several different mechanisms through which food aid
can affect the shadow price4 of inputs and thereby affect agricultural productivity and
rural incomes.
The most researched factor market effects relate to the value of labor. If
households value leisure, then income transfers, even in kind transfers associated with the
receipt of food aid, will induce increased demand for leisure and reduced supply of labor.
All else held constant, reduced labor supply will reduce farmers� output and cash
incomes. Labor productivity thus increases while yields per unit area cultivated fall.
Available evidence shows that labor supply becomes more responsive to changes in
income as people grow wealthier. This implies that poorly targeted food aid may magnify
inevitable labor market disincentive effects by providing benefits to those who are most
likely to turn transfers into leisure instead of increased consumption.
4 The shadow price of a good or service differs from the local market price in the presence of any sort of binding constraint (e.g., cash liquidity, subsistence, availability) that makes the good or service relatively more scarce for a particular decision-maker. In areas where market imperfections are widespread, search and transactions costs, credit constraints, etc. common drive a significant wedge between observable market prices and the true economic valuation � shadow prices � that guide resource allocation.

�25�
Special concerns have been voiced about the labor market effects of ill-conceived
food-for-work (FFW) projects, which may distort local labor markets by attracting
workers away from vital activities during the agricultural year, especially if the wages
offered under FFW schemes are at or above prevailing market wage rates (Maxwell and
Singer, 1979). However, FFW schemes can also create valuable inputs, perhaps
especially public goods such as feeder roads and reforestation or soil and water
conservation structures to reduce soil erosion. For example, von Braun et al. (1999)
report on the multiplier effects of a FFW-built road in the Ethiopian lowlands, where
improved market access directly attributable to that road led to the establishment of water
mills and fruit plantations and the revival of traditional cotton spinning and weaving in
the three years after the road was built. Moreover, well-conceived and managed FFW
projects that invest in necessary materials to complement labor inputs clearly can �crowd
in� private investment, as Holden et al. (2003) find in the case of private investment in
soil and water conservation structures in Tigray region of Ethiopia and Bezuneh et al.
(1988) find in purchased farm inputs use in Baringo District, Kenya.
In so far as food aid provides timely transfers at times when recipients are cash-
strapped, it can obviate binding seasonal liquidity constraints, enabling smallholders to
undertake productive investments. Many small farmers run short of the cash necessary to
purchase food, pay hired workers and purchase inputs in the planting and growing
season; hence the colloquial term �hungry season� used for this period in many regions.
Given rampant rural financial market failures, the marginal cost of capital can be quite
high, sufficient to preclude purchase of high-return inputs such as chemical fertilizer or
investment in capital improvements such as improved soil and water conservation
structures or labor-intensive cultivation practices offering sharply increased expected
crop yields (von Braun 1995, Barrett et al. 2002, Moser and Barrett 2003). The income
transfer component of well-timed and well-targeted food aid can obviate binding liquidity
constraints, stimulating smallholder productivity, as has been demonstrated in Kenya
(Bezuneh et al. 1988, Barrett et al. 2001). The effect may be subtle, appearing not as
increased investment, but rather as reduced disinvestment, whether of valuable natural

�26�
capital through erosion-inducing deforestation (Barrett 1999) or sale of high return assets,
such as livestock, to meet short-term cash requirements for food, medicines or school
fees (Barrett et al. 2001).
At a subtle but important level, there is a fundamental inconsistency in arguments
that because food aid expands local food supply, it must create producer disincentives.
The inconsistency emerges because, as previously discussed, food demand inevitably
increases less than food supply, causing some displacement of commercial imports. But
displaced commercial food imports reduce demand for foreign currency, affecting the
real exchange rate or freeing up foreign exchange to increase the local supply of imported
inputs. Either way, adverse food product price effects are inextricably linked to favorable
input price effects for food producers. Either there is little displacement and no product
or factor price effects, or there is commercial food market displacement, in which case
product prices move against producers while tradable input prices adjust favorably for
farmers. The net effects of food aid deliveries on domestic food productions are
analytically ambiguous (Mohapatra et al. 1999). Hence the need for empirical
investigation of this question, like that we offer in the next section.
The final inputs that can be affected by food aid are transport and storage
equipment. Poorly timed and managed food aid can compete with local merchants for
scarce transport capacity and commercial storage space, bidding up their cost and
choking off investment in commercial market intermediation. By contrast, well timed
and managed food aid can help stabilize capacity utilization for commercial storage and
transport providers, thereby encouraging investment to benefit the broader agricultural
marketing channel. Furthermore, food aid deliveries into relatively remote areas can
temporarily relieve transport bottlenecks by creating new backhaul capacity, thereby
reducing marketing costs for local producers through a de facto transport subsidy
3.3. Risk Management Effects
Beyond its prospective input and output price effects, food aid can also affect
food production through changing the production risks faced by farmers. African food

�27�
producers face considerable risk due to climate, disease, pests, civil unrest and other
shocks. Underdeveloped rural financial markets leave most such risk uninsured.
Uninsured risk causes net commodity sellers � all but the smallest farmers, who are
commonly net buyers of the products they grow � to reduce output, resulting in lower
aggregate productivity (Finkelshtain and Chalfant 1991, Barrett 1996). Effective
insurance can thus boost productivity by reducing farmers� practice of costly risk
mitigation strategies.
Risk management instruments only generate desirable productivity and poverty
reduction benefits if they are credible, however. Farmers do not drop costly risk
mitigation strategies in response to unreliable insurance. Historically, food aid targeting
and timeliness has been of mixed effectiveness at best, providing unreliable insurance
against shocks. Moreover, much food aid appears to substitute to a considerable degree
for informal social insurance flows, generating little net additional insurance coverage for
smallholder producers.
On the other hand, were food aid more effective in providing insurance, it would
have to be appropriately priced and linked to natural disasters in order to avoid creating
perverse incentive problems for farmers. For example, if food aid were available to a
farmer whenever he/she suffered a severe production shortfall, regardless of cause, then
moral hazard problems could easily arise. This is a well known problem in insurance
whereby the insured has reduced incentive to take all reasonable precaution to avoid or
minimize losses once they know that the insurance will compensate regardless of the
causes of their losses. Moral hazard can be avoided by linking food aid transfers to
specific climate or other catastrophic events that lead to losses over which the farmer has
no control. Another incentive problem can arise if the food aid is given free or on a
subsidized basis. In this case farmers may take on too much risk, because they do not
bear the full cost of any resulting losses although they capture all of any windfall gains
(Skees et al., 1999). This familiar result from the insurance literature carries important
lessons for food aid: provide only what intended beneficiaries would be willing to pay for
on their it if they had the necessary cash.

�28�
African farmers have evolved a wide array of traditional risk management
strategies (e.g., kin support systems, intercropping, temporary migration) over the
centuries. These systems generally work well except in catastrophic years of highly
covariate risk (e.g., broad-scale drought or floods), when nearly everyone suffers losses at
the same time, so that there are scant redistributable surpluses within the local system or
off-farm employment opportunities. Once food aid begins to flow on a regular basis, then
farmers may begin to take it for granted, reducing their incentive to practice traditional
risk management strategies. This can induce farming practices that are more vulnerable to
drought or flood, thereby increasing expected losses in bad years while undercutting
traditional social insurance arrangements for which farmers have to pay implicitly. Of
course, this merely reinforces the need for food aid. These problems can add enormously
to the cost of government assistance over time in response to natural disasters.
Governments may also face similar incentive problems when receiving large
amounts of subsidized or free food aid from abroad. If they can take food aid for granted
in emergency situations, then they may not take reasonable precautionary actions, like
investing in irrigation or in agricultural research and extension to reduce the risk of losses
in national food production, or in stockpiling food or setting aside funds for emergency
food imports in times of need. They may also underinvest in long-term agricultural
development, which otherwise could eventually eliminate a country�s need for any food
aid.
Such disincentives can not only lower productivity and incomes for African
countries, they can also compel reallocation of scarce overseas development assistance
budgets, leading to what Barrett and Carter (2002) term a �relief trap�. Due to sharp
increases in emergency spending on response to humanitarian emergencies, the share of
global aid flows spent on proper development investments � education, health, economic
infrastructure, agricultural production technologies, etc. � fell from 47 percent in 1993 to
31 percent in 1999. The United States� government�s spending on international
agricultural development has suffered disproportionately, falling from $900 million in
1990 to $300 million in 1999. For example, USAID spends $200-300 million per year
�29�
(and growing) on food aid and only $4 million (and falling) on agricultural development
in Ethiopia. A whole food aid distribution industry has grown up (international, public
and NGOs) that now has a vested interest in the continuation of current high levels of
food aid because food aid now accounts for much of their gross revenue.
To avoid these problems, stakeholders need to reflect seriously on when and
where food aid is the most appropriate form in which to offer insurance. With the
emergence of new and potentially more efficient climate risk management products, such
as rainfall insurance and catastrophe bonds, and given the availability of emergency loan
facilities at the International Monetary Fund, the World Bank and other international
financial institutions, the default assumption that food aid is necessarily an appropriate
response to drought, flood or locust infestation may need revisiting (Skees et al., 1999,
Barrett and Maxwell forthcoming).
3.4 Some Empirical Evidence on the Producer Incentives Effects
How do the data suggest the countervailing product market, factor market and risk
effects of food aid net out in their effects on agricultural productivity? The empirical
literature on the net producer incentive effects of food aid in Sub-Saharan Africa is
inconclusive. Several studies report positive effects on recipient country food production,
while a somewhat smaller number show negative effects. For example, Grannell (1986)
and Msuya (1986) both argue that considerable attention was paid to the risk of
disincentive effects at the local market level in Ethiopia. Their findings suggest that food
aid projects were reasonably successful in avoiding the disincentive effect. Bezuneh et al.
(1988) and Barrett et al. (2001) found that food aid resulted in increased marketable
surplus, labor demand and household savings among participants in a food-for-work
scheme in Kenya. Dorosh et al. (1995), Barrett et al. (1999) and Barrett (2001) report
very similar findings. While Tschirley et al. (1996) and Donovan et al. (1999) found that
increased yellow maize food aid depressed prices for both yellow and white maize in
Mozambique�s Maputo market, they do not study the net effects on Mozambican
producers. Jackson and Eade (1982) report significant labor market disincentives from

�30�
food-for-work projects in a number of developing countries, but likewise do not study the
net effects across all factor and product markets. Moreover, Maxwell et al. (1994) and
von Braun et al. (1999) find little support for the claim of labor market disincentive
effects of food-for-work schemes.
As pointed out by Barrett (2002), there does not seem to be a mass of empirical
evidence in support of the hypothesis that food aid significantly displaces domestically
produced food on recipient country markets. Particularly in Sub-Saharan African
countries, where balance of payments constraints bind at the macroeconomic level and
working capital constraints bind at the household level, it seems reasonable to believe the
empirical evidence suggesting that food aid�s contemporaneous displacement of food
purchases might foster productive investments that generate significant dynamic income
gains from food aid. This reinforces Singer�s (1987) argument that critics of food aid
have unduly used a narrow framework for the disincentive debate. He points out that the
immediate price disincentive may be only the left hook of the J curve with a cumulative
expansion of income and output that follows.

�31�
4. FOOD AID AND AGRICULTURAL DEVELOPMENT IN SUB-SAHARAN AFRICA
Generally, the producer disincentive effects discussed in Section 3 will be greater
the less well integrated the food aid destination market is into broader national, regional
or global markets. This stems from the fact that a given volume of food aid represents a
larger share of aggregate supply the more segmented the market into which it is
delivered, thus exerting greater downward pressure on producer prices. Because food
markets conditions matter to net production incentives, we briefly examine the salient
features of food markets in the region in the next subsection before proceeding to briefly
discuss the results of an empirical analysis of the impact of food aid on food production
in Sub-Saharan Africa to date.
4.1 Food Markets in Sub-Saharan Africa
Although several countries in Sub-Saharan Africa have undertaken major market
reforms during the last two decades, food markets in the region still appear highly
inefficient (Kherellah et al. 2002). In particular, inefficient parastatal marketing boards,
high transaction costs from poor infrastructure, dispersed populations and problems with
physical security and contract enforcement, lead to relatively wide margins between
producer and consumer prices, up to 70 percent of product values (Ahmed and Rustagi,
1987).
Markets can be inefficient either because trader behavior appears noncompetitive
or because the costs of commerce are high. The best way to distinguish between these is
by testing for spatial equilibrium. Markets are in spatial equilibrium if prices differ
between them only by the costs of arbitrage between the markets (e.g., transport,
handling, taxes), implying that competition among traders extinguishes profit for the least
efficient arbitrageurs. While earlier empirical evidence appeared inconclusive, more
recent and methodologically sophisticated work suggests that markets are commonly in
spatial equilibrium, although extraordinarily high costs of commerce often preclude
profitable product flows between spatially distinct markets, leading to high inter-market

�32�
margins and significant geographic market segmentation.5 This raises the prospect that
costs constrain commerce and that producer price effects should be relatively more
pronounced in Sub-Saharan Africa than elsewhere in the developing world. Put
differently, the analysis that follows in no way denies the adverse producer price effects
of food aid. Rather, it underscores the importance of factor market constraints to
agricultural productivity growth on the continent. As we argue in Section 5, these effects
are likely present especially in post-harvest processing and distribution, raising the
prospect that food aid might be employed productively to address the very food market
inefficiencies that presently give rise to adverse producer price effects.
4.2. Analysis of Relationship Between Food Aid and Food Production
The relationship between food aid flows and food production in Sub-Saharan
African is investigated within a vector autoregressive (VAR) framework for the period
1970-2000 for 42 Sub-Saharan African countries that received food aid.6 Annual food aid
flows data were obtained from the World Food Programme and food production data
from the FAO�s Production Yearbook. Because cereals food aid accounts for more than
90 percent of total food aid shipments to Sub-Saharan Africa, cereals serve as a
reasonable proxy for overall trends in food aid and production. All volume figures were
converted to a per capita basis using annual population data reported in the FAO�s
Production Yearbook. Country-level annual rainfall data were obtained from Tyndall
Centre for Climate Change (Mitchell et al., 2003). Given that the impact of rainfall
volume varies between different geographic areas based on agroecology, altitude, etc., we
measure rainfall in standardized deviations from country-specific means, obtained by
subtracting a country�s mean annual rainfall from rainfall and dividing by the country-
5 Examples include Golletti and Babu (1994), who studied maize markets in Malawi, Barrett (1995), who studied multiple food markets in Madagascar, Negassa (1998), who explored different markets in Ethiopia, and Abdulai (2000)� s research on maize markets in Ghana. 6 The countries include: Angola, Burundi, Benin, Burkina Faso, Botswana, Cape Verde, Central African Republic, Chad, Cameroon, Comoros, Congo, Cote d�Ivoire, Djibouti, Ethiopia, Equatorial Guinea, Guinea-Bissau, Gambia, Ghana, Kenya, Lesotho, Liberia, Madagascar, Mauritius, Mauritania, Mali, Malawi, Mozambique, Niger, Nigeria, Rwanda, Senegal, Sierra Leone, Somalia, Sudan, Swaziland, Tanzania, Togo, Uganda, Zaire, Zambia, and Zimbabwe.

�33�
specific standard deviation. Yearly dummies for disasters were constructed from data
obtained from the Center for Research on the Epidemiology of Disasters (CRED) in
Belgium. The CRED data base contains detailed information on natural disasters and
conflicts on annual basis for all countries.
The model was first estimated for the entire 1970-2000 sample, and then for two
sub-samples, 1970-85 and 1986-2000, to capture significant shifts in food aid
procurement and distribution modalities in Sub-Saharan Africa in the latter period. The
technical details of the VAR model and estimation techniques are explained in the
Technical Appendix.
Our VAR estimation results reveal that, on average, food aid exerts a positive
impact on food production. Food aid does not appear to depress food production out to a
horizon of four years, by which point the effects have dampened to near zero. This
positive net effect of food aid on food production indicates that any disincentive effects
due to depressed product prices induced by food aid shipments must be more than offset,
on average, by positive risk management and factor price effects. This is not to say that
food aid is necessarily the best possible resource to use for rural development
interventions, just that rural Sub-Saharan Africa is so starved for investible resources of
any sort that any reasonably well-managed aid program can have net beneficial effects,
even in spite of the well-known product market disincentive effects associated with food
aid. Even an imperfect resource can prove valuable when resources of any sort are so
scarce.
Estimates for the impact of food production on food aid flows also indicate that
past values of food output negatively affect current levels of food aid. Specifically, the
negative and significant coefficients of lagged food production indicate that increases in
food production tend to reduce food aid shipments in subsequent periods, while declines
in food production are accompanied by increased supplies of food aid. The results for the
two sub-periods, 1970-1984 and 1985-2000, appear qualitatively similar, although the
coefficient estimates relating food aid to subsequent food production are slightly higher

�34�
in the second period, perhaps reflecting some improvement in food aid programming due
to advances in early warning systems and targeting methods.7
In order to make the net effects clearer, we compute impulse response functions to
depict the time path of food production responses to a one-year increase in food aid
shipments of one kilogram per capita. Figure 4 depicts the impulse response functions of
both food aid and food production to a food aid shock over the whole period. In contrast
to comparable impulse response function estimates Barrett et al. (1999) reported using a
smaller and more geographically diverse set of countries and only PL 480 food aid flows
from the United States, food aid (the dashed line) exhibits little persistence over time.
This is consistent with the observation that the overwhelming majority of food aid
shipments into Africa have been emergency flows and with the claim that these flows
respond, albeit with a significant lag, to local production shocks. Of more immediate
interest to this analysis, the effects of food aid on per capita food production (the solid
line in Figure 4) appear positive and persistent for three years, with negative effects in the
fourth year and negligible impact thereafter. In the 1986-2000 period shown in Figure 5,
the negative lagged effects vanish entirely. Food aid has only positive lagged effects on
food production per capita in the more current period, in the wake of significant reforms
in food aid programming. It would appear that development resources of any sort are
sufficiently scarce and food aid has been sufficiently well targeted overall in Sub-Saharan
Africa over the past thirty years that it has effectively relieved factor market constraints
so as to overcome the product price disincentives that naturally arise from food aid
shipments.
7 See Barrett and Maxwell (forthcoming) for detailed explanation of changes in food aid targeting, procurement and distribution modalities since the mid-1980s.

�35�
Figure 4: Estimated Impulse Response Functions
-0.6
-0.4
-0.2
0.0
0.2
0.4
0.6
0.8
1.0
0 1 2 3 4 5 6 7 8 9 10
Years since food aid shock
Volu
me
(kg
per c
apita
) Food production per capita
Food aid per capita
Figure 5: Estimated Impulse Response Functions1986-2000 Subsample
-0.6
-0.4
-0.2
0.0
0.2
0.4
0.6
0.8
1.0
0 1 2 3 4 5 6 7 8 9 10
Years since food aid shock
Volu
me
(kg
per c
apita
)
Food production per capita
Food aid per capita
�36�
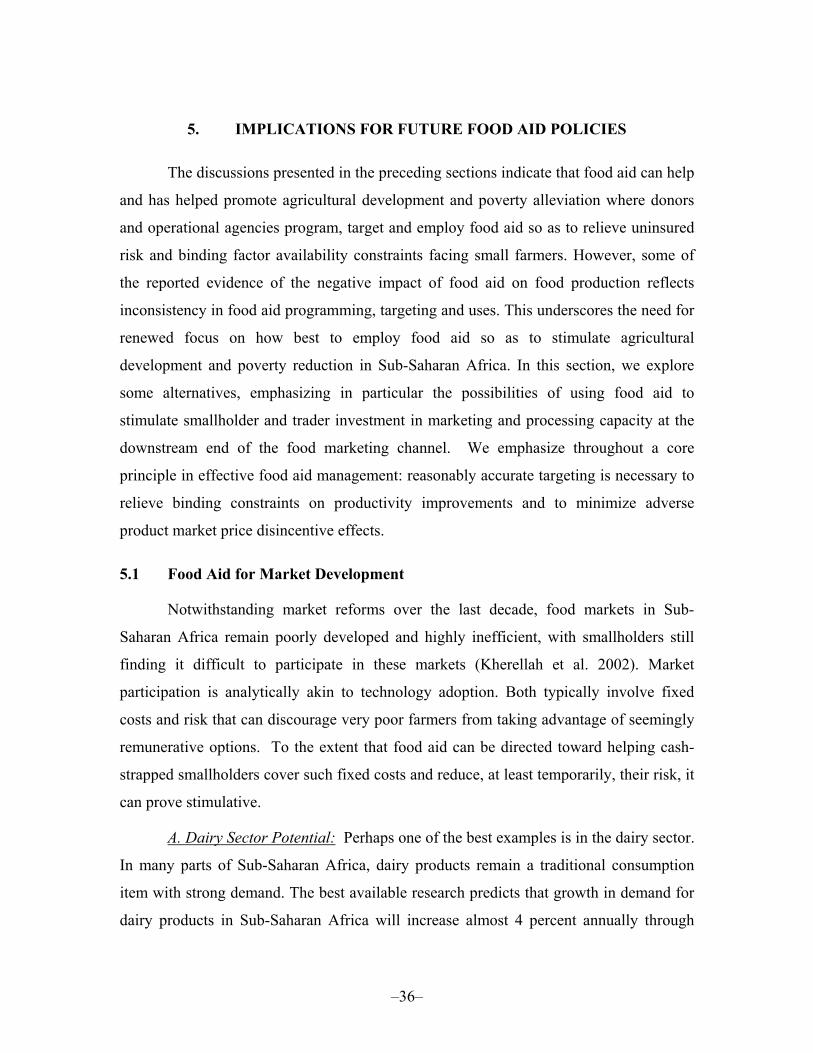
5. IMPLICATIONS FOR FUTURE FOOD AID POLICIES
The discussions presented in the preceding sections indicate that food aid can help
and has helped promote agricultural development and poverty alleviation where donors
and operational agencies program, target and employ food aid so as to relieve uninsured
risk and binding factor availability constraints facing small farmers. However, some of
the reported evidence of the negative impact of food aid on food production reflects
inconsistency in food aid programming, targeting and uses. This underscores the need for
renewed focus on how best to employ food aid so as to stimulate agricultural
development and poverty reduction in Sub-Saharan Africa. In this section, we explore
some alternatives, emphasizing in particular the possibilities of using food aid to
stimulate smallholder and trader investment in marketing and processing capacity at the
downstream end of the food marketing channel. We emphasize throughout a core
principle in effective food aid management: reasonably accurate targeting is necessary to
relieve binding constraints on productivity improvements and to minimize adverse
product market price disincentive effects.
5.1 Food Aid for Market Development
Notwithstanding market reforms over the last decade, food markets in Sub-
Saharan Africa remain poorly developed and highly inefficient, with smallholders still
finding it difficult to participate in these markets (Kherellah et al. 2002). Market
participation is analytically akin to technology adoption. Both typically involve fixed
costs and risk that can discourage very poor farmers from taking advantage of seemingly
remunerative options. To the extent that food aid can be directed toward helping cash-
strapped smallholders cover such fixed costs and reduce, at least temporarily, their risk, it
can prove stimulative.
A. Dairy Sector Potential: Perhaps one of the best examples is in the dairy sector.
In many parts of Sub-Saharan Africa, dairy products remain a traditional consumption
item with strong demand. The best available research predicts that growth in demand for
dairy products in Sub-Saharan Africa will increase almost 4 percent annually through
�37�
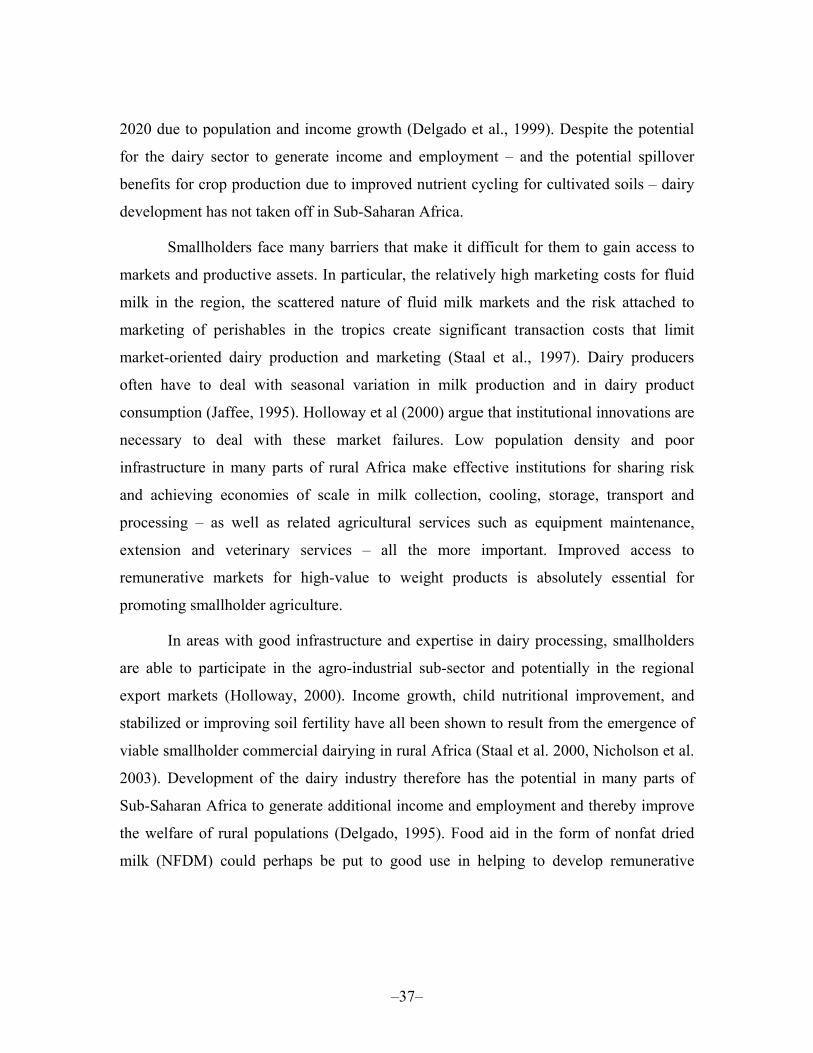
2020 due to population and income growth (Delgado et al., 1999). Despite the potential
for the dairy sector to generate income and employment � and the potential spillover
benefits for crop production due to improved nutrient cycling for cultivated soils � dairy
development has not taken off in Sub-Saharan Africa.
Smallholders face many barriers that make it difficult for them to gain access to
markets and productive assets. In particular, the relatively high marketing costs for fluid
milk in the region, the scattered nature of fluid milk markets and the risk attached to
marketing of perishables in the tropics create significant transaction costs that limit
market-oriented dairy production and marketing (Staal et al., 1997). Dairy producers
often have to deal with seasonal variation in milk production and in dairy product
consumption (Jaffee, 1995). Holloway et al (2000) argue that institutional innovations are
necessary to deal with these market failures. Low population density and poor
infrastructure in many parts of rural Africa make effective institutions for sharing risk
and achieving economies of scale in milk collection, cooling, storage, transport and
processing � as well as related agricultural services such as equipment maintenance,
extension and veterinary services � all the more important. Improved access to
remunerative markets for high-value to weight products is absolutely essential for
promoting smallholder agriculture.
In areas with good infrastructure and expertise in dairy processing, smallholders
are able to participate in the agro-industrial sub-sector and potentially in the regional
export markets (Holloway, 2000). Income growth, child nutritional improvement, and
stabilized or improving soil fertility have all been shown to result from the emergence of
viable smallholder commercial dairying in rural Africa (Staal et al. 2000, Nicholson et al.
2003). Development of the dairy industry therefore has the potential in many parts of
Sub-Saharan Africa to generate additional income and employment and thereby improve
the welfare of rural populations (Delgado, 1995). Food aid in the form of nonfat dried
milk (NFDM) could perhaps be put to good use in helping to develop remunerative

�38�
domestic food production, processing and marketing channels that would benefit poorer
rural producers.8
Food aid has been employed previously to advance agricultural markets for the
benefits of smallholders and consumers. Of particular note is the Indian experience with
Operation Flood. Operation Flood, launched in 1970, was instrumental in helping Indian
dairy farmers shape their own development. The scheme involved the establishment of
milk producers� cooperatives in the villages and the provision of modern technology. The
objectives included: an increase in milk production (�a flood of milk�, hence the name),
an increase in rural incomes, and the transfer to milk producers of an increased share of
the profits of milk marketing, which had previously been perceived to benefit mainly
middlemen. The project was carried out in three phases.
The first phase of Operation Flood was financed by the sale within India of
skimmed milk powder and butter oil donated by the European Community via the WFP.
During this phase, the program aimed at linking India�s 18 best milksheds with the milk
markets of the four main cities: Delhi, Mumbai, Calcutta and Madras. Two main policy
changes that played a role in this phase were the provision of direct financial assistance to
the cooperatives to develop the dairy industry and the decision to sell dairy food aid at
commercial prices within India. These changes reduced the price risks for farmers, small-
scale traders and private processors (Candler and Kumar, 1998).
The second phase of the project was implemented during 1981-85. The number of
milksheds was increased to 136 and was linked to more than 290 urban markets. By the
end of 1985, the capital raised from the sale of food aid from the European Community 8 More targeted use of NFDM food aid flows to help stimulate local dairy market development in recipient countries could also help relieve tensions among dairy exporters. For example, in three successive meetings (September-November 2002) of the Consultative Committee on Surplus Disposal, the international regulatory body established to oversee global food aid flows, Australia and the European Community registered concerns about sharp growth in U.S. nonfat NFDM donations, which more than doubled from U.S. fiscal year 2001 to 2002, to more than 57,000 metric tons, with an expected further expansion beyond 200,000 tons in fiscal year 2003 under the U.S.�s new Food for Education program, representing an astonishing 20 percent of total NFDM traded in the global marketplace (Barrett and Maxwell forthcoming). The Australian delegation pointed out, however, that much of the expanded NFDM distribution runs through U.S.-based NGOs that are subsidiaries of commercial entities that also sell NFDM under Section 416(b) and PL480 Title I programs.

�39�
and from a World Bank loan, had created a self-sustaining system of 43,000 village
cooperatives covering 4.25 million milk producers.9 Milk powder production increased
from 22,000 tons in 1970 to 140,000 tonnes in 1989, as a result of dairies set up under
Operation Flood. The European Community food aid thus helped to promote enhanced
value-added in upstream production and processing by smallholder producers and
therefore greater self-reliance. Direct marketing of milk by newly formed producers�
cooperatives resulted in an increasing share of the profits from milk marketing contracts
accruing to poor producers (Candler and Kumar, 1998).
The third phase of the project, carried out during 1985-86, enabled the dairy
cooperatives to build up the basic infrastructure necessary to procure and market the
increasing amount of milk they were producing. Moreover, facilities were created by the
cooperatives to provide better veterinary care services to member producers. Although
Operation Flood was not designed as a production or poverty project, by virtue of
facilitating small milk producers� entrance into a higher value-added segment of the food
marketing chain, it had a significant impact on both poverty and broader agricultural
production (Candler and Kumar, 1998). The project did not exclude the better-off, but a
majority of the beneficiaries were poor, mostly landless, tribal and marginal farmers. It is
estimated that 40 million tons more milk were produced in 1995 than would have been
produced if the pre-1971 growth rate had continued (Candler and Kumar, 1998).10 Under
the new policy, per capita milk consumption increased from 107 grams/head/day in 1970
to 193 grams/head/day in 1994 (Candler and Kumar, 1998).11 Due to high income
elasticity of demand for education in Indian villages, the project indirectly contributed to
9 In the second phase of Operation Flood, the European Community decided to use a significant portion of its dairy surplus to support the project directly, rather than indirectly through the World Food Program. Operation Flood II was therefore funded by the National Dairy Development Board (NDDB), the government of India, the World Bank, and the European Community through food aid, and the farmer-owners of the village dairy cooperative societies (Candler and Kumar, 1998). 10 Alderman�s (1987) study on cooperative dairy development in Karnataka found that milk production per family was from one and a half times to twice as high in Operation Flood as in non-Operation Flood villages. 11 However, critics rightly argue that this increase in milk production should not be attributed exclusively to Operation Flood (Doornbos et et., 1990).

�40�
an increase in the number of children attending school. Thus, by raising incomes,
Operation Flood had multiple benefits, including nutrition, education (especially girls)
and job creation.
We hypothesize that similar, positive results are attainable in Sub-Saharan Africa.
Food aid flows could temporarily facilitate uptake of improved dairy cattle breeds,
formation of effective producer marketing cooperatives, investment in necessary storage,
processing and transport equipment, and introduction of new value-added dairy products,
thereby increasing efficiency in production, processing, and distribution and increasing
and stabilizing smallholder producer incomes and improving dairy product availability to
lower-income rural and urban consumers. Consider three countries in which food aid for
dairy market development might be especially promising.
Although Kenya has more smallholder dairy producers selling milk off-farm than
any other African country, commercialization in 1990 ranged only from 43-48 percent
(Jaffe, 1995).12 As a result of the high transaction cost faced by smallholders in marketing
their milk, they consume a higher proportion of the milk they produce at home than do
larger farmers (Staal et al., 1997). Prior to 1992, the Kenya Cooperative Creameries
(KCC) possessed monopoly power over the dairy sector in the country. The 1992 dairy
market liberalization revoked KCC�s monopoly on urban milk sales and led to a rapid
innovation in milk marketing, especially for raw milk. Most notably, a variety of �self-
help groups� and other private marketing intermediaries that emerged after the
liberalization and established dairy cooperatives that were once an integral part of the
KCC milk collection system began marketing milk directly to urban centers. The
liberalization has also resulted in the emergence of several dairy processing units
producing pasteurized milk, butter, cheese, yoghurt, ice cream and ghee. A recent study
by Ouma et al (2000) indicates that consumption of dairy products has increased
significantly since liberalization.
12 Estimates for several other countries in West and Central Africa range from 25-40% of milk sold off the farm (Staal et al., 1997).

�41�
However, seasonality in production and consumption � due in part to limited use
of modern inputs such as feed concentrates, veterinary services and artificial insemination
� leads to temporal variation in prices and output volumes, creating disincentives to
investment in productivity-enhancing capital equipment. Many smallholder cooperatives
and their individual members lack the financial liquidity necessary to buy cooling or
transportation equipment to store and market milk profitably. Kenya, a net dairy product
importer, could likely benefit from a program akin to Operation Flood, giving or selling
nonfat dried milk powder food aid to smallholder cooperatives and local processors in the
dry season, when milk production is low and prices typically peak, so as to help stabilize
the market and enable investment in productivity enhancing equipment and institutional
improvements that are otherwise unaffordable.
Ethiopia similarly embarked on market-oriented policy reforms in 1992, although
no clearly defined dairy policy exists. Privatization of state enterprises, removal of input
market controls, the emergence of private processors and distributors in urban and peri-
urban milksheds and increased adoption of improved livestock breeds through producer
cooperatives and state farms have led to increased milk production (Ahmed et al., 2003).
The state Dairy Development Enterprise (DDE) still processes milk from various sources
� including food aid � into pasteurized milk, butter, soft cheese, yoghurt, cream milk,
cheese and ice cream. But smallholder marketing cooperatives have increased
substantially as a result of promotion by the Finish International Development
Association, FAO Technical Cooperation Program and the World Food Programme. The
cooperatives purchase milk from both members and non-members, process it into fresh
milk, cream, skim milk, sour milk, butter and cottage cheese, and sell the products to
traders and local consumers. The value-added from processing is then returned as a semi-
annual, lump-sum payment to group members and others who supplied milk to the group
during the period. Holloway et al (2000) find that the groups mitigate some of the
transactions costs that otherwise impede smallholder entry into commercial milk
production. As in the �Operation Flood� example in India, food aid in the form of milk
powder could be used to support the development of more dairy processing units serving

�42�
a larger number of poorer producers. Instead of supplying the DDE with untargeted free
food aid that may create market disincentives, food aid could be sold or given to private
processing units and the proceeds used to develop the smallholder dairy industry.
Rwanda�s entire dairy industry was destroyed during the 1990-94 civil war. Milk
production fell to only 40,000 liters a day in 1999, resulting in a shortfall of 1,835,000
liters a day (Kanuma, 1999). The country continues to import large quantities of milk,
including powdered milk for domestic sale. The demand for NFDM is particularly high in
the country. In recent years, an ACDI/VOCA project has sold NFDM Title II PL 480
food aid shipments from the United States and used the proceeds to support natural
resource management and other projects. But food aid in the form of NFDM could
perhaps be better used to develop Rwanda�s dairy industry. Emphasis could be placed on
the production of value-added products like yoghurt, ice cream, and pastries, on
organizing smallholders into cooperatives following the relatively successful Ethiopian
and Kenyan models, and in facilitating acquisition of necessary storage, transport and
processing equipment, higher yielding breeds and veterinary supplies, thus sustainably
improving smallholder dairy productivity and sowing the seeds for eliminating over time
the need for NFDM food aid flows (and perhaps even commercial dairy imports).
B. Grains Processing Sector: Food aid has affected consumption patterns in
some developing countries. The classic example is West Africa, where massive wheat
and rice food aid shipments in the 1970s, along with rapid urbanization, have changed
eating and food preparation habits, reducing reliance on indigenous coarse grains such as
millet, sorghum and maize (Delgado and Miller, 1985). While the shift towards imported
�superior� cereals supplied by aid and away from domestically produced �inferior�
coarse grains created disincentives for domestic grain producers, it helped stimulate
commercial grain processing in both urban and rural areas. In particular, the increase in
demand for bread and other wheat products resulted in investments in bakeries and other
wheat processing units in several areas in the region, leading to increased employment
and non-farm incomes in both rural and urban areas. Prior to the entry of food aid
shipments, there was insufficient business to justify investment in equipment and training

�43�
by commercial processors and bakers. Food aid helped to make such businesses viable,
with multiplier effects that suggest similar possibilities elsewhere on the continent.
The possibilities of using food aid to stimulate the development of improved
grains processing and bakery industries are intriguing. The increased use of blended and
micronutrient fortified foods in refugee and school feeding programs opens up
possibilities for contracting with recipient country processors, perhaps using raw
commodity to help pay for the processing costs, thereby providing a minimum efficient
scale of operation to justify initial investment in equipment and training. The political
sensitivity of importing whole grain genetically modified (GM) maize similarly raises the
possibility of establishing local mills to grind GM maize into flour, paying part of these
costs in kind with commodities the mill can process and sell.
5.2 Food Aid For Smallholder Productivity Enhancement
Just as food aid can be used to stimulate smallholder and trader investment in
post-harvest marketing and processing capacity, so can it be used to stimulate uptake of
improved natural resources management and production technologies by producers. The
basic principle is simple: target food aid by recipients and by season so as to relieve
smallholders� seasonal liquidity constraints, permitting them to reallocate their labor time
from wage labor employment to productive labor-intensive activities on their own farms
(e.g., constructing soil and water conservation structures) or to purchase productivity-
enhancing inputs (e.g., inorganic fertilizer and other chemicals, hybrid seed, artificial
insemination services for dairy livestock, mechanical traction during field preparation).
Great care has to be taken during the design of such programs in order to ensure they do
not crowd out private investment. In particular, good knowledge about local farming
systems, local market characteristics and prices, and distribution of resources and
welfare, can preempt design failures and generate significant and sustainable gains in
private on-farm investment and in productivity and aggregate output. For example,
Holden et al. (2003) found that the success of FFW investments in stimulating on-farm
soil conservation, sustainable agricultural productivity increases, and income growth

�44�
depends crucially on a number of conditioning factors, including careful identification of
relevant investment projects and of appropriate technology design, local involvement in
implementation and maintenance of investments after the project, clear specification of
property rights to the investments, implementation only where private capacity or
willingness to invest are limited, and timing of projects so as to minimize labor crowding
out. The demands on food aid programmers are indisputably great, but it is plainly
feasible to deploy food aid effectively to help stimulate agricultural productivity, as is
apparent from the national-scale empirical results reported in Section 4.
5.3 Conditions for Success
In order for food aid to be effective in developing recipient country food markets
and stimulating agricultural productivity, a number of accompanying conditions must be
met. First, food aid must increase demand for the final product(s) by enough to sustain or
increase farm incomes. For example, in the case of dairy products, demand comes mainly
from consumers who earn income from non-agricultural activities. Reducing dairy prices by
increasing production would in general help to increase market demand for dairy products.
The demand for dairy products is generally elastic with respect to income and prices. Hence,
even increases in supply could still lead to higher incomes for producers because the
additional revenue gained from greater supply will more than compensate for the reduction
in price. Given the strong growth linkages between agriculture and non-agriculture,
investment and productivity gains outside agriculture, especially improvements in
productivity of the sectors highly linked with agriculture, such as post-harvest processing,
are needed to maximize growth linkages and thereby to advance agricultural market
development goals.
Second, a substantial supply response needs to be achieved. Besides demand side
constraints discussed above, the supply side response is also necessary for successful food
aid for market development. One important prerequisite is that constraints on supply are
identified in advance and that it is feasible to relax these constraints through investments or
other program activities. Here, it is important to understand and alleviate constraints

�45�
throughout the production and marketing chain to enable a significant increase in supply and
producer incomes. For example, the use of local processors to make blended/fortified
products and to mill genetically modified foods can perhaps help to build up domestic
processing capacity, with long-term benefits to the local agricultural sector.
In addition to considering the above conditions, food aid for market development
must satisfy an opportunity cost criterion. That is, not only must the conditions described
above be sufficiently favorable that this modality has a beneficial impact, but also this
beneficial impact must be greater than that which could be achieved by disbursing this aid
using other approaches. This opportunity cost criterion turns fundamentally on the ultimate
objective underlying the transfer. For example, if the primary objective is to help the poor,
then food aid for market development may not stack up well against some more
conventional targeted assistance programs. Food aid for market development will only help
the poor if it links some of the smallest farms or even the landless to new markets (as in
India�s Operation Flood) or if it creates lots of new employment for poor people.

�46�
6. CONCLUSIONS
Although annual food aid shipments to Sub-Saharan Africa have fallen back to the
3-4 million metric tons per year range of the mid-to-late 1970s, global food aid increasingly
focuses on this region of the world. As donors, governments and development agencies all
struggle with problems of persistent poverty and low agricultural productivity in Africa, the
role of food aid attracts ever more attention. There are widespread calls for improved and
more creative use of food aid to promote sustainable rural development in a way that will
also serve to wean countries from food aid naturally.
This paper examined the potential impacts of food aid on food production and the
prospects for using food aid to stimulate downstream market development. In spite of well-
known problems, food aid to Africa has typically had sufficient ameliorative effects through
relief of those constraints and reduction of farmer risk exposure as to have made food
production relatively more remunerative than it would otherwise have been. Put differently,
it seems that the collapse of per capita food productivity in Sub-Saharan Africa over the
decade to the mid-1980s would have been still more severe without the sharp simultaneous
increase in food aid flows to the region.
This core result � that food aid has indeed proved effective on average in relieving
constraints to investment and productivity growth � opens the door to alternative, creative
ways of using aid flows programmed in the form of food � due largely to donor domestic
political pressures (Barrett and Maxwell forthcoming) � to advance the goals of agricultural
and rural development and poverty reduction. There are obvious, familiar risks to using
food aid for market development. Because it expands local food supply, it creates adverse
product price effects. These can be significantly attenuated through effective management,
especially reasonably accurate targeting and timing of food aid to food deficit households
with a high income elasticity of demand for food. But if food aid can be used to relieve
short-term working capital, transport capacity and other constraints to investment and
productivity growth, or if its distribution can be used effectively to help build farmer
cooperative groups that can add value to raw commodities through processing and improved

�47�
marketing, then food aid can and does have salutary effects. From a nutritional and overall
development perspective, there is a strong case for using non-emergency food aid for
seeding the emergence of agro-processing industries in selected Sub-Saharan African
countries, perhaps especially in the dairy subsector. The success of Operation Flood in India
suggests the potential in such uses. More broadly, food aid�s apparent historical success in
stimulating food productivity in Africa suggests that the relatively unheralded factor market
effects of food aid may trump the oft-repeated product market disincentive effects.

�48�
REFERENCES
Abdulai, A. (2000). Spatial Price Transmission and Asymmetry in the Ghanaian Maize Market. Journal of Development Economics, 63: 327-349.
Abdulai, A. and C.L. Delgado. (1995). Re-establishing Agriculture as a Priority for Development Policy in Sub-Saharan Africa. Conference Proceedings. Washington, D.C.: International Food Policy Research Institute.
Ahmed, M.A.M., S. Ehui and Y. Assefa. (2003). Dairy Development in Ethiopia. Environment and Production Technology Division Discussion Paper, Washington, D.C.: International Food Policy Research Institute.
Ahmed, R. and N. Rustagi (1987). Marketing and Price Incentives in African and Asian Countries: A Comparison, in Dieter Elz, ed Agricultural marketing strategy and pricing policy Washington, D.C. : World Bank.
Alderman, H. (1987). Cooperative Dairy Development in Karnataka, India: An Assessment. IFPRI Research Report No. 64. Washington, D.C.
Barrett, C.B. (1995). Madagascar: An Empirical Test of the Market Relaxation - State Compression Hypothesis. Development Policy Review 13 (4): 391-406.
Barrett, C.B. (2001). Does Food Aid Stabilize Food Availability? Economic Development and Cultural Change, 49(2): 335-349.
Barrett, C.B. (2002). Food Security and Food Assistance Programs, in B.L. Gardner and G.C. Rausser, eds. Handbook of Agricultural Economics (Amsterdam: Elsevier Science).
Barrett, C.B. (2003), �Food Aid Effectiveness: �It�s The Targeting, Stupid!�� Policy Service, Strategy and Policy Division, World Food Programme working paper.
Barrett, C.B. and M.R. Carter (2002). Can�t Get Ahead For Falling Behind: New Directions for Development Policy To Escape Poverty and Relief Traps, Choices, 16 (4): 35-38.
Barrett, C.B. and D.C. Clay. (2003). Self-Targeting Accuracy in the Presence of Imperfect Factor Markets: Evidence from Food-For Work in Ethiopia. Journal of Development Studies. 39, 5: 152-180.
Barrett, C.B. and K.C. Heisey. (2002). How Does Multilateral Food Aid Respond to Fluctuating Needs? Food Policy. 27: 477-491.
Barrett, C.B. and D.G. Maxwell (forthcoming). Food Aid After Fifty Years: Recasting Its Role. London: Routledge.
Barrett, C.B. and J.G. McPeak (2003). Poverty Traps and Safety Nets. Cornell University working paper.
Barrett, C.B., S. Mohapatra, and D.L. Snyder. (1999). The Dynamic Effects of U.S. Food Aid. Economic Inquiry, 37(4): 647-656.

�49�
Bezuneh, M., B.J. Deaton and G.W. Norton. (1988). Food Aid Impacts in Rural Kenya. American Journal of Agricultural Economics, 70(1): 181-191.
Bhagwati, J. (1986). Food Aid, Agricultural Production and Welfare, in: S. Guhan and M.R. Shroff, eds. Essays on Economic Progress and Welfare in Honor of I.G. Patel. New Delhi, Oxford University.
Bhagwati, J. and T.N. Srinivasen. (1969). Optimum Policy Intervention to Achieve Non-Economic Objectives. Review of Economic Studies, 27-38.
Candler, W. and N. Kumar. (1998). India: The Dairy Revolution. The Impact of Dairy Development in India and the World Bank Contribution. Washington, D.C.: The World Bank.
Colette, P. (2001). Bellmon Analysis. Monetization of NFDM in Rwanda. ACDI/VOCA: Washington, DC.
Delgado, C.L. (1995). Agricultural Diversification and Export Promotion in Sub-Saharan Africa. Food Policy, 20(3): 225-243.
Dercon, S. (1998), �Wealth, risk and activity choice: cattle in Western Tanzania,� Journal of Development Economics, 55, 1: 1�42.
Devereaux, S. (1988). Entitlements, Availability and Famine: A Revisionists View of Wollo, 1972-74. Food Policy, 13(3).
Donovan, C., R. Myers, D. Tschirly and M. Weber. (1999). The Effects of Food Aid on Maize Prices in Mozambique, in G.H. Peters and J. von Braun, eds, Food Security, Diversification and Resource Management: Refocusing the Role of Agriculture? Proceedings of the Twenty-Third International Conference of Agricultural Economists. Brookfield, VT: Ashgate.
Doornbos, M., F. van Dorsten, M. Mitra and P. Terhal. (1990). Dairy Aid and Development: India�s Operation Flood. Indo-Dutch Studies on Development Alternatives 3. New Delhi/Newbury Park/London: Sage Publications.
Dorosh, P., C. Ninno and D.E. Sahn (1995). Poverty Alleviation in Mozambique: A Multimarket Analysis of the Role of Food Aid. Agricultural Economics, 13(1): 89-99.
Dorosh, P., Q. Shahabuddin, M. Abdul Aziz and N. Farid. (2002). Bumper Crops, Producer Incentives and Persistent Poverty: Implications for Food Aid Programs in Bangladesh. Markets, Trade and Institutions Division Discussion Paper No. 43, Washington, D.C.: International Food Policy Research Institute.
Fan, S and N. Rao. (2003). Public Spending in Developing Countries: Trends, Determination, and Impact. Environment and Production Technology Division Discussion Paper No. 99, Washington, D.C.: International Food Policy Research Institute.
Felleke, G. and G. Geda. (2001). The Ethiopian Dairy Development Policy: A Draft Document. Ministry of Agriculture/AFRDRD/AFRDT Food and Agricultural Organization/SSFF. Addis Ababa, Ethiopia.

�50�
Ferris-Morris, M. (2003). Past and Present Uses of Title II Non-Fat Dry Milk in Humanitarian Operations. Background Paper for United States Agency for International Development: Washington, D.C.
Finkelshtain, I and J.A. Chalfant. (1991). Marketed Surplus Under Risk: Do Peasants Agree with Sandmo? American Journal of Agricultural Economics 73(2):557-567.
Gabbert, S. and H.P. Weikard. (2000). The Poor Performance of the Rich � Bilateral Versus Multilateral Food Aid Allocation. Quarterly Journal of International Agriculture, 39(2): 199-218.
Gabre-Madhin, E., C.B. Barrett and P. Dorosh. (2003). Technological Change and Price Effects in Agriculture: Conceptual and Comparative Perspectives. Markets, Trade and Institutions Division Discussion Paper No. 62, Washington, D.C.: International Food Policy Research Institute.
Golleti, F. and S. Babu. (1994). Market Liberalization and Integration of Maize Markets in Malawi. Agricultural Economics, 11: 311-324.
Granell, T.F. (1986). Ethiopia: Food-For-Work in the Rehabilitation of Forest, Grazing and Agricultural Lands in Ethiopia. Paper presented at WFP/ADB seminar on Food Aid for Development in Sub-Saharan Africa, Abidjan.
Griffen, P. (1979). The Impact of Food Aid � Peru, A Case Study. Food Policy, 4(1): 50.
Haggblade, S. and P. Hazell. (1989). Agricultural Technology and Farm-Nonfarm Growth Linkages. Agricultural Economics, 3: 345-69.
Hanrahan, C.E. (2002). Agricultural Export and Food Aid Programs. Congressional Research Service Issue Brief IB 98006.
Holden, S., C.B. Barrett and F. Hagos. (2003).Food-For-Work for Poverty Reduction and the Promotion of Sustainable Land Use: Can it Work? Cornell University Working Paper.
Holloway, G., C. Nicholson, C.L. Delgado, S. Staal and S. Ehui. (2000). Agroindustrialization through Institutional Innovation Transaction Costs, Cooperatives and Milk-Market Development in the East-African Highlands. Agricultural Economics, 23: 279-288.
Jackson, T. and D. Eade (1982). Against the grain: The dilemma of project food aid. Oxford: OXFAM.
Jaffee, S. (1995). Perishable Profits: Private Sector Dairy Processing and Marketing in Kenya, in: Jaffe S., Morton, J. (Eds.), Marketing Africa�s High-Valued Foods: Comparative Experiences of an Emergent Private Sector, Kendall-Hunt, Dubuque, IA, pp. 199-253.
Jayne, T.S., J.Strauss, T. Yamano and D. Molla. (2001). Giving to the Poor? Targeting of Food Aid in Rural Ethiopia. World Development, 29(5): 887-910.

�51�
Jayne, T.S., J.Strauss, T. Yamano and D. Molla. (2002). Targeting Food Aid in Rural Ethiopia: Chronic Needs or Inertia? Journal of Development Economics, 67: 247-288.
Kanuma, S. 1999. Special Fund to Revive Rwanda Dairy Industry. The East African, July 1999.
Kherallah, M., Delgado, C., Gabre-Madhin, E., Minot, N. and Johnson, M. (2002). Reforming Agricultural Markets: Achievements and Challenges. Baltimore, MD: John Hopkins University Press.
Lavy, V. (1990). Does Food Aid Depress Food Production? The Disincentive Dilemma in the African Context. World Bank Working Paper No. 1406.
Lele, U. (1984). Rural Africa: Modernization, Equity, and Long-Term Development, in: C.K. Eicher and J.M. Staatz (1984) (eds.) Agricultural Development in the Third World.
Maxwell, S. and H.W. Singer. (1979). Food Aid to Developing Countries: A Survey. World Development, 7(3): 225-247.
Mellor, J.W. (1987). Food Aid for Food Security and Economic Development, in Clay, E.J. and J.Shaw (eds.) Poverty, Development and Food, Macmillan, London.
Mellor, J.W. (1985). The Role of Government and New Agricultural Technologies. IFPRI Food Policy Statement 3, Washington.
Mitchell, T.D., Carter, T.R., Jones, P.D., Hulme,M., New, M., 2003: A comprehensive set of high-resolution grids of monthly climate for Europe and the globe: the observed record (1901-2000) and 16 scenarios (2001-2100). Journal of Climate: submitted
Mohapatra, S., C.B. Barrett, D.L. Snyder and B. Biswas. (1999). Does Food Aid Really Discourage Food Production? Indian Journal of Agricultural Economics, 54(2): 212-219.
Msuya, M. (1986). �Food Aid in Development Financing: Some Experiences from ADB Operations.� Paper presented at WFP/ADB seminar on Food Aid for Development in Sub-Saharan Africa, Abidjan.
Negassa, A. (1998). Vertical and Spatial Integration of Maize Markets in Ethiopia: Implications for Grain Market and Food Security Policies. Working Paper No. 9. Ministry of Economic Development and Cooperation, Addis Ababa, Ethiopia.
Organisation for Economic Co-operation and Development (2003), International Development Statistics Online http://www.oecd.org/dataoecd/50/17/5037721.htm
Overseas Development Institute. (2000). Reforming Food Aid: Time to Grasp the Nettle. Briefing Paper. January 2000. Sussex, United Kingdom.
Ouma, E., S.J. Staal, A. Omore, L. Njoroge, E.K. Kangethe, S.M. Arimi and D. Njubi. (2000). Consumption Patterns of Dairy Products in Kenya. Smallholder Dairy Project. International Livestock Research Instiute: Nairobi.

�52�
Schultz, T.W. (1960). Value of U.S. Farm Surpluses to Underdeveloped Countries. Journal of Farm Economics, 42(5): 1019-1030.
Shaw, D.J. and H.W. Singer. (1996). A Future Food Aid Regime: Implications of the Final Act of the Uruguay Round. World Development, 21(4/5): 447-460.
Sen, A.K. (1981). Poverty and Famines, Clarendon Press, Oxford.
Skees, J., P. Hazell and M. Miranda. (1999). New Approaches to Crop Yield Insurance in Developing Countries. Environment and Production Technology Division Discussion Paper No. 106, Washington, D.C.: International Food Policy Research Institute.
Srinivason, T.N. (1989). Food Aid: A Cause of Development Failure or an Instrument for Success? World Bank Economic Review, 3(1): 39-65.
Staal, S., C.L. Delgado and C. Nicholson. (1997). Smallholder Dairying Under Transaction Costs in East Africa. World Development, 25(5): 779-794.
Stewart, F. (1988). Adjustment with a Human Face: the Role of Food Aid. Food Policy, 13(1).
United States Department of Agriculture. (2001). Report to Congress on Food Aid Monetization. Foreign Agricultural Service, USDA.
von Braun, J. and B. Huddleston. (1988). Implications of Food Aid for Price Policy in Recipient Countries, in: J.W. Mellor and R. Ahmed, eds. Agricultural Price Policy for Developing Countries. Baltimore: John Hopkins University Press.
von Braun, J., T. Teklu and P. Webb (1999), Famine in Africa: Causes, Responses, and Prevention, Johns Hopkins University Press, Baltimore MD.
World Food Program. (1987). Food Aid: Policies and Programs, World Food Program, Rome.
World Food Program/African Development Bank. (1987). Food Aid for Development in Sub-Saharan Africa, Report on the WFP/ADB Seminar on Food Aid for Development in Sub-Saharan Africa, Abidjan.
Zeitlin, M. (1987). Interim Evaluation Report prepared on AID-ORT Food For Peace, MCH Component Area Nutrition Improvement Project.
Zimmerman, F.J. and M.R. Carter (2003), �Asset smoothing, consumption smoothing and the reproduction of inequality under risk and subsistence constraints,� Journal of Development Economics 71, 2: 233-260.

�53�
TECHNICAL APPENDIX
Given that past levels of food production may help predict current level of food
aid, and vice versa, the VAR relationship can be specified as:
tkt
n
kkkt
n
kkt FAFPFP εβαα +∑+∑+= −
=−
= 110 (1)
tkt
m
kkkt
m
kkt FPFAFA µβαα +∑+∑+= −
=−
= 1
'
10 '' (2)
where FP and FA are domestic food production and food aid inflows, respectively; α0,
0'α , kα , k'α , βk and 'kβ are parameters to be estimated and εt and µt are error terms. The
combination of time series of food production and food aid across countries in Sub-
Saharan Africa to obtain a panel data to estimate equations (1) and (2) imposes the
assumption that the underlying structural relationship between food aid and food
production is the same for each country in the sample (Lavy, 1990; Barrett et al., 1999).
Time-invariant country specific effects in the equations (1) and (2) summarize the
influence of unobserved variables such as infrastructure, period average climate, soils,
elevation, history, and culture that might persistently affect the volatility of food
production and food aid flows.
Thus, quations (1) and (2) can be rewritten as:
itikit
n
kkkit
n
kkit FAFPFP εηβαα ++∑+∑+= −
=−
= 110 (3)
itikit
m
kkkit
m
kkit FPFAFA µξβαα ++∑+∑+= −
=−
= 1
'
10 '' (4)
where ηi and ξi are the country-specific effects, which are assumed to be distributed
independently across countries, with variance 2ησ and 2
ξσ . In the presence of correlations
between the country-specific effects and the lagged FA and FP variables, ordinary least
squares (OLS) and generalized least squares (GLS) will yield biased estimates. The
traditional technique to overcome this problem is to eliminate the individual effects in the

�54�
sample by transforming the data into first differences or deviations from individual
means, and then estimating by OLS.
However, if this first differences or �fixed effects� estimator is used, there may
still be a simultaneity problem because past levels of food production or food aid may be
correlated with the past error terms. This can be illustrated by considering the first
difference versions of equations (3) and (4):
)()()( 111
11
1 −−−−=
−−−=
− −+−∑+−∑=− ititkitkit
n
kkkitkit
n
kkitit FAFAFPFPFPFP εεβα (5)
)()()( 111
'1
1
'1 −−−−
=−−−
=− −+−∑+−∑=− ititkitkit
m
kkkitkit
m
kkitit FPFPFAFAFAFA µµβα (6)
In equations (5) and (6), the lagged values of food production (FPt-1) and food aid (FAt-
1) are correlated with the lagged error terms εt-1 and µt-1, leading to correlation between
the regressors and the error terms. An instrumental variables estimator or generalized
method of moments (GMM) approach will, however, yield unbiased estimates. Holtz-
Eakin et al. (1988) demonstrate that in the absence of cross-sectional heteroskedasticity
in the errors, first differencing and instrumental variables estimator can be employed to
obtain consistent parameter estimates.13 Equations (5) and (6) were estimated with the
GMM approach, using annual rainfall and yearly dummies for disaster as control
variables. The estimated equations are specified as:14
itkits
kkkit
n
kkkit
n
kkit YRFFAFPFP ηδγβαα ∆++∑+∆∑+∆∑+=∆ −
=−
=−
= 1110 (7)
itkits
kkkit
m
kkkit
m
kkit YRFFPFAFA ξδγβαα ∆++∑+∆∑+∆∑+=∆ −
=−
=−
= 1110 (8)
where RF and Y represent rainfall and yearly disaster dummies, respectively; γ and δ are
parameters to be estimated. The yearly dummies for disasters are constructed such that Y
13 Anderson and Hsiao (1982) have also suggested the use of this transformation for estimation of univariate autocorrelation models in panel data. 14 In a recent paper, Blundell and Bond (1998) demonstrate the importance of exploiting initial condition information in generating efficient estimators for dynamic panel data models where the number of time series observations is small. Our time series is over 30 years and therefore does not suffer from small number of observations.

�55�
takes the value of one in years where a country experienced a natural or human disaster,
otherwise it takes the value of zero.
The specification employed does not include information on factors such as soil
quality or production technology that may affect food production but for which we have
no data. These factors must be treated as country-specific effects. However, given that the
estimation approach employed here uses differencing, the time invariant component of
these effects gets eliminated and thus cross-sectional differences in soil quality, irrigation
infrastructure, etc. pose no problem in our estimation. Given controls for annual variation
in rainfall and disasters, it is unlikely that there remain significant unobserved covariates
that are correlated with both food aid and food production. After estimating the model
using the entire 1970-2000 sample, it was re-estimated for two sub-samples, 1970-85 and
1986-2000 to capture the potential for structural change over time in the food aid-
production relationship due to significant shifts in food aid procurement and distribution
modalities in Sub-Saharan Africa in the latter period.
As stated by Holtz-Eakin et al. (1988), two important questions in this estimation
are whether the data are consistent with a lag length m and whether food aid causes food
production.15 It therefore makes sense to think of testing for noncausality conditional
upon the outcome of a test for the lag length. The appropriate lag length is determined by
starting with an arbitrary but long lag, then reestimating the equation with successively
shorter lag lengths. Varying the lag length can be considered a constraint that can be
tested by considering the fact that the difference in the unconstrained and constrained
sum of squared residuals has a chi-squared distribution.16 For the estimations with the
whole sample, a lag length of four (m = 4) was found to be appropriate for both food
15 The Im, Pesaran and Shin (1997) panel unit root test could not reject the null hypothesis of unit root in the food aid and food production variables. The two variables were therefore specified in first differences. 16 If Q is the unrestricted sum of squared residuals and QR is the restricted sum of squared residuals, each of them will have a chi-square distribution. The appropriate test statistic is QQL R −= . L has a chi-squared distribution with degrees of freedom equal to the degrees of freedom of QR minus the degrees of freedom of Q.

�56�
production and food aid, while a lag length of three (m = 3) was found to be suitable for
each of the two subsamples.
Based on the m = 4, Granger causality tests to were carried out for the entire
sample to establish the direction of causality between food aid and food production. The
F-statistic for the null hypothesis that changes in food aid do not affect changes in food
production � i.e., that )1(' mkk K=β = 0 in equation (6) � was 6.51 with four degrees of
freedom, against a critical value of 2.37. The F-statistic for the null hypothesis that
changes in food production do not affect changes in food aid was 5.28 (against the same
critical value of 2.37). We can reject both null hypotheses: that food production does not
Granger cause food aid flows and that food aid does not Granger cause food production,
suggesting bidirectional causality between food aid and food production and reinforcing
the use of the GMM approach.
To obtain consistent estimates, each regression employed instruments of one
period lags. For example, in the first run (in the first column), with n = 5, the instrument
is lagged from t-2 to t-6, while in the second column with n = 4, the instrument is lagged
from t-2 to t-5. The parameters are estimated with the generalized method of moments
(GMM) estimator developed by Hansen (1982) and White (1982). This estimator is
efficient and allows for conditional heteroskedasticity in the errors.17
17 This estimation strategy is similar to that of approach proposed by Griliches and Hausman (1986) in the presence of endogeneity and measurement error.

�57�
LIST OF DISCUSSION PAPERS
No. 01 �Market Opportunities for African Agriculture: An Examination of Demand-Side Constraints on Agricultural Growth� by Xinshen Diao, Paul Dorosh, and Shaikh Mahfuzur Rahman with Siet Meijer, Mark Rosegrant, Yukitsugu Yanoma, and Weibo Li.
No. 02 �Exploring Regional Dynamics in Sub-Saharan African Agriculture� by Xinshen Diao and Yukitsugu Yanoma.
No. 03 �The Effect of WTO and FTAA on Agriculture and the Rural Sector in Latin America� by Samuel Morley and Valeria Piñeiro.
No. 04 �Public Expenditure, Growth, and Poverty Reduction in Rural Uganda� by Shenggen Fan, Xiaobo Zhang, and Neetha Rao.