Embed Size (px)
Citation preview

J. Fluid Mech. (2014), vol. 746, pp. 193–213. c© Cambridge University Press 2014doi:10.1017/jfm.2014.121
193
Formation of particle clouds
B. Zhao1,2, A. W. K. Law1,2,†, E. E. Adams3 and J. W. Er1
1School of Civil and Environmental Engineering, Nanyang Technological University,50 Nanyang Avenue, 639798, Republic of Singapore
2DHI-NTU Centre, Nanyang Environment and Water Research Institute,Nanyang Technological University, 1 Cleantech Loop, 637141, Republic of Singapore
3Department of Civil and Environmental Engineering, Massachusetts Institute of Technology,Cambridge, MA 02139, USA
(Received 25 September 2013; revised 21 February 2014; accepted 27 February 2014)
In the literature, it has been conceptualized that a group of dense particles releasedinstantaneously into homogeneous stagnant water would form a circulating vortexcloud and descend through the water column as a thermal. However, Wen &Nacamuli (Hydrodynamics: Theory and Applications, 1996, pp. 1275–1280) observedthe formation of particle clumps characterized by a narrow, fast-moving core sheddingparticles into the wake. They found clump formation to be possible even for particlesin the non-cohesive range as long as the source Rayleigh number was large (Ra> 103)or, equivalently, the source cloud number was small (Nc< 3.2× 10⁻²). This physicalphenomenon has not been investigated further since the experiments of Wen andNacamuli. In the present study, the relationship between Nc and the formationprocess is examined more systematically. The theoretical support for cloud numberdependence is explored by considering flows passing a porous sphere. Here Nc valuesranging from 2.9× 10⁻³ to 5.9× 10⁻² are tested experimentally using particles withdifferent initial masses and grain sizes, from non-cohesive to marginally cohesive.The formation processes are categorized into cloud formation, a transitional regimeand clump formation, and their distinct features are presented through qualitativedescription of the flow patterns and quantitative assessment of the gross characteristics.
Key words: convection, plumes/thermals
1. IntroductionDuring land reclamation and dredged material disposal, large amounts of sediment
are dumped into the aquatic environment. The sediment can be discharged eitherinstantaneously (e.g. by clamshell buckets or split barges) or continuously (e.g. throughpipelines). The subsequent underwater behaviour is closely related to the sourceconditions. In the past, these particles have been conceptualized to descend as agroup and form a particle cloud (Rahimipour & Wilkinson 1992; Li 1997; Ruggaber2000; Bush, Thurber & Blanchette 2003; Zhao et al. 2012; Gensheimer, Adams &Law 2013; Zhao et al. 2013a). As illustrated in figure 1, the conceptualization ofthe convective descent process can be categorized into three phases (Rahimipour &Wilkinson 1992): (i) a relatively short initial acceleration phase, within which the
† Email address for correspondence: [email protected]

194 B. Zhao, A. W. K. Law, E. E. Adams and J. W. Er
Initial acceleration phase(a) (b)
Self-preserving phase
Dispersive phase
FIGURE 1. A particle cloud descending through homogeneous stagnant water; (a) aschematic diagram (dashed lines indicate the self-similar growth path of the particlethermal); (b) images of a typical laboratory particle cloud.
particles accelerate as a solid sphere; (ii) a self-preserving phase, within which theparticles form a cloud growing self-similarly in shape due to turbulent entrainment;and (iii) a dispersive phase, within which the individual particles descend at theirsettling velocities. During the self-preserving phase, the particle cloud behavessimilarly to a single-phase miscible thermal (Scorer 1957; Turner 1973), which ischaracterized by coherent vortex ring structures. Here, the above process is referredto as cloud formation, which is ‘thermal-like’.
As the particle cloud grows due to turbulent entrainment, the transfer of momentumto the entrained ambient stagnant water results in a continuous decay in the vortexstrength and a decrease in the vertical descent velocity. During the process, thesolid phase gradually separates from the entrained fluid phase as individual particles(Lai et al. 2013). The particles then settle in a dispersed manner and can easilybe carried away by ambient flows. Gensheimer et al. (2013) found also that thecoherent vortex structure would be completely destroyed or never be formed with theexistence of strong ambient currents, while the effect of ambient waves was foundto be less significant by Zhao et al. (2013a). To characterize the transition from theself-preserving phase to the dispersive phase, Rahimipour & Wilkinson (1992) defineda cloud number (Nc) as the ratio of the settling velocity (ws) of individual particlesto the characteristic circulation velocity (wt) within the particle thermal,
Nc= ws
wt= ws√
B0/r∝ wsr
r0√
r0∆g. (1.1)
Here wt =√B0/r; r is the bulk radius of the particle cloud underwater; B0=V0∆g isthe total kinematic buoyancy excess, where V0 is the total volume of solid particles;r0 = [(3V0)/(4(1− n)π)]1/3 is the initial equivalent radius of a sphere with thesame total volume as the particle, including void space, where n is the void ratio andassumed to be constant here for particles initially at the settled state; ∆= (ρs − ρa)/ρais the normalized density difference; and g is the gravitational acceleration. As theparticle cloud descends, the bulk size grows due to the turbulent entrainment ofambient water. With a constant total buoyancy excess, Nc increases as wt decreasesaccording to (1.1). Rahimipour & Wilkinson (1992) found that the growth rate was

Formation of particle clouds 195
a function of Nc when Nc < 1, and the rate became very small once Nc reachedapproximately 1.5.
The formation of a particle thermal is of particular importance because of its abilityto retain the dense particles inside the vortex structure, which is formed due to theinternal density gradient and shear force at the density interface in a manner similarto a single-phase miscible thermal (Zhao et al. 2013b). Thus, the discrete particlesare trapped inside the large eddies and descend as a group with a bulk velocity muchhigher than the individual particle settling velocity. The particle loss from the trailingstem has also been found to be negligible due to the high entrainment velocity at therear of the particle thermal (Ruggaber 2000).
Owing to the transient nature of instantaneous releases, the subsequent formationprocess is highly dependent on the initial conditions. Wen & Nacamuli (1996)conducted an experimental study and observed particle clouds with distinct features.They formulated three non-dimensional parameters based on source conditions, andfound that the formation process correlated most closely with a Rayleigh number(Ra) defined as follows:
Ra= B0/r20
w2s
= 1Nc2
r=r0
, (1.2)
which can be expressed in terms of the cloud number defined based on the sourcecondition (i.e. r = r0). Their experimental results showed that when Ra < 103, theparticles formed a vortex ring or cloud; when Ra approached 103, a clump formed atthe beginning but subsequently collapsed into a cloud; and when Ra> 103, the clumpfeature became more prominent. During the clump formation, they observed thatthe particles formed a narrow, fast-moving, particle-rich core that continuously shedparticles into the wake, which is referred to as ‘wake-like’ here. Thus, the higherthe value of Ra (or the lower the value of Nc), the more wake-like the formation issupposed to be.
It has commonly been reported in the literature that dense particles releasedinstantaneously would behave like a thermal, and so far the observation of clumpformation and wake-like phenomena has been made only by Wen & Nacamuli(1996). It is therefore worthwhile to first review previous studies and examine whyclump formation has rarely been reported. The conditions of previous experimentalstudies on three-dimensional particle clouds are summarized in table A.1 in theAppendix. It can be seen that most of the cases are within the cloud formationregime (i.e. Nc> 3.2× 10⁻² or equivalently Ra< 103 as noted by Wen & Nacamuli(1996)). However, a few cases fall within the clump formation regime according to therespective cloud numbers. Ruggaber (2000) examined conditions with cloud numberdown to O(10−4) but did not observe clear clump formation. This might be attributedto the fact that in order to achieve a smooth release, he mixed the particles initiallywith water and then released them in suspension by constant stirring, which preventedthe formation of clumps and subsequent wake-like phenomenon. Gensheimer et al.(2013) adopted the same source conditions as those of Ruggaber (2000) during theirinvestigation of particle clouds in ambient currents. Therefore, their experimentalconditions are not repeated in table A.1. Bush et al. (2003) performed experimentswith Nc ranging from 1.0× 10⁻² to 2.2× 10⁻¹. Their releases were from a funnel, andpulling up the plug might have affected the initial compactness and the subsequentformation process. Deguen, Olson & Cardin (2011) also reported one case with acloud number down to O(10−5). Their experimental images (cf. figure 5(c)) seem tosuggest the existence of particle clumps, but due to the relatively small experimental

196 B. Zhao, A. W. K. Law, E. E. Adams and J. W. Er
domain, vortical motion and mixing very quickly became dominant after the particlesreached the bottom of a spherical flask. Some doubts also remain in regard to oneof Wen & Nacamuli’s cases on cloud formation (second line under Wen & Nacamuli(1996) in table A.1, with text struck through), which had a cloud number even lowerthan the other clump formation cases. That particular condition is not consideredhere due to the limited information available. Despite its pioneering findings, thescope of the Wen & Nacamuli (1996) study was mostly qualitative and preliminary,and the selection of Ra as the governing parameter was highly empirical. No furtherinvestigation was undertaken by Wen & Nacamuli or other researchers afterwards asfar as we are aware.
The primary goal of the present study is to confirm the existence and raisethe significance of clump formation. To further reveal the mechanism, the grosscharacteristics of particle clouds undergoing various formation processes are assessedthrough a novel integrated view approach and compared in both qualitative andquantitative ways. In the following, the cloud number dependence is first examinedtheoretically in § 2; the experimental methodology is introduced in § 3; experimentalobservations on the formation process and the behaviour of gross characteristics aredescribed in § 4; and finally, a summary of the results is presented in § 5.
2. TheoryWhen dense particles are released in a settled state, they start as a clump and
accelerate from rest due to gravity. The clump can continue to descend either asa particle-dense core or as a diluted and well-mixed cloud. The process essentiallydepends on the capability of the ambient water to flow through the solid phase. Ifthe interstitial space between particles is small enough that it is hard for entrainedwater to move through, the flow tends to go around the clump and peel off someparticles around the surface, which leads to wake-like clump formation. However, ifthe pore size is large enough, the flow goes through and destroys the clump. Thedetails of clump breakup and dilution are too complicated to be fully resolved at themoment, so the present discussion will be limited to the onset condition of clumppreservation or dilution by formalizing the problem as a flow passing a porous sphere.The level of flow resistance will be estimated by considering the hydraulic gradientacross the sphere and the associated seepage velocity based on dimensional arguments.By examining two asymptotic conditions, the cloud number is shown to govern theformation of a particle cloud.
Here, the free stream velocity U is assumed to be proportional to the previouslydefined characteristic circulation velocity (wt), which is also a characteristic clouddescent velocity. With a bulk radius of r= r0, it can be derived that
U ∝wt ∝√
B0
r0∝√r0∆g. (2.1)
The drag force around the porous sphere can be calculated as
FD = 12ρaCDAU2 (2.2)
where CD is the drag coefficient and A is the projection area. A bulk Reynolds numbercan be defined as
Re= wtr0
ν=√
B0
ν, (2.3)

Formation of particle clouds 197
which is normally within the turbulent range in the context of sediment disposalin water for both laboratory experiments and field applications. Based on theexperimental conditions listed in table A.1, the bulk Reynolds number can be foundto vary in the range from 1.7× 10³ to 5.4× 10⁴, and will be much higher for fieldconditions with even larger buoyancy. Therefore, CD is assumed to be constant andthe average head loss across the sphere can be estimated by
hL = FD
ρagA∝ U2
g. (2.4)
It is assumed that the flow through the porous sphere is mainly driven by the hydraulicgradient, i, which should be expressed in the following form based on Darcy’s law:
i∝ hL
2r0∝ U2
gr0. (2.5)
To estimate the characteristic seepage velocity induced by the above hydraulicgradient, we will borrow notation from studies of flow through a packed sediment bed.The pressure loss during one-dimensional flow through a packed bed consists of bothviscous energy loss and inertial loss, and the amount per unit length (i.e. equivalenthydraulic gradient) can be calculated by Ergun’s equation in the following format(Ergun 1952; Niven 2002; Cheng 2003):
i= c1ν
gd2p
us + c21
gdpu2
s , (2.6)
where c1 and c2 are constants depending on the porosity and sphericity of the particles,dp is the particle diameter, and us is the seepage velocity, which can be estimated byinversely applying the above equation. Although both terms on the right-hand sideof (2.6) may be important in reality, only the asymptotic cases are discussed here.In the limit of small particle size, the nonlinear term due to inertia can be ignored.Substituting the expressions from (2.1) and (2.5) into (2.6) and rearranging yields(us
U
)Lin∝ (∆g)1/2d2
p
νr1/20
. (2.7)
At the other extreme of large particle size, only the nonlinear inertia term is retained.Repeating the above substitution yields(us
U
)NL∝(
dp
r0
)1/2
. (2.8)
The seepage velocity normalized by the free stream velocity represents the relativeease of flow through the porous sphere. To the extent that this ease is inverselycorrelated with the tendency for clump formation, we expect wake-like behaviourto increase with decreasing us/U. It can be noted that both (2.7) and (2.8) suggestan increasing tendency for particle clumping as r0 increases and dp decreases. Thedensity difference (∆) is also important when viscous effects dominate.
The focus of the discussion will now shift back to the definition of cloud number,which, from (1.2), is given by
Nc= ws√B0/r0
∝ ws√∆gr0
. (2.9)

198 B. Zhao, A. W. K. Law, E. E. Adams and J. W. Er
For small particle sizes (i.e. Stokes flow), the settling velocity of a spherical particlecan be calculated as (Lamb 1993)
ws = 118∆gν
d2p ∝
∆gν
d2p. (2.10)
Substituting dp from (2.10) into (2.7) yields(us
U
)Lin∝ ws√
∆gr0∝Nc. (2.11)
For large particle sizes, the settling velocity of a spherical particle can be calculated bybalancing the gravity, buoyancy force and drag force; for a constant drag coefficient,it can be expressed as
ws =(
4∆gdp
3CD
)1/2
∝ (∆gdp)1/2
. (2.12)
Substituting dp from (2.12) into (2.8) yields(us
U
)NL∝ ws√
∆gr0∝Nc. (2.13)
Therefore, the above derivation suggests that the formation process (i.e. thepreservation or dilution of a particle clump) is governed by the cloud number for thefull range of particle sizes under turbulent conditions. The settling velocity (ws) inthe definition of the cloud number helps to incorporate the nonlinearity introducedby the density difference (∆) and to provide a smooth transition.
Wen & Nacamuli (1996) suggested that the tendency to form particle clumpsincreases with decreasing Nc. Based on the above definition of cloud number, Ncdecreases as ws decreases (or as ∆g or r0 increases). Considering the limit of verysmall ws (i.e. low relative velocity between the solid-particle and fluid phases), theflow in a well-mixed particle cloud will behave like the release of a single-phasebuoyant fluid and form a classic buoyant vortex ring or thermal (Scorer 1957; Turner1973) with no clumping. Therefore, we suspect that the wake-like phenomenon couldbe related to the tendency of particles to form clumps (even if the particle sizesare not in the cohesive range) rather than their small settling velocity. The settlingvelocity is simply a reflection of the combined effect of particle size and densitydifference. It will be shown later that non-cohesive particles indeed form clumps, asobserved during the present experiments.
3. Experiments3.1. Experimental set-up
The experiments were conducted by releasing a finite mass of heavy particlesinstantaneously into stagnant ambient water. As discussed earlier, the settling velocity(ws) is a function of both particle size (dp) and reduced gravity (∆g), and the totalbuoyancy excess (B0) is a function of both the initial length scale (r0) and ∆g. Thus,in laboratory experiments, the cloud number can be varied by changing any of thethree parameters dp, r0 and ∆g. However, a change in ∆g results in simultaneousvariations of ws and B0 in the same direction, thus making it less flexible to vary
Formation of particle clouds 199
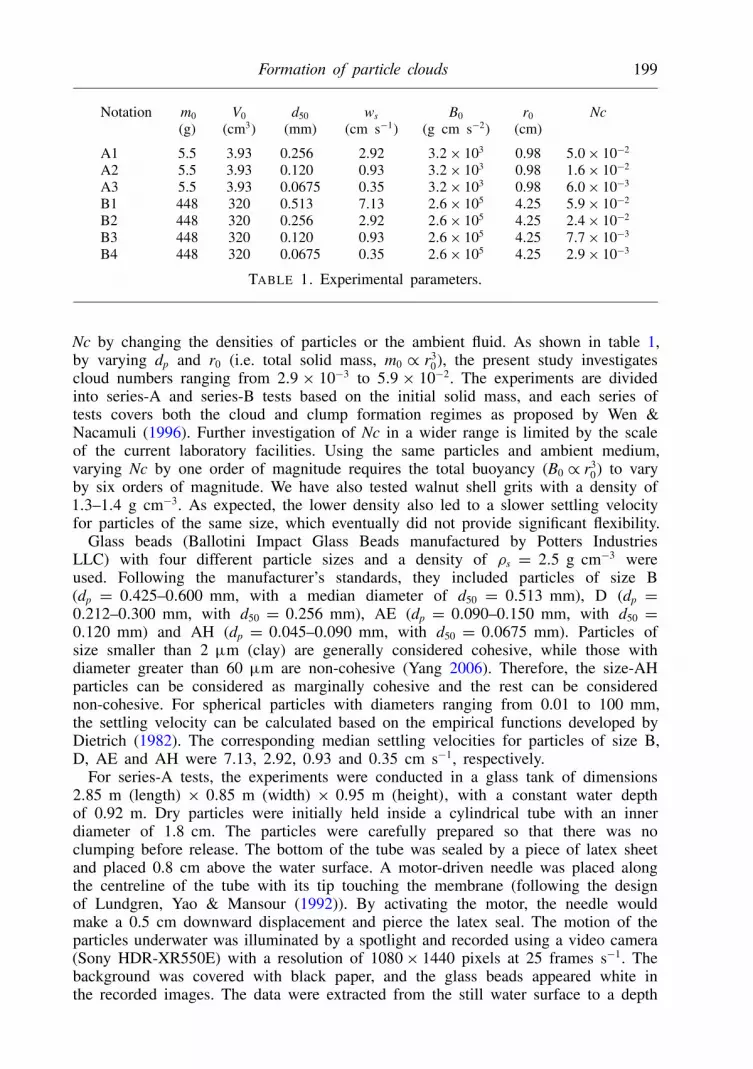
Notation m0 V0 d50 ws B0 r0 Nc(g) (cm3) (mm) (cm s−1) (g cm s−2) (cm)
A1 5.5 3.93 0.256 2.92 3.2× 10³ 0.98 5.0× 10⁻²
A2 5.5 3.93 0.120 0.93 3.2× 10³ 0.98 1.6× 10⁻²
A3 5.5 3.93 0.0675 0.35 3.2× 10³ 0.98 6.0× 10⁻³
B1 448 320 0.513 7.13 2.6× 10⁵ 4.25 5.9× 10⁻²
B2 448 320 0.256 2.92 2.6× 10⁵ 4.25 2.4× 10⁻²
B3 448 320 0.120 0.93 2.6× 10⁵ 4.25 7.7× 10⁻³
B4 448 320 0.0675 0.35 2.6× 10⁵ 4.25 2.9× 10⁻³
TABLE 1. Experimental parameters.
Nc by changing the densities of particles or the ambient fluid. As shown in table 1,by varying dp and r0 (i.e. total solid mass, m0 ∝ r3
0), the present study investigatescloud numbers ranging from 2.9 × 10⁻³ to 5.9 × 10⁻². The experiments are dividedinto series-A and series-B tests based on the initial solid mass, and each series oftests covers both the cloud and clump formation regimes as proposed by Wen &Nacamuli (1996). Further investigation of Nc in a wider range is limited by the scaleof the current laboratory facilities. Using the same particles and ambient medium,varying Nc by one order of magnitude requires the total buoyancy (B0 ∝ r3
0) to varyby six orders of magnitude. We have also tested walnut shell grits with a density of1.3–1.4 g cm−3. As expected, the lower density also led to a slower settling velocityfor particles of the same size, which eventually did not provide significant flexibility.
Glass beads (Ballotini Impact Glass Beads manufactured by Potters IndustriesLLC) with four different particle sizes and a density of ρs = 2.5 g cm−3 wereused. Following the manufacturer’s standards, they included particles of size B(dp = 0.425–0.600 mm, with a median diameter of d50 = 0.513 mm), D (dp =0.212–0.300 mm, with d50 = 0.256 mm), AE (dp = 0.090–0.150 mm, with d50 =0.120 mm) and AH (dp = 0.045–0.090 mm, with d50 = 0.0675 mm). Particles ofsize smaller than 2 µm (clay) are generally considered cohesive, while those withdiameter greater than 60 µm are non-cohesive (Yang 2006). Therefore, the size-AHparticles can be considered as marginally cohesive and the rest can be considerednon-cohesive. For spherical particles with diameters ranging from 0.01 to 100 mm,the settling velocity can be calculated based on the empirical functions developed byDietrich (1982). The corresponding median settling velocities for particles of size B,D, AE and AH were 7.13, 2.92, 0.93 and 0.35 cm s−1, respectively.
For series-A tests, the experiments were conducted in a glass tank of dimensions2.85 m (length) × 0.85 m (width) × 0.95 m (height), with a constant water depthof 0.92 m. Dry particles were initially held inside a cylindrical tube with an innerdiameter of 1.8 cm. The particles were carefully prepared so that there was noclumping before release. The bottom of the tube was sealed by a piece of latex sheetand placed 0.8 cm above the water surface. A motor-driven needle was placed alongthe centreline of the tube with its tip touching the membrane (following the designof Lundgren, Yao & Mansour (1992)). By activating the motor, the needle wouldmake a 0.5 cm downward displacement and pierce the latex seal. The motion of theparticles underwater was illuminated by a spotlight and recorded using a video camera(Sony HDR-XR550E) with a resolution of 1080× 1440 pixels at 25 frames s−1. Thebackground was covered with black paper, and the glass beads appeared white inthe recorded images. The data were extracted from the still water surface to a depth

200 B. Zhao, A. W. K. Law, E. E. Adams and J. W. Er
of 80 cm with a spatial resolution of 0.09 cm pixel−1. For series-B tests, similarexperimental procedures were followed except that the experiments were conducted ina different glass tank, of dimensions 2.4 m (length)×1.2 m (width)×2.2 m (height),with a greater water depth of 2.1 m; the particles were held inside a larger cylindricaltube (with inner diameter 7.8 cm) placed 3.5 cm above the water surface, and werereleased by pulling a board initially covering the bottom of the tube. Each test wasconducted five times to ensure repeatability.
The motion of instantaneously released particles is dominated by the total buoyancyexcess, B0. Characteristic scales are defined as
Ln = B1/30 g−1/3, Tn = B1/6
0 g−2/3, Un = B1/60 g1/3 (3.1)
and are used to normalize the experimental results under different conditions.Substituting in the current experimental parameters, for series-A tests we haveLn = 1.49 cm, Tn = 0.039 s and Un = 38.2 cm s−1; and for series-B tests we haveLn = 6.46 cm, Tn = 0.081 s and Un = 79.6 cm s−1. Although the actual dimensionsare larger, the normalized field of view for series-B tests is actually smaller thanthat for series-A tests. In the present study, the physical references are set at the stillwater surface (z= 0) and the time of release (t = 0), and the downward direction ischosen as positive.
3.2. Parametric analysisAs summarized in table A.1, the existing laboratory experimental studies mainlycovered cases where the released particles formed a particle thermal (i.e. cloudformation). Assuming the formation of particle clumps can be triggered given a smallenough cloud number, its significance in actual field conditions can then be assessedto provide some indication as to the practical importance during sediment disposal.
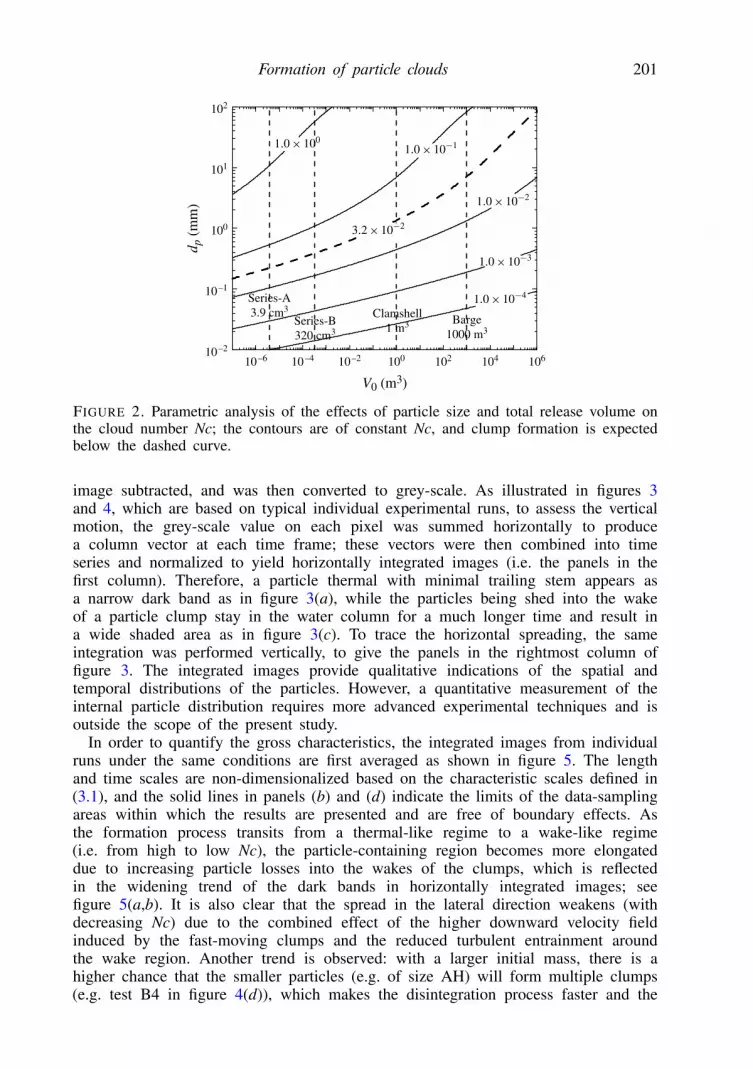
A parametric study was performed, with results shown in figure 2, to reveal theeffects of particle size and total release volume (i.e. total mass) on Nc. The densityof sediment is assumed to be 2.65 g cm−3. Here, the value of Nc is primarilydetermined by the particle size (i.e. settling velocity). Assuming Nc ≈ 3.2 × 10⁻² tobe the threshold for clump formation, the release of fine sand (with dp ≈ 0.1 mm)from a clamshell bucket (with a typical volume of V0 ≈ 1 m3) would result inwake-like behaviour. The release of larger volumes (e.g. from a split barge with atypical volume of V0 ≈ 1000 m3) would cause the wake formation to happen witheven larger sediment sizes. Therefore, clump formation with small Nc is likely to bea common occurrence in field operations.
3.3. Integrated view analysisAs shown earlier in figure 1, with the formation of a particle thermal, the solidparticles descend as a group with a self-preserving elliptical shape. In previous studies,the behaviour of particle clouds was usually quantified by their gross characteristics,which include the maximum radius of the elliptical particle cloud and the descentvelocity of the frontal or centroid position. However, as shown in this section, themotion of particle clumps is highly irregular, and thus the identification of suchcharacteristics can be difficult. Inspired by work of Burridge & Hunt (2012), thepresent study introduces an integrated approach, which provides a common frameworkfor comparing the behaviours of particle thermals and clumps. In the post-processing,each image frame recorded by the video camera first had a constant background
Formation of particle clouds 201
102
101
100
100
10–1
d p (
mm
)
V0 (m3)
10–2
10–6 10–4 10–2 100 102 104 106
Series-A3.9 cm3
Series-B320 cm3
Clamshell1 m3 Barge
1000 m3
FIGURE 2. Parametric analysis of the effects of particle size and total release volume onthe cloud number Nc; the contours are of constant Nc, and clump formation is expectedbelow the dashed curve.
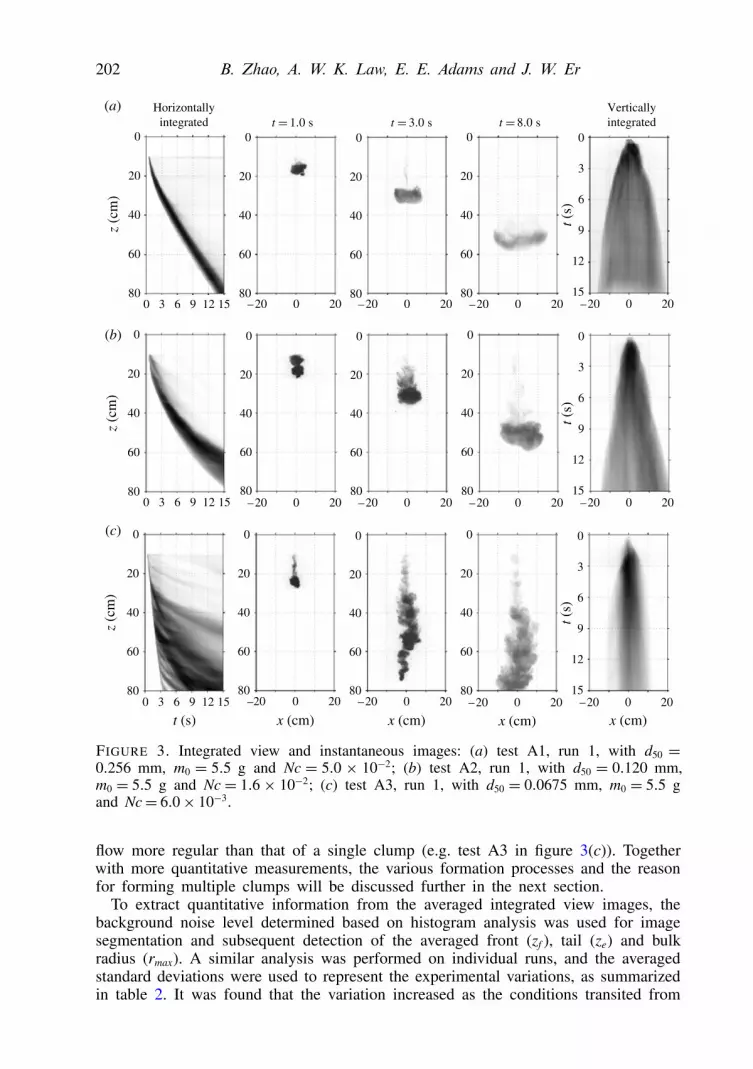
image subtracted, and was then converted to grey-scale. As illustrated in figures 3and 4, which are based on typical individual experimental runs, to assess the verticalmotion, the grey-scale value on each pixel was summed horizontally to producea column vector at each time frame; these vectors were then combined into timeseries and normalized to yield horizontally integrated images (i.e. the panels in thefirst column). Therefore, a particle thermal with minimal trailing stem appears asa narrow dark band as in figure 3(a), while the particles being shed into the wakeof a particle clump stay in the water column for a much longer time and result ina wide shaded area as in figure 3(c). To trace the horizontal spreading, the sameintegration was performed vertically, to give the panels in the rightmost column offigure 3. The integrated images provide qualitative indications of the spatial andtemporal distributions of the particles. However, a quantitative measurement of theinternal particle distribution requires more advanced experimental techniques and isoutside the scope of the present study.
In order to quantify the gross characteristics, the integrated images from individualruns under the same conditions are first averaged as shown in figure 5. The lengthand time scales are non-dimensionalized based on the characteristic scales defined in(3.1), and the solid lines in panels (b) and (d) indicate the limits of the data-samplingareas within which the results are presented and are free of boundary effects. Asthe formation process transits from a thermal-like regime to a wake-like regime(i.e. from high to low Nc), the particle-containing region becomes more elongateddue to increasing particle losses into the wakes of the clumps, which is reflectedin the widening trend of the dark bands in horizontally integrated images; seefigure 5(a,b). It is also clear that the spread in the lateral direction weakens (withdecreasing Nc) due to the combined effect of the higher downward velocity fieldinduced by the fast-moving clumps and the reduced turbulent entrainment aroundthe wake region. Another trend is observed: with a larger initial mass, there is ahigher chance that the smaller particles (e.g. of size AH) will form multiple clumps(e.g. test B4 in figure 4(d)), which makes the disintegration process faster and the
202 B. Zhao, A. W. K. Law, E. E. Adams and J. W. Er
(a)
(b)
(c)
0
20
40
z (c
m)
60
80
0
20
40
60
80
0
20
40
60
80
0
6
20
40
60
80–20 0 20 –20 0 200 3 6 9 –20 0 20 –20 0 2012 15
Horizontallyintegrated
Verticallyintegrated
0
3
9
12
15
0
20
40
z (c
m)
60
80
0
20
40
60
80
0
20
40
60
80
0
6
20
40
60
80–20 0 20 –20 0 200 3 6 9
t (s)
t (s)
–20 0 20 –20 0 2012 15
0
3
9
12
15
0
20
40
z (c
m)
60
80
0
20
40
60
80
0
20
40
60
80
0
6
20
40
60
80–20 0 20 –20 0 200 3 6 9
t (s)
t (s)
x (cm)–20 0 20
x (cm) x (cm)–20 0 20
x (cm)12 15
0
3
9
12
15
FIGURE 3. Integrated view and instantaneous images: (a) test A1, run 1, with d50 =0.256 mm, m0 = 5.5 g and Nc = 5.0 × 10⁻²; (b) test A2, run 1, with d50 = 0.120 mm,m0 = 5.5 g and Nc = 1.6× 10⁻²; (c) test A3, run 1, with d50 = 0.0675 mm, m0 = 5.5 gand Nc= 6.0× 10⁻³.
flow more regular than that of a single clump (e.g. test A3 in figure 3(c)). Togetherwith more quantitative measurements, the various formation processes and the reasonfor forming multiple clumps will be discussed further in the next section.
To extract quantitative information from the averaged integrated view images, thebackground noise level determined based on histogram analysis was used for imagesegmentation and subsequent detection of the averaged front (zf ), tail (ze) and bulkradius (rmax). A similar analysis was performed on individual runs, and the averagedstandard deviations were used to represent the experimental variations, as summarizedin table 2. It was found that the variation increased as the conditions transited from

Formation of particle clouds 203
(a)0
Horizontallyintegrated
30
60
90
120
z (c
m)
150
180
0
30
60
90
120
150
180
0
30
60
90
120
150
1800 2 4 6
t (s)
8 10 –40 400 –40 400
0
30
60
90
120
150
180–40 40
10
8
6
4
2
0
0 –40 400
(b) 0
30
60
90
120
z (c
m)
150
180
0
30
60
90
120
150
180
0
30
60
90
120
150
1800 2 4 6
t (s)
8 10 –40 400 –40 400
0
30
60
90
120
150
180–40 40
10
8
6
4
2
0
0 –40 400
(c) 0
30
60
90
120
z (c
m)
150
180
0
30
60
90
120
150
180
0
30
60
90
120
150
1800 2 4 6
t (s)
8 10 –40 400 –40 400
0
30
60
90
120
150
180–40 40
10
8
6
4
2
0
0 –40 400
(d) 0
30
60
90
120
z (c
m)
150
180
0
30
60
90
120
150
180
0
30
60
90
120
150
1800 2 4 6
t (s)
t (s)
x (cm) x (cm) x (cm) x (cm)8 10 –40 400 –40 400
0
30
60
90
120
150
180–40 40
10
8
6
4
2
0
0 –40 400
Verticallyintegrated
FIGURE 4. Integrated view and instantaneous images: (a) test B1, run 1, with d50 =0.513 mm, m0 = 448 g and Nc = 5.9 × 10⁻²; (b) test B2, run 1, with d50 = 0.256 mm,m0 = 448 g and Nc = 2.4 × 10⁻²; (c) test B3, run 1, with d50 = 0.120 mm, m0 = 448 gand Nc = 7.7 × 10⁻³; (d) test B4, run 1, with d50 = 0.0675 mm, m0 = 448 g and Nc =2.9× 10⁻³.

204 B. Zhao, A. W. K. Law, E. E. Adams and J. W. Er
(d)
0
10
20
30
40
50
0
10
20
30
40
50
0
10
20
30
40
501000 200 1000 200
0
10
20
30
40
500 100 200 0 200100 0 200100
(a)
(b)
(c)
0 100 200
0 100 200
0
10
20
30
40
50
0
10
20
30
40
50
0
10
20
30
40
50
0
50
100
150
200
250
0
50
100
150
200
250
0
50
100
150
200
250
0
50
100
150
200
250
0
50
100
150
200
250–20 0 20
–20 0 20 –20 0 20 –20 0 20 –20 0 20
–20 0 20 –20 0 20
0
50
100
150
200
250
0
50
100
150
200
250
FIGURE 5. Averaged integrated view: (a) horizontally integrated view of series-A test;(b) horizontally integrated view of series-B test; (c) vertically integrated view of series-Atest; (d) vertically integrated view of series-B test. The solid lines in (b) and (d) indicatethe limits of the data-sampling area.

Formation of particle clouds 205
Parameter A1 A2 A3 B1 B2 B3 B4
zf 3.2 % 4.1 % 16.7 % 5.1 % 4.1 % 7.4 % 8.0 %ze 5.8 % 9.7 % 23.4 % 7.7 % 13.3 % 9.2 % 15.4 %r 11.2 % 9.4 % 16.4 % 8.3 % 8.7 % 8.5 % 11.3 %
TABLE 2. Summary of experimental variations.
cloud to clump formation; this was mainly attributed to the higher irregularity andasymmetry of wake-like behaviour. The overall variation was around 10 %, and themaximum variation was found in test A3, during which the particles mostly formeda single clump with a strong meandering flow pattern, as shown in figure 3(c). In thefollowing, only averaged gross characteristics of the released particles are discussed.
4. Formation processesThe behaviour of particle clouds is commonly represented by gross characteristics,
such as the trajectory of descent based on the frontal position (zf ) and the lateralspread based on the maximum cloud radius (rmax). During the self-preserving phaseof cloud formation, these gross characteristics have been found to follow the powerlaws
zf ∝ t0.5, rmax ∝ t0.5, (4.1)
which were derived based on the assumptions of constant total buoyancy excess andself-similarity (Scorer 1957; Turner 1973). In figures 6 and 7, zf and rmax are plottedagainst time on a log–log scale. Data fittings are performed, and the resulting best-fitpower laws (i.e. the slopes denoted by S) are compared with the above theoreticalvalues. The solid horizontal lines indicate limits of the data-sampling areas and arelabelled with their corresponding actual dimensions; the vertical dotted lines indicatethe times of transition in flow regimes. In the following, the formation processes areclassified into three categories – cloud formation, a transitional regime and clumpformation – and are described individually in more detail.
4.1. Cloud formation
As illustrated in figures 3(a) and 4(a) (with Nc = 5.0 × 10⁻² and 5.9 × 10⁻²,respectively), when the cloud number is in the higher range, the particles behavelike a thermal and their motion follows the classic three-phase mode (Rahimipour &Wilkinson 1992). Immediately after water entry, the particles accelerate as a poroussphere. During this stage, due to the relative ease of flow through the pores, the solidparticles become well mixed with the ambient water and the mixture starts to behavelike a dense fluid. Circulation is generated by the shear force around the densityinterface, and the particles form an elliptical particle thermal characterized by vortexring structures. With the entrainment at the rear of the particle thermal, there is anegligible number of particles in the trailing stem. The particle thermal descends withmore or less constant total buoyancy and preserved shape. Data fittings are performedon the entire range of the data as shown in figures 6(a) and 7(a), with the slopesfixed at the theoretical value of 0.5. The coefficients of determination (denoted by R2)are also reported and suggest a reasonable agreement with the theoretical predictionsin (4.1), considering the experimental variations. Note that the initial accelerationphase is so short that the results of data fitting are not significantly affected even ifthis phase is incorporated.

206 B. Zhao, A. W. K. Law, E. E. Adams and J. W. Er
(a)
(b)
(c)
0.8
1.0
1.2
1.4
1.6
1.8
0
0.2
0.4
0.6
0.8
1.0
1.2
0.8
1.0
1.2
1.4
1.6
1.8
0.8
1.0
1.2
1.4
1.6
1.8
1.85 1.951.66
1.70
1.74
0
0.2
0.4
0.6
0.8
1.0
1.2
1.0 1.2 1.4 1.6 1.8 2.0 2.2 2.4 2.6 1.0 1.2 1.4 1.6 1.8 2.0 2.2 2.4 2.6
1.0 1.2 1.4 1.6 1.8 2.0 2.2 2.4 2.6
1.0 1.2 1.4 1.6 1.8 2.0 2.2 2.4 2.6
1.0 1.2 1.4 1.6 1.8 2.0 2.2 2.4 2.6
1.0 1.2 1.4 1.6 1.8 2.0 2.2 2.4 2.60
0.2
0.4
0.6
0.8
1.0
1.2
FIGURE 6. Integrated view and instantaneous images: (a) test A1, run 1, with d50 =0.256 mm, m0 = 5.5 g and Nc = 5.0 × 10⁻²; (b) test A2, run 1, with d50 = 0.120 mm,m0 = 5.5 g and Nc = 1.6× 10⁻²; (c) test A3, run 1, with d50 = 0.0675 mm, m0 = 5.5 gand Nc= 6.0× 10⁻³. The solid horizontal lines indicate limits of the data-sampling area,and the vertical dotted lines indicate the times of transition in flow regimes.
4.2. Transitional regimeAs suggested by the theory introduced in § 2, the resistance of flow through theporous sphere increases as the cloud number decreases. It is observed that beforeentering complete clump formation, the particles first experience a transitional regime.As illustrated in figures 3(b) and 4(b) (with Nc = 1.6 × 10⁻² and 2.4 × 10⁻²,respectively), the particles initially descend and accelerate as a heavy clump due

Formation of particle clouds 207
(a)
(b)
(c)
(d)
0.8
1.0
1.2
1.4
1.6
1.8
0
0.2
0.4
0.6
0.8
1.0
1.2
0.8
1.0
1.2
1.4
1.6
1.8
0.8
1.0
1.2
1.4
1.6
1.8
0.8
1.0
1.2
1.4
1.6
1.8
0
0.2
0.4
0.6
0.8
1.0
1.2
0
0.2
0.4
0.6
0.8
1.0
1.2
1.0 1.2 1.4 1.6 1.8 2.0 2.2 2.4 2.6 1.0 1.2 1.4 1.6 1.8 2.0 2.2 2.4 2.6
1.0 1.2 1.4 1.6 1.8 2.0 2.2 2.4 2.6
1.0 1.2 1.4 1.6 1.8 2.0 2.2 2.4 2.6
1.0 1.2 1.4 1.6 1.8 2.0 2.2 2.4 2.6
1.0 1.2 1.4 1.6 1.8 2.0 2.2 2.4 2.6
1.0 1.2 1.4 1.6 1.8 2.0 2.2 2.4 2.6
1.0 1.2 1.4 1.6 1.8 2.0 2.2 2.4 2.60
0.2
0.4
0.6
0.8
1.0
1.2
FIGURE 7. Integrated view and instantaneous images: (a) test B1, run 1, with d50 =0.513 mm, m0 = 448 g and Nc = 5.9 × 10⁻²; (b) test B2, run 1, with d50 = 0.256 mm,m0 = 448 g and Nc = 2.4 × 10⁻²; (c) test B3, run 1, with d50 = 0.120 mm, m0 = 448 gand Nc = 7.7 × 10⁻³; (d) test B4, run 1, with d50 = 0.0675 mm, m0 = 448 g and Nc =2.9 × 10⁻³. The solid horizontal lines indicate limits of the data-sampling area, and thevertical dotted lines indicate the times of transition in flow regimes.

208 B. Zhao, A. W. K. Law, E. E. Adams and J. W. Er
to high flow resistance through the pores; particles around the surface are peeled off,and thus the radius of the clump becomes smaller and the velocity becomes higher.Considering (2.5), the continuous reduction in size and the increment in velocityresult in an increasing hydraulic gradient across the particle clump. Once beyonda certain threshold, the ambient water will flow through the pores and cause theclump to disintegrate, and the particles will behave again as a dense fluid. Duringthe transition, the clump at the front quickly transforms into a leading thermal. Theinduced flow field (especially the entrainment at the rear) engulfs the particles in thewake region, and thus the particles finally descend together like a particle thermal. Asshown in figures 6(b) and 7(b), transitions in flow regimes can be visually identified.Before the transition, the best-fit power laws are found to be
zf ,A2 ∝ t0.925±0.039, rmax,A2 ∝ t0.994±0.076, (4.2a)zf ,B2 ∝ t1.024±0.010, rmax,B2 ∝ t0.764±0.009, (4.2b)
which indicate much faster development than expected for a particle thermal. However,after the transformation,
zf ,A2 ∝ t0.463±0.001, rmax,A2 ∝ t0.525±0.003, (4.3a)zf ,B2 ∝ t0.432±0.003, rmax,B2 ∝ t0.511±0.004, (4.3b)
suggesting that the power laws fall back to the theoretical values of a thermal. In theabove and subsequent fitting correlations, the power laws are reported togetherwith their uncertainties (based on ± the respective standard error). As certainstandard errors of the slopes fall even below 0.01, the values are all reported tothe third decimal place for consistency. However, it should be noted that the aboverepresentations do not imply accuracy up to three decimal places.
It may be argued that the formation of particle clumps before transition is partof the initial acceleration phase of a conventional particle cloud, since eventuallythe particles behave like a thermal with all the particles descending together. Thefundamental distinction between these two phenomena is whether the ambient wateris flowing around or through the particles. During the initial acceleration phase ofcloud formation, particles are well mixed with the ambient water, and they move asa ballistic volume straight downwards without the meandering and significant lossof particles into the wake that are features of a clump. It should be noted that thetransition from wake-like to thermal-like behaviour is only possible if the clumpdisintegrates and forms a leading thermal within a short distance of the source, sothat the entrainment velocity at the rear of the leading vortex is strong enough toincorporate all the particles lost in the wake. In the context of sediment disposal inambient currents and waves, the particles initially lost in the wake may be carriedlaterally away from the leading clump, and thus remain as turbidity even afterthe formation of the sediment vortex. Therefore, the loss as turbidity can be moresignificant than that in stagnant ambient.
4.3. Clump formationAs the cloud number decreases further, the wake-like flow phenomenon tends todominate the descent process. With a higher resistance of flow through the particles,clumps are more easily formed and persist for longer distances. As illustrated infigures 3(c), 4(c) and 4(d) (with Nc = 6.0 × 10⁻³, 7.7 × 10⁻³ and 2.9 × 10⁻³,
Formation of particle clouds 209
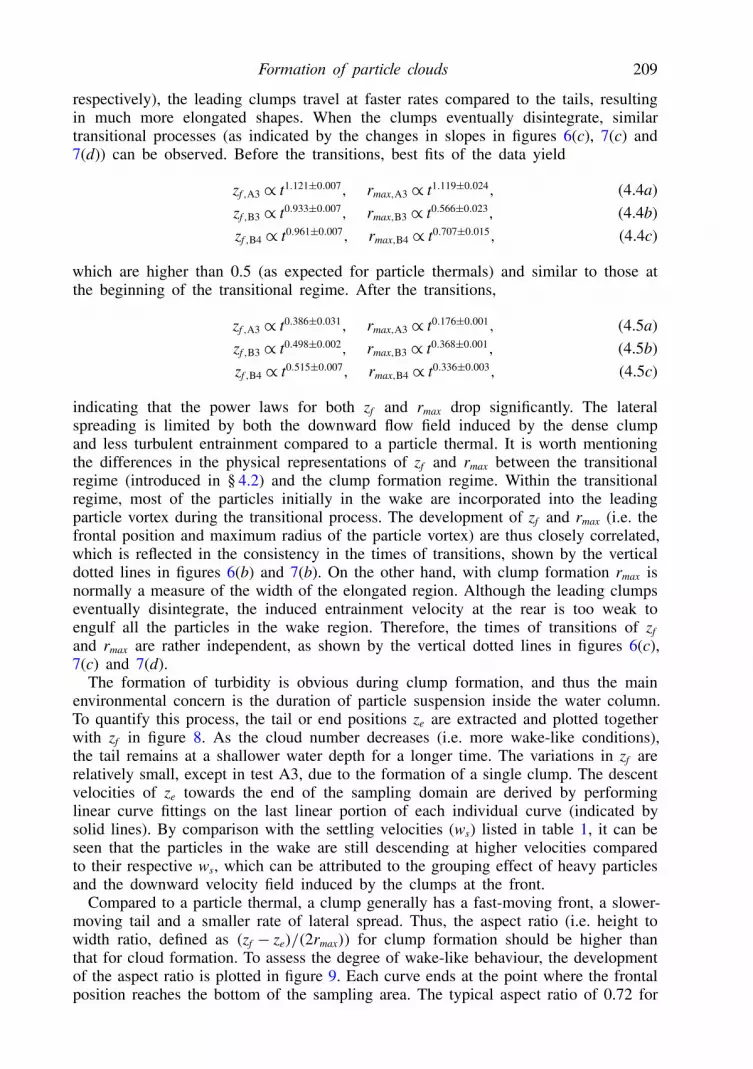
respectively), the leading clumps travel at faster rates compared to the tails, resultingin much more elongated shapes. When the clumps eventually disintegrate, similartransitional processes (as indicated by the changes in slopes in figures 6(c), 7(c) and7(d)) can be observed. Before the transitions, best fits of the data yield
zf ,A3 ∝ t1.121±0.007, rmax,A3 ∝ t1.119±0.024, (4.4a)zf ,B3 ∝ t0.933±0.007, rmax,B3 ∝ t0.566±0.023, (4.4b)zf ,B4 ∝ t0.961±0.007, rmax,B4 ∝ t0.707±0.015, (4.4c)
which are higher than 0.5 (as expected for particle thermals) and similar to those atthe beginning of the transitional regime. After the transitions,
zf ,A3 ∝ t0.386±0.031, rmax,A3 ∝ t0.176±0.001, (4.5a)zf ,B3 ∝ t0.498±0.002, rmax,B3 ∝ t0.368±0.001, (4.5b)zf ,B4 ∝ t0.515±0.007, rmax,B4 ∝ t0.336±0.003, (4.5c)
indicating that the power laws for both zf and rmax drop significantly. The lateralspreading is limited by both the downward flow field induced by the dense clumpand less turbulent entrainment compared to a particle thermal. It is worth mentioningthe differences in the physical representations of zf and rmax between the transitionalregime (introduced in § 4.2) and the clump formation regime. Within the transitionalregime, most of the particles initially in the wake are incorporated into the leadingparticle vortex during the transitional process. The development of zf and rmax (i.e. thefrontal position and maximum radius of the particle vortex) are thus closely correlated,which is reflected in the consistency in the times of transitions, shown by the verticaldotted lines in figures 6(b) and 7(b). On the other hand, with clump formation rmax isnormally a measure of the width of the elongated region. Although the leading clumpseventually disintegrate, the induced entrainment velocity at the rear is too weak toengulf all the particles in the wake region. Therefore, the times of transitions of zf
and rmax are rather independent, as shown by the vertical dotted lines in figures 6(c),7(c) and 7(d).
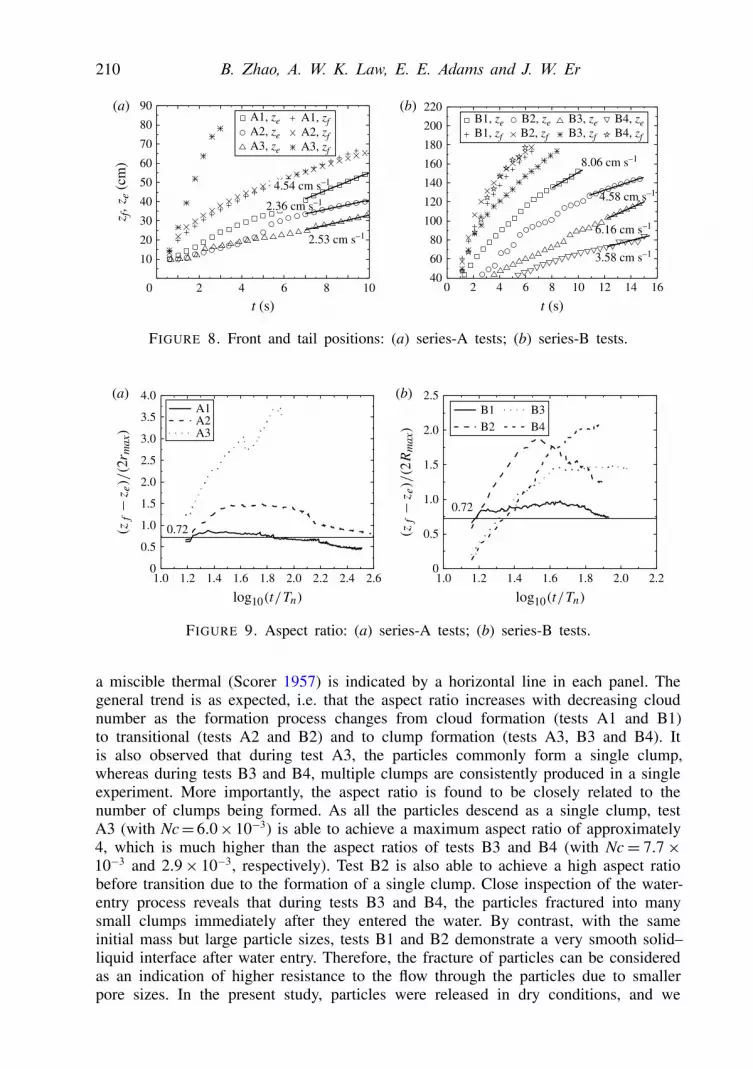
The formation of turbidity is obvious during clump formation, and thus the mainenvironmental concern is the duration of particle suspension inside the water column.To quantify this process, the tail or end positions ze are extracted and plotted togetherwith zf in figure 8. As the cloud number decreases (i.e. more wake-like conditions),the tail remains at a shallower water depth for a longer time. The variations in zf arerelatively small, except in test A3, due to the formation of a single clump. The descentvelocities of ze towards the end of the sampling domain are derived by performinglinear curve fittings on the last linear portion of each individual curve (indicated bysolid lines). By comparison with the settling velocities (ws) listed in table 1, it can beseen that the particles in the wake are still descending at higher velocities comparedto their respective ws, which can be attributed to the grouping effect of heavy particlesand the downward velocity field induced by the clumps at the front.
Compared to a particle thermal, a clump generally has a fast-moving front, a slower-moving tail and a smaller rate of lateral spread. Thus, the aspect ratio (i.e. height towidth ratio, defined as (zf − ze)/(2rmax)) for clump formation should be higher thanthat for cloud formation. To assess the degree of wake-like behaviour, the developmentof the aspect ratio is plotted in figure 9. Each curve ends at the point where the frontalposition reaches the bottom of the sampling area. The typical aspect ratio of 0.72 for
210 B. Zhao, A. W. K. Law, E. E. Adams and J. W. Er
(a) (b)
0
10
20
30
40
50
60
70
80
90A1, ze A1, zfA2, ze A2, zfA3, ze A3, zf
z f, z
e (c
m)
t (s)8642 10 0 2 4 6 8 10 12 14 16
40
60
80
100
120
140
160
2.53 cm s–1
180
200
220B1, ze B2, ze B3, ze B4, zeB1, zf B2, zf B3, zf B4, zf
t (s)
8.06 cm s–1
4.58 cm s–1
6.16 cm s–1
3.58 cm s–1
4.54 cm s–1
2.36 cm s–1
FIGURE 8. Front and tail positions: (a) series-A tests; (b) series-B tests.
(a) (b)
0
0.5
1.0
1.5
2.0
2.5
0.72
1.0 1.2 1.4 1.6 1.8 2.0 2.2 1.0 1.2 1.4 1.6 1.8 2.0 2.22.4 2.60
0.5
1.0
1.5
2.0
2.5
3.0
3.5
4.0
0.72
A1A2A3
B1B2
B3B4
FIGURE 9. Aspect ratio: (a) series-A tests; (b) series-B tests.
a miscible thermal (Scorer 1957) is indicated by a horizontal line in each panel. Thegeneral trend is as expected, i.e. that the aspect ratio increases with decreasing cloudnumber as the formation process changes from cloud formation (tests A1 and B1)to transitional (tests A2 and B2) and to clump formation (tests A3, B3 and B4). Itis also observed that during test A3, the particles commonly form a single clump,whereas during tests B3 and B4, multiple clumps are consistently produced in a singleexperiment. More importantly, the aspect ratio is found to be closely related to thenumber of clumps being formed. As all the particles descend as a single clump, testA3 (with Nc= 6.0× 10⁻³) is able to achieve a maximum aspect ratio of approximately4, which is much higher than the aspect ratios of tests B3 and B4 (with Nc= 7.7×10⁻³ and 2.9× 10⁻³, respectively). Test B2 is also able to achieve a high aspect ratiobefore transition due to the formation of a single clump. Close inspection of the water-entry process reveals that during tests B3 and B4, the particles fractured into manysmall clumps immediately after they entered the water. By contrast, with the sameinitial mass but large particle sizes, tests B1 and B2 demonstrate a very smooth solid–liquid interface after water entry. Therefore, the fracture of particles can be consideredas an indication of higher resistance to the flow through the particles due to smallerpore sizes. In the present study, particles were released in dry conditions, and we

Formation of particle clouds 211
believe that the initial water content could also play an important role in the numberof clumps being formed, which requires further investigation.
5. ConclusionsA systematic experimental study has been conducted to examine the process of
formation of particle clouds comprising both non-cohesive and marginally cohesiveparticles. By varying the particle size and initial mass, the present study covers cloudnumbers ranging from 2.9 × 10⁻³ to 5.9 × 10⁻². A theoretical analysis of the flowpassing a porous sphere is performed to support the cloud number dependence ofthe formation process. A detailed review of existing literature on three-dimensionalparticle clouds and a parametric analysis reveal the need to investigate the criterionfor clump formation and its significance in terms of introducing severe particle lossesas turbidity. A novel integrated view analysis approach is proposed and adoptedto provide qualitative descriptions about the spatial and temporal distributions ofsolid particles. The formation processes are categorized into cloud formation, atransitional regime and clump formation, and distinct features are described throughqualitative comparison of the flow patterns and quantitative assessment of the grosscharacteristics.
As the first detailed study on the formation process of particle clouds, the scopeof the current work is still limited. Further research should be done to gain a morecomplete understanding of the parametric space associated with the cloud number(e.g. the effects of density difference and ambient viscosity). Although the presentstudy focuses on fully turbulent conditions, as characterized by the bulk Reynoldsnumber defined in (2.3), it should be noted that the viscous effect is also involvedin the definition of cloud number through the settling velocity of individual particles.Therefore, it is worthwhile to test particles and ambient media with different propertiesin future studies.
The current cloud number definition is limited to particles of uniform size. Thusit is of practical interest to explore the effect of particle size distributions on theformation process of particle clouds; in fact, the authors have already initiated suchstudies. Looking ahead, it would be beneficial to investigate the particle dynamicsunder conditions of high solid concentration, especially the detailed mechanisms forclump formation and subsequent disintegration.
AcknowledgementThis research was supported by the National Research Foundation of Singapore
through the Singapore–MIT Alliance for Research and Technology’s CENSAM IRGresearch programme.
AppendixThe conditions of previous experimental studies on three-dimensional particle clouds
are summarized in table A.1. It should be noted that certain parameters were notreported explicitly, and thus are derived here based on other known quantities. Thosederived values are marked with a shaded background in the table. The density ofparticles is assumed to be 2.65 g cm−3 if not stated in the study; the air void ratioin dry particles is assumed to be 40 % by total volume (Ruggaber 2000); and theparticle settling velocity is estimated using the empirical functions of Dietrich (1982)for spherical particles with diameters ranging from 0.01 to 100 mm.

212 B. Zhao, A. W. K. Law, E. E. Adams and J. W. Er
m0 V0 ρs dp Size range ws B0 r0 Nc(g) (cm3) (g cm−3) (mm) (mm) (cm s−1) (g cm s−2) (cm)
Rahimipour & Wilkinson (1992)5.49 3.45 2.65 0.2 0.15–0.25 2.1 3.4× 10³ 0.94 3.4× 10⁻²
5.49 3.45 2.65 0.325 0.30–0.35 5.1 3.4× 10³ 0.94 8.3× 10⁻²
12.16 7.65 2.65 0.325 0.30–0.35 5.1 7.4× 10³ 1.22 7.2× 10⁻²
Wen & Nacamuli (1996)(vortex) 199.8 240 1.39 1.25 — 4.4 5.5× 10⁴ 3.85 7.2× 10⁻²
(cloud) 108.1 68 2.65 0.03 — 0.52 6.6× 10⁴ 2.53 5.1× 10⁻³
(wake) 83.5 53 2.65 0.11 — 1.3 5.1× 10⁴ 2.32 1.3× 10⁻²
(vortex) 34.4 22 2.65 0.21 — 2.7 2.1× 10⁴ 1.73 3.2× 10⁻²
(vortex) 93.3 59 2.65 0.21 — 2.7 5.7× 10⁴ 2.41 2.7× 10⁻²
(wake) 474.8 299 2.65 0.21 — 2.7 2.9× 10⁴ 4.15 2.1× 10⁻²
Li (1997)4.68 3 2.6 0.225 0.15–0.3 4 2.8× 10³ 0.89 6.7× 10⁻²
6.24 4 2.6 0.45 0.3–0.6 6.3 3.8× 10³ 0.98 1.0× 10⁻¹
7.80 5 2.6 0.89 0.6–1.18 14 4.7× 10³ 1.06 2.2× 10⁻¹
Ruggaber (2000)40 27 2.5 0.264 0.208–0.290 3.2 2.4× 10⁴ 2.0 3.9× 10⁻²
40 27 2.5 0.129 0.075–0.148 1.36 2.4× 10⁴ 2.0 1.6× 10⁻²
40 27 2.5 0.024 0.012–0.038 0.047 2.4× 10⁴ 2.0 5.7× 10⁻⁴
40 25 2.67 0.01 0.001–0.045 0.009 2.5× 10⁴ 2.0 1.1× 10⁻⁴
Bühler & Papantoniou (2001)86.14 55 2.6 1.95 1.5–2 18.8 5.2× 10⁴ 2.36 1.9× 10⁻¹
44.72 29 2.6 1.95 1.5–2 18.8 2.7× 10⁴ 1.90 2.2× 10⁻¹
21.53 14 2.6 1.95 1.5–2 18.8 1.3× 10⁴ 1.49 2.5× 10⁻¹
11.60 7 2.6 1.95 1.5–2 18.8 7.0× 10³ 1.21 2.7× 10⁻¹
89.45 57 2.6 2.62 2–3 21.8 5.4× 10³ 2.39 2.2× 10⁻¹
44.72 29 2.6 2.62 2–3 21.8 2.7× 10⁴ 1.90 2.5× 10⁻¹
21.53 14 2.6 2.62 2–3 21.8 1.3× 10⁴ 1.49 2.8× 10⁻¹
11.60 7 2.6 2.62 2–3 21.8 7.0× 10³ 1.21 3.2× 10⁻¹
Bush et al. (2003)Note: cloud number ranged from 1.0× 10⁻² to 2.2× 10⁻¹
Gu & Li (2004)7.80 5 2.6 0.89 0.6–1.18 14 4.7× 10³ 1.06 2.2× 10⁻¹
7.80 5 2.6 0.45 0.3–0.6 6.3 4.7× 10³ 1.06 9.7× 10⁻²
7.80 5 2.6 0.225 0.15–0.3 4 4.7× 10³ 1.06 6.2× 10⁻²
Deguen et al. (2011)0.50 0.32 2.6 — — 8.6 3.0× 10² 0.42 2.1× 10⁻¹
1.70 1.09 2.6 — — 1.4 1.0× 10³ 0.64 2.8× 10⁻²
1.00 0.62 2.7 — — 0.002 6.2× 10² 0.53 4.3× 10⁻⁵
Zhao et al. (2012)8.4 5.60 2.5 0.513 0.425–0.600 7.13 4.9× 10³ 1.10 1.1× 10⁻¹
Lai et al. (2013)3 2.00 2.5 0.725 0.600–0.850 10.5 1.8× 10³ 0.78 2.0× 10⁻¹
3 2.00 2.5 0.513 0.425–0.600 7.13 1.8× 10³ 0.78 1.3× 10⁻¹
3 2.00 2.5 0.256 0.212–0.300 2.92 1.8× 10³ 0.78 5.4× 10⁻²
TABLE A.1. Summary of experimental parameters.

Formation of particle clouds 213
REFERENCES
BÜHLER, J. & PAPANTONIOU, D. A. 2001 On the motion of suspension thermals and particle swarms.J. Hydraul. Res. 39 (6), 643–653.
BURRIDGE, H. C. & HUNT, G. R. 2012 The rise heights of low- and high-Froude-number turbulentaxisymmetric fountains. J. Fluid Mech. 691, 392–416.
BUSH, J. W. M., THURBER, B. A. & BLANCHETTE, F. 2003 Particle clouds in homogeneous andstratified environments. J. Fluid Mech. 489, 29–54.
CHENG, N. S. 2003 Application of Ergun equation to computation of critical shear velocity subjectto seepage. J. Irrig. Drain. Engng ASCE 129 (4), 278–283.
DEGUEN, R., OLSON, P. & CARDIN, P. 2011 Experiments on turbulent metal-silicate mixing in amagma ocean. Earth Planet. Sci. Lett. 310 (3–4), 303–313.
DIETRICH, W. E. 1982 Settling velocity of natural particles. Water Resour. Res. 18 (6), 1615–1626.ERGUN, S. 1952 Fluid flow through packed columns. Chem. Engng Prog. 48, 89–94.GENSHEIMER, R. J., ADAMS, E. E. & LAW, A. W. K. 2013 Dynamics of particle clouds in ambient
currents with application to open-water sediment disposal. J. Hydraul. Engng 139 (2), 114–123.GU, J. & LI, C. W. 2004 Modelling instantaneous discharge of unsorted particle cloud in ambient
water by an Eulerian–Lagrangian method. J. Hydraul. Res. 42 (4), 399–405.LAI, A. C. H., ZHAO, B., LAW, A. W. K. & ADAMS, E. E. 2013 Two-phase modelling of sediment
clouds. Environ. Fluid Mech. 13, 435–463.LAMB, H. 1993 Hydrodynamics. Cambridge University Press.LI, C. W. 1997 Convection of particle thermals. J. Hydraul. Res. 35 (3), 363–376.LUNDGREN, T. S., YAO, J. & MANSOUR, N. N. 1992 Microburst modelling and scaling. J. Fluid
Mech. 239, 461–488.NIVEN, R. K. 2002 Physical insight into the Ergun and Wen & Yu equations for fluid flow in
packed and fluidised beds. Chem. Engng Sci. 57, 527–534.RAHIMIPOUR, H. & WILKINSON, D. 1992 Dynamic behaviour of particle clouds. In Eleventh
Australasian Fluid Mechanics Conference, University of Tasmania, Hobart, 14–18 Decembervol. 1 and 2, pp. 743–746.
RUGGABER, G. J. 2000 The dynamics of particle clouds related to open-water sediment disposal.PhD thesis, Department of Civil and Environmental Engineering, Massachusetts Institute ofTechnology, Cambridge, MA.
SCORER, R. S. 1957 Experiments on convection of isolated masses of buoyant fluid. J. Fluid Mech.2 (6), 583–594.
TURNER, J. S. 1973 Buoyancy Effects in Fluids. Cambridge University Press.WEN, F. & NACAMULI, A. 1996 The effect of the Rayleigh number on a particle cloud. In
Hydrodynamics: Theory and Applications vol. 1 and 2, pp. 1275–1280. Balkema.YANG, C. T. 2006 Erosion and sedimentation manual. Tech. Rep. Technical Service Center, US
Bureau of Reclamation.ZHAO, B., LAW, A. W. K., ADAMS, E. E., SHAO, D. & HUANG, Z. 2012 Effect of air release
height on the formation of sediment thermal in water. J. Hydraul. Res. 50 (5), 532–540.ZHAO, B., LAW, A. W. K., HUANG, Z., ADAMS, E. E. & LAI, A. C. H. 2013a Behaviour of
sediment clouds in waves. ASCE J. Waterway Port Coast. Ocean Engng 139 (1), 24–33.ZHAO, B., LAW, A. W. K., LAI, A. C. H. & ADAMS, E. E. 2013b On the internal vorticity and
density structures of miscible thermals. J. Fluid Mech 722, R5.


