Embed Size (px)
Citation preview

Fostering Participation and Capacity Building
with Neighborhood Information Systems
by
David L. Epstein
A dissertation submitted in partial fulfillment
of the requirements for the degree of
Doctor of Philosophy
(Urban and Regional Planning)
in the University of Michigan
2015
Doctoral Committee:
Professor Margaret Dewar, Chair
Professor Larry Gant
Professor Jonathan Levine
Professor June Manning Thomas

© David L. Epstein 2015

ii
Dedication
To my mother, Judith Epstein, who instilled in me a hunger for knowledge and a respect for formal education
&
To my wife, Iris Fadlon, who convinced me not to wait—we could finish all our work and start a family

iii
Acknowledgements
The Center on Urban Poverty and Community Development at Case Western Reserve
University owns and operates the NEO CANDO System and the NST Web Application. Staff at
the Center generously provided data and guidance for this research—which made the project
possible.
I benefited from an excellent dissertation committee whose members provided
constructive feedback at the level of theory and domain-specific knowledge down to grammar,
tone, and word-choice. Each committee member contributed something unique. I pitched nearly
a dozen dissertation topics to Margi, which she read carefully and reflected upon. She helped me
to see the potential value of one of my ideas—an in depth evaluation of neighborhood
information systems—and shared related writing she had started on the subject. After I moved to
Baltimore, Margi made an extra effort to meet in person. Her enthusiasm for this research
motivated me to write more and to write better. Jonathan has stood by me since I arrived at UM
in 2004 and provided sound personal and academic guidance. He demonstrated both patience and
mental agility as I moved from a dissertation about economic development and environmental
conservation in Israel to this dissertation about information systems and community development
in Cleveland. Praise from June is like a rare jolt of electricity. She provided it when I most
needed it and taught me to target my implications and recommendations beyond Cleveland. The
basis for the mixed-methods design employed in this research came from my very first meeting
with Larry. I introduced myself and explained the topic. He wondered whether neighborhood
information system developers track usage.
I could not have completed such a large undertaking without the support of family and
friends. My mother-in-law, Dina Fadlon, came from Israel to care for my newborn son,
permitting me to finish the dissertation proposal and permitting my wife to start medical
residency. My mother, Judi Epstein, helped pay for daycare since my belief that a 3-month old
boy (at the time) would sit cutely and coo while I wrote proved inaccurate. She also helped
analyze IRS 990 forms for Cleveland organizations. Both my mother and my aunt, Jackie Caplan

iv
drove multiple hours to babysit while I attended conferences. In the past few months, my wife,
Iris Fadlon, has come home from her medical residency and cared for our two children alone
while I finished my research job at 6pm and stayed until midnight to finish this dissertation. My
friends Mary and Stephen Clark provided hospitality and local knowledge of Minneapolis that
resulted in a lovely and productive week.
Many people contributed by introducing me to the right contacts, explaining which issues
were the most important, sharing reports and raw data, allowing me to observe their community
development activities, and responding to detailed questions in-person, over the phone, and by
email. The keenest insights come from them. The errors are my own. While my dissertation
eventually focused on Cleveland, preliminary research in other cities—especially in
Minneapolis—proved essential in honing my research questions. The list of contributors
includes—but is not limited to—the individuals below.
Greg Baron. Director of Real Estate Development at Detroit Shoreway Community Development
Organization. Previously Housing Director. Cleveland, OH.
Gayle Bonneville. Project Coordinator, Saint Anthony West Neighborhood Organization. Minneapolis,
MN.
Andrea Bruno. Housing Manager at St. Clair Superior Development Corporation. Cleveland, OH.
Jeff Corn. Community Programs Coordinator at the Center for Urban and Regional Affairs, University of
Minnesota. Minneapolis, MN.
Dr. Claudia Coulton. Lillian F. Harris Professor of Urban Social Research, Jack, Joseph and Morton
Mandel School of Applied Social Sciences, Case Western Reserve University. Cleveland, OH.
Dr. William J. Craig. Retired. Previously Associate Director, Center for Urban and Regional Affairs,
University of Minnesota. Minneapolis, MN.
Justin D. Fleming, Esq. Director of Real Estate at Cleveland Neighborhood Progress. Previously,
Program Officer at Neighborhood Progress, Inc. Cleveland, OH.
Frank Ford. Senior Policy Advisor for Thriving Communities Institute. Previously, Sr. Vice President
for Research and Development at Neighborhood Progress, Inc. Cleveland, OH.
Colleen M. Gilson. Vice President of CDC Services, Cleveland Neighborhood Progress. Previously,
Executive Director of the Cleveland Neighborhood Development Coalition. Cleveland, OH.
Joseph Giuliano. Director of Housing at Detroit Shoreway Development Organization. Cleveland, OH.
Kellie F. Glenn. Project Director/Compliance Officer, Community Development Department Division of
Administrative Services, City of Cleveland. Cleveland, OH.

v
James Greene. Manager of Cartography, GIS, Data Analysis at the Department of Community
Development, City of Cleveland. Cleveland, OH.
April Hirsh, MSSA. Research Assistant at the Center on Urban Poverty and Community Development,
Jack, Joseph and Morton Mandel School of Applied Social Sciences Case Western Reserve University.
Cleveland, OH.
Larry J. Hiscock. Program Officer for Transitway Engagement, Nexus Community Partners. Previously,
Director/Lead Organizer for Harrison Neighborhood Association. Minneapolis, MN.
Dr. Seema D. Iyer. Associate Director of the Jacob France Institute and Research Assistant Professor,
University of Baltimore. Baltimore, MD.
Eamon Johnson. Research Assistant, Department of Electrical Engineering and Computer Science, Case
School of Engineering, Case Western Reserve University. Previously, Analyst / Programmer, Center on
Urban Poverty and Community Development, Jack, Joseph and Morton Mandel School of Applied Social
Sciences. Cleveland, OH.
Joy D. Johnson. Associate Director at Burten, Bell, Carr Development, Inc. Previously Grants
Management Director. Cleveland, OH.
Peggy Kearsey. Housing Director, Westown Community Development Corporation. Cleveland, OH.
Marge Misak. Land Trust Program Director, Neighborhood Housing Services of Greater Cleveland.
Cleveland, OH.
Nelima Sitati Munene. Executive Director of Summit Hill Association. Previously Community
Organizer for Harrison Neighborhood Association. Minneapolis, MN.
Ronald J.H. O'Leary. Director of the Department of Building and Housing, City of Cleveland.
Previously Assistant Director. Cleveland, OH.
Corey Powell. Statistical Consultant, Center for Statistical Consultation and Research, University of
Michigan Ann Arbor, MI.
Stacia Pugh. Housing Development Officer at Slavic Village Development. Cleveland, OH.
Cory Riordan. Executive Director of Tremont West Development Corporation. Previously, Executive
Director of St. Clair Superior Development Corporation. Cleveland, OH.
Erica Y. Robinson. Famicos Foundation. Cleveland, OH.
James Rudyk Jr. Executive Director of Northwest Side Housing Center. Previously Director of
Community Organizing at Empowering and Strengthening Ohio's People. Cleveland, OH.
Michael Schramm. Director of Information Technology and Research at the Cuyahoga Land Bank and
Research Associate at the Center on Urban Poverty and Community Development , Case Western
Reserve University. Cleveland, OH.
Marlane Weslian. Neighborhood Development Officer at Slavic Village Development. Cleveland, OH.

vi
For the most recent version of this research, related research, and errata, please email
[email protected] or review https://mcommunity.umich.edu/#profile:davideps.
vii
Table of Contents
Dedication ....................................................................................................................................... ii
Acknowledgements ........................................................................................................................ iii
List of Figures .............................................................................................................................. xiii
List of Tables ............................................................................................................................... xiv
List of Appendices ....................................................................................................................... xvi
List of Abbreviations .................................................................................................................. xvii
Abstract ...................................................................................................................................... xviii
Chapter 1: Introduction ................................................................................................................... 1
Chapter 2: Literature Review .......................................................................................................... 6
Science and Technology Studies (STS) ...................................................................................... 6
Participation, Capacity, and Capacity Building .......................................................................... 8
Public Participation Geographic Information Systems (PPGIS) and Neighborhood Information
Systems (NIS) ........................................................................................................................... 14
GIS & PPGIS ........................................................................................................................ 14
NIS ........................................................................................................................................ 16
Management Information Systems (MIS) ................................................................................ 22
Gaps in Knowledge and Calls for Research ............................................................................. 26
Chapter 3: Research Questions and Hypotheses ........................................................................... 30
Q1. What claims do NNIP partner organizations make about neighborhood information
systems in their mission statements and websites? ................................................................... 30

viii
Hypothesis 1.......................................................................................................................... 31
Q2. Who uses NIS and how frequently? ................................................................................... 32
Hypothesis 2a ........................................................................................................................ 33
Hypothesis 2b........................................................................................................................ 33
Hypothesis 2c ........................................................................................................................ 33
Q3. How do Community Development Corporation (CDC) staff use NIS? ............................ 34
Hypothesis 3a ........................................................................................................................ 34
Hypothesis 3b........................................................................................................................ 35
Q4. Does NIS improve public participation and, if so, what factors mediate the improvement?
................................................................................................................................................... 36
Hypothesis 4a ........................................................................................................................ 36
Hypothesis 4b........................................................................................................................ 37
Q5. Does NIS improve the capacity of a CDC and, if so, what factors mediate the
improvement? ........................................................................................................................... 37
Hypothesis 5.......................................................................................................................... 38
Chapter 4: Theoretical Framework ............................................................................................... 40
Information Quality, System Quality, and Service Quality .................................................. 42
System Use............................................................................................................................ 42
Contingency and Alternative Explanations .......................................................................... 42
Net Benefits .......................................................................................................................... 43
Characteristics ....................................................................................................................... 43
Social Actors ......................................................................................................................... 44
Functions ............................................................................................................................... 44
Strategies ............................................................................................................................... 44
Neighborhood context ........................................................................................................... 45

ix
Outcomes .............................................................................................................................. 46
Chapter 5: Research Design, Methods, and Data ......................................................................... 47
Critical Case .............................................................................................................................. 47
A pressing need for information: addressing problem properties ......................................... 49
The Neighborhood Information Systems: NEO CANDO & the NST web app ................... 51
The Community Development System ................................................................................. 52
Embedded Cases ................................................................................................................... 57
Methods and Data Sources........................................................................................................ 63
Q1. What claims do NNIP partner organizations make about neighborhood information
systems in their mission statements and websites? ............................................................... 63
Q2. Who uses NIS and how frequently? ............................................................................... 64
Q3. How do CDC staff members use NIS? .......................................................................... 68
Q4. Does NIS improve public participation and, if so, what factors mediate the
improvement? ....................................................................................................................... 72
Q5. Does NIS improve capacity and, if so, what factors mediate the improvement? .......... 72
Chapter 6: Findings regarding System Quality, Data Quality, and Service Quality .................... 90
System Quality: Ubiquity, Selectivity, and Customizability .................................................... 90
Ubiquity ................................................................................................................................ 90
Selectivity ............................................................................................................................. 93
Customization ....................................................................................................................... 93
Information Quality .................................................................................................................. 94
Breadth of information .......................................................................................................... 94
Currency / Accuracy of Information ..................................................................................... 94
Service Quality.......................................................................................................................... 95
Training ................................................................................................................................. 95

x
Responsiveness ..................................................................................................................... 96
Assurance and Empathy ........................................................................................................ 96
Chapter 7: Findings regarding research questions ........................................................................ 97
Q1: What claims do NNIP partner organizations make about neighborhood information
systems in their mission statements and websites? ................................................................... 97
NNIP Partner missions, activities, and claims ...................................................................... 97
Q2. Who uses NIS and how frequently? ................................................................................. 102
Overview ............................................................................................................................. 102
CDC Staff NIS use patterns ................................................................................................ 105
Resident activists NIS (non)use patterns ............................................................................ 106
Q3. How do CDC staffers use NIS? ....................................................................................... 112
Common Tasks ................................................................................................................... 112
Development Strategies and Functions ............................................................................... 122
Q4. Does NIS improve public participation and, if so, what factors mediate the improvement?
................................................................................................................................................. 132
Political Capacity ................................................................................................................ 132
Q5. Does NIS improve CDC capacity and, if so, what factors mediate the improvement? ... 134
Resource Capacity .............................................................................................................. 134
Organizational Capacity...................................................................................................... 135
Programmatic Capacity ....................................................................................................... 137
Network Capacity ............................................................................................................... 168
Political Capacity ................................................................................................................ 170
Chapter Summary ............................................................................................................... 170
Chapter 8: Threats to Validity ..................................................................................................... 171
Conclusion Validity ................................................................................................................ 172

xi
Low Power .......................................................................................................................... 172
Violated Assumptions ......................................................................................................... 173
Fishing................................................................................................................................. 174
Unreliability of Measures ................................................................................................... 174
Restriction of Range ........................................................................................................... 179
Unreliability of Treatment Implementation ........................................................................ 180
Extraneous Variance in the Experimental Setting .............................................................. 180
Heterogeneity of Units ........................................................................................................ 181
Inaccurate Effect Size Estimation ....................................................................................... 182
Internal Validity ...................................................................................................................... 182
Ambiguous Temporal Precedence ...................................................................................... 182
Selection .............................................................................................................................. 183
History................................................................................................................................. 184
Maturation ........................................................................................................................... 184
Regression ........................................................................................................................... 184
Attrition ............................................................................................................................... 185
Testing................................................................................................................................. 185
Instrumentation ................................................................................................................... 185
Construct Validity ................................................................................................................... 185
Construct confounding ........................................................................................................ 186
Mono-Operation Bias.......................................................................................................... 186
Mono-Method Bias ............................................................................................................. 186
External Validity ..................................................................................................................... 186
Interaction of the Causal Relationship with Units .............................................................. 187
Interaction of the Causal Relationship with Settings .......................................................... 187

xii
Summary of Threats to Validity ............................................................................................. 187
Chapter 9: Discussion of Findings .............................................................................................. 189
Integration of disparate bodies of knowledge ......................................................................... 189
Contributions to bodies of knowledge .................................................................................... 190
Science and Technology Studies (STS) .............................................................................. 190
Participation, Capacity, and Capacity Building .................................................................. 192
Geographic Information Systems (GIS), Public Participation Geographic Information
Systems (PPGIS), and Neighborhood Information Systems (NIS) .................................... 193
Management Information Systems (MIS) .......................................................................... 194
Practical implications for Decision-Making with NIS............................................................ 195
Recommendations to NIS Developers and Funders ............................................................... 198
Conclusions and future research ............................................................................................. 201
Appendices .................................................................................................................................. 203
Bibliography ............................................................................................................................... 214

xiii
List of Figures
Figure 1: Chaskin's (2001, 296) Community Capacity and Capacity Building Framework (legend
added, inferred from author’s text) ............................................................................................... 11
Figure 2: DeLone & McLean (2003) Framework for Information System Success .................... 24
Figure 3: Final theoretical framework incorporating multiple sub-frameworks .......................... 41
Figure 4: Cleveland Community Development Corporation Service Areas (August 2012) ........ 62
Figure 5: Data Entry Form for Analysis of NNIP Mission Statements & Websites .................... 64
Figure 6: Scatterplot Matrix for all Data Rows (Purchases & Non-Purchases) ........................... 88
Figure 7: Scatterplot Matrix for Purchases Only (Non-Purchases Removed) .............................. 89
Figure 8: NIS Users At Least 1 Day Per Year ............................................................................ 103
Figure 9: NIS Users At Least 6 Months Per Year (At least one query in six different months
within the same year) .................................................................................................................. 104
Figure 10: Relationship of NIS to Grant Writing by CDC Staffers ............................................ 123
Figure 11: Relationship of NIS to Property Transfer and Rehab by CDC Staffers .................... 129
Figure 12: CDC Property Purchases and Model Estimates ........................................................ 156
Figure 13: Percentage of CDC Purchases Transferred and Model Estimates ............................ 162
Figure 14: Actual Rehab Rate of CDC Purchases and Model Estimates ................................... 167
Figure 15: Diagnostic Plots for Zero Inflated Model of CDC Housing Purchases, Step 1
(Binomial) with Autoregressive Correlation Structure ............................................................... 212
Figure 16: Diagnostic Plots for Zero Inflated Model of CDC Housing Purchases, Step 2
(Weighted by Step 1 Estimates) with Autoregressive Correlation Structure ............................. 212
Figure 17: Diagnostic Plots for Model of CDC Housing Transfers (Autoregressive) ............... 213
Figure 18: Diagnostic Plots for Model of CDC Housing Rehabs (Autoregressive) ................... 213
xiv
List of Tables
Table 1: Glickman and Servon's (1998) CDC Capacity Framework & Elements Implemented in
this Research ................................................................................................................................. 13
Table 2: Range of measures for each component in the DeLone & McLean (1992, 2003) model
....................................................................................................................................................... 24
Table 3: Gaps in Knowledge and Calls for Research by Body of Knowledge ............................. 28
Table 4: Summary of Cleveland as Critical Case for NIS Use ..................................................... 57
Table 5: Overview of Cleveland Community Development Corporations .................................. 60
Table 6: Summary of NIS Logfiles ............................................................................................... 65
Table 7: Logfile Column Descriptions ......................................................................................... 66
Table 8: Summary of Qualitative Data Collection ....................................................................... 69
Table 9: Structure of the Interview Database ............................................................................... 71
Table 10: Neighborhood Context Variables ................................................................................. 77
Table 11: Organizational Variables .............................................................................................. 78
Table 12: CDC Property Purchases 2008-2011 ............................................................................ 84
Table 13: Physical Description of CDC Purchases Dataset.......................................................... 86
Table 14: Claimed Outcomes from National Neighborhood Indicator Partnership (NNIP) Partner
Websites ........................................................................................................................................ 99
Table 15: Cleveland Area Public Entities Using NIS ................................................................. 105
Table 16: Common Tasks that rely on NIS ................................................................................ 113
Table 17: NIS Use Supporting Public Participation within Development Functions ................. 124
Table 18: Hypothesized Relationships Between Independent and Dependent Variables .......... 141
Table 19: Zero-inflated Model of CDC Annual Property Purchases--Stage 1 (Binomial), Initial
Version ........................................................................................................................................ 148
Table 20: Zero-inflated Model of CDC Annual Property Purchases--Stage 1 (Binomial), Final
Version ........................................................................................................................................ 149
Table 21: Interpretation of Stage 1 Model Coefficients using Autoregressive Correlation

xv
Structure ...................................................................................................................................... 150
Table 22: Zero-inflated Model of CDC Annual Property Purchases--Stage 2 (Weighted by Step 1
Estimates), Initial Version .......................................................................................................... 152
Table 23: Zero-inflated Model of CDC Annual Property Purchases--Stage 2 (Weighted by Step 1
Estimates), Final Version ............................................................................................................ 153
Table 24: Interpretation of Stage 2 Model Coefficients using Autoregressive Correlation
Structure ...................................................................................................................................... 153
Table 25: Model of Percent of CDC Annual Purchases Transferred to a Responsible New Owner,
Initial Version ............................................................................................................................. 158
Table 26: Model of Percent of CDC Annual Purchases Transferred to a Responsible New Owner,
Final Version ............................................................................................................................... 159
Table 27: Model of the Percentage of Annual CDC Purchases Rehabilitated, Initial Version .. 163
Table 28: Model of the Percentage of Annual CDC Purchases Rehabilitated, Final Version.... 164
Table 29: Four Types of Validity................................................................................................ 171
Table 30: Code grammar for an instance of technology use ...................................................... 205
Table 31: Code grammar for other subjects ................................................................................ 207
Table 32: Interview results by Development Function ............................................................... 210

xvi
List of Appendices
Appendix A: The Grammar of Parameterized Coding ............................................................... 204
Appendix B: Interview results by Development Function ......................................................... 210
Appendix C: Regression Diagnostic Plots .................................................................................. 212
xvii
List of Abbreviations
CDC community development corporation
GIS geographic information system
MIS management information system
NIS neighborhood information system
NPI Neighborhood Progress, Inc.
PPGIS public participation geographic information system
Rehab rehabilitation (an improvement in the physical condition of a place of residence)

xviii
Abstract
Applying information to decision making, monitoring neighborhood conditions, targeting
resources, and recommending action have long been key urban planning functions. Increasingly,
nonprofit organizations like community development corporations (CDCs) carry out these
functions in distressed urban areas. Scholars in multiple disciplines argue that “data
democratization”—increased access to data—would support a wide range of community change
efforts. Proponents of a specific data delivery tool—neighborhood information systems (NIS)—
claim that the technology can increase public participation and build capacity in distressed urban
neighborhoods. This research evaluates these claims in Cleveland where the mortgage
foreclosure crisis has left a glut of vacant and abandoned properties and a dire need to prioritize
activities with limited resources. The research provides an integrated theoretical framework,
bringing together four distinct bodies of knowledge for the first time: science and technology
studies; participation, capacity, and capacity building; geographic information systems; and
management information systems. The mixed-methods approach employed includes interviews
with sixty community development professionals in Cleveland and a longitudinal regression
analysis of thirty CDCs’ housing rehabilitation outcomes between July 1, 2007 to June 30, 2011.
NIS increased the networking capacity of CDCs engaged in the city’s Code Enforcement
Partnership by improving communication between partners. NIS also increased programmatic
capacity, especially as measured by the percentage of CDC-owned properties sold to new owners
who pay taxes on those properties. Staff in one CDC successfully leveraged NIS to improve
public participation, a measure of political capacity. The findings also suggest that access to NIS
does not fundamentally change CDC priorities. This research helps to fill specific gaps in
multiple bodies of knowledge and features an in depth analysis of threats to validity, practical
implications for decision-making with NIS, and recommendations for NIS developers and
funders. Developers and funders in other cities may wish to consider their role as not just
democratizing data—but providing a platform for partnerships by enabling organizations to
better share data in order to achieve shared objectives.

1
Chapter 1: Introduction
The mortgage foreclosure crisis led to a glut of vacant and abandoned properties in some
U.S. cities that outstripped available resources for demolition and challenged local leaders to
strategize and prioritize community development activities (Nelson 2008). While applying
information to decision making, monitoring neighborhood conditions, targeting resources, and
recommending action have long been key urban planning functions (Friedmann 1987; Meyerson
1956; Myers 1997; Thomson 2008) the language employed by some public officials revealed the
scale and urgency of the problem. A county representative estimated in 2011, for example, that
ten thousand homes inside Cleveland were “rotting corpses” (Niquette 2011). Prioritizing such a
large demolition queue—and identifying homes that can be saved before they meet the same
end—requires organizing an immense amount of information and weighing options against each
other. Scholars and practitioners have recognized the potential of technology to support mapping,
sorting, and filtering tasks (Chandler et al. 2006; Harris 1989) and for neighborhood-level data to
empower local organizations tackling planning issues (Sawicki and Craig 1996). But, few
researchers have studied the actual impact of technology and data on urban planning decisions
and outcomes (Sieber 2006). This gap in knowledge is unfortunate because the Department of
Housing and Urban Development has provided software to grantees to improve their capacity
(Leitner et al. 2000) and yet still identifies capacity as a problem (HUD 2010). For decades,
nonprofit organizations—many grant funded—have been providing services once provided by
government agencies directly (Wolch 1990). Determining if, when, and how technology
improves the capacity of such organizations to conduct planning activities would benefit those
organizations, technology developers and funders—and city residents. That is the goal of this
research—more specifically—to determine if, when, and how neighborhood information systems
can improve the capacity of community development corporations in Cleveland to rehabilitate
vacant and abandoned housing.
Neighborhood information systems (NIS) are not a standardized product but a loose term for
a composite of technologies. A NIS installation includes (1) a spatially enabled database, which

2
ties geographic information such as neighborhood boundaries to attributes such as population
size; (2) a web-based interface that facilitates data selection, download, and mapping; and (3) a
web-server that allows multiple users to access the system at the same time over the Internet.
Users employ NISs for grant-writing, advocacy, neighborhood stabilization, community
organizing, protecting health & safety, decision-support, and predicting residential abandonment
(Kingsley 1998; Enterprise 2010; Kingsley and Treuhaft 2008; Krouk, Pitkin, and Richman
2000). The following vignette, constructed from multiple interviews, illustrates how a CDC
employee might incorporate NIS into community development work.
One morning in 2011, Lisa Smith1 was driving the same route to work as always when she
saw something that made her stop the car and get out. A man stood pensively in front of a house
that had been vacant for months. In a friendly tone he explained his plan to flip it. Someone—he
reasoned—might be willing to buy the place from him in a few months for more money. Lisa
saw similar speculation all the time in her work at the community development corporation
(CDC). Speculators like this rarely improved the property or paid property taxes. While a
responsible owner could rehabilitate the house in its current condition, after a few more flips—it
would be too rundown. Lisa knew she would have to act quickly. When she arrived at work, she
looked up the property on a website maintained by one of the local universities. She saw a few
minor code violations, but nothing that would prevent the CDC from buying and rehabilitating
the property. Lisa also looked up the oversized, vacant, and ugly house next door. She would
need to get rid of that house in order to market the house she planned to buy. Lisa selected data
from different city agencies to examine together. She smiled. The system showed that the ugly
house had already passed through a number of sheriff sales without a buyer. It was eligible for
demolition by the county, which would happen faster than demolition by the city. She drafted a
short email to her supervisor that outlined a plan to buy one house and knock down the other.
Once her supervisor approved the plan, Lisa would record it on the website for city and county
employees to see, which often—though not always—insured that the right house was left
standing and the right house was knocked down.
The website Lisa used is an example of a neighborhood information system. The vignette
1 This vignette is based primarily on interview (#17,364,10/19/2011). The name has been changed.

3
weaves together many of the key issues in this research. Vacant properties pose a serious
problem. Often, CDC employees—not city employees—address the problem at the
neighborhood level. They select among multiple options and strategies with the help of
neighborhood information systems. System proponents, developers, and funders expect that the
technology will have a positive impact. In medical parlance, these proponents approach data and
technology as a treatment for a disease—vacant and abandoned properties in this case. More
generally, proponents argue that these systems can treat a number of problems, including lack of
government accountability and transparency, poor public participation in decision making, and
the low capacity of organizations in distressed urban areas (Kubisch et al. 2010; Kingsley 1999;
Treuhaft 2006). While researchers routinely evaluate the efficacy of pharmaceutical or surgical
interventions in the health fields, researchers rarely evaluate the efficacy of technological
interventions in planning. In this study, I develop and apply a method to conduct such
evaluations.
The vignette also makes clear that users can integrate NIS into workflows that mix strategic
thinking with serendipity and emotion. Lisa ran into this would-be speculator by chance and
responded emotionally to his plan to flip a house within her jurisdiction. She had not previously
suggested rehabilitating this particular house. According to the NIS, it was not an ideal
rehabilitation target—especially with a dilapidated house right next door. But, her desire to
protect the neighborhood from another speculator motivated her course of action. Lisa relied on
the NIS initially as one might rely on a friend known for caution—to play devil’s advocate and
supply reasons not to proceed. Such reasons may have included unseen property damage or a
murky title that could delay acquisition.
To proponents, NIS serves as the nerve center for an impartial, systematic decision-making
process they refer to as data-driven. Lisa’s workflow hardly seems driven by data though. She
clearly used data. She relied on the NIS to reality-check the first house and to provide
information about sheriff sales, which she transformed into a demolition strategy for the second
house. But, serendipity—seeing a man outside a vacant house and stopping to talk with him—
catalyzed the whole decision-making process. Anger, frustration, sadness, hope, rebelliousness,
and a sense of responsibility all may have played a role. After all, most organizations are made
by, of, and for human beings—not data. The vignette raises many questions. What would Lisa
4
have done if the NIS were not available? Did using the NIS save her time? If so, does that mean
Lisa can be more productive? Did using the NIS result in a better outcome? How do community
development professionals even define a better outcome? If Lisa’s decision-making process was
flawed—how could it have been improved? Given that decision-making in organizations may
differ from the data-driven process that NIS proponents envision, should developers and
foundations continue to pour time and money into building and maintaining these systems?
NIS supporters have yet to posit explicit mechanisms and theories that connect the
provision of data with these benefits. Their reports provide intriguing vignettes and anecdotal
evidence, but not fuller evaluations. None isolate the impact of specific data and tools on specific
planning processes. In one report, the authors write that the impact of the NIS in Providence,
Rhode Island, is its incorporation into a foreclosure early warning system and into neighborhood
policing efforts (Treuhaft et al. 2007). This assertion conflates use with effect. How did the NIS
help these projects? How should institutions and individuals employ the technology for the
greatest benefit?
NIS supporters make claims that—if true—could radically improve decision-making in
organizations conducting important geographically targeted work. Community development
corporations (CDCs) in particular seek to improve the quality of life in specific distressed
neighborhoods (Rubin 2000) and their investments have had a positive impact on property values
(Galster et al. 2005). Most recently, some of these organizations have helped to rehabilitate
vacant and abandoned structures left behind by the foreclosure crisis (Kingsley et al. 2009). But,
the need for such services—subsidized in part through community development block grants
(CDBGs)—can outstrip the capacity of local-level organizations (HUD 2010). Increasing the
capacity of grantees remains a Department of Housing and Urban Development (HUD) priority
(ibid). NIS may provide just the needed capacity boost to enable small nonprofit organizations to
meet local demand for community development services. Furthermore, funders often require
neighborhood interventions to include components that line up with supposed NIS strengths,
such as public participation (Kubisch et al. 2010). Behind these exciting claims and urgent needs
lies conflicting evidence. On one hand, many planning activities involve routine calculations that
computers can automate (Chandler et al. 2006; Harris 1989). On the other hand, studies show
that introducing new technology rarely produces the desired organizational improvements

5
(Robey and Sahay 2001).

6
Chapter 2: Literature Review
This research weaves together knowledge from four largely disparate areas: science and
technology studies (STS), capacity and capacity building, public participation geographic
information systems (PPGIS) and neighborhood information systems (NIS), and management
information systems (MIS).
Science and Technology Studies2 (STS)
Definitions of technology often contain a material component and a social component
(Grint and Woolgar 1997:9–10). Two opposing theoretical approaches describe the relationship
between these components. Technological determinism holds that a given technology impacts
society in a predestined and unmediated manner. Social contingency3 holds that the impact of
technology is mediated by social factors. These approaches are not monolithic. Scholars have
identified and organized strains of deterministic thinking into typologies including hard and soft
(Smith 1994); normative, nomological, and unintended consequences (Bimber 1994); and
justificatory, descriptive methodological, and normative (Wyatt 2008).
The earliest known example of technologically deterministic thinking in the United States
occurred in 1787 when an avid supporter of factory industrialization proclaimed that it led to
“paths of virtue” and promoted “political salvation” in an unstable economy (Smith 1994:4). The
claimed benefits of technology do not stop at logically connected outcomes such as factory
productivity, but extend to wider social change.. Although hinted at from the mid-1800s to early
1900s (see for instance Brette 2003 concerning Veblen), social contingency came much later.
Latour and Woolgar's (1979) work paved the way for contingency theory by raising
doubts about whether scientists follow the scientific method and whether technology stands
separate from society. Contingency theorists focus on the factors mediating technology
development and technology use. For example, those employing actor-network theory have
2 This field of study is also referred to as science, technology, and society, with no change in the acronym (STS).
3 Social contingency is also referred to as social construction

7
sought to explain how a myriad of interconnected people, policies, events, and extant technical
artifacts contribute to the development of other technologies (Latour 2007) such as GIS (Harvey
2001) and housing (Cowan, Morgan, and Mcdermont 2009). Other theorists have sought to
explain the integration of a new technology into an existing lifestyle, organization, or industry
(e.g.: Barley 1986; Leonardi 2007; Zuboff 1988).
Contingency theorists argue that organizational change occurs as individuals respond to a
technology’s affordances and constraints (Leonardi and Barley 2010). Increasingly,
organizational leadership tries to initiate change through the introduction of new information
technologies. These efforts frequently fall short of expectations (Robey and Sahay 2001). For
instance, adoption of expensive enterprise resource planning systems that integrate sales,
procurement, accounting, and other business activities does not always yield the efficiency gains
and cost savings vendors promise and customers expect (Grant et al. 2006). However, many
studies treat information technologies identically to mechanical technologies, failing to
understand the role information plays in the specific workplace under investigation (Leonardi
2007). An exceptional study found that when computer technicians gained access to each other’s
solutions to past customer problems, they not only learned how to solve those problems but
sought out the appropriate coworker for advice directly, contrary to established protocol
(Leonardi 2007). The study showed that information affects both decisions (how to solve the
problem) and relationships (whom to speak to about the problem).
Nuanced studies about technology—especially information technology—have not left a
mark on the world of practice or the popular media. Financial incentives push marketers to
exaggerate benefits, and customers remain hopeful that the newest device will work miracles.
Professionals in the fields of computers and telecommunications continue to embrace “the
language of momentum, trajectory, and technical imperatives” (Winner 1997:1). The Arab
Spring in 2010 provides a recent example. Despite video footage of violent clashes between
human actors and a diversity of eventual outcomes (see Howard 2011), technology pundits and
activists both attributed Facebook, Twitter, and the Internet with performing the hard but
inevitably successful work of spreading democracy. After Mubarak’s departure, a Google
executive active in the Egyptian grassroots opposition exclaimed in an interview that “if you
want to liberate a society, just give them the Internet” (Cooper 2011). To be fair, technologies
can seduce even ardent adherents of the socially contingent approach in their private lives and

8
elicit a sense of wonder, offering technological determinism a certain level of immortality (Wyatt
2008:167).
Participation, Capacity, and Capacity Building
Urban planning and technology scholars offer slightly different understandings of
participation, capacity, and capacity building. In terms of participation, since at least the 1960s,
academics in planning and political science defined participation as public involvement in
decision making, accountability, and transparency (Arnstein 1969). Democratic societies include
legal requirements for the governed to have a voice in their government. Scholars provide
different normative prescriptions ranging from self-government, which models citizens as
deliberative community members (Barber 1984; Etzioni 1993) to e-government, which models
citizens as individual consumers (Ho 1999; Osborne and Gaebler 1992). Leaning toward the
former model, planning scholars have defined and measured participation by how well
participants represent a constituency (Morrissey 2000), the number of participants (ibid), the
freedom participants enjoy to create new option (Lowndes 1995), and the degree of influence
over a decision (Arnstein 1969). Although planning as a discipline holds participatory decision
making as a desirable ideal (Friedmann 1987), the literature includes both reasons for and against
increased public participation. While the involvement of local residents and affected parties can
increase the legitimacy of nonprofit and governmental organizations, including CDCs (Glickman
and Servon 1998), residents may want to pursue activities that professional planners believe are
discriminatory (Bratt 2009; Campbell 1996; Kymlicka and Norman 1994) or unlikely to succeed
on technical grounds.
Scholars trained in engineering and communications employ the term “access” over
“participation”. In the 1980s and 1990s, technology boosters argued that new information and
communication tools would provide everyone with better choices and better access to goods and
services (e.g.: Negroponte 1996). The term “digital divide” first appeared in a 1995 report by the
National Telecommunication and Information Agency to describe systematic socioeconomic
gaps in use of computer networks. A study in 2000 showed that nearly eighty-percent of white
Americans earning at least $75,000 were online while three quarters or more of black Americans
and people 65 years old or over were not online (Lenhart 2000). In 2011, 21% of Americans
reported not using the Internet with age and income still explanatory—but not race (Zickuhr and

9
Smith 2012). While cell phones have brought many people online for the first time, reasons for
not using the Internet still include: lack of access, lack of a computer, or the cost of access
(28%); the time or difficulty to learn how (21%); and disinterest (42%) (ibid). Early policy
discourse on ending the digital divide both in the U.S. and internationally focused on improving
the distribution of personal computers and Internet infrastructure with an underlying logic
described by one critic as “’technologic optimism bordering on determinism’” (Epstein et al.
2011:94 quoting Thompson 2004). Later discourse has focused on skills and the social resources
necessary for building those skills—arguing that material access alone is insufficient for
enjoying the benefits of information technologies (Epstein et al. 2011).
Definitions of capacity and capacity building also differ between disciplines. Scholars in
urban planning, sociology, and public health define capacity as the power of an individual,
organization, network, or community to accomplish a task or goal and capacity building as
increasing that power (e.g Chaskin 2001; Glickman and Servon 1998; Maclellan-Wright et al.
2007). In technology studies, capacity often refers to the power—called the affordance (Oliver
2011)—inherent in a technology to accomplish a task or goal. This research examines
technology through an urban planning lens and therefore explores planning related literature
about capacity more thoroughly than technology related literature about affordances. The
methods section picks up the affordances theme again by including questions designed to reveal
how NIS delivers claimed benefits at the level of interface features and system functionality.
Chaskin (2001) and Maclellan-Wright et al (2007) both provide approaches for studying
capacity at the community level. Chaskin’s (2001) framework, based on empirical community
building work and designed to summarize observed processes, consists of six interrelated
components. Each level of social agency (type of actor) draws upon characteristics of community
capacity and pursues capacity building functions through a number of strategies. Conditioning
influences help or hinder these efforts to build capacity and produce other outcomes. Maclellan-
Wright et al (2007) developed a community capacity measurement instrument for guiding health
related programming, which consists of nine distinct components with one to four indicators
each. The components are participation; leadership; community structures; role of external
supports; asking why; resource mobilization; skill, knowledge, and learning; links with others;
and sense of community. Many overlaps exist between these two approaches. Characteristics of
community capacity in the first approach explicitly includes the subcomponents “sense of

10
community” and “access to resources”, which are main components in the second approach.
Similarly, “leadership” falls under strategies in the first approach and stands on its own in the
second approach. However, Chaskin’s conditioning influences have no parallel in the other
framework and are extremely useful for research on community development corporations,
which serve neighborhoods with very different conditions that influence both the strategies staff
members adopt and their chance for success. Moreover, Chaskin’s attention to multiple levels of
social agency (individuals, organizations, and networks) dovetails with a model for examining
information systems introduced later which posits that benefits may accrue at the individual,
organizational, or even higher levels. For these reasons, Chaskin’s model merits closer
inspection.
Figure 1 below illustrates the relationship between framework components with the most
important flow occurring from left to right (Chaskin 2001, 295).4 An actor from one of the levels
of social agency (#2), for example the director of a CDC, draws upon skills and resources
described by characteristics of community capacity to pursue a capacity building function (#3)
such as the production of a new service—a house painting program. This director is affected by
conditioning influences (#5) such as poor residential stability in the neighborhood. The
residential turnover impacts the director’s strategies (#4). He or she might need to focus on
building leadership to replace leaders who have left or focus on organizational collaboration
(networking) to tap leaders and resources outside the neighborhood. If successful, these
strategies may build both the capacity of the CDC and of the community—and result in other
outcomes (#6) as well, such as improved (or stabilized) real estate values. Note that CDC staff
members seek to improve their conditioning influences (neighborhood conditions) and the model
lacks such a feedback loop.
4 There are slight differences in the frameworks described by two related publications, an article (Chaskin 2001,
296) and a book (Chaskin et al. 2001, 12). This research follows the article version, which only places
“organizing” under Strategies and does not include a somewhat overlapping “organizing and advocacy”
Function.

11
Figure 1: Chaskin's (2001, 296) Community Capacity and Capacity Building Framework
(legend added, inferred from author’s text)
Scholars also offer multidimensional capacity frameworks for organizations
(Fredericksen and London 2000; Glickman and Servon 1998; Lusthaus et al. 2002; McKinsey &
Company 2001; De Vita and Fleming 2001). Some scholars have focused on a single dimension
of capacity building, such as organizational capacity (Germann and Wilson 2004; Nu’Man et al.
2007) or financial capacity (Bowman 2011). Evaluations of how geographic information
technology impacts nonprofit organizations are sometimes phrased in terms of the capacity of
organizations to “adopt” the technology (e.g.: Bishop 2009).
Of the frameworks reviewed, Glickman and Servon's CDC Capacity provides the richest
description of capacity and capacity building specifically geared toward the type of organizations
under investigation in this research. It consists of five sub-capacities each summarized in the
table below. Each sub-capacity relates to a number of capacity building needs that the authors
Border of main community capacity component
Border of secondary community capacity component
Border of mediating community capacity components or outputs
Flow of influence or use, i.e.: (2) actors use (4) strategies & (5) safety
influences (1) commitment

12
describe. For example, resource capacity relates to the needs for (1) long-term operating
support, (2) resources for stabilization and expansion, (3) development capital, (4) access to
funders, and (5) balanced portfolio risk (Glickman and Servon 1998). However, in their
application of the framework (Glickman and Servon 2003), the authors address only a subset of
these capacity building needs and this research adopts the same pragmatic approach.5 A star (*)
indicates that the capacity-building need is addressed qualitatively in this research. A plus (+)
indicates that the capacity building need is addressed qualitatively and quantitatively in this
research. Chapter 5 describes the measurement of these needs in detail. Needs left unmarked in
the table are not addressed in this research at all.
5 Glickman and Servon (2003) acknowledge the difficulty of operationalizing their framework, writing that “to
gain an understanding of the effectiveness of CDCs and the impact partnerships have on their relative strength,
it is necessary to measure the various dimensions of capacity. We approach this task with humility since it
certainly is easier to identify what kinds of capacity exist in nonprofit organizations in theory than to measure
them in practice. In addition, some of the elements of capacity are more difficult and fuzzy to measure and
quantify than are others.”

13
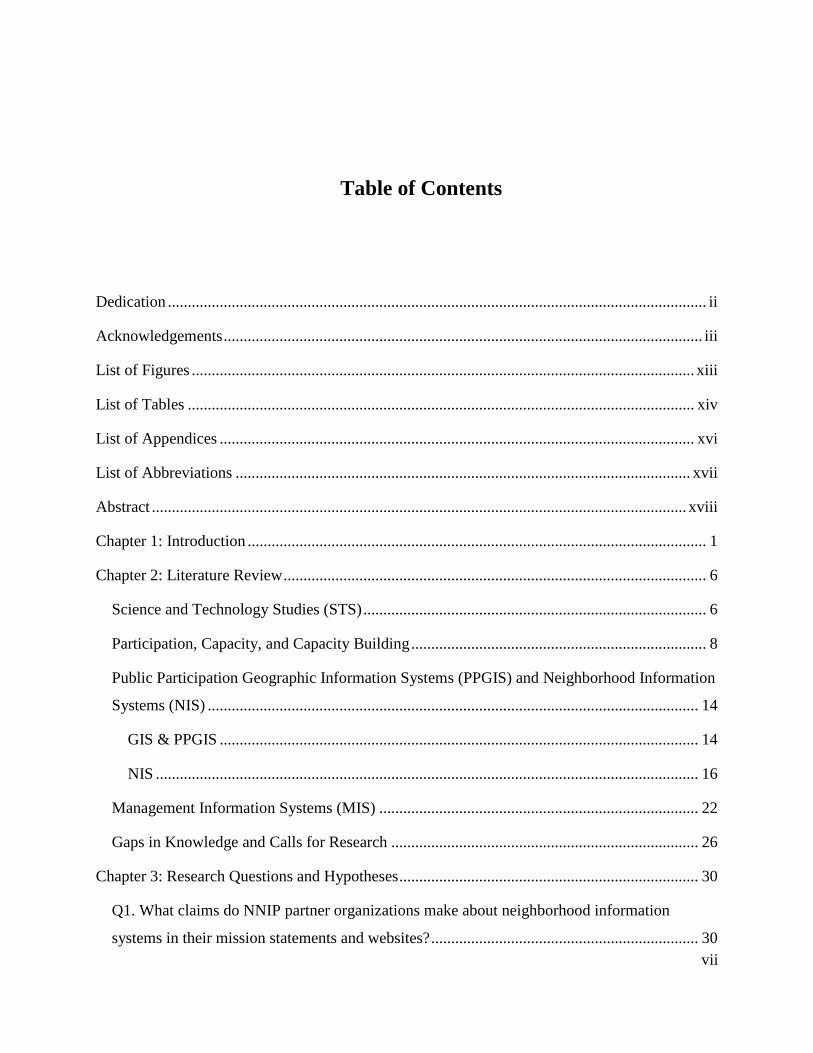
Table 1: Glickman and Servon's (1998) CDC Capacity Framework & Elements Implemented in
this Research
Capacity Description
(The ability to...) Capacity-Building Needs
Resource
capacity
Increase, manage
and sustain
funding
1. Long-term operating support +
2. Development capital +
3. Resource for stabilization and expansion
4. Access to funders
5. Balanced portfolio risk
Organizational
capacity
Leverage staff
skills & work
efficiently
1. Competent and stable staff +
2. Project management *
3. Effective executive director
4. Effective fiscal management
5. Board development and leadership
6. Managed growth
7. Evaluation
Programmatic
capacity
Pursue
community
development
(housing,
economic
development)
Skills related to:
1. Housing +
2. Organizing *
3. Commercial development
4. Economic development
5. Responsiveness to changing community concerns *
Networking
capacity
Build partnerships
with other
organizations to
move agendas
forward
1. Strong relationships with other organizations and
institutions *
2. Mutually supportive programs *
3. Promotion of CDCs' agendas externally *
4. Access to nonfinancial resources

14
Political
Capacity
Influence
government
officials and
express legitimacy
within the
community
Community participation *
Political leverage *
Educated constituents partners
Conflict management
* Addressed qualitatively in this research
+ Addressed both qualitatively and quantitatively in this research
Unmarked capacity-building needs are not addressed in this research
The authors posit that training CDC staff to employ “management information systems”
is a capacity building strategy addressing two needs of organizational capacity, “effective fiscal
management” and “project management.” This explicit mention of technology as potentially
contributing to capacity building forms the foundation of this research, providing a bridge
between the technology side of the theoretical framework and the capacity side of the theoretical
framework (both discussed later) that is grounded in the literature. While Glickman and Servon's
conceptualization of CDC capacity focuses on organizational level characteristics, these are not
the only factors affecting a CDC's operations. Neighborhood context matters as well (Rubin
2000). Since Chaskin (2001) offers an approach to capacity with neighborhood context and
Glickman and Servon (1998) offer an approach to capacity with institution specific detail,
linking the two approaches into a single theoretical framework should prove useful (also
discussed later).
Public Participation Geographic Information Systems (PPGIS) and
Neighborhood Information Systems (NIS)
GIS & PPGIS
Increased use of geographic information systems (GIS) by scholars and practitioners in the
early 1990s resulted in strongly worded exchanges between proponents and social theorists,
which turned more constructive toward the end of the decade (Sullivan 2006). Proponents

15
demonstrated how the technology eased many tasks. At least seventy percent of the data
processing in planning departments involves routine calculations on spatial data (Chandler et al.
2006). Much of this work is administrative (Harris 1989), like checking the zoning designation
of parcels for permit applications. Critics argued that GIS—originally designed to simplify,
quantify and analyze property arrangements for planning, control, and taxation—conflicts with
the goals and workflow of community-based organizations (Kwan 2002; Leitner et al. 2000).
Critics also emphasized the empiricist and positivist assumptions embedded in any discrete
model of space (Pickles 1997) and—implicitly—to the tendency of governments to grossly
simplify the relationships between people and land (Scott 1998).
The National Center for Geographic Information and Analysis, an independent consortium,
started a number of research programs on GIS including Initiative 19 in 1996 focused on the
social implications of spatial representations of people and space. Initiative 19 led to a series of
meetings and discussions amongst scholars and practitioners interested in using spatial
technologies to empower less privileged social groups (Sieber 2006). These proponents referred
to public participation geographic information systems (PPGIS) as a means to this end. PPGIS
also reflected the transfer of information technology from government agencies to (smaller)
nonprofit organizations, as the former moved away from directly providing some goods and
services and the latter moved to fill the gap. This shift of responsibilities had been occurring for
decades (Wolch 1990). Neighborhood groups use GIS for a range of purposes including
administrative (e.g. to maintain a database of properties), strategic (e.g. to target resources),
tactical (e.g. maps for persuasion), and organizational (e.g. for grant writing) (Craig and Elwood
1998). Staff in nonprofit organizations have employed GIS to examine issues at the
neighborhood and national levels, including bike-paths, residential foreclosures, transit-oriented
development, and green infrastructure (Al-Kodmany 2012).
Evaluations of GIS fall into two broad categories, one focused on the technical details of
the technology (hardware, software, and data) and one focused on the impact of the technology
on social outcomes. The former category started as far back as NCGIA Initiative 1 (1988) and
continues today (e.g. Brown 2012). The latter category remains rare (Nedovic-Budic 1999;
Sieber 2006). Nedovic-Budic (1999) reviews methods relevant to the evaluation of GIS effects
and selects the original form of the DeLone and McLean model (1992) to organize findings. The
next section will explain this model in detail. Note now though that Nedovic-Budic employs the

16
model as an organizational aid to inventory methods not the results of evaluations. She
concludes that within the planning field, evaluations of GIS should focus on “organizational goal
achievement, public policy and decision-making effectiveness, and societal or community
impacts” (1999, 293). She emphasizes the importance of multiple forms of data collection:
qualitative, quantitative, cross-sectional, and longitudinal (ibid). After an extensive review,
Sieber (2006) finds that outcomes in the PPGIS literature vary from material deliverables (maps
and reports) to empowerment, participation, equity, and increased democracy. But, the literature
fails to firmly connect technology with outcome. She writes that
“Few PPGIS researchers explore measures of PPGIS effectiveness. Difficulties in
measurement arise from the demands to establish a causal or associative relationship
between technology and the outcome ascribed to it. A positive effect may be unconnected
to PPGIS and instead reflect a well-connected and resourced organization.”
(Sieber 2006:502)
Despite the dearth of evaluations available, several organizations have advocated for broader use
of GIS technology. HUD provided GIS tools to community development corporations to
improve their capacity to complete funded projects (Leitner et al. 2000). In 1995 the Urban
Institute and partners in seven cities started the National Neighborhood Indicators Partnership,
which advocates for the development of neighborhood-level indicator systems and their
application in distressed urban areas (NNIP Webpage, “Concept”). The systems of many partners
include mapping and querying on a web page, providing community-based organizations GIS
functionality as envisioned by PPGIS scholars (e.g. Leitner et al. 2000) and providing a
conceptual bridge between GIS and NIS.
NIS
The National Neighborhood Indicators Partnership (NNIP) currently includes 47
organizations across 36 cities. While the vast majority are private nonprofit organizations, the list
includes government institutions like the Chicago Metropolitan Agency for Planning (CMAP)
and academic institutions like the Baltimore Neighborhood Indicators Alliance (BNIA) at the
University of Baltimore, the Center on Urban Poverty and Community Development at Case
Western Reserve University, and the Center for Urban and Regional Affairs (CURA) at the

17
University of Minnesota. Community development and technology scholars and practitioners
frequently refer to these types of organizations as “data intermediaries” (i.e. Kubisch et al. 2010)
because they form an intermediate step between raw data producers and lay data users that
makes the data easier to access. NNIP partners commit to building a recurrently updated data
system, strengthening distressed neighborhoods, and working with organizations that use data for
“advocacy, organizing, program planning, or policy development” (NNIP n.d.).
In supporting NNIP, the Urban Institute returned to the idea of an urban social report
(Bell 1969; Kingsley 1998) popular at the time of its founding in 1968 after violence in
American cities brought attention to inner city neighborhoods, blight, social inequality, and
racism. Respected and influential foundations such as The Annie E. Casey Foundation, the
Rockefeller Foundation, and the John D. and Catherine T. MacArthur Foundation have all
provided NNIP with funding (NNIP n.d.). The theoretical roots of NIS can also be traced back to
government accountability and performance tracking tools and to the previously described rise of
PPGIS (Hwang and Hoffman 2009).
In 1994, leaders in the New York City Police Department created an approach to
evaluation and management that relied heavily on computer calculated statistics, which they
called CompStat. The approach spread quickly to other departments and to other cities and
countries. In 1999, Baltimore’s CitiStat extended the principle to “all municipal functions” in
order to “maximize personal accountability” across city government within a single program
(Anon 2010). Hwang and Hoffman (2009) argue that the similarity between NIS and CitiStat lies
in their mutual reliance on information technology, which “drives reinvention,” and their mutual
promotion of and benefit from “better data practice” (Hwang and Hoffman 2009, 168). While
this argument has merit, focusing on data practice overlooks that CitiStat-style programs do not
rely on data alone. They require political buy-in from city mayors and the heads of city
departments to reward better performance and punish worse performance (Behn 2005). Focusing
on data practice as a technical accomplishment may divert researchers’ attention from assessing
the contribution of data practice to neighborhood impacts. Similarly, Hwang and Hoffman
(2009) argue that the connection to PPGIS concerns a common focus on how staff in
neighborhood organizations employ the technology in their day-to-day work (i.e. Elwood 2002),
which can divert researcher attention from assessing the contribution of such work to

18
neighborhood impacts.
As part of the Urban Institute, NNIP reports carry weight with government agencies,
foundations, and community-based organizations. NNIP and its affiliates advocate for an
approach to local-level decision-making that relies heavily on data and technology. Literature
about NNIP and partner activities include material published by the network and material
published in peer-review publications.
NNIP Produced Material6
Researchers associated with the Urban Institute, NNIP partners, NIS funders, and policy
think tanks publish reports that describe, through mini case studies, how these systems are built
and used across the county. The reports stress the need for collaboration between government
agencies that produce and maintain major administrative datasets such as property records, data
intermediaries that make these datasets easier to understand, and local foundations that fund such
activities. For example, the Providence Plan, a NNIP partner, has developed “long-term
collaborative relationships with data providers…and assembled rich datasets that combine
property-level and individual-level data from previously separate sources.” (Treuhaft et al.
2007:29). The resulting NIS in Providence supports multiple neighborhood change efforts and
each effort is described as a “community impact” of the system (ibid). A local early warning
system draws on the NIS’ property data to help prevent housing abandonment. Information in the
NIS helps participants in neighborhood policing programs target their efforts and prisoner re-
entry advocates understand and communicate relevant issues to a wider audience. Several reports
capture the complex interplay between collaborative decision-making, technology development,
and public policy-making. For example, staff at the Polis Center in Indianapolis, a NNIP partner,
strove to create an early warning system for housing abandonment but found that it lacked
support after a reshuffling of jobs and priorities in local government (despite a related meeting
attended by 400 residents). Thinking practically, Polis Center staff members met with
6 Several NNIP thought-leaders published a new book in September 2014 that may elaborate on some of what is
analyzed here: Strengthening Communities with Neighborhood Data by G. Thomas Kingsley, Claudia J.
Coulton, and Kathryn L.S. Pettit.
19
representatives from other non-profit organizations and devised a completely different tool for
evaluating Community Development Block Grant applications (Kingsley and Pettit 2008, 10).
Data can act as an aid to decision-making (such as in the Providence early warning system)—but
also as an aid to public mobilization. For example, leaders in two organizations supporting the
NNIP partner in Atlanta sought to raise interest in a new data system for combatting mortgage
foreclosures in the city. Staff in the Office of University-Community Partnerships (OUCP) at
Emory University and in the Atlanta Regional Commission (ARC) acquired census tract level
HDMA data from the Urban Institute and made a series of maps examining foreclosures, which
they then presented to various audiences. The team felt that “the data ‘got their foot in the door’
to mobilizing serious joint consideration of [foreclosure] response strategies” (Kingsley et al.
2009, 18).
While helpful in showing the breadth of different projects, a review of these publications
reveals a number of analytical shortcomings:
1) Poorly defined terms. Key concepts like poor neighborhoods (Kingsley 1998), low-
income neighborhoods (Enterprise 2010; Kingsley and Treuhaft 2008), distressed urban
neighborhoods (ibid), participation, and capacity building remain loosely or implicitly
defined.
2) Conflating use with impact. Treuhaft et al. (2007:29) write that the “community impacts”
of the NIS in Providence are its incorporation into an early warning system,
neighborhood policing, advocacy around prisoner reentry, and tools for “neighborhood
and regional action”. While many technology scholars define use as a form of impact, at
least one dissenting scholar argues that “information has no intrinsic value” and impact
must reflect influence on “human decision-makers” that affects “physical events”
(DeLone and Mclean 1992, 69, quoting Emery 1971). This dissenting opinion dovetails
with those of many practicing planners and planning scholars who seek to improve the
lives of people and the function of places and to measure those changes (Myers 1997).
Impact might be usefully redefined as the contribution of NIS to the outcomes of the
various Providence programs—but not as its use alone.
3) Vague connection between use and impact. Kingsley and Pettit (2008) do not mention
how—if at all—NIS was used in an Indianapolis summit attended by four hundred

20
residents. The Community Development Block Grant tool that eventually emerged from
the summit does use NIS, but does not appear to directly involve residents in any way.
Yet, the narrative suggests a connection between NIS and public participation.
4) No counterfactual from which to measure impacts. Staff at Emory University and at the
Atlanta Regional Commission (ARC) believe data from NIS “got their foot in the door”,
helping to mobilize a six county coalition around mortgage foreclosure prevention
(Kingsley et al. 2009, 18–21). An accurate evaluation should compare NIS to tools staff
members employed previously.
5) No confirmation of mechanisms. Kingsley (1998, 1999) claims “one-stop shopping” is a
key NIS advantage because it saves users time. NIS systems frequently provide mapping,
which has proven useful in participatory planning efforts (Al-Kodmany 1999). NIS may
also provide tools for avoiding “data overload” by focusing user attention on relevant
information and making reasonable predictions (Simon 1945:123 & 248). Time savings,
visual cues, and data reduction are three potential mechanisms through which NIS may
deliver benefits under certain conditions, but reports from practitioners do not confirm
the “why” behind claimed benefits.
Despite these shortcomings, practitioners and scholars involved with comprehensive
community initiatives designed to involve residents in decision-making and build the
capacity of individuals and institutions see NNIP as “one of the most important new
resources in the community change field” (Kubisch et al. 2010:39). The perceived potential
of NIS to contribute positively in community change efforts is very high. Evidence in peer-
review publication to support this potential or its realization remains sparse, as the next
section explains.
Peer-Reviewed Material
Despite frequent mention in professional practice reports and the growth of NNIP from
seven to thirty-five locations, only nineteen articles or briefs in peer-review journals mention the
partnership directly.7 The dearth of peer reviewed studies alone reveals a broad gap in
7 Multiple searches for “NNIP” or “National Neighborhood Indicators Partnership” in the University of Michigan’s

21
knowledge. Several articles mention the partnership only to introduce the concept of
neighborhood information systems (Ali et al. 2007; Borders, Edwards, and Miller 2013; Castro
and Atkinson 2009; Planas Llado and Soler Maso 2011). Several articles discuss the
development and management of neighborhood information systems in detail including the need
for data sharing and collaboration (Hwang 2006; Stoecker 2006; Weitzman, Silver, and Brazil
2006). Urban Institute affiliated researchers authored two articles advocating for the use of
indicator systems to improve policy (Howell et al. 2003; Kingsley 2003).
One study (Hwang and Hoffman 2009) examines the demographics and purpose of
neighborhood information system use. A broad survey of 221 respondents distributed via NNIP
partners and other NIS providers from December 2006 to March 2007 found that 92.7% were
affiliated with organizations and only 7.3% of users were unaffiliated individual (ibid). The three
largest organizational users were: community nonprofits, CDCs, and CBOs (29.2%); government
agencies (17.8%); and universities and colleges (16.4%). Housing and demographic datasets
proved the most popular in the survey. Respondents used the data for proposal writing,
evaluation, and strategic planning. The survey had several limitations. First, data collection
proceeded from a convenience sample to a snowball sample with no tracking of nonresponse
error, and the authors admit to the possibility of self-selection bias (ibid). Second, the published
results do not specify the user base of specific neighborhood information systems or the
variability between systems. Third, the survey does not differentiate between users who access
the system only once a year from those who access the system more regularly.
Two sets of scholars collect data through self-reporting (surveys and/or interviews) to
examine the impacts of neighborhood information systems and bring somewhat contradictory
findings (Hwang and Hoffman 2009; Weitzman et al. 2006). Weitzman et al. (2006) find that
amassing neighborhood data does not ensure political change or better decision-making. Hwang
and Hoffman (2009) find that data access through NIS empower community organizations and
build capacity. They did not find evidence that NIS leads to more participatory decision making.
The authors did not independently confirm respondent claims that the systems lead to
empowerment or to capacity building.
ArticlesPlus meta-search engine, most recently submitted on 11/9/2014.

22
Management Information Systems (MIS)
Management information system (MIS) scholars have developed several approaches to
evaluating information systems. One major stream examines user acceptance of technology
(starting with Davis, Bagozzi, and Warshaw 1989) and another major stream examines
information system success (starting with DeLone and McLean 1992). Since previous work in
PPGIS has explored cultural acceptance of the technology (see Sieber 2006:494), the research
herein focuses on the latter stream. Delone and Mclean’s (1992) Information Success Model
unites temporal ordering of subcomponents and covariance between subcomponents. It remains
the most frequently cited model in the management information system literature (Lowry,
Karuga, and Richardson 2007). Variations include extending the model to three dimensions
(technical development, deployment to the user, and delivery of benefits) (Ballantine, Bonner,
and Levy 1996), separating the temporal and covariance dimensions (Seddon 1997), and adding
service quality as a subcomponent (DeLone and McLean 2003). Recently, several scholars have
produced very different and specialized models for particular technologies including enterprise
resource planning systems (e.g. Zaitar and Ouzarf 2012) and service-oriented architecture (e.g.
Mueller et al. 2010).
DeLone and McLean’s model provides a useful set of conceptual components while
making few assumptions about the nature of the information system. The authors urge scholars
to identify meaningful measures for model components in specific situations (DeLone and
McLean 1992, 2003), a common approach in the field of information systems (Tate et al. 2014)
despite the aforementioned move toward specialized models by some scholars. A review of four
popular, general-purpose models (Davis et al. 1989; DeLone and McLean 1992, 2003; Seddon
1997) found enterprise systems, knowledge management, and data warehousing to be the most
common evaluation targets (Urbach, Smolnik, and Riempp 2009). Furthermore, two articles
about the evaluation of GIS (Nedovic-Budic 1999) and NIS (Hwang and Hoffman 2009)
mention DeLone and Mclean’s (1992) model—though neither applies it to empirical planning
research. Nedovic-Budic (1999) employs the model to structure a literature review of methods
for GIS evaluation. Hwang and Hoffman (2009) distill the framework into a definition of
effective and successful NIS that—in the interest of brevity—removes the level of detail
necessary for in-depth evaluations of specific systems.
Figure 2 (below) provides an overview of the DeLone and McLean model. All

23
components together capture an elusive dependent variable called “information system success”.
However, the authors argue that “causality flows in the same direction as the information
process” (DeLone and McLean 2003:15)—from left to right—making earlier constructs
independent variables for later constructs. The figure can be succinctly understood as having
three columns. Components in the first column (Information Quality, System Quality, and
Service Quality) capture the potential usefulness of the system. This column mostly concerns
hardware and software, but Service Quality may involve customer support and training.
Components in the second column (Intention to Use, Use, and User Satisfaction) all
involve people who use the information system. Individuals want to use the system (Intention to
Use) based on its perceived usefulness from the first column. Given access, both in terms of
infrastructure (an Internet connection) and permission (an account or no login required) Intention
becomes Use. Critics argue that use is a behavior that must precede success—but does not cause
it as the model assumes (DeLone and McLean 2003). The authors reply that research must
examine the nature of use and not rely on narrowly defined quantitative measures (ibid). User
Satisfaction measures the reaction of users to the system because “a ‘good’ information system
perceived by its users as a ‘poor’ system is a poor system” (Nedovic-Budic 1999 cites Ives et al.
1983, 786).
The third column (Net Benefits) captures any gains that accrue from using the system.
Originally, the model specified both individual impacts and organizational impacts (DeLone and
McLean 1992) but the new model allows evaluators to define the relevant level (or levels) of
social hierarchy for analysis. Nedovic-Budic (1999, 293) adds societal impacts to the model,
noting that geographic information systems are “often viewed as a tool that will enhance public
participation and involvement in the planning process” although—she concludes—the initial
evidence “is not very optimistic”. A positive or negative use experience and the presence or
absence of benefits feed back into User Satisfaction.

24
Figure 2: DeLone & McLean (2003) Framework for Information System Success
Scholars have employed different measures for model components. Table 2 (below)
provides the number of measures DeLone and McLean (1992, 2003) identify and the measures
employed in this research, which are described in detail in Chapter 5.
Table 2: Range of measures for each component in the DeLone & McLean (1992, 2003) model
Model Part # Measures in Literature Measures in this research
Information
Quality 18
Breadth of data8, Accuracy/Currency9, Relevance
System Quality
23
Ease of use, Usefulness of system features &
functions
Service Quality 5
Responsiveness, assurance, empathy
8 The concept behind breadth of data falls under System Quality (Database contents) or Information Quality
(Completeness) in the original model.
9 Accuracy and currency are listed under both System Quality and Information Quality in the original model. In
the urban planning context, these concepts are closely connected and considered jointly in this research.

25
Information Use 23
Direct vs. chauffeured (indirect) use10
Number of queries11
User Satisfaction 8 Decision-making satisfaction
Individual Impact 21
Time to make a decision12; Correctness of
decision; Improved individual productivity
Organizational
Impact 19
Range & scope of application; Increase work
volume; Service effectiveness (defined later
according to interviews as the transfer rate and
rehab rate)
Scholars typically collect data through self-report surveys to apply the model (Petter,
DeLone, and McLean 2008) and test for predicted correlations between components through
structural equation modeling (Urbach et al. 2009). Multiple empirical studies have validated the
model, including the primary relationship under investigation in this research—that between use
and net benefits. In a broad meta-analysis, Petter et. al. (2008) found sixteen studies reporting
that use positively contributed to net benefits at the individual level with six studies reporting no
statistical relationship. The authors found five studies reporting that use positively contributed to
net benefits at the organizational level with one study reporting no statistical relationship.
Another meta-analysis confirmed the higher frequency of individual impact studies (26) versus
organizational impact studies (12) (Urbach et al. 2009).
Both the management information system field in general and the DeLone and McLean
10 Chauffeured use includes users who receive NIS data through another party, such as a CDC.
11 The number of queries per year likely include use by “confusion,” a term Hwang and Hoffman (2009), employ
to refer to useless queries submitted by users who do not know how to use the system properly. However, an
alternative method considered for this research, days of use per year, does not capture sporadic but intense
access staff members described in interviews. Another option, download time—a proxy for amount of data
requested, was not possible to implement with the logfiles received and would have been distorted by poorly
defined queries, server load, and Internet traffic.
12 In this research, time to make a decision includes the time to collect and arrange the information necessary to
make the decision.

26
model in particular have been the subject of critique. MIS scholars tend to attribute changes in
outcome to success of the system under investigation (Nedovic-Budic 1999) rather than actively
seeking alternative explanations. Review of the figure above reveals that the DeLone and
McLean model lacks formal mention of contingent variables (Ballantine et al. 1996). The model,
according to several scholars, rests on deterministic assumptions (e.g.: Bartis and Mitev 2008).
Some critics argue for a socially contingent approach, especially one realized through qualitative
methods (ibid). Other critics add contingency quantitatively, via interaction terms, finding—for
instance—that larger organizations benefit more from enterprise resource planning (ERP)
software than smaller organizations (e.g.: Ifinedo and Nahar 2009).
Several MIS scholars have called for specific avenues of future research. It is important
to explore new use contexts and different types of information systems that may reveal the
existence of boundary conditions and limits to the DeLone and McLean model (Petter et al.
2008). Although DeLone and McLean (1992, 2003) argue for scholars to identify measures
pertinent to specific domains, as a business oriented discipline, the bulk of MIS researchers focus
on the for-profit sector. The literature review did not identify a single application of the model
within the field of community development such as toward public participation or capacity
building. Scholars should also consider new forms of data collection since overreliance on self-
reported measures may introduce error (Petter et al. 2008; Tate et al. 2014). Further, measuring
use solely as frequency of use oversimplifies a key model component (Petter et al. 2008). Tate et.
al. (2014:1242) argue for “more process theories that examine the motors of change over time”
and for qualitative and mixed-methods approaches that result in “richer and more insightful
measures of success”. They further recommend multi-level models, which examine both
individual and organizational impacts (ibid).
Gaps in Knowledge and Calls for Research
This section reviews gaps in knowledge and calls for research revealed in the literature
review. In the field of science and technology studies (STS), Leonardi (2007) argues that
researchers should pay closer attention to the impact of increased information provided by
information technologies, especially the impact within organizations. Wyatt (2008) argues that
STS researchers must confront technological determinism directly by grappling with the reasons
behind different outcomes regarding the same technology. These concerns remain largely outside
27
of planning scholarship. Even when theoretical frameworks and measurement tools for
participation (Arnstein 1969; Morrissey 2000) and capacity (e.g Chaskin 2001; Glickman and
Servon 1998; Maclellan-Wright et al. 2007) refer to technologies such as management
information systems, they do not call for evaluation of their impact on increasing participation
and building capacity. Instead, for instance, Glickman and Servon (2003) identify political
capacity, networking capacity, and neighborhood impacts of capacity building as difficult to
measure and worthy of additional research. GIS scholars also find neighborhood (i.e. societal)
impacts difficult to measure and to attribute back to the technology (Nedovic-Budic 1999; Sieber
2006). They urge researchers to fill these gaps and to find techniques to identify GIS
contributions to organizational accomplishments and decision-making (ibid). Other scholars note
the importance of reporting negative findings, noting the absence of writing about GIS failures
(Tulloch and Shapiro 2003).
Neighborhood information systems provide GIS to users for free through an interactive
website. Both practitioners and scholars have called for case studies showing the value of these
systems for community development (Kingsley and Pettit 2008) with particular emphasis on
contributions to participatory decision-making (Hwang and Hoffman 2009). Practitioners offer
use vignettes that sometimes conflate use with impact (e.g. Treuhaft et al. 2007) and do not
employ a counterfactual from which to measure NIS impacts (e.g. Kingsley et al. 2009).
Practitioners rarely confirm the mechanism delivering claimed impacts, which may include one-
stop-shopping (Kingsley 1998, 1999), mapping (Al-Kodmany 1999), and data reduction (Simon
1945). These practices decrease confidence in findings. Scholars studying NIS offer conflicting
reports. Weitzman et al. (2006) find that amassing neighborhood data does not ensure political
change or better decision-making. Hwang and Hoffman (2009) find that data access through NIS
empower community organizations and build capacity. They did not find evidence that NIS leads
to more participatory decision making. The authors did not independently confirm respondent
claims that the systems lead to empowerment or to capacity building.
MIS scholars have identified several weaknesses in their work and called for specific
remedies. Past evaluations have not sought alternative explanations for impacts or explained why
some users benefit more than others (Ballantine et al. 1996; Nedovic-Budic 1999). Bartis and
Mitev (2008) argue specifically for a socially contingent approach. There is a need to examine
different types of information systems (Petter et al. 2008) and different types of data collection—

28
avoiding overreliance on self-reported measures (Petter et al. 2008; Tate et al. 2014). Tate et. al.
(2014) argue for studies of process through qualitative and mixed-methods approaches and for
multi-level models that include both individual and organizational impacts. The following table
summarizes these gaps and calls for research topics and methods. Scholars have not urged the
use of specific methods in science and technology studies and participation, capacity, and
capacity building. Therefore, the corresponding cells in the “Needed Method” column are
marked with “N/A”, meaning “not applicable”.
Table 3: Gaps in Knowledge and Calls for Research by Body of Knowledge
Body of Knowledge
Gaps in Knowledge and Calls for Research
Needed Topic Needed Method
Science and Technology
Studies (STS)
Impact of information
technology (IT) within
organizations and reasons for
divergent outcomes
N/A
Participation, Capacity, and
Capacity Building
Political capacity, networking
capacity, and neighborhood
impacts. Evaluation of IT
contribution.
N/A
GIS, PPGIS, and
Neighborhood Information
Systems (NIS)
Evaluation of technology
effects. Separate use & impact
In depth case studies,
quantitative, or mixed-
methods.
Management Information
Systems
Diversity of system types and
use scenarios, including in
non-profit organizations and
for community development.
Qualitative, mixed methods,
attention to alternative
explanations, multi-level
models.
The largest gap in knowledge remains unidentified even after reviewing the work of critical
scholars within these diverse literatures because the gap lies between them. While these fields are

29
related, they are estranged—barely on speaking terms. As mentioned previously, Nedovic-Budic
(1999) and Hwang and Hoffman (2009) reference DeLone and McLean’s (1992) model, but GIS
and NIS scholars have yet to employ the model in an empirical evaluation. Similarly, STS and
MIS scholars have yet to apply their concepts and models to investigate capacity building efforts.
The research herein seeks to address this overarching gap by providing a unified theoretical
framework for evaluating the socially contingent impact of technology on capacity building.
Developing the unified theoretical framework from foundational work in the aforementioned
fields should formalize and strengthen the connections between them and help fill each of the
identified gaps.
The research identifies and seeks to explain divergent technological impacts, positioning it
to contribute to the contingent approach to technology common in science and technology
studies. It will also examine the connection between technology and capacity building, including
political capacity building and network capacity building. The theoretical framework employed
herein separates use from impact and examines impact in depth. Finally, the DeLone and
McLean model has never before been applied using the mixed methods employed herein and
never before been applied to this particular combination of technology (NIS) and organization
(CDC), which positions the research to contribute to the diversity of MIS evaluations. The mixed
methods approach aids the search for alternative explanations, protects against some spurious
correlations, and enables multi-level work (qualitative interviews for individuals and quantitative
administrative records for organizations).
The next chapter, Chapter 3 (page 30), details the specific research questions, the hypothesized
answers to those research questions, and the reasons for the hypothesized answers drawn from
the relevant literature. Chapter 4 (page 40) describes the theoretical framework and explains how
it unifies relevant work in disparate fields. Chapter 5 (page 47) details the research design, case
selection criteria, selected case and subcases (i.e. embedded cases), operationalization of
theoretical framework components, and the methods for each research question.

30
Chapter 3: Research Questions and Hypotheses
The research questions in this chapter were developed to address gaps in knowledge
identified previously in the literature review. For example, there is little understanding about
how information technologies might support capacity building efforts. Scholars have also
explicitly called for more research on political capacity (which includes public participation) and
network capacity. These gaps are the focus of several research questions. Question 3 examines
the relationship between NIS use and public participation and capacity building from a process
perspective. Question 4 and Question 5 examines this relationship from a causal perspective. The
research questions are ordered to provide a complete picture of NIS, from proponent claims; to
use of the system in community development, to benefits from use of the system. The hypotheses
that follow each research question were developed by extrapolating from research discussed
previously in the literature review and several additional studies introduced below. There are five
research questions (Q1 to Q5).
Q1. What claims do NNIP partner organizations make about neighborhood
information systems in their mission statements and websites?
Technology scholars often systematize and test vendor claims (e.g. Schubert and Williams
2009) and this research question seeks to extend the practice to neighborhood information
systems in order to better structure findings into a practical and constructive evaluation. The
claims are drawn from mission statements and webpages of NNIP partners, mostly nonprofits.
The connection of mission statements to actual priorities and activities within nonprofit
organizations remains unknown. But in the for-profit sector, issues emphasized in mission
statements reflect both the image directors wish to convey to the public and the day-to-day
priorities and activities within the organization (Bartkus and Glassman 2008). This suggests that
mission statements will reflect the expectations of NNIP membership. According to NNIP,
partners must:
Build and operate an information system with recurrently updated indicators on

31
neighborhood conditions
Facilitate and promote the direct practical use of data by community and government
leaders in community building and local policymaking; and
Emphasize the use of information to build the capacities of institutions and residents in
distressed neighborhoods.
(NNIP Website, “Becoming a Partner”)
NNIP membership requirements lead to the following hypothesis:
Hypothesis 1
The mission statements and webpages will emphasize “indicators” (data), users (community and
government leaders), and the purpose or outcome of use (policymaking and capacity building
that benefit institutions and residents in distressed neighborhoods).
32
Q2. Who uses NIS and how frequently?
The term use herein refers to any activity a human being undertakes to obtain data stored in
an information system. The history of computers and GIS in the field of urban planning suggests
that staff in government agencies and nonprofits conducting planning activities will use NIS—if
it makes the work easier (Chandler et al. 2006; Harris 1989). As noted in Chapter 3, a survey of
NIS users nationwide supports this claim, finding that 92.7% of users were affiliated with
organizations (Hwang and Hoffman 2009). The three most common organizational affiliations
were: community nonprofits, CDCs, and CBOs (29.2%); government agencies (17.8%); and
universities and colleges (16.4%).
The same survey found that only 7.3% of users were unaffiliated individuals (Hwang and
Hoffman 2009), exposing a potential problem when juxtaposed against the final NNIP
membership requirement quoted above. Nationally, residents compose less than a tenth of NIS
users and residents in distressed urban areas may compose a tiny fraction of that tenth. Mention
of non-stockholders such as customers and community members in corporate mission statements
remains purely symbolic without these parties enjoying any corresponding influence over
decision-making (Bartkus and Glassman 2008). Mention of residents in NNIP mission
statements and webpages may also be purely symbolic. There are several alternative
explanations however. The average percent of resident users reported in the survey might mask
significant differences between NNIP sites. Perhaps residents benefit from NIS indirectly when
institutional users access the system. For example, institutional users could pass NIS information
to residents over the phone or in a newsletter. Institutional users might rely on NIS to plan
activities that build the capacity of residents—residents who never use the system directly. The
answer to this research question will begin to narrow the long list of possible relationships
between residents and NIS.
The survey asked users to rank the relative frequency (from “never” to “always”) with
which they accessed various categories of data (“demographics”, “housing”, “health”, etc.) but
did not ask for more precise measures of data access (Hwang and Hoffman 2009). Since many
NIS providers are affiliated with universities—students, professors, and staff are likely to know
about and use the systems. A professor may employ the system for multiple studies in a
planning-related field or recommend students use the system to complete a project he or she

33
assigns every year or every semester. But, since such use is not central to a job responsibility,
this use will be less frequent than use by government and CDC staff members involved in
planning.
Compared with institutional users, predicting the frequency of NIS use by residents is
less clear cut. The literature suggests that the most vulnerable members of society may not have
the opportunity to enjoy any benefits that NIS provide because they lack access or interest
(Zickuhr and Smith 2012) or skill (Epstein et al. 2011). Furthermore, initial exploratory
interviews suggested that NIS providers in Cleveland, Detroit, and Minneapolis advertise NIS to
organizational users more than to individual users.
The reasoning above yields three hypotheses:
Hypothesis 2a
City departmental and CDC staff will be the most frequent users of neighborhood
information systems.
Hypothesis 2b
People affiliated with local educational institutions will use the NIS, but less frequently
than people affiliated with local government departments or with CDCs.
Hypothesis 2c
Residents not affiliated with governmental, educational, or community development
organizations will not use NIS frequently or will not use NIS at all.

34
Q3. How do Community Development Corporation (CDC) staff use NIS?
Community development refers to efforts to improve the well-being of residents in a
particular geographic area through built environment, human capital, social capital, and
commercial strategies (Rubin 2000; DeFilippis and Saegert 2008) though considerable
disagreement persists over details (e.g.: DeFilippis 2010; Kirkpatrick 2007; Shaffer 2006). Built
environment strategies include housing and real estate development, code enforcement, paint
programs, side lot adoption, and the demolition of dangerous structures. Human capital strategies
include workforce development, technical training, and general education programs. Social
capital strategies include strengthening the relations between people and between people and
local organizations. Commercial strategies include business attraction, business retention,
business incubators, and facade maintenance grants. Specific CDCs prioritize these strategies
differently and may integrate NIS differently into their work.
While vendors and pundits claim that technology will radically alter organizational
structures and employee workflows, scholarship suggests that computer applications reinforce
the preexisting structure of organizations (Grint and Woolgar 1997:25) and that employees
integrate software into preexisting workflows (Grant et al. 2006). For these reasons, hypothesis
3a states:
Hypothesis 3a
CDC staff members will use NIS to pursue the same work as they pursued before using
NIS.
Theory also suggests that a given technology may provide affordances that make certain
activities and ways of working easier (Oliver 2011). CDC staff members will likely only use NIS
in work for which it is well-suited. As Chapter 4 will make clear, funders and programmers
developed one version of the NIS under investigation to assist with a physical development
strategy of community development. Therefore, the next hypothesis is:

35
Hypothesis 3b
CDC staff members will use NIS primarily to pursue the physical development strategy
such as through residential rehabilitation.
As the theoretical framework in Chapter 4 will explain, the ability of a CDC to conduct
public participation activities is an expression of that CDC's political capacity. However, this
research presents questions about participation and capacity separately to mirror the claims of
NIS proponents.

36
Q4. Does NIS improve public participation and, if so, what factors mediate the
improvement?
The claim that NIS can improve public participation encounters two challenges in the
literature, one related to CDCs and one related to GIS. Historically, Community Action Agencies
(CAAs)—the predecessors of Community Development Corporations (CDCs) created by the
Economic Opportunity Act of 1964—strove to achieve “maximum feasible participation” of
local residents in decision-making (DeFilippis 2008). But, perceived radicalization of some
CAAs ended direct federal funding of grassroots participation and gave rise to the current
Community Development Block Grant (CDBG) system in which cities receive money and make
allocations to community organizations (ibid). In response to reductions in federal support in the
1980s and 1990s many CDC directors saw residential and commercial real-estate construction
and management as a path to solvency (ibid) and reassigned community organizers to non-
organizing tasks (Vidal and Keyes 2005). Intrinsic tensions between aggressive community
organizing and development deal-making limits the extent to which the two approaches can
coexist in the same institution (Yin 1998; Stoecker 2003; Smock 2003; Stoecker 2008).
Consequently, many CDCs become disconnected from the day to day lives of local residents.
From this point of view, there is little reason to believe CDC staff members will employ NIS to
pursue public participation and therefore little reason to expect an opportunity to examine the
tool's impact. Therefore, the first hypothesis for this research question is:
Hypothesis 4a
CDC staff members will not use NIS to increase public participation because they will
not be pursuing public participation activities and NIS does not require them to pursue public
participation activities.
There remains insufficient evidence to conclude that NIS could increase public
participation. GIS has been employed successfully within public participation processes to
capture local neighborhood knowledge, formally express residents' preferences, and deepen

37
communication about important issues (Talen 2000). Some scholars even argue that Internet-
based GIS could provide unprecedented levels of public participation (Drummond and French
2008). However, multiple studies reveal that even when a stated goal of GIS use, an increase in
public participation does not automatically occur and change remains difficult to define,
measure, and detect (Sieber 2006). Therefore, the next hypothesis is:
Hypothesis 4b
NIS will not increase public participation within CDCs employing NIS in public
participation activities.
Q5. Does NIS improve the capacity of a CDC and, if so, what factors mediate
the improvement?
The basis for the earlier hypothesis that CDC staff members will not change their
workflow to use NIS suggests that any capacity improvements that require such changes will not
occur (Grant et al. 2006; Grint and Woolgar 1997). HUD previously supplied local community
development organizations with GIS software to bolster their capacity (Leitner et al. 2000) and
GIS software is now even more affordable and widely available—yet HUD recently reported that
some local community development organizations still lack the capacity necessary to complete
contracted activities (HUD 2010). Clearly, GIS provision does not guarantee greater capacity.
GIS overlaps considerably with NIS, suggesting that the latter will not guarantee greater capacity
either. Scholars evaluating GIS report that capacity improvements—when detected at all—vary
by organization (Elwood 2008; Robey and Sahay 2001). The following factors are associated
with some form of capacity gain—variously defined—from GIS (ibid):
More resources (money, computers, and employees)
The presence of staff trained on GIS
Decentralized decision-making (more staff autonomy)
Good fit between staff assumptions and GIS assumptions (e.g. staff conceive of space in

38
terms of discrete parcels and not something more abstract)
Management researchers found that simply controlling more material resources (money,
property) and better intangible resources (reputation, business practices) can lead to firm growth
and success, depending on how these factors are defined and measured (Newbert 2007). Such
empirical findings for the resource-based approach to analyzing organizations, though rather
weak, dovetails with the findings concerning when GIS builds an organization’s capacity.
Therefore, this research examines several of these factors as alternative explanations for an
increase in capacity. Take, for example, staff members in a community development corporation
who increase their use of NIS and rehabilitate more vacant properties than last year. The analysis
would have to control for a potential increase in resources as well, such as CDBG funding and
employees. The increase in production may not be due to NIS entirely. It may not be due to NIS
at all. Further, since CDCs operate in and on specific neighborhoods—local environmental
factors such as the residential vacancy rate and owner occupancy rate may strongly determine
what type of work staff members pursue and their level of success. These competing
explanations seem—as a whole—more convincing than technology alone; therefore the
hypothesis for this research question is:
Hypothesis 5
NIS does not improve the capacity of CDCs to conduct community development.
Capacity improvements are more succinctly explained by other factors.
These research questions were selected to help fill gaps in knowledge highlighted in Chapter
2. The hypotheses were developed by extrapolating from the limited information currently
available. Determining the correctness of these hypotheses requires conducting empirical
research. Chapter 4 lays out the theoretical framework employed in the research and Chapter 5
describes the research design and methods. Chapter 6 and 7 detail the findings, with the
correctness of the hypotheses clearly noted. However, findings always come with caveats and

39
Chapter 8 acknowledges relevant threats to validity. Finally, Chapter 9 discusses the findings in
terms of contributions, implications, and recommendations.

40
Chapter 4: Theoretical Framework
The theoretical framework employed in this research, shown in Figure 3, consists of defined
terms, a sub-framework for evaluating the impact of an information system (based on Delone &
McLean 2003), and a sub-framework for understanding the relationships between participation,
capacity building, and information (based on Chaskin 2001; Glickman and Servon 1998; Sawicki
and Craig 1996). Community development scholars and practitioners employ concepts that are
difficult to define, but must be pinned down in this research. In the U.S., the term neighborhood
refers to a city subsection with a “propensity toward homogeneity” in terms of housing type
(Thomson 2008) and very possibly a similar homogeneity in terms of housing quality, household
income, and racial/ethnic makeup. Neighborhood residents share an interest in the provision of
certain goods and services due to mutual proximity (DeRienzo 2008). The term community goes
a step further, suggesting that people living in proximity share a sense of purpose (ibid).
The framework weaves related but hitherto disparate research streams into a workable whole
for the first time using two techniques, routing and refined replacement. The color of a
component in Figure 3 signifies the original work as labeled in the legend entitled “Component
Sources” in the upper right hand corner. Gray lines route components structured by DeLone and
McLean (2003)13 shown in gray to related components structured by Chaskin (2001)14 shown in
orange. Several items in Chaskin’s “Characteristics” components have been refined and replaced
by more specific and detailed theoretical understandings drawn from the literature (Glickman
and Servon 1998; Sawicki and Craig 1996). Components depicted with a thin outline are
measured qualitatively while those depicted with a thick gray outline are measured both
qualitatively and quantitatively, as detailed in the legend entitled “Component Methods” in the
upper left hand corner. The quantitative models take a CDC’s Characteristics and Neighborhood
Context as independent variables (inputs) and that CDC’s annual Outcomes as the dependent
13 see Figure 2 on page 25 for comparison
14 see Figure 1 one page 12 for comparison

41
variables (outputs). Each dependent variable requires a separate model. The legend entitled
“Component connection” on the bottom of the figure describes the three types of relationships
between the components:
Flow of influence or use (thin blue lines): Chaskin’s empirical work suggests, for
instance, that neighborhood context affects the decisions and priorities of social
actors.
Quantitative inputs and outputs (thick gray lines): While thick gray outlines on
certain components show that they are measured both qualitatively and quantitatively,
the connection lines show the structure of the quantitative evaluation models with
both Characteristics and Neighborhood Context explaining Outcomes.
Feedback (black dotted lines): The study of capacity building and community
development requires showing that past outputs contribute to future inputs.
Figure 3: Final theoretical framework incorporating multiple sub-frameworks

42
Each component is described in the sections that follow.
Information Quality, System Quality, and Service Quality
Information Quality focuses on the data in the information system. The term information
here refers to the finest grain “facts” in the system—not to their interpretation in reports.
Information quality, therefore, is data quality. System Quality includes aspects of the hardware
and software that affect an information system's speed, reliability, and range of functions. Service
quality covers assistance that information system providers offer to information system users.
Delone and McLean added this component to the 2003 model after receiving criticism that the
1992 model lacked such a component. They noted that in the 1980s, computer users shifted from
being primarily engineers, scientists, and other technology professionals to laypeople (so called
“end users”). This meant that information system creators no longer just built and maintained the
systems—they needed to provide customer service as well. These components contribute to a
potential user’s decision to actually use the information system. They therefore also may be
correctly conceptualized as feeding into the Information (NIS use) item within the
Characteristics component, but are drawn as shown above to minimize clutter (to the extent
possible in a complex figure) and to keep components from the same literature together.
System Use
System Use measures how, how often, or how intensely users employ the system. The
methods and data sources in Chapter 5 discuss this component in detail.
Contingency and Alternative Explanations
As discussed in Chapter 3, even the updated (2003) DeLone and McLean success model
rests on deterministic assumptions (Ballantine et al. 1996; Bartis and Mitev 2008). Both science,
technology, and society (STS) scholars and management information systems (MIS) scholars
argue for theoretical frameworks that allow impacts to vary widely from case to case based on
social context (contingency) and that consider non-technological reasons for those impacts
(alternative explanations). Recent scholars have added model components to address its
shortcomings either qualitatively (Bartis and Mitev 2008) or quantitatively (Ifinedo and Nahar
2009). The mixed-methods approach employed herein does both as described in Chapter 5.

43
Net Benefits
Net benefits measure the impact of information system use. The methods and data sources
in Chapter 5 discuss this component in detail.
Characteristics
This component is based on Chaskin's characteristics of community capacity, which
cover community level attributes such as the “ability to solve problems” and “access to
resources” in the original framework (Chaskin et al. 2001, 16)15. However, these clearly vary
from actor to actor and are re-conceptualized and expanded upon in the final framework. CDC
capacity (Glickman & Servon 1998) provides a rich model with which to examine many types of
organizations, especially community development corporations.
Although not detailed in the figure above, all of a CDCs various sub-capacities are
interrelated (Glickman and Servon 1998) and contribute to outputs that become the inputs of
capacities in the future (De Vita and Fleming 2001:23), potentially causing an endogeneity
problem. As Chapter 5 will show, the qualitative methods in this research avoid endogeneity by
revealing the relationship between preexisting and outcome levels of specific sub-capacities
through rich narrative description and probing. The quantitative methods in this research avoid
endogeneity by operationalizing relationships suggested in the qualitative data without placing
measures representing the same sub-capacity as both an independent and dependent variable. For
example, organizational capacity (staff size and NIS use), resource capacity (CDBG funding, SII
participation) are modeled as explanatory of programmatic capacity building (e.g. the number of
residential housing units rehabilitated).
While Chaskin places “information dissemination” under functions, he does not account
for “information access”—the primary concern of this research. Sawicki and Craig's (1996)
concept of data democratization serves this purpose, placed within this component because
distinct actors make use of the data to varying degrees. This placement within the theoretical
framework also follows a precedent set by scholars examining the impact of Internet and
communications technologies in developing countries. They approach information as an asset or
15 Chaskin's concept of “commitment” falls outside the scope of this research.

44
resource accessed at an actor level (Gigler 2004; Kleine 2010). While listed separately in the
framework, NIS use is a measure of Glickman and Servon’s organizational capacity.
Social Actors
The final framework addresses three types of actors: residents, institutions, and networks
of institutions. This research focuses on community development corporations (institutions), but
also examines related activities by block club activists (residents), housing committee members
(residents), a code enforcement partnership (network), and an investment initiative (network).
Functions
Functions are the work that a CDC's capacity enables it to perform. The framework
considers common CDC functions in Cleveland: grant writing, residential rehabilitation, code
enforcement, demolition advocacy, and other programs. This work is described more in detail
though the common tasks that functions share that are conducive to NIS use (starting on page
112). Actors perform the same functions in different ways depending on the strategies they
adopt.
Strategies
Strategies represent five different approaches to capacity building.
1. The physical development strategy holds that improving the built environment will
improve quality of life for neighborhood residents. Although Chaskin (2001) does not
include this strategy in his capacity building framework, it is necessary for studying
community development corporations because CDC staff members frequently employ the
physical development strategy explicitly or implicitly in their work (Rubin 1995). For
example, Neighborhood Progress Inc.'s Strategic Investment Initiative, which supports
CDCs in several Cleveland neighborhoods, seeks to ameliorate the blight of abandoned
houses enough to catalyze investment from the private market (see description in
Treuhaft and Kingsley 2008).
2. The community participation strategy holds that “bringing people together” will help

45
“solve community problems and address collective goals” (Chaskin 2001, 92). Chaskin
calls this strategy “organizing” or “community organizing”. The strategy has been
renamed here to cover a broader range of activities, from initially convening a resident-
led housing committee that holds public officials accountable (see “Committees” on page
127 and “Political Capacity” on page 133) to helping individual residents with basic
research on problem properties over the phone (see “Fielding call-ins” on page 121).
While the instances vary considerably, CDC staff members pursuing this strategy share a
willingness to involve residents in the nuts-and-bolts of community development on a
parcel by parcel level. Chaskin et al. (2006) explains these aspects of capacity building as
institutional efforts to build social capital (Putnam 1995).
3. The leadership development strategy holds that influential people can “direct the
attention” of neighborhood residents toward “goals and the paths to achieve them”
(Chaskin 2001,28 cites Bass 1990).
4. The organizational development strategy holds that organizations “can be important
vehicles for solving community problems, and for helping community members find
common ground and take action in the service of shared goals” (Chaskin 2001, 61).
5. The organizational collaboration strategy, like the community participation strategy,
focuses on bringing people together to solve shared problems, but does so at the
organization rather than the individual level in order to access resources outside a
particular organization or geographic neighborhood (Chaskin 2001, 123).
This research recognizes that actors may apply different strategies to different functions. For
example, CDC staff members may combine community participation and leadership
development strategies to pursue the function of demolition advocacy. Similarly, they may apply
an organizational collaboration strategy for code enforcement. Therefore, the strategies
component flows into the functions component in the final framework.
Neighborhood context
These are environmental factors such as vacancy rate and owner occupancy rate that may

46
help or hinder capacity and capacity building. Chaskin referred to these as conditioning
influences.
Outcomes
Outcomes are neighborhood changes produced by a social actor, such as rehabilitated
housing. In this research, outcomes must be attributed to (1) the neighborhood information
system; (2) another element of CDC capacity; (3) neighborhood context; or (4)
unknown/unmeasured factors. Outcomes feed back into the Characteristics component as a new
(hopefully higher) level of CDC capacity and feed back into the Neighborhood context
component as new (hopefully positive) environmental factors.
This chapter has shown how important theoretical foundations from disparate academic
fields—along with criticisms of those foundations—can be brought together into a single
cohesive framework to examine the contingent impacts of an information system at multiple
social levels (individuals, organizations, and networks) while accounting for alternative (non-
technological) explanations. It identifies and provides examples of two techniques for weaving
together separate theoretical constructs, routing and refined replacement. Next, Chapter 5
grounds this theoretical framework by articulating the research design, methods, and data.

47
Chapter 5: Research Design, Methods, and Data
Critical Case
This research employs a single critical case research design with multiple embedded
cases (Yin 2009) and a mixed methods triangulation strategy (Jick 1979). NIS proponents do not
yet offer a theory explaining why the technology should promote capacity building in
organizations and individuals, nor do they qualify such claims. A default theory, though overly
simplistic and deterministic, provides a way to move forward:
If NIS, then capacity building (AB)
A single critical case provides leverage to challenge such a theory (Yin 2009), since a
given treatment (technology) that fails to produce the anticipated effect (capacity building) in the
most ideal circumstances is unlikely to succeed in worse circumstances. But, such a research
design does little to enrich impoverished theory. Multiple cases provide opportunities to examine
when and why a theory holds true, and thus facilitate theory building. This research combines
both approaches by examining a critical case city with multiple imbedded organizations as the
units of analysis.
A critical case, by definition, provides the optimum conditions to support a theory. While
“best” and “easiest” also describe such cases, the term “critical” reflects that the theory must
hold in such a situation for it to retain any plausibility. If the empirical outcome conflicts with
the outcome predicted by the theory—then the theory should be dismissed in its current form.
Put another way, a critical case provides a theory with plenty of rope to hang itself. Additionally,
by providing optimum conditions, a critical case provides the best chance of detecting the
predicted outcome. This point of view expresses the concern that social science techniques are
not infinitely sensitive; a theory may hold in less than ideal conditions—but the predicted
outcome may remain undetectable. Determining the optimum conditions for theory left implicit
in the relevant literature poses a challenge. The site selection process for this research sought to

48
meet three criteria:
1. A pressing need for information
a) A problem to solve. Information matters in the face of a challenging task or a
constraint on resources.
b) Strategic action possible. Without a perceived chance to apply information to a
pressing need, an actor will not seek out such information. Incessant conflict between
public agencies and non-profit developers, for example, would likely undermine the
usefulness of a NIS because follow-through on strategic choices remains impossible.
A critical case city would therefore demonstrate some level of cooperation between
major community development actors.
2. A well-respected neighborhood information system (NIS)
a) Well-implemented & mature feature-set. Examining the impact of a poorly
implemented or fledgling NIS will bias the research toward an easily explainable
negative finding. Examining a well-implemented and mature NIS will bias the
research toward a positive finding. A critical case design must provide a bias toward
positive findings in order to bolster any shortcomings in the theory that the study
reveals.
b) Availability of NIS training. Previous research on geographic information systems
highlight the need for technical assistance for new users (Sawicki and Craig 1996;
Ghose 2011) although some newer scholars argue that new web-based systems reduce
this need with a corresponding loss of analytical tools . A critical case must have such
assistance available.
3. A well-respected community development system
a) High level of professionalization. In a strictly deterministic approach, organizations
benefit just from access to NIS—regardless of staff experience. However, if this
approach proves incorrect, a critical case should still provide the best chance to
validate NIS claims. Less experienced staff may not know what information to seek

49
or how to use that information to further community development. Personnel in a
critical case therefore must show a high-level of community development acumen
allowing them to extract whatever benefit the technology can offer.
b) Organizations of every size. Some scholars argue that organizations with greater
resources (usually larger organizations) outperform smaller organizations (Wernerfelt
1984; then more critically Wernerfelt 2007). Accounting for the possibility that NIS
does not explain performance but the number of employees and amount of funding do
explain performance requires including a range of organization sizes. Working with
multiple imbedded cases allows the research to meet this requirement.
c) Public/private sector cooperation. (See Item #1b)
Cleveland meets these three criteria as detailed below and summarized in Table 4 on page 57.
A pressing need for information: addressing problem properties
The wave of mortgage foreclosures hit Northeast Ohio early and hard. The number of
foreclosures filed in Cuyahoga County quadrupled between 1995 and 2007, with local leaders
already sounding the alarm on subprime lending in the late 1990s (Coulton and Hexter 2010).
Nearly a fifth of the census tracts in the county saw at least a ten percent rise in vacancies
between 2000 and 201017. While the city’s defenses included its strong community development
industry system and neighborhood information system (ibid), these proved insufficient to stop
vacant buildings from falling into disrepair. Between 2005 and 2008, the demand for municipal
board-ups increased threefold, condemnations fourfold, and demolitions fivefold (Frater, Gilson,
and O’Leary 2009).
A Cuyahoga County official estimated ten thousand homes inside Cleveland were
“rotting corpses” (Niquette 2011). Toward the end of 2011, the Department of Community
Development listed 7,761 properties as vacant and distressed (V&D) candidates for demolition18.
17 Based on NEO CANDO Census data downloaded 4/5/2013
18 V&D totals received as an Excel spreadsheet on April 2, 2012 from the Department of Community Development.
The department defines vacant & distressed as an entire building with no evidence of occupancy and at least one of
the following conditions: house is boarded; a considerable amount of minor defects exist; house is open and
vandalized; major defects and damage to structural items exist; house is dilapidated; significant untrimmed

50
A single census tract (#1198) contained 1,182 such properties and 69 tracts contained over a
hundred such properties each. In nineteen tracts, over ten percent of the structures were vacant
and distressed in 2011. As of February 2013, more than 17,000 homes within the Cleveland
Division of Water service area were not receiving water and were likely sitting vacant (Davis
2013). While not all of these structures are currently distressed, without care from the property
owner or another party they are headed in that direction. For each property, local CDC staff must
decide to: (1) advocate for immediate demolition; (2) motivate the homeowner (possibly a bank)
to maintain the property; (3) acquire the property and pursue rehabilitation; or (4) hope that a
responsible homeowner proceeds “as is”. The first three options require identifying the current
homeowner. Typing each address into the Cuyahoga County Auditor’s website and receiving
usable information takes a great deal of time, even in ideal circumstances. However, in many
cases the circumstances are not ideal.
The city’s housing court judge explains that “there are thousands of foreclosures in
limbo, just hanging out there, just sitting, with nothing being done” (Conlin 2013). So called
“zombie properties” occur when the bank managing a loan starts foreclosure proceedings, the
homeowner vacates the property, and then the bank does not continue with foreclosure. Who is
legally responsible for the property? Finding the answer requires more exacting title research.
Information can provide opportunities for strategic action in Cleveland. Understanding
the full legal history of a property can reveal potential solutions. For example, a house in
Cuyahoga County that passes through two sheriff sales without a buyer becomes eligible for
demolition by the county. The Cuyahoga County Land Bank will acquire certain types of
properties, clear the title, and offer CDCs first choice to purchase at a reduced price for
rehabilitation. Since creative options for action exist in Cleveland, a tool that links map,
homebuyer, lien, loan, court, and sheriff sale information together would benefit community
development professionals.
vegetation and/or trash, deteriorated walkways, driveways, fencing; property is severely overgrown; property is the
site of much debris or abandoned vehicles (Anon 2011)

51
The Neighborhood Information Systems: NEO CANDO & the NST web app
Researchers and staffers at the Center on Urban Poverty and Development started the
CAN DO system in 1992. They updated and renamed the tool in 2005, placing it on the web.
NEO CANDO (Northeast Ohio Community and Neighborhood Data for Organizing) contains
data for seventeen counties and parcel-level data for Cuyahoga County and provides integrated
mapping. The National Vacant Properties Campaign considered it the best NIS in the country
(LISC 2009:18). With support from NPI, the City of Cleveland, Cuyahoga County, and the
Cuyahoga County Land Bank, the Center developed the Neighborhood Stabilization Team web
application (NST web app) for CDC and city staff, which includes additional public data,
proprietary information on adjustable rate mortgages, and custom fields for user notes (#46,
12/20/2010 and other interviews)20.
Both the Center on Urban Poverty and Community Development that owns and operates
the system and Neighborhood Progress Inc. offer CDC staffers training on the local
neighborhood information systems. NEO CANDO provides a clear interface for locating and
mapping information along with detailed descriptions of the data sources, geographic levels, and
terminology. The Center is part of the Mandel School of Applied Social Sciences, which offers
master’s students in applied social science (MSASS) a NEO CANDO training every year. They
offer similar trainings to the general public on request. Such requests resulted in trainings for the
University’s library staff, the Begun Center for Violence Prevention Research, the First Suburbs
Consortium of Cuyahoga County, and Project Access (personal communication 11/9/2011).
Initially, the Center offered bi-weekly trainings for the more advanced tool, the NST web
application. These sessions are monthly and open to anyone, though the trainers advertise
specifically for CDC staffers. The city’s code inspectors, city council members, and housing
court have attended special trainings. Until June 30, 2012, Neighborhood Progress—with NSP2
funding—provided additional technical support to area CDC staff. Usually, each session would
include staffers from a single CDC who brought questions about specific problem properties in
their service area. A NPI representative with legal training and proficiency with the NST web
20 The format for citing interviews is (#Assigned Person ID, Date of Interview) for individuals affiliated with a
community development corporation or government entity and (‘resident’, Date of Interview) for individuals
without such an affiliation.
52
application answered these questions from both a legal and technical perspective using maps and
tables from the application projected on a large screen. He informed attendants about new
functions in the software, new data sources, and upcoming funding opportunities (observed in
person on 11/8/2011). These training opportunities make Cleveland a critical case for studying
NIS since community development professionals with training are more likely to exploit any
benefit the technology can provide.
The Community Development System
In cities across the United States, non-profit organizations and government agencies
pursue community development through a dense network of interlocking relationships that form
an industry system (Yin 1998). Researchers highlight numerous components of this system in
Cleveland as especially strong and focused on housing (Dewar 2013; McQuarrie and Krumholz
2011; Yin 1998). The level of professionalization, presence of development organizations of
different sizes, and cross-sector cooperation make Cleveland a critical case for NIS research, as
explained in more detail below.
Professionalization
Scholars in non-profit management and public administration refer to the process of
moving from voluntary to paid staff, formalizing duties, and standardizing knowledge as
“professionalization” (Hwang and Powell 2009; Markowitz and Tice 2002; Vakil 1997). In terms
of community development in Cleveland, this process has involved non-profit intermediary
organizations, both competition and cooperation between local CDCs, local degree-granting
universities, and the technical training opportunities already mentioned.
An impressive array of local and national non-profit intermediary organizations call
Cleveland home. City agencies, local foundations, and local corporations worked together to
establish Neighborhood Progress Inc. (NPI) in 1989, which provides financial, technical, and
capacity-building services to CDCs pursuing physical development projects (Lowe 2008;
McQuarrie and Krumholz 2011). NPI’s Strategic Investment Initiative received a Bright Ideas
award in 2010 from the Ash Center at Harvard University (Ash Center 2010). It features
“precise, narrow targeting” to restore private markets “in a select number of Cleveland
neighborhoods which have undergone previous decline but show potential to

53
'recover'”(Neighborhood Progress Inc. 2011). In 2010, NPI paid about $3M in grants including
to thirteen CDCs in amounts ranging from $5K (St. Clair Superior) to $702K (Buckeye)23. NPI
gave $10K to upgrade NEO CANDO in 2004 and has continued to give about $50,000 a year to
maintain and expand the application (#46, 10/20/2011). The Cleveland Foundation gives roughly
$80M in grants to non-profit organizations in Cleveland and surrounding areas—including to
several CDCs.25 Cleveland is also one of the sites for Living Cities’ Integration Initiative, which
brings together the financial resources of anchor institutions, foundations, and government
agencies to create economic opportunities in the city (Hexter, Austrian, and Clouse 2013)
Two large national community development intermediaries, LISC and Enterprise
Community Partners once operated in the city, strengthening the local community development
system. LISC no longer appears to be active in Cleveland, focusing its Ohio efforts in Toledo
and Cincinnati. Enterprise still supports projects in Cleveland, largely through local partners,
including NPI and the Cleveland Housing Network. In 2004, Enterprise pitched in with NPI to
upgrade NEO CANDO, giving $30K (#46, 10/20/2011). Enterprise has been involved in
implementing or funding several development projects in Cleveland including Opportunity
Homes, a scatter-site project in six neighborhoods (started in 2009), St. Luke’s Manor senior
housing, which transforms a vacant, historic hospital (started in 2011), and The Winton on
Lorain, which provides homes to homeless men and women (completed in 2013)(Enterprise
Community Partners n.d.).
The relationships between CDCs in Cleveland express both competition and cooperation
and have resulted in the survival of CDCs that focus on—and are successful at—housing
construction and rehabilitation. The Department of Community Development and the City
Council are each responsible for distributing half the city’s CDBG allocation. When historical
development patterns or ward boundary changes place multiple CDCs within the jurisdiction of a
single council representative, the competition can be especially fierce. In 2011, the Department
23 According to the IRS 990 Form for 2011
25 An overview of the Cleveland Foundation’s grant making is available at
http://www.clevelandfoundation.org/grants/our-grantmaking/ with more detailed accounting available through
its searchable online grants database.

54
of Community Development funded twenty-five CDCs27, down from thirty-two in 2005.28 The
number of voting organizational members for the local CDC trade association—the Cleveland
Neighborhood Development Coalition—fell to thirty-six as of April 2013 from forty-eight in
October 201129. In 2011, Detroit Shoreway, one of the few Cleveland CDCs that rehabilitates
both single-family and multi-family housing, received additional CDBG funding to open a new
office for three adjoining neighborhoods, each of which once had its own development
organization.
Despite the inherent professional competition, organizational cooperation between CDCs
is especially strong in Cleveland. As mentioned above, the city’s CDCs belong to a trade
organization, which holds trainings, hosts forums, and organizes policy advocacy. The Cleveland
Housing Network (CHN), managed in part by 15 constituent CDCs, is a national leader in
producing affordable lease-to-purchase housing with low income housing tax credits (LIHTC)
(McQuarrie and Krumholz 2011). Although best known for its successful confrontational tactics,
Empowering and Strengthening Ohio's People (ESOP)30 worked successfully under contract with
NPI to conduct foreclosure prevention door-knocking with CDC staff and to target banks holding
sizeable portfolios of vacant property (#46 11/8/2011 & other interviews)—a further sign of the
innovative and collaborative nature of the community development system in Cleveland.
CDCs in Cleveland benefit from two local universities and the information resources they
provide. The Center on Urban Poverty and Community Development at Case Western Reserve
University continues to develop two neighborhood information systems: (1) NEO CANDO for
the general public and (2) the Neighborhood Stabilization Team (NST) web application for CDC
staff members and other nonprofit and government community development professionals. The
Center is part of the Mandel School of Applied Social Sciences, which produces student interns
and graduates who often work in local CDCs. Cleveland State University offers a Planning
27 Not counting Detroit Shoreway’s SCFBC office, which receives its own funding stream from the city, but does
not have its own accounting department or IRS number.
28 FOIA spreadsheets [meaning?]
29 Current page available at http://www.cndc2.org/members.html#votingMembers. Oct 2001 page available at
http://web.archive.org/web/20011023182449/http://www.cndc2.org/members_sponsors.htm
30 Originally, the acronym stood for East Side Organizing Project. The name was changed in 2007.

55
Accreditation Board-accredited Master’s in Urban Planning, Design, and Development through
the Maxine Goodman Levin College of Urban Affairs. The College houses NODIS, a regional
data system designated by the State of Ohio and the U.S. Bureau of the Census.
Variation in CDC size
Cleveland CDC staff sizes roughly reflect the central tendency and variability of CDC
staff sizes nationally. This variability allows the current research to examine the impact of staff
size on development outcomes and the interaction between staff size and NIS use. In 2005,
CDCs employed a median of seven fulltime and three part-time people. CDCs in Cleveland
receiving CDBG funding that same year employed a median of 6.5 people and one part-time
person. The national survey (NCCED 2006) showed a wide spread between the largest
organization (1,100 employees) and the smallest organizations (a few volunteers). In Cleveland
this spread was from two to thirty-four fulltime employees. Consolidation and the housing crisis
have only increased the variability of staff sizes. In 2012, the median CDC staff size in
Cleveland was eight people with a range from 0.5 (one part-time person) to fifty people (source
calls/websites). Uniform staff sizes (small or large) would have made separating staff size effects
from NIS use effects extremely difficult. However, the situation in Cleveland makes such in-
depth study possible, strengthening its position as a critical case for NIS study.
Multi-sector cooperation
Community development requires at least a modicum of cooperation between public
sector agencies, non-profit actors, and—with housing construction and rehabilitation—for-profit
lenders. The community development system in Cleveland far exceeds this minimum threshold.
Ex-CDC staff members routinely move on to prominent positions in non-profit intermediaries
and government agencies—including the mayor’s chair—where they support and protect
community development programs (McQuarrie and Krumholz 2011). Low-income housing
projects benefit from nearly free property from the city’s land bank and a complete tax
abatement for fifteen years on new construction (McQuarrie & Krumholz 2011). The Cuyahoga
County Land Bank allows CDCs to acquire tax-foreclosed properties at very low cost,
motivating staffers to research the available selections carefully. But, these examples of
cooperation do not change the fact that misunderstandings can and do arise between local

56
government agencies and CDC staff about specific properties. The city has accidently bulldozed
properties a local CDC intended to acquire and rehabilitate. The recent Code Enforcement
Partnership between the City of Cleveland and many area CDCs provides a framework to
coordinate community development efforts more closely and efficiently.
While the need for code enforcement activity increased rapidly in Cleveland during the
foreclosure crisis, the city lost 25% of its code inspectors in 2009 due to budget cuts (Frater et al.
2009). The remaining enforcers simply could not manage the workload. Representatives from
NPI, several CDCs, and the city’s Building and Housing Department and Community
Development Department came up with an innovative solution. The partnership divides
responsibilities between CDC staff and city code enforcers. The former conducts a windshield
survey of every housing unit, works with homeowners to correct minor violations, and refers
major violations to city staff. The latter pursue only major violations and minor violations that
the homeowner does not—or cannot afford to—correct. The partnership participants turned to
the NST web application to facilitate data sharing. For the first time ever, CDC staff members
can directly view code enforcement actions and city staff members can view which properties are
marked locally for demolition31 or for redevelopment.
Cleveland also provides examples of strong cooperation with for-profit entities to further
physical development projects. City officials and non-profit organizations in Cleveland
challenged bank mergers in the 1990s under the Community Reinvestment Act, resulting in a
$4.2 billion neighborhood lending pool and a new crop of bankers eager to support local projects
(McQuarrie & Krumholz 2011). Together, the high level of cooperation between community
development actors makes Cleveland a critical case for NIS research generally and for NIS
improvements to inter-organizational coordination more specifically.
Table 4 (below) reviews all the criteria for a critical case of NIS use and summarizes how
Cleveland meets these criteria.
31 The NST web application does not allow CDC staffers to prioritize demolition targets. Some CDC staffers email
code enforcement officers a list of priority demolitions (#10,384,2/20/12).

57
Table 4: Summary of Cleveland as Critical Case for NIS Use
Criteria Sub-criteria Cleveland Detail
Pressing need
for
information
Problem Addressing vacant & abandoned property from foreclosure crisis
in context of municipal budget cuts.
Strategic action
truly possible (See cooperation between key actors)
The
Neighborhood
Information
System (NIS)
Maturity &
Feature-set
NEO CANDO recognized as one of the best NIS in the country.
NST web application even more advanced.
Availability of
technical training
The Center of Urban Poverty and Community Development at
Case Western Reserve University
Neighborhood Progress Inc.
The
community
development
system
Professional-
ization
Nonprofit
Intermediaries
Local:
Neighborhood Progress Inc (NPI)
The Cleveland Foundation
National:
Enterprise Community Partners
Local Initiatives Support Corporation
(LISC)
CDC-driven
organizations
Cleveland Neighborhood Development
Coalition (CNDC)
Cleveland Housing Network (CHN)
Degree granting
institutions
The Center on Urban Poverty and
Community Development (at CWRU)
Maxine Goodman Levin College of Urban
Affairs (at CSU)
Range of CDC
sizes In 2012, CDC fulltime staff sizes ranged from 3 to 50 people
Cooperation
between key
actors
Positive community/bank relationships
Common CDC/government career trajectory (revolving door)
City & County Land Banks
Code Enforcement Partnership
Embedded Cases
CDCs are generally non-profit, tax-exempt entities created to improve quality of life in
specific parts of a city—often poorer areas. But, the term lacks a more formal legal definition.
The authors of the National Congress for Community Economic Development’s last census of
these organizations explain that:

58
Community development is a broad term, embracing a wide array of organizations that
work to reinvigorate poor areas. The groups go by different designations, depending on
their roots and mix of activities. While not all are technically incorporated as “community
development corporations” (CDCs), that term has, over time, become synonymous with
the industry as a whole, and is used here as such.
(NCCED 2006:3)
This research includes all 30 community development organizations that received CDBG
funding from Cleveland’s Community Development Department between July 1, 2007, and June
30, 2011. Several organizations lost funding during this period and several gained funding during
this period as detailed in the footnotes for specific entries. I use the term community development
corporation (CDC) to refer to these funded organizations. Under this definition, Harvard
Community Services, founded in 1970, only became a CDC in 2009 when it started to receive
CDBG funding. Conversely, the Stockyard Redevelopment Organization stopped functioning as
a CDC in 2010, when it stopped receiving CDBG funding. This definition:
1. Quickly and strategically winnows the list of potential organizations to include in the
research from over 3,400 nonprofits in the City of Cleveland32 to just 30 organizations
that definitely met criteria relevant both to the topic under investigation (community
development) and the research design (critical case with a pressing need for information).
Every CDBG funded project must33:
a. Directly benefit low-and moderate-income residents
b. Eliminate and prevent blight and property deterioration
c. Serve an urgent need
32[need the name of the website or the webpage to precede the url] http://www.guidestar.org/ last accessed 6/9/2014
33http://www.city.cleveland.oh.us/CityofCleveland/Home/Government/CityAgencies/CommunityDevelopment/Bloc
kGrantProgram last accessed 6/9/2014

59
2. Permits uniform tracking of organizational size since CDBG applicants submit budget
details and—historically—also the number of fulltime staff members. Controlling for
funding and staffing levels permits better estimation of the effect NIS has on program
outcomes.
All the CDCs that lost CDBG funding during the research period appear to have quickly gone
out of business. The research, therefore, may overlook what Harvard Community Services
accomplished before receiving CDBG funding, but it does not overlook what CDCs
accomplished after losing CDBG funding.
I targeted a representative subset of organizations for semi-structured interviews and
performed quantitative modeling of programmatic capacity for all organizations. CDC
performance may stem from organizational factors (such as the number of employees, amount of
funding, level of NIS use) or neighborhood factors (such as vacancy rate and poverty rate). Table
5 (below) provides some of these details for each embedded case to convey the diversity of
situations under investigation. The average number of employees between 2005 and 2012 is
based on an earlier figure from city CDBG records and a later figure based on a combination of
interviews and the organizations' websites34. The average amount of CDBG funding is based on
city records for all years from 2007 to 2011. The aereal weighting method employed in this
research allocates the appropriate parts of Census block groups to CDC service areas to permit
an accurate analysis of socio-economic and built-environment conditions within the most
meaningful geographic units for the research topic (see Saporito et al. 2007). The average
population, residential vacancy, and percent of people in poverty from 2007 to 2011 is based on
the proportion of individual American Community Survey (ACS) block groups falling within
CDC service areas as reported to Neighborhood Progress Inc. in August 2012. At least one staff
member in CDCs marked with a check (✔) in the interview column (“I”) was interviewed in-
person, by phone, or by email.
34 The IRS 990 form proved an unreliable source of information about staff size. Employee recall of staff levels
also proved suspect.
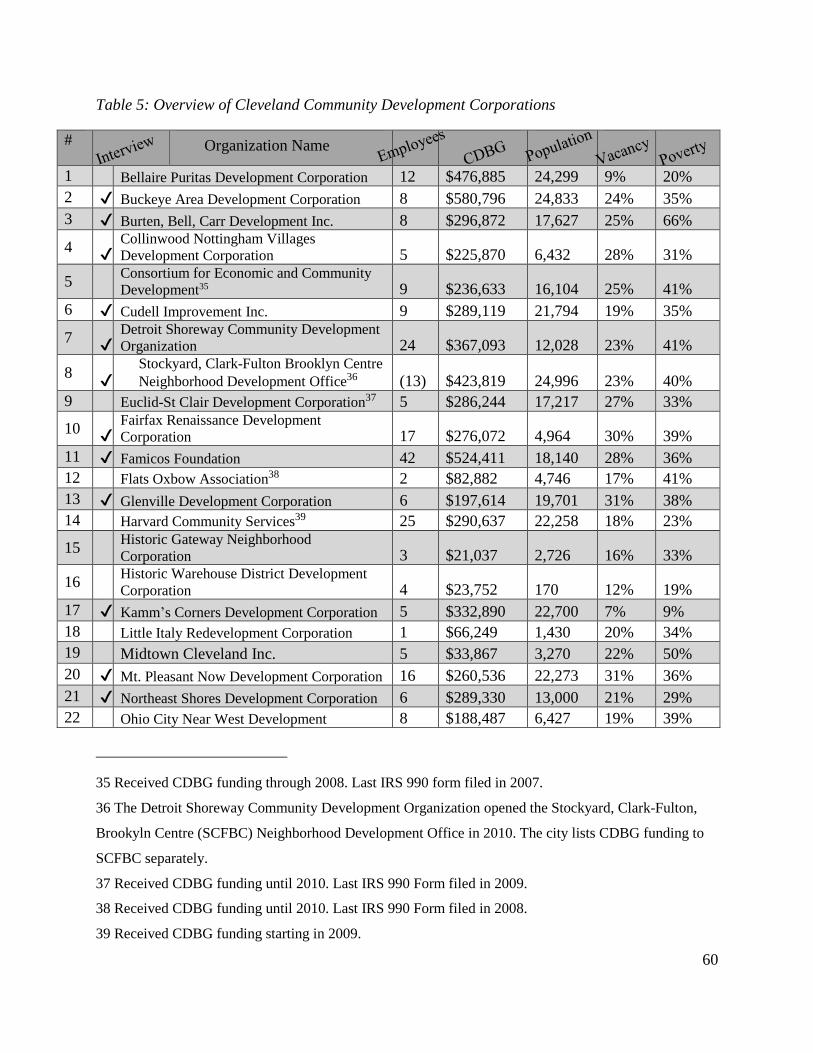
60
Table 5: Overview of Cleveland Community Development Corporations
#
1 Bellaire Puritas Development Corporation 12 $476,885 24,299 9% 20%
2 ✔ Buckeye Area Development Corporation 8 $580,796 24,833 24% 35%
3 ✔ Burten, Bell, Carr Development Inc. 8 $296,872 17,627 25% 66%
4 ✔
Collinwood Nottingham Villages
Development Corporation 5 $225,870 6,432 28% 31%
5
Consortium for Economic and Community
Development35 9 $236,633 16,104 25% 41%
6 ✔ Cudell Improvement Inc. 9 $289,119 21,794 19% 35%
7 ✔
Detroit Shoreway Community Development
Organization 24 $367,093 12,028 23% 41%
8 ✔
Stockyard, Clark-Fulton Brooklyn Centre
Neighborhood Development Office36 (13) $423,819 24,996 23% 40%
9 Euclid-St Clair Development Corporation37 5 $286,244 17,217 27% 33%
10 ✔
Fairfax Renaissance Development
Corporation 17 $276,072 4,964 30% 39%
11 ✔ Famicos Foundation 42 $524,411 18,140 28% 36%
12 Flats Oxbow Association38 2 $82,882 4,746 17% 41%
13 ✔ Glenville Development Corporation 6 $197,614 19,701 31% 38%
14 Harvard Community Services39 25 $290,637 22,258 18% 23%
15
Historic Gateway Neighborhood
Corporation 3 $21,037 2,726 16% 33%
16
Historic Warehouse District Development
Corporation 4 $23,752 170 12% 19%
17 ✔ Kamm’s Corners Development Corporation 5 $332,890 22,700 7% 9%
18 Little Italy Redevelopment Corporation 1 $66,249 1,430 20% 34%
19 Midtown Cleveland Inc. 5 $33,867 3,270 22% 50%
20 ✔ Mt. Pleasant Now Development Corporation 16 $260,536 22,273 31% 36%
21 ✔ Northeast Shores Development Corporation 6 $289,330 13,000 21% 29%
22 Ohio City Near West Development 8 $188,487 6,427 19% 39%
35 Received CDBG funding through 2008. Last IRS 990 form filed in 2007.
36 The Detroit Shoreway Community Development Organization opened the Stockyard, Clark-Fulton,
Brookyln Centre (SCFBC) Neighborhood Development Office in 2010. The city lists CDBG funding to
SCFBC separately.
37 Received CDBG funding until 2010. Last IRS 990 Form filed in 2009.
38 Received CDBG funding until 2010. Last IRS 990 Form filed in 2008.
39 Received CDBG funding starting in 2009.
Organization Name
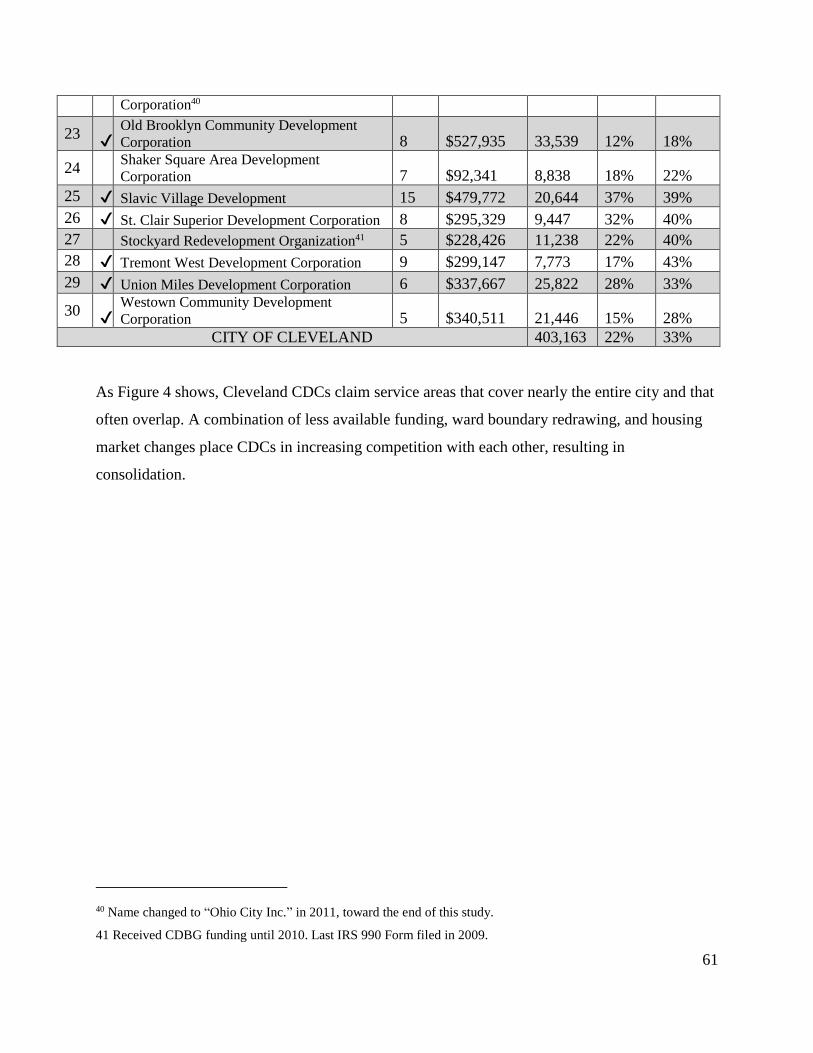
61
Corporation40
23 ✔
Old Brooklyn Community Development
Corporation 8 $527,935 33,539 12% 18%
24
Shaker Square Area Development
Corporation 7 $92,341 8,838 18% 22%
25 ✔ Slavic Village Development 15 $479,772 20,644 37% 39%
26 ✔ St. Clair Superior Development Corporation 8 $295,329 9,447 32% 40%
27 Stockyard Redevelopment Organization41 5 $228,426 11,238 22% 40%
28 ✔ Tremont West Development Corporation 9 $299,147 7,773 17% 43%
29 ✔ Union Miles Development Corporation 6 $337,667 25,822 28% 33%
30 ✔
Westown Community Development
Corporation 5 $340,511 21,446 15% 28%
CITY OF CLEVELAND 403,163 22% 33%
As Figure 4 shows, Cleveland CDCs claim service areas that cover nearly the entire city and that
often overlap. A combination of less available funding, ward boundary redrawing, and housing
market changes place CDCs in increasing competition with each other, resulting in
consolidation.
40 Name changed to “Ohio City Inc.” in 2011, toward the end of this study.
41 Received CDBG funding until 2010. Last IRS 990 Form filed in 2009.

62
Figure 4: Cleveland Community Development Corporation Service Areas (August 2012)

63
Methods and Data Sources
The methods and data sources vary slightly with each research question. To avoid
redundancy, data sources introduced in an early research question are simply referenced in later
research questions rather than described again in full detail.
Q1. What claims do NNIP partner organizations make about neighborhood
information systems in their mission statements and websites?
Data Collection
At the time of data collection in July 2012, the NNIP website provided a list of 49
partners in 36 U.S. cities along with links to their websites. Nearly all partner websites include
explicit mission statements. When absent, the analysis relies on text from pages labeled “about
us”. Phrases from the websites were copy and pasted by hand into a multipart form in a
Microsoft Access database and then coded using four subforms with prepopulated lists of codes.
The codes were iteratively developed during coding until additional modifications were not
necessary. I copy and pasted phrases from the websites into one of four subforms visible on a
single main form. Each subform was designed to store a type of content:
1. Related actors, such as anticipated users and strategic partners
2. Goals, strategies, results, or products, which may involve “buzzwords”
(repeated or trendy terms)
3. Services and specific named programs that rely on the information system
4. Causal claims that include a subject, verb, and (claimed) result
Data Analysis
I transferred selections of text from the website relevant to these a priori themes to an
Access Database and assigned qualitative codes developed iteratively through common
techniques (Bernard and Ryan 2010:56–61) such as:
1. Repetition, which suggests a focus or preoccupation (such as with data quality);
2. Indigenous typologies, which—in this research—took the form of trade jargon and
conveyed a trend or ideal (such as one-stop-shopping for data); and
3. Linguistic connectors, which communicate explicit or implicit causal relationships

64
(such as between data access and societal benefit)
Below, Figure 5 shows the form used to enter and code the mission statements and website
content.
Figure 5: Data Entry Form for Analysis of NNIP Mission Statements & Websites
After entering these data, I queried the database to create summary tables using the SQL
programming language.
Q2. Who uses NIS and how frequently?
Data Collection
Answering this research question requires processing logfiles for NEO CANDO and the
NST web application generously provided by the Center on Urban Poverty and Community
Development. Logfiles are computer records automatically generated during the execution of
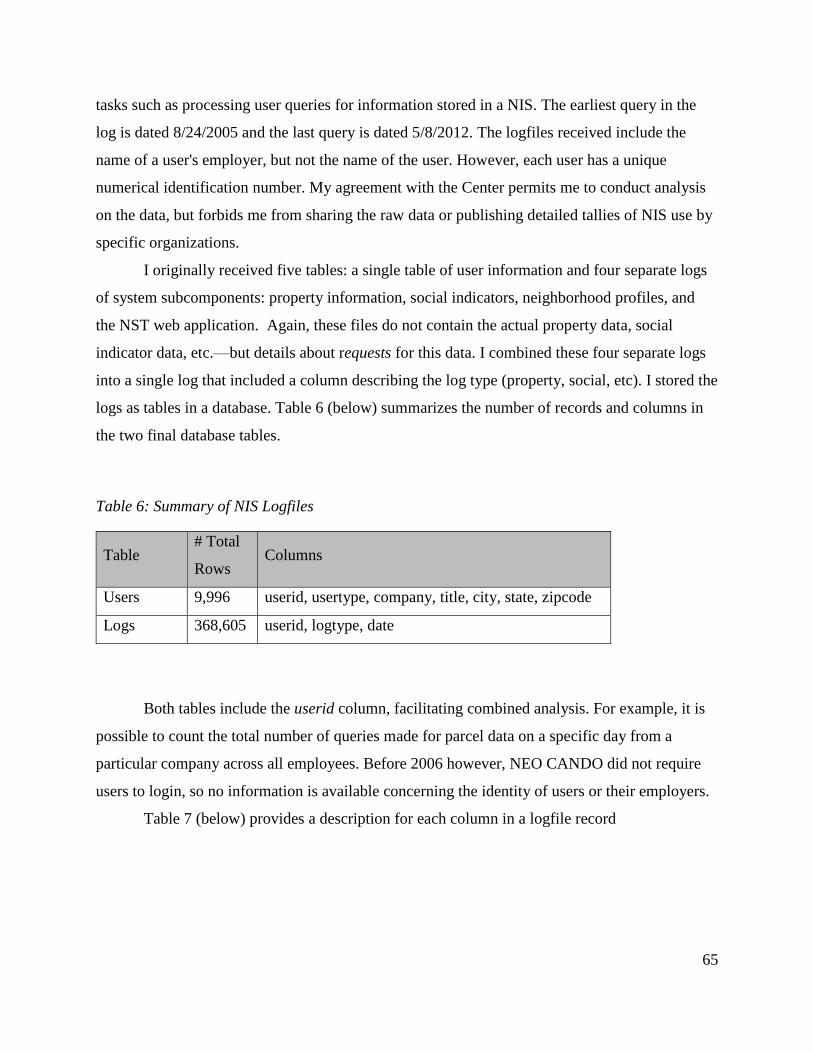
65
tasks such as processing user queries for information stored in a NIS. The earliest query in the
log is dated 8/24/2005 and the last query is dated 5/8/2012. The logfiles received include the
name of a user's employer, but not the name of the user. However, each user has a unique
numerical identification number. My agreement with the Center permits me to conduct analysis
on the data, but forbids me from sharing the raw data or publishing detailed tallies of NIS use by
specific organizations.
I originally received five tables: a single table of user information and four separate logs
of system subcomponents: property information, social indicators, neighborhood profiles, and
the NST web application. Again, these files do not contain the actual property data, social
indicator data, etc.—but details about requests for this data. I combined these four separate logs
into a single log that included a column describing the log type (property, social, etc). I stored the
logs as tables in a database. Table 6 (below) summarizes the number of records and columns in
the two final database tables.
Table 6: Summary of NIS Logfiles
Table # Total
Rows Columns
Users 9,996 userid, usertype, company, title, city, state, zipcode
Logs 368,605 userid, logtype, date
Both tables include the userid column, facilitating combined analysis. For example, it is
possible to count the total number of queries made for parcel data on a specific day from a
particular company across all employees. Before 2006 however, NEO CANDO did not require
users to login, so no information is available concerning the identity of users or their employers.
Table 7 (below) provides a description for each column in a logfile record

66
Table 7: Logfile Column Descriptions
Logfile
Column Description
Userid Unique user number
Usertype
A self-identified type of user from thirteen possible types: Community
Development Non-Profit, Education, Foundation, Government,
Healthcare / Medical, Media, Other For-Profit, Other Non-Profit, Public
Citizen (Not Representing an Organization), Real Estate For-Profit,
Research, Social Work, Unknown
Company The name of the user's employer
Title The user's work title
City Either the user's home or work location (could be either)
Logtype One of four types of information requests: property, social, profile, or
NST
Date Date of the NIS query
The user log table required extensive data cleaning in order to permit accurate
aggregation by company name. For example, the 1,922 users associated with Case Western
Reserve University—which houses the Poverty Center that produces both NIS systems—spelled
the school 301 different ways such as “Case Sociology Department”, “FPB School of Nursing”,
“case western eserve university”, and “CWRU Med School”. The same problem occurred with
the names of community development corporations, which would have undermined the
regression technique employed to answer research questions #4 and #5, which use CDCs as the
level of analysis. Additionally, students, faculty, and staff members at educational institutions
often declared themselves “Public Citizen (Not Representing an Organization)”, the category I
rely on to identify non-institutional users. I cleaned the usertype column by examining the
company and title for each alleged “Public Citizen”, reassigning 91 users to more accurate types.
Of those reassigned, 84 (92%) were associated with an educational institution. Such cleaning
ensures that students pursuing assignments and faculty members pursuing research are not
mistaken for neighborhood residents independently investigating problem properties.

67
In order to better understand how residents use (or do not use) NIS, I conducted
interviews with nine people active with two different CDCs, but not employed by a CDC.
Data Analysis
Answering this research question requires writing short computer programs in SQL to
aggregate the total number of users of each usertype who submitted at least one NIS query.
Generating subtotals for each year permits analyzing usertype trends over time. Filtering out
users who do not submit more than a threshold number of queries reveals which usertypes rely
on NIS more intensely. The company variable permits counting the number of unique
organizations in addition to the number of unique users.
To understand the point of view of residents active with CDCs, I coded these interviews
using the same approach described in the next chapter for interviews with CDC staff members.

68
Q3. How do CDC staff members use NIS?
I define a Cleveland CDC as any organization receiving CDBG funding from the city's
Department of Community Development (see “Embedded Cases” on page 57).
Data Collection
From July 1, 2010, to July 16, 2013, I conducted semi-structured interviews with sixty
people in thirty organizations in Cleveland and one state-level agency in Columbus. Thirteen
interviews with employees in six different organizations were conducted in-person during
September 2011, and several included NIS demonstrations. During this time I also observed a
collaborative brainstorming and decision-making session using the NST web application at a
Neighborhood Stabilization Team meeting between staff members from Neighborhood Progress
Inc., the Poverty Center, and a single CDC. I completed the rest of the interviews over the phone
and over email. Initial in-person and phone interviews lasted between twenty minutes and two
hours. They were often followed-up with questions over email. Several interviewees also
provided spreadsheets, maps, and reports.
Table 8 (below) summarizes the extent and type of contact I initiated with staff in each
CDC marked previously with a check (✔) in Table 5 (page 59) and with the staff of other non-
profit organizations and government agencies. The table shows the number of people (# People),
type of communication (In person, Phone, Email), and total number of interviews per
organization (Total # Times). For example, I interviewed four people at Fairfax Renaissance
Development Corporation—one in person—and conducted four phone calls and a single follow-
up email. Note that the email column presents only the number of emails I actually received from
staff members and coded for analysis—not emails from my unsuccessful attempts to contact
potential interviewees or emails concerning scheduling a phone call.

69
Table 8: Summary of Qualitative Data Collection
Type
Organization
# People
Type of Communication
Total #
Times In person Phone Email
Co
mm
unity
Dev
elopm
ent C
orp
orato
ns
Buckeye Area Dev. Corp 1 0 1 1 2
Burten Bell Carr Dev. Inc. 2 0 3 0 3
Collinwood & Nottingham Villages Dev.
Corp. 1 0 1 0 1
Cudell Improvement Inc. 1 0 1 0 1
Detroit Shoreway Community Dev. Org. 3 0 4 0 4
Fairfax Renaissance Dev. Corp. 4 1 4 0 5
Famicos Foundation 3 0 4 1 5
Glenville Dev. Corp. 1 0 1 0 1
Kamms Corners Dev. Corp. 1 0 1 0 1
Mount Pleasant NOW Dev. Corp. 1 0 2 2 4
Northeast Shores Dev. Corp. 1 0 1 0 1
Old Brooklyn Community Dev. Corp. 1 0 1 0 1
Stockyards,Clark Fulton, Brooklyn Centre
Community Dev. Office 3 2 4 7 13
Slavic Village Dev. 6 3 4 4 11
St. Clair Superior Dev. Corp. 3 0 3 1 4
Tremont West Dev. Corp. 3 2 1 1 3
Union Miles Dev. Corp. 1 0 1 0 1
Westown Community Dev. Corp. 2 0 4 0 4 O
ther N
on-P
rofit
Org
aniizatio
ns
Brooklyn Center Community Association 1 0 1 1 2
Cleveland Housing Network 2 0 2 0 2
Cleveland Neighborhood Development
Coalition 1 0 1 0 1
Neighborhood Progress Inc. 2 3 1 11 15
Empowering and Strengthening Ohio's
People 1 1 1 7 9
Case Western Reserve University 2 1 2 0 3
Cuyahoga Community Land Trust 1 0 1 0 1
Go
vern
men
t
Dep
artmen
ts
& A
gen
cies
Cleveland Dept. of Building & Housing 4 0 4 3 7
Cleveland Dept. Community
Development 4 0 5 2 7
Cleveland Housing Court 1 0 1 0 1

70
Cleveland Planning Commission 1 0 0 1 1
Cuyahoga Land Bank 1 0 1 1 2
Ohio Development Services Agency 1 0 1 0 1
In the interviews, I asked staff members whether and how they use NEO CANDO and the
NST web application in their day-to-day community development functions. I also asked how
they performed these same functions previously before the NIS. I wrote detailed notes during in-
person and phone interviews, either by hand or on a laptop. I typed any handwritten notes shortly
after the interview.
Determining which CDC activities actually involve NIS use permits restricting later
quantitative investigations of participation and capacity building to only those activities that
actually use the technology, reducing spurious findings.
Data Analysis
Interview database
I built a database for interviews using standard database principles of reducing
redundancy by linking tables of unique information through keys and external keys. A key field
uniquely identifies a record (row) in a table. An external key field in one table links to a key field
in another table as shown in Table 9 (below). For example, quoted text in the Quotes table links
to the Interviews table through the Interview-ID in the former, which matches a key field with
the same name in the latter. In this way, thirty quotes from the same interview do not need
duplicate information about the date and type of interview (phone, in-person, etc), they only
point to the same Interview-ID. Similarly, the Employer and Target fields follow the same CDC
naming convention employed for the NIS logfiles and CDBG administrative records, facilitating
linking between the qualitative and quantitative sides of the research.

71
Table 9: Structure of the Interview Database
Table Data Fields Key External Keys
Interviews
Full transcript
Date
Type (in-person, phone, email)
Interview memo
Interview-ID Person-ID
People Personal Initials
Person Memo Person-ID
Employer
(CDC name)
Quotes Quoted text
Quote memo Quote-ID
Interview-ID
Target (CDC
name)
Codes Code
Code memo Code-ID Quote-ID
The database permits two types of qualitative coding: (1) coding by speaker/relationship, and (2)
coding by topic. The Employer field stores the home institution of the speaker, and the Target
field stores which institution he or she is talking about on a quote-by-quote basis. Unless an
interviewee currently works for—or previously worked for—the organization targeted by his or
her comments, those comments guide future questions to employees of that organization rather
than providing definitive material about the organization.
Interview coding
The separate literatures on community development corporations and neighborhood
information systems provides potential themes for coding. The former suggest activities that
CDC employees perform regularly and the latter suggest how NIS users generally use the
technology. However, the coding system employed in this research emerged from a long iterative
process of reading, coding, and recoding interview transcripts. The need to capture detail and
nuance concisely gave rise to a coding technique I call parameterized coding. Appendix A: The
Grammar of Parameterized Coding (page 207) provides the rationale for and examples of the
technique.
Coding analysis
Conducting qualitative analysis on these codes entails writing SQL queries that break

72
apart the long codes according to the standardized grammar, check for validity, and then perform
sorting, filtering, and aggregation as needed.
Q4. Does NIS improve public participation and, if so, what factors mediate the
improvement?
In this research public participation is defined as a key element of political capacity, as
defined by Glickman and Servon (1988). The answer to this question relies exclusively on
responses to semi-structured interview questions by CDC employees, resident activists, and
government officials. The qualitative coding techniques detailed for research question #3
enabled easy characterization of uses, outcomes, and levels of evidence.
Q5. Does NIS improve capacity and, if so, what factors mediate the
improvement?
This question is addressed through the sequential exploratory strategy described in
Creswell (2009), which calls for initial qualitative data collection and analysis to guide
subsequent quantitative data collection and analysis. This strategy permits the quantitative study
of phenomena that are not well enough understood to otherwise approach constructively
quantitatively. The results of semi-structured interviews guide the development of generalized
estimating equation (GEE) models by helping to select appropriate variables. The qualitative
data are also analyzed thoroughly using the coding techniques detailed for research question #3,
which enable easy characterization of NIS uses, outcomes, and levels of evidence. In some cases
interviewees may have performed the same work with NIS and without NIS and will be able to
isolate its impact qualitatively.
The quantitative models are designed to explain the volume and quality of residential
rehabilitation activities by CDC capacity (including NIS use), neighborhood characteristics, and
consumer demand. High volume (number of units purchased) and high quality (percent of
purchases transferred and percent of purchases improved) are interpreted as evidence of
programmatic capacity building42. The quantitative models include data from July 1, 2007 (the
42 An alternative approach, in which year-to-year differences in volume and quality are interpreted—if
positive—as capacity building—has intuitive appeal, but proved difficult to implement in practice.

73
start of CDBG Year 33) to June 30, 2011 (the end of CDBG Year 36). For simplicity, the end of
a CDBG pay period determines the year in this research—from 2008 to 2011. The Poverty
Center did not begin to track NEO CANDO use by individual users until September 26, 2006.
This date determined the earliest CDBG funding year that could be analyzed quantitatively.
In all the models, CDBG funding and NIS queries are aligned against outcomes occurring
six months later. For example, year 2008 for CDBG and NIS runs June 1, 2007 to June 30, 2008
(the fiscal year) while year 2008 for outcomes runs January 1, 2008 to December 31, 2008 (the
calendar year). This time shift serves two purposes. First, it reflects the qualitative findings that
staff members can identify, renovate, and transfer a property in three to six months (with NIS
sometimes starting the process). Second, it strengthens the claim that discovered correlations are
causal by increasing the chance that NIS use precedes outcomes. Threats to validity caused by
the ambiguous connection between a particular query and a particular outcome and the
ambiguous timing are addressed in Chapter 8 (Ambiguous Temporal Precedence on page 184 ).
Generalized Estimating Equations
Generalized estimating equations (GEE) allow researchers to overcome two common
statistical challenges: non-normally distributed data and repeated measures (Ballinger 2004).
Non-normally distributed data often result in non-normally distributed residuals, violating a
fundamental assumption of linear regression (Lewis-Beck 1980). Repeated measures of the same
individuals or organizations violate another fundamental assumption of linear regression—that
each observation is independent (ibid). Organizational researchers in particular have started to
employ GEEs with longitudinal (panel) data (Ballinger 2004) and the current research
demonstrates the method's promise in the field of urban planning. GEEs enable researchers to
anticipate residuals that match the distribution of the dependent variable—including the Poisson
Firstly, this approach requires the first observation for each CDC to establish a baseline, reducing the
overall “N” for statistical analysis from 110 to 80, completely eliminating two CDCs for which only one
observation exists. Secondly, basing the dependent variable on differences requires then deciding which
of the independent variables should also be based on differences. Thirdly, such an approach requires an
additional interpretive step within a regression framework, which is—by definition—already a marginal
approach: a unit change in the difference of X produces a corresponding change in the difference of Y
equal to the coefficient of X. This approach may be useful in situations where more years of data are
available.

74
distribution for count data. GEEs enable researchers to group observations from the same source
and to assign weights based on the amount of additional information each additional observation
provides (Hanley 2003). Like other forms of regression, GEEs produce marginal models based
on the concept of ceteris paribus (holding other factors constant) to establish a unit change
relationship between independent and dependent variables while remaining silent as to whether
the former actually cause the corresponding change in the latter (Wooldridge 2001:34).
However, repeated measures may be arranged into a table for analysis in which the independent
variables represent a condition or event occurring prior to the condition or event represented by
the dependent variables, strengthening the case for causality. This does not remove the
possibility that independent variables dated after the dependent variable may also prove
“explanatory”.
The generalized estimating equations package for the R programming language is called
“geepack” (Halekoh, Højsgaard, and Yan 2006). The package permits several weighting
approaches, called “correlation structures” that determine how to approach repeated measures.
These approaches are common to multiple GEE implementations and selecting among them
remains more art than science. When the correlation structure is set to independence, generalized
estimating equations produce the same model as traditional linear regression. When working
with repeated measures, this option violates fundamental statistical assumptions and is therefore
used to produce a baseline for comparison with other correlation structures without seriously
changing the underlying computer code43.
An exchangeable correlation structure posits that every measure of a unit of observation
will be equally correlated with every other measure of the same unit of observation. For
example, one CDC may purchase very few properties and another CDC may purchase many
properties—but a single correlation estimate, alpha (α), would capture the similarity in outcomes
from year to year in both cases. However, this option best suits a research design with repeated
measures that have no intrinsic order. For example, the weights of five deer grazing in one field
versus deer grazing in several other fields (Zuur et al. 2009:307). It is reasonable to assume that
43 However, in this research, assuming independence despite repeated measures did not greatly change the results.
See, for example, the comparison of a model that assumes independence and the same model with an
autoregressive correlation structure in Table 22 (page 164) and corresponding Figure 12 (page 168).

75
some fields support grazing more than other fields and therefore the measurements are not
independent, but each measure reflects the mass of a different animal and the order does not
matter.
The autoregressive correlation structure posits that measures of the same unit of
observation closer to each other in time will be more correlated with each other than measures of
the same unit of observation further apart in time. Measures of the same unit of observation that
are one time unit apart (a year in this research) have a correlation of α, measures that are two
time units apart have a correlation of α2, and measures that are three time units apart have a
correlation of α3. Since 0<= α<=1, the correlation decreases with increased time between the
measures44. This structure is the obvious option for researchers working with data collected at
known, ordered, intervals.
The autoregressive correlation structure does not match the research design described
herein perfectly, however. In many research domains, biological or physical limits determine
how much the dependent variable can possibly vary from one observation to the next. For
example, if the dependent variable were human body weight and the time between measurements
was only one hour, we would expect a very high degree of correlation between observations of
the dependent variable because even if an individual exercised vigorously and did not eat—
metabolism limits how much body weight can fluctuate in such a short length of time. Similarly,
if the dependent variable were the number of commercial construction projects a company
currently had underway and the time between elements was one month, we would expect a very
high degree of correlation because new projects may not begin every month—and ongoing
projects take years to complete. But, several CDC staffers claimed they could locate, purchase,
and rehabilitate a suitable property in three to six months. This timeframe allows for
considerable fluctuation in year to year totals and does little to explain why annual outcomes
should be correlated—save for stability in the underlying drivers of CDC activities. I hypothesize
that this correlation structure, the default for this research design, will draw explanatory power
away from the neighborhood factors that are based on Census data.
44 Except in the extremely rare case that α=1 when temporal distance has no effect on the correlation between two
measures.

76
Lastly, an unstructured correlation structure45 holds that any two measures (b, c) of the
same unit of observation have their own correlation αb,c. Researchers employ this approach when
their research design and domain-specific theory fails to offer any guidance.
Given these choices, I elected to compare the independence and autoregressive
correlation structures in order to compare traditional regression with the most obvious choice for
ordered repeated measures. Traditional R2 calculations are not possible with GEEs since some of
the variance exists within groups and some between groups. While alternative calculations have
been proposed (e.g. Natarajan et al. 2007) no such feature is readily available in R. Instead, I
employ graphical techniques to assess model fit in this research, comparing actual and estimated
values. I also calculate the mean percentage difference between the actual and estimated values
across all organizations and years. A good model would have a very small percentage difference
between the actual and estimated values.
The quantitative models rely on data drawn from numerous sources and arranged into
neighborhood contextual factors, organizational factors, and outcomes as described in the
theoretical framework (Figure 3 on page 41). The quantity of CDC property purchases is
modeled in two stages. First neighborhood contextual factors alone predict the odds that a CDC
will purchase at least one property (Stage 1). Then, both neighborhood and organizational factors
predict how many properties a CDC will purchase. Interviews with CDC staff members suggest
that this approach captures the fundamental decision-making process within the organization.
The quality of CDC property purchases is modeled in a single stage based only on those
properties that were purchased. Below, Table 10 provides an overview of the neighborhood
contextual variables and Table 11 provides an overview of the organizational variables. The
section that follows describes the construction of dependent variables based on property records.
45 Each approach to solving the repeated measures problem employs a matrix of correlations and is therefore
similarly “structured”. But, this one reads like an oxymoron—“unstructured correlation structure”—and lacks a
theoretical foundation. It assumes that the correct correlation between two measures is just what appears in the
data on hand.

77
Table 10: Neighborhood Context Variables
Variable Description & Source
Residential
vacancy rate
These variables are based on linear interpolation between the 2006-2010
and 2007-2011 American Community Survey (ACS) datasets46. An aerial
weighting method assigns Census data to CDC service areas47 based on
their overlap with block groups, allowing the study to employ the most
relevant geographies to CDC staff members (see Saporito et al. 2007 for
more on the method) 48. See Unreliability of Measures on page 176 for
threats to validity due to margins of error in independent variables.
Owner occupancy
rate
Number of private
sales
Both these variables come from an analysis of housing sales in CDC
jurisdictions during the period under investigation using data provided by
the Poverty Center at Case Western Reserve University. Sales involving
CDCs were excluded in order to capture the desirability of each
neighborhood in the private market over time.
Median cost
per square foot
of structure
46 The United States Census warns against crudely comparing datasets from overlapping years. The linear
interpolation therefore may reduce the accuracy of a single year's estimate but captures the best estimate of the
direction of neighborhood change. Without such interpolation, these variables would remain static over the
longitudinal study. Single year estimates for these variables are not available at such a fine level of resolution,
making this approach a reasonable compromise.
47 This research relies on CDC service areas reported to Neighborhood Progress Inc. in August 2012
48 The dataset includes other variables such as the poverty rate and income levels, but interviews suggested these
primarily affect the ability of local homeowners to voluntarily correct code violations—which this research does
not examine quantitatively.

78
Table 11: Organizational Variables
Capacity Variable Description & Source
Resource
Capacity
CDBG
Annual Community Development Block Grant (CDBG)
allocations from the City of Cleveland's Grantee
Comparison Spreadsheets received via a Freedom of
Information Act request.
SII
CDCs participating in Neighborhood Progress Inc.'s
Strategic Investment Initiative (SII) receive additional
funding.
Organizational
Capacity
Emp
The number of employees in the CDC according to a
linear interpolation between a 2005 value and a 2012
value. The earlier value is from City of Cleveland's
Grantee Comparison Spreadsheets and the latter value is
from a combination of phone interviews and website
searches49.
NIS
The annual number of property-related queries staff in
each organization submitted to the neighborhood
information system each year, obtained from the Poverty
Center at Case Western Reserve University. This also
falls under the definition of Programmatic Capacity, but
Programmatic Capacity is defined as housing
development outcomes, a dependent variable in the
quantitative analysis.
Networking
Capacity SII
CDCs participating in Neighborhood Progress Inc.'s
Strategic Investment Initiative (SII) receive access to
49 The planned source for employee information, IRS 990 forms, proved inaccurate.

79
resources outside the organization, such as technical
support.
Programmatic
Capacity
(The dependent
variables)
Purchases
The number of residential properties that a CDC takes
title to in a given year that does not involve the Cleveland
Housing Network. The process of identifying these
properties is described below.
Transfer
rate
The percentage of purchased residential properties that a
CDC eventually transfers (usually by selling) to a new
owner who pays taxes on the property. Interviewees
defined this success measure. The process of identifying
these properties is described below.
Rehab
rate
The percentage of purchased residential properties that
eventually undergo rehabilitation or new development
after a CDC took title, regardless of who currently owns
the property. Interviewees defined this success measure.
The process of identifying these properties is described
below.
Political
capacity N/A
This sub-capacity is not studied quantitatively in this
research.
Measuring resource capacity with CDBG records.
The Community Development Department of the City of Cleveland maintains annual
spreadsheets tracking the accomplishments of organizations that receive public funding such as
Community Development Block Grants. Through a Freedom of Information Act request, I
received seven such spreadsheets for 2005 (fiscal year 31) through 2011 (fiscal year 36) with
years defined as starting on June 1 and ending on July 30. Spreadsheets before fiscal year 2008
(June 1, 2007) were not included in this research because user (CDC) specific NIS data is not
available before September 2006.

80
Constructing the outcome variables: purchases, transfer rate, and rehab rate
CDC staffers support housing in many ways, from promoting a positive image of their
neighborhood(s) to directly purchasing and rehabilitating properties. No master list of such
activities exists for Cleveland (or likely any other city), especially not one that includes parcel
numbers through which to analyze activities and outcomes over time. The quantitative side of
this research includes only properties listing a CDC or a CDC related legal entity50 on the chain
of title from 2008 to 2011. Ownership permits CDC staff to optionally add a rider to the deed
specifying how a developer must proceed, for example to start work within 30 days and to
complete work within 270 days. The rider often specifies that failure to comply gives the CDC
the “the right of reversion,” the right to buy back the property for its original price. Since the
CDC remains legally responsible for upkeep and taxes until selling a purchased property to the
next owner, the subset of cases where a CDC takes title represents those in which organizational
staffers are most directly involved and the organization is most liable financially. Examining
specifically these cases better evaluates the potential of NIS, since higher stakes likely translate
into more motivated property research. Examining the efficacy of NIS for less direct property
transactions would have raised two difficulties I elected to avoid: (1) how to consistently detect
CDC involvement short of ownership for a four-year duration for all CDCs at the parcel-level of
detail necessary to track outcomes; and (2) how to argue that staffers used NIS to conduct
research for these less-involved transactions. The research relies on the sources of data described
below.
Property and building permit records
CDCs do not report all housing production and rehabilitation activities to any federal or
municipal agency. Interviews with CDC staff members revealed that applying CDBG funding to
directly purchase or rehabilitate property triggers higher building standards that may cause the
finished house to cost more than target low-income buyers can afford. Therefore, the housing
production and rehabilitation numbers reported to the city in the Grantee Comparison
Spreadsheets do not provide a complete picture of CDC housing activities. There are two other
ways to receive this information: (1) from CDC employees themselves and (2) from city and
50 For more on finding these entities based on IRS 990 tax forms, see Finding CDC property purchases on page 71.

81
county administrative records. Although I collected recent housing production and rehabilitation
numbers from some CDCs, I worried that this data suffered from three sources of error:
1) Systematic exaggeration due to every person's desire to describe their hard work in a
positive manner.
2) Accidental double counting of properties due to the complexity of the rehabilitation
process: a property purchased one year and rehabilitated the next may be counted in the
totals for both years.
3) Accidental recall errors. It is unreasonable to expect an employee to remember the
number of houses rehabilitated in 2008, especially given the staff turnover rate in some
CDCs.
Therefore, I designed a two step process to calculate housing activity for use as a dependent
variable related to programmatic capacity:
1) Find all properties (with and without structures) purchased by each CDC between
7/1/2007 and 6/30/2011 using Cuyahoga County Auditor's records. These dates
correspond to the start of CDBG fiscal year #33 (referred to as 2008 in this research) and
the end of CDBG fiscal year #37 (referred to as 2011 in this research).
2) Determine whether the house activity was “successful” as defined by the interviewees.
CDC employees define two categories of success, transfer and improvement (rehab or
new construction). The former relies on Cuyahoga County Auditor's property tax records
and the latter relies on Cleveland's Department of Building and Housing permit records.
The next sections describe these steps in more detail.
Finding CDC property purchases
CDCs purchase properties from individual homeowners, banks, and government entities

82
like the Cuyahoga County Land Bank. Since the housing crash, CDCs are primarily—though not
exclusively—involved in rehabilitation over new construction. Therefore, the majority of the
properties have an existing house. CDCs then sell this property to a developer or new owner for a
small fee. A few CDCs also arrange deals between buyers and sellers without actually taking
possession of the property. Since the CDC is not on the chain of title, such facilitated
transactions are impossible to track through administrative property data alone and lie outside
this research. CDCs take title both under their own business names and under the names of
related businesses, often limited liability companies (LLCs)51. I find these related businesses
using “Schedule R” of the IRS 990 form that must be completed annually for a non-profit
organization to maintain tax exempt status. Schedule R includes subsections for the
“Identification of Related Organizations Taxable as a Partnership” and “Identification of Related
Organizations Taxable as a Corporation or Trust”. From July 1, 2007, to June 30, 2011, CDCs in
Cleveland purchased 368 properties. This count includes properties of all classes (residential,
commercial, agricultural, land bank, and exempt) in order to capture any possible changes of
class during the rehabilitation process52.
The research excludes more than six-hundred properties purchased and rehabilitated by
the Cleveland Housing Network (CHN), which differs from a CDC in several ways. CHN
conducts activities across the city instead of focusing on a home neighborhood. It pursues
housing development only—not code enforcement, paint programs, side lot expansions, or
demolition advocacy like CDCs.
CHN is also far larger and more influential than any of the CDCs. In 2011, CHN received
more than $23M in contributions and grants and over $43M in total revenue, roughly ten times
more than even well-established CDCs such as Slavic Village Development and Detroit
Shoreway Community Development Organization. According to one interview with a person
knowledgeable about CHN, its staff members do not use NIS since they can contact city and
51 Readers familiar with the role of limited dividend housing associations (LDHAs) in LIHTCs in Michigan will
note that these are in fact general or limited partnerships, limited liability companies, joint ventures, or trusts
and would therefore be listed on 990 forms as well (www.legislature.mi.gov)
52 Properties in the city or county land bank are most frequently—though not exclusively—assigned to the land bank
class.
83
state agencies directly and receive any information they require in a timely fashion (#75,
6/24/2013). For this reason, staff members in nearly all CDCs leave CHN staff members to
conduct their own housing research, even if the potential project falls within a CDC service area.
Staff in Slavic Village and Detroit Shoreway, however, supplement CHN research using
NIS (#75, 6/24/2013). This poses a challenge to the quantitative side of the research design.
Since all CHN production outcomes are excluded—any CDC submitted queries to support CHN
projects would appear—incorrectly—to have no impact on the ground. But, including all CHN
outcomes would wash out any beneficial impact NIS has on housing activities since CHN staff
members have privileged access to information outside of NIS. A compromise solution, counting
CHN outcomes only in the Slavic Village and Detroit Shoreway services areas may appear to
stack the deck toward a statistically significant and positive finding. Omitting CHN outcomes
completely should be viewed as a step toward a hypothetical better solution, perhaps one that
incorporates CHN involvement as a Boolean independent variable with parcel as the unit of
observation. Regardless, evaluating community development will likely always require
identifying the property transactions of CDCs and assessing the completeness of the list. Please
see Imputation of CDC outcomes under Threats to Validity on page 179 for further discussion.
Table 12 (below) provides an overview of all detected property purchases by CDCs with years
that the organization did not qualify as a CDC due to lack of CDBG funding marked with “n/a”.

84
Table 12: CDC Property Purchases 2008-2011
Organization Y2008 Y2009 Y2010 Y2011 TOTAL
Bellaire Puritas Development Corporation 0 4 7 0 11
Buckeye Area Development 0 0 3 0 3
Burten Bell Carr Development 0 2 2 0 4
Collinwood Nottingham Villages Development Corporation 18 24 21 4 67
Consortium for Economic and Community Development 0 n/a n/a n/a 0
Cudell Improvement Inc 0 9 16 0 25
Detroit Shoreway Community Development Corp 5 9 7 6 27
Euclid-St Clair Development Corporation 0 3 0 n/a 3
Fairfax Renaissance Development Corporation 13 12 12 2 39
Famicos Foundation 4 5 6 1 16
Flats Oxbow 0 0 0 n/a 0
Glenville Development Corporation 0 0 0 0 0
Harvard Community Services n/a 2 2 0 4
Historic Gateway Neighborhood Corp 0 0 0 0 0
Historic Warehouse District Development Corp 0 0 0 0 0
Kamms Area Development Corp 0 0 1 2 3
Little Italy Redevelopment Corporation 0 0 0 0 0
Midtown Cleveland 0 0 0 0 0
Mt Pleasant Now Development 2 0 3 2 7
Northeast Shores Development Corporation 2 8 8 1 19
Ohio City Near West Development Corp 0 1 0 0 1
Old Brooklyn Community Development Corp 0 1 8 0 9
Shaker Square Area Development Corporation 0 0 1 0 1
Slavic Village Development 14 32 33 14 93
St Clair Superior Development Corporation 0 0 0 0 0
Stockyard Clark Fulton n/a n/a 1 5 6
Stockyard Redevelopment Organization 0 0 1 1 2
Tremont West Development Corporation 0 1 2 1 4
Union Miles Development Corporation 6 2 0 2 10
Westown Community Development Corp 0 8 6 0 14
TOTAL 64 123 140 41 368

85
CDC property purchases are not an end in and of themselves. As the next section details,
interviewees described two end goals.
Determining housing activity “success”
CDC staffers engaged in purchasing and rehabilitating houses defined success in two
ways:
Transferred: Several CDC employees report that transferring a CDC-owned property to a
“responsible owner” (#48, 2/21/2012) –meaning someone who maintains the property and pays
taxes—marks the end of a successful instance of community development. I do not track
property upkeep but focus instead on tax delinquency as tracked by the Cuyahoga County
Auditor. Any property purchased by a CDC during the time frame of this study and then owned
by an individual or other non-public organization with no back taxes owed is counted as
successfully transferred.
Improved: Another sign of successful community development occurs when a developer
or new owner invests in a property received from a CDC. I define a closed permit of any of the
following categories as constituting an improvement. These permits require an inspection to be
marked as closed rather than ongoing or canceled. While developers may request a Certificate of
Occupation (COO), this formality is not necessary for all rehabilitation projects. For example,
any renovation under $15,000 does not legally require a new COO.
For new housing construction: Only completed permits of type “New”.
For housing rehabilitation: Only completed permits of the following types: Electrical,
Exterior Alterations , HVAC and Refrigeration, Plumbing , Interior Alterations , Interior
Demolitions, Re-roofing, Additions , Change of Use , and Combo.
Ideally, such permits should have been requested after a CDC takes title in order to securely
attribute the outcome to that CDC, but I allow for a one-month window to account for record
keeping differences between departments and administrative errors. Therefore an application for
new construction requested even 27 days before a CDC took title would count toward that CDCs
physical improvement total provided the permit currently has a completed status and property
records show a residential structure, which in Cleveland could have 1 to 3 units. This success
measure does not consider who currently owns the property or whether taxes have been paid.

86
The total dataset includes thirty CDCs over four years. Some CDCs entered the study
midway by gaining CDBG funding and some CDCs left the study midway by losing CDBG
funding, yielding 111 rows of data instead of the 120 rows anticipated (30 CDCs x 4 years =
120). The table below shows for instance that the dataset includes four years of data for twenty-
four of the organizations and only one year of data for two of the organizations.
Table 13: Physical Description of CDC Purchases Dataset
Total
Dataset
Purchases
# Years
of Data
CDCs Rows CDCs Rows
1 2 2 6 6
2 0 0 7 14
3 4 12 3 9
4 24 96 6 24
Total 30 110 22 53
The columns concerning purchases reflect only the rows in which a CDC purchased at least one
residential property in a given year. These columns show that only twenty-two of the thirty
CDCs purchased properties during the study period and that only 53 of the 110 data rows involve
a purchase. Approximately fifty percent of these data rows have zero purchases.
Modeling housing activity “success”
Researchers often use a two-stage model (Zuur et al. 2009) to explain data with many
zeros. Interviews with CDC staff members support this approach, revealing that staff members
employ a two-stage decision model themselves. They first identify neighborhood needs and then
allocate resources to meet those needs. To a large degree, neighborhood contextual factors
determine whether CDC staff members pursue residential redevelopment at all. The first stage of
the quantitative model mirrors this decision making process, matching neighborhood factors
87
against a binary housing outcome (zero = no housing purchases; one = yes, at least one housing
purchase). The second stage either models only the “yes” cases—or, down-weights the “no”
cases using information from the first stage. The former approach is called a “hurdle” model
since only data jumping over the first stage (i.e. non-zero) are included in the second stage. The
latter approach is called a “zero inflated” model, which posits that—for domain specific
reasons—zeros may occur in the second stage. Since staff at a community development
corporation may decide that residential rehabilitation is necessary in their neighborhood (stage 1)
but lack the capacity to purchase property and work with developers (stage 2) this research
employs a zero inflated approach to modeling residential purchases by CDCs.
Figure 6 and Figure 7 display scatterplot matrices of key independent and dependent
variables. The diagonal provides a histogram of the distribution of each variable. Below the
diagonal are scatter plots of all variable combinations. Above the diagonal are correlations of all
variable combinations. Larger correlations are printed in a larger font. Correlations too small to
see are too small to cause multicollinearity problems (if between two independent variables) or
to provide significant linear prediction (if between an independent and dependent variables). The
first matrix (Figure 6) contains all the data and shows the large number of zeros in the outcome
variables (no purchases and therefore no transfers and no rehabs), necessitating a two stage
model. It also shows that all the count variables (NIS Queries, Number of Employees, Number of
Private Sales, and Purchases by CDC) are highly right skewed. A Poisson distribution is
therefore employed to model the residuals for the purchases model. The second matrix (Figure 7)
shows only data rows in which the CDC made at least one purchase. This matrix shows that the
two other dependent variables, transfer rate and rehab rate are less right skewed—though not
normal. Regardless, a traditional Gaussian distribution is employed to model the residuals in
these two models. The application of these scatter plot matrices to model construction is
discussed in the quantitative section on programmatic capacity building.

88
Figure 6: Scatterplot Matrix for all Data Rows (Purchases & Non-Purchases)

89
Figure 7: Scatterplot Matrix for Purchases Only (Non-Purchases Removed)

90
Chapter 6: Findings regarding System Quality, Data Quality, and
Service Quality
The semi-structured interviews provide considerable validation of Delone and McLean’s
(2003) information system success model, which has received wide empirical support in other
fields—but never in the field of community development. Scholars criticized an earlier version
of the model (1992) for failing to capture system users’ needs for training and assistance.
DeLone and McLean (2003) responded by adding the “Service Quality” component (see model
on page 24). Interviews conducted in this research did not reveal system aspects that fell outside
the current model, validating its general construction. However, while the authors assert that the
model flows in the direction of information use—from left to right—the interviews revealed that
increased adoption results in more departments willing to share data and higher data quality
overall in terms of data breadth. System use comes after data quality in the model. This finding
suggests an area for further exploration and refinement. Despite this movement through the
model in the opposite direction anticipated, the interviews show that the overall flow in the
model is from left to right, which makes this chapter necessary. The answers to research
questions 3, 4, and 5 refer to system use (middle of the model) and net benefits (end of the
model), which depend on system quality, data quality, and service quality (start of the model).
This chapter provides key findings for these early model components.
System Quality: Ubiquity, Selectivity, and Customizability
Interviewees described three aspect of the system directly related to system quality in
DeLone and McLean’s model. I refer to these aspects as ubiquity, selectivity, and
customizability.
Ubiquity
In computer science, ubiquity refers to the widespread integration of information
processing into everyday devices to such an extent that users are unaware of the underlying
complexity (Weiser 1991). I employ the term in this research to represent a critical mass of

91
technology adoption. The breadth of data in the system exists due to the ubiquity of the system:
widespread stakeholder adoption leads to more data contributions, which—in turn—improves
data breadth.
In Cleveland, the NST web application is becoming ubiquitous among CDC staffers and
the subset of municipal employees that interact with them on a regular basis. The former
expressed pleasure that the latter were now on-board:
“[Person] is training the city inspectors to use NST. So it will be both the city and the
CDCs that change data. It doesn't make sense for just the CDCs to use it.” (#3,
11/3/2011)
One individual closely involved with the development of the NST web application and familiar
with a broad cross-section of users described the process of public sector adoption:
“Government agencies were always legally obligated to give data but they found reasons
not to. But, it reached a critical mass when agencies start using the [NST] system. Now, it
is unusual to find an agency that will not share data.” (#46, 10/20/2011)
Interviews (excerpted here) and logfiles (analyzed later) reveal that all the CDCs involved in
residential rehabilitation, residential construction, or code enforcement use the system to some
extent. The Cleveland Code Enforcement Partnership provides an example of this widespread
adoption, as another interviewee explains:
“The NST tool is the intermediary for the partnership between the city and CDCs for
code enforcement. City Building and Housing, Planning, and the Housing Court [all have
access]. Some City Councilmen and staff use it. We've given data to the Federal
Reserve. City administrators and head staff love it. Most [non-management] staff see its
value also.” )1102/11/8 ,74#(
Both NEO CANDO and the NST web application provide the most common elements of cloud
computing—software, computing power, and data storage (Leavitt 2009) and—to a degree—its
most common benefits: ease of access, cost savings, and data sharing.
In terms of ease of access, system administrators at CWRU's Poverty Center allow
anyone to create an account for the NEO CANDO system and grant NST accounts to any city
employee, CDC employee, or educational researcher. As discussed previously under system
selectivity, a single web-based interface provides all neighborhood information system selection

92
tools. Users encounter the same login process, forms, and drop-down lists in NEO CANDO and
in the NST web application as in countless other websites.
In terms of cost savings, while many interviewees praised the convenience of free access
to both NEO CANDO and the NST web application, tracing such access to financial benefits
proves exceedingly difficult. Employees in many organizations already enjoyed NEO CANDO
when they received access to the more advanced NST web application—also for free. Therefore
they gained more functionality and more underlying data for the same “price”. An interviewee at
one CDC acknowledged that her organization had stopped paying for the commercial
Metroscan53 product once NST became available. However, she could not trace the savings to a
reallocation for another CDC expenditure and does not even think of the change in terms of cost
savings:
“In 2008, with the housing crisis—that hit non-profits hard. I don’t think it [the NST web
application] is money saved. I think it is money you are not losing. Like we had cable
[TV] and now it is not feasible to have cable or those extras. We haven’t lost anything—
we can get the same info as before.” (#17, 2/23/2012)
Once information is loaded into the system, data sharing occurs automatically because users
manipulate a single set of property data—not a private set for each user or organization. To save
query processing time, system administrators assign users access to a subset of properties
corresponding roughly to a particular CDC's service area. But, these assignments allow users in
organizations with adjacent (or overlapping) jurisdictions to still see each others' data. Also,
employees at NPI and city departments gain access to property data for the entire city. This joint
access transparently supports the common task of communicating information discussed further
below. The NST web application provides data sharing to a larger degree than NEO CANDO
due to its custom fields (see “Customization” below).
53 The website for CoreLogic, which produces MetroScan, describes it as “a comprehensive database of residential,
commercial, industrial and vacant property,” updated using, “more than 3,600 government and proprietary data
sources.” http://www.corelogic.com/products/metroscan-online.aspx#container-Overview

93
Selectivity
The term selectivity refers to the process of choosing best candidates or being able to
differentiate between very similar choices54(OED). Community development professionals select
properties to research based either on criteria outside the NIS (i.e. windshield surveys, resident
inquiries) or criteria inside the NIS. Users prefer NEO CANDO and the NST web application
over other public websites because of the list building and filtering tools. A CDC employee may
have a page full of parcel numbers of potentially vacant properties and want details like the
owners' names, foreclosure status, and property tax status. As detailed in the answer to research
question #5, “Does NIS improve the capacity of a CDC,” community development corporation
employees claim that the selectivity of the NIS saves time in housing rehabilitation work that is
then reinvested into completing more rehabilitations (see “Times savings via selectivity” on page
138).
Customization
The term customization refers to the process of adapting something to particular
requirements (OED). NST provides users with twenty blank fields to be used flexibly as needed
by individual users or as defined within their respective organizations. In practice, only staff in
very few organizations use these fields, but those who do speak convincingly of their benefits.
These fields are used to store two types of locally collected data: systematic surveys and memos.
One interviewee provided an example of the former, entering data from a vacancy survey
conducted by the CDC to see the results alongside city vacancy data and USPS vacancy data (#5,
7/11/2011). Another interviewee provided an example of the latter, entering the participants in
the CDC's weatherization and paint programs through their parcel numbers (#48, 1/18/2011).
Interactions with residents can also lead to more ad-hoc memos. One interviewee explains that:
“Some block clubs that are passionate do their own surveys on distressed
properties. rieht morf atad htiw em ot dnes ot teehsdaerps a pu epyt lliw meht fo emoS..
syevrus … [or] eyesore cards that are self-explanatory. All the info residents gather get
into NST. We get interns that help with data collection. ,84#( ” 10/20/2011)
54 Another definition relevant here comes from radio engineering. Selectivity refers to the ability to differentiate
between similar signals or to pull a signal out of interference (OED).

94
Whatever we do in the office we plug them into the custom fields. I get a phone call from a
resident that there are squatters. I call the city and plug in the complaint into a custom field. I
[also] plug my redevelopment interest into the house. ,84#( ” 2/21/2012) Customization may
provide time savings like selectivity but the interviews did not provide such detail. In the long
term, customization may lead CDC employees to make different decisions than they would have
without the custom fields by allowing them to better integrate locally collected data with city
sources to reveal more assets, opportunities, and threats. Building up locally collected data
sources and learning to integrate them likely takes years and impacts may take quite a while to
appear.
Information Quality
Two components of data quality attracted the most attention in interviews, breadth of
information and the accuracy and/or currency of the information. Although the interview
questions focused on how interviewees used data, interviewees repeatedly commented, usually
positively, on the quality of the data—not just about how they used them.
Breadth of information
The breadth of data is a product of the different types of data in the system and the number of
different public agencies contributing data to the system. One CDC employee explains that
“NST is not like Microsoft Word that everyone needs on their computer. But if you are
like me and are dealing with land, NST is useful. There are so many columns: deed
status, purchase price, etc. )1102/11/01 ,24#( ”
Like with selectivity, CDC employees claim that the breadth of information in the NIS
contributes to time savings for housing rehabilitation work (see page 139).
Currency / Accuracy of Information
In urban planning, data accuracy and data currency are closely related. Since the situation on the
ground changes due to the natural effects of the environment on aging structures and the
activities of numerous people—CDC employees, city workers, private investors, homeowners,
copper scavengers, arsonists—old data quickly become wrong data.
Interviewees described several leaps in accuracy, mostly due to an increase in breadth—

95
the addition of data better suited to a particular task than the data previously available. One CDC
staff person described the progression of data used to track vacancy:
“Water turnoffs data is not the final answer on vacancy. People live without water. And
water is sometimes left on in vacant buildings. ,oS.. we would send out a mass mail and
whatever came back was vacant. Now we have USPS vacancy data in NST.” (#42,
10/11/2011)
She concluded that while the software “gives us a big head start... morf si noitamrofni tseb eht
.ytinummoc eht ni elpoep ot gniklat I jump out of my car when I see someone near a building. ”
a fo etad ycnacav eht enimreted ot srobhgien ot skaeps CDC rehtona ta nosrep ffats A .)dibi(
.)1102/4/11 ,01#( evael tnapucco tsal eht nees evah yam yeht esuaceb esuoh
Several experienced users expressed frustration with the quality of data from city
agencies, which feed the NST system. One CDC staffer exclaimed that some of the houses on
Cleveland's worst-of-the-worst list for immediate demolition have already been rehabilitated. He
continues:
“The NST web app is still playing catchup with demolitions...There are four districts in
the Building and Housing Department each with a chief inspector and they differ in data
quality. The city is notorious for losing applications for side yard expansions. It holds
back progress. The city water department is famous for bad data.” (#48, 7/11/2011).
NIS cannot be more accurate than the data in the system. This CDC employee still uses NST
daily though. Two employees at a different CDC conclude that while they also use a commercial
property database (Metroscan), NEO CANDO and NST may be more current (#9, 2/8/2011 &
#58, 3/2/2012).
Service Quality
Delone and McLean (2003) added service quality to their 1992 model based on ideas in
marketing and noting the rise in computing by end users who need assistance. Surprisingly, the
model is not explicit about the need for training, which both users and NST providers referred to
repeatedly.
Training
CWRU's Poverty Center offers online and phone-in user assistance for NEO CANDO
96
and the NST web application. Master of Social Work students receive an annual NEO CANDO
training and the Center employees offer other trainings—to university librarians for instance—as
needed. Starting March 2011, the Poverty Center offered NST trainings twice a month and later
switched to a monthly schedule. In the words of a Center staff member, “anyone can attend,
but...[the trainings] are mostly broadcast to our CDC audience of users” (email 11/9/2011). The
trainers supplement the monthly schedule with classes for specific groups such as the city's chief
code inspectors, city council members, and housing court staff. NPI expanded its technical
support to CDCs from nine CDCs involved in the Strategic Investment Initiative to 22 CDCs, all
but two of which are located in Cleveland. A city department manager said that the Poverty
Center has offered both private sessions for his staff in the workplace and group sessions at Case
Western Reserve University (#72, 4/3/2012).
Responsiveness
Responsiveness means that an organization's service staff “give prompt service to users”
(DeLone and McLean 2003:18). Only one interviewee provided material that aligned with the
concept of responsiveness:
“They are very responsive at implementing suggestions. I noticed there was no field to
mark a ecittal gnissim on the lower part of a porch during inspections. They have added a
field. They also added wording so I know that ' garage out of plum ' means ' leaning ”.'
)1102/12/01 ,55#(
Assurance and Empathy
Assurance means that an organization's service staff “have the knowledge to do their job
well” and empathy means that an organization's service staff “has users' best interest at heart”
(DeLone & McLean 2003). CDC employees appear confident that people at the Poverty Center
are highly skilled and in the words of one long-term CDC staff member—“get it,” get “the
CDC’s criteria and responsibilities” (#42, 11/10/2011)
97
Chapter 7: Findings regarding research questions
This chapter offers detailed findings for each research question.
Q1: What claims do NNIP partner organizations make about neighborhood
information systems in their mission statements and websites?
NNIP Partner missions, activities, and claims
Staff members in NNIP affiliated organizations make claims about how data and
technology impact community development. I examine the institutional websites of affiliates to
better understand these claims, focusing on mission statements.
NNIP partner mission statements vary from those evoking data delivery as a goal (e.g.
CamConnect in Camden) to those that do not mention data delivery at all (e.g. CMAP in
Chicago). Many emphasize data provision as a strategy toward a social end. For example, the
mission of DataHaven in New Haven, CT is to improve “the Greater New Haven and Valley
Region by compiling and sharing high-quality public information for effective decision making"
(DataHaven, "About DataHaven"). Nearly eighty-percent (37 of 47) of the websites of these
organizations tout the data and high-tech tools found therein using 89 different words and
phrases to describe their timeliness (recent, new, updated), quantity (comprehensive, extensive,
more), quality (rigorous, assured, vetted), convenience (free, practical, one-stop shopping), scope
(regional-level, neighborhood-level, parcel-level), formatting (table, map, profile), and potential
function (track, compare, decide). NNIP partners generally provide data for display, download,
and mapping online.
The websites contain statements about the identity of anticipated data users. For instance,
the website for NEO CANDO in Cleveland states that “academic researchers, community and
economic development professionals, public officials, neighborhood activists, business leaders
and concerned citizens of all types can easily use this system to explore aspects of the area”
(NEO CANDO n.d.). Employees of government agencies, nonprofit organizations, schools, and
98
businesses are the most anticipated data users across NNIP partners (61%)55. Nearly half (43%)
of the websites specify residents, citizens, or individuals as data users. Terms that conflate
private individuals and organization employees such as “community”, “neighborhood”, and
“stakeholder” appear on nearly half (45%) of the websites in descriptions of anticipated users.
Adding these instances raises the total for organizational users to 68% (32 websites) and
individual users to 57% (27 websites)
The most prevalent themes on NNIP partner websites concern decision-making (68%),
public participation (53%), capacity or capacity building (32%), accountability or transparency
(21%) and social justice, equity, or equality (19%). I focus on the first three themes, especially
on participation and capacity, because they are intimately tied to decision-making on the
websites (e.g. “collaborative decision-making” and “the capacity to use information in
decisions”) and also intimately tied to decision-making in the urban planning literature (Arnstein
1969; Chaskin 2001; Davidoff 1965). Examples of participation on the websites vary widely.
Many advisory groups worked together to decide which data and indicators Minnesota Compass
would collect, process, and distribute (Anon n.d.). The website of Community Link in
Sacramento claims that the organization offers users opportunities to “study and influence public
policy” (Anon n.d.). Washington DC LISC seeks to address needs “identified by the
neighborhood residents” (DC LISC n.d.). A few NNIP partners, like CURA in Minneapolis
claim to support neighborhood associations and community organizing (CURA n.d.).
Examples of capacity and capacity building also vary widely—both in terms of subject
(capacity of whom?) and objective (capacity for what?). Subjects include residents56,
55 This includes all organizational employees and those individuals likely to use NIS in connection with official
duties such as university faculty and students.
56 Examples include the Polis Center at Indiana University-Purdue University Indianapolis and the Center for Urban
and Regional Affairs at the University of Minnesota in Minneapolis.

99
organizations57, and communities58. Objectives include the capacity to change59, to make
decisions60, to act collectively61, to collect and use information62, and to meet goals and confront
problems63. Some of the partners allude to subcategories of capacity such as organizational
capacity (RHCDA), operating capacity (MetroGIS), and technical capacity (DC LISC). Capacity
can also refer to the ability of an NNIP partner to provide information to prospective users
(Providence Plan). The NNIP website states that NNIP partners “have adopted as a primary
purpose using information to build the capacities of institutions and residents in distressed urban
neighborhoods” (NNIP n.d.). This implies that information—and perhaps the technology that
delivers information—can build capacity.
NNIP partner websites frequently describe data and information technologies as leading
to desirable outcomes. These outcomes fall into four broad categories, listed in Table 14 (below)
from vague to concrete.
Table 14: Claimed Outcomes from National Neighborhood Indicator Partnership (NNIP)
Partner Websites
Claimed outcome NNIP Partner Example
(From respective websites)
Positive social
change, more
democracy
Community Research Institute’s commitment to “building a growing data
sharehouse for the region,” improves “the democratic decision-making
capacity in our local communities…”
“…as stakeholders use the enhanced capabilities available to them through
57 Examples include MetroGIS in Minneapolis, the Center for Urban and Regional Affairs at the University of
Minnesota in Minneapolis, the Nonprofit Center in Milwauke, The Providence Plan, and the Regional Housing
and Community Development Alliance in St. Louis.
58 Examples include: the Polis Center at Indiana University-Purdue University, the Urban Strategies Council in
Oakland, and Community Link in Sacramento.
59 Such as the Polis Center at Indiana University-Purdue University Indianapolis
60 Such as the Community Research Institute at Grand Valley State University in Grand Rapids
61 Such as the Urban Strategies Council in Oakland
62 Examples include: the Urban Strategies Council in Oakland and the Nonprofit Center in Milwaukee
63 Examples include: the Urban Strategies Council in Oakland and the Nonprofit Center in Milwaukee

100
MetroGIS, they better serve society’s needs...”
Institutional
collaboration,
grassroots
participation
The Piton Foundation “uses information and communication to bring people
in Denver closer…through a deeper understanding of the collective
challenges they face.”
“By layering data from many sources”, Children’s Optimal Health in
Austin, “can help communities … unearth opportunities for collaborative
change.
Communication,
influence,
advocacy
Staff members of the Greater New Orleans Community Data Center
“believe that reliable, targeted data can help leaders create positive
community change”
The mission of Neighborhood Nexus in Atlanta, is “to provide data, tools
and expertise as a catalyst to promote healthy communities…” Staff
emphasize that “visualizing data and telling your own stories with the data
are key.”
Targeting,
efficiency,
decision-making
The Neighborhood Nexus website advertises “dashboard” technology,
which displays and tracks a customized assortment of indicators to help
users determine whether they are spending “limited resources in the right
way.” Similarly, the organization’s asset maps allow users to “compare the
data (i.e. food stamp recipients) to the assets (i.e. grocery stores) and
determine if a gap exists”
The Center for Community Building and Neighborhood Action’s website in
Memphis offers “, all the data needed to drive decision making in your
community
Hypothesis 1 (see page 31) appears correct. The mission statements and webpages
emphasize indicators and the purpose or outcome of system use. However, the causal statements
above rely on implicit assumptions about the benefits of access to information, the use of
101
technology, the decision-making process of individuals and organizations, and the problems
people face in low-income neighborhoods. What is the logical connection between a “data
sharehouse” and “democratic decision-making capacity” (CRI n.d.)? How can using a
technology allow someone to “better serve society’s needs” (MetroGIS n.d.)? Under what
conditions can leaders leverage data to “create positive community change” (GNOCDC)? What
factors contribute to the decision making approach commonly referred to as “data-driven”—
besides data? The rest of this research begins to answer some of these questions.

102
Q2. Who uses NIS and how frequently?
This chapter communicates findings from analyzing NIS logfiles and from interviews
with NIS users and local residents. While there are more educational users, twenty non-profit
organizations, mostly CDCs, use NIS far more intensely.
Overview
Based on logfile analysis, students, faculty, and staff are by far the largest user category
when measured as at least one query per year. As Figure 8 shows below, this group grew
exponentially from just 100 individuals in a handful of institutions in 2006 to nearly 1,200
individuals in 200 organizations in 2009 (displayed in blue). The distant second category, non-
profit organizations, currently includes less than half the number of people but in a larger number
of institutions (displayed in brown). Government users compose the third category with 300
people in 25 different agencies (displayed in purple). While the size of the educational/research
category has plateaued, the latter two categories are still growing slowly. The number of
“citizen” users—people unaffiliated with any of the other categories—plateaued at less than 100
people in 2007.
Refining the measure from at least one query a year to at least one query during each of
six different months produces a radically different portrait of NIS users in Cleveland shown in
Figure 9. These users may issue a query (or more) every other month for example. Users who do
not use the system at least this frequently have been filtered away. The remaining users are not
simply working on a single short-term project that requires data. NIS forms a part of their
workflow. Using this measure, employees in non-profit organizations place in the top category
with 65 people in 20 different institutions. Employees in government agencies place in a distant
second category, three-fifths the size. Users in universities and research institutions fall into a
close third category. In conclusion, institutional employees relying on NIS this heavily compose
a rare but rapidly growing subset of users. In contrast, a negligible and stable number of
individual citizens use NIS this heavily.

103
Figure 8: NIS Users At Least 1 Day Per Year

104
Figure 9: NIS Users At Least 6 Months Per Year (At least one query in six different months
within the same year)

105
Semi-structured interviews with CDC staff, government employees, and a handful of
neighborhood activists support this logfile analysis. As explored more fully in later sections, at
least one staffer in every CDC conducting housing construction, housing rehabilitation, site
assembly, or code enforcement work uses the NST web application. CDC staffers use NEO
CANDO for grant applications that require demographic information.
The top four public jurisdictions with departments using either NEO CANDO or the NST
web application are:
Table 15: Cleveland Area Public Entities Using NIS
# Jurisdiction / Entity # Queries
1 City of Cleveland 16,436
2 Cuyahoga County 5,553
3 City of South Euclid 4,166
4 City of Lakewood 1,615
City of Cleveland employees do not consistently specify which department they work in when
creating a user profile. Based on the available data, the departments of Community
Development, Building and Housing, Public Health, Law, and the Housing Court all use the
system. Interviews confirm that city workers in Community Development and Building and
Housing use the NST system with increasing frequency, but are silent on comparisons with other
departments. The remainder of this section examines how CDC staff members and residents
active in neighborhood-level development issues receive pertinent information.
CDC Staff NIS use patterns
The majority of interviewees at CDCs claimed to use either NEO CANDO or NST very
frequently–or not at all. Frequent use varied from a few times a day to a few times per month.
However, one interviewee described a very different pattern of use. For the common single
property lookups that lead other employees to near daily NIS use, this individual prefers the

106
older tools. He explains why:
“I get the data from the source, from the county auditor's website, from court records on
individuals and properties. I look that up at the source from my favorites [bookmarks] on
my computer. I have my own process and there is no reason for me to change. I did
property research for this organization...[for a long time] before these tools became what
they are now. ...if I'm looking at a few properties, I use my old method.” (#67,
5/15/2013)
The reason for this use pattern is not lack of technical knowledge or difficulty learning new
tools. This user downloads massive amounts of data from NST and loads them into a desktop
GIS three or four times a year. He explains, “we do a lot of property research for land for larger
projects...We do not try to go out and find houses to rehab” (ibid). This means his team is not
constantly looking for opportunities that require immediate research and action like staff in other
CDCs.
Resident activists NIS (non)use patterns
For the most part, residents do not use NEO CANDO and they cannot use the NST
application, which requires employment in a governmental, nonprofit community development,
or research institution. This section provides a mirror image of the next section, which covers—
along with other topics—how CDC employees use NEO CANDO and NST in their work with
concerned residents.
Most residents are not neighborhood activists and contact a CDC only when personal
experience requires such contact. Most often, the resident wishes to express concerns about a
problem property, expand his or her own property—or both. One resident described this last
situation:
“There were two houses next to my house and they were stripped, no windows – all sold
for scrap. I was afraid someone would start a fire. I didn't want kids to play over there.
And it was several years. The current owner is a bank. They never cut the grass or there is
cut grass and paper on the lawn, making a mess. If I want to sell my house – how can I ?
[The city] condemned them. [The local CDC] was instrumental in getting them
demolished. I told [CDC employee] that I wanted to buy the lot. em pleh lliw ]ehs dna[..
,ytreporp eht niatbo fill out paperwork, and it would be a clear title. ]sesuoh eht fo enO[..
.semit lareves dlos saw They would collect rent but not invest in the property. The
owners never lived in the neighborhood. They never had to look at the house or listen to
the renter's loud music. I've lived here 42 years. I like the neighborhood and I like my

107
house. I will now make a bigger garden, a three car garage, fence it in, put in a picnic
table.” (#54, 11/11/2011)
The next chapter describes such contact with residents from the point of view of the CDC
employee receiving the phone call. In short, the employee uses the NST web application to
retrieve information about the property's current owners and ownership history. Therefore, even
a resident who is not a neighborhood activist—but telephones his or her local CDC with an
inquiry—accesses NIS indirectly through the CDC employee on the other side of the line. Some
neighborhood activists have learned to conduct property research on their own.
Most of the neighborhood activists interviewed enjoyed access to a personal computer
and popular office software. While familiar with NEO CANDO, they used the County Auditor's
website more often. They conduct first-pass research on a property before asking a CDC staff
person to continue in more detail. Properties that are newly vacant, poorly maintained, or clearly
dangerous attract their attention. Also, neighbors less knowledgeable about property research
will ask these activists to pursue an investigation, possibly before purchasing and rehabbing a
house. Although able to conduct some degree of research on their own, some activists question
whether the effort warrants their time since CDC employees have greater skill and access to
information. One activist provides this example:
“I've gone online to see if there are back taxes, who owns [a property]. Sometimes my
neighbors call me instead of the CDC for information. But, I’ve started sending email to
the CDC to ask [about properties]. Usually, I go right to the County Auditor’s website. I
have it in my favorite places [bookmarks]. Are taxes current? Are there assessments for
the city cutting the grass? Since I know [CDC staffer] has more access, I’ve been taking
advantage of it. A resident called me and said the people in the beautiful house are gone.
I called [CDC staffer] and he said it is in foreclosure. The people are in Puerto Rico but
they are working with the bank. We are eagle-eye on that property so no one will break
in...with my block club we watch it. Someone from Bank of America came and we came
over to see who they were. When a property is boarded up, it tells thieves that it is
vacant.” (Resident, 3/9/2012)
However, another quiet-spoken resident paints a far darker portrait of violence and resilience on
her street. She describes the events prompting her first property queries:
“[My neighbor] got shot in his driveway because there were people dealing drugs on the
street and having sex in a car. He told the guy to leave. The guy came back and shot
him. ohw pukool ot em deksa dna sretupmoc htiw doog saw I taht was ]robhgien sihT[..

108
.sesuoh ybraen denwo I realize we had to do something. I've been hiding in my locked-up
house and it wasn't enough. I started looking up back taxes on the County Auditor's
website. The website is pretty good. Originally, I found the link to the website in the
Plain Dealer [local paper] or I stumbled upon the Auditor's website. I'm not sure. This
was four years ago. An absentee landlord next door was foreclosed on. The renters were
nice people who were asked to leave in one day. So I helped them. They have rights. I
1)
At the time of this research, her neighbor, having recovered from the attack, was investigating
the feasibility of personally rehabbing nearby homes in order to improve the area.
“If I had someone backing me like [names a particular CDC staffer] – maybe I could do
it. I decided I'm going to try to change things after I got shot. [the CDC staffer] said she
was going to get these houses boarded up and she did get them boarded up. Let's go to
[the CDC] and get these houses demolished so the people aren't selling drugs from
them. ,esuoh eht nwod gniraet fo daetsnI.. can they [the CDC] donate it to me ? I know a
certified electrician and a certified plumber. And it is easy to run a paint brush across the
house. ”.rehtegot semoh eseht tup em pleh dluoc ohw krow fo tuo sdneirf tog ev'I
)1102/8/11 ,tnediseR(
In a different neighborhood, resident activists formed a housing committee at the suggestion of a
staff person at their local CDC.
“I started attending those [CDC] meetings. 8 to 10 people questioned what the situation
was. How many houses were vacant and abandoned? That was the task for the CDC—to
identify vacant property...In March we asked how many houses [were] torn down last
year—only 24 houses. That sparked outrage amongst the committee [members]. [Name
of CDC staffer] felt that as residents we would need to engage and become more vocal.
[We] decided on a public meeting. We basically took the CDC out of it. We didn’t
require them to make the flier [or to] make the appointment with the Director of Building
and Housing. We call ourselves resident-driven.” (Resident, 3/9/2012)
Her assertion that identifying vacant property is a central task of the local CDC not only proves
correct in this particular case, but for nearly all CDCs in Cleveland. Later analysis shows that the
common tasks CDC employees conduct using NIS include identifying vacant property. While
“resident-driven” in terms of calling for, advertising, and running the meeting, the committee
members still relied on CDC employees to provide evidence that the neighborhood was not
receiving its “fair share” of demolitions:
“We created our list of 800 properties and took 25 of the worst of the worst and
scheduled a small meeting with [residents, CDC staffers, and city officials] and went

109
through the properties one by one. We told him [the Director of Building and Housing]
'focus on these'. We could tell him because of NEO CANDO [actually, the NST web
application] they are on the demolition list and through the legal process. Some have
been on the list for four years. I don’t even know what is the full extent of what they
[CDC staffers] can pull up. The limited version [NEO CANDO] is for regular residents.
It seems any question I ask about a property [name of CDC staffer] can go online and get
an answer.” (Resident, 3/9/2012)
The relationship between committee members and CDC staff members is two-way. This
committee's local CDC relies on them to follow updates on the Housing Court and Building
Standards websites and to email testimony for use in Housing Court (#48,300,11/7/2011). Two
different committee members explain that—while more demolitions are required—demolitions
are not always the best answer.
“We found there were houses on the demolition list we didn’t want on the list. They are
in a historic district. They [the city] refused to take them off the list but are working with
developers. There are 16 such houses and 6 on the demolition list. Some can’t be saved.
But we [members of the housing committee] don’t like the thought process in the city—
to spend every penny on tear downs. They are going to force up the value of properties
left [they claim] but new construction is not always good construction. And this city has a
history…we need to respect. Also, what about low income people? [Where will they
live?]” (Resident, 3/9/2012)
“I use Excel to create a statistical formatting of four-year data. The County Auditor's
website is useful so I don't have to bother [name of CDC staffer]. I've looked up maybe
four houses in the last five or six months. I'm advocating for new policies and procedures
in my historic district. We should allow people to evaluate condemnation targets for
architectural value and rehab potential.” (Resident, 11/7/2011)
In order to balance the argument for demolition (fueled by concerns for safety and preserving
home values) against the argument for historic preservation (fueled by respect for place and
concern for the less fortunate), the interviewee uses a simple rule of thumb: “would you let your
mother live in this house?” (Resident, 11/7/2011).
Although committee members rely on the NST web application indirectly through CDC
employees, they question the quality of the data and express concern that the general public
knows so little about the availability of public information on housing in Cleveland.
“The idea, concept, is amazing for NEO CANDO. It was sincere—but only as good as
the info put into it. But Cleveland—what impacts my daily life—our city doesn’t get the
info in there very well. The info at the Building Department is sketchy at best...I don’t

110
think the general public knows that there is vacant house data in them [systems like NEO
CANDO]. People don’t know it [NEO CANDO] exists...I didn’t even know about it over
a year ago—and I had been on the [housing] committee for 3 or 4 months. I think it is a
good thing—but no awareness and [poor] data quality.” (Resident, 3/9/2012)
Neighborhood Connection grants of less than $5,000 each fund many block club
activities and do not require demographic statistics in the proposal. The Cleveland Foundation
has awarded more than 1,600 such grants since 2003, totaling $5 million (The Cleveland
Foundation 2015). Block club leaders hear about the opportunity from CDC staff or from their
City Councilman. Some leaders only ask the CDC to act as a fiscal agent should the application
prove successful. Others also ask for help estimating a project budget and preparing the final
application. The leaders of two successful block clubs explain how much they have
accomplished—not only without using NEO CANDO—but without even using email.
“We left technology behind. We are old-school. We are block clubs without e-mail. We
fund gardening and organize people by letting them be people. Technology doesn't let
people be people.” (Resident, 11/8/2011)
“I have gotten six houses torn down. I got it done with my mouth. I started at the [CDC],
then [list of public officials she contacted]. All the inspectors know me by name. eman[..
of CDC staffer] looks up who owns a house, taxes owed, and gets inspectors. neeb ev'I
living here for 25 years. So I have my own information. I know this woman died four
years ago. The house has no owner. There is black mold on the house, which is near our
orchard...” (Resident, 11/8/2011)
Another resident activist bristled at the accusation that block club leaders or residents
more generally need technical assistance with tools like NEO CANDO. She pointed out that
there are bloggers of all ages in her neighborhood writing about planning issues in Cleveland and
conversing on public access websites like REALNEO64. Upon learning about the NST web
application during an interview for this research, she became alarmed and questioned aloud
whether CDC employees should enjoy access to any technologies or information not granted to
the general population. This research focuses on how CDC employees use NIS and the impact
the systems have on CDC outcomes. It leaves many important ethical questions unexplored
concerning privacy, the distribution of propriety data, and tiered access to information. The next
64 http://realneo.us/

111
section examines in more detail how CDC staff members use NEO CANDO and the NST web
application.
Hypothesis 2a, 2b, and 2c (page 33) are correct. There are fewer NIS users based in
community development corporations, but they use the system frequently. There are more NIS
users based in educational institutions, but they do not use the system frequently. Residents not
affiliated with such organizations hardly use NIS at all.

112
Q3. How do CDC staffers use NIS?
Interviewees described in detail how they used the neighborhood information system. CDC
employees rely on the system for a range of common tasks that overlap with multiple community
development functions (introduced on page 40). The adjective “common” refers both to
frequency (these tasks are executed often) and commonality (the same task serves many
functions). For example, finding owners is a major part of both the rehabilitation function and
the code enforcement function. Discovering that daily computer work in CDCs is divided into
multipurpose, common tasks provides a glimpse inside DeLone and McLean’s “Use” component
specific to community development activity (see original model on page 24 and final theoretical
framework on page 41 ). As the literature review explained, scholars—including DeLone and
McLean—have called for applying the model in new domains, identifying more nuanced
descriptions of use than the raw number of queries, and revealing richer understandings of work
processes that involve information systems. The findings below contribute to filling the gaps
identified by these scholars.
Common Tasks
By allowing CDC staff members to define the tasks they pursued with NIS, I discovered
that they turn to the system again and again to pursue a few tasks common to multiple
overarching development activities. These tasks are tracking vacancy, finding owners, vetting
applicants, and communicating information. Table 16 (below) summarizes how the tasks form
part of multiple larger development functions and the section that follows describes each task in
detail.
Common tasks such as tracking vacancy and finding owners link NIS with CDC
development functions like rehabbing houses and conducting code enforcement. A single
common task overlaps multiple development functions. CDC staff members, for example, must
survey homes on foot to pursue code enforcement. The NIS cannot conduct the survey, but
excels at storing survey results and retrieving an owner's tax address, which a CDC staff member
uses to send a letter warning of potential housing code violations and offering assistance through
various CDC and city programs. The task of finding an owner’s address is not only part of code
enforcement though—it is necessary to acquire residential properties for rehabilitation and

113
sometimes even for grant writing.
Table 16: Common Tasks that rely on NIS
Development
Function
Tracking vacancy Finding owners Vetting Applicants
& Homeowners
Communicating
information
single family
rehab or new
construction
Identify houses for
rehab, empty lots for
new construction
Use owner details in
an acquisition strategy
Identify suitable
new owners,
investors, and
developers based
on their upkeep of
other properties
Share intentions
with coworkers &
city
code enforcement
Know potential
problem properties
ahead of systematic
housing survey
Use owner details to
send warning letter
and offer aid
Identify owners
meriting special
consideration such
as one who
participated in a
paint program last
year but now lost a
job and cannot
afford repairs.
Use owner info
for letter to
owner, store
memos for self
(follow-up),
coworkers, and
city
resident outreach
Answer questions
about vacant
properties and enter
local knowledge
See “code
enforcement”
(triggered by resident
concerns)
See “side lot
expansions”
Answer questions
about problem
properties, enter
local knowledge
grant writing Include vacancy data
in grant application
Include bank
ownership trends in
grant application
?
Is formal form of
inter-
organizational
communication
demolition
advocacy
Opt for demolition of
some vacant houses
Convince owners to
demolish or find other
strategy
?
CDC staff share
their initial
survey with city
and can check
steps city
agencies have
taken
multi,commercial
& assembly
Identify houses for
rehab, lots for site
Use owner details in
acquisition strategy
Identify suitable
new owners,
investors,
developers based
Share intentions
with coworkers &
city

114
Tracking vacancy
The housing rehabilitation, code enforcement, and demolition advocacy development
functions require CDC staffers to carefully track vacancy. For example, code enforcement
requires knowing which properties are vacant and possibly abandoned because these may require
more effort to keep up to code and may turn into legal cases.66 Several other development
65 In some neighborhoods there are so few commercial structures and vacant lots that CDC staffers do not need NIS
for this work.
66 CDC staffers may advocate for the city to declare such a property a public nuisance and then seek receivership
over the property as a step toward rehabilitating or demolishing it (see Ohio Revised Code
http://codes.ohio.gov/orc/3767)
assembly65 on their upkeep of
other properties
foreclosure
prevention
Use proprietary
adjustable rate
mortgage data to
target prevention
efforts—before
vacancy
Use owner details for
door-knocking
?
Share door-
knocking results
with coworkers
for follow-up.
May feed into
vacancy tracking.
Side lot
expansion
Identify empty lots
for side lot program
Lots already in land
bank. See “vetting
applicants”.
Identify suitable
neighbors to
purchase side lot
based on their
upkeep of own
property
Share intentions
with coworkers &
city employees
Planning Examine trends
Use owner details in
acquisition strategy to
implement plan.
?
Create maps and
tables for plans or
download
necessary data.
historic
preservation
Often similar to Single Family, Multi-Family, or commercial development
Other
programming
(paint, etc)
Often similar to code enforcement

115
functions benefit from tracking vacancy, but to a lesser degree. This task often combines
retrieving postal vacancy data67 from NST68 with conducting windshield surveys and entering the
results into the system. One interviewee emphasized the centrality of this task:
“it is extremely important for us to have a count of vacancy to know about our service
area. This is a windshield survey. We literally get into a car and drive and [also] record
severity [ quality of structures]” (#48, 2/21/2012)
A CDC staff-initiated code enforcement action against the owner of a vacant and distressed
house can lead to condemnation by the city. From that point, CDC staff either elect to purchase
the house or advocate for demolition. When CDC staff elect to purchase a house, their ultimate
goal is either (a) to rehabilitate and sell the property to a responsible owner, or (b) to transfer the
property directly as-is to a responsible owner who will—at the very least—bring the house up to
code and pay city taxes. But, the entire chain of events starts with tracking vacancy. The breadth
of data section previously showed that NST eases this task by providing USPS vacancy status,
widely considered by CDC staffers more accurate than water shutoff status for determining
vacancy. Aspects of tracking vacancy directly associated with physical development are
discussed further under that development function.
Finding owners
All the development functions that require tracking vacancy also require finding owners. Indeed,
a vacancy determination usually triggers a search for the owner as one CDC staffer described:
“In our neighborhood it is not so clear [a house] is vacant. We don’t allow boarding on
the outside. I may send an outreach letter [and wait for] 'returned undeliverable' to show
me it is indeed vacant. Then I look on NST and look for alternative addresses for the
owner. )3102/72/3 ,03#( ”
67 The data come from the United States Postal Service under an agreement with the Department of Housing and
Urban Development and include all addresses (both residential and commercial) in the USPS database (see
http://www.huduser.org/portal/datasets/usps.html). However, entries in the NST web application do not appear
to include individual units of apartment buildings.
68 NST provides a Boolean flag for postal vacancy with “0” meaning occupied and “1” meaning either vacant
(inhabitable but not one lives there) or no-stat (under construction or uninhabitable for other reasons) (see the
NST Data Dictionary at http://neocando.case.edu/nst/resources.jsp )

116
Additionally, weatherization programs and paint programs require finding owners when the
problem property is a rental, especially when the tenant is hard to reach or not forthcoming about
the owner's address. Successfully administering these programs in a neighborhood may also
trigger a search for the owners of surrounding vacant structures that undermine the value of the
recently upgraded homes (#3, 11/03/2011).
NST greatly eases the task of finding homeowners by providing both list building tools
and offering the tax address field from the County Auditor's website. In more complex cases,
NST signals whether the county land bank, HUD, or Fannie Mae own the property. It can
provide the name of a purchaser from a Sheriff Sale and links to any court cases involving the
property. An employee at one CDC gushed about the system's impact on this task:
“I took the [NST] training course and learned all the wonderful features and what we can
do as CDC employees. It cuts out all the hard tracking of finding owners—does it at the
click of a button. I can find where home owners live quickly instead of going to three
different websites.” (#10, 11/4/2011)
An employee of another CDC explained how easily he finds owners' addresses for code
enforcement:
“NST helps us handle the [code enforcement] data and immediately spits back owners '
names and banks involved. We send out letters. They are polite and give a warning that
the problems could lead to citations from the city in the future if not corrected. ,42#( ”
)1102/81/01
In a more unusual case, a resident-initiated effort to preserve a historic vacant house required
locating the current owner. After receiving a call from a concerned neighbor, a CDC staff person
turned to NST and found that a bank owned the house in question. Over a period of months, he
convinced the institution's representatives to stop demolition and donate the house to the CDC
(#48, 7/11/2011).
Vetting Applicants
As employees of a nonprofit organization eligible to receive property from the Cuyahoga
County Land Bank and other institutions at a fraction of market value, CDC staff are frequently
approached by developers, local businesses, and residents hoping to acquire land and houses
quickly and cheaply. CDC staff are placed in the unenviable position of determining who will

117
make a responsible homeowner or neighbor and avoiding individuals likely to contribute further
to the crisis of vacant and abandoned homes in the city. One CDC staff person explained the way
she interacts with developers and local businesses:
“When developers want my assistance, I help them as well. I have to determine if they
are responsible. If they are responsible, I help. If not I tell them t'nera sexat ruoy ees I'
'diap . I can use NST to pull a permit and to see if a developer has paid taxes. [Local bank]
is doing a big development. I help them with site assembly. [Local business] hired us to
help with acquisition and land assembly also.” (#51, 11/11/2011)
Residents also approach the CDC for both houses to fix-up and side lot expansions. “The
ultimate result [of a demolition] is our office doing a side lot expansion or a community garden”,
explains a staff person in a different CDC.” He continues, “we screen interested property owners
[using NST]” (#48, 2/21/2012).
Therefore, people working in CDCs employ NIS both for finding problem properties and
for vetting potential new owners. They locate salvageable vacant properties saddled with unpaid
city taxes and code violations and restrict the owners of such properties from receiving any
more—at least through the community development system. Irresponsible owners can still
purchase properties through the private market.
Communicating Information
CDC employees use NST to (a) communicate information with people in the same
organization; (b) communicate information with people in other organizations; and (c) to
communicate with residents.
Communicating with people in the same organization through shared data
Like many other websites, NST provides cloud-based data storage and retrieval. Users
with access to the same records communicate with each other through the system by seeing each
others' changes to shared information. As one CDC employee explains, he and his coworkers are
constantly updating records with the understanding that the data may prove useful sometime in
the future:
“We put data into the system. We have our own weatherization program and we have
houses in the city paint program. We bulk upload that into the system so in land assembly

118
and tax foreclosure recommendations we can see that some owners tried to upkeep their
property [and take steps to help them]” (#48, 1/18/2011)
Communicating with people in other organizations
Staff in different organizations rely on NST to communicate with each other (a) through
shared data, as above; and (b) through formal reports using information from the system.
Inter-organizational communication through shared data
As a cloud-based system, employees in different organizations can share data as easily as
employees in the same organization. When all parties actively look for changes in the
information, the overall effect can be profound, as one CDC staffer describes:
“Before the NST webapp, we would get requests ni seeyolpme ,,ppstseuqer teg dluow
.noitazinagro emas eht ni seeyolpme sa ylisae sa atad erahs nac snoitazinagro tnereffid
)2102/02/2 ,01#( ”.atad erahs snoitazinanahc rof kool ylevitca seitrap lla nehW
But this arrangement breaks down when one party either does not know how to use the system or
does not understand the importance of checking for changes in the information. A CDC
employee questioned why, over the last six months, the city placed three houses on the
demolition list after she had earmarked them in NST for rehabilitation:
“I don’t know if the city is looking at our data. We specify that we want to rehab this
property. Not everyone who works for the city has been trained on the NST web app. So,
maybe they don’t see our intention listed in NST. I’m pretty sure that is the problem—not
everyone at the city is using it. We do want them to condemn properties because it helps
with acquisition.” (#10, 2/20/2012)
Finally, due to redistricting, servicing of some city blocks may shift to another CDC.
Redistricting will trigger funding shifts as well that may cause some CDCs to close. One
interviewee explained the importance of having electronic records that transcend the silos of
individual institutions:
“We are redistricting every 10 years. I would have to exchange paper files with another
CDC. Now they will see notes in the web app. That information stands beyond the
individual CDC. CDCs will go—in Cleveland they will shrink in number...Cleveland
2014 my service areas will change when the new council forms. )2102/11/01 ,03#( ”
Inter-organizational communication through applications and reports
CDC staff members use NIS for grant writing and monitoring report writing. They apply

119
for financial support from public agencies and private foundations. Additionally, some CDCs act
as the fiscal agent for neighborhood block groups and other clubs that cannot receive funds
directly due to lack of an IRS tax status. In these cases, staff members help residents prepare the
initial applications. Nearly all funders require applicants to provide detailed information to
support claims of eligibility and need. CDC staff members use demographic data in NEO
CANDO and property data in NST to build their case for funding. Successful applications then
require staff members to submit monitoring reports on a regular basis.
At the start of this research, the forms for these reports existed completely outside the
NST web application, causing staff members to manually copy information from the system into
the forms. The Department, the CDCs, and NST developers are now working together to
streamline that arrangement. But, for several years CDC staffers expressed both gratitude that
NST and NEO CANDO readily provided the necessary information and frustration at the amount
of duplicate work they performed. One person working at a CDC described a common situation
in which the system proves useful:
“To report for CDBG...I need to know the parcel number, , 10/19/2011)
Another interviewee describes (rather colorfully) how NST helps her staff track and report
private development completed without CDC support:
“Our 'productive use' [reporting category] also comes from private purchases. tihs yloH
dellup yeht ]TSN ni[ ees I dna swodniw wen dedda dna ]esuoh a[ ti dedis enoemos
’esu evitcudorp‘ ni si ti dna stimrep . We can [also] track sales.” (#30, 3/27/2013)
CDC staff members also write reports to document activities subject to the Uniform Relocation
Act (URA) which regulates the acquisition of property and displacement of people on federally
funded projects. A staffer explained how she builds a body of evidence to support her URA-
related claims:
“All NST information is automatically updated. I can print that as proof for the URA
report, which HUD requires when Cleveland Housing Network goes to do a rehab. This
is my tool for proof. I've usually accumulated a few copies to show over time. It pulls
maps from Google and I can see the pictures.” (#10, 11/4/2011)
Complaints about the CDBG reporting system—especially in connection with code
enforcement—are numerous. A seasoned employee describes a high level of redundancy, which

120
includes both reports to the city and letters to homeowners:
“I need to do the paper survey in the car dna then enter information again into NST when
I come back. .. I am [also] writing the letter which is a different task. ssel gnivah era eW
troper ]ylhtnom[ eht etareneg t’nseod ti esuaceb TSN gnisu ekil dluow ew naht elpoep
)3102/72/3 ,03#( ”.diap teg ot etareneg ot deen ew ]taht[
Since her organization downsized, there are simply not enough hours in the day to enter the code
enforcement information into the CDBG form and also into the NST web application (#30,
10/11/2012). Adding urgency to the problem, she points out that CDC service areas will most
likely expand in the next few years due to consolidation, forcing staff in the CDCs that survive to
handle even more housing units. She argues that staffers should be able to enter field code
enforcement surveys directly into the NST web application via a cell phone or other portable
device and that should be sufficient to generate both the monthly report and letters to
homeowners.
Communication between CDC staff members and local residents
CDC employees use NST to direct foreclosure prevention services to residents most at
risk of foreclosure, to provide residents who call-in or drop-in the information they seek, and to
support block club meetings and issue-based committees.
Information targeting with NIS
The NST web application features an “At Risk Factors” category that includes a
subprime lender flag and a high cost mortgage flag69 based on public HDMA data and an ARM
reset date based on a purchased proprietary dataset. Staff from CDCs and Empowering and
Strengthening Ohio’s People (ESOP) joined together to leverage this information to conduct
foreclosure prevention housecalls with homeowners most likely to be at risk of foreclosure.
However, the utility of the information plummeted as layoffs outpaced ARM resets as the
underlying problem. As one individual who works closely with staff in many CDCs explained:
“That [ARM resets] is not the problem now. Now it is based on loss of income—not bad
69 It is unclear what constitutes high cost in these data. In some research “high cost’ is synonymous with “subprime
lender” (i.e. http://www.urban.org/uploadedpdf/411941_highcost.pdf ). However NST has separate flags for
high cost and subprime.

121
mortgages. , 11/8/2011)
Not only does the NIS direct CDC staffers into the neighborhood to speak with specific
residents, the system also helps staffers field questions residents ask over the phone or in-person
at the CDC office.
Fielding call-ins and drop-ins with NIS
All the CDC staff members interviewed receive call-ins from residents requesting
information about a particular house or empty lot. The frequency of these calls varies from
organization to organization from only a couple a week (#43, 2/23/2012) to an average of ten per
week peaking at five on a single day (#48, 2/21/2012). Staff in two CDCs (#10, 2/20/2012 &
#51, 11/11/2011) asserted that they receive more call-ins and walk-ins now than in 2006.
Even in a neighborhood with few functioning block clubs, individual residents will still
call in, as one CDC employee describes:
“There is always one person who calls about vacant buildings. We have a few key people
who are really concerned: ?gnidliub siht htiw ot gniog uoy era tahw' That building ? Did
someone buy that building?' I tell them that I don’t know but I’ll check it out.” (#58,
3/2/2012)
A staff person in a different CDC describes the types of phone calls he receives:
“We have people [residents] that call about vacant homes and we try to do advocacy and
we push foreclosure or demolition...also people call about side lot extensions. I tell
[them] to call me once a month and once [the property] hits the land bank we can move
on it.” (#67, 5/15/2013)
For single properties and focused questions, NST's breadth of information and list building tools
are useful but unnecessary. The County Auditor's website or a commercial product like
Metroscan can suffice.
An employee in one organization meets regularly in her office with local residents. This
practice appears rare but shows how community development professionals and local residents
can employ a neighborhood information system in joint decision making.
“When residents call me. They may come in and I use NEO CANDO with them in the
office. They get comfort from knowing about the properties. owT.. or eerht times a week a
resident will come in and I help them research properties. Sometimes they want to buy

122
and rehab homes. I help them with the research. Sometimes we see there is a loan and a
lien and a lot of trouble with the property they want. So we look for others.” (#51,
10/25/2011)
Communication with residents is not removed from the intra-organization and inter-organization
data sharing discussed previously. Sometimes residents request information about a property
with details in NST of complex provenance. An interviewee provides an example:
“The web app has custom fields. Whatever we do in the office we plug them into the
custom fields. I get a phone call from a resident that there are squatters. I call the city and
plug in the complaint into a custom field. I plug my redevelopment interest into the
house. Then [a coworker] gets a complaint by a neighbor and I can tell the residents that
[the coworker] is working with the owner to redevelop the problem property.” (#48,
2/21/2012)
The information a CDC staff person retrieves from the system and provides to a resident may
have originated with another staff person, another resident, or a city employee.
Supporting block clubs and committees with NIS
Several CDCs support active block clubs and housing committees by communicating
with them about information stored in NIS. This use of the system is discussed in the next
section, which examines different combinations of development strategies and functions.
Development Strategies and Functions
Interviewees reported many instances of applying development strategies to different
development functions, some of which require NIS use for the common tasks outlined
previously. A numerical overview of these interview results is available in Appendix A (See
page 205). The Oxford English Dictionary defines a strategy as “the art of projecting and
directing the larger military movements and operations of a campaign” or—in non-military
settings—“a plan for successful action based on the rationality and interdependence of the moves
of the opposing participants”. This research defines a development strategy as one of four
overarching approaches CDC staff members may adopt in pursuing community development:
leadership strategy, organizational development strategy, organizing strategy, and organizational
collaboration strategy (see page 44). In this research development functions are five distinct types
of work pursued by many CDCs: grant writing, construction and rehabilitation of property, code

123
enforcement, demolition advocacy, and other programs (see page 44). For example, an
organizational development strategy fits the grant writing development function as a CDC strives
for more resources with which to address neighborhood problems. However, a leadership
strategy or an organizing strategy are viable alternatives for the same development function,
premised on growing stronger block clubs and local organizations to address the same
neighborhood problems. The pairing of strategy and development function determine—in part—
whether and how a given CDC uses a neighborhood information system. Several common
configurations are detailed below.
The organizational development strategy and grant writing function
At least one staff member in every CDC targeted in this research employs NEO CANDO
for grant writing. The system provides access to city administrative information and census data
arranged by locally used geographies, such as statistical planning areas (SPA)--which serve as an
official proxy for neighborhoods. Grant writing, when successful, builds resource capacity.
One CDC employee described using NEO CANDO on a large grant for the Hershey
Foundation of Ohio to find the number of home owners versus renters in a section of her service
area (#65, 12/6/2012). CDCs staffers also help block clubs apply for funding from the city and
from private foundations. Such applications usually do not require quantitative evidence to
support assertions of need. However, should a funder require such evidence from a block club, a
CDC staffer would seek the desired information in NEO CANDO. Figure 10 illustrates the
relationships between NIS, CDC, block club, and funder:
Figure 10: Relationship of NIS to Grant Writing by CDC Staffers

124
The next section addresses the various connections between a CDC and local residents in more
detail.
The strategy of public participation and the function of community organizing
Staff from fourteen different CDCs provided detailed information about programming
that involve frequent interaction with residents. Staff in ten of those CDCs commented also on
the role (or lack of a role) of NIS in those interactions. In a few cases, resident contact occurs as
part of a formal “community organizing” or “community outreach” program. However, more
often it occurs as part of other CDC programming, underscoring its position in the model as a
strategy whether interviewees refer to it as “organizing”, as “participation” or as something else.
As one interviewee explains:
“Community organizing – [is] always part of the job. It may be a part of whatever
program I’m working with at the time and can stand alone as well. Everything branches
off of organizing. It takes community organizing to make programs succeed. ,85#( ”
)2102/2/3
Participation can involve resident call-ins and walk-ins, block club activities, and service-area
wide issue-based committees. In order to stress community organizing as a function rather than
public participation as a strategy, this section stresses concrete programming and activities such
as block clubs and issue-based committees. Block clubs tackle many issues while a given
committee focuses on only one or two issues. NIS—when involved at all—provides information
for a CDC staffer to share with people living or working in the service area or stores information
a CDC staffer receives from people living or working in the service area.
Table 17 (below) provides an overview of development functions that involve contact
with residents and NIS use by the number of different organizations matching the criteria. For
example, staff members of three of the ten organizations who discussed contact with residents in
detail, described demolition advocacy programs and two of them explained the role of the
neighborhood information system.
Table 17: NIS Use Supporting Public Participation within Development Functions
Development Function
Staff from this number of CDCs
discussed this function
Staff from this number of CDCs
use NIS for this function

125
code enforcement 4 4
demolition advocacy 3 2
grant writing 2 1
single family new/rehab 2 2
other programming 2 2
side lot expansion 2 2
foreclosure prevention 2 2
historic preservation 1 1
Planning 1 1
Code enforcement and demolition advocacy were the most common development functions to
involve residents, often in block club meetings. The following section describes the role of NIS
in supporting public participation within these development functions.
Block Clubs
Community organizing ties into multiple other development functions such as demolition
advocacy and code enforcement. For many CDCs, this is clear from the connections between
block clubs and programmatic activities. As interviewees from two different CDCs explain:
“Block club organizing is about quality of life issues...We do community building around
re-use. Try to get those houses demolished, which leaves vacant land for yard expansions,
community parks, and community gardens.” (#65, 12/6/2012)
“Community outreach includes community organizing work with the block clubs and
responding to concerns, which feeds into the new code enforcement work. ,42#( ”
)1102/81/01
However, public participation is not always as well integrated with programmatic
activities. An interviewee in a third CDC does not promote “issue organizing” or turn block club
member concerns about vacant and abandoned housing into an “organizing tool” (#64,
11/28/2012). In this case, block clubs are not part of a strategy of public participation but
constitute a separate (siloed) development function that does not require NIS—underscoring the

126
weakness of deterministic claims about information technology. Although staffers in the same
CDC use NIS for housing development and code enforcement, nothing about the technology
forced them to adopt a more integrated and engaged approach to block clubs.
Staff in two CDCs (#15, 12/3/2012 and #65, 12/6/2012) asserted that they have stronger
block clubs now than in 2006 in terms of number of clubs or frequency of meetings. Staff in two
CDCs (#42, 11/10/2011 and #11, 12/3/2012) asserted that their local block clubs or outreach
program had weakened since 2006. Changes in the level of block club activity should not be
automatically attributed to CDC staff priorities and skill. As one CDC staff person explains:
“Block clubs grow and shrink based on concerns on the street. ock clubs grow and
shrink based on concerns on the street.ubs are victims of their own success. s are victims
of their own success..” (#49, 2/27/2012)
One neighborhood, for example, did not have block clubs until 2007, when residents
became more concerned about crime (#15, 12/3/2012). Many interviewees report staffing
problems around organizing including relying solely on AmeriCorps VISTA interns from year-
to-year and organizers being routinely assigned non-organizing tasks (#9, 2/8/2011). One
interviewee described his CDC's organizer as “well rounded” because she does “accounts
receivable, payout, and managing neighborhood groups...Always more than organizing”.
Another interviewee, sighing, said that after losing a dedicated outreach person, “we do what we
can” (#11, 12/3/2012). The role of NIS within community organizing varies widely. The staff in
one CDC regularly provide every block club with a printout of problem property addresses that
shows “who owns it, bank, [and] taxes” (#53, 11/11/2011) while staff in another CDC will only
occasionally use the NIS to “share [data] with the community to better identify area needs...that
we can organize around.” (#25, 2/3/2011). Other CDC staffers report never using NIS with block
clubs.
Several interviewees described situations about which data are not necessary, do not
exist, or take a tangential role in addressing neighborhood problems. The leaders of two of the
most successful block clubs in Cleveland hardly touch the computer or request data at all. They
rely on staff at their local CDC to help with applications for funding from the city and from
foundations. Another interviewee put the need for hard data into perspective, a CDC staff person
explained that “statistics don’t affect the [block club] issues . If the [exact ] poverty rate is 20% or

127
25% it won’t affect the issue.” (#49, 2/27/2012)
Staff members in some CDCs face gang and drug-related neighborhood problems. The
NIS addresses these problems only indirectly by facilitating research on vacant structures used
for crime. These staffers focus on more face-to-face community building rather than more data.
“We were getting calls from three streets, drug ridden, full of abandoned housing—
gunshots. I had a drug dealer pull a gun on me three months on the job. xis evah eW...
,sbulc kcolb three active. We have a Christmas event—and no one has screwed with the
tree yet. Even a local drug dealer says 'thank you for making the neighborhood nicer'.
NEO CANDO is good for capturing data for repeat problems in homes. I’d like to use it
more. But our staff is shrinking. We do a lot of door to door that doesn’t require the
computer. )2102/11/01 ,03#( “
Committees are another community organizing tool.
Committees
A number of CDCs organize committees to bring together residents from neighborhoods
across the service area to discuss and take action on shared problems. Staff and residents created
the housing committee introduced in the previous section (Question #2: Who uses NIS and how
frequently). They did this to pursue “demolition advocacy” because the ward, according to their
research, “was not getting its fair share [of demolitions]” (resident, 11/7/2011). By shifting some
responsibility from CDC staff members onto resident volunteers, such committees can make
priority-setting and decision-making more democratic. One staff member explained that before
the formation of this committee, the decision to prioritize one demolition over another was
entirely his—and he did not even live in the service area (#50, 11/7/2011). Now, he provides the
committee with information about problem properties and demolitions from a number of
sources—especially from the NST web application. I discuss this example more fully in answer
to Research Question #4, which concerns political capacity building (see page 133).
While block club leaders and local committee members may request information from
their CDC, they often do not know where the information comes from. In only two interviews
did a CDC staff member report that local resident activists were aware of the NST web
application.
The physical development strategy and the housing rehabilitation, code enforcement, and

128
demolition advocacy functions
Housing rehabilitation
Thirteen interviewees from nine different CDCs discussed the rehabilitation of residential
housing and all reported using the NST web application and receiving a benefit from the system.
Five interviewees from three different CDCs provided evidence to support this claimed benefit.
Like any modern database, NST excels at identifying records that match particular
criteria and looking up additional details about records of particular interest. In the context of use
by CDC staffers, a record represents a property with a unique parcel number. CDC employees
use this information to decide whether to purchase a house to rehabilitate or—less frequently—a
vacant lot on which to build new. Interviewees explain how the common task of tracking
vacancy (and problem properties more generally) fits within the physical development function
of CDCs:
“I can create a spreadsheet [in NST] to locate the ' low-hanging fruit'. The legal situation
of some homes is a mess. They are stuck. I can determine which properties are bank
owned and easy to acquire.” (#51, 10/25/2011)
“I’m so excited about the new [NST] web app. I do a lot of land acquisition. To see how
we can acquire new properties… ] tremendously. )2102/32/2 ,34#( ”
“[We] utilized law school fellows to research [with NST] over 300 distressed properties,
ses…” (#5, 02/21/2012)
NST differs from other public websites by providing a single interface for data from thirteen
different city and state agencies, aligning data from different agencies and also allowing CDC
employees to enter their own data and notes. In some CDCs, the same search criteria inform
multiple development functions. For example, a problem property with clear title that triggers
code enforcement activity may become a CDC acquisition target in organizations with a “fine
line between code enforcement and acquiring property” (#51, 10/25/2011) but not in others (#10,
2/20/2012). Figure 11 shows the relationship between CDC, NIS, and various development
stakeholders.

129
In this figure, the development stakeholders are the two land banks (county and city), a given
CDC, developers, business owners, and residents. The blue lines show that CDC staff members
pursue three common tasks using NIS within this development function:
1) They track vacancy to identify houses and lots suitable for development
2) They vet applicants to determine which developers, business owners, and residents are
priority matches for the available houses and lots based on the physical condition and tax
status of the applicants' current properties
3) They communicate information from the tracking and vetting processes to coworkers and
to staff in other organizations.
The green lines show that funding for houses and vacant lots flows from developers, business
owners, and residents to the CDC and from the CDC to the land banks. The purple lines show
that property title flows from the land banks to the CDC and from the CDC to the buyer. Staffers
may add a rider to the property title that allows the CDC to reverse a sale should a developer not
meet certain responsibilities by a deadline.
While grounded empirically, the diagram is only a model and—like all models—is a
simplification. CDC staff members know their neighborhoods well and carry a mental map of
vacant structures and knowledge about which local residents and business owners would likely
Figure 11: Relationship of NIS to Property Transfer and Rehab by CDC Staffers

130
make responsible buyers and which would likely not. Data—even when available—do not
necessarily drive every step in the development process. They may help staff members pursue
past decisions based on gut intuition or sentimentality. In these cases, decisions are not driven by
data but followed with data. As one CDC employee describes:
“We didn't locate the house through NEO CANDO or the web app. A staff member saw a
person working on the house. They were going to flip it. We decided better we should
buy it. We then used the web app to find the owner of a nearby house that needed to be
demolished.” (#17, 10/19/2011)
The above quote forms part of the vignette of “Lisa Smith” provided in the introduction to this
research. The threat of an investor hoping to flip a property can, understandably, trigger an
emotional response to protect the neighborhood. In this example, CDC staff members identified
the rehab target through serendipity and only later employed data—and indirectly at that—
through another development function, demolition advocacy of a nearby eyesore.
Code enforcement
The City of Cleveland's Building and Housing Department partnered with CDCs to
address problem properties and to catch potential problem properties early. According to the
partnership, Concentrated Inspection Areas. dneps ot detcepxe era sreffats CDC two months per
area and complete the whole city every three years. CDC staff do not have certification for
inspections from the State of tate of are allowed to do an initial less formal inspection.
ygetarts tnempoleved lacisyhp a htiw tnemecrofne edoc eusrup dnalevelC ni sCDC ynaM
sa yltcerid dna ylkciuq sa pihsrenwo gnizilibats dna kcots gnisuoh eht gnivorpmi no desucof
a ro ygetarts pihsredael a hguorht ksat siht hcaorppa ,revewoh ,sCDC wef A .elbissop
,55#( ”.snoitcepsni eht ot tuo emoc“ ot stnediser lacol gnitivni ,ygetarts noitapicitrap ytinummoc
)1102/12/01
Demolition advocacy
In some neighborhoods, advocating for the city, county, or current owners to tear down
dilapidated structures is a major part of community development work. One CDC staffer
explained that
“Our neighborhood is distressed. It is not about rehabs—these houses are done. If there is

131
a wind they will come down… residents] a evah t’nod I' backhoe eht nwod kconk ot[ '
)2102/2/3 ,85#( ”.]flesym gnidliub
In these parts of the city, CDC employees and—in a few case—residents advocate for their “fair
share” of demolitions (#61, 4/17/2012) or opportunities to expedite the demolition of a particular
property. A staff member at a different CDC describes finding such an opportunity using the
NST web application:
“There is a Cuyahoga County Tax Auditors website. But, it would only show whether the
owner was behind on taxes or whether it was in foreclosure. eht swohs ppabew ehT..
.selas ffirehs ni neeb sah esuoh eht semit fo rebmun After two sheriff sales with no
purchasers, the county can take ownership and demolish. If not for the webapp, we would
not be getting this house demolished until 2013. The city says they will demolish its log
of houses before 2014, without giving specific dates for specific houses. The county
moves faster and will give a specific date. We believe this house will be demolished
before Nov 30th [2011].” (#17, 10/19/2011)
The description shows how the breadth of information in the NIS immediately opened up an
opportunity that would have taken more time to investigate and may have remained overlooked
entirely.
Hypothesis 3a (page 34) appears correct. NIS does not guide CDC staffers toward
particular types of community development work or toward a particular workflow. The
descriptions above suggest that CDC staffers use NIS to pursue the work they were doing before
access to the system. Hypothesis 3b (page 35) appears largely correct—but not completely
correct. While many CDCs focus on the physical development strategy through housing
rehabilitation, code enforcement, and demolition advocacy—some pursue public participation.
As the next section shows, staff in one CDC used the public participation strategy to effectively
strengthen demolition advocacy.

132
Q4. Does NIS improve public participation and, if so, what factors mediate the
improvement?
In this research, public participation is defined as a key component of political capacity in
accordance with Glickman and Servon's (1998) work.
Political Capacity
NIS contributes to political capacity building only in CDCs in which staff use
information to pursue two capacity building needs, community participation and political
leverage70. The research revealed only one effective arrangement, in which CDC staff provided
NIS-derived lists and tables to resident housing committee members (an instance of community
participation) who employed the information in a neighborhood meeting (another instance of
community participation) with key city officials present—resulting in political leverage. As
discussed at the end of the earlier section on strategies and functions (starting on page 124), the
strategy of public participation is most commonly associated with the function of community
organizing. Staff in one CDC helped to organize a resident housing committee and provide
committee members with information about local housing conditions and demolition rates. The
information angered many residents, who believed the city was not giving them a “fair share” of
demolitions. They organized a neighborhood meeting and invited city officials. One official who
attended many of the meetings commented on their approach:
“Everyone feels they are not receiving their fair share [of demolitions]...The bottom line:
citizens have a right not to have blighted, unsafe structures next to them, behind them or
on their street. This Housing Committee did an extraordinary job researching and
documenting the need for accelerated action.” (#61, 4/17/2012)
He estimates that the pace of demolition increased in this CDC's service area since the
committee's formation and claims that the detail-oriented accounting and prioritizing of
properties catalyzed action. It is not uncommon for CDC staff members or resident activists to
count the total number of problem properties in a neighborhood and approach Building and
Housing employees to argue for more demolitions. But, the need always exceeds the city's
budget and prioritizing tens of thousands of potential targets takes time. He explains:
70 See Table 1 on page 13 for an overview of the capacities and capacity building needs.

133
“My experience...is such that neighborhoods with plans and strategies help focus and
accelerate demolition activity...The research reinforced the need for demolition...But that
reinforcement exists in many city neighborhoods. It was the focus [of this group] on
specific properties that has helped focus my Department with results accelerating.” (#61,
4/24/2012)
Committee members' attention to individual properties includes both demolition and
historic preservation, a rare combination in Cleveland and one that city representatives respect.
The same official explains that demolition priorities are necessary, but should not “represent a
top-down approach from the Department’s perspective” but include “neighborhood strategies
and input” (#61, 4/24/2012).
Although NIS contributed to political capacity building in this particular example—it
could not have done so if CDC staff members did not decide to pursue the function of housing
rehabilitation with a strategy of public participation. Without this decision, there would not have
been a housing committee of resident activists with the power to vote in city elections. The NIS
information would have been politically less effective remaining in the hands of CDC
employees, dependent on the city for CDBG funding. A poet and playwright once wrote that a
key difficulty in leveraging the power of accurate information, is judging “in whose hands it will
be effective” (Brecht 1966:133). The staff in this CDC judged well. The staff in other CDCs did
not judge as well—or did not attempt to build political capacity through NIS. Hypothesis 4a
(page 36) appears largely correct—but not completely correct. While staff in nearly all CDCs
opted not to use NIS to increase public participation—staff in one CDC did opt to use NIS to
increase public participation. Hypothesis 4b (page 37) is incorrect. Staff in this one CDC were
successful. NIS helped them to increase public participation. The following section examines the
impact of NIS on the other capacities: resource capacity, organizational capacity, programmatic
capacity, and network capacity.

134
Q5. Does NIS improve CDC capacity and, if so, what factors mediate the
improvement?
This section provides qualitative findings regarding capacity building separately for each sub-
capacity. Quantitative finding for neighborhood rehabilitation tasks, which fall under
programmatic capacity, are also discussed.
Resource Capacity
Resource capacity reflects the ability of CDC staff “to increase, manage, and sustain
funding” (Glickman & Servon 1998, 506). While the capacity building framework contains five
resource capacity-building needs (see Table 1 on page 13), this research focuses on only two,
long-term operating support and development capital, as expressed in grant writing activity. This
focus reflects both the urgency with which interviewees’ write grants to fund CDC programming
and the methodological challenges of pursuing some of the other capacity-building needs.
Balanced portfolio risk, for example, would be difficult to assess without full access to an
organization’s financial records. Narrowly defining and measuring this sub-capacity leads to
both mono-operation bias (page 188) and mono-method bias (page 188).
Twelve interviewees from seven different CDCs discussed grant writing and only one
person denied using NEO CANDO for grant writing. This individual only applies to grants that
do not require detailed demographic data about the population to be served. Two other
interviewees from different organizations acknowledged that some grants do not require such
detail, but they use NEO CANDO when applying to grants that do require such detail.
Widespread adoption suggests that users prefer NEO CANDO to national sources, such as the
U.S. Census website, which lacks locally defined geographies like wards and statistical planning
areas (a proxy for neighborhoods) and to the websites of local agencies, which utilize different
interfaces.
Most interviewees had either been using the system since they started writing grants or
could not clearly recall any previous experience. Only a single interviewee could persuasively
compare grant writing with NEO CANDO with grant writing without NEO CANDO:
“I went to grad school at Case [Western Reserve University] so I have always used NEO
CANDO. We used to have to get info from school districts and police departments before
NEO CANDO had that data. I think writing grants with NEO CANDO takes less time. I

135
don't know if it makes applications more successful. We are writing more grants—but
our needs are greater too. We are also more involved in green space planning, playground
design, parks design. [Now] we spend less time researching statistics, more time on other
projects.” (#65, 12/6/2012)
A single description of previously having to acquire data from school districts and police
departments does not provide a clear picture of the impact of NIS on resource capacity. The user
quoted above suggests that using NEO CANDO does not result in better grant applications or
even more grant applications because staff reallocate time saved using the technology to
programmatic efforts such as green space planning. This suggests capacity building occurs—if at
all—via breadth of activities rather than quality or quantity improvements in one activity. While
Cleveland offers a critical case for NIS in terms of the strength of the data system and the
development system, the longstanding practice of the latter using the former in grant making
raises a measurement problem. Few practitioners working in CDCs remember their previous way
of looking-up statistics for grants well enough to offer a convincing comparison.
No interviewee claimed that NIS use led to more grant applications, better applications,
or more funding—and one interviewee actually reported diverting time saved in grant writing to
other pursuits rather than to additional grant writing. Therefore, the qualitative data collected
does not provide any evidence that NIS builds resource capacity. Without such evidence,
establishing a quantitative relationship between more NIS use and more grant writing or more
funding—even if possible—would likely only be spurious.
Organizational Capacity
Organizational capacity reflects how “staff, boards of directors, and others carry out the
functions of nonprofits” (Glickman & Servon 1998, 512). This includes coordinating work
efficiently to achieve more with available resources (ibid). In their earlier paper (1998), the
authors place the use of “management information systems” (MIS) within two organizational
capacity subareas. They claim MIS will yield “increased efficiency and effectiveness” within
fiscal management and will “control costs and ensure quality and affordability of projects”
within project management. (ibid, 514-516). In their later paper (2003), the authors employ a
different term, “financial information systems”, and place it within a different capacity
altogether—programmatic capacity—which will be addressed in the next section.

136
The interviews in this research suggest that neighborhood information systems have yet
to build organizational capacity, but may do so in the future in certain situations. The increase in
“efficiency and effectiveness” that Glickman and Servon expect may not have occurred because
information systems cannot produce these outcomes without corresponding changes in decision-
making process that take better advantage of information system strengths. The discussion
section on page 190 provides recommendations for adding NIS use to Heath and Heath’s (2013)
decision-making process, which seeks to mitigate common cognitive biases when addressing
personal and organizational challenges. An important part of their process focuses on widening
the frame of opportunities, which requires carefully noting and returning to those opportunities at
the appropriate time. Employees in some CDCs have started to use NST’s custom fields to make
these sorts of notes and reminders.
The claimed benefits of NST's custom fields to the common task of intra-organizational
communication make logical sense. But, the staff members of only a few CDCs report using
these custom fields and starting to do so only recently. Eventually though they may coordinate
work more efficiently, relying on each others' stored notes to guide their work, saving time by
avoiding duplicate effort and past mistakes and potentially even yielding better decisions. While
face-to-face discussions, paper notes, and emails all allow the exchange of information, only the
custom fields allow the exchange to occur within the same workflow as—and simultaneously
with—official property data. The NST interface facilitates a durable connection between human
activity (a phone call with a resident, a decision to rehabilitate)—and a specific parcel.
Glickman and Servon note that CDC staff “must be of appropriate size, talent, and
structure” but that “long hours, low pay, and inadequate fringe benefits contribute to a high
burnout rate among CDC staff” (ibid). The CDC staff members pushing for the widespread use
of custom fields in their organizations are young (definitely under 40 years old, likely under 30
years old), computer savvy, and have graduate degrees. While well-poised to use NIS, these staff
members may overvalue the technology and undervalue Glickman and Servon’s reference to
“structure”—the organizational changes necessary to build capacity, including build capacity
through technology. In interviews, these staffers expressed a desire for “data-driven” decision-
making more often than older staff members. The problems this raises are discussed in the
discussion section (page 190). These individuals also work in CDCs with an above average

137
number of full-time employees. The size of the organization makes sharing information between
staff members especially necessary and the NST web application may allow this information to
help in the future—possibly even after substantial employee turnover.
Programmatic Capacity
Assessing programmatic capacity building through neighborhood information systems
requires reviewing the concept of net benefits in the DeLone and McLean framework. Net
benefits in the 2003 framework encompasses both individual benefits and organizational benefits
from the original 1992 framework. Individuals use technology and their aggregate benefits
accrue to the organization. Interviewees widely reported experiencing a particular individual
benefit from NIS—time savings. This section details the reason for time savings at the individual
level and the form time savings takes at the aggregate (organizational) level. While not using the
terms selectivity and breadth of information employed in this research, interviewees repeatedly
report that being able to quickly select certain parcels for study and retrieve all desired
information from a single source saves considerable time.
Times savings via selectivity
NEO CANDO and the NST web application provide selectivity tools unavailable in other
websites that provide city and county data. For example, the Cuyahoga County Auditor website
allows users to search only by a single last name, single parcel number, single AFN number
(deed number), or single address. In contrast, NEO CANDO and the NST web application allow
users to type or paste in a long list of parcel numbers. As one CDC staffer explained, “if it wasn't
for NEO CANDO and NST, we would literally be typing in each address in the [County]
Auditor's website” (#5, 10/24/2011). Before these tools existed, overwhelmed with the number
of properties she had to research, a staffer in a different CDC once tried calling the city's
prosecutor's office for help—only to be denied (#51, 11/11/2011), which emphasizes the
importance of the current information systems..
Besides allowing parcel lists from outside the system to be pasted-in, NST provides
convenient filtering of more than two hundred property variables to create lists inside the system:
“If we have a model block and we want to know the number of vacant properties, I can
use an address range and show owners, sale prices, tax mailing addresses, whether the

138
owners are local.” (#51, 10/25/2011)
Interviewees made clear that building lists of properties was more vital on a day-to-day basis
than mapping. “[I] do not use the mapping function with NST,” said one CDC staff person, “[I]
write queries and get a table of matches” (#5, 01/18/2011). Even an infrequent user praised these
tools:
“I use the NST web application [only] 3 or 4 times a year to see what is going on [and]
look for opportunities—see if properties have changed hands...I grab large portions of
data for infill housing development [and other projects]...create a list and pull out of the
data—filter out factors—I want to pull out and pull it into GIS.” (#67, 5/15/2013)
The quotes above highlight the importance of working with multiple properties at once with
phrases like “address range”, “table of matches”, “large portions”, and “filter out factors”.
Times savings via breadth of information
Breadth of information contributes to time savings in several ways. If the necessary data
were not online before, then NST saves a CDC employee from making several phone calls or
resorting to even slower means. One interviewee jokes that “[NST] gives me all the data that I
need. I don't need to call all over Cleveland” (#10, 4/11/2011). Even if the data were online
before, having all the information in one place saves time. Switching between websites and
retyping parcel numbers would prove tedious even for websites with identical interfaces.
However, the websites of the Cuyahoga County Land Bank, City of Cleveland Land Bank,
Cuyahoga County Sheriff's Office, and Cuyahoga County Auditor all have very different
interfaces. “[NST] is my one-stop shop for learning about a property”, explains one interviewee,
I used to use different websites, used took more skill to learn” (#51, 10/25/2011). Another
interviewee claimed that the interface for NEO CANDO was more user-friendly than the
interface of another university maintained service (NODICE) (#9, 2/8/2011).
Block club members often ask CDC staffers about houses that appear vacant.
“Organizing staff dealing with vacancy will pull up the [Cuyahoga County] auditor's website.
,35#( ”.egasu retaw ro erusolcerof egagtrom uoy llet t'nseod etisbew s'rotidua eht tuB
gnihtyreve kcart“ ot slanoisseforp tnempoleved swolla noitacilppa bew TSN ehT .)1102/11/11
enO .)2102/11/01 ,03#( ”setisbew 7 ro 6 ot og ton dna sbat eht lla ni poows eno ni ytreporp a no
TSN ,tuB .lecxE ro esabatad sseccA na esu dluoc ew“ segdelwonkca eeweivretni

139
.)1102/11/7 ,5#( ”ycnacav latsop SPSU dna tekcod erusolcerof eht htiw pu senil ]yllacitamotua[
There are shortcomings in the available data however. The NST web application does not
include information about resident complaints to the city about problem properties. “This is
when it gets tricky” explains one CDC staffer (#10, 2/20/12). In theory, the city places board-
ups, condemnations, and—finally—the demolition contractor into the shared system. If the
property a resident calls the city about moves toward demolition, CDC employees should be able
to stop the process if they want to rehab the house.
Measure of time savings
Interviewees consistently report that the NST web application transforms days of work
into just minutes of work:
“I've been here 11 years. I was an intern and property research was my main job. Now I
can do that in 5 minutes with NEO CANDO [likely referring to the NST web
application]” (#51, 10/25/2011). “Where you really save time is processing a whole area.
I would spend a week on a spreadsheet for multiple properties. Now it is just a few
minutes.” (#51, 11/11/2011)
“An intern can get a full list [in NST] with all the columns in 45 minutes. I had to get
addresses by walking the streets. It would take two days” (#42, 10/11/2011). “We would
send out a mass mail and whatever came back was vacant. Now we have USPS vacancy
data in NST.” (#42, 11/10/2011)
“[Before NST,] we would start with GIS and look at all properties. Map out areas...[look
up] back-taxes, liens, take photographs to demonstrate it is a nuisance...[with NST] we
had everything…within five minutes…I couldn't give an exact number of [time] saving.
It would have taken all day!” (#48, 1/18/2011)
Whether time savings translates into increased capacity depends on what CDC employees do
with the saved time. The next sections discuss particular programmatic capacity areas in more
detail.
Housing Rehabilitation
To rehabilitate neighborhood housing, CDC staff members negotiate purchasing a home
in need of repair from a private owner or public entity such as the Cuyahoga County Land Bank.
Then, the staffers sell the property to a developer who brings the structure up to code and ready

140
for sale. This research examines, both qualitatively and quantitatively, the impact of NIS on this
process, excluding the Cleveland Housing Network as a possible developer (see “Finding CDC
property purchases” on page 81).
Qualitative analysis
Nearly half the interviewees discussing using NST in housing rehabilitation provide
detailed comparisons with public agency websites (i.e. Cuyahoga County Auditor), proprietary
databases (i.e. Metroscan), and desktop software (Excel and Access). They argue that NST
allows them to do the same quality work faster. One interviewee summarized the technology's
impact:
“We do not end up with anything new or different. It is mostly a time saving aspect...We
would have done all of our projects regardless of access to NST/NEO CANDO...[But]
even though we may get the same answer—we get it faster.” (#48, 1/18/2011)
Employees in three different CDCs reported reinvesting the time saved by using the NST web
application (or part of the time saved) back into conducting more housing rehabilitation work:
“We're trying to push more properties through rehab. The time savings allows me to be in
the field and survey more. Strong churches and businesses are interested in expanding
business or parking lots...In the past, I'm not sure we could pump out as many [planning]
studies. NST gives us time to target our neighborhood.” (#48, 7/11/2011)
Because it saves me time, I can do more work. The main part of my job is selling vacant
homes. We acquire 50 properties a year. The more I do, the better for the neighborhood. ”
)1102/11/11 ,15#(
“You are able to get more accomplished with the extra time. Saved time allows you to
update data in the app, ]os[ stabilization becomes more a functioning piece. You can get
more accomplished in your neighborhood.” (#10, 4/11/2011)
However, an employee in a fourth CDC, reported diverting the time saved by using the NST web
application to other development functions:
“I'm on the board for [different organizations]...NST frees me up for that. (#42,
10/11/2011) “My time saved with NST is focused on sustainability. We are looking at it
as a neighborhood to create jobs, retrain, GED counseling. Somebody has to take on
sustainability. I'm the champion of sustainability and I meet with heavy hitters in that
area.” (#42, 11/10/2011)

141
Since the majority of CDC employees report reinvesting time saved through the NST web
application back into rehabilitating houses, there should be a relationship between the extent of
NIS use and the amount of homes rehabilitated.
Quantitative analysis
This section reports the results of quantitative modeling of housing rehabilitation by
CDCs in Cleveland. The models include independent variables that interviewees claimed either
guided their decision-making or influenced rehabilitation outcomes. The independent variables
represent neighborhood factors, private consumer (house buyer) factors, and organizational
factors (CDC sub-capacities). The dependent variables represent CDC programmatic capacity
outcomes in terms of the quantity of activity (number of homes purchased) and quality of
activity (percent of purchases transferred and percent of purchases rehabilitated).
In interviews, CDC staffers asserted that there are two interrelated measures of success
for single family rehabilitation activities. When a CDC purchases a property and transfers title to
a new owner who pays taxes—that constitutes success. When a CDC purchases a property and
physically improves it—that also constitutes success. Ideally, both of these outcomes occur
together, but this research addresses them in separate models. Some CDC staff members rely on
NIS to determine whether a prospective buyer already owns property in the city that is current on
taxes and in good physical condition in order to assess whether he or she will steward the
property under consideration responsibly. Table 18 (below) summarizes the independent
variables and their hypothesized relationship with the dependent variables.
Table 18: Hypothesized Relationships between Independent and Dependent Variables
Type Ind.
Variable
Dependent Variables & Hypothesized Relationships
# Purchases Transfer Rate Rehab Rate
Neighborhood
Factors
Owner
occupancy
rate
Positive. CDC staff seek
to attract owner
occupants and therefore
focus on areas with high
owner occupancy
Positive. Prospective
owner occupants will
want to live alongside
other owner occupants.
Owner occupants are
Positive. CDCs or new
owners are more likely
to invest in a house
alongside other owner
occupied houses,

142
already. more likely to pay
taxes than absentee
landlords.
which are presumably
being well-maintained.
Vacancy
rate
Positive. Vacant and
abandoned properties
signal CDC staff to act
and form the raw
material for
rehabilitation.
Negative. Prospective
owners are less likely
to buy in an area with
many vacant and
abandoned properties.
Negative. CDCs or
new owners are less
likely to invest in a
house near vacant and
abandoned properties.
Consumer
Factors
Median
house
sales in
private
sales
Unclear. CDCs receive
homes from the land
bank at under market
cost (suggests no
relationship). But, high
cost signals a
functioning market
without need for CDC
action (suggests
negative relationship)
Positive. High cost
indicates a popular
neighborhood.
Mixed. A CDC may
not invest in an
expensive home, but
new owners may
invest to improve
value.
Number of
private
sales
Mixed. Too few sales
signal a static market
requiring CDC action.
Many sales could mean
a solid market—or
flipping and the need for
CDCs to vet buyers.
Positive. Many sales
indicate a popular
neighborhood.
No relationship. High
sales suggest owner
need not invest and
low sales suggest
owner should not
invest.
CDC Factors
(Capacities)
CDBG
Funding
(Resource
No relationship. CDCs
receive property at a
reduced price. CDC
No relationship.
Transfers require
employees and
No relationship. For
same reasons as
purchases.

143
capacity) boards may limit
purchases. CDBG
money rarely directly
used for purchases.
research—not funding.
Number of
employees
(Organizat
ional
Capacity)
Positive. Identifying
suitable houses requires
computer research,
phone calls, and
legwork.
Positive. Identifying
suitable buyers requires
computer research,
phone calls, and
legwork.
Positive. Rehabbing
requires phone calls,
and legwork and
selecting the right
house initially
(research).
NIS use
(Organizat
ional
Capacity)
Positive. NIS helps
staffers identify more
houses suitable for
rehabilitation.
Positive. NIS helps
staffers check if buyers
paid taxes on other
properties.
Positive. NIS helps
staffers identify good
rehab targets.
Strategic
Investment
Initiative
(SII)
(all
capacities)
Positive. SII members
receive funding and
technical + legal advice
about housing
development.
Positive. SII members
receive funding and
technical + legal advice
about housing
development.
Positive. SII members
receive funding and
technical + legal
advice about housing
development.
Year
Unclear. Learning may
lead to more purchases
over time (positive).
However, success in
early stages may lower
purchases over time.
(The data agree,
suggesting a nonlinear
relationship).
Unclear. Learning may
lead to better decisions
and more transfers over
time (positive).
However, later
purchases have less
time in this study to be
transferred (negative).
Unclear. Learning
may lead to better
decisions and more
rehabs over time
(positive). However,
later purchases have
less time in this study
to be rehabbed
(negative).

144
The sections that follow detail three models, one for each dependent variable. Plots of the
actual values of independent variables versus the estimated values produced by the models
follow each section. Diagnostic plots to assess the models against regression assumptions are
provided in Appendix B (starting on page 214). The residual versus estimate plot for the first
stage of the purchases model shows the dual bands typical of binomial regression residual plots
(Zuur et al. 2009:254). Visual inspection of the normal Q-Q plot for the second stage of the
purchases model suggests that the residuals are not normally distributed, violating a regression
assumption. Repeated efforts to correct this problem failed, including specifying a Poisson rather
than Gaussian error term. Visual inspection of the residuals versus estimate plots for the transfer
rate and rehab rate revealed heteroscedasticity, another violation. All of these problems likely
stem from omitted independent variables, a topic for future investigation (see Chapter 8,
specifically “Extraneous Variance in the Experimental Setting” on page 182). Still, the violations
are not egregious and the models do shed needed light on the capacity building potential of NIS.
The models also serve as a proof of concept for applying the sequential exploratory strategy
described in Creswell (2009) specifically to conduct quantitative analyses that are guided by
qualitative interviews with technology users in order to reveal any impact of the technology on
work outcomes.
CDC Purchases
When potential private owners and for-profit developers view purchasing and renovating
houses in a neighborhood as too risky, non-profit developers like CDCs act to improve the
housing stock and jump-start the market (Rubin 2000). CDC staffers often see themselves as the
developers of last resort. The quantity of CDC purchases therefore both reflect the weakness of
the local housing market and the strength of the CDC to make the necessary purchases. A CDC's
transfer rate and rehab rate, addressed later, serve as proxies for decision-making quality.
Most of the purchase data in a given year are zeros suggesting a two-stage model rather
than a single-stage model (Bolker et al. 2009:11). This research employs a zero-inflated model in
which the first stage captures factors that influence the decision to pursue housing purchase and
rehabilitation at all while the second stage captures factors that determine how many houses
CDC staff purchase. The purchases are recorded as a Boolean (yes/no) in the first stage and

145
resulting estimates down-weight the zeros in the second stage.
Based on interviews, I initially selected the variables below as potentially explanatory of
CDCs home purchases.
Owner occupancy rate: The CDC interviewees expressed a distinct preference for
owner occupants over owners who plan to rent the property—especially over absentee landlords
living in other states. However, one interviewee explained that the preference was strong, but not
absolute:
“In the west side of Cleveland and more stable communities, we are partnering with
rehabs . We want owner occupants…#30, 3/27/2013)
I hypothesize that CDCs will purchase more homes in neighborhoods where owner occupants
tend to live. The owner occupancy rate is also highly correlated (.98) with the rate of single
family detached housing so the variable signals that the neighborhood is composed of the target
type of home. Since interviewees described considering owner occupancy as part of their initial
strategy, it fits within the first stage of the model—and proved statistically significant.
Vacancy rate: CDC staff members focus their attention on vacant residential structures.
Therefore, staffers operating in neighborhoods with higher vacancy rates should be both more
likely to purchases at least one house for rehabilitation (1st stage) and also more likely to
purchase many houses for rehabilitation (2nd stage). However, the vacancy rate is not effective at
predicting whether a CDC will purchase at least one house, with a correlation of only .20 when
purchases are recoded as Boolean. Even CDCs operating in low vacancy areas purchase homes,
perhaps to address a lone problem property, to enter the housing market at market-rate, or to
introduce needed low-income alternatives. Regardless of the reason, the vacancy rate did not
prove statistically significant in the 1st stage of the model. The vacancy rate proved statistically
significant in the 2nd stage of the model at the .05 level when time was excluded from the model,
but only at the .10 level when time was included in the model.
Median house cost in private sales and number of private sales: I initially added these
variables as a precautionary measure in both stages of the CDC purchasing model and they
proved—unsurprisingly—not statistically significant. CDCs receive properties from the
Cuyahoga County Land Bank at far below market rate so the median sales price and number of
houses sold at that sales price are less of an issue.

146
CDBG Funding (Resource capacity): I added this variable as a precautionary measure
in the second stage of the model. CDCs in Cleveland do not use CDBG funding to directly
purchases houses for rehabilitation because doing so triggers additional federal and local housing
quality standards. Moreover, CDC boards frequently limit—to reduce risk—how much the CDC
may pay for a house and how many houses may be in the pipeline at once. CDC directors rely on
CDBG funding to pay staff and losing this funding would likely cause many CDCs to cut
payrolls drastically or shut down entirely. But, CDBG funding does not explain whether CDC
staff make purchases for rehabilitation or how many purchases they make.
Number of employees (Organizational Capacity): For the second stage of the model,
the community development literature argues—and interviewees for this research confirm—that
larger CDCs perform more work than smaller CDCs. Interviewees described identifying houses
to purchase though research (via NIS), walking the neighborhood, speaking with neighbors, and
making phone calls. This work takes considerable time. The number of employees in a CDC
should therefore positively affect the number of purchases (2nd stage). The number of employees
and CDBG funding are moderately correlated (.54) and their inclusion in the same model could
introduce multicollinearity problems and false findings of insignificance (false negatives).
However, both these variables were also poor predictors of housing purchases when tested
separately.
NIS use (Organizational Capacity): CDC staff members report that, prior to the NST
web application, selecting houses to purchase and identifying and contacting owners proved a
time consuming and arduous process. They claim that NIS makes the process less time
consuming and less complex. If the alleged time savings are funneled back into the process of
purchasing houses, CDCs with staff members who rely on these tools should—other factors
being equal—purchase more homes.
Interviews suggest that neighborhood factors and consumer factors drive the fundamental
decision whether to pursue housing redevelopment at all. For this reason, I did not place NIS use
(or any organizational factors) in the 1st stage of the model. If CDC staff members decide to
pursue housing redevelopment, then I reason that NIS use may impact the result. Therefore, I
initially placed NIS use in the 2nd stage of the model.
The NIS coefficient in the 2nd stage was slightly negative and not close to statistically

147
significant. Perhaps more importantly, in all the models built for this research using multiple
statistical techniques—the NIS coefficient was always negative and insignificant when the
number of purchases was the dependent variable. The information NIS provides may convince
users not to purchase the house as often—or more often—than it convinces users to purchase.
Alternatively, time saved identifying homes to purchase may be routed to other CDC activities.
The responses of a few interviewees suggest interaction effects between the number of
employees and NIS use. Larger organizations may receive more benefit from NIS and smaller
organizations may receive less benefit from NIS. One interviewee explained that “I’d like to use
it [NIS] more. But our staff is shrinking. We do a lot of door to door that doesn’t require the
computer. I’ve been honest and said [to NIS supporters] I’m having a hard time keeping all of
my data in there” (#30,10/11/2012). However, no models created for this research showed
statistically significant interactions between the number of employees and NIS use.
Strategic Investment Initiative (SII) Member (all sub-capacities): Membership in
Neighborhood Progress Inc.'s SII includes many perks. Most relevant to the number of
purchases, membership includes funding (resource capacity), and technical and legal assistance
(organizational capacity, programmatic capacity). Additionally, membership includes a better
relationship with NPI, a vital Cleveland non-profit organization with many contacts (networking
capacity, political capacity). SII membership also implies a community development strategy
premised on physical redevelopment rather than—for example—community organizing. I
expected SII members to be more likely to purchase at least one house (1st stage) and more likely
to purchase many houses (2nd stage). Membership was only statistically significant in the first
stage.
Year: The year variable serves as a proxy for multiple unspecified variables, such as
those measuring organizational learning, response to initial rehabilitation successes, policy
changes, and neighborhood factors besides owner occupancy rate and vacancy rate. The number
of CDC purchases increased between 2008 and 2010 and then decreased in 2011. Isolating the
relationship of the known variables requires modeling this nonlinearity using both year and
year2. The regression will assign one term a positive coefficient, contributing to the initial
increase in purchases. The regression will assign the other term a negative coefficient. The latter
term will eventually overpower the first term and decrease the estimate in the final year of the

148
study. To avoid bias due to the particular years under investigation, the years are always recoded
as 1 to 4 (1=2008 and 4=2011). This arrangement proved statistically significant only in the 2nd
stage of the model.
The tables below summarize a two-stage model to explain CDC property purchases. To
illustrate the process of model development clearly and transparently, each stage is divided into
an initial model, which includes independent variables that did not prove statistically
significant—and a final model, which includes only independent variables that proved
statistically significant after all others were removed one at a time, starting with the least
significant (highest p-value). Since multicollinearity can cause significant variables to appear
insignificant and contribute to left-out variable bias, I checked that the variance inflation factor
(VIF) was below the commonly recommended value of five (low multicollinearity) before
removing variables that proved insignificant. The (independent) variables are listed in the first
column. The coefficients for the independent and autoregressive versions of the model are listed
in the second and third columns, respectively. Coefficients with a p-value below .10 (90%
confidence level) are marked with a symbol noting the degree of statistical significance.
The first stage of the model is a logistic regression that uses neighborhood contextual
factors to explain the decision of CDC staff members to purchase at least one property.
Table 19: Zero-inflated Model of CDC Annual Property Purchases--Stage 1 (Binomial), Initial
Version
variables Independent autoregressive
(Intercept) -8.912 *** -9.396 ***
Owner Occupancy
Rate 0.064 ** 0.059 **
Vacancy Rate 0.040 0.054
Median Sales Price -0.011 -0.009
Number of Sales 0.001 0.001
Strategic Investment
Initiative 2.307 ** 2.136 *
Year 4.519 ** 4.692 **
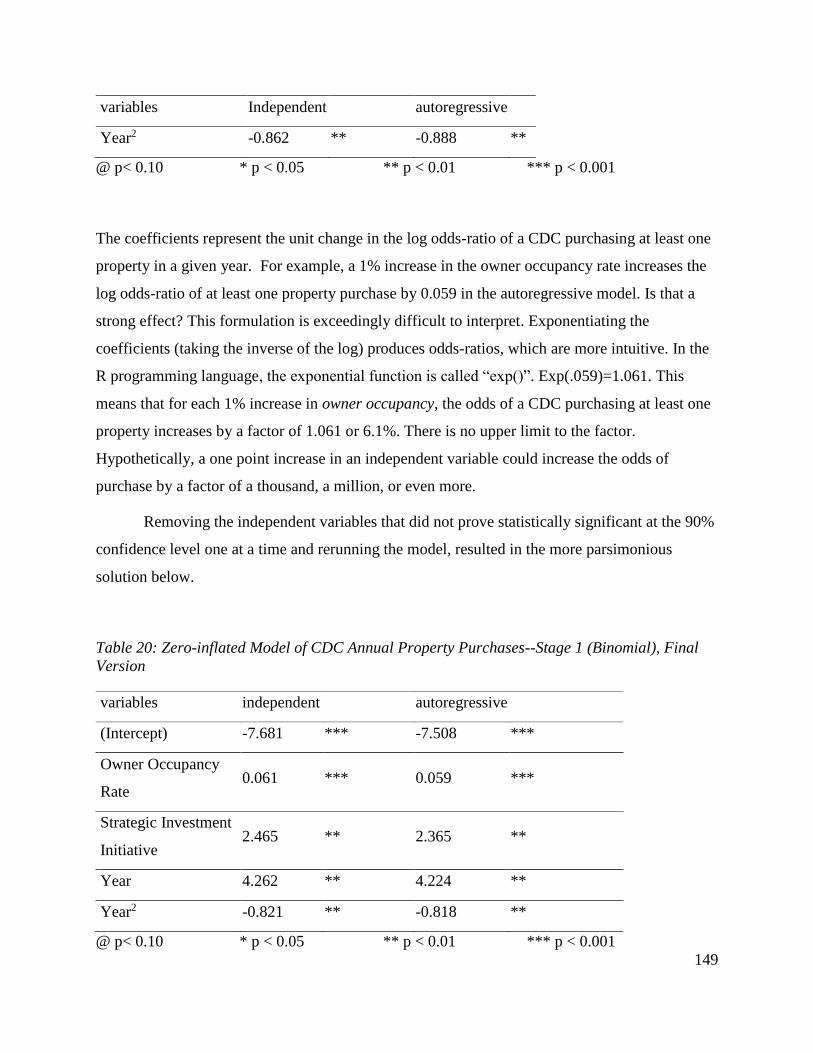
149
variables Independent autoregressive
Year2 -0.862 ** -0.888 **
@ p< 0.10 * p < 0.05 ** p < 0.01 *** p < 0.001
The coefficients represent the unit change in the log odds-ratio of a CDC purchasing at least one
property in a given year. For example, a 1% increase in the owner occupancy rate increases the
log odds-ratio of at least one property purchase by 0.059 in the autoregressive model. Is that a
strong effect? This formulation is exceedingly difficult to interpret. Exponentiating the
coefficients (taking the inverse of the log) produces odds-ratios, which are more intuitive. In the
R programming language, the exponential function is called “exp()”. Exp(.059)=1.061. This
means that for each 1% increase in owner occupancy, the odds of a CDC purchasing at least one
property increases by a factor of 1.061 or 6.1%. There is no upper limit to the factor.
Hypothetically, a one point increase in an independent variable could increase the odds of
purchase by a factor of a thousand, a million, or even more.
Removing the independent variables that did not prove statistically significant at the 90%
confidence level one at a time and rerunning the model, resulted in the more parsimonious
solution below.
Table 20: Zero-inflated Model of CDC Annual Property Purchases--Stage 1 (Binomial), Final
Version
variables independent autoregressive
(Intercept) -7.681 *** -7.508 ***
Owner Occupancy
Rate 0.061 *** 0.059 ***
Strategic Investment
Initiative 2.465 ** 2.365 **
Year 4.262 ** 4.224 **
Year2 -0.821 ** -0.818 **
@ p< 0.10 * p < 0.05 ** p < 0.01 *** p < 0.001

150
For this stage in the model, regression without adjustment for repeated measures produces nearly
the same coefficient estimates as generalized estimating equations. The reason is that the
autoregressive component turns out to be extremely small, with an alpha (α) of only 0.159. This
means that within each CDC, the number of properties purchased in 2008 are estimated as
having a correlation with the number of properties purchased in 2009 of α1=0.159, with those
purchased in 2010 of α2=0.025, and with those purchased in 2011 of α3=0.004. Forcing the
outcome variable into a Boolean eliminates some of the correlation between years. As
hypothesized, the autoregressive element pulled explanatory strength away from the most static
independent variables like Owner occupancy rate and Strategic Investment Initiative in the form
of slightly lower coefficient values. However, the difference was far less than anticipated.
Table 21 assists in assessing the impact of the independent variables on the odds that a
CDC will purchase at least one property. Multiplying the marginal unit change by the range the
independent variable exhibits in the dataset provides an intuitive way to assess its impact. The
range is simply the highest value the variable takes in the dataset minus the lowest value the
variable takes in the dataset. Table 21 provides an interpretation of the each variable’s impact.
Table 21: Interpretation of Stage 1 Model Coefficients using Autoregressive Correlation
Structure
Variables Unit Change in
Log Odds-Ratio
Unit Change
in Odds Ratio
Difference
Between Min
and Max in
Dataset
Max Impact of
Independent
Variable in Dataset
Owner
occupancy
rate
0.059 1.061
72.1
(Percentage)
Odds of purchase
increase by 438% or
by a factor of 4.4.
Strategic
Investment
Initiative
2.365 10.644
1.00
(Boolean)
Odds of purchase
increase by a factor
of 10.6

151
Year
4.224 68.306
4.00
(Study period)
Odds of purchase
increase by a factor
of 273.0
Year2
-0.818 -2.266
42-12=15
(Study period)
Odds of purchase
decrease by a factor
of 34.0
The Year and Year2 variables perform the heavy lifting in this model, affecting the odds
of property purchase far more than owner occupancy or SII. Unfortunately, while statistically
significant, these two variables are theoretically dull. They represent the fallout and slow
recovery from the foreclosure crisis not adequately represented by more precise variables.
Each percentage point increase in the owner occupancy rate contributes, on average, to
only a 6.1% increase in the odds ratio for purchasing property. This translates to Bellaire Puritas
Development Corporation having greater odds than the Historic Gateway Neighborhood
Corporation (holding other factors constant) by a factor of only 4.34, despite having an owner
occupancy rate seventy-one percentage points higher.
SII captures both neighborhood and CDC factors. While SII neighborhoods contain
vacant structures, they also contain amenities. Staff members in Neighborhood Progress Inc.
believe a real estate-based approach to community development may stabilize conditions in these
neighborhoods. Relatedly, staff members in CDCs located in SII neighborhoods are willing and
able to purchase properties and work with contractors and developers.
The second stage models the number of properties purchased, weighted by the estimates
from the first stage, which are probabilities (between 0 and 1) that a given CDC will purchase
property in a given year. This stage includes more independent variables because I theorize that
organizational factors play a large role in determining whether a CDC can capitalize on
opportunities presented by neighborhood factors71. Like many count variables, the number of
purchases is right-skewed and requires a Poisson error term rather than the typical Gaussian error
71 The Year and Year2 variables actually capture city and national forces as well—everything contributing to the
overall trend in the data but not captured elsewhere.

152
term (or Binomial error term from the first stage) to avoid violating regression assumptions—or
at least to reduce the severity of such violations. Table 22 (below) summarizes the initial results
for the second stage of the model.
Table 22: Zero-inflated Model of CDC Annual Property Purchases--Stage 2 (Weighted by Step 1
Estimates), Initial Version
variables independent autoregressive
(Intercept) -3.424 ** -3.048 @
Vacancy Rate 0.071 @ 0.015
Median Sales Price -0.001 -0.002
Number of Sales 0.001 0.002 @
Com. Dev. Block Grant
Amount 0.000 0.002 @
Number of Employees -0.007 -0.026
NIS Total Queries 0.265 -0.397
Strategic Investment
Initiative 0.575 -0.044
Year 2.542 ** 2.707 ***
Year2 -0.515 *** -0.502 ***
@ p< 0.10 * p < 0.05 ** p < 0.01 *** p < 0.001
Using the actual number of properties purchased and down-weighting the CDCs and year
without a purchase (through the stage 1 estimates) drives the correlation estimate much higher
than in the first stage. Within each CDC, the number of properties purchased in 2008 are
estimated as having a correlation with the number of properties purchased in 2009 of α1=0.893,
with those purchased in 2010 of α2=0.797, and with those purchased in 2011 of α3=0.712.
Therefore, the independence correlation structure and autoregressive correlation structure
provide very different estimates. While the vacancy rate proved statistically significant at the

153
90% confidence level in the former, it was not so in the latter. Conversely, number of sales and
CDBG funding proved significant in the latter and not in the former. Since failure to achieve
statistical significance at the 90% confidence level destined an independent variable for
stepwise elimination from the model in this research, the correlation structure employed here
determined the trajectory of model construction. While both final Stage 2 models in Table 23
(below) include the same variables to enhance comparability, they would not have included the
same variables if stepwise elimination had been applied using identical criteria in each case.
Table 23: Zero-inflated Model of CDC Annual Property Purchases--Stage 2 (Weighted by Step 1
Estimates), Final Version
variables independent autoregressive
(Intercept) -2.100 -3.507 *
Number of Sales 0.002 0.002 *
Year 2.492 ** 3.340 ***
Year2 -0.466 *** -0.615 ***
@ p< 0.10 * p < 0.05 ** p < 0.01 *** p < 0.001
All of the CDC level independent variables eventually flickered out of statistical significance
during model building. As with the first stage, the coefficients for the remaining variables must
be exponentiated to ease interpretation.
Table 24: Interpretation of Stage 2 Model Coefficients using Autoregressive Correlation
Structure
Variables
Unit
Change
in Log
Count
Unit
Change in
Count
(as a
multiple)
Difference
Between
Min and
Max in
Dataset
Max Impact of Independent
Variable in Dataset
(Ceteris paribus)

154
Number of
Sales 0.002 1.002 1295
Each private sale increases the
number of CDC purchases by
0.2% for a maximum increase
of 259% or a factor of 2.6
Year 3.340 28.219
4.00
(Study
period)
Each year the number of
purchases increase by a factor
of 28.2 for a maximum
increase by a factor of 112.9
Year2 -0.615 1.850
42-12=15
(Study
period)
Over the four years, the
number of purchases also
decreases by a factor of 27.8.
As with the first stage, the two year (time) variables have a major impact on the overall
shape of the model over the period under investigation. But, they do not contribute anything to
explaining difference between cases during the same year. The number of sales in a
neighborhood does very little to explain why some CDCs purchases many properties and other
purchase few properties. Figure 12 displays the actual data (black solid line) versus the
autoregressive model estimates (gray solid line) and traditional model estimates (gray dashed
line).
On average, the autoregressive model is off by 3.4 purchases. Since many CDCs do not
purchase any property in a given year, calculating the average error as a percentage poses a
problem because the denominator is zero in these cases. If we replace the zero with 0.49 to
indicate the near purchase of one property but the decision not to—the average percentage error
is 275%. Very high. Ignoring the instances with zero purchases altogether, the average error
becomes 4.8 purchases (slightly higher), but the average percentage error becomes only 90%
(much less). This means that the model often estimates that a CDC will make twice as many or
half as many purchases as it actually makes. As Figure 12 shows, the model predicts the number
of purchases of Bellaire Puritas, Westown, and Old Brooklyn relatively well. But, it radically
underestimates high achieving CDCs like Slavic Village and Collinwood Nottingham. There are
likely key variables affecting CDC purchase volumes that did not surface in the interviews or the

155
literature review. Alternatively, the number of purchases CDC staffers make is subject to a great
deal of chance and coincidence that cannot be modeled effectively.

156
Figure 12: CDC Property Purchases and Model Estimates
While Community Development Block Grants are the greatest funder of CDC budgets
nationally, the amount received did not prove explanatory of higher rates of property acquisition.
There are three likely reasons why more CDBG money does not relate directly to more
purchases. First, CDCs can purchase from an inventory of properties at lower than market cost
from the Cuyahoga County Land Bank—so less money is actually required. Second, CDC
governing boards often establish purchasing limits to reduce risk to the organization. Regardless
of the funding available, CDC employees are prohibited from spending more than, say, $5,000
for a house and from having more than twenty houses in production at a time. Third, spending
CDBG money to purchase a house triggers federal housing quality standards (HQS)
requirements and city Green Building requirements. Meeting these requirements increases
rehabilitation costs, potentially resulting in a home too expensive for low and middle income
buyers (or resulting in a home packaged with a subsidy most CDCs cannot afford to offer).
CDBG funding can be both vital to a CDC for paying salaries and not contribute to its property
purchases.
The models provide very little support for the qualitative finding that vacancy drives
purchases. The residential vacancy variable based on the American Community Survey proved
significant at the 90% confidence level using traditional regression, but compensating for
repeated measures removed the significance. Generalized estimating equations with an
autoregressive correlation structure down-weight similar purchasing volumes from the same
CDC instead of attributing them to relatively constant independent variables such as vacancy.
Did Slavic Village staffers continue to purchase at high volumes in 2009 through 2011 because
that is what they did in 2008? Or, did they continue to purchase at high volumes because the
vacancy rate remained high and they saw an opportunity to acquire homes cheaply and sell to
responsible buyers?
The large discrepancies between the actual values and the estimates in several cases—
including Slavic Village—suggest that the model is missing vital information about these
organizations such as important partnerships (outside the Strategic Investment Initiative), the
priorities of the director, and staff training and experience. An older CDC staff person explained
that “there are gaps between someone my age and someone coming out of college regarding

157
using technology” SIGcrA htiw deniart sreffats regnuoy eht fo wef a ,deednI .)2102/11/01 ,03#(
yam gniniart hcuS .)2102/6/21 ,56# ;1102/12/01 ,55#( egelloc ni ODNAC OEN htiw neve dna
neve ro—seireuq SIN fo rebmun emas eht htiw erom hsilpmocca srebmem ffats eseht pleh
.yreuq elgnis a gnittimbus tuohtiw secruos rehto morf noitamrofni etarucca evired
Although there are clearly missing variables, the models are sufficient to argue that using
NIS does not directly result in more purchases. At first glance, this would seem to clash with the
qualitative finding that staffers routinely use NIS when selecting properties to buy and attest to
its usefulness. However, if the system provides reasons not to buy roughly as often as it provides
reasons to buy—a perfectly plausible scenario—then more queries will not yield more purchases.
According to interviews, NIS enables CDC staffers to conduct background research more
quickly and therefore consider more options (see the qualitative analysis starting on page 141).
Therefore, the system may improve programmatic capacity in the area of housing development
by improving the quality of purchases and not the quantity. This research considers two quality
measures, (1) the percentage of purchases transferred to a responsible owner and (2) the
percentage of purchases physically improved
CDC Transfers (Percentage of Total Purchased)
When CDC staff members purchase a house, it usually was vacant and possibly
abandoned. Transferring (usually by selling) that house to a new owner who then pays city taxes
on the property constitutes a successful instance of community development, according to
interviewees. Unlike the number of CDC purchases, which rose in 2009, plateaued in 2010, and
then fell in 2011, the CDC transfer rate zig-zags. Instead of capturing this movement with
complex polynomial techniques, I added the year and year2 with the hope that they would
explain at least some of the variability—but with the expectation that they would not prove
statistically significant and be dropped from the final model.
The transfer rate is a ratio rather than a count and not as right-skewed as the number of
purchases. Therefore, the model employs the same Gaussian error distribution and identity link
function common to traditional linear models. Data rows representing an organization and year
without a house purchase are removed, since only purchased houses may eventually be
transferred or rehabilitated. A transfer rate or rehab rate of zero can occur when a CDC
purchases properties but does not transfer or rehab any of those properties by the close of the

158
research period. The identity link function means that the coefficients do not need to be
transformed before interpretation.
Table 25 (below) summarizes the initial model for the percentage of properties that a
CDC purchased in a given year that are now owned by a person or company current on city
property taxes.
Table 25: Model of Percent of CDC Annual Purchases Transferred to a Responsible New
Owner, Initial Version
Variables independent autoregressive
(Intercept) -1.138 1.948
Owner Occupancy Rate 0.974 * 1.007 *
Vacancy Rate 0.430 0.336
Number of Sales -0.018 -0.019
Median Sales Price 0.996 @ 0.937 @
Com. Dev. Block Grant
Amount -0.006 -0.011
Number of Employees 0.111 0.087
NIS Total Queries 35.799 *** 36.031 ***
Strategic Investment
Initiative -21.449 @ -19.996
Year 5.375 5.241
Year2 -2.921 -2.806
@ p< 0.10 * p < 0.05 ** p < 0.01 *** p < 0.001
A very low estimated correlation (0.125) between transfer rates of the same CDC from year to
year explains the similarly between the independent and autoregressive models. The Strategic
Investment Initiative is the only independent variable that proved statistically significant at least
at the 90% level in the independent model but not the autoregressive model. As with purchases,
final transfer models based on the assumption of independence would have included different

159
variables. The year and year2 did not come close to statistical significance. Stepwise removal of
the least significant variables in the autoregressive model yielded the final models shown next in
Table 26.
Table 26: Model of Percent of CDC Annual Purchases Transferred to a Responsible New
Owner, Final Version
variables independent autoregressive
(Intercept) -7.370 -4.478
Owner Occupancy
Rate 0.816 ** 0.768 *
Median Sales Price 1.215 *** 1.151 ***
NIS Total Queries 17.302 @ 22.143 **
@ p< 0.10 * p < 0.05 ** p < 0.01 *** p < 0.001
The final model includes both neighborhood factors (owner occupancy rate and median sales
price) and an organizational factor (NIS total queries). The estimated correlation between
transfer rates of the same CDC from year to year was slightly higher in the final autoregressive
model (0.348) contributing to different significant levels for the owner occupancy rate and NIS
coefficients.
In the final autoregressive model, a one percentage point increase in the owner occupancy
rate corresponds to—all other factors held constant—a 0.768 percentage point increase in the
transfer rate. The range for neighborhood owner occupancy for CDCs that purchased at least one
property covers 55.6 percentage points. Owner occupancy has a maximum impact on the transfer
rate of 55.6*0.768=42.7 percentage points. This finding reaffirms an earlier one: CDCs operating
in jurisdictions with high owner occupancy rates tend to purchase more houses—and therefore
have them available for sale. The finding also shows that CDCs can locate people who want to
buy such properties and pay taxes on them—likely owner occupants themselves.
Every $1,000 increase in median sales price corresponds to a 1.151 percentage point
increase in the transfer rate. The range for median sales prices covers $91,600. Sales price has a
maximum impact on the transfer rate of 91.6*1.151=105 percentage points. This exposes a
weakness in the model apparent also from the plots in Figure 13—four of the estimates exceed a

160
100% transfer rate. Ideally, model estimates should remain within the logical constraints of their
domain. CDC staffers cannot possibly sell more properties than they buy. The large impact of
median sales price suggests that new buyers prefer to live in neighborhoods with desirable
(expensive) houses and that such buyers pay their property taxes.
An increase of 1,000 NIS queries corresponds to a 22.143 percentage point increase in
the transfer rate. The range for NIS queries covers 2,350 queries. NIS queries have a maximum
impact on the transfer rate of 2.350*22.143=52 percentage points. Since only transfers to new
homeowners current on taxes are included in the transfer rate calculation and CDC staff
members report using NIS to check if prospective buyers have paid taxes on other properties
they may own before selling to them and the regression coefficient is sizable and statistically
significant—I argue for a causal connection. NIS contributes to programmatic capacity
building, helping staffers identify responsible owners for CDC purchased properties.
There exist several threats to the validity of this finding. While the NIS queries included
in these quantitative models concern residential properties (as opposed to social demographics or
neighborhood characteristics), they are not necessarily tied to the specific residential properties
included in the transfer rate or to properties owned by prospective buyers. It is exceedingly
difficult to determine from the log files whether CDC staff members used NIS to vet the current
owner of a specific transferred property. Also, the CDBG funding year is the finest temporal unit
employed in the analysis. Many queries occurred a few months before a given transfer or—even
worse—a few months after a given transfer. A more cautiously worded finding would be that
CDCs issuing more NIS queries tend to have higher transfer rates, all other factors being equal.
Still, the qualitative and quantitative results together lead me to proceed beyond association and
to argue for causality. But, the model should not be misinterpreted as deterministic. NIS likely
helps vet prospective buyers, but repeating the same query mindlessly will not magically
increase transfer rates.
Membership in the Strategic Investment Initiative was associated with a statistically
significant decrease in the transfer rate in the independent model but not in the autoregressive
model—which resulted in its removal. Regardless, as a major Neighborhood Progress Inc.
initiative, it is worth hypothesizing why the coefficient was negative. SII member CDCs might
sell more often than non-SII member CDCs to new owners who are not current on their taxes.
Or, SII member CDCs might purchase property and then wait longer to find the right owner. An
161
interviewee knowledgeable about activities in many CDCs provides circumstantial evidence for
this behavior. “Some of the CDCs”, she explains, “may have been doing the work of the county
land bank in the past [before the land bank existed]. CDCs would pick up and hold houses until
they could find qualified buyers.” (#75, 6/24/2013). The single CDC she provided as an
example—Slavic Village—is a SII member.
Figure 13 displays the actual data (black solid line) versus the autoregressive model
estimates (gray solid line) and traditional model estimates (gray dashed line). The autoregressive
model performs moderately well for CDCs maintaining a relatively steady transfer rate above
40% and below 90%, such as Bellaire Puritas, Slavic Village, and Westown. It performs poorly
when estimating transfer rates that fluctuate greatly such as that of Mt Pleasant Now, estimating
very low rates such as Burten Bell Carr, and estimating very high rates such as Kamms Area
Development—with an estimate above the plotting window. On average, the autoregressive
model estimates are 23.5 percentage points off of the actual transfer rates.

162
Figure 13: Percentage of CDC Purchases Transferred and Model Estimates

163
Home rehabilitation rate (Percentage of Total Purchased)
The houses that CDC staff members purchase often need repairs in order to pass
inspection and may need extensive work before becoming attractive to prospective buyers. In
their initial state, these houses lowered surrounding home values and likely also the morale of
local owners and residents. Interviewees described a completed housing rehabilitation as
indicating a successful instance of community development. In this research, a rehabilitation
(rehab) is defined as a residential property purchased by a CDC during the period under
investigation (July 1, 2007 to June 30, 2011) and physically improved after purchase by any
party before the close of the period. Physical improvement includes completion of any of the
permits listed in the methods section of this research. Early purchases have more time for
rehabilitation than later purchases. While the approach is the same as that taken previously for
the transfer rate, rehabilitating property may take more time than finalizing a property transfer.
The research design therefore contributes to the sharp decline in the rehab rate from a high of
50% in 2009 to a low of 5% in 2011, the final year of this study. The average transfer rate
roughly follows the same curve as the number of purchases, rising in 2009, plateauing in 2010,
and falling (sharply) in 201l, suggesting the year and year2 modeling approach employed for
purchases will prove statistically significant.
The rehabilitation models use the Gaussian error distribution and identity link employed
for the transfer rate, the most common employed in linear regression. Table 27 summarizes the
initial models for the rehab rate achieved by CDCs, according to building permit data.
Table 27: Model of the Percentage of Annual CDC Purchases Rehabilitated, Initial Version
Variables Independent autoregressive
(Intercept) -40.453 -40.606
Owner Occupancy Rate 1.109 ** 1.108 **
Vacancy Rate 0.971 0.976
Median Sales Price 0.964 @ 0.968 @
Number of Sales -0.049 * -0.049 *
Com. Dev. Block Grant
Amount 0.040 0.040

164
Variables Independent autoregressive
Number of Employees 1.055 * 1.057 *
NIS Total Queries 18.114 * 17.990 *
Strategic Investment
Initiative -35.597 *** -35.636 ***
Year 12.425 12.382
Year2 -6.434 * -6.426 *
@ p< 0.10 * p < 0.05 ** p < 0.01 *** p < 0.001
A very low estimated correlation (0.007) between transfer rates of the same CDC from year to
year explains the similarity between the independent and autoregressive models. The coefficients
and their level of significance match nearly perfectly between the models. Year proved
insignificant but year2 proved significant and negative, responding to the aforementioned drop in
the transfer rate over time.
Table 28: Model of the Percentage of Annual CDC Purchases Rehabilitated, Final Version
Variables Independence autoregressive
(Intercept) -0.731 -0.842
Owner Occupancy Rate 1.520 *** 1.522 ***
Number of Sales -0.044 *** -0.044 ***
Number of Employees 1.070 ** 1.075 *
NIS Total Queries 16.369 * 15.908 @
Strategic Investment
Initiative -29.825 *** -29.790 ***
Year2 -3.162 * -3.158 *
@ p< 0.10 * p < 0.05 ** p < 0.01 *** p < 0.001
The final model includes two neighborhood factors (owner occupancy rate and number of

165
private sale), two organizational factors (number of employees and NIS total queries), and a
combination factor (Strategic Investment Initiative membership). The estimated correlation
between rehab rates of the same CDC from year to year was higher in the final autoregressive
model, but still tiny (0.021). However, this correlation was sufficient to downgrade the level of
significance of both the number of employees and NIS total queries.
In the final autoregressive model, a one percentage point increase in the owner occupancy
rate corresponds to—all other factors held constant—a 1.522 percentage point increase in the
transfer rate. The range for neighborhood owner occupancy for CDCs that purchased at least one
property covers 55.6 percentage points72. Owner occupancy has a maximum impact on the rehab
rate of 55.6*0.768=84.6 percentage points. Owners are likely willing to maintain property in
which they live, especially if neighbors are maintaining their property as well.
Each private sale reduces the rehab rate by 0.044 percentage points. The range for the
number of private sales is 35 to 1,295 with a spread of 1,260. These sales have a maximum
impact on the rehab rate of 1,260*0.044 = -55.4 percentage points. People who purchase a house
from a CDC in a neighborhood with many private (non-CDC) sales may believe that they do not
need to invest further in order to sell the house at a future date.
Each CDC staff member increases the rehab rate by 1.075 percentage points. The largest
CDC had an estimated 50 fulltime employees and the smallest had an estimated 1.67 fulltime
employees73 for a difference of 48.3. The number of fulltime employees has a maximum impact
on the rehab rate of 80.7 percentage points. CDC staffers inspect properties extensively on site
prior to purchase, assessing their potential for rehabilitation. These efforts did not register in the
property purchase models because they likely often result in the decision not to purchase a
property—similar to offsite research via NIS. However, these efforts register in the rehabilitation
model because CDCs with more employees are likely able to conduct more thorough property
inspections. Staffers may also initiate work themselves before selling the property,
communicating with contractors and developers and insuring that each property’s potential for
rehabilitation is realized.
An increase of 1,000 NIS queries corresponds to a 15.908 percentage point increase in
72 As mentioned previously, the range for owner occupancy for the entire dataset covers 72.1 percentage points.
73 The partial employee arises from interpolation between estimates in 2005 and 2012.

166
the transfer rate. The statistical significance of this variable decreased from the initial model and
from the independent version. NIS is only significant in the final autoregressive model at the .10
level (90%). The range for NIS queries covers 2,350 queries. NIS queries have a maximum
impact on the rehabilitation rate of 2.350*15.908=37.4 percentage points. NIS appears to be
more effective at vetting potential buyers for their tax compliance than for determining,
explaining, or predicting which properties will be rehabilitated. Since the NIS in Cleveland
actually provides CDC staffers tax compliance information and not (of course) the future state of
properties—this outcome makes perfect sense.
On average, membership in the Strategic Investment Initiative lowers the rehabilitation
rate by 29.790 percentage points. As discussed above for the transfer rate model, SII members
may purchase property and then wait for the right owner. The rehabilitation model suggests that
they do not significantly invest in the property during the wait.
Due to the design of the research and analysis, properties purchased later have less time
to be rehabilitated. The negative year2 coefficient translates to a CDC in year four (2011) having
a rehabilitation rate 3.158*44-3.158*41=47.4 percentage points lower, on average, than the same
CDC in year one (2008). Figure 14 shows the actual data (black solid line) versus the
autoregressive model estimates (gray solid line) and traditional model estimates (gray dashed
line). The models perform reasonably well for Collingwood Nottingham, Cudell, Mt. Pleasant,
and Slavic Village. They fail to capture the more dynamic rehabilitation rates of Detroit
Shoreway, Famicos, and Union Miles. On average, the autoregressive model estimates are 21.5
percentage points off of the actual rehabilitation rates.

167
Figure 14: Actual Rehab Rate of CDC Purchases and Model Estimates

168
Network Capacity
Interviewees described many ways in which NEO CANDO and the NST web application
help them establish more effective partnerships with other organizations. This section provides
details, but does not model the process quantitatively. The results align well with Glickman and
Servon's (1998) framework, strongly suggesting that NIS builds network capacity by allowing
CDC members to achieve three capacity-building needs (See Table 1 on page 13): establishing
strong relationships with other organizations, engaging in mutually supportive programs, and
promoting the CDCs’ agendas externally. The Cleveland Code Enforcement Partnership
provides a lens with which to see how NIS allows CDC members to achieve these needs.
The Cleveland Code Enforcement Partnership ties two municipal departments (Building
and Housing and Community Development) and fourteen CDCs together into a mutually
beneficial arrangement that better addresses vacant and abandoned housing, despite the city's
shortage of code enforcement officers due to budget limitations. Importantly, to maintain CDBG
funding, CDCs must take on more contractually binding responsibility without a commensurate
boost in the amount of money received. CDC staff and local residents only “benefit” from the
point of view that the arrangement positions the nonprofits to take on unmet city responsibilities
in a more organized and efficient manner than would have occurred without the partnership. The
improvement occurs—in part—because NIS eases a common task —communicating
information—that overlaps with multiple CDC functions (see “common tasks” starting on page
112 and “communicating information” on page 117). CDCs communicate their demolition and
rehabilitation interests through the NST web application, fulfilling the network capacity building
need of promoting an organization's agenda to external parties, such as city employees. One
interviewee familiar with the partnership explained that the NST web application is the
“intermediary for the partnership,” allowing the city departments to share data with the CDCs
and vice versa (#47, 8/11/2011). More generally, a CDC staff member explained that “NST is a
way to communicate with other organizations” and “eliminates [an] unneeded phone call” (#10,
11/4/2011).
It is difficult to tease apart the impact of this new technology (NIS) from the impact of
new municipal priorities and policies that urge city departments to work more closely with CDCs
on code enforcement activity. One interviewee describes how the combination of impacts makes

169
CDC demolition advocacy far more effective, sometimes turning years of effort into weeks of
effort.
“[There is] no block now between the city and the CDCs. We are meeting and our
concerns are heard. .. There was this one particular building, demolished]. melborp ehT
...noitazinagro saw erofeb No one can find the file. It was like ' who has the file?'. Maybe it
is on the computer now. It is so much better. ” (#58, 3/2/2012)
In this example, the NST web application provided the same “file” to both CDC employees and
to city employees. Sharing a base of information allows all parties to agree—at the very least—
on which parcel they are discussing and its current status.
Communicating effectively, however, requires both parties to pay attention. Employees at
the Department of Building and Housing have demolished structures that were not on CDC
staffers' demolition lists. One staffer exclaimed in an interview, “Now there are even buildings
coming down that we were not notified of—not on my list. They are bypassing me. I want them
to prioritize my list” (#58, 3/2/2012). It remains unclear from the data collected whether city
representatives have their own demolition priorities that trump local concerns or whether city
representatives are simply unaware of local concerns. City representatives have taken steps
toward demolishing CDC rehabilitation targets—sometimes even completing the demolition. A
staff member at a second CDC explained that sometimes “I don’t know if the city is looking at
our data” (#10, 2/20/2012).
The interviews provide some evidence that NIS has improved the network capacity of
CDCs in regard to their relationships with other non-profit organizations. It has not only
strengthened the relationship between CDCs and the city, but also between CDCs and
Neighborhood Progress Inc. These relationships require a shared store of information to further
discussions about problem properties. Before NIS, city departments and NPI built this store by
separately requesting ad-hoc lists of parcels and conditions from CDCs. Now, all parties
independently pull the information they need from NIS. One interviewee described how, “when
the webapp came, 2/20/2012). Only one CDC staff member claimed that NIS may help
coordinate activities with non-profit organizations besides NPI. She explained that
“In the coming year, we are hoping to partner with our many social service organizations
and non-profits. I anticipate that we will use NEO CANDO to better understand the gaps
in services in our community and where the greatest need is. This will allow these

170
organizations to partner to better serve our stakeholders and develop programming and
resources to meet those needs.” (#25, 2/3/2011)
The current research does not provide sufficient evidence to argue that NIS improves—or does
not improve—the network capacity of CDCs outside the framework of the code enforcement
partnership.
Political Capacity
NIS contributed to political capacity building only in one CDC as discussed in the answer
to research Question #4 (see page 133).
Chapter Summary
This chapter has examined the impact of NIS on capacity. Hypothesis 5 (page 38) is
clearly incorrect. While neighborhood and organizational factors help explain capacity
building—so does NIS use for two outcomes: residential property transfers to owners who pay
property taxes and residential rehabilitations. However, findings always come with caveats and
Chapter 8 acknowledges relevant threats to validity.

171
Chapter 8: Threats to Validity
Shadish, Cook, and Campbell (2002) define validity as "the approximate truth of an
inference" and assert that assessments of validity ultimately entail "fallible human judgments" (p.
34). They define threats to validity as “specific reasons why we can be partly or completely
wrong when we make an inference about covariance, about causation, about constructs, or about
whether the causal relationship holds over variations in persons, settings, treatments, and
outcomes" (p. 39). The purpose of this section is to provide the reader with sufficient—and
sufficiently organized—information to make informed judgments about the validity of findings
in this research. Both quantitative research and qualitative research are subject to threats to
validity, but the nature of those threats and their remedies can differ greatly (Creswell 2009;
Shadish et al. 2002). However, this section prioritizes providing a practically organized synthesis
of threats over attention to nuanced differences between them. It places Creswell’s validity
procedure for qualitative methods (2009:190–193)74 within the structure of Shadish, Cook, and
Campbell’s most recent validity typology for quantitative methods (2002:33–102). Table 29
provides a summary of the typology.
Table 29: Four Types of Validity
Type of
Validity Description
Conclusion
Validity75
The validity of inferences about the correlation (covariation) between treatment
and outcome
74 Creswell does not provide as detailed a typology for qualitative research as the one he provides for quantitative
research and this latter typology is less detailed than the one provided by Shadish, Cook, and Campbell.
75 Shadish, Cook, and Campbell refer to this type of validity as “Statistical Conclusion Validity,” but qualitative
researchers also makes cause and effect claims and these must also be subjected to an examination of validity—
even though the claimed relationships are not statistical. For this reason, I have generalized the name by
removing the word “statistical”.

172
Internal
Validity
The validity of inferences about whether observed covariation between A (the
presumed treatment) and B (the presumed outcome) reflects a causal relationship
from A to B as those variables were manipulated or measured.
Construct
Validity
The validity of inferences about the higher order (theoretical) constructs and
their representation as specific variables.
External
Validity
The validity of inferences about whether the cause-effect relationship holds over
variation in persons, settings, treatment variables, and measurement variables.
(Shadish, Cook, and Campbell 2002, 38, Table 2.1 with reformatting)
The subsections to follow address each type of validity and its particular threats in more detail in
the order that they appear in Shadish et al.(2002). Several threats are especially large in this
research: unreliability of measures (page 176), extraneous variance in the experimental setting
(page 182), ambiguous temporal precedence (page 184), selection (page 185), construct
confounding (page 188), mono-operation bias (page 188), mono-method bias (page 188),
interaction of the causal relationship with units (page 189), and interaction of the causal
relationship with settings (page 189).
Conclusion Validity
The first type of validity concerns whether—and how strongly—the presumed cause and effect
covary. There are nine potential threats.
Low Power76
Quantitative research can suffer from low statistical power resulting in a false negative.
Multiple years of data increase the effective sample size of this study beyond the thirty
organizations under investigation, increasing power. Extending the definition of a CDC to
include organizations not receiving CDBG funding would have increased power further but may
have included very different types of organizations and complicated analysis. I corrected for
76 Shadish, Cook, and Campbell refer to this threat as “Low Statistical Power,” but a similar concept exists for
qualitative research. The word “statistical” has therefore been removed.

173
covariates such as CDBG funding levels and employed statistical methods appropriate to the data
as Shadish, Cook, and Campbell recommend. But, key factors such as the strength of the
treatment (amount of NIS use) and variability of the treatment (differences in NIS use) remained
outside of my control, reducing validity.
In qualitative research, collecting information from too few individuals can result in
inaccurate conclusions (false negatives, false positives, incorrect themes). While the term
triangulation often refers to employing both qualitative and quantitative methods (Jick 1979) it
can also refer to converging perspectives from different respondents (Creswell 2009). For this
reason, I quantify the breadth of interview coverage when reporting key findings. Table 17 on
page 125 shows that the individuals interviewed about the use of NIS to pursue public
participation for historic preservation all worked in the same CDC. These particular findings
should be read with more skepticism than those with broader support. I offer the number of
distinct CDCs instead of the number of total staff members interviewed to permit readers to more
readily assess validity. Employees in different organizations are less likely to provide the same
responses as employees in the same organization, a product of their independence, which is
explored more in the next section.
Violated Assumptions
Research can suffer from violated assumptions, especially violation of the independence
assumption. In quantitative research, including multiple years of data poses such a threat.
Traditional regression assumes that each data point stands equally distinct from all others. But,
data points for the same CDC are more related to each other than to data points from other
CDCs. Employing generalized estimating equations reduces this threat by accounting for the
correlation between data points from the same CDC. Including both the Detroit Shoreway
Community Development Organization (DSCDO) and its Stockyards, Clark Fulton, Brooklyn
Centre office (SCFBC) as separate CDCs, however, may also violate the independence
assumption. SCFBC has its own director, field staff, and CDBG funding but shares accounting
staff with DSCDO, its parent organization. They may also share a similar organizational culture
and community development approach. Violating independence biases the results toward Type I
error (Shadish, Cook, and Campbell, 2002, 48) and threatens the quantitative finding that NIS
contributes to higher property transfer rates (page 159) and higher rehabilitation rates (page 165).

174
Semi-structured interviews with CDC staffers support the current quantitative findings though,
buffering against this threat. In the future, creating comparison models with DSCDO and SCFBC
merged into a single unit of analysis along all covariates would permit quantifying the
independence threat.
Fishing
Fishing refers to collecting or analyzing data in a way that biases the outcome, possibly
by highlighting extreme or unusual cases. In quantitative research, sifting through a dataset to
find statistically significant effects suggested by the data themselves, can threaten statistical
validity. I took several steps to avoid fishing. The independent variables for each model were
suggested by the literature, interviews with practitioners, and common sense. Instead of an
exhaustive (all combinations) search for the most significant set of independent variables, I
started with a short list of independent variables and dropped the least-significant variable one at
a time until either all remaining variables reached statistical significance or all variables proved
non-significant. I calculated the variance inflation factor before removing insignificant variables
in order to avoid accidently removing a significant variable showing as insignificant due to
multicollinearity.
An earlier version of this research with outcomes based on CDBG monitoring reports
employed an exploratory all combinations analysis. Further investigation revealed that the
reports did not include all properties CDCs purchased and rehabilitated, rendering the
exploratory results meaningless. I then created the aforementioned system to identify CDC
residential property purchases, transfers, and rehabs (page 80) and did not revisit the all-
combinations approach to model building.
Asking leading questions in semi-structured interviews produces a similar threat to
validity as fishing in quantitative research. I avoided asking leading questions, reducing the
potential for bias due to fishing.
Unreliability of Measures
The unreliability of measures can lead to Type I or Type II error, especially in
longitudinal studies (Shadish et al. 2002:49, citing Willett 1988). I report herein on the reliability
of measures used in this research as Shadish et. al.(2002) recommend to reduce threats to

175
validity. But, in this research, I did not employ multiple measures of the same conceptual
construct or latent variable modeling as they also recommend. The quantitative research may
suffer from multiple sources of unreliability, including: (1) Estimation of staff size; (2) Margin
of error in American Community Survey data; (3) Attribution of a NIS query to a CDC; and (4)
Imputed CDC outcomes. The qualitative research may suffer from multiple sources of
unreliability as well, including: (5) oversimplification and (6) insufficient review by stakeholders
and external auditors. Each measure merits individual attention.
Estimation of staff size
Estimates of the number of fulltime CDC staff members each year are based on a linear
interpolation between a 2005 estimate and 2012 estimate with the former coming from CDBG
monitoring reports when available and the latter (or in some cases both) coming from short
phone interviews with CDC staff members or the CDC’s website. This method likely produces
better estimates than the staff sizes reported in IRS 990 forms, which are—in some instances—
outrageous. But, the method remains imperfect. The 2005 estimates, when coming from phone
interviews, are subject to recall error. All estimates are subject to differences in defining fulltime
and part-time employees between organizations. Linear interpolation between two points
produces fractional full-time employees, which cannot actually occur. Either a CDC has 11
fulltime employees or 12 fulltime employees—never 11.5 full-time employees. Some CDCs may
have lost many employees all at once between 2005 and 2012 but linear interpolation eliminates
this possibility. This (unmeasured) sudden drop in staff size would have likely resulted in a
corresponding (measured) drop in CDC activities and outcomes. The mismatch between
independent and dependent measurements would lead to a Type II error, understating the
contribution of CDC staff size in explaining outcomes.
Margin of error in American Community Survey data
Two independent variables, the vacancy rate and owner occupancy rate, come from the
U.S. Census’ American Community Survey and have corresponding margins of error that are
ignored in this research. Researchers routinely include margins of error in the calculation of t-
tests to see if one population differs significantly from another population. Researchers often
ignore margins of error in more complex statistical models, though “error-in-variable models”

176
exist for special purposes (University of Michigan CSCAR, 3/21/2013). Not accounting for error
in the independent variables biases those variables toward a coefficient of zero (under estimation
regardless of direction) and non-significance (Type II error). The ACS variables may therefore
have a larger impact on CDC activities than the models currently suggest.
Attribution of a NIS query to a CDC
The relationship between NIS use and CDC residential purchases, transfers, and
rehabilitations would be invalid should NIS queries be routinely assigned to the incorrect CDC.
Users, especially student interns working temporarily in a CDC, may change jobs or hold
multiple jobs at the same time. The logfile analysis performed in this research only links a user
ID number with the employer currently listed in the corresponding anonymized user profile. If
the employer currently listed is not the current—or only—employer, the analysis will not
accurately represent the amount of property research conducted by a particular employer.
Poverty Center staff request users to make new accounts upon changing jobs, which helps insure
that the logfiles store accurate information. However, there is no way for Poverty Center staff to
enforce this request. Some users may continue to use the same account after starting a new job.
Failing to update the profile would cause all new queries to accrue to the previous employer.
Updating the profile would cause all previous queries to accrue to the new employer. I designed
and implemented a procedure to estimate how often NIS queries were misattributed to CDCs.
Since CDCs are turf-based organizations, a query attributed to a CDC should fall within
its service area. Queries that are outside the service area of the CDC currently listed in a user's
profile—may signal a mismatch. The NST web application's logfiles contain a copy of the query
submitted to the system, but not a copy of the result77. Users rarely specify a specific parcel of
interest, instead relying on criteria (such as an address range) for the system to match. The query
does include a list of ugroups, subdivisions of the city that programmers in the Poverty Center
created to improve system performance by reducing the number of records to be searched based
on a user’s identity. Ugroups are imprecise and change over time. Users in neighboring CDCs
are often assigned to some of the same ugroups.
77 The older NEO CANDO system does not store the query in the logfile so the accuracy of attributing queries to a
particular CDC cannot be verified using this method.

177
A random sample of 10,000 rows from the NST logfile78 for 2010 to 2011 returned 9,981
queries from CDC staff or interns. Approximately 11% (1,077) of these involved parcels outside
the service area assigned in my research, suggesting measurement unreliability. CDC staff
members may enter an incorrect address or investigate properties just over their service areas.
The extent and frequency of the violation determines whether the query represents a threat to
validity. Upon further investigation, only 97 of the 9,981 queries (about 1%) suggest a few users
may have been misattributed during some years in this research. This small number of queries
across multiple CDCs should not affect the results greatly.
Imputation of CDC outcomes
A master list of CDC property transactions would have made it unnecessary to search
property records for CDC related purchases, transfers, and rehabs. Therefore, no list exists to test
the completeness of the search methods employed herein. CDBG annual monitoring reports
systematically underestimate actual purchases and rehabs. Thankfully, a project manager for a
CDC generously provided a spreadsheet with parcel numbers for the 121 single family houses
his organization facilitated the sale of between 2008 and 2012. According to tax records, 45 of
these properties were last purchased before July 1, 2007 or sold after June 30, 2011, leaving 76
property transfers within the time frame of this study. Removing those involving the Cleveland
Housing Network leaves 21 eligible properties. The search method I employed identified 27 such
properties. The additional six properties may have been incorrectly attributed to this CDC instead
of a related CDC. While unreliability remains, the property search reasonably estimates CDC
activity relying on information available publically in many jurisdictions. The method will,
however, completely ignore efforts by CDC staffers to facilitate property deals without taking
title. The extent of these “third party” transactions in Cleveland remains unknown though
interviews suggest that no CDC relies on them exclusively.
Oversimplification
Qualitative research requires presenting “discrepant information that runs counter to the
themes…[since] real life is composed of different perspectives that do not always coalesce”
78 There are roughly 35,000 NST queries in the logfile complete enough for analysis

178
(Creswell 2009:192). Similar to when movie editors once manually cut film by hand, the
researcher must consider whether very different findings would have resulted by including the
interview material left “on the cutting room floor”. Quotes from interviewees that ran counter to
prevailing themes in this study are still included in the write-up, for example:
While CDC staff members often integrate public participation with programmatic
activities, a staff member in one CDC said that his organization does not promote “issue
organizing” (page 125). Since the NIS in Cleveland provides information especially
suited to housing development and rehabilitation, the finding that at least one CDC does
not connect public participation with neighborhood issues suggests that NIS is not—and
cannot—be used to improve public participation around housing development and
rehabilitation in that jurisdiction.
Three CDC staff members interviewed reported explicitly reinvesting time saved using
NIS back into core CDC development activities, but a fourth reported using the saved
time to cultivate her interest in sustainability (page 141). The latter quote suggests that
even if NIS were to save CDC employees time, housing development and rehabilitation
efforts may not increase in every case.
CDC staff members generally focus on owner occupied housing, but one interviewee
acknowledged partnering in her lowest income census tract with a developer known for
producing rental units (page 145). This qualitative finding suggests why the regression
coefficient for owner occupied housing was not always statistically significant in the
quantitative models and not higher even when significant.
But, despite a conscious effort to report discrepant information, the chance for over
simplification remains very real. I focused on identifying emerging themes, insuring that they
enjoyed broad support in terms of individual interviewees and CDC representation, and
including counter quotes. I did not conduct a systematic review of quotes excluded from the final
write-up. While not explicitly recommended in any qualitative methods texts I have encountered,
such a systematic review may prove helpful in avoiding oversimplification.
Insufficient review
Both individuals close to the subject under investigation (including interviewees) and far from

179
the subject under investigation but familiar with qualitative methods should review the findings
to verify—and recommend how to improve—their validity80. Some outside review of
preliminary findings occurred while conducting interviews and during conference presentations,
but review of this material outside of the dissertation committee remains incomplete and
unsystematic. While conducting interviews, I checked that I understood statements that were
particularly complex or that ran counter to prior findings. In follow-up interviews, I repeated
sections of that interviewee’s past statements and shared preliminary findings in order to receive
clarifications and additional material. No interviewee in Cleveland, however, has read a full draft
of this study. I intend to send several interviewees who have expressed interest copies after my
dissertation defense in order to inform the next version of this work, which will likely take the
form of multiple journal articles. Attendees at the Community Indicators Consortium (CIC)
conference in 2012 and the Association of Collegiate Schools of Planning (ACSP) conference in
2012 and 2014 provided limited but useful feedback after my presentation. I sent several full
papers out and received only one comment—which was to use less jargon. I have tried to
simplify and clarify my use of language in this manuscript.
Restriction of Range
Defining the primary outcome variable as the number of residential properties purchased
in a year resulted in a large number of zeros in the dataset. This could produce a floor effect, an
error caused by a surplus of inaccurate minimum values. The inaccuracy would have occurred if,
for instance, CDC staffers were in the process of purchasing at least one property and that effort
went undetected. I did not investigate this possibility since it is difficult to determine from
property records. Restricting the range of an independent variable in this way tends to weaken its
relationship with the dependent variable, leading to a Type II error (Shadish, Cook, and
Campbell,2002, 49). I assumed in this research that the zeros represent accurate data drawn from
administrative records and model them responsibly with a zero-inflated model. I did not compare
the results of a single stage model with a two stage model in order to quantify the differences in
such approaches, though this may be a topic for future study.
80 Creswell (2009, 191-2) refers to “member checking”, “peer debriefing”, and use of an “external auditor”

180
Unreliability of Treatment Implementation
This threat to validity overlaps somewhat with the unreliability of measures discussed
previously. In retrospective studies such as this one, control of the treatment is—by definition—
impossible. I did not randomly assign staffers in some CDCs to use NIS and others in different
CDCs not to use NIS. I did not specify how many NIS queries staffers should submit, how they
should specify the query criteria, or how they should interpret and apply the results. Still, the
qualitative methods employed herein are less prone to this threat to validity because the
interview protocol called for addition probing about the specifics of information use.
The quantitative methods employed herein rely on the annual number of NIS queries
from computer logfiles, which likely include queries that CDC staffers submitted by accident and
queries that returned results which were never carefully reviewed. The research proceeded under
the assumption that the ratio of useless queries versus useful queries is equal across organizations
within a given year and that useful queries are all equally useful. Such assumptions will be
necessary in quantitative studies of the impact of information systems until researchers identify
better estimates of information use.
Extraneous Variance in the Experimental Setting
Unaddressed differences between interviews and unmeasured covariates can result in
incorrect findings—including the finding of no clear trends. Generally, in qualitative data
collection, the researcher finds that some participants are more generous with their time and
more forthright in their responses than other participants. In this particular study, the number of
questions greatly outpaced the amount of time most participants volunteered. To save time, I
asked a number of core questions and then focused on questions that remained poorly or
incompletely answered by other participants. There are therefore extraneous sources of variance
between interviews (duration, amount of trust, participant mood and stress level) which may
have colored responses and uncollected responses to questions that were never asked.
Regardless, the uses of NIS emphasized in this study reflect achieving sufficient
responses from interviewees that the last few responses for a particular question provided little to
no additional information. Qualitative researchers, especially those employing a grounded theory
approach, refer to this phenomenon as “saturation” (Dey 1999:116). Focusing on questions with
181
less saturated responses took precedence over searching for potentially discrepant examples,
which both increased the breadth of the study and the threat of oversimplification (page 179).
The quantitative models in this research include the independent variables interviewees
mentioned as influencing decision-making about housing rehabilitation. However, as described
in detail after each model, they explain the outcome of some CDCs far better than the outcome of
others. This suggests that an omitted variable (or several omitted variables) may be necessary to
explain the outcome in all cases. Omitted independent variables are the greatest threat to the
validity of the quantitative models in this research. The explanatory power assigned to NIS may
actually be more properly assigned to an omitted independent variable or variables. Formal
education in planning or another field that emphasizes data analysis may be highly correlated
with NIS use and contribute to the volume and success of CDC housing rehabilitations. The
culture and priorities within different CDCs must also impact the distribution of resources to
activities such as housing rehabilitation and therefore impact annual outcomes. Qualitative
findings about the decision-making process in some CDCs remained incomplete (or nonexistent)
for other CDCs and were not part of the quantitative models.
Heterogeneity of Units
This research includes all organizations receiving CDBG funding during the time period
under investigation, resulting in the inclusion of a wide assortment of organizations (see Table 5
on page 60). Including very different units tends to make outcomes more variable and more
difficult to explain. In quantitative research, measuring units along multiple dimensions to
control for differences through statistical techniques as employed in this research improves the
models—but often insufficiently, as previously discussed.
But, heterogeneity of units also makes both qualitative and quantitative findings more
generalizable since one should not generalize beyond the conditions investigated. In this
particular study, the wide assortment of CDCs also made the process of qualitative data
collection more engaging and contributed to the richness of the qualitative findings. I do not
consider the heterogeneity of units a major source of error beyond exposing the aforementioned
problem of omitted independent variables. In fact, I would like to open the investigation in the
future to both organizations receiving CDBG funding and those not receiving CDBG funding.

182
Inaccurate Effect Size Estimation
The regression coefficients generalized estimating equations produce—as with other forms
of regression—describe the average marginal change that occurs in the dependent variable when
a particular independent variable changes by one unit and all other independent variables remain
constant. Several researchers have identified conditions under which generalized estimating
equations may produce biased estimates (e.g. Pepe and Anderson 1994) but this area of
investigation still appears incomplete and the necessary diagnostic tools are not widely available.
I cannot, therefore, comment on the likelihood of this threat to validity.
Internal Validity
Internal validity refers to the degree of support for a causal relationship between the
treatment (A) and outcome (B) in the units under analysis. Such an inference requires that:
1. A precedes B in time
2. A covaries with B (covered under conclusion validity above)
3. There are no other plausible explanations
(Shadish et al. 2002:53)
There are eight threats to internal validity, focused primarily on temporal order and alternative
explanations.
Ambiguous Temporal Precedence
Uncertainty about the order of events plagues the quantitative findings far more than the
qualitative findings. In interviews, CDC staff members described which tasks involved NIS and
how those tasks were performed. Since many of the respondents continue to perform these tasks
on a daily basis, there is little possibility of error in their details. CDC staff members use NIS to
find suitable rehabilitation candidates and then purchase some of those candidates. CDC staff
member also purchase properties for rehabilitation and then track progress in NIS, such as the
issuance of permits and the demolition of nearby nuisance properties. They often use NIS both
before and after making a particular purchase in reference to that purchase. While these details
add to the richness of the qualitative results, they make the direction of causality in the
quantitative results harder to determine. Shifting the date of queries to align with outcomes six
183
months later imperfectly addresses the threat.
For example, the qualitative findings reveal that CDC employees use NIS to identify
responsible new owners for rehabilitated properties (“Vetting Applicants” on page 116). The
related quantitative model found that the number of NIS queries significantly and positively
explains the percentage of annual CDC purchases transferred to responsible owners, defined as
owners current on property taxes (“CDC Transfers” on page 159). Though the logfiles specify
the CDC associated with the query and the time of the query, they only rarely specify a
property—and never specify a purpose. All, some, or none of the queries assigned to a particular
CDC may involve vetting potential owners before transferring property. Similarly, all, some, or
none of the queries assigned to a particular CDC may involve checking up on a property and its
owners after transferring property.
Relying on logfiles provides accurate estimates of NIS use frequency, but no information
about purpose and outcome—and therefore no information about temporal order. A sensitivity
analysis that randomly defines some queries as having occurred after the outcomes and removes
those queries may reveal how tenuously quantitative findings rest on assumptions about temporal
order.
Selection
Defining a community development corporation as an organization that receives CDBG
funding led to the inclusion of the Historic Gateway Neighborhood CDC, the Historic
Warehouse District CDC, and the Little Italy Redevelopment Corporation, which all focus on
commercial activities, do not use NIS, and do not redevelop residential properties. Failure to
conduct interviews with any employees in these CDCs may have influenced the qualitative
results through similar means as oversimplification except—continuing the film editing analogy
on page 179—instead of landing on the cutting room floor, the film was never shot. Since NIS
use and all outcomes were zero for these organizations, the impact of organizations using NIS
and producing outcomes may be viewed by some readers as exaggerating significance in the
quantitative models. I hold that any valid selection criteria for evaluating the impact of NIS on
CDC outcomes would have to include all the organizations receiving CDBG funding at the very
least and that these three organizations are rightly part of this research. Omitting them in the

184
qualitative side is a source of weakness and including them in the quantitative side is a source of
strength.
History
The threat of history refers to incidents that may have occurred between application of
the treatment (NIS use) and measurement of the results (CDC outcomes). In this research, threats
posed by history have already been covered under extraneous variance (page 182).
Maturation
The quantitative models ignore learning occurring within organizations when staff
members overcome new challenges and when they participate in training opportunities. This
raises a credible threat related to omitted variables such as employee skills and experience.
Additionally, staff members in the two organizations that gained CDBG funding for the first time
during the study (Detroit Shoreway’s SCFBC office and Harvard Community Services) may
have learned more than staff members in other organizations. However, since the majority of the
CDCs were well-established organizations, maturation likely poses less of a threat than omitted
variables. Importantly, the critical case research design assumes that sufficient time has passed
for CDC staffers to learn how to benefit from NIS. The findings for organizational capacity
suggest that this process is still underway.
Regression
Regression analysis identifies the mean impact a unit change in an independent variable
has on the dependent variable, holding all other independent variables constant. A related threat
to validity in quantitative research, regression to the mean, occurs whenever there are
imperfectly correlated variables (independent and dependent) and a nonrandom sample. Since
this research includes all organizations that qualify as CDCs and not a sample of the CDC
population in Cleveland—especially not a sample defined by very high or very low measures—
the results should be moderately protected against the regression to the mean threat. But,
measures in a particular year may be usefully thought of as representing a sample of all years
under investigation. A low outcome one year would likely be followed (statistically speaking) by
a value closer to the overall mean in subsequent years. Regression analysis may incorrectly

185
attribute this return to the mean to an independent variable. The likelihood and potential impact
of this risk were not investigated.
Attrition
CDCs dropped out of the study when they lost CDBG funding or went out of business.
The year before dropping out, these CDCs often showed no NIS use and no residential property
outcomes. Interviews were not conducted with employees from CDCs that dropped out of the
study. The potential impact of attrition was not investigated.
Testing
The testing threat refers to the possibility that the very act of conducting research (giving
a “test”) can impact results. During interviews, NIS-specific questions revealed to interviewees
the focus of the research and they may have been inclined to exaggerate the effect of NIS in
order to give the confirmation they assumed I wanted. The interview protocols, however, called
for specific examples of NIS benefits and descriptions of the mechanism(s) within NIS
delivering those benefits. Probing for such details and discounting unsupported claims reduced
the threat of testing. The testing threat cannot occur during retrospective analysis of
administrative records and logfiles since the participants were unaware of the study at the time of
recording. In fact, the study did not exist at the time of recording.
Instrumentation
No changes in the measurement of quantitative variables occurred during the study.
Focusing on interview questions with answers that remained open instead of asking the same
battery of questions to each interviewee may be viewed as a change in instrumentation. This
threat to validity was addressed previously (see “extraneous variance” on page 182).
Construct Validity
The task of connecting measurable variables to theoretical and socially relevant categories is
both a requirement and a central task for research (Shadish et al. 2002:65). Construct validity
concerns the strength of those connections. There are fourteen threats to construct validity.
Several involve subject reactions to treatment, which do not apply to this research. Three
186
relevant threats are briefly introduced below.
Construct confounding
As Table 11 (page 78) shows, whether a CDC participates in Neighborhood Progress
Inc’s (NPI’s) Strategic Investment Initiative (SII) affects both its resource capacity and its
network capacity because participants receive both funding and access to a larger number of
professional contacts. When this Boolean variable acts within a quantitative model, it could
represent either theoretical construct or both theoretical constructs. Similarly, the number of NIS
queries submitted by CDC staff in a year represents the construct information use, which is part
of another construct, organizational capacity. Construct validity also concerns case selection.
Although the term “CDC” is employed widely in the community development field, it remains
only loosely defined. Including only organizations that received CDBG funding focuses the
study on relevant cases.
Mono-Operation Bias
Constructs that are operationalized through a single variable may not capture the richness
of the underlying theory. For example, resource capacity is measured only by the amount of
CDBG funding a CDC receives and its only capacity building outcome, grant writing, remains
only sparsely described in terms of process and unmeasured qualitatively or quantitatively (see
page 135). This research did not find a relationship between NIS use and resource capacity. This
could reflect a Type II error caused by poor operationalization.
Mono-Method Bias
When a construct is measured by a single method, that method becomes part of the
construct. For example, self-report bias can plague a construct measured only through interviews
such as resource capacity, networking capacity, and political capacity. Triangulation via
multiple interviewees does not reduce the risk. Programmatic capacity, supported by both
qualitative and quantitative research enjoys protection against this source of bias.
External Validity
External validity concerns the extent to which a causal relationship identified through

187
empirical research holds in contexts similar to those originally studied and in contexts different
than those originally studied. There are five threats to external validity. Two are explored below.
Interaction of the Causal Relationship with Units
Developers at Case Western Reserve University created the NST web application so that
CDC staff members could pursue neighborhood stabilization activities. But, this does not mean
that the system automatically contributes to CDC capacity building or that it could never
contribute to capacity building in a different kind of organization. Still, the link between the
technology and the units (users) under investigation cannot be ignored. In the nomenclature of
science and technology studies, the NST web application delivers an affordance carefully tuned
to property research. It would be more reasonable to generalize the findings from this research
onto the employees of a real estate company or lawyers in a title research firm with access to the
NST web application than onto employees in a new CDC focused on new commercial and retail
construction. Grant writers in nonprofit organizations across Cleveland likely rely on NEO
CANDO to support assertions of program need and program impact even though they do not
work in a CDC. But, there were no findings concerning grant writing to generalize.
Interaction of the Causal Relationship with Settings
The critical case research design employed in this study limits the generalizability of the
findings. By definition, the results of this study are based on elements of the setting such as the
unusually strong neighborhood information system and the unusually strong community
development system. The findings provide an example of the impact NIS can have on CDC
capacity building in a setting conducive to such a relationship. But, these findings must be
generalized onto other cities and contexts very cautiously.
Summary of Threats to Validity
This chapter has provided a practically organized synthesis of threats to validity by placing
Creswell’s validity procedure for qualitative methods (2009:190–193) within the structure of
Shadish, Cook, and Campbell’s most recent validity typology for quantitative methods
(2002:33–102). As shown, the research suffers under some degree of threat in each subarea of
validity: conclusion, internal, construct, and external. Three threats loom especially large—all

188
against the quantitative side of the research: unreliability of measures (page 176), omitted
variables (part of extraneous variance in the experimental setting on page 181), and ambiguous
temporal precedence (page 184). However, the qualitative side of the research mitigates these
threats to a degree. The direction and significance of the coefficients are trustworthy—far more
trustworthy than their exact value. CDCs with staff members who use NIS often are also likely to
use NIS specifically to vet potential new owners, and—because of this use—likely to have
higher transfer rates to new owners who pay their taxes. But, the impact of NIS on the transfer
rate may be much smaller or much larger than the impact discussed under Table 26 on page 161.
The next and final chapter reviews the findings and their implications.

189
Chapter 9: Discussion of Findings
This research represents the first case study of information system use within the field of
community development informed by both science and technology studies (STS) and
management information systems (MIS). This discussion chapter is divided into five sections:
integration of disparate bodies of knowledge; contributions to bodies of knowledge; practical
implications for decision-making with NIS; recommendations to NIS developers and funders;
and conclusions and future research.
Integration of disparate bodies of knowledge
The crosspollination of theoretical constructs from disparate bodies of knowledge yields
fertile grounds on which to sow new research programs. This work provides both a useful
integrated theoretical framework and two approaches for building such frameworks from
different sources and for different purposes. Since the 1990s, scholars in management
information systems have been calling repeatedly for application of their models to a wider range
of systems and contexts, especially application of DeLone and McLean’s (1992, 2003) model.
Also since the 1990s, scholars focused on the capacity of nonprofit organizations, including
community development corporations (Glickman & Servon 1998), have acknowledged the
potential for information systems to contribute to capacity building. A few scholars and
practitioners coming to information systems through the geographic variant (GIS, PPGIS, and
NIS) have been aware of the management information system literature, but have yet to
empirically apply MIS models in their own research (e.g. Nedovic-Budic 1999). Despite wide
recognition of the need for dialogue between these disciplines, little dialogue has occurred. The
barrier, I believe—has been theory. It is a daunting task for any scholar to build theory outside
his or her own field. Community development activities driven in part by turf-based nonprofit
organizations (CDCs) might look like another planet to a management information system
scholar focused on global for-profit retail firms. Similarly, the underlying functionality of a
multifaceted information system might appear equally foreign to an urban planning or social
work scholar focused on grassroots public participation and capacity building. Luckily, scholars

190
have already generated useful theoretical frameworks in their own fields of expertise. The
primary contribution of this research has been to draw several of these frameworks into a new,
more comprehensive whole. While the findings from this research should be generalized
cautiously, its theoretical framework (Figure 3 page 41) may prove immediately useful to
scholars examining the impact of technology on public participation and capacity building in a
range of contexts.
The research illustrates two approaches to combining disparate theoretical frameworks,
which I call routing and refined replacement. In Figure 3, elements of the upper part of the
framework (DeLone and McLean 2003) are connected to the lower part of the framework
(Chaskin 2001) through routing, depicted as gray lines and arrows. DeLone and McLean’s
information success model defines a number of independent and dependent variable
relationships. These requirements are routed from Chaskin’s community capacity building
framework in the form of Characteristics and Neighborhood Context (both sources for
independent variables) and Outcomes (dependent variables). Sawicki and Craig’s (1998) concept
of data democratization and Glickman and Servon’s (1998) CDC capacity building framework
enter into the Characteristics subcomponent through refined replacement. Chaskin’s original
concept for the subcomponent included “access to resources” and “ability to solve problems”
(Figure 1 on page 11). The final framework defines information as the “resource” under
investigation and CDC capacity as a more robust conceptualization of “ability”. Researchers may
find these two approaches, routing and refined replacement useful in building integrated
frameworks in their own work.
Contributions to bodies of knowledge
This section describes the findings’ substantive and methodological contributions to
bodies of knowledge integrated in the theoretical framework. The bodies of knowledge are
covered in the same order as in the literature review (Chapter 2) with particular attention to the
gaps highlighted in Table 3 on page 28 in the columns labelled “needed topic” and “needed
method”.
Science and Technology Studies (STS)
This work responds to a call by science and technology studies (STS) scholars to examine

191
the impact of information access within organizations and to examine divergent technological
impacts across organizations. The findings suggest that an improvement in information access
may improve the capacity of an organization by allowing staff members to more easily perform
the tasks they already perform, if the information is carefully tailored to those tasks. This may
seem self-evident, but pundits often claim that information technology will improve outcomes
without identifying which outcomes is to be improved or how it is to be improved. The NST web
application was designed to allow CDC staff members to more easily perform parcel-level tasks
common to a physical development strategy for community development, especially residential
rehabilitation. The findings reveal that users indeed enjoy an affordance when pursuing that type
of work under certain conditions.
The research revealed many differences in how CDC staff members used NIS and the
impact the systems had on their work. How people work, such as querying only a few properties
at once or querying many properties at once can impact the benefits they receives from the
information system. Several respondents preferred the traditional county and city websites for
looking up a single property, but all agreed that NIS offered considerable time savings when
looking up many properties. This shows that CDC staffers choose to use NIS in some situations
and not others even though it is always available to them. Moreover, even CDC staffers who use
the system routinely have not changed their approach to community development to realize the
full potential of NIS. Some CDCs do not rehabilitate many properties at once or even compare
many options before rehabilitating a single property. Similarly, CDC staffers in only one CDC in
Cleveland decided to adopt a grassroots approach to community development and employ NIS
accordingly to build political capacity. A staff member at this CDC witnessed a successful
grassroots effort at another CDC and decided to duplicate that effort. The outcome was hardly
guaranteed—despite information access and computer skills. Vital to this particular case, he
encountered support within the organization and in the neighborhood and was able to build a
committee that had never existed previously. This shows that NIS outcomes rely on more than
NIS. CDCs previously focused on commercial projects did not switch to residential projects to
enjoy potential benefits from NIS. In some cases, focus on commercial projects reflects CDC
priorities in the face of many potential avenues for development. In other cases, focus on
commercial projects reflects the lack of residential development opportunities due to the historic
growth of the neighborhood. NIS cannot change organizational priorities or neighborhood

192
history.
Participation, Capacity, and Capacity Building
Scholars examining participation, capacity, and capacity building have yet to evaluate the
contribution of information systems and have also called specifically for a focus on political
capacity and networking capacity (Glickman & Servon 2003). The fundamental contribution of
this research toward these gaps is an integrated theoretical framework and a detailed example of
its empirical application. The findings also offer substantive contributions. In response to the
specific call for focused research, NIS helped staff members in one CDC increase public
participation and political leverage, both prerequisites for political capacity (Glickman & Servon
1998). NIS also enabled staff members in CDCs and city agencies involved in the Cleveland
Code Enforcement Partnership to communicate more effectively, evidence of networking
capacity building.
The findings extend beyond the specific call for gap filling and add to what is already
known about previously researched sub-capacities. NIS builds programmatic capacity for
purchasing and rehabilitating vacant and abandoned housing. CDCs with staffers who submit
more NIS queries sell a higher percentage of CDC-owned properties to new owners who pay
taxes. CDCs with staffers who submit more NIS queries also purchase a higher percentage of
properties that are eventually rehabilitated. These findings begin to fill gaps in knowledge
concerning both the neighborhood impacts of capacity building and the societal impacts of
information technology by (1) suggesting a method to define locally desirable impacts—
interviews with residents and development professionals; (2) implementing this method and
revealing more property tax paying owners and more physical rehabilitation as locally desirable
impacts; and (3) linking NIS use with these outcomes both qualitatively and quantitatively. The
research focuses on whether NIS contributed to CDCs doing more or better work—not whether
that work proved sufficient to change the neighborhood81
81 Thank you to Seema Iyer, Associate Director of the Jacob France Institute, which houses the Baltimore
Neighborhood Indicators Alliance (a NNIP partner), for this astute observation and phrasing (private
communication 7/16/2014).

193
This research did not find evidence that using NIS results in resource capacity building
or organizational capacity building. Cleveland’s role as a critical case for NIS together with a
failure to detect an impact on resource capacity and organizational capacity does not bode well
for these causal relationships—or, alternatively, does not bode well for the theoretical framework
and methods employed herein. The impact of NIS on resource capacity proved impossible to
isolate because interviewees could not provide a point of reference to establish a counterfactual.
In the literature review, I identified conflating use with impact as a weakness of previous NIS
research. I cannot now claim that the widespread use of NEO CANDO by CDC employees for
grant writing is its impact. The option remains tempting though because they are professionals.
If CDC employees use NIS for grant writing, it should have an impact on their capacity to win
grants. But, such reasoning dismisses the need for evaluation. Constructive work on resource
capacity may require identifying a new NIS or a new NIS user in order to establish a base case
and then return a year later. Organizational capacity may prove even more difficult to measure.
CDC employees in Cleveland discover uses for custom fields in the NST Web App through trial
and error. The benefits of this experimentation may take years to accrue and may take the form
of increased interdepartmental collaboration and increased retention of institutional knowledge
despite high staff turnover.
Geographic Information Systems (GIS), Public Participation Geographic
Information Systems (PPGIS), and Neighborhood Information Systems
(NIS)
Regardless of their variant of interest, geographic information system scholars have noted
a lack of in depth evaluations that consider the impact of use on users and their organizations.
The study described herein provides an in depth evaluation of system use on user outcomes. The
clear separation of system use from system outcomes and focus on impacts is itself a
contribution to those scholars and practitioners more interesting in technological impacts than
technological adoption. PPGIS and NIS research often examines public participation and
capacity building and therefore the findings discussed previously are equally relevant here as
well. Moreover, the mixed-methods approach may offer more persuasive evidence of impact
than the case study approach more common in PPGIS and NIS work.

194
The evaluation draws on an innovative dataset of outcomes imputed from multiple years
of administrative records. Scholars interested in nonprofit community development organizations
may wish to familiarize themselves of potential linkages between American Community Survey
tables, IRS 990 forms, CDBG and other funding compliance forms, and city property records.
Management Information Systems (MIS)
MIS researchers have called for investigations of diverse use scenarios, more attention to
change processes, collection of rich qualitative data, and multi-level (individual &
organizational) analysis. This research represents the first application of an MIS model to the
field of community development. CDC employees do not resemble the profit-focused and
efficiency-focused information systems users commonly described in the MIS literature and they
sometimes do not operate within a functioning housing market. CDC employees are focused on
future social gains that accrue from attracting new resident owners who pay property taxes and
from rehabilitating once dilapidated housing. They often focus on low income homebuyers rather
than seeking homebuyers who can provide the highest profits. In fact, the Cuyahoga County
Land Bank restricts the fees CDCs can charge new buyers for properties originating from its
inventory at below market prices. CDCs also receive properties from banks and individuals at
below market prices—sometimes even for free. Therefore, findings from this research clearly
add a new perspective to the more traditionally business focused MIS literature.
The research provides insights into workflows and change processes involving
information systems. Qualitative interviews revealed common tasks (see Table 16 on page 113)
executed with NIS that overlap multiple development functions. Two of these functions have
been diagrammed with the actors, tasks, and relationships to NIS clearly indicated (grant writing
on page 124 and residential rehabilitation on page 129).
MIS researchers have called for the development of multilevel models and application of
qualitative and mixed-methods to help fill gaps in the literature. This research demonstrates a
way to combine individual level and organizational level analysis by using qualitative methods
for the former and quantitative methods for the latter. Researchers considering a mixed-methods
approach might find the sequential exploratory strategy (Creswell 2009) followed herein useful.
Interviewing and observing technology users and building quantitative models based on those

195
interviews and observations can produce useful evaluations of the nature, magnitude, and
requirements of technology benefits. Qualitative methods may be employed to establish a
counterfactual and triangulate an impact through multiple respondents. This technique might
permit an evaluation to proceed even without longitudinal quantitative data or may supplement
such data when they exist.
Parameterized coding might also prove useful to scholars heeding the MIS call to
qualitative and mixed-methods work. . This technique allows researchers to iteratively turn
quotes into themes and themes into variables. Moreover, it facilitates chaining these variables
together and capturing complex phenomena and interactions. While I focused on information
systems, all these methods, techniques, and approaches should translate to a range of different
technologies including broadband, wireless, cell phones, and social media making them pertinent
not only to MIS researchers but to STS researchers as well.
Practical implications for Decision-Making with NIS
The emphasis on data quality, data breadth, and data-driven decision-making on NNIP
partner websites draws attention away from the need for sound decision-making processes.
Although partner websites frequently mention the need for collaboration and public participation,
the term data-driven implies that human beings only need to buckle-up for the ride and click
“start”. Data sit on a hard drive, appear on a computer screen, or hover over an audience during a
presentation. But data do not drive. Studies reveal that successful decisions depend on more than
data alone. After analyzing 1,048 business decisions, researchers found that data, modeling, and
formal analysis accounted for 8% of the success rate, organizational variables such as capital
availability accounted for 39% of the success rate, and the decision making process accounted
for 53% of the success rate (Lovallo and Sibony 2010).
The findings herein provide strong evidence that, despite the need for and use of data,
community development decisions are not data-driven. They are human-driven, context-based,
and—at best—data-guided. CDC employees conduct windshield surveys, walk house-to-house,
speak with residents and developers, and go to court. CDC employees query, enter and interpret
data—and finally incorporate all these data into decisions—decisions ultimately made by human
beings. Despite hyperbolic assertions to the contrary, this finding likely surprises no one. Unlike
equity trades, 73% of which automated systems initiated in the United States (Anon 2009) and

196
which requires multivariate analysis of means to optimize a single end (profit), planning
decisions require multivariate analysis of both ends and means. Planning decisions are wicked
problems that cannot be optimized (Rittel and Webber 1973) and therefore cannot be data-
driven. Instead, planners rely on data to frame problems and argue for and against solutions
(Dryzek 1989). NIS provide data but do not require that framing or deliberation occur.
This final chapter offers an exploratory example of integrating data access with decision-
making that ties NIS use with the WRAP decision-making process (Heath and Heath 2013). The
WRAP process is designed to counter cognitive biases that impair decision making. It is named
after the first letter of the first word of its four steps (widen, reality-test, attain, prepare). The
next paragraphs introduce each step, the cognitive bias the step counters, and practical tools
drawn from Heath and Heath’s (2013) book. I then offer examples of how community
development professionals can use NIS to apply some of the tools.
The first step is to widen the options under consideration, which counters narrow this-
or-that or yes-or-no framing common to decision-making. Tools for widening options include
avoiding false dichotomies, forcing brainstorming by imagining all current options as
impossible, and pursuing multiple options at once—via separate teams if possible. NIS excels at
finding all parcels that meet specific criteria and will return parcels that users may not have
thought pertinent. Lisa Smith, in the introductory vignette, might have benefited from this step
since she used the NIS only to check if she should buy a specific house—or not. Several CDC
employees already cast a wide net when looking for properties to rehabilitate. Users can also
develop criteria separately, identify matching parcels, and then meet to compare and contrast
findings. This technique is not currently practiced. But, the time savings that NIS provides when
processing multiple properties along multiple criteria makes this step of the WRAP process more
plausible to implement now in (frequently understaffed) CDCs than before NIS existed.
CDC employees in Cleveland already use creative thinking in their use of NIS. They
widen their data options by using a parcel-based system to learn about people, vetting potential
buyers based on the physical condition and tax-status of properties the potential buyer already
owns. They did not ask the simple binary question, “Should we buy a background report on this
potential buyer—or not?” Instead they asked, “How else can I get more information about this
person?”

197
The second step is to reality-test assumptions, which counters the tendency to seek
information that confirms preexisting notions. Tools for reality-testing include arranging for
constructive disagreement (e.g. devils’ advocate), seeking disconfirming information, trusting
average outcomes over more optimistic calculations, collecting qualitative data from individuals
close to the problem under investigation, and exploring the feasibility of options through small
experiments. CDC directors may wish to reality-test ideas by routinely assigning employees to
use NIS to find fault with an emerging plan. Many CDC employees already reality-test
assumptions through windshield surveys and discussions with residents that can result in
challenges to NIS data. Funders and developers can offer users tools to switch from parcel data
to pertinent neighborhood and city summaries. For example, suppose a CDC employee identifies
a parcel that she believes, after rehabbing, could be easily sold to a new owner occupant. Before
proceeding to acquire the parcel, she may want to check how many similar parcels owner
occupants have purchased in the last three months in her neighborhood and across the city. She
may also want to check how many similar parcels sit in CDC inventories, unsold. Providing
one-click access to this information would facilitate its inclusion in the decision-making process.
The third step is to attain distance before deciding, which counters the torrent of
emotions that often accompanies decision-making and distorts information. Tools for attaining
distance include imagining how one will feel about a decision 10 minutes, 10 months, and 10
years into the future, imagining how an outsider or successor may view the situation, and
imagining the advice one would give to an associate facing the same situation. Reviewing core
priorities can also provide distance from and perspective for specific decision-making instances.
Unfortunately, NIS cannot currently and perhaps never will be able to emulate or predict human
feelings about particular decisions. However, NIS developers may program NIS to prompt users
with a number of questions to explore the impact of emotions on their decision making. Such
questions may have helped Lisa Smith, the CDC employee from the introduction, realize that her
encounter with an investor she judged irresponsible had resulted in a narrow focus on a single
house instead of a broader investigation. Users may also wish to compare current NIS property
search criteria against core priorities to insure that the former conform to the latter. Such a
review may reveal, for example, that after many iterations, the current criteria appear well-suited
for market rate rehabilitations in conflict with a core priority to enable low-income
homeownership.

198
The fourth and final step is to prepare to be wrong, which counters the overconfidence
that decision-makers express in their own predictions about the future. Tools for this step include
imagining a range of future scenarios from extremely negative to extremely positive, imagining
that an option fails and predicting why, inserting tests to reveal the existence of a problem or
time points to assess progress, and insuring that all participants trust the fairness of the decision-
making process. NIS do not offer robust scenario planning functions though some users in
Cleveland CDCs insert elements of plans into the NST web application’s custom fields along
with follow up dates for revisiting options. NIS developers may wish to expand on this usage by
allowing users to maintain multiple lists of parcels and proposed actions. One list may record
acquisition and demolition priorities in a hypothetical worse housing market and another list may
record acquisition and demolition priorities in a hypothetical better housing market. Parcels with
the same proposed action in either market might be the safest bets. NIS developers might also
provide users with custom notifications on specific parcels or areas. The NIS would email the
user when parcel-level changes trigger a notification—for example, if any three houses on a
block sold with mortgages or with owner occupants. Such sales may indicate an improving
market and the need to revisit a more optimistic scenario.
Recommendations to NIS Developers and Funders
Leaders in funding organizations such as government agencies and private foundations
seeking to improve public participation and programmatic capacities of nonprofit organizations
like CDCs should control their expectations concerning the role of technology and act
strategically. This research provides evidence that some claims of NIS proponents hold true in
Cleveland. But Cleveland is a critical case and the lessons may not transfer easily. Moreover,
data cannot directly change facts on the ground. According to the qualitative and quantitative
findings, the decision to purchase and renovate residential property is based on the number of
such properties in the neighborhood, the condition of such properties, the owner occupancy rate,
and the strength of the local submarket (median sales price, number of sales). Access to
information does not immediately change any of the hard underlying realities. NIS funders and
developers may not have the expertise necessary to aid users in incorporating data access into an
effective decision making process. Scholars and practitioners who apply lessons from
psychology and other fields to decision-making may prove helpful. Importantly, this research

199
does not provide any evidence that NIS can help build completely new capacities within
organizations.
Only a single factor—widely known but only cursorily studied in this research—
predicted that an organization would acquire a new programmatic capacity. The factor was fiscal
threat. New CDBG funding contracts between the Cleveland Department of Community
Development and local CDCs require many of the latter to fulfill Code Enforcement Partnership
activities. CDCs that had never had code enforcement officers suddenly needed them. When
CDC directors learned their organizations may not be eligible for CDBG funding unless they
agreed to conduct code enforcement activities—they found a way to conduct those activities.
This “capacity building” had little to nothing to do with technology. There are likely ways,
though, of building programmatic capacities up from scratch without threatening grantees with
bankruptcy.
For example, interviews with CDC staff members suggest that some organizations
cultivate an ethic of serving residents while other organizations cultivate an ethic of empowering
residents. Switching from the former to the latter may require that funders convene a series of
sessions between CDC directors and professional consultants experienced in guiding clients
through a critical (re)evaluation of mission, strategies, and tactics. The directors of data
intermediaries may also benefit from critical reevaluation of the information technologies they
offer to users. The directors of data intermediaries may wish to re-envision their organizations as
not just democratizing data but providing a platform for partnerships.
This research reveals the potential of data intermediaries to improve working
relationships between disparate institutional actors. Usually data intermediaries add value to pre-
existing data and store them, allowing users to bypass the original source altogether. Instead, the
Poverty Center’s NST web application serves as the technology platform for the Cleveland Code
Enforcement Partnership, enabling CDC employees and city employees to communicate more
clearly and precisely by attaching comments to specific parcels. This finding renders the claims
of several NNIP partners that initially appeared up in the clouds suddenly more grounded. For
example, the Piton Foundation website says that the organization “uses information and
communication to bring people in Denver closer…through a deeper understanding of the
collective challenges they face.” (see Table 14 on page 99). This research shows how such

200
claims are plausible and testable. Interviewees in Cleveland quantified which data were available
prior to the NST web application and the time and effort required to receive those data. The
interviewees then quantified which data the NST web application made available and the time
and effort required to receive those data. The change described was significant and persuasive.
Neither the Poverty Center nor the NST web application caused this cooperation to occur.
A complex set of events—the mortgage foreclosure crisis, rise of vacant and abandoned
properties in Cleveland, loss of code inspectors, and historic precedent of a city-CDC partnership
–brought the parties together. Representatives of the Department of Housing, Department of
Community Development, and the majority of Cleveland’s CDCs all had something to gain from
better code enforcement. The partnership was not one of equals though. The Department of
Community Development’s control over a resource the CDCs desperately need—CDBG
allocations—all but assured that CDC staffers would bear the brunt of the labor. Still, even after
the intention to partner and underlying roles were established, the effort may have failed if the
NST web application had not provided an appropriate channel of communication and radically
improved data access.
Most partnerships can flourish without the help of a data intermediary. Face-to-face
communication, email, a shared calendar, and an occasional spreadsheet prove sufficient to keep
partners abreast of activities, events, and details of interest. These partners may still rely on the
same data intermediary to support their separate grant writing, analysis, and reporting endeavors.
But when partners must often and asynchronously share information about thousands of
multivariate items (i.e. properties), a data sharing platform offers many advantages—as
presented in this research.
The amount of data available to community development professionals and laypeople is
increasing rapidly, due in part to the efforts of NNIP and its partners. But tools enabling users to
collaboratively incorporate these data into multifaceted, multiyear plans are in their infancy. In a
more mature form, such tools would allow users to transform a subset of a data warehouse’s
inventory into a curated exhibit to guide plan writing and then to supplement the written report
through live links. A similar approach could someday lead to self-updating program evaluations
in which newly collected data move through a pipeline of statistical functions and conditional
logic, finally refreshing a pre-established report. Moving in this direction will likely require that

201
data intermediaries take the following steps (in order of importance):
1. Provide a user interface and database storage for user annotations. These may look like
the NST web application’s twenty custom fields, the comments available on many blogs,
or the revisions pages on Wikipedia.
2. Add a login and flexible group settings that allow users to share their annotations with
some users but not with all users. Formal governance arrangements (like the Cleveland
Code Enforcement Partnership), neighborhood planning processes, institutional
affiliations, geographic areas, and ad-hoc alliances may all serve the basis of a group in
terms of data sharing.
3. Allow users to construct and save simple sort and filter queries through an intuitive menu
system.
4. Allow users to write, save, and run more complex queries. The query language should be
common, stable, and well-documented, such as SQL.
5. Allow users to display query results graphically and assemble several graphics together
into a dashboard.
The addition of a login may conflict with the definition of data democratization that some data
intermediary directors and software developers hold dear. These individuals define information
access as unchecked and anonymous. Should such conflicts arise, one solution would be to
provide users with the option of a login that makes the annotation tools available.
Conclusions and future research
This research shows how data, relationships, city policies, neighborhood conditions, activist
residents, and the hard work of city and CDC employees result in capacity building and changes
on the ground—parcel by parcel. Many CDCs in Cleveland partner with the city to conduct code
enforcement. Their staffers access and share code enforcement data better than ever before
because of NIS. Employees in several CDCs have learned to use NIS to insure that their
residential parcels go to responsible owners who pay property taxes. Staff in one CDC mobilized
a housing committee through which residents advocated for their “fair share” of demolitions
using NIS data. When I started this research, I anticipated finding very little qualitative or

202
quantitative evidence that NIS had an identifiable impact. The research did reveal the potential
for technology to build network capacity, political capacity, and programmatic capacity in
specific situations.
A pressing need for information, a mature neighborhood information system, and a strong
community development system together define the critical case research design for NIS (see
page 47), but not all the criteria may be required to realize some impact on public participation
and capacity building. A pressing need for information is most important, since without urgency
potential users are unlikely to take the time to learn NIS. This research showed that the impact of
the technology was dependent—in part—on the prior availability of information. Places where
information has historically been difficult to find may have a very low bar for the level of NIS
necessary to realize an impact. For example, if potential users currently must drive to an office
and sort through piles of paperwork to find a property owner’s tax address—even a rudimentary
webpage should have a considerable impact on programmatic capacity. While a coordinated
community development system involving government agencies, nonprofit organizations, and
for-profit developers offers the ideal setting for the implementation and constructive use of NIS,
a single strong CDC might be able to build programmatic capacity in isolation—and even build
political capacity given sufficient interest in strengthening public participation. Improving
network capacity though likely requires peer organizations ready and willing to use NIS.
In future work in the same vein as this research, parcel-level, employee-level, and
organizational-level findings might be traced upward to fill the gap in knowledge about societal
impacts of capacity building and of PPGIS. Such an effort would start with a rehab or a new tax
payer tied—in part—to neighborhood information system use. It would then investigate other
residents’ willingness to invest in their own property after seeing the nearby rehab or investigate
increases to city-wide property tax collection due to the presence of new taxpayers.
The term data-driven is here to stay, although it falsely suggests that information and
technology push forward specific—and better—outcomes. They do not. The path for information
systems and technology to improve participation and build capacity therefore must begin with
dedicated institutional staff and residents who together decide that participation and higher
capacity are desirable ends.

203
Appendices

204
Appendix A: The Grammar of Parameterized Coding
The need to capture detail and nuance concisely gave rise to a coding approach I call
parameterized coding. Without this technique, every theme or detail requires its own code,
causing at least two problems:
1) Adding a code to a span of text takes time, whether in qualitative coding software or on
paper with colored markers. Adding five codes takes about five times as long as adding
one code.
2) Adding multiple codes to a single interview quote describing a complex instance of NIS
use may lead to ambiguity. For example, consider coding for only three factors (NIS
name, CDC activity, and impact) for the hypothetical quote:
“We use NEO CANDO for grant writing and the NST web application for finding
owners. I'm not certain that NEO CANDO leads to winning more grants but NST
definitely helps find homeowners more quickly.”
This may produce the following codes: NEO CANDO, NST, grant_writing, find_owners,
uncertain, and more_quickly. These codes fail to capture that NEO CANDO and NST are both
NIS, grant_writing and find_owners are both activities, and uncertain and more_quickly are both
claimed impacts. Prefixing each code with an appropriate short word adds meaning to the
individual codes. For example, the code nis:NEOCANDO emphasizes that “nis” is a variable
with a fixed number of valid values—such as the value “NEOCANDO”. However, these prefixes
do not convey that the quoted text describes two distinct syntactical chains linking NIS use, CDC
activity, and claimed impacts (or lack thereof). To address this problem, some qualitative
software packages permit creating two identical quotes from the same span of text that can be
coded separately. Parameterized coding permits this solution, but usually makes it unnecessary.
Parameterized coding permits formally and concisely describing very complex NIS use
scenarios in a single long code where subcomponents are separated by punctuation according to
a standardized grammar. Table 30 summarizes the grammar for those codes prefaced in the

205
database with a “t|” to signify code-type technology use
Table 30: Code grammar for an instance of technology use
Part Time Technology Development
Function
Database
Function
Assess-
ment
Compare
Elem
ent
p = past
n = now
f =
future
neo = NEO
CANDO
nst = NST web
application
nis = either
system
ot = other
software
low = low-tech
(paper)
na = no NIS by
choice
ge = general / all
sf = single family
mf = multi family
sa = site assembly
ce = code enforce
da = demolition
advocacy
fp = foreclosure
prevention
sl = side lot exp.
rp = resident partic
hp = historic pres.
gr = grant writing
ma = map assets
pl = other planning
pr = other program
id = identifying
matches
re = retrieving
details
up = updating
data
map = mapping
tf = tech failed
of = other
failure
tl = tech
limited
ad = adequate
(default)
ts = time
savings
bd = better
decisions
pn = possible
now, not
before
comp =
before/after
comparison
offered
Sep
arator
Ends
with a
colon
“:”
Ends with a
colon “:”
Multiple functions
separated by a
dash “-”. Ends
with a colon “:”
Multiple
functions
separated by a
dash “-”. Ends
Ends with a
colon “:” if the
next field
exists.
This is an
optional
element.

206
with a colon “:”
A quote describing how a CDC staffer currently receives calls from residents concerned about
problem properties, looks-up the property in the NST web application, and shares information
with the resident without entering any information from the call into the system or assessing the
system would be coded as t|n:nst:rp-ce:re:ad. The final element “ad” signifies that the process
appears “adequate” as it neither elicited praise nor derision from the interviewee. Since the quote
does not compare a workflow using NIS with a workflow not using NIS, the code does not
include the optional “comp” at the end.
Table 31 below summarizes the grammar for those codes prefaced in the database with a
“s|” to signify code-type subject

207
Table 31: Code grammar for other subjects
Part Heading Sub-Heading 1 Sub-Heading 2
Elem
ent
Process = lengthy
sections about
processes within a
CDC including
development
functions.
Same Development Function
elements as the “t” code type above
plus:
“data” = data sharing
“change” = process change
“turnover” = staff change
freq = frequency with which staff
performs the process
increase, decrease, or change =
adjustment between 2006 and
2012 performance of process
problem = challenge associated
with the process
success = description of success
for the process
collaboration =
distinct
organizations
working together
Same Development Function
elements as the “t” code type.
history = retrospective of the
relationship
problem = challenge associated
with collaboration
tech = about the
development of a
technology (NEO
CANDO or NST)
more than its use
Same Technology elements as the
“t” code type above.

208
Part Heading Sub-Heading 1 Sub-Heading 2
funding = about cdbg = Community Development
Block Grant
lihtc = Low Income Housing Tax
Credits
npi = Neighborhood Progress Inc.
nsp = Neighborhood Stabilization
Program
other = other funding sources
private = private foundations
problem = challenge associated
with funding
reporting = monitoring required
by funding
goal = purpose of
success criteria for a
given Development
Function
Same Development Function
elements as the “t” code type above
plus “data” for quotes about data
sharing.
transfer = finding responsible
owner as goal (usually for single
family)
improve = investment as goal
(usually for single family)
cdc
jurisdiction = about service areas
and other CDC geographies
change = adjustment (usually to
jurisdiction)
training npi = Neighborhood Progress Inc.
(teaches, not CWRU)
nst = NST web application
yes = completed training
no = did not complete training

209
Part Heading Sub-Heading 1 Sub-Heading 2
targeting neighborhoods
houses
Sep
arator
Ends with a colon
“:”
Ends with a colon “:” Optional. Ends with a colon “:”
For example, the interview quote: “People drop in with questions about nearby properties about
twice a week. I also receive phone calls. Mostly random residents. morf desaercni evah sllaC..
stnediser …” was coded as s|process:rp:freq:increase. This code signals that the process of
resident participation, as measured by frequency of contact, increased in the CDC, according to
the interviewee.

210
Appendix B: Interview results by Development Function
P=person
O=organization
Total=Total number of interviews
The following are not mutually exclusive
Confirm=Confirm NIS use
Proof=Provide evidence of benefit
Deny/Qualify=Either deny benefit or qualify the benefit
For example, thirteen people discussed single family rehab or new construction in interviews.
Twelve of those people reported using NIS for this activity. Five of those provided proof that
NIS was helpful.
Table 32: Interview results by Development Function
Development Function
Total Confirm Proof Deny/Qualify
P O P O P O P O
single family (rehab/new) 13 9 12 8 5 3 2 2
code enforcement 12 7 11 7 5 3 6 3
resident outreach & participation 11 6 8 5 0 0 8 5
grant writing 8 5 7 5 1 1 2 2
demolition advocacy 8 5 7 5 2 2 4 2
multi,commercial & assembly 8 4 7 3 5 2 2 2
other programming 6 4 4 3 1 1 4 2

211
foreclosure prevention 5 5 3 3 0 0 3 3
sidelot expansion 5 3 2 2 1 1 3 1
planning 3 3 0 0 0 0 3 3
historic preservation 3 1 3 1 0 0 3 1
Total of 49 people from 28 different CDCs
This table only includes assertions made by a CDC staff person about operations at his or her
own CDC. It does not include assertions made by a CDC staff person about the operations at
other CDCs (including a past employer) or assertions made by a staff person at another nonprofit
or a city agency.

212
Appendix C: Regression Diagnostic Plots
Figure 15: Diagnostic Plots for Zero Inflated Model of CDC Housing Purchases, Step 1
(Binomial) with Autoregressive Correlation Structure
Figure 16: Diagnostic Plots for Zero Inflated Model of CDC Housing Purchases, Step 2
(Weighted by Step 1 Estimates) with Autoregressive Correlation Structure

213
Figure 17: Diagnostic Plots for Model of CDC Housing Transfers (Autoregressive)
Figure 18: Diagnostic Plots for Model of CDC Housing Rehabs (Autoregressive)

214
Bibliography
Ali, Robbie, David Wheitner, Evelyn O. Talbott, and Jeanne V Zborowski. 2007. “Connecting
Environmental Health Data to People and Policy: Integrating Information and Mobilizing
Communities for Environmental Public Health Tracking.” Journal of community health 32(5):357–
74. Retrieved November 09, 2014 (http://www.ncbi.nlm.nih.gov/pubmed/17922206).
Al-Kodmany, K. 1999. “Using Visualization Techniques for Enhancing Public Participation in Planning
and Design: Process, Implementation, and Evaluation.” Landscape and Urban Planning 45(1):37–
45. Retrieved (http://linkinghub.elsevier.com/retrieve/pii/S0169204699000249).
Al-Kodmany, Kheir. 2012. “Utilizing GIS in Nonprofit Organizations for Urban Planning Applications:
Experiences from the Field.” Journal of Geographic Information System 04(04):279–97. Retrieved
February 12, 2013
(http://www.scirp.org/journal/PaperDownload.aspx?DOI=10.4236/jgis.2012.44034).
Anon. 2009. “The Real Story of Trading Software Espionage.” InformationWeek WallStreet &
Technology, July 10. Retrieved (http://www.wallstreetandtech.com/trading-technology/the-real-
story-of-trading-software-espionage/a/d-id/1262125?).
Anon. 2010. “CitiStat / Learn About CitiStat.” City of Baltimore. Retrieved October 05, 2014
(http://www.baltimorecity.gov/Government/AgenciesDepartments/CitiStat/LearnaboutCitiStat.aspx)
.
Anon. 2011. City of Cleveland Neighborhood Stabilization Program Amendment to FY 2010-2011
Community Development Block Grant Action Plant. Retrieved (http://www.cleveland-
oh.gov/clnd_images/communitydevelopment/NSP3SubstantialAmendment.pdf).
Anon. n.d. “Mission & Goals.” Community Link. Retrieved (http://communitylinkcr.org/about/mission-
goals/).
Anon. n.d. “The Data.” Minnesota Compass. Retrieved (http://www.mncompass.org/about/the-data.php).

215
Arnstein, Sherry R. 1969. “A Ladder Of Citizen Participation.” Journal of the American Institute of
Planners 35(4):216–24. Retrieved March 16, 2012
(http://www.tandfonline.com/doi/abs/10.1080/01944366908977225).
Ash Center. 2010. “2010 Bright Ideas.” Ash Center for Democractic Governance and Innovation.
Ballantine, J., M. Bonner, and M. Levy. 1996. “The 3-D Model of Information Systems Success: The
Search for the Dependent Variable Continues.” Information Resources … 9(4). Retrieved November
05, 2014 (http://www.igi-global.com/article/model-information-systems-success/51027).
Ballinger, Gary a. 2004. “Using Generalized Estimating Equations for Longitudinal Data Analysis.”
Organizational Research Methods 7(2):127–50. Retrieved January 21, 2014
(http://orm.sagepub.com/cgi/doi/10.1177/1094428104263672).
Barber, B. R. 1984. Strong Democracy: Participatory Politics for a New Age. Berkeley: University of
California Press.
Barley, SR. 1986. “Technology as an Occasion for Structuring: Evidence from Observations of CT
Scanners and the Social Order of Radiology Departments.” Administrative science quarterly
31(1):78–108. Retrieved August 23, 2012 (http://www.jstor.org/stable/10.2307/2392767).
Bartis, Eszter and Nathalie Mitev. 2008. “A Multiple Narrative Approach to Information Systems Failure:
A Successful System That Failed.” European Journal of Information Systems 17(2):112–24.
Retrieved October 19, 2013 (http://www.palgrave-journals.com/doifinder/10.1057/ejis.2008.3).
Bartkus, Barbara R. and Myron Glassman. 2008. “Stakeholder Management Do Firms Practice What
They Preach ? Mission Management Statements and Stakeholder Management.” Journal of Business
Ethics 83(2):207–16.
Behn, Robert D. 2005. “The Core Drivers of CitiStat: It’s Not Just About the Meetings and the Maps.”
International Public Management Journal 8(3):295–319. Retrieved
(http://www.tandfonline.com/doi/abs/10.1080/10967490500439594).
Bell, Daniel. 1969. “The Idea of a Social Report.” Public Interest 15(Spring):72–84.

216
Bernard, H. Rusell and Gery W. Ryan. 2010. Analyzing Qualitative Data Systematic Approaches. Los
Angeles: Sage.
Bimber, Bruce. 1994. “Three Faces of Technological Determinism.” Pp. 79–100 in Does Technology
Drive History? The Dilemma of Technological Determinism. Retrieved August 01, 2012
(http://scholar.google.com/scholar?hl=en&btnG=Search&q=intitle:Three+Faces+of+Technological
+Determinism#0).
Bishop, S. W. 2009. “Building Programmatic Capacity at the Grassroots Level: The Reactions of Local
Nonprofit Organizations to Public Participation Geographic Information Systems.” Nonprofit and
Voluntary Sector Quarterly 39(6):991–1013. Retrieved August 24, 2011
(http://nvs.sagepub.com/cgi/doi/10.1177/0899764009334984).
Bolker, Benjamin M. et al. 2009. “Generalized Linear Mixed Models: A Practical Guide for Ecology and
Evolution.” Trends in ecology & evolution 24(3):127–35. Retrieved January 09, 2014
(http://www.ncbi.nlm.nih.gov/pubmed/19185386).
Borders, S., J. Edwards, and A. Miller. 2013. “Lessons From Patchwork Nation: A New Framework for
Building Community Indicators.” The Foundation Review 5(3). Retrieved September 30, 2014
(http://scholarworks.gvsu.edu/tfr/vol5/iss3/4/?utm_source=scholarworks.gvsu.edu%2Ftfr%2Fvol5%
2Fiss3%2F4&utm_medium=PDF&utm_campaign=PDFCoverPages).
Bowman, Woods. 2011. “Financial Capacity and Sustainability of Ordinary Nonprofits.” 22(1).
Bratt, Rachel G. 2009. “Challenges for Nonprofit Housing Organizations Created By the Private Housing
Market.” Journal of Urban Affairs 31(1):67–96. Retrieved (http://doi.wiley.com/10.1111/j.1467-
9906.2008.00429.x).
Brecht, Bertolt. 1966. “Writing the Truth: Five Difficulties.” in Galileo, edited by Eric Bentley. New
York: Grove Press.
Brette, Olivier. 2003. “Thorstein Veblen’s Theory of Institutional Change: Beyond Technological
Determinism.” European Journal of the History of Economic Thought. Retrieved July 30, 2012
(http://books.google.com/books?hl=en&lr=&id=JK1lVtA_PGUC&oi=fnd&pg=PR9&dq=Thorstein
+Veblen&ots=njGbLhKTSm&sig=uStofrmE3eioe1g6WZyONMOZIQE).

217
Campbell, Scott. 1996. “Green Cities , Growing Cities , Just Cities ?”
Castro, Daniel and Rob Atkinson. 2009. “Ten Ideas for Policymakers to Drive Digital Progress.” IEEE
internet computing March/Apri. Retrieved November 09, 2014
(http://cat.inist.fr/?aModele=afficheN&cpsidt=21474219).
Chandler, Arnold, G. Thomas Kingsley, Josh Kirschenbaum, and Kathryn L. S. Pettit. 2006. The
Potential of Parcel-Based GIS in Community Development and Urban Land Management.
Chaskin, R. J. 2001. “Building Community Capacity: A Definitional Framework and Case Studies from a
Comprehensive Community Initiative.” Urban Affairs Review 36(3):291–323. Retrieved March 01,
2011 (http://uar.sagepub.com/cgi/doi/10.1177/10780870122184876).
Chaskin, Robert, Prudence Brown, Sudhir Venkatesh, and Avis Vidal. 2001. Building Community
Capacity. Hawthorne, NY: Aldine De Gruyter.
Chaskin, Robert, Robert Goerge, Ada Skyles, and Shannon Guiltinan. 2006. “Measuring Social Capital:
An Expoloration in Community-Research Partnership.” Journal of Community Psychology
34(4):489–514.
Conlin, Michelle. 2013. “Special Report: The Latest Foreclosure Horror: The Zombie Title.” Reuters,
January 10. Retrieved (http://www.reuters.com/article/2013/01/10/us-usa-foreclosures-zombies-
idUSBRE9090G920130110).
Cooper, Anderson. 2011. “Mubarak Steps Down; Crowds Still at Tahrir Square.” CNN, February 21.
Coulton, Claudia and Kathy Hexter. 2010. Facing the Foreclosure Crisis in Greater Cleveland: What
Happened and How Communities Are Responding. Cleveland.
Cowan, Dave, Karen Morgan, and Morag Mcdermont. 2009. “Nominations: An Actor-Network
Approach.” Housing Studies 24(3):281–300. Retrieved March 01, 2011
(http://www.informaworld.com/openurl?genre=article&doi=10.1080/02673030902814598&magic=
crossref||D404A21C5BB053405B1A640AFFD44AE3).
Craig, William J. and Sarah A. Elwood. 1998. “How and Why Community Groups Use Maps and
Geographic Information.” Cartography & Geographic Information Systems 25(2):95 – .

218
Creswell, John W. 2009. Research Design Qualitative, Quantitative, and Mixed Methods Approaches.
Third Edit. Thousand Oaks, CA: Sage Publications.
CRI. n.d. “About / Mission.” Website of Community Research Institute. Retrieved
(http://cridata.org/about.aspx).
CURA. n.d. “Programs at CURA.” Website of the Center for Urban and Regional Affairs. Retrieved
(http://www.cura.umn.edu/program-overview).
Davidoff, Paul. 1965. “Advocacy and Pluralism in Planning.” Journal of the American Institute of
Planners 31(4):331–37. Retrieved (file:///C:/Documents and Settings/David/My
Documents/DOC_ARCHIVE/d/DAVIDOFF(1965)_Advocacy_Pluralism_Planning.pdf).
Davis, Dave. 2013. “More than 17,000 Northeast Ohio Homes Aren’t Receiving Water and Appear to Be
Vacant.” The Plain Dealer, March.
Davis, FD, RP Bagozzi, and PR Warshaw. 1989. “User Acceptance of Computer Technology: A
Comparison of Two Theoretical Models.” Management science 35(8):982–1003. Retrieved
November 06, 2014 (http://pubsonline.informs.org/doi/abs/10.1287/mnsc.35.8.982).
DC LISC. n.d. “What We Do > Strategies.” Website of DC Local Initiatives Support Corporation.
Retrieved (http://www.lisc.org/washington_dc/what_we_do/strategies.php).
DeFilippis, James. 2008. “Community Control and Development: The Long View.” in The Community
Development Reader, edited by James DeFilippis and Susan Seagert. New York: Routledge.
DeFilippis, James. 2010. “The Myth of Social Capital in Community Development.” Housing Policy
Debate (March 2012):37–41.
DeFilippis, James and Susan Saegert, eds. 2008. The Community Development Reader. New York:
Routledge.
DeLone, William H. and Ephraim R. McLean. 1992. “Information Systems Success: The Quest for the
Dependent Variable.” Information Systems Research 3(1):60–95. Retrieved
(http://isr.journal.informs.org/cgi/doi/10.1287/isre.3.1.60).

219
DeLone, William H. and Ephraim R. McLean. 2003. “The DeLone and McLean Model of Information
Systems Success: A Ten-Year Update.” Journal of Management Information Systems 19(4):9–30.
DeRienzo, Harold. 2008. “Community Organizing for Power and Democracy: Lessons Learned from a
Life in the Trenches.” in The Community Development Reader, edited by J. DeFilippis and S.
Saegert. New York: Routledge.
Dewar, Margaret. 2009. What Helps or Hinders Nonprofit Developers in Reusing Vacant , Abandoned ,
and Contaminated Property ? Findings from Detroit and Cleveland.
Dey, Ian. 1999. Grounding Grounded Theory. Academic Press.
Drummond, William J. and Steven P. French. 2008. “The Future of GIS in Planning: Converging
Technologies and Diverging Interests.” Journal of the American Planning Association 74(2):161–
74. Retrieved October 03, 2011
(http://www.tandfonline.com/doi/abs/10.1080/01944360801982146).
Dryzek, John S. 1989. “Policy Sciences of Democracy.” Polity 22(1):97.
Elwood, Sarah. 2002. “The Impacts of GIS Use for Neighborhood Revitalization in Minneapolis.” Pp.
77–88 in Community Participation and geographic information systems. London: Taylor & Francis.
Elwood, Sarah. 2008. “Grassroots Groups as Stakeholders in Spatial Data Infrastructures: Challenges and
Opportunities for Local Data Development and Sharing.” International Journal of Geographical
Information Science 22(1):71–90. Retrieved April 17, 2012
(http://www.tandfonline.com/doi/abs/10.1080/13658810701348971).
Enterprise. 2010. Stabilizing Neighborhoods by the Numbers: A Case Study of Cleveland’s NEO CANDO
Data System. Columbia, MD.
Enterprise Community Partners. n.d. “See Our Work in Ohio.”
Epstein, Dmitry, Erik C. Nisbet, and Tarleton Gillespie. 2011. “Who’s Responsible for the Digital
Divide? Public Perceptions and Policy Implications.” The Information Society 27(2):92–104.
Retrieved October 28, 2014 (http://www.tandfonline.com/doi/abs/10.1080/01972243.2011.548695).

220
Etzioni, Amitai. 1993. The Spirit of Community: Rights, Responsibilities, and the Communitarian
Agenda. New York: Crown Publishers.
Frater, Mark, Colleen M. Gilson, and Ronald J. H. O’Leary. 2009. The City of Cleveland Code
Enforcement Partnership. Cleveland.
Fredericksen, Patricia and Rosanne London. 2000. “Disconnect in the of Hollow State : In The Pivotal
Role Capacity Organizational Development Organizations.” Public Administration 60(3):230–39.
Friedmann, John. 1987. Planning in the Public Domain: From Knowledge to Action. Princeton: Princeton
University Press.
Galster, George, Diane Levy, Noah Sawyer, Kenneth Temkin, and Chris Walker. 2005. The Impact of
Community Development Corporations on Urban Neighborhoods.
Germann, Kathy and Doug Wilson. 2004. “Organizational Capacity for Community Development in
Regional Health Authorities: A Conceptual Model.” Health promotion international 19(3):289–98.
Retrieved October 12, 2014 (http://www.ncbi.nlm.nih.gov/pubmed/15306613).
Ghose, Rina. 2011. “Politics and Power in Participation and GIS Use for Community Decision Making.”
Pp. 423–38 in The SAGE Handbook of GIS and society.
Gigler, Bjorn-Soren. 2004. “Including the Excluded--Can ICTs Empower Poor Communities? Towards
an Alternative Evaluation Framework Based on the Capability Approach.” in International
Conference on the Capability Approach. Pavia, Italy: 4th International Conference on the Capability
Approach.
Glickman, N. J. and L. J. Servon. 1998. “More than Bricks and Sticks : Five Components of Community
Development Corporation Capacity More than Bricks and Sticks : Five Components.” Housing
Policy Debate 9(3):497–539.
Glickman, N. J. and L. J. Servon. 2003. “By the Numbers: Measuring Community Development
Corporations’ Capacity.” Journal of Planning Education and Research 22(3):240–56. Retrieved
March 18, 2012 (http://jpe.sagepub.com/cgi/doi/10.1177/0739456X02250314).

221
Grant, David, Richard Hall, Nick Wailes, and Christopher Wright. 2006. “The False Promise of
Technological Determinism: The Case of Enterprise Resource Planning Systems.” New Technology,
Work and Employment 21(1):2–15. Retrieved (http://doi.wiley.com/10.1111/j.1468-
005X.2006.00159.x).
Grint, Keith and Steve Woolgar. 1997. “Theories of Technology.” Pp. 6–38 in The Machine at Work:
Technology, Work and Organization.
Halekoh, Ulrich, S. Højsgaard, and J. Yan. 2006. “The R Package Geepack for Generalized Estimating
Equations.” Journal of Statistical Software 15(2):9–10. Retrieved February 20, 2014
(http://www.jstatsoft.org/v15/i02/paper).
Hanley, J. a. 2003. “Statistical Analysis of Correlated Data Using Generalized Estimating Equations: An
Orientation.” American Journal of Epidemiology 157(4):364–75. Retrieved January 21, 2014
(http://aje.oupjournals.org/cgi/doi/10.1093/aje/kwf215).
Harris, Britton. 1989. “Beyond Geographic Information Systems.” Journal of the American Planning
Association 55(1):85–90.
Harvey, Francis. 2001. “Constructing GIS: Actor Networks of Collaboration.” URISA Journal 13(1):29–
37. Retrieved August 31, 2012 (http://www.oifii.org/oifii/segmentation-voronoi/edwards-et-al/urisa-
vol13no1_2001.pdf#page=29).
Heath, Chip and Dan Heath. 2013. Decisive: How to Make Better Choices in Life and Work. New York:
Crown Business.
Hexter, Kathryn W., Ziona Austrian, and Candi Clouse. 2013. Living Cities: The Integration Initiative in
Cleveland Ohio.
Ho, Alfred Tat-kei. 1999. “Reinventing Local Governments and the E-Government Initiative.” Public
Administration Review.
Howard, Philip N. 2011. The Digital Origins of Dictatorship and Democracy: Information Technology
and Political Islam. New York: Oxford University Press.

222
Howell, Embry M., Kathryn L. S. Pettit, Barbara a Ormond, and G. Thomas Kingsley. 2003. “Using the
National Neighborhood Indicators Partnership to Improve Public Health.” Journal of public health
management and practice : JPHMP 9(3):235–42. Retrieved
(http://www.ncbi.nlm.nih.gov/pubmed/12747321).
HUD. 2010. HUD Strategic Plan FY2010-2015. Retrieved
(http://portal.hud.gov/hudportal/documents/huddoc?id=DOC_4436.pdf).
Hwang, Hokyu and Walter W. Powell. 2009. “Charity : The Influences of Professionalism in the
Nonprofit Sector.” Administrative Science Quarterly 54:268–98.
Hwang, S. and M. Hoffman. 2009. “In Pursuit of the Effective Neighborhood Information System: User-
Friendliness and Training.” Government Information Quarterly 26(1):166–73. Retrieved December
25, 2010 (http://linkinghub.elsevier.com/retrieve/pii/S0740624X08000956).
Hwang, Sungsoo. 2006. “Role of University in the Partnership for IT Innovations of Community
Development: Utilizing Universities’ Assets for ‘Neighborhood Information System’Development.”
Public Administration and Management: An Interactive … 11(2):75–84,86–100. Retrieved
November 09, 2014 (http://www.spaef.com/article/127/Role).
Ifinedo, Princely and Nazmun Nahar. 2009. “Interactions between Contingency, Organizational IT
Factors, and ERP Success.” Industrial Management & Data Systems 109(1):118–37. Retrieved
October 19, 2013 (http://www.emeraldinsight.com/10.1108/02635570910926627).
Jick, TD. 1979. “Mixing Qualitative and Quantitative Methods: Triangulation in Action.” Administrative
science quarterly 24:602–11. Retrieved May 17, 2013
(http://www.jstor.org/stable/10.2307/2392366).
Kingsley, G. Thoma. 2003. “Housing, Health, and the Neighborhood Context.” American Journal of
Preventive Medicine 24(3):6–7. Retrieved November 09, 2014
(http://linkinghub.elsevier.com/retrieve/pii/S0749379702006517).
Kingsley, G. Thomas. 1998. Neighborhood Indicators : Taking Advantage of the New Potential.
Kingsley, Thomas et al. 2009. Addressing the Foreclosure Crisis: Action-Oriented Research in Three
Cities. Washington, D.C.
223
Kingsley, Thomas G. 1999. Building and Operating Neighborhood Indicator Systems: A Guidebook. The
Urban Institute. Retrieved March 11, 2012 (http://www.urban.org/url.cfm?ID=409297).
Kingsley, Thomas G. and Kathryn L. S. Pettit. 2008. Data and Decisions : Parcel-Level Information
Changing the Way Business Gets Done.
Kingsley and Treuhaft. 2008. “Development_Land_Information_Systems.” Annual review of population
law.
Kirkpatrick, L. O. 2007. “The Two ‘Logics’ of Community Development: Neighborhoods, Markets, and
Community Development Corporations.” Politics & Society 35(2):329–59. Retrieved April 27, 2012
(http://pas.sagepub.com/cgi/doi/10.1177/0032329207300395).
Kleine, Dorothea. 2010. “ICT4What ? - Using the Choice Framework to Operationalise the Capability
Approach to Development.” Journal of International Development 22:674–92.
Krouk, Danny, Bill Pitkin, and Neal Richman. 2000. “Internet Based Neighborhood Information
Systems : A Comparative Analysis.” Pp. 275–97 in Community Informatics, edited by Michael
Gurstein. Idea Group Publishing.
Kubisch, Anne C., Patricia Auspos, Prudence Brown, and Tom Dewar. 2010. Voices from the Field III.
Kwan, Mei-Po. 2002. “Feminist Visualization: Re-Envisioning GIS as a Method in Feminist Geographic
Research.” Annals of the Association of American Geographers 92(4):645–61. Retrieved March 31,
2012 (http://www.tandfonline.com/doi/abs/10.1111/1467-8306.00309).
Kymlicka, Will and Wayne Norman. 1994. “Return of the Citizen : A Survey of Recent Work on
Citizenship Theory and Wayne Norman.” Ethics 104(2):352–81.
Latour, Bruno. 2007. Reassembling the Social: An Introduction to Actor-Network-Theory. Oxford:
Oxford University Press.
Latour, Bruno and Steve Woolgar. 1979. Laboratory Life The Construction of Scientific Facts. Beverly
Hills: Sage Publication.

224
Leavitt, Neal. 2009. “Is Cloud Computing Really Ready for Prime Time.” Computer 41(1):15–20.
Retrieved August 23, 2013 (http://www.engr.sjsu.edu/fayad/current.courses/cmpe203-
fall2012/docs/lectureB3/03-CO_0809-CloudComputingReadyForPrimetime.pdf).
Leitner, Helga, Sarah Elwood, Eric Sheppard, Susanna Mcmaster, and Robert Mcmaster. 2000. “Modes
of GIS Provision and Their Appropriateness for Neighborhood Organizations : Examples from
Minneapolis and St . Paul , Minnesota.” URISA Journal 12(4):45–58.
Lenhart, Amanda. 2000. Who’s Not Online. Washington DC.
Leonardi, Paul M. 2007. “Activating the Informational Capabilities of Information Technology for
Organizational Change.” Organization Science 813–32.
Leonardi, Paul M. and Stephen R. Barley. 2010. “What’s Under Construction Here? Social Action,
Materiality, and Power in Constructivist Studies of Technology and Organizing.” The Academy of
Management Annals 4(1):1–51. Retrieved March 01, 2012
(http://www.tandfonline.com/doi/abs/10.1080/19416521003654160).
Lewis-Beck, Michael. 1980. Applied Regression An Introduction. Newbury Park, Calif.: Sage
Publications.
LISC. 2009. Improving Philadelphia’s Vacant Property Programs. Philadelphia.
Lovallo, Dan and Olivier Sibony. 2010. “The Case for Behavioral Strategy.” McKinsey Quarterly March.
Retrieved (http://www.mckinsey.com/insights/strategy/the_case_for_behavioral_strategy).
Lowe, J. 2008. “Limitations of Community Development Partnerships: Cleveland Ohio and
Neighborhood Progress Inc.” Cities 25(1):37–44. Retrieved March 01, 2011
(http://linkinghub.elsevier.com/retrieve/pii/S0264275107001138).
Lowndes, V. 1995. “Citizenship and Urban Politics.” Pp. 160–80 in Theories of Urban Politics, edited by
D. Judge, G Stoker, and H. Wolman. London: Sage Publication.
Lowry, PB, GG Karuga, and VJ Richardson. 2007. “Assessing Leading Institutions, Faculty, and Articles
in Premier Information Systems Research Journals.” Communications of the Association for

225
Information Systems 20. Retrieved October 25, 2014
(http://aisel.aisnet.org/cgi/viewcontent.cgi?article=2599&context=cais).
Lusthaus, Charles, Marie--Helen Adrien, Anderson Gary, Fred Carden, and George Plinio Montalvan.
2002. Organizational Assessment: A Framework for Improving Performance. Washington DC &
Ottawa, Canada: Inter-American Development Bank & International Development Research Centre.
Retrieved October 25, 2014
(http://books.google.com/books?hl=en&lr=&id=HrfVlz_5HIgC&oi=fnd&pg=PR9&dq=Organizatio
nal+Assessment+A+Framework+for+Improving+Performance&ots=AUf7V4UJqC&sig=7We9zQy
dwzMCHDwPAbkp5WZ4p0s).
Maclellan-Wright, Mary Frances et al. 2007. “The Development of Measures of Community Capacity for
Community-Based Funding Programs in Canada.” Health promotion international 22(4):299–306.
Retrieved November 03, 2010 (http://www.ncbi.nlm.nih.gov/pubmed/17942594).
Markowitz, L. and K. W. Tice. 2002. “Paradoxes of Professionalization: Parallel Dilemmas in Women’s
Organizations in the Americas.” Gender & Society 16(6):941–58. Retrieved April 08, 2013
(http://gas.sagepub.com/cgi/doi/10.1177/089124302237896).
McKinsey & Company. 2001. Effective Capacity Building in Nonprofit Organizations.
McQuarrie, Michael and Norman Krumholz. 2011. “Institutionalized Social Skill and the Rise of
Mediating Organizations in Urban Governance: The Case of the Cleveland Housing Network.”
Housing Policy Debate 21(3):421–42. Retrieved March 23, 2012
(http://www.tandfonline.com/doi/abs/10.1080/10511482.2011.591408).
MetroGIS. n.d. “About MetroGIS.” Website of MetroGIS. Retrieved
(http://www.metrogis.org/about/index.shtml).
Meyerson, Martin. 1956. “Building the Middle-Range Bridge for Comprehensive Planning.” Journal of
the American Institute of Planners 22(2):58–64.
Morrissey, Janice. 2000. “Citizen Participation : Lessons from Learning Teams in Rural EZ / EC
Communities.” Community Development Journal 35(1).

226
Mueller, Benjamin, Goetz Viering, Christine Legner, and Gerold Riempp. 2010. “Understanding the
Economic Potential of Service-Oriented Architecture.” Journal of Management Information Systems
26(4):145–80. Retrieved November 06, 2014
(http://mesharpe.metapress.com/openurl.asp?genre=article&id=doi:10.2753/MIS0742-1222260406).
Myers, Dowell. 1997. “Anchor Points for Planning’s Identification.” Journal of Planning Education and
Research 16:223. Retrieved July 18, 2012 (http://jpe.sagepub.com/content/16/3/223.short).
Natarajan, S., S. Lipsitz, M. Parzen, and S. Lipshultz. 2007. “A Measure of Partial Association for
Generalized Estimating Equations.” Statistical Modelling 7(2):175–90. Retrieved
(http://smj.sagepub.com/cgi/doi/10.1177/1471082X0700700204).
NCCED. 2006. Reaching New Heights. Washington DC.
Nedovic-Budic, Z. 1999. “Evaluating the Effects of GIS Technology: Review of Methods.” Journal of
Planning Literature 13(3):284–95. Retrieved December 25, 2010
(http://jpl.sagepub.com/cgi/doi/10.1177/08854129922092405).
Negroponte, Nicholas. 1996. Being Digital. Vintage.
Neighborhood Progress Inc. 2011. “Strategic Investment Initiative.”
Nelson, Lisa. 2008. Foreclosures Filings in Cuyahoga County.
NEO CANDO. n.d. “About NEO CANDO.” Website for Northeast Ohio Community and Neighborhood
Data for Organizing (NEO CANDO). Retrieved
(http://neocando.case.edu/cando/index.jsp?tPage=about).
Newbert, Scott L. 2007. “Empirical Research on the Resource-Based View of the Firm: An Assessment
and Suggestions for Future Research.” Strategic Management Journal 28(2):121–46.
Niquette, Mark. 2011. “Cleveland’s Zombie House Scourge.” Financial Post, November 12. Retrieved
(http://business.financialpost.com/2011/12/21/clevelands-zombie-house-scourge/).
NNIP. n.d. “Funders.” Website of the National Neighborhood Indicators Partnership. Retrieved
(http://www.neighborhoodindicators.org/about-nnip/funders).

227
NNIP. n.d. “NNIP Concept.” Website of the National Neighborhood Indicators Partnership. Retrieved
(http://www.neighborhoodindicators.org/about-nnip/nnip-concept).
Nu’Man, Jeanette, Winifred King, Amee Bhalakia, and Shaniece Criss. 2007. “A Framework for Building
Organizational Capacity Integrating Planning, Monitoring, and Evaluation.” Journal of Public
Health … January:24–32. Retrieved October 25, 2014
(http://journals.lww.com/jphmp/Abstract/2007/01001/A_Framework_for_Building_Organizational_
Capacity.6.aspx).
Oliver, M. 2011. “Technological Determinism in Educational Technology Research: Some Alternative
Ways of Thinking about the Relationship between Learning and Technology.” Journal of Computer
Assisted Learning (November 2010):no – no. Retrieved August 09, 2011
(http://doi.wiley.com/10.1111/j.1365-2729.2011.00406.x).
Osborne, David and Ted Gaebler. 1992. Reinventing Government: How the Entrepreneurial Spirit Is
Transforming the Public Sector. Plume.
Pepe, M. S. and G. L. Anderson. 1994. “A Cautionary Note on Inference for Marginal Regression Models
with Longitudinal Data and General Correlated Response Data.” Communications in Statistics -
Simulation and Computation 23:939–51.
Petter, Stacie, William DeLone, and Ephraim McLean. 2008. “Measuring Information Systems Success:
Models, Dimensions, Measures, and Interrelationships.” European Journal of Information Systems
17(3):236–63. Retrieved July 12, 2014 (http://www.palgrave-
journals.com/doifinder/10.1057/ejis.2008.15).
Pickles, John. 1997. “Tool or Science?GIS, Technoscience, and the Theoretical Turn.” Annals of the
Association of American Geographers 87(2):363–72. Retrieved December 25, 2010
(http://www.tandfonline.com/doi/abs/10.1111/0004-5608.00058).
Planas Llado, a. and P. Soler Maso. 2011. “Design and Application of a System of Evaluation Indicators
for Municipal Cultural Policies.” Evaluation 17(3):277–91. Retrieved November 09, 2014
(http://evi.sagepub.com/cgi/doi/10.1177/1356389011402180).
Putnam, R. 1995. “Bowling Alone: America’s Declining Social Capital.” Journal of Democracy 6(1):65–
78.

228
Rittel, Horst and Melvin Webber. 1973. “Dilemmas in a General Theory of Planning.” Policy Sciences
4:155–69.
Robey, Daniel and Sundeep Sahay. 2001. “Transforming Work Through Information Technology : A
Comparative Case Study of Geographic Information Systems in County Government.” Information
Systems Research 7(1):93–110.
Rubin, H. J. 1995. “Renewing Hope in the Inner City: Conversations with Community-Based
Development Practitioners.” Administration & Society 27(1):127–60. Retrieved June 10, 2012
(http://aas.sagepub.com/cgi/doi/10.1177/009539979502700106).
Rubin, Herbert J. 2000. Renewing Hope within Neighborhoods of Despair. Albany: State University of
New York Press.
Saporito, Salvatore, Jana M. Chavers, Laura C. Nixon, and Megan R. McQuiddy. 2007. “From Here to
There: Methods of Allocating Data between Census Geography and Socially Meaningful Areas.”
Social Science Research 36(3):897–920. Retrieved February 23, 2013
(http://linkinghub.elsevier.com/retrieve/pii/S0049089X0600069X).
Sawicki, David S. and William J. Craig . 1996. “The Democratization of Data Bridging the Gap for
Community Groups.” Journal of the American Planning Association 62(4):512–23.
Schubert, Petra and Susan P. Williams. 2009. “An Extended Framework for Comparing Expectations and
Realized Benefits of Enterprise Systems Implementations.” Information Systems 1–12.
Scott, James C. 1998. Seeing like a State : How Certain Schemes to Improve the Human Condition Have
Failed.
Seddon, P. B. 1997. “A Respecification and Extension of the DeLone and McLean Model of IS Success.”
Information systems research 8(3):240–53.
Shadish, William R., Thomas D. Cook, and Donald T. Campbell. 2002. Experimental and Quasi-
Experimental Designs for Generalized Causal Inference. Houghton Mifflin Company.

229
Shaffer, R. 2006. “Rethinking Community Economic Development.” Economic Development Quarterly
20(1):59–74. Retrieved March 01, 2011
(http://edq.sagepub.com/cgi/doi/10.1177/0891242405283106).
Sieber, Renee. 2006. “Public Participation Geographic Information Systems: A Literature Review and
Framework.” Annals of the Association of American Geographers 96(3):491–507. Retrieved March
16, 2012 (http://www.tandfonline.com/doi/abs/10.1111/j.1467-8306.2006.00702.x).
Simon, Herbert. 1945. Administrative Behavior. 1997th ed. New York, N.Y: The Free Press.
Smith, Merritt Roe. 1994. “Technological Determinism in American Culture.” Pp. 1–36 in Does
Technology Drive History? The Dilemma of Technological Determinism1. Cambridge MA: MIT
Press.
Smock, Kristina. 2003. Democracy in Action: Community Organizing and Urban Change. New York:
Columbia University Press.
Stoecker, Randy. 2003. “Understanding the Development-Organizing Dialectic.” Journal of Urban
Affairs 25(4):493–512.
Stoecker, Randy. 2006. “Neighborhood Data Systems: A Best Practice Analysis.” Community
Development 37(4):109–22. Retrieved
(http://www.informaworld.com/openurl?genre=article&doi=10.1080/15575330609490198&magic=
crossref||D404A21C5BB053405B1A640AFFD44AE3).
Stoecker, Randy. 2008. “The CDC Model of Urban Development A Critique and an Alternative.” in The
Community Development Reader, edited by J. DeFilippis and S. Saegert. New York: Routledge.
Sullivan, David O. 2006. “Geographical Information Science : Critical GIS.” Progress in Human
Geography 6:783–91.
Talen, Emily. 2000. “Bottom-Up GIS.” Journal of the American Planning Association 66(3):279–94.
Retrieved June 10, 2012 (http://www.tandfonline.com/doi/abs/10.1080/01944360008976107).
Tate, Mary, Darshana Sedera, Ephraim McLean, and Andrew Burton-Jones. 2014. “Information Systems
Success Research: The ‘20-Year Update?’ Panel Report from PACIS, 2011.” Communications of

230
the Association for Information Systems 34. Retrieved November 06, 2014
(http://aisel.aisnet.org/cgi/viewcontent.cgi?article=3788&context=cais).
The Cleveland Foundation. 2015. “Our Grants.” Retrieved
(http://www.clevelandfoundation.org/grants/grants-overview/).
Thomson, D. E. 2008. “Strategic, Geographic Targeting of Housing and Community Development
Resources: A Conceptual Framework and Critical Review.” Urban Affairs Review 43(5):629–62.
Retrieved May 04, 2012 (http://uar.sagepub.com/cgi/doi/10.1177/1078087407311193).
Treuhaft, Sarah. 2006. The Democratization of Data : How the Internet Is Shaping the Work of Data
Intermediaries. Berkeley.
Treuhaft, Sarah et al. 2007. Bridging the Innovation Divide : An Agenda for Disseminating Technology
Innovations within the Nonprofit Sector A Report by PolicyLink and BCT Partners.
Treuhaft, Sarah and Thomas Kinglsey. 2008. Transforming Community Development With Land
Information Systems.
Tulloch, David L. and Tamara Shapiro. 2003. “The Intersection of Data Access And Public Participation :
Impacting GIS Users ’ Success ?” Urisa Journal 15(APA II):55–60.
Urbach, Nils, Stefan Smolnik, and Gerold Riempp. 2009. “The State of Research on Information Systems
Success.” Business & Information Systems Engineering 1(4):315–25. Retrieved August 14, 2014
(http://link.springer.com/10.1007/s12599-009-0059-y).
Vakil, C. 1997. “Confronting the Classification Taxonomy Problem : Toward a Taxonomy of NGOs.”
World Development 25(12):2057–70.
Vidal, Avis and Langley Keyes. 2005. Beyond Housing : Growing Community Development Systems.
De Vita, Carol J. and Cory Fleming. 2001. “Building Nonprofit Capacity.” Pp. 5–32 in Building
Capacity, edited by Carol J. De Vita and Cory Fleming. The Urban Institute.
Weiser, M. 1991. “The Computer for the 21st Century.” Scientific American, January, 19–25. Retrieved
(http://ieeexplore.ieee.org/lpdocs/epic03/wrapper.htm?arnumber=993141).
231
Weitzman, Beth C., Diana Silver, and Caitlyn Brazil. 2006. “Efforts to Improve Public Policy and
Programs through Data Practice : Experiences in 15 Distressed American Cities.” Administration
Review 66(3):386–99.
Wernerfelt, B. 1984. “A Resource-Based View of the Firm.” Strategic management journal 5(2):171–80.
Retrieved January 23, 2013 (http://onlinelibrary.wiley.com/doi/10.1002/smj.4250050207/abstract).
Wernerfelt, B. 2007. “The Resource-�Based View of the Firm: Ten Years After.” Strategic management
journal 16(3):171–74. Retrieved January 23, 2013
(http://onlinelibrary.wiley.com/doi/10.1002/smj.4250160303/abstract).
Winner, Langdon. 1997. “Perspectives: Technological Determinism: Alive and Kicking?” Bulletin of
Science, Technology & Society 17(1):1–2. Retrieved January 12, 2012
(http://bst.sagepub.com/cgi/doi/10.1177/027046769701700101).
Wolch, Jennifer R. 1990. The Shadow State: Government and Voluntary Sector in Transition. The
Foundation Center.
Wooldridge, JM. 2001. Econometric Analysis of Cross Section and Panel Data. Retrieved January 13,
2013
(http://books.google.com/books?hl=en&lr=&id=cdBPOJUP4VsC&oi=fnd&pg=PR17&dq=Econom
etric+Analysis+of+Cross+Section+and+Panel+Data&ots=jbacFVjapi&sig=SEzMRpi9X-
qjOhz0k8EQg5DDDDM).
Wyatt, S. 2008. “Technological Determinism Is Dead; Long Live Technological Determinism.” in The
handbook of science and technology studies, edited by Edward J. Hackett, Olga Amsterdamska,
Michael Lynch, and Judy Wajcman. London: The MIT Press. Retrieved July 30, 2012
(http://scholar.google.com/scholar?hl=en&btnG=Search&q=intitle:Technological+Determinism+is+
Dead+Long+Live+Technological+Determinism#0).
Yin, Jordan S. 1998. “The Community Development Industry System A Case Study of Politics and
Institutions in Cleveland, 1967-1997.” Journal of Urban Affairs 20(2):137–57.
Yin, Robert K. 2009. Case Study Research. Volume 5. Thousand Oaks, CA: Sage Publication.

232
Zaitar, Youssef and M. Ouzarf. 2012. “ERP Projects: Key Success Factors and Risk of Failure A
Proposed Model of Governance of Enterprise Resource Planning.” International Journal of
Computer Applications 46(8):34–40. Retrieved November 06, 2014
(http://scholar.google.com/scholar?hl=en&btnG=Search&q=intitle:ERP+Projects+:+Key+Success+
Factors+and+Risk+of+Failure+A+Proposed+Model+of+Governance+of+Enterprise+Resource+Pla
nning#0).
Zickuhr, Kathryn and Aaron Smith. 2012. Digital Differences.
Zuboff, Shoshana. 1988. In the Age of the Smart Machine: The Future of Work and Power. New York:
Basic Books.
Zuur, Alain, Elena Ieno, Neil Walker, Anatoly Saveliev, and Graham Smith. 2009. Mixed Effects Models
and Extensions in Ecology with R. Springer.