Embed Size (px)
Citation preview

This article appeared in a journal published by Elsevier. The attachedcopy is furnished to the author for internal non-commercial researchand education use, including for instruction at the authors institution
and sharing with colleagues.
Other uses, including reproduction and distribution, or selling orlicensing copies, or posting to personal, institutional or third party
websites are prohibited.
In most cases authors are permitted to post their version of thearticle (e.g. in Word or Tex form) to their personal website orinstitutional repository. Authors requiring further information
regarding Elsevier’s archiving and manuscript policies areencouraged to visit:
http://www.elsevier.com/authorsrights

Author's personal copy
Maturitas 77 (2014) 142– 148
Contents lists available at ScienceDirect
Maturitas
jo u r n al hom epa ge: www.elsev ier .com/ locate /matur i tas
Fractal dimension and mandibular cortical width in normal andosteoporotic men and women
Rafael Sindeauxa,1, Paulo Tadeu de Souza Figueiredob,1, Nilce Santos de Meloc,2,Ana Tereza Bittencourt Guimarãesd,5, Leonardo Lazartee,3, Fernando Borges Pereiraa,1,Ana Patrícia de Paula f,4, André Ferreira Leiteb,∗
a University of Brasília, Brazilb Oral Radiology, Department of Dentistry, Faculty of Health Science, University of Brasília, Brazilc Oral Pathology, Department of Dentistry, Faculty of Health Science, University of Brasília, Brazild Biostatistics, Biological Sciences Department, State University of West Paraná, Paraná, Brazile Department of Mathematics, University of Brasília, Brazilf Hospital de Base of Federal District, Brasília, Brazil
a r t i c l e i n f o
Article history:Received 1 June 2013Received in revised form20 September 2013Accepted 16 October 2013
Keywords:Bone densityOsteoporosisFractalsJawDental radiography
a b s t r a c t
Objective: To verify whether fractal dimensions (FD) on the mandibular trabecular and cortical bone andmandibular cortical width (MCW) differ between patients with normal bone mineral density (BMD) andosteoporosis.Study design: In this retrospective study, 133 dental panoramic radiographs from men aged >60 yearsand postmenopausal women with a bone densitometry report of the lumbar spine and hip classifiedas either normal or osteoporotic were selected. Fractal dimensions of five standardized trabecular andcortical mandibular regions of interest and mandibular cortical width were measured on the panoramicradiographs by an experienced oral radiologist, blinded to the densitometric diagnosis. The followingstatistical analyses were performed: ANOVA and a forward logistic stepwise regression to verify associ-ations between dental panoramic measurements and the densitometric diagnosis. P values less than .05indicated statistical significance.Main outcome measures: Fractal dimension and mandibular cortical width.Results: Differences were found in the FD values on mandibular cortical bone and MCW between patientswith normal BMD and with osteoporosis, but not in the FD values of trabecular bone. The odds of havinglower mean values of MCW and FD on cortical bone were 2.16, 3125 and 1005 times in osteoporoticpatients, respectively, compared with patients with normal BMD.Conclusion: The values of FD analysis on mandibular cortical bone and MCW were lower in women withosteoporosis. A well-adjusted logistic regression model showed that cortical bone measurements mightbe considered as auxiliary tools to referring patients for DXA exam.
© 2013 Elsevier Ireland Ltd. All rights reserved.
1. Introduction
Osteoporosis is a disease characterized by reduced bonestrength and increased susceptibility to fractures secondary to aminor or no trauma. The bone strength primarily reflects in the
∗ Corresponding author at: Campus Universitário Darcy Ribeiro, Asa Norte, ZipCode 70910-900, Brazil. Tel.: +55 61 99511168; fax: +number: +55 61 35635946.
E-mail addresses: [email protected], [email protected] (A.F. Leite).1 Address: Campus Universitário Darcy Ribeiro, Zip Code 70910-900, Brazil.2 Address: Campus Universitário Darcy Ribeiro, Asa Norte, Zip Code 70910-900,
Brazil.3 Address: Campus Universitário Darcy Ribeiro, Asa Norte, Brazil.4 Address: SMHS, Área Especial, Q. 10, Zip Code 70330-150, Brasília, Brazil.5 Address: Rua Universitária 2069, Cascavel, Paraná, Brazil. Zip Code 85819-110.
integration of bone mineral density and quality [1]. The aging ofworldwide populations may explain the increased incidence ofosteoporosis. Fragility fractures related to this common bone dis-ease are an important cause of mortality and morbidity that impliessocial and economic burdens [2].
Although postmenopausal women are more likely to developosteoporosis and have the highest fracture risk, men have greaterchance of being undertreated, being undiagnosed or dying fromfractures than women [3]. Therefore, the identification of high-riskindividuals for osteoporotic fractures is the basis of any preven-tive osteoporosis program. Early intervention may maximize bonemass retention and enhancement and, thus, reduce the risk offracture.
Currently, osteoporosis diagnosis is based on the identificationof different risk factors, the most important being low bone mineral
0378-5122/$ – see front matter © 2013 Elsevier Ireland Ltd. All rights reserved.http://dx.doi.org/10.1016/j.maturitas.2013.10.011
Author's personal copy
R. Sindeaux et al. / Maturitas 77 (2014) 142– 148 143
density (BMD) of the femur or lumbar spine [4]. BMD is routinelydetermined by dual-energy X-ray absorptiometry (DXA). AlthoughBMD is a strong determinant of bone strength [5], many patientswithout densitometric diagnosis of osteoporosis are at increasedrisk of fracture, and a high percentage of fractures can occur inpatients with normal BMD T-score [6]. Consequently, in order toproperly assess fracture, other factors are important to be taken intoaccount, such as clinical risk factors, as well as microarchitectureof bone [7].
The bone microarchitecture is changed in osteoporotic patients.Osteoporosis decreases the thickness and number of trabeculae andincreases trabecular separation. Therefore, it alters X-ray attenua-tion in the bone and thereby changes the density and texture ofthe image [8]. The trabecular bone exhibits fractal properties, suchas self-similarity and lack of well-defined scale [9,10]. Due to thefractal properties of bone, some authors have focused on evaluatingbone diseases, such as osteoporosis, by fractal dimension (FD) anal-ysis [11–14]. A recent study has demonstrated that bone textureparameters, including FD, improve failure load prediction whenadded to BMD [14].
Although FD has been proven to be efficient in evaluating bonequality on several bone sites, few studies have analyzed FD ondental panoramic radiographs of osteoporotic patients, with con-troversial results for the jaw bones [15–21]. Nevertheless, someprevious studies have demonstrated that dental panoramic radio-graphs could be considered as a readily available screening tool forreferring patients for bone densitometry for osteoporosis investi-gation, being applied to a large fraction of the elderly population[22–28]. The majority of the aforementioned studies was per-formed in postmenopausal women, and found a reduction ofmandibular cortical width (MCW) in women with osteoporosis[22–26]. Therefore, the purpose of this study was to verify whetherthere were differences in FD and MCW on dental panoramic radio-graphs of men and women with normal BMD and osteoporosis.
2. Methods
This was a retrospective study based on images collected fromthe osteoporosis prevention and diagnosis program of the FederalDistrict Health Department, Brazil, between 2008 and 2010. Ini-tially, 300 records of patients with dental panoramic radiographsand DXA exams were selected. DXA and dental panoramic radio-graphs were performed at the same time. The study was approvedby the Research Ethics Committee of the University of Brasília.Sample size calculation was estimated by population proportion,considering estimative maximum error of 0.05, degree of confi-dence of 90%, and the proportion of osteoporosis in our population.From these parameters, the calculated sample size for the studiedpopulation was composed by 133 elderly.
2.1. BMD assessment
The selected lumbar spine (L1–L4) and hip DXA scans wereperformed on the GE DPX-NT by the same technician. BMD val-ues were classified as normal (T score ≥ −1.0), osteopenia (−1.0 > Tscore > −2.5) and osteoporosis (T score ≤ −2.5), according to theWHO criteria. Osteoporosis was defined as a BMD T score of ≤−2.5at either the lumbar spine or the hip. The coefficients of variationof the lumbar spine and the hip measurements were 1% and 1.6%,respectively.
2.2. Dental panoramic radiographs
The selected dental panoramic radiographs were taken with thesame panoramic machine (Rotograph Plus; Villa Medical System,Buccinosco, Italy). Patients were positioned in the device in such
a way that the vertical line produced by the machine was alignedwith the patient’s sagittal plane and the horizontal line parallel tothe floor.
2.3. Inclusion and exclusion criteria
Images from men aged >60 years and postmenopausal womenwith a bone densitometry report of the lumbar spine and hip clas-sified as either normal or osteoporotic were selected. Images fromsubjects with osteopenia or from patients who were previouslydiagnosed with any metabolic bone disease other than osteoporosisand those who had taken medications affecting bone metabolismwere excluded. Inadequate radiographic materials, presence ofcondensing osteitis, osteosclerosis, images with local destructivelesions of the mandible, and radiographs with undesirable anatom-ical structures or superimpositions of ghost images of anatomicalstructures were also excluded.
2.4. Fractal dimension
Dental panoramic radiographs were scanned in 8-bit gray-scaleacquisition depth and 600 dpi spatial resolutions, with a scannerhaving transparency adaptor (Epson Exp, 1680Pro, Seiko EpsonCorp, Nagano, Japan). Images were stored as JPEG format with amatrix of 7008 × 2975 pixels.
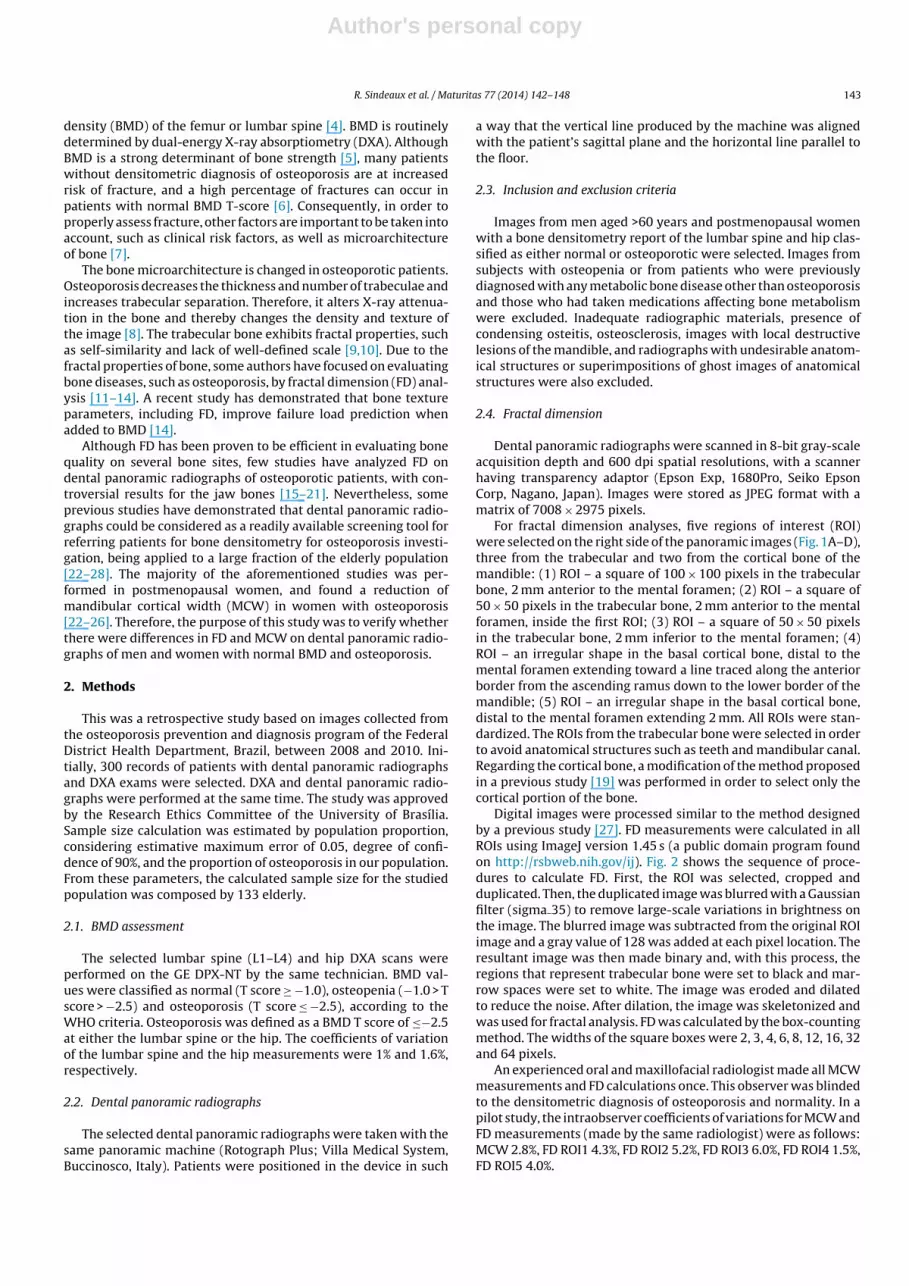
For fractal dimension analyses, five regions of interest (ROI)were selected on the right side of the panoramic images (Fig. 1A–D),three from the trabecular and two from the cortical bone of themandible: (1) ROI – a square of 100 × 100 pixels in the trabecularbone, 2 mm anterior to the mental foramen; (2) ROI – a square of50 × 50 pixels in the trabecular bone, 2 mm anterior to the mentalforamen, inside the first ROI; (3) ROI – a square of 50 × 50 pixelsin the trabecular bone, 2 mm inferior to the mental foramen; (4)ROI – an irregular shape in the basal cortical bone, distal to themental foramen extending toward a line traced along the anteriorborder from the ascending ramus down to the lower border of themandible; (5) ROI – an irregular shape in the basal cortical bone,distal to the mental foramen extending 2 mm. All ROIs were stan-dardized. The ROIs from the trabecular bone were selected in orderto avoid anatomical structures such as teeth and mandibular canal.Regarding the cortical bone, a modification of the method proposedin a previous study [19] was performed in order to select only thecortical portion of the bone.
Digital images were processed similar to the method designedby a previous study [27]. FD measurements were calculated in allROIs using ImageJ version 1.45 s (a public domain program foundon http://rsbweb.nih.gov/ij). Fig. 2 shows the sequence of proce-dures to calculate FD. First, the ROI was selected, cropped andduplicated. Then, the duplicated image was blurred with a Gaussianfilter (sigma 35) to remove large-scale variations in brightness onthe image. The blurred image was subtracted from the original ROIimage and a gray value of 128 was added at each pixel location. Theresultant image was then made binary and, with this process, theregions that represent trabecular bone were set to black and mar-row spaces were set to white. The image was eroded and dilatedto reduce the noise. After dilation, the image was skeletonized andwas used for fractal analysis. FD was calculated by the box-countingmethod. The widths of the square boxes were 2, 3, 4, 6, 8, 12, 16, 32and 64 pixels.
An experienced oral and maxillofacial radiologist made all MCWmeasurements and FD calculations once. This observer was blindedto the densitometric diagnosis of osteoporosis and normality. In apilot study, the intraobserver coefficients of variations for MCW andFD measurements (made by the same radiologist) were as follows:MCW 2.8%, FD ROI1 4.3%, FD ROI2 5.2%, FD ROI3 6.0%, FD ROI4 1.5%,FD ROI5 4.0%.
Author's personal copy
144 R. Sindeaux et al. / Maturitas 77 (2014) 142– 148
Fig. 1. Graphic and radiographic representation of fractal dimensions and mandibular cortical width measurements. A and B, ROIs of trabecular mandibular bone; C and D,ROIs of cortical mandibular bone; E and F, mandibular cortical width (MCW) measurement.
2.5. Mandibular cortical width
MCW was measured on the right side using the proceduredescribed previously [23]. A line parallel to the long axis of themandible and tangential to the inferior border was drawn on theimage using tools contained in ImageJ software. A line perpendic-ular to this tangent intersecting the inferior border of the mentalforamen was constructed, along which MCW was measured (Fig. 1Eand F).
2.6. Statistical analyses
Normal distribution of the data was evaluated by Lillieforstest and homoscedasticity of the variables between groups (nor-mal and osteoporotic patients) was checked with Levene’s test.Extreme values of the observed variables that were not normallydistributed or homoscedastic were checked with Cook’s Distanceand excluded from the sample. Age, fractal dimension measure-ments and mandibular cortical width were compared betweenmen and women by parametric t test. These variables were alsocompared between men and women with normal and osteo-porotic diagnosis by using Two-way ANOVA and a subsequentTukey test. Forward logistic stepwise regression was used to verifywhether an association existed between the variables of interest.
In this model, the presence or absence of osteoporosis was con-sidered as the dependent variable. After achieving the final modelof logistic regression, the odds were calculated from the formulaPr = 1/[1 + e−( + � (ˇixi)], as was the constant of the model. Theability of the model to distinguish cases with osteoporosis fromcases without the disease was evaluated by using a receiver oper-ating characteristic (ROC) curve analysis. Statistical analysis wasperformed by using Statistica 7.0 (StatSoft, 2004). P values less than.05 indicated statistical significance.
3. Results
From the 300 initially selected dental panoramic images, 133matched the inclusion criteria. Of these images, 84 (63.16%) wereof women and 49 were of men (36.84%). According to the DXA,87 (65.41%) images were from osteoporotic patients (62 womenand 25 men) and 46 (34.59%) from patients with normal BMD (22women and 24 men).
Table 1 shows the mean values and standard deviations of thecontinuous variables, and also the differences between the womenand men groups. Regarding all BMD measurements, significant dif-ferences were found between men and women. MCW and the FDsmeasured on the basal cortical bone (ROI4) were also significantlydifferent in men and women.

Author's personal copy
R. Sindeaux et al. / Maturitas 77 (2014) 142– 148 145
Fig. 2. Processing of panoramic radiograph for fractal dimension calculation after selecting the region of interest (ROI). A, panoramic radiograph with a ROI; B, the originalselected ROI; C, a Gaussian blurred image; D, a subtraction image; E, an added 128 image; F, a binary image; G, an eroded image; H, a dilated image; I, a skeletonized image.
3.1. Mandibular cortical width
Significant differences were verified in MCW between womenwith normal BMD and osteoporosis (Table 2). In women with nor-mal BMD, mean values of MCW were significantly higher thanthose with osteoporosis. In men, mean values of MCW were not
Table 1Differences in the mean values of age, bone mineral densities, mandibular corticalwidths and fractal dimensions between men and women.
Women (n = 84) Men (n = 49) p-value
Mean ± SD Mean ± SD
Age (years)* 63.88 ± 8.35 67.88 ± 5.41 0.002BMD L1–L4 (g/cm2)* 0.789 ± 0.182 1.022 ± 0.210 0.000BMD femoral neck (g/cm2)* 0.736 ± 0.146 0.902 ± 0.164 0.000BMD total hip (g/cm2)* 0.789 ± 0.158 0.965 ± 0.166 0.000MCW (mm)* 3.088 ± 1.041 3.703 ± 1.085 0.002FD ROI1 1.164 ± 0.133 1.173 ± 0.131 0.693FD ROI2 1.143 ± 0.113 1.165 ± 0.106 0.279FD ROI3 1.137 ± 0.150 1.159 ± 0.140 0.390FD ROI4* 1.365 ± 0.085 1.408 ± 0.065 0.003FD ROI5 1.371 ± 0.092 1.372 ± 0.063 0.971
t test.* p < 0.05
statistically different between groups (p > 0.05). However, it couldbe observed a reduction tendency of MCW values in men withlower BMD values. Comparing men and women, the mean valuesof MCW were considered statistically equivalent (Fig. 3F), althougha tendency of higher values of MCW could be found in men withosteoporosis (p = 0.053).
3.2. Fractal dimension
Regarding the smaller FD on the cortical bone (ROI5),a difference was found between women with normal BMD
Table 2Means (±standard deviation) for mandibular cortical width values of women andmen with normal BMD and osteoporosis.
Gender Densitometric diagnosis MCW (mm)
Women Normal BMD 4.036 ± 0.930*
Osteoporosis 2.752 ± 0.859*
Men Normal BMD 3.982 ± 1.251Osteoporosis 3.434 ± 0.839
F 4.204p-Value 0.042
F, analysis of variance.* p < 0.05.

Author's personal copy
146 R. Sindeaux et al. / Maturitas 77 (2014) 142– 148
Fig. 3. Comparison of mean values and confidence intervals of FDs and MCW measurements between men and women, and between individuals with normal BMD andosteoporosis.
and osteoporosis (p < 0.05). The values among men werestatistically equivalent (Table 3). The other FD of corti-cal bone (ROI4) showed a tendency to be higher in menwith osteoporosis than in men with normal BMD, howeverthe difference was statistically significant only for women(Table 3).
When considering only the comparison between densitometricdiagnoses, regardless of gender, it was possible to verify signifi-cant differences for both cortical bone FDs (ROIs 4 and 5). Thus, themean values among patients with osteoporosis were significantlylower than in patients with normal diagnosis (t = 5.423, p = 0.000;t = 2.486, p = 0.014, respectively).
Table 3Means (±SD) for fractal dimension values of women and men with normal BMD and osteoporosis.
Gender DXA ROI1 ROI2 ROI3 ROI4 ROI5
Women Normal 1.147 ± 0.081 1.185 ± 0.119 1.137 ± 0.125 1.429 ± 0.057* 1.420 ± 0.079*
Osteoporosis 1.142 ± 0.122 1.156 ± 0.138 1.137 ± 0.159 1.342 ± 0.082* 1.354 ± 0.090*
Men Normal 1.178 ± 0.116 1.160 ± 0.156 1.163 ± 0.153 1.427 ± 0.058 1.373 ± 0.069Osteoporosis 1.152 ± 0.096 1.186 ± 0.103 1.156 ± 0.128 1.389 ± 0.066 1.371 ± 0.059
F 0.244 1.193 0.016 3.369 4.434p-Value 0.621 0.276 0.896 0.068 0.037
F, analysis of variance.* p < 0.05.

Author's personal copy
R. Sindeaux et al. / Maturitas 77 (2014) 142– 148 147
Table 4Binary logistic regression table.
Variables B SE Wald OR OR Upper limit (95%) OR Lower limit (95%)
Constant 24.379 6.978 12.207MCW −0.770 0.270 8.096 0.463 0.273 0.787ROI4 −8.042 3.996 4.049 0.000 0.000 0.811ROI5 −6.913 3.083 5.027 0.001 0.000 0.419Gender (male) −0.774 0.439 3.111 0.461 0.195 1.090
MCW, mandibular cortical width; ROI4, region of interest 4; ROI5, region of interest 5.
No significant differences were found between FD on the tra-becular bone (ROIs 1, 2, and 3) in men and women with normalBMD and osteoporosis (Table 3). Fig. 3 shows the mean values andconfidence intervals of FDs and MCW measurements between menand women, and also between individuals with normal BMD andosteoporosis.
After analyzing MCW and each of the fractal dimensions sepa-rately, an analysis was performed with the combination of all thevariables in a well-adjusted logistic regression model (p = 0.000,AIC = 140 283). As our interest was to model the predictors forosteoporosis, a categorical dichotomous outcome (presence orabsence of osteoporosis), the appropriate multivariate analysis wasbinary logistic regression. After adjusting, only the following vari-ables entered into the equation of this regression model: MCW,fractal dimensions on cortical bone (ROIs 4 and 5) and gender(male). Table 4 shows the estimates of this binary logistic regressionmodel.
When analyzing the odds ratio (OR), it can be verified that indi-viduals with normal BMD had low probability of having lower meanvalues of MCW (0.463, 95% CI 0.273–0.787). On the other hand,the odds of having lower mean values of MCW were 2.16 times inosteoporotic patients (95% CI 1.27–3.66). Regarding the FDs on thecortical bone (ROIs 4 and 5), the odds of having lower FD valuesin osteoporotic patients were 3125 times (95% CI 1.23–7 837 854)and 1005 times (95% CI 2.38–423 176), respectively, compared withpatients with normal BMD.
From this model, the probabilities were estimated and plottedon a ROC curve. The area under the ROC curve was 0.820 for thismodel.
4. Discussion
Differences in FDs of cortical bone and MCW were foundbetween women with osteoporosis and normal BMD. Furthermore,measurements of FD on the mandibular trabecular bone were notstatistically different between both densitometric diagnoses. Ina well-adjusted logistic regression model, only the cortical bonemeasurements entered into the equation. The odds of having lowermean values of MCW and FD on the cortical bone were higher inosteoporotic patients. The results of our study suggest that corti-cal bone measurements are more reliable than the trabecular bonemeasurements to discriminate between normal and osteoporoticpatients.
In the present study, the performance of the FDs of the corticalbone was different from the FDs of the trabecular bone in women.Statistically significant differences of FD of the mandibular corti-cal bone were found between women with osteoporosis and thosewith normal BMD. Only one previous study has evaluated FD on thecortical bone [19]. However, a direct comparison with our resultswas not possible, as this previous study has selected a different ROIand has not evaluated BMD.
MCW was also thinner in patients with osteoporosis comparedwith patients with normal BMD, but the differences were onlystatistically significant and higher in women. This is in agreementwith some previous studies that found higher probability of cortical
thinning and erosions in elderly people [20,25]. Some authors havedemonstrated that the probability of a lower MCW is higher inwomen and men with osteoporosis, with better results for women[25,28]. The differences in results between both sexes are probablydue to the anatomical variations of the mandibular cortex [28].Alman et al. [20] have suggested that MCW, when evaluated in amale population, may perform better in an older sample.
Regarding mandibular trabecular bone, our results are in agree-ment with some previous studies [17,18], but in contrast withothers [15,20,21]. Law et al. [15] verified that mean values ofFD on the trabecular bone were higher for radiographs from theosteoporotic group than for those from the control group. Never-theless, the method of calculating FD (power spectra) was differentfrom our study (box counting). Another recent study with differ-ent results had used box counting method for calculating FD [20].However, men were the majority in the sample, and only 5.85% ofthem presented osteoporosis. The higher prevalence of osteoporo-sis (65.41%) in our study may be explained by the fact that thisstudy was conducted in a sample of patients from primary healthcare service, contrasting with earlier studies with patients fromsecondary and tertiary health care services [20,26,27].
In a recent study with 73 panoramic images of women, FD val-ues were different between normal and osteoporotic groups [21].Nevertheless, the selected ROIs were on the anterior portion of themandible and below the mandibular canal, differently from ourstudy. Some authors have stated that discrepancies of results in theprevious studies with FD of trabecular bone could be explained byanatomical variations, discrepancies in the imaging methods usedto obtain bone images, the differences in selecting the areas to bemeasured, and/or in the techniques for measuring fractal dimen-sion [29].
FD was calculated only once, as the aim of this study was notto evaluate its reproducibility. FD will always have the same valuewhen the same image processing and analysis techniques are used.[17]. In our study, the ROIs of the trabecular bone were 2.11 mm(50 × 50 pixels) and 4.23 mm (100 × 100 pixels). We have selectedthis ROI size based on a study that stated that the lower andupper limits within which trabecular bone is effectively fractal are0.025 mm and 4.25 mm respectively [30]. Our study had also useddigitized panoramic images similarly to Yasar et al. [19] and boxcounting method for FD calculation. This method of FD calculationwas the most used in the previous clinical studies, probably due toits simplicity and availability [17–21].
Although there were similarities in the methodology of ourstudy with the previous studies, there were differences regard-ing the composition and size of the sample, the techniquesfor measuring fractal dimension, differences in acquisitions ofradiographs and differences in ROI location and size. These dif-ferences may explain the discrepancies in FD results for thetrabecular bone. Furthermore, few studies have analyzed FD ondental radiographs of osteoporotic patients [15–21]. Of these stud-ies, only two included men in the sample [16,20]. The lack ofearlier studies with age- and gender-matched samples, with asimilar methodology for calculating FD precludes direct compar-isons.

Author's personal copy
148 R. Sindeaux et al. / Maturitas 77 (2014) 142– 148
Fractal dimension is a noninvasive analysis that may provideinformation about the trabecular microarchitecture, which is inde-pendent of bone density. It was a limitation of our study that therelationship between FD of mandibular cortical and trabecular boneand the presence of osteoporotic fractures has not been evalu-ated. Some authors have demonstrated that on other skeletal bonesites FD could differentiate osteoporotic women with vertebralcrush fractures from control age-matched women [12]. A possi-ble connection between mandibular FD and osteoporotic fracturesdeserves further investigation, and could be complementary toBMD in assessing bone fragility. The sample size may also be consid-ered a limitation of our study, especially regarding male population.Further studies with a larger sample size should be performed totest the differences of MCW and FD on the cortical and trabecularbone between men with osteoporosis and normal BMD. Anotherlimitation of our study was the difficulty to compare our resultswith the previous studies due to methodological differences.
Our logistic regression model showed that patients withosteoporosis have higher probability of having lower mean val-ues of FDs on the cortical bone and MCW. This preliminarywell-adjusted model should be tested in other populations forbeing considered as an important auxiliary tool for osteoporosisscreening.
In conclusion, FDs of mandibular cortical bone and MCW werelower in women with osteoporosis. A well-adjusted logistic regres-sion model showed that cortical bone measurements might beconsidered as auxiliary tools to referring patients for DXA exam.The results of our study, although promising, warrant further inves-tigation, especially regarding male population. The standardizationof the techniques for measuring FD and the analysis of their repro-ducibility and validity for identifying normal BMD and osteoporosisin both men and women should be more investigated. On the otherhand, FD of mandibular trabecular bone cannot still be used asosteoporosis predictor.
Contributors
Sindeaux R, Figueiredo PTS, Melo NS, Lazarte L, Pereira FB, PaulaAP, Leite AF designed the study, drafted and revised the manuscript.Guimarães ATB performed the statistical analyses. Sindeaux R wasresponsible for radiological assessment (fractal dimension andmandibular cortical width measurements). Pereira FB and Paula APcollected clinical data. All authors have read and approved the finalmanuscript.
Competing interests
The authors declare no conflict of interest.
Funding information
The authors have received no funding for this article.
Ethical approval
This was a retrospective study approved by the Research EthicsCommittee of the University of Brasília (Brazil).
References
[1] NIH. Consensus development panel on osteoporosis prevention, diagno-sis, and therapy. Osteoporosis prevention, diagnosis, and therapy. JAMA2001;285:785–95.
[2] Cummings SR, Melton LJ. Epidemiology and outcomes of osteoporotic fractures.Lancet 2002;359:1761–7.
[3] Ebeling PR. Clinical practice. Osteoporosis in men. N Engl J Med2008;358:1474–82.
[4] Kanis JA. Assessment of fracture risk and its application to screening forpostmenopausal osteoporosis: synopsis of a WHO report. WHO study group.Osteoporos Int 1994;4:368–81.
[5] Marshall D, Johnell O, Wedel H. Meta-analysis of how well measures ofbone mineral density predict occurrence of osteoporotic fractures. BMJ1996;312:1254–9.
[6] Schuit SC, van der Klift M, Weel AE, et al. Fracture incidence and associationwith bone mineral density in elderly men and women: the Rotterdam study.Bone 2004;34:195–202.
[7] Kolta S, Paratte S, Amphoux T, et al. Bone texture analysis of human femursusing a new device (BMATM) improves failure load prediction. Osteoporos Int2012;23:1311–6.
[8] Eckstein F, Matsuura M, Kuhn V, et al. Sex differences of human trabecular bonemicrostructure in aging are site-dependent. J Bone Miner Res 2007;22:817–24.
[9] Sanchez-Molina D, Velazquez-Ameijide J, Quintana V, et al. Fractal dimen-sion and mechanical properties of human cortical bone. Med Eng Phys2013;35:576–82.
[10] Geraets WG, van der Stelt P. Fractal properties of bone. Dentomaxillofac Radiol2000;29:144–53.
[11] Ergün S, Sarac oglu A, Güneri P, Ozpinar B. Application of fractal analysis inhyperparathyroidism. Dentomaxillofac Radiol 2009;38:281–8.
[12] Pothuaud L, Lespessailles E, Harba R, et al. Fractal analysis of trabecular bonetexture on radiographs: discriminant value in postmenopausal osteoporosis.Osteoporos Int 1998;8:618–25.
[13] Lespessailles E, Gadois C, Kousignian I, et al. Clinical interest of bone tex-ture analysis in osteoporosis: a case control multicenter study. Osteoporos Int2008;19:1019–28.
[14] Le Corroller T, Halgrin J, Pithioux M, Guenoun D, Chabrand P, Champ-saur P. Combination of texture analysis and bone mineral density improvesthe prediction of fracture load in human femurs. Osteoporos Int 2012;23:163–9.
[15] Law AN, Bollen AM, Chen SK. Detecting osteoporosis using dental radiographs:a comparison of four methods. J Am Dent Assoc 1996;127:1734–42.
[16] Bollen AM, Taguchi A, Hujoel PP, Hollender LG. Fractal dimension on dentalradiographs. Dentomaxillofac Radiol 2001;30:270–5.
[17] Yas ar F, Akgünlü F. The differences in panoramic mandibular indices and fractaldimension between patients with and without spinal osteoporosis. Dentomax-illofac Radiol 2006;35:1–9.
[18] Tosoni GM, Lurie AG, Cowan AE, Burleson JA. Pixel intensity and fractal anal-yses: detecting osteoporosis in perimenopausal and postmenopausal womenby using digital panoramic images. Oral Surg Oral Med Oral Pathol Oral RadiolEndod 2006;102:235–41.
[19] Yasar F, Akgünlü F. Evaluating mandibular cortical index quantitatively. Eur JDent 2008;2:283–90.
[20] Alman AC, Johnson LR, Calverley DC, Grunwald GK, Lezotte DC, Hokanson JE.Diagnostic capabilities of fractal dimension and mandibular cortical width toidentify men and women with decreased bone mineral density. Osteoporos Int2012;23:1631–6.
[21] Oliveira ML, Pedrosa EF, Cruz AD, Haiter-Neto F, Paula FJ, WatanabePC. Relationship between bone mineral density and trabecular bone pat-tern in postmenopausal osteoporotic Brazilian women. Clin Oral Investig2013;17:1847–53.
[22] Klemetti E, Kolmakov S, Heiskanen P, Vainio P, Lassila V. Panoramic mandibularindex and bone mineral densities in postmenopausal women. Oral Surg OralMed Oral Pathol 1993;75:774–9.
[23] Taguchi A, Suei Y, Ohtsuka M, Otani K, Tanimoto K, Ohtaki M. Usefulness ofpanoramic radiography in the diagnosis of postmenopausal osteoporosis inwomen. Width and morphology of inferior cortex of the mandible. Dentomax-illofac Radiol 1996;25:263–7.
[24] Devlin H, Allen P, Graham J, et al. The role of the dental surgeon in detectingosteoporosis: the OSTEODENT study. Br Dent J 2008;24(204):E16.
[25] Ferreira Leite A, de Souza Figueiredo PT, Ramos Barra F, Santos de Melo N, dePaula AP. Relationships between mandibular cortical indexes, bone mineraldensity, and osteoporotic fractures in Brazilian men over 60 years old. OralSurg Oral Med Oral Pathol Oral Radiol Endod 2011;112:648–56.
[26] Vlasiadis KZ, Damilakis J, Velegrakis GA, et al. Relationship between BMD, den-tal panoramic radiographic findings and biochemical markers of bone turnoverin diagnosis of osteoporosis. Maturitas 2008;59:226–33.
[27] White SC, Rudolph DJ. Alterations of the trabecular pattern of the jaws inpatients with osteoporosis. Oral Surg Oral Med Oral Pathol 1999;88:628–35.
[28] Roberts M, Yuan J, Graham J, Jacobs R, Devlin H. Changes in mandibularcortical width measurements with age in men and women. Osteoporos Int2011;22:1915–25.
[29] Chappard C, Brunet-Imbault B, Lemineur G, et al. Anisotropy changes inpost-menopausal osteoporosis: characterization by a new index applied totrabecular bone radiographic images. Osteoporos Int 2005;16:1193–202.
[30] Parkinson IH, Fazzalari NL. Methodological principles for fractal analysis oftrabecular bone. J Microsc 2000;198(Pt 2):134–42.


![[Secondary prevention in osteoporotic fractures. The GIOS project]](https://img.pdfslide.net/doc/110x75/63487f43de40dd034d093bb9/secondary-prevention-in-osteoporotic-fractures-the-gios-project.jpg)


