Embed Size (px)
Citation preview
Fredrik Malmberg
The Rotting Fish? Institutional Trust, Dysfunctional Contexts, and Corruption ToleranceA multilevel study of the justification of low-level corruption in a global perspective
Fredrik Malm
berg | The Rotting Fish? Institutional Trust, Dysfunctional C
ontexts, and Corruption Tolerance | 2019
Fredrik Malmberg
The Rotting Fish? Institutional Trust, Dysfunctional Contexts, and Corruption ToleranceA multilevel study of the justification of low-level corruption in a global perspective
The aim of this thesis is to examine variations in attitudes towards certain forms of behavior that can be viewed as a type of low-le-vel (societal) corruption. Are some societies or cultures more to-lerant of corrupt practices? Do dysfunctional social structures and corrupt elites produce dysfunctional citizens who tolerate free riding behavior (the so-called rotting fish thesis), or is corrup-tion tolerance part of a “larger culture” that influences the qua-lity of public institutions (the so-called raccomandazione thesis)?
This thesis examines both individual- and country-level determi-nants of corruption tolerance across 84 countries in a multilevel framework using data from the World Values Survey. The focus on the individual level lies on how institutional trust helps to shape cor-ruption tolerance, while the contextual factors of interest include socio-economic development, economic inequality, institutional quality, and institutional performance. Additionally, this study in-vestigates potential cross-level interactions between the micro- and macro-level factors of interest. In what kinds of contexts does a lack of trust in public authorities lead to a higher corruption tolerance?
Åbo Akademi University Press | ISBN 978-951-765-944-4
9 7 8 9 5 1 7 6 5 9 4 4 4
Fredrik Malmberg
- Born1989 in Borgå, Finland
- Master of Social Sciences (Political science), Åbo Akademi University 2014
Portrait photo: Studio Auran Kuva Oy
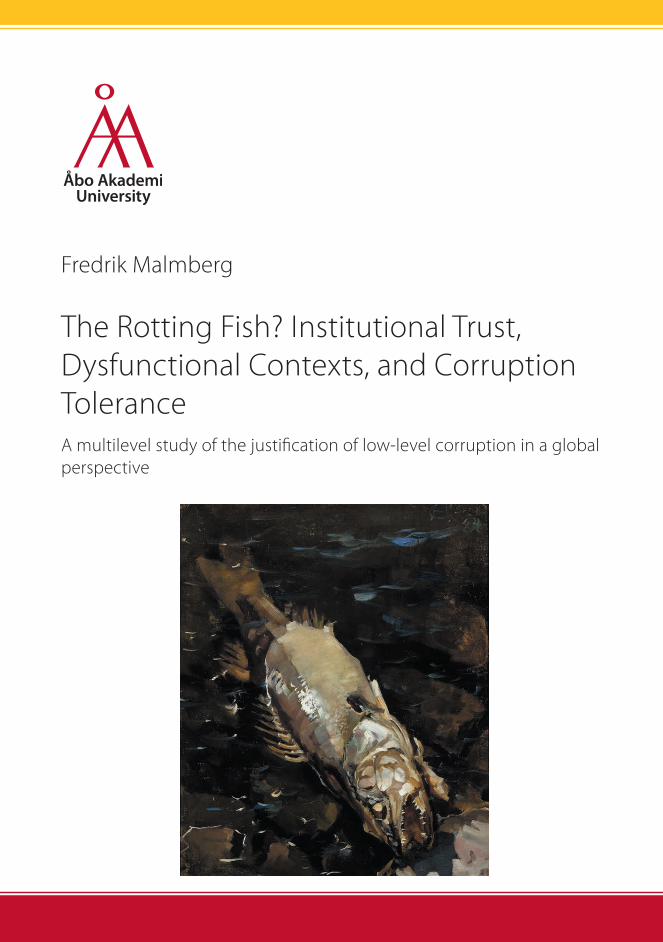
Cover picture: Mädäntynyt kuha (eng. Decaying Sander, swe. Rutten gös), 1884 by Akseli Gallen-Kallela (1865–1931)
Åbo Akademi University Press Tavastgatan 13, FI-20500 Åbo, Finland Tel. +358 (0)2 215 4793 E-mail: [email protected]
Sales and distribution: Åbo Akademi University Library Domkyrkogatan 2–4, FI-20500 Åbo, Finland Tel. +358 (0)2 -215 4190 E-mail: [email protected]
THE ROTTING FISH? INSTITUTIONAL TRUST, DYSFUNCTIONAL CONTEXTS, AND CORRUPTION TOLERANCE

The Rotting Fish? Institutional Trust, Dysfunctional Contexts,
and Corruption ToleranceA multilevel study of the justification of low-level corruption in a
global perspective
Fredrik Malmberg
Åbo Akademis förlag | Åbo Akademi University PressÅbo, Finland, 2019
CIP Cataloguing in Publication
Malmberg, Fredrik.The rotting fish? Institutional trust, dysfunctional contexts, and corruption tolerance : a multilevel study of the justification of low-level corruption in a global perspective / Fredrik Malmberg. - Åbo : Åbo Akademi University Press, 2019.Diss.: Åbo Akademi University. ISBN 978-951-765-944-4
ISBN 978-951-765-944-4ISBN 978-951-765-945-1 (digital)
Painosalama OyÅbo 2019
i
Förord
När jag tog ut mina magisterspapper i statskunskap från Åbo Akademi efter fem år i
Åbo, och flyttade tillbaka till min gamla hemstad Borgå sommaren 2014, hade jag ingen
aning om att jag snart skulle vara tillbaka vid ÅA och än en gång studera, fastän denna
gång på doktorandnivå. Jag hade inga som helst planer på att doktorera. Inte heller då
jag strax senare på hösten blev ombedd att hålla föreläsningarna i en kurs på basis av
temat i min magistersavhandling (demokrati och korruption), vilket jag tackade ja till.
Detta blev min första erfarenhet av att få undervisa.
Efter att ha fått ett litet smakprov av arbetslivet under den återstående delen av året
fick jag nyåret 2015 ett erbjudande som jag inte kunde tacka nej till. Professor Carsten
Anckar, som fungerat som min handledare under min pro gradu process, skrev till mig
och erbjöd mig möjligheten att komma och jobba i hans projekt om koloniala arv som
projektassistent. Han nämnde även möjligheten att kunna så småningom börja
doktorera. Och på den vägen blev jag, när mina doktorandstudier formellt började
hösten 2015. Utan Carsten vet jag inte var jag skulle vara just nu. Kanske jag skulle
fortsättningsvis sitta i KSF-medias kundservice i Jorvas och ta emot arga kundsamtal
gällande uteblivna morgontidningar. Därför är jag evigt tacksam för allting som
Carsten har gjort för min skull, inte minst för all finansiering som Carsten har hjälpt
mig få, så att jag inte har behövt oroa mig ekonomiskt under denna långa process. Tack
även för alla råd och all uppmuntran som jag har fått och alla möjligheter att utveckla
mig själv och mitt kunnande, bl.a. genom min kurs ”Corruption and development”
som jag har fått hålla varje vår sen jag började. Utan Carstens stöd skulle jag aldrig ha
fått denna avhandling färdig.
Jag vill även passa på att rikta ett stort tack till min andra handledare, docent Krister
Lundell. Tack för att du har tagit dig tid till att läsa och kommentera mina utkast och
tack för alla inspirerande luncher tillsammans. Många tack även till mina andra
underbara kollegor på fjärde våningen i ASA-huset för allt det professionella, tekniska
och mentala stöd som ni ger på jobbet, under pauser, seminarier, luncher och fikor,
samt under fritiden och mer festliga tillfällen. Ni är alltför många för att jag skulle
kunna nämna er vid namn men ni vet vilka ni är.
Jag står även i djup tacksamhetsskuld till Åbo Akademi och Stiftelsen för Åbo
Akademi som har bidragit mig med generösa mängder av finansiering så att jag har
kunnat slutföra mina doktorandstudier. Utan all denna finansiering skulle jag inte ha
kunnat gå på de internationella konferenserna NoPSA och ECPR, Summer School i
Essex, forskarskolan samt andra arbetsrelaterade resor. Tack även för att jag har fått ha
mitt arbetsrum till förfogande.
Ett stort tack till mina två förhandsgranskare, docent Staffan Andersson och
biträdande professor Gissur Erlingsson, för att ni har delat med er av er värdefulla tid
och er omfattande kunskap. Era kommentarer var mycket nyttiga och användbara, och
ii
jag har försökt att ta dem i beaktande så mycket som möjligt i slutförandet av denna
avhandling. Tack även till Ream Barclay som språkgranskade avhandlingen samt alla
andra som har läst igenom och kommenterat mina manuskript.
Viktigt i denna process har även varit Finlandssvenska forskarskolan som har hjälpt
mig att vidareutveckla mina idéer och resonemang. Flera tack går därför till alla som
har deltagit i forskarskolan och särskilt de som har kommenterat mina utkast samt de
som har möjliggjort själva forskarskolan. Samma sak gäller alla andra
forskarseminarier där jag har deltagit under min doktorandtid.
Sist men inte minst vill jag tacka min familj: Pappa Rolf, mamma Dorita, lillebror
Johan och vår siameskatt Disa, för allt det stöd som jag har fått av er. Ett särskilt tack
riktas till min biologistuderande bror Johan som ofta har hållit mig sällskap under min
tid i Åbo. Stort tack till hela familjen för alla bastukvällar, utsökta middagar, resor samt
andra aktiviteter som vi har gjort tillsammans under våra besök i Borgå då vi har länsat
era skafferier samt kyl- och barskåp. Utan allt detta skulle jag knappast ha orkat
slutföra denna avhandling. Därför tillägnar jag den er.
Åbo den 16 oktober 2019
Fredrik Malmberg
iii
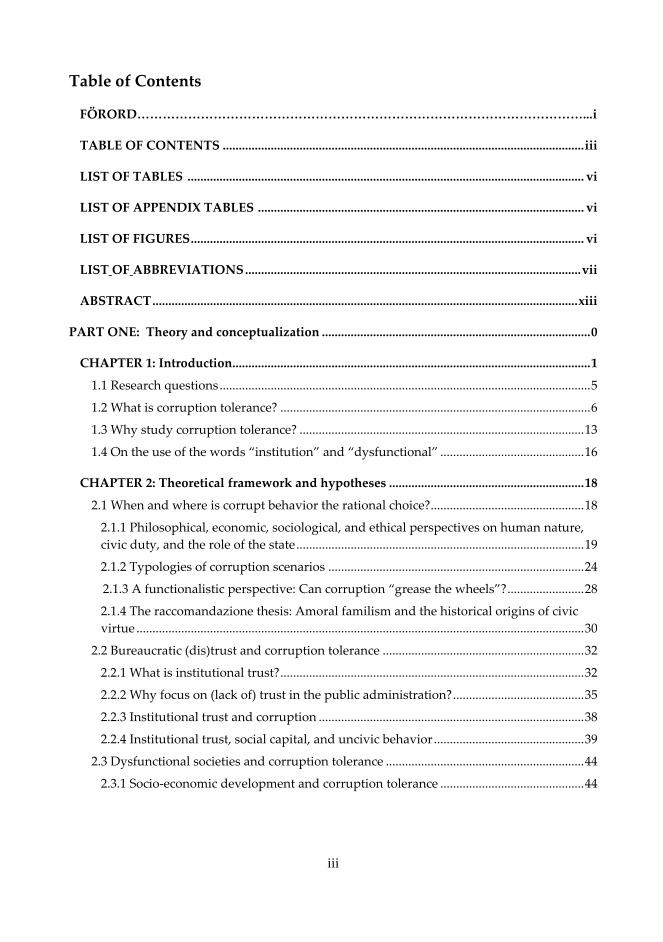
Table of Contents
FÖRORD……………………………………………………………………………………………...i
TABLE OF CONTENTS ................................................................................................................. iii
LIST OF TABLES ............................................................................................................................ vi
LIST OF APPENDIX TABLES ...................................................................................................... vi
LIST OF FIGURES ........................................................................................................................... vi
LIST OF ABBREVIATIONS ......................................................................................................... vii
ABSTRACT ..................................................................................................................................... xiii
PART ONE: Theory and conceptualization .................................................................................... 0
CHAPTER 1: Introduction................................................................................................................ 1
1.1 Research questions .................................................................................................................... 5
1.2 What is corruption tolerance? ................................................................................................. 6
1.3 Why study corruption tolerance? ......................................................................................... 13
1.4 On the use of the words “institution” and “dysfunctional” ............................................. 16
CHAPTER 2: Theoretical framework and hypotheses ............................................................. 18
2.1 When and where is corrupt behavior the rational choice? ................................................ 18
2.1.1 Philosophical, economic, sociological, and ethical perspectives on human nature,
civic duty, and the role of the state .......................................................................................... 19
2.1.2 Typologies of corruption scenarios ................................................................................ 24
2.1.3 A functionalistic perspective: Can corruption “grease the wheels”? ........................ 28
2.1.4 The raccomandazione thesis: Amoral familism and the historical origins of civic
virtue ............................................................................................................................................ 30
2.2 Bureaucratic (dis)trust and corruption tolerance ............................................................... 32
2.2.1 What is institutional trust? ............................................................................................... 32
2.2.2 Why focus on (lack of) trust in the public administration? ......................................... 35
2.2.3 Institutional trust and corruption ................................................................................... 38
2.2.4 Institutional trust, social capital, and uncivic behavior ............................................... 39
2.3 Dysfunctional societies and corruption tolerance .............................................................. 44
2.3.1 Socio-economic development and corruption tolerance ............................................. 44
iv
2.3.2 Economic inequality and corruption tolerance ............................................................ 51
2.3.3 Institutional quality, economic performance, and corruption tolerance .................. 56
2.4 The moderating effect of dysfunctional contexts ............................................................... 64
2.4.1 The moderating effect of socio-economic development ............................................. 65
2.4.2 The moderating effect of economic inequality ............................................................. 66
2.4.3 The moderating effect of institutional quality and economic performance ............. 68
2.5 Summary of formal hypotheses............................................................................................ 71
PART TWO: Research design, results, and conclusions ............................................................ 72
CHAPTER 3: Research design ..................................................................................................... 73
3.1 Operationalization of variables ............................................................................................ 73
3.1.1 Dependent variable: Corruption tolerance ................................................................... 73
3.1.2 Independent variables and control variables ............................................................... 76
3.1.2.1 Micro-level variables .................................................................................................. 76
3.1.2.2 Macro-level variables ................................................................................................. 79
3.2 Research Model, Method of Analysis, and Data Sources ................................................. 84
3.2.1 Research model ................................................................................................................. 84
3.2.2 Method of analysis ........................................................................................................... 85
3.2.3 Data sources ...................................................................................................................... 87
CHAPTER 4: Empirical analyses .................................................................................................. 88
4.1 Descriptive analyses ............................................................................................................... 88
4.2 Multivariate analysis .............................................................................................................. 93
4.2.1 Micro-level effects ............................................................................................................. 93
4.2.1.1 Bureaucratic distrust, perceived corruption, and corruption tolerance ............. 94
4.2.1.2 Micro-level controls ................................................................................................... 96
4.2.2 Macro-level effects ............................................................................................................ 98
4.2.2.1 Socio-economic development and corruption tolerance .................................... 100
4.2.2.2 Economic inequality and corruption tolerance ................................................... 101
4.2.2.3 Institutional quality, economic performance, and corruption tolerance ......... 103
4.2.2.4 Macro-level controls ................................................................................................ 105
4.2.3 Interaction effects ............................................................................................................ 107
4.2.3.1 Interaction effect of bureaucratic distrust and economic inequality ................ 110
4.2.3.2 Interaction effect of bureaucratic distrust and procedural quality ................... 112
4.2.3.3 Interaction effect of bureaucratic distrust and self-perceived corruption ....... 114
v
4.3 Robustness checks ................................................................................................................. 117
CHAPTER 5: Discussion and conclusions ................................................................................ 122
5.1 Findings and implications.................................................................................................... 122
5.2 Limitations and suggestions for future studies ................................................................ 133
5.3 Concluding remarks ............................................................................................................. 138
Appendix ......................................................................................................................................... 141
References ....................................................................................................................................... 158
vi
LIST OF TABLES
Table 4.1 Descriptive information of main variables ..................................................................... 89
Table 4.2 Relationship between bureaucratic distrust, self-perceived corruption, and
corruption tolerance ........................................................................................................................... 94
Table 4.3 Micro- and macro-level effects ......................................................................................... 99
Table 4.4 Cross-level interactions ................................................................................................... 109
Table 4.5 Interaction effect of self-perceived corruption and bureaucratic distrust on tolerance
of bribe taking .................................................................................................................................... 115
LIST OF APPENDIX TABLES
Appendix table 1 Country-wave means ........................................................................................ 141
LIST OF FIGURES
Figure 3.1 Research model ................................................................................................................. 84
Figure 3.2 Three-level structure ........................................................................................................ 86
Figure 4.1 Dependent variable .......................................................................................................... 90
Figure 4.2 Tolerance of bribe taking ................................................................................................. 90
Figure 4.3 Average corruption tolerance in 84 countries (WVS Wave 3-6) ................................. 91
Figure 4.4 Average corruption tolerance in 170 country-waves (WVS Wave 3-6) ..................... 92
Figure 4.5 Bureaucratic distrust and corruption tolerance ............................................................ 95
Figure 4.6 Income inequality and corruption tolerance ............................................................... 102
Figure 4.7 Average corruption tolerance in the post-communist countries ............................. 106
Figure 4.8 Interaction effect of bureaucratic distrust and income inequality ........................... 110
Figure 4.9 Interaction effect of bureaucratic distrust and control of corruption ...................... 113
Figure 4.10 Interaction effect of self-perceived extent of corruption and bureaucratic distrust
on probability of tolerating bribe taking ........................................................................................ 116
Figure 4.11 Interaction effect of bureaucratic distrust and income inequality on probability of
tolerating bribe taking ....................................................................................................................... 118
Figure 4.12 Interaction effect of bureaucratic distrust and income inequality on probability of
finding avoiding paying fares on public transports (free riding) acceptable ........................... 119
vii
LIST OF ABBREVIATIONS
BBC British Broadcasting Corporation
BPI Bribe Payers Index
CPI Corruption Perception Index
CC Control of Corruption
CNN Cable News Network
ESS European Social Survey
ETM Evolutionary Theory of Morality
GCB Global Corruption Barometer
GDP Gross Domestic Product
GE Government Effectiveness
HDI Human Development Index
ICAC Independent Commission Against Corruption
ICC Intra-Cluster Correlation
IMF International Monetary Fund
LAPOP Latin American Public Opinion Project
NGO Non-Governmental Organization
NPM New Public Management
OLS Ordinary Least Square
PD Power Distance
RCT Rational Choice Theory
SD Standard Deviation
SDB Social Desirability Bias
SES Socio-Economic Status
SLT Social Learning Theory
SOP Standard Operating Procedure
TI Transparency International
UA Uncertainty Avoidance
UN United Nations
UNDP United Nations Development Programme
UNU-WIDER United Nations University World Institute for Development
Economics Research
US United States
VIF Variance Inflation Factor
WB World Bank
WGI Worldwide Governance Indicators
WIID World Income Inequality Database
WTO World Trade Organization
WVS World Values Survey
viii
ABSTRACT
Tolerance of bribery, tax evasion, and other forms of what can be considered a type of low-level (societal)
corruption or an indicator of civic morality, or rather the lack thereof, has been a much-debated
phenomenon within the social sciences. Are some societies or cultures more accepting of corrupt
practices, and if so, why? Do dysfunctional structures and corrupt elites generate dysfunctional citizens
who tolerate free riding behavior (the so-called rotting fish thesis), or is corruption tolerance part of a
“larger culture” that affects the quality of public institutions (the so-called raccomandazione thesis)? The
central question examined in this study is hence “Do dysfunctional societal contexts generate
dysfunctional citizens with a higher tolerance of corrupt behavior?”.
This overarching research question and the subsidiary research questions derived from it are
approached using multilevel analysis of World Values Survey data from over 80 different countries from
around the globe. The aim of these analyses is to empirically examine the relationship between both
subjective and objective measures of societal dysfunctionality and corruption tolerance, operationalized
using an index of corruption tolerance. A key individual-level factor is argued to be trust in the
institutions that exercise government authority and are tasked with the implementation of public policy,
namely the police, the courts, and the civil service (bureaucratic distrust). Public administrations and
individual civil servants are generally expected to perform their duties in an evenhanded and efficient
manner. Failure to meet these expectations may have deleterious consequences for the legitimacy and
utility of the formal norms that citizens and firms are expected to follow, possibly resulting in wider
acceptance of “uncivic” free riding behavior. The focus of this study lies partly on the conditions under
which bureaucratic distrust influences corruption tolerance, and if/how the nature of this relationship
varies depending on country characteristics such as the level of socio-economic development and
economic inequality, the extent of public-sector corruption and government efficiency, and economic
performance. However, this study is also interested in the potential direct effects of these contextual
factors.
The results of the analyses in this study suggest that citizens who distrust the implementing
authorities and perceive public officials as corrupt generally have a higher tendency of tolerating
corruption. Moreover, out of the five previously mentioned main macro-level variables, only economic
inequality is significantly related to corruption tolerance. Societies with a high level of economic
inequality tend to show a higher tolerance of practices that can be understood as corrupt. Finally, the
results suggest that the effect of bureaucratic distrust tends to be significantly weaker in highly unequal
and highly corrupt societies, possibly due to varying expectations among citizens in different societies.
Citizens in relatively equal societies with low levels of corruption are argued to have higher hopes and
expectations of public institutions and officials, which can have negative consequences in the form of a
higher corruption tolerance if they feel that they have been unfairly treated by the state.
ix
ABSTRAKT
Tolerans gällande tagande av mutor, skattesmitning och andra former av vad som kan anses vara en typ
av (samhällelig) korruption på låg nivå eller ett mått på medborgerlig moral, eller snarare avsaknaden
av det, har varit ett omdebatterat fenomen inom samhällsvetenskaperna. Är vissa samhällen eller
kulturer mer accepterande av korrupt praxis, och i så fall varför? Genererar dysfunktionella strukturer
och korrupta eliter dysfunktionella medborgare som tolererar fusk och snålskjutsåkande på
allmänhetens bekostnad (den s.k. rotting fish-tesen), eller är korruptionstolerans en del av en ”mer
övergripande kultur” som påverkar kvaliteten på de offentliga institutionerna (den s.k. raccomandazione-
tesen)? Den centrala frågan som undersöks i denna studie är därmed ”Genererar dysfunktionella
kontexter dysfunktionella medborgare med en högre tolerans angående korrupt beteende?”.
Denna övergripande forskningsfråga och de forskningsfrågor som är härledda från den granskas
med hjälp av flernivåanalys av World Values Survey-data från över 80 olika länder världen runt. Målet
med dessa analyser är att empiriskt undersöka förhållandet mellan både subjektiva och objektiva mått
på samhällelig dysfunktionalitet och korruptionstolerans, operationaliserat med hjälp av ett
korruptionstoleransindex. En nyckelvariabel på individnivån argumenteras vara förtroendet för de
institutioner som utövar statlig auktoritet och har till uppgift att implementera offentlig policy, nämligen
polisen, rättsväsendet, och statsförvaltningen (byråkratiskt misstroende). Den offentliga
administrationen och de individuella tjänstemännen förväntas generellt utföra sina plikter på ett
opartiskt och effektivt sätt. Ett misslyckande i att uppfylla dessa förväntningar eller krav kan ha skadliga
följder för legitimiteten och nyttan av formella normer som medborgare och företag förväntas följa,
vilket möjligtvis kan resultera i en mer omfattande acceptans av fusk och korruption. Studiens fokus
ligger delvis på omständigheterna under vilka byråkratiskt misstroende påverkar korruptionstolerans,
och om/hur detta förhållandes natur varierar beroende på ländernas strukturer när det kommer till
socio-ekonomisk utveckling och ekonomisk ojämlikhet, graden av offentlig korruption och statlig
effektivitet, samt ekonomisk prestanda. Dock är den även intresserad av de potentiella direkta effekterna
av dessa kontextuella faktorer.
Analysresultaten tyder på att medborgare som misstror de implementerande myndigheterna och
uppfattar offentliga tjänstemän som korrupta generellt tenderar ha en högre korruptionstolerans.
Dessutom verkar ekonomisk ojämlikhet vara den enda av de fem tidigare nämnda makrovariablerna
som har ett signifikant samband med korruptionstolerans. Samhällen med en hög nivå av ekonomisk
ojämlikhet tenderar ha en högre nivå av tolerans gällande praxis som kan uppfattas som korrupt.
Slutligen så tyder resultaten på att effekten av byråkratiskt misstroende tenderar att vara märkbart
svagare i samhällen med hög ojämlikhet och omfattande korruption, möjligtvis på grund av varierande
förväntningar bland medborgare i olika samhällen. Medborgare i relativt jämlika samhällen med låga
nivåer av korruption argumenteras ha större förhoppningar och förväntningar på offentliga institutioner
och tjänstemän, vilket kan ha negativa konsekvenser i form av högre korruptionstolerans ifall de
upplever sig ha blivit orättvist behandlade av staten.

PART ONE
Theory and conceptualization

1
1. Introduction
“The Fish Rots from the Head Down” – old proverb
The 18th century French philosopher Jean-Jacques Rousseau (1712 – 1778) expressed the
thought that men and women are born good and pure of nature only to be corrupted
by society and the prevailing institutions1 at a later stage (Lane & Ersson 2000, 1). A
similar notion is repeated in the very old proverb cited above, where “the fish” can be
viewed as a metaphor for the general society and “the head” for the institutions or the
elites that comprise or shape these institutions. In other words, the moral sturdiness of
the broader layers of society is to some degree a function of the perceived behavior and
morality of those at the top and those that represent the state.
A central objective of this dissertation is to test this claim with a focus on a specific
category of institutions and a specific societal phenomenon that many would label a
serious threat towards social order and political stability, namely the bureaucratic or
order institutions that comprise the state apparatus itself and corruption tolerance, i.e.
citizen views of corrupt and uncivic behavior. How confidence in public authorities
interacts with contextual factors central in theories of modernization, such as socio-
economic development, economic inequality, or institutional quality and economic
performance, in shaping attitudes toward corrupt practices is largely unexplored in the
relevant literature. This is where the current monographic research piece hopes to
make its most significant contribution in the fields of good governance and citizen
opinion concerning norms of civic behavior.
There are several strong reasons why it is important to examine which factors
generate a higher corruption tolerance.2 For instance, it may illuminate why the
willingness to behave corruptly is significantly stronger in some groups or societies, or
why the willingness to oppose corruption or act as whistleblowers is weaker (Moreno
2002; Lavena 2013; Lascoumes & Tomescu-Hatto 2008). In other words, it may facilitate
the building of a “corruption-resistance” by giving policy makers and anti-corruption
practitioners additional empirical data on the factors that produce the kinds of
“uncivic” attitudes that may ultimately result in corrupt behavior. This in turn could
result in more efficient and well-functioning states that are ready and able to meet the
demands of ordinary citizens.
Bribery, an act commonly regarded as the most typical form of what is often
considered to be “corruption”3, and other related behaviors that aim to provide private
benefits at the expense of the wider community and the public good, is widely seen as
unethical, immoral and deplorable in all societies due to the uncivic betrayal of trust,
1 See section 1.4 in this chapter for a brief discussion on the use of the word “institution”. 2 See section 1.3 in this chapter for a more extensive discussion on this topic. 3 See discussion on “what is corruption?” in section 1.2 of this chapter.
2
waste of resources, and other negative externalities commonly associated with these
types of behavior. In spite of a broad agreement on the undesirability of these types of
free riding behavior, previous studies have found significant cross-country and cross-
regional variation in what some scholars call “low-level corruption tolerance”4
(Pozsgai Alvarez 2015), i.e. in attitudes regarding the justification or acceptance of
corrupt or free riding behavior such as bribe taking or tax evasion (e.g. Moreno 2002).
For instance, while value-mapping surveys show that a large majority of respondents
(70-80 %, WVS 2015) claim that they find someone accepting a bribe completely
unacceptable, there still remains a significant portion of survey respondents who say
that they consider it acceptable praxis, at least under some circumstances.
A short clarification, which is expanded upon in later sections, is in place regarding
the exact meaning of the term “corruption tolerance”, as it is generally used here. This
dissertation does not intend to focus solely on attitudes regarding the abuse of public
office or power, so-called “public corruption”, which is the contemporary conception
of corruption. Due to both practical and theoretical reasons, it has adopted a relatively
broad definition of corruption. A definition that is not focused on any specific forms of
behavior (e.g. bribery or nepotism) but more on corruption as a wider “syndrome”5, a
decay of civic duty among citizens of a society, that can potentially be caused by the
widespread malfeasance of public officials or some other factors. Moreover, the study
intends to utilize the extensive literature on corruption as a theoretical starting point
for explaining variations in the attitudes of interest in this dissertation.
The great majority of the current literature on corruption and good governance has
focused on the input, i.e. the political, side of the government, and has explored the
significance of the political system and various kinds of institutional configurations
such as the electoral or the party system (Dahlberg & Holmberg 2013). One major
recurring research theme has been the impact of democracy on corruption, and a
growing number of empirical studies have depicted a non-linear relationship between
these two concepts (see e.g. Malmberg 2014). These studies have therefore concluded
that the introduction of democratic elements such as free competitive elections is not
enough; something more is needed if one hopes to get corruption under control and
wishes to generate a relatively good and civic citizenry. This “more” requires,
according to some calculations made by scholars, a period of several decades (at least
40 years according to Lambsdorff [2006]) for the democratic system to “consolidate”
enough, during which “new” kinds of (political) corruption may run rampant,
4 Throughout this study, it will mainly be using the term low-level corruption tolerance or just corruption tolerance when
discussing this phenomenon. When discussing its results, it will refer to low-level corruption tolerance, however,
for the sake of brevity it will leave out the low-level part. For a discussion regarding the difference between low-
level and high-level corruption tolerance, see section 1.2 in this chapter. 5 Compare with Johnston (2005) and the discussion in Chapter 2, section 2.1.2.
3
resulting in losses of faith in the democratic system and possibly in a return to various
forms of authoritarianism.
A growing number of empirical studies have linked trust, both interpersonal and
institutional, to corruption and unethical behavior. Enrico Colombatto (2003, 363), for
instance, argues that under several circumstances corruption may be “a rational and
understandable reaction to institutional failures” and/or even a legitimate tool to
achieve widely shared goals. This view is shared by Donatella Della Porta (2000, 205),
among others, who claims that the “lack of confidence in government actually favors
corruption insofar as it transforms citizens into clients and bribers who look for private
protection to gain access to decision-makers”. Trust is often argued to influence
behavior and the willingness to cooperate in a pro-social manner and is thereby very
likely to have an impact on individual tendencies of resorting to both illicit means of
influence and other malfeasance that serves self-interest (Sööt & Rootalu 2012, 82).
Susan Rose-Ackerman and Bonnie J. Palifka (2016, 236) meanwhile argue that the
large majority of people in societies perceived to have extensive amounts of corruption
view corrupt behavior such as bribery, nepotism, and cronyism as “a detour around
the constrictions of a dysfunctional state”, even though they largely condemn such
behavior. If this statement is true, there should be a greater prevalence of voiced
corruption acceptance in so-called “dysfunctional states”6 with low-quality public
services that are unable to meet the demands of ordinary citizens, or at least in the
minds of those who perceive the state as dysfunctional and, therefore, unworthy of their
trust. However, is there sufficient empirical evidence to support the prevalence of a
rationalization and justification of corrupt behavior in the minds of individual citizens
based on institutional quality or perceived social injustices? Alternatively, are there
some “cultural” explanations that can be traced far back in time that explain any
current cross-country differences in views on malfeasance? These are some of the
questions explored in this study.
Utilizing an immense quantity of high quality, individual level survey data,
accumulated over more than three decades, this study examines the link between
confidence in the implementing institutions (the police, the courts, and the civil
service), and why some members of society find corruption to be justifiable, while most
do not. Furthermore, it also examines why some societies seem to be more tolerant of
corrupt and uncivic behavior. Additionally, it also examines the potential impact of
public sector performance, measured using different indicators of institutional quality,
and other so-called “ecological” effects in a multilevel framework, while also
considering possible cross-level interactions. One of the main questions that this study
seeks to answer is therefore: What is the role of public institutions and social structures
in explaining individual and societal differences in corruption tolerance? According to
6 See section 1.4 in this chapter for a brief discussion on the use of the word “dysfunctional”.
4
Maria Kravtsova, Aleksey Oshchepkov and Christian Welzel (2014, 8), “[t]here is a
small but growing body of papers that analyze factors determining individual
willingness to engage in corruption or propensity to justify it […], but they do not pay
much attention to social values”. This study therefore builds on these relatively few
previous studies on the individual determinants of the propensity to justify corrupt
behavior with a focus on the relationship between the citizens, the state, and the civic
culture.
The structure of this dissertation is as follows: This dissertation is divided into two
main parts. The first part (Part I), of which this introduction chapter (Chapter 1) is a
part of, lays out the theoretical and conceptual foundations for the present study,
building on previous research on corruption, civic attitudes, trust, social capital,
inequality, and other related research areas. First, the research questions are presented,
after which the central concepts of this study, “corruption” on one hand and
“corruption tolerance” on the other hand are discussed and clarified conceptually. The
distinction between these two concepts is central to the theoretical discussion that
comes later in this study. Following this, the reasons why corruption tolerance should
be studied are discussed, and this introduction is wrapped up with a short discussion
regarding the often used ambiguous words “institution” and “dysfunctional”, words
included in the title of this dissertation that play central roles in the theoretical
discussion to come.
The following chapter (Chapter 2) starts by providing some general theoretical
arguments as to why a rational citizen or a group of citizens could perceive corruption
and bribe taking as justifiable in some cases or contexts. This chapter also presents a
few typologies of corruption that are useful to bear in mind when thinking of how
attitudes may vary and how different kinds of societies experience different kinds of
corruption. Next, some arguments are provided as to why and how institutional trust
or confidence in the public authorities, especially in the bureaucratic implementing
institutions that constitute the state apparatus itself, and the general (perceived) quality
of the public sector are linked with the individual tendency to justify corrupt or
unethical behavior. The focus here is on individual- or micro-level (subjective) factors
that may influence attitudes towards deviant behavior. The next section moves up the
ladder of abstraction to consider potential contextual country- or macro-level predictors
of corruption tolerance. Do dysfunctional societies produce equally dysfunctional
citizens? In the final two theoretical sections, this study considers potential cross-level
interaction or moderating effects and the hypotheses are summarized. It is argued that
the level of economic inequality in a society and the institutional quality has a
modifying influence on the effects of confidence that depends on prevalent
expectations of fair and impartial treatment from public officials.
Part II is the empirical part of this study and begins by presenting the research
design (Chapter 3), which includes the operationalization of the variables, an
5
illustration of the research model, and descriptions of the method of analysis and the
data sources used in this study. The following chapter (Chapter 4) presents the results
of the empirical analyses. It also briefly discusses the implications of the results for the
hypotheses presented in the previous chapter and concludes with a few robustness
tests. The final chapter of this study (Chapter 5) summarizes and discusses the results
and the conclusions that can be inferred from them based on the theoretical discussions
in Part I. This final chapter also considers the limitations of this study, and touches
upon a few policy recommendations based on the conclusions, while providing some
recommendations for future studies. Finally, this chapter concludes with some remarks
on the discussions in the previous chapters.
1.1 Research questions
After this introduction to the themes of this study, this study moves on to discussing
the precise research questions that are examined here. The dissertation operates with
one main research question, which in turn is divided into three subsidiary or “sub”-
research questions concerning the impact of more specific factors. The overarching
research question that sets the whole theme of this dissertation reads as follows:
Main research question: Do dysfunctional societal contexts generate dysfunctional
citizens with a higher tolerance of corrupt behavior?
This overarching research question sets the main theme of this dissertation and is in
turn divided into the following three subsidiary research questions that structure the
theoretical and empirical parts of this dissertation:
Sub-research question 1: Do bureaucratic distrust and self-perceived public sector
corruption affect corruption tolerance?
Sub-research question 2: Do dysfunctional social contexts affect corruption tolerance?
Sub-research question 3: Is the relationship between bureaucratic distrust and corruption
tolerance moderated by the self-perceived extent of corruption and/or different social contexts?
If so, how?
The theoretical foundations for these research questions and the hypotheses derived
from them are laid out and presented in the next chapter (Chapter 2). In the next
section, the two central concepts of this study, “corruption” and “corruption
tolerance”, are examined closer.
6
1.2 What is corruption tolerance?
The phenomenon encapsulated in the terms “corruption tolerance”, “corruption
permissiveness” or “corruption acceptance”, whichever term one chooses to use, is
utilized in a number of different ways in various studies and contexts (for a review, see
e.g. Pozsgai Alvarez 2015). There is even an ongoing scholarly debate regarding if it is
even rational to apply these terms in many of the cases where they are applied today.
The main goal of this section is to clarify what exactly this study principally refers
to when discussing corruption tolerance, which is the most frequently used term for
this phenomenon in this particular study. Before moving on to discussing this topic,
however, we first need to take a brief general look at the first part of this concept,
namely “corruption”. What is it exactly?
What is corruption?
Providing an exact and uncontroversial answer to this question is no easy task.
Corruption is a multidimensional phenomenon and probably one of the most complex
and oldest concepts in the social sciences, as we will see. There is no universally agreed
upon definition of corruption, and there are both extremely broad and extremely
narrow definitions, however, these various definitions will not be elaborated upon here
beyond a few examples (for a more comprehensive discussion, see e.g. Mikkelsen
2013).
The word “corruption” itself has its roots in the Latin verb corrumpere, where a
translation could read to break up, annihilate, destroy, spoil, make worse, or weaken.7 These
translations reveal an intrinsic negative connotation that gives a good idea of how
much (or rather how little) people value activities viewed as corrupt and those
individuals who engage themselves in such activities. In a literal sense, when
something becomes corrupted it comes apart into considerably smaller, weaker, and
vulnerable pieces of a whole (Mikkelsen 2013, 358-359). Hence, corruption is often
metaphorically described as a cancer or an infectious disease on society and the root of
many of the misfortunes that can befall an organized society, including, among other
things; poverty, inequality, political instability, and a general atmosphere of distrust
towards both other members of society and the governing institutions (Groop 2013,
21).
The early pre-modern conceptions of corruption, originating from great thinkers
such as Plato, Machiavelli, Montesquieu and Rousseau (see e.g. Friedrich 1972), were
very broad and focused mainly on the moral character of individuals, societies and
cultures. Corruption, when referring to people, was understood as the decay or
7 University of Notre Dame Latin Dictionary (2019).
7
unravelling of communities, and as a deviation from moral duty or loss of virtue, which
was believed to manifest itself as behavior contrary to public or civic duty (Mikkelsen
2013, 359). This broadness in turn meant that these conceptions were arguably of
limited use in the institutional engineering that followed the liberal revolutions where
the new social engineers strived to limit the types of behavior that had earlier often
been the norm in absolutist monarchies, such as, for instance, the sale of public offices
to the highest bidders (known as venal office) or close acquaintances. Niccolò
Machiavelli, whom Mark E. Warren describes as “the period’s most perceptive student
of corruption”, regarded corruption primarily as a moral condition, “measured by the
distance between a people’s collective character and moral standards of everyday
conduct as defined by their Christian context” (Warren 2004, 329). Rousseau, whose
ideas were briefly touched upon in the beginning of this dissertation, meanwhile
claimed that all human beings were born good and pure, but became corrupted by
civilization and their surrounding society. Corruption has therefore historically been
seen in political thought as a “decay of the body politic” or societal corruption, a
dangerous impurity or damaging infection in the moral fabric of a political community
(Dobel 1978).
The old Romans, whose success in the accumulation of wealth and power was
argued to have resulted in a general moral decay that contributed to the eventual
downfalls first of the Roman Republic and then the subsequent Roman Empire, is often
used to exemplify this (Hindess 2012). One common theme also explored in the
sociological literature is how “success” and socio-economic development, or rather
various forces of modernization may engender feelings of normlessness and alienation
(what Durkheim [2013 [1893]] calls “anomie”) that may prove fertile for both self-
damaging behavior8 and various forms of malfeasance and corruption. However, the
limitation of corruption specifically within the politico-administrative sphere, or in the
gray area between the public and private spheres, craved by the new societal engineers
required conceptions centered on specific standards of conduct within this particular
sphere, and a prerequisite for this was the existence of commonly agreed upon rules
that regulate the public sphere.
Warren has identified two historical developments that according to him were
essential to the development of politically practical concepts of corruption. The first
innovation was i) rationalized bureaucracies with clearly written rules and codes of
conduct, while the second was ii) the idea that an institution can be superior to the
individual constituting it (Warren 2004, 329). These two developments together gave
birth to guidelines that enabled an identification of corruption in behavioral terms,
rather than purely as moral decay, and this in turn gave the conceptual tools needed in
order to limit and combat behavior identified as corruption within the public sector.
8 Émile Durkheim (2006) associated anomie with suicide in one famous study from 1897.
8
The “modern” narrow and most frequently utilized definition of (public) corruption as
“abuse of public office or power for private gain” originates from these developments and
focuses on (public sector) elite conduct that is contrary to the rules and demands of a
public office and often aims at self-enrichment.
Many of the contemporary studies of corruption proceed from a variant of the
aforementioned narrow definition of corruption. However, there are some notable
exceptions. Michael Johnston (2005, 12), one of the most prominent scholars in the field
of corruption research, for instance, defined corruption as “the abuse of public roles or
resources for private benefit” (italics in the original, see also Chapter 2, section 2.1.2 of this
dissertation and Johnston’s “syndromes of corruption”). The main difference between
this definition and the previous one is that while the former holds that a public office
holder or authority always must be involved for it to be considered corruption, the
latter does not hold the same requirement. The latter can be interpreted as a somewhat
broader definition, including the abuse of public resources for private benefit as an
attribute of corruption. This definition could therefore arguably also cover various
forms of embezzlement that involve public resources such as taxpayer money or public
property.
J. Patrick Dobel (1978, 960), in his “theory of corruption”, uses a similarly broad
notion of what he calls societal or state corruption (contrast with individual corruption) as
“the moral incapacity of citizens to make disinterested moral commitments to actions,
symbols and institutions which benefit the common welfare”, i.e. disloyalty towards
the state and the common good. He further argues that “[t]he corruption of states and
the corruption of people proceed hand-in-hand [,…t]o take corruption seriously is to
take civic virtue seriously” (Dobel 1978, 972). Focusing exclusively on the behavior of
public officials would then not only be insufficient but also futile when examining the
“corruption of states” and its causes.
Johnston (2005, 12) in turn argues that instead of focusing on specific actions (e.g.
bribe taking), or sporadic corruption, i.e. corruption that occurs irregularly, it is more
fruitful to focus on what he calls systemic corruption, i.e. corruption that is primarily the
result of weaknesses of institutions or processes. The reason for this is the varying
degree of ambiguity involved in the words “abuse/misuse”, “public”, “private”, and
“benefit”, which are often widely contested both academically and elsewhere. Many
actions, especially those that can be found in the gray zones between public and
private, are extremely difficult to categorize with absolute certainty as either “corrupt”
or “not corrupt”. It can for instance be very difficult to identify the exact moment when
private resources become public resources (or vice versa).9 Is it after your money has
9 In many states, the boundaries between public and private resources or between public and private actors have
become somewhat fuzzy, to say the least, during the last few decades. The emergence of the so-called “post-
modern state” and New Public Management (NPM) is argued to have led to “a blurring of conventional
divisions between different spheres of activity, notably the public and private sectors” (Heywood 2018,
9
actually been transferred to the tax authorities, or is before, when you are bound by
law to pay the taxes?10 Johnston furthermore argues that the previously mentioned
ambiguity or contention regarding the exact meaning of corruption can be turned into
an advantage at a systemic level as “useful indicators of difficulties or change at the
level of participation and institutions” (Johnston 2005, 12). Frequent abuses of public
resources by private citizens, or acceptance thereof, could for instance be a sign of
disputed boundaries between “public” and “private”, and signal critical institutional
weaknesses such as frequent abuses of power by the public officials themselves.
Due to this inherent conceptual ambiguity of corruption and the broad definition of
corruption tolerance utilized in this dissertation (see below), this study has decided to
adopt Johnston’s (2005) broader definition of corruption as the abuse of public roles
or resources for private benefit.
Paul Heywood (2018, 9), among other scholars, points out that the word
“corruption” is generally treated as if its meaning is self-evident. He argues that this
practice “acts as an obstacle to moving the anticorruption agenda forward” and that
“[a] main drawback to discussing “corruption,” without any adjectives, is that we
cannot reach any kind of consensus, other than at an abstract or generic level, over
what it comprises” (Heywood 2018, 10). Furthermore, it is important to distinguish
between different types and forms of corruption so that we may examine how they
relate to both one another and to other factors. There are a multitude of different
corruption typologies in the corruption literature, some of which were already
mentioned (individual/societal corruption and sporadic/systemic corruption), and we
will continue to briefly examine a few of them here and a few later on in this study.
To start off, corruption can be divided into public(-sector) corruption on one hand and
private(-sector) corruption on the other hand. Public corruption embraces the earlier
discussed duty of public officials as its starting point, while private corruption consists
of malfeasance that takes place in the private sector without the public sector or any
government officials involved (Rose-Ackerman & Palifka 2016, 7). Private corruption
may involve workplace malfeasance such as sexual harassment, unethical decision-
making, workplace theft, insider trading, business-to-business malfeasance such as
corporate espionage, bribery of other businesses or their employees, and other forms
of behavior that break the rules of a workplace and/or the law, or are perceived as
unethical business practices (Mikkelsen 2013, 360). This latter type of corruption falls
outside the scope of this study because it involves neither public roles nor (at least in
most cases) resources. Corruption, as it is generally used in this dissertation, does not
include all types of malfeasance or deviant behavior such as ordinary theft or fraud.
15). Heywood (2018, 15) further claims that in many states “there no longer exists a clear separation
between the respective remits of public and private providers: not just in terms of policy delivery, but
increasingly in terms of policy design, especially in relation to financial and regulatory matters”. 10 “Render unto Caesar the things that are Caesar's” (Biblehub 2019).
10
Another vital distinction that has been made in the corruption literature is that
between political, elite or grand corruption on one hand and bureaucratic or petty corruption
on the other hand (Rose-Ackerman & Palifka 2016, 11).
Grand corruption involves fewer but more powerful actors (e.g. top-level
politicians, bureaucrats, and businesspersons) and substantial sums of money and
other valuable benefits such as public procurement contracts and favorable legislation.
Petty corruption, meanwhile, involves ordinary citizens, grass-root-level bureaucrats
and smaller sums of money and less valuable benefits such as a driver’s license or
business permit (Rose-Ackerman & Palifka 2016, 11). Moreover, petty corruption,
which is considerably easier for citizens to observe than the distant and opaque grand
corruption, is said to be more common in less wealthy societies while grand corruption
is argued to be the dominant form of corruption in wealthy consolidated democracies.
This distinction is highly relevant, as we will see later in this dissertation, due to the
observation made by some scholars (see e.g. Uslaner 2008) that the type of perceived
corruption (petty or grand) has important implications for how it affects attitudes
concerning, for instance, the general trustworthiness of fellow citizens.
A large majority of prior corruption research has focused on the causes and
consequences of corruption as a general phenomenon in contemporary societies (see
e.g. Treisman 2000; Montinola & Jackman 2002; Lambsdorff 2006). These studies have
met quite a lot of criticism largely due to a) the difficulties involved in the
conceptualization of this phenomenon, and b) the substantial difficulties involved in
operationalizing it and observing it directly due to its highly illusive nature.
What is corruption tolerance?
The notion in the present study to empirically analyze and compare attitudes towards
corruption is far from a novel one. There have been quite a few case or area studies of
how citizens in different societies perceive corruption and the criteria they use to judge
the acceptability of illegitimate behavior (see e.g. López López et al. 2017; Lascoumes
& Tomescu-Hatto 2008).
One groundbreaking study of variations in public opinions on corruption was
written by Arnold Heidenheimer (1970), who divided corruption into three different
types: Black, white, and grey corruption. Black corruption indicates according to this
typology actions that a majority consensus of both elite and mass opinion would
condemn and punish on grounds of principle. White corruption meanwhile indicates
actions that this majority consensus would not condemn nor punish as vigorously due
to the perceived costs involved in enforcing such rules. Grey corruption, on the other
11
hand, indicates a lack of consensus or a dissonance in elite contra mass opinion on
whether certain actions should be condemned and/or punished (Heidenheimer 1970).11
However, there have been relatively few previous studies that have examined the
connection between various country- and individual-level variables and the
willingness to accept or tolerate corrupt behavior across multiple societies (see e.g.
Lavena 2013; Kravtsova et al. 2017; Pop 2012).
There have been some related empirical studies concerning “the roots of civic
morality” (Letki 2006) or so-called rational-choice corruptors (Bohn 2012, 2013).
However, none, to the best of my knowledge, has focused specifically and
systematically on the relationship between a) confidence in the implementing
institutions12, b) institutional quality, and the attitudes of interest with the scope and
scale of the present study.
Previous literature on corruption tolerance can be divided into two categories based
on the definition of corruption tolerance and the type of corruption involved, i.e. high-
or low-level corruption (Pozsgai Alvarez 2015; see earlier discussion).
As was already discussed, high-level (or grand) corruption involves senior
politicians, administrators, and other elites, and concerns relatively large sums of
money or other valuable benefits, while low-level (or petty) corruption involves mostly
lower level officials and ordinary citizens, and concerns smaller sums or benefits. One
key differentiating factor between these two categories is the accessibility of corrupt
dealings to ordinary citizens: The average citizen tends only to have access to relatively
low-ranking public officials and petty resources, and can therefore only engage in
corrupt actions with them.
The first category includes studies that define corruption tolerance as “citizens’
support for corrupt politicians” (Pozsgai Alvarez 2015, 102). The studies belonging to
this category examine why citizens continue to give their support to corrupt
governments and politicians even though they are often aware of the fact that the
public actors are likely to be involved in corrupt dealings (e.g. Chang & Kerr 2009;
Manzetti & Wilson 2009; Pani 2011). Meanwhile, the second category includes studies
that define corruption tolerance as “citizens’ willingness to engage in corruption”
(Pozsgai Alvarez 2015, 102). The focus of the present study lies mainly on this second
category of definitions, of which one example is Gabriela Catterberg and Alejandro
11 Usually elites want to see an action punished while others do not, and the majority is ambiguous on the subject
(Lascoumes & Tomescu-Hatto 2008, 24). Examples of grey corruption are (certain types of) lobbying or political
appointments for non-political offices, which tend to be formally legal but are sometimes perceived as morally
questionable practices by certain groups. 12 In a similar fashion to Kravtsova et al.’s (2017, 14) study of postmaterialism, this study will not interpret the
relationship between institutional trust and corruption tolerance as a causal relationship, but rather as a correlation.
Institutional trust will function more as a sort of individual-level proxy of perceived institutional quality, because
both confidence and attitudes towards corruption are likely to be simultaneously determined by a third factor.
12
Moreno’s (2006, 42) definition of what they call corruption permissiveness as “the
willingness to justify acts of corruption in society”.
“Corruption” is in this context understood in the previously discussed older and
considerably broader sense as a decay of the body politic or citizen misconduct
involving public resources, as opposed to the more narrow (political) elite misconduct,
which may involve various types of low-level corruption or “free riding” activities
involving the public sphere or the public good. This broader perspective of corruption
thusly resembles somewhat the one adopted by Raymond Fisman and Edward Miguel
(2007, 1022), who examined the “corrupt” behavior of UN diplomats with regard to
parking violations, and interpret it as “reflecting their underlying propensity to break
rules for private gain”.
Ordinary citizens are arguably more likely to be willing to accept such acts in which
they themselves or their family can personally engage and benefit from, which
excludes most forms of elite or high-level corruption where the corruptors tend to be
economic agents with repeated interactions with government officials. This would
thereby suggest that an individual could have both a high tolerance of low-level
corruption and a low tolerance of high-level corruption or vice versa. Eric Uslaner
(2008), for instance, has argued that ordinary people blame growing inequality on the
immoral and corrupt behavior of elites, which they condemn and criticize, while at the
same time excusing and justifying low-level or petty corruption in which they
themselves willingly participate.
However, one could also imagine there to be some spillover effects where a citizen’s
support for corrupt government officials (i.e. high-level corruption tolerance) could
influence his or her own willingness to engage in “grass root corruption” or vice versa.
Factors that explain high-level corruption tolerance, such as the occurrence of
widespread clientelism and vote buying, could therefore also potentially contribute to
predicting low-level corruption tolerance.
The index used to measure low-level corruption tolerance in this study is very
similar to the “civic morality index”13 used by Natalia Letki (2006, 312) to study
attitudes regarding “the acceptability of certain types of public good related behavior”.
Only one (acceptability of bribe taking) of the four items included in Moreno’s (2002)
corruption permissiveness is excluded from Letki’s index (see Chapter 3, section 3.1.1).
This study’s dependent variable can therefore also be understood in a broader sense as
not just acceptance of (public) corruption in the strict modern public office-centered
sense14 that we saw earlier, but also as the opposite concept of civic morality. A concept
13 Stephen Knack and Philip Keefer (1997, 1256-1257) used a similar index to assess the “strength of norms of civic
cooperation”. However, this index also included WVS items asking about the justifiability of “keeping money that
you found” and “failing to report damage you´ve done accidentally to a parked vehicle”, i.e. questions that capture
honesty in general, rather than attitudes toward free riding behavior and the public good. 14 I.e. as “abuse of public office or power for private gain”, which may include such practices as bribe taking,
nepotism, etc.
13
that Letki (2006, 306) describes as “honesty in the context of the public good […that]
leads citizens to maximize public rather than private gains, therefore deterring them
from engaging in corruption and free-riding”.
Following this logic and combining the two previously discussed definitions with
the earlier adopted definition of corruption, this study has chosen to define corruption
tolerance as the willingness to justify the abuse of public roles or resources in order
to maximize private gains.
The average citizen rarely has the resources (money, contacts, etc.) needed to take
advantage of the system in such a way that he or she can extract large benefits from it.
This observation in turn suggests that he or she often has to settle with “minor” or
“grass-root” forms of corruption, such as claiming undeserved government benefits,
avoiding fares on public transports, or cheating on taxes. The key similarity between
“grass-root” and “elite” corruption is therefore that it involves individuals or groups
striving to maximize private benefits at the expense of the rest of society or the public
good, i.e. acts of disloyalty towards the state (Dobel 1978).
However, this dissertation will address both low- and high-level corruption
tolerance in order to give a more complete and nuanced picture of corruption tolerance
as a broader phenomenon, and how these two tolerances could potentially interact
with each other.
1.3 Why study corruption tolerance?
What determines individual- and country-level variations in attitudes toward abuse of
power and other related “social order norms”? Why are some individuals, societies
and/or cultures perceived to be more tolerant of both high-level and low-level
corruption compared to others? The answers to these questions may aid in explaining
why the general willingness to oppose corruption, for instance by acting as what is
called a “whistleblower”15, might be weaker, and why the willingness to participate in
corrupt exchanges might be stronger, in some social groups and societies compared to
others (Moreno 2002; Lavena 2013; Lascoumes & Tomescu-Hatto 2008).
Take for instance France as an illustration due the notably high corruption tolerance-
level observed in this advanced European democracy (see Figure 4.3 in Chapter 4,
section 4.1). Survey evidence concerning “ambiguities” in attitudes toward corruption
in France reveal that French citizens have a higher overall tendency of tolerating both
corruption and tax avoidance compared to the average European citizen (European
15 Whistleblowing entails reporting practices that attempt to “reveal fraudulent inside behavior to internal or
external authorities” (Lacoumes & Tomescu-Hatto 2008, 30).
14
Social Survey [ESS] in Lacoumes & Tomescu-Hatto 2008, 36).16 The authors’ own
survey finds, among other things, that “a large number of French citizens consider it
normal to solicit the help of elected officials in seeking solutions to personal problems”
(Lacoumes & Tomescu-Hatto 2008, 36).
Moreover, the survey also reveals that, in the authors’ own words, “[…] what
resembles a chain reaction, the high level of tolerance of corruption makes the practice
of whistleblowing appear almost unethical. Reporting is often seen as an uncivic
practice and provokes negative reactions among a large part of the population”
(Lacoumes & Tomescu-Hatto 2008, 37). High levels of tolerance regarding modes of
behavior linked with the phenomenon known as corruption could therefore be
deleterious to any efforts to control it efficiently if it makes ordinary citizens less likely
to report it and less likely to take an active stance against malfeasance. On the contrary,
they may instead take active measures to try to sabotage anti-corruption measures by,
for instance, ridiculing those who resist demands for bribes and are willing to “blow
the whistle” on such practices.
In some endemic cases, many may even show admiration towards those who dare
exploit the system using corrupt methods. There is for instance a 1997 report from an
anti-corruption commission in the Philippines where the head of this commission,
Eufemio Domingo, laments that
[w]e have all the laws, rules and regulations and especially institutions not only to curb, but
to eliminate, corruption. The problem is that these laws, rules and regulations are not being
faithfully implemented…I am afraid that many people are accepting (corruption) as another
part of our way of life. Big-time grafters are lionised in society. They are invited to all sorts of
social events, elected and re-elected to government offices. It is considered an honor – in fact a
social distinction – to have them as guests in family and community affairs (Balgos 1998, in
Quah 2004, 65).
Hence, it is of considerable importance that policymakers are provided with further
empirical evidence concerning different factors that might conspire to make citizens
more inclined to accept these types of “anti-democratic” and “illiberal” behaviors and
which particular social groups are most susceptible to these kinds of dispositions.
The ambition of this study is thus to develop a model of the impact of the
performance of public policy implementing institutions, measured using both
subjective individual-level measures and objective country-level measures, on
corruption tolerance, while taking into account various contextual or “ecological”
16 Sixty-seven percent of Europeans judge it completely unacceptable for a public official to accept a bribe, while the
corresponding percentage for French citizens is 49. Similar patterns can be seen concerning tax avoidance: While
fifty percent of Europeans perceive it as completely unacceptable to pay cash to avoid the VAT, the corresponding
percentage for French citizens is 32 (Lacoumes & Tomescu-Hatto 2008, 36). The average score on the corruption
tolerance index used in this study is approximately 49 for France compared to 38 for all included cases (see Figure
4.3 in section 4.1).
15
factors such as the extent of economic inequality. The purpose of this dissertation is
thus to contribute to the existing research in this area by examining the potential effects
of a number of different variables that characterize the relationships between citizens
and administrators of public policy on the tendency to condone corrupt behavior
within varying contexts.
What do we have to gain in learning which individual- and country-level factors
affect the level of tolerance toward corruption? One answer already hinted at in the
previous paragraphs is that these types of studies enable us to identify structural
weaknesses in our institutions that shape and influence individual views, values and
behavior, spawning so-called “cultures of corruption”. This in turn might empower
policymakers to reform these institutions and structures, influencing the degree to
which citizens perceive corruption and their willingness to justify illicit actions. In
short, it could be of use in detecting, strengthening, and sustaining a general
willingness in society to combat corruption and refrain from participating in it (Lavena
2013, 345-346).
Moreover, as stressed by Eric Chang and Nicholas Kerr (2009, 6), “anti-corruption
policies can be most successful if geared toward removing institutions that induce
corruption tolerance”. One study of high-level corruption tolerance, for instance,
demonstrates that those who are more tolerant of bribery are significantly more likely
to be supportive of governments perceived as corrupt17 (Manzetti & Wilson 2009).
Corrupt governments are unlikely to promote (effective) anti-corruption legislation
and if the citizens are less likely to “throw out the rascals”, it could indicate that a
significant change in a country’s corruption situation is doubtful.
Finally, it deserves to be emphasized that studies in psychology have demonstrated
that individual attitudes can be good predictors of de facto behavior in moral dilemmas.
Icek Ajzen and Martin Fishbein (1977, 912), in their review of 109 investigations18 into
the association between attitudes and behavior, conclude that “[a] person’s attitude has
a consistently strong relation with his or her behavior when it is directed at the same
target and when it involves the same action”. Studies have also indicated that so-called
“rational-choice corruptors”19, i.e. individuals that are prepared to justify bribe giving
as a practical necessity, are more likely to experience corruption, possibly due to their
higher willingness to participate in acts that “expedite” transactions with public
officials (Bohn 2012).
17 However, this effect is found to be smaller than both the economic variables and government effectiveness, i.e.
factors that are argued to predict clientelism (Manzetti & Wilson 2009). 18 Ajzen and Fishbein (1977) found that the inconsistencies in statistical significance of earlier studies often were a
result of low or partial correspondence between attitudinal and behavioral entities (action and target), i.e. inadequate
measurements. 19 Rational-choice corruptors were respondents who answered “Yes” (15.9 %) to the survey question “Given the way
things are, sometimes paying a bribe is justified” in the Americas Barometer survey 2012 administered in 24
countries (Bohn 2012, 75).
16
However, with all of this said, it is important to bear in mind that attitude is only
one of several components that factor into how a person actually behaves. Many other
factors, such as the perceived probability that the official will accept the bribe and
withholds from reporting it, the discretion and capacity of the official to meet the
wishes of the bribe giver, the bribe giver’s willingness to take risks and the size of his20
social stakes, or the perceived social approval or disapproval of “cheating the system”,
tend to have a decisive role to play in situations where bribe giving is an option
(Klitgaard 1991; Lee & Guven 2013; Pop 2012; Corbacho et al. 2016). The same generally
goes for other forms of illicit behavior. Positive attitudes towards illicit acts are
therefore not necessarily always related to actual deviance, which begs for a closer
examination of these associations.
1.4 On the use of the words “institution” and “dysfunctional”
A short clarification regarding to what exactly this dissertation refers to, when it talks
about “institutions” on one hand and “dysfunctional” on the other, is in order before
moving on to the next chapter. This section starts by briefly examining the concept of
institutions.
The title of this dissertation includes the words “institutional trust” and various
forms of the word “institution” are used throughout this study, however, what does
the word actually mean and how is it used here? The word itself is quite an ambiguous
and much-debated concept21 with basically two fundamentally different senses. An
institution can either be defined as “simple rules or norms [that] constrain the actors,
who take the existence of institutions into account when they orientate their
behaviour”22, or as organizations with interests and behavior patterns of their own such
as banks (financial institutions) (Lane & Ersson 2000, 36-37).
In this dissertation, the term “institution” is used in the latter, wider, holistic
sociological sense where institutions are composed of not only rules and norms but
also activity, values, and beliefs. The study contemplated on using the words “actor”
or “organization”, but found them ultimately to be too narrow and opaque for its
purpose, which is to take into account what the public institutions actually do or how
they perform in the eyes of the general public.
In contrary to the political actors, the modern bureaucratic ones tend to be fairly
universal and governed by the same basic principles, which are discussed later, out of
the necessity to preserve social order. What matters here is therefore how well the
20 This study says “his” because many studies have shown that men are more likely to participate in corruption than
women. 21 See Lane and Ersson (2000) for a more thorough discussion of institutions. 22 The so-called rational choice approach to neo-institutionalism (Lane & Ersson 2000, 37).
17
institutional arrangements (the organizational part) of these institutions comply with or
conform to the institutional environment (the formal rules and norms), in the terms used
by Lance Davis and Douglass North (1970).
Another pairing of words included in the title of this dissertation is “dysfunctional
contexts”.23 But to what kind of contexts does it indicate exactly? According to the
Merriam-Webster (2019) online dictionary, the word “dysfunctional” refers to
something “characterized by or exhibiting dysfunction: such as a: not functioning
properly: marked by impaired or abnormal functioning […or] b: characterized by
abnormal or unhealthy interpersonal behavior or interaction”.
Focus here is on the dysfunctional consequences of certain kinds of societies and
institutions. In this dissertation, the term “dysfunctional” is used in a very broad way
to mainly characterize societies plagued by extensive corruption, inefficient
bureaucracies, low levels of socio-economic development, high levels of inequality,
and/or poor economic growth. Contextual factors that previous studies have argued to
be the source of much unhappiness and despair among the populations of these
societies: low social trust, crime, conflicts, oppressive governments, and general social
instability (e.g. Banfield 1958; Dobel 1978; Rothstein & Uslaner 2005; Uslaner 2008;
Paskov & Dewilde 2012; Rothstein 2013; Fukuyama 2014), as we will see later on in this
dissertation.
23 I would like to thank one of the reviewers, Gissur Erlingsson, for pointing out the value of adding this part to
the conceptual discussion.
18
2. Theoretical framework and hypotheses
This chapter commences by discussing the phenomenon of corruption tolerance from
various theoretical perspectives, including philosophical, economic, sociological, and
ethical views on socially deviant behavior that challenges civic morality and public
order. This discussion also includes the functional perspective introduced by the so-
called revisionist school of thought, spearheaded by Nathaniel H. Leff (1964) and
Samuel P. Huntington (1968), among others, who argue that corruption might have an
important role to play in processes of economic and political modernization in
developing countries.
Following this rather abstract theoretical discussion about the potential beneficial
effects of corruption, the study moves on to a more specific theoretical discussion
concerning how individual-level institutional trust and perceptions of public
corruption, country-level socio-economic development, inequality, institutional
quality and performance, as well as the cross-level interaction between these factors,
might influence individual attitudes regarding corruption. The hypotheses of this
study are introduced continuously throughout this discussion.
2.1 When and where is corrupt behavior the rational choice?
As previously mentioned, social surveys tend to show that there are those who seem
to have higher levels of tolerance towards behavior that is generally viewed to be
contrary to widely recognized principles of civic morality24, including bribe taking, and
that there are wider bases of acceptance in some societies compared to others.
What explains this observed variation? Are some individuals, groups, societies and
cultures “by nature, history or tradition” more “morally deviant” or myopic than others
or is it (in some cases) a rational reaction to certain institutional constraints or societal
conditions? In other words, is the variation in attitudes toward free riding (“anti-social
capital”) among citizens explained by “culture” and historical long-term experiences
of social organization (the raccomandazione thesis; Banfield 1958; Putnam 1993; Uslaner
2004), by the quality and performance of public institutions and the perceived honesty
and fairness of elites (the rotting fish thesis; Rothstein 2013; Rothstein & Stolle 2002;
Rothstein & Teorell 2008), or by some other explanations?
The economic concept of self-interest, or what critics often call greed, and the
tendency to free ride is widely considered the cognitive basis of corrupt behavior
(Rose-Ackerman & Palifka 2016). Nevertheless, what additional factors regulate the
24 According to Letki (2006, 306), civic morality “refers to the sense of civic responsibility for the public good, and
thus entails obedience to the rules, and honest and responsible behavior”.
19
propensity of human beings to behave self-interestedly in a societally harmful and
unproductive manner and how do these various variables interact? This chapter begins
its exploration of these questions by first delving deeper into the basic nature of human
beings, or what the great philosophers called “the state of nature”, and the
prerequisites of social order.
2.1.1 Philosophical, economic, sociological, and ethical perspectives on
human nature, civic duty, and the role of the state
On human nature
The history of political philosophy is characterized by two competing views on human
nature: the egoistic perspective (Epicureanism) versus the altruistic perspective
(Stoicism). Both perspectives agree on that human beings are inclined to watch over
their own interests, but they disagree on whether they are also inclined to care for
others (Lane & Ersson 2000, 40).
The Epicurean philosophers on one hand emphasize the importance of self-interests
and argue that human motivation is ultimately determined by the love of oneself. Rules
of proper conduct hence become vital in limiting egoism and channeling it along
specific paths of behavior in order to render social life possible. These rules may be
divinely inspired as in religion or they may be imposed by the domination of powerful
rulers with the ability to punish those who break the rules. Alternatively, they may
originate from mutual consent as a pact or a contract between the subjects and the
ruler(s) (Lane & Ersson 2000, 40-41). The Stoicist line of thought on the other hand
emphasizes that human beings have a natural tendency towards virtue. It is claimed
that human beings know by the use of reason that certain rules are valid and necessary
for the formation of humanity, a union of mutual respect where members naturally
take care of one another, i.e. behave altruistically. Some means of controlling egoism
are still required, however, because reason does not always triumph over other
instincts. Hence, the mission of Stoicism is first to clarify how much humans have in
common and second to devise enforcement mechanisms (Lane & Ersson 2000, 41). But
how would these enforcement mechanisms actually work or how could rules of proper
conduct be made more self-enforceable, without the need of constant policing by rulers
or religious authorities?
The 18th century Scottish philosopher David Hume (1711 – 1776) argues that man
has a natural interest in social order and justice but is inclined towards myopia, i.e.
shortsightedness, which tends to tip the scale in favor of egoism and the hunt for
20
personal25, immediate advantages, often of a material kind (Lane & Ersson 2000, 43-45).
If matters of self-interest (governed by particularistic norms) clash with broader societal
interests (governed by universalistic norms) and if the potential consequences of a
breach against the latter are believed to lie very remote in a distant future, people tend
to prioritize the former when forced to choose.26
The science of economics has traditionally viewed humans as homo economicus, or
economic man, a consistently rational, calculating, and self-interested atomistic
creature who always tends to act according to what is best for his or her own
particularistic interests, following a basic cost-benefit calculation that contains all the
relevant situational facts (Rational choice theory [RCT]; see e.g. Becker 1976).27 One
consequence that follows from this particular view of basic human nature is argued to
be the so-called free rider problem. Corrupt actors are argued to bear a close resemblance
to so-called free riders from a collective action scenario (Schweitzer 2004, 27). A free
rider is a person who refrains from contributing to a common good due to a cost-benefit
calculation in which he concludes that his individual costs outweigh the actual benefits
of participating; he reckons on that he will be enjoying the fruits of the labor irrespective
of his own contribution thanks to the contribution of most other people. In the case of
societal corruption, the common good in question is social order: By refraining from
behaving corruptly and displaying disloyalty towards the common good, people
contribute to the preservation of social order (Dobel 1978). However, if a person
calculates that his particularistic gains from corrupt behavior outweigh the possible
benefits of abstaining from it, and especially if the risk of detection and potential
sanctions are miniscule, he is more likely to behave corruptly due to his faith in the
continuation of the social status quo.
This is where the issue of myopia, or shortsightedness, enters the picture. The
corrupt actor fails to take into account how his own actions, or rather perceptions of his
actions, may influence the cost-benefit calculations of others, i.e. the cumulative
(contagion) effects of his behavior, which may result in a complete breakdown of social
order, especially in the long run. Furthermore, a corruptly behaving actor shows no
regard for the disadvantages (resulting from the deal or act) to those who do not take
part in the corrupt act (in economic terms, negative externalities), which may result in
the emergence of distrust and an erosion (or non-emergence) of “socially positive social
capital”28 or important institutions (Graeff 2004, 52).
25 “Personal” or “self-interest” in this case tends to include family and/or close friends, but may even be extended
to larger in-groups such as political parties or cliques. 26 A person may for instance believe that he or she will be punished in the afterlife by divine retribution. 27 For critique of the purely individualistic, “fully rational” view of human nature and the idea that human beings
were primordially individualistic (“the Hobbesean fallacy”) see, for instance, Thaler and Sunstein (2008) and
Fukuyama (2011, 48). 28 Contrast this “type” of social capital to negative social capital which is beneficial for the one who possesses it (i.e.
the corrupt actor), due to its corrupt exchange enabling function, but detrimental for the rest of society (Graeff 2004).
21
What then is the key factor that facilitates social order if pure self-interest tends to
prevail over altruism, or rather feelings of civic duty29, because of myopia? Hume gives
one simple answer: the State. Legislation sets the boundaries for human behavior and
enforcement mechanisms (the police, the judiciary) oversee compliance, resulting in
that “[…] men acquire a security against each other’s weakness and passion, as well as
against their own, and, under the shelter of their governors, begin to taste at ease the
sweets of society and mutual assistance” (Hume 2003 [1738], 383).
Alas, the mere existence of the State is not enough. There must be clear and
institutionalized ethical principles that help to guide the behavior of and the
relationships between and among both ordinary citizens and public officials. From
where then do these ethical principles originate and how are they related to corruption?
Modern ethics versus tribal ethics
Concerning ethics and people’s reactions to corruption, one can claim that they are the
consequence of a conflict between two different kinds of ethics that have evolved since
the dawn of humankind (López López et al. 2017, 263). Before the development of large
modern social structures such as cities, states and empires, humans were (and still are
in certain cases30) organized into extended families or tribes that offered shelter from
starvation, natural catastrophes, predators, and other humans and tribes, and
worshipped common ancestors (Fukuyama 2011). Every action or inaction that
furthered the interests of the tribe (the in-group) and facilitated its survival and
prosperity was considered good or “ethical” behavior, including theft from other tribes
or the killing of members from competing tribes. Commandments such as “Thou shalt
not steal” or “Thou shalt not kill” only applied within the tribe among tribe members,
and did not pertain to out-groups or non-members (López López et al. 2017, 263).
The tribal stage of human history lasted for thousands of years (and, as noted, still
continuous in some parts of the world) and strongly influenced individual thinking or
human instincts31, but in the contemporary world most individuals live in considerably
larger societies where codes of ethics have also evolved as a result of diversification
(López López et al. 2017, 263). The family (extended or otherwise) still exists as an
institution, but stealing from others to provide for your own family and kin or other
in-groups (party, religious or ethnic group, etc.) is no longer considered ethical
behavior according to the modern ethics that mostly have superseded so-called tribal
29 Altruism, i.e. concern for the welfare of others, could imply simply one or two other persons, but it is used here
in the wider “civic duty” sense where individuals are motivated by a concern for the wider community or the state
(Orviska & Hudson 2003, 86). 30 There are still some places in the world today, such as Papua New Guinea, where humans are still organized in
tribal ways (Fukuyama 2011). 31 As noted by Fukuyama on the issue of human nature (2011, 66) “[a]ll human beings gravitate toward the favoring
of kin and friends with whom they have exchanged favors unless strongly incentivized to do otherwise”. Not
favoring our own kin and friends does not come naturally for human beings.
22
ethics as the dominant system of ethics. The instinct or desire to favor kin and comrades
in all situations is far from dead, however its strength relative to modern ethics and
ideals may vary across different places and contexts depending on such factors as the
strength of the state, as we will see later. Where state institutions are weak, clans, tribes,
mafia families, or other similar informal institutions tend to take their place and
perform the duties formally assigned to them, such as keeping order and adjudication.
Sometimes a conflict may still arise between modern ethics on one hand and tribal
ethics on the other, which may cause a power holder to, for instance, favor an in-group
member or accept a bribe in order to support their family. Moreover, conflicts may also
arise among different types of modern ethics, such as duty-based ethics and
consequentialist ethics. We will examine this closer using the act of bribery as an
example.
Bribery, i.e. the “use of a reward to pervert the judgement of a person in a position
of trust” (Nye 1967, 284), is the most common form of what is widely perceived as
corrupt behavior from the perspective of modern ethics. From a Kantian duty- or rule-
based ethics perspective, corrupt behavior of this sort on the behalf of a wielder of
(delegated) power is always wrong. It is a breach of duty where the agent (the receiver
of the bribe) betrays the trust of the principal (who has delegated the power) and acts
against the best interest(s) of said principal in return for a (often monetary) reward or
a promise of a reward in the near future (Kant et al. 2002).32 This can be seen as a
fundamentally moralistic view that unequivocally condemns corruption without any
regard to its possible beneficial consequences33 (see the critique by the so-called
revisionists). According to this view, it is not the consequences of a person’s actions that
determine if they are right or wrong, but the way they comply with the rules designed to
guide the behavior of the office-holder, i.e. the duty. There are, however, hypothetical
situations where the use of a bribe could be considered justifiable from a more modern
ethical perspective. The classic example often used in the corruption literature is the
“political prisoner-evil regime”-scenario where a prison guard accepts a bribe in return
for releasing a political prisoner held by a corrupt or “evil” regime.34
If, on the other hand, an individual would apply a set of ethical principles building
on consequentialism or utilitarian analysis he or she could argue that a corrupt act is
ethical if the total sum of winners exceeds the total sum of losers. In other words, if the
benefits are greater than the losses in that particular situation, at least in a myopic
perspective. There are at least a couple plausible alternative scenarios where this sort
32 One could argue that the actual results of the bribe may be in the best interest of the principal but this study finds
it unlikely. In that case, a bribe would hardly be necessary at all. 33 With “beneficial consequences”, this study mainly refers to more wide-reaching consequences that may even
benefit society as a whole, not just specific individuals. 34 This is sometimes called “noble cause corruption”. Authors often give the example of using bribery to save Jews
from concentration camps in Nazi Germany (Rose-Ackerman & Palifka 2016, 10).
23
of ethical thinking could result in the conclusion that the use of bribes, or indeed some
other type of corrupt tactic, is morally justifiable.35
One could imagine, for instance, an entrepreneurial individual who intends to set
up a firm but he or she requires a business license or a permit for this purpose. It could
potentially be very costly and time-consuming for the prospective entrepreneur if there
are many bureaucratic hurdles to pass and if the quality of the public service is
substandard with long transactional delays. The result could even be that the
individual abandons the idea altogether. A potential solution to this problem could be
a relatively small additional payment to the service provider that “cuts” the red tape,
i.e. bypasses the bureaucratic hurdles and provides a short cut to the business
license/permit. The “grease money” could result in a new business venture and
potentially many new job opportunities and new sources of tax revenue, thereby
ending in a plus-sum situation in the mind of the owner of the newly established
business if he considers the red tape to be excessive and over-encumbering. The bribe
would thereby be the lesser of two evils if the other alternative were exit from the
venture. In cases where the public servant demands a bribe for the service, paying may
be the only alternative if the individual truly wishes the permit application to be
successful (see e.g. De Soto 1989).
The rationalization in the scenario described above is an example of the classic cost-
benefit analysis from economic theory used to appraise the desirability of a certain
option, in this case bribe paying. In the next section, a useful typology of two distinct
general forms of low-level corruption is presented, where individuals or firms pay
bribes to either [a] obtain benefits to which they are not entitled to normally,
alternatively to skip a certain cost such as a fee or a tax, or [b] to obtain benefits to
which they are entitled to without additional payments.36
35 This argument also holds for other types of free riding, such as cheating on taxes. If a person for instance believes
that he or she can make “better”, i.e. more efficient, use of the money that otherwise would be paid as taxes, they
are more likely to try to cheat. 36 Shleifer and Vishny (1993) divided corruption into two separate types based on the occurrence of direct losses in
state resources: “Corruption with theft” (tax evasion and fee avoidance) and “corruption without theft” (bribe
extortion above and beyond official fees).
24
2.1.2 Typologies of corruption scenarios
Before moving on to discussing ideas concerning the so-called “functionalistic” role of
corruption, a few additional typologies (see Chapter 1, section 1.2) are presented that
are useful to keep in mind when analyzing why attitudes toward corruption may vary
across different scenarios.
Corruption does not vary only in form (e.g. bribery vs. nepotism) but also in type
with regard to the individual relationships and motivational aspects of the actors
involved in corrupt transactions (Bauhr 2017). Similarly, corruption does not vary
across countries only in quantity but also in substance, meaning macro differences in the
kinds of corruption that societies experience that result from variations in the extent of
political and economic liberalization and in the strength of different kinds of
institutions and influences the consequences of corruption (Johnston 2005).37 The
section begins by examining the variations in the types of corruption scenarios on the
individual-level before moving on to the societal-level.
Corruption is a highly complex phenomenon that can be divided into a multitude
of different types or forms, each with their own potential causes and consequences.
Some scholars have argued that corruption can generally be divided into two separate
ideal types based on either the relationship between the briber (the person who pays
the bribe) and the bribee (the person who accepts or demands the bribe) or,
alternatively, the supply side motivations for engaging in corruption: [a] Extortive or
need corruption and [b] collusive or greed corruption (Klitgaard 1991; Bauhr 2017).38
The scenario described in the previous section can be classified as a case of collusive
or greed corruption. A person in need of a certain public good or service (the license or
permit) is provided with a short cut that allows him or her to skip some costly paper
work in return for a relatively small remuneration to the service provider. The public
official who provides the public good is hence considered to be helping the client reach
his or her goal by providing a special advantage, which a corruption-free society would
not allow, even though the official’s own actions are more likely motivated by self-
interest rather than altruism. Extortive or need corruption, on the other hand, can be
described as a situation where a person or firm in need of a certain public good or
service is blackmailed into paying a bribe or perform some kind of service to the public
official in return for something that he or she would have received free of charge or for
a considerably smaller fee, alternatively considerably quicker, in a corruption-free
37 I want to thank one of the reviewers of this dissertation, Staffan Andersson, for pointing out the value of adding
this part to the discussion in this section. 38 Some cultures have their own words for these different types of petty corruption. Bardhan (1997, 1323, cited in
Rose-Ackerman & Palifka 2016, 51), for instance, points out that in Russian there is a difference “between
mzdoimstvo, taking a remuneration to do what you are supposed to do anyway, and likhoimstvo, taking a
remuneration for what you are not supposed to do”.
25
society. The official in this scenario is erecting barriers instead of pulling them down,
thereby hindering the attainment of the client’s goals.
Of course, the collusive corruption scenario is highly dependent on that the public
official has a relatively large amount of discretion and influence that can open up the
proposed short cut through the bureaucratic paperwork. This is commonly not the case
in modern rational bureaucracies, at least not in the lower ranks where monitoring is
relatively strict, and several officials are involved in the same cases. The extortive
corruption scenario is therefore likely to be the most frequently occurring scenario and
this can have especially severe implications for the poor who may lack the resources to
be able to pay for the basic services that they need. Uslaner (2011, 148) thusly states
that “[c]orruption acts as a tax on the poor […; t]hose in fortunate financial
circumstances (the “well-off”) can afford bribes, but the poor often do without basic
services”.
It can however be very difficult for the individual or the firm to identify which type
of bureaucratic corruption characterizes a particular transfer. Scholars such as Gunnar
Myrdal (1968) and Oskar Kurer (1993) argue that corrupt public officials have
incentives to create distortions in the economy in the form of new red tape that causes
additional delays to the transactions, thereby creating new opportunities for speed
money collection. The barriers that the official “helps” to pull down may originally
have been raised by the official himself or his accomplices, which means that what may
seem like collusive or “helping hand” corruption in the eyes of the bribe giver is
actually a case of extortive or “hindering hand” corruption. It is also highly likely that
the public official does his utmost to make it seem like he is helping the potential rent
source in order to increase his chances of securing a bribe. A friendly-minded target is
(quite naturally) more willing to relinquish the cash and keep quiet about it than a
hostile minded one who feels threatened by the bribe-extorting official.
The nature of and the basic motivations behind these two previously described
corrupt exchange scenarios are, as we can see, completely different, and it is therefore
also reasonable to expect the consequences to differ, both concerning the corrupt act
itself and eventual engagement in anti-corruption efforts (Bauhr 2017). A citizen
engages in corruption either to get fair treatment (need corruption) or to get a special
illicit advantage (greed corruption). Both those who engage in need corruption and
those who engage in greed corruption would benefit from a corruption-free society,
due to the earlier discussed negative impacts of corruption on, for instance, the national
economy (Mauro 1998), however, as pointed out by Monika Bauhr (2017, 564), “the
advantages of a corruption-free society are far from equally distributed between
citizens”. Citizens engaged in need corruption are likely to be the primary beneficiaries
of a corruption-free society, while the advantages for those engaged in greed
corruption are likely to be quite blurry and to occur with a relatively large time-lag.
Furthermore, there is likely to be very tangible drawbacks for the “greed corrupt” who
26
cannot access the same set of privileges in a non-corrupt society (Bauhr 2017), which
means that their elite resources become considerably less useful in achieving specific
goals such as securing a top education for their children.
Bauhr (2017) argues that it is this distinction in basic motivation that influences a
person’s inclination to oppose and willingness to fight corruption, where “greed
corruptors” have a much greater tendency to tolerate corruption and to free ride on
other people’s efforts to reduce corruption. The next section discusses the so-called
functionalistic view of corruption that argues that it can under certain conditions
“grease the wheels of economy”, thereby bringing prosperity and other positive
societal consequences. Under what conditions can corruption be perceived as positive
for society as a whole and not just for certain individuals? However, before moving on
to the next section, as promised, this section will take a moment to consider variations
in the kinds of (systemic) corruption that societies experience or syndromes of
corruption, using Johnston’s (2005) terminology (see Chapter 1, section 1.2).
Johnston (2005; 2014) posits a typology where he divides macro (and meso39) level
corruption scenarios into four different syndromes of corruption: [1] Influence
Markets, [2] Elite Cartels, [3] Oligarchs and Clans, and [4] Official Moguls. According
to Johnston (2014, 32), these syndromes “reflect underlying trends in, and balances or
imbalances between, participation and institutions: how people pursue, use, and
exchange wealth and power, and the social, political, economic, and state institutions
within (or outside of) which they do so”.40
Hence, the Influence Markets syndrome reflects consolidated democracies with
highly competitive markets and strong institutions, where wealthy private interests
seek to use their wealth to influence public decision-making processes by, for instance,
acquiring exclusive access to decision makers and/or financing their election
campaigns.41 Elite Cartels meanwhile reflects consolidating democracies in the middle
of a liberalization process, with only moderately strong institutions, where elites
collude in networks to share corrupt benefits and stave off rising political and economic
competition.42 Oligarchs and Clans reflect transitional societies where a small number
39 Johnston (2014, 31) is careful to point out that the syndromes do not reflect “system types”, that there is
considerable variation within the four groups, that a society can move between these different categories over time,
and that we can find several different syndromes at work in various areas, regions, sectors, and levels of a society. 40 Contrast this taxonomy to Rose-Ackerman and Palifka’s (2016, 277) similar, but less comprehensive and more
bribe-focused one, which posits four types of highly corrupt states based on the location of the bribe recipients within
government (Many, at bottom vs. Few, at top) and the number of bribers (Few vs. Many). Hence, the following ideal
types are posited: [1] Bilateral monopoly, [2] Mafia-dominated state, [3] Competitive bribery, and [4] Kleptocracy.
The bargaining (monopoly) power of government officials versus corrupt private actors is argued to determine the
overall impact of corruption on society and the distribution of gains between bribers and bribes. 41 The United States, Japan, Germany, Australia, France, the UK, and Uruguay are given as examples of Influence
Markets (Johnston 2014, 34). 42 Italy, South Korea, Botswana, Argentina, Belgium, Brazil, Israel, Poland, Portugal, South Africa, and Zambia are
given as examples of Elite Cartels (Johnston 2014, 34).
27
of highly influential and wealthy individuals, backed by personal followings, compete
with one another (often violently), while striving to take advantage of weak institutions
in order to further increase their power and wealth.43 Finally, the Official Moguls
syndrome reflects undemocratic regimes where powerful individuals or small groups
who wield both state and personal power (often called “kleptocrats”) use this
unchecked power to enrich themselves with impunity in a context of recent economic
liberalization and weak institutions44 (Johnston 2014, 30-34).
The point of the previous discussion was to once again highlight the very important
observation that corruption does not vary merely in quantity but also in quality or
substance, in addition to spatial variations subnationally and across government levels
and sectors (Heywood 2018). This is one thing that the standard cross-country
corruption indices, such as the Corruption Perception Index or the Control of
Corruption indicator, have been heavily criticized45 for failing to take into account
when they measure corruption on a unidimensional scale with single-country scores,
often with a focus on the occurrence of bribery (Andersson 2017). A Swedish case study
by Jonas Linde and Gissur Erlingsson (2013), for instance, found that country indices
have difficulties in capturing the nature and extent of corruption in countries
characterized by strong local self-government, where corrupt activities are largely
expected to occur on the local level. The study also showed that a relatively large share
of Swedes believed their politicians and public officials to be corrupt, and that the
extent of corruption has increased during the last decades, even though Sweden
continues to be ranked among the six least corrupt countries in the world by TI. This
in turn could have serious consequences for general system support in Sweden (Linde
& Erlingsson 2013, 598-599).
This focus on bribery of public officials, which tends to be common in the latter two
syndromes where institutions tend to be weak and disorderly, creates a blind spot for
the types of corruption that occur in the previous two syndromes where state
institutions are at least moderately strong and capable and public sector corruption is
often more about sophisticated ways of gaining access and influence within public
institutions or elite networks (e.g. conflict of interest) (Andersson 2017). The reason for
this focus on bribery is of course that every-day payoffs to poorly paid police officers
or doctors (or “petty corruption”) is considerably easier to observe than cases of
political corruption in elite networks. This is all very understandable from a practical
viewpoint with regard to data collection. When you think of corruption, you often tend
to think of bribery. However, from a theoretical and empirical viewpoint it leads to a
43 Russia, the Philippines, Mexico, Bangladesh, Bulgaria, Colombia, India, Malaysia, Niger, and Senegal are given
as examples of Oligarchs and Clans (Johnston 2014, 34). 44 China, Kenya, Indonesia, Algeria, Chad, Haiti, Iran, Kuwait, Nigeria, Rwanda, Syria, and Uganda are given as
examples of Official Moguls (Johnston 2014, 34). 45 For more critique of the macro corruption indices, see for instance Galtung (2006).
28
distorted picture of corruption as a global phenomenon. As argued by Staffan
Andersson (2017, 70), if corruption measures ignore other forms of corruption “[t]his
can lead to misinterpretation of the prevalence and nature of corruption in the given
setting, and to a focus on corruption types/problems that are not the most pressing”.
2.1.3 A functionalistic perspective: Can corruption “grease the wheels”?
Huntington (1968) and several other early theorists from the so-called revisionist46
school suggested a functionalistic view to help explain the prevalence of corruption in
transition and developing countries. This group of scholars hypothesized that it may
make the economies of developing nations run smoother by enabling businesses and
individuals to escape the smothering effects of inefficient laws and government
regulations that distort the functioning of these economies. This in turn would allow
them to cut back on both monetary and temporal costs, enabling more innovation,
trade, business creation and economic growth (Leff 1964; Leys 1965; Bayley 1966;
Huntington 1968). In the corruption literature, this reasoning is often called the “grease
the wheels”-hypothesis, while the opposite view, i.e. that corruption exacerbates poor
economic development even further, is called the “sand the wheels”-hypothesis.
Over the next few pages, the arguments on which the “grease the wheels”-
hypothesis is based will be examined more closely, in order to give a clearer and more
exhaustive understanding of why corruption may be the more rational behavioral
mode for some individuals or firms when dealing with inefficient and unreliable public
service delivery. The study will also present a quick overview of the state-of-the-art
concerning the empirical support for this hypothesis vis-à-vis the alternative one.
However, it is important to bear in mind that the primary interest of this dissertation
lies in why some individuals may believe that corruption is a justifiable or even
preferable alternative, not in the actual, beneficial, or detrimental, consequences of
corruption. There is also quite a high chance that the act of, for instance, paying a bribe
really is beneficial for both the giver and the recipient, at least in the short run, but in
the long run and on a societal level it is likely to do more harm than good when it is
aggregated (Rose-Ackerman & Palifka 2016, 83-91). The same goes with the act of
cheating on taxes: The person who evades taxes may have a better idea how to use the
money than the state, but if many people do it, it can have serious consequences for the
state’s ability to provide quality services.
Many corruption theorists tend to assume that the central government is constantly
and actively pursuing economic development on a countrywide scale, and that a 46 The terms “revisionists” or “functionalists” where coined by their adversaries in order to differentiate them from
the traditional “moralistic approach”, which they feared may bias the research into the economic consequences of
corruption and result in cultural relativism concerning the western definition of graft (Méon & Weill 2010).
29
corrupt and inefficient bureaucracy hinders or limits the execution of policies aiming
at heightened productivity and economic growth, thereby “sanding the wheels” of the
economy. However, this may not always be the case according to some scholars. Leff
(1964, 389) argues that corruption may be used by groups that “are more likely to
promote growth than is the government”, which he also argues is often the case in
developing country contexts, thereby pushing forward development in these countries
through this “enhanced participation in policy formulation”. 47 In the words of
Huntington (1968, 386), “[in] terms of economic growth, the only thing worse than a
society with a rigid, overcentralized, dishonest bureaucracy is one with a rigid,
overcentralized, honest bureaucracy”. It could therefore be expected that a low
confidence in the abilities of the public servants or the government to deliver quality
public goods or services, or economic development in general, could result in a greater
tendency to accept corruption as a personal security mechanism in order to cope with
insecurity and uncertainty.
Other theoretical arguments concerning the potential beneficial effects of corruption
include the claims that corruption enhances bureaucratic predictability and that it
allows poorly remunerated civil servants to supplement insufficient wages48 with bribe
money, thereby strengthening their work ethics. Leff (1964, 395-396) asserts that
corruption can reduce uncertainty and increase investment “[b]y enabling
entrepreneurs to control and render predictable [the governmental] influence on their
environment”. Individuals or firms can use bribes to escape taxation if government
spending is inefficient, thereby freeing up resources for investments. Colin Leys (1965)
and David Bayley (1966) further claim that informal payments under the table may act
as incentives for attracting capable and motivated civil servants who otherwise may
have opted for a better paid job in some other sector. The authors also argue that the
existence of widespread corruption can provide means of accessing the state apparatus
to minorities who otherwise would lack any means of influencing policies that affect
themselves. They may for instance be discriminated due to personal prejudices
amongst the bureaucrats themselves or because of formal discriminatory decisions
made by the political elites. Bribes may potentially offer a way around these
discriminatory practices.
47Leff (1964, 389) describes corruption as “an extralegal institution used by individuals or groups to gain influence
over the actions of the bureaucracy”. 48 Government employees were paid very little, if anything, in early- and premodern societies, especially on the local
(village) level, and were often allowed to pay themselves whatever the felt that they deserved out of the taxes that
they collected (Smith 1971, 427). In tsarist Russia, for instance, there was for a long time a system in place called
kormlenie (feeding), where the subjects were supposed to “feed” the representatives of the ruler (i.e. the officials)
with both edibles and material supplies (Suhara 2003, 389). This praxis partially continued in many colonies where
the colonial masters turned a blind eye on the corrupt behavior of tax collectors, in order to save on wage costs.
30
2.1.4 The raccomandazione thesis: Amoral familism and the historical
origins of civic virtue
While the “rotting fish” thesis (which is elaborated upon in section 2.3.3 of this chapter)
argues that corruption trickles down from the top from selfish, myopic, and
unaccountable leaders to the broader bases of society, the raccomandazione thesis in turn
emphasizes that corruption is an integral part of a larger culture with long historical
roots (Uslaner 2004, 79). The term raccomandazione refers more specifically to the Italian
practice of seeking personal favors from influential people in high places.
The proponents of the the raccomandazione thesis often refer to the concept of amoral
familism49, a term coined by Edward C. Banfield in his renowned study from 1958 of a
“backward” village in the southern parts of Italy.50 This term refers to “the inability [of
a community] to act together for their common good or, indeed, for any end
transcending the immediate, material interest of the nuclear family”51 (Banfield 1958,
10). In order words, loyalty to the in-group is prioritized at the cost of the wider
community when the interests of these two groups do not meet or if they clash with
one another. This in turn hinders cooperation and results in an absence of organized
action for the solving of local problems such as shortcomings in educational
opportunity, flawed infrastructure, or the lack of a stable and effective party
organization (Banfield 1958, 30-31). Additionally, it gives rise to nepotism and
patronage due to the strong feelings of moral duty and social pressure to act in ways
that favor those closest to you.
Building on Banfield’s pioneering study, Robert Putnam set out to elaborate further
on the roots of civic-mindedness and the consequences of amoral familism in his
seminal work “Making Democracy Work: Civic Traditions in Modern Italy” (1993).
This highly influential study, which aimed to explain differences in the performance of
political institutions in twenty Italian regions, came to the conclusion that differences
in civic engagement, which could be traced far back in time52, are the main explaining
factors of why the institutions of the northern regions have performed so much better
than their counterparts in the south.53 Putnam argues that this long history of civic
engagement has generated communities rich with social capital and citizens with a
49 Alternatively, amoral individualism, in case if an individual lacks close kin. Banfield also notes that the term is
somewhat misguiding: The individual does not lack a moral, it is simply restricted to only include one’s family.
Other counterparts to Banfield’s family-specific concept include amoral clanism, amoral groupism, and amoral
classism (Huntington 1965, 411). 50 Banfield (1958) used the fictitious name “Montegrano” to protect the original name of the town. 51 The author claims that a combination of three factors produces this phenomenon: [1] High mortality rates, [2]
certain land tenure conditions, and [3] a lack of the extended family-institution (Banfield 1958, 10). 52 Putnam (1993, 162) traced the regional differences back even as far as to the 11th century. 53 Putnam tells a little story about a meeting with a reform-minded Italian politician from the south to whom he told
about his findings. After hearing about the findings, the politician complained: "What you seem to be telling me is
that nothing I can do will improve my region. Our fate was sealed hundreds of years ago." (Putnam 1993, 188).
31
greater interest in the common good and cooperation, who possess higher levels of
generalized trust, social tolerance and political interest, are more active politically, and
are generally endowed with norms of citizenship (Zmerli 2010, 665). In other words,
resources that the people of Banfield’s “backward” village generally lacked.
One way to understand this cultural, “alternative” explanation of differences in
attitudes toward corruption is by relating it to the earlier discussion regarding the
relationship or conflict between what was called “tribal ethics” on one hand and
“modern ethics” on the other. Tribal ethics dominate over modern ethics in these
“backward” societies, but the real question is why. Why have modern ethics failed to
become the dominant system of ethics in some societies where the interests of the
family, tribe or clan prevail over the interests of the larger society? Why is there a
greater lack of solidarity between different social groups, which creates incentives for
corruption, in some societies compared to others?
One plausible answer to these questions, which was already briefly mentioned in
previous sections, has to do with the strength of the state or what in the development
community often is called “state capacity”. State capacity, which can be defined as a
state’s “ability to implement official goals, especially over the actual or potential
opposition of powerful social groups” (Skocpol 1985, 9), can be estimated in several
different ways. One way is to measure it indirectly, by examining subjective
evaluations of the level of trust in public institutions. In the next section, the study
discusses how bureaucratic distrust or a lack of confidence in the impartial
implementing institutions could be related to corruption tolerance, which is part of the
aforementioned “rotting fish” thesis. Later, it will also discuss other alternative
indicators of state capacity and institutional quality.
32
2.2 Bureaucratic (dis)trust and corruption tolerance
2.2.1 What is institutional trust?
The level of trust in governmental organizations and agents has received a great
amount of both academic and non-academic attention during the last few decades,
largely as a result of the so-called “crisis of confidence” observed by some scholars in
contemporary democracies (Marien 2011; Catterberg & Moreno 2006). Numerous
studies have investigated both the causes and consequences of trust or confidence54 in
various governmental institutions, in addition to the many contributions to the
theoretical debates regarding how to conceptualize and measure this highly debated
and complex phenomenon.
Nevertheless, what exactly does trust in public authorities entail and in what ways
does it differ from other types of trust? In order to be able to answer these questions
we first need to briefly elaborate on the more general concept of trust and its different
varieties.
Trust is arguably the most valuable resource available to free market-based
economies and a vital ingredient for well-functioning societies and institutions. It
enables cooperation between trustor and trustee even though there remains
uncertainty and risk regarding the future behavior of the different actors involved and
the consequences of their actions (or inactions!). It enables us, for instance, to board a
passenger plane and put or lives in the hands of the pilot and the rest of the crew, to
trust the storage of our money to banks rather than in our mattresses, to lend our
possessions to friends or neighbors, or to try out new and innovative solutions to our
problems (Offe 1999). In short, “[t]rust helps us solve collective action problems by
reducing transaction costs” (Uslaner 2005, 4).
Early research in human psychology concluded that there are two dimensions to
trust: Competence and care (or trustworthiness) (Hovland et al. 1953). Trust in the
competence of a trustee refers to beliefs or judgements regarding the ability of the
trusted individual or organization to reach stated goals or act in a consistent manner
(Houston & Harding 2013, 55). Proof of competence, in the form of information on
previous performances and evaluations of the quality of the provided services, is
thereby usually required by the trustor. Care or trustworthiness, in contrast, refers to
54 Some authors use the words trust and confidence interchangeably, while others argue that they are separate
constructs. Sonja Zmerli, Ken Newton, and José R. Montero (2007), for instance, argue that “trust” should be used
exclusively in interpersonal situations, while “confidence” is appropriate when examining attitudes towards
institutions. Claus Offe (1999, 44) similarly argues that trust can in some ways be seen as the “opposite” of
confidence. Misplaced trust is always perceived as the trustor’s own fault, while misplaced confidence is attributed
to other, exterior factors, such as bad luck, chance, or Providence. The situation is furthermore aggravated by the
fact that some languages only have a single word that covers both concepts. For an excellent discussion on the
matter, see Cole and Cohn (2016).
33
beliefs about the manner in how the trustee would consciously manage the given trust.
Would the trustee take the interests of the trustor into account or is he or she purely
driven by raw self-interest? In other words, does the trustee have the trustor’s interests
at heart?
Scholars commonly call trust in public authorities or abstract systems institutional
trust in order to conceptually distinguish it from the two other often-discussed varieties
of trust, interpersonal/particularized trust and generalized trust (Rose-Ackerman & Palifka
2016, 248-249). The concept of institutional trust builds on the notion that citizens
expect public organizations and government representatives to behave in a neutral,
competent, and impartial manner while implementing public policies (Rose-Ackerman
& Palifka 2016, 253). There should be no suspicions whatsoever that personal affections
or considerations influence the decision making or actions of a public-sector official.
All business with public administrations should be based on clear, public rules, and
not on personal feelings or calculations of profit maximization.
Many authors use the umbrella term “political trust” in their studies, and while there
is quite a strong consensus about the importance of this concept, considerable amounts
of disagreement exist concerning the “true” meaning of this concept and its causes and
consequences (Zmerli & Hooghe 2011, 2-3). Consequently, the theoretical status of this
concept remains according to Sonja Zmerli and Marc Hooghe “highly dubious”.
Russell Hardin (1999) argues that the words “trust” and “I trust you” in their
ordinary meaning implies that a person possesses relevant, specific and sufficient
knowledge regarding the motivations, actual behavior, and other important factors of
the individual, group or organization whose trustworthiness is under evaluation. This
is what we base our trust in our neighbors and colleagues on. We can form personal,
dyadic, reciprocal, and iterative relations with other people, which are likely to
produce a relatively clear picture of their competence and trustworthiness. However,
most or at the very least many citizens lack firsthand experience when it comes to the
government or public officials in general, and cannot therefore sincerely claim to be in
possession of knowledge of the kind that is required for trust formation in the
traditional sense of the word. Scale issues alone make it virtually impossible to learn to
trust a sufficient number of individuals within an organization. It is therefore illogical
for citizens to trust institutions, and political trust thereby becomes meaningless,
following this line of logic (Hardin 1999, 23-24; Zmerli & Hooghe 2011, 3). Hence, there
is a wide scholarly agreement on a rather clear conceptual difference between trust in
individuals on one hand and trust in institutions or organizations (abstract systems) on
the other.
What do scholars then usually mean when they talk about trust in institutions or
political trust? Hardin’s (1999, 38-39) answer to the question “what is trust in
government?” is that it is not realistically possible or even rational to have trust in
public organizations, but what we can have are strong expectations based on the
34
perceived predictability of the organization and its reputation. A person can have a
certain degree of confidence, based on general knowledge about the history of the
organization, in the abilities of the organization or the civil servant to function in an
expected way. As argued by Hardin (1999, 39), “[i]t is not a relationship of trust or
distrust […,a]t best, much of the time it is a relationship of inductive expectations”. In
other words, the basis of institutional trust can be said to lie in normative expectations of
how a public actor ought to behave. This notion of institutional trust can be traced back to
the 1960s and David Easton (1965), who argues that citizen attitudes toward the
political system generate what he calls diffuse support, which can be contrasted against
specific support, i.e. support for a certain regime or a political decision. Diffuse support
implies that a citizen sees a certain institution and/or its decisions as legitimate and is
ready to comply with them even though he himself may not agree with them.
What becomes clear from this discussion is that political trust is seen by scholars as
a completely different beast altogether in comparison to interpersonal trust. At best it
is considered to be very thin and mostly resembles “a general recognition of authority
and a benign attitude towards political institutions” (Zmerli & Hooghe 2011, 3).
Finally, it must be emphasized that, ultimately, this study examines two dimensions
of institutional quality: one subjective (institutional trust), and one more objective.
Letki (2006, 309) argues that the accuracy of the subjective assessments of institutional
trustworthiness is “irrelevant”, because what really matters is whether citizens believe
that they can afford to trust the institutions as “a reflection of institutional legitimacy”.
This dimension will therefore be complemented and contrasted with indicators of the
more “objective” dimension, which are discussed later. How well do individual
perceptions of institutional quality mirror more objective indicators and do they all
impact civic morality in the same way in different contexts? In the next section,
however, the study discusses the reasoning behind why it has taken the route of
focusing specifically on one specific part of the public sector, namely the public
administration.
35
2.2.2 Why focus on (lack of) trust in the public administration?
Many of the previous investigations into the causes and consequences of institutional
trust have either bundled together both trust in political or representational institutions
(political parties, the Government, the Parliament) and trust in “non-political” or
bureaucratic institutions (the civil service, the police, the courts) charged with the
implementation of public policy, or have solely focused on the former kind of trust (e.g.
Marien & Hooghe 2011; Sööt & Rootalu 2012; Tavits 2010). However, as this study will
demonstrate over the following pages there are several strong theoretical and empirical
reasons to believe that this is not an adequate strategy for the purposes of this particular
study. This study delimits its institutional trust variable to the implementing or
bureaucratic institutions due to the following reasons.
Firstly, this study aims to include as many different countries and political systems
as possible in the empirical analyses, including both (more or less) democratic and non-
democratic systems. Consequently then, not all countries have an identical set of basic
political institutions. Some institutions may be entirely absent in certain countries such
as China, which lacks a de facto multi-party system, while in other countries they may
be severely restricted or deeply flawed when it comes to fulfilling the purposes for
which they are intended in representative democracies. Some political institutions such
as parliaments are only elaborate set pieces or smoke screens designed to give an air of
democratic legitimacy to extremely centralized authoritarian regimes. In these non-
democratic countries, it would be only natural for the citizens to distrust the existing
political institutions that mainly represent the interests of the ruling elite(s). Examining
the relationship between confidence in political institutions and corruption tolerance
in these particular countries where the political institutions are by definition corrupt and
lack democratic accountability would thereby be a meaningless exercise.
While political institutions may radically differ in both structure and function
between different states, implementing institutions on the other hand resemble out of
practical necessity their counterparts in other countries to a significantly higher degree.
No sovereign contemporary state in existence is entirely without a police force, court
system or civil service of some kind. All states, whether democratic, semi-democratic
or non-democratic, benevolent or repressive, rich or poor, are in need of civil servants
with discretionary powers who distribute valuable goods and services or impose
onerous costs (Rose-Ackerman & Palifka 2016, 51). Inefficient and corrupt
implementers of public policy contribute to economic stagnation and undermine the
legitimacy of both democratically chosen and autocratic regimes, potentially resulting
in civil uprisings55 or military coup d'états. It therefore lies in the best interest of all
55 The Arab Spring, for instance, which began in Tunisia is claimed to have started from the demonstrations that
followed after the police confiscated a local fruit vendor’s cart, and demanded a bribe in return for the cart, which
the fruit vendor, Mohamed Bouazizi, refused to pay and instead set himself on fire and later died (CNN 2016).
36
regime types to be able to effectively limit bureaucratic corruption in their respective
countries.
Some studies have even demonstrated that authoritarian regimes are sometimes
perceived as better capable of controlling corruption than their more democratic
counterparts in other countries. Andrei Shleifer and Robert Vishny (1993), for instance,
argue that extremely centralized authoritarian governments such as the Philippines
under Ferdinand Marcos, the Soviet regime or Indonesia under Suharto, were able to
centralize and monopolize corruption itself, thereby creating predictability and
certainty (concerning, for instance, the size and frequency of bribes), hence avoiding
repetitive and competitive bribery that scares away potential investors, financial
institutions, and other economic actors. Only a limited number of handpicked (loyal)
officials were given the “privilege” to accept bribes, either directly or through
intermediaries, and a large share of these bribes went directly to the bank accounts of
the power holders who in return turned a blind eye on this praxis. This way the rulers
were able to secure the loyalty of important elites without sacrificing economic growth
and drowning the country in a free-for-all rent seeking.
Secondly, Bo Rothstein and Dietlind Stolle (2002, 10), in their study of institutional
trust as a determinant of generalized trust, argue that there are three main reasons why
it is essential to distinguish the representational side from the implementation side of the
political system in these types of studies. The first reason is that institutions dominated
by politicians have as their basis of trust (or distrust) partisanship, while institutions
dominated by civil servants in turn build their trust on their own reputation of being
impartial (Rothstein & Stolle 2002, 10; Rothstein & Teorell 2008; see later discussion on
impartiality and corruption). A Government consisting of one or a few political parties,
or a Parliament where the ruling party or parties hold a majority, is expected to pursue
ideological goals in a partisan way. People with similar ideological leanings as the
ruling parties are therefore expected to possess a higher confidence in the Government
or the Parliament, compared to those who support the opposition or otherwise have
differing ideologies. Political trust influenced by ideological leanings (specific support)
is thereby less likely to be correlated with attitudes toward the state as an institution
(diffuse support) and norms of civic behavior (Rothstein & Stolle 2008).
Rothstein and Stolle’s second reason is that unlike the representational institutions,
the so-called order institutions (the courts, the police, and other legal institutions) have
a special task of detecting and punishing those who use opportunistic (or, using the
authors’ own preferred word, treacherous) strategies, i.e. those who should not be
trusted due to their tendency to break this trust. The last and third reason is, according
to Rothstein and Stolle 2002, 10-11), “that the impartiality, efficicency [sic] and fairness
of street-level political institutions are important dimensions of institutional trust and
confidence that can be conceptually separated from conventional trust in politicians,
parties, and “the government””.
37
Thirdly, it should yet be emphasized that the stated focus on confidence in the
implementing institutions is not due to a wish to deny or downplay the important role
played by the political institutions, such as the Parliament, in explaining variations in
corruption tolerance. On the contrary. The representative institutions constitute a
significant part of the proverbial fish head referenced to in the beginning of this
dissertation due to their part in both the propagation of and opposition to grand
corruption, which in turn tends to either feed or constrain corruption on the lower
levels of government as a sort of institutional spillover effect (Rose-Ackerman & Palifka
2016, 185-186). Kimmo Grönlund and Maija Setälä (2012, 5-6) for instance note that the
normative expectations towards them are at least partly similar as towards the
judiciary and the police in a democratic context. Dishonesty and corruption also have
a tendency to negatively affect people’s trust in the representative institutions, but the
issue of expected impartiality is arguably considerably more complex in their case.
Democratically elected representatives are expected to define the public interest by
responding to political pressures, which means that being partial in favor of their
constituents and supporters is arguably part of their job description (Warren 2006, 803-
804). Consequently, this makes it harder to justify the application of the traditional
office-based conception of public corruption, which Warren accuses of not being
political enough, on the behavior of elected politicians. Warren (2006) has therefore
suggested an alternative definition of political corruption in representative
democracies, namely as duplicitous exclusion of those who have a rightful claim of being
included in a decision.
Several scholars have even claimed that a distrusting attitude towards the
representative institutions and the political process could be beneficial in some cases
and a sign of a healthy democratic society (for a summary of the arguments concerning
“the critical citizen”, see e.g. Marien & Hooghe 2010; Geissel 2008). A less “gullible”
citizenry that is discontent with how democracy works is argued to be better equipped
to critically examine government policies and governance, thereby putting pressure on
officials and holding them accountable on a constant basis. Benjamin Barber, for
instance, has maintained that “a certain amount of rational distrust is necessary for
political accountability in a participatory democracy” (Barber 1983, in Aitalieva 2017,
5). Some scholars have even suggested a public choice view of government as a
Leviathan that deserves to be mistrusted by citizens as a kind of self-preservation
mechanism against the predatory behavior of the state (Aitalieva 2017, 5).
Fourth and finally, social surveys and empirical studies confirm that people in
general tend to be less trusting of representative institutions and elected officials
(politicians), in comparison to the public administration and nonelected officials
(Grönlund & Setälä 2012; Houston & Harding 2013). This observation seems to confirm
the notion that a certain level of distrust is perfectly normal in representative
democracies and that the normative expectations toward the representative
38
institutions are more ambiguous and “political”. Additionally, Grönlund and Setälä
(2012, 17) conclude “that the expectation of incorruptibility of officials is held (almost)
universally […; r]egardless the level of corruption in their country, people value the
honesty and impartiality of public officials”.
The main reason for choosing to focus on the implementing institutions is simply an
attempt to distill “unhealthy” distrust in the government institutions as a whole from
a more “healthy” distrust and skepticism that may have its roots in democratic
discontent, partisanship or personal feelings toward individual politicians or parties.
Based on the previously discussed (theoretical) necessity to disentangle the “twin
concepts” of political trust and bureaucratic trust from each other, the following
definition of “bureaucratic distrust”, the key individual-level independent variable of
this study, is hereby adopted:
Bureaucratic distrust refers to a general expectation that the public administration will not
perform its duties in an impartial and/or efficient manner.
2.2.3 Institutional trust and corruption
Corruption research has identified institutional distrust as both a cause and a
consequence of various kinds of corrupt behavior. One often cited study that provides
empirical evidence of the latter causal relationship was carried out by Christopher
Anderson and Yulya Tverdova (2003). Their analysis of surveys conducted in sixteen
mature and newly established democracies around the globe shows that citizens in
countries perceived to have higher levels of public corruption also display more critical
evaluations of the performance of the political system and a greater distrust of civil
servants. These results are supported by Grönlund and Setälä (2012, 18), among others,
who demonstrate that “people’s perception of the honesty of officials is positively
associated with both trust in parliament and trust in the legal system”.
Many of the cross-country studies that have found a relationship between
corruption and institutional trust have not measured the level of corruption per se, but
rather perceptions of corruption. This, however, can be highly problematic due to
similarities in operationalization between these two concepts. Political or institutional
trust is often measured using questions such as “How often can you trust the
government to do what is right?” or “Is Government run by a few people looking out
for their own interests or run for the benefit of all?” (Morris & Klesner 2010, 1265). These
questions could almost directly be substituted with the question “Do you think the
government is corrupt?” i.e. “do you perceive that public officials abuse their power
for private gain?”. It is therefore important to take into consideration if these questions
de facto measure at least in part the same underlying phenomenon: the level of distrust
39
toward public officials and institutions. This could mean that a low institutional trust
also implies perceptions of widespread corruption, which in turn, in the words of
Stephen Morris and Joseph Klesner (2010, 1266), could “create the expectation of
corruption and inductively feed corrupt behavior, whereas corruption itself
deductively confirms and reinforces people’s expectations of others”.
Other studies confirm the existence of a discrepancy between actual corruption and
perceived corruption. Morris (2008), for instance, claims that they are mildly related and
have different causes and consequences, while Mitchell Seligson (2002) notes that
perceptions are considerably more pronounced and widespread than the actual
victimization of corruption. The corruption literature is quite clear on the point that
perceptions of corruption are something “more than” corruption itself. The question
thus remains how institutional trust or distrust is linked to actual corrupt behavior,
intent or even attitudes.
2.2.4 Institutional trust, social capital, and uncivic behavior
While quite a large body of empirical studies has examined the determinants of
institutional trust, relatively fewer have taken a closer look at the potential consequences
of varying levels of confidence or trust in public authorities.
Rothstein and Stolle’s (2002) analysis of survey data from Sweden and the World
Value Study found that generalized interpersonal trust, which they consider to be the
most important part of Putnam’s (1993) concept of social capital, could be explained by
an individual’s institutional trust (particularly trust in the order or implementing
institutions) and their perceptions of fairness and impartiality. Christian Bjørnskov
(2004) in turn demonstrates in a survey-based study of 29 European countries a strong
negative correlation between generalized trust and corruption. Social capital is argued
to be vital in overcoming so-called social dilemmas56 or collective action problems such
as endemic corruption, where cooperation would benefit all but is only possible if
agents trust that (almost all) other agents will cooperate, i.e. it is conditional on the
expected behavior of others (Rothstein & Eek 2009; Ostrom 1998). For instance, it would
not make sense to be the only parent or one of few parents who abstain from paying a
bribe to a teacher in order for one’s child to pass an exam or get a certain grade.
Cooperation tends to be costly in both time and money and therefore requires strong
incentives that can be viewed as a kind of “cooperation insurance”.
Trusting “most people” blindly without this insurance of cooperation would be pure
and dangerous gullibility in societies that do not consist purely of saints. People do not
believe that “people in general” will refrain from behaving opportunistically or
56 Also known as social traps (Rothstein 2003).
40
illegally because they have some kind of intimate knowledge concerning their morality
or behavioral history, but because they have confidence in that the same rules apply to
them all and that the game is not rigged. However, it is not enough that the rules
formally apply to all: they must also be convincingly enforced by well-resourced and
able institutions. If these two conditions are perceived to be met, people are more likely
to make the inference that it is safe to trust others and play by the rules, while the
opposite may be true otherwise (Rothstein & Eek 2009, 89). In other words, citizens
may be more averse to taking the risk of trusting strangers who might cheat them in
societies where these conditions are not perceived to be (fully) met (Bigoni et al 2015,
1339). It can therefore be argued that strong formal institutions can play this same role
in regard to substituting or combatting both corruption, which can be seen as a sort of
informal institution, and corruption tolerance, a sort of “anti-social” capital.
The causation argued by Rothstein and Stolle (2002) receives support in an
experiment-based study involving two student groups in Sweden, a high trust/low
corruption country, and Romania, a low trust/high corruption country (Rothstein &
Eek 2009). The authors of this study find “that corrupt behavior by public authorities
clearly influences people’s trust in them, in both the Romanian and Swedish samples”
and that people lose their trust in the general population if they encounter deceitful
behavior by public authorities (Rothstein & Eek 2009, 106-107). The conclusion that the
causal pathway mainly goes from institutional trust to social trust is further
substantiated by recent empirical evidence from, among others, Kim Sønderskov and
Peter Dinesen (2016) and Ran Tao, Dali Yang, Ming Li and Xi Lu (2013). The former,
who utilize a cross-lagged panel model, find that institutional trust is the most
important predictor of generalized trust, even if the authors cannot rule out a (limited)
feedback effect from the latter type of trust (Sønderskov & Dinesen 2016, 20).
However, while several empirical studies present evidence of that a lack of
confidence in the fairness, impartiality and competence of public bureaucrats erodes
social trust, it is at the same time argued to increase the expected utility of a third type
of trust, namely interpersonal or particularized trust (Rose-Ackerman & Palifka 2016, 250-
252). The basis of this trust is not self-interest and commonly agreed upon rules of
conduct, but family, clan, love or friendship, i.e. close personal relationships containing
strong mutual obligations to other members of the same in-group. In societies where
citizens generally do not expect to receive impartial treatment by government
representatives, and where generalized trust is consequentially quite low, people are
more likely to believe that they require personal ties either to the public officials
themselves or to powerful private patrons with the kind of connections that can help
to facilitate the matter in question. In other words, when formal institutions are
perceived as ineffective, people instead turn to personal connections and informal
institutions such as nepotism and other forms of corruption.
41
Several studies have examined the relationship between institutional trust and the
propensity to behave in an ethical way. One such study by Sofie Marien and Marc
Hooghe (2011) finds that lower levels of political trust57 is related to a more condoning
attitude toward illegal behavior58 in 33 European countries. Their assumption was that
a low trust in public authorities causes a more widespread questioning of the
legitimacy of these institutions and a lesser willingness to comply with their decisions,
i.e. the laws and regulations of society which are considered to be mere recommendations
rather than obligations (Marien & Hooghe 2011, 282). This in turn may result in a higher
frequency of law-breaking behavior among the populous where vice may almost
become a virtue and the dishonest, who are able to “cheat the system” by quicker and
cheaper means, are seen as cunning and resourceful (Rose-Ackerman & Palifka 2016,
259-260). Other studies have come to similar conclusions when it comes to other kinds
of illegal or risk-taking behaviors. Martin Lindström (2008a; 2008b), for instance, finds
low levels of political trust (in the Swedish national parliament) to be associated with
the illegal use of drugs and the purchase of illegal liquor in Sweden. Consequently, one
could also infer that some individuals would be more willing to try to influence the
implementation of policies and decisions that they find illegitimate using corrupt
exchanges.
One of the relatively few empirical micro-level studies to have systematically
examined if distrust in political institutions produces actual corrupt behavior among
ordinary citizens and vice versa focused on 17 countries in Sub-Saharan Africa (Cho &
Kirwin 2007). The findings in this paper indicate a circular relationship between
corruption and distrust, where citizens’ experience with corruption leads to distrust,
which in turn tends to increase experiences of corruption. Both distrust in institutions
generally and dissatisfaction with government services (health care and education)
specifically are found to be both a cause and a consequence of direct encounters with
corruption. This leads the authors to conclude that “the experience of corruption
decreases popular satisfaction with government service delivery in basic health care
and education sectors and perceptions of an unjust government service delivered by
corrupt public officials motivates citizens to pay a bribe or give a gift to obtain public
services” (Cho & Kirwin 2007, 16).
Another study by Mari-Liis Sööt and Kadri Rootalu (2012) analyzed data from an
original survey conducted among Estonian public-sector employees and found that
trust in institutions59, age and nationality are the most influential factors when it comes
57 “Political trust” is in this case measured using an index constructed out of four items from the European Values
Survey (EVS): trust in parliament, the justice system, the armed forces and the police (Marien & Hooghe 2011, 275). 58 “Legal permissiveness” is assessed using three questions from the EVS regarding the justifiability of a certain
action: Cheating on taxes if you have a chance, claiming government benefits to which you are not entitled, and
paying cash in order to avoid paying sales tax (Marien & Hooghe 2011, 274). 59 Sööt and Rootalu’s (2012, 87) trust index contained questions regarding three political institutions: The judiciary,
the police, and politicians.
42
to the opinions of public officials regarding corrupt and unethical behavior.
Respondents that had a higher level of trust tended to have both a higher awareness of
corruption60 and a lower tolerance of it. Charles H. Blake (2009) comes to similar
conclusions with regard to ordinary citizens in his analysis of data from the fourth
wave of the World Values Survey (1999 – 2004). The results of his logistic regression of
64 countries61 reveal that those who expressed confidence in the police were 16 percent
less likely to express acceptance of corruption. However, the statistical significance of
this relationship disappeared when he restricted his analysis to include only the Latin
American countries62, a geographical region singled out by scholars as especially
tolerant of corrupt behavior (Blake 2009, 102-104; Lavena 2013; Moreno 2002). Blake’s
latter findings are contradicted in another similar study, which includes six Latin
American countries63 in OLS multiple regression models that contain data from WVS
2005 – 2007 (Lavena 2013). Individuals with a high confidence in public institutions64
tended to be less permissive of corruption.65
One empirical survey-based study that challenges the commonly held assumption
of a negative relationship between trust and corruption focuses separately on both
public official and citizen attitudes in Estonia, a young post-communist democracy
(Tavits 2010). This study finds no evidence in either case that supports the theory that
generalized trust or institutional trust66 significantly affects a person’s “corruptibility”,
i.e. willingness to engage in corruption. However, it must be noted that in the case of
the citizens, Margit Tavits’ (2010, 1262-1263) “corruptibility” measure relies on a direct
question regarding their involvement in corruption (“Have you ever paid a bribe or
offered a gift to a public official in order to influence the provision of a public
service?”). The officials are meanwhile confronted with hypothetical scenarios where
they have to choose between participating in the corrupt exchange or not. These
measurements are therefore distinctly different from the “bribe justification”
measurements of other studies, which could explain the insignificance of the trust
variables.
60 Sööt and Rootalu’s (2012, 88) corruption awareness index contained four questions regarding hypothetical
situations involving different forms of corruption. Higher values reflected that the respondent held a narrow
definition of corruption. 61 Blake (2009, 102) excludes five countries classified as not free by Freedom House due to concerns about the
reliability of survey responses: Belarus, China, Egypt, Iran, and Vietnam. 62 Argentina, Brazil, Chile, Colombia, Dominican Republic, El Salvador, Mexico, Peru, Uruguay, and Venezuela. 63 Argentina, Brazil, Chile, Mexico, Uruguay, and Guatemala. 64 Government, civil service, police, and political parties. 65 Measured using Moreno’s (2002) index of corruption permissiveness. 66 Tavits’ (2010) trust in government variable was measured taking an average of the responses to questions
concerning the courts, the police, and the politicians.
43
Interestingly, Tavits’ (2010, 1263) study also included an independent variable
labeled as “Perceived acceptability of corruption”67, intended to increase reliability by
measuring the concept of “definitions”, as part of the “social learning” effects (see
discussion on social learning theory [SLT] in section 2.3.3 of this chapter).
Consequently, the results for both public officials and private citizens show a
significant and strong impact on the likelihood of engaging in corruption even when
controlling for wages (public officials) or extortion68 (general public), which was
unsurprisingly observed as being the by far strongest predictor of bribe paying. Tavits
(2010, 1275) therefore concludes “that willingness to engage in corrupt behavior is
more likely when one does not define corruption as morally or situationally wrong”.
While those who are less confident in public authorities are generally expected to be
more tolerant of corruption, those who are more confident are meanwhile expected to
be significantly less tolerant due to the following reasons. People with a high
confidence in the implementing institutions are expected to be more sensitive or
“allergic” to those occurrences that can defile or stain the image of the public
institutions and go against their normative values, thereby resulting in a loss of
confidence. Additionally, they are argued to be more likely to believe that the chances
of escaping justice are slim, and that all members of society have the same chances and
opportunities (Pop 2012, 30). Earlier studies have also empirically demonstrated that
trusting citizens have a higher willingness to support policy goals and allocate
resources to them, in addition to being significantly more willing to both accept and
follow the decisions of authorities they consider trustworthy and legitimate (Chanley
et al. 2000; Tyler 2006; Tyler & Huo 2002; Levi & Stoker 2000; Grimes 2008).
The theoretical arguments and empirical evidence discussed above give quite a clear
indication of how the relationship between confidence and corruption tolerance would
generally tend to look like. Hence, the first hypothesis in this study is formulated as
follows:
Hypothesis 1: Individuals who are more distrusting of the implementing institutions
(the police, the courts, and the civil service) tend to be more tolerant of corrupt
behavior.
In addition to examining the link between bureaucratic distrust and corruption
tolerance, this study also intends to take a closer look at another key factor on the
individual level, namely self-reported levels of perceived public corruption. The aim is to
examine both the direct effects of self-reported levels of perceived corruption, as well
as its interaction with bureaucratic distrust, on corruption tolerance. Here, the study
67 This variable included four questions concerning hypothetical third person scenarios involving different types of
corrupt exchanges. The respondent was supposed to answer on a 4-point scale how strongly they agree that it is
corruption (Tavits 2010, 1263). 68 I.e. if they were asked to pay a bribe.
44
begins by presenting the hypothesis of the direct effect of perceived corruption and
later on it will discuss potential indirect or moderating (interaction) effects of perceived
corruption. Unfortunately, the extent of public corruption-question was only included in
the third wave of the World Values Survey (1995 – 1999), which consequently limits
those analyses that include this variable to this specific time period and the 56 countries
included in this wave. The following hypothesis is formed based on the previously
discussed arguments:
Hypothesis 2: Individuals who perceive a greater extent of public corruption tend to
have a higher corruption tolerance.
2.3 Dysfunctional societies and corruption tolerance
This theoretical section discusses the potential effects of different macro indicators of
societal “dysfunctionality” on attitudes towards corrupt and uncivic behavior. Are
citizen attitudes and values influenced or shaped by the structures of the surrounding
societies and the quality of the public institutions, or are they simply peculiar
characteristics of certain cultural heritages transferred from parents to children
through processes of socialization? In other words, do dysfunctional and weak states
produce dysfunctional citizens?
The umbrella term “dysfunctionality”, as we saw in Chapter 1, section 1.4, refers in
this case to the extent of poverty and economic inequality in a country, and to the
quality of the public institutions, factors that are widely considered to have an
impairing effect on the cohesiveness of societies and social wellbeing (e.g. Kotzian
2014). This section begins by discussing the potential effects of the level of socio-
economic development and poverty on corruption and attitudes toward corrupt
behavior, after which it will continue on to addressing the potential effects of economic
inequality. Lastly, this section will conclude with a discussion concerning how
different aspects of institutional quality may influence people’s perceptions of corrupt
and uncivic behavior.
2.3.1 Socio-economic development and corruption tolerance
In the literature on corruption, one factor constantly resurfaces as one of the, if not the,
strongest predictors of the extent of corruption: a countries level of socio-economic
development, often operationalized as GDP per capita or with the Human
Development Index (see e.g. Treisman 2000; Lambsdorff 2006). A great number of
45
empirical studies have demonstrated that public corruption tends to be perceived as
more widespread in socio-economically less developed countries and that corrupt and
criminal practices tend to prosper in contexts of extensive and deep poverty. However,
do these observations also indicate that the populations of these countries possess
values and attitudes that are more conducive to corrupt and uncivic practices?
While it is difficult to separate the socio-economic causes from the consequences (see
e.g. Mauro 1998), most scholars would still agree that a low level of development and
deep-seated poverty create a fertile soil for both low- and high-level corruption. The
issue of socio-economic development and corruption has received a lot of attention
during the last few decades, partly due to a change in attitudes toward public
corruption, which used to be seen mainly as a domestic problem, among development
aid donor organizations such as the World Bank or the IMF.69
Several attempts to explain the relationship between socio-economic development
and corruption have been made, including various ways that it can increase public
accountability by, for instance, giving rise to a well-educated middle class with higher
demands on public goods and services, better paid civil servants who are less willing
to risk their stable livelihoods for illegal gains, or more resources in general to invest
in anti-corruption initiatives such as e-government or ethics training (e.g. Rose-
Ackerman & Palifka 2016). However, the focus of this section is not directly on elites
or government structures, but on the grass roots, i.e. the attitudes and values of
ordinary citizens. Does the level of development also translate into more or less tolerant
attitudes regarding corrupt and uncivic behavior?
As we will see, there are somewhat conflicting theoretical expectations regarding
the exact relationship between socio-economic development and general attitudes
toward corrupt and uncivic practices. On one hand, socio-economic development is
argued to generate postmaterial or emancipative values, which are in turn argued to
be conducive to liberal democracy and pro-democratic attitudes. However, on the
other hand, emancipative values are furthermore argued to include norm and
authority challenging attitudes and values that revolve around the needs of the
individual rather than those of the collective. This latter dimension of value change
may generate conditions suitable to choices where the individual prioritizes his or her
own self-interest before the public good, while the former should strengthen attitudes
that are hostile towards such non-democratic and uncivic practices (Welzel 2010;
Welzel & Inglehart 2008; Kravtsova et al. 2017).
69 Former World Bank President, James D. Wolfensohn, “made a groundbreaking speech on the "cancer of
corruption" to all the Bank's shareholders at the 1996 Annual Meetings, placing the issue squarely on the
development agenda for the first time for a multilateral institution. "Let's not mince words - we need to deal with
the cancer of corruption…," Wolfensohn said. "Let me emphasize that the Bank Group will not tolerate corruption
in the programs that we support, and we are taking steps to ensure that our own activities continue to meet the
highest standards of probity."” (The World Bank [1])
46
Modernization theorists all the way from Karl Marx and Max Weber to Samuel
Huntington and Ronald Inglehart, just to name a few, have long argued that socio-
economic development brings with it profound value change, although there has been
a lot of disagreement and debate regarding exactly what kind of value change and if the
direction of the value change is dependent on prevailing societal traditions. Next, this
section will therefore examine the arguments for why a low level of socio-economic
development could be related to a higher level of corruption tolerance in a society.
Does poverty breed corruption tolerance?
Some scholars argue that the extensive corruption in developing countries may be a
syndrome of unfinished processes of modernization or a residual of traditional
societies living on in the collective memory of citizens. Johann Graf Lambsdorff (2010,
1), among others, has noted that “[t]here is widespread belief that “western societies”
apply a more vigorous definition of bribery […,] and are thus superior in their moral
standards”. Many western business companies have for instance excused their bribing
of foreign officials in non-western countries by referring to “local customs and
traditions” or business necessity70, which has accordingly made companies from so-
called relatively “corruption-free” wealthy countries an important source of public
corruption, a fact often ignored by most corruption indices71 and the governments in
these countries.
Several renowned scholars have claimed that the “moral superiority” of western
nations is a result of the high levels of prosperity and modernization that these
countries have attained in comparison to the so-called developing world. According to
Huntington (1968, 378), modernization entails a gradual change in the basic values of
a society towards universalistic- and merit-based norms, loyalty to and identification
with the nation-state (“the public interest”), and ideals of equal rights and obligations
in relation to the state. Corruption is therefore argued to be a natural consequence of
the modernization process where traditional values and norms collide with modern
ones, resulting in “opportunities for individuals to act in ways justified by neither”
(Huntington 1968, 378). Customs that previously were sanctioned or even advocated,
such as using your official position to aid your kin or seeking out political patrons for
assistance in strictly private matters, could suddenly become illegal and officially
unacceptable.
70 Lambsdorff (2010, 3) provides an example of this with observations from panel discussions where such a position
was stated by representatives from the Federation of German Industry, and a citation from Lord Young, former
head of Cable and Wireless and Secretary of State for Trade and Industry for the United Kingdom, who said in a
BBC interview that “Now when you’re talking about kickbacks, you’re talking about something that’s illegal in
this country, and that of course you wouldn’t dream of doing ... but there are parts of the world I’ve been to where
we all know it happens, and if you want to be in business, you have to do.” 71 Transparency International’s Bribe Payers Index (BPI) is an exception that ranks countries based on perceptions
regarding the supply side of corruption (Bribe Payers Index 2017).
47
Traditional societies are claimed to lack a clear-cut distinction between the private
and the public spheres, and between traditional “tribute giving” and outright bribery
on one hand, and the “special obligations” linked to any favor on all societal levels on
the other hand (Myrdal 1968, 413-414; see also Treisman 2000, 404). This blurriness of
the boundaries between public and private roles is thereby argued to lower the social
stigma of both the exploitation of public positions for private gain and the giving of
“gifts” in return for specific favors.
There are some well-founded reasons to believe that widespread poverty may be
related to attitudes that are more accepting of corrupt practices. Abraham Maslow’s
(1970) renowned motivational theory, the hierarchy of needs, argues that basic
physiological and psychological needs have to be fulfilled prior to being motivated by
higher needs related to esteem and self-actualization. According to Maslow, the lower
levels of this hierarchy include needs related to survival, such as food, water, rest,
security, safety, belongingness, and love, while the higher levels contain such needs as
the need for independence, status, prestige, personal growth, and, most pertinently,
the need for moral standards and ethics. For instance, if people are hungry and lack the
resources needed to buy food for their family, they are consequently more likely to
steal some bread, even though theft is both morally and legally condemned and
sanctioned by society and religion.
Similarly, a person who lives in great insecurity and the threat of violence is more
likely to resort to bribe giving, clientelism72, or other illicit practices in order to fulfill the
need for personal security. Scholars largely agree that the phenomenon of clientelism,
which is closely related to corruption, thrives in poor democracies with weak
institutions unable or unwilling to deliver programmatic public goods that target
broader layers of the population, including even those who have not sworn their vote
or loyalty to a specific politician or party beforehand (Manzetti & Wilson 2009, 81-83).
Poverty is said to make citizens more willing to support corrupt politicians73 and
governments, or at least turn a blind eye to high-level corruption, in return for club
goods or “bribes” such as jobs, contracts, permits or more basic goods (e.g. a Christmas
turkey, a toaster or a pair of shoes), and is thereby argued to loosen the mores of social
morality. A tolerance of high-level corruption could in turn translate into a tolerance
of low-level corruption following that the patron is likely to function as a role model to
the client due to his higher socio-economic status and perceived success in life.
72 There is no universally accepted definition of clientelism, but James C. Scott (1972, 92) for instance defines it as a
relationship “in which an individual of higher socioeconomic status (patron) uses his own influence and resources
to provide protection or benefits, or both, for a person of lower status (the client) who, for his part, reciprocates by
offering generous support and assistance, including personal service, to the patron”. 73 One often cited case comes from Brazil, where the supporters of Adhemar de Barros, one of the most prominent
Brazilian politicians from the 1930s to the 1960s, liked to exclaim “Rouba, mas faz!” (“He steals, but delivers!”)
(Manzetti & Wilson 2009, 84).
48
Another argument as to why corruption tolerance may be negatively related to
socio-economic development is that developed countries tend to have more highly
educated citizenry that may be better equipped to understand the negative
consequences of different forms of corrupt practices and act on the information, in
addition to being more likely to identify themselves with the country as a whole rather
than with specific in-groups (Uslaner 2002; Uslaner & Rothstein 2016). The citizens in
these countries also tend to possess the skills needed to find gainful employment and
live under more secure conditions, where they may feel that clientelistic networks or
bribe-paying are unnecessary for achieving sufficient and stable living conditions for
themselves and for their families (Uslaner & Rothstein 2016, 229).
As was already touched upon in an earlier section of this dissertation, some scholars
contribute the observed lack of cooperation and public-spiritedness in extremely poor
and “backward” societies to a special kind of ethos called “amoral familism” (Banfield
1958). The previously described existential pressures generated by unfulfilled basic
needs feed this kind of ethos where the needs and interests of the immediate family
come first and civic morality or the common good comes second or third.
However, there are also some reasons to believe that the general attitudes and values
in less developed countries might not actually differ from those in developed countries,
and that they may even be less tolerant of corrupt practices. Next, this study will
examine the arguments that suggest that a higher level of socio-economic development
could engender a higher tolerance of corrupt and uncivic behavior.
Do forces of modernization engender a greater tolerance of corrupt practices?
The existential pressures produced by unfulfilled basic needs are argued to increase
the utility of so called “collectivistic” or “survival” values and conformity to group
norms, which in turn increases the demand for authoritarian institutions to enforce
them (Welzel 2014). The pioneer of cross-cultural psychology, Harry C. Triandis (1995
in Welzel 2014, 33), argues that “collectivism is the psychological response to existential
hardship because hardship makes people dependent on kinship solidarity”. This
dependency on solidarity could consequently make people less tolerant of
disobedience and free riding behavior in general if it has the potential to hurt the
collective in any way. Strict social norms may therefore be valued more highly in less
developed societies due to their greater utility and potential lack of (effective)
alternative enforcement methods (see Kotzian 2014 and section 2.3.3 in this chapter).
Socio-economic development and processes of modernization are in turn argued to
result in that a growing number of citizens no longer value strict obedience to
authorities and norms of civic virtue to as high a degree as in less developed, more
traditional societies (Zmerli 2010, 671; Kravtsova et al. 2017). The utility of survival
values such as norm conformity decline as people possess more action resources (e.g.
higher wages and levels of education, more spare time and better health) to spend on
49
realizing their potential, which in turn gradually increases the utility (and demand) of
freedom to do just that. A growing share of people adopt what Christian Welzel (2014)
calls “emancipative values”, which refers to the human development towards
empowerment and emancipation from domination by various kinds of authority (e.g.
religious, political, etc.). However, there is also a chance, at least in the short run, that
social norms may become almost completely eroded as a consequence of
modernization forces such as urbanization. Urbanization may lead to what Émile
Durkheim (2013) calls “anomie”, i.e. feelings of norm- or rootlessness, when large
urban centers, where people do not even know their next-door neighbors, replace tight
rural communities, where “everybody knows everybody” and community norms are
familiar to most if not all villagers.
Moreover, scholars such as John Clammer (2012; see also Hao & Johnston 2007)
claim that forces of globalization and processes of neo-liberal market-driven
development, which have been heavily promoted by global financial institutions like
the IMF, the WTO and the World Bank, have engendered so-called “market-cultures”
that have fundamentally reframed various aspects of morality. It is argued that
“capitalism transforms social relations, brings into existence new social strata,
monetises what were formerly gift or cooperative rather than commoditised
relationships, […and] introduces new values (including the alien idea that time is
money)” (Clammer 2012, 121).
Self-interest or greed becomes viewed as something resembling “good” and people
are encouraged to get rich, which stands in stark contrast to more traditional values
often rooted in religion espousing a rich spiritual life and altruism, rather than
materialism and self-interest. Social solidarity thereby stands at risk of being eroded
(or not to form at all) as all attention is turned towards individual rather than collective
interests and gains. Furthermore, the negative moral consequences of this “reframing
of morality” are argued to be felt the strongest in transition economies where the
capitalist economy is still a relatively fresh experience (Clammer 2012, 128). Market-
driven driven development and globalization is further argued to intensify both
international and domestic inequalities, which, as we will see in the next section, can
potentially have devastating consequences for civic morality and social order in a
society.
Empirical research has supported the claim that individuals in more developed
societies have a higher likelihood of placing greater emphasis on the previously
described postmaterialist or emancipative values and/or being surrounded by people
who express these kinds of values (Inglehart 1971; Welzel 2010). Postmaterialists are
described as people who “do not take for granted the norms prescribed by external
sources of authority, including the family, religion, or the state […] and decide for
themselves which social rules and norms to follow” (Kravtsova et al. 2017, 4). Empirical
studies have also demonstrated the existence of a link between postmaterialism and
50
individualism/autonomy, which suggests inherent distrusting and elite challenging
views towards authorities (Welzel 2010, 2013; Dobewall & Strack 2014; Catterberg &
Moreno 2006). Based on these observations one could expect postmaterialists to be
more tolerant of corruption and free riding behavior, but studies have also associated
postmaterialism with support for democracy and transparency, civic activism,
generalized trust, and impartiality (Welzel 2010; Welzel & Inglehart 2008).
These last observations suggest that the impact of socio-economic development is
more complex than one might expect at first glance and that there are conflicting
expectations regarding the diffusion of so-called postmaterialist values. Kravtsova et
al.’s (2017) multilevel study of the link between postmaterialist values and the approval
of bribery suggests that the individual level link is dependent on the contextual share
of the surrounding postmaterialists. Individuals who put a greater emphasis on
postmaterial values generally tend to be more tolerant of corruption, while the so-
called ecological effect operates in the other direction. Highly affluent countries
possessing a larger share of postmaterialists demonstrate a significantly higher overall
disapproval of corruption among their populations, and a negative individual-level
relationship between postmaterial values and the acceptance of bribe taking. Kravtsova
et al. (2017, 229) argue that the reason why the social effects of postmaterialism lead to
a greater disapproval of corruption, instead of a greater approval, can be explained with
the help of the evolutionary theory of morality (ETM, see Krebs 2008). In short, this theory
argues that humans have a natural tendency to think and behave prosocially following
an evolutionary process that has resulted in that prosocial attributes are more likely to
spread74 and gain support in a population.
Empirical evidence of this phenomenon is provided by Jong-Sung You and Sanjeev
Khagram (2005), who note that individuals in high-income countries perceive less
corruption but are more likely to justify bribe taking and cheating on taxes. Kravtsova
et al. (2017) on the other hand found no evidence of a greater tendency to condemn
bribery in more developed countries or any significant relationship at all with
economic development.
As we have seen, there are highly conflicting expectations regarding the potential
effects of socio-economic development and forces of modernization on levels of
corruption tolerance in various societies, and it is not entirely clear which of these
effects dominate, if any. However, based on the earlier discussed concept of “amoral
familism”, which is said to thrive in extremely poor, “backward” societies (Banfield
1958), and the arguments that predict the diffusion of so-called “democratic values”,
such as equality, through more equal and universal opportunities of acquiring
educational services, the following hypothesis regarding the direct effect of socio-
economic development on attitudes toward corruption is formed:
74 For more on how the ecological effects are argued to work, see Kravtsova et al. (2017, 227-229).
51
Hypothesis 3: Corruption tolerance tends to be higher in socio-economically less
developed societies.
2.3.2 Economic inequality and corruption tolerance
Besides the level of socio-economic development of a country, another related factor
has also received extensive attention among scholars when it comes to explaining why
some societies are perceived to be more corrupt, less trusting, and less public-spirited
than other societies, namely the level of economic inequality, i.e. the distribution of
wealth in a society. These studies have looked at the consequences of how equally
resources are distributed within a society when it comes to both social capital and
corruption (e.g. Dobel 1978; Uslaner 2008). This section begins by discussing the impact
of economic inequality on corruption, where social capital (usually proxied by
generalized trust) is argued to be an important intermediate variable, before moving
on to a discussion concerning the (claimed) more indirect influence of economic
inequality and generalized trust, which are argued to have a more direct causal
relationship.
Does inequality breed cultures of corruption?
While empirical studies have indicated a strong causal impact of inequality
(commonly measured using the Gini index) on generalized trust, they have in turn also
demonstrated weak correlations between economic inequality and various indices of
perceived corruption. However, several studies have linked high levels of economic
inequality with widespread corruption (Dobel 1978; You & Khagram 2005; Gyimah-
Brempong & Munoz de Camacho 2006; Uslaner 2008). As discussed in the previous
section, corruption favors those who can afford to pay sizeable bribes for substantial
benefits, and disfavors those who are more dependent on formally free or subsidized
government services and goods. Members of affluent and influential elites can use their
deep pockets and valuable contacts to strive to preserve the status quo, i.e. hinder the
redistribution of wealth, through high-level payoffs and patronage, thereby creating
vicious circles of corruption and rising inequality (You & Khagram 2005).
There is some empirical evidence that supports the theory that economic inequality
makes people more likely to behave corruptly. The study by You and Khagram (2005),
for instance, indicates that economic inequality may affect the morals of the people,
rich and poor alike, and make them more accepting of corrupt practices through
normative mechanisms.
You and Khagram (2005, 138-139) provide several theoretical arguments as to why
economic inequality could potentially contribute to increasing the corruption tolerance
52
of both rich and poor alike. Firstly, growing levels of inequality result in higher stakes
for the rich who “have more to lose through fair political, administrative, and judicial
processes”, which often imply high societal pressure for redistributive policies and
higher levels of progressive taxation (You & Khagram 2005, 138). Corruption may in
some scenarios be the most effective way for the affluent and privileged ones to avoid
the kind of policies that aim to narrow the income gap between rich and poor.
Secondly, it also grants them more resources to invest in both legal and illegal
influence-buying, which can include such activities as political lobbying, election
campaign contributions, general political contributions, and even bribery with an aim
of influencing legislative processes (grand corruption) or the implementation of laws
(petty corruption). Thirdly, the poor often lack the necessary resources needed to be
able to monitor the rich and the powerful efficiently. This implies that in highly
unequal societies, where the middle class is either miniscule or (almost) completely
absent, the risk of getting caught when engaging in corruption and being punished is
substantially smaller, and this in turn might signal that corrupt behavior is more
acceptable (You & Khagram 2005, 138-139).
Fourthly, the poor are often the main targets or engagers when it comes to petty
corruption, and if a large share of a highly unequal society is engaged in petty
corruption it eventually might become viewed as something “normal” or “everyday”.
In other words, a great bulk of the people now sees the widespread petty corruption as
appropriate behavior. This phenomenon has been noted by Uslaner (2008, 92), who,
when analyzing corruption attitudes in transition countries, observes that “grand
corruption makes people less trusting of others and more envious of those who have
become wealthy by dishonest means, while petty corruption has little effect on people’s
attitudes”. Ordinary people at the bottom of the income ladder excuse their own
participation in corruption by rationalizing to themselves and others that they are the
victims and that they have no choice but to pay the bribe so that they can secure a
certain public service for their family, thereby deserving absolution. This self-
rationalization in turn becomes considerably easier if they can observe others like them,
or “better” than them, behaving similarly and point out that they are far from the only
ones acting in such a manner.
A potential fifth reason as to why inequality might generate corruption tolerance is
related to the theme of the next section, namely institutional quality and government
performance. Economic inequality is claimed to be “an important indicator of
government performance” and empirical studies point to a negative relationship
between inequality and trust in government (Aitalieva 2017, 1). Perceptions of high
inequality could be interpreted by citizens as a sign of that the government does not
really care about the interests of ordinary citizens (Dobel 1978). Economic inequality,
and in extension poverty, could therefore potentially be seen as an indicator of
53
government performance in relation to desirable (long-term) outcomes from public
policy. As mentioned, this subject is expanded upon in the next section.
Inequality is argued to erode social solidarity and give rise to strong tensions
between those at the top and those who have less, resulting in “all for all” scenarios
where different social groups harbor deep mistrust and enmity against one another
(Rothstein & Uslaner 2005; Dobel 1978). Uslaner (2011) has developed a model that
links inequality, corruption, and trust in government into something that he calls an
“inequality trap”. He claims that the institutional accounts of the causes and
consequences of corruption, which have been highly popular among academics, are in
fact lacking, and in turn proposes a structural account of corruption that rests upon
both inequality and generalized trust. While he admits that the earlier mentioned
simple correlation between inequality and public corruption on a country level is
“minuscule”, he still urges that “[i]nequality matters because people think it matters”
(Uslaner 2008, 54).
Uslaner (2011, 143; see also You & Khagram 2005; Dobel 1978) provides three key
pathways ways by which inequality breeds corruption:
1. [By] leading ordinary citizens to see the system as stacked against them […];
2. creating a sense of dependency of ordinary citizens and a sense of pessimism for the future,
which in turn undermines the moral dictates of treating your neighbours honestly; and
3. distorting the key institutions of fairness in society, the courts, which ordinary citizens see
as their protectors against evil-doers, especially those with more influence than they have
[…].
He furthermore argues that “[o]rdinary citizens (far more than elites) believe that you
cannot get rich without being corrupt and that corruption plays a large role in
promoting more inequality” (Uslaner 2011, 147). The following cautioning by Alexis
de Tocqueville from his classic book “Democracy in America” (1835) does a superb job
of illustrating the previously discussed arguments regarding the corrupting influence
of inequality and the line of reasoning involved in these causal processes:
[W]hat is to be feared is not so much the immorality of the great as the fact that immorality
may lead to greatness. In a democracy, private citizens see a man of their own rank in life who
rises from that obscure position in a few years to riches and power; the spectacle excites their
surprise and envy, and they are led to inquire how a person who was yesterday their equal
today is their ruler. To attribute his rise to his talents or his virtues is unpleasant, for it is
tacitly to acknowledge that they are themselves less virtuous or less talented than he was. They
are therefore led, and often rightly, to impute his success mainly to some of his vices; and an
odious connection is thus formed between the ideas of turpitude and power, unworthiness and
success, utility and dishonor. (Alexis de Tocqueville 2003 [1835], 203)
54
There is also some empirical evidence that supports the argument that inequality
erodes social solidarity, defined as “the willingness to contribute to the welfare of other
people” (Paskov & Dewilde 2012), resulting in the previously described “all for all”
high-corruption equilibrium.
Can rising inequality decrease corruption tolerance?
Based on the previously discussed theoretical arguments and the empirical evidence it
is reasonable to expect corruption tolerance to be higher in less egalitarian societies.
However, recent micro-level empirical evidence provided by Ioana Pop (2012), whose
study included 43 European countries, seemingly contradicts the theoretical
expectation that inequality fosters corrupt behavior in ordinary citizens: Individuals in
countries with a greater economic inequality (Gini) tended to show a lower acceptance
of corrupt acts.75 This finding could according to the author be explained by the fact
that corruption mainly benefits a small minority that can afford to buy unfair
advantages over the poor grand majority. The highly visible inequality, injustice, and
grand corruption in these societies is argued to make ordinary people more sensitive
towards corruption, which they associate with the high inequality, and thereby less
accepting of it and its effects (Pop 2012, 30-31).
This is in fact also consistent with the observations of Uslaner (2008, 54), who argues
that people blame growing inequality on the dishonesty of public officials and business
leaders, and refers to anti-corruption riots in China where the peasants have protested
against the corrupt behavior of the elites and their own poverty. The consequences of
free riding behavior such as tax evasion and the usage of bribes become arguably
clearer in more unequal societies or in societies that have experienced a sharp decline
in equality, and this in turn may make the population more intolerant of that sort of
behavior.
Evidence could thereby point at a possible non-linear statistical relationship between
economic inequality and corruption tolerance. Pop’s (2012) study included several
transition countries with relatively low levels of economic inequality that resulted from
their communist heritages and lack of free markets. Many observers have noted that
post-communist countries tend to have widespread occurrences of corruption, which
many scholars claim to be a result of their socialist heritages where circumventing the
cumbersome and ineffective public bureaucracies became a way of survival in an
environment with scarce resources, resulting in an incorporation of corruption
tolerance into the very norms and values of these societies (Pop 2012, 30; Sandholtz &
Taagepera 2005; Karklins 2005).
75 Acceptance of corruption is measured using a modified version of Moreno’s index, where the European Values
Study (EVS) questions are first turned binary before they are computed into a summative scale of 0 to 4 (Pop 2012,
31).
55
Wayne Sandholtz and Rein Taagepera (2005, 110) present findings that they claim,
“suggest that corruption is not just the product of immediate material incentives, but
is also powerfully influenced by cultural orientations that are acquired through
socialization in a society’s historical heritage”. Moreno (2002, 8) also notes in his study
on corruption permissiveness that post-communist countries have the highest average
level of tolerance among all the observed regions, which is why this study will control
for these particular countries in its empirical analyses.
However, because of its Eurocentric focus, Pop’s study excluded many extremely
unequal societies, many of which can be found on the African continent and in Latin
America.76 Public attitudes toward corruption could therefore be quite different in a
high inequality setting, where citizens are likely to be accustomed to extremely high
gaps in income and consumption, compared to countries with low- or medium-levels
of economic inequality. These extremely unequal societies are arguably those where
“cultures of corruption” are likely to be most vibrant: inequality breeds cynicism
among ordinary people regarding the chances of attaining success in life without being
ruthless and corrupt. This cynicism in turn may erode the public spiritedness of the
ordinary citizens and make them less likely to strive for the common good and abstain
from free riding behavior.
The following hypothesis is hereby formulated:
Hypothesis 4: Corruption tolerance tends to be lower in societies with intermediate
levels of economic inequality, but significantly higher in extremely unequal societies.
[non-linear relationship]
76 Chile, for instance, has a Gini coefficient of around 55 in 2000, while South Africa has 63 in 2013, on a scale from
0 – 100 (The World Bank 2017).
56
2.3.3 Institutional quality, economic performance, and corruption
tolerance
The two previous sections discussed how the extent of poverty and the distribution of
economic resources could potentially affect general attitudes toward behavior that
undermines the common good. Now it is time to shift the focus back to the public
institutions again and discuss the potential consequences for civic morality of living in
societies with dysfunctional public institutions that produce unsatisfactory outcomes.
The rotting fish argument: Does public corruption and inefficiency increase
corruption tolerance?
Former US president Jimmy Carter (1977 – 1981) expressed that “a country can expect
a government as good as its people” (paraphrased in Rose & Mishler 2011, 118).
However, the arguments presented in this study suggest that it is possible to reverse
this statement to suggest “a country can expect a people as good as its government”,
i.e. that elite misconduct and a general weakness of government generates citizen
misconduct.
The people that constitute the different branches of government can be said to
provide important role models for ordinary citizens, and the behavior and performance
of representatives from the former group may have a significant influence on the
public-spiritedness of those from the latter. This is arguably the core of the rotting fish
argument. Before discussing the potential relationship between institutional quality
and corruption/corruption tolerance, however, this study first needs to elaborate on
what “institutional quality” actually is and how it can be defined. Later on, the study
will discuss how it is operationalized for its empirical part.
Good governance, government performance, public sector performance, or
institutional quality77, whichever term a person chooses to use, is a hotly debated
subject among both academics and policymakers, but a wide consensus is still missing
regarding what exactly it should entail, how it should be defined, and the most suitable
way to measure it (Kaufmann et al. 2010; Van de Walle 2009). As with most, if not all,
phenomena of interest to social science researchers, there are both wide and narrow
definitions of institutional quality. However, instead of just summarizing these
definitions, this section will start by examining the general characteristics of good and
bad governance.
Bribe paying could widely be viewed as justifiable or even a normal part of the
administrative processes in countries with long delays in transactions, widespread
corruption and onerous amounts of bureaucratic paperwork (Dong et al. 2012, 15). One
77 This study will mostly be using the term “institutional quality” due to the reason that it finds it clearer and more
precise than the term “governance”.
57
scholar, Hernando De Soto (1989), and his research team experienced this first hand
during an experiment while setting up a small garment factory in Lima, Peru. The
intention of the research team was to follow bureaucratic regulations and procedures
without having to resort to any bribe paying, but this simply became an impossible
task. In the end, they are reported to have been asked for “speed money” ten times and
twice it became necessary for further continuation of the experiment (De Soto 1989, in
Torgler & Valev 2010, 557). The demand for additional payments may be so strong or
the professional ethics may be so weak78 that the administrative machine cannot
function properly without these informal remunerations.
The perceived quality of public institutions may signal the chance of being detected
and sanctioned when engaging in corrupt transactions or other illegal activities, and
the widespread existence of opportunities that only open up through bribery. Low
institutional quality may on one hand imply weak accountability and too much
discretion for individual public officials, which according to principal-agent theory
implies greater informational asymmetries between government agents and their
supervising principals to whom they are duty bound.79 This lack of information
regarding the daily activities of individual agents creates incentives for both bribe
taking and bribe giving, if there exists a goal conflict between the principals, who are
presumed to represent the public interest, and the agents, who are expected to behave
corruptly if the benefits of such behavior outweigh the costs (Persson et al. 2013;
Klitgaard 1991).
However, poor institutional quality may on the other hand also imply excessive80 or
inefficient monitoring of the everyday work of public officials, i.e. too little discretion
or autonomy, which can have a negative impact on the length or frequency of
bureaucratic transactions, or on the perceived competence of individual bureaucrats.
Highly detailed and rigid regulations and standard operating procedures (SOPs) that
prevent agents from, in the eyes of the citizens, “following common sense”, may send
signals of incompetence, untrustworthiness, and unreliability on behalf of the agent(s).
Furthermore, as argued by Claus Offe (1999, 53), “[t]he absence of trust is rather
likely to condition a type of behavior on the part of the non-trusted that is rigidly and
ritualistically following orders and seeks to hide behind established rules and
routines”. Moreover, if a public organization (the government) judges that it cannot
afford to give its own officials at least some discretionary powers, out of fear that they
will abuse them or neglect their duty, then how could ordinary citizens place their trust
in them? A delicate balance is therefore clearly required between accountability and
monitoring on one hand, and discretion and flexibility on the other, if the aim is to
78 For instance, due to low public wages. 79 The principal can for instance be a senior/higher level official, a politician or an ordinary citizen. 80 As argued by Fukuyama (2014, 546-547), red tape can be so complex that it actually makes it hard it for the
principal to supervise if rules are being followed.
58
reach a high institutional quality and win the trust of the citizens (Fukuyama 2014).
Here it is again important to remember that the public bureaucracy within a certain
country is not a monolithic entity. Some specific organizations or institutions may thus
require more discretion and autonomy to function more efficiently, while others
should have less.
Francis Fukuyama (2014) argues that the problem with inefficient bureaucracies in
rich countries with a relatively high state capacity81, such as the United States, is not
necessarily too much discretion, as it often is in poor countries such as Nigeria, but
rather too little. Growing demands in advanced democracies for more democratic
accountability in the form of formal procedures intended to increase the transparency
and responsiveness of administrative agencies have often had the opposite effect.
Transaction costs have increased while innovation and risk taking has decreased,
which in turn has led to even greater demands for more accountability and, ultimately,
distrust and perceptions of illegitimacy. The question then is which factors, more
precisely, explain how people judge their government and its institutions?
According to Rothstein and Stolle (2002), public institutions such as the legal system
have two key aspects on which people judge them: fairness and efficiency. Uslaner (2011,
144) claims that fairness is “the key to the connection between law and corruption” due
to the reflection of the advantages of some individuals or groups that is inherent in it.
If citizens perceive the police or the courts as unfair and partial, they are more likely to
express a low confidence in them, and this may in turn lead people to believe that the
only way to become successful is by taking part in corrupt exchanges. Grönlund and
Setälä argue that “[c]orruption is likely to reduce trust in institutions, because it is
contradictory to the idea of impartiality […; c]orrupt institutions and public institutions do
not treat citizens impartially, they do it unequally on the basis of how able and how
willing citizens are to perform personal reciprocal favors” (emphasis added, Grönlund
& Setälä 2012, 5). Rasma Karklins (2005, 103) meanwhile argues that public corruption
“undermines public spiritedness and commitment to serving the public good”.
Corruption as a term refers in this institutional context to the earlier discussed
contemporary narrow conceptualization of corruption that focuses on the public sector
and the rules and demands of a public office (in other words, public corruption). It is
therefore important to keep it theoretically separated from the broader
conceptualization of “corruption” in corruption tolerance, which focuses on the
general attitudes and values of ordinary citizens rather than on the (perceived)
behavior of bureaucratic and political elites and office holders.
Fairness, impartiality and efficiency are not expectations reserved solely for the legal
system. They pertain to the entire implementing side of the political system, i.e. the
81 Fukuyama (2014, 541-543) argues that a high state capacity consists of three different parts: [1] technocratic
competence or professionalism (education & experience), [2] cohesion based on shared norms or a strong esprit de
corps, and [3] resources such as an adequate pay.
59
legal and administrative82 branches of government charged with the implementation
of public policy (Rothstein & Stolle 2002). This is the main reason why this study
focuses on the following two aspects of institutional quality, which are called procedural
quality in order to separate them from the second dimension of institutional quality (see
the next section): government efficiency and the extent of public sector corruption, i.e. abuse
of public office for private gain.
However, the commonly used aggregated measures of both government efficiency
and corruption are often found to be so highly correlated that it may be impossible to
include both at the same time in the same models due to the issue of collinearity. While
some studies have argued that government intervention in the economy and excessive
red tape generates corruption as a result of the consequent reduction in transparency
and competition (Kaufman & Wei 1999; Goel & Nelson 2010), other studies have
argued that corrupt actors often have incentives to create administrative barriers (or at
least preserve them) and longer handling times in order to collect larger or a greater
number of rents (Myrdal 1968). Consequently, because of this arguably very close
reciprocal relationship between inefficiency and corruption, this study will mainly be
using one single aggregated measure of procedural quality, namely an indicator of the
ability of the state to control corruption, which can also be interpreted as the perceived
extent of corruption in a society.
This has also been the strategy of other related studies such as the one by Mattias
Agerberg (2018, 1), who argues that corruption “is now understood […as] arguably the
most blatant example of poor institutional quality”. High public sector inefficiency
combined with low levels of corruption (especially petty), or high levels of corruption
together with high efficiency, seems like a very improbable scenario. An indicator of
the government’s ability to control corruption in an efficient manner is hence used in
this study as a proxy for both dimensions of institutional quality.
The decision to include a measure of corruption in this study is also motivated by
social learning theory (SLT; Bandura 1971). This theory assumes that exposure to signals
from the surrounding environment influences and shapes individual behavior by
differentiating common, and therefore often formally and/or informally acceptable,
behavior from socially deviant, often unacceptable or taboo, behavior (see also Akers
1998). People perceive that their fellow citizens react in a certain way in relation to the
dysfunctional environment and consequently the threshold and the shame of behaving
similarly becomes significantly smaller. In other words, “if everybody’s doing it, it
can’t be that bad”, becomes the way of reasoning among many when it comes to
82 However, as pointed out by Rothstein and Stolle (2002, 17), the high-level civil service may in fact be perceived as
partisan and as an extension of the elected public officials in many countries. One example of such a country is the
United States where high-level civil servants are indeed often politicized (Peters & Pierre 2004). Rothstein and
Stolle’s (2002, 16) factor analysis of confidence in various “political” institutions suggests that confidence in the civil
service falls under the same dimension as the institutions of the elected officials (the parliament, the government
and the political parties).
60
corruption in countries where corruption is very common. Research by Inge
Amundsen (1999, 5), among others, supports this theory and he argues that “as
corruption spreads, the social acceptance of it may also increase […, w]hen it is
generally understood that there is a climate of corruption, still more people will believe
it is inevitable and expected”.
The inability of the state to control the corrupt behavior of its administrators and
politicians, thereby providing clean public services and political processes, could
therefore increase the willingness to tolerate corruption through several different
causal pathways. Firstly, it may spawn a sense of inevitability. People might feel that
they have no choice but to accept corrupt and free riding behavior as a rational
response to an inefficient and corrupt institutional environment where you may feel
forced to pay a bribe to get anything done in a reasonable time. Secondly, people are
more likely to perceive that others behave in similar ways when confronted with
similar challenges in relation to the state, and this could further reinforce the feeling
that what they are doing is inevitable or even acceptable and just. Thirdly, the
government’s inability to keep corruption under check could further signal that high-
level politicians or even state institutions such as the courts are in the pockets of
affluent elites, which further erodes the state’s legitimacy. High-level corruption
involving large sums of money or other highly valuable resources might be compared
to the significantly smaller sums often involved in low-level corruption, and this
comparison could provide even deeper feelings of justification.
Some empirical evidence in support of the “rotting fish” thesis is provided in a very
recent study carried out by Nan Zhang (2017) on the determinants of accountability
norms. This study performed a laboratory experiment in the form of a corruption game
in order to elucidate if there are differences in the willingness to report bribery between
students originating from the northern regions of Italy on one hand and the southern
regions on the other (see section 2.1.4 in this chapter), and if these potential differences
are dependent upon the quality of the enforcement institutions. Zhang (2017, 12)
concludes based on the evidence from this experiment that there is very little to support
the notion proposed by the earlier discussed “raccomandazione” thesis that corruption
has a cultural base that promotes a tolerance of illicit behavior among Southerners in
Italy. There was no significant difference in reporting rates across different subgroups,
holding the institutional configuration constant (Zhang 2017, 11). However, there was
a significant institutional effect indicating that participants were more willing to report
bribery under strict enforcement, i.e. more efficient and credible enforcement
authorities that show a high responsiveness to grassroots monitoring.
Prior empirical evidence in support of this theorized negative (positive) relationship
between institutional quality and corruption tolerance (civic morality) is also provided
by Letki (2006, 321), who concluded based on evidence from 38 countries that quality
61
of government83 “is an important factor increasing the citizen’s civic morality”.
Meanwhile Pop (2012) found no significant relationship between the level of
(perceived) corruption84 and the acceptance of corrupt acts in 43 European countries,
and Kravtsova et al. (2016) came to a similar conclusion regarding control of corruption
and the justification of bribery in 95 countries.
Can high-quality institutions substitute anti-corruption norms?
While many scholars have argued that weak and dysfunctional public institutions
promote a tolerance of illicit behavior among ordinary citizens, some have also
suggested the possibility that individuals in countries with uncontrolled and endemic
corruption might be less tolerant of corrupt practices than their peers in countries with
higher quality institutions. Pop (2012, 30), for instance, argues that individuals in more
corrupt countries are more likely to perceive the unfair consequences of corrupt
practices which bestow valuable advantages on those that can afford them while
punishing those who cannot. Furthermore, they are also more likely to come in direct
contact with this type of unfair competition that could further reinforce their negative
feelings towards various forms of corruption.
Endemic grand corruption, uncovered in high-profile corruption scandals, could
result in a deep moral disgust towards such undemocratic and widely condemned
immoral practices, possibly resulting in widespread protests and anti-corruption
movements against corruption, as has been the case in many countries, with several
recent examples from Russia and Brazil. This point is also argued by Rasma Karklins
(2005) and Bo Rothstein and Daniel Eek (2009, 106), who state that their data “seems to
confirm the hypothesis that it is not the case that people who live in highly corrupt
societies come to morally accept corrupt behavior by public officials”. These people
could therefore have a higher tendency to officially condemn bribe taking, while still
feeling forced by “the system” to take part in it in one way or another.
Similarly, one might also imagine that citizens in “cleaner” countries where petty
corruption is considerably rarer and where confidence in authorities is generally
higher, might develop a more tolerant attitude toward such a “invisible” and rarely
noted phenomenon as corruption. If corruption and the negative consequences of
corruption remain hidden and out of sight from the ordinary citizen, it may instead
generate feelings of ambivalence or apathy towards such behavior, rather than anger
and antagonism. Many a citizen in the relatively corruption-free developed West may
not simply take these issues seriously due to the apparent lack of corruption in their
own vicinity.
83 Letki (2006) operationalized quality of government using a composite index consisting of four dimensions from
the Worldwide Governance Indicators (WGI): Government effectiveness, regulatory quality, rule of law and control
of corruption. 84 Operationalized using the Corruption Perception Index (CPI).
62
Empirical evidence that might support the argument that institutional quality could
be positively related to corruption tolerance is provided by Ting Gong, Shiru Wang
and Jianming Ren (2015), who based their analysis on an original survey conducted
among university students in Hong Kong and Mainland China. Results from this
survey, which compared perceptions of corruption, implied that “the Mainland
[China] students who hold weak formal institutions responsible for pervasive
corruption, instead of taking it as an excuse to forgive corrupt individuals, reckon on
personal power to fight corruption and, thus, show statistically less tolerance for
corruption in hypothetical scenarios” (Gong et al. 2015, 475). A lack of confidence in
public organizations could lead to feelings of great frustration with their incompetence
in keeping corruption levels down, and this might in turn result in feelings of a more
personal responsibility in regards to staying clean from corrupt practices and putting
pressure on others to stay clean. Meanwhile, students in Hong Kong, where the
government has claimed considerable fame for its anti-corruption accomplishments,
showed a tendency to push the responsibility of fighting corruption over to
government agencies such as the Independent Commission Against Corruption
(ICAC), resulting in displays of tolerance of individual corruption under certain
specific circumstances (Gong et al. 2015, 475-476).
The argument that corruption tolerance may be positively related to governmental
quality is also consistent with the findings of Peter Kotzian (2014) regarding civic
norms and law abidance. The study, which included 17 countries, found that “[h]igher
welfare spending [and governmental quality] substantially decreases the importance
assigned to abidance to laws” (Kotzian 2014, 72-73). One plausible explanation for this
finding could according to the author be a substitution process whereby developed
welfare states have effective institutions that substitute the civic norms needed for the
citizens to exercise control over the political system. Countries without an effective
“third party” control system that guarantees social order have a significantly greater
need for strong social norms (e.g. “thou shalt not steal”) that keep society from
descending into chaos and a “all for all” situation (Kotzian 2014, 74; Rothstein &
Uslaner 2005). Norms regarding law abidance and, presumably, that one should avoid
free riding on the public good should hence become significantly weaker in societies
where there are other alternative means of controlling citizen behavior and voluntary
norm abidance is not necessary to as high a degree.
However, this study finds the earlier discussed theoretical arguments and empirical
evidence concerning a potential negative relationship between institutional quality and
corruption tolerance more compelling, which leads it to formulate the following
hypothesis:
Hypothesis 5: Corruption tolerance tends to be higher in countries with a lower level
of procedural quality.
63
Does economic performance influence corruption tolerance?
As was discussed earlier, bureaucratic efficiency and the extent of public sector
corruption is likely to be highly correlated. However, instead of using a separate
aggregated measure for the government efficiency dimension, this study will utilize a
different kind of proxy that is not as clearly related to governmental quality or
performance as the previously discussed aggregate measures. This indicator may or
may not actually be a result of the efficiency or quality of the public sector, but more
importantly, the citizens are likely to perceive it as a prominent indicator of government
efficiency and legitimacy, namely a country’s economic performance (Newton 2006;
Easton 1965).
As argued by Letki (2006, 310), “[e]conomic growth is a basic criterion of a
government’s efficacy, thus influencing government’s legitimacy”. A recent economic
decline, not to mention an actual economic crisis, may have a negative impact on citizen
confidence in the ability of the state to govern the economy and reduce poverty, which
in turn may reduce the general willingness to abide by the law and stay clear from
using bribes or other corrupt tactics. The inability of the state to uphold its end of the
bargain in the “social contract” by providing economic opportunities to its citizens may
in turn cause them to rebel against the social order upheld by the state, thus resulting
in a higher frequency of free riding behavior.
Some empirical evidence in support of this potential relationship between economic
performance and civic norms is provided in both Kotzian (2014) and Letki (2006). While
Kotzian finds that economic performance in the form of recent GDP growth has a
positive effect on law abidance and civic engagement, Letki meanwhile finds that
citizens living in low-unemployment countries have a significantly higher level of civic
morality.
Based on the previous discussion regarding the impact of economic performance on
corruption tolerance the following hypothesis is formulated:
Hypothesis 6: Corruption tolerance tends to be higher in countries with a poor
economic performance.
However, the study also expects procedural quality to have a greater likelihood of
having an impact on corruption tolerance due to the more long-term or “sticky” effects
of poor institutional quality, which tends to be more stable than economic performance.
64
2.4 The moderating effect of dysfunctional contexts
Previous sections have mostly discussed potential direct effects of a. bureaucratic
distrust and b. various indicators of state dysfunctionality. The aim of the present
section is to discuss potential moderating effects of the previously presented indicators
of dysfunctional societies on the earlier proposed association between bureaucratic
distrust and corruption tolerance.
Even though the potential direct effect of, for instance, socio-economic development
or economic inequality on attitudes toward corruption is likely to be weak or non-
significant85, there may still be significant indirect effects through bureaucratic distrust,
which was earlier argued to be a key predictor of socially deviant behavior. The key
question of this section is therefore: Under what conditions is bureaucratic distrust
more likely to be associated with corruption and free riding condoning attitudes?
The following section will discuss the indirect effects in the same order as in the
previous section concerning the direct effects, beginning with socio-economic
development. Many of the arguments are closely related to the ones in the previous
section, so this study will strive to keep them short to avoid repeating itself. First,
however, the section starts by briefly elaborating on why this study has opted to
include so-called cross-level interactions in its models.
Why include cross-level interactions?
Most studies have assumed that the impact of institutional trust is uniform across cases
(e.g. Letki 2006; Pop 2012; Kotzian 2014). However, a few studies have noted that the
correlation between institutional trust and corruption tolerance tends to be
significantly weaker in some countries such as the ones in Latin America (Blake 2009;
Andrews 2008).
Studying corruption tolerance or civic morality is a very complicated task, especially
if one also aims at explaining differences between different countries and/or periods.
Very few respondents admit to finding for instance bribe taking acceptable, which
means that the measure of corruption tolerance is highly skewed, and this fact pertains
to most countries and time period from whence there is data available. Consequently,
there is quite a limited variation in corruption tolerance between different countries, a
factor that makes it difficult to explore the effects of various contextual factors that
previous studies have linked with various kinds of corruption. The limited variation in
the data combined with the limited number of higher-level cases available makes it
simply very difficult to find significant differences.
In order to deal with this complicating factor this study has decided to include cross-
level interactions in its models to see if the contextual factors have indirect effects
85 The effects are likely to be weak due to the limited variation in the dependent variable.
65
through its key individual level variable “Bureaucratic distrust”. As was mentioned
earlier, this study does not consider institutional trust to be a cause of attitudes toward
civic norms regarding free riding, but rather a correlate or a symptom due to their
endogeneity. Both bureaucratic distrust and corruption tolerance are likely to be
caused by other, and as this study would argue, similar exogenous forces or shocks. If
the previously discussed contextual factors really are sources of uncivic attitudes and
values, then it could be expected that the correlation between bureaucratic distrust and
corruption tolerance is stronger in such contexts where the deep distrust of the state
institutions actually stems from extensive poverty, inequality, and poor institutional
quality and performance. For instance, in countries with extensive public sector
corruption, i.e. low procedural quality, it could be expected that the relationship
between bureaucratic distrust and corruption tolerance is significantly stronger than in
countries with a high institutional quality such as the Scandinavian countries.
However, based on the theoretical importance of prevailing citizen expectations
highlighted in other studies (e.g. Ariely & Uslaner 2017), it could also be the case that
the association is significantly weaker in the previously mentioned contexts.
One important reason why it is worthwhile to include cross-level interactions is that
it may illuminate under what conditions bureaucratic distrust is most strongly related
to corruption tolerance. For instance, one could argue that in contexts where the
association between bureaucratic distrust and corruption tolerance is very weak or
even completely absent, traditional approaches to civil service reform and other efforts
that aim to increase confidence in public institutions are more likely to fail in boosting
civic morality. In such cases it may be more important to focus on other relevant factors,
such as alleviating poverty or inequality.
2.4.1 The moderating effect of socio-economic development
Earlier it was hypothesized that corruption tolerance tends to be higher in less
developed countries where people live in less secure environments where bribe giving
and patronage may become a way of dealing with this insecurity. However, does this
(also) reflect as a contextual effect on the trust-corruption tolerance relationship? Does
the relationship between institutional trust and corruption tolerance differ depending
on the level of socio-economic development in a country?
One could expect the correlation between bureaucratic distrust and corruption
tolerance to be stronger in socio-economically more developed countries, where
citizens are more likely to lack personal experience of the negative consequences of
corruption and free riding. A high confidence in authorities in highly corrupt countries
could furthermore be a sign of support for the government in general and the
widespread occurrence of clientelism or vote buying. Participation in clientelistic
66
networks could foster more condoning attitudes towards certain types of corrupt
behavior such as bribe taking and nepotism, not least if it relates to the behavior of the
patron himself or his associates. Studies have most commonly associated clientelism
with developing country settings and poorer voters who are more susceptible to
clientelist offers (Hicken 2011, 299). This could potentially indicate that highly trusting
individuals tend to be more permissive of corrupt behavior in countries with low levels
of economic development and widespread clientelistic networks.
Distrusting citizens perceive more public corruption than their more trusting peers
in both highly developed and less developed countries. However, their reactions to this
perceived corruption are argued to differ in the different contexts: The distrusting ones
in the less developed countries are argued to adapt a more tolerant attitude towards
corruption than their brethren in the wealthy countries, who (at least partly) have
adopted more postmaterial values that advocate equality and fairness.
Hypothesis 7: The association between bureaucratic distrust and corruption tolerance
is weaker in less developed societies.
2.4.2 The moderating effect of economic inequality
Earlier this study hypothesized about the potential direct effects of economic inequality
on the general attitude towards corrupt and uncivic behavior. Highly unequal societies
were assumed to be more tolerant of corrupt acts than societies that have a more equal
division of resources and opportunities. However, what about possible indirect or
moderating effects of economic inequality on the relationship between this study’s key
individual-level variable, bureaucratic distrust, and corruption tolerance? Are citizens
who are more distrusting of public institutions more or less likely to justify acts of
corruption in societies with high levels of economic inequality?
There are at least two hypothetical reasons why the relationship between
bureaucratic distrust and corruption tolerance could vary across different contexts of
(in)equality, the first having to do with the prevailing expectations of citizens and the
second with the question “Who are the stakeholders in a corrupt system?”.
Firstly, one could imagine that the association between bureaucratic distrust and
corruption tolerance could be stronger in societies with a highly unequal distribution
of resources and opportunities if citizens attribute this inequality to the unfairness and
partiality of the public institutions and accordingly perceive them as illegitimate
(Rothstein 2011; Tyler 2006; see earlier sections). However, in theory the association
between these two micro-level factors could also be weaker in highly unequal societies
due to differences in expectations regarding the behavior of public authorities such as
the police or, more precisely, an adjustment to prevailing circumstances. Long historical
67
experiences of high levels of economic inequality and endemic corruption could
potentially mean that the citizens of these kinds of societies have become socialized not
to expect fair and evenhanded treatment from public authorities (Ariely & Uslaner
2017; Uslaner 2008). They become demoralized and see corruption as something that is
inevitable and beyond their control, albeit not necessarily acceptable. Their lack of
expectations may instead suggest that the honesty and performance of public
institutions such as the police, which they perceive to be in the pocket of a rich
minority, does not have a significant impact on their own personal morality (Andrews
2008, 178; see also next section).
Meanwhile, citizens in societies with a relatively equal distribution of resources are
claimed to hold greater expectations (and demands) regarding their public institutions
and officials (Ariely & Uslaner 2017; Uslaner 2008). They see unfair treatment as, in the
words of Gal Ariely and Eric Uslaner (2017, 350), “a violation of the integrity of the
governmental system”. Societies with relatively low levels of inequality have a
significantly greater growth potential for inequality that can be blamed on the
hypothetical corrupt behavior of elites. A loss of confidence in the public institutions
could therefore potentially have a significantly larger negative impact on the
legitimacy of these institutions in the eyes of the citizens in more equal contexts than
in the previously discussed highly unequal ones. This negative impact would in turn
based on earlier arguments be related to a higher tendency to condone low-level
corruption and free riding.
The results of Ariely and Uslaner’s (2017) recent empirical study of 31 countries
suggest that people who perceive unfair treatments are considerably more likely to
perceive (grand) corruption and that these perceptions are higher in more unequal
countries. However, the results also indicate that “[t]he impact of fair treatment on
corruption perceptions is much greater in more equal countries, where people are far
more likely to expect fair treatment” (Ariely & Uslaner 2017, 358). The authors therefore
conclude that perceptions of fair treatment are less important in highly unequal
societies.
Secondly, in theory one could even expect the relationship between bureaucratic
distrust and corruption tolerance to be the opposite of the earlier hypothesized one in
highly unequal societies due to the following reason.
Corruption can be perceived as an informal institution or rather a system of informal
institutions. As argued by Fukuyama (2011, 526) “[a]ny institution or system of
institutions benefits certain groups in a society, often at the expense of others, [… and
t]hose elite groups [who] have a stake in existing institutional arrangements […] will
defend the status quo as long as they continue to remain cohesive”. Groups that benefit
from corrupt arrangements within public institutions, i.e. stakeholders, are arguably
more likely to possess a greater confidence in these institutions than those who do not.
Conversely, those who suffer the most from the consequences of corruption in highly
68
unequal societies, i.e. the poor majority that lacks the means to benefit from corruption,
are likely to be relatively less tolerant and more welcoming of institutional change and
tighter control. Consequently, there could exist a wealthy minority with a privileged
access to power, a (relatively) high confidence in the corruptible authorities, and a
higher than average tolerance of corrupt practices. However, this group could include
some lower SES individuals too who benefit from clientelistic arrangements.
Based on these arguments, one could therefore expect the effects of distrusting
attitudes towards implementing institutions to vary across societies with differing
degrees of economic equality. More specifically, this study expects the level of
bureaucratic distrust to matter less in highly unequal societies where corruption
tolerance is generally higher. The following hypothesis is hereby formulated:
Hypothesis 8: The association between bureaucratic distrust and corruption tolerance
is weaker in highly unequal societies.
2.4.3 The moderating effect of institutional quality and economic
performance
In addition to exploring the direct effects of institutional quality on corruption
tolerance, this study is also interested in possible interaction effects between
institutional trust and institutional quality. Does the relationship between confidence
in implementing institutions and corruption tolerance differ depending on the
institutional quality?
Theoretically, one could imagine that the relationship between bureaucratic distrust
and corruption tolerance could be weaker, or even the opposite, in countries with a low
institutional quality or performance due to similar reasons as discussed in the previous
section, namely expectations among the public and the occurrence of significant
stakeholder groups that benefit from a corrupt system either directly or indirectly.
Christina Andrews (2008) notes in her bivariate analysis of the correlation between
confidence in institutions and civic morality in 30 countries that the Latin American
countries showed the weakest correlations. Moreover, she also notes that this group
has the highest number of correlations in the opposite direction, i.e. that a higher
confidence is related to a lower civic morality. The author speculates that “[o]ne
explanation for these results is that in Latin America public institutions are still too frail
to impact the civic morality of their citizens” (Andrews 2008, 178, emphasis added).
Thus, she arrives to the conclusion that confidence in institutions and civic morality
only seem to be related in Western democracies and in post-communist countries,
while factors such as inequality or unemployment matter more in explaining civic
morality in developing countries. People from countries with long histories of “frail”
69
institutions do not generally come to expect neither impartiality nor efficiency from the
public institutions, and are therefore not as deeply affected, at least with regard to their
own civic morality, when confronted by corruption and unprofessionalism among
public administrators as those who expect more from their public institutions.
This “adjustment-hypothesis”, which was also discussed in the previous section, is
consistent with the empirical observations from a recent survey in the Western
Balkans86 concerning citizens’ opinions of the police. The survey finds that “[t]he
perception of high corruption of the police survives simultaneously with a relatively
high level of trust, which may indicate reconciliation with the fact that corruption is
omnipresent in the institutions, and that citizens have become accustomed to it as an
inevitable segment of public administration” (Mandić 2017, 22). Furthermore, one
could also theoretically argue that a low confidence in public institutions could
correlate with less tolerant attitudes toward corrupt behavior and that this might
especially be the case if a low confidence in government is a result of perceived
corruption within the government or in society in general. Those unable to reap the
rewards of a corrupt system, and who only suffer the costs, are arguably less likely to
both trust the authorities and tolerate corrupt behavior.
Distrusting citizens in countries with high quality institutions, meanwhile, are
considerably less likely to have any personal experience of (petty) corruption and a
clear picture of its detrimental consequences. They are therefore less likely to hold as
negative a view of this more “alien” phenomenon because, as was discussed earlier,
efficient institutions may have substituted at least to some degree their anti-corruption
norms (Kotzian 2014).
Moreover, due to the more sophisticated and clandestine forms that corruption
tends to take in advanced democracies with well-consolidated institutions such as the
Nordic countries (Erlingsson et al. 2014; Andersson 2017), it does not automatically
follow that the public sectors in these countries are perceived by their citizens as less
corrupt and more trustworthy. Gissur Erlingsson, Jonas Linde and Richard Öhrvall
(2014) demonstrate that there is quite a large distrust towards public officials in the
aforementioned countries, and that relatively many citizens, especially in Sweden and
Iceland, do not believe that public officials treat citizens fairly (see also section 2.1.2 of
this chapter). Additionally, the scholars observe a link between perceptions of
dishonest bureaucrats and dissatisfaction with the performance of the political system
(Erlingsson et al. 2014, 114). This potent combination of high expectations and
perceptions of unfair and partial treatment could together contribute in producing the
kinds of attitudes that are of interest in this study.
Based on these theoretical arguments and empirical observations, this study expects
the positive effect of bureaucratic distrust on corruption tolerance to be weaker in
86 Albania, Bosnia and Herzegovina, Montenegro, Kosovo, Macedonia, and Serbia.
70
countries with a poor institutional quality, which encompasses on one hand procedural
quality (extent of corruption and level of efficiency) and on the other hand economic
performance. However, just as was noted earlier, the study also expects procedural
quality to have a greater likelihood of having an impact due to the more long-term or
“sticky” effects of poor institutional quality on public mentality. The following
hypothesis is hereby formulated:
Hypothesis 9a: The association between bureaucratic distrust and corruption tolerance
is weaker in countries with a low procedural quality (high corruption and inefficiency)
and poor economic performance.
Furthermore, in addition to examining the cross-level interaction effect between the
individual-level indicator of confidence in the bureaucratic institutions and a measure
of country-level perceived corruption, this study will also investigate whether there is
an interaction effect between the former variable and the micro-level measure of self-
perceived extent of corruption among public officials.
This study expects there to be a similar interaction effect as with the macro-level
corruption indicator. The level of confidence in public authorities should not matter to
as high a degree when it comes to explaining the level of corruption tolerance of
individuals who perceive that almost all public officials are engaged in corruption.
Both those citizens who have a high confidence and those who have a low confidence
have come to expect corruption and inefficiency as something almost approximating
normality, at least to some degree. Citizens with a high confidence who perceive no or
almost no corruption, on the other hand, are more likely to hold very high standards
when it comes to corrupt or deviant behavior. They hold clear expectations of both
impartiality and efficiency from their public institutions. The following final
hypothesis is thusly formed:
Hypothesis 9b: The association between bureaucratic distrust and corruption tolerance
is weaker among individuals who perceive a greater extent of public corruption.
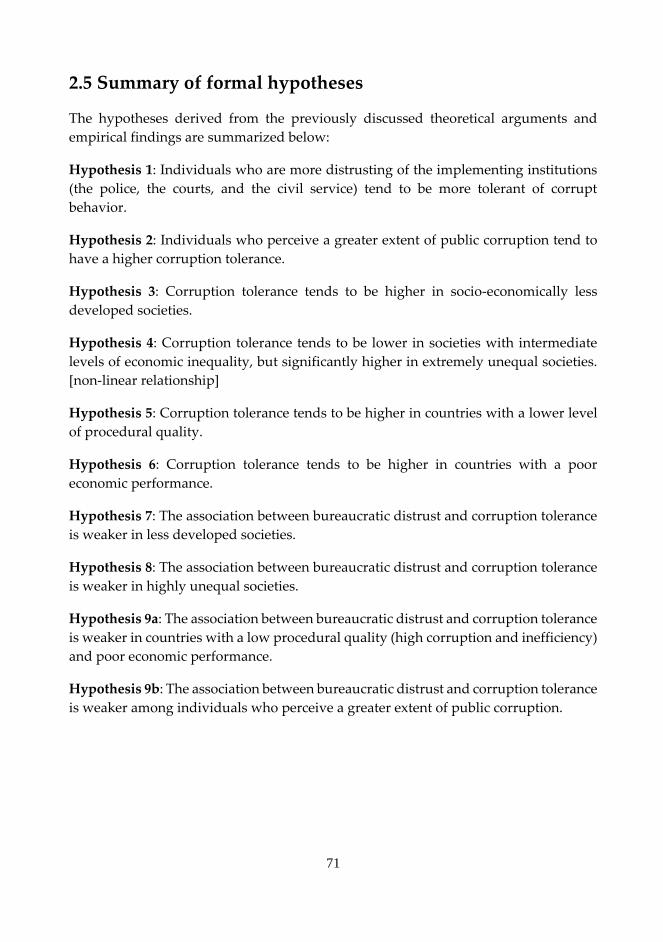
71
2.5 Summary of formal hypotheses
The hypotheses derived from the previously discussed theoretical arguments and
empirical findings are summarized below:
Hypothesis 1: Individuals who are more distrusting of the implementing institutions
(the police, the courts, and the civil service) tend to be more tolerant of corrupt
behavior.
Hypothesis 2: Individuals who perceive a greater extent of public corruption tend to
have a higher corruption tolerance.
Hypothesis 3: Corruption tolerance tends to be higher in socio-economically less
developed societies.
Hypothesis 4: Corruption tolerance tends to be lower in societies with intermediate
levels of economic inequality, but significantly higher in extremely unequal societies.
[non-linear relationship]
Hypothesis 5: Corruption tolerance tends to be higher in countries with a lower level
of procedural quality.
Hypothesis 6: Corruption tolerance tends to be higher in countries with a poor
economic performance.
Hypothesis 7: The association between bureaucratic distrust and corruption tolerance
is weaker in less developed societies.
Hypothesis 8: The association between bureaucratic distrust and corruption tolerance
is weaker in highly unequal societies.
Hypothesis 9a: The association between bureaucratic distrust and corruption tolerance
is weaker in countries with a low procedural quality (high corruption and inefficiency)
and poor economic performance.
Hypothesis 9b: The association between bureaucratic distrust and corruption tolerance
is weaker among individuals who perceive a greater extent of public corruption.
72
PART TWO
Research design, results, and conclusions
73
3. Research design
This chapter presents the research design used in this study, beginning with a
discussion concerning the way the variables are operationalized. After this discussion
follows an illustrated figure of this study’s research model and a detailed description
of the method of analysis. Lastly, the sources of data utilized in this study are
presented.
3.1 Operationalization of variables
The chapter begins by discussing how the variables are operationalized, starting with
the dependent variable, corruption tolerance, and then moving on to the micro- and
macro-level predictors. The data for all macro-level predictors included in this study
originate from at least one or a couple of years prior to the survey occasion when the
phenomenon of interest, corruption tolerance, was measured.
3.1.1 Dependent variable: Corruption tolerance
One problem, which needs to be settled before an attempt is made to answer the earlier
listed research questions, is how can the earlier conceptualized and defined
phenomenon of interest in this thesis, low-level corruption tolerance (see Chapter 1,
section 1.2), be operationalized?
A review of previous studies related to this one reveals that two different strategies
have mainly been utilized in the literature that has applied quantitative methods in an
attempt to elucidate the determinants of corruption tolerance both within and across
different societies. The first one has employed an index constructed by Alejandro
Moreno (2002) while the second one has made use of a single survey item. Both
strategies will now be briefly discussed, starting with the index-based
operationalization strategy, and rounding off with a discussion regarding which one
of these two strategies (in a modified form) is the main strategy utilized in this thesis.
Moreno’s (2002) solution to the problem of how to measure corruption tolerance is
the construction of an index, which he chooses to call an “index of corruption
permissiveness”, based upon four different questions asked in the World Value Survey
(WVS). In his article, Moreno (2002, 3) defines corruption permissiveness as “the extent
to which individuals tend to justify certain practices that can be considered to be corrupt”. The
questions from the WVS that form the backbone of the index are based on the extent
74
that individual respondents are prepared to justify the acts or behaviors included in
the following four survey items:
[1] “claiming government benefits to which you are not entitled”,
[2] “avoiding a fare on public transport”,
[3] “cheating on taxes if you have a chance” and
[4] “accepting a bribe in the course of their duties”,
on a scale from 1 to 10 were 1 indicates that the corrupt practice is “Never justifiable”
and 10 indicates that it is “Always justifiable” (Moreno 2002, 4).
Other researchers such as Roberta Gatti, Stefano Paternostro and James Rigolini
(2003) have chosen a slightly different, more parsimonious, strategy for the
operationalization of corruption tolerance. They decided to only utilize the question
concerning whether they think that “someone accepting a bribe in the course of their
duties” can always be justified, never be justified, or something in between, as a proxy
for the respondent’s attitude toward such rule-breaking and explicitly corrupt
behavior. However, as argued by some scholars, there are at least three advantages to
using a multi-item index of corruption tolerance instead of just a single-item one
(Williams & Martinez 2014).
Firstly, it may be difficult for a single-item question to adequately capture different
inter-related aspects of the earlier defined concept of corruption tolerance and it may
furthermore be negatively affected by random errors in measurement. Secondly, errors
tend to be averaged out in a multi-item index, which indicates a greater reliability.
Thirdly, a multi-item index pools together information that the different items have in
common, and is therefore likely to produce superior score reliability (Williams &
Martinez 2014). Moreover, as we saw in earlier discussions (Johnston 2005, 2014;
Andersson 2017; see Chapter 2, section 2.1.2), some scholars have argued against a
unidimensional measurement of corruption (and, indirectly, corruption tolerance)
with a focus on bribery. Previous research has shown that corruption varies greatly in
both form and scale, and some forms of corruption are more common in certain types
of societies (or parts of societies, e.g. sectors or government levels) than in others
(Johnston 2005, 2014). Bribery, for instance, is more common in economically less
developed societies where civil servants are poorly remunerated, while it is relatively
rare in advanced post-industrial societies, such as the Nordic countries, where “undue
influence” or “conflict of interest” or other more “gray” forms of corruption are more
frequent (Andersson 2017).
Certain forms of corruption are furthermore more morally ambiguous than others
and can arguably be placed on several different points on a lengthy “moral scale” that
goes from one extreme to another. For instance, some would probably argue that
bribery, or at least the high-level type involving larger sums, is more morally
75
repugnant than for instance nepotism, where a person in a position of power favors
their kin. Similarly, in accordance with the broad definition of corruption adopted in
this study, many would probably argue that the abuse of entrusted power is a
considerably worse crime than a simple abuse of public resources perpetrated by
ordinary citizens. Of course, the “level of immorality” of an act is arguably also highly
dependent on many contextual factors, such as who are the potential victims and how
many are there, the extent of the direct and indirect damage, and what was the purpose
of the act (self-enrichment, support to a party or family member/friend, ideological,
etc.) (Etzioni 2017).
Exclusively focusing on the act of bribery, the most clear-cut form of corruption in
the modern sense of the word, and tolerance thereof, would result in too narrow a view
of the broader phenomenon of corruption. Hence, this would miss many important
nuances of the more and less sophisticated forms of corruption, which can have very
serious consequences, especially when aggregated (Dobel 1978; Andersson 2017).
When constructing indices that aim to measure specific social or political
phenomena it is inevitable that some measurement problems will arise. One such
problem highlighted by Moreno (2002, 4) himself is that the answers to the previously
mentioned survey questions might be contaminated with social desirability biases,
which signifies that it may be difficult for respondents to answer truthfully to the
questions due to a fear of being judged and frowned upon by their surrounding society
and peers in particular. Despite this problem, Moreno still judges that the additive
index allows for sufficient cross-country and cross-regional variation, thus allowing us
to come to some conclusions. Other survey-based studies that have used similar
questions regarding various hypothetical scenarios agree that these measures have face
validity, and that they suffer less from social desirability bias than more direct
questions regarding a person’s involvement in corruption and other forms of unethical
behavior (Tavits 2010, 1262).
In order to maximize the limited variance and deal with the skewness of the
dependent variable, this study has decided to chiefly utilize a heavily modified version
of Moreno’s index of corruption permissiveness, which is also utilized by Pop but with
a different scale. Instead of aggregating all four items as they are and taking the average
value, this study will follow the same path as Pop (2013, 31) and recode all four scales
so that all respondents who answered that the four corrupt practices were justifiable to
some degree receive a value of 1 while those who declared them “never justifiable”
receive a value of 0.
A reliability analysis reveals that the four items have a Cronbach’s Alpha of 0.807 in
the full sample, which indicates that respondents scoring high on one variable tend to
score high on all four. The recoded items are then computed into a 5-pointed
summative scale that measures the acceptance of corrupt practices and varies between
the scores 0, 25, 50, 75 and 100, where a higher value indicates a greater tolerance (see
76
Chapter 4, Figure 4.1). However, the study will also strive to control the robustness of
its results using various alternative measurement strategies, including Moreno’s
original corruption permissiveness index.
The average score on the corruption tolerance index for the entire pooled sample is
38.3 (SD = 38.3) but there is quite a large variation across different countries and
country-waves, with the lowest country/country-wave average in Bangladesh
(5.6)/Bangladesh (4th Wave, 3.5) and the highest in the Philippines (64.2)/ India (6th
Wave, 78.6).
3.1.2 Independent variables and control variables
The aim of this section is to describe the operationalization of the independent
variables and the control variables included in this study. The section begins by looking
at how the individual- or micro-level variables are operationalized.
3.1.2.1 Micro-level variables
Bureaucratic distrust
Bureaucratic distrust is operationalized using an aggregated measure of institutional
trust. Earlier studies have demonstrated that all the different trust judgements
concerning both political and implementing institutions generally can be added into
one single scale that measures institutional trust (see e.g. Marien 2011).
However, as was mentioned earlier in this study (see Chapter 2, section 2.2.2), there
is evidence of covariance87 between the trust judgements regarding the implementing
institutions, which compels this study to aggregate these into an index of bureaucratic
distrust. A reliability analysis reveals that the Cronbach’s Alpha of a scale containing
the three items (trust in the police, courts, and civil service) is 0.743, which indicates
that respondents scoring high on one variable tend to score high on all three. The scale
of this index run from zero to 10, where a higher value indicates a greater mistrust
towards public officials or organizations.
Unfortunately, the question that measures people’s confidence in the courts is
missing in wave 4 (2000 – 2004) of the World Values Survey, resulting in a loss of both
countries and country-waves. This study has therefore decided to only include the
items regarding confidence in the police and the civil service in order to maximize the
87 Marien (2011, 18) notes some covariation between the police and the legal system “due to sources other than [a]
general attitude of “trust in political institutions””.
77
number of higher-level units. This indicator is treated as a continuous variable with a
scale that ranges from zero to one where one indicates a complete lack of confidence.
However, this study will also perform its analyses using the three-item index and
report if there are any substantial differences in the results.
The average score on the bureaucratic distrust index for the entire pooled sample is
0.5 (SD = 0.25), but there is quite a large variation across different countries and
country-waves, with the lowest country/country-wave average in Uzbekistan
(0.19)/Vietnam (5th Wave, 0.18) and the highest in the Dominican Republic
(0.7)/Argentina (4th Wave, 0.75).
Self-perceived extent of public corruption
Perceived extent of public corruption is operationalized using the following question
in wave 3 of the World Values Survey: “How widespread do you think bribe taking
and corruption is in this country?” (1 = Almost no public officials engaged in it; 2 = A
few are; 3 = Most are; 4 = Almost all public officials are engaged in it). This item will
initially be treated as a dichotomous variable that varies between zero (almost none or
a few are engaged) and one (most or almost all are engaged) in the micro-level analysis.
Later on, it is treated as a continuous variable with a scale that ranges from zero to one
where one indicates a high level of self-perceived corruption in the interaction analysis.
The average score (in original metrics) on this micro-level corruption perception
indicator is 2.9 (SD = 0.8).
Micro-level controls
Socio-economic status
Six different standard questions in the WVS regarding socio-economic status (SES) are
included in the analyses as individual-level controls: Age, gender, income, education,
marital status, and employment status.
Age is included because aging is often argued to be strongly related to people’s
attitudes toward rule breaking or deviant behavior. A person’s age is argued to have
an effect through either some type of socialization effect where people acquire greater
social stakes as they grow older, thereby becoming more reluctant to risk losing hard-
earned resources (the desistance theory), or through some biological process where the
aging of the organism affects individual behavior (the aging theory, Gottfredson &
Hirschi 1990).
Gender is likewise included due to the frequently observed greater aversion towards,
and lesser involvement in, corruption, tax evasion, and other kinds of rule breaking
behaviors observed among women. This in turn is claimed to be either due to
78
differences in nature between men and women, where men are more competitive and
risk-taking than women, or due to differences in opportunity structure, where men are
more often in direct contact with public authorities (Torgler & Valev 2010).
Income is included due to the assigned importance of the amount of resources
available to invest in corrupt activities or, alternatively, to cope with unsecure
conditions. High-income individuals may on one hand have more opportunities to
behave corruptly, but low-income individuals may on the other hand perceive
corruption as a personal security mechanism (Jaime-Castillo & Martinez-Cousinou
2012). More affluent individuals are furthermore argued to have a higher likelihood of
cheating in order to attain private benefits and further increase their resources, due to
a sense of greed where affluence begets a sense of self-entitlement and a feeling of being
“above the law” in some cases (Grundmann & Lambsdorff 2017).
Education is controlled for due to the simple reason that education is claimed to foster
civic values and attitudes and increase understanding about the negative consequences
of bribery and other similar behaviors (Uslaner & Rothstein 2016).
Finally, Marital status and Employment status are included partly because of the same
reasons as age, i.e. higher social stakes: Those who are married or/and are employed
may risk their marriage, job and social status if they choose to behave in a corrupt and
dishonest way (Kravtsova et al. 2017).
Age and income are treated as continuous variables and grand mean centered in the
analyses. Some of the initially categorical variables are transformed into dummy
variables in order to facilitate the estimations. Gender was recoded so that the
respondent receives a one if the respondent is female and zero if the respondent is male.
Education was transformed so that the respondent receives a one if he or she has a
university degree and a zero for all other educational levels. Marital status was
transformed so that the respondent receives a one if the respondent is married and zero
otherwise. Employment status is transformed so that the respondent receives a one if the
respondent is unemployed and zero if the respondent has another employment status.
Religiosity
In addition to the previously discussed standard controls for socio-economic
characteristics, it was also judged necessary to include a simple measure of how
religious a respondent perceives him or herself to be. Corruption tolerance and civic
morality tends to be viewed as “a manifestation of individuals’ broader moral code”
(Letki 2006, 315), and is thereby intimately linked with religion, which generally tends
to condemn corrupt and socially deviant behavior (Beets 2007), and religious values
that should be controlled for.
The indicator of religiosity used in the current study is based on the WVS survey
item asking “How important is God in your life?” on a scale of one (“Not at all
79
important”) to 10 (“Very important”), which is treated as continuous and recoded to
range from zero to one.
Generalized trust
As a final micro-level control, this study will include the often-used proxy for social
capital, i.e. the level of generalized trust. People with a high generalized trust are often
argued to have a greater tendency to cooperate with other people outside their own in-
groups, and are thereby seen as less likely to free ride on the public good and turn to
corrupt practices (Uslaner 2004).
This variable is operationalized using the standard survey question used to measure
social capital in the literature: “Generally speaking, would you say that most people
can be trusted or that you need to be very careful in dealing with people?”, which is
recoded to range between zero (“Most people can be trusted”) and one (“Need to be
very careful”).
3.1.2.2 Macro-level variables
Socio-economic development
The widely used term “development” (and “poverty” for that matter) is rather fuzzy
and there is an extensive debate among scholars regarding the correct way of
operationalizing this phenomenon (see e.g. Milenkovic et al. 2014).
The commonly used gross domestic product (GDP) per capita measure has received
a lot of criticism due to its alleged narrowness and inability to capture other important
non-economic dimensions that are argued to be important determinants of the
wellbeing of populations, such as happiness, life expectancy, access to education,
internet connectedness or gender equality. Economic growth alone is widely argued to
be insufficient as an indicator of how developed a certain society is or how capable its
citizens are in comparison to other societies’, which is why this study has opted to use
the term socio-economic development rather than mere economic development.
However, despite the previously mentioned criticism directed towards this
measure, this study has still decided due to reasons of data availability to mainly utilize
GDP per capita, which is “the sum of gross value added by all resident producers in
the economy plus any product taxes and minus any subsidies not included in the value
of the products” divided by midyear population (The World Bank [2]).
The data for this variable are retrieved from a secondary source88, the V-Dem
extended dataset (2018), and it has been transformed by taking the natural logarithm
88 The original source is the Maddison Project Database (2018).
80
(ln). An alternative, education-based development indicator will also be used to control
the robustness of the findings. The Education index, which is an integral part of the
widely used Human Development Index, is calculated using mean years of schooling
and expected years of schooling (UNDP 2018).
The data for this variable in turn originate from the United Nations Development
Programme’s (UNDP) Human Development Reports. The scale of both development
indicators have been recoded to range from zero to one in order to facilitate
interpretation.
The average GDP per capita (in $) for the entire pooled sample is 8817.14 (SD =
7669.20) but there is a very large variation across different countries, with the lowest
country/country-wave average in Tanzania (4th Wave, 534.76) and the highest in the
United States (5th Wave, 30199.81).
Economic Inequality
Economic inequality is operationalized in this study using the standard measure of
inequality, the (income based) Gini index, which measures how unequal the
distribution of income is as a Gini coefficient on a scale from zero to 100. The data for
this variable originate in part from both the V-Dem extended dataset (2018) and the
UNU-WIDER (2017) World Income Inequality Database (WIID). The scale of this
variable has been recoded to range from zero to one in order to facilitate interpretation.
The average original score on the income based Gini index for the entire pooled
sample is 39.39 (SD = 9.86) but there is a relatively large variation across different
countries, with the lowest country/country-wave average in Slovakia (19.45)/(4th Wave,
534.76) and the highest in Zimbabwe (73.3) (5th Wave, 30199.81).
Institutional quality and economic performance
Procedural quality
Procedural quality, i.e. the efficiency and “cleanliness” of government activities, is
operationalized using different measures of efficiency and corruption, two of which
are retrieved from the Worldwide Governance Indicators (WGI; The World Bank [3])
project, a set of cross-country indicators of governance developed by Daniel
Kaufmann, Aart Kraay and Massimo Mastruzzi (2010). The WGI measure governance
in over 200 countries since 1996 and consist of six broad dimensions of governance:
“Voice and Accountability”, “Political Stability and Absence of Violence/Terrorism”,
“Government Effectiveness”, “Regulatory Quality”, “Rule of Law” and “Control of
Corruption”.
This study has chosen to utilize two of the six governance indicators in its empirical
analyses, namely Government Effectiveness (GE) and Control of Corruption (CC).
81
The former indicator captures “perceptions of the quality of public services, the quality
of the civil service and the degree of its independence from political pressures, the
quality of policy formulation and implementation, and the credibility of the
government's commitment to such policies”. The latter in turn captures “perceptions
of the extent to which public power is exercised for private gain, including both petty
and grand forms of corruption, as well as "capture" of the state by elites and private
interests” (Kaufmann et al. 2010, 4). As can be inferred from the two previous
quotations, the chosen indicators are based exclusively on subjective assessments of
public sector efficiency and corruption, gathered from various household, firm and
expert surveys.
There are three reasons why Kaufmann et al. (2010, 17-18) decided to use perception-
based measurements of governance. The first reason is that the behavior of agents is
influenced by how they perceive reality. The authors argue that “[i]f citizens believe
that the courts are inefficient or the police are corrupt, they are unlikely to avail
themselves of their services”89 (Kaufmann et al. 2010, 18). Investors are similarly more
likely to base their investment decisions on expert evaluations and perceptions of
reality rather than on actual cold hard facts. The conclusion is thusly that perceptions
influence reality and therefore possess intrinsic value.
The second reason is that there are very few real alternatives when assessing some
important questions or phenomena related to governance. Corruption, for instance, is
a very illusive phenomenon that does not leave a lot of concrete evidence due to its
illegal nature. This makes it almost impossible to objectively measure some aspects of
governance (Kaufmann et al. 2010, 18). The third and final reason mentioned by the
authors is that available objective data tend to capture so-called “official” or de jure
aspects of government praxis, which may differ from the actual or de facto reality that
individual agents or citizens confront on a daily basis. Bribe taking may for instance
formally be prohibited by law, but informally widely tolerated in some parts of the
public sector. Official statistics regarding the quality of service delivery can be
manipulated by those in power, and is therefore unreliable as an indicator of
institutional quality.
However, correlation analysis shows that these two measures have an extremely
high correlation (Pearson’s r = .939), which raises the issue of multicollinearity and
compels this study to analyze them in separate models to see which is the better
predictor. This gives a good indication of how closely entangled inefficiency and
corruption truly are, with inefficiency giving strong incentives for the use of bribes and
with corrupt public officials colluding to engender ever more bureaucratic obstacles
with the hope of extorting bribes, as argued by Myrdal (1968).
89 Or the citizens may instead turn to informal institutions such as corruption or organized crime, as this study has
argued in earlier sections.
82
The scale of this variable has been recoded to range from zero to one. The average
original score on the Control of Corruption index, which ranges between -2.5 (very
corrupt) and 2.5 (very clean), for the entire pooled sample is .095 (SD = 1.06) but there
is quite a large variation across different countries, with the lowest country/country-
wave score in Iraq (-1.39)/Georgia (3rd Wave, -1.39) and the highest in Finland (2.45).
Economic performance
This study’s second dimension of institutional performance is more interested in the
potential outcome of government activities rather than in the activities themselves. Here
this study has decided to focus on economic performance, operationalized using the
cumulated90 rate of growth in GDP of the five previous years before the survey
occasion. The data used for this variable originate from the WGI dataset (The World
Bank [3]). However, alternative indicators of economic performance are also used (see
Chapter 4, section 4.2.2.3). The scale of this variable has been recoded to range from
zero to one.
Macro-level controls
Post-communist countries
In addition to the previously discussed macro-level independent variables, this study
will also include a couple of system-level controls, the first of which is a dummy for
the former communist countries. The specific historical experiences of scarcity,
inefficiency and corrupt public institutions is argued to have resulted in the diffusion
of resilient norms that are conducive to corrupt behavior.
Similarly, dummies for the Latin American or East Asian countries could also have
been included in the analyses, due to the earlier mentioned high level of corruption
tolerance observed in some of the countries in these regions. However, the study opted
not to include them, due to there being no specific common historical experience or
critical juncture in the recent history of these particular countries comparable to that of
the post-communist countries and the collapse of the Soviet Union and the rest of the
socialist systems in Eastern Europe.
Furthermore, adding dummies for these particular cases would not be that helpful
in telling us what exactly is so special about these countries, other than their weak
institutions, high levels of inequality or other potential explanatory factors that are
90 The average rate of growth and the rate of growth in the previous year are also tested.
83
controlled for elsewhere. The post-communist countries are arguably unique in this
regard and therefore deserve a dummy variable.
Duration of democracy
The second macro-level control variable included in the analyses is an indicator of how
long a country has been democratic since 1900 without any significant interruptions in
the prevailing form of government. The data for this variable originate from the Boix-
Miller-Rosato (2014) dataset.
Studies have demonstrated that long91, uninterrupted periods of democratic
governance are required for countries to experience any significant reductions in
perceived corruption (e.g. Treisman 2000). One reason for this is probably that it takes
a long time for new fragile democratic institutions to consolidate so that they can
become better at resisting corrupt abuses. Another reason could be that it takes time
for democratic values and norms to take root in a society after it has made the transition
from an autocratic system to a democratic one, as people slowly adjust to their newly
won liberties and political rights. This adjustment is likely to be especially difficult for
older generations who are more used to living under autocratic rule and have formed
their basic values and norms under such circumstances (Inglehart 1971).
Only the current democratic regime is taken into account and not brief democratic
experiences in the beginning of the 20th century, as in the case of Estonia, which was
categorized by the Polity Project as a democracy between the years 1919 and 1933
before first suffering a democratic breakdown and then occupation by the Soviet Union
and (briefly) Nazi Germany from 1940 onward until 1991 when the current democratic
period began (Polity Project 2019; Encyclopedia Britannica 2019). This study finds it
unlikely that such distant and short-lived experiences of democratic governance have
left any strong and enduring impressions on the values of ordinary citizens and has
therefore chosen to focus on the length of more recent experiences of democracy. In
Estonia’s case, the relevant period is therefore from 1991 to the year of the survey in
question.
The year 1900 was chosen as a threshold year mainly because it represents, in the
words of John Gerring, Philip Bond, William T. Barndt and Carola Moreno (2005, 341),
“a period […] in which mass democracy becomes a world-historical phenomenon (no
longer restricted to the US and a few European states)” and because of data availability.
However, this study will also try using alternative indicators of democratization, such
as a country’s degree of democratization (polity index, Polity Project 2019) and
91 Daniel Treisman (2000) found that at least 40 years of consecutive democracy was needed for even a small decrease
in corruption level.
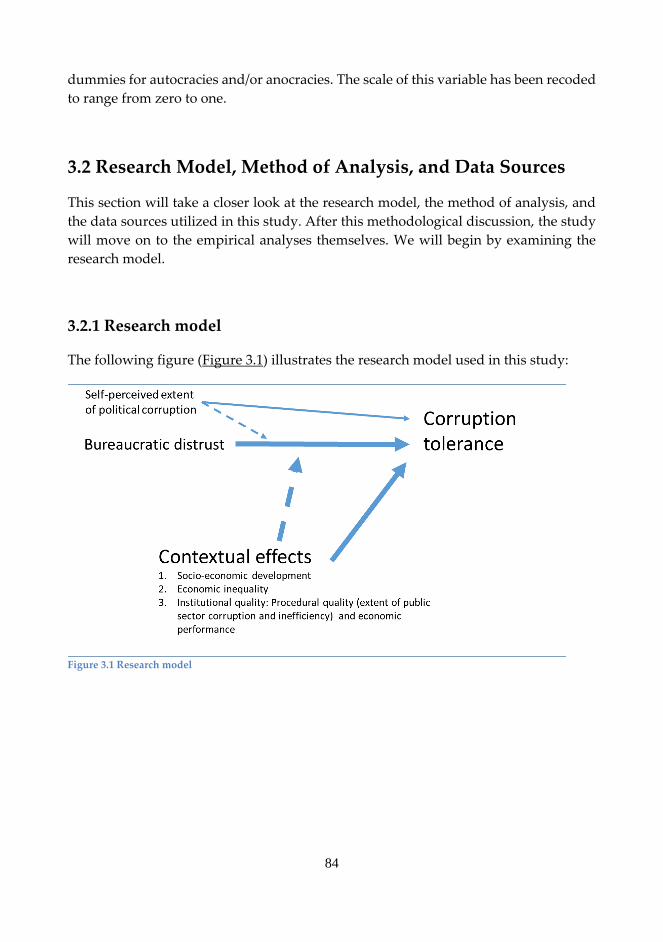
84
dummies for autocracies and/or anocracies. The scale of this variable has been recoded
to range from zero to one.
3.2 Research Model, Method of Analysis, and Data Sources
This section will take a closer look at the research model, the method of analysis, and
the data sources utilized in this study. After this methodological discussion, the study
will move on to the empirical analyses themselves. We will begin by examining the
research model.
3.2.1 Research model
The following figure (Figure 3.1) illustrates the research model used in this study:
Figure 3.1 Research model
85
3.2.2 Method of analysis
The main method of analysis utilized in this dissertation is three-level hierarchical
multilevel modeling (see Figure 3.2) where the primary units of observation are
individuals (the first level) nested within country-waves, (the second level) which in
turn are nested within countries (the third level), and the outcome variable of interest,
“Corruption tolerance”, is treated as a linear outcome. All continuous variables included
in this study have been centered around their grand mean values in order to facilitate
the interpretation of the intercept.
There are several reasons why using multilevel analysis is recommended as an
alternative to the more traditional single level methods in order to answer questions of
interest to social scientists. Next, this section will briefly summarize some of the
advantages of including more than one level in the analyses.
One of the central assumptions of linear regression models is that the variance is
homoscedastic, i.e. that the size of the error term, or residual92, is the same across the
values of an independent variable. This means that there should be no patterns
whatsoever among the residuals. However, this is often not the case in statistical
analyses based on real world data: Individual cases are often grouped or clustered into
subgroups where the patterns regarding the effect of the independent variable on the
dependent variable can vary quite substantially between different clusters of cases. For
instance, members of a given society often share certain social norms regarding, inter
alia, ethics, trust and reciprocity, and also to a high degree answer under the same
public and private institutions. This often also equates to that their attitudes toward
different societal phenomena are likely to be correlated, corruption included. To ignore
the realistic complexity intrinsic to naturally occurring dependencies and fit only
single-level models could therefore result in inefficient standard errors and the loss of
important information (Jones & Duncan 1998).
92 The differential between the predicted (modeled) value and the actual sample value.
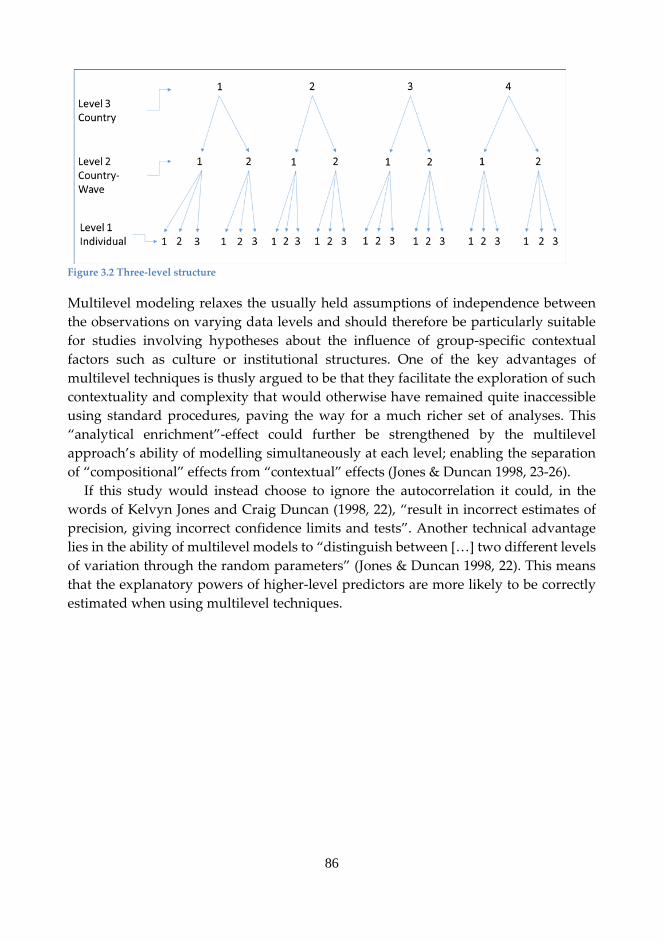
86
Figure 3.2 Three-level structure
Multilevel modeling relaxes the usually held assumptions of independence between
the observations on varying data levels and should therefore be particularly suitable
for studies involving hypotheses about the influence of group-specific contextual
factors such as culture or institutional structures. One of the key advantages of
multilevel techniques is thusly argued to be that they facilitate the exploration of such
contextuality and complexity that would otherwise have remained quite inaccessible
using standard procedures, paving the way for a much richer set of analyses. This
“analytical enrichment”-effect could further be strengthened by the multilevel
approach’s ability of modelling simultaneously at each level; enabling the separation
of “compositional” effects from “contextual” effects (Jones & Duncan 1998, 23-26).
If this study would instead choose to ignore the autocorrelation it could, in the
words of Kelvyn Jones and Craig Duncan (1998, 22), “result in incorrect estimates of
precision, giving incorrect confidence limits and tests”. Another technical advantage
lies in the ability of multilevel models to “distinguish between […] two different levels
of variation through the random parameters” (Jones & Duncan 1998, 22). This means
that the explanatory powers of higher-level predictors are more likely to be correctly
estimated when using multilevel techniques.
87
3.2.3 Data sources
This study utilizes high quality data from the official WVS aggregate file, which pools
together individual-level data from all six waves. The number of countries included in
the World Values Survey was very limited in the first two survey waves covering the
periods 1981 – 1984 and 1990 – 1994 (10 and 18 countries respectively).
High coverage was attained only since the third wave (1995 – 1999; 57 countries) and
this study has therefore chosen to include data exclusively from the four latest waves
of the survey in its main analyses: 1995 – 1999 (Wave III), 2000 – 2004 (Wave IV), 2005
– 2009 (Wave V), and 2010 – 2014 (Wave VI). This sample includes in total more than
300 000 individuals from over 90 different countries representing all global regions of
relevance. However, after the deletion of cases where there are data missing for key
variables of interest, the final sample includes 84 countries, 170 country-waves, and
around 230 000 individual respondents.
Other data sources for the macro-level variables include the V-Dem extended
dataset (2018), the Worldwide Governance indicators (The World Bank [3]), the UNDP
(2018) Human Development database, the UNU-WIDER (2017) World Income
Inequality Database (WIID), and the Boix-Miller-Rosato (2014) and Polity Project (2019)
datasets.
88
4. Empirical analyses
This chapter presents the results and findings of the empirical analyses and compares
them to the earlier discussed hypotheses and the findings in previous empirical
studies. It starts by presenting a few descriptive statistics of the variables that also
demonstrate the variation in corruption tolerance across all the countries and country-
waves included in the statistical analyses, before moving on to the main micro-, macro-
, and cross-level analyses. Lastly, it discusses the robustness of the findings.
4.1 Descriptive analyses
The chapter begins by first looking at some descriptive analyses of the data included
in this study. As can be seen from Table 4.1, the average corruption tolerance in the 84
countries and the 170 country-waves included in these analyses is relatively low (~ 38
on a scale from 0 – 100). However, figures 4.3 and 4.4 indicate that there is quite a lot
of variation in the average country- and country-wave-level corruption tolerance,
ranging from as low as approximately 7.7 and 3.5 in Bangladesh (Waves 3 & 4; country
average: 5.6) to as high as 64.2 (country average) in the Philippines and 77.3 in Thailand
(wave 5). These findings indicate that the country context matters with regard to the
variation in corruption tolerance, although, there seems to be a greater variation
between different country-waves.
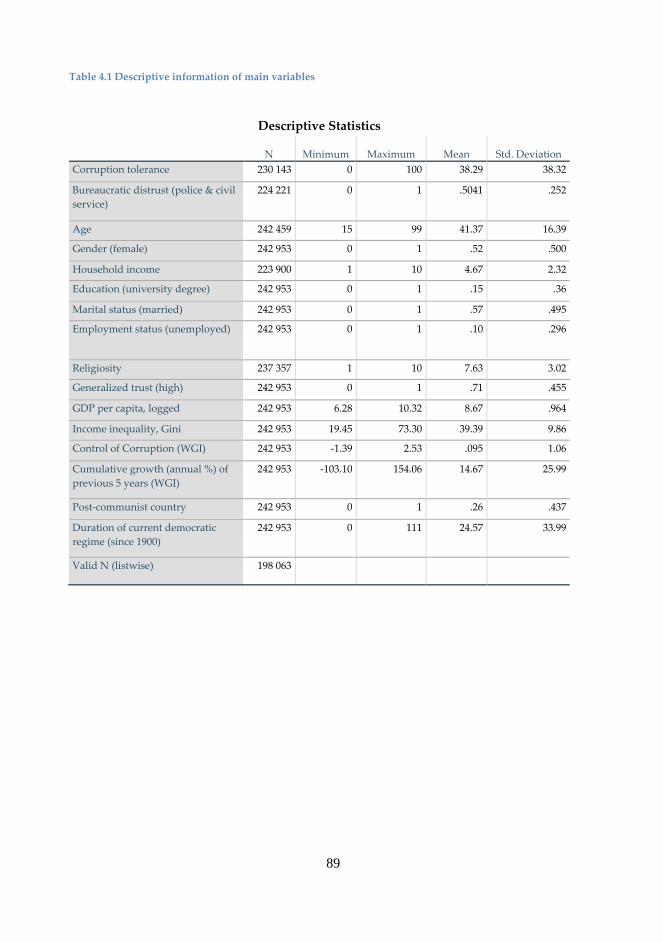
89
Table 4.1 Descriptive information of main variables
Descriptive Statistics
N Minimum Maximum Mean Std. Deviation
Corruption tolerance 230 143 0 100 38.29 38.32
Bureaucratic distrust (police & civil
service)
224 221 0 1 .5041 .252
Age 242 459 15 99 41.37 16.39
Gender (female) 242 953 0 1 .52 .500
Household income 223 900 1 10 4.67 2.32
Education (university degree) 242 953 0 1 .15 .36
Marital status (married) 242 953 0 1 .57 .495
Employment status (unemployed) 242 953 0 1 .10 .296
Religiosity 237 357 1 10 7.63 3.02
Generalized trust (high) 242 953 0 1 .71 .455
GDP per capita, logged 242 953 6.28 10.32 8.67 .964
Income inequality, Gini 242 953 19.45 73.30 39.39 9.86
Control of Corruption (WGI) 242 953 -1.39 2.53 .095 1.06
Cumulative growth (annual %) of
previous 5 years (WGI)
242 953 -103.10 154.06 14.67 25.99
Post-communist country 242 953 0 1 .26 .437
Duration of current democratic
regime (since 1900)
242 953 0 111 24.57 33.99
Valid N (listwise) 198 063
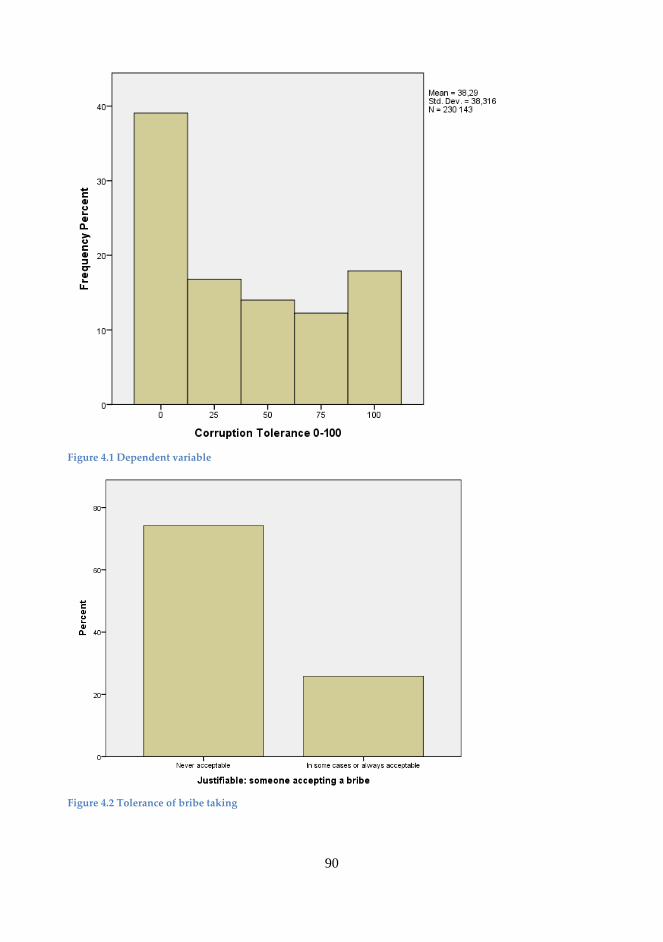
90
Figure 4.1 Dependent variable
Figure 4.2 Tolerance of bribe taking
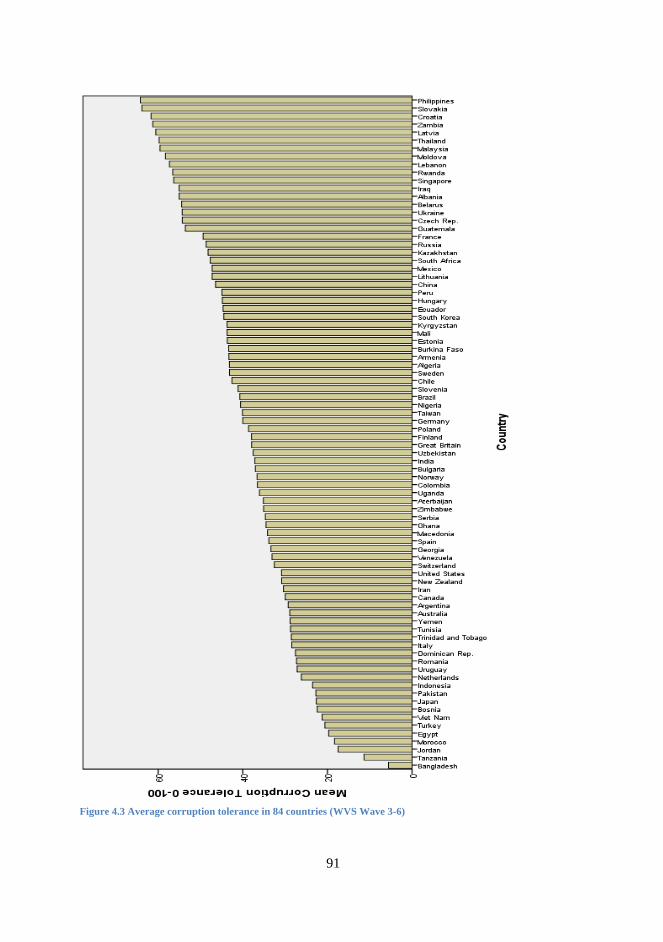
91
Figure 4.3 Average corruption tolerance in 84 countries (WVS Wave 3-6)
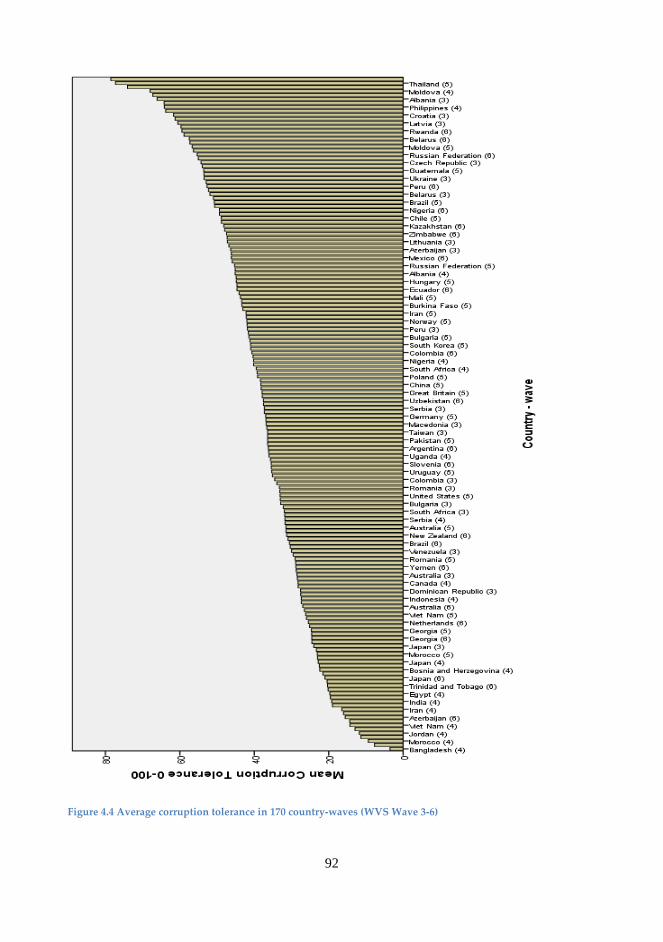
92
Figure 4.4 Average corruption tolerance in 170 country-waves (WVS Wave 3-6)
93
4.2 Multivariate Analysis
This section continues on to the multivariate analysis of the previously described data,
starting with the micro effects before moving on to the macro (contextual) effects and
finishing with the interaction effects. As a start, the section begins by analyzing the
impact of individual characteristics and values.
4.2.1 Micro-level effects
As we saw from the figures in the previous section, there is a relatively large variation
in the data between both countries and different country-waves. However, in order to
estimate just how much of the variation is situated on the higher levels and how much
is due to compositional (individual) characteristics, and which particular factors
explain this variation, a number of multilevel models need to be estimated. The
modeling strategy utilized here, which is divided into six different stages, is as follows:
In the first stage, a null model is estimated so that the estimated variance
components in this model can be used to calculate the intra-cluster correlations (ICC),
which indicate how much of the variance in corruption tolerance is explained at the
country- and the country-wave-levels respectively (Hox et al. 2017). The ICCs in the
null or empty model (Model 0) in Table 4.2 are approximately 6.3 % at the country-
level (level 3) and 7.5 % at the country-wave-level (level 2), which indicates that the
remaining 92.5 % of the variation is explained by individual-level factors. All three
variance components are highly significant (p<0.01), which means that corruption
tolerance not only varies significantly among individual, but also across country-waves
and countries. The estimation that only 7.5 % from the variance is due to contextual
factors indicates that the differences between individuals weigh more than the
differences between countries or country-waves.
In the second stage, the study proceeds to estimating a model (Model 1a) that
contains all individual-level predictors, except for the self-perceived corruption
dummy variable, in order to ensure that the country-level variation is not solely a result
of differences in population composition. Following this, in the third stage, it estimates
a model (Model 1b) containing the second key micro-level variable of interest in this
study, the indicator of the self-perceived extent of corruption, which limits the data to
wave 3 of the WVS.
After having analyzed the micro-level effects, the study proceeds to the fourth stage,
where it analyzes the effects of the macro-level variables of interest (Model 2 and 3).
Having done this, it turns its attention in the fifth stage to the cross-level interactions
between bureaucratic distrust and the key macro-level variables of interest and
includes interaction terms in the next set of models (Model 4 and 5). Finally, in the sixth
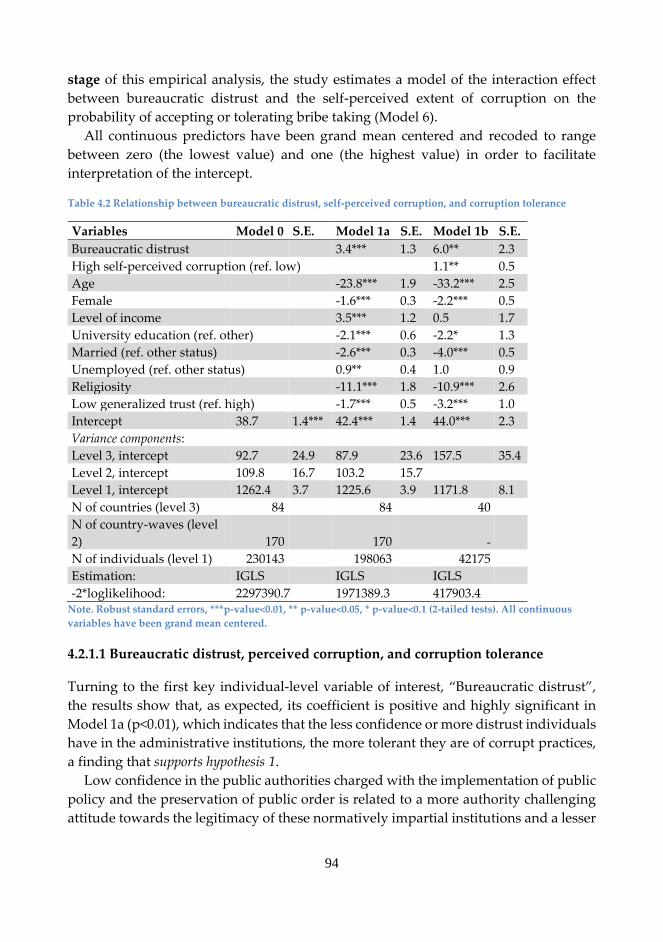
94
stage of this empirical analysis, the study estimates a model of the interaction effect
between bureaucratic distrust and the self-perceived extent of corruption on the
probability of accepting or tolerating bribe taking (Model 6).
All continuous predictors have been grand mean centered and recoded to range
between zero (the lowest value) and one (the highest value) in order to facilitate
interpretation of the intercept.
Table 4.2 Relationship between bureaucratic distrust, self-perceived corruption, and corruption tolerance
Variables Model 0 S.E. Model 1a S.E. Model 1b S.E.
Bureaucratic distrust 3.4*** 1.3 6.0** 2.3
High self-perceived corruption (ref. low) 1.1** 0.5
Age -23.8*** 1.9 -33.2*** 2.5
Female -1.6*** 0.3 -2.2*** 0.5
Level of income 3.5*** 1.2 0.5 1.7
University education (ref. other) -2.1*** 0.6 -2.2* 1.3
Married (ref. other status) -2.6*** 0.3 -4.0*** 0.5
Unemployed (ref. other status) 0.9** 0.4 1.0 0.9
Religiosity -11.1*** 1.8 -10.9*** 2.6
Low generalized trust (ref. high) -1.7*** 0.5 -3.2*** 1.0
Intercept 38.7 1.4*** 42.4*** 1.4 44.0*** 2.3
Variance components: Level 3, intercept 92.7 24.9 87.9 23.6 157.5 35.4
Level 2, intercept 109.8 16.7 103.2 15.7 Level 1, intercept 1262.4 3.7 1225.6 3.9 1171.8 8.1
N of countries (level 3) 84 84 40 N of country-waves (level
2) 170 170 - N of individuals (level 1) 230143 198063 42175 Estimation: IGLS IGLS IGLS -2*loglikelihood: 2297390.7 1971389.3 417903.4
Note. Robust standard errors, ***p-value<0.01, ** p-value<0.05, * p-value<0.1 (2-tailed tests). All continuous
variables have been grand mean centered.
4.2.1.1 Bureaucratic distrust, perceived corruption, and corruption tolerance
Turning to the first key individual-level variable of interest, “Bureaucratic distrust”,
the results show that, as expected, its coefficient is positive and highly significant in
Model 1a (p<0.01), which indicates that the less confidence or more distrust individuals
have in the administrative institutions, the more tolerant they are of corrupt practices,
a finding that supports hypothesis 1.
Low confidence in the public authorities charged with the implementation of public
policy and the preservation of public order is related to a more authority challenging
attitude towards the legitimacy of these normatively impartial institutions and a lesser
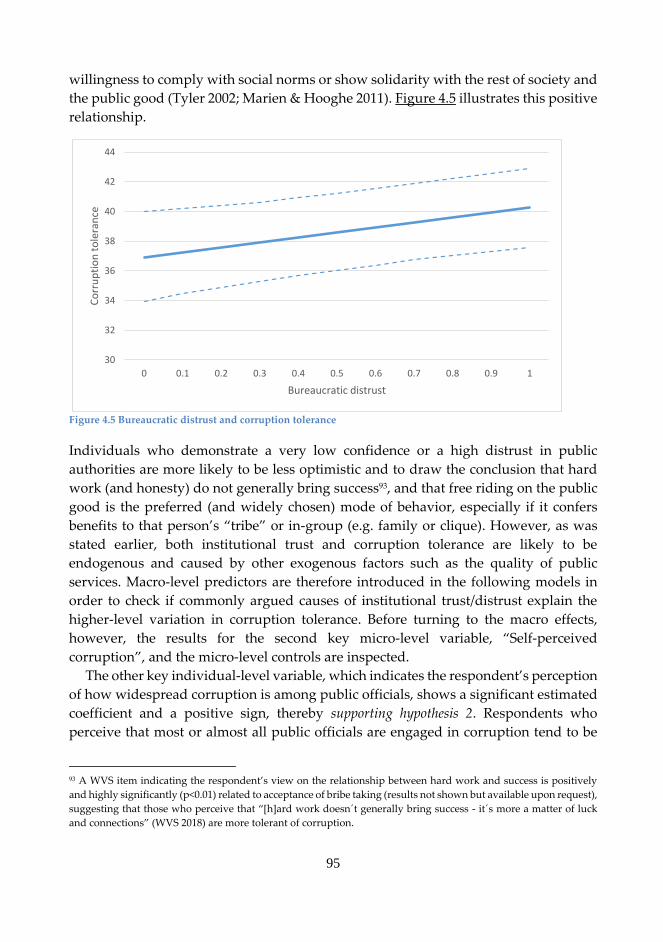
95
willingness to comply with social norms or show solidarity with the rest of society and
the public good (Tyler 2002; Marien & Hooghe 2011). Figure 4.5 illustrates this positive
relationship.
Figure 4.5 Bureaucratic distrust and corruption tolerance
Individuals who demonstrate a very low confidence or a high distrust in public
authorities are more likely to be less optimistic and to draw the conclusion that hard
work (and honesty) do not generally bring success93, and that free riding on the public
good is the preferred (and widely chosen) mode of behavior, especially if it confers
benefits to that person’s “tribe” or in-group (e.g. family or clique). However, as was
stated earlier, both institutional trust and corruption tolerance are likely to be
endogenous and caused by other exogenous factors such as the quality of public
services. Macro-level predictors are therefore introduced in the following models in
order to check if commonly argued causes of institutional trust/distrust explain the
higher-level variation in corruption tolerance. Before turning to the macro effects,
however, the results for the second key micro-level variable, “Self-perceived
corruption”, and the micro-level controls are inspected.
The other key individual-level variable, which indicates the respondent’s perception
of how widespread corruption is among public officials, shows a significant estimated
coefficient and a positive sign, thereby supporting hypothesis 2. Respondents who
perceive that most or almost all public officials are engaged in corruption tend to be
93 A WVS item indicating the respondent’s view on the relationship between hard work and success is positively
and highly significantly (p<0.01) related to acceptance of bribe taking (results not shown but available upon request),
suggesting that those who perceive that “[h]ard work doesn´t generally bring success - it´s more a matter of luck
and connections” (WVS 2018) are more tolerant of corruption.
30
32
34
36
38
40
42
44
0 0.1 0.2 0.3 0.4 0.5 0.6 0.7 0.8 0.9 1
Co
rru
pti
on
to
lera
nce
Bureaucratic distrust
96
significantly more accepting of corrupt behavior in comparison to those who perceive
that only very few or almost no one is engaged in such activities. However, the size of
the coefficient is quite small relative to the other significant coefficients: The difference
between the respondents who perceive only a little or no corruption and those who
perceive a lot is approximately only a single percent.
4.2.1.2 Micro-level controls
The correlations between corruption tolerance and the other individual-level controls
in Model 1a are generally in agreement with the expectations and results of previous
studies.
First, as previous studies have also demonstrated, age is found to be quite a strong
predictor of corruption tolerance. As the individual grows older, he or she tends to
become less tolerant of deviant behavior due to various socialization effects related to
aging such as the rising stakes or costs of participating in corrupt exchanges or
behaving in a socially deviant manner (Torgler & Valev 2010).
Second, women have a tendency to be less tolerant of corruption compared to men,
which potentially could be related to differences in the competitive natures of men and
women (Lee & Guven 2013). Empirical evidence from the economics literature has
demonstrated that men tend to be more competitive and consequently more likely to
resort to foul play and cheating in order to get ahead of the competition.
Third, those with a higher income tend to show a greater tolerance of corruption
(and, as recent experiments have demonstrated, a lower tax morale), proposedly due
to what is described as a “psychological force” that makes affluent people more likely
to cheat in these kinds of scenarios, i.e. a sense of greed (Grundmann & Lambsdorff
2017). However, the income variable is non-significant in Model 1b, which
consequently challenges this finding.
Fourth, those with a higher education are more likely to condemn corruption,
arguably as a result of the civic knowledge, skills and values that are conveyed via the
education system to the more highly educated who are thereby in a better position to
understand the consequences of corrupt and uncivic behavior (Uslaner & Rothstein
2016).
Fifth, religiosity is found to be negatively linked with corruption tolerance.
Respondents who consider God to be more important in their lives tend to be less
tolerant of corruption, presumably due to the ethical and moral guidance derived from
the various religious frameworks that tend to condemn lies, dishonesty, greed, and
deception, i.e. modes of behavior closely related to various forms of corruption (Beets
2007).
97
Sixth, married people have a lesser tendency to justify corruption, possibly due to
similar reasons as with aging, i.e. a greater risk aversion due to larger stakes (Kravtsova
et al. 2017). Seventh, the study finds a positive effect of unemployment. However, the
effect is miniscule and does not turn up significant in Model 1b nor when Moreno’s
original additive corruption permissiveness index is used.
In addition to the standard socio-economic status (SES) control variables (plus a
measure of religiosity) usually included in these types of analyses, a commonly used
proxy for social capital, namely generalized or interpersonal trust, was also included
in the analyses. People with a higher confidence in public authorities are more likely
to possess higher levels of generalized trust and social capital (Rothstein & Stolle 2002),
which could potentially indicate that at least a part of the impact of bureaucratic
distrust is indirect, via generalized trust. According to the results, the effect of a low
generalized trust (“you cannot be too careful” vs. “most people can be trusted”) is
significant (p<0.05), but negative, i.e. a low generalized trust is related to a lower
corruption tolerance.
However, this finding is in fact in line with previous findings regarding the link
between interpersonal trust and the importance that citizens attach to civic norms
regarding law abidance.94 According to Kotzian (2014, 66), “[i]f persons believe people
to be basically bad, unhelpful, and not to be trusted, they are likely to perceive it as
necessary to have them constrained by laws and norms”. Distrusting persons who fear
their fellow men are therefore (somewhat) more likely to emphasize that uncivic
behavior cannot be tolerated at any cost and that the Machiavellian “wicked man”
must be restrained by force and strong social norms. It must though be underscored
that generalized trust matters only to a negligible degree and that the coefficient turns
non-significant in some of the models, especially those that utilize Moreno’s original
index.
Now, having covered the predictors on the individual level, the analysis will switch
level and turn its focus from the individual- or micro-level variables to the country- or
macro-level variables instead in the next section.
94 Operationalized with the European Social Survey question, “[i]n order to be a good citizen, how important is it
[…] to always obey to laws/regulations?” (Kotzian 2014, 81).
98
4.2.2 Macro-level effects
The present section changes focus from the micro-level characteristics to the macro-
level contextual factors in order to investigate if the level of socio-economic
development (natural log of GDP per capita), income inequality (Gini), institutional
quality (Control of Corruption), and/or economic performance (Economic growth) can
contribute to explaining the observed macro-level differences in corruption tolerance
across countries and/or country-waves.
Model 2 in Table 4.3 shows the estimated effects of the key system-level variables,
together with the previously discussed individual-level ones but without any country-
level controls. Model 3 meanwhile introduces in addition to the previously mentioned
variables two macro-level controls plus a country dummy for an observed outlier case,
Zimbabwe.
The introduction of the macro-level predictors in the analysis has quite a powerful
impact on the dependent variable. However, much of this explanatory power seems to
originate from just three explanatory variables: “GINI”, “Post-Communist Country”
and the outlier dummy. Once these three variables are added to Model 1, the country-
level variance component shrinks from around 88 in Model 1 to 60, i.e. by almost a
third, while the country-wave component remains virtually unchanged.95
95 The country-level variables in Model 2 and Model 3 do not significantly improve the model’s fit to the data (due
to the relatively large number of new parameters). However, the -2*log-likelihood or deviance decreased from
1971389.286 (Model 1) to 1971377.361 in a model with only the three previously mentioned variables (model not
shown), a difference of 11.925. This difference can be seen as a ꭓ² value with 3 degrees of freedom (three new
parameters), which indicates a high statistical significance (p<0.01).
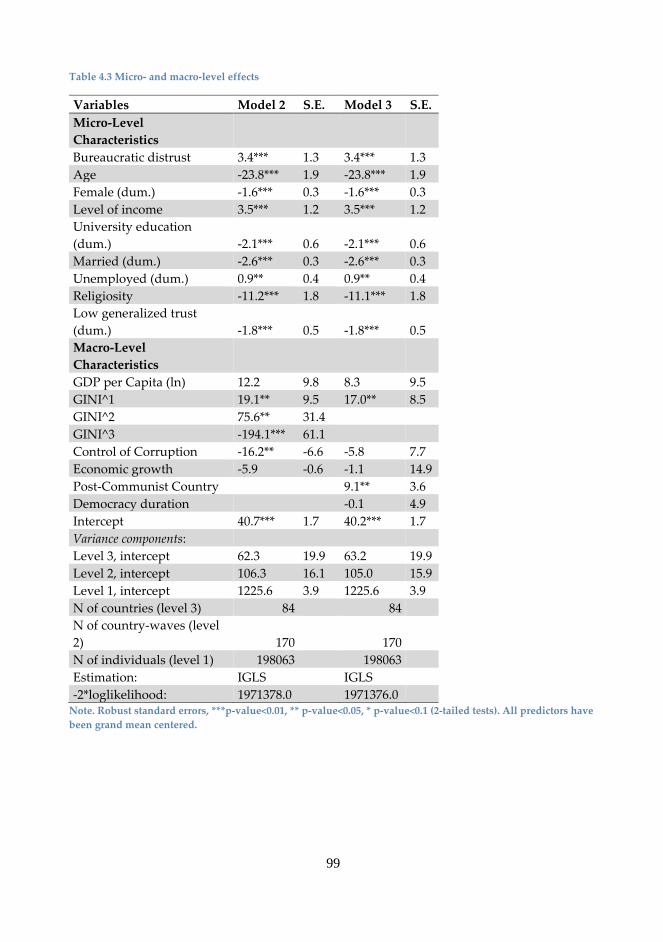
99
Table 4.3 Micro- and macro-level effects
Variables Model 2 S.E. Model 3 S.E.
Micro-Level
Characteristics Bureaucratic distrust 3.4*** 1.3 3.4*** 1.3
Age -23.8*** 1.9 -23.8*** 1.9
Female (dum.) -1.6*** 0.3 -1.6*** 0.3
Level of income 3.5*** 1.2 3.5*** 1.2
University education
(dum.) -2.1*** 0.6 -2.1*** 0.6
Married (dum.) -2.6*** 0.3 -2.6*** 0.3
Unemployed (dum.) 0.9** 0.4 0.9** 0.4
Religiosity -11.2*** 1.8 -11.1*** 1.8
Low generalized trust
(dum.) -1.8*** 0.5 -1.8*** 0.5
Macro-Level
Characteristics GDP per Capita (ln) 12.2 9.8 8.3 9.5
GINI^1 19.1** 9.5 17.0** 8.5
GINI^2 75.6** 31.4 GINI^3 -194.1*** 61.1 Control of Corruption -16.2** -6.6 -5.8 7.7
Economic growth -5.9 -0.6 -1.1 14.9
Post-Communist Country 9.1** 3.6
Democracy duration -0.1 4.9
Intercept 40.7*** 1.7 40.2*** 1.7
Variance components:
Level 3, intercept 62.3 19.9 63.2 19.9
Level 2, intercept 106.3 16.1 105.0 15.9
Level 1, intercept 1225.6 3.9 1225.6 3.9
N of countries (level 3) 84 84
N of country-waves (level
2) 170 170
N of individuals (level 1) 198063 198063
Estimation: IGLS IGLS
-2*loglikelihood: 1971378.0 1971376.0 Note. Robust standard errors, ***p-value<0.01, ** p-value<0.05, * p-value<0.1 (2-tailed tests). All predictors have
been grand mean centered.
100
4.2.2.1 Socio-economic development and corruption tolerance
This section begins the review of potential macro-level explanations by focusing on the
first dimension of interest, socio-economic development, operationalized in the presented
models using the natural log of a country’s GDP per capita. Numerous studies have
demonstrated that the level of socio-economic development and corruption tend to be
highly correlated96 and that more developed countries tend to be perceived as
significantly less corrupt. However, is there also a relationship between development
level and public attitudes towards corrupt and uncivic behavior? In other words, have
the populations of poor countries a tendency to be more tolerant of corruption when
compared to the populations of more affluent countries?
As we saw earlier in the theory section, there are somewhat conflicting expectations
regarding the relationship between socio-economic development and corruption
tolerance. However, based on the previously mentioned observations regarding the
link between development and corruption, and the arguments that widespread
poverty contributes to generating “cultures of corruption”, social deviancy, and moral
flexibility among citizens, it was hypothesized that socio-economically less developed
societies tend to be significantly more tolerant of corrupt practices.
An inspection of the coefficients of GDP per capita (ln) reveals that it is non-
significant in both models in Table 4.3. Moreover, the coefficient shows a positive sign
when institutional (procedural) quality is taken into account97, which contradicts
hypothesis 3, according to which countries with a higher level of socio-economic
development should be less tolerant of corruption, not more. This finding mirrors the
findings of Kravtsova et al. (2017) and Dülmer (2014), who report that the attitude
regarding the acceptance of bribes is not related to a country’s level of development,
measured using the Human Development Index (HDI). However, this study also tried
using an alternative indicator of development, the Education index98, which is a
component of the HDI and calculated using mean years of schooling and expected
years of schooling (UNDP 2018). The coefficient for this variable is in turn highly
significant (p<0.01) and positive (24.6) as long as the corruption indicator is also
included in the model. Once “Control of Corruption” is removed, it turns non-
significant.
Based on these results it can be concluded that there is no significant relationship
between a country’s level of development and corruption tolerance: poor countries do not
96 The correlation between GDP per capita and Control of Corruption is .729. This study ran tests for collinearity,
but it does not seem to be a problem based on the resulting VIF-value of 2.152. The correlation with its alternative
development indicator, the Education index, is smaller (.613, VIF=1.631), but the results were similar. This leads this
study to conclude that the observed reaction is not due to collinearity. 97 The coefficient does show an expected negative sign when this study includes it as the sole macro-level predictor,
but its size is miniscule (-0.704) and non-significant, and it turns positive when it introduces its corruption indicator. 98 Results not shown but available upon request.
101
have a significantly higher acceptance or tolerance of corrupt practices and free riding
when compared to rich countries. On the contrary, there seems to be some indications
of the opposite when one also considers institutional quality, although this might still
be due to collinearity and should therefore be interpreted with caution. Now, this
chapter will shift its attention to another related variable that concerns economic
resources, or rather the distribution of them, namely economic inequality.
4.2.2.2 Economic inequality and corruption tolerance
This section turns its attention to the relationship between corruption tolerance and
this study’s second “dimension of dysfunctionality”, economic inequality,
operationalized using the income-based Gini index99 where higher values indicate a
higher level of income inequality.
Earlier in the theoretical discussion, it was hypothesized that there may be a non-
linear statistical relationship between inequality and corruption tolerance based on a
previous empirical finding that suggested a negative correlation between inequality and
corruption tolerance (Pop 2012). A finding that contradicts many of the earlier
theoretical arguments and empirical evidence regarding the impact of inequality on
public attitudes regarding corruption and civic morality or social solidarity (Dobel
1978; You & Khagram 2005; Uslaner 2008; Kotzian 2014; Rothstein & Uslaner 2005;
Paskov & Dewilde 2012). Pop’s study, however, only included European countries,
thereby excluding many of the extremely unequal societies often found in Latin
America or on the African continent. Consequently, it was hypothesized that the
relationship between inequality and corruption tolerance could potentially be non-
linear, a hypothesis which this study’s initial analysis (shown in Model 2 in Table 4.3)
seemed to support as the results showed a highly significant (p<0.01) cubic, tilted S-
shaped relationship.
However, a closer look at the data reveals that this initially observed non-linear
relationship is largely due to a couple of influential outliers (Slovakia and Zimbabwe)
and once dummy variables for Zimbabwe (included but not shown) and for the post-
communist countries in general are included (see Model 3 and the discussion regarding
control variables), the non-linear relationship turns non-significant. A significant
(p<0.05) and strongly positive linear relationship between income inequality and
corruption tolerance can now be discerned. This finding indicates that highly unequal
societies tend to be significantly more tolerant of corrupt practices than their more
equal counterparts, if one also takes into account the post-communist countries where
99 Alternative versions of the Gini index base their estimates on wealth instead of income, but because it is more
difficult to measure wealth than income, most Gini coefficients usually refer to income (Investopedia [2]).
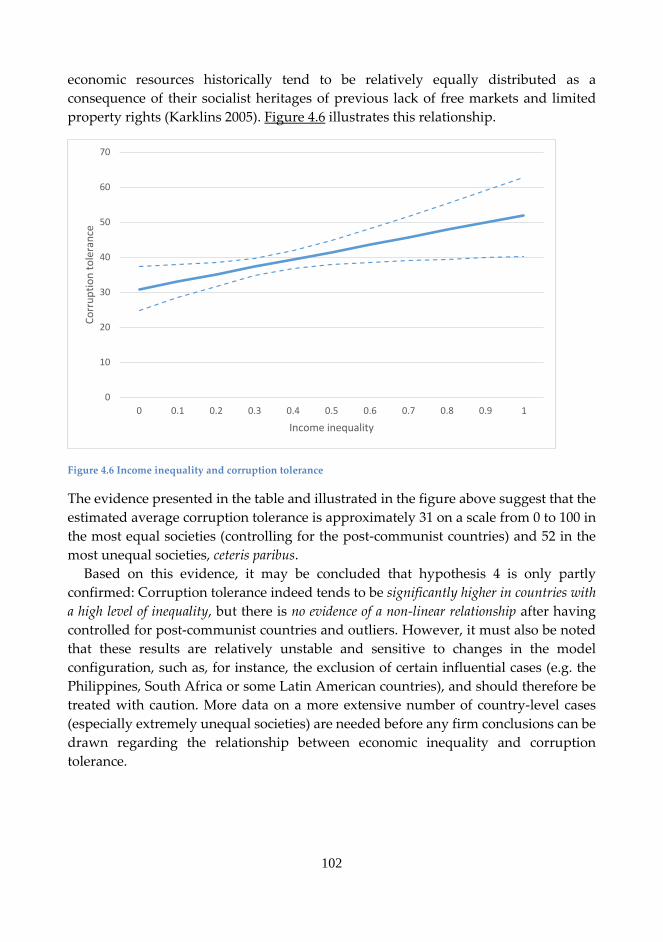
102
economic resources historically tend to be relatively equally distributed as a
consequence of their socialist heritages of previous lack of free markets and limited
property rights (Karklins 2005). Figure 4.6 illustrates this relationship.
Figure 4.6 Income inequality and corruption tolerance
The evidence presented in the table and illustrated in the figure above suggest that the
estimated average corruption tolerance is approximately 31 on a scale from 0 to 100 in
the most equal societies (controlling for the post-communist countries) and 52 in the
most unequal societies, ceteris paribus.
Based on this evidence, it may be concluded that hypothesis 4 is only partly
confirmed: Corruption tolerance indeed tends to be significantly higher in countries with
a high level of inequality, but there is no evidence of a non-linear relationship after having
controlled for post-communist countries and outliers. However, it must also be noted
that these results are relatively unstable and sensitive to changes in the model
configuration, such as, for instance, the exclusion of certain influential cases (e.g. the
Philippines, South Africa or some Latin American countries), and should therefore be
treated with caution. More data on a more extensive number of country-level cases
(especially extremely unequal societies) are needed before any firm conclusions can be
drawn regarding the relationship between economic inequality and corruption
tolerance.
0
10
20
30
40
50
60
70
0 0.1 0.2 0.3 0.4 0.5 0.6 0.7 0.8 0.9 1
Co
rru
pti
on
to
lera
nce
Income inequality
103
4.2.2.3 Institutional quality, economic performance, and corruption tolerance
This section turns the spotlight to the results regarding the two outlined dimensions of
institutional quality or performance: procedural quality, operationalized with the WGI’s
Control of Corruption indicator, and economic performance, operationalized with the
cumulated growth in GDP of the five previous years before the survey occasion.100 The
section begins by turning its attention to what this study chose to call the “procedural”
dimension of institutional quality.
Procedural quality and corruption tolerance
Earlier it was hypothesized that corruption tolerance should be higher in countries
with a high level of public sector corruption and low efficiency, i.e. that corruption of
the “head” (the state) or elite misconduct causes decay of the body politic or societal
corruption. This hypothesis was based on the argument that if citizens believe that
public institutions and office holders are corrupt, i.e. partial to those that can afford to
buy unfair advantages, and inefficient, and if they perceive corruption as “the only
game in town” and required to “get things done”, they become more likely to view the
formal institutions as illegitimate and instead turn to informal institutions such as
clientelism. This could in turn increase their expressed tolerance concerning instances
of bribery, cheating with taxes, and other related forms of uncivic behavior.
The first indicator of institutional quality, Control of Corruption, is significant
(p<0.05) in Model 2 and the sign of the coefficient is negative, which would seem to
support hypothesis 4 that corruption tolerance tends be higher in countries with higher
levels of perceived corruption, i.e. lower institutional quality. However, the observed
effect seems to be dependent on the inclusion of the socio-economic development level
indicator. Once the non-significant “GDP per capita (ln)” variable is removed from the
model, the Control of Corruption coefficient drops from around -16 to -8 but remains
significant. Furthermore, this effect turns non-significant once the control for the post-
communist countries is added to the model (see Model 3).
This finding is in line with the earlier mentioned non-significant results in Pop (2012)
and Kravtsova et al. (2017) regarding the effect of institutional quality on bribe
acceptance and does not support the conclusions of Moreno (2002) and Letki (2006)
regarding its impact on “civic morality”, a concept closely related to the phenomenon
of interest in this study (see discussion in Chapter 1, section 1.2).
However, it is difficult to draw any definitive conclusions regarding the link
between procedural quality and corruption tolerance due to the fact that it is difficult
to tell if the above average corruption tolerance in post-communist countries is a direct
100 This study also tried using the average growth during the same period and it produced similar results, but the
effects were somewhat stronger for the other measures of growth.
104
consequence of the unique experiences during communist times or if it is a result of the
high extent of corruption in these countries, or a combination of both factors. Either
way one could still interpret these results as being consistent with the basic
interpretation of the rotting fish thesis in the light that the well documented (see e.g.
Karklins 2005) dysfunctionality of the Soviet and other socialist state institutions have
often tended to produce a greater proportion of “dysfunctional” citizens with a higher
tolerance of rule breaking behavior.
Hypothesis 5, i.e. that there is a negative association between procedural quality and
corruption tolerance, however cannot be confirmed based on these results and their
inconsistency.
Economic performance and corruption tolerance
Next, the study turns its attention to its second dimension of institutional quality,
economic performance, which focuses more on the potential outcomes of government
choices and institutional performance.
The coefficient for this variable demonstrates the expected negative sign in Model 2
but fails to reach statistical significance in the present models. Furthermore, it switches
signs from negative to positive (but remains non-significant) when the dummy for the
post-communist countries is introduced in Model 3 (see discussion regarding the
controls in Chapter 3, section 3.1.2). After taking into account the cases that experienced
deep economic contraction during or after the fall of the communist regimes and the
collapse of the Soviet Union (Investopedia [1]), there is no evidence that recent
economic performance is in any way related to prevailing attitudes towards corrupt
practices.
An alternative indicator of economic performance, the natural log of the average
inflation of the previous five years, behaves in a similar way as the growth variable,
albeit turns up highly significant and positive (19.4) in the first model.101 However,
when controlling for the former communist states, the previously highly significant
positive effect of the inflation level becomes non-significant.
A third alternative indicator of economic performance, the level of unemployment,
in turn fails to reach any conventional level of significance, and even turns up negative,
thereby supporting the conclusion that there is no significant impact of recent economic
performance, except for, perhaps, in the unique cases of the former Soviet republics in
the immediate aftermath of the collapse of the Soviet Union. It is therefore possible that
only a veritable economic catastrophe, such as the one that occurred in the former
Soviet states (Investopedia [1]) or the Great Depression during the 1930s (and, more
recently, the Great Recession [2007 – 2009]; Investopedia [3]-[4]), can have a significant
impact on expressed public attitudes towards corruption and free riding, at least
101 Results not shown but available upon request.
105
temporarily as a civic protest to recent developments (see the next section). Ordinary
economic fluctuations seem considerably less likely to have any meaningful impact on
prevailing attitudes, at least in the short run.102
These results seem contrary to those of Kotzian (2014) who found that economic
performance has a positive impact on the acceptance of civic norms (especially law
abidance and civic engagement), and partly similar103 to the results of Letki (2006) who
found no significant effect of GDP growth (of the previous year) on civic morality.
However, based on the inconsistency of these results it cannot be confirmed that
economic performance has a significant impact on corruption tolerance (Hypothesis 6).
4.2.2.4 Macro-level controls
In addition to the previously discussed contextual variables, this study also included
two macro-level controls in Model 3: A dummy for the post-communist states and an
indicator of how long a country continuously has been designated a democracy since
the year 1900, which is when the age of global mass democracy is perceived to have
begun in earnest (Gerring et al. 2005).
Only one of these two control variables turns up significant (p <0.01), namely the
dummy for post-communist countries. Furthermore, the coefficient for this dummy
variable shows a positive sign, which indicates that corruption tolerance is higher in
these particular countries. A separate hypothesis for this variable was not formed, but
this result was to be expected based on the arguments forwarded in Karklins (2004)
and Sandholtz and Taagepera (2005), among others, who argue that “old habits die
hard” and that a “culture of impunity”, especially among elite groups, has lived on in
some of these states. While corruption tolerance is on average somewhat higher in this
group of countries, there is quite a large variation within this group and between
different country-waves, ranging from as low as 15.6 in Azerbaijan (Wave 6) and 22.4
in Bosnia and Herzegovina to 68 in Moldova (Wave 4) and 63.8 in Slovakia. Figure 4.7
illustrates these differences across different country-waves.
102 However, one could imagine that it may have strong long-term effects, for instance, on child development (see
Kalil 2013). Young people, especially those from low SES backgrounds who have experienced a strong economic
downturn during their childhood, may become more pessimistic and cynical as young adults. 103 However, Letki (2006) finds that citizens living in countries with low unemployment are significantly more
disapproving of dishonest behaviour, but this study in turn found no significant effect of the level of unemployment.
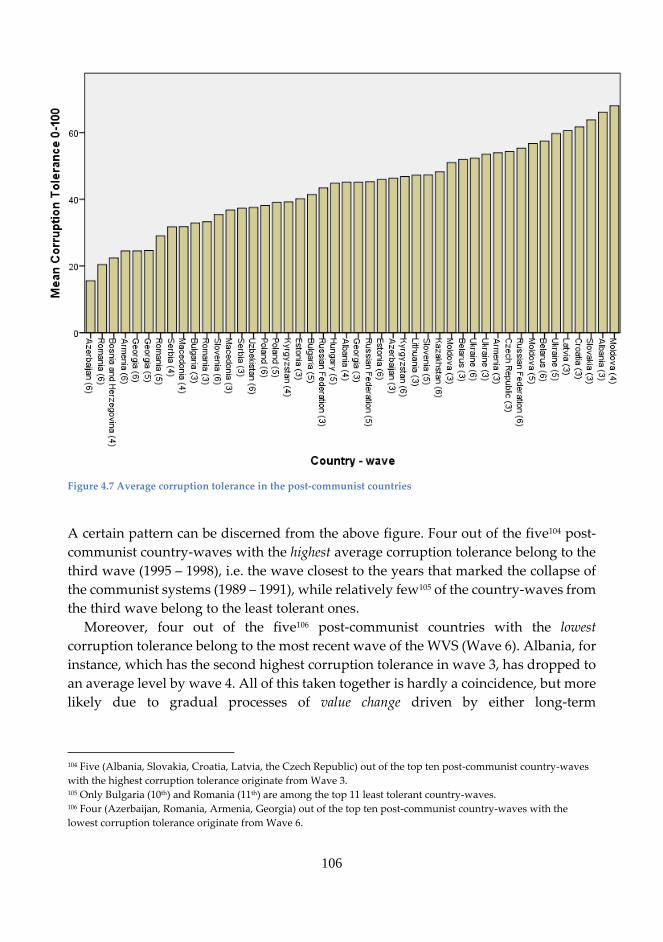
106
Figure 4.7 Average corruption tolerance in the post-communist countries
A certain pattern can be discerned from the above figure. Four out of the five104 post-
communist country-waves with the highest average corruption tolerance belong to the
third wave (1995 – 1998), i.e. the wave closest to the years that marked the collapse of
the communist systems (1989 – 1991), while relatively few105 of the country-waves from
the third wave belong to the least tolerant ones.
Moreover, four out of the five106 post-communist countries with the lowest
corruption tolerance belong to the most recent wave of the WVS (Wave 6). Albania, for
instance, which has the second highest corruption tolerance in wave 3, has dropped to
an average level by wave 4. All of this taken together is hardly a coincidence, but more
likely due to gradual processes of value change driven by either long-term
104 Five (Albania, Slovakia, Croatia, Latvia, the Czech Republic) out of the top ten post-communist country-waves
with the highest corruption tolerance originate from Wave 3. 105 Only Bulgaria (10th) and Romania (11th) are among the top 11 least tolerant country-waves. 106 Four (Azerbaijan, Romania, Armenia, Georgia) out of the top ten post-communist country-waves with the
lowest corruption tolerance originate from Wave 6.
107
developments (the accumulated experience from the communist era) or short-term
events (the collapse of the communist systems) or a combination of both.
Inglehart (1971) has argued that value change principally happens through a process
called intergenerational population replacement, where younger birth cohorts replace
older ones in the population. Those generations whose basic values were shaped by
the deeply dysfunctional and/or autocratic institutions during their formative107 pre-
adult years are gradually replaced by younger generations who grow up with
relatively less dysfunctional and, at least in some cases, more democratic institutions.
Moreover, those belonging to the former group become more conservative and less
likely to take risks as they grow older (see the previous discussion on age and
corruption tolerance), which would also point to a life-cycle effect when it comes to
attitudes toward deviant behavior. This somewhat slow process could potentially
explain some of the change that we can observe in the previous figure.
4.2.3 Interaction effects
This section explores potential interaction effects between the two key micro-level
variables “Bureaucratic distrust” and “Self-perceived corruption” on one hand, and
“Bureaucratic distrust” and the four key macro-level variables of interest, “GDP per
capita (ln)”, “Economic inequality”, “Control of Corruption”, and “Economic Growth”
on the other. The aim here is to explore if and how the relationship between confidence
in the bureaucratic institutions and corruption tolerance varies within different
contexts and/or across varying perceptions of the extent of public corruption.
First, the section looks at Model 4 in Table 4.4 where Model 3 from the previous table
is re-estimated while this time allowing the relationship between “Bureaucratic
distrust” and “Corruption tolerance” to vary across countries and country-waves. The
results show that the coefficient of “Bureaucratic distrust” has significant random
components (Bureaucratic distrust/Bureaucratic distrust) that differ across countries
and country-waves, which in other words indicates that the relationship between these
two variables does vary across different contexts.108
Next, cross-level interaction terms are introduced to the model to see if they can
contribute to explaining any of the observed variance in effect. Looking at Model 5, the
study finds two significant cross-level interaction effects concerning the key micro- and
macro-level variables: “Bureaucratic distrustxGINI” and “Bureaucratic
107 Inglehart (1971) assumes in the socialization hypothesis that people form their basic values in their pre-adult
years and that they change very little after this period. 108 Deviance decreased from 1971376.023 (Model 3) to 1970657.163 (Model 4), a difference of 718.86. This difference
can be seen as a ꭓ² value with 4 degrees of freedom (four new parameters), which indicates a very high statistical
significance (p<0.01) and that the more complex model is needed.
108
distrustxCorruption”.109 None of the two alternative indicators of socio-economic
development shows any significant interaction effect at all, which indicates that there
are no significant differences concerning the effect of bureaucratic distrust in different
contexts of socio-economic development. The study thereby finds no support for
hypothesis 7 that bureaucratic distrust is more strongly associated with corruption
tolerance in more developed countries.
The following sections take a closer look at the significant interaction effects that the
study does find and compare the results to the remaining hypotheses. Finally, the study
will test hypothesis 9b, i.e. if there is a significant interaction effect in the expected
direction between the two key variables on the individual-level.
109 Deviance decreased from 1970657.163 (Model 4) to 1970631.633 (Model 5), a difference of 25.530. This difference
can be seen as a ꭓ² value with 4 degrees of freedom (four new parameters), which indicates a high statistical
significance (p<0.01).
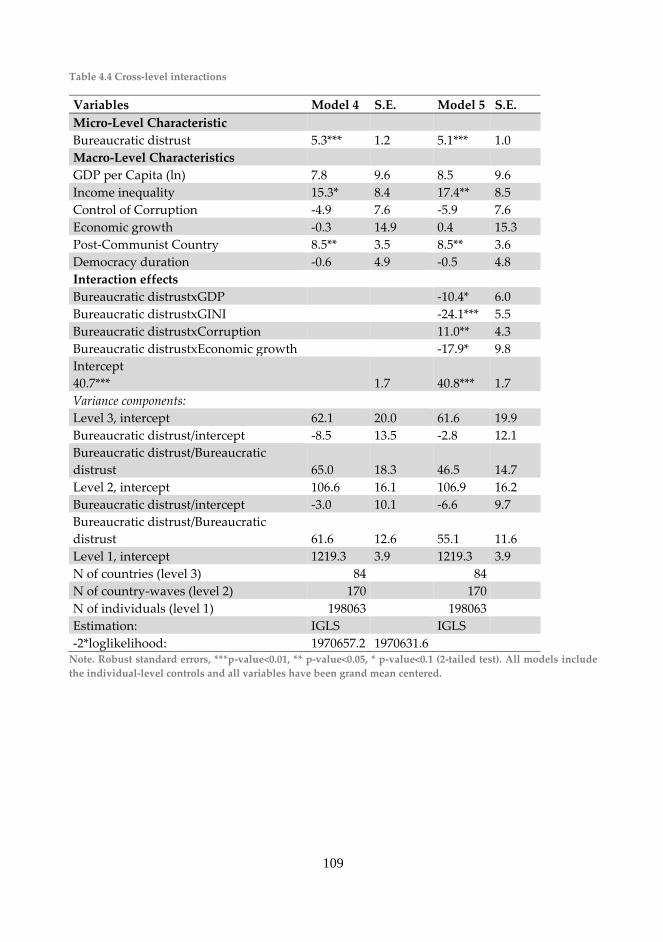
109
Table 4.4 Cross-level interactions
Variables Model 4 S.E. Model 5 S.E.
Micro-Level Characteristic Bureaucratic distrust 5.3*** 1.2 5.1*** 1.0
Macro-Level Characteristics GDP per Capita (ln) 7.8 9.6 8.5 9.6
Income inequality 15.3* 8.4 17.4** 8.5
Control of Corruption -4.9 7.6 -5.9 7.6
Economic growth -0.3 14.9 0.4 15.3
Post-Communist Country 8.5** 3.5 8.5** 3.6
Democracy duration -0.6 4.9 -0.5 4.8
Interaction effects Bureaucratic distrustxGDP -10.4* 6.0
Bureaucratic distrustxGINI -24.1*** 5.5
Bureaucratic distrustxCorruption 11.0** 4.3
Bureaucratic distrustxEconomic growth -17.9* 9.8
Intercept
40.7*** 1.7 40.8*** 1.7
Variance components:
Level 3, intercept 62.1 20.0 61.6 19.9
Bureaucratic distrust/intercept -8.5 13.5 -2.8 12.1
Bureaucratic distrust/Bureaucratic
distrust 65.0 18.3 46.5 14.7
Level 2, intercept 106.6 16.1 106.9 16.2
Bureaucratic distrust/intercept -3.0 10.1 -6.6 9.7
Bureaucratic distrust/Bureaucratic
distrust 61.6 12.6 55.1 11.6
Level 1, intercept 1219.3 3.9 1219.3 3.9
N of countries (level 3) 84 84
N of country-waves (level 2) 170 170
N of individuals (level 1) 198063 198063
Estimation: IGLS IGLS
-2*loglikelihood: 1970657.2 1970631.6 Note. Robust standard errors, ***p-value<0.01, ** p-value<0.05, * p-value<0.1 (2-tailed test). All models include
the individual-level controls and all variables have been grand mean centered.
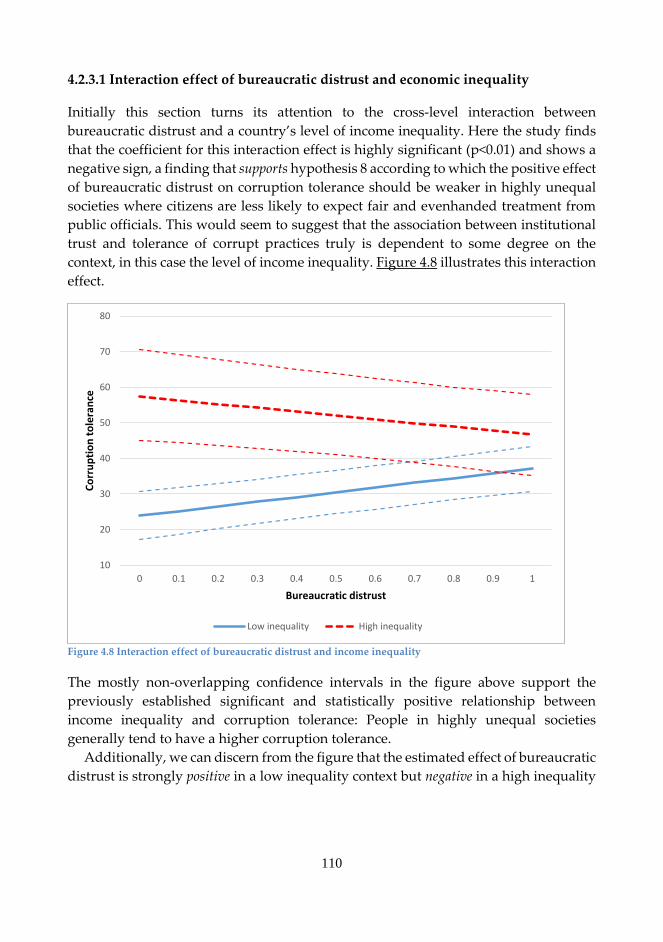
110
4.2.3.1 Interaction effect of bureaucratic distrust and economic inequality
Initially this section turns its attention to the cross-level interaction between
bureaucratic distrust and a country’s level of income inequality. Here the study finds
that the coefficient for this interaction effect is highly significant (p<0.01) and shows a
negative sign, a finding that supports hypothesis 8 according to which the positive effect
of bureaucratic distrust on corruption tolerance should be weaker in highly unequal
societies where citizens are less likely to expect fair and evenhanded treatment from
public officials. This would seem to suggest that the association between institutional
trust and tolerance of corrupt practices truly is dependent to some degree on the
context, in this case the level of income inequality. Figure 4.8 illustrates this interaction
effect.
Figure 4.8 Interaction effect of bureaucratic distrust and income inequality
The mostly non-overlapping confidence intervals in the figure above support the
previously established significant and statistically positive relationship between
income inequality and corruption tolerance: People in highly unequal societies
generally tend to have a higher corruption tolerance.
Additionally, we can discern from the figure that the estimated effect of bureaucratic
distrust is strongly positive in a low inequality context but negative in a high inequality
10
20
30
40
50
60
70
80
0 0.1 0.2 0.3 0.4 0.5 0.6 0.7 0.8 0.9 1
Co
rru
pti
on
to
lera
nce
Bureaucratic distrust
Low inequality High inequality
111
context.110 As inequality rises, the effect of bureaucratic distrust weakens, until it may
even turn negative, which indicates that those with a high confidence in the public
institutions tend to be somewhat more tolerant of corrupt behavior than those with a
low confidence. A highly distrusting individual is estimated to have approximately the
same level of corruption tolerance, around 44 on a scale ranging between 0 and 100,
ceteris paribus, in both a high and a low inequality context, and the largest difference in
corruption tolerance is between the most trusting individuals. An individual with a
high confidence in the public institutions is estimated to have corruption tolerance
score of around 50 in a highly unequal context, while his or her counterpart in an equal
context is estimated to have a corruption tolerance score of around 27.
A potential contributing factor that may help to explain this finding is related to the
earlier discussed general expectations held by the citizens in these societies. A recent
empirical study by Ariely and Uslaner (2016) indicates that ordinary citizens in
unequal countries tend not to expect fair treatment by government officials. Partiality
in favor of elites instead of impartiality is the prevailing norm, while ordinary people
have to pay bribes for basic services and goods that they are righteously entitled to. If
those in highly unequal societies are not as accustomed to expect public officials to be
impartial, it is also likely that the correlation between a high distrust in public
authorities and high corruption tolerance will tend to be significantly weaker.
Distrust may still matter to some degree, but clearly not nearly as much as in more
equal societies where citizens have internalized stronger expectations of impartiality
and fairness on behalf of state actors. Ariely and Uslaner (2016, 360) argue that citizens
“are more likely to associate unfairness with corruption in the countries with more
egalitarian income distributions […and that] these greater expectations for honesty
among public officials lead people to perceive unfair treatment as evidence of
corruption”. If citizens perceive that the government treats them unfairly, they become
more likely to perceive the regime as corrupt, even though this might not actually be
the case, and the extent of corruption in the country is in fact very limited.111
Another potential contributing explanation to this finding is that those who have a
high confidence in the public authorities in these highly unequal (and highly corrupt)
dysfunctional societies are those with personal stakes in the status quo, i.e. the
prevailing institutions, that benefits them in certain ways (Fukuyama 2011, 526). They
have a high confidence in a corrupt civil service, police force and/or judiciary because
110 For instance, in highly unequal Mexico (Gini ~55) the bivariate correlation between bureaucratic distrust and
corruption tolerance is either negative (wave 3) or non-significant in all the included waves, while it is strongly
positive and significant in Finland (wave 3 & 5), which is one of the most equal countries in the world according to
the Gini index (~22). 111 As Ariely and Uslaner (2016, 352) point out, unfairness and corruption is not the same thing. Many things in life
(and in politics especially) are unfair, but that does not mean that it is corrupt. Politics is about winning and losing,
and those who lose are more likely to perceive “foul play”, even though no actual corruption, i.e. abuse of public
power for private gain, was involved.
112
they know that it is corruptible and favors them if given the right incentives. These
stakeholders in the current highly unequal system, who could potentially belong to
wealthy elite groups112 or groups that benefit from clientelistic and patrimonial
systems, are those able to use their resources (both real and social capital) to manipulate
the political and bureaucratic systems in their advantage and to evade capture and
prosecution by corrupt means. Those with a low confidence in the state are meanwhile
the ones who have the most to lose from the prevailing unfair system, those at the
bottom of society who are forced to pay onerous bribes in order to get access to public
services and goods.
4.2.3.2 Interaction effect of bureaucratic distrust and procedural quality
Next, the study turns its attention to the other interaction term that showed any signs
of significance, “Bureaucratic distrustxCorruption”. Does the effect of bureaucratic
distrust also vary across different contexts of procedural quality? The fact that the
coefficient of this interaction term is significant (p<0.05) suggests that this indeed seems
to be the case.
Furthermore, the coefficients of this interaction variable show a positive sign, which
indicates that the effect of bureaucratic distrust is stronger in countries that are deemed
to have a higher procedural quality, i.e. a lower level of corruption. This supports
hypothesis 9a that the positive association between bureaucratic distrust and corruption
tolerance is weaker in countries with low procedural quality (high levels of corruption
and inefficiency) where public institutions are perceived to be “too frail” to have a
significant impact on civic morality (Andrews 2008).
Figure 4.9 illustrates the estimated difference in effect between two different
categories of countries, countries with the lowest score on the Control of Corruption
index and countries with the highest score.
112 As we saw earlier, there are some indications that those with a higher income are more tolerant of corruption,
which could be due to the fact that corruption mainly benefits the wealthy and punishes the poor.
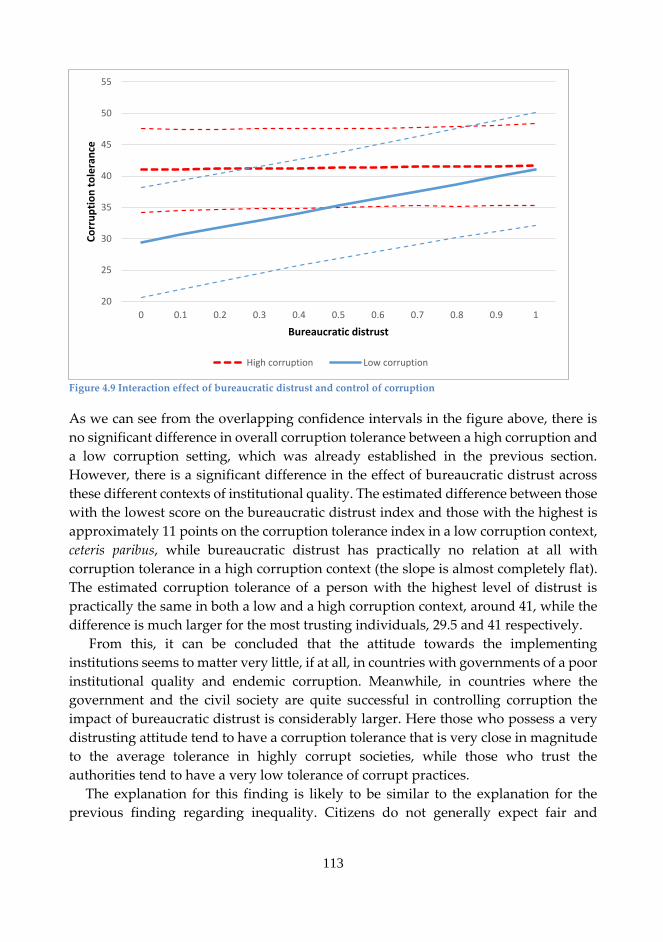
113
Figure 4.9 Interaction effect of bureaucratic distrust and control of corruption
As we can see from the overlapping confidence intervals in the figure above, there is
no significant difference in overall corruption tolerance between a high corruption and
a low corruption setting, which was already established in the previous section.
However, there is a significant difference in the effect of bureaucratic distrust across
these different contexts of institutional quality. The estimated difference between those
with the lowest score on the bureaucratic distrust index and those with the highest is
approximately 11 points on the corruption tolerance index in a low corruption context,
ceteris paribus, while bureaucratic distrust has practically no relation at all with
corruption tolerance in a high corruption context (the slope is almost completely flat).
The estimated corruption tolerance of a person with the highest level of distrust is
practically the same in both a low and a high corruption context, around 41, while the
difference is much larger for the most trusting individuals, 29.5 and 41 respectively.
From this, it can be concluded that the attitude towards the implementing
institutions seems to matter very little, if at all, in countries with governments of a poor
institutional quality and endemic corruption. Meanwhile, in countries where the
government and the civil society are quite successful in controlling corruption the
impact of bureaucratic distrust is considerably larger. Here those who possess a very
distrusting attitude tend to have a corruption tolerance that is very close in magnitude
to the average tolerance in highly corrupt societies, while those who trust the
authorities tend to have a very low tolerance of corrupt practices.
The explanation for this finding is likely to be similar to the explanation for the
previous finding regarding inequality. Citizens do not generally expect fair and
20
25
30
35
40
45
50
55
0 0.1 0.2 0.3 0.4 0.5 0.6 0.7 0.8 0.9 1
Co
rru
pti
on
to
lera
nce
Bureaucratic distrust
High corruption Low corruption
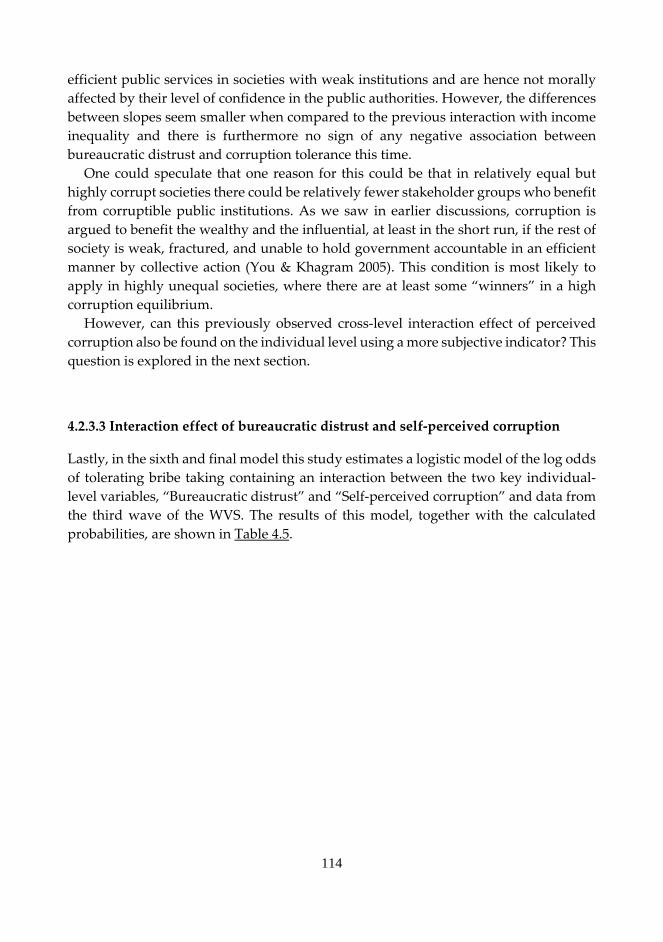
114
efficient public services in societies with weak institutions and are hence not morally
affected by their level of confidence in the public authorities. However, the differences
between slopes seem smaller when compared to the previous interaction with income
inequality and there is furthermore no sign of any negative association between
bureaucratic distrust and corruption tolerance this time.
One could speculate that one reason for this could be that in relatively equal but
highly corrupt societies there could be relatively fewer stakeholder groups who benefit
from corruptible public institutions. As we saw in earlier discussions, corruption is
argued to benefit the wealthy and the influential, at least in the short run, if the rest of
society is weak, fractured, and unable to hold government accountable in an efficient
manner by collective action (You & Khagram 2005). This condition is most likely to
apply in highly unequal societies, where there are at least some “winners” in a high
corruption equilibrium.
However, can this previously observed cross-level interaction effect of perceived
corruption also be found on the individual level using a more subjective indicator? This
question is explored in the next section.
4.2.3.3 Interaction effect of bureaucratic distrust and self-perceived corruption
Lastly, in the sixth and final model this study estimates a logistic model of the log odds
of tolerating bribe taking containing an interaction between the two key individual-
level variables, “Bureaucratic distrust” and “Self-perceived corruption” and data from
the third wave of the WVS. The results of this model, together with the calculated
probabilities, are shown in Table 4.5.
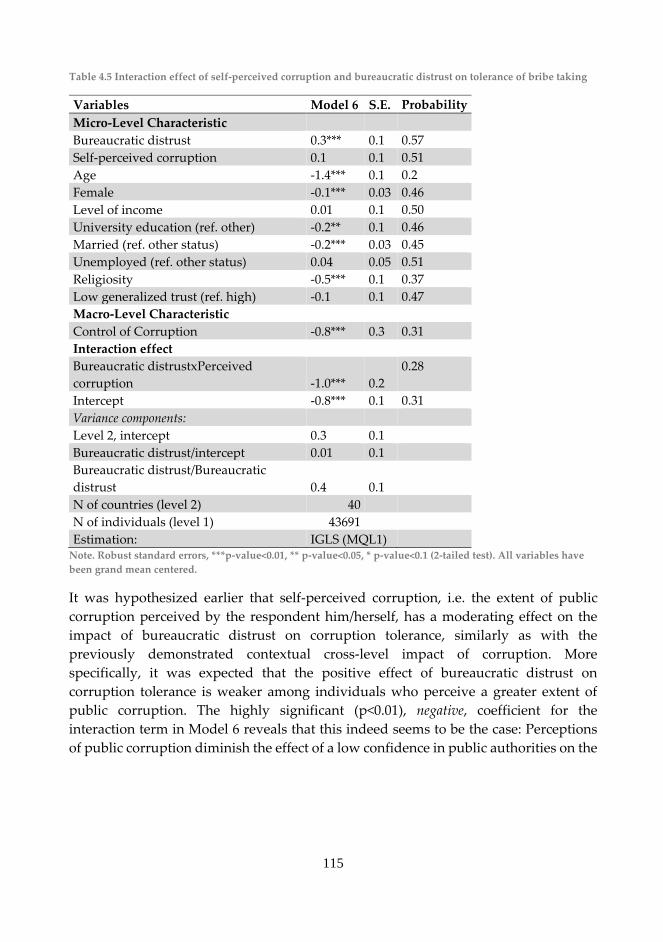
115
Table 4.5 Interaction effect of self-perceived corruption and bureaucratic distrust on tolerance of bribe taking
Variables Model 6 S.E. Probability
Micro-Level Characteristic
Bureaucratic distrust 0.3*** 0.1 0.57
Self-perceived corruption 0.1 0.1 0.51
Age -1.4*** 0.1 0.2
Female -0.1*** 0.03 0.46
Level of income 0.01 0.1 0.50
University education (ref. other) -0.2** 0.1 0.46
Married (ref. other status) -0.2*** 0.03 0.45
Unemployed (ref. other status) 0.04 0.05 0.51
Religiosity -0.5*** 0.1 0.37
Low generalized trust (ref. high) -0.1 0.1 0.47
Macro-Level Characteristic
Control of Corruption -0.8*** 0.3 0.31
Interaction effect
Bureaucratic distrustxPerceived
corruption -1.0*** 0.2
0.28
Intercept -0.8*** 0.1 0.31
Variance components:
Level 2, intercept 0.3 0.1
Bureaucratic distrust/intercept 0.01 0.1
Bureaucratic distrust/Bureaucratic
distrust 0.4 0.1
N of countries (level 2) 40
N of individuals (level 1) 43691
Estimation: IGLS (MQL1) Note. Robust standard errors, ***p-value<0.01, ** p-value<0.05, * p-value<0.1 (2-tailed test). All variables have
been grand mean centered.
It was hypothesized earlier that self-perceived corruption, i.e. the extent of public
corruption perceived by the respondent him/herself, has a moderating effect on the
impact of bureaucratic distrust on corruption tolerance, similarly as with the
previously demonstrated contextual cross-level impact of corruption. More
specifically, it was expected that the positive effect of bureaucratic distrust on
corruption tolerance is weaker among individuals who perceive a greater extent of
public corruption. The highly significant (p<0.01), negative, coefficient for the
interaction term in Model 6 reveals that this indeed seems to be the case: Perceptions
of public corruption diminish the effect of a low confidence in public authorities on the
116
probability of justifying bribe taking. Figure 4.10 illustrates this interaction effect,
which closely resembles the previously observed interactions.
Figure 4.10 Interaction effect of self-perceived extent of corruption and bureaucratic distrust on probability of
tolerating bribe taking
As noted, the pattern in the figure above on the micro-level closely mirrors the pattern
that we saw previously on the macro-level regarding the interaction with the control
of corruption indicator. Here we can see that those who perceive the least public
corruption and who have the highest level of confidence in public authorities have the
estimated very low probability of tolerating bribe taking of around 0.19, ceteris paribus.
Meanwhile, the probability of tolerating bribe taking is almost twice as large,
approximately 0.37, for those who perceive very little public sector corruption but still
have a very low confidence in the implementing institutions.
However, for those who perceive a lot of public corruption, irrespective of their level
of confidence in the authorities, their estimated probability of tolerating bribe taking
remains approximately 0.28, ceteris paribus. This finding seems to support the earlier
conclusion that the individual level of bureaucratic distrust does not seem to matter in
a high corruption environment when it comes to predicting attitudes toward corrupt
behavior.
0,1
0,15
0,2
0,25
0,3
0,35
0,4
0,45
0 0.1 0.2 0.3 0.4 0.5 0.6 0.7 0.8 0.9 1
Bri
be
tak
ing
just
ifia
ble
Bureaucratic distrust
Predicted probability of tolerating bribe taking
Low corruption High corruption
117
4.3 Robustness checks
This final section of the empirical analysis chapter discusses the strategies used to check
the robustness of the findings in this study. Firstly, as was already discussed in the
previous result section and in the section on operationalization of the variables,
multiple alternative indicators for the independent variables are utilized in order to
check the consistency of the results. For instance, two different indicators of socio-
economic development (logged GDP per capita and the Education index) are used to
examine the impact of two distinct but closely related dimensions of the same
phenomenon. All results from using the alternative predictor variables were reported,
although not shown, in the previous section.
Secondly, and related to the first point, a few alternative versions of this study’s
dependent variable and a secondary method of analysis, logistic regression in a
multilevel framework, are tested. The main alternative version of its dependent
variable is a binary transformation of the bribe item used in its index of corruption
tolerance, where respondents received a 0 if they answered that “accepting a bribe in
the course of their duties” is never acceptable, and 1 if they considered it acceptable to
some degree. However, this study also tried using similar binary transformations of
the three other items included in the index, which are not considered to be acts of
corruption in the strict modern sense of the word, but still are arguably important
indicators of civic morality in general and attitudes towards what could be considered
“moral” or “societal” corruption (cheating with taxes, etc.) (Dobel 1978, 960).
The two figures (Figure 4.11 and 4.12) below demonstrate results for two of these
four items concerning the only independent macro variable found to be significantly
related to corruption tolerance in the previous section, income inequality (GINI). First,
in Figure 4.11 we have the predicted probability of finding the main item of interest,
bribe taking, acceptable, which is arguably perceived as the most serious ethical
violation113 from a corruption standpoint and lies closest to the contemporary
understanding of corruption, i.e. abuse of entrusted power for private gain.
113 About 73 percent of the respondents answered that bribe taking is never acceptable.
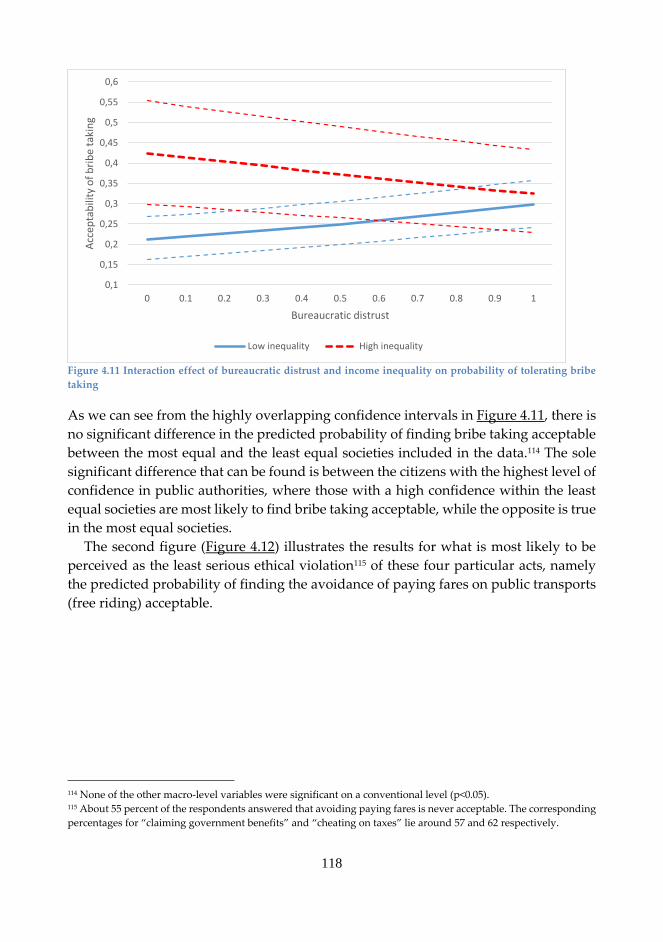
118
Figure 4.11 Interaction effect of bureaucratic distrust and income inequality on probability of tolerating bribe
taking
As we can see from the highly overlapping confidence intervals in Figure 4.11, there is
no significant difference in the predicted probability of finding bribe taking acceptable
between the most equal and the least equal societies included in the data.114 The sole
significant difference that can be found is between the citizens with the highest level of
confidence in public authorities, where those with a high confidence within the least
equal societies are most likely to find bribe taking acceptable, while the opposite is true
in the most equal societies.
The second figure (Figure 4.12) illustrates the results for what is most likely to be
perceived as the least serious ethical violation115 of these four particular acts, namely
the predicted probability of finding the avoidance of paying fares on public transports
(free riding) acceptable.
114 None of the other macro-level variables were significant on a conventional level (p<0.05). 115 About 55 percent of the respondents answered that avoiding paying fares is never acceptable. The corresponding
percentages for “claiming government benefits” and “cheating on taxes” lie around 57 and 62 respectively.
0,1
0,15
0,2
0,25
0,3
0,35
0,4
0,45
0,5
0,55
0,6
0 0.1 0.2 0.3 0.4 0.5 0.6 0.7 0.8 0.9 1
Acc
epta
bili
ty o
f b
rib
e ta
kin
g
Bureaucratic distrust
Low inequality High inequality
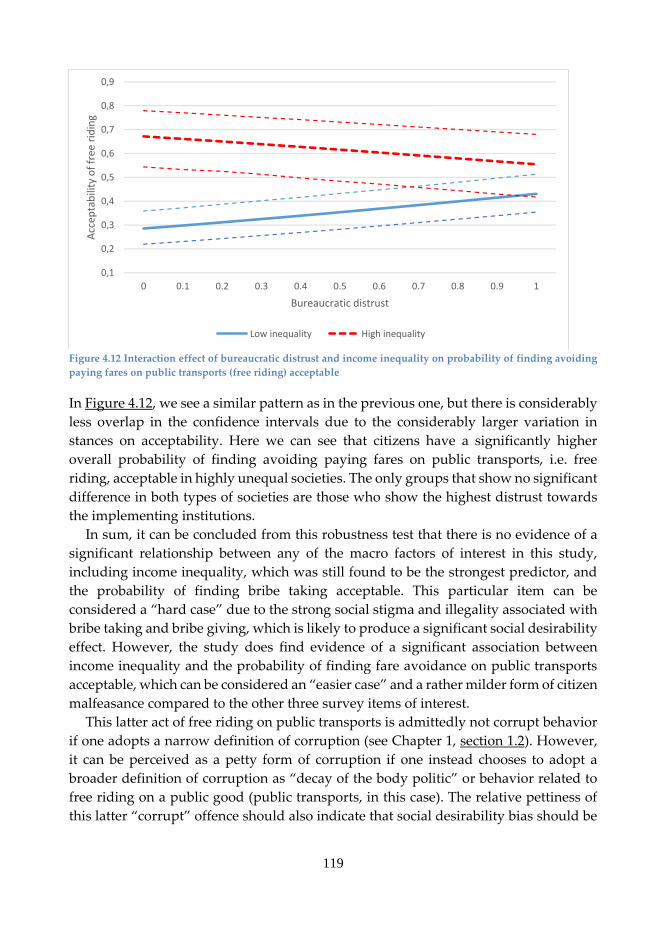
119
Figure 4.12 Interaction effect of bureaucratic distrust and income inequality on probability of finding avoiding
paying fares on public transports (free riding) acceptable
In Figure 4.12, we see a similar pattern as in the previous one, but there is considerably
less overlap in the confidence intervals due to the considerably larger variation in
stances on acceptability. Here we can see that citizens have a significantly higher
overall probability of finding avoiding paying fares on public transports, i.e. free
riding, acceptable in highly unequal societies. The only groups that show no significant
difference in both types of societies are those who show the highest distrust towards
the implementing institutions.
In sum, it can be concluded from this robustness test that there is no evidence of a
significant relationship between any of the macro factors of interest in this study,
including income inequality, which was still found to be the strongest predictor, and
the probability of finding bribe taking acceptable. This particular item can be
considered a “hard case” due to the strong social stigma and illegality associated with
bribe taking and bribe giving, which is likely to produce a significant social desirability
effect. However, the study does find evidence of a significant association between
income inequality and the probability of finding fare avoidance on public transports
acceptable, which can be considered an “easier case” and a rather milder form of citizen
malfeasance compared to the other three survey items of interest.
This latter act of free riding on public transports is admittedly not corrupt behavior
if one adopts a narrow definition of corruption (see Chapter 1, section 1.2). However,
it can be perceived as a petty form of corruption if one instead chooses to adopt a
broader definition of corruption as “decay of the body politic” or behavior related to
free riding on a public good (public transports, in this case). The relative pettiness of
this latter “corrupt” offence should also indicate that social desirability bias should be
0,1
0,2
0,3
0,4
0,5
0,6
0,7
0,8
0,9
0 0.1 0.2 0.3 0.4 0.5 0.6 0.7 0.8 0.9 1
Acc
epta
bili
ty o
f fr
ee r
idin
g
Bureaucratic distrust
Low inequality High inequality
120
considerably less of a problem than in the case of the other more serious items that tend
to carry significantly larger penalties and social stigmas (Welsh et al. 2015).
Previous studies have highlighted correlations between country levels of corruption
and other types of unethical behavior similar to the act of free riding on public
transports, such as parking ticket violations among United Nations diplomats living in
New York City (Fisman & Miguel 2007).116 These findings could therefore indicate that
these types of behavior are intimately linked with corruption and could thereby
function as “cultural” proxies for social norms that may generate more traditional
forms of corrupt behavior. Of course, in this case it is not a question of public officials
abusing their office but of ordinary citizens who justify free riding on a public good,
which still fits the broader conceptualization of societal corruption that takes into
account the abuse of public resources. Even minor abuses can have harsh societal
consequences when they are aggregated over time.
Moreover, it is important to study attitudes towards minor infractions such as free
riding on public transports or parking violations because research has pointed to the
existence of a “slippery-slope” effect where the mechanism of moral disengagement117
allows individuals who have committed minor infractions in the past to gradually
become more prone to justify more serious ethical violations in the future (Welsh et al.
2015).
As a third and final robustness check, this study controls for the potential
confounding influence of certain cultural dimensions often claimed to be associated
with the prevalence of corruption and corrupt behavior (Husted 1999; McLaughlin
2013). More specifically, it used the six measures of national culture118 developed by
social psychologist Geert Hofstede. Are the previously presented findings only
manifestations of some latent differences in cultural programming119, as argued by the
earlier discussed cultural approaches (see Chapter 2, section 2.1.4) to cross-country
differences in political behavior and attitudes?
Including these cultural variables in the main model (Model 3) does not
substantially affect the earlier results concerning the main contextual effects, if
anything, the GINI (and the GDP) coefficient increases in size and displays a higher
level of significance (p<0.01) than before. The only two cultural dimensions to display
116 Fisman and Miguel (2007, 1021) themselves argue that “[t]he act of parking illegally fits well with a standard
definition of corruption, i.e., “the abuse of entrusted power for private gain,” suggesting that the comparison of
parking violations by diplomats from different societies serves as a plausible measure of the extent of corruption
social norms or a corruption “culture””. 117 Welsh et al. (2015, 116) describe moral disengagement as “a form of moral self-deception that allows individuals
to justify unethical behavior and avoid self-censure”. 118 Power Distance, Individualism, Masculinity, Uncertainty Avoidance, Long Term Orientation, and Indulgence
(Hofstede Insights [1]). Results not shown due to missing data for many of the country cases (data was only available
for 55 of 84 cases), but available upon request. 119 Hofstede has defined “culture” as “[t]he collective programming of the mind that distinguishes the members of
one group or category of people from others” (Hofstede Insights [2]).
121
any signs of significance (p<0.05) are Power Distance (PD) and Uncertainty Avoidance
(UA). Moreover, the PD coefficient displays the expected positive sign while the UA
coefficient in turn displays a negative sign.
These results are at least partially120 in line with previous research concerning the
association between corruption and cultural values (e.g. Husted 1999; McLaughlin
2013). Hofstede (in Husted 1999, 343) describes Power Distance as “the extent to which
the less powerful members of institutions and organizations within a country expect
and accept that power is distributed unequally”. High levels of PD are argued to be
reflecting paternalistic modes of power, where the less powerful members of
institutions are expected to show loyalty to their superiors in return for particularistic
favors rather than due to more general legitimacy-related reasons (McLaughlin 2013,
86). Furthermore, an expert panel from a previous study mentioned in Husted (1999,
344) judged that people from a high PD culture should be more likely to perceive
“questionable business practice as ethical”.
Taken together, this evidence would hence seem to suggest that not only is a
relatively high corruption tolerance associated with the unequal distribution of material
wealth (operationalized with the Gini index), it is also associated with high expectations
and tolerance of an unequal distribution of power. While one could expect these two
variables to correlate very strongly with each other, as money is often equaled with
power, this does not in fact seem to be the case according to correlation analysis. The
two variables are according to this analysis positively correlated with each other,
however, the correlation is relatively moderate (Pearson’s r =.225).
With regard to Uncertainty Avoidance, the picture becomes somewhat less clear.
Hofstede (in Husted 1999, 345) defines UA as “the extent to which members of a culture
feel threatened by uncertainty or unknown situations”. Husted argues that because
corruption can be viewed as an uncertainty-reducing mechanism, it should therefore
be more prevalent in high UA cultures. However, based on the previously described
results there seems to be a negative relationship between UA and corruption tolerance,
which would seem to conflict with this expectation.
120 “Masculine” cultures are also sometimes argued to be associated with cultures of corruption due to their tendency
to give high priority to values related with achievement and success (McLaughlin 2013, 86), however, this study
found no significant effect of Masculinity.
122
5. Discussion and conclusions
The overarching goal of this multilevel study with a global focus has been to explore if
tolerance of low-level corruption, conceptualized in a broad, classic Machiavellian
sense as “decay of the body politic”, varies across contexts and if so-called
dysfunctional social contexts (societal structures, such as the distribution of resources,
and public institutions) engender morally dysfunctional or “uncivic” citizens with a
greater tolerance of rule breaking behavior.
Additionally, it has also paid close attention to the association between varying
levels of institutional trust, or more precisely, confidence in the normatively impartial
public institutions, and corruption tolerance, and whether this association varies across
contexts and in what ways.
A number of important implications and conclusions can be drawn based on the
findings in both this study and in earlier related studies regarding what some scholars
call low-level corruption tolerance (Pozsgai Alvarez 2015; Uslaner 2008). However,
there are also a few weaknesses and limitations to this study and the conclusions that
can be drawn from it, which must be brought to light so that the research community
may find better ways of dealing with them in future studies and produce more nuanced
analyses, not least regarding strategies of operationalizing corruption tolerance.
Finally, this chapter provides some concluding remarks and tentative suggestions for
future studies into this highly important topic.
5.1 Findings and implications
Several important findings and implications can be noted on the basis of the empirical
results presented in the previous chapter. This section begins the review of the findings
by focusing on the observed micro-level associations.
First, the individual-level evidence presented in this study indicate that citizens who
harbor a deep distrust towards public authorities, such as the police or the judiciary,
and perceive corruption as widespread among public officials tend on average to be
significantly more tolerant when it comes to low-level corruption and rule breaking
behavior. These two interrelated findings support earlier assertions concerning
institutional trust as a subjective indicator of the perceived legitimacy of the state,
which influences the willingness of citizens to obey formal institutions (laws,
regulations, etc.) and public authorities, and abstain from free riding or rule breaking
behavior that is otherwise viewed as completely unacceptable (e.g. Tyler 2006).
Perceived corruption and incompetence contribute to the delegitimization of formal
institutions and the legitimization of informal practices such as bribery or tax
123
avoidance. If individuals perceive injustice and partiality as the dominant behavioral
strategy among public officials, who are normatively expected to behave in an
impartial and evenhanded manner, they become less likely to behave in the way a
“good citizen” is expected to behave and contribute to the public good.
Second, while there are some differences in the perceived justifiability of certain
unethical behaviors across various societies and cultures, people do not generally come
to tolerate bribe taking, cheating with taxes, and other forms of free riding, even though
they in some cases may feel “compelled” to participate in it due to so-called descriptive
norms, i.e. the perceived frequency of certain types of behavior (Köbis et al. 2015).
Corruption may become a sort of Standard Operating Procedure (SOP) in certain
societies where people continue to take part in corrupt transactions and pay grease
money or kickbacks, even though they strongly oppose and even resent it due to its
intrinsic unfairness, because they believe that other people do likewise and that
refusing to do so would be either foolish, useless or both (Köbis et al. 2015). This is
argued to be the number one reason why many citizens in endemically corrupt
societies may officially promote a highly critical view of corrupt practices such as
paying bribes to the traffic police, while unofficially continuing to contribute to its
reproduction.
People generally recognize that it is both legally and morally wrong (and socially
condemned) and that there are severe negative externalities for society as a whole
associated with this kind of behavior. This is evident from the empirical observations
presented in this study and from the evidence discussed in earlier studies (e.g.
Rothstein & Varraich 2017), which show relatively little variation across different
societies and time periods. The considerably greater variation in perceived and
experienced corruption across different societies demonstrates exactly why the
“corruption trap” of a high corruption equilibrium is so devious and hard to break out
from once a society is caught in it.
Here we can draw some parallels to recent research suggesting that this same
phenomenon also applies to tolerance of or support for corrupt politicians (high-level
corruption tolerance) in contemporary democracies (Agerberg, Forthcoming). When
forced to choose, people generally prefer uncorrupt and honest, but less efficient,
politicians to efficient and corrupt politicians (Allen et al. 2016).
However, in contexts of widespread political corruption citizens may have severe
difficulties in telling honest politicians apart from dishonest ones (“all politicians are
corrupt”), especially if suspicions of corruption and allegations of dishonesty are
commonly used as political weapons to target political opponents. In these particular
contexts, where there is often a lack of reliable and credible sources of information on
the honesty of candidates, it can be more rational for an ordinary citizen to vote for the
candidate who is positioned closest to his or her own political preferences and “gets
things done” (rouba mas faz) or provides concrete clientelistic goods in return for the
124
vote, even though that candidate has a high likelihood of being corrupt. Better to vote
for the devil that you know than for the devil you do not, or, alternatively, abstain from
voting altogether. This might also explain why election turnouts tend to be significantly
lower in more corrupt democracies (Stockemer et al. 2013).
Third, so-called dysfunctional contexts with deep-seated poverty, corrupt and
incompetent public administrations and/or weak economic performance do not
generally tend to produce or consist of dysfunctional citizens unable to distinguish
between civic and uncivic behavior. At least not to any statistically significant degree
when one also includes acts of a more unethical nature than mere free riding on public
transports.
There is no evidence that a country’s level of socio-economic development is directly
related to its average level of corruption tolerance or that citizens in poor developing
countries are generally more uncivic or less virtuous than citizens in more affluent
countries. A lower level of development does not equal inferiority with regard to civic
morality in general.
On the contrary, there is much evidence to suggest that increased material wellbeing
and security make citizens more likely to question and challenge the legitimacy of
different kinds of authorities and social norms. This could in turn in some cases, at least
in the short-run, result in a growing prevalence of what can be considered “uncivic”
norms and behaviors that may include various forms of corruption (Kravtsova et al.
2017). Moreover, there is also the earlier discussed risk that modernization of
traditional societies and the espousal of neo-liberal policies and principles will lead to
an extensive monetization of various aspects of social life (e.g. time, gifts, favors etc.),
which can be conducive to corrupt behavior, especially in transitional societies
(Clammer 2012; Hao & Johnston 2007). The risk is even greater if ordinary citizens
perceive these processes of modernization to be associated with growing inequalities,
as will shortly be discussed.
In sum, societies that are more affluent are not ipso facto more civic and honest or
less corrupt than their poorer cousins. A rapidly increasing level of socio-economic
development or modernization can instead potentially lead to what Huntington (1965)
has called “political decay” and a breakdown of social order, unless governmental
institutions and political development are able to keep up with the intensive economic
growth and the consequential social changes (e.g. growing inequalities) and increasing
demands in modernizing societies.
Likewise, there is no evidence of a significant direct association between
institutional quality, economic performance, and corruption tolerance, after having
controlled for the post-communist transition countries. Countries, which due to their
unique historical experiences with extremely dysfunctional, although relatively strong,
governmental institutions combined with a lack of impersonal free markets have to be
treated as extreme cases of institutional failure (Rose-Ackerman & Palifka 2016, 258-
125
259). The low variance of the dependent variable and the high influence of the post-
communist countries makes it impossible to ascertain for sure if there is an
independent effect of institutional quality. Additional survey data, especially
longitudinal, from a much wider spectrum of contexts are needed in order to be able
to determine with greater certainty if and how institutional quality is related to uncivic,
free riding-condoning attitudes.
Moreover, as we saw in Chapter 2, section 2.1.2, several scholars have criticized the
unidimensional single-score corruption indices for failing to register those forms of
corruption that are more common in mature democracies. These forms take place on
specific levels (e.g. local) or sectors of government and include conflict of interest and
favoritism, which clearly violate the principle of impartiality, and other less clear-cut
forms of corruption that are harder to detect (Andersson 2017; Johnston 2005; Linde &
Erlingsson 2013). The studies by Andersson (2017) and Linde and Erlingsson (2013),
for instance, find that Swedish citizens perceive public sector corruption as a significant
(growing) problem although they very rarely pay bribes for public services. This
finding may at least partially contribute to explaining why there is such a weak link
between country-level measurements of corruption and this study’s measure of
corruption tolerance. Future studies should hence aim at finding multidimensional
approaches to measuring corruption of various types, not just bribery.
Fourth, the sole contextual variable found to be significant in (almost) all models
estimated in this study is economic inequality, operationalized using the income-based
Gini-index. This finding is very much consistent with many of the previous arguments
and observations regarding the destabilizing and adverse effects of high inequality on
societal corruption, social trust, the rule of law and political stability (Dobel 1978;
Rothstein & Uslaner 2005; Uslaner 2008; Paskov & Dewilde 2012).
Highly skewed distributions of economic resources not only have an adverse effect
on social trust and, indirectly, on the extent of corruption in societies, as argued by
Uslaner (2008) in his “inequality trap” thesis. They also seem to be associated with
lower levels of civic morality, another important, but often forgotten or ignored aspect
of the highly debated concept that is often denominated “social capital” and is argued
to be vital for vibrant democratic societies (Letki 2006). Inequality of both wealth and
opportunities is often suggested to have deep and profound effects on the coherence
and solidarity in contemporary societies (e.g. Paskov & Dewilde 2012; Rothstein &
Uslaner 2005).
Ordinary citizens do not consider themselves masters of their own fate in highly
skewed societies and a sense of normlessness is likely to be more prevalent in these
sorts of settings. The poor majority perceives corruption and other forms of
malfeasance as both morally and legally wrong, but many still feel starkly compelled
to take part in it in their own way, using whatever means they have at their disposal,
even though they themselves usually are the principal victims in corrupt and unstable
126
political systems. The illegality or unethicalness of their own behavior seems minor
and insignificant in comparison to the corrupt behavior of powerful elites, so
consequently some may come to view it as justifiable in highly unequal and corrupt
societies where success is often associated with patronage, nepotism and other forms
of elite corruption. Hard labor and honest efforts in turn seem like dead ends in these
contexts, if one hopes to climb the social ranks and reach elite or even middle class
status. People distrust others and expect them to attempt to attain success and
prosperity by means of cheating, and consequently they themselves become more
likely to cheat, resulting in a self-fulfilling prophesy (Uslaner 2004; 2008; 2011).
However, eventually there may come a point when ordinary citizens have had
enough with all the corruption and immorality in their surroundings, which may stoke
an anger and resentment against all forms of corruption, both petty and grand, which
they blame for the dysfunctionalities of their societies. People may lose faith in the
democratic process and institutions, and some may turn to populist and anti-
democratic leaders who promise easy and quick remedies that will rein in the
corruption of the elites, or to left-wing parties who propose radical redistributions of
wealth that result in yet further political turbulence, distrust and violence. This path of
development is unfortunately familiar from many highly polarized countries in the
Latin American context (see e.g. Fukuyama 2014).
As we saw earlier in the theoretical discussion, high levels of inequality and
corruption tend to go hand in hand: high inequality tends to engender environments
that are favorable to various forms of corruption, while corruption in turn tends to have
an inequality increasing effect due to its elite-favoring nature (Uslaner 2008). It
therefore seems probable that it is this vicious cycle of both extreme inequality and
endemic corruption that has the greatest likelihood of generating higher than average
levels of corruption tolerance (both low- and high-level) among citizens. This in turn
further exacerbates the problem of creating and maintaining strong, autonomous and
merit based institutions able to withstand the pressure of influential elites who distort
public policies in their own favor. Autonomous and well-functioning public
institutions demand a sufficient amount of public resources121, resources that are lost
when the willingness to pay taxes becomes weaker, or the willingness to claim
illegitimate social benefits122 grows stronger, not to mention the vast amounts of public
resources that are both directly and indirectly lost due to corruption and outright
waste.
The most obvious policy implication of this particular finding is of course a
recommendation to strive to reduce inequality, especially in the most extreme cases in
Latin America, sub-Saharan Africa and East Asia. However, to do this in practice can
be quite difficult due to the “stickiness” of inequality, and it is likely to take quite some
121 For instance, to pay competitively high wages to public officials. 122 For instance, pensions for already deceased persons.
127
time to achieve even with the right policies in place (Jackman & Miller 2005; Uslaner
2008, see also next section). Another complementary pathway would be to try to erode
the perceived connection between success and corruption by signaling to ordinary
citizens that it is possible to achieve success in life without having to resort to unethical
approaches.
Potential means of achieving this could be reforms that increase transparency in
various fields of public administration such as taxation and public finances in general.
Greater tax transparency regarding how much individuals and businesses have paid
and how the money is used would increase incentives to improve service delivery,
discourage tax evasion and the giving of unjustified tax exemptions to special interests,
and, consequently, increase trust in the impartialness of government (Kornhauser
2005). These kinds of reforms, which are greatly facilitated by the growing
digitalization of contemporary societies, could potentially send powerful signals
through the media that the majority of wealthy individuals and businesses obediently
pay their taxes, as good citizens ought to.
Other alternative methods of “virtue signaling” could include various types of
information campaigns somewhat similar to the “I paid a bribe” initiative in India (I
Paid a Bribe 2019), such as “I pay my taxes”- or “I never free ride”-campaigns on social
media. Extensive information campaigns or just small reminders or prompts of
statistical facts could provide the “nudge” needed to alter descriptive norms, especially
in the relatively “cleaner” regions where the actual frequency of malfeasance is
relatively small and for those persons who lack first-hand experience of real corruption
(Köbis et al. 2015).
This could potentially trigger a virtuous cycle in these regions, however, it is
important to keep in mind that there is always the chance that these transparency- or
knowledge-increasing measures will backfire and instead feed the perceptions of that
“everybody is corrupt”, especially in the relatively “dirtier” regions. Nevertheless, this
could provide the opportunity for more targeted anti-corruption efforts where
resources could be more efficiently concentrated to these more salient problem cases.
Additional research into the effects of “sunshine” reforms and various kinds of
information campaigns (especially on the internet and social media) on corruption
norms and corrupt behavior is clearly needed.
Fifth, the significant random slope coefficients show that the association between
bureaucratic distrust and corruption tolerance is not uniform and indeed tends to vary
to some degree across different contexts. This observation is important because
previous studies have generally assumed that the relationship is always uniform across
different country contexts (e.g. Letki 2006; Pop 2012). Most studies have completely
ignored the possibility that this particular association might vary across contexts (see
Andrews 2008 for an exception).
128
While there is on average a positive relationship between a low confidence in public
authorities and corruption tolerance, as was expected based on earlier results, there are
also cases where this relationship is non-significant or possibly even negative, i.e. that
those who demonstrate a high trust in the bureaucratic institutions tend to be more
tolerant of corrupt and unethical practices than those who show a high distrust. This
latter finding is consistent with the observations of Huntington (1968, 64), who notes
that “both corruption and violence are illegitimate means of making demands upon
the system, but corruption is also an illegitimate mean of satisfying those demands…he
who corrupts a system’s police officers is more likely to identify with the system than he
who storms the system’s police stations” (emphasis added). Those who identify with a
corrupt system and prefer the status quo that serves their interests (i.e. the
stakeholders) are hence arguably more likely to be more trusting of the corrupt system
and to demonstrate a higher tolerance of corrupt and uncivic practices.
Sixth, of the four main contextual variables examined in this study, it seems like
bureaucratic distrust interacts the strongest with income inequality (Gini) while the
second strongest interaction is with corruption control. According to the previously
demonstrated results, a high bureaucratic distrust is most likely to be related to a high
corruption tolerance in the economically least skewed and least corrupt societies, while
the relationship is non-existing or sometimes even negative in the most unequal and
corrupt societies. This last observation implies that a high confidence in public
authorities could in some cases be associated with a high corruption tolerance in
extremely unequal and corrupt societies where corruption tolerance, as we saw, is on
average significantly higher than in more equal societies with a relatively high state
capacity.
The earlier discussed arguments derived partly from Ariely and Uslaner’s (2016)
and Andrews’ (2008) recent studies could potentially assist in interpreting some of the
results from where we looked at the relationship between the level of economic
inequality and corruption tolerance. Perceptions of unfair treatment and that “the
game is rigged” by shadowy elites, i.e. perceptions of grand corruption, is more likely
to result in both distrust of the state and more favorable attitudes towards malfeasance
and uncivic behavior in relatively more equal societies where the principles of fair and
impartial treatment are held in very high regard and often taken for granted. More
poetically speaking, one could say that the fires of revolution burn the brightest where
the ideals are the loftiest. Expectations among citizens thusly play a key role also in this
line of argument.
Ordinary citizens pay taxes and expect high quality and impartial service delivery
in return for their well-earned money. If they for some reason perceive that these
expectations have not been met adequately, they may lose faith in the system and
become less willing to pay taxes and more likely to express more positive sentiments
towards uncivic behavior such as bribery. In highly unequal societies, on the other
129
hand, ordinary people are less likely to perceive impartiality and fairness on behalf of
public officials as the norm. They more or less willingly pay their taxes (or not) but they
do not hold as high expectations of receiving fair and impartial treatment from the
state, which they perceive to be in the pocket of the wealthy few. Consequently, when
they encounter something that they perceive as unfair or partial treatment on behalf of
the state, such as bureaucratic corruption, it does not influence their faith in the system
or their willingness to obey the law as severely as in societies with a more equal
distribution of resources. The public institutions are, in the words of Andrews (2008,
178), “too frail” to have any real direct impact on civic morality.
Another potential reason why fair and impartial treatment is likely to be valued
somewhat higher in more equal societies could also be related to the earlier discussed
prevalence of postmaterial values in society. In extremely unequal societies, where the
proportion of citizens who live below the poverty line tends to be substantial, the
emphasis on material values is likely to be strong. This in turn implies that as long as
the government manages to fulfill at least some of their basic material needs they
would still continue to perceive the government as legitimate, even if it is widely
perceived as corrupt (see the discussion below on the case of Bangladesh). They would
hence base their trust in government more on policy performance, such as the
government’s progress in alleviating poverty or providing affordable living and decent
health care, rather than on procedural quality.
In sum, as we move from a relatively equal society towards a greater degree of
inequality and poverty, the expectation of fairness and impartiality loses its strength
and its association with perceptions of grand corruption becomes weaker. This in turn
results in a relatively lower corruption tolerance for the most distrusting citizens, as
people no longer equal unfairness with grand corruption as strongly as in previous
contexts.
However, as inequality grows, corruption also becomes more widespread, as it
tends to do in highly unequal societies where it is considerably easier for affluent elites
to practice state capture. People blame grand corruption123 and the unethical behavior
of the rich for the economic and social injustices in society, and they come to expect
partiality, rather than impartiality, and unfairness, rather than fairness, which results
in higher levels of corruption tolerance across the whole spectrum of institutional trust.
Thus, it could therefore be argued that it is not the lack of trust in public authority that
is the more likely cause of citizen misbehavior in extremely unequal and corrupt
societies, but rather the perceived link or “odious connection”, in the words of
Tocqueville, between malfeasance and success.
123 As argued by Uslaner (2008), people associate grand corruption with inequality, not petty corruption, due to the
smallness of the sums involved in bureaucratic corruption, which can involve for instance the giving of a small sum
to a doctor or a traffic police.
130
The policy implications of these findings concerning the complex relationship
between institutional trust and corruption tolerance is that traditional reforms aimed
at increasing trust in public administrations, such as codes of conduct, increased
administrative surveillance, professional training, more resources and greater
transparency and bureaucratic competition, are likely to be relatively ineffective in
reducing corruption tolerance in highly unequal and corrupt social contexts (Andrews
2008). The ethical behavior or perceived fairness of street-level public officials does not
matter that much as long as the citizens perceive that the state institutions themselves
are held captive by affluent elites through grand corruption, and are thus judged
illegitimate (Uslaner 2008).
Ambitious reformers should therefore start from the top, i.e. from the head of the
fish, and deal with the main problems of elite corruption on one hand and economic
and social injustice on the other. Reducing societal corruption in general without
tackling these larger issues of inequality and discrimination of non-elites hence seems
like a fool’s errand. As was already discussed, these are no easy matters to deal with,
and the situation is further complicated by Ariely and Uslaner’s (2017, 360) claim that
citizens will show no support for the type of policies that will result in greater equality
and less corruption due to their lack of faith in the government’s ability to deliver
public services.
In more equal and relatively cleaner societies, at least when bribery is concerned, on
the other hand, the question of perceived fair treatment by government officials
becomes more salient. In these contexts, “people see unfair treatment […] as reflecting
a corrupt regime” (Ariely & Uslaner 2017, 360). Reforms in these contexts should
therefore focus more on strengthening and sustaining perceptions of fair treatment by
both individual government officials and institutions. Here, one should also put more
focus on combating the more common and ambiguous forms of public corruption, such
as conflict of interest or favoritism (Andersson 2017).
Any indications of discrimination or maltreatment by even a single individual
official or institution could potentially shake the confidence in the entire system and
result in a greater tolerance of corruption and malfeasance. The more traditional
approaches to evoking high ethical standards and integrity among public officials are
arguably of a considerably greater utility in these kinds of social settings.
However, there are some good reasons to believe that these more traditional
approaches are ultimately insufficient for the task at hand of reducing perceptions of
unfair treatment. Many welfare programs are means tested, which implies that the
government selectively singles out those social groups who are eligible to take part in
programs that provide specific public goods or services (Rothstein 2003, 191). Means
testing often tends to be a very complicated and difficult process largely due to many
gray zones in the legal framework that should be applied to individual citizens. This
procedure often raises suspicions of prejudices, stereotyping, or ignorance on behalf of
131
the means-testing bureaucrat, which of course in turn suggests partial and unfair
treatment of certain individuals or groups. Rothstein and Uslaner (2005, 42) therefore
advocate the establishment of universal social programs, i.e. programs “that are
intended to create equal conditions for citizens regardless of their income,
ethnic/religious background, sex, and race”.124 Such programs are argued to “enhance
social solidarity and the perception of a shared fate among citizens” (Rothstein &
Uslaner 2005, 43), and should therefore arguably lead to a lower corruption tolerance.
Nevertheless, as was already mentioned in a previous paragraph, reforms such as
universalistic welfare programs are difficult to implement in highly unequal settings
due to the endemic lack of trust and sense of “shared fate” in these societies. Moreover,
Rothstein and Uslaner (2005, 53) argue that universalistic welfare policies are hard to
enact without an honest (and effective) government. This argument suggests that even
though this study did not find a significant association between institutional quality
and corruption tolerance, there is still the possibility of at least an indirect tie between
these two variables, through inequality.
Societies with a low state capacity, on one hand, are unable to enact reforms that
reduce economic and social injustice or prevent inequality from spiraling out of hand
due to both resistance from powerful stakeholders and a lack of political support from
ordinary citizens with low social and institutional trust. In countries with less
inequality and higher state capacity, on the other hand, these kinds of reforms should
be easier to enact, and should therefore be a high priority for policy makers who want
to prevent vicious cycles and spur virtuous cycles of civic morality and good
governance. The best advice for policy makers in countries caught in inequality or
social traps (Uslaner 2008; Rothstein 2003), and for the supporting international
community, is hence to concentrate efforts primarily on building a sufficient state
capacity before moving on to other problems (see e.g. Fukuyama 2011; 2014).
At the same time, it is also of great importance to keep citizens educated of what
they reasonably can and should expect in their dealings with the state and its
representatives, and inform them of the criteria used in decision-making. This way we
can try to avoid unrealistic expectations that may needlessly shatter trust in the state.
What is often viewed as unfair treatment on behalf of the state and the legal system is
not necessarily a sign of grand corruption, even though they are strongly connected
(Uslaner 2008, 7). Often it is a result of a political conflict where the citizens who
perceive unfair treatment are on the losing side. Other times, it may be a sign of lack of
124 Universalistic social welfare programs do not of course mean that everybody always gets to take part in the
program and receive, for instance, an equally sized benefit or grant (Rothstein 2003). It only implies that everybody
has an equal opportunity of participating in the program and getting something, irrespective of income, race, gender,
or other social group.
132
integrity among public officials, not public corruption (see Heywood 2018).125 Politics
and public administration needs to become clearer and more transparent for ordinary
citizens so that they can, instead of rebelling against the state, become encouraged to
take part in it more actively through different formal channels of political participation
(Dobel 1978, 972). This way they can strive to change those policies that they perceive
as unfair.
Lastly, one contributing factor to the initially observed higher than average
corruption tolerance in the countries with the most equal income distributions is likely
to be the communist heritage that several of them have, and the turbulent transitions
from command to free market economies on one hand and from autocracy to
democracy on the other. Such transitions may produce a “moral vacuum” and a sense
of normlessness where the previous moral system has been violently torn down and a
new one has not yet fully emerged to replace the old one.
Yufan Hao and Michael Johnston (2007) provide an example of this type of “crisis of
values” with Post-Mao China, which launched market-oriented reforms in 1978. While
the old Maoist view emphasized the socialist values of equality and solidarity before
short-term economic development, new reform-minded leaders such as Deng Xiaoping
instead encouraged people “to get rich and to get rich fast” (Hao & Johnston 2007, 589).
This development together with the rapid economic growth that China experienced is
argued to have generated a strong thirst for money and a kind of materialism where
everything has a price126, which in turn encouraged bribery, embezzlement, swindling,
tax evasion, extortion, smuggling, speculation, and a long list of other unethical and
often illegal practices (Hao & Johnston 2007).
However, because the transition was only partial in nature in China, and moreover
state-controlled, it is highly likely that the consequences for civic morality in general
were considerably less severe than in the countries that experienced a wholesale and
very turbulent transition period. Furthermore, citizens in former communist countries
are also, as we have seen, argued to be more likely to perceive higher levels of grand
corruption and unfairness (Karklins 2005; Uslaner 2008). Consequently, they are
arguably more likely to demonstrate higher levels of corruption tolerance as a result of
perceptions of rapidly rising levels of inequality that erode or prevent social trust from
developing. Policymakers in transition countries should therefore strive to prevent
inequality from further increasing and implement the previously discussed reforms
that may help to build social solidarity and decrease corruption tolerance.
125 As argued by Heywood (2018, 4) “it is quite possible to act noncorruptly but also without integrity; for
instance, by performing a task with little effort, habitually turning up late to work, or refusing to cover for
colleagues”. 126 Hao and Johnston (2007, 590) mention the story of a visitor who asked for directions in Canton and was told,
“Sure I’ll tell you – if you pay me”.
133
5.2 Limitations and suggestions for future studies
All studies have their own strengths and limitations and this one is no exception in this
regard. This section discusses the potential limitations of this study and some of the
steps that have been taken in an attempt to minimize their confounding or distorting
effects, in order to raise awareness of them so that scholars may hopefully find some
more efficient ways of dealing with them in future studies. Furthermore, a few
suggestions are provided for these follow-up studies.
A first obvious limitation concerns the important question of causal direction. It
cannot be proven here without a doubt that negative perceptions of government
institutions or high levels of inequality lead to higher corruption tolerance, rather than
the other way around, i.e. that high levels of corruption tolerance lead to higher levels
of inequality or poorly performing institutions. Put differently, it is rather impossible
to conclude if the fish rots from the head down or from the body up based on the very
broad empirical evidence presented in this study. Moreover, it is also very likely that
the causal direction goes both ways if uncivic attitudes actually lead to a higher
frequency of tax evasion, benefit frauds or even bribery and other unsavory practices.
Practices that result in significant losses of valuable public resources, which in turn
affects the public sector’s ability to provide quality services and build up a sufficient
resistance against attempts of covert influence. In other words, there is a high
probability of “feedback mechanisms” between these variables.
However, the fact that institutional arrangements and incentive structures, such as
the distribution of wealth, tend to be relatively sticky and durable (Jackman & Miller
2005; Uslaner 2008) and unlikely to experience significant short-run changes without
extensive reforms or strong exogenous shocks such as wars or revolutions, suggests
that it is rather unlikely that current popular opinions or values can have any
significant short-term effects on such conditions. At least as long as they do not lead to
the aforementioned wars and revolutions that in turn lead to radical redistributions.
Robert Jackman and Ross Miller’s (2005) extensive examination of the matter instead
points to the conclusion that values and norms are more likely to be endogenous and
influenced by these previously mentioned incentive structure.
Furthermore, as economies grow and diversify, and citizens attain higher levels of
education and adopt values of a more postmaterialistic kind, they are also likely to
become more critical of the inequalities in their surrounding societies (e.g. Welzel &
Inglehart 2008). This would further suggest that the causal pathway is more likely to
go from structural inequality or institutional performance to public attitudes. People
become more aware of their broader social, political and economic conditions, which
in turn increases the likelihood that they will react in a certain way to said conditions.
Another example of this structural rigidity is when formal democratic institutions are
unable to accommodate the increasing number of critical citizens who feel a greater
134
need to participate politically in a more direct way than is currently possible with the
representative institutions based on parties and elections (Dalton 2009).
Moreover, as emphasized by Jackman and Miller (2005, 196), the cultural
explanations proclaim the durability of values, which implies very limited changes in
values and behavior, while the institutional perspective points to changes in behavior
as a result of changes in rules and incentives. The case with the post-communist
countries in turn suggests that it was the very specific and much analyzed institutional
failures of the socialist systems that contributed to shaping public opinions and norms
in the societies in question, not some cultural or civic “backwardness” that can be
traced far back in history. Hence, it is much more likely that perceptions of inequality
or dysfunctional institutions have a considerably greater impact on general attitudes
rather than the other way around. Values and norms may change quite rapidly while
social structures and institutions tend to be more conservative, which can in turn have
deleterious consequences for political order and democratic processes.
Nevertheless, additional research is needed in order to be able to determine with a
greater confidence what the causal pathway actually looks like. Studies based on panel
data and various laboratory and survey experiments are promising avenues in this
regard. In any sense, as was mentioned earlier, this study has also taken some measures
in order to try to deal with this causality problem. One important step is that all the
data for the predictor variables originate from at least one or a couple of years before
the measurement occasion for the dependent variable.
A second limitation concerns social desirability bias (SDB), which could potentially
vary in strength or prevalence across different societies due to various cultural factors.
It is easy to imagine that in some countries, cultures, or religions, it could be perceived
as more taboo to admit to anybody else, and especially to an outsider, that for instance
bribery or cheating with taxes or benefits is ever justifiable, even if that person is
completely anonymous. Take for instance a country like Japan, which has one of the
lowest levels of corruption tolerance according to the index used in this study127, but is
only in 20th place in the CPI 2017 with a score of 73. In more collectivist societies such
as Japan, South Korea or China where conformity to social norms is highly celebrated,
“losing one’s face” by confessing tolerance of deviant behavior may be perceived as
considerably less acceptable than in more individualistic societies (Kim & Markus 1999;
Oh 2013). This may in turn imply that the respondents in these kinds of societies with
certain cultural predispositions are more reluctant to express their actual feelings and
views regarding such matters.
However, this does not necessarily imply that collectivists are more likely to follow
social norms. The study by Se Hyung Oh (2013), for instance, indicates that collectivists
may signal or present a higher level of conformity, but their true or internalized level of
127 Japan’s average score on the corruption tolerance index is 22.6 compared to the total average of 38.3.
135
conformity may not actually differ from that of individualists. Future studies should
hence strive at finding and adopting more appropriate strategies to deal with the
problem of SDB, which may confound the results of cross-cultural studies such as this
one that deal with taboo subjects. Various kinds of survey techniques aiming at
minimizing SDB would be useful in dealing with this problem in future cross-cultural
studies that explore similar questions.
A third potential limitation or problem with this study concerns the
operationalization of its dependent variable, corruption tolerance. Some critics are
likely to argue that the index designed to measure this phenomenon is too broad and
that ultimately, only one of the four items (tolerance of bribery) used to construct this
index can really be defined as corruption in the contemporary sense of the word.
However, this study would argue that this is not necessarily a problem, or at least not
an insurmountable one, for a couple of reasons.
Limiting this study solely to attitudes regarding public corruption, i.e. corruption
involving public officials, would result in too narrow a perspective for the purposes of
this study. While the act of bribe taking or giving is often considered synonymous with
corruption, many forms of behavior are not as clearly designated as “corruption”.
These more ambiguous cases, which sometimes are called “grey corruption” following
Heidenheimer’s (1970) famous typology (see Chapter 1, section 1.2), tend to be
somewhat controversial and perceived by some as too petty to be what they consider
actual forms of corruption. Choosing to focus exclusively on the act of bribery would
arguably limit this study too much and unnecessarily, and would thereby exclude
various types of embezzlement, collusion and other forms of “minor” malfeasance
often associated with corruption. Corruption is, as we have seen in previous
discussions, a considerably broader phenomenon than mere bribery and concerns
several different aspects of civic morality. That is why this study chose to adopt a
definition resembling the significantly broader and pre-modern view of corruption as
“decay of the body politic” or “societal corruption”.
Despite these remarks to the above-mentioned criticism, this study still generally
agrees with the observation that the corruption tolerance index used here is somewhat
too broad and cumbersome for the purpose of studying attitudes towards corruption
across countries in a more detailed fashion, taking into account different dimensions
of corruption such as public corruption. In lack of better alternatives, this study must
make do with what it presently has at its disposal when it comes to worldwide surveys.
There have been many fascinating case and area studies of corruption tolerance such
as Lascoumes and Tomescu-Hatto’s (2008) study of attitudes in France or the multitude
of studies that have emerged from the Latin American Public Opinion Project (LAPOP)
over the last couple of decades. However, we are still lacking detailed global surveys
on corruption that enable statistical analyses of differences in public attitudes across
both countries and time. Future waves of global studies such as the WVS should hence
136
strive to include a greater number of items that concern behaviors commonly thought
of as (black) corruption, such as favoritism, nepotism, conflicts of interest, vote buying,
etc., and behaviors that can be perceived as borderline (white and/or grey) corruption,
such as lobbying or political appointments for non-political offices.128
Furthermore, it would also be of great interest to have more attitudinal studies of
so-called “corruption-free” environments such as the Nordic countries and other
advanced democracies, especially with regard to various forms of grey corruption. Can
we find similar ambiguities as was found in the French study concerning less clear-cut
cases of what some perceive as corruption? Where do people and groups in these
contexts draw the line between what is corrupt behavior and what is not? Do people
perceive differences in the role of politicians on one hand and bureaucrats on the other
when it comes to corruption? These are a few examples of the types of questions that
future studies could and should attempt to answer.
A fourth limitation is that this study is located too high on Giovanni Sartori’s “ladder
of abstraction”, i.e. it is too broad or generalizing, in order to be able to take into account
more specific conditions that may have had an impact on the phenomenon of interest.
As we saw earlier, there is a relatively large variation across individual survey waves
within the same country context in some cases. This unexplained variation could
potentially be the result of political scandals, conflicts or some other recent events or
developments that may have had an effect on public opinion. Similarly, the very broad
objective indicators used in this study are not sensitive enough to be able to take into
account the potential impacts of different dimensions of institutional performance or
the relative performance of political systems across time. Citizens may in some cases
perceive that states that have performed very poorly in the past perform comparatively
better today, at least within some areas such as poverty alleviation, health service or
security provision, even though they still lag very much behind the highly developed
countries in general performance. Take for instance the case of Bangladesh, the country
that demonstrates the lowest level of corruption tolerance according to the index used
in this study.
Previous studies have indicated a considerable gap between the by experts observed
institutional trustworthiness and the public survey reported level of trust in public
institutions in Bangladesh (Askvik & Jamil 2013). Bangladeshi citizens have tended to
demonstrate a significantly higher trust in certain public institutions (especially
parliament and central government) than would be predicted based on expert
evaluations of institutional quality and comparisons with other developing countries.
Naomi Hossain’s (2008) explanation for this observed gap is that there have been some
fully legitimate and rational reasons for many Bangladeshi citizens, especially among
the poor who constitute a very large proportion of the population of Bangladesh, to
128 The seventh wave of the World Values Survey (forthcoming) includes corruption as a new topic and nine separate
items concerning this topic (WVS [2]).
137
trust the government who has made some good progress, particularly since the 1990s,
in alleviating poverty and providing public goods that fill their more materialistic
needs.
Hossain’s (2008) interpretation of the gap, if correct, could potentially support the
institutional performance- or “rotting fish” thesis: The relative change towards better
policy performance has induced ordinary citizens to show a greater loyalty towards
the central government. However, it is extremely difficult to control for the relative
performance across time of individual countries in a large-N study such as this one that
strives to utilize more objective performance indicators that are comparable across
countries. Hence, this could at least partly explain why the expected association
between institutional quality and corruption tolerance is so seemingly weak or non-
existing according to the results. In sum, relative performance across time or specific
dimensions of institutional performance could matter more than general performance
relative to other countries, at least with regard to institutional trust and in some
contexts where poor citizens who espouse to more materialistic values have perceived
some indications of a positive change in policy performance.
A fifth limitation closely related to the previously discussed criticism concerning the
high level of abstraction is that this study is unable to take into account potential
intrastate variation (Rose-Ackerman & Palifka 2016, 248). Heywood (2018, 12), among
others, argues that we should stop our “near exclusive focus on nation-states as our
unit of analysis–and with it, the increasing production of rank indices measuring the
amount of corruption in any one state compared with another”. The focus on nation-
states is perfectly understandable given their claim to sovereignty and legitimate
authority, however, it is also quite problematic. Aksel Sundström and Daniel
Stockemer (2015), for instance, observe in their study of the relationship between
corruption perceptions and turnout across 170 European regions that France’s regions
are located between the fiftieth and the eightieth percentiles in their relative corruption
level across all regions. There is hence likely to be substantial variation in corruption
tolerance across different regions within a state, such as for instance between the
Southern and Northern regions/states of Italy or the United States, or between the
former West and East Germany. Scholars should hence assert more effort into
gathering cross-regional empirical data so that this variation can also be included in
future multi-level studies.
138
5.3 Concluding remarks
The aim of this dissertation has been to contribute to the relatively meager literature
on what many scholars call “corruption tolerance”, or more specifically “low-level
corruption tolerance”. This is done by on the one hand reviewing the arguments and
conclusions and summarizing the findings of previous studies, and on the other hand,
contributing with some empirical evidence on potential determinants of corruption
tolerance.
As we have seen, many studies have examined variations in the extent of corrupt
behavior and various other types of uncivic behaviors such as tax evasion, but the
willingness to take part in such acts does not automatically translate into a general
acceptance of such behavior on the part of others or even themselves. People generally
do not behave corruptly solely due to a certain type of psyche. To blame such behavior
mainly on the moral depravation or greediness of the actors who take part in corrupt
activities is, in the words of Gissur Erlingsson, Andreas Bergh, and Mats Sjölin (2008,
600), “not intellectually satisfying”. Individuals may feel that they lack any real options
and have no choice but to behave in a certain way, and consequently find various ways
of justifying and explaining their own behavior, but this does mean that they perceive
it as a legitimate way of pursuing personal interests. The same goes for norms of
accountability: Individuals from societies where public monitoring is weak and
enforcement is ineffective may feel a greater unwillingness to report bribery and other
malfeasance, but this does not imply that they are in general more tolerant or accepting
of such behavior (Zhang 2017). As many previous studies on human behavior have
shown, incentives are often key due to the myopia or shortsightedness of human
beings.
The observations and evidence presented in this study in turn cast doubt on if we
can truly even speak of a “cultural basis of corruption” and a link between indicators
of governmental quality and mass attitudes towards malfeasance and uncivic behavior.
The answer to the question “is there a cultural basis for corruption?” could be
affirmative if we would choose to view the extent of inequality as a dimension or an
indicator of political culture instead of a socio-economic indicator. This view could
arguably be taken due to the earlier discussed stickiness of economic inequality.
However, the relationship between the perceived corruption of public institutions and
corruption tolerance is more ambiguous. Can we then really speak of an actual
“tolerance” or should we instead find some other alternative term, such as “reluctant
acceptance”, to characterize the situation in many societies caught in a high corruption
equilibrium with poorly institutionalized public institutions? This study has no
definitive answer here and it leaves it to others to attempt to answer this question.
However, as we have seen in this study there seems to be some cases, although
139
relatively few, where one can truly speak of a higher tolerance of malfeasance and
uncivic behavior.
One major theme that has been explored in this dissertation concerns the
relationship between forces of modernization and attitudes towards malfeasance and
uncivic behavior involving free riding on the public good and abuse of public
resources. This study would argue here, similarly as Huntington (1968), that corruption
tolerance and especially corruption itself should not simply be seen as a symptom of
dysfunctional societies and an inherent rottenness, but more as a (unfortunate) side
effect of these previously mentioned modernization processes.
Modernization inevitably leads to value change in broad layers of society, and some
aspects of this value change can, as we have seen, be quite conducive to corruption,
even though they are vital for further economic growth. The “spirit of capitalism” can
be harnessed either in a way that is also beneficial for society as a whole or in a myopic
way that is only beneficial for in-groups and potentially damaging for out-groups
within a society. Public institutions play a key part in steering along which paths this
spirit is channeled and for what purposes it is utilized. Fukuyama (2014) argues that
clientelism, which is often associated with corruption, should be viewed as an early
form of democratic participation in countries with a relatively poor and uneducated
electorate and weak public bureaucracies that can be exploited by parties and
individual politicians for clientelistic purposes. A well-resourced professional, merit-
based and autonomous public bureaucracy can better resist such and other more
nefarious attempts by “political entrepreneurs” who may feel tempted to direct their
entrepreneurial energy and self-interest towards corrupt ends. Countries with robust
and efficient public institutions are hence better equipped to block all manner of
corrupt influence even though the general opinion towards malfeasance becomes less
harsh as societal incentive structures change.
The empirical evidence presented in this study shows no obvious connection
between perceived levels of corruption and government efficiency and the measure of
corruption tolerance used in this study. Institutional quality is seemingly not sufficient
to explain cross-country differences in corruption tolerance, and neither is socio-
economic development or modernization by themselves. However, there is one specific
structural factor that seems to be to some degree related to a “higher-than-normal”
corruption tolerance and a weak social capital endowment, namely economic
inequality. High levels of inequality tend to signal a weak and corrupt public sector
dominated by certain well-organized and wealthy private actors that are able to use
their privileged access to block reforms that could increase equality and benefit society
as a whole. The citizens in these kinds of societies sense this and become cynical
towards the state, the political elites and even towards democracy itself as a political
system “of the people, by the people, for the people”.

140
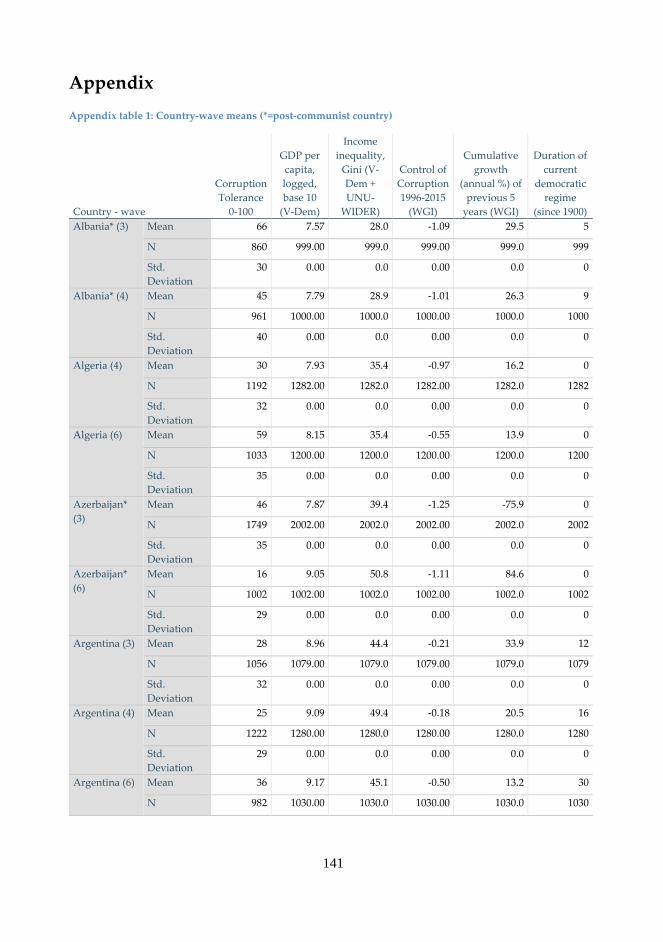
141
Appendix
Appendix table 1: Country-wave means (*=post-communist country)
Country - wave
Corruption
Tolerance
0-100
GDP per
capita,
logged,
base 10
(V-Dem)
Income
inequality,
Gini (V-
Dem +
UNU-
WIDER)
Control of
Corruption
1996-2015
(WGI)
Cumulative
growth
(annual %) of
previous 5
years (WGI)
Duration of
current
democratic
regime
(since 1900)
Albania* (3) Mean 66 7.57 28.0 -1.09 29.5 5
N 860 999.00 999.0 999.00 999.0 999
Std.
Deviation
30 0.00 0.0 0.00 0.0 0
Albania* (4) Mean 45 7.79 28.9 -1.01 26.3 9
N 961 1000.00 1000.0 1000.00 1000.0 1000
Std.
Deviation
40 0.00 0.0 0.00 0.0 0
Algeria (4) Mean 30 7.93 35.4 -0.97 16.2 0
N 1192 1282.00 1282.0 1282.00 1282.0 1282
Std.
Deviation
32 0.00 0.0 0.00 0.0 0
Algeria (6) Mean 59 8.15 35.4 -0.55 13.9 0
N 1033 1200.00 1200.0 1200.00 1200.0 1200
Std.
Deviation
35 0.00 0.0 0.00 0.0 0
Azerbaijan*
(3)
Mean 46 7.87 39.4 -1.25 -75.9 0
N 1749 2002.00 2002.0 2002.00 2002.0 2002
Std.
Deviation
35 0.00 0.0 0.00 0.0 0
Azerbaijan*
(6)
Mean 16 9.05 50.8 -1.11 84.6 0
N 1002 1002.00 1002.0 1002.00 1002.0 1002
Std.
Deviation
29 0.00 0.0 0.00 0.0 0
Argentina (3) Mean 28 8.96 44.4 -0.21 33.9 12
N 1056 1079.00 1079.0 1079.00 1079.0 1079
Std.
Deviation
32 0.00 0.0 0.00 0.0 0
Argentina (4) Mean 25 9.09 49.4 -0.18 20.5 16
N 1222 1280.00 1280.0 1280.00 1280.0 1280
Std.
Deviation
29 0.00 0.0 0.00 0.0 0
Argentina (6) Mean 36 9.17 45.1 -0.50 13.2 30
N 982 1030.00 1030.0 1030.00 1030.0 1030
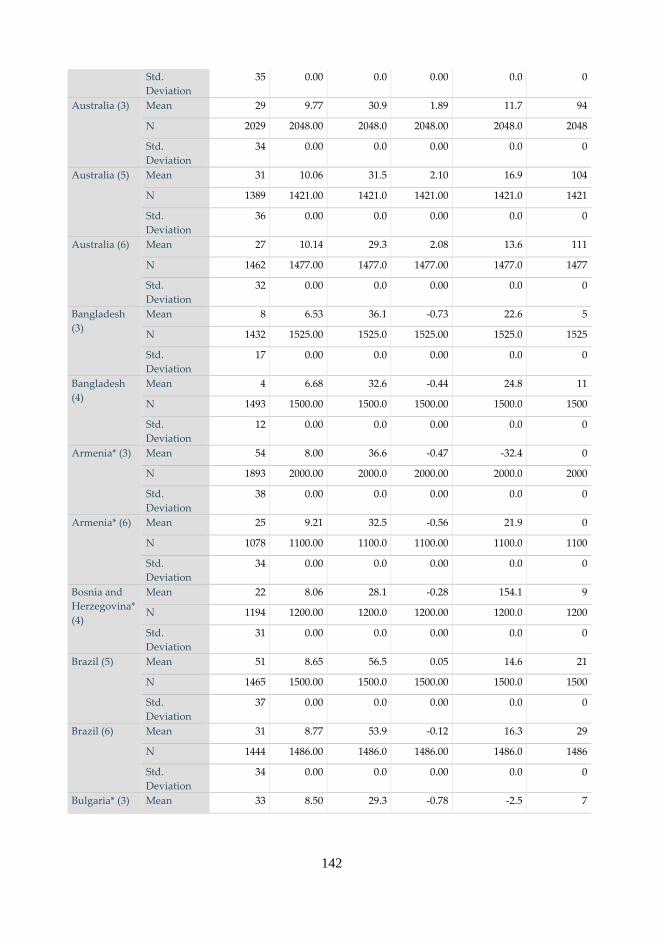
142
Std.
Deviation
35 0.00 0.0 0.00 0.0 0
Australia (3) Mean 29 9.77 30.9 1.89 11.7 94
N 2029 2048.00 2048.0 2048.00 2048.0 2048
Std.
Deviation
34 0.00 0.0 0.00 0.0 0
Australia (5) Mean 31 10.06 31.5 2.10 16.9 104
N 1389 1421.00 1421.0 1421.00 1421.0 1421
Std.
Deviation
36 0.00 0.0 0.00 0.0 0
Australia (6) Mean 27 10.14 29.3 2.08 13.6 111
N 1462 1477.00 1477.0 1477.00 1477.0 1477
Std.
Deviation
32 0.00 0.0 0.00 0.0 0
Bangladesh
(3)
Mean 8 6.53 36.1 -0.73 22.6 5
N 1432 1525.00 1525.0 1525.00 1525.0 1525
Std.
Deviation
17 0.00 0.0 0.00 0.0 0
Bangladesh
(4)
Mean 4 6.68 32.6 -0.44 24.8 11
N 1493 1500.00 1500.0 1500.00 1500.0 1500
Std.
Deviation
12 0.00 0.0 0.00 0.0 0
Armenia* (3) Mean 54 8.00 36.6 -0.47 -32.4 0
N 1893 2000.00 2000.0 2000.00 2000.0 2000
Std.
Deviation
38 0.00 0.0 0.00 0.0 0
Armenia* (6) Mean 25 9.21 32.5 -0.56 21.9 0
N 1078 1100.00 1100.0 1100.00 1100.0 1100
Std.
Deviation
34 0.00 0.0 0.00 0.0 0
Bosnia and
Herzegovina*
(4)
Mean 22 8.06 28.1 -0.28 154.1 9
N 1194 1200.00 1200.0 1200.00 1200.0 1200
Std.
Deviation
31 0.00 0.0 0.00 0.0 0
Brazil (5) Mean 51 8.65 56.5 0.05 14.6 21
N 1465 1500.00 1500.0 1500.00 1500.0 1500
Std.
Deviation
37 0.00 0.0 0.00 0.0 0
Brazil (6) Mean 31 8.77 53.9 -0.12 16.3 29
N 1444 1486.00 1486.0 1486.00 1486.0 1486
Std.
Deviation
34 0.00 0.0 0.00 0.0 0
Bulgaria* (3) Mean 33 8.50 29.3 -0.78 -2.5 7
143
N 1023 1072.00 1072.0 1072.00 1072.0 1072
Std.
Deviation
38 0.00 0.0 0.00 0.0 0
Bulgaria* (5) Mean 41 8.85 30.9 0.10 26.8 15
N 952 1001.00 1001.0 1001.00 1001.0 1001
Std.
Deviation
40 0.00 0.0 0.00 0.0 0
Belarus* (3) Mean 52 8.68 30.8 -0.93 -40.5 3
N 1799 2092.00 2092.0 2092.00 2092.0 2092
Std.
Deviation
36 0.00 0.0 0.00 0.0 0
Belarus* (6) Mean 57 9.45 27.7 -0.64 36.8 0
N 1522 1535.00 1535.0 1535.00 1535.0 1535
Std.
Deviation
39 0.00 0.0 0.00 0.0 0
Canada (4) Mean 28 9.93 32.4 2.24 17.7 99
N 1902 1931.00 1931.0 1931.00 1931.0 1931
Std.
Deviation
35 0.00 0.0 0.00 0.0 0
Canada (5) Mean 31 10.08 33.0 1.85 12.9 105
N 2118 2164.00 2164.0 2164.00 2164.0 2164
Std.
Deviation
37 0.00 0.0 0.00 0.0 0
Chile (3) Mean 38 8.97 50.0 1.45 39.5 6
N 959 1000.00 1000.0 1000.00 1000.0 1000
Std.
Deviation
38 0.00 0.0 0.00 0.0 0
Chile (4) Mean 42 9.22 55.4 1.36 27.0 10
N 1143 1200.00 1200.0 1200.00 1200.0 1200
Std.
Deviation
37 0.00 0.0 0.00 0.0 0
Chile (5) Mean 49 9.35 54.6 1.37 23.4 16
N 915 1000.00 1000.0 1000.00 1000.0 1000
Std.
Deviation
36 0.00 0.0 0.00 0.0 0
Chile (6) Mean 42 9.49 52.0 1.35 18.9 21
N 959 1000.00 1000.0 1000.00 1000.0 1000
Std.
Deviation
37 0.00 0.0 0.00 0.0 0
China (5) Mean 38 8.55 46.9 -0.56 53.3 0
N 1462 1991.00 1991.0 1991.00 1991.0 1991
Std.
Deviation
37 0.00 0.0 0.00 0.0 0
144
China (6) Mean 53 8.90 39.0 -0.54 53.4 0
N 1852 2300.00 2300.0 2300.00 2300.0 2300
Std.
Deviation
39 0.00 0.0 0.00 0.0 0
Taiwan (3) Mean 36 9.39 31.6 0.59 30.4 0
N 757 780.00 780.0 780.00 780.0 780
Std.
Deviation
37 0.00 0.0 0.00 0.0 0
Taiwan (5) Mean 38 9.83 33.8 0.86 15.7 10
N 1216 1227.00 1227.0 1227.00 1227.0 1227
Std.
Deviation
37 0.00 0.0 0.00 0.0 0
Taiwan (6) Mean 45 9.96 34.5 0.60 19.3 16
N 1147 1238.00 1238.0 1238.00 1238.0 1238
Std.
Deviation
35 0.00 0.0 0.00 0.0 0
Colombia (3) Mean 35 8.54 59.2 -0.49 18.8 39
N 2991 2996.00 2996.0 2996.00 2996.0 2996
Std.
Deviation
36 0.00 0.0 0.00 0.0 0
Colombia (6) Mean 41 8.83 53.6 -0.30 22.8 54
N 1496 1512.00 1512.0 1512.00 1512.0 1512
Std.
Deviation
35 0.00 0.0 0.00 0.0 0
Croatia* (3) Mean 62 8.59 26.5 -0.82 -10.3 0
N 1158 1196.00 1196.0 1196.00 1196.0 1196
Std.
Deviation
34 0.00 0.0 0.00 0.0 0
Czech
Republic* (3)
Mean 54 8.96 25.8 0.65 12.8 5
N 1087 1147.00 1147.0 1147.00 1147.0 1147
Std.
Deviation
38 0.00 0.0 0.00 0.0 0
Dominican
Republic (3)
Mean 28 7.94 49.9 -0.10 26.4 30
N 393 417.00 417.0 417.00 417.0 417
Std.
Deviation
33 0.00 0.0 0.00 0.0 0
Ecuador (6) Mean 45 8.51 48.7 -0.89 24.0 10
N 1199 1202.00 1202.0 1202.00 1202.0 1202
Std.
Deviation
40 0.00 0.0 0.00 0.0 0
Estonia* (3) Mean 40 8.99 36.8 -0.06 -20.3 5
N 951 1021.00 1021.0 1021.00 1021.0 1021
145
Std.
Deviation
33 0.00 0.0 0.00 0.0 0
Estonia* (6) Mean 46 9.83 31.5 0.91 0.2 20
N 1451 1533.00 1533.0 1533.00 1533.0 1533
Std.
Deviation
37 0.00 0.0 0.00 0.0 0
Finland (3) Mean 35 9.61 24.9 2.36 -1.8 79
N 966 987.00 987.0 987.00 987.0 987
Std.
Deviation
35 0.00 0.0 0.00 0.0 0
Finland (5) Mean 40 9.99 26.6 2.53 15.8 88
N 1012 1014.00 1014.0 1014.00 1014.0 1014
Std.
Deviation
36 0.00 0.0 0.00 0.0 0
France (5) Mean 49 9.96 28.3 1.34 8.2 105
N 993 1001.00 1001.0 1001.00 1001.0 1001
Std.
Deviation
37 0.00 0.0 0.00 0.0 0
Georgia* (3) Mean 45 7.79 40.0 -1.39 -103.1 0
N 1949 2008.00 2008.0 2008.00 2008.0 2008
Std.
Deviation
38 0.00 0.0 0.00 0.0 0
Georgia* (5) Mean 25 8.36 39.8 -0.61 39.5 0
N 1430 1500.00 1500.0 1500.00 1500.0 1500
Std.
Deviation
36 0.00 0.0 0.00 0.0 0
Georgia* (6) Mean 25 8.66 41.9 -0.22 19.5 10
N 1196 1202.00 1202.0 1202.00 1202.0 1202
Std.
Deviation
34 0.00 0.0 0.00 0.0 0
Germany (3) Mean 43 9.72 28.9 1.99 5.9 7
N 1998 2026.00 2026.0 2026.00 2026.0 2026
Std.
Deviation
36 0.00 0.0 0.00 0.0 0
Germany (5) Mean 37 9.87 28.7 1.86 2.9 16
N 2016 2064.00 2064.0 2064.00 2064.0 2064
Std.
Deviation
39 0.00 0.0 0.00 0.0 0
Ghana (5) Mean 35 7.32 40.7 -0.22 27.6 10
N 1473 1534.00 1534.0 1534.00 1534.0 1534
Std.
Deviation
30 0.00 0.0 0.00 0.0 0
Ghana (6) Mean 34 7.51 40.7 0.03 40.1 15
146
N 1552 1552.00 1552.0 1552.00 1552.0 1552
Std.
Deviation
37 0.00 0.0 0.00 0.0 0
Guatemala (5) Mean 54 8.32 49.0 -0.54 16.1 34
N 992 1000.00 1000.0 1000.00 1000.0 1000
Std.
Deviation
37 0.00 0.0 0.00 0.0 0
Hungary* (5) Mean 45 8.99 30.0 0.65 14.5 19
N 999 1007.00 1007.0 1007.00 1007.0 1007
Std.
Deviation
39 0.00 0.0 0.00 0.0 0
India (3) Mean 20 7.25 31.5 -0.40 23.4 45
N 1851 2040.00 2040.0 2040.00 2040.0 2040
Std.
Deviation
33 0.00 0.0 0.00 0.0 0
India (4) Mean 19 7.47 28.4 -0.28 30.3 51
N 1816 2002.00 2002.0 2002.00 2002.0 2002
Std.
Deviation
33 0.00 0.0 0.00 0.0 0
India (5) Mean 37 7.73 37.2 -0.41 33.7 56
N 1585 2001.00 2001.0 2001.00 2001.0 2001
Std.
Deviation
41 0.00 0.0 0.00 0.0 0
India (6) Mean 79 8.06 34.7 -0.48 37.1 64
N 1544 1581.00 1581.0 1581.00 1581.0 1581
Std.
Deviation
28 0.00 0.0 0.00 0.0 0
Indonesia (4) Mean 27 8.06 29.7 -1.08 5.1 2
N 965 1000.00 1000.0 1000.00 1000.0 1000
Std.
Deviation
29 0.00 0.0 0.00 0.0 0
Indonesia (5) Mean 22 8.20 32.0 -0.89 23.6 7
N 1936 2015.00 2015.0 2015.00 2015.0 2015
Std.
Deviation
32 0.00 0.0 0.00 0.0 0
Iran (4) Mean 16 8.32 44.1 -0.77 14.0 0
N 2208 2532.00 2532.0 2532.00 2532.0 2532
Std.
Deviation
25 0.00 0.0 0.00 0.0 0
Iran (5) Mean 42 8.58 39.2 -0.42 29.1 0
N 2602 2667.00 2667.0 2667.00 2667.0 2667
Std.
Deviation
37 0.00 0.0 0.00 0.0 0
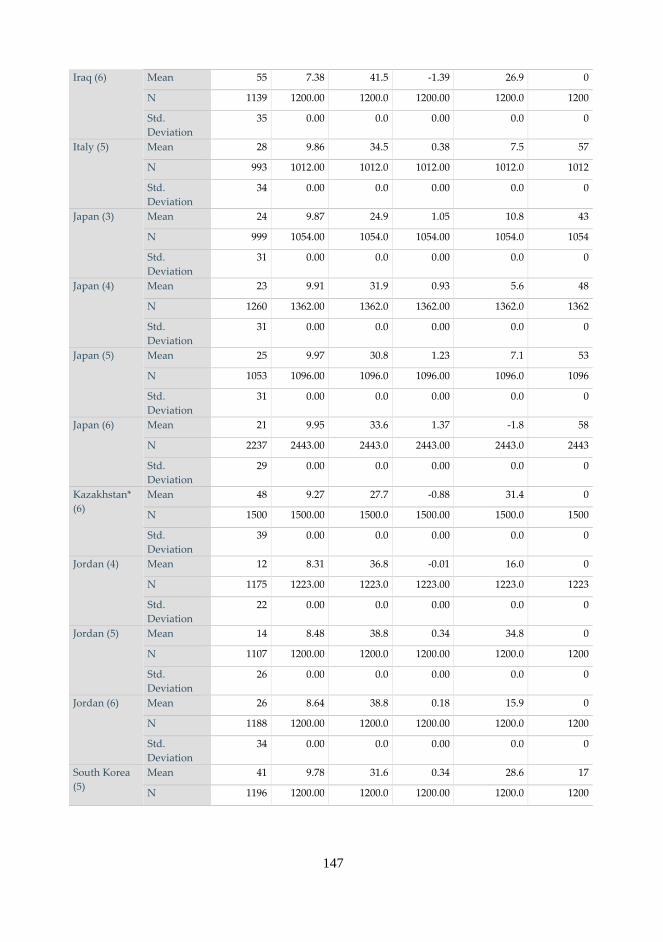
147
Iraq (6) Mean 55 7.38 41.5 -1.39 26.9 0
N 1139 1200.00 1200.0 1200.00 1200.0 1200
Std.
Deviation
35 0.00 0.0 0.00 0.0 0
Italy (5) Mean 28 9.86 34.5 0.38 7.5 57
N 993 1012.00 1012.0 1012.00 1012.0 1012
Std.
Deviation
34 0.00 0.0 0.00 0.0 0
Japan (3) Mean 24 9.87 24.9 1.05 10.8 43
N 999 1054.00 1054.0 1054.00 1054.0 1054
Std.
Deviation
31 0.00 0.0 0.00 0.0 0
Japan (4) Mean 23 9.91 31.9 0.93 5.6 48
N 1260 1362.00 1362.0 1362.00 1362.0 1362
Std.
Deviation
31 0.00 0.0 0.00 0.0 0
Japan (5) Mean 25 9.97 30.8 1.23 7.1 53
N 1053 1096.00 1096.0 1096.00 1096.0 1096
Std.
Deviation
31 0.00 0.0 0.00 0.0 0
Japan (6) Mean 21 9.95 33.6 1.37 -1.8 58
N 2237 2443.00 2443.0 2443.00 2443.0 2443
Std.
Deviation
29 0.00 0.0 0.00 0.0 0
Kazakhstan*
(6)
Mean 48 9.27 27.7 -0.88 31.4 0
N 1500 1500.00 1500.0 1500.00 1500.0 1500
Std.
Deviation
39 0.00 0.0 0.00 0.0 0
Jordan (4) Mean 12 8.31 36.8 -0.01 16.0 0
N 1175 1223.00 1223.0 1223.00 1223.0 1223
Std.
Deviation
22 0.00 0.0 0.00 0.0 0
Jordan (5) Mean 14 8.48 38.8 0.34 34.8 0
N 1107 1200.00 1200.0 1200.00 1200.0 1200
Std.
Deviation
26 0.00 0.0 0.00 0.0 0
Jordan (6) Mean 26 8.64 38.8 0.18 15.9 0
N 1188 1200.00 1200.0 1200.00 1200.0 1200
Std.
Deviation
34 0.00 0.0 0.00 0.0 0
South Korea
(5)
Mean 41 9.78 31.6 0.34 28.6 17
N 1196 1200.00 1200.0 1200.00 1200.0 1200
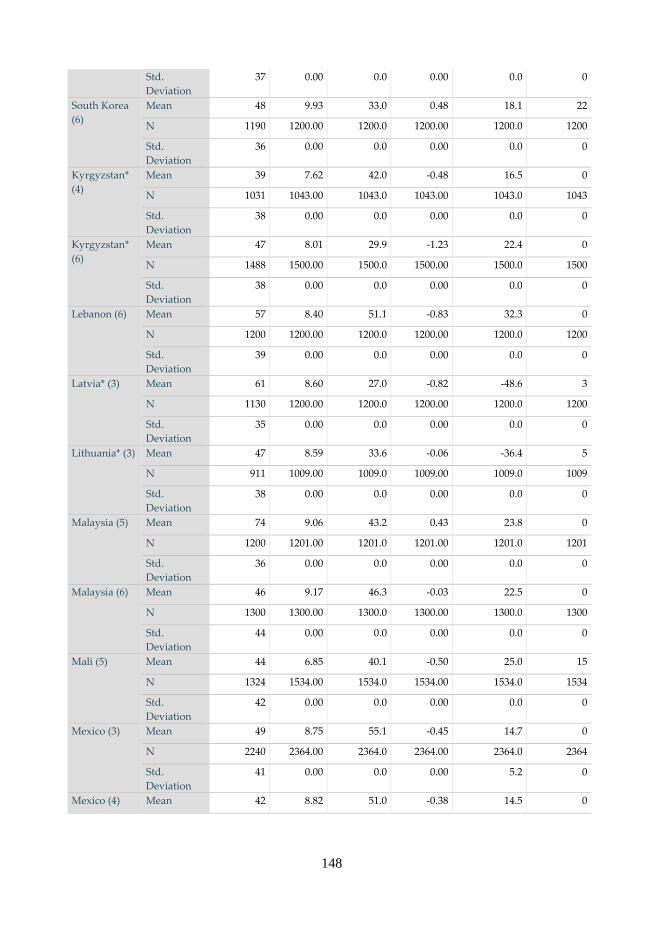
148
Std.
Deviation
37 0.00 0.0 0.00 0.0 0
South Korea
(6)
Mean 48 9.93 33.0 0.48 18.1 22
N 1190 1200.00 1200.0 1200.00 1200.0 1200
Std.
Deviation
36 0.00 0.0 0.00 0.0 0
Kyrgyzstan*
(4)
Mean 39 7.62 42.0 -0.48 16.5 0
N 1031 1043.00 1043.0 1043.00 1043.0 1043
Std.
Deviation
38 0.00 0.0 0.00 0.0 0
Kyrgyzstan*
(6)
Mean 47 8.01 29.9 -1.23 22.4 0
N 1488 1500.00 1500.0 1500.00 1500.0 1500
Std.
Deviation
38 0.00 0.0 0.00 0.0 0
Lebanon (6) Mean 57 8.40 51.1 -0.83 32.3 0
N 1200 1200.00 1200.0 1200.00 1200.0 1200
Std.
Deviation
39 0.00 0.0 0.00 0.0 0
Latvia* (3) Mean 61 8.60 27.0 -0.82 -48.6 3
N 1130 1200.00 1200.0 1200.00 1200.0 1200
Std.
Deviation
35 0.00 0.0 0.00 0.0 0
Lithuania* (3) Mean 47 8.59 33.6 -0.06 -36.4 5
N 911 1009.00 1009.0 1009.00 1009.0 1009
Std.
Deviation
38 0.00 0.0 0.00 0.0 0
Malaysia (5) Mean 74 9.06 43.2 0.43 23.8 0
N 1200 1201.00 1201.0 1201.00 1201.0 1201
Std.
Deviation
36 0.00 0.0 0.00 0.0 0
Malaysia (6) Mean 46 9.17 46.3 -0.03 22.5 0
N 1300 1300.00 1300.0 1300.00 1300.0 1300
Std.
Deviation
44 0.00 0.0 0.00 0.0 0
Mali (5) Mean 44 6.85 40.1 -0.50 25.0 15
N 1324 1534.00 1534.0 1534.00 1534.0 1534
Std.
Deviation
42 0.00 0.0 0.00 0.0 0
Mexico (3) Mean 49 8.75 55.1 -0.45 14.7 0
N 2240 2364.00 2364.0 2364.00 2364.0 2364
Std.
Deviation
41 0.00 0.0 0.00 5.2 0
Mexico (4) Mean 42 8.82 51.0 -0.38 14.5 0
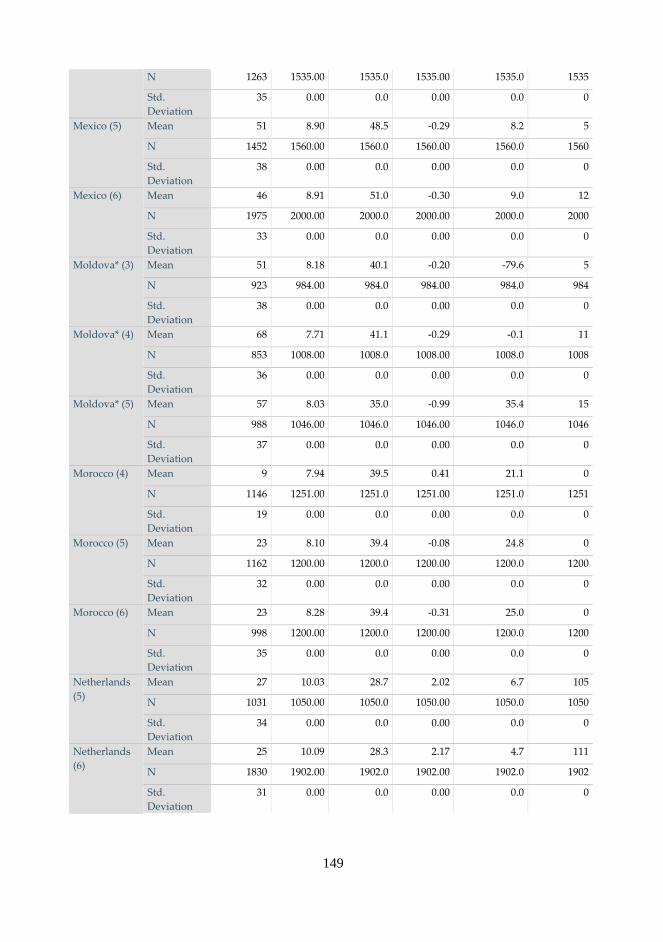
149
N 1263 1535.00 1535.0 1535.00 1535.0 1535
Std.
Deviation
35 0.00 0.0 0.00 0.0 0
Mexico (5) Mean 51 8.90 48.5 -0.29 8.2 5
N 1452 1560.00 1560.0 1560.00 1560.0 1560
Std.
Deviation
38 0.00 0.0 0.00 0.0 0
Mexico (6) Mean 46 8.91 51.0 -0.30 9.0 12
N 1975 2000.00 2000.0 2000.00 2000.0 2000
Std.
Deviation
33 0.00 0.0 0.00 0.0 0
Moldova* (3) Mean 51 8.18 40.1 -0.20 -79.6 5
N 923 984.00 984.0 984.00 984.0 984
Std.
Deviation
38 0.00 0.0 0.00 0.0 0
Moldova* (4) Mean 68 7.71 41.1 -0.29 -0.1 11
N 853 1008.00 1008.0 1008.00 1008.0 1008
Std.
Deviation
36 0.00 0.0 0.00 0.0 0
Moldova* (5) Mean 57 8.03 35.0 -0.99 35.4 15
N 988 1046.00 1046.0 1046.00 1046.0 1046
Std.
Deviation
37 0.00 0.0 0.00 0.0 0
Morocco (4) Mean 9 7.94 39.5 0.41 21.1 0
N 1146 1251.00 1251.0 1251.00 1251.0 1251
Std.
Deviation
19 0.00 0.0 0.00 0.0 0
Morocco (5) Mean 23 8.10 39.4 -0.08 24.8 0
N 1162 1200.00 1200.0 1200.00 1200.0 1200
Std.
Deviation
32 0.00 0.0 0.00 0.0 0
Morocco (6) Mean 23 8.28 39.4 -0.31 25.0 0
N 998 1200.00 1200.0 1200.00 1200.0 1200
Std.
Deviation
35 0.00 0.0 0.00 0.0 0
Netherlands
(5)
Mean 27 10.03 28.7 2.02 6.7 105
N 1031 1050.00 1050.0 1050.00 1050.0 1050
Std.
Deviation
34 0.00 0.0 0.00 0.0 0
Netherlands
(6)
Mean 25 10.09 28.3 2.17 4.7 111
N 1830 1902.00 1902.0 1902.00 1902.0 1902
Std.
Deviation
31 0.00 0.0 0.00 0.0 0
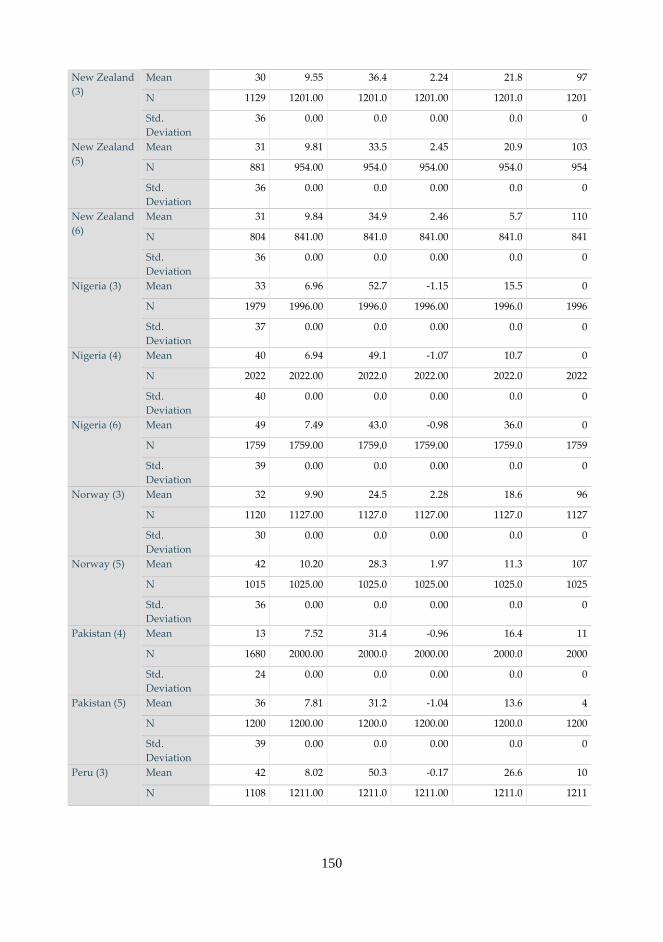
150
New Zealand
(3)
Mean 30 9.55 36.4 2.24 21.8 97
N 1129 1201.00 1201.0 1201.00 1201.0 1201
Std.
Deviation
36 0.00 0.0 0.00 0.0 0
New Zealand
(5)
Mean 31 9.81 33.5 2.45 20.9 103
N 881 954.00 954.0 954.00 954.0 954
Std.
Deviation
36 0.00 0.0 0.00 0.0 0
New Zealand
(6)
Mean 31 9.84 34.9 2.46 5.7 110
N 804 841.00 841.0 841.00 841.0 841
Std.
Deviation
36 0.00 0.0 0.00 0.0 0
Nigeria (3) Mean 33 6.96 52.7 -1.15 15.5 0
N 1979 1996.00 1996.0 1996.00 1996.0 1996
Std.
Deviation
37 0.00 0.0 0.00 0.0 0
Nigeria (4) Mean 40 6.94 49.1 -1.07 10.7 0
N 2022 2022.00 2022.0 2022.00 2022.0 2022
Std.
Deviation
40 0.00 0.0 0.00 0.0 0
Nigeria (6) Mean 49 7.49 43.0 -0.98 36.0 0
N 1759 1759.00 1759.0 1759.00 1759.0 1759
Std.
Deviation
39 0.00 0.0 0.00 0.0 0
Norway (3) Mean 32 9.90 24.5 2.28 18.6 96
N 1120 1127.00 1127.0 1127.00 1127.0 1127
Std.
Deviation
30 0.00 0.0 0.00 0.0 0
Norway (5) Mean 42 10.20 28.3 1.97 11.3 107
N 1015 1025.00 1025.0 1025.00 1025.0 1025
Std.
Deviation
36 0.00 0.0 0.00 0.0 0
Pakistan (4) Mean 13 7.52 31.4 -0.96 16.4 11
N 1680 2000.00 2000.0 2000.00 2000.0 2000
Std.
Deviation
24 0.00 0.0 0.00 0.0 0
Pakistan (5) Mean 36 7.81 31.2 -1.04 13.6 4
N 1200 1200.00 1200.0 1200.00 1200.0 1200
Std.
Deviation
39 0.00 0.0 0.00 0.0 0
Peru (3) Mean 42 8.02 50.3 -0.17 26.6 10
N 1108 1211.00 1211.0 1211.00 1211.0 1211
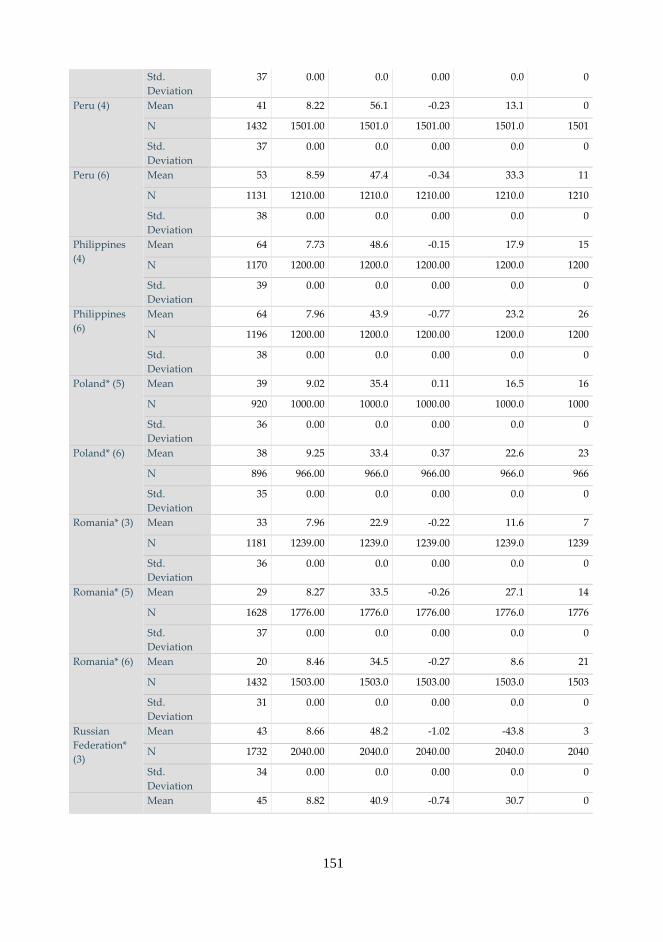
151
Std.
Deviation
37 0.00 0.0 0.00 0.0 0
Peru (4) Mean 41 8.22 56.1 -0.23 13.1 0
N 1432 1501.00 1501.0 1501.00 1501.0 1501
Std.
Deviation
37 0.00 0.0 0.00 0.0 0
Peru (6) Mean 53 8.59 47.4 -0.34 33.3 11
N 1131 1210.00 1210.0 1210.00 1210.0 1210
Std.
Deviation
38 0.00 0.0 0.00 0.0 0
Philippines
(4)
Mean 64 7.73 48.6 -0.15 17.9 15
N 1170 1200.00 1200.0 1200.00 1200.0 1200
Std.
Deviation
39 0.00 0.0 0.00 0.0 0
Philippines
(6)
Mean 64 7.96 43.9 -0.77 23.2 26
N 1196 1200.00 1200.0 1200.00 1200.0 1200
Std.
Deviation
38 0.00 0.0 0.00 0.0 0
Poland* (5) Mean 39 9.02 35.4 0.11 16.5 16
N 920 1000.00 1000.0 1000.00 1000.0 1000
Std.
Deviation
36 0.00 0.0 0.00 0.0 0
Poland* (6) Mean 38 9.25 33.4 0.37 22.6 23
N 896 966.00 966.0 966.00 966.0 966
Std.
Deviation
35 0.00 0.0 0.00 0.0 0
Romania* (3) Mean 33 7.96 22.9 -0.22 11.6 7
N 1181 1239.00 1239.0 1239.00 1239.0 1239
Std.
Deviation
36 0.00 0.0 0.00 0.0 0
Romania* (5) Mean 29 8.27 33.5 -0.26 27.1 14
N 1628 1776.00 1776.0 1776.00 1776.0 1776
Std.
Deviation
37 0.00 0.0 0.00 0.0 0
Romania* (6) Mean 20 8.46 34.5 -0.27 8.6 21
N 1432 1503.00 1503.0 1503.00 1503.0 1503
Std.
Deviation
31 0.00 0.0 0.00 0.0 0
Russian
Federation*
(3)
Mean 43 8.66 48.2 -1.02 -43.8 3
N 1732 2040.00 2040.0 2040.00 2040.0 2040
Std.
Deviation
34 0.00 0.0 0.00 0.0 0
Mean 45 8.82 40.9 -0.74 30.7 0
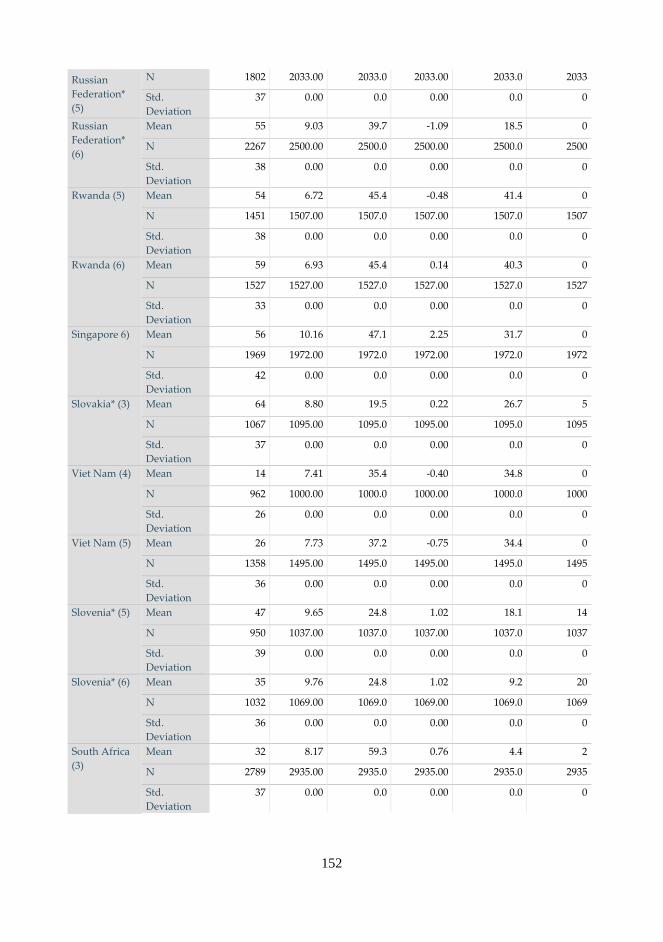
152
Russian
Federation*
(5)
N 1802 2033.00 2033.0 2033.00 2033.0 2033
Std.
Deviation
37 0.00 0.0 0.00 0.0 0
Russian
Federation*
(6)
Mean 55 9.03 39.7 -1.09 18.5 0
N 2267 2500.00 2500.0 2500.00 2500.0 2500
Std.
Deviation
38 0.00 0.0 0.00 0.0 0
Rwanda (5) Mean 54 6.72 45.4 -0.48 41.4 0
N 1451 1507.00 1507.0 1507.00 1507.0 1507
Std.
Deviation
38 0.00 0.0 0.00 0.0 0
Rwanda (6) Mean 59 6.93 45.4 0.14 40.3 0
N 1527 1527.00 1527.0 1527.00 1527.0 1527
Std.
Deviation
33 0.00 0.0 0.00 0.0 0
Singapore 6) Mean 56 10.16 47.1 2.25 31.7 0
N 1969 1972.00 1972.0 1972.00 1972.0 1972
Std.
Deviation
42 0.00 0.0 0.00 0.0 0
Slovakia* (3) Mean 64 8.80 19.5 0.22 26.7 5
N 1067 1095.00 1095.0 1095.00 1095.0 1095
Std.
Deviation
37 0.00 0.0 0.00 0.0 0
Viet Nam (4) Mean 14 7.41 35.4 -0.40 34.8 0
N 962 1000.00 1000.0 1000.00 1000.0 1000
Std.
Deviation
26 0.00 0.0 0.00 0.0 0
Viet Nam (5) Mean 26 7.73 37.2 -0.75 34.4 0
N 1358 1495.00 1495.0 1495.00 1495.0 1495
Std.
Deviation
36 0.00 0.0 0.00 0.0 0
Slovenia* (5) Mean 47 9.65 24.8 1.02 18.1 14
N 950 1037.00 1037.0 1037.00 1037.0 1037
Std.
Deviation
39 0.00 0.0 0.00 0.0 0
Slovenia* (6) Mean 35 9.76 24.8 1.02 9.2 20
N 1032 1069.00 1069.0 1069.00 1069.0 1069
Std.
Deviation
36 0.00 0.0 0.00 0.0 0
South Africa
(3)
Mean 32 8.17 59.3 0.76 4.4 2
N 2789 2935.00 2935.0 2935.00 2935.0 2935
Std.
Deviation
37 0.00 0.0 0.00 0.0 0
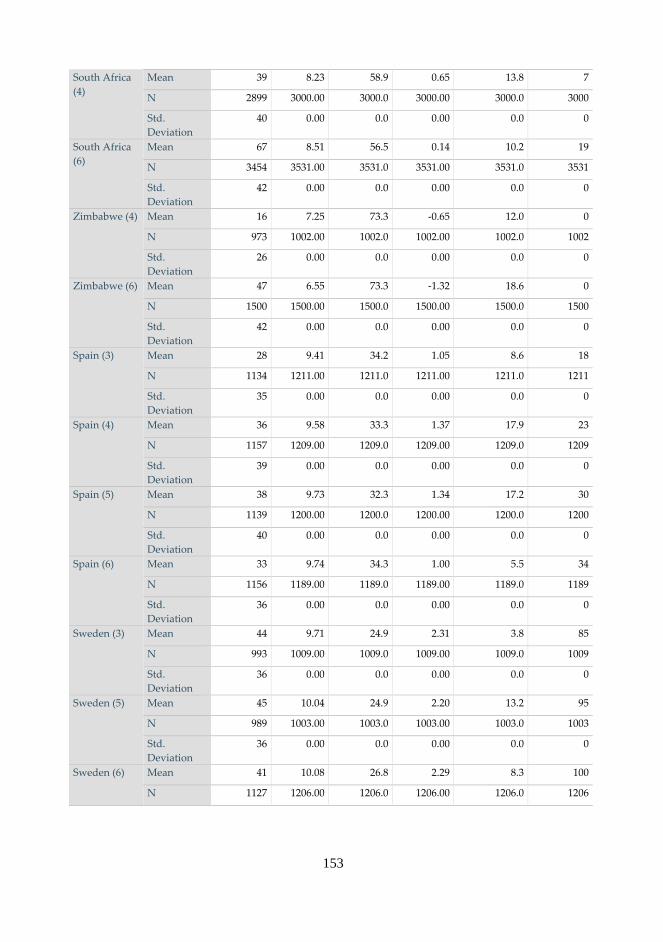
153
South Africa
(4)
Mean 39 8.23 58.9 0.65 13.8 7
N 2899 3000.00 3000.0 3000.00 3000.0 3000
Std.
Deviation
40 0.00 0.0 0.00 0.0 0
South Africa
(6)
Mean 67 8.51 56.5 0.14 10.2 19
N 3454 3531.00 3531.0 3531.00 3531.0 3531
Std.
Deviation
42 0.00 0.0 0.00 0.0 0
Zimbabwe (4) Mean 16 7.25 73.3 -0.65 12.0 0
N 973 1002.00 1002.0 1002.00 1002.0 1002
Std.
Deviation
26 0.00 0.0 0.00 0.0 0
Zimbabwe (6) Mean 47 6.55 73.3 -1.32 18.6 0
N 1500 1500.00 1500.0 1500.00 1500.0 1500
Std.
Deviation
42 0.00 0.0 0.00 0.0 0
Spain (3) Mean 28 9.41 34.2 1.05 8.6 18
N 1134 1211.00 1211.0 1211.00 1211.0 1211
Std.
Deviation
35 0.00 0.0 0.00 0.0 0
Spain (4) Mean 36 9.58 33.3 1.37 17.9 23
N 1157 1209.00 1209.0 1209.00 1209.0 1209
Std.
Deviation
39 0.00 0.0 0.00 0.0 0
Spain (5) Mean 38 9.73 32.3 1.34 17.2 30
N 1139 1200.00 1200.0 1200.00 1200.0 1200
Std.
Deviation
40 0.00 0.0 0.00 0.0 0
Spain (6) Mean 33 9.74 34.3 1.00 5.5 34
N 1156 1189.00 1189.0 1189.00 1189.0 1189
Std.
Deviation
36 0.00 0.0 0.00 0.0 0
Sweden (3) Mean 44 9.71 24.9 2.31 3.8 85
N 993 1009.00 1009.0 1009.00 1009.0 1009
Std.
Deviation
36 0.00 0.0 0.00 0.0 0
Sweden (5) Mean 45 10.04 24.9 2.20 13.2 95
N 989 1003.00 1003.0 1003.00 1003.0 1003
Std.
Deviation
36 0.00 0.0 0.00 0.0 0
Sweden (6) Mean 41 10.08 26.8 2.29 8.3 100
N 1127 1206.00 1206.0 1206.00 1206.0 1206
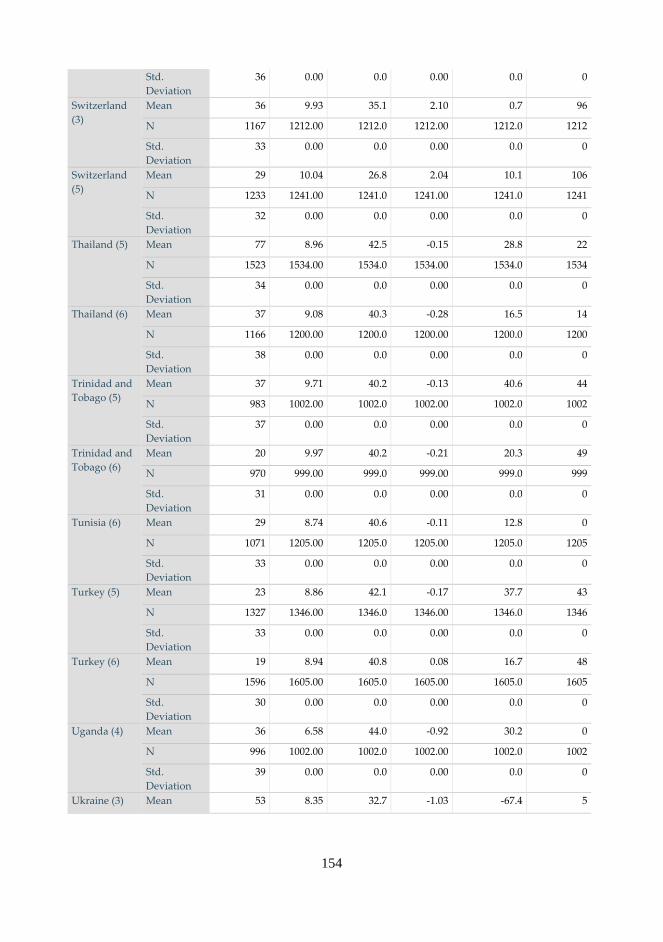
154
Std.
Deviation
36 0.00 0.0 0.00 0.0 0
Switzerland
(3)
Mean 36 9.93 35.1 2.10 0.7 96
N 1167 1212.00 1212.0 1212.00 1212.0 1212
Std.
Deviation
33 0.00 0.0 0.00 0.0 0
Switzerland
(5)
Mean 29 10.04 26.8 2.04 10.1 106
N 1233 1241.00 1241.0 1241.00 1241.0 1241
Std.
Deviation
32 0.00 0.0 0.00 0.0 0
Thailand (5) Mean 77 8.96 42.5 -0.15 28.8 22
N 1523 1534.00 1534.0 1534.00 1534.0 1534
Std.
Deviation
34 0.00 0.0 0.00 0.0 0
Thailand (6) Mean 37 9.08 40.3 -0.28 16.5 14
N 1166 1200.00 1200.0 1200.00 1200.0 1200
Std.
Deviation
38 0.00 0.0 0.00 0.0 0
Trinidad and
Tobago (5)
Mean 37 9.71 40.2 -0.13 40.6 44
N 983 1002.00 1002.0 1002.00 1002.0 1002
Std.
Deviation
37 0.00 0.0 0.00 0.0 0
Trinidad and
Tobago (6)
Mean 20 9.97 40.2 -0.21 20.3 49
N 970 999.00 999.0 999.00 999.0 999
Std.
Deviation
31 0.00 0.0 0.00 0.0 0
Tunisia (6) Mean 29 8.74 40.6 -0.11 12.8 0
N 1071 1205.00 1205.0 1205.00 1205.0 1205
Std.
Deviation
33 0.00 0.0 0.00 0.0 0
Turkey (5) Mean 23 8.86 42.1 -0.17 37.7 43
N 1327 1346.00 1346.0 1346.00 1346.0 1346
Std.
Deviation
33 0.00 0.0 0.00 0.0 0
Turkey (6) Mean 19 8.94 40.8 0.08 16.7 48
N 1596 1605.00 1605.0 1605.00 1605.0 1605
Std.
Deviation
30 0.00 0.0 0.00 0.0 0
Uganda (4) Mean 36 6.58 44.0 -0.92 30.2 0
N 996 1002.00 1002.0 1002.00 1002.0 1002
Std.
Deviation
39 0.00 0.0 0.00 0.0 0
Ukraine (3) Mean 53 8.35 32.7 -1.03 -67.4 5
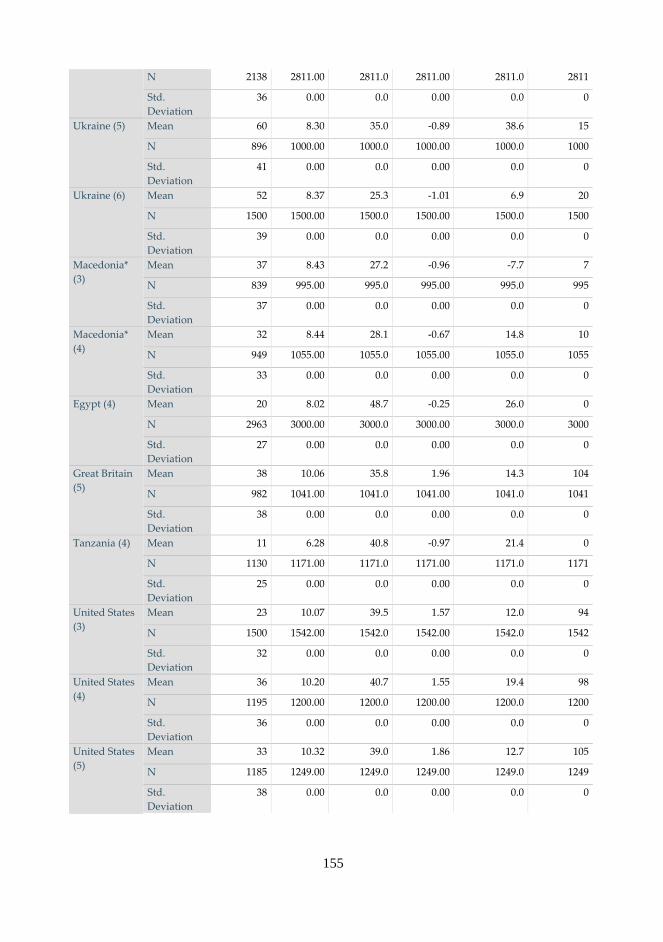
155
N 2138 2811.00 2811.0 2811.00 2811.0 2811
Std.
Deviation
36 0.00 0.0 0.00 0.0 0
Ukraine (5) Mean 60 8.30 35.0 -0.89 38.6 15
N 896 1000.00 1000.0 1000.00 1000.0 1000
Std.
Deviation
41 0.00 0.0 0.00 0.0 0
Ukraine (6) Mean 52 8.37 25.3 -1.01 6.9 20
N 1500 1500.00 1500.0 1500.00 1500.0 1500
Std.
Deviation
39 0.00 0.0 0.00 0.0 0
Macedonia*
(3)
Mean 37 8.43 27.2 -0.96 -7.7 7
N 839 995.00 995.0 995.00 995.0 995
Std.
Deviation
37 0.00 0.0 0.00 0.0 0
Macedonia*
(4)
Mean 32 8.44 28.1 -0.67 14.8 10
N 949 1055.00 1055.0 1055.00 1055.0 1055
Std.
Deviation
33 0.00 0.0 0.00 0.0 0
Egypt (4) Mean 20 8.02 48.7 -0.25 26.0 0
N 2963 3000.00 3000.0 3000.00 3000.0 3000
Std.
Deviation
27 0.00 0.0 0.00 0.0 0
Great Britain
(5)
Mean 38 10.06 35.8 1.96 14.3 104
N 982 1041.00 1041.0 1041.00 1041.0 1041
Std.
Deviation
38 0.00 0.0 0.00 0.0 0
Tanzania (4) Mean 11 6.28 40.8 -0.97 21.4 0
N 1130 1171.00 1171.0 1171.00 1171.0 1171
Std.
Deviation
25 0.00 0.0 0.00 0.0 0
United States
(3)
Mean 23 10.07 39.5 1.57 12.0 94
N 1500 1542.00 1542.0 1542.00 1542.0 1542
Std.
Deviation
32 0.00 0.0 0.00 0.0 0
United States
(4)
Mean 36 10.20 40.7 1.55 19.4 98
N 1195 1200.00 1200.0 1200.00 1200.0 1200
Std.
Deviation
36 0.00 0.0 0.00 0.0 0
United States
(5)
Mean 33 10.32 39.0 1.86 12.7 105
N 1185 1249.00 1249.0 1249.00 1249.0 1249
Std.
Deviation
38 0.00 0.0 0.00 0.0 0
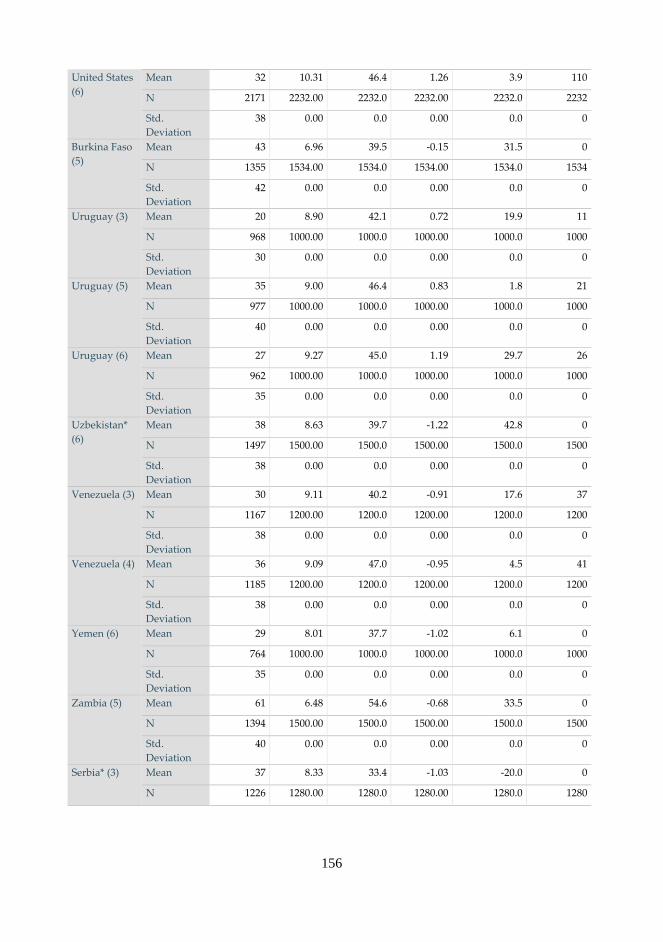
156
United States
(6)
Mean 32 10.31 46.4 1.26 3.9 110
N 2171 2232.00 2232.0 2232.00 2232.0 2232
Std.
Deviation
38 0.00 0.0 0.00 0.0 0
Burkina Faso
(5)
Mean 43 6.96 39.5 -0.15 31.5 0
N 1355 1534.00 1534.0 1534.00 1534.0 1534
Std.
Deviation
42 0.00 0.0 0.00 0.0 0
Uruguay (3) Mean 20 8.90 42.1 0.72 19.9 11
N 968 1000.00 1000.0 1000.00 1000.0 1000
Std.
Deviation
30 0.00 0.0 0.00 0.0 0
Uruguay (5) Mean 35 9.00 46.4 0.83 1.8 21
N 977 1000.00 1000.0 1000.00 1000.0 1000
Std.
Deviation
40 0.00 0.0 0.00 0.0 0
Uruguay (6) Mean 27 9.27 45.0 1.19 29.7 26
N 962 1000.00 1000.0 1000.00 1000.0 1000
Std.
Deviation
35 0.00 0.0 0.00 0.0 0
Uzbekistan*
(6)
Mean 38 8.63 39.7 -1.22 42.8 0
N 1497 1500.00 1500.0 1500.00 1500.0 1500
Std.
Deviation
38 0.00 0.0 0.00 0.0 0
Venezuela (3) Mean 30 9.11 40.2 -0.91 17.6 37
N 1167 1200.00 1200.0 1200.00 1200.0 1200
Std.
Deviation
38 0.00 0.0 0.00 0.0 0
Venezuela (4) Mean 36 9.09 47.0 -0.95 4.5 41
N 1185 1200.00 1200.0 1200.00 1200.0 1200
Std.
Deviation
38 0.00 0.0 0.00 0.0 0
Yemen (6) Mean 29 8.01 37.7 -1.02 6.1 0
N 764 1000.00 1000.0 1000.00 1000.0 1000
Std.
Deviation
35 0.00 0.0 0.00 0.0 0
Zambia (5) Mean 61 6.48 54.6 -0.68 33.5 0
N 1394 1500.00 1500.0 1500.00 1500.0 1500
Std.
Deviation
40 0.00 0.0 0.00 0.0 0
Serbia* (3) Mean 37 8.33 33.4 -1.03 -20.0 0
N 1226 1280.00 1280.0 1280.00 1280.0 1280
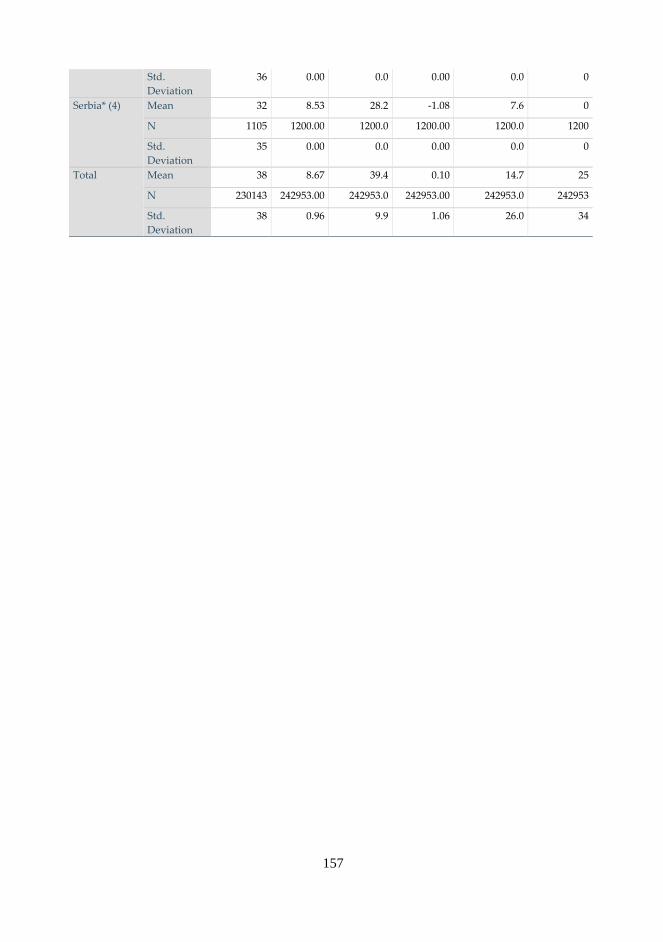
157
Std.
Deviation
36 0.00 0.0 0.00 0.0 0
Serbia* (4) Mean 32 8.53 28.2 -1.08 7.6 0
N 1105 1200.00 1200.0 1200.00 1200.0 1200
Std.
Deviation
35 0.00 0.0 0.00 0.0 0
Total Mean 38 8.67 39.4 0.10 14.7 25
N 230143 242953.00 242953.0 242953.00 242953.0 242953
Std.
Deviation
38 0.96 9.9 1.06 26.0 34
158
References
Printed material
Agerberg, Mattias (Forthcoming) The Lesser Evil? Corruption Voting and the Importance
of Clean Alternatives. Paper presented at the ECPR General Conference in Hamburg
23.8.2018.
Agerberg, Mattias (2018) The Curse of Knowledge? Education, Corruption, and
Politics. Political Behavior, pp. 1-31.
Aitalieva, Nurgul R. (2017) Trust in Government and Income Inequality. In Farazmand,
Ali (ed.) (2018) Global Encyclopedia of Public Administration, Public Policy, and Governance.
Springer, pp.1-7.
Ajzen, Icek & Martin Fishbein (1977) Attitude-Behavior Relations: A Theoretical
Analysis and Review of Empirical Research. Psychological Bulletin 84, pp. 888-918.
Akers, Ronald L. (1998) Social Structure and Social Learning. Roxbury.
Allen, Nicholas, Sarah Birch, & Katja Sarmiento-Mirwaldt (2016) Honesty above all
else? Expectations and perceptions of political conduct in three established
democracies. Comparative European Politics, pp. 1-24.
Amundsen, Inge (1999) Political Corruption: an introduction to the issues. Working Paper
- Chr. Michelsen Institute, 7, pp. 1-32. Available at:
https://www.cmi.no/publications/file/1040-political-corruption.pdf
Anderson, Christopher J. & Yulya V. Tverdova (2003) Corruption, Political Allegiances,
and Attitudes Toward Government in Contemporary Democracies. American Journal of
Political Science, 47(1), pp. 91-109.
Andersson, Staffan (2017). Beyond Unidimensional Measurement of Corruption. Public
Integrity, 19(1), pp. 58-76. doi:10.1080/10999922.2016.1200408.
Andrews, Christina (2008) Legitimacy and Context: Implications for Public Sector
Reform in Developing Countries. Public Administration and Development. 28, pp.171-180.
Ariely, Gal & Eric Uslaner (2017) Corruption, fairness, and inequality. International
Political Science Review, 38(3), pp. 349-362.
159
Arts, Wil & Loek Halman (eds.) (2014) Value contrasts and consensus in present-day
Europe: Painting Europe’s moral landscapes. Leiden, The Netherlands: Brill.
Askvik, Steinar & Ishtiaq Jamil (2013) The Institutional Trust Paradox in Bangladesh.
Public Organization Review, 13(4), pp. 459-476.
Bandura, Albert (1971) Social Learning Theory. General Learning Press.
Banfield, Edward C. & Laura Fasano Banfield (1958) The Moral Basis of a Backward
Society. Glencoe, Ill.: Free Press.
Barber, Benjamin (1983) The Logic and Limits of Trust. New Brunswick, NJ: Rutgers
University Press.
Barcham, Manuhuia, Barry Hindess & Peter Lamour (eds.) (2012) Corruption: Expanding
the Focus. ANU E Press.
Bauhr, Monika (2017) Need or Greed? Conditions for Collective Action against
Corruption. Governance, 30(4), pp. 561-581.
Bayley, David H. (1966) The Effects of Corruption in a Developing Nation. In
Heidenheimer, Arnold J., Michael Johnston & Victor T. LeVine (eds.) (1999) Political
Corruption. A Handbook. Transaction Publishers, New Brunswick, New Jersey.
Becker, Gary S. (1976) The Economic Approach to Human Behavior. University of Chicago
Press.
Beets, Douglas (2007) Global Corruption and Religion: An Empirical Examination.
Journal of Global Ethics Volume 3, Issue 1, pp. 69-85.
Bigoni, Maria, Stefania Bortolotti, Marco Casari, Diego Gambetta & Francesca Pancotto
(2016) Amoral Familism, Social Capital, or Trust? The Behavioural Foundations of the
Italian North-South Divide. Economic Journal 126(594): 1318-1341.
Bjørnskov, Christian (2004) Social Capital, Political Competition, and Corruption. Aarhus:
Aarhus School of Business, Aarhus University.
Blake, Charles H. & Stephen D. Morris (eds.) (2009) Corruption and Democracy in Latin
America. University of Pittsburgh Press.
Blake, Charles H. (2009) Public Attitudes toward Corruption. In Blake, Charles H. &
Stephen D. Morris (eds.) (2009) Corruption and Democracy in Latin America. University
of Pittsburgh Press.
160
Bohn, Simone (2012) Corruption in Latin America: Understanding the perception-
exposure gap. Journal of Politics in Latin America, 4 (3), pp. 67-95.
Bohn, Simone (2013) Justifying corrupt exchanges: rational-choice corruptors.
Zeitschrift für Vergleichende Politikwissenschaft 2013, 7, pp. 159-182.
Boix, Carles, Michael K. Miller, & Sebastian Rosato (2014) Boix-Miller-Rosato
Dichotomous Coding of Democracy, 1800-2010, https://doi.org/10.7910/DVN/28468,
Harvard Dataverse, V1, UNF:5:x3P4QDm6R349bpyygm/g1Q==
Catterberg, Gabriela & Alejandro Moreno (2006) The Individual Bases of Political
Trust: Trends in New and Established Democracies. International Journal of
Public Opinion Research 18, no. 1, pp. 31-48.
Chang, Eric C.C. & Nicholas N. Kerr (2009) Do Voters Have Different Attitudes Toward
Corruption? Afrobarometer Working Paper No. 116. Available at:
https://www.files.ethz.ch/isn/110435/AfropaperNo116.pdf
Chanley, Virginia, Thomas Rudolph & Wendy Rahn (2000). The origins and
consequences of public trust in government: A time series analysis. Public Opinion
Quarterly, 64(3), pp. 239-256.
Cho, Wonbin & Matthew F. Kirwin (2007) A Vicious Cycle of Corruption and Mistrust in
Institutions in Sub-Saharan Africa: A Micro-Level Analysis. Afrobarometer Working
Paper, No. 71, Michigan State University. Available at:
http://afrobarometer.org/sites/default/files/publications/Working%20paper/Afropape
rNo71.pdf
Clammer, John (2012) Corruption, Development, Chaos and Social Disorganization:
Sociological reflections on corruption and its social basis. In Barcham, Manuhuia, Barry
Hindess & Peter Lamour (eds.) (2012) Corruption: Expanding the Focus. ANU E Press.
Cole, Lindsey M & Ellen S. Cohn (2016). Institutional trust across cultures: Its definitions,
conceptualizations, and antecedents across eastern and western European nations. In
Shockley, Ellie, Tess M.S. Neal, Lisa M. PytlikZillig & Brian Bornstein (eds.) (2016)
Interdisciplinary Perspectives on Trust: Towards Theoretical and Methodological Integration.
Springer International Publishing.
Colombatto, Enrico (2003) Why is Corruptin Tolerated? The Review of Austrian
Economics, 16:4, pp. 363-379. Kluwer Academic Publishers.
Coppedge, Michael, John Gerring, Carl Henrik Knutsen, Staffan I. Lindberg, Svend-
Erik Skaaning, Jan Teorell, David Altman, Michael Bernhard, M. Steven Fish, Agnes
161
Cornell, Sirianne Dahlum, Haakon Gjerløw, Adam Glynn, Allen Hicken, Joshua
Krusell, Anna Lührmann, Kyle L. Marquardt, Kelly McMann, Valeriya Mechkova,
Juraj Medzihorsky, Moa Olin, Pamela Paxton, Daniel Pemstein, Josefine Pernes,
Johannes von Römer, Brigitte Seim, Rachel Sigman, Jeffrey Staton, Natalia Stepanova,
Aksel Sundström, Eitan Tzelgov, Yi-ting Wang, Tore Wig, Steven Wilson & Daniel
Ziblatt (2018) V-Dem [Country-Year/Country-Date] Dataset v8. Varieties of Democracy
(V-Dem) Project. https://doi.org/10.23696/vdemcy18
Corbacho, Ana, Daniel W. Gingerich, Virginia Oliveros & Mauricio Ruiz-Vega (2016)
Corruption as a Self-Fulfilling Prophecy: Evidence from a Survey Experiment in Costa
Rica. American Journal of Political Science, Vol. 00, No. 0, pp. 1-16.
Dahlberg, Stefan & Sören Holmberg (2013) Democracy and Bureaucracy: How their
Quality Matters for Popular Satisfaction. West European Politics, 37(3), pp. 1-23.
Dalton, Russell J. (2009) The Good Citizen: How a younger generation is reshaping American
politics. CQ Press.
Davis, Lance & Douglass North (1970) Institutional Change and American Economic
Growth: A First Step Towards a Theory of Institutional Innovation. The Journal of
Economic History, Vol. 30, No. 1, pp. 131-149.
Della Porta, Donatella (2000). Social capital, beliefs in government and political
corruption. In Pharr, Susan J. & Robert D. Putnam (eds.) (2000) Disaffected democracies:
What’s troubling the trilateral countries? Princeton, NJ: Princeton University Press, pp.
202-230.
De Soto, Hernando (1989) The Other Path. The Invisible Revolution in the Third World.
New York: Harper & Row.
Dobel, J. Patrick (1978) The Corruption of a State. The American Political Science Review,
72(3), pp. 958-973.
Dobewall, Henrik & Micha Strack (2014) Relationship of Inglehart’s and Schwartz’s
value dimensions revisited. International Journal of Psychology, 49(4), pp. 240-248.
Dong, Bin, Uwe Dulleck, & Benno Torgler (2012) Conditional Corruption. Journal of
Economic Psychology 33(3), pp. 609-627.
Durkheim, Emile (2013) [1893] The Division of Labor in Society. Palgrave; 2nd edition.
Durkheim, Emile (2006) [1897] On Suicide. Penguin Classics; Translation edition.
162
Dülmer, Hermann (2014) Modernization, culture and morality in Europe:
Universalism, contextualism or relativism? In Arts, Wil & Loek Halman (eds.) (2014)
Value contrasts and consensus in present-day Europe: Painting Europe’s moral landscapes.
Leiden, The Netherlands: Brill, pp. 251-276.
Easton, David (1965) A Systems Analysis of Political Life. New York: Wiley.
Erlingsson, Gissur Ó, Andreas Bergh & Mats Sjölin (2008) Public Corruption in
Swedish Municipalities - Trouble Looming on the Horizon? Local Government Studies,
34(5), pp. 595-608. doi:10.1080/03003930802413780
Erlingsson, Gissur Ó, Jonas Linde & Richard Öhrvall (2014) Not so Fair After All?
Perceptions of Procedural Fairness and Satisfaction With Democracy in the Nordic
Welfare States. International Journal of Public Administration 37, no. 2, pp. 106-119.
Etzioni, Amitai (2017) The Moral Wrestler: Ignored by Maslow. Society, 54(6), pp. 512-
519. doi:10.1007/s12115-017-0200-3
Evans, Peter B., Dietrich Rueschemeyer & Theda Skocpol (eds.) (1985) Bringing the state
back in. Cambridge University Press, Cambridge.
Farazmand, Ali (ed.) (2018) Global Encyclopedia of Public Administration, Public Policy,
and Governance. Springer.
Fisman, Raymond & Edward Miguel (2007) Corruption, Norms, and Legal
Enforcement: Evidence from Diplomatic Parking Tickets. Journal of Political Economy,
115(6), pp. 1020-1048.
Friedrich, Carl J. (1972) Corruption Concepts in Historical Perspective. In
Heidenheimer, Arnold J., Michael Johnston & Victor T. LeVine (ed.) (2007) Political
Corruption. A Handbook. Transaction Publishers, New Brunswick, New Jersey, pp. 15-
23.
Fukuyama, Francis (2011) The Origins of Political Order: From Prehuman Times to the
French Revolution. Profile Books.
Fukuyama, Francis (2014) Political Order and Political Decay: From the Industrial
Revolution to the Globalisation of Democracy. Profile Books.
Galtung, Fredrik (2006) Measuring the Immeasurable: Boundaries and Functions of
(Macro) Corruption Indices. In Sampford, Charles, Arthur Shacklock & Carmel
Connors (eds.) (2006) Measuring Corruption. Abingdon, Oxon. Ashgate Publishing
Group, pp. 101-124.
163
Gatti, Roberta, Stefano Paternostro & James Rigolini (2003) Individual Attitudes Toward
Corruption: Do Social Effects Matter? World Bank Policy Research Working Paper 3122.
Available at:
http://documents.worldbank.org/curated/en/432741468765319923/pdf/wps3122.pdf
Geissel, Brigitte (2008). Do Critical Citizens Foster Better Governance? A Comparative
Study. West European Politics, 31(5), pp. 855-873.
Gerring, John, Philip Bond, William T. Barndt, & Carola Moreno (2005) Democracy and
Economic Growth. A Historical Perspective. World Politics 57 (3), pp. 323-364.
Goel, Rajeev & Michael Nelson (2010) Causes of corruption: History, geography and
government. Journal of Policy Modeling, 2010, vol. 32, issue 4, pp. 433-447.
Gong Ting, Shiru Wang & Jianming Ren (2015) Corruption in the Eye of the Beholder:
Survey Evidence from Mainland China and Hong Kong, International Public
Management Journal, 18:3, pp. 458-482
Gottfredson, Michael R. & Travis Hirschi (1990) A General Theory of Crime. Stanford:
Stanford University Press.
Graeff, Peter (2004) Why should one trust in corruption? The linkage between corruption,
norms and social capital. In Lambsdorff, Johann Graf, Schramm, Matthias & Taube,
Markus (eds.) (2004) New Institutional Economics of Corruption. London: Routledge.
Grimes, Marcia (2008) Consent, political trust and compliance: Rejoinder to Kaina’s
remarks on ‘Organizing consent’. European Journal of Political Research, 47(4), pp. 522–
535.
Groop, Catharina (2013) Accountability and corruption: A study into political institutions as
referees between principals and agents. (Doctoral dissertation) Åbo: Åbo Akademi
University Press.
Grundmann, Susanna & Johann Graf Lambsdorff (2017) How income and tax rates
provoke cheating – An experimental investigation of tax morale. Journal of Economic
Psychology, 63, pp. 27-42.
Grönlund, Kimmo & Maija Setälä (2012) In Honest Officials We Trust: Institutional
Confidence in Europe. The American Review of Public Administration, 42(5), pp. 523-542.
Gyimah-Brempong, Kwabena & Samaria Munoz de Camacho (2006) Corruption,
Growth, and Income Distribution: Are There Regional Differences? Economics of
Governance 7, pp. 245-69.
164
Hao, Yufan & Michael Johnston (2007) Corruption and the Future of Economic Reform
in China. In Heidenheimer, Arnold J., Michael Johnston & Victor T. LeVine (ed.) (2007)
Political Corruption. A Handbook. Transaction Publishers, New Brunswick, New Jersey.
Hardin, Russell (1999) Do We Want Trust in Government? In Warren, Mark E. (ed.)
(1999) Democracy and Trust, Cambridge University Press, pp. 22-41.
Heidenheimer, Arnold J. (ed.) (1970) Political Corruption: Readings in Comparative
Analysis. New Brunswick, NJ: Transaction.
Heidenheimer, Arnold J., Michael Johnston & Victor T. LeVine (eds.) (1999) Political
Corruption. A Handbook. Transaction Publishers, New Brunswick, New Jersey.
Heidenheimer, Arnold J., Michael Johnston & Victor T. LeVine (eds.) (2007) Political
Corruption. A Handbook. Transaction Publishers, New Brunswick, New Jersey.
Heywood, Paul M. (2018) Combating Corruption in the Twenty-First Century: New
Approaches. Daedalus, 147(3), pp. 83-97.
Hicken, Allen (2011) Clientelism. Annual Review of Political Science, 14, pp. 289-310.
Hindess, Barry (2012) Introduction: How should we think about corruption? In
Barcham, Manuhuia, Barry Hindess & Peter Lamour (eds.) (2012) Corruption: Expanding
the Focus. ANU E Press.
Hossain, Naomi (2008) Who trusts government? Understanding political trust among the
poor in Bangladesh. National University of Singapore: Asia Research Institute Working
Paper No 103. Available at: http://www.ari.nus.edu.sg/wps/wps08_103.pdf
Houston, David J. & Lauren Howard Harding (2013) Public Trust in Government
Administrators. Public Integrity, 16:1, pp. 53-76.
Hox, Joop, Mirjam Moerbeek & Rens van de Schoot (2017) Multilevel Analysis:
Techniques and Applications. Third Edition. Routledge.
Hovland, Carl Iver, Irving L. Janis & Harold H. Kelley (1953) Communication and
Persuasion. New Haven: Yale University Press.
Hume, David (2003) [1738] A Treatise of Human Nature. Dover Publications, Inc.
Huntington, Samuel P. (1965) Political Development and Political Decay. World Politics,
17(3), pp. 386-430.
165
Huntington, Samuel P. (1968) Political order in changing societies. New Haven: Yale
University Press.
Husted, Bryan W. (1999) Wealth, Culture, and Corruption. Journal of International
Business Studies 30(2), pp. 339-359.
Inglehart, Ronald (1971) The Silent Revolution in Europe: Intergenerational Change in
Post-Industrial Societies, American Political Science Review 65, pp. 991-1017.
Jackman, Robert W. & Ross A. Miller (2004) Before Norms: Institutions and Civic Culture.
University of Michigan Press.
Jaime-Castillo, Antonio M. & Gloria Martinez-Cousinou (2012) Distributive effects and
moral justification of corruption. Conference paper presented at Second ISA Forum of
Sociology 2012.
Johnston, Michael (2005) Syndromes of Corruption: Wealth, Power, and Democracy.
Cambridge University Press.
Johnston, Michael (2014) Corruption, Contention, and Reform: The Power of Deep
Democratization. Cambridge University Press.
Jones, Kelvyn & Craig Duncan (1998) Modelling context and heterogeneity: Applying
multilevel models. In Scarbrough, Elinor and Eric Tanenbaum (eds.) (1998) Research
Strategies in the Social Sciences. Oxford University Press.
Kalil, Ariel (2013) Effects of the Great Recession on Child Development. The ANNALS
of the American Academy of Political and Social Science, 650(1), pp. 232-250.
Kant, Immanuel, Jerome B. Schneewind & Allen W. Wood (2002) Groundwork for the
Metaphysics of Morals. Yale University Press.
Kaufmann, Daniel, Aart Kraay & Massimo Mastruzzi (2010) The Worldwide Governance
Indicators: Methodology and Analytical Issues. World Bank Policy Research Working
Paper No. 5430. Available at: https://ssrn.com/abstract=1682130
Kaufmann, Daniel & Shang-Jin Wei (1999) Does "grease money" speed up the wheels of
commerce? Policy Research Working Paper Series 2254, The World Bank. Available at:
http://documents.worldbank.org/curated/en/189751468739475975/123523322_2004111
7155048/additional/multi-page.pdf
Karklins, Rasma (2005) The System Made Me Do It: Corruption in Post-Communist
Societies. Armonk, NY: M. E. Sharpe.
166
Kim, Heejung & Hazel Rose Markus (1999) Deviance or Uniqueness, Harmony or
Conformity? A Cultural Analysis. Journal of Personality and Social Psychology, 77(4), pp.
785-800.
Klitgaard, Robert E. (1991) Controlling corruption. Berkeley: University of California
Press.
Knack, Stephen & Philip Keefer (1997) Does Social Capital Have an Economic Payoff?
A Cross-Country Investigation. The Quarterly Journal of Economics, 112(4), pp. 1251-
1288.
Kornhauser, Marjorie E. (2005) Doing the Full Monty: Will Publicizing Tax Information
Increase Compliance? Canadian Journal of Law and Jurisprudence, Vol. 18, 95-113.
Kotzian, Peter (2014) Good Governance and Norms of Citizenship: An Investigation
into the System‐ and Individual‐Level Determinants of Attachment to Civic Norms.
American Journal of Economics and Sociology, 73(1), pp. 58-83.
Kravtsova, Maria, Aleksey Oshchepkov & Christian Welzel (2017) Values and
Corruption: Do Postmaterialists Justify Bribery? Journal of Cross-Cultural Psychology,
Vol. 48(2) pp. 225-242.
Krebs, Dennis L. (2008) Morality: An Evolutionary Account. Perspectives on
Psychological Science. Vol 3, Issue 3, pp. 149-173.
Köbis Nils C, Jan-Willem van Prooijen, Francesca Righetti & Paul A. M. Van Lange
(2015) “Who Doesn’t?”—The Impact of Descriptive Norms on Corruption. PLoS ONE
10(6): e0131830. doi:10.1371/journal.pone.0131830
Lambsdorff, Johann Graf, Matthias Schramm & Markus Taube (eds.) (2004) New
Institutional Economics of Corruption. London: Routledge.
Lambsdorff, Johann Graf (2006) Consequences and Causes of Corruption—What Do
We Know From a Cross-Section of Countries? In Rose-Ackerman, Susan (ed.) (2006)
International Handbook on the Economics of Corruption. Publisher: Edward Elgar, pp. 3-52.
Lambsdorff, Johann Graf (2010) Who accepts bribery? Evidence from a global household
survey. Passauer Diskussionspapiere: Volkswirtschaftliche Reihe, No. V-61-10.
Available at: https://www.econstor.eu/bitstream/10419/55011/1/684339161.pdf
Lane, Jan-Erik & Svante O. Ersson (2000) The new institutional politics: Performance and
outcomes. London: Routledge.
167
Lascoumes, Pierre & Odette Tomescu-Hatto (2008) French Ambiguities in
Understandings of Corruption: Concurrent Definitions. Perspectives on European Politics
and Society, 9(1), pp. 24-38.
Lavena, Cecilia F. (2013) What Determines Permissiveness Toward Corruption? Public
Integrity, Vol. 15 Issue 4, pp. 345-366.
Lee, Wang-Sheng & Cahit Guven (2013) Engaging in Corruption: The Influence of
Cultural Values and Contagion Effects At the Microlevel. Journal of Economic Psychology
39, pp. 287.
Leff, Nathaniel H. (1964) Economic development through bureaucratic corruption.
American Behavioral Scientist 8, pp. 8-14. In Heidenheimer, Arnold J., Michael
Johnston & Victor T. LeVine (eds.) (1989) Political corruption: A handbook. Oxford,
Transaction Books, pp. 389-403.
Letki, Natalia (2006) Investigating the roots of civic morality: Trust, social capital, and
institutional performance. Political Behavior 28 (4), pp. 305-325.
Levi, Margaret & Laura Stoker (2000) Political trust and trustworthiness. Annual Review
of Political Science 3, pp. 475-507.
Leys, Colin (1965) What is the Problem about Corruption? In Heidenheimer, Arnold J.,
Michael Johnston & Victor T. LeVine (eds.) (2007) Political Corruption. A Handbook.
Transaction Publishers, New Brunswick, New Jersey, pp. 59-73.
Linde, Jonas & Gissur Ó Erlingsson (2013) The Eroding Effect of Corruption on System
Support in Sweden. Governance, 26(4), pp. 585-603. doi:10.1111/gove.12004
Lindström, Martin (2008a) Social capital, political trust and experience of cannabis
smoking. Preventive Medicine, 46(6), pp. 599-604.
Lindström, Martin (2008b) Social capital, political trust and purchase of illegal liquor.
Health Policy, 86(2-3) pp. 266-275.
López López, Wilson, María Bocarejo, Diana Peralta, Claudia Pineda Marín & Etienne
Mullet (2017) Mapping Colombian Citizens’ Views Regarding Ordinary Corruption:
Threat, Bribery, and the Illicit Sharing of Confidential Information. Social Indicators
Research, 133(1), pp. 259-273.
Malmberg, Fredrik (2014) Demokrati och korruption: En studie av 174 länder. [Democracy
and corruption: A study of 174 countries] (Master’s thesis) Åbo: Åbo Akademi.
168
Mandić, Sofija (2017) THE CITIZENS’ OPINION OF THE POLICE. Comparative Analysis
of the Results of Public Opinion Surveys Conducted in Albania, Bosnia and Herzegovina,
Montenegro, Macedonia, Serbia and Kosovo. Belgrade Centre for Security Policy. Available
at:
http://www.bezbednost.org/upload/document/the_citizens_opinion_of_the_police_20
17.pdf
Manzetti, Luigi & Carole J. Wilson (2009) Why Do Corrupt Governments Maintain
Public Support? In Blake, Charles H. & Stephen D. Morris (eds.) (2009) Corruption and
Democracy in Latin America. University of Pittsburgh Press.
Marien, Sofie (2011) Measuring Political Trust Across Time and Space. In Zmerli, Sonja
& Marc Hooghe (eds.) (2011) Political Trust: Why context matters. The ECPR Press.
Marien, Sofie & Marc Hooghe (2011) Does political trust matter? An empirical
investigation into the relation between political trust and support for law compliance.
European Journal Of Political Research, 50(2), pp. 267-291.
Marshall, Monty G, Keith Jaggers & Ted Gurr (2017) Polity IV Project (Data users’
manual). Available at: http://www.systemicpeace.org/inscr/p4manualv2016.pdf
Maslow, Abraham H. (1970) Motivation and personality. New York: Harper & Row.
Mauro, Paolo (1998) Corruption: Causes, Consequences, and Agenda for Further
Research. Finance & Development. Vol. 35, No. 1, pp. 11-14.
McLaughlin, Erin (2013) Culture and Corruption: An Explanation of the Differences
between Scandinavia and Africa. American International Journal of Research in
Humanities, Arts and Social Sciences 2(2), pp. 85-91.
Méon, Pierre-Guillaume & Laurent Weill (2010) Is Corruption an Efficient Grease? A
Cross-Country Aggregate Analysis. World Development 38(3), pp. 244-59.
Mikkelsen, Kim Sass (2013) In murky waters: a disentangling of corruption and related
concepts. Crime, Law & Social Change 60, pp. 357-374.
Milenkovic, Nemanja, Jovanka Vukmirovic, Milica Bulajic & Zoran Radojicic (2014) A
multivariate approach in measuring socio-economic development of MENA countries.
Economic modeling. Volume 38, pp. 604-608.
Montinola, Gabriella R. & Robert W. Jackman (2002) Sources of Corruption: A Cross-
Country Study. British Journal of Political Science, 32(1), pp. 147-170.
169
Moreno, Alejandro (2002) Corruption and Democracy: A Cultural Assessment.
Comparative Sociology 1, nos. 3–4, pp. 495-507.
Morris, Stephen D. (2008) Disaggregating corruption: A comparison of participation
and perceptions in Latin America with a focus on Mexico. Bulletin of Latin American
Research, 28(2), pp. 388-409.
Morris, Stephen D. & Joseph L. Klesner (2010) Corruption and Trust: Theoretical
Considerations and Evidence From Mexico. Comparative Political Studies 43(10) pp.
1258-1285.
Myrdal, Gunnar (1968) Corruption – Its Causes and Effects. In Heidenheimer, Arnold
J., Michael Johnston & Victor T. LeVine (eds.) (1989) Political corruption: A handbook, 405-
421, Oxford, Transaction Books.
Newton, Kenneth (2006) Political Support: Social Capital, Civil Society and Political
and Economic Performance. Political Studies, 54(4), pp. 846-864.
Nye, Joseph S. (1967) Corruption and Political Development: A Cost-Benefit Analysis.
In Heidenheimer, Arnold J., Michael Johnston & Victor T. LeVine (eds.) (2007) Political
Corruption. A Handbook. Transaction Publishers, New Brunswick, New Jersey, pp. 281-
300.
Offe, Claus (1999) How can we trust our fellow citizens? In Warren, Mark E. (eds.)
(1999) Democracy and Trust, Publisher: Cambridge University Press, pp. 42-87.
Oh, Se Hyung David (2013) Do collectivists conform more than individualists? Cross-
cultural differences in compliance and internalization. Social Behavior and Personality,
41(6), pp. 981-994.
Orviska, Marta & John Hudson (2003) Tax evasion, civic duty and the law abiding
citizen. European Journal of Political Economy, 19(1), pp. 83-102.
Ostrom, Elinor (1998) A Behavioural Approach to the Rational Choice Theory of
Collection Action Presidential Address, American Political Science Association.
American Political Science Review 92(1), pp. 1-22.
Pani, Marco (2011) Hold your nose and vote: corruption and public decisions in a
representative democracy? Public Choice, 148(1), pp. 163-196.
Paskov, Marii & Caroline Dewilde (2012) Income inequality and solidarity in Europe.
Research in Social Stratification and Mobility, 30(4), pp. 415-432.
170
Persson, Anna, Bo Rothstein & Jan Teorell (2013) Why Anticorruption Reforms Fail—
Systemic Corruption as a Collective Action Problem. Governance July 2013, Vol.26(3),
pp. 449-471.
Peters, B. Guy & Jordan Pierre (eds.) (2004) Politicization of the Civil Service in
Comparative Perspective. Routledge.
Pharr, Susan J. & Robert D. Putnam (eds.) (2000) Disaffected democracies: What’s troubling
the trilateral countries? Princeton, NJ: Princeton University Press.
Pop, Ioana (2012) Acceptance of corrupt acts: A comparative study of values regarding
corruption in Europe. Journal of Social Research & Policy, Vol. 3, Issue 1.
Pozsgai Alvarez, Joseph (2015) Low-Level Corruption Tolerance: An “Action-Based”
Approach for Peru and Latin America. Journal Of Politics In Latin America, 7(2), pp. 99-
129.
Putnam, Robert (1993) Making Democracy Work: Civic Traditions in Modern Italy.
Princeton, New Jersey: Princeton University Press.
Quah, Jon S.T. (2004) Democratization and political corruption in the Philippines and
South Korea: A comparative analysis. Crime, Law & Social Change 42, pp. 61–81
Rose, Richard & William Mishler (2011) Political Trust and Distrust in Post-
Authoritarian Contexts. In Zmerli, Sonja & Marc Hooghe (eds.) (2011) Political Trust:
Why context matters. The ECPR Press.
Rose-Ackerman, Susan (ed.) (2006) International Handbook on the Economics of Corruption.
Publisher: Edward Elgar.
Rose-Ackerman, Susan & Bonnie J. Palifka (2016) Corruption and Government: Causes,
Consequences, and Reform. Cambridge University Press.
Rothstein, Bo & Dietlind Stolle (2002) How Political Institutions Create and Destroy
Social Capital: An Institutional Theory of Generalized Trust. Comparative Politics 40(4),
pp. 441-59
Rothstein, Bo & Dietlind Stolle (2008) The State and Social Capital: An Institutional
Theory of Generalized Trust. Comparative Politics 40(4), pp. 441-59
Rothstein, Bo & Jan Teorell (2008) What is Quality of Government: A Theory of
Impartial Political Institutions. Governance: An International Journal of Policy,
Administration, and Institutions, Vol. 21, No. 2, pp. 165-190.
171
Rothstein, Bo & Daniel Eek (2009) Political Corruption and Social Trust: An
Experimental Approach. Rationality and Society, Vol.21(1), pp. 81-112.
Rothstein, Bo (2003) Sociala fällor och tillitens problem. [Social traps and the problem with
trust] Stockholm: SNS Förlag.
Rothstein, Bo (2011) The Quality of Government: Corruption, Social Trust, and Inequality in
International Perspective. Chicago: University of Chicago Press.
Rothstein, Bo (2013) Corruption and Social Trust: Why the Fish Rots from the Head
Down. Social Research: An International Quarterly, 80(4), pp. 1009-1032.
Rothstein, Bo & Aiysha Varraich (2017) Making Sense of Corruption. Cambridge
University Press.
Rothstein, Bo & Eric Uslaner (2005) All for all - Equality, corruption, and social trust.
World Politics, 58(1), pp. 41-72.
Sampford, Charles, Arthur Shacklock & Carmel Connors (eds.) (2006) Measuring
Corruption. Abingdon, Oxon. Ashgate Publishing Group.
Sandholtz, Wayne & Rein Taagepera (2005) Corruption, Culture and Communism.
International Review of Sociology Vol. 15, No. 1, March 2005, pp. 109-131.
Scarbrough, Elinor and Eric Tanenbaum (eds.) (1998) Research Strategies in the Social
Sciences: A Guide to New Approaches. Oxford University Press.
Schweitzer, Helmut (2004) Corruption – its spread and decline. In Lambsdorff, Johann
Graf, Schramm, Matthias & Taube, Markus (eds.) (2004) New Institutional Economics of
Corruption. London: Routledge.
Scott, James C. (1972) Patron-Client Politics and Political Change in Southeast Asia. The
American Political Science Review, Vol. 66, No. 1, pp. 91-113.
Seligson, Mitchell A. (2002) The impact of corruption on regime legitimacy: A
comparative study of four Latin American countries. Journal of Politics, 64, pp. 408-433.
Shleifer, Andrei & Robert W. Vishny (1993) Corruption. Quarterly Journal of Economics
108, pp. 599-617.
Shockley, Ellie, Tess M.S. Neal, Lisa M. PytlikZillig & Brian Bornstein (eds.) (2016)
Interdisciplinary Perspectives on Trust: Towards Theoretical and Methodological Integration.
Springer International Publishing.
172
Skocpol, Theda (1985) Bringing the state back in. In P.B. Evans, D. Rueschemeyer, T.
Skocpol (eds.) (1985) Bringing the state back in. Cambridge University Press, Cambridge.
Smith, Theodore M. (1971) Corruption, Tradition, and Change. In Heidenheimer,
Arnold J., Michael Johnston & Victor T. LeVine (eds.) (1999) Political Corruption. A
Handbook. Transaction Publishers, New Brunswick, New Jersey.
Stockemer, Daniel, Bernadette LaMontagne & Lyle Scruggs (2013) Bribes and ballots:
The impact of corruption on voter turnout in democracies. International Political Science
Review 34.1, pp. 74-90.
Suhara, Manabu (2003) Corruption in Russia: A Historical Perspective. Symposium paper
available at http://src-h.slav.hokudai.ac.jp/sympo/03september/pdf/M_Suhara.pdf
Sundstrom, Aksel & Daniel Stockemer (2015) Regional variation in voter turnout in
Europe: The impact of corruption perceptions. Electoral Studies, 40(C), pp. 158-169.
Sønderskov, Kim M. & Peter T. Dinesen (2016) Trusting the State, Trusting Each Other?
The Effect of Institutional Trust on Social Trust. Political behavior. Vol.38(1), pp.179-202.
Sööt, Mari-Liis & Kadri Rootalu (2012) INSTITUTIONAL TRUST AND OPINIONS OF
CORRUPTION. Public Administration and Development, 32(1), pp. 82-95.
Tao, Ran, Dali L. Yang, Ming Li & Xi Lu (2013) How does political trust affect social
trust? An analysis of survey data from rural China using an instrumental variables
approach. International Political Science Review 0(0) pp. 1–17.
Tavits, Margit (2010) Why Do People Engage in Corruption? The Case of Estonia. Social
Forces 88(3, March), pp. 1257-1280.
Teorell, Jan, Stefan Dahlberg, Sören Holmberg, Bo Rothstein, Anna Khomenko &
Richard Svensson (2017) The Quality of Government Standard Dataset, version Jan17.
University of Gothenburg: The Quality of Government Institute. Available at:
http://www.qog.pol.gu.se doi:10.18157/QoGStdJan17
Thaler, Richard H. & Cass R. Sunstein (2008) Nudge: Improving Decisions About Health,
Wealth, and Happiness. Yale University Press.
Tocqueville, Alexis de (2003) [1835] Democracy in America. Barnes and Nobles
Publishing, Inc.
Torgler, Benno & Neven T. Valev (2010) Gender and public attitudes toward corruption
and tax evasion. Contemporary Economic Policy 28(4), pp. 554-568.
173
Treisman, Daniel (2000) The Causes of Corruption: a cross-national study. Journal of
Public Economics 76, pp. 399–457.
Triandis, Harry C. (1995) Individualism and Collectivism. Boulder: Westview Press.
Tyler, Tom (2006) Why people obey the law. (2nd edn). Princeton, NJ: Princeton
University Press.
Tyler, Tom & Yuen J. Huo (2002) Trust in the law. New York: Russell Sage Foundation.
Uslaner, Eric M. (2002) The Moral Foundations of Trust. New York: Cambridge
University Press.
Uslaner, Eric M. (2004) Trust and Corruption. In Lambsdorff, Johann Graf, Schramm,
Matthias & Taube, Markus (eds.) (2004) New Institutional Economics of Corruption.
London: Routledge.
Uslaner, Eric M. (2008) Corruption, Inequality and the Rule of Law. Cambridge University
Press.
Uslaner, Eric M. (2011) Corruption, the Inequality Trap and Trust in Government. In
Zmerli, Sonja & Marc Hooghe (eds.) Political Trust: Why context matters. The ECPR
Press, pp. 141-162.
Uslaner, Eric M. & Bo Rothstein (2016) The Historical Roots of Corruption: State
Building, Economic Inequality, and Mass Education. Comparative Politics. Vol.48(2), pp.
227-248.
Van Deth, Jan W., José Ramón Montero & Anders Westholm (eds.) (2007) Citizenship
and involvement in European democracies: A comparative analysis. London: Routledge.
Van de Walle, Steven (2009) International Comparisons of Public Sector Performance.
Public Management Review, 11:1, pp. 39-56.
Warren, Mark E. (2004) What Does Corruption Mean in a Democracy? American Journal
of Political Science. Vol. 48, No. 2, pp. 328-343.
Warren, Mark E. (2006) Political Corruption as Duplicitous Exclusion. Political Science
and Politics. Vol. XXXIX, Nr. 4.
Warren, Mark E. (ed.) (1999) Democracy and Trust, Publisher: Cambridge University
Press.
174
Welsh, David T, Lisa D. Ordóñez, Deirdre G. Snyder & Micheal S. Christian (2015) The
Slippery Slope: How Small Ethical Transgressions Pave the Way for Larger Future
Transgressions. Journal of Applied Psychology, 100(1), pp. 114-127.
Welzel, Christian & Ronald Inglehart (2008) The role of ordinary people in
democratization. Journal of Democracy, 19(1), pp. 125-140.
Welzel, Christian (2010) How selfish are self-expression values? A civicness test. Journal
of Cross-Cultural Psychology, 41(2), pp. 152-174.
Welzel, Christian (2013) Freedom Rising: Human Empowerment and the Quest for
Emancipation. Cambridge University Press.
Welzel, Christian (2014) Evolution, Empowerment, and Emancipation: How Societies
Climb the Freedom Ladder. World Development Vol. 64, pp. 33-51.
Williams, Colin C. & Álvaro Martínez (2014). Explaining cross-national variations in
tax morality in the European Union: An exploratory analysis. Studies of Transition States
and Societies, 6(1), pp. 5-18.
You, Jong-Sung, & Sanjeev Khagram (2005). A comparative study of inequality and
corruption. American Sociological Review, 70(1), pp. 136-157.
Zhang, Nan (2017) Institutions, Norms, and Accountability: A Corruption Experiment
with Northern and Southern Italians. Journal of Experimental Political Science. Vol. 5,
Issue 1, pp. 11-25.
Zmerli, Sonja (2010) Social Capital and Norms of Citizenship: An Ambiguous
Relationship? American Behavioral Scientist. Vol. 53, Issue 5.
Zmerli, Sonja, Ken Newton & José R. Montero (2007) Trust in people, confidence in
political institutions, and satisfaction with democracy. In van Deth, Jan W., José Ramón
Montero & Anders Westholm (eds.) (2007) Citizenship and involvement in European
democracies: A comparative analysis (pp. 35-65). London: Routledge.
Zmerli, Sonja & Marc Hooghe (2011) Introduction: The Context of Political Trust. In
Zmerli, Sonja & Marc Hooghe (eds.) (2011) Political Trust: Why context matters. The
ECPR Press.
Zmerli, Sonja & Marc Hooghe (eds.) (2011) Political Trust: Why context matters. The
ECPR Press.
175
Electronic resources
Biblehub (2019)
https://biblehub.com/mark/12-17.htm (accessed on 16.9.2019)
Boix-Miller-Rosato (2014)
https://dataverse.harvard.edu/dataset.xhtml?persistentId=doi:10.7910/DVN/28468
(accessed on 29.6.2017)
Bribe Payers Index (2017)
https://www.transparency.org/research/bpi/overview (accessed on 28.11.2017)
CIA World Factbook (2017)
https://www.cia.gov/library/publications/the-world-factbook/geos/ch.html (accessed
on 29.6.2017)
CNN (2016)
https://edition.cnn.com/2016/05/03/middleeast/arab-spring-corruption-transparency-
international/index.html (accessed on 19.3.2019)
Encyclopedia Britannica (2019)
https://www.britannica.com/place/Estonia/Cultural-life#ref37293 (accessed on
8.4.2019)
Global Corruption Barometer (2015)
http://www.transparency.org/gcb2013/country/?country=finland (accessed on
19.11.2015)
Global Corruption Barometer (2013)
https://www.transparency.org/gcb2013/results (accessed on 4.7.2017)
Hofstede Insights (2019)
https://www.hofstede-insights.com/ [1] (accessed 30.1.2019)
https://www.hofstede-insights.com/models/ [2] (accessed 30.1.2019)
176
I Paid A Bribe (2019)
http://ipaidabribe.com/#gsc.tab=0 (accessed 8.2.2019)
Investopedia (2018-2019)
https://www.investopedia.com/articles/investing/021716/why-ussr-collapsed-
economically.asp [1] (accessed 20.6.2018)
https://www.investopedia.com/terms/g/gini-index.asp [2] (accessed on 22.10.2018)
https://www.investopedia.com/terms/g/great_depression.asp [3] (accessed on
10.4.2019)
https://www.investopedia.com/terms/g/great-recession.asp [4] (accessed on 10.4.2019)
Latin American Public Opinion Project (2018)
https://www.vanderbilt.edu/lapop/about.php (accessed on 15.10.2018)
Merriam-Webster (2019)
https://www.merriam-webster.com/dictionary/dysfunctional (accessed on 6.9.2019)
Polity Project (2019)
http://www.systemicpeace.org/inscrdata.html (accessed on 8.4.2019)
SAS FAQ. UCLA: Statistical Consulting Group (2017)
https://stats.idre.ucla.edu/sas/faq/how-can-i-interpret-log-transformed-variables-in-
terms-of-percent-change-in-linear-regression/ (accessed on 20.10.2017)
The World Bank (2016 – 2018)
http://web.worldbank.org/WBSITE/EXTERNAL/NEWS/0,,contentMDK:20190202~me
nuPK:34457~pagePK:34370~piPK:34424~theSitePK:4607,00.html [1] (accessed on
28.11.2017)
https://data.worldbank.org/indicator/NY.GDP.PCAP.CD [2] (accessed on 21.6.2018)
https://info.worldbank.org/governance/wgi/#home [3] (accessed on 25.5.2018)
United Nations Development Programme – Human Development Reports (2018)
http://hdr.undp.org/en/content/human-development-index-hdi (accessed on
22.10.2018)
University of Notre Dame Latin Dictionary (2019)
http://www.archives.nd.edu/cgi-bin/lookup.pl?stem=corru&ending= (accessed on
23.4.2019)
V-Dem (2018)
https://www.v-dem.net/en/data/data-version-8/ (accessed on 3.6.2018)
177
World Value Survey (2015 – 2019)
http://www.worldvaluessurvey.org/WVSContents.jsp [1] (accessed on multiple
occasions)
http://www.worldvaluessurvey.org/WVSContents.jsp?CMSID=QuestDevelopment
[2] (accessed on 15.10.2018)
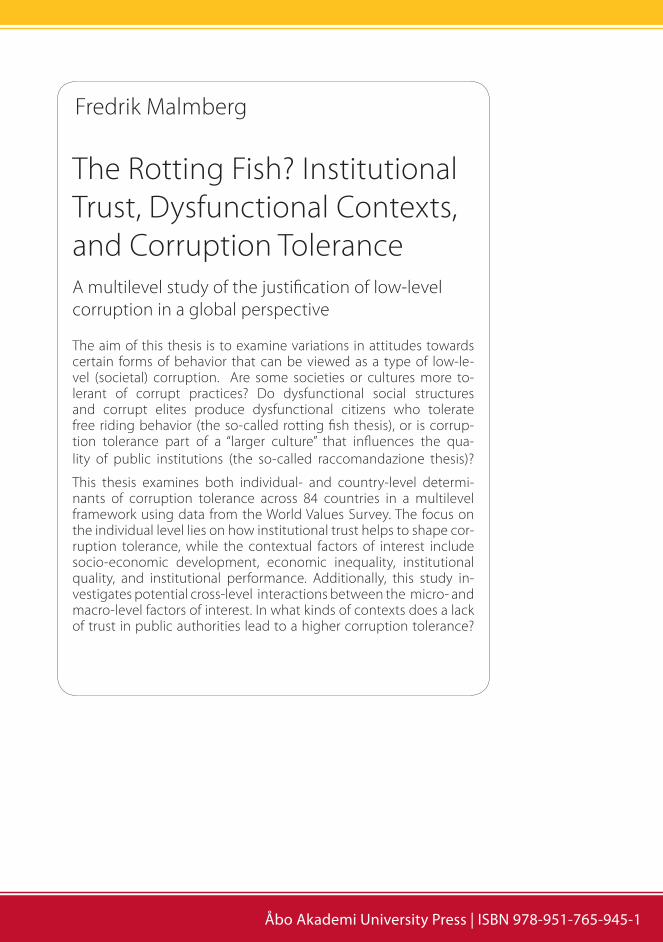
Fredrik Malmberg
The Rotting Fish? Institutional Trust, Dysfunctional Contexts, and Corruption ToleranceA multilevel study of the justification of low-level corruption in a global perspective
Fredrik Malm
berg | The Rotting Fish? Institutional Trust, Dysfunctional C
ontexts, and Corruption Tolerance | 2019
Fredrik Malmberg
The Rotting Fish? Institutional Trust, Dysfunctional Contexts, and Corruption ToleranceA multilevel study of the justification of low-level corruption in a global perspective
The aim of this thesis is to examine variations in attitudes towards certain forms of behavior that can be viewed as a type of low-le-vel (societal) corruption. Are some societies or cultures more to-lerant of corrupt practices? Do dysfunctional social structures and corrupt elites produce dysfunctional citizens who tolerate free riding behavior (the so-called rotting fish thesis), or is corrup-tion tolerance part of a “larger culture” that influences the qua-lity of public institutions (the so-called raccomandazione thesis)?
This thesis examines both individual- and country-level determi-nants of corruption tolerance across 84 countries in a multilevel framework using data from the World Values Survey. The focus on the individual level lies on how institutional trust helps to shape cor-ruption tolerance, while the contextual factors of interest include socio-economic development, economic inequality, institutional quality, and institutional performance. Additionally, this study in-vestigates potential cross-level interactions between the micro- and macro-level factors of interest. In what kinds of contexts does a lack of trust in public authorities lead to a higher corruption tolerance?
Åbo Akademi University Press | ISBN 978-951-765-945-1


