Embed Size (px)
Citation preview
GENES, CHROMOSOMES & CANCER 49:132–143 (2010)
Frequent Deletion of CDKN2A and RecurrentCoamplification of KIT, PDGFRA, and KDR inFibrosarcoma of Bone—An Array ComparativeGenomic Hybridization Study
Tarja Niini,1* Jose Antonio Lopez-Guerrero,2 Shinsuke Ninomiya,1 Mohamed Guled,1
Claudia Maria Hattinger,3 Francesca Michelacci,3 Tom Bohling,1 Antonio Llombart-Bosch,4
Piero Picci,3 Massimo Serra,3 and Sakari Knuutila1
1Departmentof Pathology,Haartman Institute and HUSLAB,Universityof Helsinki and Helsinki University Central Hospital,Helsinki,Finland2Laboratoryof Molecular Biology,Fundacio¤ n InstitutoValenciano de Oncolog|Ła,Valencia,Spain3Laboratoryof Oncologic Research,Orthopaedic Rizzoli Institute,Bologna,Italy4Departmentof Pathology,UniversitatdeValencia Studi General,Valencia,Spain
Very little is known about the genetics of fibrosarcoma (FS) of bone. We applied array comparative genomic hybridization
(CGH) to identify genes and genomic regions with potential role in the pathogenesis of this tumor. Seventeen patients with
FS of bone were included in the study. Array CGH analysis was carried out in 13 fresh frozen tissue specimens from 11 of
these patients (nine primary tumors and four local recurrences). DNA was extracted and hybridizations were performed on
Agilent 244K CGH oligoarrays. The data were analyzed using Agilent DNA Analytics Software. The number of changes per
patient ranged from 0 to 132 (average ¼ 43). Losses were most commonly detected at 6q, 8p, 9p, 10, 13q, and 20p. CDKN2A
was homozygously deleted in 7/11 patients. Hypermethylation of both p16INK4a and p14ARF was found in 1/14 patients. An
internal deletion of STARD13 was found in a region with common losses at 13q13.1. The most frequent gains were seen at
1q, 4q, 5p, 8q, 12p, 15q, 16q, 17q, 20q, 22q, and Xp. Single recurrent high level amplification was detected at 4q12, including
KIT, PDGFRA, and KDR. No activating mutations were found in any of them. Immunohistochemistry revealed expression of
PDGFRA and/or PDGFRB in 12/17 samples. Moreover, small regions of gains pinpointed genes of particular interest, such as
IGF1R at 15q26.3 and CHD1L at 1q21.1. In conclusion, our analysis provided novel findings that can be exploited when
searching for markers for diagnosis and prognosis, and targets of therapy in this tumor type. VVC 2009 Wiley-Liss, Inc.
INTRODUCTION
Fibrosarcoma (FS) of bone is an extremely rare
neoplasm, which constitutes only about 5% of all
primary malignant bone tumors (Campanacci,
1999). In most cases, patients with FS of bone
are treated with surgery with the possible adjunct
of pre- and/or post-operative chemotherapy regi-
mens, which are very similar or almost identical
to those used for high-grade osteosarcoma (OS).
Right now, on the basis of the available knowl-
edge, there is no reason to differentiate the treat-
ment between these two tumors. The prognosis
of FS of bone is very poor: the 5-year overall sur-
vival being about 34% (Kahn and Vigorita, 2002).
New therapeutic strategies are therefore needed.
A better and more detailed genetic characteriza-
tion of this neoplasm may lead to the identifica-
tion of tumor-related biological markers, which
may become valuable therapeutic targets and
drive the planning of future tailored treatment
regimens.
The diagnosis of FS of bone is very often diffi-
cult, and the differential diagnosis has to be
done, on a histological basis, from malignant fi-
brous histiocytoma (MFH) of bone or from OS.
The immunohistochemical evaluation of noncol-
lagenous proteins of bone (osteonectin, osteopon-
tin, and osteocalcin) may in some cases help to
Additional Supporting Information may be found in the onlineversion of this article.
Supported by: European Commission, Grant number:EuroBoNeT LSHC-CT-2006-018814; Jose Maria Buesa 2007 fromthe Spanish Group for Research on Sarcomas.
*Correspondence to: Tarja Niini, Laboratory of CytomolecularGenetics, Department of Pathology, HUSLAB, P.O. Box 400,FI-00029 HUS, Helsinki, Finland. E-mail: [email protected]
Received 28 May 2009; Accepted 23 September 2009
DOI 10.1002/gcc.20727
Published online 27 October 2009 inWiley InterScience (www.interscience.wiley.com).
VVC 2009 Wiley-Liss, Inc.
distinguish these three tumor types (Serra et al.,
1996).
Very little is understood regarding the genetics
of FS of bone. To our knowledge, only two
papers have previously been published about this
topic. We previously studied nine FSs of bone by
conventional comparative genomic hybridization
(CGH) and array CGH using microchips contain-
ing probes specific for 59 oncogenes and tumor
suppressor genes (Hattinger et al., 2004). Hallor
et al. (2007) studied one case of FS of bone using
cytogenetics, fluorescence in-situ hybridization
(FISH), and array CGH encompassing about
30,000 BAC clones.
In this study, we performed an array CGH
analysis to find genomic regions or genes with
potential involvement in the pathogenesis of FS
of bone. Nine primary tumors and four local
recurrences from 11 patients were studied using
CGH oligo microarrays containing 244,000 probes
encompassing the whole genome.
MATERIALS AND METHODS
Patients and Material
Nineteen fresh frozen tissue specimens from
17 patients with FS of bone were considered for
this study (15 primary tumors and 4 local recur-
rences). After histological revision, tumor speci-
mens with only a proportion of neoplastic cells
over 80% were used for DNA isolation. Enough
good quality DNA for array CGH hybridization
was available from 13 of these specimens (nine
primary tumors and four local recurrences)
obtained from 11 patients. The supplementary
analyses for methylation and mutations were per-
formed on 16 specimens (12 primary tumors and
4 local recurrences) from 14 patients, as quality
and amount of DNA in these analyses is not as
critical as in array CGH. All clinical data of the
whole group of 17 patients are shown in Table 1.
DNA Isolation
Genomic DNA was extracted using the stand-
ard phenol–chloroform method. Two reference
DNAs, female and male, were extracted from
pools of blood samples (four individuals per
each). The concentration and the quality of DNA
were measured using NanoDrop ND-1000 Spec-
trophotometer (NanoDrop Technologies, Wil-
mington, DE) and gel electrophoresis.
Array CGH Hybridization and Data Analysis
Digestion, labeling, and hybridization were
performed by following Agilent’s protocol version
4.0 for Agilent Human Genome CGH 244A oligo
microarrays (Agilent Technologies, Santa Clara,
CA). Briefly, same amounts (1.5 lg) of patient
DNA and gender-matched reference DNA were
digested. The digested DNAs were labeled by
random priming with Cy3-dUTP (reference
DNA) and Cy5-dUTP (patient DNA) using Agi-
lent Labeling Kit. The labeled DNAs were puri-
fied. Afterward, differentially labeled patient and
reference DNAs were combined and hybridized
to Agilent Human Genome CGH 244A microar-
rays at 65�C for 40 hr. The hybridized arrays
were washed and scanned using Agilent scanner.
The array images were analyzed using Agilent
Feature Extraction Software (version 9.5.3.1),
which also performs dye normalization for the
data. The normalized data were analyzed using
Agilent DNA Analytics Software (version 4.0)
with ADM-2 algorithm, which is an aberration
detection algorithm that identifies all aberrant
intervals in a given sample with consistently high
or low log ratios based on the statistical score. In
addition, it incorporates quality information about
each probe measurement. The ADM-2 algorithm
searches for intervals in which the average log ra-
tio of the sample and reference channels exceed
a user specified threshold. In this study, we used
threshold ‘‘8.’’ To get rid of long aberrations with
low absolute mean ratios that often represent
noise, we applied Fuzzy Zero correction algo-
rithm. Fuzzy Zero applies a correction to all aber-
rant intervals identified in ADM-2 analysis by
reassessing their significance without the assump-
tion of probe-to-probe error independence.
The minimum log ratio that the ADM-2 algo-
rithm considers as a gain or a loss depends on the
quality of the hybridization and the number of
the probes in the region. To assure the exclusion
of very low or very small aberrations, we added a
custom-made aberration filter defining a region
with a copy number aberration as a region with
minimum seven probes gained/lost and with min-
imum absolute average log2 ratio of 0.2 (gain) or
�0.2 (loss). The level of losses and gains was
checked visually in the individual profiles. A loss
was regarded as homozygous when log2 ratio was
lower than �1 and a gain as high level amplifica-
tion when log2 ratio was higher than 1.
The smallest somatic copy number variations
were automatically excluded because of the
COPY NUMBER PROFILING IN FIBROSARCOMA OF BONE 133
Genes, Chromosomes & Cancer DOI 10.1002/gcc
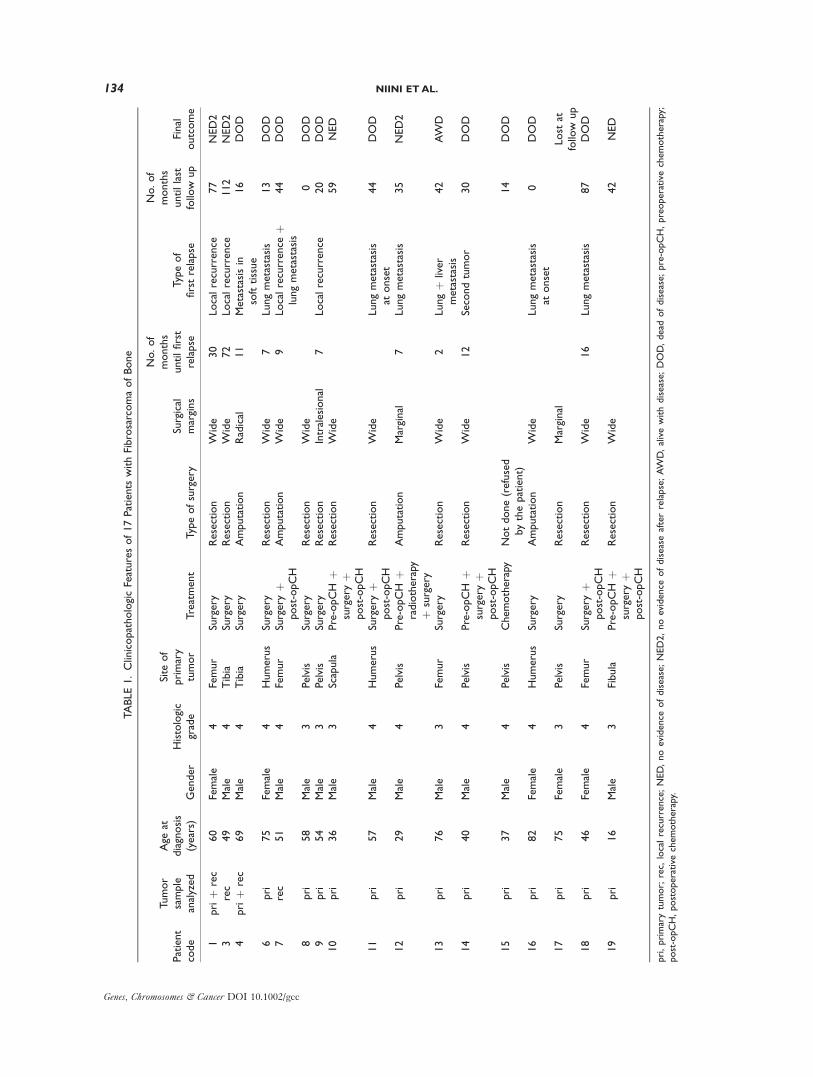
TABLE1.ClinicopathologicFeaturesof17Patients
withFibrosarcomaofBone
Patient
code
Tumor
sample
analyzed
Age
atdiagnosis
(years)
Gender
Histologic
grade
Site
of
primary
tumor
Treatment
Typeofsurgery
Surgical
margins
No.of
months
untilfirst
relapse
Typeof
firstrelapse
No.of
months
untillast
follow
up
Final
outcome
1priþ
rec
60
Female
4Femur
Surgery
Resection
Wide
30
Localrecurrence
77
NED2
3rec
49
Male
4Tibia
Surgery
Resection
Wide
72
Localrecurrence
112
NED2
4priþ
rec
69
Male
4Tibia
Surgery
Amputation
Radical
11
Metastasisin
softtissue
16
DOD
6pri
75
Female
4Humerus
Surgery
Resection
Wide
7Lungmetastasis
13
DOD
7rec
51
Male
4Femur
Surgery
þpost-opCH
Amputation
Wide
9Localrecurrence
þlungmetastasis
44
DOD
8pri
58
Male
3Pelvis
Surgery
Resection
Wide
0DOD
9pri
54
Male
3Pelvis
Surgery
Resection
Intralesional
7Localrecurrence
20
DOD
10
pri
36
Male
3Scapula
Pre-opCH
þsurgery
þpost-opCH
Resection
Wide
59
NED
11
pri
57
Male
4Humerus
Surgery
þpost-opCH
Resection
Wide
Lungmetastasis
atonset
44
DOD
12
pri
29
Male
4Pelvis
Pre-opCH
þradiotherapy
þsurgery
Amputation
Marginal
7Lungmetastasis
35
NED2
13
pri
76
Male
3Femur
Surgery
Resection
Wide
2Lungþ
liver
metastasis
42
AW
D
14
pri
40
Male
4Pelvis
Pre-opCH
þsurgery
þpost-opCH
Resection
Wide
12
Secondtumor
30
DOD
15
pri
37
Male
4Pelvis
Chemotherapy
Notdone(refused
bythepatient)
14
DOD
16
pri
82
Female
4Humerus
Surgery
Amputation
Wide
Lungmetastasis
atonset
0DOD
17
pri
75
Female
3Pelvis
Surgery
Resection
Marginal
Lost
atfollow
up
18
pri
46
Female
4Femur
Surgery
þpost-opCH
Resection
Wide
16
Lungmetastasis
87
DOD
19
pri
16
Male
3Fibula
Pre-opCH
þsurgery
þpost-opCH
Resection
Wide
42
NED
pri,primarytumor;
rec,
localrecurrence;NED,noevidence
ofdisease;NED2,noevidence
ofdiseaseafterrelapse;AW
D,alivewithdisease;DOD,dead
ofdisease;pre-opCH,preoperative
chemotherapy;
post-opCH,postoperative
chemotherapy.
134 NIINI ET AL.
Genes, Chromosomes & Cancer DOI 10.1002/gcc
custom-made aberration filter (minimum seven
probes gained/lost). For the regions with most
frequent gains or losses, the somatic copy number
variations were excluded by visual examination of
the regions, with a connected window of known
copy number variable regions in the DNA Ana-
lytics Software.
Methylation-Specific Polymerase Chain Reaction of
the p16INK4a and p14ARF Genes
Methylation-specific PCR for p16INK4a and
p14ARF promoter methylation was performed as
described previously (Herman et al., 1996; Estel-
ler et al., 2000). The DNA was modified with
bisulphite solution by using ImprintTM DNA
Modification Kit (Sigma-Aldrich, St Louis, MO)
according to the manufacturer’s instructions. After
bisulphite modification, specific primers recogniz-
ing the methylated and unmethylated sequences
of the promoter regions of p16INK4a and p14ARF
were used for methylation-specific PCR as previ-
ously reported (Herman et al., 1996; Esteller
et al., 2000).
The PCR mixture contained �30 ng of bisul-
phite-treated DNA, 0.2 mM deoxynucleotide tri-
phosphates, 1.5 mM magnesium chloride, 20 pmol
of each primer, 1� PCR buffer P, and 1 unit of
AmpliTaq Gold (Applied Biosystems, NJ, USA)
in a final volume of 20 ll. Amplification was car-
ried out in a PTC-200 Peltier Thermal Cycler
(BIO-RAD, CA, USA). Reactions of p16INK4a
were denatured for 15 min at 95�C and incubated
for 35 cycles [95�C for 30 s, 60�C (unmethylated)
or 65�C (methylated) for 30 s, 72�C for 30 s] and
followed by a final 10 min extension at 72�C.Reactions of both unmethylated and methylated
PCR for p14ARF were denatured for 15 min at
95�C and incubated for 35 cycles (95�C for 45 s,
58�C for 45 s, 72�C for 1 min) and followed by a
final 10 min extension at 72�C. Each PCR prod-
uct was loaded on a 1.5% agarose gel, stained
with ethidium bromide, and visualized under UV
illumination.
Mutational Analysis of KIT, PDGFRA, and KDR
Intronic PCR primers were used to amplify
Exons 9, 11, 13 (Lasota et al., 2000), and 17 of
KIT (Corless et al., 2002) and Exons 12 and 18 of
PDGFRA (Heinrich et al., 2003). Primers for
exons codifying the yuxtamembrane and kinase
domains of KDR were designed (Supporting In-
formation Table 1). PCR was performed in 25 ll
reactions containing 2 ll DNA, 50 mM KCl, 10
mM Tris–HCl, pH 8.3, 2 mM MgCl2, 0.2 mM of
each dNTP, 0.2 lM for each primer, and 2 U
AmpliTaq Gold (Perkin-Elmer, Norwalk, CT).
PCR was carried out in a DNA Thermal Cycler
9700 (Perkin-Elmer, Norwalk, CT) wherein the
samples were preheated in an initial step at 95�Cfor 10 min; amplified by 40 cycles of 1 min of
denaturation at 94�C, 1.5 min of annealing at
56�C for KIT primers, 2 min at 65�C for PDGFRAprimers or 1 min at 58�C for KDR primers, and 1
min of extension at 72�C. An additional extension
step of 10 min was also performed. Ten-microli-
ter PCR products were visualized on an ethi-
dium-bromide-stained 2% ultraPure agarose gel
electrophoresis (Life Technologies, Paisley, Scot-
land) and photographed. Negative controls were
included in every set of amplifications. A bidirec-
tional sequencing analysis on an ABI 3130xl
sequencer using the BigDye terminator v3.1 kit
(Applied Biosystems, Foster City, CA) with the
specific primers was performed. Ensembl (http://
www.ensembl.org/Homo_sapiens/index.html) con-
sensus sequences for KIT (ENSG00000157404),
PDGFRA (ENSG00000134853), and KDR (ENS-
G00000128052) were used for characterizing the
mutations.
Immunohistochemistry of KIT, PDGFRA,
and PDGFRB
The expression of KIT, PDGFRA, and
PDGFRB was studied by immunohistochemistry
in the 19 tumor specimens (15 primary tumors
and 4 local recurrences) obtained from the whole
group of 17 patients originally considered for this
study. By using an avidin–biotin-peroxidase com-
plex method, immunohistochemistry was carried
out with the following primary antibodies: antihu-
man CD117 (KIT) rabbit polyclonal antibody
(1:50 dilution rate; DakoCytomation, Glostrup,
Denmark), antihuman PDGF receptor a-subunit(1:100 dilution rate), and antihuman PDGF re-
ceptor b-subunit (1:200 dilution rate) mouse
monoclonal antibodies (both from Genzyme,
Cambridge, MA). Primary antibodies were incu-
bated overnight at 4�C. Development of immu-
noreaction was obtained with diaminobenzidine
and nuclei were counterstained with Gill’s hema-
toxylin. As positive controls, tissue sections of a
PDGF receptor-positive breast cancer and of a
KIT-positive gastrointestinal tumor were used.
Immunostaining was scored on a scale of positiv-
ity from one plus to three plus, according to the
COPY NUMBER PROFILING IN FIBROSARCOMA OF BONE 135
Genes, Chromosomes & Cancer DOI 10.1002/gcc
percentage of positive cells. Cases with 5–10%
positive cells were classified as þ, cases with 10–
50% positive cells as þþ, and cases with more
than 50% positive cells as þþþ. All immunohis-
tochemical stainings were evaluated without
knowing the genetic data to avoid any possible
bias in data interpretation.
RESULTS
Array CGH Findings
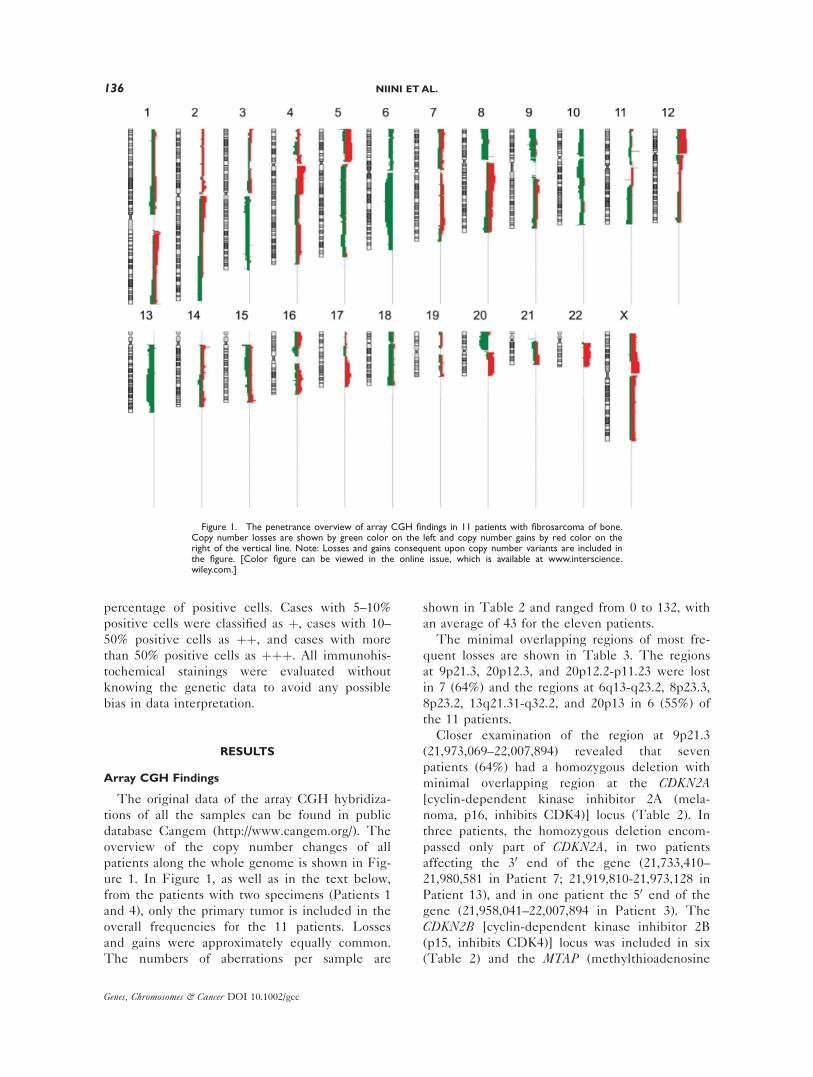
The original data of the array CGH hybridiza-
tions of all the samples can be found in public
database Cangem (http://www.cangem.org/). The
overview of the copy number changes of all
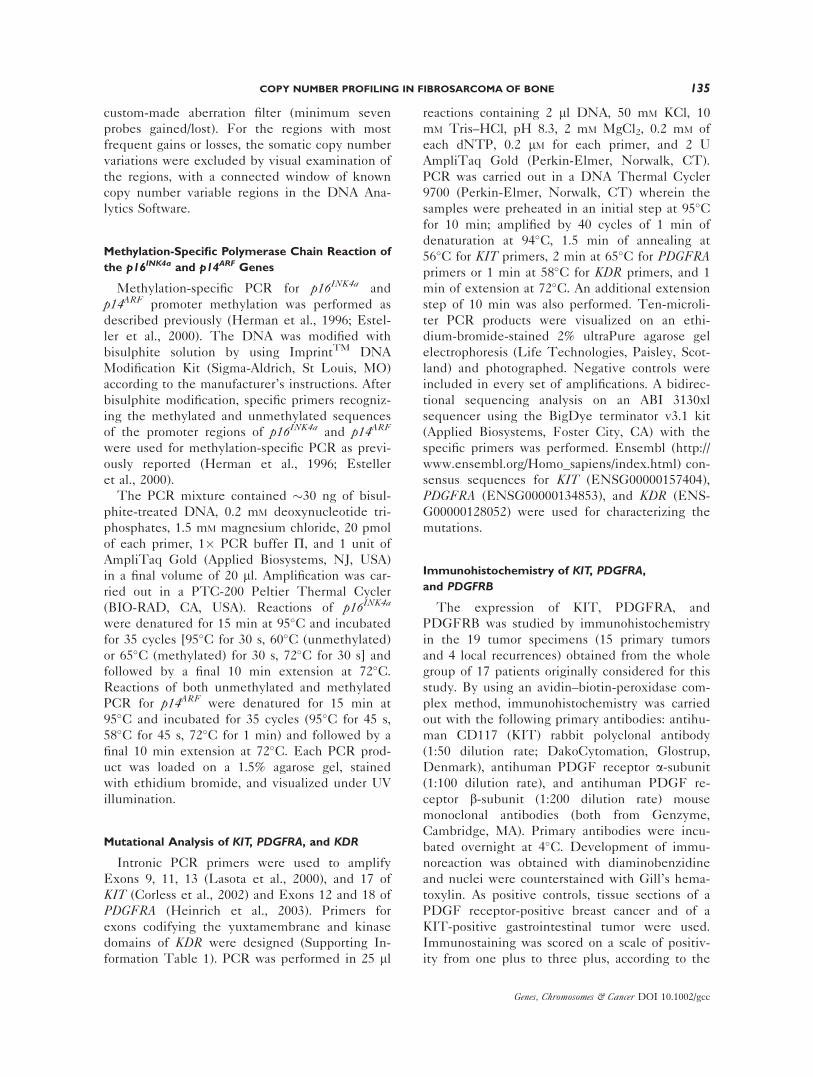
patients along the whole genome is shown in Fig-
ure 1. In Figure 1, as well as in the text below,
from the patients with two specimens (Patients 1
and 4), only the primary tumor is included in the
overall frequencies for the 11 patients. Losses
and gains were approximately equally common.
The numbers of aberrations per sample are
shown in Table 2 and ranged from 0 to 132, with
an average of 43 for the eleven patients.
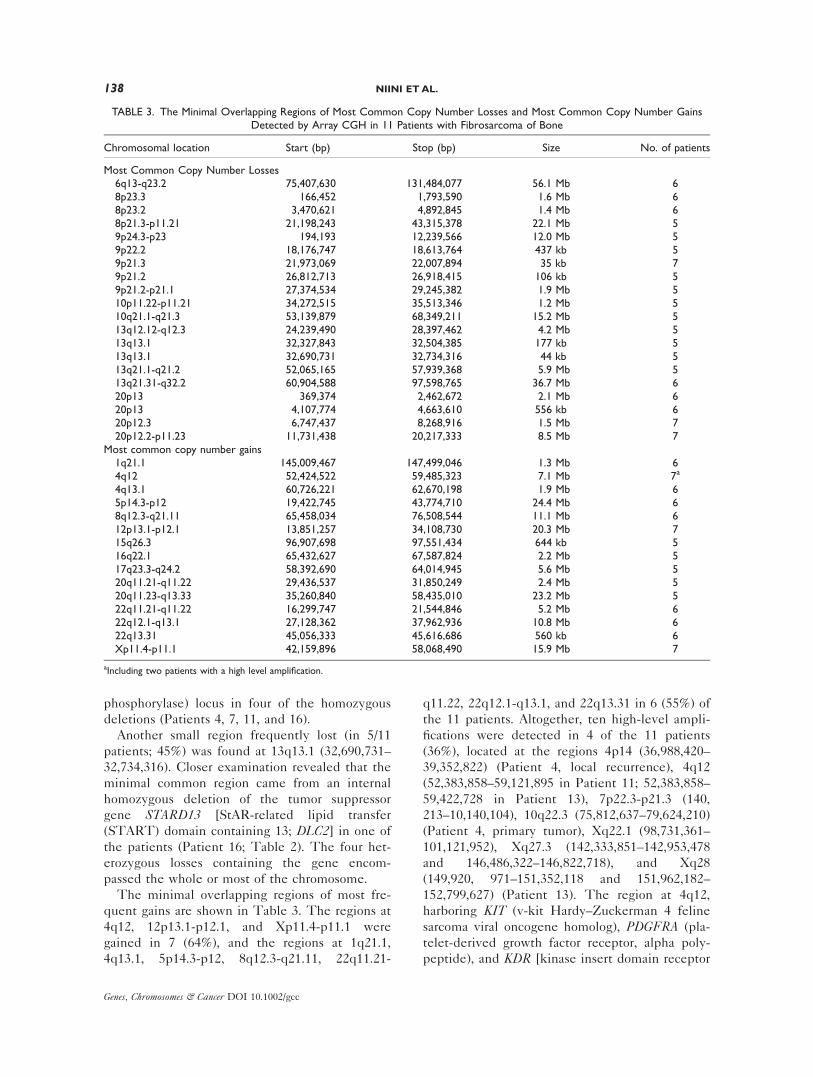
The minimal overlapping regions of most fre-
quent losses are shown in Table 3. The regions
at 9p21.3, 20p12.3, and 20p12.2-p11.23 were lost
in 7 (64%) and the regions at 6q13-q23.2, 8p23.3,
8p23.2, 13q21.31-q32.2, and 20p13 in 6 (55%) of
the 11 patients.
Closer examination of the region at 9p21.3
(21,973,069–22,007,894) revealed that seven
patients (64%) had a homozygous deletion with
minimal overlapping region at the CDKN2A[cyclin-dependent kinase inhibitor 2A (mela-
noma, p16, inhibits CDK4)] locus (Table 2). In
three patients, the homozygous deletion encom-
passed only part of CDKN2A, in two patients
affecting the 30 end of the gene (21,733,410–
21,980,581 in Patient 7; 21,919,810-21,973,128 in
Patient 13), and in one patient the 50 end of the
gene (21,958,041–22,007,894 in Patient 3). The
CDKN2B [cyclin-dependent kinase inhibitor 2B
(p15, inhibits CDK4)] locus was included in six
(Table 2) and the MTAP (methylthioadenosine
Figure 1. The penetrance overview of array CGH findings in 11 patients with fibrosarcoma of bone.Copy number losses are shown by green color on the left and copy number gains by red color on theright of the vertical line. Note: Losses and gains consequent upon copy number variants are included inthe figure. [Color figure can be viewed in the online issue, which is available at www.interscience.wiley.com.]
136 NIINI ET AL.
Genes, Chromosomes & Cancer DOI 10.1002/gcc
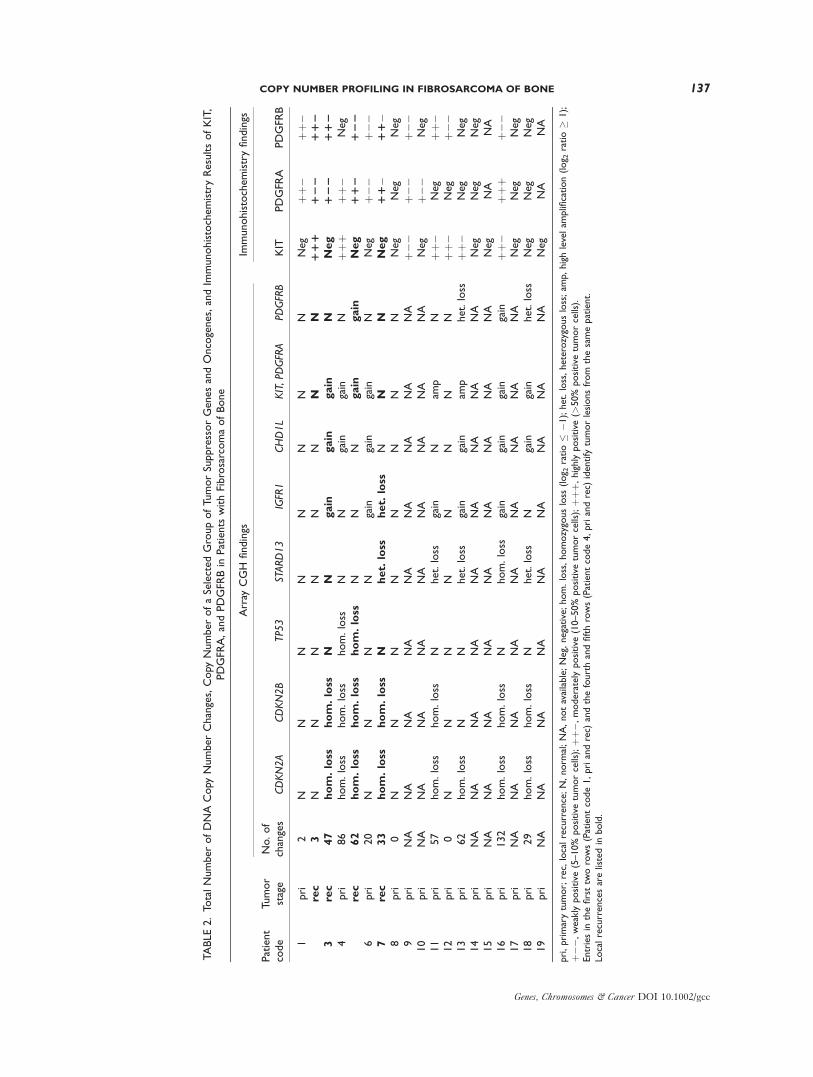
TABLE2.To
talNumberofDNACopy
NumberChanges,Copy
NumberofaSelectedGroupofTumorSuppressorGenesandOncogenes,andIm
munohistochemistryResultsofKIT,
PDGFR
A,andPDGFR
Bin
Patients
withFibrosarcomaofBone
Patient
code
Tumor
stage
Array
CGH
findings
Immunohistochemistryfindings
No.of
changes
CDKN2A
CDKN2B
TP53
STARD13
IGFR1
CHD1L
KIT,PD
GFRA
PDGFRB
KIT
PDGFR
APDGFR
B
1pri
2N
NN
NN
NN
NNeg
þþ�
þþ�
rec
3N
NN
NN
NN
N111
122
112
3rec
47
hom.loss
hom.loss
NN
gain
gain
gain
NNeg
122
112
4pri
86
hom.loss
hom.loss
hom.loss
NN
gain
gain
Nþþ
þþþ
�Neg
rec
62
hom.loss
hom.loss
hom.loss
NN
Ngain
gain
Neg
112
122
6pri
20
NN
NN
gain
gain
gain
NNeg
þ��
þ��
7rec
33
hom.loss
hom.loss
Nhet.
loss
het.
loss
NN
NNeg
11�
11�
8pri
0N
NN
NN
NN
NNeg
Neg
Neg
9pri
NA
NA
NA
NA
NA
NA
NA
NA
NA
þ��
þ��
þ��
10
pri
NA
NA
NA
NA
NA
NA
NA
NA
NA
Neg
þ��
Neg
11
pri
57
hom.loss
hom.loss
Nhet.loss
gain
Nam
pN
þþ�
Neg
þþ�
12
pri
0N
NN
NN
NN
Nþþ
�Neg
þ��
13
pri
62
hom.loss
NN
het.loss
gain
gain
amp
het.loss
þþ�
Neg
Neg
14
pri
NA
NA
NA
NA
NA
NA
NA
NA
NA
Neg
Neg
Neg
15
pri
NA
NA
NA
NA
NA
NA
NA
NA
NA
Neg
NA
NA
16
pri
132
hom.loss
hom.loss
Nhom.loss
gain
gain
gain
gain
þþ�
þþþ
þ��
17
pri
NA
NA
NA
NA
NA
NA
NA
NA
NA
Neg
Neg
Neg
18
pri
29
hom.loss
hom.loss
Nhet.loss
Ngain
gain
het.loss
Neg
Neg
Neg
19
pri
NA
NA
NA
NA
NA
NA
NA
NA
NA
Neg
NA
NA
pri,primarytumor;rec,
localrecurrence;N,norm
al;NA,notavailable;Neg,negative;hom.loss,homozygousloss
(log 2
ratio�
�1);het.loss,heterozygousloss;am
p,highlevelam
plification(log 2
ratio�
1);
þ��,
weaklypositive
(5–10%
positive
tumorcells);þþ
�,moderatelypositive
(10–50%
positive
tumorcells);þþ
þ,highlypositive
(>50%
positive
tumorcells).
Entriesin
thefirsttw
orows(Patientcode1,priandrec)
andthefourthandfifthrows(Patientcode4,priandrec)
identify
tumorlesionsfrom
thesamepatient.
Localrecurrencesarelistedin
bold.
COPY NUMBER PROFILING IN FIBROSARCOMA OF BONE 137
Genes, Chromosomes & Cancer DOI 10.1002/gcc
phosphorylase) locus in four of the homozygous
deletions (Patients 4, 7, 11, and 16).
Another small region frequently lost (in 5/11
patients; 45%) was found at 13q13.1 (32,690,731–
32,734,316). Closer examination revealed that the
minimal common region came from an internal
homozygous deletion of the tumor suppressor
gene STARD13 [StAR-related lipid transfer
(START) domain containing 13; DLC2] in one of
the patients (Patient 16; Table 2). The four het-
erozygous losses containing the gene encom-
passed the whole or most of the chromosome.
The minimal overlapping regions of most fre-
quent gains are shown in Table 3. The regions at
4q12, 12p13.1-p12.1, and Xp11.4-p11.1 were
gained in 7 (64%), and the regions at 1q21.1,
4q13.1, 5p14.3-p12, 8q12.3-q21.11, 22q11.21-
q11.22, 22q12.1-q13.1, and 22q13.31 in 6 (55%) of
the 11 patients. Altogether, ten high-level ampli-
fications were detected in 4 of the 11 patients
(36%), located at the regions 4p14 (36,988,420–
39,352,822) (Patient 4, local recurrence), 4q12
(52,383,858–59,121,895 in Patient 11; 52,383,858–
59,422,728 in Patient 13), 7p22.3-p21.3 (140,
213–10,140,104), 10q22.3 (75,812,637–79,624,210)
(Patient 4, primary tumor), Xq22.1 (98,731,361–
101,121,952), Xq27.3 (142,333,851–142,953,478
and 146,486,322–146,822,718), and Xq28
(149,920, 971–151,352,118 and 151,962,182–
152,799,627) (Patient 13). The region at 4q12,
harboring KIT (v-kit Hardy–Zuckerman 4 feline
sarcoma viral oncogene homolog), PDGFRA (pla-
telet-derived growth factor receptor, alpha poly-
peptide), and KDR [kinase insert domain receptor
TABLE 3. The Minimal Overlapping Regions of Most Common Copy Number Losses and Most Common Copy Number GainsDetected by Array CGH in 11 Patients with Fibrosarcoma of Bone
Chromosomal location Start (bp) Stop (bp) Size No. of patients
Most Common Copy Number Losses6q13-q23.2 75,407,630 131,484,077 56.1 Mb 68p23.3 ,166,452 1,793,590 1.6 Mb 68p23.2 3,470,621 4,892,845 1.4 Mb 68p21.3-p11.21 21,198,243 43,315,378 22.1 Mb 59p24.3-p23 ,194,193 12,239,566 12.0 Mb 59p22.2 18,176,747 18,613,764 437.kb 59p21.3 21,973,069 22,007,894 35.kb 79p21.2 26,812,713 26,918,415 106.kb 59p21.2-p21.1 27,374,534 29,245,382 1.9 Mb 510p11.22-p11.21 34,272,515 35,513,346 1.2 Mb 510q21.1-q21.3 53,139,879 68,349,211 15.2 Mb 513q12.12-q12.3 24,239,490 28,397,462 4.2 Mb 513q13.1 32,327,843 32,504,385 177.kb 513q13.1 32,690,731 32,734,316 44.kb 513q21.1-q21.2 52,065,165 57,939,368 5.9 Mb 513q21.31-q32.2 60,904,588 97,598,765 36.7 Mb 620p13 ,369,374 2,462,672 2.1 Mb 620p13 4,107,774 4,663,610 556.kb 620p12.3 6,747,437 8,268,916 1.5 Mb 720p12.2-p11.23 11,731,438 20,217,333 8.5 Mb 7
Most common copy number gains1q21.1 145,009,467 147,499,046 1.3 Mb 64q12 52,424,522 59,485,323 7.1 Mb 7a
4q13.1 60,726,221 62,670,198 1.9 Mb 65p14.3-p12 19,422,745 43,774,710 24.4 Mb 68q12.3-q21.11 65,458,034 76,508,544 11.1 Mb 612p13.1-p12.1 13,851,257 34,108,730 20.3 Mb 715q26.3 96,907,698 97,551,434 644.kb 516q22.1 65,432,627 67,587,824 2.2 Mb 517q23.3-q24.2 58,392,690 64,014,945 5.6 Mb 520q11.21-q11.22 29,436,537 31,850,249 2.4 Mb 520q11.23-q13.33 35,260,840 58,435,010 23.2 Mb 522q11.21-q11.22 16,299,747 21,544,846 5.2 Mb 622q12.1-q13.1 27,128,362 37,962,936 10.8 Mb 622q13.31 45,056,333 45,616,686 560.kb 6Xp11.4-p11.1 42,159,896 58,068,490 15.9 Mb 7
aIncluding two patients with a high level amplification.
138 NIINI ET AL.
Genes, Chromosomes & Cancer DOI 10.1002/gcc
(a type III receptor tyrosine kinase); VEGFR2],was highly amplified in 2 of the 11 patients (18%;
Table 2).
A small minimal overlapping region of gains at
15q26.3 (96,907,698–97,551,434) contains four
genes, one of which is IGF1R (insulin-like growth
factor 1 receptor). This region was gained in 5 of
the 11 patients (45%; Table 2). Another relatively
small minimal overlapping region at 1q21.1
(145,009,467–147,499,046), gained in 6 of the
patients (55%), contains 12 genes. One of these is
CHD1L (chromodomain helicase DNA-binding
protein 1-like; Table 2).
There were four regions showing clearly higher
frequency of gains in the local recurrences (three
of four; 75%) compared to the overall frequency.
The minimal overlapping regions of these gains
were seen at 7q35-q36.1, 8q23.3-q24.13, 11q12.2-
q12.3, and 11q13.2-q13.3 (Patients 3, 4, and 7).
Because of the small number of patients, the sta-
tistical significance of difference in frequencies
could not be demonstrated. The region at
11q13.2-q13.3 (66,875,572–70,410,288; size 3,5
Mb) contains the CCND1 (cyclin D1) gene and
FGF (fibroblast growth factor) cluster with around
50 other genes.
Hypermethylation of CDKN2A
Because of the finding of frequent deletion of
CDKN2A in array CGH, methylation status of the
two genes at the CDKN2A locus, p16INK4a and
p14ARF, was studied in 16 specimens from 14
patients (12 primary tumors and 4 local recur-
rences). Since array CGH fundamentally is not a
quantitative method, the methylation analysis
was also performed on the seven patients (eight
samples), which seemed to possess a homozygous
deletion at CDKN2A. The other seven patients
included four patients (five samples) with no de-
letion at CDKN2A and three patients without
array CGH result. Hypermethylation of both
p16INK4a and p14ARF was detected in 1 of the 14
patients studied (7%; Patient 9), a patient lacking
an array CGH result. Both genes were hyperme-
thylated in this same patient.
Mutational Analysis of KIT, PDGFRA, and KDR
The KIT, PDGFRA, and KDR genes, located in
the region with recurrent high level amplification,
were screened for mutations in 16 tumor speci-
mens (12 primary tumors and 4 local recurrences)
from 14 patients. Particular regions that codify for
the yuxtamembrane and kinase domains, crucial
for the regulation of the activity of these tyrosine
kinase receptors, were studied. No activating
mutations were found in these regions in any of
the genes. One patient (Patient 15) without array
CGH result showed a heterozygous silent muta-
tion in the third position of Codon 798 of KIT[ATC (Ile) > ATT (Ile)] (Exon 17), which is not
a polymorphism. Four patients (Patients 4, 7, 10,
and 15) carried the polymorphism rs2228230 in
Exon 18 of PDGFRA. This polymorphism was
present heterozygously and consisted of a synony-
mous change in the third position of Codon 824
[GTC (Val) > GTT (Val)].
Immunohistochemistry of KIT, PDGFRA,
and PDGFRB
KIT and PDGF-receptors were selected to be
studied by immunohistochemistry, since the KITand PDGFRA genes were included in the region
with recurrent high level amplification. The
results are shown in Table 2.
KIT was expressed in 6 of the 15 primary
tumors (40%) and in one of the four local recur-
rences (25%). Among the seven cases that
showed a KIT-positive immunoreaction, the 4q12
region was highly amplified in two patients
(Patients 11 and 13), gained in two patients
(Patients 4 and 16), and not affected by changes
in two patients (Patients 1 and 12). In one of the
patients, array CGH result was missing.
PDGFRA was expressed in 6 of the 13 pri-
mary tumors with available immunohistochemis-
try data (46%) and in all of the four local
recurrences. Among the seven tumors showing
gain of 4q12 region, a positive immunoreaction
for PDGFRA was present in four cases (Patients
3, 4, 6, and 16). PDGFRB was also expressed in
6 of the 13 primary tumors (46%) and in all local
recurrences. Immunohistochemistry data posi-
tively correlated with array CGH results: both
two cases with losses at 5q (Patients 13 and 18)
were negative for PDGFRB and both two cases
with gain at 5q were PDGFRB-positive (Patient
4, recurrence and Patient 16). However, there
were seven cases in which PDGFRB positivity
was not associated with changes at 5q. By consid-
ering the 12 cases that resulted positive to either
PDGFRA or PDGFRB, it is worthwhile noting
that eight cases (including all four local recur-
rences) expressed both receptors and four cases
only one of them.
COPY NUMBER PROFILING IN FIBROSARCOMA OF BONE 139
Genes, Chromosomes & Cancer DOI 10.1002/gcc
DISCUSSION
High number of recurrent copy number aberra-
tions was detected in the 11 patients with FS of
bone. Gains were most frequently found at
regions 1q, 4q, 5p, 8q, 12p, 15q, 16q, 17q, 20q,
22q, and Xp, each of which has previously been
found to be commonly gained in at least some
types of sarcomas (Mairal et al., 1999; Pandita
et al., 1999; Squire et al., 2003; Lau et al., 2004;
Man et al., 2004; Larramendy et al., 2006; Meza-
Zepeda et al., 2006; Ohguri et al., 2006; Rozeman
et al., 2006; Tarkkanen et al., 2006). The regions
with most common losses were 6q, 8p, 9p, 10,
13q, and 20p. All these regions have been found
to be frequently lost in many types of sarcomas,
except for 20p, which seems to be relatively com-
mon only in MFHs of soft tissue and bone (Mai-
ral et al., 1999; Tarkkanen et al., 2006).
In our previous study (Hattinger et al., 2004),
which included a different series of FS of bone
patients, the most frequently detected aberrations
were gains of the chromosomal region 22q (by
conventional CGH) and of the platelet-derived
growth factor beta (PDGFB) gene located at
22q12.3-q13.1 (by array CGH). Findings obtained
in the present study were in agreement with
those already published and further indicated the
involvement of 22q harbored genes in the patho-
genesis of FS of bone. In the other previous
study of FS of bone, Hallor et al. (2007) studied
only one case with ring chromosome 6 and found
losses of distal ends of 6p and 6q as sole copy
number aberrations using array CGH.
When comparing our results to the pattern of
changes found in array CGH studies of OS
(Squire et al., 2003; Lau et al., 2004; Man et al.,
2004; Zielenska et al., 2004; Atiye et al., 2005),
many similarities were seen, but also many differ-
ences could be pointed out, the most striking
ones at the regions 3p, 6p, 8p, 12p, 17p, 20p, and
22. More than the changes in OS, our results
resembled the pattern of changes detected in 26
patients with MFH of bone using conventional
CGH (Tarkkanen et al., 2006). Differences, how-
ever, could also be found compared to results of
that study, the most eye-catching ones at the
regions 1p, 6p, and 12q with more frequent gains
in the patients with MFH and the region 8p with
more frequent losses in our patients with FS.
The range in the number of aberrations per
patients was high. In three patients, none or only
a couple of aberrations were seen. In the other
eight patients, the number of alterations ranged
from 20 to 132, with an average of 58. Thus, as
in many other sarcoma types (Mairal et al., 1999;
Pandita et al., 1999; Squire et al., 2003; Larra-
mendy et al., 2006; Rozeman et al., 2006; Tarkka-
nen et al., 2006), high chromosomal instability is
a common phenomenon in FS of bone, too. The
possible association between complexity of copy
number karyotype and prognosis needs to be
studied with a larger patient material.
Homozygous losses with minimal overlapping
region at the CDKN2A locus (9p21.3) were
detected in 7 of the 11 patients (64%). Six of the
losses also included CDKN2B. Our results suggest
that in FS of bone the homozygous deletions of
CDKN2A are much more common than in OS, in
which they are seen in about 10% of the patients
(Miller et al., 1996; Nielsen et al., 1998; Wei
et al., 1999; Tsuchiya et al., 2000; Patino-Garcia
et al., 2003; Lopez-Guerrero et al., 2004). Homo-
zygous deletions of the gene have also been
reported in MFH of soft tissue (Orlow et al.,
1999; Simons et al., 2000). To our knowledge, al-
together nine cases with FS of soft tissue have
been studied for the deletions at CDKN2A, but
no deletions were found (Maelandsmo et al.,
1995; Orlow et al., 1999).
CDKN2A encodes two different transcripts,
p16INK4a and p14ARF, from different promoters
and in alternate reading frames [for review, see
Kim and Sharpless (2006)]. Methylation status of
p16INK4a and p14ARF was studied in 14 patients,
including 7 patients showing a homozygous dele-
tion of CDKN2A in array CGH. Both p16INK4a
and p14ARF were found to be hypermethylated in
one and the same patient (a patient without an
array CGH result). Deletion, thus, seems to be
the main mechanism of the inactivation of these
genes in FS of bone. Though hypermethylation
of both p16INK4a and p14ARF was detected in the
same patient, methylation of these two genes has
been reported to occur independently in colo-
rectal carcinoma (Esteller et al., 2000).
It is noteworthy that all the patients with the
loss of CDKN2A possessed high number of copy
number changes (29–132). This suggests that the
mechanisms driving tumorigenesis in patients
with a close to normal karyotype may be totally
different from those in the patients with a com-
plex karyotype.
Interestingly, the CCND1 gene encoding cyclin
D1 that acts in the same pathway as p16INK4a
with opposing effects, is situated at region
11q13.2-q13.3 that was gained in three of the
four local recurrences (75%). Concerning the RB1
140 NIINI ET AL.
Genes, Chromosomes & Cancer DOI 10.1002/gcc
gene, heterozygous large losses at 13q, mostly
affecting the whole chromosome, were found in 4
of the 11 patients (36%). All of the patients with
gain at CCND1 or loss at RB1 also showed a
homozygous deletion at CDKN2A. Regarding
TP53, a 72-kb homozygous deletion containing
the gene (17p13.1; 7,466,188–7,537,896) was
found in one of the patients (Table 2). Thus, it
seems that not only the disruption of RB pathway
but also that of TP53 pathway plays a role in the
pathogenesis of FS of bone.
Single recurrent high level amplification
located at 4q12 was found in our patient material.
This region has previously been shown to be fre-
quently gained in OS (Squire et al., 2003; Atiye
et al., 2005) and in MFH of bone (Tarkkanen
et al., 2006). In OS, high level amplifications at
4q12 have also been reported (Lau et al., 2004;
Man et al., 2004). The region harbors the genes
encoding tyrosine kinases KIT, PDGFRA, and
KDR, which are of particular interest because of
their potential use as targets for directed thera-
pies. These genes were screened for mutations in
14 of our patients, but no activating mutations
were found in any of the genes.
The absence of KIT mutations was expectable
as, to our knowledge, KIT has not been reported
to be activated by mutations in other sarcomas
than GIST [Burger et al., 2005; reviewed in
Miettinen and Lasota (2005)]. Expression of KIT
was, however, detected in 5 of our 15 primary
tumors (33%) and in one of four local recurrences
(25%). The samples with high level amplification
at 4q12 showed moderate expression of the pro-
tein. Overexpression of the wild-type KIT recep-
tors has been reported in many neoplasms,
including OS and Ewing sarcoma (Tamborini
et al., 2004; Burger et al., 2005; Entz-Werle et al.,
2005; McIntyre et al., 2005; Bozzi et al., 2007).
Fibroblastic soft tissue sarcomas, as most soft tis-
sue sarcomas, have generally been found to be
KIT negative [Hornick and Fletcher, 2002;
reviewed in Miettinen and Lasota (2005)]. In a
study of OS, KIT overexpression resulted from
amplification of the gene itself in most of the
cases (Entz-Werle et al., 2007). In other tumors,
including Ewing sarcoma, the overexpression of
the wild-type receptor has usually been suggested
to be caused by autocrine/paracrine loop activa-
tion (Tamborini et al., 2004; Burger et al., 2005;
Bozzi et al., 2007). In many cases, the phospho-
rylation of KIT has also been studied, and in
each example the wild-type KIT receptor was
shown to be phosphorylated and, thus, as its
active form (Gonzalez et al., 2004; Tamborini
et al., 2004; Bozzi et al., 2007). Based on these
data, we can hypothesize that our samples are
also expressing a phosphorylated and active KIT
receptor.
PDGFRA was expressed in 6 (46%) and
PDGFRB also in 6 (46%) of the 13 primary
tumors. Coexpression of the receptors was
detected in 4 of the 13 primary tumors (31%) and
in all of the local recurrences. The expression of
PDGFRA and PDGFRB in more than half of the
samples, as well as their frequent coexpression,
including all of the local recurrences, supports
our previous study that already suggested these
receptors to play an important role in the patho-
genesis of FS of bone (Hattinger et al., 2004).
We previously detected expression of PDGFRA
in 20%, the expression of PDGFRB in 28%, and
simultaneous expression of PDGFB ligand and
the receptors in 32% of 25 cases with FS of bone,
suggesting a presence of a PDGFB-mediated
autocrine loop. Using conventional CGH, we also
found a gain at the chromosomal region 22q con-
taining the PDGFB gene (22q13.1) in seven of
nine cases (78%), including one high level ampli-
fication. In addition, we showed a gain of PDGFBin three of five cases using DNA arrays. These
results are in concordance with our present study
showing a gain at the region containing PDGFBin 6 of the 11 patients (55%).
The 4q12 region with high level amplifications
in our patients also contains the KDR gene.
Overexpression of its ligand, VEGF, associates
with poor prognosis in sarcomas, including OS
and Ewing sarcoma [Lee et al., 1999; Kaya et al.,
2000; Fuchs et al., 2004; reviewed in DuBois
and Demetri (2007)]. In one study of 30 patients
with nonmetastatic OS, the expression of KDR
was found in 67% of the patients but the expres-
sion did not correlate with survival (Lee et al.,
1999).
Frequent losses (in 5/11 patients; 45%) were
found at 13q13.1 with minimal overlapping region
inside the STARD13 gene. The small region
derived from a homozygous internal deletion of
the gene in one of the patients. STARD13 was
recently identified as a tumor suppressor gene in
hepatocellular carcinoma (Leung et al., 2005),
and it has also been found to be downregulated
in many other solid tumors (Ullmannova and
Popescu, 2006). The gene encodes a GTPase-
activating protein exhibiting its tumor suppressor
functions by negatively regulating RHOA (ras
homolog gene family, member A), the
COPY NUMBER PROFILING IN FIBROSARCOMA OF BONE 141
Genes, Chromosomes & Cancer DOI 10.1002/gcc
overexpression of which is believed to be
involved in tumorigenesis of many cancer types
[Pille et al., 2005; reviewed in Sahai and Marshall
(2002)].
A small minimal overlapping region of frequent
gains (in 5/11 patients; 45%) was detected at
15q26.3. The region contains only four genes,
one of which is IGF1R. The IGF1R pathway has
been shown to play a central role in sarcomas,
and the first clinical trials targeting IGF1 receptor
in sarcoma therapy are currently underway
[reviewed in Scotlandi and Picci (2008)]. The
15q26.3 region with IGF1R is frequently gained
in chondrosarcoma and MFHs of bone and soft
tissue (Mairal et al., 1999; Rozeman et al., 2006;
Tarkkanen et al., 2006). Moreover, one high-level
amplification of the 15q25-qter region has been
reported in OS (Squire et al., 2003). If IGF1Rturns out to be important for the pathogenesis of
FS of bone, as our results suggest, the patients
can be assumed to benefit from treatment tar-
geted to IGF1R in this sarcoma type, too.
Another relatively small minimal overlapping
region of frequent gains (in 6/11 patients; 55%)
was found at the region 1q21.1. This region is
frequently gained in many solid tumors, including
OS and MFHs of both bone and soft tissue
(Simon et al., 1998; Tirkkonen et al., 1998; Fang
et al., 2001; Squire et al., 2003; Lau et al., 2004;
Atiye et al., 2005; Tarkkanen et al., 2006; Ma
et al., 2008). Moreover, high level amplifications
have been reported in a few patients with OS
(Lau et al., 2004; Atiye et al., 2005) and one
patient with MFH of soft tissue (Mairal et al.,
1999). The minimal overlapping region of the
gains in our patients contains 12 genes. Interest-
ingly, one of these is CHD1L, which was recently
reported as a candidate oncogene in hepatocellu-
lar carcinoma (Ma et al., 2008).
In conclusion, our array analysis revealed
several regions and genes, which may be involved
in the pathogenesis of FS of bone. Particularly,
the deletion of CDKN2A seems to play a crucial
role in a substantial proportion of the patients.
The recurrent high level amplification at 4q12
including KIT, PDGFRA, and KDR suggests that
some, if not all, of these genes may also have
influence on the pathogenesis of this tumor.
Other genes with potential importance include
STARD13, IGF1R, and CHD1L. The results open
up a good starting point for identifying new
diagnostic and prognostic markers, as well as
potential targets for therapy in this aggressive
type of tumor.
REFERENCES
Atiye J, Wolf M, Kaur S, Monni O, Bohling T, Kivioja A, Tas E,Serra M, Tarkkanen M, Knuutila S. 2005. Gene amplificationsin osteosarcoma-CGH microarray analysis. Genes ChromosomesCancer 42:158–163.
Bozzi F, Tamborini E, Negri T, Pastore E, Ferrari A, Luksch R,Casanova M, Pierotti MA, Bellani FF, Pilotti S. 2007. Evidencefor activation of KIT, PDGFRalpha, and PDGFRbeta receptorsin the Ewing sarcoma family of tumors. Cancer 109:1638–1645.
Burger H, den Bakker MA, Kros JM, van Tol H, de Bruin AM,Oosterhuis W, van den Ingh HF, van der Harst E, de SchipperHP, Wiemer EA, Nooter K. 2005. Activating mutations in c-KIT and PDGFRalpha are exclusively found in gastrointestinalstromal tumors and not in other tumors overexpressing theseimatinib mesylate target genes. Cancer Biol Ther 4:1270–1274.
Campanacci M. 1999.Bone and Soft Tissue Tumors, 2nd ed.Wien: Springer. 1319 p.
Corless CL, McGreevey L, Haley A, Town A, Heinrich MC.2002. KIT mutations are common in incidental gastrointestinalstromal tumors one centimeter or less in size. Am J Pathol160:1567–1572.
DuBois S, Demetri G. 2007. Markers of angiogenesis and clinicalfeatures in patients with sarcoma. Cancer 109:813–819.
Entz-Werle N, Marcellin L, Gaub MP, Guerin E, Schneider A,Berard-Marec P, Kalifa C, Brugiere L, Pacquement H, SchmittC, Tabone MD, Jeanne-Pasquier C, Terrier P, Dijoud F, OudetP, Lutz P, Babin-Boilletot A. 2005. Prognostic significance ofallelic imbalance at the c-kit gene locus and c-kit overexpres-sion by immunohistochemistry in pediatric osteosarcomas.J Clin Oncol 23:2248–2255.
Entz-Werle N, Gaub MP, Lavaux T, Marcellin L, Metzger N,Marec-Berard P, Schmitt C, Brugiere L, Kalifa C, Tabone MD,Pacquement H, Gentet P, Lutz P, Oudet P, Babin A. 2007.KIT gene in pediatric osteosarcomas: Could it be a new thera-peutic target? Int J Cancer 120:2510–2516.
Esteller M, Tortola S, Toyota M, Capella G, Peinado MA, BaylinSB, Herman JG. 2000. Hypermethylation-associated inactivationof p14(ARF) is independent of p16(INK4a) methylation andp53 mutational status. Cancer Res 60:129–133.
Fang Y, Guan X, Guo Y, Sham J, Deng M, Liang Q, Li H, ZhangH, Zhou H, Trent J. 2001. Analysis of genetic alterations in pri-mary nasopharyngeal carcinoma by comparative genomichybridization. Genes Chromosomes Cancer 30:254–260.
Fuchs B, Inwards CY, Janknecht R. 2004. Vascular endothelialgrowth factor expression is up-regulated by EWS-ETS oncopro-teins and Sp1 and may represent an independent predictor ofsurvival in Ewing’s sarcoma. Clin Cancer Res 10:1344–1353.
Gonzalez I, Andreu EJ, Panizo A, Inoges S, Fontalba A, Fernan-dez-Luna JL, Gaboli M, Sierrasesumaga L, Martin-Algarra S,Pardo J, Prosper F, de Alava E. 2004. Imatinib inhibits prolifer-ation of Ewing tumor cells mediated by the stem cell factor/KIT receptor pathway, and sensitizes cells to vincristine anddoxorubicin-induced apoptosis. Clin Cancer Res 10:751–761.
Hallor KH, Heidenblad M, Brosjo O, Mandahl N, Mertens F.2007. Tiling resolution array comparative genomic hybridizationanalysis of a fibrosarcoma of bone. Cancer Genet Cytogenet172:80–83.
Hattinger CM, Tarkkanen M, Benini S, Pasello M, Stoico G, Bac-chini P, Knuutila S, Scotlandi K, Picci P, Serra M. 2004.Genetic analysis of fibrosarcoma of bone, a rare tumour entityclosely related to osteosarcoma and malignant fibrous histiocy-toma of bone. Eur J. Cell Biol 83:483–491.
Heinrich MC, Corless CL, Duensing A, McGreevey L, Chen CJ,Joseph N, Singer S, Griffith DJ, Haley A, Town A, DemetriGD, Fletcher CD, Fletcher JA. 2003. PDGFRA activatingmutations in gastrointestinal stromal tumors. Science 299:708–710.
Herman JG, Graff JR, Myohanen S, Nelkin BD, Baylin SB. 1996.Methylation-specific PCR: A novel PCR assay for methylationstatus of CpG islands. Proc Natl Acad Sci USA 93:9821–9826.
Hornick JL, Fletcher CD. 2002. Immunohistochemical stainingfor KIT (CD117) in soft tissue sarcomas is very limited in dis-tribution. Am J Clin Pathol 117:188–193.
Kahn LB, Vigorita V. 2002. Pathology and genetics of tumours ofsoft tissue and bone. In: Fletcher CDM, Unni KK, Mertens F,editors. World Health Organization Classification of Tumours.Lyon, France: IARC Press. p 289.
Kaya M, Wada T, Akatsuka T, Kawaguchi S, Nagoya S, ShindohM, Higashino F, Mezawa F, Okada F, Ishii S. 2000. Vascular
142 NIINI ET AL.
Genes, Chromosomes & Cancer DOI 10.1002/gcc
endothelial growth factor expression in untreated osteosarcomais predictive of pulmonary metastasis and poor prognosis. ClinCancer Res 6:572–577.
Kim WY, Sharpless NE. 2006. The regulation of INK4/ARF incancer and aging. Cell 127:265–275.
Larramendy ML, Kaur S, Svarvar C, Bohling T, Knuutila S. 2006.Gene copy number profiling of soft-tissue leiomyosarcomas byarray-comparative genomic hybridization. Cancer Genet Cyto-genet 169:94–101.
Lasota J, Wozniak A, Sarlomo-Rikala M, Rys J, Kordek R, NassarA, Sobin LH, Miettinen M. 2000. Mutations in exons 9 and 13of KIT gene are rare events in gastrointestinal stromal tumors.A study of 200 cases. Am J Pathol 157:1091–1095.
Lau CC, Harris CP, Lu XY, Perlaky L, Gogineni S, Chintagum-pala M, Hicks J, Johnson ME, Davino NA, Huvos AG, MeyersPA, Healy JH, Gorlick R, Rao PH. 2004. Frequent amplifica-tion and rearrangement of chromosomal bands 6p12-p21 and17p11.2 in osteosarcoma. Genes Chromosomes Cancer 39:11–21.
Lee YH, Tokunaga T, Oshika Y, Suto R, Yanagisawa K, Tomi-sawa M, Fukuda H, Nakano H, Abe S, Tateishi A, Kijima H,Yamazaki H, Tamaoki N, Ueyama Y, Nakamura M. 1999. Cell-retained isoforms of vascular endothelial growth factor (VEGF)are correlated with poor prognosis in osteosarcoma. Eur J Can-cer 35:1089–1093.
Leung TH, Ching YP, Yam JW, Wong CM, Yau TO, Jin DY, NgIO. 2005. Deleted in liver cancer 2 (DLC2) suppresses celltransformation by means of inhibition of RhoA activity. ProcNatl Acad Sci USA 102:15207–15212.
Lopez-Guerrero JA, Lopez-Gines C, Pellin A, Carda C, Llombart-Bosch A. 2004. Deregulation of the G1 to S-phase cell cyclecheckpoint is involved in the pathogenesis of human osteosar-coma. Diagn Mol Pathol 13:81–91.
Ma NF, Hu L, Fung JM, Xie D, Zheng BJ, Chen L, Tang DJ,Fu L, Wu Z, Chen M, Fang Y, Guan XY. 2008. Isolation andcharacterization of a novel oncogene, amplified in liver cancer1, within a commonly amplified region at 1q21 in hepatocellularcarcinoma. Hepatology 47:503–510.
Maelandsmo GM, Berner JM, Florenes VA, Forus A, Hovig E,Fodstad O, Myklebost O. 1995. Homozygous deletion fre-quency and expression levels of the CDKN2 gene in humansarcomas—Relationship to amplification and mRNA levels ofCDK4 and CCND1. Br J Cancer 72:393–398.
Mairal A, Terrier P, Chibon F, Sastre X, Lecesne A, Aurias A.1999. Loss of chromosome 13 is the most frequent genomicimbalance in malignant fibrous histiocytomas. A comparativegenomic hybridization analysis of a series of 30 cases. CancerGenet Cytogenet 111:134–138.
Man TK, Lu XY, Jaeweon K, Perlaky L, Harris CP, Shah S,Ladanyi M, Gorlick R, Lau CC, Rao PH. 2004. Genome-widearray comparative genomic hybridization analysis reveals dis-tinct amplifications in osteosarcoma. BMC Cancer 4:45.
McIntyre A, Summersgill B, Grygalewicz B, Gillis AJ, Stoop J,van Gurp RJ, Dennis N, Fisher C, Huddart R, Cooper C, ClarkJ, Oosterhuis JW, Looijenga LH, Shipley J. 2005. Amplificationand overexpression of the KIT gene is associated with progres-sion in the seminoma subtype of testicular germ cell tumors ofadolescents and adults. Cancer Res 65:8085–8089.
Meza-Zepeda LA, Kresse SH, Barragan-Polania AH, BjerkehagenB, Ohnstad HO, Namlos HM, Wang J, Kristiansen BE,Myklebost O. 2006. Array comparative genomic hybridizationreveals distinct DNA copy number differences between gastro-intestinal stromal tumors and leiomyosarcomas. Cancer Res66:8984–8993.
Miettinen M, Lasota J. 2005. KIT (CD117): A review on expres-sion in normal and neoplastic tissues, and mutations and theirclinicopathologic correlation. Appl Immunohistochem Mol Mor-phol 13:205–220.
Miller CW, Aslo A, Campbell MJ, Kawamata N, Lampkin BC,Koeffler HP. 1996. Alterations of the p15, p16, and p18 genesin osteosarcoma. Cancer Genet Cytogenet 86:136–142.
Nielsen GP, Burns KL, Rosenberg AE, Louis DN. 1998.CDKN2A gene deletions and loss of p16 expression occur inosteosarcomas that lack RB alterations. Am J Pathol 153:159–163.
Ohguri T, Hisaoka M, Kawauchi S, Sasaki K, Aoki T, KanemitsuS, Matsuyama A, Korogi Y, Hashimoto H. 2006. Cytogeneticanalysis of myxoid liposarcoma and myxofibrosarcoma by array-
based comparative genomic hybridisation. J Clin Pathol 59:978–983.
Orlow I, Drobnjak M, Zhang ZF, Lewis J, Woodruff JM, BrennanMF, Cordon-Cardo C. 1999. Alterations of INK4A and INK4Bgenes in adult soft tissue sarcomas: Effect on survival. J NatlCancer Inst 91:73–79.
Pandita A, Zielenska M, Thorner P, Bayani J, Godbout R, Green-berg M, Squire JA. 1999. Application of comparative genomichybridization, spectral karyotyping, and microarray analysis inthe identification of subtype-specific patterns of genomicchanges in rhabdomyosarcoma. Neoplasia 1:262–275.
Patino-Garcia A, Pineiro ES, Diez MZ, Iturriagagoitia LG, Kluss-mann FA, Ariznabarreta LS. 2003. Genetic and epigenetic alter-ations of the cell cycle regulators and tumor suppressor genesin pediatric osteosarcomas. J Pediatr Hematol Oncol 25:362–367.
Pille JY, Denoyelle C, Varet J, Bertrand JR, Soria J, Opolon P, LuH, Pritchard LL, Vannier JP, Malvy C, Soria C, Li H. 2005.Anti-RhoA and anti-RhoC siRNAs inhibit the proliferation andinvasiveness of MDA-MB-231 breast cancer cells in vitro and invivo. Mol Ther 11:267–274.
Rozeman LB, Szuhai K, Schrage YM, Rosenberg C, Tanke HJ,Taminiau AH, Cleton-Jansen AM, Bovee JV, Hogendoorn PC.2006. Array-comparative genomic hybridization of central chon-drosarcoma: Identification of ribosomal protein S6 and cyclin-dependent kinase 4 as candidate target genes for genomic aber-rations. Cancer 107:380–388.
Sahai E, Marshall CJ. 2002. RHO-GTPases and cancer. Nat RevCancer 2:133–142.
Scotlandi K, Picci P. 2008. Targeting insulin-like growth factor 1receptor in sarcomas. Curr Opin Oncol 20:419–427.
Serra M, Scotlandi K, Sollazzo MR, Sarti M, Maurici D, Benini S,Picci P, Bertoni F, Baldini N. 1996. Value of immunohisto-chemical detection of noncollagenous proteins of bone for diag-nosis of bone tumours. Int J Oncol 9:257–261.
Simon R, Burger H, Brinkschmidt C, Bocker W, Hertle L, TerpeHJ. 1998. Chromosomal aberrations associated with invasion inpapillary superficial bladder cancer. J Pathol 185:345–351.
Simons A, Schepens M, Jeuken J, Sprenger S, van de Zande G,Bjerkehagen B, Forus A, Weibolt V, Molenaar I, van den BergE, Myklebost O, Bridge J, van Kessel AG, Suijkerbuijk R.2000. Frequent loss of 9p21 (p16(INK4A)) and other genomicimbalances in human malignant fibrous histiocytoma. CancerGenet Cytogenet 118:89–98.
Squire JA, Pei J, Marrano P, Beheshti B, Bayani J, Lim G, Moldo-van L, Zielenska M. 2003. High-resolution mapping of amplifi-cations and deletions in pediatric osteosarcoma by use of CGHanalysis of cDNA microarrays. Genes Chromosomes Cancer38:215–225.
Tamborini E, Bonadiman L, Negri T, Greco A, Staurengo S,Bidoli P, Pastorino U, Pierotti MA, Pilotti S. 2004. Detection ofoverexpressed and phosphorylated wild-type kit receptor in sur-gical specimens of small cell lung cancer. Clin Cancer Res10:8214–8219.
Tarkkanen M, Larramendy ML, Bohling T, Serra M, HattingerCM, Kivioja A, Elomaa I, Picci P, Knuutila S. 2006. Malignantfibrous histiocytoma of bone: Analysis of genomic imbalancesby comparative genomic hybridisation and C-MYC expressionby immunohistochemistry. Eur J Cancer 42:1172–1180.
Tirkkonen M, Tanner M, Karhu R, Kallioniemi A, Isola J, Kallio-niemi OP. 1998. Molecular cytogenetics of primary breast can-cer by CGH. Genes Chromosomes Cancer 21:177–184.
Tsuchiya T, Sekine K, Hinohara S, Namiki T, Nobori T, KanekoY. 2000. Analysis of the p16INK4, p14ARF, p15, TP53, andMDM2 genes and their prognostic implications in osteosarcomaand Ewing sarcoma. Cancer Genet Cytogenet 120:91–98.
Ullmannova V, Popescu NC. 2006. Expression profile of the tu-mor suppressor genes DLC-1 and DLC-2 in solid tumors. Int JOncol 29:1127–1132.
Wei G, Lonardo F, Ueda T, Kim T, Huvos AG, Healey JH,Ladanyi M. 1999. CDK4 gene amplification in osteosarcoma:Reciprocal relationship with INK4A gene alterations and map-ping of 12q13 amplicons. Int J Cancer 80:199–204.
Zielenska M, Marrano P, Thorner P, Pei J, Beheshti B, Ho M,Bayani J, Liu Y, Sun BC, Squire JA, Hao XS. 2004. High-reso-lution cDNA microarray CGH mapping of genomic imbalancesin osteosarcoma using formalin-fixed paraffin-embedded tissue.Cytogenet Genome Res 107:77–82.
COPY NUMBER PROFILING IN FIBROSARCOMA OF BONE 143
Genes, Chromosomes & Cancer DOI 10.1002/gcc


