Embed Size (px)
Citation preview
F
FD
a
ARR1A
JOQ
KES
1
trgfitc
utwpsiilmia(e
0h
Resources, Conservation and Recycling 65 (2012) 47– 56
Contents lists available at SciVerse ScienceDirect
Resources, Conservation and Recycling
journa l h o me pa ge: www.elsev ier .com/ locate / resconrec
RIDA: A model for the generation and handling of solid waste in Denmark
rits Møller Andersen ∗, Helge V. Larsenepartment of Management Engineering, Technical University of Denmark (DTU), DTU Risø Campus, Building 130, P.O. Box 49, DK-4000 Roskilde, Denmark
r t i c l e i n f o
rticle history:eceived 26 September 2011eceived in revised form4 November 2011ccepted 23 April 2012
a b s t r a c t
Since 1994, Danish waste treatment plants have been obliged to report to the Danish EPA the annualamounts of waste treated. Applying these data, we analyse the development, link amounts of waste toeconomic and demographic variables, and present a model for the generation and treatment of waste inDenmark. Using the model and official projections of the economic development, a baseline projectionfor the generation and treatment of waste is presented.
EL classification:2153
eywords:conomic modellingolid waste
© 2012 Elsevier B.V. All rights reserved.
. Introduction
In waste planning and investments in new treatment capaci-ies evaluations of future amounts of different types of waste areequired. Linking the generation of waste to economic and demo-raphic indicators, this paper presents a simple econometric modelor the generation of different types of waste in Denmark. Further,ncluding assumptions related to the treatment of types of waste,he model may be used for scenario-analysis of required treatmentapacities.
Modelling generation of waste, different methodologies may besed. In general, generation of waste is linked to economic activi-ies and different economic activities generate different streams ofaste. Applying detailed data for economic activities or specificrocesses, in many models waste coefficients are assumed con-tant. That is, over time the amount of waste per economic activitys assumed to be constant. An example applying this assumptions found in Bruvoll and Ibenholt (1997) who use a CGE-model andink generation of waste in Norwegian manufacturing industry to
aterial input in individual manufacturing branches. Using a sim-lar approach, introducing waste intensities into a CGE model, butllowing waste coefficients to change over time, Östblom et al.
2010) analyse waste management costs and macro-economicffects of policy instruments for Sweden. In addition, they give a∗ Corresponding author.E-mail address: [email protected] (F.M. Andersen).
921-3449/$ – see front matter © 2012 Elsevier B.V. All rights reserved.ttp://dx.doi.org/10.1016/j.resconrec.2012.04.004
short review of recent studies linking economic activity and wastegeneration.
Theoretically, the assumption of constant waste coefficientsmay be argued from considering a single product and the useof unchanged technology. In this case a doubling of productionimplies a doubling of material input and waste generation. How-ever, over time technology may change and for economic activitiesproducing multiple products the product-mix may change, imply-ing that over time waste coefficients may change. Such annualchanges are assumed in Östblom et al. (2010). Analysing time seriesfor aggregated waste streams and economic activities in 27 Euro-pean countries Andersen et al. (2007) concludes that in generalan assumption of constant waste coefficients is not supported byempirical observations. Mazzanti and Montini (2009) and Mazzantiand Zoboli (2009) show that for municipal waste in EU a rela-tive decoupling from economic activity is in general observed. Thewaste model presented in this paper focuses on waste generationin Denmark and is a hybrid using econometrics on time series toanalyse the development of waste coefficients for major aggre-gated waste streams and assumes constant waste coefficients forminor and specific waste streams. That is, for major waste streamswaste generation is linked to economic and demographic variables,includes a general trend, and the development in waste coefficientsare modelled and projected according to past trends.
Finally, assuming constant or exogenous changes in treatment
coefficients for different streams of waste (waste fractions) themodel develops scenarios for required treatment facilities.The model is developed for the Danish EPA who uses the modelfor annual projections of waste generation and evaluations of

4 , Cons
rue(DiSaEiSS
2
rtotigarofwcph
oaIvshadda
sgavasf0aiotaoowrccpgcoD
8 F.M. Andersen, H.V. Larsen / Resources
equired future treatment capacities. Also large incineration plantsse the model to evaluate required future treatment capacities. Anarlier version of the model is documented in Andersen and Larsen2006). For applications of this version of the model see e.g. theanish EPA (2007) and Graasbøll et al., 2010. The present research
s part of a larger research project TOPWASTE funded by the Danishtrategic Research Council. Section 2 briefly presents the model,nd data for the generation of waste is presented in Section 3.conometric analyses for a few of the waste streams are presentedn Section 4, and a baseline projection using the model is given inection 5. Finally, a short summary and conclusions are given inection 6.
. The model
Since 1994 companies handling waste have been obliged toeport to the Danish EPA the amount, source, type, fraction, andreatment of waste entering and leaving their plants. In 2008 a totalf 217 companies operating 359 plants reported annual amountso Danish EPA, Miljøstyrelsen (2010). The data is available in thenformation system for waste and recycling “ISAG” that distin-uishes four primary sources: households, manufacturing, service,nd building and demolition, four major treatments: processing forecycling, incineration, land filling, and special treatment, 7 typesf waste (e.g. domestic waste, bulky waste, treatment residue), 33ractions (two large heterogeneous fractions “various combustibleaste” and “various non-combustible waste”, and a long list of spe-
ific fractions collected to be processed for recycling (e.g. glass,lastics)), and gives a fairly detailed description of generation andandling of waste in Denmark.
Looking at waste generation from primary sources, the amountf waste is linked to economic activities, demographic variables,nd a trend representing smooth technological and other changes.n general, waste from households is linked to categories of pri-ate consumption and the number of households, and waste fromectors is linked to production within relevant sectors. For largeeterogeneous waste streams links to economic, demographic,nd time variables are based on econometric analysis of pastevelopments, while for some minor and specific waste streamsevelopments are hard to explain and the modelling reduces to anssumption of constant waste coefficients.
Using econometrics to analyse past developments in wastetreams, we reveal past trends and links to economic and demo-raphic variables. To the extent, that the past development in themount of waste is due to changes in the level or composition of pri-ate consumption, changes in the production/product-mix within
production sector, or a smooth technological trend it seems rea-onable to expect past developments to continue in the immediateuture. That is, if over the past, e.g. household waste has increased.6% each time private consumption increased 1%, it seems reason-ble to assume that in the immediate future household waste willncrease 0.6% each time private consumption increases 1%. If on thether hand, the past development mainly reflects changes in collec-ion schemes or specific policies, e.g. reducing waste for land filling,
continuation of past trends in individual waste streams is lessbvious. In this case specific amounts of waste are transferred fromne waste stream to another. In the analysis of past developmentse try to reveal such changes by including dummy-variables to cor-
ect for sudden changes and a trend-variable to catch trend-wisehanges. Therefore, the model includes facilities for exogenouslyhanging projected amounts of waste and e.g. reduce estimatedast trends. However, in a baseline projection looking at the aggre-
ated amount of waste, past trends should be continued unlessonsiderable waste prevention has occurred or is expected toccur. Over the observation period this has not been the case inenmark.ervation and Recycling 65 (2012) 47– 56
A number of factors influencing the development in waste gen-eration and handling are not included in the model, mainly due tolack of data. A few examples are the price of waste disposal, possi-ble revenues from internal recovery of materials from waste, andimport and export of waste. If considerable changes in these fac-tors are foreseen a baseline projection need to be supplemented byexogenous analyses and evaluations.
Mathematically, the general equation for waste from primarysources is specified as:
log(wf,pst ) = ˛f,ps
0 + ˛f,ps1 · log(Xt) + ˛f,ps
2 · log(Ht) + �f,ps · Tt
+ ıf,ps · Dt (1)
where wf,pst is the amount of waste of fraction f from the primary
source ps in period t, Xt is an economic activity, Ht is the number ofhouseholds, Tt is time representing smooth technological and otherchanges over time, and Dt represents dummy variables correctingfor exogenous shifts or outliers, ˛f,ps
0 , ˛f,ps1 , ˛f,ps
2 , �f,ps, and ıf,ps
are parameters determined by econometric analysis or otherwise.Interpreting Eq. (1), if the economic activity Xt increases by 1%
the amount of waste increases by ˛f,ps1 %, if the number of house-
holds Ht increases by 1% the amount of waste increases ˛f,ps2 %,
and over time the annual increase in the amount of waste is�f,ps. Imposing restrictions on the parameters of Eq. (1), if ˛f,ps
1 = 1
and ˛f,ps2 = 0 the equation reduces to a trend-wise change in the
waste-coefficient, i.e. in the amount of waste per economic activ-ity. If ˛f,ps
1 = 0 and ˛f,ps2 = 1 the equation reduces to a trend-wise
change in the amount of waste per household. Restricting ˛f,ps2 =
(1 − ˛f,ps1 ) the equation changes to a relation between waste per
household and economic activity per household. This is relevantfor waste from households, only. Finally, restricting ˛f,ps
1 = 1 and
˛f,ps2 = �f,ps = ıf,ps = 0 the equation reduces to a constant waste-
coefficient given by ˛f,ps0 . Estimating ˛f,ps
0 over a sample periodgives an average waste-coefficient for the period. In the model, if aconstant waste-coefficient is assumed, the value is defined as thewaste-coefficient for the last year of observations and not estimatedby Eq. (1).
The treatment of waste from primary sources is modelledassuming constant treatment coefficients for the individual frac-tions, that is:
wf,mt = sf,m ·
∑
ps
wf,pst (2)
where wf,mt is the amount of waste fraction f processed by treatment
m, sf,m is the share of fraction f processed by treatment m (calculatedfor the latest year in the observation period, but may be changesexogenously in alternative scenarios), and
∑psw
f,pst is the amount
of waste fraction f generated from primary source ps.Finally, the total amount of waste from primary sources pro-
cessed by treatment m is calculated as:
wmt =
∑
f
wf,mt (3)
Typically, for waste fractions collected for recycling the process-ing is recycling and sf,m = 1 for this treatment and zero for othertreatments. For the large fraction “various combustible waste” themajor treatment is incineration. In 2008 a minor share was landfilled. However, land filling of combustible waste is prohibited andthe future share for incineration should approach 1. The other large
composite waste fraction “various non-combustible waste” is allland filled.Not all waste entering a specific treatment plant ends up beingrecycled, incinerated or land filled by the plant. In the process some

F.M. Andersen, H.V. Larsen / Resources, Conservation and Recycling 65 (2012) 47– 56 49
Table 1Aggregated amounts of waste collected in Denmark.
1000 ton % change p.a. 1994–2008
1994 1996 1998 2000 2002 2004 2006 2007 2008 Waste amount Linked to activity
Household waste, total 2575 2767 2796 3084 3121 3164 3298 3480 3654 2.5 Private consumption 1.8Domestic waste 1662 1655 1702 1676 1700 1692 1715 1721 1665 0.0 Food and beverage 0.3Bulky waste 606 639 572 730 655 687 741 778 713 1.2 Durable goods 3.2Garden and other waste 307 473 521 677 763 784 840 981 1238 10.5Industry and service 2965 3483 3749 4067 3668 3688 3910 3849 3886 2.0 Production in industry and service 3.3Building and construction 2433 3088 2962 3223 4044 4495 6113 5767 6009 6.7 Production in building and construction 2.5
2138
,459
S
prwaI
w
wim
fmfogoTtw
3
dttFd“vtdallob
TT
S
Other waste 3132 3574 2738 2657 2273 2013
Total 11,105 12,912 12,245 13,031 13,106 13,360 15
ource: Miljøstyrelsen (2010).
art is separated before treatment, and plants produce treatmentesidues to be treated by other plants. For individual fractions,aste from secondary sources (treatment plants) is related to the
mount of waste from primary sources processed by the treatment.n general, waste coefficients are assumed constant, that is:
f,sst = ˛f,ss
0 · wmt (4)
here index ss refer to secondary sources: processed for recycling,ncineration, and land fills, and m refers to the corresponding treat-
ent.Finally, treatment of waste from secondary sources is calculated
rom Eq. (2) replacing wf,pst by wf,ss
t (again assuming constant treat-ent shares for waste from secondary sources) and summing over
ractions as in Eq. (3). Adding treatments from primary and sec-ndary sources gives an indication of the total amount of wasteenerated and treated. However, it should be noted, that the partf the waste that is separated before treatment is counted twice.herefore the total is larger than the amount actually generated andreated, but indicates the amount of handling and transportation ofaste that is required.
. Generation of waste in Denmark
Looking at waste generation in Denmark, Table 1 shows theevelopment in waste from aggregated sources. From 1994 to 2008he total amount of waste collected increased 2.5% p.a. However, forhe different waste streams the development differs considerably.or households, total waste more or less follows the aggregatedevelopment, but this is composed of a fairly constant amount ofdomestic waste”, an increase in “bulky waste” till 2007, and aery large increase in “garden and other waste”. That is, domes-ic waste shows limited dependency of the aggregated economicevelopment, bulky waste is more dependant, and the increasedmounts of garden and other waste mainly reflects improved col-
ection schemes. As seen in the next section, domestic waste isinked to private consumption of food and beverage that variedver the period but was almost the same in 1994 and 2008, andulky waste is linked to private consumption of durable goodsable 2reatment of waste.
1000 ton
1994 1996 1998 2000 2002
Processing for recycling 6174 7787 7542 8461 838Incineration 2216 2507 2740 3064 334Landfills 2613 2524 1868 1489 119Special treatment 102 95 84 17 2Temporary storage 16
Total 11,105 12,913 12,234 13,031 13,10
ource: Miljøstyrelsen (2010).
2138 2027 −3.1
15,234 15,576 2.45 GDP 2.9
that increased 3.2% p.a. over the period. For industry and servicethe amount of waste in general follows the change in productionwith a slight decoupling. However, for building and constructionthe amount of waste changes considerably more than production;from 1994 to 2008 production increased by 2.5% p.a. and waste by6.7% p.a. Other waste is mainly sludge from waste-water treatmentplants and slag/ash from power plants using coal and bio-fuels. Bothwaste streams decrease; sludge due to reduced water content inthe sludge and slag/ash due to a reduced use of coal in the powerproduction.
Looking at treatments of waste (Table 2), policy has focusedon reducing land filling, increasing processing for recycling andto incinerate waste not applicable for recycling. Over the period1994–2008, of the amount of waste collected the share of wasteprocessed for recycling has increased from 56% to 69% and landfilling has decreased from 23% to 7%. Incineration has increasedfrom 20% to 23%. The increase in the share of waste recycled ismainly due to improved collection schemes for fractions collectedto be processed for recycling, e.g. glass, paper, plastics, and variousbuilding materials, but also a relative increase in amounts of wastefrom building and construction contributes to the increasing sharefor recycling. The share incinerated has increased mainly due toprohibiting land filling of waste that may be incinerated.
Finally, looking at fractions of waste Table 3 shows the devel-opment for the period 1994–2008. Fractions included in thestatistics consist of two large heterogeneous fractions, “variouscombustible” and “various non-combustible” waste, a list of frac-tions collected for recycling, e.g. paper, glass, plastics and buildingmaterials, slag and sand, a number of fractions collected for specialtreatment, and finally sludge from public waste water treatmentplants.
Looking at the overall development, over the period 1994–2008various combustible waste increased on average 2% p.a. while “var-ious non-combustible waste” decreased due to increased collectionfor recycling of materials. Due to improved collection schemes
most fractions collected for recycling for have increased consid-erable and especially collection schemes for recycling of buildingmaterials have improved, implying a massive increase in collectionof concrete, tiles, and wood.Share1994
Share2008
2004 2006 2007 2008
2 8746 10,768 10,480 10,725 0.56 0.694 3437 3489 3584 3590 0.20 0.234 1024 1002 984 1072 0.23 0.072 16 19 20 21 0.01 0.003 136 181 167 167 0.01
5 13,359 15,459 15,235 15,575 1.00 1.00

50 F.M. Andersen, H.V. Larsen / Resources, Conservation and Recycling 65 (2012) 47– 56
Table 3Waste by fractions.
1000 ton % change p.a.1994–2008
1994 1996 1998 2000 2002 2004 2006 2007 2008
Various combustibles 2532 2743 2885 3100 3127 3164 3277 3371 3341 2.0
Various non-combustibles 923 758 708 702 581 528 560 523 471 −4.7
Paper and cardboard 352 548 623 702 688 677 788 811 782 5.9Glass 110 99 104 108 135 140 131 156 107 −0.1Plastics 29 29 33 40 51 54 54 64 73 6.9Organic waste 82 193 194 252 151 165 187 183 166 5.2Garden waste 301 452 551 632 652 663 764 843 773 7.0Iron and meals 887 899 968 1192 788 606 643 518 795 −0.8Auto-tires 15 8 31 34 45 76 54 60 54 9.4Collected for recycling 1775 2228 2502 2961 2512 2381 2621 2636 2752 3.2
Concrete 552 942 780 1054 980 1119 1468 1642 1543 7.6Bricks and tiles 64 93 123 227 250 280 318 360 240 9.9Other building materials 419 532 507 311 331 632 598 558 899 5.6Asphalt 703 7037 654 551 563 731 967 787 896 1.7Wood 10 15 24 81 60 58 99 110 118 19.1Soil and stones 681 795 756 731 1597 1593 2393 1870 2135 8.5Other waste for recycling 82 166 228 373 362 306 416 610 441 12.8Building related waste 2511 3280 3072 3326 4144 4720 6259 5935 6272 6.8
Sieving waste 0 1 1 1 1 1 1 0 1 12.6Sand and screenings 53 61 67 54 47 35 32 31 28 −4.4Slags 1970 2346 1476 1186 1315 13 1378 1371 1263 −3.1Flyash 0 0 0 0 2 2 2 2 2 21.5Flue gas purification 26 1 3 3 0 33 47 43 65 6.6Slag, sand, etc. 2050 2409 1547 1243 1365 1315 1460 1447 1359 −2.9
Hospital waste 8 9 3 4 5 4 5 5 5 −3.1Dusty asbestos 6 8 8 9 14 17 21 24 32 12.5Materials for flue gas purification 0 0 1 0 2 4 5 5 6 naBatteries 0 0 0 0 4 0 3 4 3 naElectrical products 0 0 0 0 15 26 28 32 57 naRefrigerators, etc. (CFC) 0 1 4 2 10 9 14 23 32 naCFC-cooling liquids 0 0 0 0 0 0 0 0 0 naShredder waste 0 0 0 0 67 108 47 10 121 naOil and chemicals 125 160 133 141 138 161 251 290 194 3.2Collected for special treatment 138 177 148 156 256 329 373 393 449 8.8
543 1121 923 909 930 933 −1.6
031 13,105 13,359 15,459 15,235 15,575 2.4
mfih
4
fmwhe
wIhhaa
inoea
0
1
2
3
4
199 4 199 6 199 8 200 0 20 02 20 04 20 06 2008
[Mio
. ton
s]
t-values are given in parenthesis.1 Looking at the coefficients, forhouseholds a relative decoupling from economic activities is quitesignificant. If private consumption of food and beverage increases
1 R2, DW and t-values are statistical indicators of how well the equation explainsthe development. The R2 value measures the share of variation in the dependentvariable that is explained by the equation and should be as close to 1 as possible.DW is the Durbin–Watson statistic measuring serial correlation in errors. The DWstatistic varies between 0 and 4, and the central value of DW is 2. The statistic should
Sludge 1177 1317 1372 1
Total primary sources 11,105 12,912 12,233 13,
Looking at special fractions, the development is somewhatixed. The amount of slags has decreased due to a reduction in coal
red power production, while collection schemes for a number ofazardous waste streams have improved.
. Estimation results
For most major waste streams the model includes equations forractions and sources estimated on the period 1994–2008, while for
inor fractions and sources equations reduce to assuming constantaste-coefficients. All equations may be found in the model on theomepage: TOPWASTE. However, for a few of the large fractionsstimation results are presented in this section.
For the large heterogeneous fraction “various combustibleaste”, Fig. 1 shows the observed development for 1994–2008.
t is noticed that the amount of domestic waste from householdsas been almost constant, while the amount of bulky waste fromouseholds has increased till 2007 and decreased the last year. Themount of waste from production sectors also increased till 2007nd decreased slightly in 2008.
Explaining the development, domestic waste from householdss linked to private consumption of food and beverages and the
umber of households, bulky waste is linked to the consumptionf durable goods, and waste from production sectors is mod-lled aggregated and linked to total production. Estimation resultsre presented in Table 4 where coefficients refer to Eq. (1) andDomes�c waste Bulky waste Produ c�on
Fig. 1. Development in the amount of “various combustible waste”.
be between 1.5 and 2.5. Lower or higher values indicate that additional variablesshould be included in the equation. t-Values indicate if the estimated coefficientis significant different from zero. To be significant at a 5% level of significance, thet-value should exceed 2. For a further description of test-statistics see e.g. Greene(1997).

F.M. Andersen, H.V. Larsen / Resources, Conservation and Recycling 65 (2012) 47– 56 51
Tab
le
4Es
tim
atio
n
resu
lts
for
the
frac
tion
“var
iou
s
com
bust
ible
was
te”.
Act
ivit
y
vari
able
˛0
˛1
˛2
�
ı 1ı 2
R2
DW
Dom
esti
c
was
tePr
ivat
e
con
sum
pti
on
of
food
and
beve
rage
3.98
8
(5.8
9)
0.64
00
(3.5
1)
(1
−
˛1)
0.03
09
(2.5
3)
0.05
14
(6.7
4)
0.90
2.22
Bu
lky
was
tePr
ivat
e
con
sum
pti
on
of
du
rabl
e
good
s
3.30
8
(4.5
6)
0.46
56
(2.5
1)
(1
−
˛1)
–
−0.1
524
(−3.
35)
0.13
55
(2.7
2)
0.90
1.68
Was
te
from
pro
du
ctio
n
sect
ors
Prod
uct
ion
in
sect
ors
−1.2
97
(−5.
25)
1
0.00
58
(2.4
1)
0.11
48
(4.1
2)
0.95
1.59
t-V
alu
es
in
par
enth
esis
.
0.0
0.2
0.4
0.6
0.8
1.0
1994 199 6 199 8 200 0 200 2 200 4 200 6 200 8
[Mio
. ton
s]
Households Produ c�on
Fig. 2. Development in the amount of “various non-combustible waste”.
1% domestic waste increases 0.64%. Also for bulky waste a relativedecoupling is observed. However, waste from production sectorsfollows the development of the economic activity; the coefficientto production is restricted to 1 and the estimation shows a slightpositive trend.
Looking at the fraction “various non-combustible waste”, forboth households and production sectors Fig. 2 shows a considerabledecrease in the amount of waste. Various non-combustible wasteis mainly land filled, and a large number of waste policy initia-tives have been directed towards reducing this fraction increasingfractions for recycling or incineration.
Looking at the estimation results in Table 5, the amount ofhousehold waste is linked to the private consumption of durablegoods with a coefficient of 0.76, that is if private consumption ofdurable goods per household increases 1% the amount of waste perhousehold increase 0.76%. In addition, the amount of waste fromhouseholds decreases due to a negative trend of about 2% p.a.
Waste from production sectors follows production, but hasdecreased quite considerably giving a negative trend of about 8.5%p.a. That is, for this fraction an absolute decoupling is observed,mainly due to increased collection for recycling and incineration.
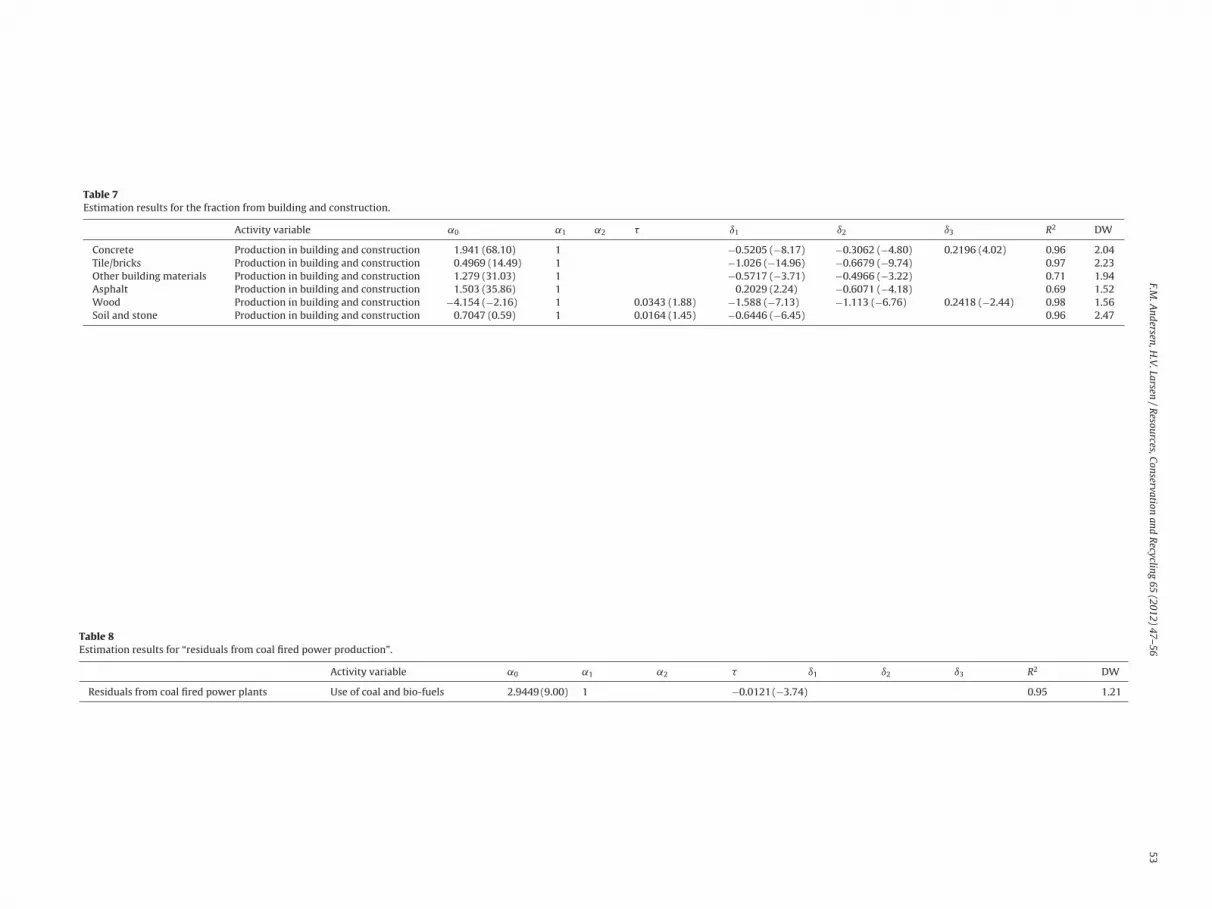
Looking at some of the fractions collected for recycling, Table 6shows estimation results for “paper and cardboard” and Table 7shows results for fractions related to building and construction.For “paper and cardboard” a relative decoupling for waste fromhouseholds is observed, but from production sectors the amountof waste follows production with a slight positive trend. Also forfractions related to building and construction the amount of wastefollows production within the sector and for the fractions “Wood”and “Soil and stone” the amount of waste collected increases morethan production (having a positive trend in the equation).
Finally, looking at “Residuals from coal fired power production”the amount of waste has decreased considerably with a decreas-ing consumption of coal. In the power production, coal has beensubstituted mainly by gas and wind, but also by bio-fuels gener-ating some residuals. Linking the amount of residuals to the useof coal therefore implies a slightly positive trend in the amount ofresiduals per TJ coal. As seen from Table 8, linking the amount ofresiduals to TJ coal and bio-fuels used implies a slightly negativetrend in the waste coefficient, bio-fuels generating less residualsper TJ than coal.
5. A baseline projection for the generation and treatmentof waste in Denmark
To use the FRIDA model for projections, inputs required areprojections of categories of private consumption, production bysectors, the number of households, and finally coal and biofuels
used for power production. Official forecasts of these variables aregiven by the Danish Ministry of Finance and the Danish EnergyAgency using the econometric models ADAM and EMMA docu-mented in Statistics Denmark (2011) and Danish Energy Agency
52F.M
. A
ndersen, H
.V.
Larsen /
Resources,
Conservation and
Recycling
65 (2012) 47– 56
Table 5Estimation results for the fraction “various non-combustible waste”.
Activity variable ˛0 ˛1 ˛2 � ı1 ı2 ı3 R2 DW
Households Private consumption ofdurable goods
3.585 (2.45) 0.7551 (0.83) 1 − ˛1 −0.0239 (−1.06) 0.2531 (4.21) 0.1725 (2.56) 0.75 1.72
Production sectors Production 7.070 (14.71) 1 (–) −0.0855 (−17.99) 0.92 2.05
Table 6Estimation results for the fraction “paper and cardboard”.
Activity variable ˛0 ˛1 ˛2 � ı1 ı2 ı3 R2 DW
Households Private consumption of durable goods 0.9957 (1.23) 0.8609 (4.17) 1 − ˛1 0.70 1.91Production sectors Production −1.875 (−4.96) 1 0.0033 (0.87) −0.5674 (−8.80) 0.96 1.55
F.M.
Andersen,
H.V
. Larsen
/ R
esources, Conservation
and R
ecycling 65 (2012) 47– 56
53
Table 7Estimation results for the fraction from building and construction.
Activity variable ˛0 ˛1 ˛2 � ı1 ı2 ı3 R2 DW
Concrete Production in building and construction 1.941 (68.10) 1 −0.5205 (−8.17) −0.3062 (−4.80) 0.2196 (4.02) 0.96 2.04Tile/bricks Production in building and construction 0.4969 (14.49) 1 −1.026 (−14.96) −0.6679 (−9.74) 0.97 2.23Other building materials Production in building and construction 1.279 (31.03) 1 −0.5717 (−3.71) −0.4966 (−3.22) 0.71 1.94Asphalt Production in building and construction 1.503 (35.86) 1 0.2029 (2.24) −0.6071 (−4.18) 0.69 1.52Wood Production in building and construction −4.154 (−2.16) 1 0.0343 (1.88) −1.588 (−7.13) −1.113 (−6.76) 0.2418 (−2.44) 0.98 1.56Soil and stone Production in building and construction 0.7047 (0.59) 1 0.0164 (1.45) −0.6446 (−6.45) 0.96 2.47
Table 8Estimation results for “residuals from coal fired power production”.
Activity variable ˛0 ˛1 ˛2 � ı1 ı2 ı3 R2 DW
Residuals from coal fired power plants Use of coal and bio-fuels 2.9449 (9.00) 1 −0.0121 (−3.74) 0.95 1.21

54 F.M. Andersen, H.V. Larsen / Resources, Conservation and Recycling 65 (2012) 47– 56
0.0
0.5
1.0
1.5
2.0
2.5
1994 199 7 200 0 20 03 200 6 200 9 201 2 2015 201 8
Inde
x
GDP Consump�on Coal and bio fuels
Ft
(uJD
sFpGrsifi1db
osif
sottcw3
a
0.0
0.2
0.4
0.6
0.8
1.0
1994 199 7 2000 20 03 200 6 200 9 2012 20 15 201 8
Shar
e
Treatme nt of waste fr om primary sources
Recycling Incinera�onLandfill Spec ial treatm entTemporary deposi�on
Fig. 5. Treatment of waste from primary sources.
0.00.20.40.60.81.01.21.41.61.82.0
201820152012200920062003200019971994
[Mio
.ton
s]
Waste from secondary sources
Variouscombus�ble waste Variousnon-combus�ble waste
Waste coll ected for re-use Waste from buil ding
Waste fr om po wer produc�on Hazardouswaste
Sludge
the amount of waste is expected to increases 42% (more than theactivity in the sector).
ig. 3. Total private consumption, production as well as coal and biofuel consump-ion.
2011). To illustrate results from the model, in this section wese the latest economic forecast by the Ministry of Finance from
une 2011 and energy forecasts by the Danish Energy Agency fromecember 2010.
Aggregated values for the development in total private con-umption, GDP and coal and biofuel consumption are shown inig. 3. From 2008 to 2020 GDP is expected to increase by 15% andrivate consumption by 22%. However, due to the economic crisesDP and private consumption decreased in 2009 by 7% and 4%,
espectively, and especially production within building and con-truction decreased by 13% in 2009. The use of coal and bio-fuelsn power production is expected to decrease further by about 8%rom 2008 to 2020, and also the substitution from coal to bio-fuelss expected to continue. The use of coal is expected to decrease by/3 from 2008 to 2020 while the use of bio-fuels is expected to beoubled, implying after 2013 a slight increase in the use of coal andio-fuels for power production.
Applying these projections, Fig. 4 shows a baseline projectionf the generation of primary waste and Fig. 5 shows the treatmenthares. Generation and treatment of waste from secondary sourcess shown in Figs. 6 and 7. The figures show historical observationsor 1994–2008, and model projections for 2009–2020.
Looking at waste from primary sources, the baseline projectionhows a 10% decrease in waste generation in 2009 (the first yearf projection). This is mainly due to a considerable reduction inhe building and construction activity and related waste. Due tohe economic crises, “various combustible waste” (linked to theonsumption of food and beverages) and “various non-combustible
aste” (linked to the consumption of durable goods) decrease by.4% and 14%, respectively.After the initial decrease, the economy is expected to recover
nd the generation of waste is expected to increase. From 2010
0
2
4
6
8
10
12
14
16
18
201820152012200920062003200019971994
[Mio
.ton
s]
Waste fro m primary sources
Variouscombus�ble waste Variousnon-combus�ble waste
Waste coll ected for re-use Waste from buil ding
Waste fr om po wer produc�on Hazardouswaste
Sludge
Fig. 4. Baseline projection of waste from primary sources.
Fig. 6. Waste from secondary sources.
to 2020 GDP increases by 22% and private consumption by 25%.The total generation of waste from primary sources increase by25%. That is, with a continuation of past trends, at the aggregatedlevel of total amounts of waste a decoupling of waste generationfrom the economic activity is not expected. This is mainly causedby increased waste from building and construction. Building andconstruction accounts for approximately 1/3 of the total amountof waste generated. The activity within the building and construc-tion sector is expected to increase by 32% (more than GDP) and
Various combustible waste increases 23% with only a slight rela-tive decoupling from the increase in private consumption. Various
0.0
0.2
0.4
0.6
0.8
1.0
1994 199 7 2000 20 03 200 6 200 9 2012 20 15 201 8
Shar
e
Treatme nt of waste from secondary sources
Recycling Incinera�onLand fill Special treatmentTemporary deposi�on
Fig. 7. Treatment of waste from secondary sources.
, Conse
nrp
cmbeaeied
aScpsowmstffmFfiasmw
amttrmt2acrmov
itmiauittipeii
fia
F.M. Andersen, H.V. Larsen / Resources
on-combustible waste decreases about 30%, waste collected forecycling increases 35%, and due to reduced use of coal waste fromower production decreases 14%.
Assuming unchanged treatments for individual fractions,hanges in the weight of fractions changes the aggregated treat-ent shares. In 2009, the share of recycling decreases as waste from
uilding and construction decreases. With the economic recov-ry and increased activity in the building and construction sectorlso the share of recycling recovers. Both the shares for incin-ration and land fill decrease slightly. However, the differences that from 2010 to 2020 the amount of waste incinerated isxpected to increase 21% while the amount land filled is expected toecrease 2%.
Looking at waste from secondary sources, over the past themounts have changed considerably. However, as mentioned inection 2, waste from secondary sources is modelled assumingonstant waste-coefficients related to the treatment of waste fromrimary sources, and as seen from Fig. 6 this implies projecting amooth development. Waste from secondary sources is about 10%f the total amount of waste and consists of two types of waste;aste sorted at treatment plants and transported to another treat-ent and residues from the treatment. About 1/2 of the waste from
econdary sources is various combustible waste going to incinera-ion, and about one-third is waste collected for recycling or wasterom building and construction. That is, the composition of wasterom secondary sources is somewhat different than waste from pri-
ary sources, and also the treatment is different. As seen fromig. 7, about 40% is recycled, 45% is incinerated, and 12% is landlled. Looking at incineration, besides waste from primary sources,n additional 15% of what is incinerated comes from secondaryources, either as residues from – or waste sorted at other treat-ents. Mainly recycling and land fill facilities deliver secondaryaste to incineration.
Adding waste from primary and secondary sources, and lookingt aggregated requirements for treatment capacities, in 2008 11.4ill. ton were recycled, 4.3 mill. ton were incinerated, and 1.3 mill.
on were land filled. Due to the economic crisis, required capaci-ies decreased in 2009. The model projection for 2009 implies thatecycling is reduced by 1.6 mill. ton or 14%, especially recycling ofaterials from building and construction decreased. According to
he baseline projection the amount of recycled waste reaches the008 level in 2018. That is, assuming a continuation of past trendst the aggregated level, present treatment capacities seem suffi-ient for the next 7 years. Looking at specific facilities for recycling,ecycling of paper and plastics increase and additional capacitiesay be required within the next 5 years. Capacities for re-cycling
f materials from building and construction appear sufficient for aery long period.
Looking at capacities for incineration, the economic crisismplies a limited reduction in the need for incineration. In 2009he model projects a decrease in the amount incinerated of 0.2
ill. ton or 4% but already in 2014 incineration is above the leveln 2008. That is, the economic crisis has a limited effect on themount of waste normally incinerated, and assuming a contin-ation of past trends till 2020 incineration capacities should be
ncrease by about 15% above the 2008 level. Future policy initia-ives increasing re-cycling and reducing incineration may changehis conclusion. In addition, the projected economic developments fairly optimistic increasing the need for incineration capacityrojected by the model. However, in the long run required incin-ration capacity is expected to increase unless major changesn waste policies or import/export of combustible waste are
ntroduced.Finally, looking at land filling over the past the amount landlled has decreased considerably. In the baseline projection thismount is expected to be almost constant at 1 mill. ton. Increased
rvation and Recycling 65 (2012) 47– 56 55
re-cycling may in the future further reduce the amount landfilled.
6. Summary and conclusions
Analysing the development in amounts of waste, a model forthe generation and treatment of waste is developed. The amount ofwaste from primary sources is linked to economic variables, and theamount of waste from secondary sources is linked to the amountof waste from primary sources treated by different treatments. Forindividual fractions of waste treatment shares are assumed to beconstant; for most fractions only one treatment is relevant.
In general, looking at the generation of waste from primarysources, in Denmark an assumption of constant waste coefficientsis not supported by empirical observations. Using econometrics,linking fractions of waste to economic activities, in general eitherthe elasticity with respect to the economic activity differs from 1.0or a trend in the waste coefficient is observed. Therefore, whethera decoupling of the aggregated waste generation from aggregatedeconomic activities is observed depends on the actual developmentin different economic activities. Looking at the past development,some waste streams develop smoothly with a smooth change ineconomic activities, e.g. various combustible waste from house-holds shows a slight relative decoupling from a smooth change inprivate consumption. Other waste streams, e.g. waste from build-ing and construction vary considerably with large changes in thebuilding and construction activity.
Applying an official projection of the economic development inDenmark the model is used to project the generation and treat-ment of waste. Looking at the first year of projection, in 2009 thegeneration of waste decreases more than 10% while GDP decreases4.4%. This shows a considerable decoupling. However, the reasonis a considerable decrease in the building and construction activityaccounting for 1/3 of the total waste generation. Other streams ofwaste decreased moderately according to the decreasing economicactivity.
Looking further ahead, the economy is expected to recover alsoimplying a recovery of activities within building and constructionand a considerable increase in waste from this activity. Aggregated,the amount of waste therefore increases more than GDP. How-ever, other waste streams, e.g. waste from power production showsan absolute decoupling. This is due to a substitution from coal torenewable power production.
Looking at treatment of waste, as most fractions have onlyone treatment, e.g. waste collected for recycling is recycled, inthe model treatment shares for individual fractions is assumedconstant. Therefore, aggregated treatment shares change due tochanges in the weight of fractions, e.g. if fractions collected forrecycling increase more than other fractions the share of recyclingincreases. In the projection, as waste from building and con-struction is collected for recycling and increases more than otherfractions, the aggregated share of recycling increases, decreasingother treatment shares. Still, amounts for incineration increase,while amounts land filled is expected to decrease.
Waste from secondary sources accounts for about 10% of thetotal amount of waste and contributes mainly to recycling andincineration of waste.
Acknowledgements
This study is part of the TOPWASTE project funded by the Danish
Strategic Research Program.We would like to thank the Danish EPA for access to the wastestatistics and Martin Sune Møller at the Danish EPA for helpfulcomments and assistance with data handling.

5 , Cons
R
A
A
B
D
D
D
Östblom G, Ljunggren Söderman M, Sjöström M. Analysing future solid wastegeneration—soft linking a model of waste management with a CGE-model forSweden. Environmental economics. Working Paper no. 118. Sweden: Swedish
6 F.M. Andersen, H.V. Larsen / Resources
eferences
ndersen FM, Larsen HV. En model til Fremskrivning af Isag Data – FRIDA.Danish Environmental Protection Agency. Arbejdsrapport fra MiljøstyrelsenNr. 35. http://www2.mst.dk/udgiv/publikationer/2006/87-7052-239-1/pdf/87-7052-240-5.pdf; 2006.
ndersen FM, Larsen HV, Skovgaard M, Moll S, Isoard S. A European model for wasteand material flows. Resources, Conservation and Recycling 2007;49:421–35.
ruvoll A, Ibenholt K. Future waste generation forecasts on the basis of a macroeco-nomic model. Resources, Conservation and Recycling 1997;19:137–49.
anish Energy Authority. The EMMA-model. http://www.ens.dk/da-DK/Info/TalOgKort/Fremskrivninger/modeller/emma/dokumentation/Sider/Forside.aspx; 2011.
anish Environmental Protection Agency. Waste Statistics 2005. Environ-mental Review No. 6 2007. Orientering fra Miljøstyrelsen. http://www2.
mst.dk/Udgiv/publications/2007/978-87-7052-581-7/pdf/978-87-7052-581-7.pdf; 2007 [in Danish].anish Environmental Protection Agency. Waste statistics 2007 and 2008.Orientering fra Miljøstyrelsen Nr. 5. http://www.mst.dk/Publikationer/Publikationer/2010/07/978-87-92668-21-9.htm; 2010 [in Danish].
ervation and Recycling 65 (2012) 47– 56
Graasbøll S, Toudal JK, Andersen J, Stentsøe S. Deponeringskapacitet i Danmark– i perioderne 2009–12 og 2013–20 Miljøprojekt Nr. 1318 2010 COWI.http://www2.mst.dk/udgiv/publikationer/2010/978-87-92617-55-2/pdf/978-87-92617-56-9.pdf; 2010 [in Danish].
Greene WH. Econometric analysis. Upper Saddle River, NJ: Prentice Hall; 1997.Mazzanti M, Montini A. Waste and environmental policy. London: Routledge;
2009.Mazzanti M, Zoboli R. Municipal waste Kurznets curves: evidence on socio-economic
drivers and policy effectiveness from the EU. Environmental and Resource Eco-nomics 2009;44:203–30.
Statistics Denmark. The ADAM-model. http://www.dst.dk/HomeUK/Guide/Adam/Documentation.aspx; 2011.
Environmental Research Institute, The National Institute of Economic Research;May 2010.


