Embed Size (px)
Citation preview
http://hol.sagepub.com/The Holocene
http://hol.sagepub.com/content/early/2014/01/06/0959683613517402The online version of this article can be found at:
DOI: 10.1177/0959683613517402
published online 6 January 2014The HoloceneAlvaro Montenegro, Richard T Callaghan and Scott M Fitzpatrick
From west to east: Environmental influences on the rate and pathways of Polynesian colonization
Published by:
http://www.sagepublications.com
can be found at:The HoloceneAdditional services and information for
http://hol.sagepub.com/cgi/alertsEmail Alerts:
http://hol.sagepub.com/subscriptionsSubscriptions:
http://www.sagepub.com/journalsReprints.navReprints:
http://www.sagepub.com/journalsPermissions.navPermissions:
What is This?
- Jan 6, 2014OnlineFirst Version of Record >>
at OHIO STATE UNIVERSITY LIBRARY on January 14, 2014hol.sagepub.comDownloaded from at OHIO STATE UNIVERSITY LIBRARY on January 14, 2014hol.sagepub.comDownloaded from
The Holocene0(0) 1 –15© The Author(s) 2014Reprints and permissions:sagepub.co.uk/journalsPermissions.navDOI: 10.1177/0959683613517402hol.sagepub.com
IntroductionSome of the most enduring and perplexing questions in Pacific prehistory are how and why Lapita groups settled Remote Ocea-nia between around 3300 and 3000 BP, and why they stopped in West Polynesia, proceeding no further east than Samoa and Tonga. This ultimately led to what is referred to as the ‘long pause’, a c. 2000-year gap between when West Polynesia was settled and the eventual colonization of East Polynesia (e.g. Cook Islands, the Marquesas Islands, and the Society Islands; Figure 1), which probably took place sometime between c. 1120 and 900 BP (Wilmshurst et al., 2011a), if not slightly earlier (Mulrooney et al., 2011; but see rejoinder Wilmshurst et al., 2011b). How were Lap-ita groups able to first venture from Near to Remote Oceania and back, crossing distances of hundreds, or even thousands of kilo-meters, but not further east? Some scholars have suggested that the chronological discrepancy between the settlement of these two regions is simply nonexistent or an artifact of incomplete sur-vey coverage. Kirch and Ellison (1994) suggested 20 years ago that a human presence could be detected by proxy using paleoen-vironmental evidence in the form of increased charcoal particles and sedimentation rates that occurred as a result of land clearance (presumably by humans prepping land for agriculture). The use of this proxy evidence to support an earlier colonization would in effect have pushed back the settlement of East Polynesia to c. 2500 BP. This fell in line with Irwin’s (1992: 88–89) assertion that
there was no ‘systematic delay’ in the colonization of West Poly-nesia (but that some time was required for continued population growth). He stated that numerous voyaging attempts were required ‘before both nearer and farther central East Polynesia’ were settled and learning techniques perfected ‘as exploration adds geographical knowledge to navigational knowledge’ (Irwin, 1992: 88). Irwin’s model thus predicted a steady and continuing colonization process into East Polynesia, requiring as much as a millennium to complete from ‘nearer East Polynesia’ (e.g. the southern Cook Islands) to ‘marginal East Polynesia’ (e.g. New Zealand; Irwin, 1992; Kirch and Ellison, 1994).
Others instead argued that hard archaeological evidence was necessary to truly establish such an important colonization epi-sode (Anderson, 1994, 1995; Spriggs and Anderson, 1993). If we do consider that East Polynesia was settled late, c. 1120–900 BP,
From west to east: Environmental influences on the rate and pathways of Polynesian colonization
Alvaro Montenegro,1,2 Richard T Callaghan3 and Scott M Fitzpatrick4
AbstractThe prime movers behind the prehistoric colonization of Remote Oceania, and in particular the large c. 2000-year temporal gap (i.e. ‘long pause’) seen between West and East Polynesia, has long been major point of interest in the Pacific. To address these events and the processes that may have led to the known chronological disparity of these diasporas, we present results from two different, but equally powerful, analytical tools which are used to examine Polynesian seafaring capabilities and trajectories. The first is a statistical model known as Seascape, which simulates voyages, while the second uses ease of eastward travel estimates based on land distribution and wind pattern analysis. These analyses were done with the goal of determining the potential role of environmental factors in the colonization process, particularly as they relate to the long pause. We show that the eastern boundary of West Polynesia, the limit of the initial colonization pulse, is marked by a discontinuity in land distribution, where the distances travelers would have to cross in order to reach islands further to the east become significantly larger. At the same time, in West Polynesia, the frequency and intensity of winds favorable to eastward displacement decrease continuously from west to east. As far as winds are concerned, eastward travel in West Polynesia is favored in the northern and southern areas and much more difficult across the central portion. Favorable winds have a clear seasonality, and eastward displacement along the northern area is much easier under El Niño conditions. Voyaging simulations show that intentional eastward voyages departing from Tonga and Samoa, when undertaken with vessels capable of sailing efficiently against the wind, afford a viable route toward several island groups in East Polynesia, with trips starting in Samoa having a higher probability of success.
Keywordsancient seafaring, computer simulations, El Niño/Southern Oscillation, Lapita expansion, long pause, Pacific colonization
Received 4 September 2013; revised manuscript accepted 22 November 2013
1Ohio State University, USA2UNESP-Univ Estadual Paulista, Brazil3University of Calgary, Canada4University of Oregon, USA
Corresponding author:Alvaro Montenegro, Ohio State University, 154 North Oval Mall, Columbus, OH 43210, USA. Email: [email protected]
517402 HOL0010.1177/0959683613517402The HoloceneMontenegro et al.research-article2014
Research paper
at OHIO STATE UNIVERSITY LIBRARY on January 14, 2014hol.sagepub.comDownloaded from
2 The Holocene XX(X)
which seems to be supported by radiocarbon dates and archaeo-logical assemblages from the Society Islands, Cook Islands, and Easter Island (Anderson and Sinoto, 2002; Hunt and Lipo, 2006), as well as a more rigorous review of over 1400 14C dates from across East Polynesia (Wilmshurst et al., 2011a), then the ques-tioned posed is why? Is it because various social and technologi-cal issues, possibly in association with climatic fluctuations, played a role in limiting movement (Anderson et al., 2006)? From a linguistic perspective, Blust (1997) notes that terms for double-hulled canoes, like that of the reconstructed Hokule’a (Finney, 1979), were used only after West Polynesia had been colonized, suggesting that the so-called long pause is in fact a real phenom-enon and that simpler outrigger canoes and/or rafts with the sail were used in the earlier stages of settlement of Remote Oceania (Anderson et al., 2006). However, Pawley and Pawley (1994) note that the linguistic distinction between double canoes and single outrigger canoes is more difficult to establish, with both kinds of canoes likely being widespread in prehistoric East Polynesia.
Despite some discrepancies in the linguistic record, each of these watercraft types would have certain limitations and advan-tages given various environmental conditions such as Madden–Julian Oscillation (MJO) and El Niño/Southern Oscillation (ENSO) events (Madden and Julian, 1972; Rasmusson and Wallace, 1983). In actuality, while an argument for an earlier (pre-1200 BP) coloni-zation of East Polynesia has waned, these questions can only be tested with complex computer simulated voyages and climatic data, which are then collated and compared with what is seen in the archaeological record and other lines of evidence.
To address this issue, we present the results of two comple-mentary analytical techniques used to evaluate the potential role of environmental factors in the proposed late colonization of East Polynesia. Both provide estimates of the feasibility of eastward voyaging. The first is computer simulation of ocean voyaging, whereas the second uses land distribution and wind data to esti-mate the ease of eastward travel in the area of interest. The voy-age simulation model considers wind and current patterns, island distribution, mortality at sea, and sailors’ navigational intent. The model, which has been validated against historically documented voyages, computes statistical probability of vessel trajectories under given physical conditions to generate a description of pos-sible voyages (e.g. Callaghan, 2001; Callaghan and Fitzpatrick, 2008; Fitzpatrick and Callaghan, 2009). The ease of eastward travel estimates is based on the duration and intensity of eastward winds in the region and on the distance between different island groups and closest island group to the east.
We first begin by describing the two types of analyses in more detail. We then highlight the results in an attempt to discern what the underlying causes may have been for the long pause were it in fact a real phenomenon.
Data and methodsThe ‘Seascape’ statistical modelThe statistical model is based on wind and current data from the CD-ROM version of the US Navy Marine Climatic Atlas of the World (National Climatic Data Center (NCD), 1995). When conducting these simulations, four variables are considered:
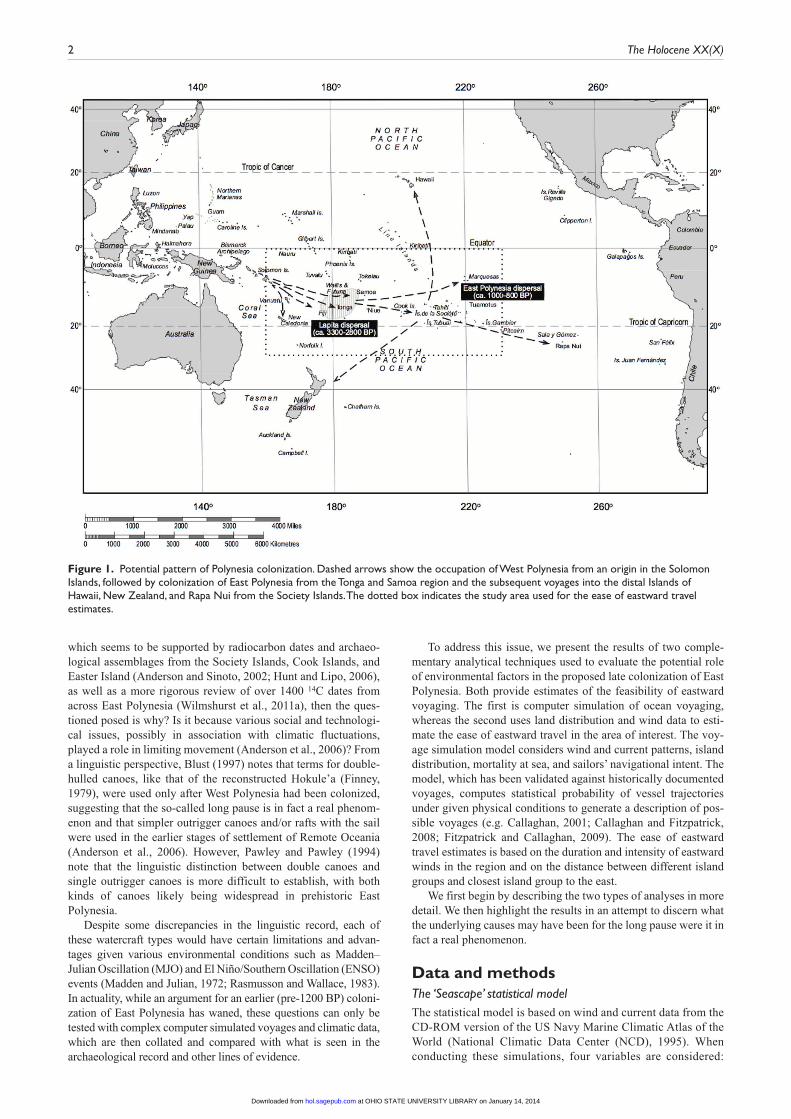
Figure 1. Potential pattern of Polynesia colonization. Dashed arrows show the occupation of West Polynesia from an origin in the Solomon Islands, followed by colonization of East Polynesia from the Tonga and Samoa region and the subsequent voyages into the distal Islands of Hawaii, New Zealand, and Rapa Nui from the Society Islands. The dotted box indicates the study area used for the ease of eastward travel estimates.
at OHIO STATE UNIVERSITY LIBRARY on January 14, 2014hol.sagepub.comDownloaded from
Montenegro et al. 3
(1) current patterns, (2) wind patterns, (3) vessel type, and (4) propulsion. Parameters selected by the operator include the starting position of the vessel, downwind or directed voyage, duration at sea, sighting distances, and what constitutes a suc-cessful voyage (see Callaghan (2001, 2003) for further details regarding simulation protocols and software architecture).
Both current and wind direction and speed are frequency-weighted according to the compiled observations from the Marine Climatic Atlas (NCD, 1995). The data are organized in one-degree Marsden squares. Wind and current forces are then allowed to operate on vessels for a 24-h period (for a justification, see Levison et al., 1973) before a new selection is made. In the model, currents affect vessels in a 1:1 ratio (Lewis, 1972: 212). The effects of wind can be calculated from performance diagrams. One type of canoe and rig likely to have been used in the coloni-zation of East Polynesia (Irwin, 2010: 137) is an outrigger canoe with an oceanic spritsail rig. Unfortunately, while the perfor-mance of oceanic lateen sails has been calculated, this has not been published for the oceanic spritsail (Irwin, 2008: 18). In fact, few performance diagrams have been published for any tradi-tional Pacific canoes (Di Piazza et al., 2007: 1221). However, the goal here is to identify areas where land distribution, wind, and current patterns form bottlenecks for eastward voyaging, not spe-cifically to identify the canoe and rig configuration most likely to have overcome these conditions.
Doran (1981: 64–65) published the performance diagrams for three traditional Polynesian canoes. Of the three, Doran only con-sidered the Wa to be ‘truly seaworthy’, and parameters from this vessel were used in one set of simulations. With a 10-knot wind, the Wa is capable of making 6 knots at 80° off the true wind. For comparison, a second set of simulations was conducted using the speeds given by Levison et al. (1973), generalized from data for a number of small sailing craft. Some further comparison was made with the speeds from a polar diagram for a reconstructed Tahitian double canoe (Di Piazza, 2013). Realistically, there may not be an historical equivalent for the hull and rig configuration used in the initial colonization of eastern Polynesia (Anderson, 2008).
Using the Seascape seafaring simulation program, we set the vessels out from off the east coasts of Samoa and Tonga with 100 simulations starting in each month of the year. Vessels were given a directed heading of due east. Four target areas were defined: the Cook Islands and Tubuai Island, the Society Islands, the Marque-sas Islands, and the Tuamotu Islands. Success was defined by ves-sels coming within 10 nautical miles of land within the target areas. Vessels not reaching target land within 200 days were con-sidered lost. Lengthy drift voyages lasting on the order of 200 days have been recorded in the South Pacific (Howay, 1944; Levi-son et al., 1973). Since these simulations are of directed voyages,
it would be expected that vessels would be better supplied than drift voyages. It should be noted that nonannual cyclical events tend to be swamped by the annual cycle in the statistical model and cannot be evaluated. Also of note is that near-shore and onshore winds can vary considerably in speed and direction from winds in the open sea (Watts, 1987: 51–53).
Ease of eastward travel estimatesThe second analysis we used involves harnessing multiannual wind data and a high-resolution land distribution map to provide different estimates of the ease of eastward travel for trips starting from islands in West and Central Polynesia such as Samoa and Tonga. Wind information is also used to identify the temporal variability of the ease of eastward travel.
Land distribution–based estimates. Island location is based on the ETOPO1 Global Relief Model (Amante and Eakins, 2009) with resolution of 1 arc-min (0.017°, or about 1.8 km at the equator). The area over which the analysis is performed can be seen in Fig-ure 1 and covers the region between the equator to 30°S and between the longitudes of 160° and 235° (160°E to 125°W). Land areas are here defined as ETOPO1 data points with mean eleva-tion of 1 m a.s.l. or more.
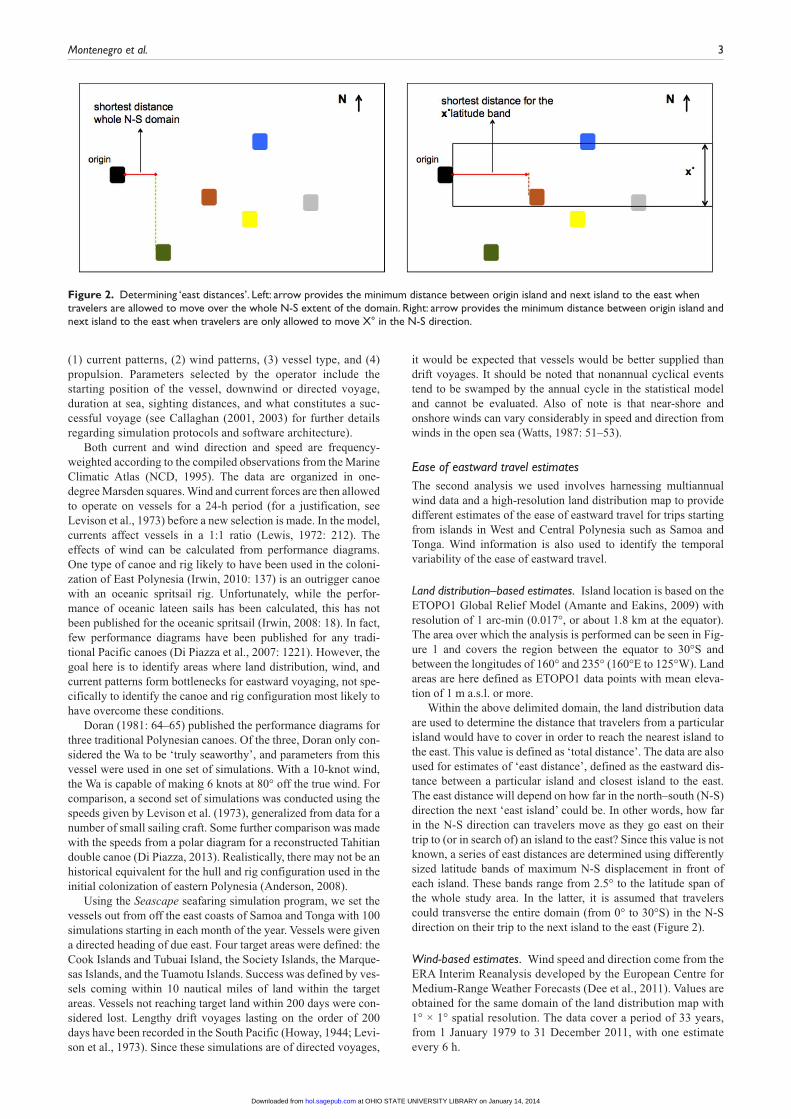
Within the above delimited domain, the land distribution data are used to determine the distance that travelers from a particular island would have to cover in order to reach the nearest island to the east. This value is defined as ‘total distance’. The data are also used for estimates of ‘east distance’, defined as the eastward dis-tance between a particular island and closest island to the east. The east distance will depend on how far in the north–south (N-S) direction the next ‘east island’ could be. In other words, how far in the N-S direction can travelers move as they go east on their trip to (or in search of) an island to the east? Since this value is not known, a series of east distances are determined using differently sized latitude bands of maximum N-S displacement in front of each island. These bands range from 2.5° to the latitude span of the whole study area. In the latter, it is assumed that travelers could transverse the entire domain (from 0° to 30°S) in the N-S direction on their trip to the next island to the east (Figure 2).
Wind-based estimates. Wind speed and direction come from the ERA Interim Reanalysis developed by the European Centre for Medium-Range Weather Forecasts (Dee et al., 2011). Values are obtained for the same domain of the land distribution map with 1° × 1° spatial resolution. The data cover a period of 33 years, from 1 January 1979 to 31 December 2011, with one estimate every 6 h.
Figure 2. Determining ‘east distances’. Left: arrow provides the minimum distance between origin island and next island to the east when travelers are allowed to move over the whole N-S extent of the domain. Right: arrow provides the minimum distance between origin island and next island to the east when travelers are only allowed to move X° in the N-S direction.
at OHIO STATE UNIVERSITY LIBRARY on January 14, 2014hol.sagepub.comDownloaded from
4 The Holocene XX(X)
We adopt a present-day reanalysis product because it offers the best available representation of atmospheric conditions in the area at around 3000 BP. The present-day data provide significantly higher spatial and temporal resolution than available proxies, and very likely, a better representation of variability than paleo-models do for the period of interest. More importantly, many proxy records and model results show that the present-day atmospheric circula-tion patterns across the South Pacific, including the interannual variability associated with ENSO cycles, had been established by 3000 BP (Cobb et al., 2013; Donders et al., 2008; McGregor and Gagan, 2004; Markgraf et al., 1992; Moy et al., 2002).
Wind information is used to generate three operational esti-mates of ease of eastward displacement that take into account duration and intensity of east flowing winds in each 1° × 1° data grid box. They are
•• Fraction of time that winds flow to the east;•• Duration of eastward spells, with spells defined as periods
during which the daily averaged winds flow continuously to the east;
•• ‘Wind Easting’ (E), defined by E = vt, where t is a time interval and v is the mean eastward wind speed during t. While this parameter has distance units, it is not inter-preted as an estimate of actual potential eastward dis-placement but adopted as a simple way to incorporate both wind duration and intensity in one value.
The goal of this particular analysis is not to test the feasibility of particular voyages. The parameters described above are used in quantitative comparisons of the ease of moving eastward between different areas as well as during different periods. Examples of the type of questions they are capable of answering include the following: As far as the wind is concerned, are vessels departing from Tonga likely to move a longer distance to the east than ves-sels departing from Samoa? Would vessels departing from Samoa have a better chance of reaching eastern destinations if the trip occurs under typical El Niño conditions as has been postulated by other scholars (Anderson et al., 2006; Finney, 1985)?
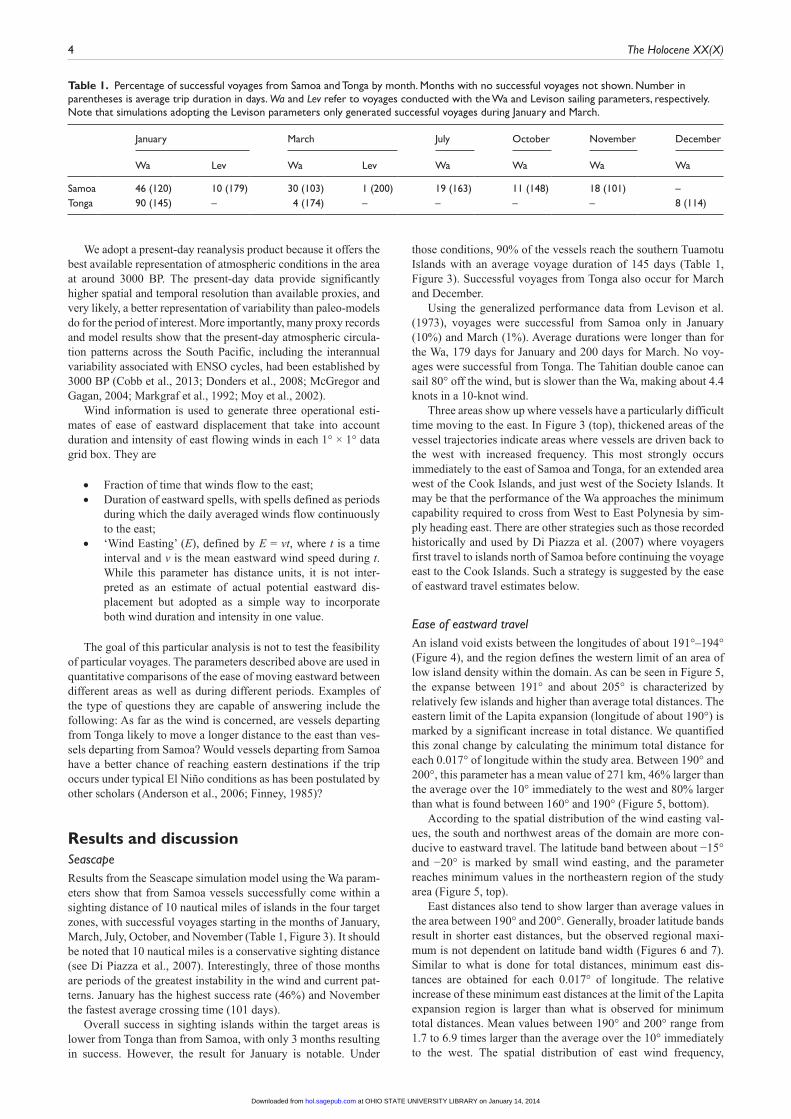
Results and discussionSeascapeResults from the Seascape simulation model using the Wa param-eters show that from Samoa vessels successfully come within a sighting distance of 10 nautical miles of islands in the four target zones, with successful voyages starting in the months of January, March, July, October, and November (Table 1, Figure 3). It should be noted that 10 nautical miles is a conservative sighting distance (see Di Piazza et al., 2007). Interestingly, three of those months are periods of the greatest instability in the wind and current pat-terns. January has the highest success rate (46%) and November the fastest average crossing time (101 days).
Overall success in sighting islands within the target areas is lower from Tonga than from Samoa, with only 3 months resulting in success. However, the result for January is notable. Under
those conditions, 90% of the vessels reach the southern Tuamotu Islands with an average voyage duration of 145 days (Table 1, Figure 3). Successful voyages from Tonga also occur for March and December.
Using the generalized performance data from Levison et al. (1973), voyages were successful from Samoa only in January (10%) and March (1%). Average durations were longer than for the Wa, 179 days for January and 200 days for March. No voy-ages were successful from Tonga. The Tahitian double canoe can sail 80° off the wind, but is slower than the Wa, making about 4.4 knots in a 10-knot wind.
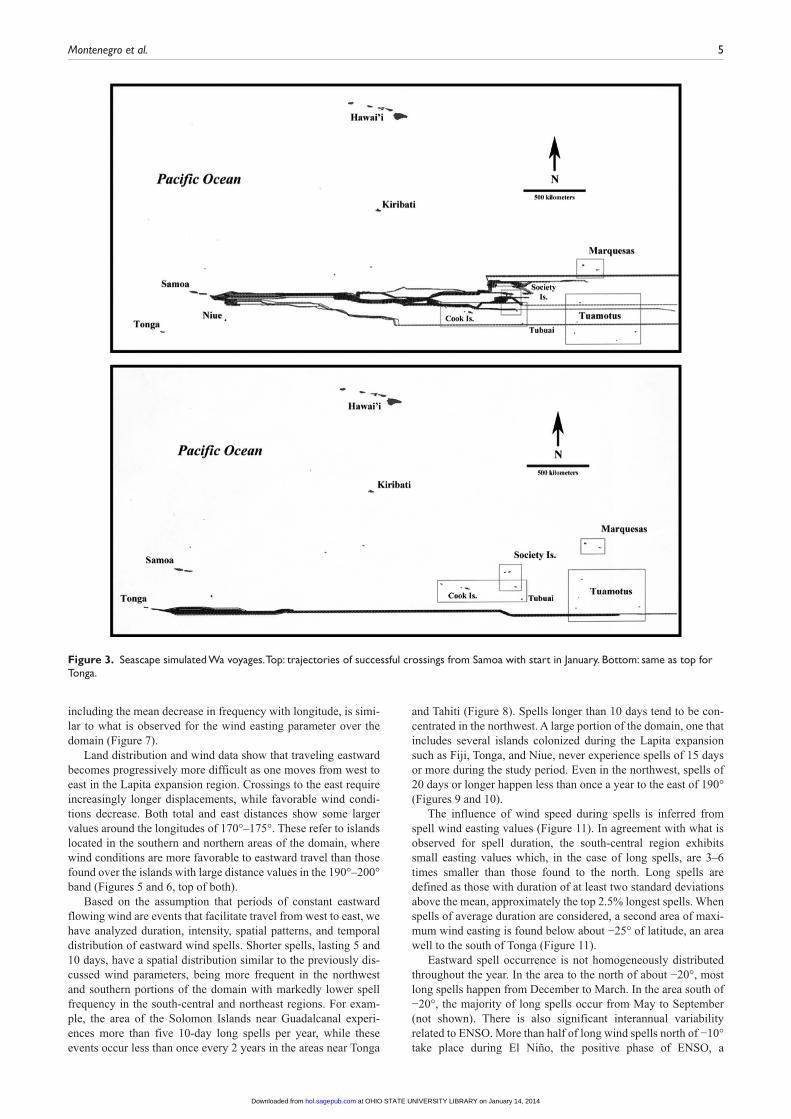
Three areas show up where vessels have a particularly difficult time moving to the east. In Figure 3 (top), thickened areas of the vessel trajectories indicate areas where vessels are driven back to the west with increased frequency. This most strongly occurs immediately to the east of Samoa and Tonga, for an extended area west of the Cook Islands, and just west of the Society Islands. It may be that the performance of the Wa approaches the minimum capability required to cross from West to East Polynesia by sim-ply heading east. There are other strategies such as those recorded historically and used by Di Piazza et al. (2007) where voyagers first travel to islands north of Samoa before continuing the voyage east to the Cook Islands. Such a strategy is suggested by the ease of eastward travel estimates below.
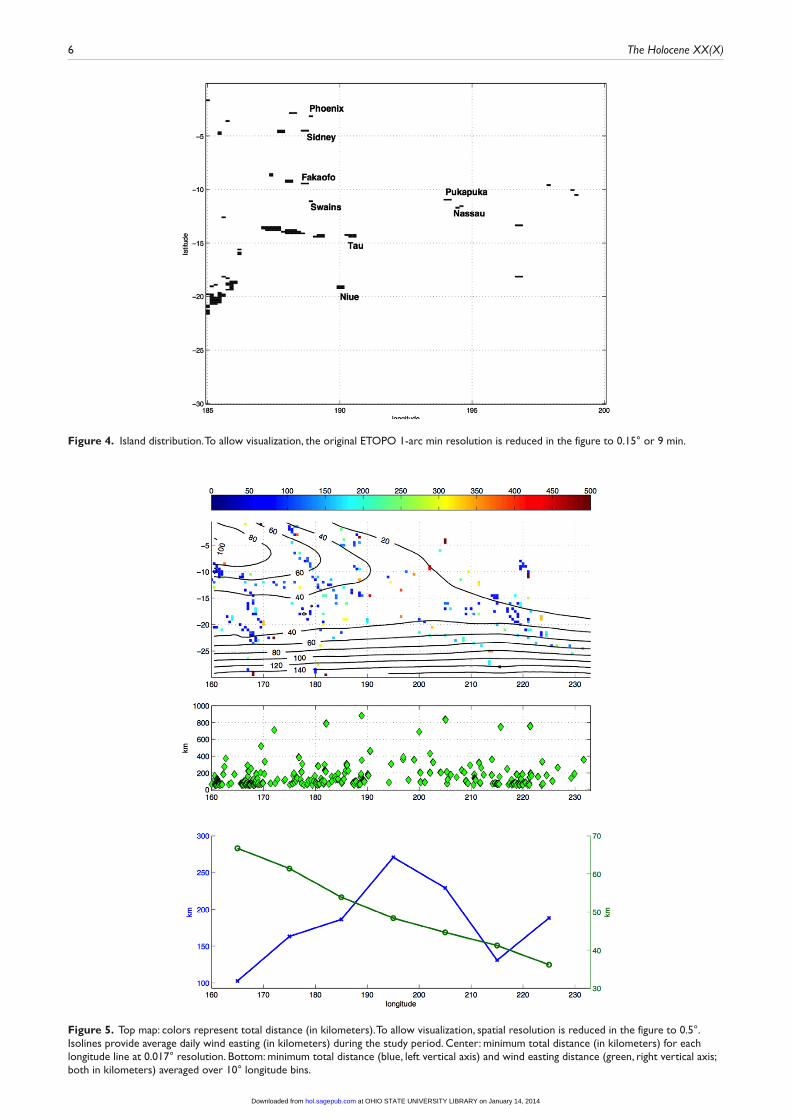
Ease of eastward travelAn island void exists between the longitudes of about 191°–194° (Figure 4), and the region defines the western limit of an area of low island density within the domain. As can be seen in Figure 5, the expanse between 191° and about 205° is characterized by relatively few islands and higher than average total distances. The eastern limit of the Lapita expansion (longitude of about 190°) is marked by a significant increase in total distance. We quantified this zonal change by calculating the minimum total distance for each 0.017° of longitude within the study area. Between 190° and 200°, this parameter has a mean value of 271 km, 46% larger than the average over the 10° immediately to the west and 80% larger than what is found between 160° and 190° (Figure 5, bottom).
According to the spatial distribution of the wind easting val-ues, the south and northwest areas of the domain are more con-ducive to eastward travel. The latitude band between about −15° and −20° is marked by small wind easting, and the parameter reaches minimum values in the northeastern region of the study area (Figure 5, top).
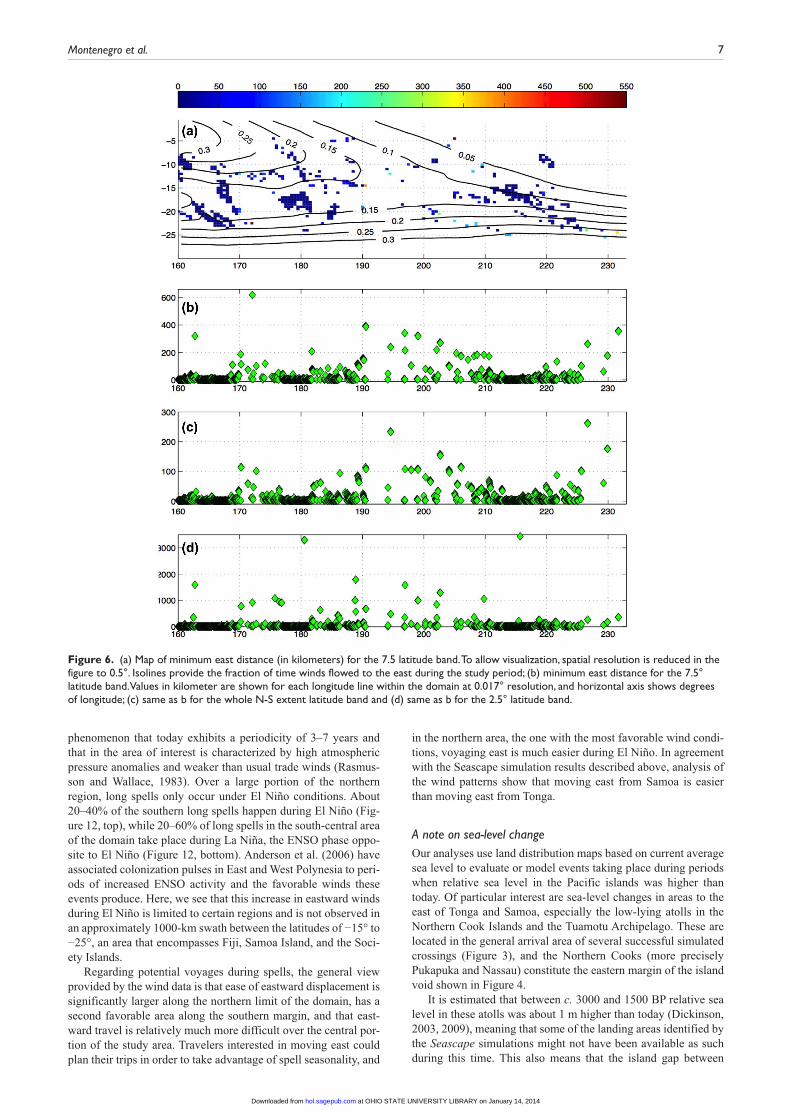
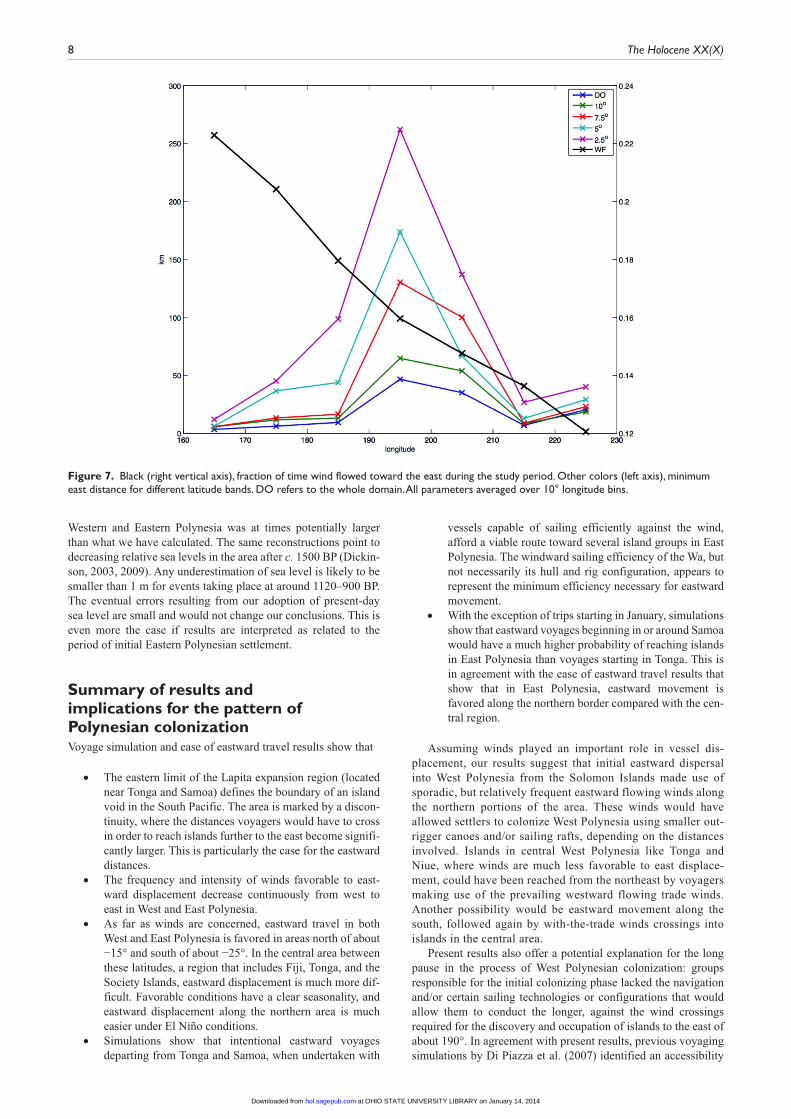
East distances also tend to show larger than average values in the area between 190° and 200°. Generally, broader latitude bands result in shorter east distances, but the observed regional maxi-mum is not dependent on latitude band width (Figures 6 and 7). Similar to what is done for total distances, minimum east dis-tances are obtained for each 0.017° of longitude. The relative increase of these minimum east distances at the limit of the Lapita expansion region is larger than what is observed for minimum total distances. Mean values between 190° and 200° range from 1.7 to 6.9 times larger than the average over the 10° immediately to the west. The spatial distribution of east wind frequency,
Table 1. Percentage of successful voyages from Samoa and Tonga by month. Months with no successful voyages not shown. Number in parentheses is average trip duration in days. Wa and Lev refer to voyages conducted with the Wa and Levison sailing parameters, respectively. Note that simulations adopting the Levison parameters only generated successful voyages during January and March.
January March July October November December
Wa Lev Wa Lev Wa Wa Wa Wa
Samoa 46 (120) 10 (179) 30 (103) 1 (200) 19 (163) 11 (148) 18 (101) –Tonga 90 (145) – 4 (174) – – – – 8 (114)
at OHIO STATE UNIVERSITY LIBRARY on January 14, 2014hol.sagepub.comDownloaded from
Montenegro et al. 5
including the mean decrease in frequency with longitude, is simi-lar to what is observed for the wind easting parameter over the domain (Figure 7).
Land distribution and wind data show that traveling eastward becomes progressively more difficult as one moves from west to east in the Lapita expansion region. Crossings to the east require increasingly longer displacements, while favorable wind condi-tions decrease. Both total and east distances show some larger values around the longitudes of 170°–175°. These refer to islands located in the southern and northern areas of the domain, where wind conditions are more favorable to eastward travel than those found over the islands with large distance values in the 190°–200° band (Figures 5 and 6, top of both).
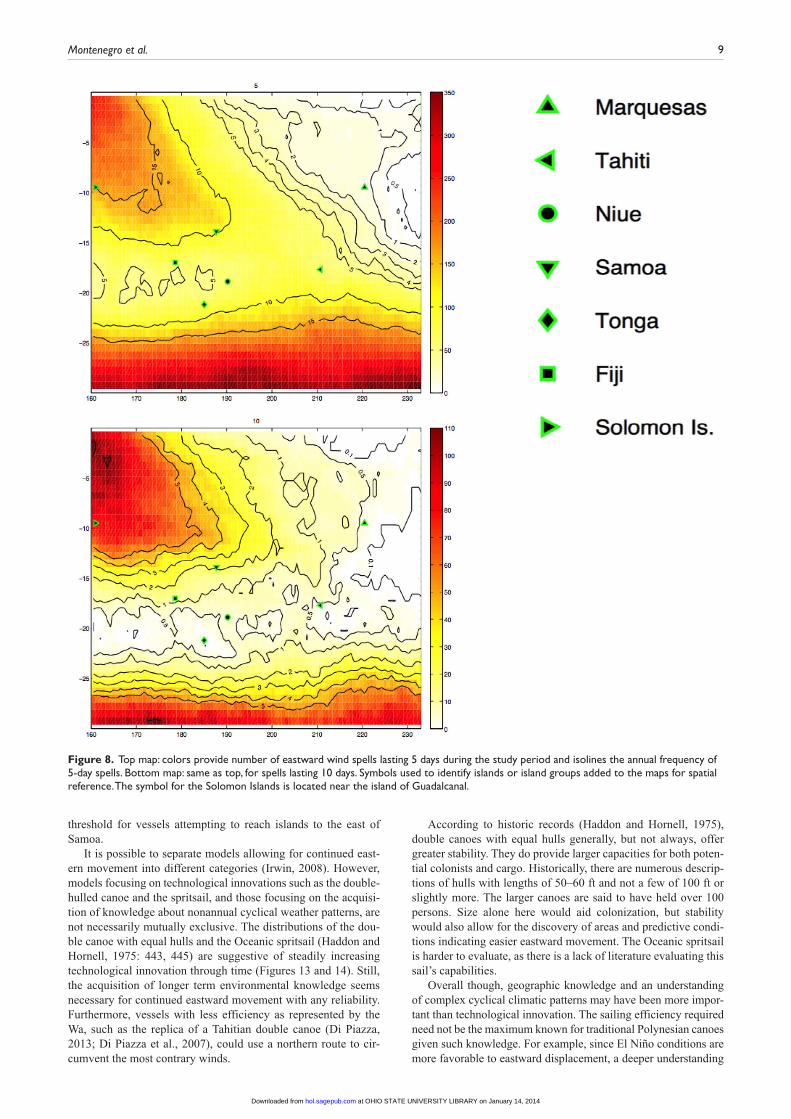
Based on the assumption that periods of constant eastward flowing wind are events that facilitate travel from west to east, we have analyzed duration, intensity, spatial patterns, and temporal distribution of eastward wind spells. Shorter spells, lasting 5 and 10 days, have a spatial distribution similar to the previously dis-cussed wind parameters, being more frequent in the northwest and southern portions of the domain with markedly lower spell frequency in the south-central and northeast regions. For exam-ple, the area of the Solomon Islands near Guadalcanal experi-ences more than five 10-day long spells per year, while these events occur less than once every 2 years in the areas near Tonga
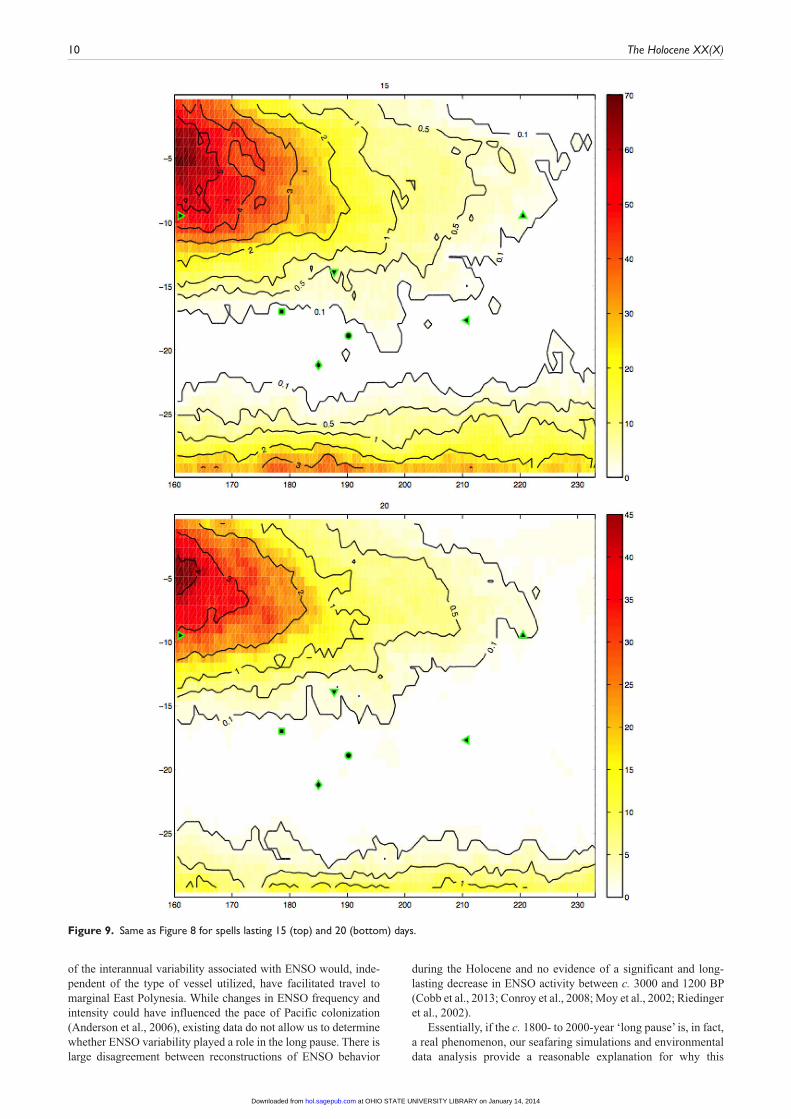
and Tahiti (Figure 8). Spells longer than 10 days tend to be con-centrated in the northwest. A large portion of the domain, one that includes several islands colonized during the Lapita expansion such as Fiji, Tonga, and Niue, never experience spells of 15 days or more during the study period. Even in the northwest, spells of 20 days or longer happen less than once a year to the east of 190° (Figures 9 and 10).
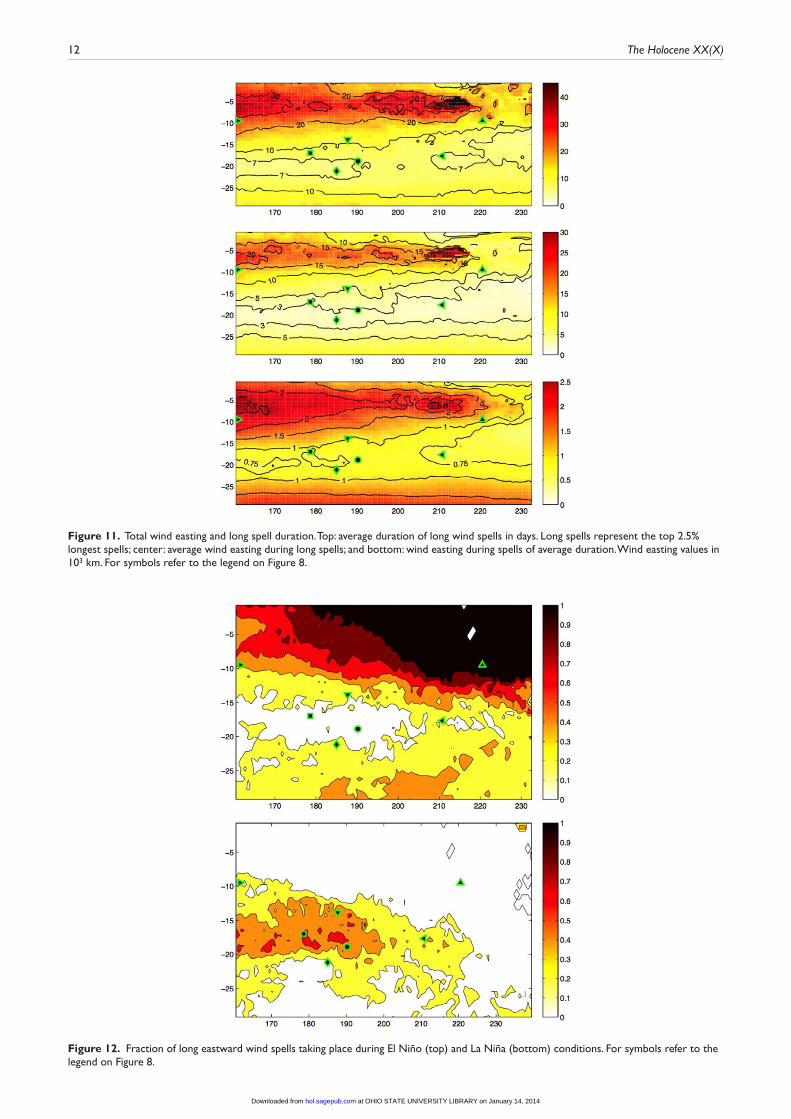
The influence of wind speed during spells is inferred from spell wind easting values (Figure 11). In agreement with what is observed for spell duration, the south-central region exhibits small easting values which, in the case of long spells, are 3–6 times smaller than those found to the north. Long spells are defined as those with duration of at least two standard deviations above the mean, approximately the top 2.5% longest spells. When spells of average duration are considered, a second area of maxi-mum wind easting is found below about −25° of latitude, an area well to the south of Tonga (Figure 11).
Eastward spell occurrence is not homogeneously distributed throughout the year. In the area to the north of about −20°, most long spells happen from December to March. In the area south of −20°, the majority of long spells occur from May to September (not shown). There is also significant interannual variability related to ENSO. More than half of long wind spells north of −10° take place during El Niño, the positive phase of ENSO, a
Figure 3. Seascape simulated Wa voyages. Top: trajectories of successful crossings from Samoa with start in January. Bottom: same as top for Tonga.
at OHIO STATE UNIVERSITY LIBRARY on January 14, 2014hol.sagepub.comDownloaded from
6 The Holocene XX(X)
Figure 4. Island distribution. To allow visualization, the original ETOPO 1-arc min resolution is reduced in the figure to 0.15° or 9 min.
Figure 5. Top map: colors represent total distance (in kilometers). To allow visualization, spatial resolution is reduced in the figure to 0.5°. Isolines provide average daily wind easting (in kilometers) during the study period. Center: minimum total distance (in kilometers) for each longitude line at 0.017° resolution. Bottom: minimum total distance (blue, left vertical axis) and wind easting distance (green, right vertical axis; both in kilometers) averaged over 10° longitude bins.
at OHIO STATE UNIVERSITY LIBRARY on January 14, 2014hol.sagepub.comDownloaded from
Montenegro et al. 7
phenomenon that today exhibits a periodicity of 3–7 years and that in the area of interest is characterized by high atmospheric pressure anomalies and weaker than usual trade winds (Rasmus-son and Wallace, 1983). Over a large portion of the northern region, long spells only occur under El Niño conditions. About 20–40% of the southern long spells happen during El Niño (Fig-ure 12, top), while 20–60% of long spells in the south-central area of the domain take place during La Niña, the ENSO phase oppo-site to El Niño (Figure 12, bottom). Anderson et al. (2006) have associated colonization pulses in East and West Polynesia to peri-ods of increased ENSO activity and the favorable winds these events produce. Here, we see that this increase in eastward winds during El Niño is limited to certain regions and is not observed in an approximately 1000-km swath between the latitudes of −15° to −25°, an area that encompasses Fiji, Samoa Island, and the Soci-ety Islands.
Regarding potential voyages during spells, the general view provided by the wind data is that ease of eastward displacement is significantly larger along the northern limit of the domain, has a second favorable area along the southern margin, and that east-ward travel is relatively much more difficult over the central por-tion of the study area. Travelers interested in moving east could plan their trips in order to take advantage of spell seasonality, and
in the northern area, the one with the most favorable wind condi-tions, voyaging east is much easier during El Niño. In agreement with the Seascape simulation results described above, analysis of the wind patterns show that moving east from Samoa is easier than moving east from Tonga.
A note on sea-level changeOur analyses use land distribution maps based on current average sea level to evaluate or model events taking place during periods when relative sea level in the Pacific islands was higher than today. Of particular interest are sea-level changes in areas to the east of Tonga and Samoa, especially the low-lying atolls in the Northern Cook Islands and the Tuamotu Archipelago. These are located in the general arrival area of several successful simulated crossings (Figure 3), and the Northern Cooks (more precisely Pukapuka and Nassau) constitute the eastern margin of the island void shown in Figure 4.
It is estimated that between c. 3000 and 1500 BP relative sea level in these atolls was about 1 m higher than today (Dickinson, 2003, 2009), meaning that some of the landing areas identified by the Seascape simulations might not have been available as such during this time. This also means that the island gap between
Figure 6. (a) Map of minimum east distance (in kilometers) for the 7.5 latitude band. To allow visualization, spatial resolution is reduced in the figure to 0.5°. Isolines provide the fraction of time winds flowed to the east during the study period; (b) minimum east distance for the 7.5° latitude band. Values in kilometer are shown for each longitude line within the domain at 0.017° resolution, and horizontal axis shows degrees of longitude; (c) same as b for the whole N-S extent latitude band and (d) same as b for the 2.5° latitude band.
at OHIO STATE UNIVERSITY LIBRARY on January 14, 2014hol.sagepub.comDownloaded from
8 The Holocene XX(X)
Western and Eastern Polynesia was at times potentially larger than what we have calculated. The same reconstructions point to decreasing relative sea levels in the area after c. 1500 BP (Dickin-son, 2003, 2009). Any underestimation of sea level is likely to be smaller than 1 m for events taking place at around 1120–900 BP. The eventual errors resulting from our adoption of present-day sea level are small and would not change our conclusions. This is even more the case if results are interpreted as related to the period of initial Eastern Polynesian settlement.
Summary of results and implications for the pattern of Polynesian colonizationVoyage simulation and ease of eastward travel results show that
•• The eastern limit of the Lapita expansion region (located near Tonga and Samoa) defines the boundary of an island void in the South Pacific. The area is marked by a discon-tinuity, where the distances voyagers would have to cross in order to reach islands further to the east become signifi-cantly larger. This is particularly the case for the eastward distances.
•• The frequency and intensity of winds favorable to east-ward displacement decrease continuously from west to east in West and East Polynesia.
•• As far as winds are concerned, eastward travel in both West and East Polynesia is favored in areas north of about −15° and south of about −25°. In the central area between these latitudes, a region that includes Fiji, Tonga, and the Society Islands, eastward displacement is much more dif-ficult. Favorable conditions have a clear seasonality, and eastward displacement along the northern area is much easier under El Niño conditions.
•• Simulations show that intentional eastward voyages departing from Tonga and Samoa, when undertaken with
vessels capable of sailing efficiently against the wind, afford a viable route toward several island groups in East Polynesia. The windward sailing efficiency of the Wa, but not necessarily its hull and rig configuration, appears to represent the minimum efficiency necessary for eastward movement.
•• With the exception of trips starting in January, simulations show that eastward voyages beginning in or around Samoa would have a much higher probability of reaching islands in East Polynesia than voyages starting in Tonga. This is in agreement with the ease of eastward travel results that show that in East Polynesia, eastward movement is favored along the northern border compared with the cen-tral region.
Assuming winds played an important role in vessel dis-placement, our results suggest that initial eastward dispersal into West Polynesia from the Solomon Islands made use of sporadic, but relatively frequent eastward flowing winds along the northern portions of the area. These winds would have allowed settlers to colonize West Polynesia using smaller out-rigger canoes and/or sailing rafts, depending on the distances involved. Islands in central West Polynesia like Tonga and Niue, where winds are much less favorable to east displace-ment, could have been reached from the northeast by voyagers making use of the prevailing westward flowing trade winds. Another possibility would be eastward movement along the south, followed again by with-the-trade winds crossings into islands in the central area.
Present results also offer a potential explanation for the long pause in the process of West Polynesian colonization: groups responsible for the initial colonizing phase lacked the navigation and/or certain sailing technologies or configurations that would allow them to conduct the longer, against the wind crossings required for the discovery and occupation of islands to the east of about 190°. In agreement with present results, previous voyaging simulations by Di Piazza et al. (2007) identified an accessibility
Figure 7. Black (right vertical axis), fraction of time wind flowed toward the east during the study period. Other colors (left axis), minimum east distance for different latitude bands. DO refers to the whole domain. All parameters averaged over 10° longitude bins.
at OHIO STATE UNIVERSITY LIBRARY on January 14, 2014hol.sagepub.comDownloaded from
Montenegro et al. 9
threshold for vessels attempting to reach islands to the east of Samoa.
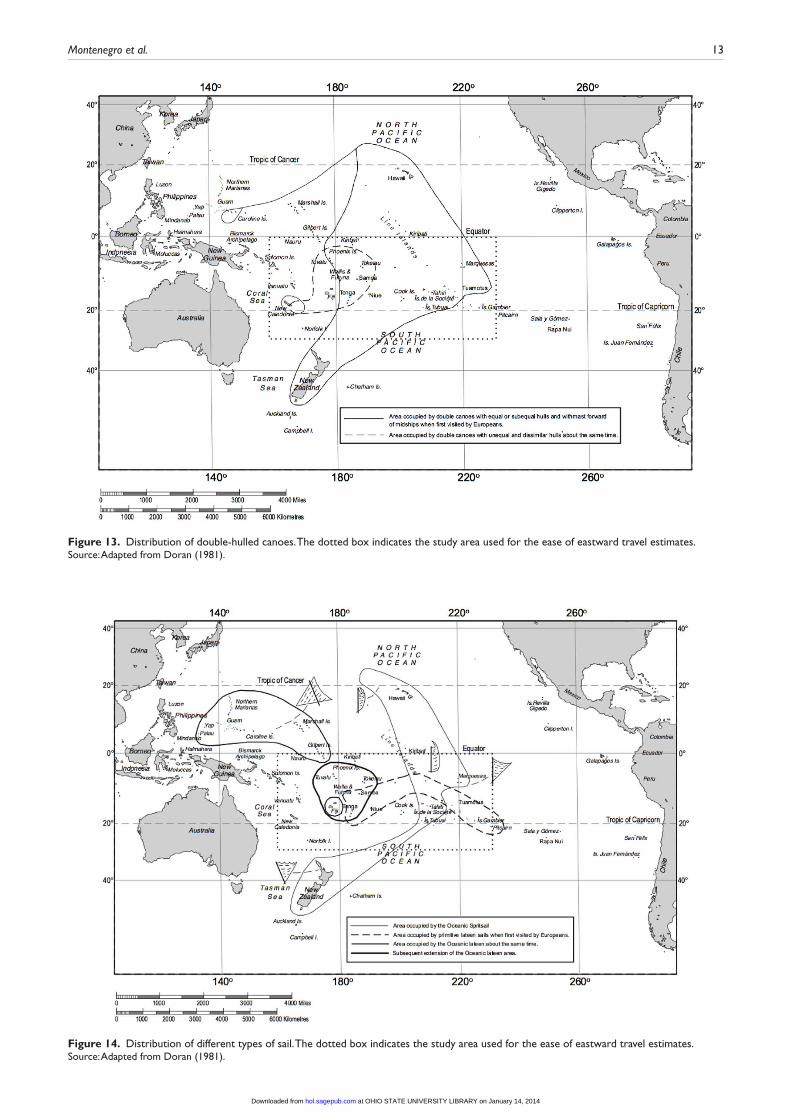
It is possible to separate models allowing for continued east-ern movement into different categories (Irwin, 2008). However, models focusing on technological innovations such as the double-hulled canoe and the spritsail, and those focusing on the acquisi-tion of knowledge about nonannual cyclical weather patterns, are not necessarily mutually exclusive. The distributions of the dou-ble canoe with equal hulls and the Oceanic spritsail (Haddon and Hornell, 1975: 443, 445) are suggestive of steadily increasing technological innovation through time (Figures 13 and 14). Still, the acquisition of longer term environmental knowledge seems necessary for continued eastward movement with any reliability. Furthermore, vessels with less efficiency as represented by the Wa, such as the replica of a Tahitian double canoe (Di Piazza, 2013; Di Piazza et al., 2007), could use a northern route to cir-cumvent the most contrary winds.
According to historic records (Haddon and Hornell, 1975), double canoes with equal hulls generally, but not always, offer greater stability. They do provide larger capacities for both poten-tial colonists and cargo. Historically, there are numerous descrip-tions of hulls with lengths of 50–60 ft and not a few of 100 ft or slightly more. The larger canoes are said to have held over 100 persons. Size alone here would aid colonization, but stability would also allow for the discovery of areas and predictive condi-tions indicating easier eastward movement. The Oceanic spritsail is harder to evaluate, as there is a lack of literature evaluating this sail’s capabilities.
Overall though, geographic knowledge and an understanding of complex cyclical climatic patterns may have been more impor-tant than technological innovation. The sailing efficiency required need not be the maximum known for traditional Polynesian canoes given such knowledge. For example, since El Niño conditions are more favorable to eastward displacement, a deeper understanding
Figure 8. Top map: colors provide number of eastward wind spells lasting 5 days during the study period and isolines the annual frequency of 5-day spells. Bottom map: same as top, for spells lasting 10 days. Symbols used to identify islands or island groups added to the maps for spatial reference. The symbol for the Solomon Islands is located near the island of Guadalcanal.
at OHIO STATE UNIVERSITY LIBRARY on January 14, 2014hol.sagepub.comDownloaded from
10 The Holocene XX(X)
of the interannual variability associated with ENSO would, inde-pendent of the type of vessel utilized, have facilitated travel to marginal East Polynesia. While changes in ENSO frequency and intensity could have influenced the pace of Pacific colonization (Anderson et al., 2006), existing data do not allow us to determine whether ENSO variability played a role in the long pause. There is large disagreement between reconstructions of ENSO behavior
during the Holocene and no evidence of a significant and long-lasting decrease in ENSO activity between c. 3000 and 1200 BP (Cobb et al., 2013; Conroy et al., 2008; Moy et al., 2002; Riedinger et al., 2002).
Essentially, if the c. 1800- to 2000-year ‘long pause’ is, in fact, a real phenomenon, our seafaring simulations and environmental data analysis provide a reasonable explanation for why this
Figure 9. Same as Figure 8 for spells lasting 15 (top) and 20 (bottom) days.
at OHIO STATE UNIVERSITY LIBRARY on January 14, 2014hol.sagepub.comDownloaded from
Montenegro et al. 11
occurred, suggesting that there was a lag time between the coloni-zation of West and East Polynesia because of insufficient seafar-ing capabilities. The fact that East Polynesia was settled later in time c. 1250–800 BP may partly be the result of voyagers devel-oping more efficient watercraft technologies (e.g. sail design, larger double hulls) that allowed them to harness contrary winds
and withstand the rigors of traveling longer distances with the necessary provisions and number of people to ensure survivabil-ity once land was reached. Given what was seen historically in terms of Polynesian seafaring capabilities (e.g. double-hulled canoe) and the relatively rapid movement into East Polynesia observed archaeologically, it would appear likely that enhanced
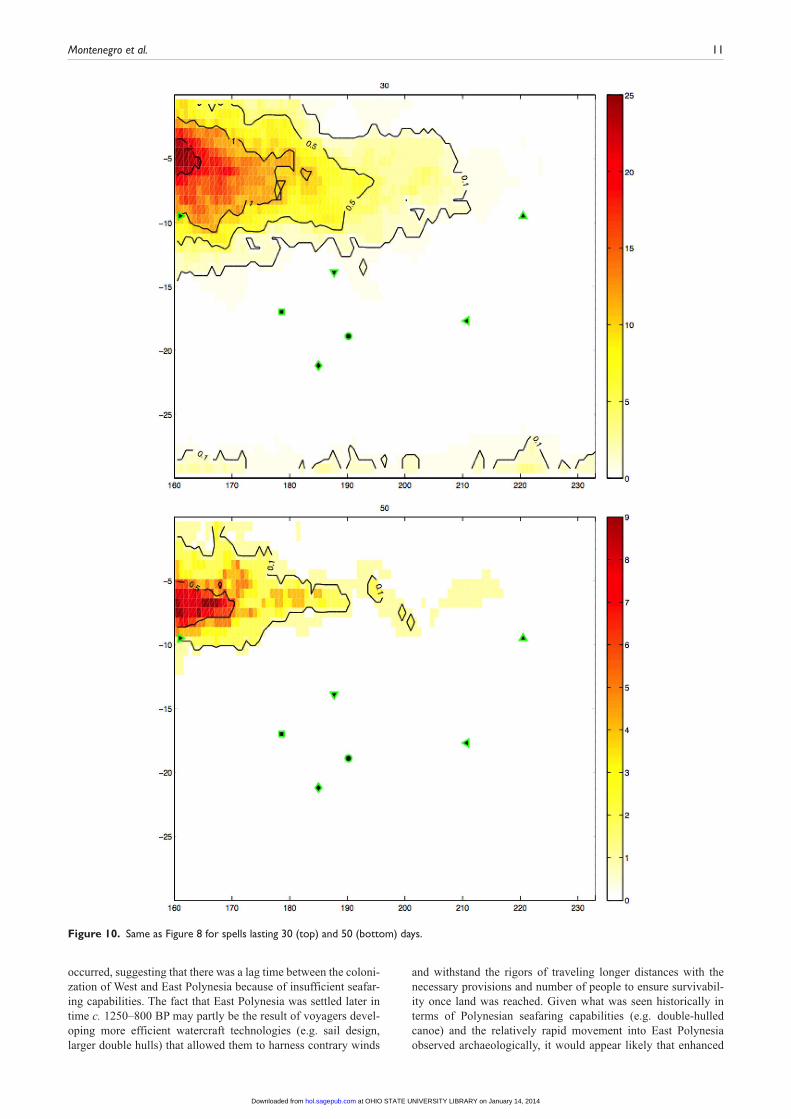
Figure 10. Same as Figure 8 for spells lasting 30 (top) and 50 (bottom) days.
at OHIO STATE UNIVERSITY LIBRARY on January 14, 2014hol.sagepub.comDownloaded from
12 The Holocene XX(X)
Figure 11. Total wind easting and long spell duration. Top: average duration of long wind spells in days. Long spells represent the top 2.5% longest spells; center: average wind easting during long spells; and bottom: wind easting during spells of average duration. Wind easting values in 103 km. For symbols refer to the legend on Figure 8.
Figure 12. Fraction of long eastward wind spells taking place during El Niño (top) and La Niña (bottom) conditions. For symbols refer to the legend on Figure 8.
at OHIO STATE UNIVERSITY LIBRARY on January 14, 2014hol.sagepub.comDownloaded from
Montenegro et al. 13
Figure 13. Distribution of double-hulled canoes. The dotted box indicates the study area used for the ease of eastward travel estimates.Source: Adapted from Doran (1981).
Figure 14. Distribution of different types of sail. The dotted box indicates the study area used for the ease of eastward travel estimates.Source: Adapted from Doran (1981).
at OHIO STATE UNIVERSITY LIBRARY on January 14, 2014hol.sagepub.comDownloaded from
14 The Holocene XX(X)
navigational (way finding) skill and knowledge of episodic wind anomalies were all pivotal to the successful colonization of what is arguably considered to be the most expansive and rapid human diaspora on earth.
AcknowledgementsThe authors are grateful for insightful comments and suggestions from two anonymous reviewers. AM was partially supported by UNESP’s international visiting scholar program. Some of the cur-rent findings were presented during the 78th Annual Meeting of the Society for American Archaeology.
FundingThis research received no specific grant from any funding agency in the public, commercial, or not-for-profit sectors.
ReferencesAmante C and Eakins BW (2009) ETOPO1 1 Arc-Minute Global
Relief Model: Procedures, Data Sources and Analysis, Techni-cal Memorandum NESDIS NGDC-24. Boulder, CO: National Oceanic and Atmospheric Administration.
Anderson AJ (1994) Palaeoenvironmental evidence of island col-onization: A response. Antiquity 68: 845–847.
Anderson AJ (1995) Current approaches in East Polynesian colo-nization research. Journal of the Polynesian Society 104: 110–132.
Anderson AJ (2008) Problems of the ‘Traditionalist’ model of long-distance Polynesian voyaging. Insights 1: 12. Avail-able at: https://www.dur.ac.uk/resources/ias/Anderson-11Nov.pdf.
Anderson AJ and Sinoto YH (2002) New radiocarbon ages of colonization sites in East Polynesia. Asian Perspectives 41: 242–257.
Anderson AJ, Chappell J, Gagan M et al. (2006) Prehistoric mari-time migration in the Pacific Islands: An hypothesis of ENSO forcing. The Holocene 16: 1–6.
Blust R (1997) Subgrouping, circularity and extinction: Some issues in Austronesia comparative linguistics. In: Zeitoun E and Li PJK (eds) Selected Papers from the Eighth Interna-tional Conference on Austronesian Linguistics. Taipei, Tai-wan: Academica Sinica, pp. 1–54.
Callaghan RT (2001) Analysis of ceramic age seafaring and inter-action potential in the Antilles: A computer simulation. Cur-rent Anthropology 42(308): 313.
Callaghan RT (2003) Prehistoric trade between Ecuador and west Mexico: A computer simulation of coastal voyages. Antiquity 77(796): 804.
Callaghan RT and Fitzpatrick SM (2008) Examining prehistoric migration patterns in the Palauan Archipelago: A computer simulated analysis of drift voyaging. Asian Perspectives 47(28): 44.
Cobb KNW, Sayani H, Watson J et al. (2013) Highly variable El Niño-Southern/Oscillation throughout the Holocene. Science 339: 67–70.
Conroy JL, Overpeck JT, Cole JE et al. (2008) Holocene changes in eastern tropical Pacific climate inferred from a Galápa-gos lake sediment record. Quaternary Science Reviews 27: 1166–1180.
Dee D, Uppala SM, Simmons AJ et al. (2011) The ERA-Interim reanalysis: Configuration and performance of the data assimi-lation system. Quarterly Journal of the Royal Meteorological Society 137: 553–597.
Dickinson WR (2003) Impact of Mid-Holocene hydro-isostatic highstand in regional sea level on the habitability of islands in Pacific Oceania. Journal of Coastal Research 19: 489–502.
Dickinson WR (2009) Pacific atoll living: How long already and until when? GSA Today 19: 4–10.
Di Piazza A (2013) An isochrone map of the prehistoric Seascape around Samoa. Geographic Research. Available at: http://onlinelibrary.wiley.com/doi/10.1111/1745-5871.12037/full.
Di Piazza A, Di Piazza P and Pearthree E (2007) Sailing virtual canoes across Oceania: Revisiting island accessibility. Jour-nal of Archaeological Science 43: 1219–1225.
Donders T, Wagner-Cremer F and Visscher H (2008) Integration of proxy data and model scenarios for the Mid-Holocene onset of modern ENSO variability. Quaternary Science Reviews 27: 571–579.
Doran E Jr (1981) Wangka: Austronesian Canoe Origins. College Station, TX: Texas A&M University Press.
Finney B (1979) Hokule’a: The Way to Tahiti. New York: Dodd, Mead and Company.
Finney B (1985) Anomalous westerlies, El Niño, and the coloni-zation of Polynesia. American Anthropologist 87: 9–26.
Fitzpatrick S and Callaghan R (2009) Examining dispersal mech-anisms for the translocation of chicken (Gallus gallus) from Polynesia to South America. Asian Perspectives 36(214): 223.
Haddon A and Hornell J (1975) Canoes of Oceania. Honolulu, HI: Bishop Museum Press.
Howay F (1944) Some lengthy open-boat voyages in the Pacific Ocean. American Neptune 4: 53–57.
Hunt TL and Lipo CP (2006) Late colonization of Easter Island. Science 311: 1603–1606.
Irwin G (1992) The Prehistoric Exploration and Colonization of the Pacific. Cambridge: Cambridge University Press, pp. 88–89.
Irwin G (2008) Pacific Seascapes, canoe performance, and a review of Lapita voyaging with regards to theories of migra-tion. Asian Perspectives 47: 12–27.
Irwin G (2010) Pacific voyaging and settlement: Issues of bio-geography and archaeology, canoe performance and com-puter simulation. In: Anderson A, Barrett JH and Boyle KV (eds) The Global Origins and Development of Seafaring (McDonald Institute Monographs). Oxford: Oxbow Books, pp. 131–141.
Kirch P and Ellison J (1994) Palaeoenvironmental evidence for human colonization of remote oceanic islands. Antiquity 68: 310–321.
Levison M, Ward RG and Webb JW (1973) The Settlement of Polynesia: A Computer Simulation. Minneapolis, MN: Uni-versity of Minnesota Press.
Lewis D (1972) We, the Navigators. Honolulu, HI: University of Hawaii Press, p. 212.
McGregor H and Gagan MK (2004) Western Pacific coral D18O records of anomalous Holocene variability in the El Niño/South-ern Oscillation. Geophysical Research Letters 31: L11204.
Madden RA and Julian PR (1972) Detection of a 4050 day oscil-lation in the zonal wind in the tropical Pacific. Journal of Atmospheric Sciences 28: 702–708.
Markgraf V, Dodson J, Kershaw A et al. (1992) Evolution of late Pleistocene and Holocene climates in the circum-South Pacific land areas. Climate Dynamics 34: 193–211.
Moy CGS, Rodbell D and Anderson DM (2002) Variability of El Niño Southern/Oscillation activity at millennial timescales during the Holocene epoch. Nature 420: 162–165.
Mulrooney MA, Bickler SH, Allen MS et al. (2011) High-preci-sion dating of colonization and settlement in East Polynesia. Proceedings of the National Academy of Sciences 108(23): E192–E194.
National Climatic Data Center (NCD) (1995) Marine Climatic Atlas of the World (technical report). Asheville, NC: NCD.
Pawley A and Pawley M (1994) Early Austronesian terms for canoe parts and seafaring. In: Pawley A and Ross MD (eds) Austronesian Terminologies: Continuity and Change (Pacific Linguistics Series C No. 127). Canberra: Department of Lin-guistics, Research School of Pacific and Asian Studies, The Australian National University, pp. 329–361.
at OHIO STATE UNIVERSITY LIBRARY on January 14, 2014hol.sagepub.comDownloaded from
Montenegro et al. 15
Rasmusson E and Wallace JM (1983) Meteorological aspects of the El Niño/Southern Oscillation. Science 222: 1195–1202.
Riedinger MA, Steinitz-Kannan M, Last WM et al. (2002) A ~6100 14C yr record of El Niño activity from the Galápagos Islands. Journal of Paleolimnology 27: 1–7.
Spriggs M and Anderson AJ (1993) Late colonization of East Polynesia. Antiquity 67: 200–217.
Watts A (1987) Reading the Weather: Modern Techniques for Yachtsmen. New York: Dodd, Mead and Company, pp. 51–53.
Wilmshurst JM, Hunt TL, Lipo CP et al. (2011a) High-precision radiocarbon dating shows recent and rapid initial human colonization of East Polynesia. Proceedings of the National Academy of Sciences 108: 1815–1820.
Wilmshurst JM, Hunt TL, Lipo CP et al. (2011b) Reply to Mul-rooney et al.: Accepting lower precision radiocarbon dates results in longer colonization chronologies for East Polynesia. Proceedings of the National Academy of Sciences 108(23): EE191–EE195.
at OHIO STATE UNIVERSITY LIBRARY on January 14, 2014hol.sagepub.comDownloaded from


![Colonization of India [17th - 19th c.] . 2](https://img.pdfslide.net/doc/110x75/632190a58a1d893baa0d2254/colonization-of-india-17th-19th-c-2.jpg)


