Embed Size (px)
Citation preview

Thèse de doctorat de Sorbonne Université
École doctorale Cerveau Cognition Comportement Spécialité : Neurosciences
Frontal contributions to conscious visual perception through causal manipulation of brain rhythms
Chloé STENGEL
Dirigée par Antoni VALERO-CABRÉ, MD, PhD
Réalisée à l’Institut du Cerveau et de la Moelle épinière.
Membres du jury :
Dr. Til Ole BERGMANN Dr. Laura DUGUE Dr. Vincenzo ROMEI Dr. Rachel SHERRARD Dr. Gregor THUT Dr. Antoni VALERO-CABRÉ
Deutsches Resilienz Zentrum, Mainz Université Paris Descartes Université de Bologne Sorbonne Université Université de Glasgow Sorbonne Université
Examinateur Examinateur Rapporteur Représentante de SU Rapporteur Directeur de thèse


3
ACKNOWLEDGEMENTS
The work presented in this thesis is far too extensive to be the work of a single person. I
would like to thank all who have contributed or who have been alongside me for this adventure.
First, I would like to thank Toni who welcomed me into his team 5 years ago. Thank you
for the trust you placed in me and for all the opportunities to learn, to travel, to meet passionate
researchers that I was given as your student. Your energy and enthusiasm for the research we have
done together pushed me to work harder and better and I am proud of what we accomplished.
A heartfelt thank you as well to Marine, who was my first teacher when I first came into the
lab and knew nothing about EEG or TMS. I hope you can see through the work of this thesis how
far I have come since then and I do believe a large part of everything I now know came from you.
You taught me to be rigorous in everything I do and you continue to be an example of this quality.
I would also like to thank Julià and Tristan, who were always generous with their time and
shared their expertise with me when I had technical questions. Thank you for the precious
feedback you gave me throughout the years and the new ideas you contributed to take our results
even further.
Thank you to Anna, Monica and Fanny also who I may not have gotten to work very closely
with but who have followed my journey and were always here with a smile and an encouraging
word or available for any help I needed.
I would like to thank Marisa Carrasco for inviting me into her lab in NYU for two months
and for offering me a wonderful learning experience, both scientifically and personally. I would
also like to thank all the members of her lab who were so welcoming to me and a particular thank
you to Yong-Jun Lin for his critical feedback on our TMS-EEG data.
Thank you to Gregor Thut and Valentin Wyart for accepting to be part of the committee
following me through the year of my PhD. Thank you for your attentive feedback.
I would also like to thank the members of the jury for my defense: Til Ole Bergmann, Laura
Dugué, Vincenzo Romei, Rachel Sherrard and Gregor Thut for accepting to come review my
work.
Thank you to the foundation Naturalia & Biologia for providing the funding which enabled
me to present my work in international conferences and to visit a partnering lab in NYU.
Thank you to Clara, Chris and, a little bit later, Marcela, the little group of PhD students of
the Frontlab. Thank you Clara for your generosity and your patience. You have helped me so
much either by taking the time to come help me for experiments or simply by being right alongside

4
me as we both experienced the same difficulties and frustrations and we solved them together.
Thank you Chris for your enthusiasm about science and research and for all the philosophical
debates. Your passion for your work was an inspiration. Thank you Marcela for your kindness
and your optimism. You are such a caring person and a single conversation with you is enough to
make anyone feel better after a rough day.
A huge thank you to Hughes who has been a great friend to me ever since my very first year
in the lab as a master student. Yes, you make very strange jokes sometimes but you are amazingly
kind and you have always been there to cheer me on, believing in me and encouraging me to have
ambition in my future as a researcher. I have faith that one day you will be able to start your own
PhD and I am waiting for the day where I will be able to read your thesis!
Thank you to all the students or visiting researcher who passed through the lab throughout
the years, Frederica, Juan, Rocio, Lydia, Justine, Valentin, Roberto, Jeremy, Angelina, Fanny,
Patrick and many others. All of you brought life into the lab and I am very glad to have met each
and every one of you. I must add a very special thank you to those of you who helped me during
my very long experimental sessions, either as pilot subjects or as an additional set of hands to set
up the EEG. Thank you for not minding getting EEG gel all over your hands and clothes and for
hours spent in a damp basement with me!
And thank you to Adrien, who may only have joined the lab a few months before the end
of my PhD, but who has been with me in the lab the whole long months of July and August while
I was writing this thesis. It was a bonding experience!
Enfin, en français, je voudrais remercier mes parents, qui m’ont soutenue pendant toutes
mes études mais qui se sont toujours assurés qu’avant la réussite académique j’étais surtout
heureuse dans ce que je faisais. Une mention particulière pour ma mère et sa ‘pensée positive’
qu’elle a fait marcher en ma faveur plus d’une fois.
Merci à ma sœur qui m’a toujours encouragée à sortir de ma zone de confort, à vouloir plus
et à ne pas avoir peur de saisir de nouvelles opportunités. Je n’aurais pas été aussi ambitieuse dans
mes études sans toi.
Un énorme merci également à Mathilde et Léa qui ont une telle confiance en moi qu’elles
m’ont offert alors que j’avais à peine 20 ans ma propre médaille de prix Nobel, en pâte à modeler,
certes, mais dont je ne suis pas moins fière et qui trône toujours sur ma bibliothèque.

5
TABLE OF CONTENTS
ACKNOWLEDGEMENTS .................................................................................................3
SUMMARY ..........................................................................................................................9
RÉSUMÉ (Français) .......................................................................................................... 13
TABLE OF ABBREVIATIONS ........................................................................................ 17
INTRODUCTION .............................................................................................................. 19
I – Brain oscillations, local and network synchronization and orienting spatial attention ... 19
I.1 – Oscillations and synchronization in network communication and information transfer ...... 20
I.2 – Network synchronization subtending visuo-spatial attention and visual perception ........... 23
II – Manipulation of brain oscillations subtending attentional and visual behaviors ........... 26
II.1 – Non-invasive stimulation techniques to manipulate brain oscillations and synchrony ...... 27
II.1.1 – Rhythmic peripheral sensory stimulation for oscillatory entrainment...................................... 27
II.1.2 – Transcranial brain stimulation technologies for oscillatory entrainment.................................. 28
II.2 – Rhythmic Transcranial Magnetic Stimulation in attentional and visual behaviors ............ 35
II.3 – Rhythmic Transcranial Magnetic Stimulation in neuropsychiatric rehabilitation .............. 37
III – Neural noise, stochastic resonance and the modulation of visual perception .............. 39
III.1 – Cognitive impairments associated to abnormal oscillations and synchrony..................... 40
III.2 – Stochastic Resonance Theory, modulation of neural coding and information processing 42
III.3 – Neural noise and Stochastic Resonance in the modulation of perception ........................ 45
REFERENCES ................................................................................................................. 50
SPECIFIC AIMS ................................................................................................................ 63
GENERAL METHODS ..................................................................................................... 67
I – Behavioral paradigm to assess visual performance....................................................... 68
I.1 – Near-threshold lateralized visual detection paradigm ........................................................ 68
I.2 – Visual target properties, features and titration procedures ................................................. 71
I.3 – Experimental blocks and session organization .................................................................. 74
I.4 – Subjective and objective measures of perception .............................................................. 75
I.5 – Signal Detection Theory and visual performance outcome measures ................................ 76

6
II – Transcranial Magnetic Stimulation ............................................................................. 80
II.1 – Stimulation parameters ................................................................................................... 81
II.2 – Design of rhythmic and random TMS patterns ................................................................ 83
II.3 – Cortical target selection and MRI-based frameless neuronavigation ................................ 87
III – Concurrent TMS-EEG recordings of brain activity ................................................... 88
III.1 – Electromagnetic TMS-EEG artifact removal and data cleaning procedures .................... 89
III.2 – Concurrent TMS-EEG recordings and EEG data pre-processing .................................... 93
III.3 – Control analysis on the TMS-EEG artifact removal and data cleaning procedures .......... 94
III.4 – Outcome measures to assess the impact of TMS on oscillatory activity .......................... 98
III.4.1 – Outcome measures for local oscillatory activity.................................................................... 98
III.4.2 – Outcome measures for inter-regional network synchronization ............................................ 100
III.5 Outcome measures to quantify and characterize noise in EEG datasets ........................... 101
III.5.1. Measures to characterize noise in the time-frequency domain ................................................ 102
III.5.2. Measures to characterize noise in the time domain ................................................................ 105
III.6 – Cluster-based permutation tests for the correction of multiple comparisons .................. 107
REFERENCES ............................................................................................................... 110
PROJECT 1: Causal role of high-beta oscillations in the right fronto-parietal network
for conscious visual detection ........................................................................................... 119
I – Entrainment of local synchrony reveals a causal role for high-beta right frontal
oscillations in human visual consciousness ..................................................................... 119
II – Causal role of high-beta right fronto-parietal synchrony in the modulation of human
conscious visual perception ............................................................................................ 135
PROJECT 2: Exploring unexpected contributions of left frontal neural noise to the
modulation of conscious visual perception in the human brain: a combined TMS-EEG
study .................................................................................................................................. 173
PROJECT 3: Non-specific effects of auditory stimulation generated by transcranial
magnetic stimulation (TMS) on cortical oscillations and visual detection performances
........................................................................................................................................... 227
GENERAL DISCUSSION ............................................................................................... 275
I - Summary of the main results ...................................................................................... 275
II – Frontal and fronto-parietal contributions to the modulation of visual perception ....... 278
II.1 – Interhemispheric asymmetries in top-down systems for the facilitation of visual
performance .......................................................................................................................... 279
II.2 – Methodological limitations of our datasets and experimental approaches ...................... 281
7
II.3 – Modulating visuo-spatial attention and recording conscious visual perception ............... 283
III- Pending questions and some future directions ........................................................... 284
III.1 – Towards an oscillatory model of attentional orienting and perceptual modulation ........ 285
III.2 – Contributions of parietal and occipital cortices to conscious perception ....................... 288
IV- Further considerations .............................................................................................. 290
IV.1 – Unexpected impact of ‘control’ TMS patterns on EEG activity .................................... 291
IV.2 – Network impact and state dependency of frequency-tailored TMS effects ................... 293
V- Conclusion and final remarks .................................................................................... 296
REFERENCES ............................................................................................................... 298

8

9
SUMMARY
Two decades of studies on the role of oscillatory activity and network synchrony have
provided extensive evidence supporting the contribution of these mechanisms to a large variety
of cognitive processes and behaviors. In the domain of visuo-spatial attention, a process that
mediates our ability to focus, select and extract relevant visual information from natural
environments, theoretical and experimental evidence have suggested a role for high-beta phase
synchrony, or the lack thereof, mediating top-down attentional influences on human conscious
visual perception. Such contributions have proven to be site- and network-specific, hence
calling for a systematic exploration of further coding contributions for fronto-parietal nodes in
a bilaterally distributed network with bearing on orientation of attention and perception.
The studies included in the current doctoral dissertation used MRI neuronavigated
Transcranial Magnetic Stimulation (TMS) in either rhythmic patterns designed to entrain high-
beta oscillations or arrhythmic patterns designed to induce different levels of neural noise and
desynchronization. TMS patterns were delivered trial-by-trial to the right and left Frontal Eye
Fields (FEF) while participants carried out a visual detection task, in which they had to report
the presence of lateralized near-threshold Gabors titrated at 50% visibility. In parallel, by means
of concurrent scalp EEG recordings, we aimed to better understand the influence of entrained
oscillations and noise patterns in the generation of frequency-specific synchrony, and ultimately
assess the ability of the probed regions and TMS-coding patterns to modulate conscious access
for near-threshold lateralized visual stimuli.
The INTRODUCTION of this dissertation summarizes the latest knowledge with regards
to the role of oscillations, synchrony and neural noise in the coding, transfer and processing of
information subtending the orienting of spatial attention and the modulation of visual
perception. Complementarily, we also review the features and application of brain stimulation
technologies, and in particular rhythmic TMS, to identify the relevant cortical regions and
characterize the oscillation and synchronization/desynchronization-based coding mechanisms
involved in enabling attentional orienting and the facilitation of conscious perception. The
introduction is completed with a short section presenting the SPECIFIC AIMS, stating the
underlying question pursued by the different studies of the dissertation, including their
relevance, methodological approaches and a priori hypothesis and prediction for outcomes. A

10
detailed section of GENERAL METHODS presents, discusses critically and justifies the choice
of behavioral paradigms, stimulation technologies patterns, experimental designs and EEG
recording, data processing and measures employed in the three sets of studies included in the
dissertation.
The RESULTS section integrates 3 different projects using each time the format of
scientific papers. The two papers included in PROJECT 1 used concurrent rhythmic TMS-EEG
approaches (high-beta 30 Hz rhythmic TMS vs random TMS 4 pulse bursts) to probe the
contribution of the right FEF to conscious visual sensitivity (d’), as measured from the Signal
Detection Theory. They showed that high-beta rhythmic TMS patterns increase local and inter-
regional synchronization in a right lateralized fronto-parietal attentional network. This outcome
supports a causal role for episodic high-beta oscillations entrained prior to target onset in the
facilitation of conscious visual perception, likely via top-down attentional orienting mediated
by the fronto-parietal dorsal attentional network. The paper in PROJECT 2 uses very similar
TMS-EEG approaches, probing the role of the left FEF with TMS patterns similar to those used
previously (high beta 30 Hz rhythmic TMS vs 3 different non-frequency specific TMS 4 pulse
bursts: non-uniform rhythmic, irregular and random patterns) inducing different levels of local
noise during task performance. Our data showed that, in this region, arrhythmic or irregular
patterns of TMS increased neural noise locally and also throughout nodes of the bilateral dorsal
attentional network. None of the tested patterns showed an impact on perceptual sensitivity (d’).
Nonetheless, based on prior evidence collected in our lab for an improvement of visual
sensitivity following arrhythmic TMS bursts, we provide preliminary evidence for a causal
relationship between TMS-induced optimal levels of neural noise and enhancements of
conscious visual perception. Finally, the paper presented in PROJECT 3 explored the impact
of different patterns of TMS-generated sounds sharing a similar temporal structure with the
electromagnetic patterns tested in prior study projects (30 Hz rhythmic sham TMS, random
sham TMS 4 pulse bursts and single sham TMS pulse) on evoked and oscillatory EEG activity
and also conscious visual perception correlates. None of the clicking sound patterns were able
to impact visual sensitivity (d’) neither did they entrain frontal or fronto-parietal oscillations.
Nonetheless, irrespective of TMS pattern type, stimulation phase-locked oscillations in central
contacts and decreased response criterion (c), rendering participants less conservative when
making perceptual decisions.
Taking all studies together, we CONCLUDE that oscillatory and phase-synchrony
contributions to visual perception probed with causal methods were site-, network- and pattern-
specific. To this regard, our TMS-EEG approach attested a potential influence of right frontal

11
(right FEF) high-beta oscillations and fronto-parietal synchronization to conscious visual
perception. In a homotopic left fontal site (left FEF), we obtain preliminary evidence of
‘stochastic-resonance-like’ effects of graded neural noise levels facilitating visual perception,
but further studies will be needed to better pinpoint this finding. Finally, at difference with
active electromagnetic TMS, sham TMS-generated sounds in rhythmic high-beta patterns failed
to entrain rhythmic activity or modulate visual sensitivity. Stimulation wise, concurrent TMS-
EEG recordings demonstrated the ability of some active TMS patterns to modulate, during their
delivery, oscillatory activity and inter-regional cortical synchrony, while other active TMS
patterns proved able to modulate neural noise levels in a TMS pattern-dependent manner. In
the GENERAL DISCUSSION we highlight further interpretations of these results in the wider
context of the existing literature on the anatomical and physiological correlates of spatial
attention and the top-down modulation of visual perception as well as the future technological
advances in the field of non-invasive brain stimulation to manipulate oscillations and synchrony
for fundamental and clinical research.

12

13
RÉSUMÉ (Français)
Deux décennies de recherche sur le rôle de l’activité oscillatoire et de la synchronisation
des réseaux neuronaux ont fourni de nombreuses preuves de la contribution de ces mécanismes
à une grande variété de processus cognitifs et de comportements. Dans le domaine de l'attention
visuo-spatiale, qui est notre capacité à se focaliser, sélectionner et extraire des informations
visuelles pertinentes dans notre environnement naturel, des preuves théoriques et
expérimentales soutiennent le rôle de la synchronie des oscillations neurales à une fréquence
beta-haute (ou de son absence) dans l’attention et la modulation de la perception visuelle
consciente. De telles contributions se sont révélées spécifiques à des sites corticaux et à des
réseaux neuronaux, appelant ainsi à l’exploration systématique des stratégies de codage des
nœuds au sein d'un réseau fronto-pariétal bilatéral de l'attention et de la modulation de la
perception consciente.
Les études incluses dans ce mémoire de thèse doctorale utilisent la Stimulation
Magnétique Transcrânienne (SMT) sous la forme des rafales rythmiques conçues pour entraîner
des oscillations beta-hautes ou arythmiques afin d'induire différents niveaux de bruit neural et
de désynchronisation des rythmes cérébraux. Les rafales de SMT sont délivrées essai-par-essai
sur les champs oculomoteurs frontaux (en anglais, FEF) des hémisphères droit et gauche, tandis
que les participants effectuent une tâche de détection visuelle dans laquelle ils doivent détecter
et localiser à droite ou à gauche la présence d’une cible visuelle au seuil de détection (c’est-à-
dire, adapté en contraste à un taux de visibilité de 50%). En parallèle, au moyen
d’enregistrements d’EEG de surface, nous avons cherché à mieux comprendre l’influence des
oscillations ou du bruit neural entraînés par la SMT sur la génération de la synchronisation
locale ou inter-régionale à une fréquence spécifique, et à évaluer la capacité des régions
cérébrales étudiées et des rafales de SMT à moduler l’accès conscient des stimuli visuels
latéralisés présentés au seuil de visibilité.
L’INTRODUCTION de ce mémoire résume l’état de l’art en ce qui concerne le rôle des
oscillations, de la synchronie et du bruit neural dans le codage, le transfert et le traitement de
l’information sous-tendant l’orientation de l’attention spatiale et la modulation de la perception
visuelle. Par ailleurs, nous détaillons également les caractéristiques et l’application des
technologies de stimulation cérébrale non-invasives, et en particulier de la SMT rythmique,
pour identifier les régions corticales et caractériser les mécanismes de codage basés sur

14
l’activité oscillatoire et la synchronisation/désynchronisation des réseaux impliqués dans
l’orientation de l’attention et la facilitation de la perception consciente. L'introduction est
complétée par une courte section présentant les OBJECTIFS SPÉCIFIQUES, exposant les
questions sous-jacentes poursuivies par les différentes études incluses dans ce mémoire, y
compris leur pertinence, leurs approches méthodologiques et leurs hypothèses et prédictions à
priori. Une section détaillée de MÉTHODES GÉNÉRALES présente, discute de manière
critique et justifie le choix du paradigme comportemental, des technologies et motifs de
stimulation, du design expérimental ainsi que de l’enregistrement, du traitement de données et
des mesures d’analyse d’EEG utilisées dans les trois séries d’études incluses dans ce mémoire.
La section RESULTATS intègre 3 projets différents présentés à chaque fois sous la forme
d’un article scientifique. Les deux articles inclus dans le PROJET 1 utilisent des approches
EEG-SMT rythmiques (rafales de SMT rythmique beta-hautes à 30 Hz versus rafales de SMT
aléatoires de 4 impulsions : non-uniformes-rythmiques, irrégulières et aléatoires) afin
d’explorer la contribution du FEF droit à la sensibilité visuelle consciente (d '), telle que
mesurée par la Théorie de Détection du Signal. Les rafales de SMT rythmiques à une fréquence
beta-haute augmentent la synchronisation locale et inter-régionale sur un réseau attentionnel
fronto-pariétal latéralisé à droite. Ces résultats corroborent le rôle causal des oscillations
épisodiques dans une bande de fréquence beta-haute entraînées avant l’apparition de la cible
dans la facilitation de la perception visuelle consciente, probablement via des effets descendants
de l’attention médiés par le réseau fronto-pariétal dorsal de l’orientation de l’attention. L’étude
du PROJET 2 utilise des approches EEG-SMT très similaires à celles déjà mentionnées, pour
explorer cette fois le rôle du FEF gauche, avec des rafales de SMT périodiques proches de celles
utilisées précédemment (rafales de SMT rythmique à 30 Hz et 3 motifs de rafales de SMT non
spécifiques en fréquence à 4 impulsions) induisant différents niveaux de bruit neural lors de
l'exécution d'une tâche d’accès à la perception consciente. Nos données montrent que, sur cette
région, des rafales non spécifiques en fréquence de SMT augmentent le bruit neural, localement
et également tout au long des nœuds du réseau bilatéral de l’attention. Aucun des motifs de
rafales de SMT délivrées n’a montré d’impact sur la sensibilité perceptuelle (d’). Néanmoins,
selon des résultats antérieurs obtenus dans note laboratoire qui ont montré une amélioration de
la sensibilité visuelle à la suite de rafales de SMT non spécifiques en fréquence, nous
fournissons des preuves préliminaires d'une relation de cause-à-effet entre les niveaux optimaux
de bruit neural induits par la SMT et les améliorations de la perception visuelle consciente.
Enfin, l’étude présentée dans le PROJET 3 examine l’impact de différents types de sons
périodiques générés par les impulsions SMT, avec une structure temporelle similaire aux rafales

15
électromagnétiques testés dans les projets d’études précédentes (rafales SMT placebo
rythmiques à 30 Hz, rafales SMT placebo aléatoires de 4 impulsions et des impulsions uniques
de SMT placebo), sur l'activité EEG évoquée et oscillatoire, ainsi que sur la perception visuelle
consciente. Les rafales sonores ne montrent pas d’impact sur la sensibilité visuelle (d’) ni
aucuns signes électroencéphalographiques d’entrainement oscillatoire frontaux ou fronto-
pariétaux. Néanmoins, quel que soit le type de rafale SMT placebo délivrées, elles ont abouti à
une synchronisation en phase l’activité oscillatoire du cortex auditif et ont diminué le critère de
réponse (c), engendrant des stratégies moins conservatrices lors de la prise de décisions
perceptuelles.
Considérant l’ensemble de nos résultats, nous CONCLUONS que les contributions
oscillatoires ou de la synchronie de réseau sur la perception visuelle consciente étudiées avec
des méthodes causales sont dépendantes du site et réseau stimulé ainsi que de la structure
temporelle de la rafale magnétique. À cet égard, notre approche SMT-EEG a attesté une
influence potentielle des oscillations dans une bande de fréquence beta-haute au niveau du
cortex frontal droit (FEF droit) et la synchronisation fronto-pariétale dans l’hémisphère droit
sur la perception visuelle consciente. Dans la région homotope à gauche (FEF gauche), nous
obtenons des preuves préliminaires d’effets présentant les mêmes propriétés que le phénomène
de résonance stochastique, c’est-à-dire une facilitation de la perception visuelle par des niveaux
de bruit graduels. Cependant, des études supplémentaires sont nécessaires pour identifier et
confirmer les corrélats comportementaux de ce résultat. Enfin, à la différence des rafales de
SMT beta-hautes actives, les rafales sonores rythmiques générées par la SMT placebo ne
parviennent pas à entraîner d'activité neurale rythmique ni à moduler la sensibilité visuelle. En
ce qui concerne la stimulation SMT, le couplage avec des enregistrements EEG nous a permis
de démontrer la capacité de certaines rafales de SMT active à moduler l’activité corticale
oscillatoire et sa synchronisation, tandis que d’autres motifs de rafales de SMT permettent la
modulation du niveau de bruit neural. Dans la DISCUSSION GÉNÉRALE, nous présentons
les interprétations de nos résultats dans le contexte plus large de la littérature existante sur les
bases anatomiques et physiologiques de l'attention spatiale, la modulation de la perception
visuelle consciente et les futurs développements technologiques dans le domaine de la
stimulation cérébrale non invasive afin de manipuler les oscillations cérébrales et la synchronie
à des fins expérimentales ou cliniques.

16

17
TABLE OF ABBREVIATIONS
ASSR Auditory Steady-State Response
cTBS continuous Theta Burst Stimulation
EEG ElectroEncephaloGraphy
EMG ElectroMyoGraphic
ERP Event-Related Potential
FEF Frontal Eye Field
ICA Independent Component Analysis
IPS IntraParietal Sulcus
iTBS intermittent Theta Burst Stimulation
ITC Inter-Trial Coherence
LFP Local Field Potential
MEG MagnetoEncephaloGraphy
MRI Magnetic Resonance Imaging
MSE Multi-Scale Entropy
MT Middle Temporal visual area
NIBS Non-Invasive Brain Stimulation
PCA Principal Component Analysis
PLV Phase-Locking Value
RMT Resting Motor Threshold
rTMS repetitive Transcranial Magnetic Stimulation
SDT Signal Detection Theory
SE Sample Entropy
SLF Superior Longitudinal Fasciculus
SR Stochastic Resonance
SSVEP Steady-State Visual Evoked Potential
tACS transcranial Alternating Current Stimulation
tCS transcranial Current Stimulation
tDCS transcranial Direct Current Stimulation
TMS Transcranial Magnetic Stimulation
tRNS transcranial Random Noise Stimulation

18

19
INTRODUCTION
I – Brain oscillations, local and network synchronization and orienting of spatial attention
Electrophysiological recordings of neural activity at any scale, either
electroencephalographic (EEG) activity from large neuronal assemblies (Berger, 1929), in vivo
local field potentials produced by local neuronal clusters (Gray & Singer, 1989), or in vivo
(Alonso & Llinás, 1989) and in vitro (Draguhn et al., 1998) single-cell voltage changes, reveal
patterns of rhythmic activity which have been referred to as neural oscillations. This
neurophysiological phenomenon is characterized by highly regular, repetitive and synchronous
activity patterns, which ensure the precise timing of neuronal activity, and can operate in a wide
range of frequencies across brain sites and neural circuits.
Oscillations were initially reported as particularly prominent during sleep or in situations
in which consciousness was decreased and neural systems did not seem to be involved in a
specific behavior (Steriade et al. 1994). For this reason, they were considered unrelated to
cognitive processes, and their physiological and behavioral role was long ignored, or considered
an irrelevant by-product or epiphenomenon bearing no role on human behaviors. Two decades
ago however, neural oscillations started to be revisited with renewed interest and since then the
number of studies addressing the role of oscillations in cognitive functions such as memory,
attention or perception has skyrocketed (reviewed in Buzsáki & Draguhn, 2004).
Amongst cognitive functions that have been widely shown to be subtended by oscillatory
activity is attentional orienting in space. Attention is the process by which we select information
in our crowded environment (Desimone & Duncan, 1995). In spite of the high processing power
of the human brain, our senses have a limited capacity to simultaneously uptake information
from the inner and outer environment. To face the challenge of overcrowded environments, to
which we are often exposed, attention acts as a selective filter that allows us to allocate
resources to the most task-relevant stimuli, hence enhance the perception of important inputs
and suppress the perception of irrelevant distractors.
Such core function of attention requires brain systems to be able to segment incoming
inputs and selectively enhance the processing of some of them at the expense of others which

20
are suppressed. A decade ago, a framework was developed by which neural oscillations
synchronized in phase across widely distributed neuronal assemblies connected by white matter
pathways, could subtend these core mechanisms (Fries, 2009).
We will highlight the mechanisms by which neural oscillations could subtend the
orientation of attention, then review empirical evidence supporting a link between this essential
brain function and oscillatory activity and synchronization.
I.1 – Oscillations and synchronization in network communication and
information transfer
Under normal conditions, the brain receives simultaneously a very high number of inputs
from stimuli present in a visual scene. Each of these incoming stimuli will reach and activate
neural assemblies in the early visual cortex. Converging input from several neuronal groups to
common neuronal targets is a common neocortical connectivity motif (Jones & Powell, 1970),
especially in the visual cortex (Salin et al., 1992), hence inputs from competing visual stimuli
present in a given visual environment will converge on similar neural assemblies in higher order
visual areas.
As a result of this organization of input patterns, high level neurons possess wide
receptive fields (Gattass et al., 2005) and, at any moment in time, neuronal assemblies in higher
order visual cortices can receive inputs generated by distinct objects and stimuli present in the
visual field. These circuits assemblies cannot respond to several stimuli at the same time as it
would give rise to a phenomenon that has been called the “curse of confusion through
convergence” (Fries, 2009). To avoid this phenomenon, neural assemblies collecting the
converging inputs from lower visual areas need to be able to segment the inputs into distinct
visual stimuli to then be able to selectively respond to the inputs that correspond to visual
stimuli relevant for the behavior at hand and ignore information from distractor stimuli.
Gamma-band oscillatory synchronization is a well-known mechanism to tackle the so
called “binding problem”, a phenomenon by which a set of individual features are bound
together to build a unified representation of an object (Singer & Gray, 1995). The phase-
synchronization at gamma frequency between several neuronal assemblies serves to strengthen
inter-regional communication and to create a dynamic network processing the same complex
stimulus (Fries, 2005, 2009; Tallon-Baudry & Bertrand, 1999). In a seminal paper, Pascal Fries
(2009) provides a detailed account on how gamma-band synchronization could help individual

21
neurons deal with the above-mentioned functional segmentation of inputs by means of two
mechanisms: feedforward coincidence detection and input gain modulation.
Consider two clusters of neurons entitled ‘A’ and ‘B’ both responding to competing
stimuli in the receptive field of neurons in a cluster entitled as ‘C’. Through a convergence of
connectivity, both A and B sustain structural synaptic connections with neurons in C (Fig. 1A,
left). Hence when two competing stimuli are present in C’s receptive field, both A and B would
fire and send an input to C. However, since A and B are involved in coding for competing
stimuli, C is unable to respond to both inputs. Hence C has to be able to segment inputs from
A and B in order to avoid confusion between the two.
As neurons in cluster A respond to a single object, through the binding by synchronization
mechanism (Singer & Gray, 1995) they will locally synchronize, i.e. progressively phase-lock
their activity at a gamma frequency. When all the neurons in A are synchronized, they will
reach the phase of their oscillation cycle where the excitability of the neurons is maximal
simultaneously and fire within a short time window. All the outputs from neuron group A will
reach the dendrites of cluster C in close succession and, through summation of synaptic input,
will have higher input gain, hence be more likely to depolarize neurons in cluster C. This
phenomenon is called Feedforward Coincidence Detection and it will enable neurons in group
A, when they are locally synchronized, to successfully depolarize C periodically when they
send a volley of outputs at the excitable phase of their oscillation cycle, and hence, to
progressively entrain neuron C to oscillate in a phase-locked manner with neurons in group A
(Fig. 1A, right).
Once A and C are synchronized in phase a second mechanism comes into play to ensure
that possible inputs from other groups of neurons cannot reach C. Indeed, once C is
synchronized with A, its membrane potential oscillates at the same frequency, creating period
of lower (i.e., more negative) transmembrane resting potential levels and therefore low
excitability for neurons and periods of higher (i.e., more positive hence closer to firing
threshold) transmembrane resting potential levels and high excitability. This input gain
modulation provides a neuron in cluster C with the ability to selectively react either more
strongly to inputs incoming in a phase-locked manner during high excitability phases or less
strongly to inputs not synchronized to the rhythms of its oscillation hence coming randomly at
any phase of its oscillation cycle (Fig. 1B). Such input gain mechanism would favor inputs
coming from neural cluster A, which is synchronized with neurons of cluster C, while lowering
the gain of inputs coming from cluster B not synchronized with the latter and therefore coming
randomly at times of high or low excitability (Fig 1A, right).

22
Figure 1. Communication through coherence. (A) Feedforward Coincidence Detection mechanism.
Neuronal clusters ‘A’ and ‘B’ have converging connections to neuronal cluster ‘C’. Through the
Feedforward Coincidence Detection mechanism, neurons in cluster A synchronize in phase with
neurons in cluster C. (B) Input Gain Modulation mechanism. Schematic representation of high (good)
and low (bad) excitability phases for neuronal oscillators of cluster C. Neurons in cluster A are
synchronized with neurons in cluster C so that inputs from neurons in A will always reach neurons in C
during high excitability phases, ensuring a higher gain compared to inputs incoming from neurons in
cluster B who reach neurons C at any phase. (Adapted from Fries, 2009).
This mechanism highlights the biased competition between neurons in group A and B.
Both mechanisms of Feedforward Coincidence Detection, which progressively entrains C with
the neuron group sending it the most synchronized inputs, and Input Gain Modulation, which
renders the input gain in C favorable only to inputs from neurons groups synchronized with it,
create a competition between A and B and only one of these competing neuron groups can
successfully send inputs to C through a winner-take-all mechanism. An exclusive
communication link is established between C and A, excluding inputs from all other competing
neuronal groups connected to C. Biased competition, subtended by inter-neuronal gamma-band
synchronization, is therefore a very effective model to explain the selectivity of attention, that
is its ability to respond to a single set of features in a visual scene containing an infinite number
of stimuli (Desimone & Duncan, 1995; Reynolds et al., 1999).
It is worth noticing that the emerging properties of selective attentional systems
highlighted above emerge from a complex interplay between structural and functional
connectivity. The former is essential to build, through learning and Hebbian rules, complex
receptive fields in higher sensory cortices. The latter, articulated by means of inter-neuronal
gamma-band synchronization, enables a dynamic segmentation of structural connections and a
time and space-specific top-down modulation of visual processing via attention.
23
I.2 – Network synchronization subtending visuo-spatial attention and
visual perception
Empirical evidence developed in the last 20 years supports the theoretical framework
presented above. In favor of the Feedforward Coincidence Detection mechanism, studies in
animal models have shown enhanced local gamma synchronization in visual areas in response
to attended stimuli (Fries et al. 2001; Bichot et al. 2005). There is also evidence supporting the
enhancement of gamma or high beta (25-60 Hz) interregional synchronization between frontal,
parietal and occipital areas either after the presentation of an attended target (Saalmann et al.
2007) or during the orientation of attention in space during a visual search task (Buschman &
Miller, 2007). This evidence supports exclusive communication channels between different
regions of the attentional network through phase synchronization during the orientation of
attention. These findings in animal models have been replicated in healthy human with
EEG/MEG recordings, showing the role of fronto-parietal synchronization at high-beta
frequencies (15-40 Hz) during tasks manipulating attention (Gross et al., 2004; Phillips &
Takeda, 2009) or conscious visual perception, a correlate of attentional orienting (Rodriguez et
al. 1999; Hipp et al. 2011).
To further outline the importance of inter-regional synchronization at beta or gamma
frequencies for cognitive activity, it should be noted that abnormal (enhanced or reduced) levels
of neural synchronization have been shown to be relevant in many pathologies and neural
disorders (Uhlhaas & Singer, 2006). In certain conditions, like in schizophrenia or autism,
reduced gamma synchronization leads to deficits in object binding and perception (Grice et al.,
2001; Uhlhaas et al., 2006). In other conditions, such as post-stroke neglect patients, it is an
abnormally enhanced local beta synchronization that is detrimental for attentional orienting and
perception (Rastelli et al., 2013).
The highlighted evidence enables the characterization of a neural network for the
orientation of attention and the top-down modulation of conscious visual perception as well as
the relevant frequency bands allowing inter-regional synchronization in this network. The
cortical regions of interest highlighted in most anatomical models for this cognitive functions
of attention include the bilateral Frontal Eye Fields (FEF) and Intra Parietal Sulci (IPS) as well
as visual areas in the occipital lobe like the medial-temporal region (MT) or the primary visual
cortex (V1) (Buschman & Miller, 2007; Hipp et al., 2011; Saalmann et al., 2007) (Fig. 2A).

24
Figure 2. Grey and white matter components of the attentional orienting network. (A) Cortical
regions synchronized at high-beta frequency during attentional orientating. In the frontal lobe (1), the
Frontal Eye Fields (FEF); in the posterior parietal Lobe (2), the Intraparietal Sulcus (IPS); in the lateral
occipito-temporal region (3), the middle temporal cortex (MT/V5); in the medial occipital region (4),
the primary visual cortex (V1) (Adapted from Hipp et al. 2011). (B) Anatomical distribution of dorsal
and ventral attention networks. (Adapted from Corbetta et Shulman, 2002). (C) Fronto-parietal
structural white matter connections: the three branches (SLF I, II and III) of the Superior Longitudinal
Fasciculus. (Adapted from Thiebaut de Schotten et al. 2011).
The FEF and IPS, as part of the dorsal attention network, have long been identified as
crucial regions for orienting attention in space (Corbetta and Shulman 2002; Corbetta et al.
2008) (Fig. 2B). Damage in these two regions has been found to be crucial to explain the deficits
and recovery of spatial attention orientating abilities in post stroke neglect patients (Corbetta et
al., 2005). In addition to the isolated activity of both of these regions, anatomical connectivity
between frontal and parietal areas of attentional networks, supported by the three branches of a
white matter tract called the Superior Longitudinal Fasciculus (SLF I, II and III) (Fig. 2C), has
been shown to subtend the deployment of spatial attention in healthy participants (Marshall et
al., 2015; Thiebaut de Schotten et al., 2011). Moreover, the disconnection of this tract can lead
to visuo-spatial attentional deficits in neglect patients (Bartolomeo et al. 2012; Thiebaut de
Schotten et al. 2014).
With regards to the relevant synchronization frequency bands for attention, seminal and
influential work by Buschman and Miller (2007) in non-human primates highlighted rhythmic
activity in the high-beta to gamma range subtending different mechanisms tied to attentional
orienting. More specifically, these authors reported a double dissociation with gamma
oscillations (35-55 Hz) subtending exogenous attentional orienting (e.g. bottom-up or
involuntary) whereas high-beta oscillations (22-34 Hz) underlay endogenous (e.g. top-down or
voluntary) attentional processes. Most studies in non-human primates correlated a broad range

25
of frequencies (from 25 to 90 Hz) to the orientating of spatial attention (Bichot et al., 2005;
Fries et al., 2001; Saalmann et al., 2007). Nonetheless, analogous follow-up studies in humans
reported similar correlations for a narrower range of lower frequency bands (between 15 and
40 Hz), more consistent with high-beta than gamma activity (Gross et al., 2004; Hipp et al.,
2011; Phillips & Takeda, 2009; Rodriguez et al., 1999).
Neural oscillations in lower frequencies bands have been associated to other processes at
play in spatial attention. Local synchronization in the parietal and occipital cortex in the alpha
band is thought to inhibit processing of distractor stimuli (Foxe & Snyder, 2011; Klimesch et
al., 2007; Thut et al., 2006; Worden et al., 2000) and oscillations at alpha (Dugué et al., 2011;
Mathewson et al., 2009, 2011) or theta frequency (Huang et al., 2015; Landau & Fries, 2012;
Landau et al., 2015) could pace the rhythmic sampling of attention, alternating periods of
concentration and periods of shifts of attention. Indeed, a multi-frequency model has been
proposed, which integrates the roles of gamma, beta, alpha and theta oscillations in the
orientation and reorientation of attention (Fiebelkorn & Kastner, 2019). However, none of these
lower frequency oscillations have been associated to inter-regional synchronization and
communication (the contributions of frequency bands outside of gamma and high-beta is
discussed in more detail in the General Discussion).
All the evidence reviewed above lead to the conclusion that synchronization in the fronto-
parietal dorsal attention network at a high-beta frequency is related to the orienting of visuo-
spatial attention and conscious visual perception. However, the studies reviewed so far obtained
their conclusions from correlations between LFPs or EEG recordings and performance
outcomes in attentional and visual perceptual tasks. Consequently, the correlational nature of
this evidence did not allow to establish any causal link between these two phenomena co-
occurring in time, and could not rule out that cortical oscillations and interregional
synchronization patterns were merely epiphenomena, holding no direct contribution to the
neural coding subtending cognitive computations. It was only a decade ago, that a new attempt
to push progress in this field explicitly advocated to move beyond correlations and called for a
need of direct manipulation of rhythmic activity (either to temporally enhance, suppress or
replace it) to unearth causal links between cortical oscillations and the modulation of attentional
and visual behaviors.

26
II – Manipulation of brain oscillations subtending attentional and visual behaviors
Traditional interventions to manipulate brain activity have required animals or human to
be engaged in specific behavioral tasks, while relying on non-invasive technologies to record
their neural activity (fMRI, surface EEG, MEG). Direct causal manipulations of cortical
activity, by means of epidural/intracranially implanted electrodes to perturb brain activity,
could exclusively be performed in animal models or in a very limited set of human patient
populations (such as Parkinson’s, epilepsy, obsessive compulsive disorder, or brain tumor
patients for which the implantation of epidural/intracranial electrodes is justified for diagnostic
or therapeutic purposes).
In this context, the 21st century has seen the development of technological innovations
able to manipulate brain activity in humans without the need of invasive surgery. Currently,
cortical rhythms can be entrained or manipulated experimentally by means of pulsed or
fluctuating sensory stimuli which can influence activity along sensory pathways and reach the
cortex. Alternatively, more recently, the field has seen the development of non-invasive
transcranial brain stimulation techniques: Transcranial Magnetic Stimulation (TMS) and
Transcranial Current Stimulation (tCS) using, respectively, electromagnetic pulses or electrical
current delivered on the scalp that penetrates the skull and can reach the cortical surface to
modulate neural activity.
As indicated above, direct electrical brain stimulation delivered through intracranial
implanted electrodes in patients with medication resistant epilepsy (brief 5-10 second trains of
1, 50 or 60 Hz) to identify seizing foci or deep brain stimulation of the subthalamic nucleus in
Parkinson’s patients (at high frequency, 90-180 Hz) to prevent tremor, bradykinesia or rigidity
provide very interesting opportunities to causally explore the role of oscillations in healthy and
pathological structures of unsound brains (Amengual et al., 2017; Cleary et al., 2012).
Nonetheless, in spite of the high spatial and temporal precision and optimal signal-to-noise ratio
for intracranial stimulation and recordings, implantation schemes are obviously guided by
clinical criteria and hence show considerable variability across patients and provide a very
sparse coverage of the cortex. Non-invasive stimulation methods enjoy much more flexibility
to explore the same phenomena in a wide variety of cortical regions and patient or healthy
subject populations.

27
II.1 – Non-invasive stimulation techniques to manipulate brain oscillations
and synchrony
As summarized above, currently, two main non-invasive approaches have been used to
entrain rhythmic activity in the human brain to improve cognition: (1) peripheral sensory
stimulation, which uses auditory, visual or tactile sensory pulsed or oscillating patterns applied
to peripheral receptors which are conveyed by bottom-up sensory pathways to influence brain
systems and networks; (2) transcranial brain stimulation via magnetic pulses or electrical
current fields targeting a cortical area or circuit directly to influence its activity patterns.
Each of these two approaches have strengths and limitations in terms of focality (spatial
resolution), timing control (temporal resolution), safety, financial cost, ease of use and
portability. The former uses a rather physiological stimulation source which can be made very
selective by capitalizing on the modality-specific (somatotopic, tonotopic and retinotopic)
organization of afferent receptors and pathways. Nonetheless, its effect depends on the integrity
of afferent pathways and these can be modulated (hence dispersed in spatial precision and
attenuated in intensity) at every synaptic step from the peripheral receptor to the receiving
cortical systems and beyond. The latter can directly target any cortical region with a level of
selectivity that depends on the spatial resolution of each technological approach. Nonetheless,
focal approaches (TMS) deliver rather intense electrical currents which are far from
physiological, whereas un-focal methods (tCS) often lack precision and intensity to produce
convincing impact on neurophysiological activity.
Both types of technologies represent unique tools to probe causal links between local and
network-mediated oscillatory synchronization on circumscribed anatomical locations and the
behavioral effects that these patterns might subserve. For this reason, they have been widely
used in the last decade and provided causal evidence for a functional role of cortical oscillations
in coding for cognitive functions.
II.1.1 – Rhythmic peripheral sensory stimulation for oscillatory
entrainment
Peripheral sensory stimulation is based on conveying rhythmic sensory patterns through
the sensory pathways able to reach and influence the activity of cortical systems. Sensory
stimuli (usually auditory, visual or less commonly tactile) that are either pulsed (a transient
stimulus that is presented repeatedly) or continuously oscillating at a fixed specific frequency

28
can be easily applied to peripheral sensory receptors. Conveyed through afferent sensory
pathways, they have been shown to entrain rhythmic activity in the brain within a frequency
band which is dictated by the periodicity of incoming stimuli.
A quite common method for sensory entrainment is the use of a visual flicker, in which
pulsed visual stimuli are rhythmically flashed while steady-state visual evoked potentials
(SSVEPs) from brain systems at the frequency of the flicker (Srinivasan et al., 1999; Vialatte
et al., 2010) are recorded via EEG recordings. Similar procedures have been translated to other
sensory modalities, and auditory stimuli modulated in amplitude or frequency (Galambos et al.
1981; Picton et al. 2003) presented monoaurally or binaurally via headphones or patterns of
rhythmic tactile stimulation applied to skin mechanoreceptors by means of pulsed electrical
stimulation, air puffs or piezo-electrical tactile stimulation devices have been used (Nangini et
al., 2006).
Entrainment through afferent sensory stimulation typically increases local and inter-
regional synchronization at the stimulus frequency in a wide range of brain areas, not limited
to the primary sensory cortices receiving afferent information, but distributed all over the cortex
and extending up to frontal systems (Srinivasan et al. 1999; Srinivasan et al. 2006; Srinivasan
et al. 2007). However, signals have to progress throughout a whole hierarchy of sensory
pathways and synaptic steps before reaching specific cortical regions. Hence this approach
cannot achieve high levels of spatial focality and entrains oscillations in a rather widely
distributed network, including sub-cortical regions (Giraud et al., 2000). Moreover, once in
primary sensory areas, to reach higher-level associative areas (e.g. frontal or prefrontal areas),
input rhythms will need to progress across cortico-cortical relay pathways. Long and multi-
synaptic afferent subcortical and cortico-cortical pathway (which can be influenced or
modulated by other inputs) imply larger time delays and timing variability, making the phase
and amplitude of oscillations entrained at destination uncertain or unstable.
II.1.2 – Transcranial brain stimulation technologies for oscillatory
entrainment
In this specific context, non-invasive brain stimulation (NIBS) technologies able to
directly deliver rhythmic activity to circumscribed regions in the brain and newly entrain
oscillations or modulate ongoing rhythmic activity are called to become very useful tools in
exploratory or therapeutic endeavors. These approaches induce electric currents directly in the
cortex, by-passing sensory cortices, for the entrainment of specific patterns of cortical activity
(see Polanía et al., 2018 and Valero-Cabré et al., 2017 for recent reviews). The two most widely

29
used NIBS techniques to date are Transcranial Current Stimulation (tCS) and Transcranial
Magnetic Stimulation (TMS). These two techniques have very different modes of action and
therefore their own set of advantages and limitations.
II.1.2.1 – Transcranial alternate current stimulation approaches (tACS)
Transcranial Current Stimulation (tCS) is achieved by circulating a low intensity current
(1-2 mA, ~0.06 mA/cm2) between at least two electrodes (an anode and a cathode) placed on
specific regions of the human scalp (Fig. 3A & B). A substantial portion of the circulating
current is generally shunted through the scalp skin (Vöröslakos et al., 2018). Nonetheless part
of it will penetrate across the different tissue layers between the skin and the cortical surface
(i.e., bone outer and inner tables, and the cerebrospinal fluid cumulated in the epidural and
subdural spaces) to reach the pia-mater and spread across rather large cortical areas located
between both electrodes (Miranda et al. 2006).
The current gradients will polarize electrical charges in the extracellular space in a
polarity dependent manner, shifting the resting membrane potential of exposed neurons closer
(anodal stimulation) or away (cathodal stimulation) from their firing thresholds, hence
increasing or decreasing their probability to generate an action potential when receiving
physiological dendritic inputs of sufficient intensity.
If instead of a constant current (tCS modality know as transcranial direct current
stimulation or tDCS), an alternating current (AC) is applied, the resting membrane potential
and consequently the firing rate probability of neurons influenced by the current field will also
fluctuate periodically, following the frequency of the AC signal. This specific modality of tCS
is referred to as transcranial Alternating Current Stimulation (tACS) and has been used to non-
invasively entrain oscillations in cortical regions (Fröhlich & McCormick, 2010; Herrmann et
al., 2013; Merlet et al., 2013).
Although tCS devices delivering either tDCS or tACS are recognized as being portable
and highly affordable compared to TMS (Fig. 3A & C), these technologies possess a rather
poor spatial resolution. Given the diversity of possible electrode montages (particularly when
density tCS approaches based on combination of several return electrodes in complex
configurations are used) and interindividual differences in head anatomical features, it is not
easy to predict how currents applied to the scalp will diffuse transcranially to reach the cortical
surface. Indeed, it is generally accepted that induced brain currents will not remain restricted to
cortical areas beneath the electrodes but will spread (Bikson et al., 2010; Datta et al., 2012).

30
Figure 3. Technical equipment for the delivery of Transcranial Current Stimulation (tCS) and
Transcranial Magnetic Stimulation (TMS). (A) tCS is delivered through a small light and portable
rechargeable battery system and controlled wirelessly from a computer or portable device. Current is
conveyed by short and light physical wires to a montage (at least two, an anode and a cathode) of leads (either
sponge contacts, or solid ferromagnetic leads, see both in the figure) placed in specific scalp locations.
Systems also often integrate independent channels to record EEG signals. (B) The wireless tCS device is
mounted directly on a lycra cap worn by participants while performing a task on a computer screen. A very
mild current will flow between at least two electrodes (active and return) placed in separate locations of the
scalp generating on the brain surface a large polarization gradient able to modulate the resting membrane
potential of exposed neurons. The wireless control of tCS allows full head and possibly body motion. (C)
TMS requires heavy non-portable equipment that charges current in a series of capacitors. From the central
unit, accumulated current is then circulated through a stimulation coil (in the picture a double ¨butterfly¨ 70
mm coil) to generate a brief magnetic field, called a pulse, capable of penetrating through skull tissue layers
and induce a focally distributed electrical current inside of the brain powerful enough to depolarize neurons.
(D) The stimulation coil is placed lying flat on a subject’s head and held manually by an operator, or with
help from a mechanic arm, while the subject is performing a task on a computer screen. TMS can be delivered
in single pulse, short bursts (4 or 5 pulses) or long patterns of repetitive (rTMS) stimulation to modulate
activity in a focal, targeted cortical region. Targeting is monitored throughout the session by means of an
MRI-based neuronavigation system. Note in (D) TMS is delivered while EEG activity is being monitored
through an independent equipment.
31
Moreover, some recent controversy debates if the standard and safe current intensities
commonly used are high enough to reach critical current density levels in the cortex (> 0.5 V/m)
able to shift transmembrane resting potentials and influence local excitability (Lafon et al.,
2017; Vöröslakos et al., 2018; reviewed in Liu et al., 2018). Indeed, to reach meaningful current
density levels, stimulation intensities should be of 4 to 6 mA, higher than the currently
recommended stimulation intensities (Antal et al., 2017). Additionally, to induce a noticeable
behavioral effect, tACS needs to be applied for relatively long periods of several minutes
(Nitsche et al., 2008; Nitsche & Paulus, 2011), hence it lacks the temporal resolution to either
entrain or modulate oscillatory activity at circumscribed time windows during task
performance.
Regardless, thanks to its low cost, excellent safety profile, and ease of use, multichannel
tACS is probably called to become the tool of choice to flexibly modulate local and
interregional synchrony throughout cortical networks in humans. Nonetheless, currently, given
the open debate on its potentially too low intensity, its known low spatial resolution and
ineffectiveness to entrain episodic short lasting oscillations, tACS is not necessarily the most
adapted technology to explore the causal role of cortical oscillations in well-defined anatomical
regions at a specific time window during task performance.
II.1.2.2 – Rhythmic transcranial magnetic stimulation approaches (TMS)
TMS is currently the most established non-invasive technology used to activate clusters
of neurons responsible for specific behaviors within a rather circumscribed cortical area
(estimated ~12-15 mm radius) in healthy humans and patients.
TMS equipment consists in capacitators which charge and store electrical current, which
is then briefly circulated (120 to 250 µs) through a stimulation coil (the most commonly used
are figure-of-eight coils) made of two contiguous loops of copper wire encapsulated in butterfly
shape protective case (Fig. 3C). Following the principles of electromagnetic induction
discovered in 1831 by Michael Faraday, the circulation of the high-intensity current generates
a brief and rapidly changing magnetic field, called a pulse, which distributes perpendicular to
the surface of the TMS coil lying flat on the scalp. Thanks to the electromagnetic induction
phenomenon, the magnetic field penetrates painlessly, and with very little distortion, the skull
bone and the epidural and subdural spaces filled with CSF to reach the cortex under the coil
and induce a current intracranially which will cause the depolarization of clusters of excitable
neurons (Hallett, 2007; Kobayashi & Pascual-Leone, 2003) hosted within a focal area of 12-15
mm radius (see Valero-Cabré et al., 2005 for an estimation in animals models). To achieve its

32
effect, the TMS coil is placed on the scalp region most closely overlying a given cortical target
(i.e. the one enabling the shortest straight path to cortical target) using a frameless stereotaxic
MRI-based neuronavigation system customized to the anatomy of each healthy participant or
patient (Fig. 3D).
Moreover, thanks to its excellent temporal resolution (Hallett, 2007), TMS allows single
pulses or multi-pulse bursts arranged in a great variety of patterns to be used in online trial-by-
trial designs to impact specific time windows during the performance of behavioral tasks (for
recent reviews see Polanía et al., 2018 or Valero-Cabré et al., 2017). Likewise, long patterns of
so called repetitive TMS (or rTMS) can induce, depending on stimulation parameters
(essentially, stimulation frequency, pattern duration and number of pulses, magnetic field
intensity and length of inter-burst intervals), excitatory or inhibitory offline modulations of
neural activity and associated behaviors, which remain transiently active beyond the
discontinuation of pulses.
More interesting for the experimental work presented in this dissertation, either single
pulses or, more efficiently, short episodes of the so-called rhythmic TMS (a modality of rTMS
delivering short bursts of 4-5 regularly spaced TMS pulses) are being used to manipulate
cortical oscillations within a targeted region. The first published precedent using TMS to
manipulate ongoing oscillations used the ability of single isolated TMS pulses to phase-reset
and synchronize local oscillators operating at the so called ‘natural frequency’ of the region.
Such an approach has been applied to induce transient increases of oscillation amplitude in
several cortical regions (Paus et al. 2001; Rosanova et al. 2009; Van Der Werf and Paus 2006).
Some years thereafter, Thut and colleagues (2011a) put forward the notion that cortical
populations of neurons consist in several oscillators, all fluctuating independently at an
identical frequency but with a random phase (Fig. 4A). Given their rather natural
desynchronized state in awake individuals, their summed spatio-temporal activity patterns tend
to cancel off, and scalp EEG or MEG recordings prove unable to reveal clear signs of
oscillations with a meaningful amplitude or increases of oscillatory power density in time-
frequency analyses.
However, when rhythmic activity from different local oscillators is phase-locked, the
amplitude of oscillatory activity at the level of the neuronal assembly increases by summation
(instead of cancelling off) allowing the emergence of cortical oscillations visible in scalp EEG
or MEG recordings. Single TMS pulses are the simplest stimulation pattern able to phase-lock
ongoing un-synchronized oscillatory activity in local circuits. They act as an external force

33
Figure 4. Mechanisms of oscillatory entrainment by periodical TMS pulses. (A) Schematic drawing
of an independent neural oscillator fluctuating naturally at the so called ‘natural frequency’. � labels the
phase of the oscillation. (B) Schematic representation of three oscillators operating with a similar
frequency. In physiological conditions these oscillators each have their own temporal dynamics and are
not phase synchronized. A periodic external force, exerted by series of single TMS pulses (n=11 pulses
in the figure) repeated rhythmically at a given frequency phase resets the cycles of the different units
within each oscillator type, hence progressively phase-locking (i.e., synchronizing) their rhythms,
making them fluctuate jointly. (C) As result of such a progressive synchronization of local oscillators,
in-phase rhythms will sum up in time and space, increasing the so-called inter-trial coherence (ITC).
Scalp EEG electrodes will record the emergence of cortical oscillations of higher amplitude hence
showing higher levels of power density. (Figure extracted From Thut et al. 2011a).

34
that resets the phase of ongoing oscillators, transiently phase-locking their temporal dynamics,
hence increasing for very few cycles, by amplitude summation, the power of the so called
‘intrinsic’ or ‘natural’ frequency at which these oscillators normally fluctuate (Fig. 4B).
Although TMS pulses are often seen as alien perturbation phenomena that, by artificially
depolarizing neurons, may interfere with their normal coding and behavioural contributions, in
the context of the depolarisation of natural oscillators they can also be conceived as low energy
stimuli able to enhance, in a specific cortical area, the power of frequency-specific oscillatory
activity restricted to the ‘natural’ frequency of the stimulated area, hence respecting the
‘intrinsic’ rhythmic activity developed by local circuits.
The phase-reset and phase locking power of single pulses was confirmed experimentally
(Rosanova et al., 2009). More specifically, single TMS pulses induced differential increases of
oscillatory activity at specific frequency bands, depending on the stimulated cortical-region and
similar to the most predominant rhythm at rest. Indeed, single pulses delivered over the occipital
cortex (Brodmann Area 19) generated power increases around 11 Hz, in the alpha band which
is well known for its role in visual processing, (Klimesch et al., 2007; Sauseng et al., 2005;
Thut et al., 2006; Worden et al., 2000). TMS over posterior and superior parietal regions
(Brodmann Area 7) selectively enhanced beta oscillatory activity with a peak at 20 Hz. Finally,
frontal stimulation (Brodmann Area 6) induced broader-band effects increasing high-beta and
gamma oscillatory activity around a 31Hz peak.
Although single pulses could be used to entrain natural oscillations, they are short-lasting
and of low amplitude (Van Der Werf & Paus, 2006). Moreover entrainment is limited to the
frequencies operating ‘naturally’, hence difficult to manipulate in exploratory or clinical
applications. In an attempt to induce more robust oscillatory entrainment patterns by
capitalizing on the phase-locking ability of TMS pulses, rhythmic TMS bursts aligning trains
of pulses delivered at a frequency of choice have been developed. These consist in short bursts
of pulses (usually 4-5) regularly spaced in time to emulate the periodicity of oscillators in the
stimulated regions. As the inter-pulse interval of the burst is tailored to fit a full cycle of a local
‘intrinsic’ oscillator, each consecutive pulse in the burst will be delivered at the same phase of
the oscillation we intend to entrain. The accrual of individual pulses within the burst will
progressively phase-reset and phase-lock more and more oscillators, leading to a gradual build-
up of a TMS entrained frequency in the targeted cortex (Fig. 4B and C).
Interleaving rhythmic TMS with EEG recordings, Thut et al. (2011b) were able to show
the effect of 5 pulse TMS bursts delivered to the Intraparietal Sulcus (IPS) at a 10 Hz frequency
(‘naturally’ present in this posterior and superior parietal area) resulting in increases of alpha

35
oscillations power. The amplitude of this oscillation grew progressively higher during the burst
and remained increased for a brief time after the 5th or last pulse of the burst (around one to two
cycles, ~150 ms). This seminal paper established the ability of rhythmic TMS to entrain
oscillations at a specific frequency dictated by burst frequency and showed that entrainment
was particularly effective in boosting ‘natural’ or ‘intrinsic’ frequencies at which local
oscillators tended to fluctuate.
Since its inception, rhythmic TMS has been used in a variety of brain regions to probe
the causal role of frequency-specific rhythmic activity on cognitive processes and behavior.
Thut et al. (2011b) stimulated participant’s brain at rest, i.e., not engaged in any specific task,
hence were not able to report any effect of rhythmic TMS and oscillation manipulation on
behavior. However, subsequent studies developed further uses of rhythmic TMS to provide
evidence for a causal role of cortical oscillations in cognitive functions as varied as short-term
memory (Sauseng et al., 2009), visual attention (Capotosto et al. 2009, 2012, 2015) or the
modulation of visual perception (Chanes et al., 2013; Jaegle & Ro, 2014; Romei et al., 2010;
Romei et al., 2011).
II.2 – Rhythmic Transcranial Magnetic Stimulation in attentional and
visual behaviors
The emergence of rhythmic TMS patterns to manipulate cortical oscillations set the stage
to add causal evidence to correlational outcomes linking oscillations, attentional orienting and
perceptual modulations (see Section I of this introduction). Rhythmic TMS bursts delivered
online during visual detection tasks confirmed a well-documented (Dugué et al., 201;
Mathewson et al., 2009; Thut et al., 2006; van Dijk et al., 2008) role of occipital and parietal
alpha oscillations (Romei et al. 2010) and the preferred posterior parietal alpha phase (Jaegle
& Ro, 2014) in the modulation of visual detection. This same approach revealed a double
dissociation between the role of theta and beta frequencies over the intraparietal sulcus for the
perception of global vs. local object features (Romei et al. 2011) previously identified in a
correlational study (Smith et al. 2006).
Extending a prior study using single-pulse TMS to prove the causal role of the right FEF
in conscious visual detection (Chanes et al., 2012), our team used rhythmic TMS in humans to
explore prior correlational intracranial EEG evidence from monkeys highlighting the
multiplexing of high-beta vs. gamma rhythms across the same fronto-parietal network to
engage endogenous vs. exogenous orienting of attention (Buschman & Miller, 2007) or other

36
correlational evidence in the human brain for a role of fronto-parietal high-beta synchronization
in attention and conscious visual perception (Gross et al., 2004; Hipp et al., 2011; Phillips &
Takeda, 2009).
Work by our lab employed trial-by-trial bursts of rhythmic TMS at two distinct
frequencies (30 Hz vs. 50 Hz) delivered on the right FEF while participants performed a near-
threshold visual detection task (Chanes et al., 2013). The results confirmed in humans previous
correlational monkey work (Buschman & Miller, 2007) exploring the roles for high-beta and
gamma band activity in an homologue frontal cortical region, the right FEF, and revealed that
the episodic entrainment of these frequencies prior to target onset modulated different aspect
of a conscious perception paradigm; gamma entrainment (active vs sham 4 TMS pulses at 50
Hz, compared to a non-uniform fixed pattern) decreased response bias (rendering participants
less conservative in indicating they had seen a target when in doubt) whereas high-beta
oscillations (active vs sham 4 TMS pulses at 30 Hz compared to a non-uniform fixed pattern)
increased visual sensitivity (i.e., boosted the capacity to differentiate the presence of a visual
target compared to a no-target noise condition).
Given the long-proven network distribution of focally applied TMS effects (Chouinard et
al., 2003; Paus et al., 1997; Valero-Cabré et al., 2005), modulations of cortical activity by TMS
cannot be reasonably expected to stay confined to the targeted region. As no brain region works
in isolation, but rather as nodes linked to complex systems, TMS induced activity spreads to
other associated network sites depending on the richness and strength of the connectivity.
Consequently, a single pulse delivered focally on a cortical region will phase-reset local
oscillators and increase the amplitude of rhythmic activity in sites distant from the TMS target
region (Rosanova et al., 2009). Similarly, rhythmic TMS delivered to frontal regions such as
the FEF could have an effect on the topography of synchronization/desynchronization of alpha
activity recorded in parieto-occipital areas (Capotosto et al., 2009).
Therefore, local rhythmic TMS can be used to probe a causal contribution of frequency
specific cortical oscillations to a task, nonetheless, their use with concurrent mapping
technologies sensitive to neural spatio-temporal dynamics such as EEG can serve to monitor its
influence on extended neural systems the stimulated region is part of. To this regard, two TMS
behavioral studies analyzed individual diffusion imaging tractography datasets (Quentin et al.,
2014, 2015) and reported significant correlations between the facilitatory impact of high-beta
right frontal rhythmic TMS stimulation on conscious visual detection and white matter
connectivity estimates of the 1st branch of the right superior Longitudinal Fasciculus (SLF),

37
linking the FEF and the Intraparietal Sulcus (IPS) and subtending the dorsal attentional network
(Thiebaut de Schotten et al., 2011).
In conclusion, converging with correlational evidence in monkeys and humans, EEG
experiments and theoretical models of oscillatory perturbations, rhythmic TMS has
demonstrated an ability to manipulate cortical oscillations. Such effects have been proven to be
TMS-frequency dependent, to primarily enhance power of intrinsic frequencies in the tested
area, and active during pulse delivery but short lasting thereafter (no longer than two cycles).
Moreover, in the attentional and visual domain, TMS alone or in conjunction with concurrent
EEG recordings has been paramount to explore the causal role of episodic high-beta and gamma
right frontal rhythms to enable visuo-spatial orienting leading to visual detection improvements.
Further research using similar causal interventional approach will help build a more
comprehensive picture of how other brain regions and frequency bands might contribute to the
modulation of attention and visual perception in healthy humans. In parallel, an emerging
research field is attempting the translation of oscillatory manipulation principles to effective
treatments for the rehabilitation of cognition in human neurological patients.
II.3 – Rhythmic Transcranial Magnetic Stimulation in neuropsychiatric
rehabilitation
Beyond their use in experimental science to probe causal relationships in the brain, non-
invasive stimulation approaches have shown promise as treatments for patients with altered
cognition. Brief rhythmic TMS bursts applied for exploratory purposes induced short-lasting
effects that are essentially restricted to the duration of the stimulation train (and one to two
cycles beyond for the frequency of interest). This limitation makes them suited for trial-by-trial
exploratory studies in cognition, operating episodically in relatively shorty time windows prior
or during task events, on the other hand it does not enable longer-lasting modulations of neural
rhythms that could be used for therapeutic purposes. It remains, however, controversial if the
use of long TMS stimulation patterns may be able to operate beyond the discontinuation of the
stimulation trains and modulate ongoing oscillations or network synchrony in a way that can
be predicted according to input parameters (reviewed in Polanía et al., 2018; Valero-Cabré et
al., 2017). Such longer lasting effects are paramount to support future uses of rhythmic TMS
stimulation to correct cognitive symptoms linked to abnormal oscillations or synchrony patterns
in the context of neuropsychiatric diseases.

38
Repetitive TMS (or rTMS), consisting in series of pulses or bursts tested in a wide range
of low or high frequencies (usually conventional rTMS at 1, 3, 5, 10 or 20 Hz, or patterned
TMS such as continuous (cTBS) or intermittent (iTBS) theta burst, which consists in bursts of
3 pulses at 50 Hz repeated every 200 ms, i.e. at 5 Hz, for longer periods of time, from 30 seconds
to 30 min) have been shown to lastingly modulate measures of motor cortico-spinal excitability
(Gangitano et al., 2002; Huang et al., 2005; Maeda et al., 2000; Pascual-Leone et al., 1994),
visual evoked potentials (Aydin-Abidin et al., 2006; Thut et al., 2003) and, most relevant for
this thesis, offline cortical oscillatory activity (Chen et al., 2003; Schindler et al., 2008; Strens
et al., 2002; Thut et al., 2003; Woźniak-Kwaśniewska et al., 2014).
Generally speaking, neurophysiological offline or after-effects have been proven to last
for up to 30 min (see Thut & Pascual-Leone, 2009 for a review), depending on stimulation site
and TMS pattern specification (frequency, type, number of pulses or bursts, duration etc.). For
conventional rTMS (pure frequencies between 1 to 20 Hz), a commonly applied rule of thumb
has established that after-effects are effective for a period of time which is ~50% of the pattern
duration. Patterned TMS (cTBS and iTBS) have been found to induce long lasting after-effects
of 20 to 60 minutes, after a pattern lasting 20-190 seconds in the cortico-spinal tract (Huang et
al., 2005). The accrual of rTMS daily sessions repeated at intervals of <24 hours showed a
potential to induce even longer-lasting effects (Bäumer et al., 2003; Maeda et al., 2000) and
backed up promises of therapeutically meaningful outcomes in neuropsychiatric diseases.
Stimulation regimes based on daily rTMS sessions protocols tested in multicentric
clinical trials have been approved by the US Food and Drug Administration (FDA) to treat
medication-resistant depression (George et al., 2010; O’Reardon et al., 2007), which is one of
the most clinically established application for rTMS. Likewise, pre-clinical and clinical rTMS
studies are currently being conducted for the treatment of Obsessive-Compulsive Disorder
(Dunlop et al., 2016) or positive symptoms of schizophrenia such as auditory verbal
hallucinations (reviewed in Thomas et al., 2016, see Thomas et al., 2019).
Additional neuropsychiatric conditions or symptoms in which rTMS is being tested in
clinical trials include, in order of relevance: post stroke rehabilitation (motor paralysis and
spasticity, aphasia, attentional awareness disorders, hemianopsia and scotoma), tinnitus, pain,
movement disorders (dystonia, essential tremor and Parkinson disease), neurodegenerative
conditions such as Alzheimer disease or semantic dementia (memory, language, executive and
spatial deficits), anxiety disorders, substance abuse, disorders of consciousness and epilepsy
(see Lefaucheur et al., 2014 for an extensive review).

39
With the exception of Parkinson’s tremor and post-stroke hemineglect and hemianopsia,
rTMS therapeutic regimes are still far from considering strategies that target focal or network-
wide oscillatory and synchrony abnormalities. This situation could be explained by the need
for more solid and detailed evidence (i.e., networks, regions, frequency bands, time-windows
and underlying mechanisms) on oscillatory and synchrony contributions to normal cognition
and their potential role in the physiopathology of neuropsychiatric symptoms. Additionally,
skepticism about the efficacy of current non-invasive brain stimulation technologies (such as
rTMS or tACS) to modulate brain oscillations and associated behaviors in a predictable manner
are slowing down developments and dampening enthusiasm.
Work focused on a human cognitive system with relatively well-established
physiological, anatomical and behavioral bases, subtended by cortical sites accessible to
transcranial brain stimulation, and pursuing a thorough causal characterization of contributing
oscillatory coding processes and their manipulation becomes paramount for the field. To this
regard, by probing and extending existing knowledge on fronto-parietal attentional systems and
further exploring their role in the modulation of visual perception (a behavior which is easy to
characterize and quantify), with an emphasis on its oscillatory basis, we will pave the way to
devise novel non-invasive stimulation treatment strategies that rehabilitate spatial attentional
and visual disorders in neurological patients. Then, on the basis of the lessons learned, similar
approaches and rationales can be progressively extended to other cognitive functions and their
dysfunctions.
III – Neural noise, stochastic resonance and the modulation of visual perception
In prior sections of this introduction, we have extensively reviewed existing evidence
supporting a behavior-specific role of local oscillatory activity and interregional synchrony;
with a special focus on anatomical systems and frequency-specific coding strategies subtending
attentional orienting and perception. We have highlighted (and shown experimental evidence
of) how the emergence of frequency-specific oscillations, a highly predictable, regular and
synchronous fluctuation of activity, enabled a most efficient processing of top-down attentional
allocation or bottom-up saliency, facilitating perception (Fries, 2005, 2009; Singer & Gray,
1995; Tallon-Baudry & Bertrand, 1999).

40
Despite such a strong focus in brain oscillations and network synchrony as one of the
fundamental pillars of neural coding, research has also inquired about the potential role of
neural noise (i.e. a highly random and unpredictable neural signal) in the modulation of
cognitive processing leading to specific behaviors. One of the most influent concepts to this
regard lies at the core of the so-called Stochastic Resonance Theory. This well-established
framework in signal processing has theorized and shown experimentally that the addition of an
optimal level of sensory noise (i.e., not too high, not too low) to a weak signal can unexpectedly
enhance stimulus saliency hence its ability to be perceived (detected or discriminated) instead
of blurring it.
To this regard, regular frequency-specific oscillations and neural noise, two different and
in some ways opposite patterns of cortical activity produced by joint or segregated neural
systems, may both be called to show a complementary role in neural coding strategies, through
different mechanisms, and contribute together to the modulation of local and network
synchronization events. Some indirect hints challenging the notion that increases of oscillation
power or synchrony is necessarily favorable to efficient coding of cognitive operations and
ultimately lead to better performance can be found in neuropsychiatric diseases. This evidence
would leave some room for neural models of cognitive coding in which systems generating
controlled levels of random neural noise would be as important as local and long-range neural
networks able to generate episodic brain rhythms.
III.1 – Cognitive impairments associated to abnormal oscillations and
synchrony
The evidence reviewed in the preceding sections of this introduction seems to strongly
support the notion that the lack of cortical oscillations are in general considered to cause
pathological states and explain cognitive impairment (Grice et al., 2001; Uhlhaas et al., 2006).
Nonetheless, neurophysiological evidence in well-known neuropsychiatric diseases also
suggest a detrimental role for cortical oscillations or excessive frequency-specific synchrony.
For example, in Parkinson patients an excess of high-beta synchronization in cortical motor
system and basal ganglia loops slows movements and increases rigidity (Witcher et al., 2014).
In epilepsy, abnormally high levels of local gamma synchronization often precedes the onset
of a seizure, whereas generalized epilepsy can be characterized by very high levels of gamma
synchronization throughout large cortical regions, leading to impaired behavior and loss of
consciousness (Uhlhaas & Singer, 2006). Therefore, although synchronization subtends the
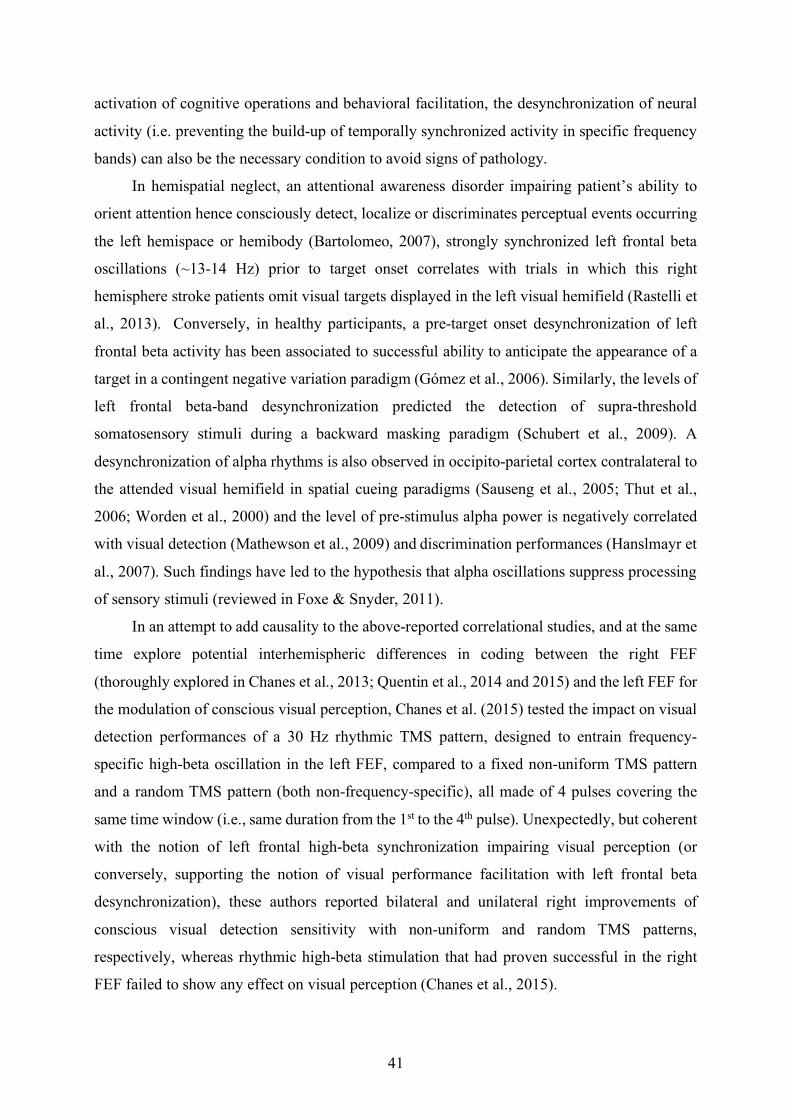
41
activation of cognitive operations and behavioral facilitation, the desynchronization of neural
activity (i.e. preventing the build-up of temporally synchronized activity in specific frequency
bands) can also be the necessary condition to avoid signs of pathology.
In hemispatial neglect, an attentional awareness disorder impairing patient’s ability to
orient attention hence consciously detect, localize or discriminates perceptual events occurring
the left hemispace or hemibody (Bartolomeo, 2007), strongly synchronized left frontal beta
oscillations (~13-14 Hz) prior to target onset correlates with trials in which this right
hemisphere stroke patients omit visual targets displayed in the left visual hemifield (Rastelli et
al., 2013). Conversely, in healthy participants, a pre-target onset desynchronization of left
frontal beta activity has been associated to successful ability to anticipate the appearance of a
target in a contingent negative variation paradigm (Gómez et al., 2006). Similarly, the levels of
left frontal beta-band desynchronization predicted the detection of supra-threshold
somatosensory stimuli during a backward masking paradigm (Schubert et al., 2009). A
desynchronization of alpha rhythms is also observed in occipito-parietal cortex contralateral to
the attended visual hemifield in spatial cueing paradigms (Sauseng et al., 2005; Thut et al.,
2006; Worden et al., 2000) and the level of pre-stimulus alpha power is negatively correlated
with visual detection (Mathewson et al., 2009) and discrimination performances (Hanslmayr et
al., 2007). Such findings have led to the hypothesis that alpha oscillations suppress processing
of sensory stimuli (reviewed in Foxe & Snyder, 2011).
In an attempt to add causality to the above-reported correlational studies, and at the same
time explore potential interhemispheric differences in coding between the right FEF
(thoroughly explored in Chanes et al., 2013; Quentin et al., 2014 and 2015) and the left FEF for
the modulation of conscious visual perception, Chanes et al. (2015) tested the impact on visual
detection performances of a 30 Hz rhythmic TMS pattern, designed to entrain frequency-
specific high-beta oscillation in the left FEF, compared to a fixed non-uniform TMS pattern
and a random TMS pattern (both non-frequency-specific), all made of 4 pulses covering the
same time window (i.e., same duration from the 1st to the 4th pulse). Unexpectedly, but coherent
with the notion of left frontal high-beta synchronization impairing visual perception (or
conversely, supporting the notion of visual performance facilitation with left frontal beta
desynchronization), these authors reported bilateral and unilateral right improvements of
conscious visual detection sensitivity with non-uniform and random TMS patterns,
respectively, whereas rhythmic high-beta stimulation that had proven successful in the right
FEF failed to show any effect on visual perception (Chanes et al., 2015).

42
This outcome nuanced prior conclusions on the causal proven beneficial role of high-beta
and gamma oscillations in attentional orienting and conscious visual perception. More
specifically, it suggested for the first time that disabling the build-up of high-beta left frontal
rhythms with TMS patterns that either entrained mixed or random frequencies on each trial (but
never a pure 30 Hz rhythm) facilitated conscious visual performance. Most importantly, it
pointed to a potential interhemispheric asymmetry in coding strategies between the left and
right fontal nodes (left and right FEF) as key regions of a bi-hemispheric fronto-parietal
network (Corbetta et al., 2005) devoted to the orientation of spatial attention activated prior to
target onset. Within such a complex system, oscillatory activity and desynchronization via the
injection of noisy patterns may engage within a bi-hemispheric network complementary
mechanisms facilitating pre-target attentional processing.
III.2 – Stochastic Resonance Theory, modulation of neural coding and
information processing
How may the addition to the brain of pulsed electromagnetic noise inducing cortical
neurons to fire asynchronously improve neural processing and behavior? The most currently
plausible answer comes from the domain of physics. In nonlinear systems (i.e. a system whose
output is not proportional to the strength of the inputs it receives), a phenomenon referred to as
‘threshold Stochastic Resonance’ (or threshold SR) occurs where the addition of controlled
levels of noise to a signal can enhance the detection of weak stimuli (Moss et al. 2004). Neurons
are nonlinear systems as they will trigger an action potential (which can be recorded
electrophysiologically as a single cell potential or a spike) following an ‘all-or-none rule’,
whereby only if the trans-membrane resting potential exceeds a specific voltage threshold the
cell depolarizes producing a spike or a burst of spikes.
With regular extracellular electrophysiological recordings, in such system, variations of
membrane potential can only be monitored by following the sequence of triggered spikes. If
the resting trans-membrane potential remains at subthreshold voltage levels, any voltage
fluctuations below that threshold will remain invisible to our recordings. The addition of
electrical noise to this system increases the volatility of the membrane potential and, when the
potential becomes positive and nears the threshold, it may stochastically (i.e. randomly) ‘push’
the transmembrane resting potential to reach and overpass the depolarization threshold, so that
high values of membrane potentials will finally manifest electrophysiologically as a spike or a
spike burst, reflecting a transient state of high neuronal excitability.
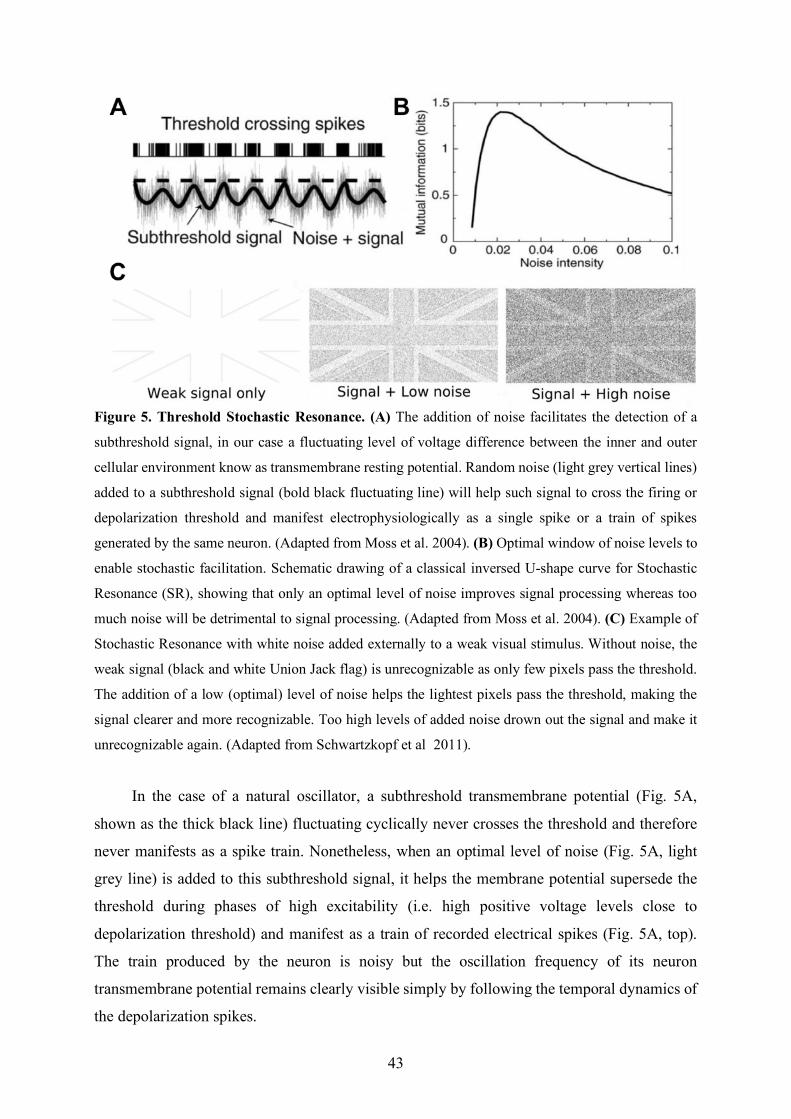
43
Figure 5. Threshold Stochastic Resonance. (A) The addition of noise facilitates the detection of a
subthreshold signal, in our case a fluctuating level of voltage difference between the inner and outer
cellular environment know as transmembrane resting potential. Random noise (light grey vertical lines)
added to a subthreshold signal (bold black fluctuating line) will help such signal to cross the firing or
depolarization threshold and manifest electrophysiologically as a single spike or a train of spikes
generated by the same neuron. (Adapted from Moss et al. 2004). (B) Optimal window of noise levels to
enable stochastic facilitation. Schematic drawing of a classical inversed U-shape curve for Stochastic
Resonance (SR), showing that only an optimal level of noise improves signal processing whereas too
much noise will be detrimental to signal processing. (Adapted from Moss et al. 2004). (C) Example of
Stochastic Resonance with white noise added externally to a weak visual stimulus. Without noise, the
weak signal (black and white Union Jack flag) is unrecognizable as only few pixels pass the threshold.
The addition of a low (optimal) level of noise helps the lightest pixels pass the threshold, making the
signal clearer and more recognizable. Too high levels of added noise drown out the signal and make it
unrecognizable again. (Adapted from Schwartzkopf et al 2011).
In the case of a natural oscillator, a subthreshold transmembrane potential (Fig. 5A,
shown as the thick black line) fluctuating cyclically never crosses the threshold and therefore
never manifests as a spike train. Nonetheless, when an optimal level of noise (Fig. 5A, light
grey line) is added to this subthreshold signal, it helps the membrane potential supersede the
threshold during phases of high excitability (i.e. high positive voltage levels close to
depolarization threshold) and manifest as a train of recorded electrical spikes (Fig. 5A, top).
The train produced by the neuron is noisy but the oscillation frequency of its neuron
transmembrane potential remains clearly visible simply by following the temporal dynamics of
the depolarization spikes.

44
In order for the Stochastic Resonance phenomenon to facilitate the detection of a given
signal (in our case, electrical fluctuations linked to neuronal activity), the magnitude of the
injected noise (electrical current inducing a voltage change in resting transmembrane
potentials) needs to be high enough so that when added up in time and space to the subthreshold
levels, the signal plus noise crosses the ‘visibility’ threshold (in our case neuronal firing
threshold).
However, if the intensity of the added noise is too high, it will cause the neuron to spike
at random times, blurring the regularly fluctuating temporal structure of the generated spike
trains. As the quality of the information contained in the spike train deteriorates, any
subthreshold variations of transmembrane resting potential will become invisible. For this
reason, the stochastic resonance phenomenon requires to identify the level of noise that
maximizes the mutual information (i.e. the amount of information that can be gained about one
variable through the observation of another variable) between spike train dynamics generated
by injected noise alone and the one generated when combining subthreshold neural signals and
injected noise (Fig. 5B & C).
Stochastic Resonance is a very robust phenomenon that has been shown to occur with
signal and noise of different types and sources (e.g. pixels within a low contrast image or sounds
during a low volume phone conversation), hence manipulated at will to enhance the salience of
weak signals making them more easy to be processed in image processing or
telecommunications engineering.
In the brain, electrical neural noise is ubiquitous in local and extended circuits. At each
level across signal transduction in the neuron and synaptic transmission between pre- and
postsynaptic neurons, noise is injected into the system (see Faisal et al. 2008 for a review).
More specifically, the (1) opening/closing dynamics of ion channels in neuronal membrane
(dendrites spines, axons or terminal boutons) (White et al. 2000); (2) variability in the amplitude
of the postsynaptic currents generated by stereotyped action potentials; (3) variation in the
neurotransmitter concentration released by the terminal bouton; (4) the neurotransmitters’
diffusion across the synaptic cleft; and (5) the fluctuations in the density of post-synaptic
receptors associated to ion channels are all phenomena affected by stochastic variability and
susceptible to generate noise. Moreover, the sources of noise generated by stochastic dynamics
at each level will sum up across individual neurons to then be further accrued depending on the
connectivity patterns of the neuronal network (Faisal et al., 2008).
Such a high level of cumulated noise has long been thought as be detrimental to
information processing (Shannon, 1948). In response, research in this domain has been

45
traditionally directed to identify the mechanisms by which brain systems limited neural noise
and gained in efficiency, for example by averaging redundant information or, in sensory
processing, relying on prior knowledge about the natural world to discriminate between signal
and noise (see Faisal et al., 2008 for a review). However, the Stochastic Resonance framework
postulates that neural noise is not an accidental byproduct of neural activity flowing across
networks that is potentially harmful to signal processing, but when dosed adequately, rather an
essential ingredient of efficient signal transmission and processing. A growing body of
experimental evidence is now supporting this same notion and suggesting an active
physiological role for noise generation systems in neural processing.
III.3 – Neural noise and Stochastic Resonance in the modulation of
perception
In a wide variety of organisms, from invertebrate to mammals, individual cells have
evolved a capacity to use external sources of noise to improve signal processing, following the
principles of Stochastic Resonance (SR). The transduction of bioelectrical signals through
membrane ion channels can be improved with a noisy electric field applied to the cell membrane
(Bezrukov & Vodyanoy, 1995). In peripheral sensory systems, sources of noise, whether
naturally present in sensory systems such as Brownian motion of hair bundles in the cochlea
(Jaramillo & Wiesenfeld, 1998), or added experimentally (Collins et al. 1996; Cordo et al. 1996;
Douglass et al. 1993) have been found essential for neurons to respond to weak afferent sensory
stimuli. At the behavioral level, it has also been repeatedly demonstrated that optimal levels of
random noise added to weak visual (Simonotto et al., 1997), auditory (Zeng et al. 2000) or
tactile (Collins et al. 1996; Iliopoulos et al. 2014) stimuli, increase the signal saliency and
detectability. Detection improvements have been found to follow an inverted U-curve across
noise intensity, suggesting as the SR theory postulates, that only accurately dosed levels of
noise can boost the identification of weak signals. Indeed, increasing or decreasing noise levels
outside of such ideal window or the addition of an optimal level of external noise to supra-
threshold stimuli leads to a deterioration of the signal and decreasing perceptual sensitivity
(Iliopoulos et al. 2014; Manjarrez et al. 2007). Moreover, across participants, optimal levels of
noise required to maximize sensory sensitivity are quite variable and need to be individually
customized (Groen and Wenderoth 2016; Iliopoulos et al. 2014; Kitajo et al. 2003).
Investigations of SR effect in human cognition have pinpointed where in our nervous
systems this phenomenon may become crucial for coding and transmission. Although SR is at

46
play in sensory receptor and afferent peripheral systems, the same phenomenon operates in
neurons and networks of the central nervous system. Evidence has shown that, for facilitation
to occur, adequate levels of noise do not need to be conveyed afferently by the exact same
receptor system that will uptake the signal. Indeed, nonfiltered high-frequency electrical noise
applied to one finger improves detection of weak electrical impulses delivered to adjacent
fingers of the same hand (Iliopoulos et al. 2014). Similarly, a noisy visual stimulus monocularly
delivered to the left eye improved the perception of a weak signal delivered to the right eye
(Kitajo et al., 2003). As visual signals from both eyes converge in primary visual areas, the
process subtending such perception improvements can only occur at the cortical level.
Furthermore, SR is a cross-modal phenomenon that works with adequate noise levels and
weak signals from different sensory modalities. Indeed, long before it was theorized, audio
white noise was shown to improve visual performance following the rules of SR, i.e.
improvement of perceptual sensitivity following an inverted-U function across noise levels
(Harper 1979; Manjarrez et al. 2007). Confirming this cross-modal character, audio white noise
has been shown to improve not only the perception of auditory signals but also boost the
salience of visual and tactile stimulation (Lugo et al. 2008). In sum, cross-modality could be a
defining feature of SR which takes place in multisensory neurons located in sensory association
cortical areas (Manjarrez et al. 2007).
SR-like phenomena have also been assessed in scalp EEG datasets of cortical activity and
verified that either power of sensory entrained oscillations or the amplitude of evoked potentials
generated by weak stimuli also followed an inverted U-curve with increasing levels of
externally added noise. More specifically, in the somatosensory (Manjarrez et al. 2002) and
visual (Mori & Kai, 2002) sensory systems, the addition of peripheral stochastic noise, tactile
and visual respectively, to a weak periodic stimuli of the same modality, facilitated the
entrainment of cortical oscillations at the stimulus frequency, an effect that wore off when noise
intensity passed a threshold level. Similarly, in a visual steady-state protocol, the addition of
visual noise to an oscillating spatial grating improved oscillation power at the frequency band
dictated by the rhythm of grating fluctuations and increased the amplitude of visual evoked
potential generated by its onset (Srebro & Malladi, 1999). Taken together, these studies
published nearly two decades ago build precedence that following the principles of Stochastic
Resonance (as illustrated in Figure 5), the entrainment of frequency specific brain oscillations
by a rhythmic sensory source can also be facilitated by the addition of adequately dosed noise.
Importantly, in all the above-discussed studies, noise was conveyed to cortical systems
by means of randomly fluctuating sources of sensory stimulation exposing peripheral receptors

47
(retinal cells, cochlear cells, skin mechanoreceptors) to such patterns (auditory, visual or
tactile). Yet, as indicated previously in this section, neuronal and synaptic components
embedded in complex cortical networks contain also a lot of intrinsic sources of noise thanks
to variability of processes such as synaptic transduction, local potential and action potential
generation, axonal conduction and stimulus propagation across neural networks (Faisal et al.
2008). Externally produced and peripherally conducted stochastic noise, as described above,
will hence depend on mixed contributions from controlled external and internal sources of noise
along a multi-synaptic afferent sensory pathway (which will be in turn modulated also by the
former), difficult to tease apart.
In this regard, Aihara and colleagues (2008) demonstrated that ‘internal’ and ‘external’
sources of noise are complementary and that they needed to be dosed adequately to make sure
that their added amount remained within an optimal window allowing Stochastic Resonance
facilitation. They estimated ‘internal’ noise levels from the degree of variability in individual
subjects’ responses to a visual detection task (measured by the spread, or inverse slope, of
individual psychometric functions) without noise or with increasing levels of ‘externally’ added
visual noise (randomly fluctuating grey levels of an image delivered to the left eye). They
demonstrated that ‘external’ noise induced improvement of perception (mediated by SR
principles) in conditions of relatively low level of ‘internal’ noise. In contrast, when the level
of ‘internal’ noise was already high, the addition of external visual noise reduced stimulus
detection performance. This finding may explain the high inter-subject variability of optimal
noise level observed in most SR paradigms and warn about the need to adequately dose
‘external’ sensory noise and ‘internal’ neural noise levels.
In this context, a better understanding of the coding role played by noise in cortical
activity and cognitive processes (within or outside the Stochastic Resonance framework), could
benefit from a direct and focal manipulation of cortical neural noise combined with EEG and
behavioral recordings. Directly addressing this issue, a recently developed modality of tCS
technology, transcranial Random Noise Stimulation (tRNS) has been gaining momentum.
This approach diverges from other tCS stimulation technologies (such as tDCS delivering
a constant polarizing current, or tACS which uses an oscillating current at a single frequency)
by being able to deliver broad-band rhythmic currents which can eventually mimic white noise.
To do so, random current intensities chosen from a normal distribution (usually with mean 0)
are delivered to the brain at each stimulation sample. Noise intensity delivered by tRNS can be
flexibly manipulated by varying the standard deviation of the normal distribution from which

48
current intensities are chosen; a higher noise standard deviation resulting in higher mean
amplitude of delivered current and vice versa.
The frequency power spectrum of white tRNS noise should be flat, and characterized by
an electrical signal that encompasses all frequencies with the exact same amplitude.
Experimental studies have shown, however, that only high-frequency bands (100-640 Hz) of
the tRNS power spectrum generated with tCS devices seem to be responsible for modulating
neuronal excitability (Terney et al., 2008). Consequently, more recent studies have delivered
not pure white noise but rather “high frequency” tRNS which consists in a high-frequency
broadband current between 100 and 640 Hz.
In spite of the pending conceptual and technological breakthroughs to be overcome,
pioneering evidence on the potential role of cortical noise in coding and information processing
has been developed thanks to the advent of this technology. In the attentional and visual
domain, varying tRNS intensities delivered over the occipital cortex have shown to exert a
similar impact than externally added visual noise in the modulation of perception for visual
near-threshold stimuli (Groen & Wenderoth, 2016), suggesting that transcranial stimulation by
tRNS may have the potential to modulate perception in a SR-like manner.
Additionally, much like the use of non-invasive stimulation compared to sensory steady-
state stimulation, direct cortical noise modulation with tRNS has enabled the translation of SR
principles to cognitive activities other than perception, such as decision making. Recently, it
has been demonstrated that the addition of an optimal noise level over the visual cortex does
not only improve stimulus sensitivity but also but the rate of evidence accumulation needed to
trigger a response (Groen et al., 2018).
Transcranial random noise technologies have rapidly expanded during the last decade in
exploratory or clinical applications. Nonetheless, tRNS suffers from the limitations associated
to tCS methods, such as unknown physiological mechanisms, weak intensity (Vöröslakos et al.,
2018; Liu et al., 2018), poor focality (Bikson et al., 2010; Datta et al., 2012) and difficulties of
recording concurrent EEG activity (Noury et al., 2016; Noury & Siegel, 2018). Additionally,
the lack of solid neurophysiological models on the role of noise in processing has limited the
value of the outcomes of tRNS studies.
The evidence gathered thus far points clearly toward a crucial influence and physiological
role for ‘internal’ and ‘external’ sources of noise in coding, signal transmission and information
processing in brain systems. Consequently, noise in the recording of neuronal activity can no
longer be dismissed as simply epi-phenomenological, irrelevant for human cognition or simply
detrimental for neural processing, hence to be avoided at all costs.

49
In this exciting but challenging context, the development of novel methods to quantify
and manipulate cortical ‘intrinsic’ noise in brain cortical systems will be necessary to extend
our current knowledge. Work should focus on developing well-tested alternative technologies
such as TMS, in novel burst configurations aiming to inject random electrical signals and
increase neural noise, and capitalize on its higher intensity, focality and compatibility with
concurrent EEG recordings.
Ever since its first application in experimental neuroscience, TMS was though to act by
inducing neural noise is the stimulated cortex. Originally, it was hypothesized that TMS
activated neurons in the targeted cortical region indiscriminately, or randomly, and therefore
added noise and interfered with task-related patterns of neural activity to create was has long
been called a ‘virtual lesion’ (Miniussi et al., 2013; Walsh & Cowey, 2000). Empirical evidence
has shown that short TMS bursts (3 pulses at 15 Hz) can increase ‘internal’ noise levels in the
left V5/MT region of the cortex, as measured by a decrease in the slope (i.e. an increase in
response variability) of the individual psychometric function for the discrimination of motion
direction with increasing motion coherence (Ruzzoli et al., 2010). It was further demonstrated
that similar short TMS bursts (3 pulses at 20 Hz delivered on left V5/MT) modulated motion
discrimination performances following the inverse U-curve characteristic of SR (Schwarzkopf
et al., 2011). Indeed, on stimuli with weak coherence for motion (i.e. subthreshold stimuli) only
TMS pulses of medium intensity (and not too low or too high intensity) increased motion
discrimination performances; whereas on motion stimuli with strong coherence (i.e. supra-
threshold stimuli) medium or high intensity TMS pulses decreased performances. All of this
evidence is coherent with a modulation of neural noise by short episodic TMS patterns.
The proposed mechanism for its action on neural activity later evolved with the
emergence of evidence for state-dependent effects of TMS, with a preferential activation of
task-irrelevant neurons (Silvanto et al., 2008 for a review) rather than an indiscriminate
activation of all neuronal population in the stimulated cortex which would increase background
noise levels. This was supported by evidence that single TMS pulses (delivered on V1 or
V5/MT) do not increase neural noise but instead specifically suppress the strength of task-
related signals during visual and motion discrimination tasks (Harris et al., 2008; Ruzzoli et al.,
2011). TMS could therefore reduce or change the ratio between noise and signal in neural
processing (Miniussi et al., 2013). Such findings are promising for the development of TMS
patterns able to selectively manipulate neural background noise or signal strength with high
spatial and temporal resolution in order to probe the causal role of noise in neural coding and
information processing.

50
REFERENCES
Aihara, T., Kitajo, K., Nozaki, D., & Yamamoto, Y. (2008). Internal noise determines external
stochastic resonance in visual perception. Vision Research, 48, 1569–1573.
Alonso, A., & Llinás, R. R. (1989). Subthreshold Na+-dependent theta-like rhythmicity in
stellate cells of entorhinal cortex layer II. Nature, 342, 175–177.
Amengual, J. L., Vernet, M., Adam, C., & Valero-Cabré, A. (2017). Local entrainment of
oscillatory activity induced by direct brain stimulation in humans. Scientific Reports, 7,
41908.
Antal, A., Alekseichuk, I., Bikson, M., Brockmöller, J., Brunoni, A. R., Chen, R., … Paulus,
W. (2017). Low intensity transcranial electric stimulation: Safety, ethical, legal
regulatory and application guidelines. Clinical Neurophysiology, 128, 1774–1809.
Aydin-Abidin, S., Moliadze, V., Eysel, U. T., & Funke, K. (2006). Effects of repetitive TMS
on visually evoked potentials and EEG in the anaesthetized cat: Dependence on stimulus
frequency and train duration: rTMS effects on cat VEPs. The Journal of Physiology, 574,
443–455.
Bartolomeo, P. (2007). Visual neglect. Current Opinion in Neurology, 20, 381–386.
Bartolomeo, P., Thiebaut De Schotten, M., & Chica, A. B. (2012). Brain networks of
visuospatial attention and their disruption in visual neglect. Frontiers in Human
Neuroscience, 6.
Bäumer, T., Lange, R., Liepert, J., Weiller, C., Siebner, H. R., Rothwell, J. C., & Münchau, A.
(2003). Repeated premotor rTMS leads to cumulative plastic changes of motor cortex
excitability in humans. NeuroImage, 20, 550–560.
Berger, H. (1929). Über das Elektrenkephalogramm des Menschen. Archiv für Psychiatrie und
Nervenkrankheiten, 87, 527–570.
Bezrukov, S. M., & Vodyanoy, I. (1995). Noise-induced enhancement of signal transduction
across voltage-dependent ion channels. Nature, 378, 362–364.
Bichot, N. P., Rossi, A. F., & Desimone, R. (2005). Parallel and Serial Neural Mechanisms for
Visual Search in Macaque Area V4. Science, 308, 529–534.
Bikson, M., Datta, A., Rahman, A., & Scaturro, J. (2010). Electrode montages for tDCS and
weak transcranial electrical stimulation: Role of “return” electrode’s position and size.
Clinical Neurophysiology, 121, 1976–1978.
51
Buschman, T. J., & Miller, E. K. (2007). Top-Down Versus Bottom-Up Control of Attention
in the Prefrontal and Posterior Parietal Cortices. Science, 315, 1860–1862.
Buzsáki, G., & Draguhn, A. (2004). Neuronal oscillations in cortical networks. Science, 304,
1926–1929.
Capotosto, P., Spadone, S., Tosoni, A., Sestieri, C., Romani, G. L., Della Penna, S., & Corbetta,
M. (2015). Dynamics of EEG Rhythms Support Distinct Visual Selection Mechanisms in
Parietal Cortex: A Simultaneous Transcranial Magnetic Stimulation and EEG Study.
Journal of Neuroscience, 35, 721–730.
Capotosto, P., Babiloni, C., Romani, G. L., & Corbetta, M. (2009). Frontoparietal cortex
controls spatial attention through modulation of anticipatory alpha rhythms. The Journal
of Neuroscience, 29, 5863–5872.
Capotosto, P., Corbetta, M., Romani, G. L., & Babiloni, C. (2012). Electrophysiological
correlates of stimulus-driven reorienting deficits after interference with right parietal
cortex during a spatial attention task: A TMS-EEG study. Journal of Cognitive
Neuroscience, 24, 2363–2371.
Chanes, L., Chica, A. B., Quentin, R., & Valero-Cabré, A. (2012). Manipulation of Pre-Target
Activity on the Right Frontal Eye Field Enhances Conscious Visual Perception in
Humans. PLoS ONE, 7, e36232.
Chanes, L., Quentin, R., Tallon-Baudry, C., & Valero-Cabré, A. (2013). Causal Frequency-
Specific Contributions of Frontal Spatiotemporal Patterns Induced by Non-Invasive
Neurostimulation to Human Visual Performance. The Journal of Neuroscience, 33, 5000–
5005.
Chanes, L., Quentin, R., Vernet, M., & Valero-Cabré, A. (2015). Arrhythmic activity in the left
frontal eye field facilitates conscious visual perception in humans. Cortex, 71, 240–247.
Chen, W.-H., Mima, T., Siebner, H. R., Oga, T., Hara, H., Satow, T., … Shibasaki, H. (2003).
Low-frequency rTMS over lateral premotor cortex induces lasting changes in regional
activation and functional coupling of cortical motor areas. Clinical Neurophysiology, 114,
1628–1637.
Chouinard, P. A., Van Der Werf, Y. D., Leonard, G., & Paus, T. (2003). Modulating Neural
Networks With Transcranial Magnetic Stimulation Applied Over the Dorsal Premotor
and Primary Motor Cortices. Journal of Neurophysiology, 90, 1071–1083.
Cleary, D. R., Raslan, A. M., Rubin, J. E., Bahgat, D., Viswanathan, A., Heinricher, M. M., &
Burchiel, K. J. (2012). Deep brain stimulation entrains local neuronal firing in human
globus pallidus internus. Journal of Neurophysiology, 109, 978–987.
52
Collins, J. J., Imhoff, T. T., & Grigg, P. (1996). Noise-enhanced information transmission in
rat SA1 cutaneous mechanoreceptors via aperiodic stochastic resonance. Journal of
Neurophysiology, 76, 642–645.
Collins, J. J., Imhoff, T. T., & Grigg, P. (1996). Noise-enhanced tactile sensation. Nature, 383,
770–770.
Corbetta, M., Kincade, M. J., Lewis, C., Snyder, A. Z., & Sapir, A. (2005). Neural basis and
recovery of spatial attention deficits in spatial neglect. Nature Neuroscience, 8, 1603–
1610.
Corbetta, M., Patel, G., & Shulman, G. L. (2008). The reorienting system of the human brain:
From environment to theory of mind. Neuron, 58, 306–324.
Corbetta, M., & Shulman, G. L. (2002). Control of goal-directed and stimulus-driven attention
in the brain. Nature Reviews Neuroscience, 3, 201.
Cordo, P., Inglis, J. T., Verschueren, S., Collins, J. J., Merfeld, D. M., Rosenblum, S., … Moss,
F. (1996). Noise in human muscle spindles. Nature, 383, 769–770.
Datta, A., Truong, D., Minhas, P., Parra, L. C., & Bikson, M. (2012). Inter-Individual Variation
during Transcranial Direct Current Stimulation and Normalization of Dose Using MRI-
Derived Computational Models. Frontiers in Psychiatry, 3, 91.
Desimone, R., & Duncan, J. (1995). Neural Mechanisms of Selective Visual Attention. Annual
Review of Neuroscience, 18, 193–222.
Douglass, J. K., Wilkens, L., Pantazelou, E., & Moss, F. (1993). Noise enhancement of
information transfer in crayfish mechanoreceptors by stochastic resonance. Nature, 365,
337–340.
Draguhn, A., Traub, R. D., Schmitz, D., & Jefferys, J. G. R. (1998). Electrical coupling
underlies high-frequency oscillations in the hippocampus in vitro. Nature, 394, 189–192.
Dugué, L., Marque, P., & VanRullen, R. (2011). The phase of ongoing oscillations mediates
the causal relation between brain excitation and visual perception. The Journal of
Neuroscience, 31, 11889–11893.
Dunlop, K., Woodside, B., Olmsted, M., Colton, P., Giacobbe, P., & Downar, J. (2016).
Reductions in Cortico-Striatal Hyperconnectivity Accompany Successful Treatment of
Obsessive-Compulsive Disorder with Dorsomedial Prefrontal rTMS.
Neuropsychopharmacology, 41, 1395–1403.
Faisal, A. A., Selen, L. P. J., & Wolpert, D. M. (2008). Noise in the nervous system. Nature
Reviews Neuroscience, 9, 292–303.

53
Fiebelkorn, I. C., & Kastner, S. (2019). A Rhythmic Theory of Attention. Trends in Cognitive
Sciences, 23, 87–101.
Foxe, J. J., & Snyder, A. C. (2011). The Role of Alpha-Band Brain Oscillations as a Sensory
Suppression Mechanism during Selective Attention. Frontiers in Psychology, 2.
Fries, P. (2005). A mechanism for cognitive dynamics: Neuronal communication through
neuronal coherence. Trends in Cognitive Sciences, 9, 474–480.
Fries, P. (2009). Neuronal Gamma-Band Synchronization as a Fundamental Process in Cortical
Computation. Annual Review of Neuroscience, 32, 209–224.
Fries, P., Reynolds, J. H., Rorie, A. E., & Desimone, R. (2001). Modulation of oscillatory
neuronal synchronization by selective visual attention. Science, 291, 1560–1563.
Fröhlich, F., & McCormick, D. A. (2010). Endogenous Electric Fields May Guide Neocortical
Network Activity. Neuron, 67, 129–143.
Galambos, R., Makeig, S., & Talmachoff, P. J. (1981). A 40-Hz auditory potential recorded
from the human scalp. Proceedings of the National Academy of Sciences, 78, 2643–2647.
Gangitano, M., Valero-Cabré, A., Tormos, J. M., Mottaghy, F. M., Romero, J. R., & Pascual-
Leone, Á. (2002). Modulation of input–output curves by low and high frequency
repetitive transcranial magnetic stimulation of the motor cortex. Clinical
Neurophysiology, 113, 1249–1257.
Gattass, R., Nascimento-Silva, S., Soares, J. G. M., Lima, B., Jansen, A. K., Diogo, A. C. M.,
… Fiorani, M. (2005). Cortical visual areas in monkeys: Location, topography,
connections, columns, plasticity and cortical dynamics. Philosophical Transactions of the
Royal Society of London. Series B, Biological Sciences, 360, 709–731.
George, M. S., Lisanby, S. H., Avery, D., McDonald, W. M., Durkalski, V., Pavlicova, M., …
Sackeim, H. A. (2010). Daily left prefrontal transcranial magnetic stimulation therapy for
major depressive disorder: A sham-controlled randomized trial. Archives of General
Psychiatry, 67, 507–516.
Giraud, A.-L., Lorenzi, C., Ashburner, J., Wable, J., Johnsrude, I., Frackowiak, R., &
Kleinschmidt, A. (2000). Representation of the Temporal Envelope of Sounds in the
Human Brain. Journal of Neurophysiology, 84, 1588–1598.
Gómez, C. M., Marco-Pallarés, J., & Grau, C. (2006). Location of brain rhythms and their
modulation by preparatory attention estimated by current density. Brain Research, 1107,
151–160.

54
Gray, C. M., & Singer, W. (1989). Stimulus-specific neuronal oscillations in orientation
columns of cat visual cortex. Proceedings of the National Academy of Sciences, 86, 1698–
1702.
Grice, S. J., Spratling, M. W., Karmiloff-Smith, A., Halit, H., Csibra, G., de Haan, M., &
Johnson, M. H. (2001). Disordered visual processing and oscillatory brain activity in
autism and Williams Syndrome. NeuroReport, 12, 2697.
Groen, O. van der, Tang, M. F., Wenderoth, N., & Mattingley, J. B. (2018). Stochastic
resonance enhances the rate of evidence accumulation during combined brain stimulation
and perceptual decision-making. PLOS Computational Biology, 14, e1006301.
Groen, O. van der, & Wenderoth, N. (2016). Transcranial Random Noise Stimulation of Visual
Cortex: Stochastic Resonance Enhances Central Mechanisms of Perception. Journal of
Neuroscience, 36, 5289–5298.
Gross, J., Schmitz, F., Schnitzler, I., Kessler, K., Shapiro, K., Hommel, B., & Schnitzler, A.
(2004). Modulation of long-range neural synchrony reflects temporal limitations of visual
attention in humans. Proceedings of the National Academy of Sciences, 101, 13050–
13055.
Hallett, M. (2007). Transcranial Magnetic Stimulation: A Primer. Neuron, 55, 187–199.
Hanslmayr, S., Aslan, A., Staudigl, T., Klimesch, W., Herrmann, C. S., & Bäuml, K.-H. (2007).
Prestimulus oscillations predict visual perception performance between and within
subjects. NeuroImage, 37, 1465–1473.
Harper, D. W. (1979). Signal detection analysis of effect of white noise intensity on sensitivity
to visual flicker. Perceptual and Motor Skills, 48, 791–798.
Harris, J. A., Clifford, C. W. G., & Miniussi, C. (2008). The Functional Effect of Transcranial
Magnetic Stimulation: Signal Suppression or Neural Noise Generation? Journal of
Cognitive Neuroscience, 20, 734–740.
Herrmann, C. S., Rach, S., Neuling, T., & Strüber, D. (2013). Transcranial alternating current
stimulation: A review of the underlying mechanisms and modulation of cognitive
processes. Frontiers in Human Neuroscience, 7.
Hipp, J. F., Engel, A. K., & Siegel, M. (2011). Oscillatory Synchronization in Large-Scale
Cortical Networks Predicts Perception. Neuron, 69, 387–396.
Huang, Y., Chen, L., & Luo, H. (2015). Behavioral Oscillation in Priming: Competing
Perceptual Predictions Conveyed in Alternating Theta-Band Rhythms. Journal of
Neuroscience, 35, 2830–2837.

55
Huang, Y.-Z., Edwards, M. J., Rounis, E., Bhatia, K. P., & Rothwell, J. C. (2005). Theta Burst
Stimulation of the Human Motor Cortex. Neuron, 45, 201–206.
Iliopoulos, F., Nierhaus, T., & Villringer, A. (2014). Electrical noise modulates perception of
electrical pulses in humans: Sensation enhancement via stochastic resonance. Journal of
Neurophysiology, 111, 1238–1248.
Jaegle, A., & Ro, T. (2014). Direct Control of Visual Perception with Phase-specific
Modulation of Posterior Parietal Cortex. Journal of Cognitive Neuroscience, 26, 422–
432.
Jaramillo, F., & Wiesenfeld, K. (1998). Mechanoelectrical transduction assisted by Brownian
motion: A role for noise in the auditory system. Nature Neuroscience, 1, 384–388.
Jones, E. G., & Powell, T. P. S. (1970). AN ANATOMICAL STUDY OF CONVERGING
SENSORY PATHWAYS WITHIN THE CEREBRAL CORTEX OF THE MONKEY.
Brain, 93, 793–820.
Kitajo, K., Nozaki, D., Ward, L. M., & Yamamoto, Y. (2003). Behavioral Stochastic Resonance
within the Human Brain. Physical Review Letters, 90.
Klimesch, W., Sauseng, P., & Hanslmayr, S. (2007). EEG alpha oscillations: The inhibition–
timing hypothesis. Brain Research Reviews, 53, 63–88.
Kobayashi, M., & Pascual-Leone, A. (2003). Transcranial magnetic stimulation in neurology.
The Lancet Neurology, 2, 145–156.
Lafon, B., Henin, S., Huang, Y., Friedman, D., Melloni, L., Thesen, T., … Liu, A. A. (2017).
Low frequency transcranial electrical stimulation does not entrain sleep rhythms
measured by human intracranial recordings. Nature Communications, 8, 1–14.
Landau, A. N., & Fries, P. (2012). Attention Samples Stimuli Rhythmically. Current Biology,
22, 1000–1004.
Landau, A. N., Schreyer, H. M., van Pelt, S., & Fries, P. (2015). Distributed Attention Is
Implemented through Theta-Rhythmic Gamma Modulation. Current Biology, 25, 2332–
2337.
Lefaucheur, J.-P., André-Obadia, N., Antal, A., Ayache, S. S., Baeken, C., Benninger, D. H.,
… Garcia-Larrea, L. (2014). Evidence-based guidelines on the therapeutic use of
repetitive transcranial magnetic stimulation (rTMS). Clinical Neurophysiology, 125,
2150–2206.
Liu, A., Vöröslakos, M., Kronberg, G., Henin, S., Krause, M. R., Huang, Y., … Buzsáki, G.
(2018). Immediate neurophysiological effects of transcranial electrical stimulation.
Nature Communications, 9, 1–12.

56
Lugo, E., Doti, R., & Faubert, J. (2008). Ubiquitous Crossmodal Stochastic Resonance in
Humans: Auditory Noise Facilitates Tactile, Visual and Proprioceptive Sensations. PLoS
ONE, 3.
Maeda, F., Keenan, J. P., Tormos, J. M., Topka, H., & Pascual-Leone, A. (2000). Modulation
of corticospinal excitability by repetitive transcranial magnetic stimulation. Clinical
Neurophysiology, 111, 800–805.
Manjarrez, E., Diez-Martınez, O., Mendez, I., & Flores, A. (2002). Stochastic resonance in
human electroencephalographic activity elicited by mechanical tactile stimuli.
Neuroscience Letters, 324, 213–216.
Manjarrez, E., Mendez, I., Martinez, L., Flores, A., & Mirasso, C. R. (2007). Effects of auditory
noise on the psychophysical detection of visual signals: Cross-modal stochastic
resonance. Neuroscience Letters, 415, 231–236.
Marshall, T. R., Bergmann, T. O., & Jensen, O. (2015). Frontoparietal Structural Connectivity
Mediates the Top-Down Control of Neuronal Synchronization Associated with Selective
Attention. PLoS Biol, 13, e1002272.
Mathewson, K. E., Gratton, G., Fabiani, M., Beck, D. M., & Ro, T. (2009). To see or not to see:
Prestimulus alpha phase predicts visual awareness. The Journal of Neuroscience, 29,
2725–2732.
Mathewson, K. E., Lleras, A., Beck, D. M., Fabiani, M., Ro, T., & Gratton, G. (2011). Pulsed
Out of Awareness: EEG Alpha Oscillations Represent a Pulsed-Inhibition of Ongoing
Cortical Processing. Frontiers in Psychology, 2.
Merlet, I., Birot, G., Salvador, R., Molaee-Ardekani, B., Mekonnen, A., Soria-Frish, A., …
Wendling, F. (2013). From oscillatory transcranial current stimulation to scalp EEG
changes: A biophysical and physiological modeling study. PloS One, 8, e57330.
Miniussi, C., Harris, J. A., & Ruzzoli, M. (2013). Modelling non-invasive brain stimulation in
cognitive neuroscience. Neuroscience & Biobehavioral Reviews, 37, 1702–1712.
Miranda, P. C., Lomarev, M., & Hallett, M. (2006). Modeling the current distribution during
transcranial direct current stimulation. Clinical Neurophysiology, 117, 1623–1629.
Mori, T., & Kai, S. (2002). Noise-induced entrainment and stochastic resonance in human brain
waves. Physical Review Letters, 88, 218101.
Moss, F., Ward, L. M., & Sannita, W. G. (2004). Stochastic resonance and sensory information
processing: A tutorial and review of application. Clinical Neurophysiology, 115, 267–
281.

57
Nangini, C., Ross, B., Tam, F., & Graham, S. J. (2006). Magnetoencephalographic study of
vibrotactile evoked transient and steady-state responses in human somatosensory cortex.
NeuroImage, 33, 252–262.
Nitsche, M. A., Cohen, L. G., Wassermann, E. M., Priori, A., Lang, N., Antal, A., … Pascual-
Leone, A. (2008). Transcranial direct current stimulation: State of the art 2008. Brain
Stimulation, 1, 206–223.
Nitsche, M. A., & Paulus, W. (2011). Transcranial direct current stimulation–update 2011.
Restorative Neurology and Neuroscience, 29, 463–492.
Noury, N., Hipp, J. F., & Siegel, M. (2016). Physiological processes non-linearly affect
electrophysiological recordings during transcranial electric stimulation. NeuroImage,
140, 99–109.
Noury, N., & Siegel, M. (2018). Analyzing EEG and MEG signals recorded during tES, a reply.
NeuroImage, 167, 53–61.
O’Reardon, J. P., Solvason, H. B., Janicak, P. G., Sampson, S., Isenberg, K. E., Nahas, Z., …
Sackeim, H. A. (2007). Efficacy and Safety of Transcranial Magnetic Stimulation in the
Acute Treatment of Major Depression: A Multisite Randomized Controlled Trial.
Biological Psychiatry, 62, 1208–1216.
Pascual-Leone, A., Valls-Solé, J., Wassermann, E. M., & Hallett, M. (1994). Responses to
rapid-rate transcranial magnetic stimulation of the human motor cortex. Brain, 117, 847–
858.
Paus, T., Jech, R., Thompson, C. J., Comeau, R., Peters, T., & Evans, A. C. (1997). Transcranial
magnetic stimulation during positron emission tomography: A new method for studying
connectivity of the human cerebral cortex. The Journal of Neuroscience, 17, 3178–3184.
Paus, T., Sipila, P. K., & Strafella, A. P. (2001). Synchronization of neuronal activity in the
human primary motor cortex by transcranial magnetic stimulation: An EEG study.
Journal of Neurophysiology, 86, 1983–1990.
Phillips, S., & Takeda, Y. (2009). Greater frontal-parietal synchrony at low gamma-band
frequencies for inefficient than efficient visual search in human EEG. International
Journal of Psychophysiology, 73, 350–354.
Picton, T. W., John, M. S., Dimitrijevic, A., & Purcell, D. (2003). Human auditory steady-state
responses. International Journal of Audiology, 42, 177–219.
Polanía, R., Nitsche, M. A., & Ruff, C. C. (2018). Studying and modifying brain function with
non-invasive brain stimulation. Nature Neuroscience, 21, 174–187.

58
Quentin, R., Chanes, L., Vernet, M., & Valero-Cabre, A. (2014). Fronto-Parietal Anatomical
Connections Influence the Modulation of Conscious Visual Perception by High-Beta
Frontal Oscillatory Activity. Cerebral Cortex, 25, 2095–2101.
Quentin, R., Elkin Frankston, S., Vernet, M., Toba, M. N., Bartolomeo, P., Chanes, L., &
Valero-Cabré, A. (2015). Visual Contrast Sensitivity Improvement by Right Frontal
High-Beta Activity Is Mediated by Contrast Gain Mechanisms and Influenced by Fronto-
Parietal White Matter Microstructure. Cerebral Cortex, 26, 2381–2390.
Rastelli, F., Tallon-Baudry, C., Migliaccio, R., Toba, M. N., Ducorps, A., Pradat-Diehl, P., …
Bartolomeo, P. (2013). Neural dynamics of neglected targets in patients with right
hemisphere damage. Cortex, 49, 1989–1996.
Reynolds, J. H., Chelazzi, L., & Desimone, R. (1999). Competitive Mechanisms Subserve
Attention in Macaque Areas V2 and V4. The Journal of Neuroscience, 19, 1736–1753.
Rodriguez, E., George, N., Lachaux, J.-P., Martinerie, J., Renault, B., & Varela, F. J. (1999).
Perception’s shadow: Long-distance synchronization of human brain activity. Nature,
397, 430.
Romei, V., Gross, J., & Thut, G. (2010). On the Role of Prestimulus Alpha Rhythms over
Occipito-Parietal Areas in Visual Input Regulation: Correlation or Causation? Journal of
Neuroscience, 30, 8692–8697.
Romei, V., Driver, J., Schyns, P. G., & Thut, G. (2011). Rhythmic TMS over parietal cortex
links distinct brain frequencies to global versus local visual processing. Current Biology,
21, 334–337.
Rosanova, M., Casali, A., Bellina, V., Resta, F., Mariotti, M., & Massimini, M. (2009). Natural
Frequencies of Human Corticothalamic Circuits. Journal of Neuroscience, 29, 7679–
7685.
Ruzzoli, M., Abrahamyan, A., Clifford, C. W. G., Marzi, C. A., Miniussi, C., & Harris, J. A.
(2011). The effect of TMS on visual motion sensitivity: An increase in neural noise or a
decrease in signal strength? Journal of Neurophysiology, 106, 138–143.
Ruzzoli, M., Marzi, C. A., & Miniussi, C. (2010). The Neural Mechanisms of the Effects of
Transcranial Magnetic Stimulation on Perception. Journal of Neurophysiology, 103,
2982–2989.
Saalmann, Y. B., Pigarev, I. N., & Vidyasagar, T. R. (2007). Neural mechanisms of visual
attention: How top-down feedback highlights relevant locations. Science, 316, 1612–
1615.

59
Salin, P. A., Girard, P., Kennedy, H., & Bullier, J. (1992). Visuotopic organization of
corticocortical connections in the visual system of the cat. Journal of Comparative
Neurology, 320, 415–434.
Sauseng, P., Klimesch, W., Stadler, W., Schabus, M., Doppelmayr, M., Hanslmayr, S., …
Birbaumer, N. (2005). A shift of visual spatial attention is selectively associated with
human EEG alpha activity. The European Journal of Neuroscience, 22, 2917–2926.
Sauseng, P., Klimesch, W., Heise, K. F., Gruber, W. R., Holz, E., Karim, A. A., … Hummel,
F. C. (2009). Brain Oscillatory Substrates of Visual Short-Term Memory Capacity.
Current Biology, 19, 1846–1852.
Schindler, K., Nyffeler, T., Wiest, R., Hauf, M., Mathis, J., Hess, C. W., & Müri, R. (2008).
Theta burst transcranial magnetic stimulation is associated with increased EEG
synchronization in the stimulated relative to unstimulated cerebral hemisphere.
Neuroscience Letters, 436, 31–34.
Schubert, R., Haufe, S., Blankenburg, F., Villringer, A., & Curio, G. (2009). Now You’ll Feel
It, Now You Won’t: EEG Rhythms Predict the Effectiveness of Perceptual Masking.
Journal of Cognitive Neuroscience, 21, 2407–2419.
Schwarzkopf, D. S., Silvanto, J., & Rees, G. (2011). Stochastic Resonance Effects Reveal the
Neural Mechanisms of Transcranial Magnetic Stimulation. Journal of Neuroscience, 31,
3143–3147.
Shannon, C. E. (1948). A Mathematical Theory of Communication. Bell System Technical
Journal, 27, 379–423.
Silvanto, J., Muggleton, N., & Walsh, V. (2008). State-dependency in brain stimulation studies
of perception and cognition. Trends in Cognitive Sciences, 12, 447–454.
Simonotto, E., Riani, M., Seife, C., Roberts, M., Twitty, J., & Moss, F. (1997). Visual
Perception of Stochastic Resonance. Physical Review Letters, 78, 1186–1189.
Singer, W., & Gray, C. (1995). Visual Feature Integration and the Temporal Correlation
Hypothesis. 555–586.
Smith, M. L., Gosselin, F., & Schyns, P. G. (2006). Perceptual moments of conscious visual
experience inferred from oscillatory brain activity. Proceedings of the National Academy
of Sciences, 103, 5626–5631.
Srebro, R., & Malladi, P. (1999). Stochastic resonance of the visually evoked potential.
Physical Review E, 59, 2566–2570.

60
Srinivasan, R., Russell, D. P., Edelman, G. M., & Tononi, G. (1999). Increased synchronization
of neuromagnetic responses during conscious perception. The Journal of Neuroscience,
19, 5435–5448.
Srinivasan, R., Bibi, F. A., & Nunez, P. L. (2006). Steady-state visual evoked potentials:
Distributed local sources and wave-like dynamics are sensitive to flicker frequency. Brain
Topography, 18, 167–187.
Srinivasan, R., Fornari, E., Knyazeva, M. G., Meuli, R., & Maeder, P. (2007). FMRI responses
in medial frontal cortex that depend on the temporal frequency of visual input.
Experimental Brain Research, 180, 677–691.
Steriade, M., Contreras, D., & Amzica, F. (1994). Synchronized sleep oscillations and their
paroxysmal developments. Trends in Neurosciences, 17, 201–207.
Strens, L. H. A., Oliviero, A., Bloem, B. R., Gerschlager, W., Rothwell, J. C., & Brown, P.
(2002). The effects of subthreshold 1 Hz repetitive TMS on cortico-cortical and
interhemispheric coherence. Clinical Neurophysiology, 113, 1279–1285.
Tallon-Baudry, C., & Bertrand, O. (1999). Oscillatory gamma activity in humans and its role
in object representation. Trends in Cognitive Sciences, 3, 151–162.
Terney, D., Chaieb, L., Moliadze, V., Antal, A., & Paulus, W. (2008). Increasing Human Brain
Excitability by Transcranial High-Frequency Random Noise Stimulation. The Journal of
Neuroscience, 28, 14147–14155.
Thiebaut de Schotten, M., Dell’Acqua, F., Forkel, S. J., Simmons, A., Vergani, F., Murphy, D.
G. M., & Catani, M. (2011). A lateralized brain network for visuospatial attention. Nature
Neuroscience, 14, 1245–1246.
Thiebaut de Schotten, M., Tomaiuolo, F., Aiello, M., Merola, S., Silvetti, M., Lecce, F., …
Doricchi, F. (2014). Damage to white matter pathways in subacute and chronic spatial
neglect: A group study and 2 single-case studies with complete virtual “in vivo”
tractography dissection. Cerebral Cortex, 24, 691–706.
Thomas, F., Moulier, V., Valéro-Cabré, A., & Januel, D. (2016). Brain connectivity and
auditory hallucinations: In search of novel noninvasive brain stimulation therapeutic
approaches for schizophrenia. Revue Neurologique, 172, 653–679.
Thomas, F., Bouaziz, N., Gallea, C., Schenin-King Andrianisaina, P., Durand, F., Bolloré, O.,
… Januel, D. (2019). Structural and functional brain biomarkers of clinical response to
rTMS of medication-resistant auditory hallucinations in schizophrenia patients: Study
protocol for a randomized sham-controlled double-blind clinical trial. Trials, 20, 229.

61
Thut, G, Théoret, H., Pfennig, A., Ives, J., Kampmann, F., Northoff, G., & Pascual-Leone, A.
(2003). Differential effects of low-frequency rTMS at the occipital pole on visual-induced
alpha desynchronization and visual-evoked potentials. NeuroImage, 18, 334–347.
Thut, G., Nietzel, A., Brandt, S. A., & Pascual-Leone, A. (2006). Alpha-band
electroencephalographic activity over occipital cortex indexes visuospatial attention bias
and predicts visual target detection. The Journal of Neuroscience, 26, 9494–9502.
Thut, G., & Pascual-Leone, A. (2009). A Review of Combined TMS-EEG Studies to
Characterize Lasting Effects of Repetitive TMS and Assess Their Usefulness in Cognitive
and Clinical Neuroscience. Brain Topography, 22, 219.
Thut, G., Schyns, P. G., & Gross, J. (2011a). Entrainment of Perceptually Relevant Brain
Oscillations by Non-Invasive Rhythmic Stimulation of the Human Brain. Frontiers in
Psychology, 2.
Thut, G., Veniero, D., Romei, V., Miniussi, C., Schyns, P., & Gross, J. (2011b). Rhythmic TMS
Causes Local Entrainment of Natural Oscillatory Signatures. Current Biology, 21, 1176–
1185.
Uhlhaas, P. J., Linden, D. E. J., Singer, W., Haenschel, C., Lindner, M., Maurer, K., &
Rodriguez, E. (2006). Dysfunctional long-range coordination of neural activity during
Gestalt perception in schizophrenia. The Journal of Neuroscience, 26, 8168–8175.
Uhlhaas, P. J., & Singer, W. (2006). Neural Synchrony in Brain Disorders: Relevance for
Cognitive Dysfunctions and Pathophysiology. Neuron, 52, 155–168.
Valero-Cabré, A., Amengual, J. L., Stengel, C., Pascual-Leone, A., & Coubard, O. A. (2017).
Transcranial magnetic stimulation in basic and clinical neuroscience: A comprehensive
review of fundamental principles and novel insights. Neuroscience & Biobehavioral
Reviews, 83, 381–404.
Valero-Cabré, A., Payne, B. R., Rushmore, J., Lomber, S. G., & Pascual-Leone, A. (2005).
Impact of repetitive transcranial magnetic stimulation of the parietal cortex on metabolic
brain activity: A 14C-2DG tracing study in the cat. Experimental Brain Research, 163,
1–12.
Van Der Werf, Y. D., & Paus, T. (2006). The neural response to transcranial magnetic
stimulation of the human motor cortex. I. Intracortical and cortico-cortical contributions.
Experimental Brain Research, 175, 231–245.
van Dijk, H., Schoffelen, J.-M., Oostenveld, R., & Jensen, O. (2008). Prestimulus oscillatory
activity in the alpha band predicts visual discrimination ability. The Journal of
Neuroscience, 28, 1816–1823.

62
Vialatte, F.-B., Maurice, M., Dauwels, J., & Cichocki, A. (2010). Steady-state visually evoked
potentials: Focus on essential paradigms and future perspectives. Progress in
Neurobiology, 90, 418–438.
Vöröslakos, M., Takeuchi, Y., Brinyiczki, K., Zombori, T., Oliva, A., Fernández-Ruiz, A., …
Berényi, A. (2018). Direct effects of transcranial electric stimulation on brain circuits in
rats and humans. Nature Communications, 9, 483.
Walsh, V., & Cowey, A. (2000). Transcranial magnetic stimulation and cognitive neuroscience.
Nature Reviews Neuroscience, 1, 73–80.
White, J. A., Rubinstein, J. T., & Kay, A. R. (2000). Channel noise in neurons. Trends in
Neurosciences, 23, 131–137.
Witcher, M., Moran, R., Tatter, S. B., & Laxton, A. W. (2014). Neuronal oscillations in
Parkinson’s disease. Frontiers in Bioscience, 19, 1291–1299.
Worden, M. S., Foxe, J. J., Wang, N., & Simpson, G. V. (2000). Anticipatory biasing of
visuospatial attention indexed by retinotopically specific alpha-band
electroencephalography increases over occipital cortex. The Journal of Neuroscience, 20,
RC63.
Woźniak-Kwaśniewska, A., Szekely, D., Aussedat, P., Bougerol, T., & David, O. (2014).
Changes of oscillatory brain activity induced by repetitive transcranial magnetic
stimulation of the left dorsolateral prefrontal cortex in healthy subjects. NeuroImage, 88,
91–99.
Zeng, F.-G., Fu, Q.-J., & Morse, R. (2000). Human hearing enhanced by noise. Brain Research,
869, 251–255.

63
SPECIFIC AIMS
The long-term goal of the larger project in which this dissertation is embedded is to develop
the use of non-invasive stimulation technologies to advance the causal characterization of normal
and dysfunctional oscillatory activity and network synchrony patterns subtending physiological
and pathological cognition in the domain of visuo-spatial attention and the modulation of conscious
visual perception. We aim to characterize sophisticated anatomical and physiological models of
visuo-spatial attentional networks, including relevant nodes, oscillation frequencies and crucial
time windows that, once identified, can be modulated to either improve attentional orienting, visual
awareness and perceptual performance in healthy participants or restore brain functions in
neurological patients.
Indeed, prior evidence has shown that local oscillations and network synchronization play a
key role in the emergence of a wide variety of cognitive processes, by enabling data coding,
information transfer or signal processing in brain systems. Likewise, pathological oscillatory
activity or network synchrony has been found to be associated with cognitive deficits, neurological
symptoms and altered behaviors. Therefore, by mapping the detailed contributions of episodic
oscillatory activity or synchrony states causally involved in visuo-spatial attentional and/or
perception, we will be able to devise rehabilitation strategies for patients affected by visuo-spatial
attention or visual perception disorders such as hemispatial neglect or hemianopsia.
The short-term goal of this thesis is to characterize the anatomical, neurophysiological and
behavioral contributions of frontal cortical regions, considered key nodes of a bilaterally distributed
fronto-parietal dorsal network, with bearing on the orienting of spatial attention, the modulation of
visual perception and providing conscious access for near-threshold perceptual stimuli. To this end,
we will use Transcranial Magnetic Stimulation (TMS) applied to specific cortical regions and
delivered during specific time windows in brief frequency-specific patterns, engineered to entrain
local oscillations, or non frequency-specific patterns designed to either prevent oscillations from
building up or to increase neural noise. These TMS patterns will be applied to healthy human
participants to episodically manipulate on a trial-by-trial basis the neural activity in the left and
right Frontal Eye Fields (FEF). Impact will be evaluated by means of concurrent EEG recordings
and conscious detection performance paradigms for low contrast lateralized visual targets.
In such context, the doctoral research project presented in this dissertation will develop the
following three specific aims:

64
SPECIFIC AIM 1: We will use TMS-EEG approaches to characterize neurophysiologically
the causal contributions of right frontal high-beta oscillations and fronto-parietal
synchronization on conscious visual perception in healthy human participants.
A bilateral but right dominant fronto-parietal network linking the Frontal Eye Field (FEF) and the
Intra Parietal Sulcus (IPS) and subtended by the 1st branch of the Superior Longitudinal Fasciculus
(SLF) has long been proposed as involved in attention orienting and the top down modulation of
visual perception. Rhythmic TMS studies have reported that the entrainment of high-beta (~30 Hz)
oscillations in a right frontal node (FEF) of this network plays a causal role in the modulation of
conscious visual detection (Chanes et al., 2013; Quentin et al., 2014, 2015). However, the lack of
concurrent EEG recordings in these studies precluded a better understanding of the
neurophysiological mechanisms behind this rhythmic TMS-induced high-beta oscillatory
entrainment. By means of coupled TMS-EEG recordings, we here aim to better understand the
local role of high-beta rhythmic activity delivered to the right FEF and explore the network effects,
likely via a fronto-parietal dorsal attentional network, of frontal stimulation and their contribution
to the modulation of conscious visual detection in healthy participants.
We hypothesize that 30 Hz rhythmic TMS delivered over the right FEF will locally entrain high-
beta activity and boost high-beta right lateralized fronto-parietal synchrony which will in turn
increase high-beta oscillations in the posterior parietal cortex, distant from the frontal cortical
target on which rhythmic TMS will be originally applied.
SPECIFIC AIM 2: We will use TMS-EEG approaches to pinpoint the neurophysiological
mechanisms subtending local and network influences of neural noise induced in the left
frontal cortex and its effects on visual perception in healthy human participants.
Prior causal evidence hypothesized a beneficial role for neural noise induction across a left
lateralized fronto-parietal network (Chanes et al., 2015) as also involved in attentional orienting
and top-down facilitation of conscious visual perception. However, the lack of concurrent EEG
recordings rendered this explanation purely speculative and precluded any neurophysiological
insights on potential subtending mechanisms. Using concurrent TMS-EEG recordings, we here aim
to evaluate and compare the impact on local and network EEG activity of 4 types of periodical
TMS patterns (from high-beta regular rhythmic bursts to random patterns) engineered to induce
different levels of neural noise in the left FEF, and to investigate differential effects on conscious
visual detection. Collaterally, we also aim to provide insight supporting a potential asymmetry of
coding strategies for left and right fronto-parietal systems in attentional orienting and conscious
visual perception.

65
We hypothesize that TMS patterns with different degrees of randomness in their temporal structure
delivered to the left FEF would induce different levels of neural noise in cortical activity and
differently facilitate conscious visual detection performance. Such outcomes would support
‘Stochastic Resonance-like’ effects, which will be finely dependent on the levels of induced noise.
They would also support an asymmetry of coding strategies for left vs right hemisphere
contributions to the top-down modulation of visual perception.
SPECIFIC AIM 3: We will use sham TMS-EEG to explore the influence of rhythmic and
arrhythmic patterns of periodical sounds associated to the delivery of TMS on brain evoked
and oscillatory activity and conscious visual performance in healthy participants.
The discharge of periodical TMS patterns is accompanied by the delivery of trains of pulsed high
intensity clicking sounds associated to each individual pulse. Drawing conclusions about the
neurophysiological and behavioral impact of active TMS patterns requires comparison with a sham
condition that, among other factors, reproduces the sounds emitted by the TMS coil. However, the
impact of lateralized sound patterns on physiological activity and cognitive (attention or
perception) behaviors is far from neutral. Moreover, since single pulses or rhythmic active TMS
patterns are being used to entrain or manipulate oscillatory activity, it is plausible that sound
patterns present during active rhythmic TMS delivery could also contribute to oscillatory
entrainment and to its behavioral impact. Using concurrent sham TMS-EEG recordings, we aim to
assess the impact of single pulses and rhythmic or random patterns of TMS-generated sounds
(delivered via sham TMS pulses or TMS-like sounds played by a speaker mounted on the TMS
coil) on cortical oscillations and conscious visual detection performance by comparing them to a
no-sound stimulation condition. Detailed insight on the impact on EEG activity of what is thought
of as a control condition could enable more nuanced conclusions on the causal effect of magnetic
stimulation on cortical entrainment and visual modulations.
We hypothesize that TMS sounds (for any of the patterns types and sound modalities tested) might
improve conscious visual detection performance preferentially for ipsilateral targets with regards
to the sham stimulated hemisphere. We do not expect 30 Hz rhythmic sham TMS to significantly
entrain high-beta cortical oscillations in fronto-parietal locations. However previous evidence
(Romei et al. 2012) leads us to hypothesize that sham TMS sounds might be able to phase-reset
cortical oscillations.

66

67
GENERAL METHODS
The work presented in the following result chapters (Projects 1, 2 and 3) combines three
categories of methodological approaches: (1) behavioral evaluations of conscious detection for
lateralized near-threshold visual targets, (2) frontal non-invasive brain stimulation with TMS
bursts and (3) scalp EEG recordings of brain activity.
In all the four studies presented in this dissertation, we followed a common general design
and methods. A conscious visual detection task for near-threshold lateralized targets was
performed by a group of healthy right-handed participants. Active or sham short TMS bursts
made of 4 pulses (or single pulses) were delivered online on a trial-by-trial basis prior to the
onset of a lateralized (left or right) visual target. These interventions aimed to manipulate
(entrain, modulate or interfere with) local activity in right or left frontal sites (right or left FEF)
and, by virtue of such effects, modify the behavioral visual performance that these regions and
their associated networks contribute to. Throughout the experimental sessions and concurrently
with TMS delivery, EEG activity was recorded with a 60 scalp electrode net to assess the impact
of brain stimulation on evoked and oscillatory neural signals. In addition to these three
experimental approaches, participant’s gaze was recorded during the behavioral task by means
of an eye-tracking system to ensure correct central fixation during each trial. In parallel, the
localization of the TMS coil on the scalp (coil center location, orientation angle and tilt angle)
was guided and continuously monitored by means of an MRI-based frameless neuronavigation
system that ensured accurate and consistent transcranial stimulation of cortical targets
throughout stimulation blocks and sessions.
In this chapter, we detail methods associated with each of these three methodological
approaches and address the challenges of combining them in a complex experimental setup in
human healthy participants. This methods chapter will also provide the occasion to specify and
justify the common methodological choices made in designing our studies.

68
I – Behavioral paradigm to assess visual performance
Healthy adult human participants, males and females, were requested to perform a
conscious visual detection task with lateralized near threshold visual stimuli, based on a
spatially un-cued version of the Posner paradigm. We quantified conscious detection
performance changes caused by different conditions of TMS stimulation (brain site, TMS
pattern and TMS modality). We ultimately aimed to assess how such behavioral outcomes
could be modulated by the manipulation of neural activity with TMS patterns in frontal regions
of the dorsal attention network.
I.1 – Near-threshold lateralized visual detection paradigm
The Posner paradigm (Posner 1980; Posner et al. 1980) was designed as a very simple
and barebones perceptual task allowing to study the effects of visuospatial attention and top-
down sensory modulation on conscious visual perception and the relationship between these
two processes. In this paradigm, participants are asked to fixate a central cross on a computer
screen and consciously report the presence of a visual target that could appear in multiple
locations outside of fixation (participants are asked to give a response that equates to “I saw a
target”). Prior to target onset, participants are presented with a cue alerting them of the
imminent target onset. Such a trial is called a ‘neutral’ detection trial. Additional elements can
then be added to this model of a trial to modulate the orientation of the spatial attention of
participants. In Posner and colleagues’ experiments, the pre-target cue was modified to include
some spatial information that would orient participant’s attention to one of the spatial locations
in which the target could appear. In our case, we used pre-target bursts of TMS to modulate the
participant’s attentional state. This paradigm is well-known and well tested and has been used
several times in our team to explore the causal modulation of conscious visual perception with
brain manipulations via TMS (Chanes et al., 2013, 2015; Quentin et al., 2015).
The detection task, synchronized with the delivery of the TMS pulses (see below for
methodology of TMS procedure), was executed in a desktop computer (HP Z800, Hewlett
Packard) using an in-house MATLAB R2012b (Mathworks) script with the Psychtoolbox
extensions (Brainard, 1997).
Participants were comfortably seated in front of a computer screen and a keyboard with
their heads resting on a chin-rest, placed 57 cm away from the center of the screen, to ensure a

69
stable positioning of their eyes. Each trial started with the presentation of a central fixation
cross (size 0.5x0.5o) and a right and left rectangular placeholders (6.0 x5.5o) located 8.5° away
from the fixation cross in the center of the screen. The placeholders indicated the two locations
at which the peripheral target could later appear. Participants were asked to fix their gaze on
the central cross the whole time it was on the screen. This fixation screen lasted between 1000
and 1500 ms to ensure sustained fixation and avoid predictability of upcoming trial events.
Then, the central cross increased its size (0.7 x 0.7o) for 66 ms, acting as a cue to alert the
participants of the imminent apparition of the target.
In 80% of the trials, the target appeared with equal probability in the left or right
rectangular placeholder 233 ms after cue offset and was kept on the screen for 33 ms. The other
20% of trials were ‘catch trials’ in which no target was shown. The window with the response
cue was shown 1000 ms after target offset. On it, two arrow-like signs (“>>>” and “<<<”),
pointing to the left and the right towards the two rectangular placeholders, were presented below
and above the fixation cross. The location of the arrows was randomized trial by trial, so that
participants could not prepare their motor response and had to wait for the apparition of the
response screen to know if the arrow pointing to the location where they saw the target was the
upper or lower arrow.
This was done to ensure that the processing of the visual target was temporally separated
from motor decisions and responses. Premotor and primary motor areas are adjacent to frontal
regions, such as the FEF, involved in attentional orienting and the modulation of conscious
visual perception. Hence, we aimed to ensure that brain activity patterns linked to these two
functions were fully temporally segregated on scalp EEG recordings. Consequently,
participants were not instructed to respond quickly but instead to be as accurate as possible in
their responses.
To provide a response, participants were required to keep the middle, index and thumb
fingers of their left hand placed above three keyboard keys: an upper key (corresponding to the
‘d’ letter key), a lower key (corresponding to the ‘c’ letter key) and the space bar. If the
participants had seen the target they indicated the location (upper or lower) of the arrow that
pointed toward the side (left/right) where they had seen the target. If the participants had not
seen the target they pressed the space bar. The trial ended after participants provided a response.

70
Figure 1. Conscious visual detection task. After a period of fixation, a central fixation cross becomes
slightly larger to alert participants of an upcoming event; then different types of active or sham TMS
pattern are delivered prior to the presentation of a visual target, a 50% visibility Gabor that may appear
at the center of a right or a left placeholder for a brief period of time (33 ms). Participants were requested
to indicate, with the middle, index and thumb fingers of the left hand, whether they did perceive a target
or not (no/yes), and, if they saw it, to signal where it appeared (right/left placeholder) by selecting the
position (upper or lower) of the arrow pointing to the location of the target. Note that catch trials (20%
of the trials) in which no target was presented in any of the placeholders were randomly interleaved on
each block.
While performing the detection task, we ensured that the participants kept their gaze
fixated on the central fixation cross and did not move their eyes to the peripheral placeholders.
We monitored both eyes positions throughout the experiment with a remote camera-based eye
tracking system (Eyelink 1000, SR Research). A trial was considered non-fixated if at any time
between the onset of the alerting cue and target offset, subject’s eyes position was recorded
more than 2° away from the center of the fixation cross on the computer screen. Subjects were
immediately alerted that they had broken fixation at the end of the trial and the non-fixated trial
was randomized to be presented again later in the experimental block. The eye-tracking system

71
was calibrated before the start of the experimental session and re-calibrated at the beginning of
each testing block. If for any reason the gaze tracking became inadequate (for example when
participants moved their heads to a largely different position) the system could also be
exceptionally recalibrated during a block at the end of a non-fixated trial.
I.2 – Visual target properties, features and titration procedures
A Gabor patch (0.5o/cycle sinusoidal spatial frequency, 0.6o exponential standard
deviation) oriented vertically was used as a target stimulus. Gabor patches are widely used as
visual stimuli in psychophysics experiments because they have been shown to optimally
activate neurons in early visual areas (Daugman, 1985). We adjusted the contrast of the target
individually to a 50% detection titration level for each participant. The use of low contrast,
near-threshold Gabors made an otherwise very simple detection task very challenging for our
healthy participants. We made sure that the task was demanding enough so that participants
missed to consciously report at least half of the target, hence leaving room for potential
improvements or degradations of conscious detection performance under the impact of TMS
patterns.
The 50% detection level contrast was determined for each participant during a calibration
block performed before the start of the experimental session. We followed a one-up/one-down
staircase titration procedure (Cornsweet, 1962). The staircase method presents the advantage
of being very efficient and completed in relatively little time because it requires few trials to
reach a threshold. At the start of the titration block, stimulus contrast was set at a Michelson
contrast of 1 which is the method for quantifying stimulus contrast most adapted to gratings or
periodic stimuli like Gabor patches (Kukkonen et al., 1993).
Participants performed the detection task described above and, at the end of each trial,
contrast was adapted: if the presented Gabor was reported as ‘seen’ its contrast was decreased
by one step of contrast, whereas if the participant missed to report a present target the Gabor
contrast level was increased also a step. The initial contrast step was set to the initial contrast
level of 1 Michelson contrast unit and on each response reversal (the target was missed when
in the previous trial it has been correctly reported as ‘seen’ or vice-versa), contrast step was
divided by two. However, throughout the titration procedure, Michelson contrast of the Gabor
target and the contrast step were always kept between 0.005 and 1. The 50% detection contrast
was considered to be reached when Gabor contrast varied by less than 0.01 Michelson contrast
during five consecutive titration trials. The 50% detection contrast level was determined twice

72
using this procedure. If the two measured contrasts differed by less than 0.01 Michelson
contrast, they were averaged and used as the fixed 50% detection contrast for the following
experimental blocks. If not, the 50% detection contrast was determined again. Note that during
the titration block no active stimulation was delivered, subjects only received sham TMS
patterns (see below for details on the TMS procedure).
Control analyses performed on the three datasets that were employed in the results
chapters of this dissertation confirmed the reliability of our titration procedure. This sanity
check showed, that, on average, the groups of participants participating in the three studies of
this thesis verified ~50% detection rates (Fig. 2, grey bar plot representing mean performances
across experimental blocks). However, we noticed that detection performance tended to
decrease with the accrual of experimental blocks (Fig. 2). The long duration of some of our
experimental sessions (~4 hours, including the laborious setting of the EEG cap) made some
participants suffer a steep drop in their detection performance rates towards the end of the
experimental session, no doubt because of a state of cumulated fatigue. In earlier studies using
this same task by our team, this drop in performance was avoided by continuously adjusting
target contrast every 20 trials along each block and experimental session. However, earlier
studies analyzed the impact of TMS patterns on conscious visual detection performance but did
not record ongoing EEG signals (Chanes et al., 2013, 2015; Quentin et al., 2015).
In the three datasets presented in this thesis, we aimed to compare EEG signals across
trials and experimental blocks. To this end, we kept the physiological properties of target
stimuli identical throughout experimental trials to ensure that the amplitude of the EEG
responses to the target onset would not be modulated by a higher or lower target contrast. The
drop of detection rate revealed by our sanity check should not bias outcomes, since the observed
drift in performance did not reach significance for any of the three datasets. Indeed, one-way
ANOVA analyses conducted on measures of detection rate for each dataset and experimental
session independently revealed no main effect of block number (all p > 0.06). Moreover, the
order of experimental TMS conditions across sessions (experimental blocks) was
counterbalanced across participants to avoid systematic biases caused by fatigue on specific
TMS conditions.

73
Figure 2. Changes in detection performances across experimental blocks. Barplots of detection rates
for each dataset analyzed in this thesis (respectively datasets 1, 2 and 3 associated to results of projects
1, 2 and 3 presented in the results section of this dissertation). Colored barplots represent detection rates
for individual experimental blocks. Grey barplots represent the average detection rates across all
experimental blocks. Colored barplots represent individual experimental blocks on each experimental
session for datasets 1 (in red hues), dataset 2 (in green hues) and dataset 3 (in blue hues). Notice that,
for datasets 2 and 3 (corresponding to projects 2 and 3), data was acquired in two separate sessions
(performed 72h to 7 days apart), hence individual blocks (3 or 4 blocks per session) are presented
separately. Mean barplots show that average correct conscious visual detection performance was
centered at ~50% detection rate. Mean performance drifted with the accrual of blocks. Nonetheless none
of the drops in performance observed in boxplots achieved statistical significance.
However, it is interesting to notice that for the data in Dataset 1 and 2 we found a
significant negative correlation between the baseline detection performance (detection rate in
sham trials) and the improvement of target detection by active TMS (difference in detection
rate between active and sham trials) (dataset 1: R2=0.118, p<0.01; dataset 2: R2=0.047, p<0.05;
dataset 3: R2=0.027, p=0.19), which indicates that the lower the detection rate of the participant
is in any experimental block, the higher the improvement of detection performances by TMS
will be in this block. Such a significant relationship between baseline detection rate and
magnitude of TMS effect highlights the need to carefully titrate individual performances prior
to the start of the experimental session and further indicates that the detection task needs to be
made difficult for healthy subjects in order to observe a potential effect of TMS.

74
I.3 – Experimental blocks and session organization
The experimental session consisted in several experimental blocks each testing a different
TMS pattern, which were divided into sub-blocks of 20 trials. The presentation of each type of
trials (no target present / right target / left target, and active / sham TMS patterns) was
randomized for each sub-block. Each sub-block embedded an equal number of sham and active
TMS trials delivering the same pattern and also the same number of left and right stimulus
presentations, including 20% of ‘catch trials’ in which no target was presented.
Each experiment started with a titration block until a stable 50% detection contrast was
reached. Participants then performed a training block in which active TMS trials (half of the
trials were active and half were sham, see below for details on the TMS procedure) were
introduced and participants were given the chance to get used to active stimulation.
Participants’ detection performance, calculated only on sham TMS trials, was checked to make
sure it remained stable around 50% detection rates even with the introduction of active TMS
trials. If needed, target contrast was manually adjusted. Only after the experimenter verified
that: (1) participants had a good understanding of what the task required, (2) they became used
to the sensory sensations triggered by active TMS bursts (sound and tapping), being able to
neglect them to concentrate on the visual detection paradigm, and, (3) they showed consistent
detection performance, experimental blocks started. Participants performed an experimental
block for each of the TMS pattern tested on each of the three studies (see below for full details
on TMS procedures).
At the end of each sub-block during training, and the end of every two sub-blocks during
experimental blocks, participants were provided, via a message displayed on the computer
screen, some feedback on task performance. Information provided included: (1) a warning note
if the alarm rate, i.e., trials in which participants indicated having ‘seen’ a target when no target
was presented on the screen (‘catch trials’), was higher than 50%; (2) the percentage of correctly
detected targets for which they made mistake when reporting target localization (likely by being
too liberal with regards to reporting the presence of a target in a position where none was
presented, or by selecting the incorrect response key when reporting target position); and finally
(3) the percentage of trials in which they had violated gaze fixation requirements. After the
presentation of the feedback, participants were invited take a short break before starting the
next sub-block.

75
I.4 – Subjective and objective measures of perception
The visual detection paradigm used in our three studies is a subjective task that relies on
the introspective report of participants acknowledging if and how they perceived a target. The
subjective evaluation of conscious perceptual representations is challenging as experimenters
need to trust the ability of participants to accurately report recent conscious experiences (‘seen’
or ‘unseen’) when these could suffer assessment biases guiding their decision to report whether
they perceived a stimulus or not (Merikle, 1992).
Other paradigms designed to avoid reliance on subjective reports claim to provide a more
objective measure of perception (Marcel, 1983). In such tasks, participants are requested to give
a forced-choice response on a stimulus, in visual categorization or identification tasks,
regardless of whether they acknowledged to have ‘seen’ the stimulus or not. The perception of
the stimulus is then evaluated on the basis of task performance: if performance nears chance
levels, it is concluded that it was not perceived; whereas when performance is above chance
levels, it is inferred that the stimulus was indeed perceived.
There is a longstanding and still ongoing debate concerning the use of subjective reports
or objective discrimination paradigms to study perception and conscious access which is
beyond the scope of this dissertation (see Merikle 1992; Weiskrantz 1998; Block 2011 for some
representative references on this topic). Nonetheless, indirectly addressing our choice of a
single conscious detection task, prior experiments from our lab assessed during the same trial
the impact of TMS on a forced-choice discrimination task (Gabor line orientation, right or left
tilting) and our subjective visual detection task (reporting absence or presence of visual target)
both similarly titrated (50-75% correct performance) and performed sequentially about the
same previously displayed near-threshold lateralized Gabor. Interestingly they consistently
failed to show modulations by frontal and posterior parietal TMS on the former but not the
latter visual task (Chanes et al., 2012, 2013, 2015; Quentin et al., 2013).
It is difficult to rule out if the dissociation found could be explained by the specific order
in which the two tasks were performed (1st the forced choice discrimination and 2nd the
subjective detection task), differences in titration levels applied to each (50% vs 75% correct
performance) or differences in cognitive demands and the anatomical and physiological neural
substrates subtending and modulating each task. Nonetheless, leveraging on this same debate,
Posner and colleagues observed in seminal studies that identical manipulation of attention
orientation had stronger effects on subjective reports than forced-choice discrimination
paradigms (Posner, 1980). They postulated that this is due to the increased complexity of

76
forced-choice tasks compared to simple ‘seen’/’not seen’ reports. Indeed, discrimination or
categorization of a visual object requires additional processing compared to simple perception
tasks. Moreover, brain networks (Lau & Passingham, 2006) and oscillatory signatures (Benwell
et al., 2017) involved in subjective reports of a conscious experience and those involved in
objective categorization or discrimination tasks have been hypothesized to be distinct and
differentially modulated by spatial attention (Dehaene et al., 2006).
Accordingly, for further studies, we retained the visual task (subjective detection reports)
that had been shown, in prior studies by our team, to be consistently modulated by fronto-
parietal TMS delivered either in single pulses or rhythmic TMS bursts. Prior knowledge,
gathered by our team, of effective TMS timings, patterns and relevant frequencies enabling an
effective modulation of conscious detection performances strengthened this choice (Chanes et
al., 2012, 2013, 2015; Quentin et al., 2013).
I.5 – Signal Detection Theory and visual performance outcome measures
As indicated above, in a conscious detection task based on 1st person reports the subjective
dimension of the response and assessment biases leveraged to take the decision to deem a
perception as deserving to be reported as ‘seen’ or ‘unseen’ can be a source of uncertainty and
behavioral noise. Indeed, even when possessing the same amount of information about a target
stimulus, participants may adopt varying response strategies. For example, very conservative
participants may decide to report a target as ‘seen’ only when absolutely sure that it was present,
failing to acknowledge present targets he/she may have been simply unsure to have seen
according to such a strict personal criterion. In contrast, more liberal participants might
systematically acknowledge to have ‘seen’ a target upon the faintest perceptual sensation of
having seen a target on the screen, hence showing very accurate performance for targets
effectively displayed, but also reporting positively on targets that weren’t actually presented on
the screen during ‘catch trials’ and/or making localization mistakes when asked to indicate if
targets had appeared ‘right’ or ‘left’.
This subjective decision-making threshold has to be differentiated from the perceptual
abilities of the participant. The characterization of this different profiles to avoid experimental
noise in our behavioral measures is achieved by applying the principles of Signal Detection
Theory (SDT) (Green & Swets, 1966; Stanislaw & Todorov, 1999). SDT is employed in
situations where participants are requested to provide a binary response to distinguish between
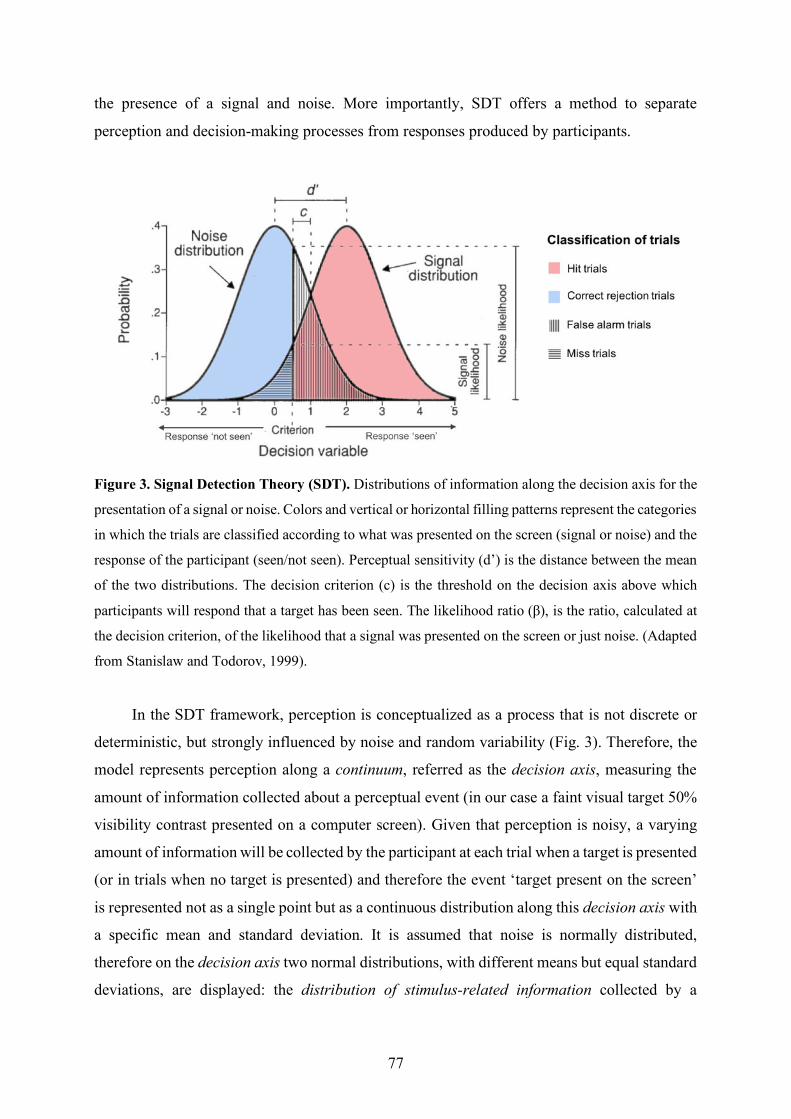
77
the presence of a signal and noise. More importantly, SDT offers a method to separate
perception and decision-making processes from responses produced by participants.
Figure 3. Signal Detection Theory (SDT). Distributions of information along the decision axis for the
presentation of a signal or noise. Colors and vertical or horizontal filling patterns represent the categories
in which the trials are classified according to what was presented on the screen (signal or noise) and the
response of the participant (seen/not seen). Perceptual sensitivity (d’) is the distance between the mean
of the two distributions. The decision criterion (c) is the threshold on the decision axis above which
participants will respond that a target has been seen. The likelihood ratio (β), is the ratio, calculated at
the decision criterion, of the likelihood that a signal was presented on the screen or just noise. (Adapted
from Stanislaw and Todorov, 1999).
In the SDT framework, perception is conceptualized as a process that is not discrete or
deterministic, but strongly influenced by noise and random variability (Fig. 3). Therefore, the
model represents perception along a continuum, referred as the decision axis, measuring the
amount of information collected about a perceptual event (in our case a faint visual target 50%
visibility contrast presented on a computer screen). Given that perception is noisy, a varying
amount of information will be collected by the participant at each trial when a target is presented
(or in trials when no target is presented) and therefore the event ‘target present on the screen’
is represented not as a single point but as a continuous distribution along this decision axis with
a specific mean and standard deviation. It is assumed that noise is normally distributed,
therefore on the decision axis two normal distributions, with different means but equal standard
deviations, are displayed: the distribution of stimulus-related information collected by a

78
participant when there is only noise on the screen (this distribution has a mean value of ‘0´
because no stimulus is presented on the screen, therefore there is no information to be collected)
and the distribution of a visual signal when indeed there is one (in our case a visual target, i.e.
Gabor) present on the screen in addition to noise.
The perception of the subject is measured by a variable called perceptual sensitivity (d’)
which is the distance between the mean of the two distributions. Perceptual sensitivity measures
how much the presence of the signal amongst the noise shifts the distribution along the decision
axis. The more the presence of a target on the screen shifts the ‘signal’ distribution, the less the
‘noise’ and ‘signal’ distribution overlap and the easiest it is for the participant to distinguish
signal from noise. Therefore, the d’ measures the ability of the participant to detect the visual
target. A d’ value of 0 means that the two distributions overlap and the participant cannot
distinguish between signal and noise. The maximal value of d’ is infinite, meaning that the two
distributions do not overlap at all and the participant can perfectly distinguish signal from noise.
The subjective decision criterion (c) of the subject is the value on the decision axis above
which the subject decides enough information has been collected so that he/she can consciously
acknowledge he/she saw the target (‘yes, I saw a target’). If this threshold is not exceeded,
he/she will respond that he/she did not detect a target. This decision criterion can be moved
along the decision axis to be more or less conservative independently of the d’. A criterion of
0 means the subject has no bias (i.e. the decision criterion is placed when the probability for
signal or noise, considering the information collected on the decision axis, is equal). A negative
criterion means the subject is liberal, hence more likely to acknowledge and respond there is a
target in case of doubt. Finally, a positive criterion means the subject is conservative, hence
more likely to respond that no target was presented when in doubt. The subjective decision
criterion of the participant can also be expressed as a likelihood ratio. At a single trial, when a
certain amount of information is collected about the presence of a target, the likelihood ratio
measures how likely is it that this amount of information can be collected in a trial when there
was a target present, compared to trials when there is only noise. The subject will acknowledge
a target was present if this likelihood ratio exceeds a certain threshold (b). A ratio b of 1 means
the subject has no bias, hence there is the same probability for the presence of a signal or noise.
Liberal participants have a threshold ratio below 1 whereas conservative participants have a
ratio above 1.
The theoretical model proposed by the SDT presented above manifests on the
participant’s performance as different types of responses during a visual perception task with
near-threshold low contrast stimuli (see Fig. 3, on the right). Indeed, across trials, the subject

79
could either correctly report the presence of a target (this trial is classified as a ‘Hit’) or miss
the presence of a target (this trial is classified as a ‘Miss’). On catch trials where no target is
displayed on the screen, the participant could correctly report that no target was present (the
trial is classified as a ‘Correct Rejection’) or mistakenly report to have seen a target (the trial is
classified as a ‘False Alarm’). The measures of perceptual sensitivity and subjective decision
criterion defined by the SDT are derived from the proportion of ‘Hits’ and ‘False Alarms’ trials
according to the following formulas:
�# =�'((�) −�'((��) � = −12 2�'((�) +�'((��)4
� = exp 9�'((�): −�'((��):2 ;
Where �'( is the inverse of the normal cumulative distribution function, His the percentage of
‘hit’ trials and FAis the percentage of ‘false alarms’ trials.
In cases in which the percentage of False Alarms is 0 (i.e., subjects were so conservative
that they never made a mistake by acknowledging the presence of a target during a ‘catch trial’)
or the percentage of Hit trials is 1 (i.e., subjects correctly reported the presence of all targets),
the �'( function results into infinite values, which prevents the calculation of inter-subject
averages or the performance of statistical analyses on these measures. The common correction
for such cases is to use a percentage (:? instead of 0 and 1 − (
:? instead of 1, where N is the
number of trials from which this percentage is calculated (Macmillan & Creelman, 2004). For
‘false alarms’ trials, N would be the number of catch trials whereas for ‘hit’ trials, N would be
the number of trials in which the target was present.
In the case of our lateralized conscious visual detection task, since participants were not
only required to respond if the target was present or not but also indicate its location (left/right
of the fixation cross) a trial was only considered a ‘hit’ if the participant: (1) correctly reported
the presence of a target and (2) also correctly identified its location. Consequently, a new
category of trials arose when participant correctly identified the presence of a target but
incorrectly reported its right or left location. These trials were called ‘error’ trials and where
excluded from the analysis given that it was impossible to rule out whether the participants
correctly detected the target but pressed the wrong button to report its location or whether they
wrongly detected a target in a location in which none was displayed. Having the information of

80
where the subject saw a target enabled us to have separate proportions of ‘Hit’ and ‘False
Alarm’ trials for targets presented in the ‘left’ and ‘right’ visual hemifield, hence to calculate
separate perceptual sensitivity and decision criterion measures for both visual fields.
To ascertain the impact of different TMS patterns and conditions tested in our studies on
the subjective conscious visual detection task, we performed three-way repeated measures
ANOVA, with within-subjects factors Visual Field (left and right targets), TMS pattern (see
below for a description of the TMS patterns tested) and TMS condition (active and sham), on
perceptual sensitivity (d’) and response criterion (c and b). According to the main effects and/or
interactions revealed by the ANOVA, we performed t-students tests pairwise comparisons
between specific conditions (find further methodological details in result chapters for Projects
1, 2 and 3).
II – Transcranial Magnetic Stimulation
In our three studies, while participants performed a visual detection task, we used TMS
to causally interact (either entrain, modulate or interfere) on a trial-by-trial basis with local
neural oscillatory activity patterns during a short time window preceding visual target onset.
With TMS, we aimed at manipulating visuo-spatial attention orienting abilities that ultimately
influence the perception of visual stimuli and their conscious access. Previous correlation and
causal evidence indicates that in frontal regions (FEF) of the right hemisphere, high-beta
cortical oscillations within a dorsal fronto-parietal network might subtend the orientation of
attention and the facilitation of conscious visual perception (Buschman & Miller, 2007; Chanes
et al., 2013; Gross et al., 2004). In contrast in the left hemisphere, less uniformly synchronized
(in a sense more noisy) patterns of activity operating in the left frontal regions (~FEF) might
be beneficial for visual detection (Chanes et al., 2015; Rastelli et al., 2013). To this regard, the
addition of specific levels of noise to neural signals has been shown to improve detection at
threshold through a mechanism called Stochastic Resonance (Kitajo et al. 2003; Lugo et al.
2008; Groen and Wenderoth 2016). We tested a variety of TMS patterns to entrain either highly
regular and highly synchronous oscillatory activity or less synchronous and hence more noisy
activity in left and right frontal nodes of the dorsal attentional orienting network.
We chose the use of TMS over non-invasive electric stimulation because magnetic
stimulation benefits from a much better spatial (Bikson et al., 2010; Valero-Cabré et al., 2005)

81
and temporal (Hallett, 2007; Nitsche et al., 2008) resolution, allowing us to modulate neural
activity trial-by-trial in a very specific pre-target onset time window by acting on circumscribed
focal brain regions, something which would be difficult to do with modalities of transcranial
electric current stimulation (tCS) such as tDCS, tACS or tRNS. Compared to tCS, the use of
TMS bursts, either in rhythmic or random patterns, ensures an undisputed ability to effectively
reach and induce depolarization effects on brain cortical regions and, importantly, allows to
record and analyze concurrent EEG activity patterns which are only temporally but not
continuously artifacted by the presence of an electrical field (Noury et al., 2016; Rogasch et al.,
2014).
II.1 – Stimulation parameters
The delivery of TMS was synchronized with the timings of the visual detection task
(Fig. 1). The MATLAB (R2012b, Mathworks) script running the behavioral task sent triggers
to a high temporal resolution multichannel synchronization device (Master 8, A.M.P.I.) which
was in turn connected by BNC cables conveying TTL trigger pulses to operate a biphasic rTMS
stimulator (Super Rapid 2, Magstim) which sent TMS pulses through a standard 70 mm
diameter figure-of-eight TMS coil.
We delivered short TMS bursts (4 pulses, in a span of 100 ms), starting 133 ms and ending
33 ms before the onset of a Gabor patch participants were asked to consciously detect. TMS-
entrained oscillations are short lasting, and changes in power does not extend beyond 1-2 cycles
after the delivery of a single pulse (Van Der Werf & Paus, 2006), or the last TMS pulse in a
short burst (Thut et al., 2011). The effects of TMS on behavior have also been shown to be
short-lasting, with effects of single TMS pulses on conscious visual perception dissipating for
intervals longer than 80-100 ms between a TMS pulse and visual target onset (Chanes et al.,
2012). For this reason, we delivered our last TMS pulse 33 ms (i.e. one full cycle of a 30 Hz
oscillation) before target onset. This time interval ensured, on the one hand, that the last cycle
of 30 Hz oscillations entrained by TMS would very likely be still ongoing at the time of Gabor
onset and, on the other hand, that the interval between the last TMS pulse and the presentation
of the Gabor patch was short enough to exert a robust effect on conscious visual behavior
performance. It should be noted that unpublished data from our team (see PhD thesis Chanes,
2014) suggests that the phase of the entrained high-beta oscillation at visual target onset had no
major effect on the TMS-driven modulation of visual sensitivity (d’) tested in a similar task.

82
We set stimulation intensity at 55% of the maximum stimulator output of our TMS
machine. This is in contrast with many TMS studies that individually customized TMS intensity
to an index of cortical excitability determined in the primary motor regions of each participant
such as the resting motor threshold (RMT) (Rossi et al., 2009). This is possible because the
primary motor cortex is an area that is easily accessible to TMS and provides a visually
detectable (hand muscle twitch) or measurable response to stimulation (hand muscle motor
evoked potential, MEP), to obtain an estimate of cortical excitability. For this reason, a majority
of TMS studies adjust stimulation intensity to the individual RMT, which is the intensity at
which a single TMS pulse can elicit a motor response in resting hand muscles of at least 50 µV
peak to peak in 50% of the trials (Rossini et al., 2015). However cortical excitability in the
primary motor cortex does not necessarily predict cortical excitability in other regions of the
brain (Kähkönen et al. 2005; Stewart et al. 2001). We therefore decided not to adjust stimulation
intensity on the basis of the individual RMT, but instead we relied on several independent TMS
experiments by our team, stimulating the same cortical regions to assess TMS-driven
modulations on a very similar or identical visual detection task as the one we used in studies
presented in this dissertation. These TMS studies reported robust modulation of conscious
visual perception by stimulating at 45% of the maximum rTMS machine output with the TMS
coil placed directly on the participant’s scalp (see Chanes et al., 2013, 2015; Quentin et al.,
2015). Nonetheless, in the studies of this dissertation, we compensated the increased distance
between coil and scalp due to the extra-thickness added by the presence of TMS compatible
EEG electrodes (~5 mm), and estimated that stimulation intensity had to be increased by 10%
and reach a total 55% of maximum stimulator output. Importantly, we tested that this level of
intensity permitted our TMS equipment to recharge its capacitors fast enough (in <20 ms),
hence be able to consistently deliver without losing any power bursts of 4 pulses at the
frequency (30 Hz) probed in our studies.
In any case, to allow for comparison with other TMS studies, at the end of each
experimental session, we determined the individual RMT in the right and left hemisphere. We
localized the cortical hotspot for the abductor pollicis brevis (APB) muscle as the coil position
over the primary motor cortex (M1) yielding the strongest thumb motor activations following
a single TMS pulse. Once the hotspot was found, coil position was fixed above this position
and stimulation intensity was progressively lowered to reach the TMS intensity at which 5 out
of 10 single pulses yielded an activation or the APB. This intensity was defined as the RMT.
For all studies, we report the average stimulation intensity expressed as the mean ± standard

83
deviation percentage that the fixed intensity of 55% of the maximal motor output used in our
studies represented with regards to individual RMT.
II.2 – Design of rhythmic and random TMS patterns
In our three sets of studies, we delivered four different TMS patterns, designed to either
entrain cortical oscillations or neural noise patterns. First, following the example of alpha (10
Hz) rhythmic TMS patterns developed by Thut and colleagues (2011) to progressively entrain
cortical oscillations, we delivered a rhythmic TMS bursts made of 4 pulses regularly spaced in
time to build a 30 Hz frequency, i.e. with a constant inter-pulse interval of 1/30 seconds (~33
ms) which corresponds to a full cycle of a 30 Hz oscillation.
We also designed 3 other non frequency-specific TMS patterns (Fig. 4). The design of
these patterns was carefully controlled so their impact on perception could be compared to the
main high-beta rhythmic pattern. All the patterns contained the same number of pulses (i.e. 4
pulses) to ensure they delivered the same exact amount of total stimulation, (i.e. that the targeted
region received the same amount of energy from all patterns). Additionally, the onset timing of
the 1st and 4th pulse remained fixed across all 4 TMS patterns to ensure stimulation was
delivered across the same time window (100 ms) and that the interval between the 4th and last
pulse of the burst and the target onset was kept constant. On top of these free design choices,
we were constrained by technical limitations that compromised the variety of patterns we could
deliver. Indeed, at least 20 ms were required by the TMS stimulator to recharge after each pulse
and be able to accurately deliver a new pulse at the established intensity (55% maximum
stimulator output), hence two adjacent pulses could not be delivered less than 20 ms apart.
Non frequency-specific patterns were originally designed to avoid carrying a unique
frequency so that, when contrasted with rhythmic patterns, one could isolate the contribution of
a high-beta 30 Hz frequency to the TMS-driven modulation of conscious visual detection.
Additionally, we made the hypothesis that given their mixed temporal structure containing
different inter-pulse intervals, hence more than one pure high-beta frequency, non frequency-
specific patterns would carry higher levels of noise and increase power in a broader frequency
band than high-beta 30 Hz rhythmic patterns designed to entrain pure 30 Hz oscillations.

84
Figure 4. Schematic representation of the TMS patterns employed in active and sham stimulation.
Frequency-specific 30 Hz rhythmic pattern designed to entrain oscillatory activity at the input frequency
in the cortex and 3 non-frequency specific patterns designed to induce different levels of noise in the
cortex.
All the non frequency-specific patterns contained unequal interpulse intervals. In the non-
uniform rhythmic pattern the two middle pulses where anticipated and delayed, respectively,
by 9 ms from the timing of the regular rhythmic pattern. However, a potential design weakness
of this pattern, is that, even if it is not completely regular (and does not contain a single
frequency), it does contain a repeating inter-pulse interval of 24 ms at the beguining and end of
the burst (Fig. 4) which could be held responsible for entraining oscillations outside of 30 Hz.
A second non frequency-specific pattern was designed, the random pattern, in which the
onset time of the two middle pulses were randomly jittered trial-to-trial with the constraint that
they had to be shifted at least 3 ms away from the onset time in the rhythmic pattern to make
sure that random patterns would never deliver a perfectly regular 30 Hz frequency. However,
since the timing of the two middle pulses were randomly jittered around (preceding or
following) the onset times they had in the rhythmic frequency-specific pattern, on average over
all trials the onset times of the pulses in the random pattern is quite close to the timings for the
30 Hz frequency-specific rhythmic pattern.
The last pattern we designed, the so called irregular pattern, seeked to avoid the
shortcomings of the two previous patterns. It had fixed pulse onset times that were chosen
randomly with the only constraint that all 3 inter-pulse intervals within the burst had to have

85
different lengths. The non-uniform rhythmic and random patterns have been used as successful
controls to rhythmic stimulation in previous work by our team (Chanes et al., 2013, 2015;
Quentin et al., 2015). The irregular pattern is a new pattern engineered to induce the maximum
level of noise in neural systems.
Given the technical constraints limiting the design of TMS bursts, our 4 patterns could be
claimed to be quite similar to one another with regards to their temporal structure. However,
the role of oscillations in stimulus coding or information processing enabling cognitive
operations is supposed to be exquisitely fine-tuned to specific frequencies and hence such
strong inter-pattern similarity could play to our advantage and be considered a strength of our
experimental design. By keeping the TMS patterns so similar to each other, any statistically
significant difference in perceptual detection measures or EEG activity across TMS patterns
could only be explained by virtue of their differences of temporal structure. Said otherwise, at
the risk of minimizing or cancelling inter-pattern differences on behavioral and
electrophysiological correlates, this design provides maximal sensitivity to isolate the impact
of pattern frequency in oscillatory entrainment, and assess the influence of different levels of
neural noise on brain systems.
Since its inception as a causal mapping technique in cognitive neuroanatomy TMS effects
interfering with cognitive processes were hypothesized to be caused by neural noise (Walsh &
Cowey, 2000). However, in spite of research directed to demonstrate this hypothesis in visual
systems (Ruzzoli et al., 2011, 2010; Schwarzkopf et al., 2011; Miniussi et al., 2013), different
complex non-synchronous TMS patterns have never been systematically compared to study
their impact on neural activity and specific behaviors.
Instead, since 2008 tCS based-technologies such as transcranial Alternate Current
Stimulation (tACS) and transcranial Random Noise Stimulation (tRNS) characterized by their
ease and flexibility of use, low cost and excellent safety profile have gained increasingly
popularity as technologies of choice to entrain oscillations and induce neural noise,
respectively. tACS uses a continuous sinusoidal current oscillating at a single frequency, to
entrain rhythmic cortical activity patterns or phase-synchronize regions. tRNS delivers a wide
variety of asynchronous stimulation, from mixed broadband patterns across specific bands of
choice to electrical white noise (Terney et al., 2008). Additionally, it allows to manipulate the
magnitude of delivered noise by changing the intensity of the current (Groen & Wenderoth,
2016). Despite these apparent advantages, both tACS and tRNS suffer from similar limitations
as any tCS technologies, hence we found both of them unsuited to the purposes of the studies
presented in this dissertation.

86
First, given their poor temporal resolution, which at the very best is in the order of seconds
or minutes (Nitsche et al., 2008), neither tACS nor tRNS are adapted for the delivery of episodic
patterns targeting specific time windows in a trial-by-trial basis in the context of a task. Second,
all tCS technologies including tACS and tRNS have a rather poor spatial resolution, which
makes them suited to act on large cortical areas, but unable to achieve the necessary spatial
specificity to target specific nodes of the dorsal attentional network such as right or left FEF
(Datta et al., 2008). Third, the effects of tCS modalities such as tACS and tRNS are considered
hard to model accurately. Hence it is quite complex to predict which cortical regions are
impacted and how much intensity these regions will receive using a given montage (Bikson et
al., 2010; Datta et al., 2012). Fourth, the presence of a continuous electrical artifact, either
constant for tDCS, oscillating for tACS or broadband for tRNS makes it extremely challenging
to record online cortical activity with scalp EEG and characterize their effects on oscillations
or neural noise (Noury et al., 2016; Noury & Siegel, 2018). Fifth and last, a vigorous debate is
currently questioning if the highest levels of tCS current provided by commercial devices
(limited for technical and safety reasons to ~1.5- 2 mA with 25-35 cm2 electrodes) may reach
cortical systems with the sufficient strength to significantly shift the resting membrane potential
of stimulated neurons (Lafon et al., 2017; Vöröslakos et al., 2018; reviewed in Liu et al., 2018).
As a result, its ability to induce consistent improvements of cognitive functions (Horvath et al.,
2015) or genuinely modulate cortical rhythms in healthy participants (Asamoah et al., 2019)
remains controversial, could be in part explained by peripheral sensory effects (Asamoah et al.
2019) and might require currents of at least 4 to 6 mA to be overcome the high resistivity of the
skin to electrical currents (Liu et al., 2018).
Given the above-mentioned limitations of tCS, and to be able to compare current findings
to prior outcomes obtained with online trial-to-trial rhythmic TMS bursts assessing conscious
visual perception (Chanes et al., 2013, 2015; Quentin et al., 2015) we opted for using this same
technique to entrain oscillations or induce neural noise levels. To the best of our knowledge,
our studies will spearhead the manipulation of neural noise levels with TMS bursts and scalp
EEG recordings. Should it prove possible, this approach carries a lot of promise for
experimental work assessing site, time and pattern specific effects of noise in brain coding and
processing.
In addition to active TMS control patterns, we also delivered sham TMS trials, interleaved
with active TMS trials during the same blocks. To this end, we used a second TMS equipment
(Magstim, Super Rapid 2) attached to a TMS coil positioned in a sham configuration, i.e., on a
neighboring region adjacent of the actively site, with the left edge of the coil in contact with the

87
scalp and its stimulation surface oriented perpendicular to the skull to direct the magnetic field
away from the scalp. Sham stimulation aimed to mimic the clicking noise characterizing the
delivery of active TMS pulses and was used to control for rhythmic or random sound
stimulation patterns, collaterally associated with TMS delivery without effectively stimulating
the brain.
However, delivering standard sham stimulation with a second TMS coil placed close to
the active TMS coil, as described above, can be cumbersome and logistically demanding. It
requires a second rTMS machine and a coil (both, quite expensive materials to be used for a
placebo effect) and an articulated mechanic arm holder (Manfrotto) placed concurrently as
close as possible on the participant’s head. For this reason, we tested replacing the second TMS
coil and rTMS machine by an audio speaker mounted on the active coil playing a recording of
the clicking sounds of TMS (TMS-like sounds) on a trial-by-trial basis with the exact same
onset time as active pulses.
To generate the sound file reproducing a TMS clicking sound, we recorded the sound
generated by 100 single TMS pulses (Aiwa CM-S32 stereo microphone) and averaged the
individual waveforms to build a sound template emulating the waveform of the TMS clicking
sound. The envelope of this waveform was then adjusted so that, when played through our
speaker (Mobi Wavemaster), the audio of the click sounded as similar as possible to the sound
of an active single TMS pulse delivered through a TMS coil placed on the participant’s head.
Systematic debriefing indicated that participants who underwent two experimental sessions,
one with sham TMS delivered through a TMS coil placed perpendicular to their scalp and a
TMS-like sham sound delivered through a speaker mounted on the active coil, were unable to
detect the difference between the two sham conditions.
II.3 – Cortical target selection and MRI-based frameless neuronavigation
In our studies we focused on stimulating either the right or the left Frontal Eye Fields
(FEFs), both key frontal nodes of a bi-hemispheric dorsal attentional orienting network
(Corbetta & Shulman, 2002; Vernet et al., 2014). These two sites were identified and labelled
in MNI space as spherical regions of interest of 5 mm radius centered on Talairach coordinates
x=31, y=-2, z=47 for the right FEF and x=-32, y=-2, z=46 for the left FEF (Paus, 1996). A T1-
weighted MRI scan (3T Siemens MPRAGE, flip angle=9, TR=2300 ms, TE=4.18 ms, slice
thickness=1mm) was acquired for participants of all studies to label the target and
neuronavigate the TMS coil. The transformation matrix from normal to native space was

88
computed for each individual MRI scan using the SPM8 toolbox running on MATLAB
R2017b. Then, the regions of interest centered on the right and left FEFs were denormalized
into the MRI native space for each individual subject and used as a target for TMS stimulation.
The targeting of our cortical targets was controlled throughout the experiment by an MRI-
based frameless neuronavigation system (Brainsight, Rogue Research). During each block, the
TMS coil was hand-held and kept on the labelled sites within ~3 mm of the target. The theorized
trajectory of the TMS field penetrating through bone and meninges to reach the cortical surface
had to be adapted to each participant’s head shape. Nonetheless, the TMS coil was placed and
angled on the scalp so as to leave the shortest possible distance between the center of the
stimulation coil and the cortical region of interest. To the best of our abilities, on each
individual, the TMS coil was kept tangential to the scalp, with a fixed anterior-to-posterior and
lateral-to-medial orientation angle (~45o to the interhemispheric longitudinal fissure, handle
pointing rostral and lateral). We also used the lowest tilt angle (<10 o) that the curvature of the
scalp on the contact zone allowed, ensuring the shortest straight path between the center of the
coil stimulation surface and the aimed cortical target on the right or left FEF.
This rigorous placement of the coil is paramount since the intensity of the magnetic field
generated by the coil decreases exponentially with distance (McConnell et al., 2001; Stokes et
al., 2005). If the center of the coil is not placed at a tilt angle that ensures maximal tangentiality
and the shortest straight path to the cortical target, the magnetic field has to cross a longer
distance to reach the cortical surface and the intensity of the induced electrical current is
weakened. Once the optimal TMS coil position, orientation angle and tilt was found for an
individual participant the neuronavigation software (Brainsight, Rogue Research) recorded the
coil’s spatial coordinates allowing us to maintain across blocks and sessions performed on
different days the exact same TMS coil position.
III – Concurrent TMS-EEG recordings of brain activity
To evaluate the online effects of TMS on brain activity and better understand the features
of TMS-induced oscillatory entrainment or TMS-generated neural noise, we recorded scalp
EEG activity prior, during and following stimulation. To this end we applied and developed in
our lab existing methods for the recording of concurrent TMS-EEG datasets, to study either
TMS-Evoked Potentials (TEPs) or the impact of magnetic stimulation on time-frequency

89
electrophysiological activity (Bonato et al., 2006; Paus et al., 2001; Van Der Werf & Paus,
2006; Van Der Werf et al., 2006), a procedure that has seen increasing developments during
the last decade. However, concurrent TMS-EEG recording presents some extremely
challenging technical problems due to the high amplitude artifacts generated on EEG recording
during TMS pulse discharge.
III.1 – Electromagnetic TMS-EEG artifact removal and data cleaning
procedures
The discharge of a magnetic pulse by TMS generates a short-lasting electric field many
orders of magnitude higher than the electric fields originating from the brain that conventional
EEG systems are designed to record. The discharge of a TMS pulse will therefore saturate
conventional EEG amplifiers and result in artifacted signals for up to hundreds of milliseconds
post-pulse (Ilmoniemi & Kičić, 2010) preventing the accurate recording of crucial post pulse
or intra-burst effects. TMS can also induce eddy-currents in the conventional EEG contacts
which could significantly warm up the electrode surface with the accrual of magnetic pulses
(Ilmoniemi & Kičić, 2010) although this risk has been greatly minimized with new slitted
electrode designs and materials (Thut et al., 2005; Virtanen et al., 1999). Finally, electrical
recharge artifact can be observed as spikes in between pulses as capacitors uptake new current
to deliver the upcoming pulse (Ilmoniemi et al., 2015). Precautionary measures can be
implemented during recordings to minimize TMS artifacts, such as employing TMS-
compatible EEG amplifiers and electrodes designed to limit the impact of stimulation artifacts
during online recordings (Ilmoniemi & Kičić, 2010). Additionally, ensuring very low skin-
electrode impedances (ideally <5 kOhm with passive electrodes, <35 kOhm with active
electrodes) helps minimizing artifact duration (~6-12 ms) (Veniero et al. 2009) and thus
preserves the most amount of un-artifacted neural signal in between the pulses of a burst.
Nonetheless, a TMS-generated pulsed electromagnetic artifact cannot be totally avoided and
will always leave a trace in EEG recordings. Artifacts will need to be carefully cleaned from
the EEG datasets before further evoked potential or time-frequency analyses can be undergone.
Additionally, the TMS field spreads onto branches of the spinal (XIst cranial nerve) or
facial (VIIth cranial nerve) nerves or directly into the neck, scalp and facial muscles (trapezius,
temporalis, masseter, orbicularis, frontalis muscles) and can cause involuntary muscle twitches,
resulting in mechanical electrode displacement and evoked electromyographic (EMG) activity
which generate artifact scalp EEG signals (Ilmoniemi & Kičić, 2010). Moreover,

90
somatosensory inputs associated with scalp tapping and facial muscle twitches will also convey
afferent proprioceptive and tactile inputs via branches of the trigeminal (Vth cranial nerve for
frontal, temporal, parietal regions) and the spinal (XIst cranial nerve for occipital regions)
cranial nerves, and hence induce evoked activity in contralateral central-parietal EEG contacts.
Finally, the loud clicking noise associated with the delivery of magnetic pulses has the potential
to activate cochlear auditory receptors by mechanical transduction via the external and middle
ear (and also through direct bone vibration of the cochlea) and may generate in EEG recordings
time-locked auditory evoked potential (Nikouline et al. 1999) in contralateral and also
ipsilateral central-temporal EEG contacts. Occasionally, in some participants, automatic startle
responses triggered by intense and unexpected stimulation accompanying sensations (sound
and/or tactile tapping sensations) may also manifest as eyelid blinks or eye movements, which
tend to significantly dwindle as participants get habituated to stimulation.
Given all these sources of non-neural electrical activity, extensive cleaning of TMS-
related artifacts from EEG recordings is paramount for further analyses. To this end, several
TMS-artifacts cleaning methods have been proposed. The first methods subtracted TMS-EEG
time series obtained during a control condition in which TMS was delivered with the brain ‘at
rest’ (i.e., while no activity was engaged via a stimulus or task) from TMS-EEG time series of
interest obtained when TMS was delivered on a stimulus- or task-activated brain (Thut et al.
2003; Thut et al. 2005). However, in addition to auditory and somatosensory evoked potentials
related to sensations accompanying TMS delivery (sound and tapping), this subtractive
approach cancels from the signal the cortical physiological activity elicited by the delivery of
the magnetic pulse itself. It is hence well suited to characterize EEG activity changes produced
on task-related brain activity correlates by the delivery of a TMS pulse, but remains however
blind to TMS-induced changes in cortical activity. And yet, to index levels of local cortical
excitability or to pinpoint functional connectivity features of brain networks (Nikulin et al.,
2003; Rosanova et al., 2009; Van Der Werf & Paus, 2006; Van Der Werf et al., 2006) TMS-
induced brain activity cannot be disregarded as artefactual activity and hence subtracted from
EEG traces during artifact cleaning.
Alternative cleaning methods have applied Kalman filters to remove the electrical artifact
that arise from the strong currents induced on scalp EEG electrodes during the delivery of
magnetic pulses (Morbidi et al., 2007). Others have used Principal Component Analysis (PCA)
to identify topographies related to TMS artifacts originated outside of the brain, segregate such
topographies from sources of biologically meaningful brain activity, then subtract the former
from unprocessed raw EEG signals (Litvak et al., 2007). Nonetheless, the variety of methods

91
developed over the years that we reviewed here are yet to be proven consistent and effective
for TMS-EEG analyses and require further development and sophistication.
Pending further progress, the most widely applied approach for TMS-artifact cleaning is
based on Independent Component Analysis (ICA), a method able to decompose a mixed signal
back into the independent sources that compose it, even in cases where no information about
the original sources and how they are mixed is available (Hyvärinen & Oja, 2000). ICA makes
a number of assumptions we need to be aware of. First, mixed signals decomposed by the ICA
must be a linear summation of the signal from all its independent sources. Second, the time-
courses of the source signals must be statistically independent from each other at any point in
time (i.e., knowledge about the time course of one source provides absolutely no information
about the time-course of any of the other sources). Third and last, the mixing matrix (similar to
a weighting matrix) that describes how sources sum up together to produce the mixed signal
must not change over time. These three assumptions apply plausibly to EEG mixed signals
(Onton et al., 2006) and ICA assumes that such signals are a linear sum of activity coming from
multiple sources (cortical sources that have functionally specific signals and are therefore
independent from one another as well as sources outside the brain generating artifacts), that are
stationary in space and therefore can be characterized by a stable topography in electrode space.
The ICA procedure decomposes the EEG signal into source signals, including artifactual
signals, and can, once the artifactual sources have been identified, remove artifact from EEG
signal by a simple subtraction of artifactual sources from the mixed EEG time series.
ICA has therefore proven to be a very powerful method for artifact correction and has
long been used to clean of a wide variety of EEG artifacts such as eye blinks, EMG activity or
50/60Hz noise from power lines (Iriarte et al., 2003; Jung et al., 2000). However, compared to
other artifacts cleaned with ICA, TMS artifact present particularities that require a careful use
of this approach. In the first milliseconds following pulse delivery, TMS artifacts have a much
higher amplitude than other EEG artifacts. When such high amplitude artifact are present in
datasets, they will dominate the topographies of the components identified by the ICA and
distort those corresponding to components associated to neural signal (Hernandez-Pavon et al.,
2012). Moreover, if the assumption that the EEG signal is composed of the sum of spatially
stable sources can be generally considered to be correct, this might not apply during the early
part of the TMS artifact. This is because the first 10 ms of the EEG signal following the pulse
contain several transient spatial components (Litvak et al., 2007) and make it difficult for ICA
to identify a component corresponding to this early portion of the TMS artifact. Contrary to the
later part which is very consistent trial-to-trial, hence can be cleaned effectively by subtraction

92
of TMS-artifact template, the first 10 ms of the TMS artifact show a more stochastic time-
course that is not well corrected by the subtraction of a template (Thut et al. 2005). For these
reasons, the early epoch of the TMS-artifact (usually 10-15 ms of signal) must be removed from
the TMS-EEG signal before ICA can be applied to clean the remaining parts of the artifact. It
should be noted that other TMS-EEG cleaning methods have not yet been able to consistently
and satisfactorily clean the early component of the TMS artifact either. Hence, whether one
uses the average TMS-template approach, PCA or ICA to subtract the TMS artifact from the
EEG signals, or employs a ‘sample-and-hold’ circuit to prevent the recording of the TMS
artifact on EEG systems, EEG signals directly following the delivery of each TMS pulse will
be lost anyway.
The independent components extracted from the signal by the ICA are visually inspected
and four types of artifact are identified: (1) Eye blinks and eye movements. These components
are identified on the basis of their topography as located on the most frontal scalp electrodes.
They are also characterized by time-courses that show bell-shaped artifacts when the subject
blinks; (2) Electrode malfunctioning (transient disconnection or ‘bad’ impedances). These
components are characterized by topographies concentrated on a single electrode and high
signal amplitudes but only present in isolated time periods or trials. The removal of these
components have little impact on the average across trials (Rogasch et al., 2014); (3) Power
line (50 Hz/60 Hz) artifacts or land noise. In our recordings made in France, these components
are identified by a 50 Hz peak in their Fourier spectral analyses; Last but not least, (4), residual
TMS artifacts. Components are identified as TMS artifacts if their topography is mainly found
on EEG contacts in the neighborhood of the TMS coil scalp location and also if their time-
course shows sharp peaks exclusively time-locked to the TMS-pulse onset time (Rogasch et al.,
2014). In the case of repetitive or rhythmic TMS delivered at a specific frequencies (in our
studies high-beta stimulation at 30 Hz), the TMS-artifact components can also be identified by
a power spectrum showing a strong peak at the frequency of stimulation (Hamidi et al., 2010).
All the components identified as artefactual can then be removed from the EEG signal.
A drawback of using ICA as a cleaning method for TMS-related artifacts is that the
components separated by ICA are independent from one another. However, TMS-related
artifacts and also part of the TMS-induced cortical activity are time-locked to the onset of the
TMS-pulse. This correlation in time violates the assumption of independence of the sources
and might make it difficult for the ICA to correctly separate TMS-related artifact from cortical
activity. Using ICA to clean the TMS-artifact might therefore be too stringent and remove from
the EEG signal some of the physiological responses to TMS together with the artifact (Hamidi

93
et al., 2010). A potential solution in case too many components that seem to contain both artifact
and cortical activity are identified, is to perform two rounds of ICA. The first ICA will remove
the brunt of high amplitude TMS-artifact whereas the second ICA might better separate less
prominent residual TMS artifacts from cortical activity (Hamidi et al., 2010; Rogasch et al.,
2014).
Despite this limitation, most artifactual components identified by ICA do not mix artifact
and neural signals (Rogasch et al., 2014) and any TMS-induced activity that does not share a
precise topography with the TMS artifact and is not strictly time-locked with pulse onset will
be correctly separated by ICA (Hamidi et al., 2010).
Finally, it is worth mentioning that in experiments contrasting active TMS with a sham
TMS control condition, or any other control condition bearing no stimulation, it is important to
apply the exact same cleaning procedure (artifact removal, interpolation and ICA cleaning) to
all the conditions to be compared. This ensures that any difference observed in the EEG signal
with or without active stimulation cannot be attributed to artifacts introduced in the signal by
the TMS-artifact cleaning procedure.
III.2 – Concurrent TMS-EEG recordings and EEG data pre-processing
We recorded EEG signals with a TMS-compatible system (BrainAmp DC and
BrainVision Recording Software, BrainProducts GmbH) with a 60 electrodes net spread on the
scalp following to the international 10-20 system. We placed the reference on the tip of the
nose, far from the position of our TMS coil (on ~FC2 and ~FC3 electrodes, for the right and
left FEF respectively) to prevent the electromagnetic TMS artifacts to impinge on our reference
signal, and the ground on the left earlobe. We recorded EOG signals from 4 additional
electrodes positioned on the left and right temples and above and below the right eye. To
minimize the duration and the amplitude of the TMS-EEG artifact we monitored the
impedances throughout each experimental sessions, before every evaluation block, and we kept
them at all times below 5 kOhm (Veniero et al., 2009). To best capture high frequency
variations of TMS artifact and also to minimize its duration we digitized the signal at a high
sampling rate of 5000 Hz (Veniero et al., 2009), which was the highest allowed by our EEG
equipment.
All EEG analysis and preprocessing were performed on MATLAB R2017b with the
FieldTrip toolbox (Oostenveld et al., 2011), an open-source toolbox for EEG analyses. The
EEG and EOG signals were epoched on a [-2 2] s window centered on the target onset. A first
94
automatic analysis removed trials in which the fixation requirements, monitored by an infrared
camera-based eye tracking system (Eyelink 1000), on the central fixation cross were violated.
These events were however very rare as for a majority of studies of this dissertation participants
were warned about incorrect fixation. Also note that any trial where fixation was broken was
repeated in randomized order in the sub-block. The timings of the triggers commanding the
delivery of TMS pulses were also automatically checked post-hoc and the extremely rare cases
of trials in which triggers were not delivered within an acceptable timing (i.e. they varied by
more than ± 3 ms from their correct onset time) were also excluded from further analyses.
Following automatic rejection of trials, all remaining trials were inspected visually and trials
containing blinks or muscle artifacts within an epoch of [-500 500] ms around target onset,
which corresponded to the window of interest in which to compute and analyze time-frequency
measures, were also excluded.
On the remaining trials, the electromagnetic TMS artifact was cleaned following the ICA
cleaning procedure highlighted in a prior section. Data within a [-4, +12] ms window centered
on the onset time of each TMS pulse (active or sham) was removed and interpolated with a
shape-preserving piecewise cubic interpolation. Datasets were down-sampled to 500 Hz to
reduce the volume of our files and processing time. Then time series corresponding to all
experimental conditions were gathered together in a single EEG dataset on which ICA was
applied. We visually inspected all independent components and identified artifact components
according to the features detailed in previous section. We then removed signal components
corresponding to eye movements, electrode malfunction, 50 Hz power line artifacts as well
residual TMS artifacts. After ICA cleaning, datasets were separated back by experimental
conditions.
III.3 – Control analysis on the TMS-EEG artifact removal and data
cleaning procedures
To ensure that the data cleaning procedure did not alter the EEG signals outside of the
small window where TMS artifacts were removed and to verify that artifact removal and
cleaning procedures applied to our original raw TMS-EEG data could not explain some of the
results we hypothesized for our studies, we conducted a control analysis. More specifically, our
main experiments were directed to study the EEG local and network-wide correlates of high-
beta oscillatory entrainment during the delivery of short rhythmic TMS bursts at 30 Hz

95
Figure 5. Control analyses to rule out an impact of TMS artifact cleaning procedures applied
to our EEG data. The figure shows data from representative trials of EEG datasets associated to the
following conditions: (A, left & right) Eyes-Open resting state EEG and active rhythmic TMS-EEG.
(B) Addition of TMS-artifacts from randomly selected active rhythmic TMS-EEG trials (right) to
our original eyes-open resting-state EEG dataset (left). (C to E) TMS-EEG artifact removal steps
applied to resting-state EEG data with added artifacts (C-D-E, Left) and active TMS-EEG data (C-
D-E, Right). (C) Removal of EEG TMS artifacted data within a [-4 +12] ms window around each
TMS pulse onset to eliminate high-amplitude portion of TMS artefacts. (D) Interpolation of blank [-
4 +12] ms periods left after artifact removal with a shape-preserving piecewise cubic interpolation.
(E) TMS artifact-free EEG time series with interpolated data following the removal of ICA
components corresponding to eye movements, electrode malfunctions, 50 Hz powerline artifact and
residual TMS artifacts.

96
compared to random TMS. Hence, we aimed to carefully verify that the different steps of data
cleaning highlighted in prior sections could not be held responsible of artificially increasing
high-beta rhythms in either sham or active TMS-EEG signals. More generally, since most of
our analyses were conducted in the frequency-domain we also verified that our cleaning
procedure did not distort the power-spectrum of our original EEG time series.
We artificially added TMS ‘artifacts’ to series of artifact-free EEG signals obtained
during eyes-open resting-state recordings (see Fig. 5A & 5B left panel). The templates of TMS-
artifacts added to resting state EEG data were obtained from 150 randomly selected trials from
an active 30 Hz rhythmic TMS-EEG dataset (Fig. 5A right graph). Individual TMS artifacts
were detected on single trials using the automated artifact detection algorithm implemented in
the FieldTrip toolbox (Oostenveld et al., 2011). The data was pre-processed to maximize jump
artifacts, then the envelope of the signal was z-normalized. Any data sample that crossed the z-
value threshold of 0.8 was considered part of a TMS-artifact (Fig. 5B, left panel, signal in red).
Artifacted samples on single trials were cut from the active TMS dataset and added to epoched
resting-state EEG signals (Fig. 5B), generating 150 artificially artifacted resting-state EEG
trials. Artificially ‘artifacted’ data, along with active TMS-EEG data, underwent the artifact
removal and cleaning procedure described above (Fig 5C to E).
On both real artifacted TMS-EEG data and artificially ‘artifacted’ resting state EEG data,
we computed, for electrode FC3 (i.e. the closest contact to the TMS coil site in this dataset and
hence showing the maximal amplitude of TMS artifact), the power spectrum for frequencies
between 6 and 80 Hz on a short time window surrounding the delivery of TMS pulses ([-166
0] ms) using Fourier transformation with multi-taper method. Since the EEG power spectrum
data were not normal (deviation from normality asserted with Shapiro-Wilk test, p<0.05) we
compared with two-sided Wilcoxon tests (alpha = 0.05) real artifact TMS-EEG data with
artificially ‘artifacted’ resting state EEG data before and after TMS artifact removal and
cleaning. We also compared raw resting state EEG data with the artificially ‘artifacted’ EEG
data following TMS artifact removal. We first compared these datasets for the 30 Hz frequency
band (the main frequency tested in our studies), and then across all frequencies within a [6 80]
Hz window, with Bonferroni correction for multiple comparisons.
We first demonstrate that our method of artificial addition of TMS ‘artifacts’ to resting
state EEG datasets correctly reproduced the amplitude of the artifact from real artifacted data
(Fig. 6A). The magnitude of the artifact on the power spectrum at 30 Hz (Fig. 6A, bottom graph)
was identical for both real artifacted TMS-EEG data and artificially ‘artifacted’ EEG resting

97
state data (p>0.4). Comparisons of the two power spectra across all frequencies also revealed
no significant differences between real and artificially ‘artifacted’ EEG data (all p>0.05).
Next, we show that our TMS-EEG cleaning procedure did not generate any change in the
power spectrum of the original EEG resting state data (Fig. 6B). Indeed, statistical comparison
of the power spectrum of resting state data before the addition of TMS artifacts and after the
artifact removal procedure showed not differences in the power neither at 30 Hz (Fig. 6B,
bottom graph) nor for any other frequency (all p>0.05).
Figure 6. Effect of TMS-EEG cleaning procedure on signal power spectrum. Top row shows power
spectra for frequencies within a [6 80] Hz window. Shaded colored areas represent 95% confidence
intervals for median power. Bottom row shows boxplots for log power between the compared conditions
at 30 Hz frequency. (A) Comparison of artifact size on power spectrum for real TMS-EEG artifacted
data (blue line) and resting state EEG data with artificially added TMS ‘artifacts’ (red line). (B)
Comparison of power spectra for resting-state data before the addition of TMS artifacts to resting state
EEG data (black line) and after the removal of artificially added TMS ‘artifacts’ to the same resting state
EEG data (red line) by means of our TMS-EEG artifact removal and cleaning procedure. (C) Power
spectra for cleaned resting-state EEG data with artificially added TMS artifacts (blue line) and TMS-
EEG signals recorded during the delivery of active 30 Hz rhythmic TMS (red line), on both cases after
applying the same artifact removal and data cleaning procedure. TMS artifact cleaning procedure did
not introduce 30 Hz power in our dataset (panel B bottom, n.s = non-significant) therefore any
significant differences in power spectrum (after TMS artifact cleaning procedure) between active TMS
and resting state data (panel C, ***: p<0.001) cannot be artifactual signal from our data cleaning
procedure.

98
Lastly, we were able to show that, following our TMS artifact removal procedure, the
delivery of 30 Hz TMS bursts on active TMS data significantly increased the power at the
frequency of stimulation compared to resting-state data (Fig. 6C, bottom graph p<0.001).
Comparison between resting state data and active TMS data also showed significant differences
in power for all frequencies within the [6 80] Hz window (all p<0.001, with Bonferroni
correction for multiple comparisons).
The result of our control analysis confirmed that TMS artifact cleaning procedure did not
introduce or increase in any way 30 Hz frequency power in our datasets. Regardless, it should
be kept in mind that, as an additional control, in all our studies and analyses of EEG signal we
compare active TMS-EEG data to equivalent sets of sham TMS-EEG data (obtained
concurrently in sham trials embedded within the blocks) and that both active and sham TMS
datasets undergo exact same artifact removal and data cleaning procedure. Hence, any unlikely
artifactual activity introduced in our active TMS-EEG data by the cleaning process should
appear as non-statistically significant when comparing active vs sham TMS-EEG conditions.
III.4 – Outcome measures to assess the impact of TMS on oscillatory
activity
We transformed cleaned EEG signal into the time-frequency domain using a 3 cycle
Morlet wavelet analysis for frequencies between 6 and 50 Hz (50 logarithmically equally
spaced frequency points) over the time-window [-500 +500] ms (t=0 centered around target
onset) using 10 milisecond steps.
Two types of outcome measures were computed: first, we estimated measures to quantify
oscillatory activity either locally (Power and Inter-Trial Coherence) or between regions
(Phase-Locking Value, see results of Study II in Project 1). Second, we also computed measures
to quantify the noise levels in EEG signal (Power peak width, Sample Entropy, Multi-Scale
Entropy) induced by different TMS patterns (see results of Project 2).
III.4.1 – Outcome measures for local oscillatory activity
Oscillation power was calculated as the squared value of the modulus of the Morlet
coefficients for each time-frequency point and expressed in decibels (dB) relative to a baseline
prior to the onset of the alerting cue (-233 ms prior to target onset) (Fig. 7A). Inter-Trial
Coherence (ITC) measures the stability of oscillation phase across trials at a fixed point in time
and for a fixed frequency. ITC is calculated by averaging the oscillation phases at each time-

99
frequency bin across trials and then taking the module of the average complex vector (Fig. 7B).
Phases across trials which are randomly distributed along the oscillation cycle will cancel out
and result to an average vector of module=0. Nonetheless, if the phase at a single time-
frequency bin is constant and does not vary between trials the average will be a unit vector of
module=1 (i.e., a perfect inter-trial phase-synchronization). Any other degree of partial
synchronization will provide an ITC value between 0 and 1. ITC expresses the degree of phase-
locking or phase alignment of oscillations to a time-locked event in the trial. In the studies
presented in this dissertation, we employed ITC to assess the phase-alignment of oscillations to
the onset of TMS pulses.
Figure 7. Outcome measures to identify quantify and characterize oscillatory activity in EEG
signals. (A) Oscillation power expressed in decibels (dB) relative to a baseline taken in the pre-cue
period, i.e. prior to the increase in size of the central alerting cue (to indicate to participants a TMS burst
was about to be delivered) prior (-233 ms) to visual target onset. (B) Inter-trial coherence calculated as
the module of the complex average vector of signal phase across trials. (C) Imaginary phase-locking
value calculated as the projection on the imaginary axis of the complex average vector across trials of
phase-difference between two signals.
100
III.4.2 – Outcome measures for inter-regional network synchronization
To measure oscillation synchronization between distant brain regions, we calculated the
Phase-Locking Value (PLV) which is a measure of the stability of the phase difference between
two signals (Lachaux et al., 1999). The PLV is calculated similarly to the ITC but it is the
average across trials at each time-frequency point of the phase difference between two signals
instead of the phase of a single signal (Fig. 7C). The PLV is also the module of a resulting
average vector in complex space therefore it is also comprised between 0 (random phase
difference between signals) and 1 (constant phase difference, or perfect phase synchronization
between signals).
When measuring inter-regional synchronization in EEG electrode space one must beware
of the volume condition effect (Srinivasan et al. 2007). Following conduction laws, electrical
signal from a single cortical source will diffuse in all directions and may be recorded
simultaneously by several electrodes on the scalp, and particularly by groups of neighboring
adjacent electrodes. Therefore, if the PLV calculated between two neighboring electrodes
shows a level of high synchronization, this might be because the two electrodes record EEG
signals from common brain sources. In such cases, high synchronization levels do not reflect
true phase synchronization but rather the degree of similarity between cortical signals from the
same sources recorded by the two neighboring electrodes.
To record and analyze true cortical phase synchronization the part of the signal
contributed to by volume conduction has to be identified and eliminated. Several methods have
been proposed to this end (Nolte et al., 2004; Nunez et al., 1997; Stam et al., 2007; Vinck et al.,
2011) but they all mostly rely on the same rationale. Considering electromagnetic conduction
laws for electrical signal, it is widely accepted that a quasi-static approximation holds for EEG.
Said otherwise, the conduction of signals from a cortical source to any scalp electrode is
instantaneous, (i.e. has no lag). It follows that if two electrodes record scalp EEG activity from
the same brain source, the signal recorded by the two scalp EEG electrodes will be at the same
phase and the phase difference between the signal of these two electrodes will always be 0. To
be sure to eliminate contributions of volume conduction to our measure of inter-region phase-
locking we need to find a measure of phase-locking that is insensitive to signals with a null
phase difference.
The representation of phase difference ‘j’ on a complex plane is given by
cos(j) + i×sin(j) where cos (j) is called the real part and sin (j) is called the imaginary part. A
phase difference of 0 will have a real part equal to 1, and an imaginary part of 0. Therefore, we

101
project the complex vector of averaged phase differences on the imaginary axis (Fig. 6C) and
take the absolute value of the Imaginary part of the PLV (Im PLV) as a measure of inter-
regional phase-synchronization (Nolte et al., 2004). If synchronization between two signals is
due solely to volume conduction, the complex vector of averaged phase difference will have a
phase of 0 and the Im PLV for this vector will be 0.
Only signals synchronized with a non-null phase difference will contribute to the Im PLV.
The imaginary part of the PLV varies between -1 and 1 according to which of the two signals
compared lead or lag in phase. By taking the absolute value of the imaginary part, we ensure
that we have a phase-locking value that remains between 0 and 1, ignoring the polarity of the
phase difference which is difficult to interpret due to the cyclicity of the phase. Taking only the
imaginary part of the PLV is very conservative. If two signals have a small (but not null) phase
difference, the Im PLV will be very small, it is therefore possible that we might miss some
inter-regional phase-synchronization signal. It is however worth noting that non-null Im PLV
provides certainty that this is not an artifact of volume conduction (Nolte et al., 2004).
III.5 Outcome measures to quantify and characterize noise in EEG
datasets
In the preceding section, we presented outcome measures to assess oscillation and
synchronization. The high relevance of the field in which these measures are applied and the
high number of methodological, conceptual and experimental literature contributions
addressing cortical oscillations and network synchrony has made these measures well-known
and studied. In contrast, the domain addressing the study of noise in neural coding and cognitive
processing is still emerging, hence there is less consensus about the most adequate outcome
measures available to quantify and describe such phenomena and the conditions and restrictions
for their application. Moreover, algorithms to calculate these measures, which can be complex
and computationally demanding, are not implemented in conventional open toolboxes of EEG
analyses. We made our choice of outcome measures to quantify and evaluate the impact of
noise on neural systems from scalp EEG data based on their applicability to physiological
signals of very short length but also considering ease of implementation in MATLAB
(Mathwork) scripts and computational demands.
At difference to oscillations, noise is a signal that by definition has a degree of
randomness or unpredictability. Approaches to objectively quantify such parameter are varied

102
and an active field of development within the signal processing field. Thus far measures of
noise can be divided into those computed in the time-frequency domain or in the time domain.
III.5.1. Measures to characterize noise in the time-frequency domain
In the time-frequency domain, a signal that is dominated by a single narrow-band
oscillation is not noisy, because a such a signal obeys very simple laws and the fluctuating
signal that represents them has very regular time dynamics, with a repeating pattern for each
cycle of the oscillation, and it is hence highly predictable. However, a signal made of a mixture
of oscillatory frequencies or that is characterized by very broad-band frequency spectrum will
be less regular, lack a clear repeated oscillation period, hence less predictable and therefore
more noisy. The extreme case is white noise, which has a flat power spectrum and is a
completely random signal. In such framework, a first set of measures to characterize noise
signals quantify the uniformity of the power distribution from the power spectrum (Inouye et
al., 1991; Rezek & Roberts, 1998; Rosso et al., 2001) in which a single peak in the power
spectrum indicates a low level of noise, whereas a flat power spectrum indicates maximal
degree of noise.
As a first estimation of noise in resting state or TMS-modulated EEG signals, we applied
an intuitive approach by which we identified peaks in the EEG power spectrum and then
quantified their bandwidth (Fig. 8A). A higher number of peaks in the EEG power spectrum,
as well as larger width of the power peaks indicates higher noise level.
The power spectrum during the delivery of short TMS bursts was computed as the average
of oscillation power from the wavelet analysis over the time window [-0.133 0] ms of interest
(spanning from the 1st TMS pulse of our busts to visual target onset, i.e lateralized near-
threshold Gabors). Peaks, or local maxima, were detected in the average power spectrum using
the ‘findpeaks’ function implemented in MATLAB R2017b (Mathworks). For each peak, the
program searches for the smallest local minima (or valley) between this peak and the next peak
that is higher than the current peak. The height, or prominence, of each peak is calculated
relative to this smallest local minima and the width of each peak is calculated at half-
prominence (Fig. 8A last panel). Given the low signal-to-noise ratio of EEG data (Kiesel et al.,
2008; Ulrich & Miller, 2001), power spectra for individual participants are very noisy hence it
is difficult to identify reliable peaks in individual subject data. In order to identify reliable peaks
in grand average data while still being able to compute power peak values and width for
individual participants and perform group level statistics on this measure, we applied the
‘jackknife’ procedure. This same approach has been used for the characterization of peak

103
amplitude and latencies in event-related potentials, when having to face the problem of noisy
single-subject data with not easily identifiable individual peaks (Kiesel et al., 2008; Ulrich &
Miller, 2001).
Figure 8. Outcome measures to identify quantify and characterize noise levels in EEG signals.
(A) Width and number of peaks in the power spectrum of EEG time series within a time window of
interest including TMS stimulation patterns. Peaks are local maxima in the power spectrum. Peak width
is calculated at the half-prominence. Peak prominence is the difference between the local maxima and
the smallest local minima between this local maxima and the next higher local maxima. (B)
Computation of ‘Multi-scale entropy’, which is the ensemble of ‘Sample entropy’ values calculated at
several time scales. ‘Time scales’ are estimated through the process of coarse graining. Sample entropy
counts in EEG time series repeating patterns in signal of length ‘m’ and ‘m+1’ and computes a ratio of
probability of repeating patterns of length ‘m’ and repeating patterns of length ‘m+1’. (Adapted from
Costa et al. 2005).

104
The power spectrum during the delivery of short TMS bursts was computed as the average
of oscillation power from the wavelet analysis over the time window [-0.133 0] ms of interest
(spanning from the 1st TMS pulse of our busts to visual target onset, i.e lateralized near-
threshold Gabors). Peaks, or local maxima, were detected in the average power spectrum using
the ‘findpeaks’ function implemented in MATLAB R2017b (Mathworks). For each peak, the
program searches for the smallest local minima (or valley) between this peak and the next peak
that is higher than the current peak. The height, or prominence, of each peak is calculated
relative to this smallest local minima and the width of each peak is calculated at half-
prominence (Fig. 8A last panel). Given the low signal-to-noise ratio of EEG data (Kiesel et al.,
2008; Ulrich & Miller, 2001), power spectra for individual participants are very noisy hence it
is difficult to identify reliable peaks in individual subject data. In order to identify reliable peaks
in grand average data while still being able to compute power peak values and width for
individual participants and perform group level statistics on this measure, we applied the
‘jackknife’ procedure. This same approach has been used for the characterization of peak
amplitude and latencies in event-related potentials, when having to face the problem of noisy
single-subject data with not easily identifiable individual peaks (Kiesel et al., 2008; Ulrich &
Miller, 2001).
For each subject i in a sample of N subjects, the jackknife procedure computes the grand
average signal over a subsample of N-1 subjects by omitting the subject i in the dataset. The
peaks in the power spectrum and their width are estimated for each of the N-1 subsampled
grand averages. Of course, measures estimated with the jackknife procedure have very low
error variance because they are estimated from grand averages over a pool of subject which
varies only by one individual. Therefore, the standard error estimated by the jackknife has to
be corrected according to the following formula:
�. �. = √� − 1× ���
Where ‘s.e.’ is the corrected standard error and ‘std’ the standard deviation of the
jackknife subsampled measures. To test for significance, t- and F-statistics must also be
corrected for the reduced error variance using the following procedure (Ulrich & Miller, 2001):
�GHII = � (� − 1):⁄
�GHII = � (� − 1)⁄

105
III.5.2. Measures to characterize noise in the time domain
In the time-domain, several measures of signal-to-noise have been developed taking
inspiration in entropy measures from information theory framework. Entropy, as expressed in
thermodynamics, estimates the degree of ‘disorder’ of a system and, in information theory,
information entropy also relates to the information content of a signal. A signal that expresses
unexpected values carries more information than a signal that expresses only predictable values
(Shannon, 1948).
Information entropy measures cannot be directly applied to physiological signals, such as
scalp EEG, because they are not adapted to signals that are finite. Nonetheless, entropy
measures have been developed that take inspiration from information entropy framework
measures and adapt them to physiological signals. One of such measures is Approximate
Entropy designed to provide reliable measure of entropy on data with a relatively small number
of data points (Pincus, 1991). This measure has been shown to be well suited and have good
sensitivity when used in EEG data. Nonetheless, it is highly dependent on the parameters used
to compute it (Rezek & Roberts, 1998). On our data, we chose to calculate entropy by
computing Sample Entropy (SE), which is a measure very similar to Approximate Entropy, i.e.
well adapted to short data segments, but less dependent on its parameters (Costa et al., 2002,
2005). SE presents an additional advantage which is to be a very intuitive measure to estimate
the unpredictability of a time series or signal.
In simple terms, Sample Entropy calculates the probability to find repeating patterns
within a signal. Repeating patterns are identified if each respective time-points in two sequences
of m consecutive points are within a distance r of each other (r usually being expressed in
percentage of the signal’s standard deviation). Follow the example in Figure 8B (central panel),
all dots labelled in blue are within a distance ‘r’ of each other, and the same applies to dots
labelled in green or in red. A repeating pattern (i.e., in our example a sequence of a green dot
followed by a red and then a blue dot) of 3 consecutive time points (consecutive colored dots
in Figure 8B) is thus identified when the same sequence (green, red, blue) is repeated towards
the end of the data segment. More formally, any pattern of m consecutive time points u1, u2, …
um in the signal is repeated if another sequence of m points v1, v2 … vm (excluding self-matches)
is found in which:
½v1 – u1½ ≤ r , ½v2 – u2½ ≤ r, …½vm – um½ ≤ r

106
The tally of all repeating patterns for each sequence of m consecutive time point yields
the probability Um(r) that two sequences of ‘m’ time points are within a distance ‘r’ of each
other. The same calculation can be performed for patterns of ‘m+1’ time points. Sample
Entropy is then defined as:
��(�, �) = − ln�ST((�)�S(�)
Sample Entropy thus represents the conditional probability that, knowing a pattern is
repeated for ‘m’ consecutive time points, it will also be repeated for ‘m+1’ time points. In other
words, SE evaluates the probability that the ‘m+1’ time point can be predicted when it follows
a known pattern of ‘m’ time points, which translates into a measure of the predictability of the
signal. The lowest this probability is, the less predictable the signal is and the higher the entropy
of the signal.
To deepen the evaluation of entropy and information content of our signals, we calculate
Sample Entropy not only on our original EEG time-series but also on several time scales ‘t’ of
our signal, through a procedure called ‘coarse graining’. Coarse-grained time series at scales ‘t’
are calculated from the original signal averaged inside non-overlapping time windows of length
‘t’ (Fig. 8B, first panel).
The analysis of the Sample Entropy across different time scales constitutes the measure
of Multi-Scale Entropy (MSE) (Costa et al., 2002, 2005). Multi-Scale Entropy varies from
Sample Entropy in that it does not evaluate noise levels or unpredictability, but rather signal
complexity (Zhang, 1991). Signal complexity differs from entropy in that neither a completely
regular signal (with an entropy of 0) nor a completely random signal (with maximal entropy)
exhibit a lot of complexity. Such fundamental difference can be easily understood with the
example of white noise. At a time-scale of 1, at which entropy is usually calculated, white noise
is a completely unpredictable signal and has a very high value of Sample Entropy. However, at
higher time scales, when long stretches of data are averaged during the above-defined ‘coarse-
graining’ procedure, the random signal that is white noise will average to a constant signal at 0
and will exhibit very low values of Sample Entropy. White noise therefore exhibits high entropy
(i.e, unpredictability) but very low complexity.
The brain is a biological system which operates at several temporal and spatial scales.
Therefore neuronal signals need to be informationally rich (i.e. a non null entropy) at several
time scales (Costa et al., 2002, 2005). For this reason, it is more biologically meaningful to
107
compare values of complexity across experimental condition than entropy. A signal that
exhibits higher Sample Entropy values at a majority of time scales compared to another signal
can be considered relatively more complex (Costa et al., 2005).
Lastly, to reduce the dimensionality of the Multi Scale Entropy value, we calculated the
area under the curve for Sample Entropy along the different time scales (Zhang, 1991). By
doing so, we assumed that a higher area under the Sample Entropy curve of a signal compared
to another one reflects higher Sample Entropy at a majority of the time scales and therefore a
higher degree of complexity. In our analyses of scalp EEG data across TMS conditions, we set
the parameters for Sample Entropy at ‘m=2’ and ‘r’ as 15% of the signal’s standard deviation
(Costa et al., 2005) and we calculated Sample Entropy over 14 time scales.
III.6 – Cluster-based permutation tests for the correction of multiple
comparisons
EEG data is characterized by high dimensionality, over both the sensor space (in our
datasets, 60 scalp EEG electrodes) and also in the time and the frequency space. Consequently,
the statistical comparison of EEG topographies, time courses or time-frequency maps leads to
the Multiple Comparison Problem (MCP). When a large number of statistical comparisons are
performed (for example for each electrode or each time-frequency point) the family-wise error
rate, that is the probability to have a false positive result to a statistical test, is not well corrected
when simply looking at p-values. The Multiple Comparison Problem requires p-values to be
corrected to account for multiple comparisons. Although several methods are available to
correct p-values, the most commonly used to evaluate behavioral or imaging large datasets are
the Bonferroni correction method or the slightly less conservative False Discovery Rate (FDR)
correction. Additionally, Nonparametric Permutation Tests are another straightforward method
to correct for multiple comparisons (Maris & Oostenveld, 2007) which have become
increasingly popular to process EEG data.
This approach compares a test statistic obtained when comparing two conditions ‘A’ and
‘B’ to the null distribution of the test statistic computed by the systematic permutation of data
labels across individual samples in groups ‘A’ and ‘B’. The p-value of nonparametric
permutations tests is the proportion of random data permutations that results in a higher test
statistic than the test statistic for comparison between ‘A’ and ‘B’. If this proportion is smaller
than a threshold alpha=0.05, conditions ‘A’ and ‘B’ are considered significantly different.
Permutation tests are based upon the simple rationale that, if the null hypothesis is true and

108
samples in ‘A’ and ‘B’ are drawn from the same distribution, then the permuted data will be
identical to the real data. However, if the null hypothesis is false, the permutated data will be
different from the real data.
For a permutation test to be exact, the null distribution has to be drawn from all possible
permutations of samples in ‘A’ and ‘B’. However, for most datasets the total number of possible
permutations is far too high and computing an exact permutation test too computationally
demanding. On such scenario, Monte-Carlo sampling procedure is used to draw a subset of all
possible permutations to estimate the null distribution exclusively in this representative subset.
The higher the number of permutations drawn, the more accurate the p-value estimated with
Monte-Carlo sampling will be. Nonetheless there is a trade-off to be accommodated between
the accuracy of the p-value and the cost of computing time.
The Multiple Comparison Problem can be solved in permutation tests by comparing the
test statitic to a null distribution obtained not for each data point separately, but instead for a
single null distribution which represents the complete data space (i.e., sensor space, time space,
or time-frequency space). Multiple comparisons are then replaced with a single comparison and
there is no Multiple Comparison Problem anymore (Maris & Oostenveld, 2007). However, in
that scenario, the null hypothesis becomes that the distributions of conditions ‘A’ and ‘B’ are
identical for all sensors or time-frequency bin. If this hypothesis is rejected it can be concluded
that at least one EEG sensor or time-frequency bin shows significant differences across
conditions ‘A’ and ‘B’ however the localization of this effect in the scalp topography or in the
time-frequency space becomes uncertain. This null hypothesis is known as the global null
hypothesis.
Using a global null hypothesis ensures strong sensitivity to differences between
conditions, however a price has to be paid in terms of effect localization. It should be noted,
however, that when analyzing EEG data, a more data point-specific null hypothesis might be
senseless. Indeed, any physiological effects recorded on EEG datasets is unlikely to be localized
at a single electrode in the sensor space, instead this effect will be spread in over adjacent
contacts. Likewise, EEG dynamic effects evolving over time will last over several consecutive
time bins. Therefore, overall, permutation tests are a highly sensitive approach for solving the
Multiple Comparison Problem in EEG datasets and are adapted to the high degree of spatio-
temporal correlation of such data (Maris & Oostenveld, 2007).
In the analyses done as part of this dissertation (see methods section on each study for
further details), we performed data cluster-based non-parametric permutation tests with Monte-
Carlo sampling. First, each pair of data points between two conditions were compared with

109
two-tailed paired Student’s t-tests. Then, adjacent data points that exceeded the established
cluster significance threshold of alpha=0.01 (see Wyart & Tallon-Baudry, 2008) were clustered
together and the sum of t-statistics of each point in the cluster is then assigned as the statistic
of the cluster. The cluster statistics were compared to the distribution of the largest cluster
statistic over the whole scalp obtained for 10000 random permutations. Any clusters exceeding
the significance threshold (alpha=0.05) of the permutation test was considered to show a
significant difference between conditions.
In section II of this chapter, we have described and addressed the rationale and
assumptions for computing pairwise comparisons across the experimental conditions in our
studies. However, given the orthogonal design characterizing such, with TMS pattern
(rhythmic, non-uniform rhythmic, random, irregular) and TMS condition (active, sham), it
could be argued that for most of our EEG analyses, ANOVA approaches could have been more
powerful to compare our experimental conditions. Notwithstanding, in the case of interactions
effects within a factorial design, the use of the cluster-based permutations method to solve the
Multiple Comparison Problem becomes highly complex and controversial. The main
controversy lies in which permutations between levels of factors should be considered
acceptable and will respect the correlation structure of the data. Additionally, considering the
restricted possible data permutations for ANOVAs with multiple factors, exact permutation
tests for such approaches either lack the power or are simple not possible. In sum, there is
currently no consensus on which strategy is more appropriate to approximate permutations tests
in factorial designs (Anderson & ter Braak, 2003; Edgington & Onghena, 2007; Suckling &
Bullmore, 2004). Therefore, for the studies of this dissertation, we prioritized the application
of a sensitive method to solve the Multiple Comparison Problem and therefore chose to
compute pairwise comparisons between our conditions.

110
REFERENCES
Anderson, M., & ter Braak, C. (2003). Permutation tests for multi-factorial analysis of variance.
Journal of Statistical Computation and Simulation, 73, 85–113.
Asamoah, B., Khatoun, A., & Laughlin, M. M. (2019). TACS motor system effects can be
caused by transcutaneous stimulation of peripheral nerves. Nature Communications, 10,
266.
Benwell, C. S. Y., Tagliabue, C. F., Veniero, D., Cecere, R., Savazzi, S., & Thut, G. (2017).
Prestimulus EEG Power Predicts Conscious Awareness But Not Objective Visual
Performance. ENeuro, 4.
Bikson, M., Datta, A., Rahman, A., & Scaturro, J. (2010). Electrode montages for tDCS and
weak transcranial electrical stimulation: Role of “return” electrode’s position and size.
Clinical Neurophysiology, 121, 1976–1978.
Block, N. (2011). Perceptual consciousness overflows cognitive access. Trends in Cognitive
Sciences, 15, 567–575.
Bonato, C., Miniussi, C., & Rossini, P. M. (2006). Transcranial magnetic stimulation and
cortical evoked potentials: A TMS/EEG co-registration study. Clinical Neurophysiology,
117, 1699–1707.
Brainard, D. H. (1997). The Psychophysics Toolbox. Spatial Vision, 10, 433–436.
Buschman, T. J., & Miller, E. K. (2007). Top-Down Versus Bottom-Up Control of Attention
in the Prefrontal and Posterior Parietal Cortices. Science, 315, 1860–1862.
Chanes, L. (2014). Frontal and parietal contributions to visual perception in humans
(Université Pierre et Marie Curie - Paris VI). Université Pierre et Marie Curie - Paris VI,
Paris.
Chanes, L., Chica, A. B., Quentin, R., & Valero-Cabré, A. (2012). Manipulation of Pre-Target
Activity on the Right Frontal Eye Field Enhances Conscious Visual Perception in
Humans. PLoS ONE, 7, e36232.
Chanes, L., Quentin, R., Tallon-Baudry, C., & Valero-Cabré, A. (2013). Causal Frequency-
Specific Contributions of Frontal Spatiotemporal Patterns Induced by Non-Invasive
Neurostimulation to Human Visual Performance. The Journal of Neuroscience, 33, 5000–
5005.
Chanes, L., Quentin, R., Vernet, M., & Valero-Cabré, A. (2015). Arrhythmic activity in the left
frontal eye field facilitates conscious visual perception in humans. Cortex, 71, 240–247.

111
Corbetta, M., & Shulman, G. L. (2002). Control of goal-directed and stimulus-driven attention
in the brain. Nature Reviews Neuroscience, 3, 201.
Cornsweet, T. N. (1962). The staircrase-method in psychophysics. The American Journal of
Psychology, 75, 485–491.
Costa, M., Goldberger, A. L., & Peng, C.-K. (2002). Multiscale Entropy Analysis of Complex
Physiologic Time Series. Physical Review Letters, 89, 068102.
Costa, M., Goldberger, A. L., & Peng, C.-K. (2005). Multiscale entropy analysis of biological
signals. Physical Review E, 71.
Datta, A., Elwassif, M., Battaglia, F., & Bikson, M. (2008). Transcranial current stimulation
focality using disc and ring electrode configurations: FEM analysis. Journal of Neural
Engineering, 5, 163–174.
Datta, A., Truong, D., Minhas, P., Parra, L. C., & Bikson, M. (2012). Inter-Individual Variation
during Transcranial Direct Current Stimulation and Normalization of Dose Using MRI-
Derived Computational Models. Frontiers in Psychiatry, 3, 91.
Daugman, J. G. (1985). Uncertainty relation for resolution in space, spatial frequency, and
orientation optimized by two-dimensional visual cortical filters. JOSA A, 2, 1160–1169.
Dehaene, S., Changeux, J.-P., Naccache, L., Sackur, J., & Sergent, C. (2006). Conscious,
preconscious, and subliminal processing: A testable taxonomy. Trends in Cognitive
Sciences, 10, 204–211.
Edgington, E., & Onghena, P. (2007). Randomization tests. Chapman and Hall/CRC.
Green, D. M., & Swets, J. A. (1966). Signal detection theory and psychophysics. Oxford,
England: John Wiley.
Groen, O. van der, & Wenderoth, N. (2016). Transcranial Random Noise Stimulation of Visual
Cortex: Stochastic Resonance Enhances Central Mechanisms of Perception. Journal of
Neuroscience, 36, 5289–5298.
Gross, J., Schmitz, F., Schnitzler, I., Kessler, K., Shapiro, K., Hommel, B., & Schnitzler, A.
(2004). Modulation of long-range neural synchrony reflects temporal limitations of visual
attention in humans. Proceedings of the National Academy of Sciences, 101, 13050–
13055.
Hallett, M. (2007). Transcranial Magnetic Stimulation: A Primer. Neuron, 55, 187–199.
Hamidi, M., Slagter, H. A., Tononi, G., & Postle, B. R. (2010). Brain responses evoked by
high-frequency repetitive transcranial magnetic stimulation: An event-related potential
study. Brain Stimulation, 3, 2–14.

112
Hernandez-Pavon, J. C., Metsomaa, J., Mutanen, T., Stenroos, M., Mäki, H., Ilmoniemi, R. J.,
& Sarvas, J. (2012). Uncovering neural independent components from highly artifactual
TMS-evoked EEG data. Journal of Neuroscience Methods, 209, 144–157.
Horvath, J. C., Forte, J. D., & Carter, O. (2015). Evidence that transcranial direct current
stimulation (tDCS) generates little-to-no reliable neurophysiologic effect beyond MEP
amplitude modulation in healthy human subjects: A systematic review.
Neuropsychologia, 66, 213–236.
Hyvärinen, A., & Oja, E. (2000). Independent component analysis: Algorithms and
applications. Neural Networks, 13, 411–430.
Ilmoniemi, R. J., Hernandez-Pavon, J. C., Mäkelä, N. N., Metsomaa, J., Mutanen, T. P.,
Stenroos, M., & Sarvas, J. (2015). Dealing with artifacts in TMS-evoked EEG. 2015 37th
Annual International Conference of the IEEE Engineering in Medicine and Biology
Society (EMBC), 230–233.
Ilmoniemi, R. J., & Kičić, D. (2010). Methodology for Combined TMS and EEG. Brain
Topography, 22, 233–248.
Inouye, T., Shinosaki, K., Sakamoto, H., Toi, S., Ukai, S., Iyama, A., … Hirano, M. (1991).
Quantification of EEG irregularity by use of the entropy of the power spectrum.
Electroencephalography and Clinical Neurophysiology, 79, 204–210.
Iriarte, J., Urrestarazu, E., Valencia, M., Alegre, M., Malanda, A., Viteri, C., & Artieda, J.
(2003). Independent component analysis as a tool to eliminate artifacts in EEG: A
quantitative study. Journal of Clinical Neurophysiology: Official Publication of the
American Electroencephalographic Society, 20, 249–257.
Jung, T.-P., Makeig, S., Humphries, C., Lee, T.-W., McKeown, M. J., Iragui, V., & Sejnowski,
T. J. (2000). Removing electroencephalographic artifacts by blind source separation.
Psychophysiology, 37, 163–178.
Kähkönen, S., Komssi, S., Wilenius, J., & Ilmoniemi, R. J. (2005). Prefrontal TMS produces
smaller EEG responses than motor-cortex TMS: Implications for rTMS treatment in
depression. Psychopharmacology, 181, 16–20.
Kiesel, A., Miller, J., Jolicœur, P., & Brisson, B. (2008). Measurement of ERP latency
differences: A comparison of single-participant and jackknife-based scoring methods.
Psychophysiology, 45, 250–274.
Kitajo, K., Nozaki, D., Ward, L. M., & Yamamoto, Y. (2003). Behavioral Stochastic Resonance
within the Human Brain. Physical Review Letters, 90.

113
Kukkonen, H., Rovamo, J., Tiippana, K., & Näsänen, R. (1993). Michelson contrast, RMS
contrast and energy of various spatial stimuli at threshold. Vision Research, 33, 1431–
1436.
Lachaux, J.-P., Rodriguez, E., Martinerie, J., Varela, F. J., & others. (1999). Measuring phase
synchrony in brain signals. Human Brain Mapping, 8, 194–208.
Lafon, B., Henin, S., Huang, Y., Friedman, D., Melloni, L., Thesen, T., … Liu, A. A. (2017).
Low frequency transcranial electrical stimulation does not entrain sleep rhythms
measured by human intracranial recordings. Nature Communications, 8, 1–14.
Lau, H. C., & Passingham, R. E. (2006). Relative blindsight in normal observers and the neural
correlate of visual consciousness. Proceedings of the National Academy of Sciences, 103,
18763–18768.
Litvak, V., Komssi, S., Scherg, M., Hoechstetter, K., Classen, J., Zaaroor, M., … Kahkonen, S.
(2007). Artifact correction and source analysis of early electroencephalographic
responses evoked by transcranial magnetic stimulation over primary motor cortex.
NeuroImage, 37, 56–70.
Liu, A., Vöröslakos, M., Kronberg, G., Henin, S., Krause, M. R., Huang, Y., … Buzsáki, G.
(2018). Immediate neurophysiological effects of transcranial electrical stimulation.
Nature Communications, 9, 1–12.
Lugo, E., Doti, R., & Faubert, J. (2008). Ubiquitous Crossmodal Stochastic Resonance in
Humans: Auditory Noise Facilitates Tactile, Visual and Proprioceptive Sensations. PLoS
ONE, 3.
Macmillan, N. A., & Creelman, C. D. (2004). Detection Theory: A User’s Guide. Psychology
Press.
Marcel, A. J. (1983). Conscious and unconscious perception: Experiments on visual masking
and word recognition. Cognitive Psychology, 15, 197–237.
Maris, E., & Oostenveld, R. (2007). Nonparametric statistical testing of EEG- and MEG-data.
Journal of Neuroscience Methods, 164, 177–190.
McConnell, K. A., Nahas, Z., Shastri, A., Lorberbaum, J. P., Kozel, F. A., Bohning, D. E., &
George, M. S. (2001). The transcranial magnetic stimulation motor threshold depends on
the distance from coil to underlying cortex: A replication in healthy adults comparing two
methods of assessing the distance to cortex. Biological Psychiatry, 49, 454–459.
Merikle, P. M. (1992). Perception without awareness. Critical issues. The American
Psychologist, 47, 792–795.

114
Miniussi, C., Harris, J. A., & Ruzzoli, M. (2013). Modelling non-invasive brain stimulation in
cognitive neuroscience. Neuroscience & Biobehavioral Reviews, 37, 1702–1712.
Morbidi, F., Garulli, A., Prattichizzo, D., Rizzo, C., Manganotti, P., & Rossi, S. (2007). Off-
line removal of TMS-induced artifacts on human electroencephalography by Kalman
filter. Journal of Neuroscience Methods, 162, 293–302.
Nikouline, V., Ruohonen, J., & Ilmoniemi, R. J. (1999). The role of the coil click in TMS
assessed with simultaneous EEG. Clinical Neurophysiology, 110, 1325–1328.
Nikulin, V. V., Kičić, D., Kähkönen, S., & Ilmoniemi, R. J. (2003). Modulation of
electroencephalographic responses to transcranial magnetic stimulation: Evidence for
changes in cortical excitability related to movement. European Journal of Neuroscience,
18, 1206–1212.
Nitsche, M. A., Cohen, L. G., Wassermann, E. M., Priori, A., Lang, N., Antal, A., … Pascual-
Leone, A. (2008). Transcranial direct current stimulation: State of the art 2008. Brain
Stimulation, 1, 206–223.
Nolte, G., Bai, O., Wheaton, L., Mari, Z., Vorbach, S., & Hallett, M. (2004). Identifying true
brain interaction from EEG data using the imaginary part of coherency. Clinical
Neurophysiology, 115, 2292–2307.
Noury, N., Hipp, J. F., & Siegel, M. (2016). Physiological processes non-linearly affect
electrophysiological recordings during transcranial electric stimulation. NeuroImage,
140, 99–109.
Noury, N., & Siegel, M. (2018). Analyzing EEG and MEG signals recorded during tES, a reply.
NeuroImage, 167, 53–61.
Nunez, P. L., Srinivasan, R., Westdorp, A. F., Wijesinghe, R. S., Tucker, D. M., Silberstein, R.
B., & Cadusch, P. J. (1997). EEG coherency: I: statistics, reference electrode, volume
conduction, Laplacians, cortical imaging, and interpretation at multiple scales.
Electroencephalography and Clinical Neurophysiology, 103, 499–515.
Onton, J., Westerfield, M., Townsend, J., & Makeig, S. (2006). Imaging human EEG dynamics
using independent component analysis. Neuroscience & Biobehavioral Reviews, 30, 808–
822.
Oostenveld, R., Fries, P., Maris, E., & Schoffelen, J.-M. (2011). FieldTrip: Open source
software for advanced analysis of MEG, EEG, and invasive electrophysiological data.
Computational Intelligence and Neuroscience, 2011, 156869.
115
Paus, T., Sipila, P. K., & Strafella, A. P. (2001). Synchronization of neuronal activity in the
human primary motor cortex by transcranial magnetic stimulation: An EEG study.
Journal of Neurophysiology, 86, 1983–1990.
Paus, T. (1996). Location and function of the human frontal eye-field: A selective review.
Neuropsychologia, 34, 475–483.
Pincus, S. M. (1991). Approximate entropy as a measure of system complexity. Proceedings of
the National Academy of Sciences, 88, 2297–2301.
Posner, M. I. (1980). Orienting of Attention. Quarterly Journal of Experimental Psychology,
32, 3–25.
Posner, M. I., Snyder, C. R., & Davidson, B. J. (1980). Attention and the detection of signals.
Journal of Experimental Psychology: General, 109, 160–174.
Quentin, R., Chanes, L., Migliaccio, R., Valabrègue, R., & Valero-Cabré, A. (2013). Fronto-
tectal white matter connectivity mediates facilitatory effects of non-invasive
neurostimulation on visual detection. NeuroImage, 82, 344–354.
Quentin, R., Elkin Frankston, S., Vernet, M., Toba, M. N., Bartolomeo, P., Chanes, L., &
Valero-Cabré, A. (2015). Visual Contrast Sensitivity Improvement by Right Frontal
High-Beta Activity Is Mediated by Contrast Gain Mechanisms and Influenced by Fronto-
Parietal White Matter Microstructure. Cerebral Cortex, 26, 2381–2390.
Rastelli, F., Tallon-Baudry, C., Migliaccio, R., Toba, M. N., Ducorps, A., Pradat-Diehl, P., …
Bartolomeo, P. (2013). Neural dynamics of neglected targets in patients with right
hemisphere damage. Cortex, 49, 1989–1996.
Rezek, I. A., & Roberts, S. J. (1998). Stochastic complexity measures for physiological signal
analysis. IEEE Transactions on Biomedical Engineering, 45, 1186–1191.
Rogasch, N. C., Thomson, R. H., Farzan, F., Fitzgibbon, B. M., Bailey, N. W., Hernandez-
Pavon, J. C., … Fitzgerald, P. B. (2014). Removing artefacts from TMS-EEG recordings
using independent component analysis: Importance for assessing prefrontal and motor
cortex network properties. NeuroImage, 101, 425–439.
Rosanova, M., Casali, A., Bellina, V., Resta, F., Mariotti, M., & Massimini, M. (2009). Natural
Frequencies of Human Corticothalamic Circuits. Journal of Neuroscience, 29, 7679–
7685.
Rossi, S., Hallett, M., Rossini, P. M., & Pascual-Leone, A. (2009). Safety, ethical
considerations, and application guidelines for the use of transcranial magnetic stimulation
in clinical practice and research. Clinical Neurophysiology, 120, 2008–2039.

116
Rossini, P. M., Burke, D., Chen, R., Cohen, L. G., Daskalakis, Z., Iorio, R. D., … Ziemann, U.
(2015). Non-invasive electrical and magnetic stimulation of the brain, spinal cord, roots
and peripheral nerves: Basic principles and procedures for routine clinical and research
application. An updated report from an I.F.C.N. Committee. Clinical Neurophysiology,
126, 1071–1107.
Rosso, O. A., Blanco, S., Yordanova, J., Kolev, V., Figliola, A., Schürmann, M., & Başar, E.
(2001). Wavelet entropy: A new tool for analysis of short duration brain electrical signals.
Journal of Neuroscience Methods, 105, 65–75.
Ruzzoli, M., Abrahamyan, A., Clifford, C. W. G., Marzi, C. A., Miniussi, C., & Harris, J. A.
(2011). The effect of TMS on visual motion sensitivity: An increase in neural noise or a
decrease in signal strength? Journal of Neurophysiology, 106, 138–143.
Ruzzoli, M., Marzi, C. A., & Miniussi, C. (2010). The Neural Mechanisms of the Effects of
Transcranial Magnetic Stimulation on Perception. Journal of Neurophysiology, 103,
2982–2989.
Schwarzkopf, D. S., Silvanto, J., & Rees, G. (2011). Stochastic Resonance Effects Reveal the
Neural Mechanisms of Transcranial Magnetic Stimulation. Journal of Neuroscience, 31,
3143–3147.
Shannon, C. E. (1948). A Mathematical Theory of Communication. Bell System Technical
Journal, 27, 379–423.
Srinivasan, R., Winter, W. R., Ding, J., & Nunez, P. L. (2007). EEG and MEG coherence:
measures of functional connectivity at distinct spatial scales of neocortical
dynamics. Journal of Neuroscience Methods, 166, 41-52.
Stam, C. J., Nolte, G., & Daffertshofer, A. (2007). Phase lag index: Assessment of functional
connectivity from multi channel EEG and MEG with diminished bias from common
sources. Human Brain Mapping, 28, 1178–1193.
Stanislaw, H., & Todorov, N. (1999). Calculation of signal detection theory measures. Behavior
Research Methods, Instruments, & Computers: A Journal of the Psychonomic Society,
Inc, 31, 137–149.
Stewart, L. M., Walsh, V., & Rothwell, J. C. (2001). Motor and phosphene thresholds: A
transcranial magnetic stimulation correlation study. Neuropsychologia, 39, 415–419.
Stokes, M. G., Chambers, C. D., Gould, I. C., Henderson, T. R., Janko, N. E., Allen, N. B., &
Mattingley, J. B. (2005). Simple metric for scaling motor threshold based on scalp-cortex
distance: Application to studies using transcranial magnetic stimulation. Journal of
Neurophysiology, 94, 4520–4527.

117
Suckling, J., & Bullmore, E. (2004). Permutation tests for factorially designed neuroimaging
experiments. Human Brain Mapping, 22, 193–205.
Terney, D., Chaieb, L., Moliadze, V., Antal, A., & Paulus, W. (2008). Increasing Human Brain
Excitability by Transcranial High-Frequency Random Noise Stimulation. The Journal of
Neuroscience, 28, 14147–14155.
Thut, G, Northoff, G., Ives, J. R., Kamitani, Y., Pfennig, A., Kampmann, F., … Pascual-Leone,
A. (2003). Effects of single-pulse transcranial magnetic stimulation (TMS) on functional
brain activity: A combined event-related TMS and evoked potential study. Clinical
Neurophysiology, 114, 2071–2080.
Thut, G., Ives, J. R., Kampmann, F., Pastor, M. A., & Pascual-Leone, A. (2005). A new device
and protocol for combining TMS and online recordings of EEG and evoked potentials.
Journal of Neuroscience Methods, 141, 207–217.
Thut, G., Veniero, D., Romei, V., Miniussi, C., Schyns, P., & Gross, J. (2011). Rhythmic TMS
Causes Local Entrainment of Natural Oscillatory Signatures. Current Biology, 21, 1176–
1185.
Ulrich, R., & Miller, J. (2001). Using the jackknife-based scoring method for measuring LRP
onset effects in factorial designs. Psychophysiology, 38, 816–827.
Valero-Cabré, A., Payne, B. R., Rushmore, J., Lomber, S. G., & Pascual-Leone, A. (2005).
Impact of repetitive transcranial magnetic stimulation of the parietal cortex on metabolic
brain activity: A 14C-2DG tracing study in the cat. Experimental Brain Research, 163,
1–12.
Van Der Werf, Y. D., & Paus, T. (2006). The neural response to transcranial magnetic
stimulation of the human motor cortex. I. Intracortical and cortico-cortical contributions.
Experimental Brain Research, 175, 231–245.
Van Der Werf, Y. D., Sadikot, A. F., Strafella, A. P., & Paus, T. (2006). The neural response
to transcranial magnetic stimulation of the human motor cortex. II. Thalamocortical
contributions. Experimental Brain Research, 175, 246–255.
Veniero, D., Bortoletto, M., & Miniussi, C. (2009). TMS-EEG co-registration: On TMS-
induced artifact. Clinical Neurophysiology, 120, 1392–1399.
Vernet, M., Quentin, R., Chanes, L., Mitsumasu, A., & Valero-Cabré, A. (2014). Frontal eye
field, where art thou? Anatomy, function, and non-invasive manipulation of frontal
regions involved in eye movements and associated cognitive operations. Frontiers in
Integrative Neuroscience, 8, 66.

118
Vinck, M., Oostenveld, R., van Wingerden, M., Battaglia, F., & Pennartz, C. M. A. (2011). An
improved index of phase-synchronization for electrophysiological data in the presence of
volume-conduction, noise and sample-size bias. NeuroImage, 55, 1548–1565.
Virtanen, J., Ruohonen, J., Näätänen, R., & Ilmoniemi, R. J. (1999). Instrumentation for the
measurement of electric brain responses to transcranial magnetic stimulation. Medical &
Biological Engineering & Computing, 37, 322–326.
Vöröslakos, M., Takeuchi, Y., Brinyiczki, K., Zombori, T., Oliva, A., Fernández-Ruiz, A., …
Berényi, A. (2018). Direct effects of transcranial electric stimulation on brain circuits in
rats and humans. Nature Communications, 9, 483.
Walsh, V., & Cowey, A. (2000). Transcranial magnetic stimulation and cognitive neuroscience.
Nature Reviews Neuroscience, 1, 73–80.
Weiskrantz, L. (1998). Consciousness and Commentaries. International Journal of Psychology,
33, 227–233.
Wyart, V., & Tallon-Baudry, C. (2008). Neural Dissociation between Visual Awareness and
Spatial Attention. Journal of Neuroscience, 28, 2667–2679.
Zhang, Y.-C. (1991). Complexity and 1/f noise. A phase space approach. Journal de Physique
I, 1, 971–977.

119
PROJECT 1 Causal role of high-beta oscillations in the right fronto-parietal
network for conscious visual detection
I – Entrainment of local synchrony reveals a causal role for high-beta right frontal oscillations in human visual consciousness
The following article has been published in Scientific Reports.
Résumé (français)
Des résultats antérieurs étayent le rôle crucial de l’activité oscillatoire dans la perception visuelle.
Mais les oscillations cérébrales sont-elles simplement corrélées ou bien causalement liées à nos
capacités à rapporter consciemment la présence d’une cible dans notre champ visuel ? Au cours de
cette étude, nous avons enregistré les signaux EEG d’un groupe de sujets sains réalisant une tâche de
détection visuelle alors qu’ils recevaient dans le même temps de courtes rafales de Stimulation
Transcranienne Magnétique (SMT) rythmiques ou aléatoires au niveau du champ oculomoteur frontal
droit juste avant la présentation d’une cible latéralisée. Nous démontrons que la SMT entraîne des
oscillations, c’est-à-dire amplifie la puissance et l’alignement de phase des oscillations beta-hautes
(et ce, pour cette dernière mesure, de manière plus importante pour les rafales rythmiques que
aléatoires) et parallèlement augmente la sensitivité visuelle pour la détection. En considérant, dans
une analyse post hoc, seulement les participants pour qui la stimulation rythmique a amélioré la
détection visuelle, nous montrons que l’amplitude de l’entrainement d’oscillations beta-hautes corrèle
avec les augmentations de performances visuelles dans le champ oculaire gauche. Notre étude apporte
des preuves en faveur d’un lien causal entre l’activité oscillatoire beta-haute dans le champ
oculomoteur frontal et la détection visuelle. De plus, ces résultats sont favorables à une application
future de la stimulation cérébrale pour manipuler la synchronie oscillatoire locale et améliorer ou
restaurer les fonctions visuelles lésées dans des populations de patients.
120

121

122

123

124

125

126

127

128

129

130

131

132

133

134

135
II – Causal role of high-beta right fronto-parietal synchrony in the modulation of human conscious visual perception
Résumé (Français)
Des études corrélationnelles chez les primates non-humains ont mis en évidence une
augmentation de la synchronisation fronto-pariétale dans la bande de fréquence beta-haute (22-
30 Hz) pendant l’orientation endogène de l’attention visuo-spatiale. Le recrutement de la
synchronie inter-régionale à cette même bande de fréquence pourrait-il constituer le mécanisme
causal par lequel l’attention est engagée chez l’homme et facilite, de façon descendante, la
perception visuelle ? De surcroît, la manipulation de ces processus amènerait-elle à une
amélioration des capacités de détection visuelle consciente ? Dans cette étude, nous avons re-
analysé les signaux encéphalographiques (EEG) d’un groupe de sujets sains (n=14) réalisant une
tâche de détection visuelle consciente, sous l’influence de brèves rafales rythmiques (30 Hz) ou
aléatoires de Stimulation Magnétique Transcrânienne (SMT), constituées d’un nombre identique
d’impulsions magnétiques et étalées sur la même durée, délivrées sur le champ oculomoteur
frontal droit juste avant l’apparition d’une cible visuelle latéralisée au seuil de détection. Nous
rapportons une augmentation de la synchronie inter-régionale dans la bande beta-haute (25-35
Hz) entre la région corticale stimulée (champs oculomoteur frontal droit) et un groupe
d’électrodes pariétales, induite par la SMT rythmique et pas aléatoire. Surtout, ces augmentations
étaient accompagnées d’améliorations des performances de détection visuelle consciente pour les
cibles visuelles gauches (controlatérales à la stimulation) dans la condition de SMT rythmiques
et pas aléatoire au niveau du groupe. Ces résultats démontrent que la synchronisation beta-haute
entre les régions frontales et pariétales chez l’homme peut être manipulée de façon non invasive
et que l’activité oscillatoire beta-haute dans la totalité du réseau attentionnel dorsal droit pourrait
contribuer à la facilitation de la détection visuelle consciente. De plus, nos résultats sont
favorables à l’application future des méthodes de stimulation cérébrale non invasives pour
manipuler la synchronie inter-régionale, une technique qui pourrait être utilisée pour améliorer
les comportements visuels de sujets sains ou de patients souffrant de troubles neurologiques.

136
Causal role of high-beta right fronto-parietal synchrony in the modulation of
human conscious visual perception
Chloé Stengel1*†, Marine Vernet1, Julià L. Amengual2, and Antoni Valero-Cabré1,3,4†
1 Institut du Cerveau et de la Moelle Epinière (ICM), CNRS UMR 7225, INSERM U 1127 and
Sorbonne Université, Paris, France
2 Institut des Sciences Cognitives Marc Jeannerod, CNRS UMR 5229 and Université Claude
Bernard, Lyon, France
3 Laboratory for Cerebral Dynamics Plasticity and Rehabilitation, Boston University, School of
Medicine, Boston, MA, USA
4 Cognitive Neuroscience and Information Technology Research Program, Open University of
Catalonia (UOC), Barcelona, Spain
† Corresponding authors: Chloé Stengel & Antoni Valero-Cabré, MD PhD, Groupe de
Dynamiques Cérébrales, Plasticité et Rééducation, Équipe Frontlab, Institut du Cerveau et de la
Moelle Epinière (ICM), Pitié-Salpêtrière, 47 boulevard de l’Hôpital, 75013 Paris, France.
Email: [email protected]; [email protected] /
Keywords: visual perception, TMS, cortical oscillations, inter-regional synchrony

137
Abstract
Correlational studies in non-human primates have reported evidence of increased fronto-
parietal high-beta band (22-30 Hz) synchrony during the endogenous capture of visuospatial
attention. But may the engagement of inter-regional synchrony at this same frequency band
provide the causal mechanism by which top-down attention is engaged and facilitates visual
perception in humans? Moreover, would the manipulation of such processes lead to increases of
conscious visual detection capabilities? Here we re-analyzed electroencephalographic (EEG)
signals from a group of healthy human participants (n=14) who performed a conscious visual
detection task, under the influence of brief rhythmic (30 Hz) or random bursts of Transcranial
Magnetic Stimulation (TMS), with an identical number of pulses and duration, delivered to the
right Frontal Eye Field (FEF) prior to the onset of a lateralized near-threshold target. We report
an increase of inter-regional synchronization in the high-beta band (25-35 Hz) between the
stimulated region (right FEF) and a cluster of parietal electrodes, and increases of local inter-trial
coherence in the same frequency band over parietal electrodes, driven by rhythmic but not random
TMS patterns. Importantly, such increases were accompained by improvements of conscious
visual detection performance for left visual targets (contralateral to the stimulation) in the
rhythmic but not the random TMS condition at the group level. These outcomes show that human
high-beta synchrony between parietal and frontal regions can be manipulated non-invasively and
that high-beta oscillatory activity across the right dorsal fronto-parietal attention network could
contribute to the facilitation of conscious visual detection. Furthermore, our results support future
applications of non-invasive brain stimulation technologies for the manipulation of inter-regional
synchrony, which could be applied to improve visual behaviors in healthy humans or neurological
patients.

138
Introduction
High cognitive functions, such as consciousness or attention orienting, do not solely rely
on the activity of single cortical regions but require the integration of processes occurring in
widely distributed cortical nodes organized in complex networks (Buzsáki & Draguhn, 2004;
Varela et al., 2001). In this context, understanding how distant regions communicate as part of a
single distributed network during the performance of a cognitive task has become a crucial
mission for system’s neuroscience.
Early theories of inter-regional communication in the brain have supported the view that
anatomical white matter connections subtend long-distance communication (Laughlin &
Sejnowski, 2003; Mesulam, 1990). However, neuronal activity, hence patterns of functional
connectivity, is highly volatile and dynamic, fluctuating in the order of milliseconds (Bressler &
Tognoli, 2006; Britz et al., 2010). Consequently, inter-regional communication cannot be solely
explained by structural connections, as they lack the flexibility to allow dynamic and selective
communication between subsets of brain regions acting as nodes within highly interconnected
networks (Fries, 2005).
During the last decade, new mechanistic models have proposed that communication
between neural populations is subtended by the synchronicity of their oscillatory activity (Engel
et al., 2001; Fries, 2005, 2009; Fries et al., 2001; Varela et al., 2001). Such models have claimed
that when two natural oscillators in the cortex synchronize in frequency and/or in phase, the spikes
sent by a first group of neurons will reach the well synchronized neurons of a target population at
their peak of excitability, ensuring a better gain of information transfer between the two neuronal
populations and, consequently, more efficient communication. This so called model of
communication-through-coherence (Fries, 2005; Fries et al., 2001) has been postulated to be
particularly useful to mediate top-down modulation (e.g. by attention or perception) on sensory
areas (Engel et al., 2001).

139
Experimental data in support of long-distance synchronization during visual perception
and the orientation of attention have been collected both in animal models (Buschman & Miller,
2007; Gregoriou et al., 2009; Saalmann et al., 2007) and humans (Gross et al., 2004; Hipp et al.,
2011; Rodriguez et al., 1999). These studies suggest that fronto-parietal regions synchronize at
beta or gamma frequency bands (ranging from 15 to 60 Hz) during episodes of attentional
orienting or perception. However, these studies have associated synchronization with specific
behaviors solely on the basis of their co-occurrence in time and space, and have proven unable to
distinguish causal contributions of oscillatory activity from epiphenomena.
Transcranial Magnetic Stimulation (TMS), a non-invasive technology to stimulate
circumscribed cortical regions, used in combination with Electroencephalography (EEG), offers
a unique tool to probe the causal implication of oscillatory synchronization between specific
anatomical locations and behavioral effects processed by such mechanisms. Indeed, TMS has
demonstrated the ability to manipulate non-invasively both behavior (Chanes et al., 2012, 2013;
Klimesch et al., 2003; Romei et al., 2010; Sauseng et al., 2009) and neuronal activity (Valero-
Cabré et al., 2011, 2007, 2005) by inducing, interfering or modulating ongoing activity in
circumscribed cortical sites.
More recently, it has been shown that the delivery of brief bursts of TMS pulses (usually
4-5 pulses) regularly spaced in time (so called rhythmic TMS), building a pure 10 Hz rhythm,
progressively phase-locked the natural alpha oscillators over the posterior parietal cortex in the
passive non-performing human brain (Thut et al., 2011). Additional studies have reported
evidence supporting the ability of rhythmic TMS, applied in a wide range of frequencies, to
modulate performance in different cognitive tasks (Jaegle & Ro, 2014; Romei et al., 2011, 2010).
Finally, a recent study by our group, based on the same dataset we further analyze in the current
report, demonstrated that 30 Hz rhythmic TMS delivered over the right Frontal Eye Field (FEF),
a region of the dorsal attention orienting network, locally entrained high beta oscillations in the
frontal region below the stimulation coil and suggested that such entrainment could be causally

140
linked to improvement of conscious visual detection for lateralized near-threshold targets (Vernet
et al. 2019).
Through such studies, rhythmic TMS has been building a solid credibility as a unique
causal tool to explore the oscillatory basis subtending the modulation of conscious perception by
identifying performance shifts tied to the entrainment of local rhythmic activity at specific
frequency bands and cortical sites. However, the role of the inter-regional synchrony between a
stimulated region (in our case the right FEF) and other areas of the attention orienting network
and their ability to modulate visual perception during the delivery of rhythmic TMS pulses
remains rather unexplored. Given evidence showing that TMS-entrained oscillations can spread
through connections to distant regions (Rosanova et al., 2009), we here re-analyzed a prior dataset
(Vernet et al. 2019), aiming to extend prior results supporting a perceptual modulatory role of
local episodic entrainment of high-beta activity in the right FEF. We hypothesized that the brief
entrainment of local 30 Hz oscillations by rhythmic patterns of TMS on the right FEF would
result in episodic inter-regional synchronization, likely operating within a dorsal fronto-parietal
system linking the FEF and posterior parietal areas (Capotosto et al. 2009; Quentin et al. 2014,
2015).
We reanalyzed a previously recorded EEG dataset from our group obtained during the
stimulation of the right FEF in healthy participants performing a lateralized conscious visual
detection task with near-threshold stimuli. We predicted that rhythmic TMS patterns would induce
transient inter-regional phase synchronization at a high beta frequency in the fronto-parietal
attention network. Such hypothesis would substantiate in EEG recordings as higher values of 30
Hz phase-locking values between frontal electrodes close to the stimulation site and parietal
electrodes for rhythmic than for random TMS patterns. We also hypothesized that, through
increased fronto-parietal phase synchronization, rhythmic stimulation over the right FEF would
distantly entrain high beta oscillations in the parietal cortex. We expected increases of local high
beta power and inter trial phase coherence over parietal electrodes during rhythmic compared to

141
random TMS patterns. Crucially, our study was based on a carefully designed control condition
(a random TMS pattern) containing the same number of pulses, thus, the same amount of
stimulation as the rhythmic 30Hz pattern of interest, but without the frequency-specific spacing
of TMS pulses. As in prior publications by our group, this strategy enabled us to isolate the effect
of the rhythmicity of the stimulation on inter-regional synchronization as well as the entrainment
of local oscillations (Chanes et al., 2013; Quentin et al., 2015; Vernet et al., 2019).

142
Material and Methods
Participants
The TMS-EEG dataset analyzed in the present study is the same used in a recent
publication to demonstrate local high-beta entrainment during stimulation of the right FEF and its
association with improvements of conscious visual performance (see Vernet et al. 2019 for
details). A group of right-handed 14 healthy participants (9 women) aged between 20 and 34 years
old (24 ± 4) took part in the original experiment. Participants had normal or corrected-to-normal
vision. They all took part voluntarily after having signed a consent form and were naïve as to the
purpose of the experiment. All the experimental procedures were performed according the
Declaration of Helsinki. A research protocol including all the interventions of this study was
sponsored by the INSERM and approved by an Institutional Review Board known in France as
Comité de Protection de Personnes (CPP Ile-de-France IV).
Conscious visual detection paradigm
An in-house MATLAB (Mathworks, version R2012b) script using the Psychtoolbox
extensions (Brainard, 1997) was used to control presentation of visual stimuli synchronized with
the delivery of the TMS pulses. During the task, participants were seated with their heads resting
on a chin-rest set so that their eyes stayed 57 cm away from the center of the screen.
Each trial started with a gray resting screen that stayed for 2.5 secs, followed by a fixation
screen that displayed a central fixation cross (size 0.5x0.5o) and a right and left rectangular
placeholders (6.0x5.5o) drawn 8.5° away from the center (Fig. 1A). These placeholders indicated
the potential right or left lateralized locations of the target during the trial. The duration of the
fixation screen was jittered between 1 and 1.5 secs to avoid predictability with regards to
upcoming events and to ensure sustained central fixation. A brief-lasting (66 ms) increase of size
(0.7 x 0.7o) for the central fixation cross alerted participants of the presentation of an upcoming

143
target. After an inter-stimulus-interval of 233 ms, in 80% of the trials a target appeared in the
middle of the left or the right placeholder with equal probability. The other 20% of the trials were
catch trials in which no target was shown in any of the placeholders. The target consisted of a
low-contrast Gabor stimulus (0.5o/cycle sinusoidal spatial frequency, 0.6o exponential standard
deviation) with vertical lines, appearing for 33 ms. Stimulus contrast was individually adjusted
for each participant during a calibration block performed prior to the beginning of the
experimental session. At all times, contrast level was never below 0.005, neither higher than 1
Michelson contrast. Similar tasks had been employed in prior publications in our research group
(see Chanes et al. 2013, 2015; Quentin et al. 2015; Vernet et al. 2019).
Participants were asked to perform a detection task, in which they had to report if they
consciously saw the target and, if ‘yes’, to report on which side it appeared (‘right’ or ‘left’). The
response window consisted in two arrow-like signs (“>>>” and “<<<”) presented simultaneously
below and above the fixation cross signaling the location of the right and left rectangular
placeholders. Participants were requested to indicate which arrow pointed to the location of the
placeholder where he/she had seen the target. The location of each arrow was randomized across
trials to prevent the preparation of a motor response prior to the appearance of the response
window and to make sure that visual processing activities in the FEF, located very close to the
motor areas, were temporally separated from motor decisions and responses. Participants
provided a response using three keyboard keys: an upper key to indicate the upper arrow
(corresponding to the ‘d’ letter key), a lower key to indicate the lower arrow (corresponding to
the ‘c’ letter key) and the space bar to indicate that no target had been consciously perceived.
Each participant performed 6 blocks: 1 calibration block, 1 training block and 4
experimental blocks (2 blocks for each TMS pattern: random or rhythmic, see details on TMS
patterns below). The order of the experimental blocks was counterbalanced across participants.
Each block was divided into sub-blocks of 20 trials. The length of the calibration and training
blocks was variable, as the termination of these two blocks was decided by the experimenter on

144
the basis of individual performance. Experimental blocks consisted of 7 sub-blocks and lasted
approximately 20 minutes each.
During the calibration block, target contrast was adjusted to reach a performance of 50%
correct detections using a staircase procedure (Cornsweet, 1962). Initially, the Gabor contrast was
set very high (Michelson contrast of 1), then, on each trial the contrast was brought up or down
according to the answer of the participant. The initial step in contrast was equal to the initial
contrast level (note that, regardless, contrast was always kept higher than 0.005 Michelson
contrast). On each change of direction, contrast steps were divided by two. When, in five
consecutive trials, contrast varied by less than 0.01 Michelson contrast, we considered that the
50% detection threshold had been reached. The threshold was measured a second time using the
same procedure. The two thresholds were then compared. If they differed by less than 0.01
Michelson contrast, the calibration block was terminated and the contrast used during the
following blocks was the average between the two thresholds. If they varied by more than 0.01
Michelson contrast, the threshold was determined again. During the calibration block, only sham
TMS patterns were delivered on the participant’s right frontal cortex. At the end of each sub-
block, the participant could take a short break.
Before starting the experimental blocks, the participant underwent a training block during
which trials with active TMS (see below for further detail on TMS procedure) were introduced.
In all the conditions (no target present, target on the right, target on the left) half the trials were
active TMS and the other half sham TMS. The order of presentation of active and sham TMS was
randomized for each sub-block of 20 trials. Participants’ performance during the training block
was checked to ensure that it stayed stable even with the intermixed active TMS trials. At the end
of each sub-block in this training period, participants were alerted if their false alarm rate was
higher than 50% and they received feedback on their percentage of incorrectly reported target
position and on their percentage of incorrect fixation. Between sub-blocks, the experimenter could

145
Figure 1. Experimental design, stimulation patterns and targeted cortical regions. (A) Visual
detection task performed by participants. After a period of fixation, a central cross became slightly larger
to alert participants of an upcoming event; then active and sham rhythmic or random TMS patterns were
delivered to the right FEF region prior to the presentation of a target that could appear at the center of a
right or left placeholder for a brief period of time. Participants were requested to indicate whether they did
perceive a target or not (no/yes), and, if they saw it, where it appeared (right/left). Notice that in 20% of
the trials, no target was presented in any of the placeholders. (B) Coronal, axial and sagittal MRI sections
from the frameless stereotaxic neuronavigation system showing the localization of the targeted cortical
right FEF (Talairach coordinates X=31, Y=-2, Z=47) in a T1-3D MRI of a representative participant. (C)
Schematic representation of the TMS patterns employed in active and sham 30 Hz rhythmic stimulation to
entrain oscillatory activity at the input frequency in the right FEF, and the random stimulation used as a
control to isolate the effect of stimulation frequency. (D) Schematic representation of the calculation of
the phase locking value. The phase of signals between each two sets of electrodes was extracted from the
Fourier spectra. For all trials, complex vectors were reconstructed with a phase (φ) equal to the phase
difference between two signals. These complex vectors were averaged over trials. TMS volume conduction
was ruled out by calculating the imaginary phase locking value, which consisted in the projection on the
imaginary axis of the complex vector averaged over all trials.

146
also manually adjust the contrast. Once the participant reached a stable performance, the
experimenter could decide to end the training block and start experimental blocks. Experimental
blocks were identical to training blocks (with the same feedback for the participant) except that
the contrast was kept constant in all sub-blocks and the participant was allowed to take a short
break only every two sub-blocks.
Recording of eye movements
During all blocks, the position of both eyes was monitored on each participant with a
remote eye tracking system (Eyelink 1000, SR Research). If the location of the participant’s eyes
was recorded more than 2° away from the center of the fixation cross at any time between the
appearance of the alerting cue and target offset, the trial was considered as non-fixated. The trial
was re-randomized amongst the remaining trials in the sub-block and repeated. Non-correctly
fixated trials were excluded from any data analysis. At the end of each block, the participant
received feedback on the percentage of incorrect fixations to improve the accuracy of their
fixations.
TMS procedure
TMS was triggered in synchronization with the presentation of the visual stimuli via a high
temporal resolution multichannel synchronization device (Master 8, A.M.P.I.) connected to two
biphasic repetitive stimulators (SuperRapid, Magstim) each attached to a standard 70 mm
diameter figure-of-eight TMS coil. The coil in charge of delivering active TMS patterns was held
tangentially to the skull above the location of the right FEF, with its handle oriented ~ parallel to
the central sulcus, at a ~45° angle in a rostral to caudal, lateral to medial direction. The other coil,
which delivered sham TMS stimulation was placed close the stimulation site but positioned
perpendicular to the skull directing the magnetic field away from the brain. The sham coil

147
produced the same clicking noise characterizing the delivery of an active TMS pulse but did not
deliver active and effective stimulation on the targeted right frontal cortex.
During the whole experiment, the position of the active TMS coil was tracked using a
neuronavigation system (Brainsight, Rogue Research). A T1-weighted MRI scan (3T Siemens
MPRAGE, flip angle=9, TR=2300 ms, TE=4.18 ms, slice thickness=1mm) was acquired for each
participant and the right FEF was localized on each individual scan as a spherical region of interest
of radius 0.5 cm centered on the Talairach coordinates x=31, y=-2, z=47 (Paus, 1996) (Fig 1B).
Using this neuronavigation system the active TMS coil was kept within a ± 3mm radius from the
center of the targeted site during the whole experimental session.
As done previously (Chanes et al. 2013; Quentin et al. 2015; Vernet et al. 2019), the two
types of TMS patterns employed in this experiment consisted in a burst made of four TMS pulses,
lasting 100 ms (measured from the onset of the first pulse to the onset of the last pulse) and ending
33 ms before the onset of the visual target. Two types of patterns were tested: a rhythmic pattern
for which the pulses were delivered regularly at a frequency of 30 Hz (33 ms of inter-pulse interval
within the burst) and a random pattern designed to not deliver any specific or pure single
frequency. In the random pattern, the time interval between the first and the fourth pulse within
the burst were kept identical to those in the rhythmic pattern. However, the onset time of the
second and third pulse were randomly jittered below and above their timings in the rhythmic
pattern (Fig. 1C). Some constraints applied to this timing randomization. First, since the time
needed by the TMS machine capacitor to fully re-charge enough current before delivering the
next pulse was limited, two pulses could not be delivered less than 20 ms apart. Second, the onset
time of the two middle pulses (the second and the third) had to be shifted at least 3 ms away from
the timings of the same bursts in the rhythmic pattern, to ensure that random patterns would never
deliver a perfectly regular 30 Hz frequency.
TMS stimulation intensity was set at a fixed level of 55% maximal simulator output
(MSO) for all participants. This value is slightly higher than the intensity proven efficient in prior

148
studies by the team (Chanes et al., 2013, 2015; Quentin et al., 2014) to take into account the
increased distance between the coil and the cortex due to the presence of the EEG electrodes and
cap. To allow across-study comparisons, at the end of the experiment, the individual resting motor
threshold (RMT) in the right hemisphere was determined visually for each participant as the TMS
intensity that yielded a motor activation of the abductor pollicis brevis muscle (thumb motion) in
about 50% of the attempts (Rossini et al., 2015). In average, the RMT was 72 ± 9% of maximum
stimulator output. The fixed stimulation intensity (55% of maximal machine output) that was used
for TMS stimulation corresponded to 78 ± 12% of our participant’s individual motor thresholds.
EEG recordings
EEG signals were continuously recorded during all experimental blocks with a TMS-
compatible system (BrainAmp DC and BrainVision Recording Software, BrainProducts GmbH).
We recorded signals from 60 electrodes spread evenly across the scalp, positioned according to
the international 10-20 system, plus a reference on the tip of the nose, a ground on the left ear
lobe and 4 additional EOG electrodes positioned above and below the right eye and on each
temple. Skin/electrode impedances were maintained below 5 kOhm. The signal was digitized at a
sampling rate of 5000 Hz.
EEG epoching and artifact removal procedure
All the EEG data analyses were performed with the FieldTrip toolbox (Oostenveld et al.,
2010) running on MATLAB 2017b. The EEG and EOG data were epoched across a [-2, 2] seconds
window centered on the onset of the target. Trials where the participant did not fixate the central
cross were automatically excluded during the task performance by monitoring the position of the
eyes using the eye tracking system. Prior to any data analysis, all trials contaminated by blinks
were removed by visual inspection. After these procedures, an average of 126±13 trials remained
for each experimental block.

149
To remove the artifact created by the discharge of a TMS pulse, data in a window of [-4
+12] ms centered on the delivery of a pulse was discarded. A second order Butterworth filter (1
to 50 Hz), with forward-backwards filtering, was applied on the remaining data before the
discarded data was interpolated using a piecewise cubic spline interpolation. For shorter
computation times, data were then down-sampled to 500 Hz before an Independent Component
Analysis (ICA) was performed. To make sure that the ICA did not introduce any differences
between conditions, trials for all four experimental blocks (whether they were active or sham TMS
trials, and whatever the TMS pattern tested) were gathered together and the ICA was computed
on this single dataset. This procedure enabled the removal of residual artifacts (including eye
movements, electrode malfunctions, 50 Hz power line artifacts and TMS artifacts lasting longer
than 12 ms). Components were identified as artifacts based on the guidelines of Rogasch et al.
(2014). On average 9 ± 2 components were rejected. After this procedure, the data was separated
into 4 conditions: active rhythmic TMS, sham rhythmic TMS, active random TMS and sham
random TMS.
EEG Data Analysis
The epoched EEG signal was transformed into the time-frequency domain using a 3-cycle
Morlet wavelet transform on the time window [-500 +500] ms around target onset and for
frequencies between 6 and 50 Hz. Three measures relative to oscillatory synchronization were
calculated: power, inter-trial coherence (ITC) and imaginary phase-locking value. Power was
calculated as the squared value of the modulus of the Morlet coefficients (per each time frame
and frequency bin) relative to a baseline window [-500 -300] ms before target onset. This outcome
measure shows, in decibels (dB) unit, the increase (positive value) or decrease (negative value)
of power relative to this period.
Inter-trial coherence (ITC) measures phase consistency across trials in a single location
(an electrode or a group of electrodes). To measure synchronization between distant regions, we

150
used the phase-locking value (PLV) (Lachaux et al., 1999). This measure reflects the stability of
the phase difference between two signals over trials in a specific frequency band. The phase
difference between two signals is extracted at all points in time from their Fourier spectra and
then averaged across all trials. The PLV is defined as the module of the resulting averaged
complex vector across trials (Fig. 1D). The following formula was used for its computation:
���X,Y(�) = Z 1�\I]^_` ∙ b �]∙c(\)\I]^_`
Z
Where � (t) represents the phase difference between the signal recorded by the electrodes x and y
at time t and ntrials is the total number of trails in the condition.
The PLV, as the module of a unit vector, is always comprised between 0 (random phase
difference between the two signals) and 1 (constant phase difference between two signals)
(Guevara & Corsi-Cabrera, 1996).
To avoid controversy on the fact that the PLV might be very sensible to volume
conduction, which would bias this parameter to show higher values between neighboring
electrodes (Vinck et al., 2011), we considered as a synchrony value the projection on the
imaginary axis of the complex vector of the PLV, so called imaginary PLV (Nolte et al., 2004;
Vinck et al., 2011).
��2���X,Y(�)4 = ��e 1�\I]^_` ∙ b �]∙c(\)\I]^_`
f
This value of synchrony effictively cancels the contribution to the PLV of signals with a
null or close to null phase difference, which is characteristic of two highly correlated signals
affected by volume conduction. The normalized value of the imaginary PLV is comprised
between -1 (when the two signals compared have a constant phase difference of - π/2) and 1
(when the two signals compared have a constant phase difference of π/2). We took as variable

151
the absolute value of the imaginary PLV (comprised between 0 and 1) to discard any information
about which signal in the pair is lagging in phase behind the other. This information is difficult to
interpret due to the cyclicity of the phase and would only render our results more difficult to
understand.
In our analysis, we computed the imaginary PLV between the electrode FC2 (the closest
to the stimulation coil) and all other scalp electrodes, for the time window [-500, +500] ms
centered around the target onset and for frequencies between 6 and 50 Hz.
Behavioral Data Analysis
Performance in the detection task was assessed through the perceptual sensitivity index
(d’), a measure from Signal Detection Theory that quantifies objective perception of stimuli
presented around the threshold of perception (Stanislaw & Todorov, 1999). Trials were separated
as “hits” (when the target was correctly detected), “misses” (when the target was not reported),
“false alarms” (when a target was reported for a catch trial, i.e. trials when no target was
presented), “correct rejections” (when no target was reported in a catch trial) and “errors” (when
a present target was reported on the wrong side of the screen). The perceptual sensitivity index
was then calculated from the rate of “hits” and “false alarms”. See Vernet et al. (2019) for more
detail on this analysis.
Statistical Analyses
We used a 2x2 orthogonal design with TMS pattern (rhythmic, random) and TMS
condition (active, sham). Therefore, values of imaginary PLV, power and ITC were compared in
two different ways. First, for each TMS pattern (rhythmic and random) we contrasted the active
TMS condition and the sham TMS condition. Second, for each stimulation condition (active and
sham) we compared the rhythmic TMS and random TMS bursts. Each pair were compared with
two-tailed paired Student’s t-test (α = 0.01). To correct for multiple comparisons in both

152
topographical and time-frequency maps, we performed cluster-based permutation tests with
Montecarlo sampling. This method clustered together neighboring electrodes or time-frequency
points that reached significance in the paired t-test, using a single t-value per cluster. A non-
parametric permutation test was applied on these clusters (10000 permutations, alpha = 0.05) to
determine which clusters survived the correction for multiple comparisons. Cluster-based
permutations is a highly sensitive method for correcting for multiple comparisons in EEG data
because it is adapted to data which is highly correlated in space and time (i.e. an effect on the
EEG signal is likely to be spread over adjacent sensors and consecutive time points) (Maris &
Oostenveld, 2007). However, currently no consensus exists on how cluster-based permutations
should be applied in factorial designs to evaluate interaction effects between multiple factors
(Edgington & Onghena, 2007; Suckling & Bullmore, 2004). For this reason, and driven by our
hypotheses of a contrast between rhythmic and random stimulation patterns to isolate the effect
of rhythmic structure of the TMS pattern on oscillatory activity, we chose to compute direct
pairwise comparisons between our conditions.
To analyze the participants’ performance, a 2x2x2 repeated measures analysis of variance
(ANOVA) was performed on values of perceptual sensitivity index (d’) with stimulation pattern
(rhythmic, random), stimulation condition (active, sham) and visual field (left, right) as within-
participant factors. Planned post-hoc t-student tests were also used for pairwise comparisons. See
Vernet et al. (2019) for more detail on this analysis.

153
Results
High-beta right fronto-parietal synchronization
Figure 2 illustrates the topographic representation of the imaginary PLV in the high-beta
band (25-35 Hz) between all scalp electrodes and FC2 (within the EEG array, the closest electrode
to the stimulated right FEF region) during the stimulation period ([-133 0] ms). Statistical analyses
revealed for such frequency band (close to the stimulation frequency) and time window
(stimulation period) a significant difference between the two TMS patterns tested. Rhythmic
active, compared to random active TMS patterns, increased synchronization between the frontal
electrode FC2 and a group of electrodes in the parieto-occipital region ipsilateral to the stimulation
(right hemisphere). The same pattern of fronto-parietal synchronization was observed when
comparing the active rhythmic condition to its sham control.
Figure 2. Topographical maps of the imaginary PLV in the time window [-0.133 0] ms for
frequencies [25 35] Hz. The map represents the imaginary synchrony values for all scalp electrodes
compared to the signal in the electrode closest to the stimulation coil (FC2). The maps are arranged
following our 2x2 cross-design. We compared sham vs. active TMS condition (in the columns) and
random vs. rhythmic TMS patterns (in the rows). Margin maps show the results of the statistical
permutation tests. Bolded electrodes represent clusters of electrodes that reached significance
(p<0.05). Imaginary synchrony significantly increased in a group of right parietal electrodes in the
active rhythmic TMS condition compared to both the sham rhythmic and active random controls.

154
Statistical analyses on the topographic maps suggest that the random TMS pattern
(comparison between random active and random sham conditions) increased synchronization
around 30 Hz between the right FEF and fronto-parietal regions in the left hemisphere
(contralateral to the stimulation), differently to what was observed during rhythmic stimulation.
However, the localization of significant differences in a permutation test is not very precise, the
building of clusters of electrodes might blur the effect over larger regions. Moreover, it must not
be forgotten that the tested null hypothesis extends to the whole array of electrodes, and cannot
be restricted to single electrodes (Maris & Oostenveld, 2007). In order to investigate in further
detail the spatial localization of the synchronization induced by rhythmic or random TMS we
defined two separate regions of interest, one in the left and one in right hemisphere, including
parietal and parieto-occipital electrodes locations.
Time-frequency maps of the averaged activity over electrodes in these regions of interest
are shown in Fig. 3. Statistical analyses on the time-frequency data confirm that the rhythmic TMS
pattern, compared to the random pattern, increased right fronto-parietal synchrony only during
the delivery of active TMS and in a frequency band restricted to high-beta (24-45 Hz) oscillations
(Fig. 3A). However, contrary to what was suggested by the first topographic analysis, statistics
showed no effect of the random TMS on left fronto-parietal synchrony (Fig. 3B comparison
between random active and sham conditions).
These topographic and time-frequency analyses on the PLV between frontal and parietal
electrodes showed that the delivery of rhythmic TMS patterns over the right FEF induced an
increase in inter-regional synchronization in the high-beta band that is short lasting (not exceeding
the period of stimulation) and restricted to the right fronto-parietal network, ipsilateral to the
stimulation.

155
Figure 3. Evolution in time of fronto-
parietal oscillatory synchronization.
(A) Imaginary synchrony between the
FC2 electrode and right parietal
electrodes. (B) Imaginary synchrony
between the FC2 electrode and left
parietal electrodes. Time is centered on
the onset of the target (dotted gray line).
Dotted red lines underline the time
window between first (-133 ms) and the
last (-33 ms) TMS pulse. Dotted black
line indicates frequency of stimulation
(30Hz). Margin maps show the results of
the statistical permutation tests, with
black points indicating clusters that
reached significance (p<0.05). Imaginary
fronto-parietal synchrony increases
ipsilaterally (right hemisphere) during
30Hz rhythmic stimulation compared to
both random and sham TMS controls.
Long-distance oscillatory entrainment
Locally, focusing only on parietal and parieto-occipital electrodes, power around 30 Hz in
both left and right regions of interest increased significantly in response to active rhythmic TMS
delivered frontally (compared to sham rhythmic TMS), but not to active random frontal
stimulation (compared to its sham control) (Fig. 4).
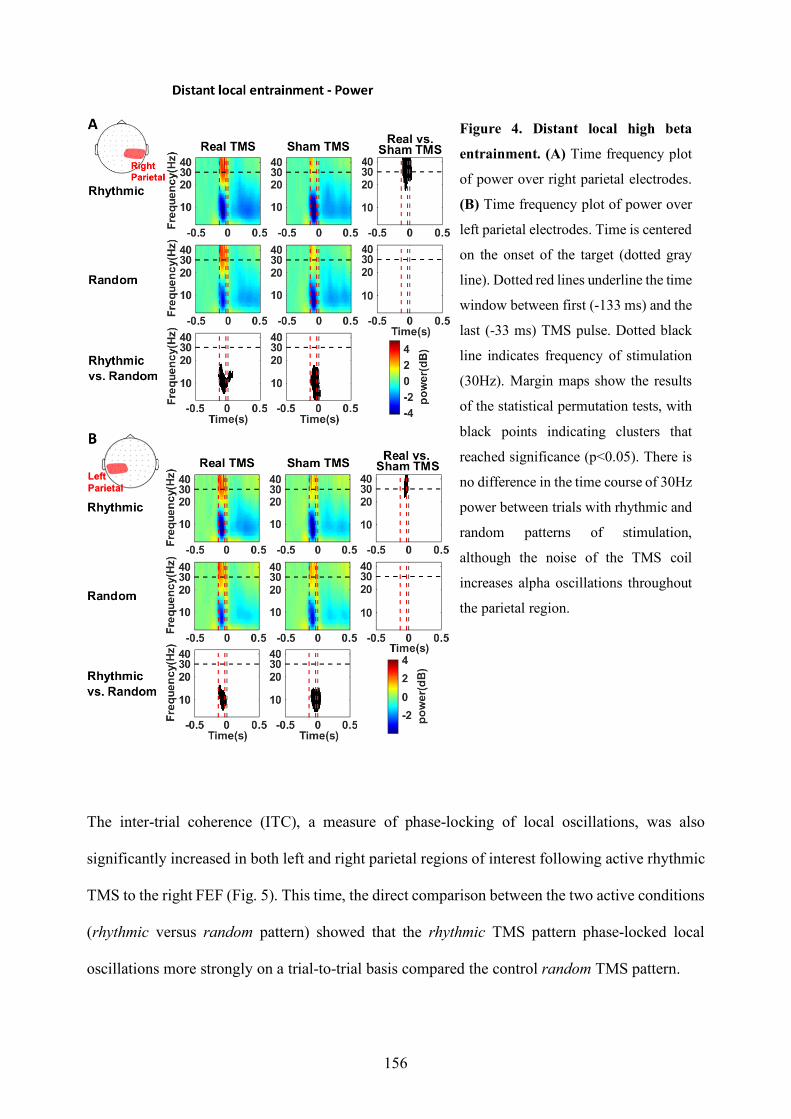
156
The inter-trial coherence (ITC), a measure of phase-locking of local oscillations, was also
significantly increased in both left and right parietal regions of interest following active rhythmic
TMS to the right FEF (Fig. 5). This time, the direct comparison between the two active conditions
(rhythmic versus random pattern) showed that the rhythmic TMS pattern phase-locked local
oscillations more strongly on a trial-to-trial basis compared the control random TMS pattern.
Figure 4. Distant local high beta
entrainment. (A) Time frequency plot
of power over right parietal electrodes.
(B) Time frequency plot of power over
left parietal electrodes. Time is centered
on the onset of the target (dotted gray
line). Dotted red lines underline the time
window between first (-133 ms) and the
last (-33 ms) TMS pulse. Dotted black
line indicates frequency of stimulation
(30Hz). Margin maps show the results
of the statistical permutation tests, with
black points indicating clusters that
reached significance (p<0.05). There is
no difference in the time course of 30Hz
power between trials with rhythmic and
random patterns of stimulation,
although the noise of the TMS coil
increases alpha oscillations throughout
the parietal region.
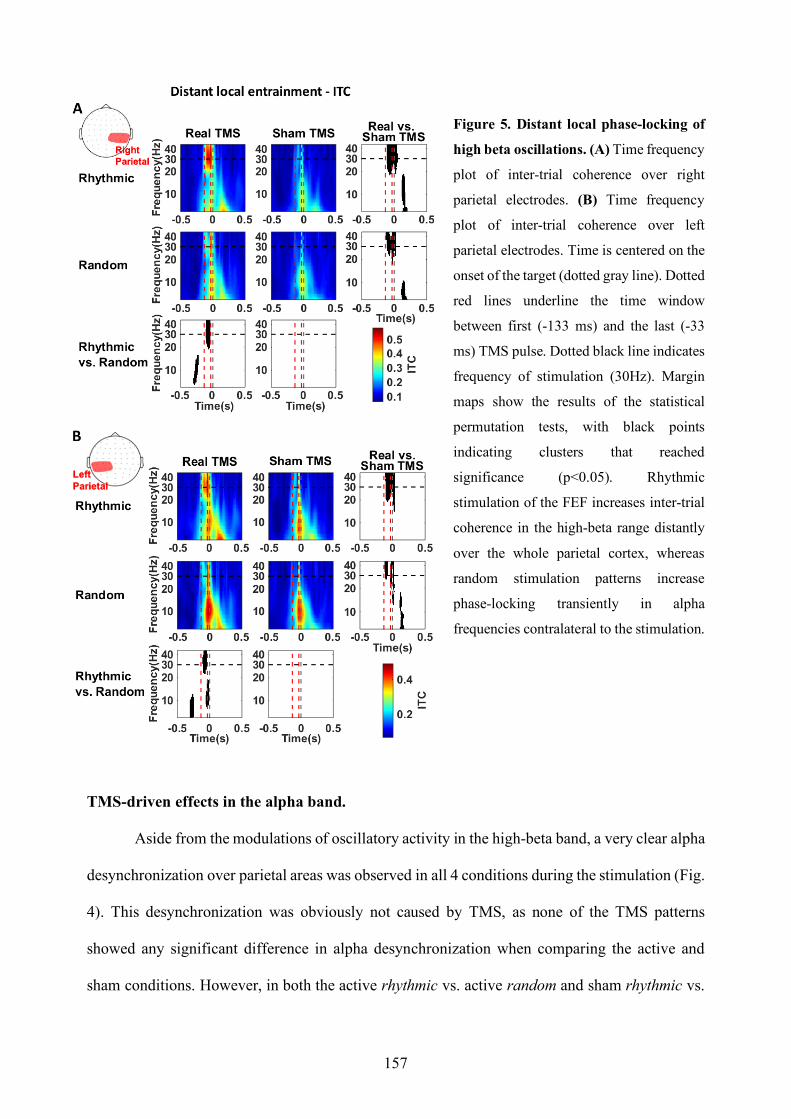
157
Figure 5. Distant local phase-locking of
high beta oscillations. (A) Time frequency
plot of inter-trial coherence over right
parietal electrodes. (B) Time frequency
plot of inter-trial coherence over left
parietal electrodes. Time is centered on the
onset of the target (dotted gray line). Dotted
red lines underline the time window
between first (-133 ms) and the last (-33
ms) TMS pulse. Dotted black line indicates
frequency of stimulation (30Hz). Margin
maps show the results of the statistical
permutation tests, with black points
indicating clusters that reached
significance (p<0.05). Rhythmic
stimulation of the FEF increases inter-trial
coherence in the high-beta range distantly
over the whole parietal cortex, whereas
random stimulation patterns increase
phase-locking transiently in alpha
frequencies contralateral to the stimulation.
TMS-driven effects in the alpha band.
Aside from the modulations of oscillatory activity in the high-beta band, a very clear alpha
desynchronization over parietal areas was observed in all 4 conditions during the stimulation (Fig.
4). This desynchronization was obviously not caused by TMS, as none of the TMS patterns
showed any significant difference in alpha desynchronization when comparing the active and
sham conditions. However, in both the active rhythmic vs. active random and sham rhythmic vs.

158
sham random comparisons, statistical analyses revealed that the rhythmic pattern induced stronger
alpha desynchronization than the random pattern.
On the contrary, at the end of the TMS burst, we observed some increases in phase-locking
in the alpha band over the same parietal areas (Fig. 5). Although visible in all 4 conditions (note
that, again, this phase-locking shows no significant difference between the active and sham
conditions), this phase-locking was stronger in the active random stimulation condition
(compared to active rhythmic stimulation) in the hemisphere contralateral to the stimulation (Fig.
5B).
Behavioral effect of induced high-beta synchronization
In addition to electrophysiological results showing an increase in right fronto-parietal
synchrony and a distant entrainment of high-beta oscillations in parietal regions, 30 Hz rhythmic
stimulation of right FEF modulates behavior in a detection at threshold task, as previously
reported in Vernet et al. (2019). A 2x2x2 ANOVA on values of perceptual sensitivity (d’) revealed
a main effect of stimulation condition (active or sham) F(1,13)=5.33; p < 0.05), with higher levels
of visual sensitivity (d’), i.e. better detection performances, in trials with active TMS, regardless
of the TMS pattern. The statistical analysis also revealed a significant main effect of visual field
(right or left) (F(1,13)=10.14; p < 0.01) with targets appearing in the right visual field generally
better detected than targets appearing in the left visual field. No other significant effects were
found although the three-way interaction visual field x stimulation pattern x stimulation condition
displayed a trend towards statistical significance (F(1,13)= 3.97; p < 0.068).
The triple interaction only approached statistical significance. Nonetheless, on the basis of
a strong a priori hypothesis supporting different effects for rhythmic and random stimulation on
conscious perception (Chanes et al. 2013, 2015; Quentin et al. 2015 and see Vernet et al. 2019 for
more detail on the statistical analysis of behavioral results) student’s t-tests were performed to
compare active and sham stimulation. These analyses revealed that rhythmic active TMS

159
(compared to sham TMS for the same pattern) increased perceptual sensitivity (d’) for targets
appearing on the left visual field (p < 0.01) but not for targets appearing in the right visual field
(p>0.88) (Fig. 6). No significant differences were found between the active and sham TMS
conditions for the random pattern in any visual field (both active vs. sham comparisons p>0.11).
Figure 6. Modulation of perceptual sensitivity (d') by TMS for targets presented in the left and right
visual field (extracted from Vernet et al., 2019). Results of the post-hoc t-tests are indicated as follows: **
p < 0.01. Notice that perceptual sensitivity is increased only for targets contralateral to the stimulation site
(left) in active compared to sham rhythmic TMS.
Active
Active
Sham
Sham
Active
Active
Sham
Sham
1
2
Perc
ep
tual sen
sit
ivit
y d
'
Rhythmic Random
Left visual field
Rightvisual field
Left visual field
Rightvisual field
**
160
Discussion
Here we used rhythmic TMS coupled to EEG recordings during a visual detection
paradigm to explore in humans the contributions of 30 Hz inter-regional synchrony within the
right dorsal fronto-parietal systems and its causal implications for the modulation of conscious
visual perception. We demonstrated that 30 Hz rhythmic TMS patterns delivered over the right
FEF induced synchronization in the high-beta band between this area and ipsilateral parietal
regions. This increase in synchronization was transient and did not extend beyond the delivery of
the last TMS pulse. Since synchronization increases were not observed when participants were
stimulated with our control random TMS pattern of equal number of pulses and total duration, we
conclude that this effect is dependent on the precise spatio-temporal structure of our high-beta
rhythmic pattern. We also posit that very likely such effects on fronto-parietal synchrony are
closely related to the local entrainment of a 30 Hz episodic rhythm induced by TMS on the right
FEF reported previously on this same dataset (Vernet et al., 2019).
Network effects of focal frontal stimulation
Given that focal stimulation of the right FEF could result, through inter-regional
synchronization, in an effect on parietal ipsilateral brain regions, we investigated if the focal
entrainment of a 30 Hz frequency in frontal regions reported previously (Vernet et al., 2019) might
show signs of spreading to anatomically distant interconnected regions, which were not targeted
and neither directly influenced by TMS. For this specific study we focused on EEG leads in
posterior parietal regions, such as those around the intraparietal sulcus (IPS) area that has been
shown to interact with the right FEF as part of a dorsal attentional orienting network (Capotosto
et al. 2009; Quentin et al. 2014; Quentin et al. 2015).
Indeed, as predicted, we found that 30 Hz rhythmic TMS patterns delivered to the right
FEF did not only locally entrain high-beta activity (Vernet et al., 2019) but they also increased

161
high-beta power and they phase-locked high-beta oscillations over parietal electrodes, a
phenomenon likely derived from previously reported entrainment of cortical oscillations by
episodic TMS (Thut et al., 2011). It is interesting to notice, however, that such distant entrainment
of high-beta oscillations could be at least partially independent from direct right fronto-parietal
synchronization mechanisms, as it was observed for both the left and right hemisphere EEG
contacts.
The electrophysiological effects described above, induced by rhythmic TMS bursts
delivered shortly before presentation of a low contrast target, were accompanied by modulations
of conscious visual performance, consisting in increases of perceptual sensitivity (d’) (Vernet et
al., 2019). Taken together, these results contribute evidence in favor of the causal implication of
high-beta oscillatory activity within a fronto-parietal system potentially involved in the allocation
of spatial attention and with bearing on the modulation of conscious visual detection performance.
Additions to previous knowledge on high-beta oscillatory activity in conscious visual
perception
These results are consistent with highly influential findings by Buschman and Miller
(2007) in non-human primates linking, by means of intracranial recordings, high-beta fronto-
parietal synchrony with the allocation of endogenous attention in a top-down visual search task
and their replication by Phillips and Takeda (2009) employing scalp EEG in humans. Our study
used a simple conscious detection task which did not manipulate the allocation of attention by
means of spatial or attentional cues. Nonetheless, this same modality of attention might have been
engaged in our participants, as on each trial they were cued with a central alert signal to the
apparition of an upcoming target with a delay of 233 ms, for which only endogenous attention
can uphold expectancy (Carrasco, 2011).
Our results build on the above-mentioned correlational results and, adding the value of
causality, provide further proof of a causal relationship between human high-beta fronto-parietal

162
synchrony and the modulation of visual perception. Most importantly, they extend results derived
from this same TMS-EEG dataset and suggest that short bursts of focal rhythmic TMS do not
only have the ability to locally entrain frequency-specific rhythms within the targeted area dictated
by the pace of stimulation as reported previously (Vernet et al. 2019) but, indeed, right frontal
local entrainment showed the ability to synchronize in a frequency-specific manner directly
stimulated target region (in this case the right FEF) with interconnected regions (such as posterior
parietal sites) and entrain rhythms at this same frequency distantly. Last but not least, our analyses
support the suitability of rhythmic TMS patterns (built as bursts of individually triggered pulses)
delivered onto a specific cortical location and the comparison of their cognitive/behavioral effects
with those under the influence of equivalent control random arrhythmic patterns (of equal duration
and number of pulses) allowing to isolate the causal contribution of stimulation frequency. Owing
to this TMS burst control pattern, the reported TMS-driven electrophysiological effects showing
significant differences between active rhythmic and random TMS conditions are unlikely to be
artifacts caused by auditory (clicking) or tactile (scalp tapping) stimulation inherent to the delivery
of TMS pulses or explained by the impact of a magnetic pulse on the neuronal activity (notice
that any of the potential artefactual effect of single pulses would be identically present in both
rhythmic and random TMS conditions).
Pioneering research, published prior to ours, already employed rhythmic TMS (without
EEG recording) to investigate the causal role of local oscillatory activity on different cognitive
functions and behavioral tasks (Jaegle & Ro, 2014; Romei et al., 2010; Romei et al., 2011).
Nonetheless, our study is the first to use coupled TMS-EEG recordings and gather evidence
supporting of a potential causal link between a complex cognitive process such as the modulation
of conscious perception subtended by long-range systems (such as dorsal attention orienting
networks) specifically with interregional synchronization between frontal and parietal sites.

163
Mechanistic explanation for the causal role of inter-regional synchrony in improvements of
visual perception
A detailed mechanistic explanation for our electrophysiological and behavioral findings
remains open. Nonetheless in their original non-human primate study, Buschman and Miller
(2007) hypothesized that synchronization of neuronal activity may increase the efficiency of inter-
areal coordination and communication, enabling to process a single object and to suppress the
processing of distractors. This hypothesis is consistent with the explanatory model developed in
2009 by Fries in which he proposes that inter-regional synchronization in the gamma-band
provides an exclusive and effective communication link between two areas which is selective to
one stimulus and invariant even in the presence of distractors (Fries, 2009).
Unfortunately, although our data show that entrained high-beta neural activity in the right
FEF (modulated by focal rhythmic TMS bursts) increased synchronization between the stimulated
site and electrodes positioned over right parietal regions, the limited spatial resolution of our EEG
montage (60 electrodes) does not enable us to pinpoint which specific parietal regions got
synchronized during right FEF rhythmic stimulation patterns. However, previous results
employing diffusion imaging with participants who underwent similar non- invasive stimulation
patterns and behavioral tasks (Quentin et al., 2014, 2015) suggest that fronto-parietal
synchronization occurs along the 1st branch of the Superior Longitudinal Fasciculus (SLF I),
which is part of the white matter connections of the dorsal attention network linking the FEF and
the posterior intraparietal sulcus (IPS). According to rich and solid correlational (Corbetta et al.,
2005, 2008) and causal evidence (Chanes et al., 2013; Chica et al., 2011) the network defined by
the areas linked by this white matter system has been shown to play a major role in the allocation
of visuo-spatial attention and the modulation of conscious perception.
We here propose that the entrainment of oscillations within a high beta frequency (around
30 Hz) in the right FEF could spread, presumably through white matter projections contained
within the SLF I, from the FEF to right parietal regions. This specific tract of white matter

164
connectivity would subtend a frequency-specific synchronization effect between areas of the
dorsal attention orienting network responsible for enabling spatial attention, and subserve more
efficient communication between frontal and parietal cortical sites. Increased coordination could
be beneficial for a fast and flexible allocation of spatial attention which would enhance visual
sensitivity and facilitate conscious access.
Although this result was strongly predicted on the basis of prior evidence showing a
significant correlation between volume of the SLF I and TMS-induced improvement of visual
perception (Quentin et al., 2014, 2015), we did not apply a strong hypothesis on the loci involved
in high-beta synchronization in our ad hoc analyses. Instead, we computed measures of synchrony
between the electrode overlaying the right FEF and all scalp electrodes of a full array of 60 EEG
leads. It is therefore remarkable that statistical analyses reveal a significant synchronization
temporally tied to the duration of the delivered rhythmic TMS between the right FEF and
electrodes over the right parietal cortex.
Modulations of alpha oscillations
In addition to the modulation of high-beta oscillations, the implemented TMS
manipulation also showed effects on alpha band oscillations (Fig. 4 and 5). Because these
modulations are visible in the active and also sham TMS conditions, we hypothesize that they
were caused by the click sound of the TMS and not a direct manipulation of neuronal activity by
the TMS pulses. The loud sound that accompanies the delivery of TMS, and that in our task is
always delivered 133 ms before the onset of the target, could have an alerting effect and prompt
participants to concentrate their attention on the computer screen. The role of alpha
desynchronization as a marker of attention orienting is well known (Capotosto et al., 2009;
Klimesch et al., 1998) and the strong alpha desynchronization we observe in all four tested
conditions is consistent with this proposition.

165
We also propose that the phase-locking of alpha oscillations observed after the last TMS
pulse is a result of the loud sound, through a different mechanism. It has been previously
demonstrated that a sound can cross-modally phase-lock alpha oscillations in occipital cortices
(Romei et al., 2012). The interaction between such cross-modal alpha phase-locking and the
random stimulation, which is designed to entrain a wide range of frequencies (amongst them
alpha) on different trials, could explain the significantly higher alpha phase-locking over the left
parietal region in the active random condition compared to the active rhythmic condition. Much
remains to be understood about these modulations in the alpha range. However, as modulations
in this frequency band were not predicted and are hence outside of the initial focus of this article,
further studies regarding the effect on the brain of the sound of sham TMS will be needed to shed
more light on these phenomena.
Summary
Our results support the ability to manipulate “at will” interregional synchrony across
specific pathways using rhythmic transcranial magnetic stimulation, an observation that might
become interesting to systematically map causal synchrony interactions at high beta or other
frequency bands, between novel sites and subtending other cognitive processes.
In conclusion, the findings contributed by this study (1) extend prior observations and
hypotheses mainly derived from invasive electrophysiological recordings in non-human primate
with correlational approaches and adds evidence for causality to previously suspected associations
between right fronto-parietal synchronization in the high-beta band and the modulation of
conscious visual performance in human participants; (2) They provide more solid ground to
hypothesize a role for right frontal oscillations and fronto-parietal synchrony at this frequency
band as a relevant physiological coding strategy, likely allowing the orienting of visuo-spatial
attention through synchronization in the fronto-parietal dorsal attention network. Important for
the field of brain plasticity, (3) our results support the use of non-invasive brain stimulation

166
methods, and in particular rhythmic TMS to engage or modulate local and inter-regional
synchrony, either to optimize cognitive performance in healthy participants or to develop novel
therapeutic approaches based in the manipulation of abnormal oscillatory activity subtending
neurological conditions.

167
Conflict of interest
The authors declare no competing interests.
Acknowledgement
Chloé Stengel was supported by a PhD fellowship from the University Pierre and Marie Curie.
Marine Vernet was supported by fellowships from the Fondation pour la Recherche Medicale.
Julià L. Amengual was supported by a fellowship from the Fondation Fyssen. The activities of
the laboratory of Dr. Valero-Cabré are supported by research grants IHU-A-ICM-Translationnel,
ANR projet Générique OSCILOSCOPUS and Flag-era-JTC-2017 CAUSALTOMICS. The
authors would also like to thank Romain Quentin, Juliette Godard and Laura Fernandez for
providing help during data acquisition and the Naturalia & Biologia Foundation for financial
assistance for traveling and attending meetings.
Author contributions
Conceptualization: M.V., C.S. and A.V.-C. Data acquisition: M.V., and A.V.-C. Data analysis:
C.S. Manuscript preparation: C.S., M.V., J.L.A. & A.V.-C. Supervision: A.V.-C.
Data availability statement
Data are available from the corresponding author upon request.

168
REFERENCES
Brainard, D. H. (1997). The psychophysics toolbox. Spatial Vision, 10, 433–436.
Bressler, S. L., & Tognoli, E. (2006). Operational principles of neurocognitive networks.
International Journal of Psychophysiology, 60, 139–148.
Britz, J., Van De Ville, D., & Michel, C. M. (2010). BOLD correlates of EEG topography reveal
rapid resting-state network dynamics. NeuroImage, 52, 1162–1170.
Buschman, T. J., & Miller, E. K. (2007). Top-Down Versus Bottom-Up Control of Attention in
the Prefrontal and Posterior Parietal Cortices. Science, 315, 1860–1862.
Buzsáki, G., & Draguhn, A. (2004). Neuronal oscillations in cortical networks. Science, 304,
1926–1929.
Capotosto, P., Babiloni, C., Romani, G. L., & Corbetta, M. (2009). Frontoparietal cortex controls
spatial attention through modulation of anticipatory alpha rhythms. The Journal of
Neuroscience, 29, 5863–5872.
Carrasco, M. (2011). Visual attention: The past 25 years. Vision Research, 51, 1484–1525.
Chanes, L., Chica, A. B., Quentin, R., & Valero-Cabré, A. (2012). Manipulation of Pre-Target
Activity on the Right Frontal Eye Field Enhances Conscious Visual Perception in Humans.
PLoS ONE, 7, e36232.
Chanes, L., Quentin, R., Tallon-Baudry, C., & Valero-Cabré, A. (2013). Causal Frequency-
Specific Contributions of Frontal Spatiotemporal Patterns Induced by Non-Invasive
Neurostimulation to Human Visual Performance. The Journal of Neuroscience, 33, 5000–
5005.
Chanes, L., Quentin, R., Vernet, M., & Valero-Cabré, A. (2015). Arrhythmic activity in the left
frontal eye field facilitates conscious visual perception in humans. Cortex, 71, 240–247.
Chica, A. B., Bartolomeo, P., & Valero-Cabré, A. (2011). Dorsal and ventral parietal contributions
to spatial orienting in the human brain. The Journal of Neuroscience, 31, 8143–8149.
Corbetta, M., Kincade, M. J., Lewis, C., Snyder, A. Z., & Sapir, A. (2005). Neural basis and
recovery of spatial attention deficits in spatial neglect. Nature Neuroscience, 8, 1603–
1610.
Corbetta, M., Patel, G., & Shulman, G. L. (2008). The reorienting system of the human brain:
From environment to theory of mind. Neuron, 58, 306–324.
Cornsweet, T. N. (1962). The staircrase-method in psychophysics. The American Journal of
Psychology, 75, 485–491.
Edgington, E., & Onghena, P. (2007). Randomization tests. Chapman and Hall/CRC.

169
Engel, A. K., Fries, P., & Singer, W. (2001). Dynamic Predictions: Oscillations and Synchrony
in Top-down Processing. Nature Reviews Neuroscience, 2, 704–716.
Fries, P. (2005). A mechanism for cognitive dynamics: Neuronal communication through
neuronal coherence. Trends in Cognitive Sciences, 9, 474–480.
Fries, P. (2009). Neuronal Gamma-Band Synchronization as a Fundamental Process in Cortical
Computation. Annual Review of Neuroscience, 32, 209–224.
Fries, P., Reynolds, J. H., Rorie, A. E., & Desimone, R. (2001). Modulation of oscillatory neuronal
synchronization by selective visual attention. Science, 291, 1560–1563.
Gregoriou, G. G., Gotts, S. J., Zhou, H., & Desimone, R. (2009). High-frequency, long-range
coupling between prefrontal and visual cortex during attention. Science, 324, 1207–1210.
Gross, J., Schmitz, F., Schnitzler, I., Kessler, K., Shapiro, K., Hommel, B., & Schnitzler, A.
(2004). Modulation of long-range neural synchrony reflects temporal limitations of visual
attention in humans. Proceedings of the National Academy of Sciences of the United States
of America, 101, 13050–13055.
Guevara, M. A., & Corsi-Cabrera, M. (1996). EEG coherence or EEG correlation? International
Journal of Psychophysiology, 23, 145–153.
Hipp, J. F., Engel, A. K., & Siegel, M. (2011). Oscillatory Synchronization in Large-Scale
Cortical Networks Predicts Perception. Neuron, 69, 387–396.
Jaegle, A., & Ro, T. (2014). Direct Control of Visual Perception with Phase-specific Modulation
of Posterior Parietal Cortex. Journal of Cognitive Neuroscience, 26, 422–432.
Klimesch, Doppelmayr, M., Russegger, H., Pachinger, T., & Schwaiger, J. (1998). Induced alpha
band power changes in the human EEG and attention. Neuroscience Letters, 244, 73–76.
Klimesch, Sauseng, P., & Gerloff, C. (2003). Enhancing cognitive performance with repetitive
transcranial magnetic stimulation at human individual alpha frequency. European Journal
of Neuroscience, 17, 1129–1133.
Lachaux, J.-P., Rodriguez, E., Martinerie, J., & Varela, F. J. (1999). Measuring phase synchrony
in brain signals. Human Brain Mapping, 8, 194–208.
Laughlin, S. B., & Sejnowski, T. J. (2003). Communication in neuronal networks. Science, 301,
1870–1874.
Maris, E., & Oostenveld, R. (2007a). Nonparametric statistical testing of EEG- and MEG-data.
Journal of Neuroscience Methods, 164, 177–190.
Maris, E., & Oostenveld, R. (2007b). Nonparametric statistical testing of EEG- and MEG-data.
Journal of Neuroscience Methods, 164, 177–190.

170
Mesulam, M. M. (1990). Large-scale neurocognitive networks and distributed processing for
attention, language, and memory. Annals of Neurology, 28, 597–613.
Nolte, G., Bai, O., Wheaton, L., Mari, Z., Vorbach, S., & Hallett, M. (2004). Identifying true brain
interaction from EEG data using the imaginary part of coherency. Clinical
Neurophysiology, 115, 2292–2307.
Oostenveld, R., Fries, P., Maris, E., & Schoffelen, J.-M. (2010). FieldTrip: Open Source Software
for Advanced Analysis of MEG, EEG, and Invasive Electrophysiological Data.
Computational Intelligence and Neuroscience, 2011, e156869.
Paus, T. (1996). Location and function of the human frontal eye-field: A selective review.
Neuropsychologia, 34, 475–483.
Phillips, S., & Takeda, Y. (2009). Greater frontal-parietal synchrony at low gamma-band
frequencies for inefficient than efficient visual search in human EEG. International
Journal of Psychophysiology, 73, 350–354.
Quentin, R., Chanes, L., Vernet, M., & Valero-Cabre, A. (2014). Fronto-Parietal Anatomical
Connections Influence the Modulation of Conscious Visual Perception by High-Beta
Frontal Oscillatory Activity. Cerebral Cortex, 25, 2095-2101.
Quentin, R, Elkin Frankston, S., Vernet, M., Toba, M. N., Bartolomeo, P., Chanes, L., & Valero-
Cabré, A. (2015). Visual Contrast Sensitivity Improvement by Right Frontal High-Beta
Activity Is Mediated by Contrast Gain Mechanisms and Influenced by Fronto-Parietal
White Matter Microstructure. Cerebral Cortex, 26, 2381–2390.
Rodriguez, E., George, N., Lachaux, J.-P., Martinerie, J., Renault, B., & Varela, F. J. (1999).
Perception’s shadow: Long-distance synchronization of human brain activity. Nature,
397, 430.
Rogasch, N. C., Thomson, R. H., Farzan, F., Fitzgibbon, B. M., Bailey, N. W., Hernandez-Pavon,
J. C., … Fitzgerald, P. B. (2014). Removing artefacts from TMS-EEG recordings using
independent component analysis: Importance for assessing prefrontal and motor cortex
network properties. NeuroImage, 101, 425–439.
Romei, V., Gross, J., & Thut, G. (2012). Sounds Reset Rhythms of Visual Cortex and
Corresponding Human Visual Perception. Current Biology, 22, 807–813.
Romei, V., Gross, J., & Thut, G. (2010). On the Role of Prestimulus Alpha Rhythms over
Occipito-Parietal Areas in Visual Input Regulation: Correlation or Causation? Journal of
Neuroscience, 30, 8692–8697.

171
Romei, V., Driver, J., Schyns, P. G., & Thut, G. (2011). Rhythmic TMS over parietal cortex links
distinct brain frequencies to global versus local visual processing. Current Biology, 21,
334–337.
Rosanova, M., Casali, A., Bellina, V., Resta, F., Mariotti, M., & Massimini, M. (2009). Natural
Frequencies of Human Corticothalamic Circuits. Journal of Neuroscience, 29, 7679–7685.
Rossini, P. M., Burke, D., Chen, R., Cohen, L. G., Daskalakis, Z., Iorio, R. D., … Ziemann, U.
(2015). Non-invasive electrical and magnetic stimulation of the brain, spinal cord, roots
and peripheral nerves: Basic principles and procedures for routine clinical and research
application. An updated report from an I.F.C.N. Committee. Clinical Neurophysiology,
126, 1071–1107.
Saalmann, Y. B., Pigarev, I. N., & Vidyasagar, T. R. (2007). Neural mechanisms of visual
attention: How top-down feedback highlights relevant locations. Science, 316, 1612–1615.
Sauseng, P., Klimesch, W., Heise, K. F., Gruber, W. R., Holz, E., Karim, A. A., … Hummel, F.
C. (2009). Brain Oscillatory Substrates of Visual Short-Term Memory Capacity. Current
Biology, 19, 1846–1852.
Stanislaw, H., & Todorov, N. (1999). Calculation of signal detection theory measures. Behavior
Research Methods, Instruments, & Computers: A Journal of the Psychonomic Society, Inc,
31, 137–149.
Suckling, J., & Bullmore, E. (2004). Permutation tests for factorially designed neuroimaging
experiments. Human Brain Mapping, 22, 193–205.
Thut, G., Veniero, D., Romei, V., Miniussi, C., Schyns, P., & Gross, J. (2011). Rhythmic TMS
Causes Local Entrainment of Natural Oscillatory Signatures. Current Biology, 21, 1176–
1185.
Valero-Cabré, A., Pascual-Leone, A., & Coubard, O. A. (2011). La stimulation magnétique
transcrânienne (SMT) dans la recherche fondamentale et clinique en neuroscience. Revue
Neurologique, 167, 291–316.
Valero-Cabré, A., Payne, B. R., & Pascual-Leone, A. (2007). Opposite impact on 14C-2-
deoxyglucose brain metabolism following patterns of high and low frequency repetitive
transcranial magnetic stimulation in the posterior parietal cortex. Experimental Brain
Research, 176, 603–615.
Valero-Cabré, A., Payne, B. R., Rushmore, J., Lomber, S. G., & Pascual-Leone, A. (2005). Impact
of repetitive transcranial magnetic stimulation of the parietal cortex on metabolic brain
activity: A 14C-2DG tracing study in the cat. Experimental Brain Research, 163, 1–12.

172
Varela, F., Lachaux, J.-P., Rodriguez, E., & Martinerie, J. (2001). The brainweb: Phase
synchronization and large-scale integration. Nature Reviews Neuroscience, 2, 229–239.
Vernet, M., Stengel, C., Quentin, R., Amengual, J. L., & Valero-Cabré, A. (2019). Entrainment
of local synchrony reveals a causal role for high-beta right frontal oscillations in human
visual consciousness. Sci Rep, 9, 14510.
Vinck, M., Oostenveld, R., van Wingerden, M., Battaglia, F., & Pennartz, C. M. A. (2011). An
improved index of phase-synchronization for electrophysiological data in the presence of
volume-conduction, noise and sample-size bias. NeuroImage, 55, 1548–1565.

173
PROJECT 2 Exploring unexpected contributions of left frontal neural noise to
the modulation of conscious visual perception in the human brain: a combined TMS-EEG study
Résumé (français)
Des résultats antérieurs chez le primate non-humain ont mis en évidence un rôle crucial des
oscillations à une fréquence beta-haute, opérant dans l’ensemble du réseau fronto-pariétal dorsal
latéralisé à droite, pour l’orientation de l’attention endogène et la modulation de la perception
visuelle consciente. Cependant, une étude parallèle faisant usage de la Stimulation Magnétique
Transcrânienne (SMT) pour examiner les contributions des régions homotopes dans l’hémisphère
gauche a reporté, paradoxalement, que dans ces régions (le champ oculomoteur frontal gauche)
une activité non spécifique en fréquence ou arythmique, générée par la stimulation cérébrale non
invasive focale, et non des oscillations à une fréquence beta-haute conduisaient à des
améliorations de la perception visuelle consciente.
Dans l’intention de mieux comprendre ce résultat, nous avons combiné la stimulation
cérébrale non invasive et les enregistrements EEG avec pour objectif de caractériser quels motifs
d’activité cérébrale, entrainés avec des courtes rafales de stimulation cérébrale non spécifiques en
fréquence, permettent une facilitation de la perception visuelle consciente. Nous avons aussi voulu
dévoiler les stratégies de codage du cortex frontal gauche permettant un engagement des fonctions
d’orientation de l’attention et de modulation de la perception visuelle consciente. A cette fin, nous
avons enregistré les signaux cérébraux d’une cohorte de sujet sains effectuant une tâche de
détection visuelle consciente simultanément à la stimulation de leur champ oculomoteur frontal
gauche avec trois types de rafales non spécifiques en fréquence (4 impulsions magnétiques,
réparties de façon irrégulières dans le temps), et une rafale de stimulation rythmiques (4
impulsions, à une fréquence de 30 Hz) utilisée pour la comparaison.
Notre intervention n’a pas permis de moduler significativement les performances de
détection visuelle consciente. Néanmoins, nous démontrons que les différentes rafales de
stimulation non spécifiques en fréquence amplifient les oscillations corticales dans une large
bande de fréquence et induisent des niveaux de bruits plus élevés dans l’activité corticale. Nous
concluons que la modulation du niveau de bruit neural par la stimulation non invasive offre une
stratégie prometteuse pour l’amélioration de l’activité neurale et offre un outil pour étudier et
mieux comprendre le rôle du bruit dans le traitement de signal dans le cortex, ainsi que
conceptualisé par le phénomène de la Résonnance Stochastique.

174
Exploring unexpected contributions of left frontal neural noise to the modulation of
conscious visual perception in the human brain: A combined TMS-EEG study
Chloé Stengel1*†, Julià L. Amengual1,2, Tristan Moreau1 & Antoni Valero-Cabré 1,3,4†
1 Cerebral Dynamics, Plasticity and Rehabilitation Group, Institut du Cerveau et de la Moelle
Epinière, CNRS UMR 7225, Paris, France
2 Institut des Sciences Cognitives Marc Jeannerod, Département de Neuroscience
Cognitive, CNRS UMR 5229, Université Claude Bernard Lyon I, 67 Boulevard Pinel, 69675
Bron Cedex, France.
3 Dept. Anatomy and Neurobiology, Laboratory of Cerebral Dynamics, Boston University
School of Medicine, Boston, USA
4 Cognitive Neuroscience and Information Tech. Research Program, Open University of
Catalonia (UOC), Barcelona, SPAIN
† Corresponding authors: Chloé Stengel & Antoni Valero-Cabré, MD PhD, Groupe de
Dynamiques Cérébrales, Plasticité et Rééducation, Équipe Frontlab, Institut du Cerveau et de la
Moelle Epinière (ICM), Pitié-Salpêtrière, 47 boulevard de l’Hôpital, 75013 Paris, France.
Email: [email protected]; [email protected] /
Keywords: visual perception, TMS, neural noise, stochastic resonance, interhemispheric differences

175
Abstract
Prior evidence in non-human and human primates has pinpointed a crucial role for high-
beta oscillations, operating throughout the right lateralized fronto-parietal dorsal network,
subserving endogenous attentional orienting and the modulation of conscious visual perception.
However, a parallel study using transcranial magnetic stimulation (TMS) to address the
contribution of homotopic regions within the left hemisphere paradoxically reported that in such
location (the left Frontal Eye Field, FEF) either non frequency-specific or arrhythmic patterns of
activity, generated with focal noninvasive brain stimulation, but not high-beta rhythms, were able
to drive improvements of conscious visual perception.
In an attempt to further understand this finding, we aimed to combine focal non-invasive
stimulation with coupled EEG recordings and characterize which patterns of neural activity
entrained with episodic non frequency-specific brain stimulation enabled a facilitation of
conscious visual perception. We also aimed to uncover left frontal coding strategies allowing the
engagement of attentional orientating and the modulation of conscious visual perception. To this
end, we recorded brain signals from a cohort of healthy participants performing a conscious visual
detection task, while having their left FEF activity manipulated with three non frequency-specific
TMS bursts (4 pulses, irregularly spaced in time), whereas a perfectly rhythmic pattern (4 pulses
at 30 Hz) was also employed to compare.
Our interventions failed to significantly modulate conscious visual detection. Nontheless,
we here show that different non frequency-specific activity patterns enhanced cortical oscillations
in a wide frequency range by inducing higher levels of noise in local cortical signals. We conclude
that the modulation of neural noise levels by noninvasive stimulation can be a promising strategy
to enhance neural activity and further understand the role of noise in cortical processing, within
the framework of the Stochatic Resonance phenomenon.

176
Introduction
A rich and influential literature spanning nearly two decades has highlighted the role of
frequency-specific oscillations in the coding of cognitive processes and the execution of
behaviors. In the domain of attention, correlational studies in animal models (Buschman & Miller,
2007; Saalmann et al., 2007) and healthy humans (Gross et al., 2004; Hipp et al., 2011; Phillips
& Takeda, 2009; Rodriguez et al., 1999) have associated high-beta oscillations in a fronto-parietal
network with the allocation of attention in space and the modulation of visual perception.
Completing these findings, non-invasive brain studies in humans have shown that the use of
rhythmic TMS bursts to entrain high-beta oscillations in the right Frontal Eye Field (FEF), a right
frontal node of the dorsal attentional network (Corbetta & Shulman, 2002), enhanced visual
perception (Chanes et al., 2013; Quentin et al., 2015; Vernet et al., 2019). Taken together, these
studies provided synergistic evidence supporting a causal role for high-beta oscillations, operating
within the right dorsal attention network, in the modulation of conscious visual perception.
However, direct and indirect data have also suggested different coding strategies for the
contributions of the left hemisphere homotopic sites to these same cognitive functions. For
example, in post stroke visuo-spatial neglect patients, the emergence of a beta rhythm has proved
detrimental for the detection of left visual targets as omissions of left visual targets over left
frontal regions have been associated with increases of local beta oscillations (Rastelli et al., 2013).
Analogously, desynchronization of beta rhythms in the left frontal cortex of healthy subjects
during a pre-stimulus period of attention orientation (Gómez et al., 2006) has been correlated with
better somatosensory target detection (Schubert et al., 2009). The latter evidence contradicts the
hypothesis of a beneficial role for beta band synchronization throughout a bilaterally distributed
fronto-parietal network for endogenous attention orienting, suggesting instead asymmetric coding
strategies contributing to the orientation of spatial attention for the left and right hemispheres,
with high-beta oscillations being causally related to attention orienting in the right but not the left
hemisphere.

177
The attentional orienting network is known to show strong inter-hemispheric functional
and structural asymmetries. Functionally, stronger activations in right hemisphere regions
compared to left hemispheric sites have been recorded during attention orientation (Corbetta &
Shulman, 2002; Shulman et al., 2010). Anatomically, the Superior Longitudinal Fasciculus (SLF),
a white-matter tract linking frontal and parietal regions operating the attentional orienting network
has shown a higher volume in the right than the left hemisphere, a feature that scaled significantly
with visual detection skills in the left hemifield (Thiebaut de Schotten et al., 2011).
In a first attempt to explore the coding strategies subtending the modulation of conscious
visual perception in left frontal sites, compared to those previously described for the right
hemisphere, Chanes et al. (2015) stimulated the left FEF with either 30 Hz frequency-specific
rhythmic patterns of TMS (aiming to entrain a high-beta oscillation in the stimulated cortex),
compared to non frequency-specific or arrhythmic patterns of TMS (which were designed to
prevent the entrainment of pure high-beta frequency-specific oscillations). Unexpectedly, result
showed that visual perception was enhanced by non frequency-specific TMS patterns, whereas
improvements of visual perception in the homologous region in the right hemisphere were driven
by 30 Hz rhythmic patterns (Chanes et al., 2013; Vernet et al., 2019). This finding strongly
suggested that the left and right FEF do not necessarily use the same coding strategy to facilitate
visual detection by enabling attention orienting systems and mechanisms.
Chanes and colleagues put forward the hypothesis that at difference with right frontal
rhythmic TMS bursts, which progressively synchronized local neurons at a single frequency, non
frequency-specific TMS bursts could enhance perception by adding noise to the targeted left
frontal cortex. Additionally, they discussed the possibility that varying inter-pulse intervals and
TMS pulses not time-locked (i.e. not in phase) with any single rhythms at any frequency could
prevent the build-up of oscillations at frequencies relevant for perception. Finally, the authors also
entertained the possibility that non frequency-specific TMS patterns might have boosted cortical
oscillations in single or several frequency bands, other than the high-beta rhythm entrained by 30

178
Hz rhythmic TMS. Nonetheless, the lack of concurrent EEG recordings precluded at the time a
more accurate interpretation of such unexpected results and the verification of such predictions.
In this context, we here used coupled TMS-EEG recordings and aimed to further clarify
how episodic patterns of arrhythmic or non frequency-specific TMS proved able to modulate
patterns of neuronal activity while gauging its ability to influence conscious visual perception.
To this end, we recorded EEG signals during the delivery of short bursts of 30 Hz rhythmic or
non frequency-specific TMS on the left FEF while participants performed a conscious visual
detection task with near-threshold stimuli. We hypothesized that non frequency-specific TMS
patterns would increase the power of cortical oscillations in a broader frequency range than a
rhythmic TMS pattern designed to specifically entrain 30 Hz oscillations. We also hypothesized
that the increase of cortical oscillations over a broader range of frequencies would manifest as a
higher level of noise in EEG cortical signals recorded during non frequency-specific stimulation
compared to rhythmic stimulation. Lastly, we searched conceptual support in the phenomenon of
Stochastic Resonance according to which the addition of optimal levels of stochastic noise to sub-
threshold stimuli can boost its saliency, hence facilitate its detectability (Moss et al., 2004). On
the latter basis, we hypothesized that an intermediate level of noise induced by non frequency-
specific TMS patterns but not rhythmic patterns would improve visual perception in healthy
subjects.

179
Materials and Methods
Participants
A group of 15 right-handed participants (9 women, and 6 males) aged between 21 and 45
years old (30 ± 7) took part in the sessions of the current study. Participants reported no history
of neurological disorders and had normal or corrected-to-normal vision. All of them voluntarily
consented to participate in the study and signed a consent form. The research protocol including
all the interventions of this study was sponsored by the INSERM (Institut National de la Santé et
la Recherche Médicale) and approved by an Institutional Review Board, the Comité de Protection
des Personnes (CPP), Ile de France V.
Visual Detection Task
Similar tasks have been employed in prior publications by our research group (see Chanes
et al., 2013, 2015; Quentin et al., 2015; Vernet et al., 2019). The presentation of visual stimuli
was controlled by an in-house MATLAB R2012b (Mathworks) script using the Psychtoolbox
extensions (Brainard, 1997) and synchronized with the delivery of the TMS pulses (see Fig 1A
for a schematic representation of the sequence of events during a trial). Participants were seated
with their eyes positioned 57 cm away from the center of a computer screen. Trials started with a
fixation screen that displayed a central fixation cross (size 0.5x0.5o) and a right and left
rectangular placeholders (6.0 x5.5o, drawn 8.5° away from the center of the screen) indicating the
potential location of a visual target later in the trial. The fixation screen was presented for an
interval randomly jittered between 1000 and 1500 ms, to avoid predictability with regards to
upcoming events and ensure sustained central fixation. Then the fixation cross became slightly
larger (size 0.7x0.7°) during 66 ms to alert participants that the target would soon appear on the
screen. After an inter-stimulus-interval of 233 ms, in 80% of the trials a low-contrast Gabor
stimulus (0.5o/cycle sinusoidal spatial frequency, 0.6o exponential standard deviation) with
vertical lines appeared for 33 ms in the center of the left or the right placeholder with equal

180
probability. The remaining 20% of the trials were catch trials in which no target was displayed on
the screen. Prior to the beginning of the experimental session, Gabor contrast was adjusted for
each participant to reach 50% detection rate during a calibration block.
Figure 1. Visual detection task, targeted cortical regions and TMS patterns. (A) Visual detection task
performed by participants. After a period of fixation, a central cross became slightly larger to alert
participants of an upcoming event; then active or sham patterns of rhythmic or non frequency-specific
TMS were delivered to the left FEF prior to the presentation of a target, a near threshold 50% visibility
Gabor, that could appear for a brief period of time at the center of a right or left placeholder. Participants
were requested to indicate whether they did perceive a target or not (no/yes), and, if they saw it, where it
appeared (right/left). Notice that in 20% of the trials, no target was presented in any of the placeholders.
(B) Coronal, axial and sagittal MRI sections from the frameless stereotaxic neuronavigation system
showing the localization of the targeted left FEF (Talairach coordinates X=-32, Y=-2, Z=46) in a T1-3D
MRI of a representative participant. (C) Schematic representation of the TMS patterns employed in active
and sham stimulation. 30 Hz rhythmic pattern (designed to entrain oscillatory activity at the input
frequency) in the left FEF and the 3 non frequency-specific TMS patterns (designed to induce different
levels of cortical local noise in the left FEF).

181
Participants were presented with a response screen 1000 ms after the Gabor target offset.
They were asked to perform a detection task in which they had to report whether they saw a target
and if ‘yes’ where had the target appeared (left/right of the fixation cross). The response screen
consisted in two arrow-like signs (“>>>” and “<<<”) displayed above and below the central
fixation cross. Participants were asked to indicate which arrow pointed towards the placeholder
(right or left) where they consciously detected the target. The location of the arrows (above or
below the fixation cross) was randomized across trials to prevent participants from preparing their
motor response prior to the onset of the response window. This precaution was taken to be able
to separate in different time epochs motor decisions from visual processing activities occurring in
frontal and central sensors associated to the right and left Frontal Eye Fields (FEF), two regions
located very close to the motor areas. Participants responded with the index/middle left hand
finger by pressing the ‘d’ letter key to indicate the upper arrow or ‘c’ letter key to indicate the
lower arrow. They were requested to press the space bar with their left thumb to indicate they had
not seen any target. The response of the participant ended the trial.
The contrast of the visual target was adjusted to reach the individual threshold contrast
where each participant showed consistent 50% detection performance following a one-up/one-
down staircase procedure. Gabor contrast was initially set at a contrast level of 1 Michelson
contrast. At the end of each trial, target contrast was increased or lowered according to the
response of the participant. The initial contrast step was equal to the initial contrast level and upon
each reversal in response it was divided by two. Note that, regardless, the contrast of the target
throughout the titration procedure was always kept between 1 and 0.005 Michelson contrast. A
consistent estimation of the 50% conscious detection threshold contrast was reached when in five
consecutive trials target contrast varied less than 0.01 Michelson contrast units. The threshold was
measured twice using this exact same procedure. If the two threshold contrasts differed by less
than 0.01 Michelson contrast unit, the calibration block was terminated and the contrast used for
the rest of the experimental session was the average between the two thresholds. If they differed

182
by more than 0.01 Michelson contrast unit, then threshold was determined again until repeated
titrations yielded two consecutive contrasts that varied by less than 0.01 Michelson contrast unit.
During the calibration block, the participant received only sham TMS (see below for details on
the TMS procedure).
Participants performed two experimental sessions, each made of 6 blocks and performed
in this order: 1 calibration block to adjust the contrast of the visual target, 1 training block to
introduce subjects to active TMS trials and ensure stable performance and 4 experimental blocks
(1 block for each TMS pattern, see below for details on the patterns tested). The two experimental
sessions were performed on two separate days, with an interval of a at least 48-72 hours and a
maximum of 7 days between sessions to avoid carry over effects. The experimental procedure
was identical during both sessions.
The order of experimental blocks for the two experimental sessions was counterbalanced
across participants. Each block was divided into short sub-blocks of 20 trials. The order of trials
(leftward target, rightward target, or catch trial with no target) and the stimulation condition (sham
and active TMS) was randomized for each sub-block. During the training block, at the end of each
sub-block participants received some feedback. They were alerted if their false alarm rate was
higher than 50% and the percentage of incorrectly reported target positions and trials with
incorrect fixations was displayed on the computer screen. At the end of each sub-block
participants took a short break (~1-2 minutes) to limit the effects of fatigue. Between sub-blocks,
the experimenter could decide to manually adjust the contrast if the conscious visual detection
performance was away from the 50% detection rate established during Gabor contrast titration.
The duration of the calibration and training blocks was variable, as the termination of these
two blocks was decided by the experimenter on the basis of individual performance. Experimental
blocks consisted of 7 sub-blocks (140 trials total) and lasted approximately 20 minutes each.
Experimental blocks were identical to training blocks (with the same feedback for the participant)

183
except that Gabor contrast was kept constant across all sub-blocks and participant were allowed
to take a short break (~5-10 minutes) only every two sub-blocks.
Eye movements recording
Throughout the experimental session, the position of both eyes was monitored with a
remote eye tracking system (Eyelink 1000, SR Research). In order to ensure fixation during the
performance of the visual detection task, if at any point between the onset of the alerting cue and
the target offset the position the participant’s eyes were recorded more than 2° away from the
center of the fixation cross, the trial was labeled as non-fixated and excluded from further analysis.
In such cases, at the end of the trial, participants were alerted that they had violated fixation
requirements and the non-fixated trial was randomized again with the remaining trials in the sub-
block.
TMS procedure
TMS was triggered via a high temporal resolution multichannel synchronization device
(Master 8, A.M.P.I.). Stimulation was delivered with a biphasic repetitive stimulator (SuperRapid,
Magstim) and a standard 70 mm diameter figure-of-eight TMS coil, held tangentially to the skull.
The position of the coil was tracked throughout the experiment with a neuronavigation system
(Brainsight, Rogue Research) and the left Frontal Eye Field (FEF) was localized on individual
T1-weighted MRI scans (3T Siemens MPRAGE, flip angle=9, TR=2300 ms, TE=4.18 ms, slice
thickness=1mm) as a spherical region of interest of 5 mm radius centered on the Talairach
coordinates x=-32, y=-2, z=46 (Paus, 1996) (Fig 1B). The coil was angled tangentially to the skull
and held in a position ensuring the shortest possible distance between the center of the stimulation
coil and the cortical region of interest. The coil handle was oriented ~parallel to the central sulcus,
at a ~45° angle in a rostral to caudal, lateral to medial direction. The neuronavigation system

184
allowed to keep the TMS coil within a ± 3 mm radius from the center of the targeted site
throughout the experiment.
Sham stimulation was delivered through an audio speaker (Mobi wavemaster) attached to
the TMS coil. To simulate a TMS pulse, the speaker played a recording of the clicking noise
characteristic of the delivery of active TMS. The precise timing of the onset of the sham audio
pulses was handled by the in-house MATLAB script using the Psychtoolbox extensions
(Brainard, 1997) which also controlled the presentation of the visual detection task. The audio file
of a TMS pulse was generated by recording the sound of 100 single TMS pulses (Aiwa CM-S32
stereo microphone) and averaging their individual waveforms. The envelope of the average
waveform was then adjusted to emphasize the high amplitude spikes at the beginning of the pulse
so that, once replayed through our speaker, the clicking sound became indistinguishable from the
loud click produced by the TMS coil. The volume of the speaker was also adjusted to reproduce
the volume of the active TMS pulse.
We delivered four different TMS patterns (Fig 1C), all comprised of a burst of 4 TMS
pulses lasting 100 ms (between the onset of the first pulse and the onset of the last pulse): a
rhythmic pattern with pulses regularly spaced in time at a frequency of 30 Hz, i.e. with a fixed
interpulse interval of 33 ms, designed to entrain high-beta cortical oscillations and 3 additional
non frequency-specific patterns (non-uniform rhythmic, random and irregular patterns) tailored to
induce different levels of neuronal noise in the stimulated cortex. In the non frequency-specific
TMS patterns, the timing of the first and last pulse of the burst were kept identical to those of the
rhythmic pattern, whereas the timings of the two middle pulses were modified to create unequal
inter-pulse intervals. In the non-uniform rhythmic pattern, the two middle pulses where anticipated
and delayed, respectively, by 9 ms. In the random pattern, the timings of the second and third
pulse were pseudo-randomly jittered below and above their timings in the rhythmic pattern. This
randomization was constrained by two rules. First, to leave enough time for the capacitors of the
TMS equipment to recharge between pulses, the inter-pulse interval had to be at least 20 ms long.

185
Second, to ensure that the random pattern would never reproduce a regular 30 Hz frequency, the
two middle pulses had to be shifted at least 3 ms away from their onset time in the rhythmic
pattern. Lastly, in the irregular pattern the onset time of the two middle pulses were delivered
randomly within the 100 ms window of the burst, with the same constrains posed for the random
pattern but an additional constraint, which was that the 3 inter-pulse intervals in the burst must all
have different length, and the timings of the pulses were fixed in all trials. The rhythmic, non-
uniform rhythmic and random patterns described above had been used previously in other studies
by our team (Chanes et al. 2013, 2015; Quentin et al. 2015; Vernet et al. 2019). For all patterns,
the last TMS pulse was delivered 33 ms before the onset of the visual target.
TMS stimulation was fixed for all participants at the level of 55% maximal simulator
output (MSO) hence not adjusted to individual resting motor threshold (RMT). Motor cortex
excitability has been proven to be a poor predictor of excitability of other cortical areas (Kähkönen
et al. 2005; Stewart et al. 2001) and a previous study by our group targeting the right FEF has
demonstrated behavioral effects at the group level with a fixed intensity of 55% MSO (taking into
account the additional coil-to-cortex distance added by the presence of EEG electrodes) (Vernet
et al., 2019). However, to allow across-study comparisons, at the end of the experiment, the
individual resting motor threshold (RMT) in the left hemisphere was determined visually on the
abductor pollicis brevis (APB) muscle of each participants as the TMS intensity yielding a thumb
twitch in about 50% of the attempts (Rossini et al., 2015). On average, the RMT of our cohort of
participants reached 66±9% of maximum stimulator output. Hence our fixed TMS intensity
translated in a stimulation intensity of 83±12% of individual motor thresholds.
EEG recordings
EEG signals were recorded concurrently with TMS from 60 scalp electrodes with a TMS-
compatible system (BrainAmp DC and BrainVision Recording Software, BrainProducts GmbH).
Electrodes were spread on the scalp according to the international 10-20 system. The reference

186
was placed on the tip of the nose and the ground on the left earlobe. EOG signals were recorded
from 4 additional electrodes positioned on the left and right temples and above and below the left
eye. At all times, impedances were kept below 5 kOhms and EEG signal was digitized at a
sampling rate of 5000 Hz.
EEG artifact removal procedure
EEG signals were analyzed with the FieldTrip toolbox (Oostenveld et al., 2011) running
on MATLAB R2017b. The EEG and EOG data were first epoched in a [-2 2] seconds window
centered on the Gabor target onset. Trials in which correct fixation, monitored by an eye tracking
system, was violated were automatically excluded. Additionally, the timings of the TTL triggers
operating TMS delivery were automatically checked for each trial and those rare events for which
the precise onset time was not respected were automatically excluded. Trials containing blinks
and muscle artifacts were also excluded following visual inspection of all trials. After exclusions,
an average of 121±14 trials remained for each TMS experimental blocks.
The brief electromagnetic field generated by TMS pulses produces a high amplitude
artifact on the EEG signals that had to be removed. To this end, data across a [-4, +12] ms window
centered on the onset of each TMS pulse was removed and the blank EEG epochs were then
interpolated with a shape-preserving piecewise cubic interpolation. The exact same artifact
removal and interpolation procedure was applied to sham trials. Once artifacts had been removed,
we down-sampled EEG signals to 500 Hz. All trials from each experimental conditions
(active/sham trials and trials with the 4 TMS patterns) within each experimental session were
gathered into two datasets. Two separate Independent Component Analyses (ICAs) were
performed on the data corresponding to each experimental session. Gathering trials across all
experimental conditions to undergo the same ICA ensured that the ICA did not introduce
differences between the experimental conditions. The artifact components were identified based
on the guidelines by Rogash et al. (2014). This procedure enabled us to remove residual TMS

187
artifacts lasting longer than 12 ms which were not removed by data interpolation. We also
removed components corresponding to eye movements, electrode malfunctions and 50 Hz power
line artifact. We removed on average 9±3 out of 60 components for each dataset.
Once the signal was calculated back to the electrode level, the cleaned EEG datasets were
separated into the 8 TMS experimental conditions: active/sham rhythmic TMS, active/sham non-
uniform rhythmic TMS, active/sham random TMS and active/sham irregular TMS and datasets
evaluating to the same TMS experimental condition from the two experimental sessions were
combined.
EEG data analysis
EEG signals were transformed into the time-frequency domain with a 3-cycle Morlet
wavelet analysis on a [-500 +500] ms window (centered on target onset) and for frequencies
between 6 and 50 Hz. In the time-frequency domain, we calculated measures of power and Inter-
Trial Coherence (ITC). ITC measures oscillatory phase alignment across trials by averaging signal
phase at each time-frequency point over all trials. Power was expressed in decibels relative to a
baseline period of 2 oscillation cycles prior to the alert cue onset (i.e., the central cross becoming
larger, preceding Gabor visual target onset by 233 ms).
First, we concentrated our analysis on a frequency ([25 35] Hz) and time ([-133 0], 0 being
the target onset) window of interest and looked at the topographies of power and ITC across all
electrodes of our montage. The frequency window of interest reflected the 30 Hz frequency of our
rhythmic TMS pattern and the time window of interest corresponded to the time window during
which our 4 types of active or sham TMS bursts were delivered. Second, we focused our analysis
on a group of electrodes of interest (electrodes F1, F3, FC1, FC3 in the international 10-20 system)
and analyzed modulations of power and ITC over the whole time-frequency space. These
electrodes were selected as they were the closes to the center of the TMS coil targeting the left
FEF with the shortest straight transcranial path.

188
We defined the degree of “noise” of a signal as its level of randomness or irregularity,
hence its unpredictability. According to this definition, a pure sine oscillation is a completely
regular and predictable signal, hence has a noise level of 0. A signal that contains several
frequencies and has a very broad-band power spectrum is more irregular, thus more noisy than
the former. Finally, at the extreme, white noise which is completely random has a flat power
spectrum.
Therefore, to quantify noise in our EEG signal we first quantified the width of the
frequency band of oscillations enhanced during stimulation. We averaged the power spectrum
over frequencies [6 45] Hz across the time window of stimulation ([-133 0] ms, between the first
TMS pulse and the visual target onset) and we detected local maxima in the averaged power
spectrum. The width of each local maximum, or peak, in the signal was calculated at half
prominence. The prominence or height, of the peak was determined relative to the smallest local
minimum located between this peak and the next peak higher than the current peak. Because of
the low signal-to-noise ratio of scalp EEG signals, reliable peaks could not be identified on
individual datasets (Kiesel et al., 2008; Ulrich & Miller, 2001). We hence calculated the averaged
power spectrum during stimulation on the grand average across all participants.
Finally, to estimate the variance in the measure of peak width over our subject group we
applied the jackknife procedure. For a sample of N subjects, this method computes, for each
subject i (i=1… N), the grand average signal over a subsample of (N-1) subjects by omitting
subject i in the dataset. The peaks in the power spectrum and their width are estimated for each of
the N subsampled grand averages. As they are estimated from grand averages over a pool of
subject which varies only by one individual, measures estimated with this method have a very low
error variance and therefore their standard error has to be corrected according to the following
formula:

189
�. �. = √� − 1× ���
Where s.e. is the corrected standard error and std corresponds to the standard deviation of the
jackknife subsampled measures. To test for significance, t- and F-statistics must also be corrected
for the reduced error variance in the following way (Ulrich & Miller, 2001):
�GHII = � (� − 1):⁄
�GHII = � (� − 1)⁄
Lastly, in the time-domain, we computed the measure of Multi-Scale Entropy (MSE)
(Costa et al., 2002, 2005). MSE evaluates the complexity of a signal. A measure of complexity
differs from a measure of noise or entropy in that neither a completely regular signal (with an
entropy of 0) nor a completely random signal (with a maximal entropy) exhibit a lot of complexity.
Indeed, both types of signals contain very poor information because they are governed by very
simple laws, for example a sine wave at a single frequency for a completely predictable signal or
a random draw from a uniform distribution for random noise signal. A complex signal is more
meaningful biologically than a completely random signal (Costa et al., 2005).
MSE is based on the calculation of Sample Entropy (SE) at several time scales. Sample
Entropy identifies repeating patterns within a time series or signal. Two time points are considered
similar if they are within a distance of r of each other and thus for any pattern of m consecutive
time points u1, u2 … um in the signal, another sequence v1, v2 … vm is considered a repetition of
the first pattern if ½v1 – u1½ ≤ r , ½v2 – u2½ ≤ r …½vm – um½ ≤ r respectively. In other words, a
sequence of consecutive time points is considered a repetition of a pattern if each time-point in
the sequence is within a distance of r from the corresponding time point in the pattern. The search
for repeating patterns in the signal is done for each sequence of m consecutive time points in the
data (excluding self-matches) and yields the probability Um(r) that two sequences of m time points

190
are within a distance r of each other. The same calculation can be done for patterns of m+1 time
points. Sample Entropy (SE) is then defined as:
��(�, �) = − ln�ST((�)�S(�)
This measure represents the conditional probability that, knowing that a pattern is repeated
for m consecutive time points, it will also be repeated for m+1 time points. Essentially, SE
evaluates the probability that the m+1 time point can be predicted when following a known pattern
of m time points. The lower this probability is, the less predictable signals are and the higher
entropy they have.
SE is calculated for each time series or signals (in our case EEG traces) at several time
scales. The signal at time scale t is the original signal averaged inside non-overlapping time
windows of length t. The complexity of the signal, as evaluated by MSE, is represented in the
evolution of the SE across time scales. Indeed, a very predictable signal will have low SE values
at all scales. A signal such as white noise that is very unpredictable will have very high SE at low
time scales. However, when long stretches of data are averaged for higher time scales, the random
signal that is white noise will average to a constant signal at 0 and will exhibit very low values of
SE at high time scales. A complex time serie that exhibits information-wise a very rich signal will
show high SE values at all time scales. Therefore, a signal that exhibits higher SE values at a
majority of time scales compared to another signal can be considered relatively more complex
(Costa et al., 2005).
To reduce the dimensionality of the MSE value and compare signal complexity over the
whole electrode array between our TMS experimental conditions, we calculated the area under
the curve for SE along time scales. We took the assumption that higher area under the SE curve
for one signal compared to another reflects higher SE at a majority of time scales, therefore higher
degree of complexity. We call this measure of area under the SE curve the MSE measure.

191
We calculated MSE on the time window of stimulation [-133 0] ms (between the first TMS
pulse and the target onset) for each electrode. Considering the values of SE at each time scale are
more reliable for longer signals, to have the most datapoints possible we computed MSE on data
at a 5000 Hz sampling rate. We set the parameters for SE at m=2 and r as 15% of the signal’s
standard deviation (Costa et al., 2005). We calculated SE over 14 time scales. However we
observed that our data segment was too short to yield reliable valued of SE at higher scales (non-
finite values of SE) thus all analyses presented in this study were carried out over 9 scales.
Many other measures of entropy are available for physiological signals however MSE is
a measure adapted to relatively short signals, therefore an ideal measure for our concurrent TMS-
EEG datasets in which we assessed the impact on EEG activity of magnetic stimulation applied
in short bursts (Costa et al., 2005; Pincus, 1991).
EEG statistical analyses
For both topographical and time-frequency maps of power, ITC and MSE, we performed
comparisons between active and sham trials for each TMS patterns as well as direct two-by-two
comparisons between active trials for the 4 TMS patterns. Each pair were compared with two-
tailed paired Student’s t-test. Comparisons between topographical maps were performed for each
electrode and comparisons between time-frequency maps were performed for each time-
frequency point in the frequency window [6 45] Hz and time window [-300 200] ms. We corrected
for multiple comparisons with cluster-based permutation tests. Clusters were formed by
neighboring electrodes or time-frequency points that exceeded the significance threshold (alpha
= 0.01) in the paired t-tests and assigned as a statistic the sum of T-statistics of each point in the
cluster.
A non-parametric permutation test (10000 permutations, Montecarlo sampling method)
was applied on the cluster statistics. The statistical results displayed in figures 2, 3 and 5 show
clusters that exceeded the significance threshold (alpha = 0.05) of the permutation test. Any effect

192
seen on any EEG signal is likely to last over several time points and spread over adjacent
electrodes, hence cluster-based permutations is a highly sensitive method to correct for multiple
comparisons in this data because it is adapted to high degree of correlation in time and space
(Maris & Oostenveld, 2007). However, there is currently no consensus on how to apply cluster-
based permutations to interaction effects for ANOVA analyses (Edgington & Onghena, 2007;
Suckling & Bullmore, 2004) and therefore we chose to carry out pairwise comparisons between
our TMS experimental conditions.
We compared the width of peak of power increase between active TMS experimental
patterns by means of a one-way repeated measure ANOVA with factor TMS pattern (rhythmic,
random and irregular). The non-uniform rhythmic pattern was excluded from this analysis because
it was the only pattern that exhibited two peaks in its power spectrum during stimulation and
therefore could not be compared in terms of the noise level of EEG signals with the 3 other
patterns which exhibited a single peak in their power spectrum during stimulation.
Behavioral data analysis
Behavioral performance in the conscious visual detection task with near-threshold Gabor
stimuli was assessed following the approach of Signal Detection Theory (SDT) (Green & Swets,
1966; Stanislaw & Todorov, 1999). SDT separates perception of the target and late-stage decision-
making processes when delivering a response and provides two sets of outcome measures:
perceptual sensitivity (d’) which is a bias free measure of a participant’s ability to distinguish the
presence of a target from noise, and decision criterion (c) and likelihood ratio (b) which are both
measures of the response bias of the participants. Indeed, participants might be biased in case of
doubt to respond more likely that they saw a target (liberal participants) or on the contrary to
respond more likely they did not see a target (conservative participants) independently of how
well they perceived the target.

193
These outcome measures are calculated from the proportions of different types of
responses. For trials in which a target was presented, if the presence and the location of target
were correctly reported the trial was counted as a ‘hit’, whereas if the target was reported as ‘not
seen’ the trial was counted as a ‘miss’. For catch trials which displayed no target, the trial was
counted as a ‘false alarm’ if the presence of a target was reported, or as a ‘correct rejection’ if the
target was reported not to be present. Very rarely, participants correctly reported the presence of
a target but signaled the wrong location for it. These trials were counted as ‘errors’ and excluded
from the analysis as it was impossible to determine if participants had seen a target in a location
where no target was presented (akin to a ‘false alarm’ trial) or simply pressed the wrong button to
report the location of the target. From the rate of ‘hit’ trials (H) and the rate of ‘false alarm’ trials
(FA), perceptual sensitivity, decision criterion and likelihood ratio were calculated as follows:
�# =�'((�) −�'((��) � = − 12 2�'((�) +�'((��)4
� = exp 9�'((�): −�'((��):2 ;
Where �'( is the inverse of the normal cumulative distribution function. To avoid infinite values,
a null rate of false alarms was corrected to (:? and a rate of hit trials of 1 was corrected to 1 − (
:?
where N is the total number of trials on which each rate is calculated, following established
procedure (Macmillan & Creelman, 2004).
Behavioral data statistical analysis
We performed 2x2x4 repeated measure ANOVAs with factors Visual Field (left, right),
TMS Condition (active, sham) and TMS Pattern (rhythmic, non-uniform rhythmic, random,
irregular) on values of d’, c and b. Post-hoc, in order to replicate exactly the analyses performed

194
in an earlier study, which tested a subset of the stimulation patterns delivered here (Chanes et al.,
2015), we performed two other repeated-measure ANOVAs on measures of d’. First, a 2x2x2
ANOVA with within-subjects factors Visual Field (left, right), TMS Condition (active sham) and
TMS Pattern (rhythmic, non-uniform rhythmic). Second, a 2x2 ANOVA on measures of d’ during
stimulation with random TMS with within subject factors Visual Field (left, right) and TMS
Condition (active sham).

195
Results
Impact of non frequency-specific patterns of TMS on high-beta oscillations
We first tested the effect of rhythmic and non frequency-specific TMS patterns on high-
beta oscillations, which we attempted to entrain in the left FEF with our 30 Hz rhythmic TMS
pattern. We examined modulations of high-beta ([25 35] Hz) power for all electrodes during
stimulation (time window [-133 0] ms centered on target onset). We show that compared to sham
TMS, active TMS significantly increased high-beta power over the whole scalp grid not only
during rhythmic bursts but also during non frequency-specific patterns (Fig 2A). Indeed, non-
uniform rhythmic, random and irregular TMS patterns, even though they do not contain a specific
30 Hz rhythm, also showed significant increase in high-beta power when comparing active and
sham trials. Direct two-by-two comparisons of active trials did not show significant differences
in the power for high-beta oscillations during stimulation between rhythmic, non-uniform
rhythmic, random or irregular active TMS patterns (data not presented in a figure).
We then analyzed the degree of phase-locking for high-beta activity during stimulation
patterns, through the calculation of the inter-trial coherence (ITC), a measure of local phase
alignment across trials. Likewise, the comparison between active and sham TMS revealed a
significant increase of high-beta phase-locking across the whole scalp for both rhythmic and all
non frequency-specific patterns (Fig 2B). However, active random stimulation increased high-
beta phase-locking less than the other TMS patterns. Indeed, a direct two-by-two comparisons
between active random TMS bursts and active rhythmic, non-uniform rhythmic and irregular
TMS bursts revealed significant differences in high-beta phase-locking (Fig 2C). We also noted
that two electrodes displayed significantly higher levels of high-beta phase-locking for the active
irregular patterns compared to active rhythmic stimulation patterns (Fig 2C).

196

197
Figure 2. Impact of rhythmic and non frequency-specific TMS patterns on local high-beta
oscillations. Topographical maps representing data in the [25 35] Hz frequency band during sham
stimulation (time window [-133 0] ms centered on visual target onset). Comparisons of high-beta
(A) power and (B) ITC between active (first row) and sham (second row) TMS for each TMS
pattern (30 Hz rhythmic TMS, and 3 non frequency-specific patterns: non-uniform rhythmic TMS,
random TMS and irregular TMS). Bottom row shows the results of the pairwise (active vs. sham
TMS) cluster-based statistical permutation tests. Bolded electrodes represent clusters of electrodes
that reached statistical significance (p<0.05). (C) Direct two-by-two comparisons between active
TMS patterns. Colored maps represent distribution of ITC over the scalp for all four TMS patterns
(30 Hz rhythmic TMS, non-uniform rhythmic TMS, random TMS and irregular TMS). Uncolored
maps show the results of the cluster-based statistical permutation tests for the pairwise comparison
of active trials in the two ITC topographical maps represented at the top of the column and the left
of the row. Bolded EEG electrodes represent clusters of sensors that reached significance (p<0.05).
Both 30 Hz rhythmic TMS and the three non frequency-specific TMS patterns increased amplitude
and phase-alignment of high-beta oscillations over the whole scalp during active stimulation.
Direct pairwise comparisons of ITC between active TMS patterns show that random TMS
increased high-beta inter-trial phase-locking less than the three other active TMS patterns. A small
cluster encompassing 2 electrodes showed higher high-beta phase-locking during irregular TMS
than rhythmic TMS, the pattern designed ad hoc to entrain high-beta oscillations in the left FEF.

198
These results suggest that unexpectedly, non frequency-specific stimulation bursts,
designed not to entrain a specific high-beta rhythm, increased high-beta power as strongly as
rhythmic stimulation bursts, specifically designed to entrain high-beta cortical oscillations. Also
surprisingly, non frequency-specific TMS patterns, namely the non-uniform rhythmic and
irregular patterns, also increased high-beta phase-locking as strongly if not more (in the case of
irregular TMS bursts) than our pure 30 Hz rhythmic TMS pattern.
Frequency-specific modulations of cortical oscillations by rhythmic and non frequency-
specific TMS patterns
To test the hypothesis that non frequency-specific TMS patterns would increase
oscillations in a wider frequency band than the frequency-specific rhythmic 30 Hz patterns, we
examined modulations of power and ITC for a group of electrodes of interest (electrodes F1, F3,
FC1 and FC3) located the nearest to the left FEF, over a broader frequency ([6 45] Hz) and time
window ([-500 500] ms centered on Gabor target onset) (Fig 3).
Active-sham comparisons revealed that during the delivery of the bursts, rhythmic and
non frequency-specific patterns increased oscillation power (Fig 3A) and ITC (Fig 3B) in a wide
frequency band, not limited to 30 Hz. For ITC, direct two-by-two comparisons showed that,
compared to the active rhythmic TMS condition, active irregular TMS increased oscillations
phase-locking in a frequency band extending to the low-beta (12 to 20 Hz) band (Fig 3C).
Additionally, similarly to what was observed on the topographical maps of ITC (Fig 2C), direct
two-by-two comparisons of time-frequency maps also showed that active random TMS bursts
increased high-beta phase-locking less strongly than active rhythmic, non-uniform rhythmic or
irregular TMS patterns (Fig 3C).
To quantify the width of the frequency band showing increased power during stimulation,
we computed the average power spectrum including the whole stimulation time

199
window ([-133 0] ms, 0 ms corresponding to being the visual target onset). We identified local
maxima in the averaged power spectrum and extracted the width of these peaks. The signal-to-
noise ratio of EEG data was too low to identify reliable peaks in the power spectrum over the
window of stimulation for individual data (Kiesel et al., 2008; Ulrich & Miller, 2001).
Therefore, we used a jackknife procedure to estimate the standard error of the width of the
peaks identified on the grand-average power spectrum. Grand-average power spectrum over
the stimulation window and estimated power peaks and their widths are shown on the marginal
plots for active TMS time-frequency maps in figure 3A, first row. Notice that for active
rhythmic, random and irregular TMS, only one peak was identified in the power spectrum at a
high-beta frequency (peak at ~28 Hz, ~27 Hz and ~28 Hz respectively). For active non-uniform
rhythmic TMS, one peak was reliably identified at a high-beta frequency (peaks at ~31 Hz).
Additionally, 12 out of 15 iterations of the jackknife procedure identified a second peak in the
low-beta range (peak at ~15 Hz). The width of the band experiencing power increases for active
rhythmic, random and irregular TMS patterns was quantified as the estimated width for the
single peak in the high-beta range (Fig 4). Since for active non-uniform rhythmic TMS, two
peaks were identified in the power spectrum, we determined that this TMS experimental
condition could not be directly compared to the other three which showed increased power
oscillations in a single frequency band.
One-way ANOVA on peak-width values of power increase for active rhythmic, random
and irregular TMS showed a significant difference between TMS patterns (F(2,41)=3.309,
MSE=0.13, p<0.05, after correction for reduced error variance from the jackknife procedure).
Planned two-tailed paired Student’s t-test showed that the active irregular TMS increased
oscillation power in a significantly wider frequency band than active rhythmic TMS (T(14) =
2,68, p<0.01, corrected for reduced error variance by jackknife procedure) or random TMS
bursts (T(14) = 2,016, p<0.05, corrected for reduced error variance by jackknife procedure)
(Fig 4).

200

201
Figure 3. Frequency-specific modulation of cortical oscillations by rhythmic and non
frequency-specific TMS patterns. Time-frequency maps in a cluster of left frontal electrodes (F1,
F3, FC1, FC3) closest to the center of the stimulation coil. Time is centered on the onset of the
visual target (dotted gray vertical line). Red dotted vertical lines signal the first (-133 ms) and last
(-33 ms) TMS pulses in the burst. Black dotted horizontal line indicates frequency (30 Hz) of
rhythmic TMS pattern. Comparisons of high-beta (A) power and (B) ITC between active (first row)
and sham (second row) TMS for each TMS pattern (30 Hz rhythmic TMS, and three non frequency-
specific patterns: non-uniform rhythmic, random and irregular TMS). Bottom row shows the results
of the pairwise (active vs. sham TMS) cluster-based statistical permutation tests. Black dots
indicate clusters that reached statistical significance (p<0.05). Right marginal graphs in the first
row for power time-frequency maps (A) show the average power spectrum over the whole window
of TMS stimulation. Colored lines show the width of the peaks of oscillations power as detected
with the jackknife procedure. (C) Direct two-by-two comparisons across the 4 types of active TMS
patterns. Colored maps represent time-frequency maps of ITC for all TMS patterns (30 Hz rhythmic
TMS, non-uniform rhythmic TMS, random TMS and irregular TMS). Black and white maps show
the results of the cluster-based statistical permutation tests for the pairwise comparison of active
TMS trials in the two ITC maps represented at the top of the column and the left of the row. Black
dots indicate clusters that reached significance (p<0.05). Both 30 rhythmic TMS and the 3 non
frequency-specific TMS patterns increased amplitude and phase-alignment of cortical oscillations
over a wide frequency band during active compared to sham stimulation. However, direct pairwise
comparisons of ITC between the 4 active TMS patterns show that the irregular TMS pattern
achieved higher increases of oscillatory phase-locking in the high-beta band than the 30 Hz
rhythmic TMS pattern. Also note that the random TMS pattern phase-locked cortical oscillations
trial-to-trial significantly less than the 3 other active TMS patterns.

202
This analysis suggests that non frequency-specific TMS differs from rhythmic stimulation
with regards to the frequency band of oscillations they are able to modulate. Indeed, active
irregular stimulation increased power and phase-locking in a significantly wider frequency band
than active rhythmic stimulation. Moreover, when analyzing the peaks in the power spectrum
during active stimulation, non-uniform rhythmic TMS patterns increased oscillation power in two
distinct frequency bands (a low-beta and a high-beta band) whereas rhythmic stimulation or other
non frequency-specific TMS patterns increased oscillations in a single peak at the high-beta
frequency band.
We here hypothesize that the band width of rhythmic activity increased by non frequency-
specific patterns could be used as a measure of the level of noise that TMS patterns induce in a
cortical location or network. Narrow-band power increases would give rise to a more regular
signals comprised of a single oscillation frequency. In contrast, wider-band power increases, or
increased oscillations in several distinct frequency bands, will denote a noisier EEG signal that is
less predictable than a single oscillation.
Modulation of signal complexity by non frequency-specific TMS patterns
In an attempt to confirm our conclusions on the modulation of EEG signal noise levels by
non frequency-specific TMS patterns, we computed another measure evaluating, this time, the
predictability and regularity of EEG signals during stimulation. In the time-domain, we computed
a measure of Multi-Scale Entropy (MSE) on the EEG signal during the window of stimulation ([-
133 0] ms, 0 being the target onset) for all electrodes. MSE estimates the complexity of a signal
by calculating Sample Entropy (SE) at several time scales. This measure estimates the probability
to find repeating patterns in the signal hence the predictability of the signal. Lower predictability
indicates higher entropy and higher noise levels in the signals. Figure 5A shows the distribution
of SE over multiple scales for the electrode group of interest (F1, F3, FC1, FC3). SE gradually
increases over increasing time scales (with a steeper increase for active compared to sham

203
stimulation), this evolution is a sign of a complex signal that possesses irregular, non-predictable
structures over multiple time-scales (Costa et al., 2002, 2005; Zhang, 1991). According to the
guidelines provided by Costa et al. (2005) a signal is considered more complex than another one
if it has higher values of entropy for a majority of scales. Therefore, to reduce the dimensionality
of our entropy measure, we calculated the area under the SE curve over all scales and used this
measure as the MSE value in following analyses.
We assessed modulation of area under the MSE curve during stimulation across all scalp
EEG electrodes (Fig 5B). Comparisons between active and sham trials revealed that non
frequency-specific TMS patterns increased MSE in clusters of sensors located over regions of the
fronto-parietal network. Random active stimulation increased MSE over a small cluster of right
frontal electrodes, whereas non-uniform rhythmic and irregular active stimulation
Figure 4. Width of peaks of power increase during rhythmic or non frequency-specific stimulation.
The non-uniform rhythmic TMS pattern is not represented because the power spectrum of oscillations
during active TMS stimulation showed two different peaks and therefore was not comparable to the
others, displaying only a single peak (in the high-beta range). Notice that error bars represent the standard
error corrected for the reduced error variance obtained from the jackknife procedure. One-way ANOVA
showed a significant main effect of TMS pattern. Results of the post-hoc t-tests are indicated as follows:
** p < 0.01, * p < 0.05. Notice that irregular TMS patterns increased cortical oscillations in a significantly
wider frequency band than rhythmic or random TMS patterns.

204
Figure 5. Modulation of signal complexity by rhythmic vs. non frequency-specific stimulation. (A)
Bar plot of Sample Entropy (SE) across time scales for the left frontal electrodes (F1, F3, FC1, FC3)
closest to the center of the stimulation coil. Color signals each of the 4 TMS pattern tested in the study
(30 Hz rhythmic TMS, and three non frequency-specific patterns: non-uniform rhythmic TMS, random
TMS and irregular TMS). Full colors indicate bar plots for active TMS condition, whereas ‘pastel’ colors
signal bar plots for sham TMS condition. Notice that the estimated values of SE increased across time
scales for all TMS patterns for both, active and sham TMS trials. This suggests that EEG time series
contain a measure of unpredictability and noise at several time scales, which is the hallmark of a complex
signal. (B) Comparisons between active TMS (1st row) and sham TMS (2nd row) topographical maps of
the areas under the curve of SE across time scales, a measured entitled MSE (Multi-scale entropy), are
shown for each TMS pattern (30 Hz rhythmic TMS, and the 3 non frequency-specific patterns: non-
uniform rhythmic TMS, random TMS and irregular TMS). The bottom row shows the results of pairwise
(active vs. sham TMS) cluster-based statistical permutation tests. Bolded EEG electrodes represent
clusters of sensors that reached significance (p<0.05). Non frequency-specific TMS increased MSE in
clusters of left frontal and bilateral parietal electrodes. Comparison for the rhythmic TMS pattern shows
only sporadic significant differences in isolated electrodes.

205
increased MSE in a more widespread topography extending to parietal electrodes. Non-uniform
rhythmic active stimulation over the left FEF increased MSE in right frontal and bilateral parietal
electrodes. Active irregular stimulation increased MSE over bilateral frontal and right parietal
electrodes. In contrast to non frequency-specific patterns, active rhythmic stimulation, (compared
to sham) significantly increased MSE in miscellaneous electrodes located at the edge of the EEG
cap, and did not reveal any clear cluster of electrodes with significant changes.
These results suggest a difference in the modulation of MSE by rhythmic and non
frequency-specific TMS, however direct two-by-two comparisons failed to show significant
differences between any of the active TMS patterns probed in our study. In sum, the MSE outcome
measures seems to confirm prior analysis using the width of peak of power increase. and by
comparing active and sham trials, it shows that left FEF stimulation with non frequency-specific
TMS patterns, but not with rhythmic TMS, increase signal complexity over frontal and parietal
electrodes.
Visual detection performance
As in prior papers by our team on this same issue (Chanes et al., 2015), the impact of
rhythmic or non frequency-specific stimulation on conscious visual detection was explored
through the calculation of conscious visual detection performance (perceptual sensitivity, noted
d’) and also response bias (decision criterion noted c and likelihood ratio noted b) which is
influenced by late decision-making stages.
Repeated-measure 2x2x3 ANOVAs with factors Visual Field (left, right), TMS Condition
(active, sham) and TMS Pattern (rhythmic, non-uniform rhythmic, random, irregular) did not
show any significant effect for any of the factors nor any significant interactions between factors
on perceptual sensitivity (d’) or likelihood ratio (b) (p>0.05). Indeed our analyses, were only able
to show a main effect of TMS Condition on decision criterion (c) (F(1,14)=9.154, MSE=0.136,

206
p<0.01) suggesting that when active stimulation was delivered participants lowered their decision
criterion and became more liberal (i.e. they were more likely to respond that a target was presented
in case of doubt), compared to sham stimulation. No main effect of TMS Pattern or interaction
between TMS Condition and Pattern were found for c values, indicating that decision criterion
was not modulated by the temporal distribution of pulses within active TMS bursts.
Figure 6. Impact of rhythmic and non frequency-specific TMS on conscious visual detection
performance. Modulation of perceptual sensitivity (A) and decision criterion ‘c’ (B) by active TMS
patterns (red bars) compared to sham TMS patterns (blue bars). Data is presented for each TMS pattern
(30 Hz rhythmic TMS and the 3 non frequency-specific TMS patterns: non-uniform rhythmic TMS,
random TMS and irregular TMS) and separated for left visual field (LVF) and right visual field (RVF)
targets. Note that the delivery of any active TMS pattern, regardless of their temporal structure lowered
decision criterion (significant main effect of TMS condition) rendering participants less conservative
(hence more liberal) when deciding if a near threshold target had been presented or not. No specific effects
of rhythmic or non frequency-specific TMS patterns of TMS were revealed by our analyses.

207
Such a non-statistically significant result on the d’ is at odds with the outcomes of a
previous study by our team that reported significant improvement of perceptual sensitivity
following active stimulation with both non-uniform rhythmic and random TMS bursts (Chanes et
al., 2015). In this earlier study a first group of healthy participants as the ones of the current study,
received in separate blocks active or sham versions of rhythmic and non-uniform rhythmic and
behavioral outcomes showed a significant interaction between TMS Condition and TMS Pattern
on d’ in a 2x2x2 repeated-measure ANOVA with factors Visual Field (left, right), TMS Condition
(active sham) and TMS Pattern (rhythmic, non-uniform rhythmic). Then, a second group of
participants underwent stimulation with active and sham random TMS bursts and a 2x2 repeated-
measure ANOVA with factors Visual Field and TMS Condition revealed a significant interaction
between the two factors.
In a further attempt to replicate the analyses of this earlier study (which compared less
TMS patterns together) we conducted, post-hoc, two repeated-measure ANOVAs identical to
those in Chanes et al. (2015). Unfortunately, we were not able to replicate such results and neither
of the two ANOVAs on d’ yielded any main effect or interactions for any of its factors (p>0.05).

208
Discussion
In this study, we aimed to better characterize the coding contributions of the left FEF to
frontal activity and the modulation of conscious visual perception. We did so by assessing the
neurophysiological impact of non frequency-specific short bursts of TMS on scalp EEG signals
from participants performing a visual detection task on near-threshold stimuli. We followed up
on previously published results (Chanes et al., 2015) which, at difference with the right FEF area
that encoded visual facilitation by enabling high-beta activity at ~30 Hz (Chanes et al. 2013,
Vernet et al. 2019), unexpectedly suggested a causal contribution of non frequency-specific TMS
patterns on the facilitation of visual perception.
Several metrics estimating the level of noise showed that several types of non-regular TMS
patterns induced higher levels of noise in cortical EEG signals. Compared to high-beta TMS bursts
which, as expected, entrained cortical oscillations in a relatively specific frequency band around
30 Hz, non frequency-specific patterns of TMS of equal duration and pulse number increased
oscillation power across a broader frequency band or on individual multiple frequency peaks.
Additionally, such non frequency-specific TMS patterns consistently increased entropy for EEG
signals (not in a single time-scale but over multiple time scales), which is a sign of increased
signal complexity.
Short bursts of arrhythmic or random TMS had been employed in multiple TMS
experiments as control patterns to isolate the impact of frequency for rhythmic TMS bursts
(Albouy et al., 2017; Chanes et al., 2013, 2015; Thut, Veniero, et al., 2011; Vernet et al., 2019).
However, the specific effect of such TMS ‘noise’ patterns on neuronal signals remained to be
characterized and understood in further detail. To fulfil this experimental and theoretical
knowledge gap, we here designed three patterns of non frequency-specific short bursts of 4 TMS
pulses, with different degrees of irregularity, plus a 30 Hz frequency-specific rhythmic TMS
pattern and, concurrently with the delivery of stimulation, we recorded EEG signals. We were

209
thus able to test and discard hypotheses about the potential effects of these non frequency-specific
patterns on neural signals (Chanes et al., 2015).
Increase of high-beta oscillations by non frequency-specific TMS
First, we were able to demonstrate that against what we initially hypothesized, non
frequency-specific TMS bursts did not prevent the build-up of cortical oscillations. In fact, when
comparing differences in power during stimulation for high-beta frequency band, our results
surprisingly revealed that active non frequency-specific TMS patterns increased high-beta
oscillations as strongly as 30 Hz rhythmic TMS patterns (known to entrain high-beta cortical
oscillations). Moreover, as previously reported for rhythmic TMS patterns (Thut, Veniero, et al.,
2011; Vernet et al., 2019), non frequency-specific TMS bursts were able to phase align cortical
oscillations at a level comparable with rhythmic episodic patterns.
As an exception however, the so called random TMS pattern did increase oscillatory phase
alignment compared to sham but showed significantly lower impact on phase alignment than high-
beta rhythmic TMS or the two other non frequency-specific TMS patterns. The random TMS
burst differed from all other TMS patterns tested in that the onset time of the middle pulses (2nd
and 3rd, out of 4 pulses) within the burst were not fixed but instead, they were randomly jittered
from trial to trial. This pulse onset timing variability could explain such a weak (indeed the
weakest of all) trial-by-trial phase alignment in response to random TMS.
Previous studies have reported how the injection of an optimal level of peripheral noise to
a visual rhythmic stimulus has the ability to enhance cortical oscillations entrained at this same
frequency band (Mori & Kai, 2002; Srebro & Malladi, 1999). It is hence plausible that the three
non frequency-specific patterns tested in this study ended up acting similarly. The onset timings
of TMS pulses in such patterns closely resembled those of a pure 30 Hz frequency, but a slight
onset timing shift of the two middle pulses added noise to an underlying 30 Hz frequency. This

210
noise, once it reached a level neither too high or too low, could have enhanced the entrainment of
high-beta cortical oscillations, even in the absence of a regular 30 Hz structure in the burst.
Frequency-specificity of effects of rhythmic and non frequency-specific TMS
If they have the similar effects on high-beta oscillations, non frequency-specific TMS
patterns differs from rhythmic TMS in the frequency specificity of the oscillations they enhance.
We here showed that, compared to 30 Hz rhythmic episodic bursts, non frequency-specific TMS
increases cortical oscillations in the stimulated left frontal cortex (the left FEF) across a broader
frequency band extending towards low-beta band. Indeed, when the two patterns were directly
compared, irregular TMS increased oscillatory phase-locking in the band more strongly than
rhythmic TMS. Additionally, non-uniform rhythmic TMS patterns showed two peaks of increased
power, one in the high-beta range and another in the low-beta range. In contrast, rhythmic TMS
increased oscillatory power within a single high-beta peak.
The bandwidth of such increases in oscillation power also revealed differences between
the three non frequency-specific TMS patterns evaluated in our study. Indeed, our analyses
showed that compared to the random TMS pattern, irregular TMS patterns were able to enhance
cortical oscillations is a wider frequency band, centered around the high-beta band. Moreover,
compared to non-uniform rhythmic TMS, irregular and random patterns enhanced power in a
single, albeit wide, frequency band, whereas non-uniform rhythmic TMS influenced cortical
oscillations in two distinct frequency bands (high-beta and low-beta).
Increased level of neural noise by non frequency-specific TMS
The distribution of power in frequency bins over power spectral density has been used in
electrophysiological signals as a measure of spectral entropy (Rezek & Roberts, 1998). In this
respect, the degree of frequency specificity of the oscillatory response to stimulation is taken as a
proxy of the level of noise induced by short TMS bursts into the cortex. The synchronization of

211
local oscillators at a single frequency during rhythmic stimulation (Thut, Schyns, et al., 2011;
Vernet et al., 2019) gives rise to a regular and predictable oscillating signal with a single narrow
power peak and very low entropy. On the contrary, the mixing of frequencies in a large number
of frequency bins results into a more complex and unpredictable signal with higher entropy. In
this framework, our results show that non frequency-specific TMS induced higher levels of noise
in the EEG activity generated by the stimulated cortex than rhythmic TMS bursts.
This conclusion was further confirmed by a second measure, the Multi-Scale Entropy
(MSE), a parameter that estimates the evolution of signal entropy over several time scales, higher
values of MSE indicating a signal that is not random but complex and rich in information at
several time scales (Costa et al., 2002, 2005; Zhang, 1991). Only non frequency-specific TMS
patterns significantly increased MSE over large clusters of EEG electrodes compared to sham
stimulation. Most interestingly, the increase of signal complexity during stimulation with non
frequency-specific TMS patterns was found most significant not on EEG electrodes over the
stimulated left FEF, but instead those overlying right frontal and bilateral parietal regions. The
poor spatial resolution of EEG does not allow us to conclude which cortical regions were the
source of this frontal and parietal increase in complexity. Nonetheless, the left FEF is a node of
the fronto-parietal network for orientation of spatial attention (Corbetta et al., 2008) and this
network is likely to be enabled during a time interval between the onset of an alerting cue and the
onset of the visual target (Gross et al., 2004; Kastner et al., 1999) in which the TMS bursts were
delivered. We hypothesize that the increase in signal complexity induced in the left FEF by non
frequency-specific TMS was likely spread throughout the dorsal attentional network to the right
FEF and bilateral Intra Parietal Sulci (IPS) via transcallosal and structural intrahemispheric
connectivity, for instance, along the Superior Longitudinal Fasciculus a bilateral white matter tract
linking frontal and parietal nodes of the attention network (Thiebaut de Schotten et al., 2011).

212
Non-invasive induction of neural noise
To the best of our knowledge, our results offer the first proof, that short TMS bursts can
modulate neural noise levels in circumscribed cortical regions. Furthermore, we provide
experimental support in favor of the ability of TMS bursts with several types of temporal
irregularities to induce distinct levels of cortical noise. Only relatively recently, transcranial
Random Noise Stimulation (tRNS) a technique delivering random levels of current mimicking a
white noise signal (Terney et al., 2008) has been used to modulate neural noise levels and
influence cognition. Through variations in the mean current intensity different levels of cortical
noise can be evoked (Groen et al., 2018; Groen & Wenderoth, 2016). In spite of some significant
advantages (e.g., lower cost, ease of use, excellent safety profile, portability and possibility of
flexible multisite stimulation), compared to TMS approaches, tRNS suffers the limitations of any
other transcranial current stimulation (tCS) approaches, essentially, low temporal and spatial
resolution and weak intracranial impact (Bikson et al., 2010; Datta et al., 2012; Nitsche et al.,
2008; Valero-Cabré et al., 2017). Moreover, concurrent EEG recordings are highly challenging
during tRNS given the continuous artifacts generated by scalp electrical currents, and no effective
cleaning methods for these artifacts have been found (Noury et al., 2016; Noury & Siegel, 2018).
Accordingly, to our knowledge, no evidence from convincing EEG recordings to confirm the
ability of tRNS to manipulate noise levels present in cortical signals have been produced.
Generating experimental proof that tRNS may be able to act by modulating cortical EEG
signals is paramount particularly given recent evidence suggesting that tCS intensity levels
normally used during electrical stimulation (~2 mA) are not strong enough to reach in sufficient
magnitude the cortical surface (Horvath et al., 2015; Vöröslakos et al., 2018). Additionally, recent
evidence supports that the behavioral impact of tCS on behavior could be in part driven by the
activation of peripheral sensory inputs rather than cortical stimulation (Asamoah et al., 2019).
The possibility to use short TMS bursts to non-invasive manipulate neural noise operating
in focal cortical regions and exert an impact on specific behaviors holds considerable promise in

213
the field of neurophysiology, as it could help us better understand neural coding. Indeed, neural
noise could play an important role for signal processing in the central nervous system. To this
regard, Stochastic Resonance (SR) theory postulates that in non-linear systems, such as neurons,
the addition of an optimal level of noise can enhance the information content of a signal (Moss et
al., 2004) and, indeed, SR-like beneficial effects of noise have been demonstrated at several
spatial scales in the nervous system. External addition of noise improves signal transduction
through membrane ions channels (Bezrukov & Vodyanoy, 1995) and single cell responses to
sensory stimuli (Collins et al., 1996; Cordo et al., 1996; Douglass et al., 1993; Jaramillo &
Wiesenfeld, 1998). At the level of cortical regions, addition of stochastic noise to weak periodic
sensory stimuli improved evoked responses recorded by EEG (Srebro & Malladi, 1999) and
entrainment of cortical activity at the frequency contained in the stimulus (Manjarrez et al., 2002;
Mori & Kai, 2002). Lastly, at the behavioral level, the injection of noise to neural activity in
cortical regions facilitates the detection of weak sensory stimuli (Groen & Wenderoth, 2016;
Iliopoulos et al., 2014; Kitajo et al., 2003; Manjarrez et al., 2007) and hence improves the coding
of higher cognitive processes to enable decision-making or facilitate memory (Groen et al., 2018;
Usher & Feingold, 2000). Overall, SR effects suggest that cortical processing is very robust to
sources of noise inherently present in the brain (Faisal et al., 2008) and very effective at detecting
weak stimuli embedded in this noise. By opening the possibility to add noise directly to
circumscribed cortical targets instead of via sensory afferent pathways, the use of non frequency-
specific TMS bursts may open new avenues to explore the causal relationship between modulation
of neuronal noise levels and cognitive function.
Improvements of visual perception by addition of noise
According to the Stochastic Resonance (SR) theory, the addition of noise can be
accompanied by better perception. Along these same lines, an earlier study by our team that
inspired the current exploration delivered TMS to the left FEF and showed improvement of visual

214
perception under the influence of two of types of non frequency-specific TMS bursts, whereas
rhythmic TMS did not elicit any improvement (Chanes et al., 2015). Unexpectedly, we were
unable to replicate this behavioral result even when two of the non frequency-specific patterns we
used were identical to the patterns previously tested. Several reasons could explain our inability
to modulate conscious visual detection. First, detection improvements for visual stimuli during
the addition of stochastic noise seems to systematically follow an inverse U-shaped curve (Collins
et al., 1996; Simonotto et al., 1997). Accordingly, only an optimal level of noise added to sensory
stimuli drives detection improvements, whereas noise levels below or above have either no effect
or a detrimental impact. It has been shown that the optimal level of noise for behavioral
improvement varies for each individual (Iliopoulos et al., 2014; Kitajo et al., 2003) likely given
differences in the level of ongoing internal noise present in targeted cortical systems before the
addition of electromagnetic noise. Indeed, participants with a high level of internal noise show
limited facilitation via SR effects (Aihara et al., 2008). Hence, we cannot rule out if the noise
levels induced by the three non frequency-specific TMS patterns tested in our study might have
been either too low or too high to improve perception. Secondly, even if we did induce noise
levels in a range susceptible to drive behavioral improvement, inter-individual variability in the
levels of optimal noise could have extended the facilitating effect over all types of TMS patterns,
cancelling off any significant perceptual improvements at the group level for each individual type
of pattern (Groen & Wenderoth, 2016). In any case, this negative behavioral result should
encourage further explorations to pinpoint and eventually customize the level of noise intensity
necessary for improving cortical processing.
We here applied relatively brief TMS bursts (4 pulses, during an interval of 100 ms from
the 1st to the 4th pulse) in order to facilitate a comparison between our results following left FEF
stimulation and effects of right FEF stimulation reported previously (Chanes et al., 2013; Quentin
et al., 2015; Vernet et al., 2019). However, short TMS bursts combined with technical limitations
of TMS machines (at least 20 ms in between two pulses) strongly limit the inter-pulse intervals

215
available to design non frequency-specific TMS patterns. The use of longer TMS bursts with more
than 4 pulses (or, if behaviorally relevant, slower TMS frequencies) could provide additional
freedom to modulate the structure of a burst within a continuum between complete random pulse
onset timing and a pure perfectly regular rhythmic oscillation. With higher flexibility to titrate
noise levels, one could individually customize non frequency-specific TMS patterns, hence reduce
inter-subject variability and become more sensitive to stochastic resonance on visual performance
effects at the group level.
Although we could not confirm previously reported improvement of conscious visual
perception in response to either rhythmic or non frequency-specific TMS patterns, we did observe
significant modulations of the subjective response criterion by active but not sham TMS. Indeed,
response criterion was lowered, indicating the participants, when in doubt about the appearance
of a visual target, provided less conservative responses (or, said otherwise, they took more liberal
perceptual decisions), hence were more likely to respond that a target had been presented in active
than in sham TMS trials. This effect, however, was not modulated by the temporal structure of
the TMS bursts as no significant main effect of TMS pattern or interaction between TMS pattern
and TMS condition (active or sham) on the response criterion were found.
To the best of our knowledge, such a TMS pattern-unspecific effect on subjective response
bias has never been reported previously in response to the stimulation of left or the right FEF
during a conscious visual detection task employing either single TMS pulses (Chanes et al.,
2012) or rhythmic vs. non frequency-specific TMS patterns (Chanes et al., 2013, 2015; Quentin
et al., 2015; Vernet et al., 2019) . However, the mentioned studies measured subjective bias with
the likelihood ratio (b) instead of the decision criterion (c) we here present. Both of these measures
are based on Signal Detection Theory to estimate the degree of subjective bias in perceptual
detection tasks. Nonetheless, they differ in that the decision criterion (c) is completely
independent from the objective perceptual sensitivity of the subject, whereas the likelihood ratio

216
(b) is not (Ingham, 1970). The decision criterion (c) has been progressively established as a more
sensitive measure of response bias (Macmillan & Creelman, 1990) than likelihood ratio (b).
Accordingly, previous studies which estimated the latter might not have been sensitive to any
modulation of the subjective response bias by active TMS, that we here report for the first time.
Indeed, interestingly, we here measured both likelihood ratio (b) and decision criterion (c) and
showed a specific effect of active vs. sham TMS only for the latter.
In order to explain this collateral finding, left frontal regions have been shown to be part
of a left-lateralized network in charge of integrating sensory information in decision-making
(Heekeren et al., 2006). We here hypothesize that any of the tested active TMS pattern delivered
to the left FEF have the capability to activate this network, leading to a modulation of decision
criterion. Alternatively, reductions of response criterion (i.e., participants becoming less
conservative or more liberal in their perceptual decisions) has been observed following the
delivery of a loud warning signal preceding a visual target (Bolognini et al., 2005; Frassinetti et
al., 2002) an effect which could be attributed to a general crossmodal increase of phasic alerting
following a warning signal (Kusnir et al., 2011; Robertson et al., 1998). Although the impact of
the loud clicking sound associated with TMS delivery is here controlled for by the use of sham
TMS patterns, the somatosensory stimulation of the scalp generated by TMS on each pulse are
only controlled for incompletely. Since the effect on decision criterion proved TMS pattern-
independent, hence not modulated by the temporal structure of the TMS bursts, this could have
been caused by an unspecific effect of active TMS. The scalp tapping sensation tied primarily to
active TMS pulses could have acted as a pre-target warning signal able to modulate the criterion
of visual perception decisions (Shams & Kim, 2010).

217
Conclusion
In conclusion, this is the first study exploring the effects of several types of non frequency-
specific TMS patterns on cortical activity focusing in the left FEF as part of a bilaterally
distributed dorsal attentional orienting network. Our study tested, with interleaved TMS-EEG
recordings, speculative hypotheses as to the effect on EEG signals of non frequency-specific TMS
bursts (Chanes et al., 2015). We brought evidence that non frequency-specific TMS patterns
increase cortical oscillations in a broadband manner, and generated cortical signals of higher
complexity in the targeted left frontal regions but also in inter-connected fronto-parietal sites of
the left and the right hemispheres.
Our results are still preliminary but encourage further studies focusing on at least three
areas: First, the role of neural noise in cognitive coding tied to the modulation of visual perception
via spatial attention mechanisms; Second, the ability of non frequency-specific patterns inducing
several levels of noise and complexity to interact and modulate brain activity and visually guided
behaviors; Third and last, the need for individualized customization of non frequency-specific
patterns to account for the variability of individual ongoing neural noise levels.

218
Conflict of interest
The authors declare no competing interests.
Acknowledgement
Chloé Stengel was supported by a PhD fellowship from the University Pierre and Marie Curie.
Julià L. Amengual was supported by a fellowship from the Fondation Fyssen. The activities of
the laboratory of Dr. Valero-Cabré are supported by research grants IHU-A-ICM-Translationnel,
ANR projet Générique OSCILOSCOPUS and Flag-era-JTC-2017 CAUSALTOMICS. The
authors would also like to thank Marine Vernet and Clara Sanchez for providing help during data
acquisition and the Naturalia & Biologia Foundation for financial assistance for traveling and
attending meetings.
Author contributions
Conceptualization: C.S., and A.V.-C. Data acquisition: C.S., and A.V.-C. Data analysis: C.S.
Manuscript preparation: C.S., J.L.A., T.M. & A.V.C. Supervision: A.V.-C.
Data availability statement
Data are available from the corresponding author upon request.

219
REFERENCES
Aihara, T., Kitajo, K., Nozaki, D., & Yamamoto, Y. (2008). Internal noise determines external
stochastic resonance in visual perception. Vision Research, 48, 1569–1573.
Albouy, P., Weiss, A., Baillet, S., & Zatorre, R. J. (2017). Selective Entrainment of Theta
Oscillations in the Dorsal Stream Causally Enhances Auditory Working Memory
Performance. Neuron, 94, 193-206.
Asamoah, B., Khatoun, A., & Laughlin, M. M. (2019). TACS motor system effects can be caused
by transcutaneous stimulation of peripheral nerves. Nature Communications, 10, 266.
Bezrukov, S. M., & Vodyanoy, I. (1995). Noise-induced enhancement of signal transduction
across voltage-dependent ion channels. Nature, 378, 362–364.
Bikson, M., Datta, A., Rahman, A., & Scaturro, J. (2010). Electrode montages for tDCS and weak
transcranial electrical stimulation: Role of “return” electrode’s position and size. Clinical
Neurophysiology, 121, 1976–1978.
Bolognini, N., Frassinetti, F., Serino, A., & Làdavas, E. (2005). “Acoustical vision” of below
threshold stimuli: Interaction among spatially converging audiovisual inputs.
Experimental Brain Research, 160, 273–282.
Brainard, D. H. (1997). The Psychophysics Toolbox. Spatial Vision, 10, 433–436.
Buschman, T. J., & Miller, E. K. (2007). Top-Down Versus Bottom-Up Control of Attention in
the Prefrontal and Posterior Parietal Cortices. Science, 315, 1860–1862.
Chanes, L., Chica, A. B., Quentin, R., & Valero-Cabré, A. (2012). Manipulation of Pre-Target
Activity on the Right Frontal Eye Field Enhances Conscious Visual Perception in Humans.
PLoS ONE, 7, e36232.
Chanes, L., Quentin, R., Tallon-Baudry, C., & Valero-Cabré, A. (2013). Causal Frequency-
Specific Contributions of Frontal Spatiotemporal Patterns Induced by Non-Invasive
Neurostimulation to Human Visual Performance. The Journal of Neuroscience, 33, 5000–
5005.
Chanes, L., Quentin, R., Vernet, M., & Valero-Cabré, A. (2015). Arrhythmic activity in the left
frontal eye field facilitates conscious visual perception in humans. Cortex, 71, 240–247.
Collins, J. J., Imhoff, T. T., & Grigg, P. (1996). Noise-enhanced information transmission in rat
SA1 cutaneous mechanoreceptors via aperiodic stochastic resonance. Journal of
Neurophysiology, 76, 642–645.
Collins, J. J., Imhoff, T. T., & Grigg, P. (1996). Noise-enhanced tactile sensation. Nature, 383,
770–770.
220
Corbetta, M., Patel, G., & Shulman, G. L. (2008). The reorienting system of the human brain:
From environment to theory of mind. Neuron, 58, 306–324.
Corbetta, M., & Shulman, G. L. (2002). Control of goal-directed and stimulus-driven attention in
the brain. Nature Reviews Neuroscience, 3, 201.
Cordo, P., Inglis, J. T., Verschueren, S., Collins, J. J., Merfeld, D. M., Rosenblum, S., … Moss,
F. (1996). Noise in human muscle spindles. Nature, 383, 769–770.
Costa, M., Goldberger, A. L., & Peng, C.-K. (2002). Multiscale Entropy Analysis of Complex
Physiologic Time Series. Physical Review Letters, 89, 068102.
Costa, M., Goldberger, A. L., & Peng, C.-K. (2005). Multiscale entropy analysis of biological
signals. Physical Review E, 71.
Datta, A., Truong, D., Minhas, P., Parra, L. C., & Bikson, M. (2012). Inter-Individual Variation
during Transcranial Direct Current Stimulation and Normalization of Dose Using MRI-
Derived Computational Models. Frontiers in Psychiatry, 3, 91.
Douglass, J. K., Wilkens, L., Pantazelou, E., & Moss, F. (1993). Noise enhancement of
information transfer in crayfish mechanoreceptors by stochastic resonance. Nature, 365,
337–340.
Edgington, E., & Onghena, P. (2007). Randomization tests. Chapman and Hall/CRC.
Faisal, A. A., Selen, L. P. J., & Wolpert, D. M. (2008). Noise in the nervous system. Nature
Reviews Neuroscience, 9, 292–303.
Frassinetti, F., Bolognini, N., & Làdavas, E. (2002). Enhancement of visual perception by
crossmodal visuo-auditory interaction. Experimental Brain Research, 147, 332–343.
Gómez, C. M., Marco-Pallarés, J., & Grau, C. (2006). Location of brain rhythms and their
modulation by preparatory attention estimated by current density. Brain Research, 1107,
151–160.
Green, D. M., & Swets, J. A. (1966). Signal detection theory and psychophysics. Oxford, England:
John Wiley.
Groen, O. van der, Tang, M. F., Wenderoth, N., & Mattingley, J. B. (2018). Stochastic resonance
enhances the rate of evidence accumulation during combined brain stimulation and
perceptual decision-making. PLOS Computational Biology, 14, e1006301.
Groen, O. van der, & Wenderoth, N. (2016). Transcranial Random Noise Stimulation of Visual
Cortex: Stochastic Resonance Enhances Central Mechanisms of Perception. Journal of
Neuroscience, 36, 5289–5298.
Gross, J., Schmitz, F., Schnitzler, I., Kessler, K., Shapiro, K., Hommel, B., & Schnitzler, A.
(2004). Modulation of long-range neural synchrony reflects temporal limitations of visual

221
attention in humans. Proceedings of the National Academy of Sciences, 101, 13050–
13055.
Heekeren, H. R., Marrett, S., Ruff, D. A., Bandettini, P. A., & Ungerleider, L. G. (2006).
Involvement of human left dorsolateral prefrontal cortex in perceptual decision making is
independent of response modality. Proceedings of the National Academy of Sciences, 103,
10023–10028.
Hipp, J. F., Engel, A. K., & Siegel, M. (2011). Oscillatory Synchronization in Large-Scale
Cortical Networks Predicts Perception. Neuron, 69, 387–396.
Horvath, J. C., Forte, J. D., & Carter, O. (2015). Evidence that transcranial direct current
stimulation (tDCS) generates little-to-no reliable neurophysiologic effect beyond MEP
amplitude modulation in healthy human subjects: A systematic review. Neuropsychologia,
66, 213–236.
Iliopoulos, F., Nierhaus, T., & Villringer, A. (2014). Electrical noise modulates perception of
electrical pulses in humans: Sensation enhancement via stochastic resonance. Journal of
Neurophysiology, 111, 1238–1248.
Ingham, J. G. (1970). Individual differences in signal detection. Acta Psychologica, 34, 39–50.
Jaramillo, F., & Wiesenfeld, K. (1998). Mechanoelectrical transduction assisted by Brownian
motion: A role for noise in the auditory system. Nature Neuroscience, 1, 384–388.
Kähkönen, S., Komssi, S., Wilenius, J., & Ilmoniemi, R. J. (2005). Prefrontal TMS produces
smaller EEG responses than motor-cortex TMS: Implications for rTMS treatment in
depression. Psychopharmacology, 181, 16–20.
Kastner, S., Pinsk, M. A., De Weerd, P., Desimone, R., & Ungerleider, L. G. (1999). Increased
Activity in Human Visual Cortex during Directed Attention in the Absence of Visual
Stimulation. Neuron, 22, 751–761.
Kiesel, A., Miller, J., Jolicœur, P., & Brisson, B. (2008). Measurement of ERP latency differences:
A comparison of single-participant and jackknife-based scoring methods.
Psychophysiology, 45, 250–274.
Kitajo, K., Nozaki, D., Ward, L. M., & Yamamoto, Y. (2003). Behavioral Stochastic Resonance
within the Human Brain. Physical Review Letters, 90.
Kusnir, F., Chica, A. B., Mitsumasu, M. A., & Bartolomeo, P. (2011). Phasic auditory alerting
improves visual conscious perception. Consciousness and Cognition, 20, 1201–1210.
Macmillan, N. A., & Creelman, C. D. (1990). Response bias: Characteristics of detection theory,
threshold theory, and “nonparametric” indexes. Psychological Bulletin, 107, 401–413.

222
Macmillan, N. A., & Creelman, C. D. (2004). Detection Theory: A User’s Guide. Psychology
Press.
Manjarrez, E., Diez-Martínez, O., Méndez, I., & Flores, A. (2002). Stochastic resonance in human
electroencephalographic activity elicited by mechanical tactile stimuli. Neuroscience
Letters, 324, 213–216.
Manjarrez, E., Mendez, I., Martinez, L., Flores, A., & Mirasso, C. R. (2007). Effects of auditory
noise on the psychophysical detection of visual signals: Cross-modal stochastic resonance.
Neuroscience Letters, 415, 231–236.
Maris, E., & Oostenveld, R. (2007). Nonparametric statistical testing of EEG- and MEG-data.
Journal of Neuroscience Methods, 164, 177–190.
Mori, T., & Kai, S. (2002). Noise-induced entrainment and stochastic resonance in human brain
waves. Physical Review Letters, 88, 218101.
Moss, F., Ward, L. M., & Sannita, W. G. (2004). Stochastic resonance and sensory information
processing: A tutorial and review of application. Clinical Neurophysiology, 115, 267–281.
Nitsche, M. A., Cohen, L. G., Wassermann, E. M., Priori, A., Lang, N., Antal, A., … Pascual-
Leone, A. (2008). Transcranial direct current stimulation: State of the art 2008. Brain
Stimulation, 1, 206–223.
Noury, N., Hipp, J. F., & Siegel, M. (2016). Physiological processes non-linearly affect
electrophysiological recordings during transcranial electric stimulation. NeuroImage, 140,
99–109.
Noury, N., & Siegel, M. (2018). Analyzing EEG and MEG signals recorded during tES, a reply.
NeuroImage, 167, 53–61.
Oostenveld, R., Fries, P., Maris, E., & Schoffelen, J.-M. (2011). FieldTrip: Open source software
for advanced analysis of MEG, EEG, and invasive electrophysiological data.
Computational Intelligence and Neuroscience, 2011, 156869.
Paus, T. (1996). Location and function of the human frontal eye-field: A selective review.
Neuropsychologia, 34, 475–483.
Phillips, S., & Takeda, Y. (2009). Greater frontal-parietal synchrony at low gamma-band
frequencies for inefficient than efficient visual search in human EEG. International
Journal of Psychophysiology, 73, 350–354.
Pincus, S. M. (1991). Approximate entropy as a measure of system complexity. Proceedings of
the National Academy of Sciences, 88, 2297–2301.
Quentin, R., Elkin Frankston, S., Vernet, M., Toba, M. N., Bartolomeo, P., Chanes, L., & Valero-
Cabré, A. (2015). Visual Contrast Sensitivity Improvement by Right Frontal High-Beta

223
Activity Is Mediated by Contrast Gain Mechanisms and Influenced by Fronto-Parietal
White Matter Microstructure. Cerebral Cortex, 26, 2381-2390.
Rastelli, F., Tallon-Baudry, C., Migliaccio, R., Toba, M. N., Ducorps, A., Pradat-Diehl, P., …
Bartolomeo, P. (2013). Neural dynamics of neglected targets in patients with right
hemisphere damage. Cortex, 49, 1989–1996.
Rezek, I. A., & Roberts, S. J. (1998). Stochastic complexity measures for physiological signal
analysis. IEEE Transactions on Biomedical Engineering, 45, 1186–1191.
Robertson, I. H., Mattingley, J. B., Rorden, C., & Driver, J. (1998). Phasic alerting of neglect
patients overcomes their spatial deficit in visual awareness. Nature, 395, 169.
Rodriguez, E., George, N., Lachaux, J.-P., Martinerie, J., Renault, B., & Varela, F. J. (1999).
Perception’s shadow: Long-distance synchronization of human brain activity. Nature,
397, 430.
Rogasch, N. C., Thomson, R. H., Farzan, F., Fitzgibbon, B. M., Bailey, N. W., Hernandez-Pavon,
J. C., … Fitzgerald, P. B. (2014). Removing artefacts from TMS-EEG recordings using
independent component analysis: Importance for assessing prefrontal and motor cortex
network properties. NeuroImage, 101, 425–439.
Rossini, P. M., Burke, D., Chen, R., Cohen, L. G., Daskalakis, Z., Iorio, R. D., … Ziemann, U.
(2015). Non-invasive electrical and magnetic stimulation of the brain, spinal cord, roots
and peripheral nerves: Basic principles and procedures for routine clinical and research
application. An updated report from an I.F.C.N. Committee. Clinical Neurophysiology,
126, 1071–1107.
Saalmann, Y. B., Pigarev, I. N., & Vidyasagar, T. R. (2007). Neural mechanisms of visual
attention: How top-down feedback highlights relevant locations. Science, 316, 1612–1615.
Schubert, R., Haufe, S., Blankenburg, F., Villringer, A., & Curio, G. (2009). Now You’ll Feel It,
Now You Won’t: EEG Rhythms Predict the Effectiveness of Perceptual Masking. Journal
of Cognitive Neuroscience, 21, 2407–2419.
Shams, L., & Kim, R. (2010). Crossmodal influences on visual perception. Physics of Life
Reviews, 7, 269–284.
Shulman, G. L., Pope, D. L. W., Astafiev, S. V., McAvoy, M. P., Snyder, A. Z., & Corbetta, M.
(2010). Right Hemisphere Dominance during Spatial Selective Attention and Target
Detection Occurs Outside the Dorsal Frontoparietal Network. Journal of Neuroscience,
30, 3640–3651.
Simonotto, E., Riani, M., Seife, C., Roberts, M., Twitty, J., & Moss, F. (1997). Visual Perception
of Stochastic Resonance. Physical Review Letters, 78, 1186–1189.

224
Srebro, R., & Malladi, P. (1999). Stochastic resonance of the visually evoked potential. Physical
Review E, 59, 2566–2570.
Stanislaw, H., & Todorov, N. (1999). Calculation of signal detection theory measures. Behavior
Research Methods, Instruments, & Computers: A Journal of the Psychonomic Society, Inc,
31, 137–149.
Stewart, L. M., Walsh, V., & Rothwell, J. C. (2001). Motor and phosphene thresholds: A
transcranial magnetic stimulation correlation study. Neuropsychologia, 39, 415–419.
Suckling, J., & Bullmore, E. (2004). Permutation tests for factorially designed neuroimaging
experiments. Human Brain Mapping, 22, 193–205.
Terney, D., Chaieb, L., Moliadze, V., Antal, A., & Paulus, W. (2008). Increasing Human Brain
Excitability by Transcranial High-Frequency Random Noise Stimulation. The Journal of
Neuroscience, 28, 14147–14155.
Thiebaut de Schotten, M., Dell’Acqua, F., Forkel, S. J., Simmons, A., Vergani, F., Murphy, D. G.
M., & Catani, M. (2011). A lateralized brain network for visuospatial attention. Nature
Neuroscience, 14, 1245–1246.
Thut, G., Schyns, P. G., & Gross, J. (2011). Entrainment of Perceptually Relevant Brain
Oscillations by Non-Invasive Rhythmic Stimulation of the Human Brain. Frontiers in
Psychology, 2.
Thut, G., Veniero, D., Romei, V., Miniussi, C., Schyns, P., & Gross, J. (2011). Rhythmic TMS
Causes Local Entrainment of Natural Oscillatory Signatures. Current Biology, 21, 1176–
1185.
Ulrich, R., & Miller, J. (2001). Using the jackknife-based scoring method for measuring LRP
onset effects in factorial designs. Psychophysiology, 38, 816–827.
Usher, M., & Feingold, M. (2000). Stochastic resonance in the speed of memory retrieval.
Biological Cybernetics, 83, L011–L016.
Valero-Cabré, A., Amengual, J. L., Stengel, C., Pascual-Leone, A., & Coubard, O. A. (2017).
Transcranial magnetic stimulation in basic and clinical neuroscience: A comprehensive
review of fundamental principles and novel insights. Neuroscience & Biobehavioral
Reviews, 83, 381–404.
Vernet, M., Stengel, C., Quentin, R., Amengual, J. L., & Valero-Cabré, A. (2019). Entrainment
of local synchrony reveals a causal role for high-beta right frontal oscillations in human
visual consciousness. Sci Rep, 9, 14510.

225
Vöröslakos, M., Takeuchi, Y., Brinyiczki, K., Zombori, T., Oliva, A., Fernández-Ruiz, A., …
Berényi, A. (2018). Direct effects of transcranial electric stimulation on brain circuits in
rats and humans. Nature Communications, 9, 483.
Zhang, Y.-C. (1991). Complexity and 1/f noise. A phase space approach. Journal de Physique I,
1, 971–977.

226

227
PROJECT 3 Non-specific effects of auditory stimulation generated by
transcranial magnetic stimulation (TMS) on cortical oscillations and visual detection performances
Résumé (français) La Stimulation Magnétique Transcrânienne (SMT) est une méthode de stimulation
cérébrale non invasive largement utilisée dans la recherche fondamentale en neurosciences
cognitives. Cependant, simultanément au bref champ électromagnétique délivré sur le cortex,
chaque impulsion de SMT génère un bref mais intense clic sonore. Afin d’annuler l’influence de
cet effet, les designs expérimentaux contrastent une stimulation active avec une SMT placebo qui
imite la stimulation auditive associée à la SMT. Néanmoins, l’influence des sons de la SMT sur
l’activité cérébrale et les performances comportementales doit être mieux caractérisée, en
particulier en ce qui concerne l’utilisation de sons répétés pour l’entrainement d’oscillations
corticales et la modulation du comportement.
Dans ce but, nous avons enregistré les signaux EEG d’une cohorte de sujets sains réalisant
une tâche de détection visuelle consciente au seuil sous l’influence d’impulsions uniques ou des
courtes rafales rythmiques ou aléatoires de SMT placebo ou de sons imitant la SMT délivrés avant
l’apparition d’une cible visuelle au niveau d’un site frontal droit préalablement impliqué dans la
facilitation de la détection visuelle consciente. Nos résultats démontrent que ni la SMT placebo
ni les sons imitant la SMT ne modulent la sensibilité visuelle. De plus, aucun indice
d’entrainement oscillatoire à une fréquence spécifique n’a été trouvé dans les signaux EEG
enregistrés pendant la stimulation placebo. Ces résultats renforcent la légitimité de la SMT
placebo comme condition contrôle adéquate dans les designs expérimentaux avec SMT active.
Néanmoins, la stimulation placebo a réinitialisé la phase des oscillations corticales dans une large
bande de fréquences dans le cortex auditif et a amené les sujets à être plus libéraux dans leurs
réponses à la tâche de détection (c’est-à-dire plus promptes à signaler la présence d’une cible
quand ils avaient un doute sur sa présence).
Nous concluons que des sons uniques ou en rafale rythmique latéralisés à droite ne
contribuent pas à des états, décrits ailleurs, d’activité neurale qui facilitent la perception visuelle.
Cependant, les effets que nous décrivons sur les processus de prise de décision et la réinitialisons
de phase non spécifique en fréquence appellent à de nouvelles études afin de mieux comprendre
les effets de la SMT placebo et d’améliorer les interprétations des études anciennes et actuelles
utilisant des designs expérimentaux avec de la SMT placebo.
228
Non-specific effects of auditory stimulation generated by transcranial magnetic stimulation (TMS) on cortical oscillations and conscious visual detection performance
Chloé Stengel1*†, Adrien Martel1, Julià L. Amengual1,2, Antoni Valero-Cabré 1,3,4†
1 Cerebral Dynamics, Plasticity and Rehabilitation Group, Institut du Cerveau et de la Moelle
Epinière, CNRS UMR 7225, Paris, France
2 Institut des Sciences Cognitives Marc Jeannerod, Département de Neuroscience
Cognitive, CNRS UMR 5229, Université Claude Bernard Lyon I, 67 Boulevard Pinel, 69675
Bron Cedex, France.
3 Dept. Anatomy and Neurobiology, Laboratory of Cerebral Dynamics, Boston University School
of Medicine, Boston, USA
4 Cognitive Neuroscience and Information Tech. Research Program, Open University of
Catalonia (UOC), Barcelona, SPAIN
† Corresponding authors: Chloé Stengel & Antoni Valero-Cabré, MD PhD, Groupe de Dynamiques
Cérébrales, Plasticité et Rééducation, Équipe Frontlab, Institut du Cerveau et de la Moelle Epinière
(ICM), Pitié-Salpêtrière, 47 boulevard de l’Hôpital, 75013 Paris, France.
Email: [email protected]; [email protected] /
Keywords: Conscious visual perception, Cortical oscillations, Crossmodal perceptual facilitation,
Decision making, Signal Detection Theory, Rhythmic transcranial magnetic stimulation,
Electroencephalography, Auditory cortex, Oscillatory entrainment
229
Abstract
Transcranial Magnetic Stimulation (TMS) is a method of non-invasive brain stimulation
widely used in fundamental research studies in cognitive neuroanatomy. However, simultaneously
with the brief electromagnetic field delivered to the cortex, each TMS pulse generates a brief but
intense clicking sound. In order to cancel the influence of this effect, experimental designs contrast
active stimulation with a sham TMS pattern mimicking auditory stimulation associated with TMS.
Nonetheless, the influence of TMS sounds on brain activity and its relation with behavioral
performance needs to be better characterized. The issue is particularly relevant with regards to
applications using repetitive sound patterns to entrain cortical oscillations and modulate behavior.
To this end, we recorded scalp EEG signals from a cohort of healthy participants performing
a near-threshold conscious visual detection task under the influence of either single pulses or short
bursts of sham TMS or TMS like-sounds (with a rhythmic or random configuration) delivered pre-
target onset around a right fontal location previously shown to facilitate conscious visual detection.
Our results show that neither sham TMS nor TMS-like sound stimulation were able to significantly
modulate visual sensitivity. In parallel, no signs of frequency-specific entrainment were found in
EEG recordings performed along with episodic sound bursts. These results strengthen the reported
ability of active rhythmic TMS patterns to entrain cortical oscillations and boost conscious visual
perception and the use of sham control designs in TMS entrainment applications. Nonetheless, sham
stimulation induced broadband phase-locking in the auditory cortex and also led participants to
become more liberal in the decision making (i.e., more prone to report to have seen a target when in
doubt about its presence).
We conclude that single or rhythmic patterns of right lateralized sound have no significant
contribution to specific states of neural activity leading to the facilitation of visual perception
reported elsewhere. Nonetheless, effects on decision-making processes and non frequency-specific
phase-locking call for new studies that allow a better understanding of sham TMS effects, improving
interpretations of past and current studies and designs for sham conditions.

230
Introduction
Transcranial Magnetic Stimulation (TMS) is a non-invasive brain stimulation method that
has been widely used to causally explore and manipulate brain-behavior relationships (recent
reviews in Polanía et al., 2018; Valero-Cabré et al., 2017). Each TMS pulse delivers an intense
brief magnetic field which induces, intracranially, a current able to depolarize clusters of cortical
neurons in circumscribed brain regions. The powerful electrical current circulating briefly through
copper wire loops inside the TMS coil case produces vibrations resulting in a brief but loud clicking
sound (Nikouline et al. 1999). The same phenomenon has been also linked to brief-lasting
deformation of the coil’s plastic case surface in contact with the scalp which, in synchrony with
pulse delivery, results in slight scalp tapping that may induce vibration of the skull and the cochlea.
Additionally, the spread of magnetic field to superficial scalp muscles can induce their contraction
and afferent proprioceptive stimulation (Ilmoniemi & Kičić, 2010).
In order to cancel out the potential influence of such sources of peripheral stimulation,
exploratory and clinical TMS designs contrast the effects of active TMS with the those of a so-
called sham TMS condition. This widely used approach aims to test participants (in trials
interleaved with active TMS trials or in a separate experimental block) in the same tasks under the
influence of the sensory confounding effects of TMS. This is done to ensure that the effects active
TMS patterns might reveal are fundamentally linked to the modulatory effect of electromagnetic
pulses, hence not significantly contributed to by the above mentioned peripheral sensory effects.
Most often, sham TMS consists in delivering active TMS pulses through a figure of eight
coil placed at a 90o angle between the coil surface and the scalp. This configuration reproduces the
loud clicking noise of active TMS while the magnetic field is projected into the air hence not
reaching the cortex. Custom-made sham TMS coils have also been designed that are equipped with
magnetic shields so that, when they are positioned flat on the scalp, they prevent the magnetic field
from reaching the brain, producing however a similar clicking noise as regular TMS coils (Duecker
& Sack, 2015). Importantly, however, to date none of the available sham TMS approaches is in a

231
opposition to accurately reproduce all the somatosensory sensations generated by the active TMS
patterns (Loo et al., 2000; Mennemeier et al., 2009) such as scalp tapping, skull and cochlear
vibration or muscle activation and ensuing proprioception.
Given the strong role played by cross-modal sensory interactions in brain systems, the
confounding effects of loud clicking sounds associated with TMS delivery need to be carefully
considered in venues exploring cognitive processes based or driven by any modality of sensory
stimulation (Shams & Kim, 2010; Spence, 2011). In the domain of visuo-spatial attention and
perception, visual detection can be improved when the onset of a visual target is accompanied by
a salient sound (Frassinetti et al. 2002; Bolognini et al. 2005; Lippert et al. 2007). Furthermore,
such effects can be observed even when the localization of the sound source in the extra-personal
space does not carry any predictive information with regards to the position of visual target to be
visually detected (Kusnir et al., 2011; Stein et al., 1996). Experimental evidence has also shown
that sound acts as a warning signal triggering phasic alerting in a supra-modal manner, hence able
to influence attentional or perceptual cognitive processes driven by other sensory modalities
(Sturm & Willmes, 2001). Finally, it has been shown that lateralized sounds have the ability to
orient spatial attention exogenously and hence improve the perception of ipsilateral visual targets
(McDonald et al. 2000; Spence and Driver 1997).
In spite of all these psychophysical precedents, to our knowledge, only Sack and colleagues
specifically analyzed in detail the effects of TMS sham stimulation on behavioral correlates of
visual perception, likely mediated by attentional orienting processes. Their studies showed that the
use of sham TMS delivered pre-target onset improved visual detection performance and that such
effects were dependent on visual target location and sham TMS pulse timing (Duecker & Sack,
2013). On the basis of their findings, they concluded that the high specificity of active TMS
peripheral sensory effects were challenging to deal with and hence demanded very careful planning
of active TMS control conditions (Duecker & Sack, 2015).

232
The presence of auditory evoked potentials elicited by active TMS was already well
documented two decades ago (Nikouline et al. 1999; Tiitinen et al. 1999) when applications of non-
invasive stimulation to study human cognition started to emerge. Nonetheless, for many years little
was learned about the effects of sham stimulation on other types of brain activity, such as cortical
oscillations.
Among recent findings in the time-frequency domain, studies documented the phase-
resetting of cortical rhythms in auditory and also visual cortical regions following peripherally
presented sounds (Mercier et al. 2013; Romei et al. 2012). Additionally, it has long been observed
that trains of clicking sounds (up to 100 Hz) give rise to an oscillatory response which follows the
rhythm dictated by their spectral components in the auditory cortex (Galambos et al. 1981; Picton
et al. 2003) and other cortical regions (Srinivasan et al. 1999; Srinivasan et al. 2006; Srinivasan et
al. 2007). This very robust phenomenon known as an Auditory Steady-State Response (ASSR) has
been employed to assess hearing capabilities in neurological patients (Picton et al., 2003) and
shown to modulate several behaviors such as listening accuracy or illusory time perception (Henry
& Obleser, 2012; Herrmann et al., 2013; Lakatos et al., 2013). There is a possibility that rhythmic
sham patterns, which consist in a train of clicks delivered at a specific frequency, could evoke
ASSR responses, in the primary auditory cortex and other cortical regions, and, by entraining
frequency-specific oscillations, modulate several high level cognitive processes. In this context,
we here entertain the hypothesis that sound-driven cortical oscillatory entrainment could interact
with oscillatory entrainment achieved with active rhythmic (or repetitive) TMS delivered directly
on the cortex (Thut et al., 2011). As a result, classical sham rhythmic or repetitive TMS bursts
would not be suited to fully control for such phenomenon and isolate pure contributions of active
rhythmic TMS patterns to the entrainment of cortical oscillations.
Aiming to explore the ability of clicking sound associated to sham TMS to entrain cortical
oscillations and modulate visual detection performances, we recorded EEG signals from a group
of healthy participants performing a conscious visual detection task with near-threshold lateralized

233
visual targets consisting in low contrast Gabors. In half the trials, we tested the impact of either
single pulses, short rhythmic or random patterns of sham TMS, delivered shortly before the onset
of the visual target. In the remaining trials, no TMS of any sort was delivered (no sham stimulation
trials). The three TMS patterns were tested in separate experimental blocks, whereas sham TMS
and no TMS trials were embedded and randomized within the same block.
We predicted that sham stimulation pulses or bursts delivered shortly before visual target
onset would improve visual perception by orienting spatial attention to the ipsilateral hemifield
with respect to the TMS coil position (Duecker & Sack, 2013). This prediction would be
substantiated in higher levels of perceptual sensitivity for visual targets for sham TMS compared
to no sham TMS trials, and for right visual hemifield targets (ipsilateral to TMS coil position)
compared to targets in the contralateral hemifield. On the basis of prior observations, we did not
predict the entrainment of cortical oscillations by rhythmic sham bursts. Nonetheless, we
hypothesized a transient phase-locking of cortical oscillations in the auditory cortex and other
sensory cortices following the onset of sham clicking sound (Romei et al. 2012).
Lastly, TMS online experimental designs interleaving active and sham trials require two
TMS devices attached to independent coils and placed on approximately the same area of the scalp.
Therefore, we also tested the use of an audio speaker attached to the TMS coil reproducing
acoustical stimulation as a sham condition. This TMS-like sound setup would reduce needed TMS
equipment and allow to conduct well controlled experiments with active/sham TMS being
delivered from exactly the same location on the subject’s scalp, making participants unaware of
the presence of two TMS coils delivering two distinct TMS modalities (Sommer et al., 2006). We
hypothesized that these two sham TMS approaches (TMS coil placed perpendicular to the scalp or
audio speaker) would produce similar effects on visual detection performance and EEG signals.

234
Material and Methods
Participants
A group of 11 right-handed participants (5 women and 6 males) aged between 21 and 45
years old (28 ± 8) took part in the study. The participants reported no history of neurological
disorders, had normal or corrected-to-normal vision and took part voluntarily. All participants were
naïve with regards to the specific purposes of the experiment. They all signed an informed consent
form prior to the start of the experiment. The protocol and informed consent form was sponsored
by the INSERM (Institut National de la Santé et la Recherche Médicale) and approved by an
Institutional Review Board, the Comité de Protection des Personnes (CPP), Ile de France V.
Visual Detection Task
Participants performed a conscious visual detection task with right or left lateralized near
threshold (50% visibility) targets (Fig 1A for the sequence of events during a trial). They were
seated with their eyes 57 cm away from the center of the computer screen. Trials started with a
fixation screen that displayed a central fixation cross (0.5x0.5o) along with two lateral placeholders
(6.0 x 5.5°, eccentricity 8.5° from fixation cross) that indicated the potential location of the visual
target later in the trial. After a fixation period lasting between 1000 and 1500 ms, the fixation cross
became slightly larger (size 0.7x0.7°) for 66 ms to alert participants that the visual target might be
appearing soon. Following an inter-stimulus interval (233 ms), in 80% of the trials a low-contrast
Gabor stimulus (0.5o/cycle sinusoidal spatial frequency, 0.6o exponential standard deviation) with
vertical lines appeared for 33 ms in the middle of the left or the right placeholder with equal
probability. The remaining 20% of the trials corresponded to catch trials in which no target was
displayed on the screen.
The response window was presented 1000 ms after the offset of the visual target.
Participants were asked to report whether they saw a target and if they did (‘yes’) to indicate where
the visual target appeared (in the left/right placeholder). In order to provide a response, the response

235
window showed two arrow-like signs (“>>>” and “<<<”) which were presented below and above
the central fixation cross. Participants were asked to indicate which arrow pointed to the location
of the placeholder where they saw the target. The location of the arrows (above or below the
fixation cross) was randomized across trials and participants were prevented from preparing their
motor response prior to the presentation of the response screen. Participants responded with their
left hand by pressing the ‘d’ or ‘c’ letter key to signal the upper or lower arrow respectively. If they
wanted to report that had not seen any target, they were asked to press the space bar.
The contrast of the Gabor stimulus was individually adjusted during a titration block
completed immediately before the experimental sham TMS sessions. In such block, we aimed to
determine the contrast threshold for which each participant achieved 50% correct detection
performance (50% visibility). To this end, a one-up/one-down titration staircase procedure was
applied (Cornsweet, 1962) for each participant. The procedure started with a Gabor stimulus of 1
Michelson contrast and a contrast step equal to the initial contrast level. Upon each response
reversal the contrast step was divided by two. Throughout the titration procedure, the contrast of
the target was always kept between 1 and 0.005 Michelson units. A final 50% detection threshold
contrast was established when, for five consecutive trials, target contrast varied by less than 0.01
Michelson units. The threshold was measured twice using this exact same procedure. If the two
thresholds differed by less than 0.01 Michelson units, the average of the two measures was used as
the 50% visual detection threshold contrast for the experimental session. If this was not the case,
the threshold was determined again until repeated titrations could yield two consecutive contrasts
that fulfilled those criteria.

236
Figure 1. Experimental task, setup and sham stimulation patterns. (A) Visual detection task. After a
period of fixation, a central cross became slightly larger to alert participants of an upcoming event, then, in
50% of the trials, sham rhythmic, random or single pulse TMS patterns were delivered prior to the
presentation of a lateralized visual target that could appear inside a right or a left placeholder (80% of total
trials; 40% right 40% left) for a brief period of time (in the remaining 20% of trials no target was presented).
Participants were requested to indicate whether they did perceive or not the presence of a target (yes/no),
and, when they saw it, to report where the target had appeared (right/left) selecting the arrow pointing at the
placeholder in which the target had appeared. (B) Right-lateral, front and top schematic drawings of a
participant’s head presenting the two tested sham procedures, placed above the right FEF on the FC2
electrode (EEG 10-20 coordinates). Sham procedure #1: active TMS pulses delivered with the TMS coil (in
grey) in a 90o sham configuration. Sham procedure #2: TMS-like sound played by a speaker (in black)
mounted on the TMS coil. (C) Schematic representation of the 3 sham TMS patterns tested in our study: 30
Hz rhythmic TMS aiming to entrain cortical oscillatory activity at the input frequency, and 2 control
patterns, random TMS and single pulse TMS, to isolate the effect of stimulation frequency.
Eye movements recordings
To ensure fixation during the performance of the detection task, the position of both eyes
was monitored with a remote eye tracking system (Eyelink 1000, SR Research, 1000 Hz sampling
frequency). If at any point between the onset of the alerting cue and the target offset the position
of participant’s eyes was recorded more than 2° away from the center of the fixation cross, the trial
was labeled as incorrectly fixated and excluded from further analyses. At the end of the trial the

237
participants were alerted through a written message presented on the computer screen that fixation
had been broken. All non-fixated trials were re-randomized and repeated during the remaining
trials of the sub-block.
Sham TMS stimulation
Sham TMS was delivered with two different procedures. On the one hand, we used a
classical sham method (sham procedure #1) based on delivering active current through a 70 mm
figure-of-eight TMS coil placed in a right frontal location, overlying the right Frontal Eye Field
(FEF). The TMS coil was placed using an articulated mechanic arm with the lateral edge of the left
loop in contact with the FC2 electrode (of the 10-20 system EEG electrode grid, closest to the right
FEF) (Fig 1B), with the handle at 45o and oriented in an anterior-to-posterior and lateral-to-medial
orientation with respect to the longitudinal midline. Importantly, the coil’s edge was placed
perpendicular (90o between the coil active surface and the scalp) with regards to the curvature of
the skull, hence projecting the active magnetic field away from the brain to avoid any effective
electromagnetic stimulation of the cortex. Sham TMS pulses were triggered via a high temporal
resolution multichannel synchronization device (Master 8, AMPI) connected to a biphasic
repetitive stimulator (SuperRapid2, Magstim) set at a fixed stimulation intensity of 55% of
maximum stimulator output. All stimulation parameters mimicked sham TMS coil position and
conditions used in previous studies assessing the impact of active TMS pulses or rhythmic trains
in right or left frontal areas (Chanes et al., 2012, 2013, 2015; Quentin et al., 2015; Vernet et al.,
2019).
We also tested (Sham Approach #2) the delivery of sham TMS-like clicking sound through
a speaker (Mobi Wavemaster) taped on top of one of the loops of a 70 mm figure-of-eight TMS
coil, which was positioned perpendicular to the skull of the participant and oriented exactly as
described above for the classical sham procedure (Fig 1B). We created a template of the waveform
generated by the TMS clicking sounds by recording 100 single TMS pulses (Aiwa CM-S32

238
microphone) and averaging their individual waveforms. Finally, we adjusted the envelope of the
average waveform to emphasize high amplitude spikes present at the beginning of the waveform.
This was achieved so that once replayed through our speaker mounted on the TMS coil, the sound
could not be distinguished from a click produced by a real active TMS pulse delivered with this
same coil using an identical scalp configuration.
Mimicking online TMS paradigms tested in prior studies and which were proven effective
for the modulation of conscious visual perception (Chanes et al., 2012, 2013, 2015; Quentin et al.,
2015; Vernet et al., 2019), we tested the behavioral and EEG impact of three different sham
TMS/TMS-like sound patterns (Fig. 1C): rhythmic sham TMS/TMS-like sounds bursts, random
sham TMS/TMS-like sounds bursts and single pulses sham TMS/TMS-like sound.
Rhythmic sham TMS/TMS-like sounds consisted in bursts of 4 TMS/sound pulses regularly
spaced in time with an inter-pulse interval of 1/30 secs at a 30 Hz frequency. The burst lasted 100
ms and the last sham pulse was delivered 33 ms before the visual target onset. To isolate the
frequency-specific structure of the rhythmic sham TMS pattern, we also tested the impact of
random sham TMS/TMS-like sounds patterns wherein the onset time of the 1st and 4th TMS/sound
pulses were kept identical as in the rhythmic pattern but the onset times of the two middle pulses
were randomly jittered (see Chanes et al., 2013; Quentin et al., 2015; Vernet et al., 2019). To be
sure that the randomization would never reproduce a 30 Hz regular burst, the onset timings of the
two jittered pulses were shifted at least 3 ms away from their 30 Hz rhythmic timings. Moreover,
in order to leave enough time for TMS capacitors to fully recharge before delivering each active
sham TMS pulse, inter-pulse interval was at least 20 ms long. In sum, both sham TMS/TMS-like
sound random patterns were designed to produce a sound of the same duration as those delivered
by the rhythmic pattern but avoiding the repetitive structure that could entrain pure high-beta
cortical oscillations, as reported for active rhythmic TMS (Vernet et al., 2019).
We also tested the delivery of single pulses of sham TMS/TMS-like sound 133 ms before
the target onset (the timing of the first pulse in the rhythmic and random sham bursts). Such a single

239
TMS/TMS-like sound pulse was added to our experiment to evaluate the perceptual and EEG
effects of a single sound, this time completely devoid of any time-frequency components,
mimicking previous active TMS studies which used single active TMS pulses to modulate
conscious visual perception (Chanes et al., 2012).
Experimental sessions
Participants performed 2 experimental sessions separated by at least 48 hours. On the 1st
experimental session, sham TMS patterns were delivered using a classical sham approach with
active TMS pulses delivered with the coil placed perpendicular to the curvature of the skull (sham
procedure #1). During the 2nd session, sham TMS-like sound patterns were delivered using a
speaker taped to the TMS coil (sham procedure #2) playing an average audio recording of TMS
clicking noises. Importantly, participants were kept naïve as to the purpose of the experiment and
they were told that they would receive active TMS.
On each of the two experimental sessions, participants performed 5 experimental blocks: a
titration block, a familiarization block and three evaluation blocks (one for each TMS/TMS-like
sound pattern tested). The experiment started with a titration block to determine the visual target
contrast threshold for which participants detected 50% of the Gabor stimuli. During the titration
block participants received no sham TMS or TMS-like sound stimulation. The titration block was
followed by a training block in which sham stimulation, either sham TMS pulses (Session 1: sham
procedure #1) or TMS like sound-pulses (Session 2: sham procedure #2) was introduced in half of
the trials. Participants were given a chance to get used to sham stimulation and were told to ignore
the loud clicking sound and remain focused on the challenging conscious visual detection task they
were required to perform. The training block consisted in short sub-blocks of 20 trials. The order
of trials (leftward target, rightward target or no-target trial) and sham conditions (sham TMS/TMS-
like sound vs. no sham TMS/no TMS-like sound) were randomized for each sub-block. At the end
of each sub-block the participants received some feedback about their performance. When their

240
false alarm rate was higher than 50%, participants were reminded to press the space bar if they had
not seen a target. Additionally, participants received on the screen information on the percentage
of incorrectly reported target positions and incorrectly fixated trials. Once the experimenter was
sure that participants had understood the task and showed stable performance, the evaluation blocks
started. The order of these three blocks within each session was counterbalanced across
participants. Each of the evaluation blocks consisted in 10 sub-blocks (20 trials per sub-block, for
a total of 200 trials) identical to those used for training, except that participants were provided
feedback and were allowed to take a short break every two sub-blocks.
Once the two experimental sessions were completed, we systematically debriefed with the
participants and inquired on their beliefs on the kind of stimulation they had received. To this
regard, 6 out of 11 participants were able to correctly guess that they had received sham stimulation.
All of them were able to notice that the single pulse TMS/TMS-sound pattern was different than
the 4-pulse rhythmic or random patterns, but the rhythmic and random patterns could not be
identified as different. None of them declared to have been aware of the existence of two different
sham procedures tested across two sessions.
Combined scalp EEG recordings
The EEG signals recorded during sham TMS/TMS like-sound trials and no-stimulation
trials was continuously recorded from 60 scalp electrodes at a sampling rate of 5000 Hz with a
TMS-compatible system (BrainAmp DC and BrainVision Recording Software, BrainProducts
GmbH). The reference electrode was placed on the tip of the nose and the ground on the left
earlobe. EOG signals were recorded from 4 additional electrodes positioned at the left and right
temple and above and below the left eye. Throughout the experiment impedances were kept below
5 kOhms.

241
EEG data cleaning
EEG data processing was performed with the FieldTrip toolbox (Oostenveld et al., 2011)
running on MATLAB R2017b. For analyses, EEG and EOG data were epoched in a [-2 2] s window
centered on visual target onset. All trials were visually inspected and any trial containing eye blinks
or muscle activity, trials on which fixation requirements had been violated or the very few trials in
which sham TMS pulses had not been triggered with the exact expected timings, were excluded
from further analyses.
The active magnetic pulses delivered away from the scalp during the Sham TMS session
(i.e. sham procedure #1 delivering active pulses through a TMS coil in a classical 90o sham
configuration) induced short lasting high amplitude artifacts on EEG recordings. As done
elsewhere (Thut et al., 2011; Vernet et al., 2019), stimulation artifacts were eliminated by cutting
off artifacted EEG data within a [-4 12] ms window around the onset of each pulse and interpolating
this period with a shape-preserving piecewise cubic interpolation.
For trials using TMS-like sound sham stimulation (i.e. sham procedure #2 delivering
recorded clicking sounds, through a speaker mounted on a TMS coil placed in the same sham
configuration as the former) no stimulation artifacts were generated on EEG signals. Nonetheless,
in order to make the data of both sham procedures (#1 and #2) comparable, a similar period of EEG
around TMS-like sound pulse onset was also removed and the signal in this same period was
interpolated using the exact same procedure reported above for sham procedure #1.
In order to implement a data cleaning procedure identical to the one used for the two 4-
pulse patterns (rhythmic, random), for sham TMS single pulses and allow comparability, we
removed and interpolated EEG signal using the same procedure describe above, not only around
the TMS/TMS-like sound pulse onset, but also in three additional windows corresponding to the
onset of pulses in the high-beta rhythmic condition. Finally, in no-sham TMS/TMS-like sound
trials (in which no sham pulse was delivered), we implemented the same cleaning procedure
described above for rhythmic and random sham TMS trials. In sum, to make sure artifact

242
removal/interpolation procedures did not introduce additional artifacts into EEG signal and ensure
a fair comparison between pairs of conditions, all sham TMS/TMS-like sound trials and also non
TMS/TMS-like sound simulation trials underwent exactly the same artifact removal and data
cleaning procedure.
EEG signals were down-sampled to 500 Hz and trials from all experimental blocks in each
respective sessions (sham procedure #1 and #2) were gathered together. Two separate ICA were
performed on the datasets of each experimental session. We removed independent components
corresponding to residual artifacts from the active TMS magnetic field not removed during data
interpolation as well as eye movement artifacts, electrode malfunction and 50 Hz land noise
interferences. Artifactual components were identified following guidelines by Rogash et al. (2014).
On average 7±3 components were removed. After ICA cleaning, each dataset was separated into 6
conditions: sham rhythmic TMS/TMS-like sound trials, sham random TMS/TMS-like sound trials
and sham single pulse TMS/TMS-like sound trials were paired with no sham TMS/TMS-like sound
stimulation trials randomly interleaved within the same block. After the complete cleaning
procedure, a mean of 85±10 trials (from a total of 100 recorded trials) remained for each given
condition.
EEG data analyses
To estimate the magnitude and topographic distribution of cortical oscillatory activity
elicited by sham stimulation, EEG signal in a [-500 500] time window centered on visual target
onset were transformed into the time-frequency domain using a 3-cycle Morlet wavelet analysis
for frequencies between 6 and 50 Hz. We assessed local oscillatory synchronization with measures
of Power and Inter-Trial Coherence (ITC), a measure of trial-to-trial phase alignment. Power was
expressed in decibels (dB) relative to a baseline window of 3 oscillation cycles prior to cue onset
(-233 ms before visual target onset).

243
We also measured the auditory Event-Related Potentials (ERPs) evoked by sham TMS and
TMS-like sound stimulation. To this end, EEG signals were re-referenced to the averaged mastoid,
low-pass filtered below 30 Hz and baseline corrected with the [-1 -0.3] second window before
visual target onset, before being averaged over trials. Our analyses focused on ERPs time-locked
to the onset of sham TMS/TMS-like sounds recorded by the Cz (vertex) EEG electrode.
Behavioral data analysis
According to participant responses, trials from the visual detection task were classified in
different categories. For trials in which a target was presented, participants could either correctly
report the presence and the location of the target (trials classified as ‘hits’) or report not having
seen the target (trials classified as ‘misses’). There is also the possibility that participants could
correctly report having seen a target but indicate the wrong location for it. These trials were
classified as ‘errors’ and excluded from analysis because it was impossible to determine if
participants had correctly seen the target but pressed the wrong button to report its location or had
seen a target in a location where no visual target was displayed. On catch trials where no target was
presented, participants could correctly report that no target was present (‘correct rejection’ trials)
or report to have seen a target that was not there (‘false alarms’ trials).
From the percentage of ‘hits’ and ‘false alarms’, the Signal Detection Theory (Green &
Swets, 1966; Stanislaw & Todorov, 1999) extracted two complementary sets of measures. First,
we computed the perceptual sensitivity (d’) which is a bias free measure of how well the participant
is able to detect the presence of the target from noise. Then, we computed the decision criterion (c)
and the likelihood ratio (b), both measures of the subjective response biases shown by participants.
Participants can display either a ‘liberal’ behavior meaning they are more likely to report having
seen a target in situation where they are unsure, or show a ‘conservative’ behavior, in which they
will more often respond not having seen the visual target except in trials in which they are very

244
confident about where a target was present on the screen. These outcome measures were calculated
as follows:
�# =�'((�) −�'((��), � = − (: 2�'((�) +�'((��)4 and � = exp ghij(k)l'hij(mn)l: o
where �'( is the inverse of the normal cumulative distribution function, His the percentage of
‘hit’ trials and FAis the percentage of ‘false alarms’ trials. To avoid infinite values, we corrected
any percentages of 0 to (:? and percentages 1 to 1 − (
:? where N is number of trials on which the
percentage is calculated (Macmillan & Creelman, 2004).
Statistical analyses
We first analyzed data from the first experimental session, where sham TMS was delivered
classically through a TMS coil placed perpendicular to the scalp (sham procedure #1). On the
behavioral outcome measures (d’, c and b), we performed three 2x2x3 repeated-measure ANOVA
with factors Visual Field (left, right target), Sham Pattern (rhythmic, random, single pulse) and
Stimulation Condition (sham stimulation, no stimulation).
For all outcome measures on EEG data, we first compared, for each pattern separately,
sham stimulation trials to no stimulation trials. Then, we compared the sham stimulation trials
directly between patterns, by pairs. ERP waveforms were compared with two-tailed paired
Student’s t-test computed for each time point in the [-200 400] ms window centered on target onset.
On time-frequency data, we first compared topographical maps of power and ITC for high-beta
frequencies ([25 35] Hz) for the duration of sham stimulation ([-133 0] ms, centered on target
onset), then we compared time-frequency maps across frequencies [6 45] Hz and [-300 200] ms
time window, at the electrode FCz, which was selected as electrode of interest because it exhibited
maximal high-beta power and ITC in the topographical maps. All two-by-two comparisons were
performed with two-tailed paired Student’s t-test computed for each electrode on topographical
maps and for each time-frequency point on time-frequency maps.

245
In a second step, we compared data from the two experimental sessions, where sham
stimulation was delivered with different techniques. A first 2x2x3 repeated measure ANOVA was
performed on trials with sham stimulation during each experimental session (sham procedure #1
and sham procedure #2) with factors Sham procedure (Sham TMS, i.e. coil at 90o orientation, and
TMS-like sounds delivered via a speaker), Visual Field (left, right) and Sham Pattern (rhythmic,
random, single pulse). Second, on data from the sham procedure #2, we performed the same 2x2x3
repeated-measure ANOVA with factors Visual Field (left, right), Sham Pattern (rhythmic, random,
single pulse) and Stimulation Condition (sham stimulation, no stimulation) that was performed on
data from the first experimental session. The two ANOVAs were performed on each behavioral
outcome measure (d’, c and b).
On EEG data, we first compared ERP waveforms data from the sham procedure #2 session
between sham stimulation (TMS-like sound) and no stimulation (no TMS-like sound) trials for
each sham TMS pattern. We then compared directly, again for each sham TMS pattern separately,
ERP waveforms for sham stimulation trials from sham procedure #1 session (sham TMS pulses
delivered via a 90° TMS coil) to sham stimulation trials in the sham procedure #2 session (TMS-
like sounds delivered with a speaker). ERP waveforms were compared with two-tailed paired
Student’s t-test computed for each time point in the [-200 400] ms window centered on target onset.
For time-frequency spectral analyses, we compared sham stimulation trials for each TMS
pattern between the Sham procedures #1 and #2 sessions. For measures of power and ITC, we
compared topographical maps for frequencies [25 35] Hz, recorded during sham stimulation ([-133
0] ms, centered on target onset). We then compared time-frequency maps across frequencies [6 45]
Hz and the [-300 200] ms time window, for electrode FCz. Pairwise comparisons were performed
with two-tailed paired Student’s t-test computed for each electrode and time-frequency point.
For all statistical tests performed on scalp EEG data, we corrected for multiple comparisons
with cluster-based permutation tests. All neighboring electrodes or time-frequency points that
exceeded the significance threshold (alpha = 0.01) in the paired t-tests were clustered together and

246
the sum of the T-statistic for all points in the cluster was used as the statistic of the cluster. A
permutation test (10000 permutations, Montecarlo sampling method, alpha = 0.05) was performed
on the clusters. Cluster-based permutation is a method of correction for multiple comparisons that
is well suited to EEG because these signals are highly correlated in space and time (i.e. an effect
spreads over adjacent sensors and lasts over several time points). Cluster-based permutations
correct very well for false positives and ensure a minimal chance of false negatives (Maris &
Oostenveld, 2007). Unfortunately, no agreement exists with regards to data permutation methods
in the case of interaction effects in a factorial design (Edgington & Onghena, 2007; Suckling &
Bullmore, 2004) therefore we chose to compute pairwise comparisons between our conditions.

247
Results
Modulation of conscious visual detection performance
Visual detection performance for near-threshold targets following a sham TMS coil placed
perpendicular to the scalp (sham procedure #1) was evaluated with perceptual sensitivity (d’) and
subjective decision-making (decision criterion, c and likelihood ratio, b). The 2x2x3 repeated-
measure ANOVAs with within-subject factors Visual Field (left, right), Stimulation Condition
(sham stimulation, no stimulation) and Stimulation Pattern (rhythmic, random, single pulse)
performed on the above-mentioned outcome measures revealed a main effect of Visual Field for
perceptual sensitivity (d’) (F(1,10)=9.781, MSE=0.544, p<0.005) and decision criterion (c)
(F(1,10)=16.706, MSE =0.177, p<0.001). This result indicates that, independently of stimulation
condition, participants perceived right visual field targets better that left ones and they also showed
a more liberal behavior for right right lateralized Gabors (Fig 2A and B).
Figure 2. Impact of sham stimulation on
measures of conscious visual detection
performances. Group averages (± standard
errors) for (A) perceptual sensitivity (d’)
and (B) decision criterion (c) corresponding
to trials delivering sham stimulation over
the FC2 electrode with a 90o sham coil
configuration (sham procedure #1) (red
columns) and trials with no sham
stimulation (blue columns). Data is
presented for each sham TMS pattern
(rhythmic, random and single pulse TMS)
and for left or right visual field targets. For
all sham TMS patterns, sham stimulation
delivered prior to target onset lowered
decision criterion (c) (significant main
effect of stimulation condition) but had no
effect on perceptual sensitivity (d’).

248
No effects of the stimulation condition or stimulation pattern were found for perceptual
sensitivity (main effect of sham condition: F(1,10)=0.12, MSE = 0.544, p = 0.73 ; main effect of
sham pattern F(2,10)= 1.181, MSE=0.544, p=0.31 ; interaction F(2,10)=1.032, MSE=0.544,
p=0.359) (Fig. 2A). However, the subjective decision criterion of our participants was modulated
by sham stimulation. Our data reveal a significant main effect of sham condition on the response
criterion (F(1,10)=4.254, MSE=0.177, p<0.05). The decision criterion was lowered when sham
stimulation preceded a visual target, or, in other words, participants were more likely to respond
that they saw a target (more liberal) when the apparition of the target was preceded by a loud
clicking sound (Fig 2B). This effect was not specific to the sham pattern delivered as no effects of
the sham pattern were found on decision criterion (c) (main effect: F(2,10)=0.1, MSE=0.177,
p=0.905, interaction between sham condition and sham pattern: F(2,10)=0.012, MSE=0.177,
p=0.988). The ANOVA on the likelihood ratio (b) revealed no effect of any of the factors (all
p>0.1).
Our results suggest that sham stimulation does not modulate the perception of visual targets
but affects subjective decision-making processes lowering the decision criterion of participants
(i.e., participants became more liberal or less conservative).
Auditory event related potential
On the electrophysiological signal, all sham stimulation patterns delivered through a TMS
coil placed perpendicular to the scalp (sham procedure #1) elicited clear auditory evoked potentials.
Comparisons of the EEG waveforms phase-locked to sham stimulation onset at the vertex electrode
(Cz) revealed a significant positive deflection during sham trials compared to trials without
stimulation for all three patterns tested (Fig. 3A). This significant positive deflection started about
140 ms post sham stimulation onset and lasted ~250 ms with two peaks at 150 and 300 ms post
stimulation onset. The shape of this evoked potential showed no difference when comparing sham
trials directly between the patterns (Fig. 3B). These results indicate that the loud clicking sound of

249
the TMS produces a clear auditory evoked potential, which was modulated neither by the frequency
content nor the length of the sham burst.
Figure 3. Auditory evoked potentials elicited by sham TMS patterns. (A) Evoked potentials elicited by
rhythmic, random and single pulse sham TMS (sham procedure #1: TMS pulses delivered with a 90o sham
configuration) (red solid line) compared to no-stimulation trials (blue solid line). (B) Two-by-two
comparisons of auditory evoked potentials across sham TMS patterns: rhythmic (red solid line), random
(blue solid line) and single pulse (green solid line). Evoked potentials correspond to recordings from
electrode Cz, referenced to both mastoids. Time is centered on visual target onset (dotted gray vertical line).
Red dotted vertical lines signal the onset of sham stimulation patterns (the 1st pulse of rhythmic and random
TMS patterns or single pulse). The width of the vertical red dotted lines indicates the duration of the sham
stimulation (rhythmic and random patterns lasted for 100 ms). Colored shaded areas indicate 95%
confidence intervals for evoked potential amplitude. Grey shaded areas represent time points showing
significant differences in evoked potential amplitude between compared conditions or patterns (cluster-
based permutation tests, a=0.05). Notice in panel A (top) the significantly more positive deflection for
evoked potentials in sham compared to no stimulation trials. The shape of this positive deflection was (panel
B) identical for the 3 tested sham patterns.

250
Figure 4. Influence of sham stimulation on high-beta power EEG activity. Topographical maps
displaying the distribution of spectral power in the high-beta [25 35] Hz band during the delivery of the
sham stimulation patterns (sham procedure #1: TMS pulses delivered with a 90o sham configuration) (time
window [-133 0] ms centered on visual target onset). The bottom row shows pairwise (Sham TMS vs. No
stimulation) cluster-based statistical permutation tests for each tested sham TMS pattern, however, notice
that none of the electrodes reached significance (p<0.05) in any of the comparisons. None of the sham
patterns (including the sham 30 Hz rhythmic patterns) showed increases of high-beta power on scalp EEG
electrodes.
Auditory entrainment of high-beta oscillations
In the time-frequency domain, we investigated the impact of sham stimulation on cortical
oscillatory signatures. More specifically, we explored signatures of auditory entrainment at the
frequency of the burst by 30 Hz rhythmic patterns of sham stimulation. None of the sham patterns
tested increased high beta ([25 35] Hz) power during the delivery of sham stimulation compared
to trials without stimulation (Fig. 4). However, the degree of trial-to-trial phase alignment in the
high-beta band, computed with Inter-Trial Coherence (ITC), was significantly increased during the
delivery of sham stimulation compared to trials without stimulation. This effect is observed for the
three sham stimulation patterns and was maximal at electrode FCz (Fig 5A).

251
Figure 5. Phase-locking of high-beta oscillations during sham stimulation. Topographical maps
displaying the distribution of inter-trial coherence (ITC) within the [25 35] Hz frequency band during sham
stimulation (sham procedure #1: TMS pulses delivered with a 90o sham configuration) (time window [-133
0] ms centered on visual target onset). (A) Sham TMS and no sham stimulation ITC topographies for
rhythmic, random and single pulse sham patterns. The bottom row displays the results of the cluster-based
statistical permutation tests. Bolded dots represent clusters of EEG electrodes showing significant statistical
differences between sham TMS vs. no sham stimulation for each pattern (p<0.05). (B) Direct comparisons
of ITC topographies between sham rhythmic pattern and the random and single pulse patterns. Black and
white topographic maps display the outcomes of cluster-based statistical permutation tests. Bolded
electrodes identify clusters of electrodes that reached significance (p<0.05). Notice that the three sham
patterns significantly increased high-beta ITC. This increase was distributed more widely over the scalp
during single pulses of sham TMS stimulation compared to rhythmic sham high-beta (30 Hz) stimulation.
A direct comparison between rhythmic sham patterns and the two control patterns which
either did not contain a specific frequency (random pattern) or had no rhythmic structure at all
(single pulse pattern) showed that increases in high-beta phase-locking was more widespread over
the scalp for single sham pulse pattern, extending over right parietal electrodes (Fig. 5B). This
significant high-beta phase-locking in response to all patterns (irrespective of the rhythmic
structure of the pattern) suggests that this was not driven by auditory entrainment at the frequency
of the sham stimulation burst.

252
Sound-triggered oscillatory phase-locking
The specificity of this oscillatory phase-locking to the high-beta band was further
investigated on time-frequency maps for ITC at electrode FCz (the sensor on the topographical
maps in which the ITC reached maximal levels, Fig 5A). Figure 6 shows that the increase of ITC
during sham stimulation compared to trials without stimulation is not specific to a high-beta
frequency band. Indeed, time-frequency analyses shows a maximal increase of ITC in the high-
theta to low-beta bands, whereas statistical analyses reveal significant transient increase of ITC
130 ms post sham stimulation onset in a wide-band frequency band (15 to 42 Hz) for the single
pulse sham condition.
Figure 6. Spectral phase-locking modulations by sham stimulation patterns. Time-frequency maps
representing inter-trial coherence (ITC) on EEG electrode FCz (in which high-beta ITC was the strongest).
The time line is centered on the onset of the visual target (dotted gray vertical line). Red dotted vertical lines
signal the 1st pulse of sham stimulation patterns. The width of the vertical red dotted lines indicates the
length of the sham burst (sham rhythmic and random patterns span 100 ms between first and last pulse).
Horizontal black dotted lines indicate frequency of stimulation for rhythmic high-beta sham pattern (30 Hz).
The bottom row shows cluster-based statistical permutation tests, in which black areas label time-frequency
clusters for which the ITC differences between Sham TMS (sham procedure #1: TMS pulses delivered with
a 90o sham configuration) and no stimulation condition reached statistical significance (p<0.05). Notice that
single pulse sham stimulation increased inter-trial coherence in a broad frequency band between 15 and 42
Hz.

253
No significant differences in ITC were found for direct comparisons of time-frequency
maps between sham patterns. It is interesting to notice, however, that the significant high-beta
phase-locking observed on ITC topographical maps (Fig. 5A) for the rhythmic and random
stimulation patterns did not reach significance on the time-frequency maps (Fig. 6).
In sum, time-frequency analyses yielded significant oscillatory phase-locking over central
electrodes following sham stimulation. This phase-locking is non-specific, broad-band and not
driven by the rhythmic structure of the different sham stimulation patterns tested.
Impact of Sham Procedure
An experimental session was performed on the same group of participants with sham
stimulation delivered through a speaker taped on a TMS coil placed above the scalp playing a
recorded TMS sound (sham procedure #2: TMS-like sounds). Behavioral performance during trials
with sham stimulation delivered through a speaker was compared to performance in the
experimental session with sham TMS delivered through a TMS coil placed perpendicular to the
scalp (sham procedure #1: Sham TMS pulses).
A 2x2x3 repeated-measure ANOVA with within-subjects factors Sham Procedure (TMS
coil, audio speaker), Visual Field (left, right) and Sham Pattern (rhythmic, random, single pulse)
revealed no main effect of Sham Procedure on perceptual sensitivity (d’) (F(1,10)=0.464,
MSE=0.586, p=0.497), decision criterion (c) (F(1,10)=1.086, MSE=0.169, p=0.299) or likelihood
ratio (b) (F(1,10)=0.087, MSE=4.864, p=0.768) (Fig. 7, results on b not shown). Only main effects
of Visual Field for d’ (F(1,10)=6.276, MSE=0.586, p<0.01) and c (F(1,10)=17.001, MSE=0.169,
p<0.001) reached significance, indicating higher perceptual sensitivity and lower decision criterion
(participants were more liberal or less conservative) for right compared to left visual targets.
Additionally, when applying the same 2x2x3 repeated-measure ANOVA with factors
Visual Field (left, right), Stimulation Condition (sham stimulation, no stimulation) and Stimulation
Pattern (rhythmic, random, single pulse) on the dataset with sham delivered through an audio

254
speaker, we found all the above-reported effects on the dataset generated by sham procedure #1,
namely a significant main effect of Visual Field for d’ (F(1,10)=4.621, MSE=0.648, p<0.05) and c
(F(1,10)=15.053, MSE=0.181, p<0.001) as well as a significant main effect of Sham Condition on
decision criterion (c) (F(1,10)=5.408, MSE=0.181, p<0.05).
Figure 7. Specific impact of sham procedure #1 (TMS pulses with a 90o coil) vs. sham procedure #2
(TMS-like sounds via a speaker) on conscious visual detection outcomes. Group averages (± standard
errors) of perceptual sensitivity (A) and decision criterion (B) corresponding to trials delivering sham
stimulation over the right FEF (EEG coordinate FC2) using sham procedure #1: active TMS pulses delivered
with a sham coil angled perpendicular to the curvature of the scalp (red columns) or sham procedure #2:
recorded TMS-like sounds played via a speaker (blue columns). Data is presented for each sham TMS
pattern (rhythmic, random and single pulse TMS) and for left or right visual field targets. Note that the type
of sham TMS approach had no effect on visual detection performance, leading to the conclusion that they
could be used indistinctively.

255
On electrophysiological recordings, sham stimulation delivered through a speaker (sham
procedure #2) elicited a clear auditory evoked potential (Fig. 8A) with a similar amplitude as the
potentials recorded following sham stimulation delivered through a TMS coil (sham procedure #1)
(Fig. 8B). Only for single sham pulses, the early negative deflection of the evoked potential showed
significant differences between the two sham procedures (Fig. 8B, graph on the far right).
Figure 8. Specific impact of sham procedure #1 (TMS pulses with a 90o coil) vs. sham procedure #2
(TMS-like sound via a speaker) on auditory evoked potentials. (A) Evoked potentials elicited by the
three sham TMS patterns (rhythmic, random, single pulse, red solid lines) delivered using sham procedure
#2 (i.e., TMS-like sound played via a speaker) compared to embedded no stimulation trials (blue solid lines).
(B) Direct comparisons of auditory evoked potentials elicited by sham TMS patterns comparing sham
procedure #1: Active TMS pulses with a 90o sham coil configuration (red solid lines) with sham procedure
#2: recorded TMS-like sounds played via a speaker (blue solid lines). The time line is centered on visual
target onset (dotted gray vertical line). Red dotted vertical lines signal the onset of sham stimulation patterns
(the 1st pulse of rhythmic and random TMS patterns or single pulse). The width of the vertical red dotted
lines indicates the length of the sham burst (sham rhythmic and random patterns span 100 ms between first
and last pulse). Colored shaded areas indicate 95% confidence intervals for evoked potential amplitude.
Grey shaded areas represent time points showing significant differences in evoked potential amplitude
between compared conditions for each sham patterns tested (cluster-based permutation tests, a=0.05). Note
that evoked potentials by sham procedure #2 were very similar to those of sham procedure #1. The single
noted difference is the higher amplitude and longer latency of the early negative deflection for the former
than the latter.

256
The early negative deflection during sham pulses delivered through an audio speaker (sham
procedure #2) showed an increased amplitude and later latency compared to trials with single sham
pulses delivered through a TMS coil (sham procedure #1).
In the time-frequency domain, the sham procedure (#1 or #2) had no effect on high beta
oscillations. Topographical maps for power or ITC at the high-beta frequency during the delivery
of sham stimulation, showed no difference between the two sham procedures (not pictured).
However, a detailed comparison of ITC maps for electrode FCz between sham procedures revealed
stronger phase-locking of high-theta to alpha band oscillations for sham procedure #2 for rhythmic
and random sham patterns (Fig. 9).
Figure 9. Impact of sham procedure #1 (TMS with a 90o coil) vs. sham procedure #2 (TMS-like sound
via speaker) on oscillatory phase-locking. Time-frequency maps representing inter-trial coherence (ITC)
at EEG electrode FCz (in which high-beta ITC was the strongest). Comparison across sham patterns
(rhythmic, random and single pulse) delivered by sham procedure #1 (active TMS pulses with a 90o sham
coil configuration) and sham procedure #2 (recorded TMS-like sound played via a speaker). The time line
is centered on the onset of the visual target (dotted gray vertical line). Red dotted vertical lines signal the 1st
pulse of sham stimulation patterns. The width of the vertical red dotted lines indicates the length of the sham
burst (sham rhythmic and random patterns span 100 ms between first and last pulse). Horizontal black dotted
lines indicate frequency of stimulation for rhythmic sham TMS pattern (30 Hz). The bottom row shows
outcomes of cluster-based statistical permutation tests in which black areas label time-frequency clusters
for which ITC difference between Sham Procedures #1 and #2 reached statistical significance (p<0.05).
Note that recorded TMS-like sounds of rhythmic and random sham patterns delivered through a speaker
phase-locked low-frequency (high theta and alpha oscillations) more strongly than TMS sounds delivered
through a TMS coil.

257
Our audio recordings dubbing the clicking sound of TMS pulses with a speaker mounted
on the TMS coil (sham procedure #2), appears to generally reproduce the effects of active pulses
delivered with the TMS coil in a sham position (sham procedure #1). Indeed, both techniques
showed identical effects on visual perception performance and subjective decision in a visual
detection task with near-threshold Gabors. The auditory potentials evoked by both clicking sounds
were of similar amplitude, except for the early negative deflection following single pulses of TMS-
like sound (sham procedure #2) which showed increased amplitude compared to sham TMS pulses
(sham procedure #1). The main difference between the two sham procedures tested in our study
was that for sham bursts (either rhythmic or random), a train of TMS-like sounds delivered through
a speaker phase-locked slow oscillations (theta to alpha band) in central scalp locations associated
to signal from auditory regions more strongly than equivalent sham TMS bursts.

258
Discussion
Our study attempted for the first time to tease apart the influence of sham rhythmic and
random TMS bursts and single sham TMS pulses on behavioral performance and
electrophysiological correlates during a conscious visual detection task with near-threshold stimuli.
We show that sham stimulation delivered prior to a visual target shifts participant’s decision
criterion to report or not as ‘seen’ a target displayed at 50% visibility. When the target onset was
preceded by the loud clicking associated with TMS delivery (produced either with a sham pulse or
with recorded TMS-like sounds) participants became more liberal or, said otherwise, a lower level
of visual saliency (lower evidence or lower information) was required for participants to
acknowledge that a target had been present. Importantly, our outcomes did not show any significant
effect of sham stimulation patterns on visual perception nor on the detection of ipsilateral vs.
contralateral targets with regards to stimulated hemisphere.
Scalp EEG recordings performed concurrently show that sham TMS elicited auditory
evoked potential in central scalp electrodes. Nonetheless, surprisingly, those were highly
unspecific, that is, they were not significantly modulated in latency or amplitude by patterns of
sham TMS varying in length (single pulse vs. 4-pulse rhythmic or random trains) or frequency
structure (rhythmic vs random 4-pulse bursts). In the time-frequency domain, all procedures of
sham stimulation induced a phase-resetting of cortical oscillators. This phenomenon was observed
for all sham patterns for the high-beta band. Nonetheless, it was more robust, wider spread over
scalp electrodes and broader-band (from beta to low gamma) in response to sham single pulses
than rhythmic or random sham stimulation bursts.
Modulation of visual detection response bias
Using a visual detection task very similar to ours, a prior study (Duecker & Sack, 2013)
showed that single sham TMS pulses preceding a visual target decreased reaction times for correct
target detection trials (vs. a no sham TMS condition). This finding converged with prior evidence

259
from the cross-modal sensory modulation literature showing that a concurrent sound, preceding or
following a visual target, leads to higher performance and faster reaction times acknowledging the
presence of visual targets (Bernstein et al. 1969; Spence and Driver 1997; Kusnir et al. 2011).
These authors concluded that single sham TMS pulses acted as a warning signal facilitating visual
detection. Nonetheless, increases of performance and/or decreases in reaction times cannot be taken
as proof of improved perception and might be caused by changes in decision criterion (Bolognini
et al. 2005; Lippert et al. 2007). In our study, participants were not asked to provide answers as fast
as possible, but instead to prioritize accuracy over speed. Moreover, we employed Signal Detection
Theory (SDT) outcome measures to dissociate influences of sham stimulation on visual salience
and sensitivity (d’) vs. later processes tied to decision-making (c or b).
Thanks to such differences, our study is now able to nuance and extend the prior reports by
Duecker and Sack (2013) and show that the loud clicking sounds tied to lateralized TMS (generated
either with sham TMS or with TMS-like sounds recorded and played) do not modulate perceptual
sensitivity outcomes (d’) but affect decision-making criterion (c) rendering participants less
conservative. Cross-modal influences of response biases in absence of any effect on visual
performance correlates (in our case d’) has been extensively reported in prior studies (Frassinetti
et al. 2002; Bolognini et al. 2005; Odgaard et al. 2003) and attributed to general phasic alerting in
response to a non-spatially predictive (hence not informative) sound that acts as a warning signal
(Kusnir et al., 2011; Robertson et al., 1998).
To evaluate subjective response bias, two measures of the Signal Detection Theory
framework were used: decision criterion (c) and likelihood ratio (b). While we demonstrated a
modulation of the decision criterion by sham stimulation patterns, we were unable to show any
modulation of the likelihood ratio. These two measures differ in their relationship to the measure
of perceptual sensitivity (d’). While the decision criterion is independent from d’, likelihood ratio
is not (Ingham, 1970), making the former a more sensitive measure to detect changes in subjective
response bias, particularly in the absence of changes of perceptual sensitivity, as is the case in our

260
study. Overall, decision criterion (c) is recommended as a better measure of response bias
(Macmillan & Creelman, 1990).
Sham TMS and orientation of spatial attention
In addition to a general alerting effect facilitating visual detection accuracy, Duecker and
Sack also reported a significant impact of coil position on detection reaction times, showing faster
responses for ipsilateral visual targets (same hemifield as the sham TMS-stimulated hemisphere)
compared to contralateral targets (Duecker & Sack, 2013). They concluded that the lateralized
sham TMS sounds prompted the orientation of spatial attention towards the hemispace
corresponding to the side of the head where sham TMS was delivered, speeding up the localization
of sensory targets in visual modalities.
Surprisingly, our analyses failed to replicate this effect. This outcome speaks in favor of a
rather weak or null influence of TMS sound on lateralized visual facilitation effects reported in
prior studies by our group either with single pulses (Chanes et al., 2012) or with rhythmic active
TMS bursts (Chanes et al., 2013, 2015; Quentin et al., 2015; Vernet et al., 2019). Indeed, we failed
to find a significant interaction between sham condition (sham TMS either with sham procedure
#1 or #2 and no sham stimulation) and visual field for detection sensitivity (d’) or response bias
measures such as the likelihood ratio (b) used in the above-cited studies.
Our results showed significant differences of visual sensitivity (d’) and response criterion
(c) between right and left targets, with better perceptual sensitivity and a more liberal decision
criterion for right (ipsilateral to the stimulated hemisphere) than left targets (contralateral to the
stimulated hemisphere). Nonetheless, these right vs left visual detection sensitivity differences,
previously reported (Chanes et al. 2013, 2015, Vernet et al. 2019), are not related to sham
stimulation since they were not only observed across sham stimulation patterns but were also found
in no sham stimulation trials.

261
Prior literature on cross-modal attention orienting has argued that a sound can improve the
processing of visual targets (Bolognini et al. 2005; Frassinetti et al. 2002; Lippert et al. 2007) and
orient spatial attention (McDonald et al. 2000; Spence and Driver 1997). However, such
modulatory effects were shown only if the sound was spatially and/or temporally predictive of the
visual target location and/or onset. This cross-modal modulatory effect has been shown to dissipate
when the sound is redundant with another cue already alerting on target onset (Lippert et al. 2007;
Kusnir et al. 2011). At difference with Duecker and Sack (2013), our visual detection paradigm
showed an alerting central visual cue (fixation cross became larger) prior to sham stimulation
(either sham TMS or TMS-like sound) and target onset. Hence it is possible that either procedure
delivering TMS sound became redundant in predicting target onset, cancelling their potential
modulatory effect on visual attention and visual detection. This difference, albeit apparently minor,
could explain why the study by Duecker and Sack (2013) yielded a difference in ipsilateral vs.
contralateral detection performance, which our data did not find.
Impact of sham TMS on cortical oscillatory activity
As a novel contribution with regards to prior attempts to study sham TMS effects, we here
recorded and analyzed scalp EEG activity tied to the different types of sham TMS patterns. We
failed to find any evidence throughout scalp electrodes of entrainment due to the sound of rhythmic
sham TMS bursts at high-beta (30 Hz) frequency compared to no stimulation or to random sham
bursts. This outcome suggests that the contribution of rhythmic TMS sound on previously
described entrainment effects of active 30 Hz TMS patterns on the right FEF and to improvements
of conscious visual perception (see Chanes et al., 2013; Quentin et al., 2015; Vernet et al., 2019)
is at best very limited and unspecific.
The delivery of sham stimulation did increase the phase-locking of high-beta oscillations.
Nonetheless, this increase was not unique to rhythmic sham TMS bursts or rhythmic TMS-like
sounds, and similar phase-locking increases were observed for random sham TMS bursts or single

262
TMS pulses (either in sham procedure #1 or sham procedure #2), which is surprising as none of
the latter patterns contain any repeating high-beta rhythmic structure that could entrain high-beta
oscillations. Further, it could be argued that high-beta phase-locking was stronger for sham single
TMS pulses (or TMS-like single sounds) than sham rhythmic TMS bursts (or TMS-like sound
bursts). Indeed, direct comparison of these two types of patterns showed wider spread scalp
increases of high-beta phase-locking for single pulse than for rhythmic sham stimulation.
Moreover, significant increases of high-beta phase-locking during rhythmic sham patterns
(compared to no sham stimulation) on EEG topographies cancelled out when analyses were
performed on a larger time-frequency window at the scalp electrode showing the peak high-beta
phase-locking (i.e., electrode FCz). This result casts doubt on the robustness of such an effect and
leads us to conclude that, paradoxically, increases of high-beta phase-locking is possibly more
robust in response to the sham single pulses than sham rhythmic stimulation.
The absence of auditory entrainment in scalp EEG recordings following short bursts of
rhythmic sham TMS or TMS-like sound stimulation is surprising, as such rhythmic monaural or
binaural sound patterns are being used for this purpose (Galambos et al., 1981; Picton et al., 2003).
Nonetheless, the auditory streams traditionally used to entrain oscillations are much longer (lasting
a few seconds) than the very short (only 4 pulses, lasting 100 ms) trains delivered in our study to
emulate prior active rhythmic TMS patterns (Chanes et al., 2013; Quentin et al., 2015; Vernet et
al., 2019). Evidence indicates that steady-state auditory responses following rhythmic sounds
develop at a latency of about 80 to 100 ms, and increases monotonically to reach maximum
amplitude only ~200 ms after their onset (Forss et al. 1993; Roß, et al. 2002). Steady-state
responses also vanished quickly a few cycles after the end of the auditory stimulus. Therefore, the
duration of the sham stimulation bursts we applied in our study might have been too short to entrain
cortical oscillations conducted by auditory afferent pathways. We cannot rule out if longer
rhythmic sham TMS or TMS-like sound patterns lasting for several seconds, might entrain
frequency-specific cortical oscillations.

263
Additionally, it has also been suggested that attention modulates the power of the frequency
following steady-state responses, with stronger cortical oscillations at the frequency of the
envelope of an attended auditory pattern and also weaker power at the frequency of the envelope
of a distractor sound stream (Bharadwaj et al. 2014; Kim et al. 2011). This attention effect is
intermodal, hence observed also when attention is directed to a visual task and diverted away from
the auditory modality (Saupe et al., 2009). Asking participants to ignore auditory stimulation to
concentrate instead on the visual task, as we did in this and prior studies (Chanes et al., 2013, 2015;
Quentin et al., 2015; Vernet et al., 2019), could reduce the probability to generate an auditory
steady-state response to rhythmic sham stimulation.
Our phase-reset analyses revealed at least two sets of outcomes, which were unexpected or
contradicted prior reports, and for which we cannot find a clear explanation. Indeed, sham
stimulation did not entrain frequency-specific cortical oscillations reflecting the rhythmic structure
of the bursts delivered. Nonetheless, clicking TMS sounds phase-locked cortical oscillations in a
broad frequency band, spanning from high theta to low gamma. Such a broad-band phase-resetting
of cortical oscillators was significant for single sham pulse but not for any of the periodical bursts,
rhythmic or random. To explain such an unexpected outcome, we here hypothesize that repeated
sham pulses within a burst could periodically phase-reset oscillators several times during a short
time windows, and blur the phase-locking effect of the first sound pulse, especially at burst
frequencies with a period lower than the inter-pulse interval. Nonetheless, this explanation remains
purely speculative and should be further investigated with ad hoc experiments or computer models
and simulations.
Second, the topography of the reported phase-resetting effects was maximal over central
scalp EEG electrodes, hence congruent with activity emerging from the auditory cortex. Prior
studies on the cross-modal effects of auditory stimulation on cortical rhythms have reported phase-
locking also in occipital regions, with a subsequent modulation of visual cortex excitability
(Mercier et al. 2013; Romei et al. 2012) however we failed to show any increases of phase-locking

264
over the occipital electrodes. Differences between the sound patterns used in these studies and the
sham TMS-pulses or recorded TMS-like sounds used in the present study could explain such
differences, and are a reminder of the dependence of phase-resetting effects on the length or
structure of auditory stimuli which requires further investigation.
Recorded TMS-like sounds acting as a sham TMS condition
In the current study we tested two different sham procedures that could be used in embedded
TMS designs, that is designs interleaving randomly active and sham TMS trials within the same
experimental block. On the one hand, we tested an approach that requires the use of two separate
TMS devices, one attached to an active coil targeting a brain region, and a second one attached to
a second TMS coil positioned next to the active TMS coil and angled perpendicularly to the
curvature of the scalp in a classical sham configuration (sham procedure #1). On the other hand,
we developed and tested a less equipment-demanding sham approach (i.e., requiring only a single
TMS machine and a single TMS coil) in which the sham TMS coil was replaced by a speaker
mounted directly on the active coil delivering a recorded TMS-like sound (sham procedure #2).
Both sham procedures showed extremely similar effects on visual detection performance
and scalp EEG correlates, supporting the idea that they can be used indistinctively, hence that sham
procedure #2 requiring a single TMS machine and TMS coil could replace sham procedure #1
requiring two TMS devices. Nonetheless, our results also revealed increased phase-locking for
slow oscillations (high theta to alpha band) for TMS-like sounds delivered through a speaker
compared to classical sham TMS pulses. The waveform and volume of the recorded clicking TMS
sound played through the audio speaker were carefully controlled to reproduce, as accurately as
possible, the sound of the brief magnetic field flowing through the TMS coil. Nonetheless, minor
discrepancies between the original and the recorded TMS sounds could have resulted in such EEG
differences in phase-locking. Sham procedure #2 might need to be further refined to achieve exact
same electrophysiological response than sham stimulation delivered with a TMS coil. Such

265
discrepancy which would over-represent low frequency phase-locking in sham trials occurs at a
spectral range (high-theta to alpha band) which is not directly modulated by high-beta rhythmic vs.
random patterns in active TMS high-beta entrainment studies previously conducted in our team
(Chanes et al., 2013, 2015; Quentin et al., 2015; Vernet et al., 2019).
Nonetheless, sham TMS approaches have been recognized to not be optimal (Duecker &
Sack, 2015) as they are not very successful at blinding participants from stimulation conditions,
particularly when they are exposed to both active and sham TMS stimulation in block designs
(Mennemeier et al., 2009; Rossi et al., 2007). The lack of efficient blinding has been mainly
attributed to a failure of sham stimulation to correctly replicate somatosensory effects of TMS by
direct scalp tapping or via the contraction of scalp muscles (Ilmoniemi & Kičić, 2010).
Additionally, participants may also differentiate sham and active stimulation by noticing changes
in the location of the clicking sound (Mennemeier et al., 2009; Sommer et al., 2006). Indeed, to
avoid coil movement between active and sham TMS trials, double blind studies require an active
and a sham coil to be placed both over the same area of the scalp. However, given the large surface
of standard 70 mm figure-of-eight TMS coils (~14 cm long from loop edge-to-loop edge), their
centers have to be placed several centimeters apart, generating a difference in sound location of
that can be noticed by participants. The use of a speaker mounted on the active TMS coil that plays
sham TMS-like sounds overcomes this limitation and makes the implementation of double-blind
studies with active/sham trials less complex and more affordable.
Conclusion and future directions
Overall, on visual detection performances, we here show that the clicking sounds associated
with TMS generate effects on response bias. Nonetheless, these effects were clearly non-specific
as they were not modulated by visual target location (location relative to stimulated hemisphere)
or by sham TMS pattern type (number of pulses, length or temporal organization). Such an absence
of main effects or interactions of sham TMS sounds with parameters tied to visual stimuli location

266
or sham TMS patterns rules out major contributions of sham TMS sound to previously reported
modulation of visual performance and brain activity correlates for active TMS modulatory (Chanes
et al., 2012) and entrainment (Chanes et al., 2013, 2015; Quentin et al., 2015; Vernet et al., 2019)
studies in the field, which relied on the use of sham procedures as the ones tested here to control
for the potential effects of TMS generated sound.
In spite of such conclusions, the potential impact of single or repetitive sounds on brain
activity and perceptual performance should not be minimized. As indicated previously, a well-
crafted study using a slightly different experimental design demonstrated effects of sham
stimulation on visual detection which were target onset time- and location-specific (Duecker &
Sack, 2013). Moreover, our EEG analyses also suggest a significant impact of sound on the phase-
resetting of cortical oscillators in auditory sites, which paradoxically, would be higher for single
pulses than for longer sham bursts.
Unfortunately, studies on the effects of sham TMS on behavioral outcomes and brain
activity are still too few to build an adequate understanding on the potential contributions of
afferent auditory activity associated to TMS, which might strongly vary across experimental
paradigms. Carefully designed experiments and sham interventions that do not take for granted the
unspecific nature of auditory effects of TMS is paramount to produce solid results (Duecker &
Sack, 2015).
The two sham procedures tested in our study addressed the contributions of auditory TMS
effects on visual detection performances. Nonetheless, the same mechanism responsible for the
generation of loud clicking sound associated to each TMS pulse (i.e., the vibration of copper loops
inside the TMS coil when briefly passing electrical currents to generate a magnetic field) deforms
the surface of the plastic case and generates a light tapping tactile sensation on the stimulated scalp
region. It has been argued that TMS skull tapping can be transmitted by bone vibration directly
into the internal ear, contributing to the nature of TMS-associated auditory sensations, which would
not be solely transmitted via the ear canal (Nikouline et al., 1999). This bone conduction of TMS-

267
associated clicks is difficult to accurately reproduce with sham stimulation. Additionally,
somatosensory and proprioceptive afferent signals can be generated by TMS fields the stimulate
nearby excitable fibers of the scalp muscles (Ilmoniemi & Kičić, 2010) and although some TMS
sham coils integrate sophisticated mechanisms to induce scalp tactile sensations (Mennemeier et
al., 2009; Rossi et al., 2007), somatosensory effects have not been specifically controlled in a vast
majority of TMS studies.
Such somatosensory effects cannot be disregarded, particularly since a recent study
blocking sensory cutaneous receptors with local anaesthetics has shown that transcutaneous
electrical stimulation of peripheral afferent nerves could explain the modulatory effects of
transcranial alternating current stimulation (tACS) on motor systems (Asamoah et al. 2019).
Moreover, similarly to rhythmic auditory stimulation, rhythmic tactile or transcutaneous nerve
stimulation might be able to entrain per se cortical oscillations at the rhythm paced by the
stimulation patterns (Asamoah et al. 2019; Nangini et al. 2006) and explain currently controversial
entrainment effects reported with tACS. Intracranial or interleaved TMS-EEG recordings leave
little doubt on the ability of intracranial electrical pulses or transcranial magnetic pulses to entrain
short-lasting cortical oscillations (Amengual et al., 2017; Thut et al., 2011; Vernet et al., 2019),
nonetheless, the potential contributions of single pulse or rhythmic vs random scalp tapping to the
impact of active TMS on cortical oscillations needs to be ruled-out in ad hoc experiments which,
given their complexity, were out of the scope of this study.
We conclude that TMS is a powerful tool for non-invasive brain stimulation which allows
an effective modulation of cortical activity in a wide variety of cortical regions, cognitive processes
and patient populations. However, the potential contribution of afferent peripheral effects (such as
sounds or scalp tactile sensations associated with TMS) needs to be adequately ruled out.
Addressing this question, the effort of our study allows to better understand the influence of TMS
sound. On the other hand, brain stimulation techniques free of sensory effects, for instance
intracranial or deep brain stimulation in implanted patients (Amengual et al., 2017; Cleary et al.,

268
2012; Fox et al., 2018) or Focused Ultrasound Stimulation (FUS) which have experienced
important development in recent years (Bystritsky et al., 2011; Deffieux et al., 2013; Tufail et al.,
2010) could be used to complement TMS findings and confirm the lack of sensory origin in causal
effects of magnetic stimulation on brain activity and behavior.

269
Conflict of interest
The authors declare no competing interests.
Acknowledgement
Chloé Stengel was supported by a PhD fellowship from the University Pierre and Marie Curie.
Julià L. Amengual was supported by a fellowship from the Fondation Fyssen. The activities of the
laboratory of Dr. Valero-Cabré are supported by research grants IHU-A-ICM-Translationnel, ANR
projet Générique OSCILOSCOPUS and Flag-era-JTC-2017 CAUSALTOMICS. The authors
would also like to thank Clara Sanchez for providing help during data acquisition and the Naturalia
& Biologia Foundation for financial assistance for traveling and attending meetings.
Author contributions
Conceptualization: C.S., J.L.A. and A.V-C. Data acquisition: C.S. and A.V-C. Data analysis: C.S.
Manuscript preparation: C.S., A.M. & A.V-C. Supervision: A.V-C.
Data availability statement
Data are available from the corresponding author upon request.

270
References
Amengual, J. L., Vernet, M., Adam, C., & Valero-Cabré, A. (2017). Local entrainment of
oscillatory activity induced by direct brain stimulation in humans. Scientific Reports, 7,
41908.
Asamoah, B., Khatoun, A., & Laughlin, M. M. (2019). TACS motor system effects can be caused
by transcutaneous stimulation of peripheral nerves. Nature Communications, 10, 266.
Bernstein, I. H., Clark, M. H., & Edelstein, B. A. (1969). Intermodal effects in choice reaction time.
Journal of Experimental Psychology, 81, 405–407.
Bharadwaj, H. M., Lee, A. K. C., & Shinn-Cunningham, B. G. (2014). Measuring auditory
selective attention using frequency tagging. Frontiers in Integrative Neuroscience, 8.
Bolognini, N., Frassinetti, F., Serino, A., & Làdavas, E. (2005). “Acoustical vision” of below
threshold stimuli: Interaction among spatially converging audiovisual inputs. Experimental
Brain Research, 160, 273–282.
Bystritsky, A., Korb, A. S., Douglas, P. K., Cohen, M. S., Melega, W. P., Mulgaonkar, A. P., …
Yoo, S.-S. (2011). A review of low-intensity focused ultrasound pulsation. Brain
Stimulation, 4, 125–136.
Chanes, L., Chica, A. B., Quentin, R., & Valero-Cabré, A. (2012). Manipulation of Pre-Target
Activity on the Right Frontal Eye Field Enhances Conscious Visual Perception in Humans.
PLoS ONE, 7, e36232.
Chanes, L., Quentin, R., Tallon-Baudry, C., & Valero-Cabré, A. (2013). Causal Frequency-
Specific Contributions of Frontal Spatiotemporal Patterns Induced by Non-Invasive
Neurostimulation to Human Visual Performance. The Journal of Neuroscience, 33, 5000–
5005.
Chanes, L., Quentin, R., Vernet, M., & Valero-Cabré, A. (2015). Arrhythmic activity in the left
frontal eye field facilitates conscious visual perception in humans. Cortex, 71, 240–247.
Cleary, D. R., Raslan, A. M., Rubin, J. E., Bahgat, D., Viswanathan, A., Heinricher, M. M., &
Burchiel, K. J. (2012). Deep brain stimulation entrains local neuronal firing in human
globus pallidus internus. Journal of Neurophysiology, 109, 978–987.
Cornsweet, T. N. (1962). The staircrase-method in psychophysics. The American Journal of
Psychology, 75, 485–491.
Deffieux, T., Younan, Y., Wattiez, N., Tanter, M., Pouget, P., & Aubry, J.-F. (2013). Low-Intensity
Focused Ultrasound Modulates Monkey Visuomotor Behavior. Current Biology, 23, 2430–
2433.

271
Duecker, F., & Sack, A. T. (2013). Pre-Stimulus Sham TMS Facilitates Target Detection. PLoS
ONE, 8, e57765.
Duecker, F., & Sack, A. T. (2015). Rethinking the role of sham TMS. Frontiers in Psychology, 6.
Edgington, E., & Onghena, P. (2007). Randomization tests. Chapman and Hall/CRC.
Forss, N., Mäkelä, J. P., Mcevoy, L., & Hari, R. (1993). Temporal integration and oscillatory
responses of the human auditory cortex revealed by evoked magnetic fields to click trains.
Hearing Research, 68, 89–96.
Fox, K. C. R., Yih, J., Raccah, O., Pendekanti, S. L., Limbach, L. E., Maydan, D. D., & Parvizi, J.
(2018). Changes in subjective experience elicited by direct stimulation of the human
orbitofrontal cortex. Neurology, 91, E1519-1527.
Frassinetti, F., Bolognini, N., & Làdavas, E. (2002). Enhancement of visual perception by
crossmodal visuo-auditory interaction. Experimental Brain Research, 147, 332–343.
Galambos, R., Makeig, S., & Talmachoff, P. J. (1981). A 40-Hz auditory potential recorded from
the human scalp. Proceedings of the National Academy of Sciences, 78, 2643–2647.
Green, D. M., & Swets, J. A. (1966). Signal detection theory and psychophysics. Oxford, England:
John Wiley.
Henry, M. J., & Obleser, J. (2012). Frequency modulation entrains slow neural oscillations and
optimizes human listening behavior. Proceedings of the National Academy of Sciences,
109, 20095–20100.
Herrmann, B., Henry, M. J., Grigutsch, M., & Obleser, J. (2013). Oscillatory Phase Dynamics in
Neural Entrainment Underpin Illusory Percepts of Time. Journal of Neuroscience, 33,
15799–15809.
Ilmoniemi, R. J., & Kičić, D. (2010). Methodology for Combined TMS and EEG. Brain
Topography, 22, 233–248.
Ingham, J. G. (1970). Individual differences in signal detection. Acta Psychologica, 34, 39–50.
Kim, D.-W., Hwang, H.-J., Lim, J.-H., Lee, Y.-H., Jung, K.-Y., & Im, C.-H. (2011). Classification
of selective attention to auditory stimuli: Toward vision-free brain–computer interfacing.
Journal of Neuroscience Methods, 197, 180–185.
Kusnir, F., Chica, A. B., Mitsumasu, M. A., & Bartolomeo, P. (2011). Phasic auditory alerting
improves visual conscious perception. Consciousness and Cognition, 20, 1201–1210.
Lakatos, P., Musacchia, G., O’Connel, M. N., Falchier, A. Y., Javitt, D. C., & Schroeder, C. E.
(2013). The Spectrotemporal Filter Mechanism of Auditory Selective Attention. Neuron,
77, 750–761.

272
Lippert, M., Logothetis, N. K., & Kayser, C. (2007). Improvement of visual contrast detection by
a simultaneous sound. Brain Research, 1173, 102–109.
Loo, C. K., Taylor, J. L., Gandevia, S. C., McDarmont, B. N., Mitchell, P. B., & Sachdev, P. S.
(2000). Transcranial magnetic stimulation (TMS) in controlled treatment studies: Are some
“sham” forms active? Biological Psychiatry, 47, 325–331.
Macmillan, N. A., & Creelman, C. D. (1990). Response bias: Characteristics of detection theory,
threshold theory, and “nonparametric” indexes. Psychological Bulletin, 107, 401–413.
Macmillan, N. A., & Creelman, C. D. (2004). Detection Theory: A User’s Guide. Psychology Press.
Maris, E., & Oostenveld, R. (2007). Nonparametric statistical testing of EEG- and MEG-data.
Journal of Neuroscience Methods, 164, 177–190.
McDonald, J. J., Teder-Sälejärvi, W. A., & Hillyard, S. A. (2000). Involuntary orienting to sound
improves visual perception. Nature, 407, 906.
Mennemeier, M., Triggs, W., Chelette, K., Woods, A., Kimbrell, T., & Dornhoffer, J. (2009). Sham
Transcranial Magnetic Stimulation Using Electrical Stimulation of the Scalp. Brain
Stimulation, 2, 168–173.
Mercier, M. R., Foxe, J. J., Fiebelkorn, I. C., Butler, J. S., Schwartz, T. H., & Molholm, S. (2013).
Auditory-driven phase reset in visual cortex: Human electrocorticography reveals
mechanisms of early multisensory integration. NeuroImage, 79, 19–29.
Nangini, C., Ross, B., Tam, F., & Graham, S. J. (2006). Magnetoencephalographic study of
vibrotactile evoked transient and steady-state responses in human somatosensory cortex.
NeuroImage, 33, 252–262.
Nikouline, V., Ruohonen, J., & Ilmoniemi, R. J. (1999). The role of the coil click in TMS assessed
with simultaneous EEG. Clinical Neurophysiology, 110, 1325–1328.
Odgaard, E. C., Arieh, Y., & Marks, L. E. (2003). Cross-modal enhancement of perceived
brightness: Sensory interaction versus response bias. Perception & Psychophysics, 65, 123–
132.
Oostenveld, R., Fries, P., Maris, E., & Schoffelen, J.-M. (2011). FieldTrip: Open source software
for advanced analysis of MEG, EEG, and invasive electrophysiological data.
Computational Intelligence and Neuroscience, 2011, 156869.
Picton, T. W., John, M. S., Dimitrijevic, A., & Purcell, D. (2003). Human auditory steady-state
responses. International Journal of Audiology, 42, 177–219.
Polanía, R., Nitsche, M. A., & Ruff, C. C. (2018). Studying and modifying brain function with non-
invasive brain stimulation. Nature Neuroscience, 21, 174–187.

273
Quentin, R., Elkin Frankston, S., Vernet, M., Toba, M. N., Bartolomeo, P., Chanes, L., & Valero-
Cabré, A. (2015). Visual Contrast Sensitivity Improvement by Right Frontal High-Beta
Activity Is Mediated by Contrast Gain Mechanisms and Influenced by Fronto-Parietal
White Matter Microstructure. Cerebral Cortex, 26, 2381–2390.
Robertson, I. H., Mattingley, J. B., Rorden, C., & Driver, J. (1998). Phasic alerting of neglect
patients overcomes their spatial deficit in visual awareness. Nature, 395, 169.
Rogasch, N. C., Thomson, R. H., Farzan, F., Fitzgibbon, B. M., Bailey, N. W., Hernandez-Pavon,
J. C., … Fitzgerald, P. B. (2014). Removing artefacts from TMS-EEG recordings using
independent component analysis: Importance for assessing prefrontal and motor cortex
network properties. NeuroImage, 101, 425–439.
Romei, V., Gross, J., & Thut, G. (2012). Sounds reset rhythms of visual cortex and corresponding
human visual perception. Current Biology: CB, 22, 807–813.
Roß, B., Picton, T. W., & Pantev, C. (2002). Temporal integration in the human auditory cortex as
represented by the development of the steady-state magnetic field. Hearing Research, 165,
68–84.
Rossi, S., Ferro, M., Cincotta, M., Ulivelli, M., & Passero, S. G. (2007). A real electro-magnetic
placebo (REMP) device for sham transcranial magnetic stimulation (TMS). Clinical
Neurophysiology, 118, 709–716.
Saupe, K., Schröger, E., Andersen, S. K., & Müller, M. M. (2009). Neural mechanisms of
intermodal sustained selective attention with concurrently presented auditory and visual
stimuli. Frontiers in Human Neuroscience, 3.
Shams, L., & Kim, R. (2010). Crossmodal influences on visual perception. Physics of Life Reviews,
7, 269–284.
Sommer, J., Jansen, A., Dräger, B., Steinsträter, O., Breitenstein, C., Deppe, M., & Knecht, S.
(2006). Transcranial magnetic stimulation—A sandwich coil design for a better sham.
Clinical Neurophysiology, 117, 440–446.
Spence, C. (2011). Crossmodal correspondences: A tutorial review. Attention, Perception, &
Psychophysics, 73, 971–995.
Spence, C., & Driver, J. (1997). Audiovisual links in exogenous covert spatial orienting. Perception
& Psychophysics, 59, 1–22.
Srinivasan, R., Russell, D. P., Edelman, G. M., & Tononi, G. (1999). Increased synchronization of
neuromagnetic responses during conscious perception. The Journal of Neuroscience: The
Official Journal of the Society for Neuroscience, 19, 5435–5448.

274
Srinivasan, R., Bibi, F. A., & Nunez, P. L. (2006). Steady-state visual evoked potentials:
Distributed local sources and wave-like dynamics are sensitive to flicker frequency. Brain
Topography, 18, 167–187.
Srinivasan, R., Fornari, E., Knyazeva, M. G., Meuli, R., & Maeder, P. (2007). FMRI responses in
medial frontal cortex that depend on the temporal frequency of visual input. Experimental
Brain Research. Experimentelle Hirnforschung. Experimentation Cerebrale, 180, 677–691.
Stanislaw, H., & Todorov, N. (1999). Calculation of signal detection theory measures. Behavior
Research Methods, Instruments, & Computers: A Journal of the Psychonomic Society, Inc,
31, 137–149.
Stein, B. E., London, N., Wilkinson, L. K., & Price, D. D. (1996). Enhancement of Perceived
Visual Intensity by Auditory Stimuli: A Psychophysical Analysis. Journal of Cognitive
Neuroscience, 8, 497–506.
Sturm, W., & Willmes, K. (2001). On the Functional Neuroanatomy of Intrinsic and Phasic
Alertness. NeuroImage, 14, S76–S84.
Suckling, J., & Bullmore, E. (2004). Permutation tests for factorially designed neuroimaging
experiments. Human Brain Mapping, 22, 193–205.
Thut, G., Veniero, D., Romei, V., Miniussi, C., Schyns, P., & Gross, J. (2011). Rhythmic TMS
Causes Local Entrainment of Natural Oscillatory Signatures. Current Biology, 21, 1176–
1185.
Tiitinen, H., Virtanen, J., Ilmoniemi, R. J., Kamppuri, J., Ollikainen, M., Ruohonen, J., &
Näätänen, R. (1999). Separation of contamination caused by coil clicks from responses
elicited by transcranial magnetic stimulation. Clinical Neurophysiology: Official Journal of
the International Federation of Clinical Neurophysiology, 110, 982–985.
Tufail, Y., Matyushov, A., Baldwin, N., Tauchmann, M. L., Georges, J., Yoshihiro, A., … Tyler,
W. J. (2010). Transcranial Pulsed Ultrasound Stimulates Intact Brain Circuits. Neuron, 66,
681–694.
Valero-Cabré, A., Amengual, J. L., Stengel, C., Pascual-Leone, A., & Coubard, O. A. (2017).
Transcranial magnetic stimulation in basic and clinical neuroscience: A comprehensive
review of fundamental principles and novel insights. Neuroscience & Biobehavioral
Reviews, 83, 381–404.
Vernet, M., Stengel, C., Quentin, R., Amengual, J. L., & Valero-Cabré, A. (2019). Entrainment of
local synchrony reveals a causal role for high-beta right frontal oscillations in human visual
consciousness. Sci Rep, 9, 14510.

275
GENERAL DISCUSSION
I - Summary of the main results
The work presented in this thesis aimed to understand the causal contributions and neural
coding strategies for attention orienting and conscious visual perception of two homotopic
nodes of the bilaterally distributed fronto-parietal dorsal attention network, the left and the right
FEFs. We used TMS to non-invasively manipulate cortical activity patterns in these regions in
order to either entrain high-beta cortical oscillations or induce neural noise. While they received
stimulation at specific time windows on a trial-by-trial basis, we asked participants to perform
a visual detection task at threshold to probe the effects of the causal manipulation of cortical
activity patterns within the left and the right FEF on conscious visual perception. We also
recorded EEG signals concurrently to TMS to study the effect of our short stimulation patterns
on brain activity in the stimulated cortex and other anatomically connected regions. Lastly, we
conducted an experiment to characterize, on visual detection performances and EEG
recordings, the confounding sensory side effects of magnetic stimulation. This last experiment
was an attempt to verify that the effects of auditory stimulation associated with the delivery of
TMS did not interact with the electrophysiological impact of active TMS bursts reported in our
first two TMS-EEG experiments. Nonetheless, it also served to assess and compare the
reliability of two sham TMS strategies and to gauge the ability of rhythmic or random series of
sounds to entrain or desynchronize oscillations and impact perceptual performance.
In a first study (Project 1, Study I), we first confirmed that the delivery of 30 Hz rhythmic
patterns of TMS on the right FEF does entrain local cortical oscillations at the frequency
contained in the burst compared to random patterns made by an equal number of pulses
delivered over the same time window but lacking a specific frequency signature. We then
replicated previous findings (Chanes et al., 2013) demonstrating that 30 Hz rhythmic TMS
delivered pre-target onset improved visual perception in the left visual hemifield. Taken
together, EEG and behavioral results bring evidence for a causal role of high-beta pre-frontal
oscillations in conscious visual perception.
In a second study (Project 1, Study II) performed on the same TMS-EEG dataset, we
extended our analysis of local EEG signals to interconnected regions. A data re-analysis based

276
on a new and independent data cleaning process confirmed prior evidence showing local
entrainment of high-beta oscillations. Importantly, however, TMS-driven effects extended
throughout an ipsilateral fronto-parietal network for attention orienting (Corbetta et al., 2008;
Corbetta & Shulman, 2002). Indeed, rhythmic TMS, compared to random TMS, increased right
fronto-parietal high-beta phase-synchronization. Moreover, high-beta oscillation power and
trial-to-trial phase alignment also increased in response to rhythmic TMS in right and left
parietal regions, distant from the stimulation site. On the basis of influential models showing a
relation between increased high-beta phase-synchronization and improved inter-regional
communication (Fries, 2005, 2009), we concluded that rhythmic TMS delivered over the right
FEF resulted in a frequency-specific state of network synchronization across the dorsal
attention network. We hypothesize that such effects might have been likely spread through the
1st branch of the Superior Longitudinal Fasciculus (SLF I), a white matter tract linking the right
FEF and right posterior parietal regions of the dorsal attention network, such as the Intra Parietal
Sulcus (Thiebaut de Schotten et al., 2011). Interestingly, previous studies have shown that the
microstructural characteristics of the SLF I correlated to the magnitude of improvement of
visual perception driven by high-beta TMS entrainment in the FEF (Quentin et al. 2014, 2015).
In a third study (Project 2), we explored the impact of arrhythmic or noisy patterns of
activity in the left FEF by comparing rhythmic high-beta stimulation to non frequency-specific
TMS patterns designed to induce different levels of neural noise. This study was inspired by
evidence suggesting different coding strategies in the right and left nodes of a bilaterally
distributed dorsal attentional network in charge of a top-down modulation of conscious
perception. Indeed, we aimed to add electrophysiological recordings to prior evidence showing
that arrhythmic or non frequency-specific left FEF TMS patterns (and not the rhythmic TMS
pattern which improved visual perception over the right FEF) enhanced conscious visual
perception (Chanes et al., 2015). To this end, we replicated the prior paradigm of Chanes et al.
(2015) by stimulating the left FEF with 30 Hz rhythmic TMS bursts compared to three different
types of non frequency-specific TMS patterns (non-uniform rhythmic, random and irregular
patterns), while participants performed a near threshold detection task. Importantly, to
characterize the patterns of cortical activity induced by the latter TMS patterns, we recorded
EEG signals all along the trials. We showed that non frequency-specific TMS patterns increased
neural noise levels over bilateral fronto-parietal areas. More specifically, non-uniform rhythmic
and irregular TMS patterns increased oscillation power over the left FEF within a broader
frequency range (not confined to the high-beta but extending to low-beta band), than 30 Hz
rhythmic TMS (whose effects impacted selectively the high-beta band). A broadband power

277
increase indicates lower signal regularity than a frequency-specific narrow-band high-beta
oscillations recorded during rhythmic 30 Hz TMS. Additionally, non frequency-specific TMS
patterns significantly increased EEG signal complexity over clusters of right frontal or right
and left parietal electrodes (compared to sham TMS). Taken together, these two results (broader
oscillatory band and higher signal complexity) support a modulation of neural noise by non
frequency-specific TMS patterns. However, at difference with a prior study of our lab (Chanes
et al., 2015) such EEG correlates fail to translate into any significant modulation of visual
sensitivity.
In our fourth and last study (Project 3), we investigated the contribution to behavior and
electrophysiological recordings of single pulses and rhythmic (30 Hz) or random patterns of 4
TMS clicking sound present in sham stimulation modalities (either using active TMS pulses
delivered in a 90o sham configuration or TMS-like sounds recorded and played via a speaker
mounted on a TMS coil). This topic holds interest as TMS pulses come always associated with
brief but intense auditory stimulation, which could possibly contribute to the impacts of active
electromagnetic pulses, such as entrained neural oscillations or improvement of conscious
visual perception. We showed that, indeed, sham TMS sound patterns (compared to no
stimulation), delivered with any of the two modalities, failed to show any sign of oscillatory
entrainment or impact on visual sensitivity. However, irrespective of their specific temporal
organization (i.e. equally for single pulse, rhythmic or random bursts) TMS clicking sounds
lowered response bias in the visual detection task, making participants less conservative in their
perceptual decisions. Loud TMS clicking sounds (in any pattern but most strongly for single
pulses) also phase-locked oscillations in a broad set of frequencies in central scalp locations
associated to the recording of auditory evoked potentials. We concluded that single or sound
bursts associated to the delivery of active TMS did not contribute in any significant manner to
local high-beta entrainment or to the improvement of perceptual outcomes reported in the 2
other active TMS studies presented in this dissertation. Nonetheless, for the design of suitable
control conditions and accurate data interpretation, TMS researchers shall be aware of the
power of single or periodic sounds to phase lock oscillatory activity and to influence response
criterion for perceptual decision making.

278
II – Frontal and fronto-parietal contributions to the modulation of visual perception
The study of the anatomical basis of attentional orienting networks and the modular
contributions of frontal and posterior parietal regions to such function has received substantial
attention in the last two decades. In particular, it is well established that both top-down (i.e.
endogenous or voluntary) and bottom-up (i.e. exogenous or automatic) attentional orienting
relies on components of a common bilaterally distributed dorsal network linking the FEFs and
the Intraparietal Sulci (IPS) (Corbetta & Shulman, 2002). Studies in primate models (Bichot et
al., 2005; Buschman & Miller, 2007; Fries et al., 2001; Saalmann et al., 2007) and healthy
humans (Chanes et al., 2013; Gross et al., 2004; Hipp et al., 2011; Phillips & Takeda, 2009;
Rodriguez et al., 1999) have highlighted the functional role of high-beta and gamma oscillations
and fronto-parietal synchronization in spatial attention and the modulation of conscious visual
perception for attended stimuli. More recently, correlational and causal evidence has revealed
a multiplexing of high-beta and gamma frequencies in fronto-parietal systems to differentially
encode for top-down (visual search task) vs. bottom up (pop-out task) spatial orienting
(Buschman & Miller, 2007) or modulate stimulus salience (perceptual sensitivity, d’) vs.
decision making (response criteria, beta) (Chanes et al., 2013). In line with this empirical
evidence, a theoretical framework hypothesized that mechanisms of stimulus selection by top-
down attention are subtended by inter-regional synchronization at a high-beta or gamma
frequency across the dorsal attention network (Engel et al., 2001; Fries, 2005, 2009).
Attempts to further extend knowledge in this domain in humans demanded concurrent
TMS-EEG approaches combining the focal manipulation of specific network nodes to
synchronize/desynchronize cortical activity and scalp EEG to monitor local and network-wide
consequences. It is by simultaneously coupling brain manipulation, behavioral testing, and the
recording of electrophysiological activity that challenging TMS-EEG experimental designs
allowed us to progress in our understanding of frequency-based oscillatory strategies of fronto-
parietal systems for the modulation of conscious visual perception via attentional networks.
The reported association of improvements of visual sensitivity for left targets and proof
of high-beta frontal entrainment and fronto-parietal phase-synchronization for rhythmic but not
random TMS patterns, delivered prior to visual target onset, is compelling evidence informing
on a causal top-down role for these type of activity to the modulation of conscious visual
perception.

279
II.1 – Interhemispheric asymmetries in top-down systems for the
facilitation of visual performance
By probing with identical causal approaches and task designs the role of right and left
frontal regions (FEF) in the modulation of visual perception, we aimed to assess potential signs
of hemispheric lateralization in attentional orienting, or interhemispheric asymmetries of
coding strategies between left and right fronto-parietal systems, suggested previously (Chanes
et al., 2013, 2015).
Evidence in favor of a right hemisphere lateralization of attentional orienting systems has
been solidly established. PET and MRI evidence showed stronger activations for right fronto-
parietal regions in tasks requiring the orienting of attention (Corbetta et al., 2000; Downar et
al., 2000; Shulman et al., 2010). In parallel, non-invasive stimulation studies (rTMS) interfering
with the activity of parietal nodes strongly suggested a causal role for right but not left parietal
nodes in the orientation of spatial attention and visual perception (Bourgeois et al., 2013b,
2013a; Capotosto et al., 2012). Morphologically speaking, the third branch of the white matter
tract linking dorsal frontal and parietal regions (the SLF III) was found to be larger in the right
than the left hemisphere, and in the same population, the degree of right lateralization of the 2nd
branch of the SLF scaled with the magnitude of the left attentional bias observed in a line
bisection task (Thiebaut de Schotten et al., 2011). As a further argument supporting a right
lateralization of spatial attention, lesions in the right fronto-parietal system, either gray matter
damage or white-matter disconnections, lead to deficits of attentional orienting towards left
contralesional targets, referred to as hemineglect (Bartolomeo, 2007; Bartolomeo et al., 2012;
Thiebaut de Schotten et al., 2014, 2005). In contrast, signs of hemineglect following damage of
homotopic regions or tracts in the left hemisphere are rare and the symptoms of right and left
lesions differ, hence suggesting they could be subtended by different mechanisms (Bartolomeo
et al., 2001). A notable consequence of right lateralization of spatial attention is that the usual
representation of sensory stimuli in the contralateral brain hemisphere does not apply to spatial
representations linked to the orienting of attention. Indeed, right fronto-parietal regions seem
to process orienting to visual targets in both visual hemifields whereas left hemisphere regions
respond only to contralateral right targets (Grosbras & Paus, 2002, 2003; Kagan et al., 2010).
The first three studies of the current dissertation extend these known asymmetric right vs.
left hemisphere contributions to the domain of spatio-temporal coding strategies. On the one
hand, we strengthen evidence in favor of right local and fronto-parietal high-beta synchrony for
the top down modulation of conscious visual perception. On the other hand, in the left
hemisphere, in spite of induced changes in left frontal and fronto-parietal EEG activity, we

280
were unable to show significant improvements of conscious visual perception following 30 Hz
rhythmic stimulation in the left FEF nor, as initially hypothesized (Chanes et al., 2015),
following non-frequency specific stimulation patterns.
Although initially disappointing, this result reinforces the notion of a strongly right
lateralized causal role of fronto-parietal systems in top-down modulation of perception, which
will be easier to modulate from right than from left hemisphere regions. Nonetheless, a more
nuanced interpretation of left FEF manipulations, taking into account EEG estimations of TMS-
induced noise, might bring novel light to the right vs. left asymmetry debate. Indeed, in the left
FEF, non-frequency specific TMS patterns which had previously been shown to facilitate
conscious access for visual stimuli (Chanes et al. 2015), induced higher levels of noise than
rhythmic patterns.
This finding provides indirect support for a role of neural noise in left frontal systems in
the modulation of visual detection. Additionally, the Stochastic Resonance framework, based
on well-established evidence that the addition of dosed levels of noise can enhance detection
of weak signals (Moss et al., 2004) across sensory modalities (Collins et al., 1996; Groen &
Wenderoth, 2016; Iliopoulos et al., 2014; Kitajo et al., 2003; Manjarrez et al., 2007; Simonotto
et al., 1997; Zeng et al., 2000), provides an opportunity to better understand our findings.
Indeed, Stochastic Resonance precedents stress the difficulty to observe group mean perceptual
improvement given a usually high level of inter-subject variability in optimal window of noise
intensity required to strengthen, instead of degrade, cortical processing (Groen & Wenderoth,
2016; Iliopoulos et al., 2014; Kitajo et al., 2003). Integrating prior published evidence by our
group and TMS-EEG evidence presented in the studies from this thesis, we put forward a
speculative working model supporting a right vs. left hemisphere asymmetry in coding strategy
subtending the orientation of spatial attention and conscious visual perception.
During the pre-target period, in right frontal regions of the dorsal attention network (right
FEF), high-beta cortical oscillations (Project 1 Study I) spreading through the 1st branch of the
SLF (Quentin et al., 2014, 2015), synchronizing right fronto-parietal systems at this same
frequency, sets a state of general high-beta phase-locking (Project 1 Study II). Such state will
favor causal improvements of visual sensitivity for right (Project 1 Study I) or possibly bilateral
visual targets (Chanes et al., 2013; Grosbras & Paus, 2002, 2003). In the left hemisphere,
increases of internal neural noise levels in the frontal node (left FEF) of the left dorsal attention
network, spreading through the fronto-parietal systems, increases neural noise in other network
nodes (Project 2), improving perception of right visual targets (Chanes et al., 2015). These two
sets of neural substrates and mechanisms could be activated independently to favor orienting to

281
either unilateral left (or bilateral) or unilateral right stimuli, or be enabled jointly to achieve a
balanced level of right high-beta synchronization and left neural noise that maximizes
performance for either left (or bilateral) or right targets. We should not discard that such
dynamic right vs left interhemispheric balance between high-beta synchronization and neural
noise enabling strategies would also operate, as suggested by our left FEF datasets (Project 2),
within fronto-parietal systems of both hemispheres, and that the final state of each system is set
through a balance between these two competing forces.
To some extent, this currently speculative model resembles the alpha synchronization/
desynchronization push-pull interhemispheric dynamics between right and left occipito-parietal
regions reported to subtend our ability to focus attention on an hemifield (contralateral alpha
desynchronization) by removing attention from the opposite hemifield (contralateral alpha
entrainment) (Marshall et al., 2015; Thut et al., 2006; Worden et al., 2000). Nonetheless, our
concurrent TMS-EEG recordings in the left FEF does not support per se a desynchronization
by non frequency-specific vs rhythmic TMS patterns, but rather an impact of local noise levels
and signal complexity, which to date has never been hypothesized in attentional orienting
mechanisms and needs to be better understood.
Hence, further studies would be absolutely necessary to solidify this model, particularly
concerning coding strategies for left dorsal attentional network based on the neural
consequences of noise induction on EEG oscillatory activity. To this end, it would be interesting
to compare within the same population in two separate sets of experiments, and under EEG
monitoring, unilateral right FEF or unilateral left FEF high-beta or arrhythmic stimulation
patterns with the concurrent application of two stimulation patterns in the right FEF and left
FEF simultaneously.
II.2 – Methodological limitations of our datasets and experimental
approaches
To the best of our efforts, during the planning of our studies we did care to design
experimental paradigms that were as similar as possible to allow comparability. This was
particularly relevant for Projects 1 and 2 which were planned to be able to compare right FEF
and left FEF outcomes. Unfortunately for logistic and organizational reasons, the two
experiments were still conducted on separate cohorts of healthy participants. Moreover,
although the 30 Hz rhythmic TMS pattern aiming to entrain high-beta oscillations was present
in both sets of studies, non frequency-specific TMS patterns tested in the right FEF with

282
concurrent EEG were restricted to the random TMS pattern, and such choice at the time was
not necessarily guided by the intention to manipulate local noise levels as a variable but rather
as a control pattern to isolate the impact of stimulation frequency.
Nonetheless, left FEF TMS-EEG evidence pointing at a contribution of graded levels of
noise sets the stage to reanalyze our right FEF TMS-EEG dataset (comparing active and sham
rhythmic vs random TMS bursts) using measures of noise, such as signal-to-noise ratio, entropy
and complexity. By doing so we will be able to build a complete picture of how stimulation
patterns impact right FEF function and further characterize left vs right differences in impact
of rhythmic or non frequency-specific TMS patterns. Indeed, this re-analysis would provide an
opportunity to address the important question of whether the noise adding abilities of non
frequency-specific TMS patterns emerge simply from the random temporal structure of their
pulses or result from an interaction between the latter and specific properties (chemo- and
cytoarchitectural, neurophysiological or anatomical) of the stimulated area.
Along the lines of what has been proposed in the prior section, the most elegant TMS-
EEG experiment to address this point would consist in testing the impact of an identical set of
TMS conditions (active and sham 30 Hz rhythmic vs different types of non frequency-specific
TMS patterns) over the right and also the left FEF, perfectly counterbalancing the order of the
interventions across participants. Unfortunately, these types of studies (as those suggested
above testing unilateral right and left vs. bilateral FEF stimulation with rhythmic and non-
frequency specific patterns) could not be conducted since assuming an average of ~4h
experiment to collect reliable TMS-EEG datasets for two TMS patterns over one cortical site,
collecting data over more than 2 TMS patterns or over 2 cortical sites would have made for a
very long, high-risk experiment. Moreover, stochastic resonance-like effects highlight the high
dependence of neural facilitatory effects on the use of optimal levels of noise, and hence the
testing of several non-frequency specific patterns is needed to demonstrate such effects,
increasing the number of conditions to be compared across. We have therefore chosen to
proceed by constraining the number of TMS patterns and cortical sites tested and conducted
sequential experiments in the right and left hemisphere to identify, step-by-step, the relevant
conditions to be tested in both hemispheres.

283
II.3 – Modulating visuo-spatial attention and recording conscious visual
perception
Throughout this dissertation, we have been referring to our studies as assessing the
contribution of right and left frontal systems to the top-down modulation of conscious visual
perception via the manipulation of visuo-spatial neural networks. However, one possible
criticism that could be easily argued is that none of our experimental paradigms directly
manipulated the allocation of attention, for example by using central or peripheral predictive or
unpredictive cues to endogenously or exogenously orient attention in space prior to target onset.
Instead, we relied on activations driven by TMS patterns tuned in frequency to experimentally
engage top-down attentional networks, hence facilitate the detection of faint visual targets
presented in the visual space.
We avoided the complexity of having to interpret combined contributions and possible
interactions of TMS top-down modulation with cue-driven orientation of attention (Chanes et
al. 2012) for several reasons. First, we prioritized a good understanding of isolated effects and
EEG patterns associated to rhythmic TMS on attentional systems, a reasonable step before
mixing processes with uncertain timings and scenarios requiring the evaluation of a very high
number of conditions (2 TMS patterns (rhythmic, random), x 2 TMS modalities (sham, active)
x 3 types of cues (neutral, valid and invalid), x 2 visual target locations (ipsilateral and
contralateral to right FEF stimulation). Second, the time interval in which we obtained
modulatory effects (100 ms TMS bursts starting 133 ms before target onset) would be poorly
adapted to test the impact of exogenous orientation of attention (with fast build-up times and
decay between ~50-80 ms, see Shepherd & Müller, 1989) limiting burst duration, number of
cumulated phase locked cycles and time-frequency analyses for theta, alpha or even higher
frequencies such as the high-beta rhythms probed in our studies. Such a time interval is also
relatively short for a spatial cue to engage maximized endogenous attention effects (estimated
to peak ~150 ms and lasting for 300-500 ms, post-cue see Shepherd & Müller, 1989 or Carrasco,
2011 for a review), hence rendering the outcomes of a study combining exogenous orientation
of attention and rhythmic TMS modulation uncertain. The difficulty to predict the onset timing
of spatial cues, TMS bursts and visual target to allow synergistic interactions in combined trials
(or avoid null effects or cancellations), would have required a chronometric approach testing
several time intervals between events in combination with an already extremely high number
of conditions.
Hence, as argued for several prior studies (Chanes et al., 2012, 2013, 2015; Quentin et
al., 2014, 2015), we rely on prior literature to confirm that the TMS-driven impacts on

284
conscious visual perception that we report very likely relied on top-down modulatory processes
mediated by the dorsal fronto-parietal attention network. First, widely reported improvements
of visual perception and awareness following TMS over FEF (Chanes et al., 2012, 2013, 2015;
Grosbras & Paus, 2002, 2003) are coherent with the enhancement of visual perception by of
covert shifts of spatial attention (Grosbras & Paus, 2003; Moore & Armstrong, 2003; Vernet et
al., 2014). Second, correlational studies have shown a role for the right FEF in endogenous
attention orienting tasks in humans (Corbetta et al., 2002; see Corbetta & Shulman, 2002 and
Vernet et al., 2014 for a review). Third, several sets of experiments have shown that TMS
delivered over the FEF interacts with spatial attention. The combined manipulation, prior to
target onset, of attention with spatial cues and single TMS pulses, showed that TMS improved
perception only for validly cued targets, but had no effect or deteriorated the perception of
invalidly cued targets (Chanes et al., 2012; Grosbras & Paus, 2002). Similarly, magnetic
stimulation over the FEF has been shown to disrupt spatial cueing effects (Smith et al., 2005)
and the process of inhibition of return (Ro et al., 2003) which prevents the orienting of attention
to spatial locations that have already been explored. Taken together, these findings support a
causal role for FEF in the modulation of spatial attention and for all these reasons, we believe
that our rhythmic or non-frequency specific TMS patterns over the left and right FEF might
have modulated spatial attention systems, and lead, via top-down processes, to enhancements
of visual sensitivity in occipital regions through contrast gain mechanisms (Quentin et al.,
2015).
III- Pending questions and some future directions
Given the complexity and the long duration of TMS-EEG experiments, the work
presented in this thesis probed causal top-down contributions to conscious visual perception via
attentional systems in a very small subset of cortical regions and frequency bands. Hence quite
a lot is left to be causally explored, either in terms of frequency bands of interest, and their
cross-frequency interactions, or in terms of network nodes. The model we built, on the basis of
our results, of oscillatory contributions to top-down modulation of attention and visual
perception focuses on the two frontal nodes, the right and left FEF, and we selectively probed
the impact of a single frequency, high-beta, compared to a maximum of 4 non frequency-
specific patterns used to manipulate noise patterns. Hence, our model remains simplistic and

285
incomplete, and most importantly, fails to consider the impact of combined cross frequency
interactions.
III.1 – Towards an oscillatory model of attentional orienting and
perceptual modulation
Guided by theories of Fries and colleagues for a role of high-frequency oscillations in
top-down influences on perception (Engel et al., 2001; Fries, 2005, 2009) and findings by
Buschman and Miller (2007) in monkeys that our team extended to humans (Chanes et al. 2013,
Quentin et al. 2015), we focused on evaluating activity in the high-beta frequency band.
However, brain rhythms oscillating in many other frequencies, such as occipital or occipito-
parietal alpha (8-12 Hz), occipital theta (5-7 Hz) and fronto-parietal low gamma (~50 Hz) bands
have also been associated with the orienting or reorienting of spatial attention and/or the
modulation of visual perception.
A role of gamma oscillations in visuospatial attentional networks has been reported but
its specific function remains debated. On the one hand, non-human primate electrophysiology
work established a correlational link between 47-52 Hz fronto-parietal (FEF to IPS) synchrony
and performance in a pop-out task driven by exogenous, or bottom-up, attention (Buschman &
Miller, 2007). Following up on this outcome, extending it to humans and adding causality to it,
TMS pre-target entrainment of 50 Hz activity in the right FEF during a near threshold visual
detection task did not act upon perceptual sensitivity (d’) as high beta 30 Hz oscillations did,
but instead reduced response criteria making participants engage in more liberal strategies for
decision making (Chanes et al., 2013).
One of the most solidly studied oscillatory models accounting for attentional orienting,
however, has relied on a spatially selective synchronization and desynchronization of alpha
activity in occipito-parietal sites. Experimental EEG and MEG evidence has described a
phenomenon of alpha desynchronization during a pre-target anticipatory period in occipito-
parietal regions of the hemisphere contralateral to the visual hemifield where the target is
expected (Sauseng et al., 2005; Thut et al., 2006; Worden et al., 2000). Concomitantly, opposite
effects, i.e. increases of alpha synchronization, in the hemisphere ipsilateral to the hemifield
from which attention is disengaged have also been well reported (Marshall et al., 2015).
Whereas contralateral alpha desynchronization signals the focusing of attention, the increases
of alpha oscillations has been interpreted as a sort of a ‘push-and-pull’ mechanism needed to
withdraw attention from the opposite hemifield and/or inhibit the processing of distractor

286
stimuli (Foxe & Snyder, 2011; Klimesch et al., 2007). Strong pre-stimulus alpha occipital
oscillations have also been found to be correlated with reduced visual detection performance
for targets with the highest contrast, suggesting a role in scaling the regional response gain
rather than modulating its sensitivity to perceptual inputs (Chaumon & Busch, 2014). Rhythmic
TMS has been applied to modulate alpha oscillations in the parietal and occipital cortex,
providing causality to the relationship between pre-stimulus alpha rhythms and the modulation
of visual perception (Jaegle & Ro, 2014; Romei et al., 2010).
Most relevantly, visual perception has also been found to be modulated by the phase of
alpha oscillations, with higher visual excitability and probability of visual detection for targets
that reach occipital regions when alpha fluctuations are in a valley or trough, and opposite
effects when such input coincides with the crest or peak of the alpha cycle (Busch et al., 2009;
Dugué et al., 2011; Mathewson et al., 2009). These observations have led to the model of
attention as a cyclic process, at an alpha frequency, alternating periods of inhibition of inputs
and periods where visual targets more easily reach awareness (Mathewson et al., 2011).
Occipital theta oscillations have also been involved in rhythmic sampling when attention
alternates between several spatial locations (Huang et al., 2015; Landau & Fries, 2012; Landau
et al., 2015). Similarly, a recent V1/V2 TMS experiment probed via phase reset the involvement
of occipital theta rhythms in the periodical reorienting of attention at this specific frequency
(Dugué et al., 2016; and see Dugué & VanRullen, 2017 for a review on the role of alpha and
theta oscillations probed by TMS).
The correlational and causal evidence supporting roles of fronto-parietal gamma and beta
and occipito-parietal alpha and theta rhythms in the orienting (or reorienting) of spatial attention
and the modulation of visual perception highlight different and possibly complementary roles
for each frequency band. To this regard, on the basis of experimental human and monkey work,
a recent account has put forward an integrated oscillatory model for orientation and
reorientation of attention which for the first time would reconcile a diversity of findings in
several frequency bands (Fiebelkorn et al., 2018, Fiebelkorn & Kastner, 2019 for a review).
To make a very long story short, this model posits a mechanism of fluctuation between two
anatomically segregated brain states: a state associated to attention orientation and enhanced
visual processing, subtended by frontal beta oscillations and parietal gamma oscillations in
nodes of the attention network; and a state associated to attentional shifts subtended by parietal
alpha oscillations, which could suppress the processing of visual stimuli currently attended,
allowing attentional reorienting to other events in the visual field. Importantly, a theta rhythm

287
would be in charge of mediating fluctuations between these two states, hence set the system in
a state prone to orienting or reorienting.
In principle, the causal contribution of all these different frequency bands can be tested
with rhythmic TMS patterns coupled to EEG recordings, provided that their operating gray
matter nodes can be anatomically identified, spatially segregated and controllable from a
restricted number of network locations. However, one should be careful when comparing the
behavioral effects within the same cortical region of rhythmic TMS delivered at different
frequencies. Indeed, beyond frequency, other features of rhythmic TMS bursts and the task
epochs in which these are delivered can influence the observed impact on behavior. More
specifically, hard-to-honor compromises between the number of TMS pulses delivered within
a rhythmic burst (number of entrained cycles and total delivered energy), the pre-target onset
time window covered by the pattern (chronometry of the impact) and the interval between the
last pulse and a pre-target spatial cue or the visual target to be detected (phase at which the last
generated cycle might interact with cue or target onset), make experimental designs aiming to
compare frequencies very challenging.
When patterns are made equal in number of pulses, two bursts of rhythmic TMS at
different frequencies will not only differ in the specific frequency they contain but also in the
total duration of the burst, and hence the window of time during which the pattern is delivered.
Indeed, a 4-pulse pattern delivered at 10, 30 or 50 Hz will last for a period of 300, 100 and 60
ms, respectively. Thus it is impossible to tease apart if potential differences when contrasting
their impact on behavior are causally related to differences in frequency, discrepancies in the
period covered by the entrained episodic oscillation, or the onset time of its 1st pulse entraining
the 1st cycle. Conversely, if the duration of the rhythmic TMS patterns is equalized by varying
the number of pulses (4 pulses at 10 Hz, 10 pulses at 30 Hz or 15 pulses at 50 Hz, for an equal
duration of 300 ms for all patterns), then it could be argued that bursts with a higher number of
pulses might phase-lock cortical oscillators more strongly than those with less pulses (Thut et
al., 2011a).
Finally, following the entrainment of episodic oscillations, the time interval (or Stimulus
Onset Asynchrony, SOA) between the last pulse of the burst and the event that we aim to
transiently modulate (either a spatial cue or a target) determines which phase of the last
entrained oscillatory cycle will interact with the onset of that event. If the time interval used in
experimental designs comparing across frequencies is kept the same to preserve an identical
chronometry, event onset will interact with the entrained oscillations at different phases. If
instead the interval is varied hence adapted to the cycle duration at each frequency (for example

288
to reach target onset at the peak or the through of the oscillation), then it could always be argued
that differences in chronometry could account for potential differences. To avoid these
confounding effects, we restricted our experiments to a single frequency (30 Hz) of rhythmic
TMS and compared it to a control condition consisting in random or non-frequency-specific
TMS patterns with exact same number of pulses, total duration and time interval between the
last pulse and the target onset.
III.2 – Contributions of parietal and occipital cortices to conscious
perception
The studies of this dissertation used TMS-EEG approaches to highlight oscillatory
activity recorded in response to frontal stimulation. Nonetheless, entrained or modulated
activity by TMS bursts did not remain confined in the stimulated targets (in our case right or
left FEF) but spread out to parietal cortices via increased fronto-parietal synchronization and
parietal inter-trial coherence at the delivered frequency. This finding should not be surprising
since, as presented in the introduction, repetitive TMS patterns are known to generate effects
not only locally but also spread through networks in humans and animals (Chouinard et al.,
2003; Paus et al., 1997; Valero-Cabré et al., 2005). Moreover, in attentional and perceptual
modulation systems, the anatomical characteristics of fronto-parietal white-matter connections
correlates significantly with the magnitude of visual facilitatory outputs following frontal
stimulation (Quentin et al., 2014, 2015). Lastly, direct stimulation of posterior parietal areas
with alpha rhythms highlights the causal role of these regions in attention and conscious visual
perception (Jaegle & Ro, 2014; Romei et al., 2010).
Nonetheless, from a hodological network perspective, given the role of the primary visual
systems as the final receptor of attentional modulation, the missing link in our results remains
the relationship between entrained oscillatory activity in the fronto-parietal attention network
and occipital areas. None of our EEG analyses to this regard have been able to reveal EEG signs
of occipital modulations (on visual evoked activity or alpha oscillations) temporally associated
to top-down influences of the fronto-parietal attention systems manipulated with high-beta
rhythmic TMS on the right and left FEF.
Taylor et al. (2007) provided the first causal electrophysiological characterization of
distant fronto-occipital influences by showing a modulation of event related activity (ERP)
evoked by a target following 10 Hz TMS bursts delivered to the right FEF during the allocation
of attention period. Nonetheless no time-frequency analyses of frontal or occipital EEG activity

289
were performed on this dataset at the time. Some years thereafter, studies by Capotosto and
colleagues aimed to further bridge this gap and showed that brief rTMS disrupting activity in
both the right FEF and the right IPS during a pre-stimulus anticipation period impaired the
identification of visual targets (Capotosto et al. 2009; Capotosto et al. 2012). Additionally, EEG
recordings monitoring anticipatory alpha rhythms revealed disruptions of the characteristic
topography of alpha synchronization and desynchronization in the hemisphere ipsilateral and
contralateral, respectively, to the expected target position (Capotosto et al. 2009; Capotosto et
al. 2012). Importantly, the causal association between the disruption of occipital alpha rhythms
and impaired visual perception performance was strengthened by positive inter-subject
correlation between response reaction time in the visual discrimination task and the level of
posterior alpha desynchronization. These authors concluded that fronto-parietal regions
modulate visual perception by influencing alpha rhythms in parietal and/or occipital areas, but
their model lacked a precise mechanism to explain the cross-frequency synchronization
between posterior alpha rhythms and top-down fronto-parietal activity at a gamma or high-beta
band.
Traditional approaches characterizing causal coding strategies in attention and perceptual
networks have been based on interacting (disrupting, modulating or entraining) with known
patterns of activity in single nodes of a network and measuring the local and network distributed
impact of this manipulation. However, as our understanding of complex interactions across
brain systems via oscillatory and synchrony processes evolves, multi-focal stimulation (i.e.,
simultaneous modulation of several targets) seems to be called to play a role. In the attentional
and visual domain, paired pulse TMS protocols delivering with varying inter-pulse interval a
pair of pulses to two cortical region have been used to establish top-down influences of FEFs
and posterior parietal cortex (PPC) on the excitability of visual areas evaluated via phosphenes
(Silvanto et al., 2006, 2009). Similar operational principles could be extended to the use of brief
periodical patterns tailored to prove the causal role of entrained local frequency-specific
oscillations in fronto-parietal areas such as the FEF or the IPS on a physiological output (visual,
motor or cognitive) evoked from stimulation of an interconnected region. Moreover, assuming
the logistic feasibility and safety of the intervention, patterns of bifocal rhythmic TMS titrated
in phase difference (Plewnia et al., 2008) could be used in combination with EEG to pinpoint
the specific role of interregional synchronization across a fronto-parietal network, without a
need to do so via network effects of local entrainment. Even more complex experimental setups
in which interregional connectivity between two distant cortical locations is probed before and
following the influence of conventional rTMS or TBS protocol delivered on a third region have

290
also been developed (Davare et al., 2010). Multi-coil TMS experiments under EEG monitoring
(2 or maximum 3 TMS coils given space restrictions) should be seriously considered to pursue
a causal characterization of spatial attention and visual perception networks addressing
synchrony processes and cross-frequency interaction between nodes.
IV- Further considerations
Compared to prior work (Chanes et al., 2012, 2013, 2015; Quentin et al., 2014, 2015) the
most significant methodological achievement of this thesis is the recording of EEG activity
concurrently with the delivery of magnetic stimulation and the evaluation of behavioral
performance. Indeed, coupled TMS-EEG recordings granted access to novel and more detailed
insight about the effects of non-invasive stimulation on local and interregional cortical activity.
It hence provided extremely valuable information on the organization of brain systems, even in
those cases (see Projects 2 and 3) in which no significant TMS effects were found on behavior.
Globally, our outcomes attested to the high complexity of the TMS mediated modulation of
EEG signals, particular for non frequency-specific patterns, with EEG impacts that were not
always intuitive or predictable.
First, we showed that despite the highlighted high focality of TMS compared to other
non-invasive brain stimulation technologies, the local TMS impact does not remain confined
to the stimulated cortical regions but instead it spreads across network nodes likely conveyed
and constrained by anatomical connectivity patterns. Secondly, our data strengthens prior
evidence in the human brain at rest (i.e., not engaged in any task), showing that short rhythmic
TMS bursts entrain cortical oscillations at the frequency carried by the burst (Thut al., 2011b).
Additionally, they also show that non frequency-specific bursts of TMS (lacking a regular
rhythmic structure), can also modulate cortical oscillatory activity. Namely, these patterns
increased the amplitude and phase-alignment of cortical oscillations in a wide frequency band.
Third and last, our data showed that the loud clicking sounds associated with the delivery of
TMS pulses phase-lock cortical oscillations in a broad frequency band and that, unexpectedly,
such phase-locking effects proved more intense following single pulses than sham TMS bursts.
In sum, our TMS-EEG datasets uncovered novel effects driven by both active and sham
TMS on cortical activity which had not been considered before, particularly for non frequency-
specific active TMS bursts on the left FEF and sham TMS or TMS-like sound patterns. In light

291
of these findings, it appears worthwhile to critically re-examine the design of TMS protocols
and the conclusions that can be derived from such.
IV.1 – Unexpected impact of ‘control’ TMS patterns on EEG activity
As indicated above, some unexpected TMS-EEG findings highlight the need to
understand in further detail the influence on brain activity of TMS conditions or patterns which
are usually used as control conditions, i.e. contrasted to the main TMS patterns of interest. Both
active non frequency-specific (or arrhythmic) TMS patterns and sham TMS have largely been
used as control conditions in active rhythmic TMS experiments (Albouy et al., 2017; Chanes et
al., 2013; Thut et al., 2011b; Vernet et al., 2019). Such experimental designs rely on the
assumption that by contrasting active rhythmic TMS with such controls the specific effect on
brain activity of direct cortical rhythmic stimulation will be isolated. However, this conclusion
holds true only if such ‘control’ conditions carry effects which are independent and do not
interact with the specific effects of active rhythmic TMS. Our findings suggest, unexpectedly,
that this may not be the case. Indeed, in our study on the left FEF, rhythmic and non frequency-
specific TMS showed similar effects on cortical oscillations, consisting in enhancement of
power and phase-locking of cortical oscillations in overlapping frequency bands (Project 2).
Less than a decade ago, rhythmic TMS at an alpha frequency (but not arrhythmic
patterns) was shown to progressively phased-lock natural alpha oscillators in parieto-occipital
areas (Thut et al., 2011b). It is reasonable to assume that rhythmic TMS at a higher frequency
(30 Hz) and in a different cortical region (right or left FEF) entrains cortical oscillations through
a similar mechanism (Thut et al., 2017; Thut et al., 2011a).
The mechanism by which non frequency-specific TMS acts on cortical oscillations
remains however less clear, particularly because, unexpectedly, some configurations of these
TMS patterns ended up increasing high-beta power and phase alignment as strongly as pure
rhythmic 30 Hz stimulation bursts did.
It could be argued that given the strong constraints for the design of TMS bursts
(particularly the minimal time required by rTMS machines to recharge and discharge
consecutive pulses at medium levels of intensity (e.g. at least 20 ms to recharge for 45-55%
intensity pulses) precluding very brief inter-pulse intervals), non frequency-specific patterns
(particularly the random pattern) resulted in sets of bursts very similar in mean frequency as
those delivered by the rhythmic condition and therefore resulting in the same effects on EEG
correlates. This phenomenon was probably not observed in the pioneering study by Thut et al.
2011b, since lower stimulation frequencies leave longer intervals (e.g. alpha 8-12 Hz used in

292
Thut et al. 2011b, with ~100 ms inter-pulse period) for capacitors to recharge, allowing higher
flexibility to randomize inter-pulse intervals and generate further differences between rhythmic
and arrhythmic bursts. In contrast, the higher frequency of our patterns constrained to 30 Hz
bursts (i.e., 33 ms inter-pulse intervals) severely curtailed our ability to produce very distinct
rhythmic vs. non frequency-specific stimulation, reducing the magnitude of EEG and
behavioral differences.
Nonetheless, if this explanation could apply to certain types of non frequency-specific
patterns we designed such as the random pattern (all 3 inter-pulse intervals equal or higher than
20 ms but otherwise randomly jittered trial-to-trial), it is less likely for other types with fixed
very unequal intervals such as the non-uniform rhythmic (24, 51, 24 ms intervals) or the
irregular (40, 25, 35 ms) patterns. Hence alternatively, we also hypothesize that the ability
shown by some specific non frequency-specific patterns to increase high-beta oscillatory
activity to similar levels as rhythmic patterns could also be related to the addition of optimal
levels of noise to a rhythmic signal (Mori & Kai, 2002; Srebro & Malladi, 1999). As a result,
following Stochastic Resonance principles, electromagnetic noise would facilitate instead of
prevent high-beta oscillations, making the net impact of rhythmic and non frequency-specific
patterns on EEG measures similar (though likely mediated by different mechanisms), and
curtailing our ability to observe behavioral differences between these two types of patterns.
Additionally, all our experiments include embedded sham conditions in which the sound
structure of the tested active patterns is presented either by means of an active TMS pulse
delivered with a TMS coil placed in a sham position on the scalp (i.e., preventing the magnetic
field from reaching the cortex) or by playing the sound of a TMS pulse with a speaker mounted
on the active TMS coil. To this regard, our data showed, surprisingly, that the sound of sham
TMS pulses organized in 4 pulse bursts (rhythmic and random) or single sham TMS pulses,
with respect to no-stimulation condition, phase-locked oscillations in central scalp regions,
most likely reflecting activity from the auditory cortex (Project 3). Phase-locking effects were
higher for single sham TMS pulse than for any type of bursts, including the rhythmic burst.
These observations are important as they emphasize the importance of ruling out TMS sound
related phase locking when comparing sham and active control conditions. Evidently, phase-
resetting properties by active TMS pulses, lying at the heart of TMS-driven entrainment
(Rosanova et al., 2009; Thut et al., 2011a), could potentially interact with auditory stimulation-
driven phase-resetting, making it very complex to tease out one from the other on EEG
recordings.

293
In sum, any conclusions about cognition and brain function drawn from TMS experiments
depend not solely on the effects of the active TMS patterns of interest but also on the effect of
the control condition it is contrasted to. To this regard, our findings call for a more careful
examination of specific and non-specific effects on brain activity by TMS patterns used in the
so called ‘control’ conditions, either non-frequency specific patterns employed to isolate the
impact of frequency in entrainment designs, or, most importantly, sham TMS which is widely
used in research and clinical protocols (Duecker & Sack, 2013, 2015).
IV.2 – Network impact and state dependency of frequency-tailored TMS
effects
One of the unique uses of TMS as a brain exploration technology is the manipulation of
brain activity to probe its causal role on brain function. However, pinpointing causal inferences
using this approach is not always as straightforward as presented. For the last two decades, the
strategies behind uses of this method (which, technologically, has hardly changed) has evolved
from ‘virtual lesion’ approaches probing individual regions by taking them transiently ‘offline’
and measuring impact on behavior, to more largely network distributed and physiologically-
inspired approaches (Romei et al., 2016). The need for full hodological approaches have
required concurrent whole brain recording methods such as fMRI or EEG and correlations of
TMS outcomes with diffusion imaging approaches to better understand the extent of its impact
on brain systems. Moreover, stimulation approaches inspired by neurophysiology have helped
to move beyond the assumption that the brain is simply an ensemble of regions that can be
efficiently controlled by any externally delivered TMS pattern, hence placing a focus on
characterizing the spatiotemporal local and distributed coding related to the cognitive and
behavioral processes that we aim to manipulate.
Additionally, two very powerful and related notions have emerged during this transition.
First, the state dependency of TMS effects, indicating that the impact of stimulation is
extremely dependent on (hence should be respectful to) the levels and patterns of ongoing
activity in the target region and its associated network (Silvanto et al., 2008). Second, the
importance to develop TMS approaches that, rather than disrupt the activity of a cortical target,
entrain activity mimicking local and network-distributed coding strategies for a more efficient
manipulation of healthy and impaired behaviors (Thut et al., 2017; Thut & Miniussi, 2009; Thut
et al., 2011a).
294
Following these developments in the field, rhythmic TMS patterns used in the studies of
this thesis achieve effective modulation of behavior by acting primarily on the natural frequency
at which local or extended systems tend to operate and get synchronized (Romei et al., 2016).
However, as a result of such a stimulation approach that capitalizes on the ability to interact
with network-wide activity patterns, TMS shows widely distributed effects which make it
difficult to pinpoint the precise spatio-temporal coding pattern (i.e. oscillatory activity or the
lack thereof on a specific region) that might be causally related to a cognitive function (Thut,
2014).
Indeed, our own datasets show that rhythmic TMS over the right FEF did not only entrain
cortical oscillations in the right FEF, but it also increased phase-synchrony between frontal and
parietal regions and entrained high-beta oscillations in the posterior parietal cortical regions.
Parallel behavioral measurements during TMS-EEG recordings, showed that high-beta
rhythmic patterns enhanced conscious visual perception for near-threshold lateralized targets.
Nonetheless, the fronto-parietal distribution of TMS effects (during and immediately following
stimulation) revealed by TMS-EEG recordings opens the major question of which specific
nodes or groups of nodes other than the manipulated right FEF might contribute the most to
such effects on visual perception. Moreover, although in our studies no cross-frequency
modulations between high-beta and other frequencies were revealed neither locally nor
distantly to the right FEF target, other studies and more complex models of oscillatory
interactions for attentional systems have highlighted possible cross-frequency interactions,
between parieto-occipital theta or alpha, frontal beta and parietal gamma rhythms in attentional
systems (Capotosto et al., 2012; Capotosto et al., 2009; Fiebelkorn et al., 2018; Fiebelkorn &
Kastner, 2019 for a review). Therefore, it could be argued that evidence supporting jointly the
modulation of brain activity and a shift in behavior might not be conclusive to make a reliable
inference of causality between these two events given oscillatory activity spread to other inter-
connected regions or cross-frequency activity at other frequency bands than the one contained
in the stimulation pattern could also contribute to the effect.
In spite of the stated limitations, the causal role for high-beta right frontal oscillations and
fronto-parietal synchronization for the top-down modulation of conscious visual perception
should be considered strong given the support of prior literature that, for the last 20 years, with
correlational or causal approaches in humans or animal models reported findings in this same
direction (Buschman & Miller, 2007; Chanes et al., 2013; Fries et al., 2001; Gregoriou et al.,
2009; Gross et al., 2004; Hipp et al., 2011; Phillips & Takeda, 2009; Quentin et al., 2014, 2015).

295
However, a technological strategy to overcome some of the stated limitations and tease
out the contributions of network synchrony between several nodes from local synchronization
in isolated nodes, and identify cross-frequency interactions, would be to combine traditional
rhythmic mono-focal stimulation with multi-coil (2 or 3 sites simultaneously) TMS approaches.
To our knowledge, no commercially available, CE certified TMS equipment exists that allows
the synchronized use of multiple sources of rhythmic or non frequency-specific TMS via small
coils that can be fitted simultaneously on the scalp and are able to deliver repetitive pulses
without warming up excessively. Hence, while awaiting technological solutions in this
direction, the approaches are logistically complex as several interconnected rTMS machines
and standard figure-of-eight-coils (70 or 45 mm diameter) are needed. Additionally, the safety
of these intervention would need to be assessed and included in international guidelines, so that
ethical committees can allow its uses in experimental procedures. An alternative approach
worth trying that provides much more flexibility, an excellent safety profile and ease of use
would be high density multichannel tACS stimulation. Nonetheless, its poor focality to
modulate specific anatomical locations compared to TMS and its weak effects (unless used at
intensities above 4-6 mA to overcome skin resistance), has lately instilled some controversy in
the field of stimulation with regards to uses in exploratory applications (Lafon et al., 2017;
Vöröslakos et al., 2018; reviewed in Liu et al., 2018).
Another area in which the domain has room for improvement, is state dependency. As
indicated above, since 2008, well-established conceptual and experimental developments have
warned about the need to consider the influence of ongoing cortical activity at the moment of
stimulation (see reviews in Silvanto et al., 2008; Silvanto & Pascual-Leone, 2008). Such state
dependency framework stated the importance of being aware of ongoing activity in the targeted
cortical region and its associated network, most importantly it provided strategies (by priming
the targeted region by means of non-invasive stimulation techniques or task adaptation
approaches) to manipulate activity levels and maximize the effect of stimulation on excitability.
Only more recently this framework was extended to the manipulation of oscillations and
synchrony ( Romei et al., 2016) and emphasized the importance of monitoring via EEG
recordings ‘activity state’. A very influential study, of several published to this regard, showed
that the same stimulation pattern could either strongly enhance cortical oscillations when
delivered in phase with ongoing rhythms or show no effect when delivered out of phase (Ngo
et al., 2013). This finding provides a rather simple rule to be used in TMS protocols (single
pulse or rhythmic TMS) to target specific cortical oscillators by tailoring stimulation to the
optimal cycle phase to maximize intended effects, compared to other oscillators for which

296
stimulation will be delivered in suboptimal phase, hence ineffective. The complexity of this
approach lies in the fact that, to be effective, one needs to be able to put in place a temporally
accurate system to detect and estimate oscillation phase with the least number of cycles possible
to then synchronize the TMS pulse (or burst) delivery so that it hits the target at the right phase.
However, the more complex the EEG metrics that one relies on to drive stimulation, the more
efficient the algorithm needs to be in real time. Eventually, closed-loop systems might be able
to adjust several TMS parameters in real time to the dynamics of brain activity at local or
network level to achieve a desired brain state much more precisely and with less intra-subject
variability than current TMS strategies stimulating trial-by-trial at fixed parameters (Bergmann,
2018; Zrenner et al., 2016). However, as promising and sophisticated as such future
developments for brain stimulation to boost function in the healthy brain or rehabilitate
neurological deficits might be, their development will always rely on better anatomical and
physiological knowledge of brain patterns subtending specific cognitive operations and
behaviors (Bergmann, 2018). The outcomes of this dissertation intend to be a modest
contribution in this direction.
V- Conclusion and final remarks
The work presented in this thesis is in continuity with years of research developed in our
lab on the causal basis of brain activity subtending the top-down modulation of conscious visual
perception, via attentional orienting networks. With regards to prior achievements, the
challenging implementation of TMS-EEG protocols has enabled us to progressively refine our
methodological approaches, designs and knowledge in this cognitive domain and its
manipulation with non-invasive brain stimulation (NIBS). We have progressed from an initial
single pulse TMS study supporting a causal role for the right FEF in the modulation and
conscious visual perception (Chanes et al., 2012), to the use of frequency-tailored TMS on FEF
suggesting a functional role for local high-beta oscillations (Chanes et al., 2013) likely distinct
for the left and right FEF (Chanes et al., 2015). The precious addition of EEG recordings to this
work allows now to enrich this background via causation details on the local and network
activity patterns subtending the top-down modulation of conscious visual perception and, for
the first time, insight on the functional role of neural noise in such processes.
Our findings provide some answers, but as in every complex domain, it essentially opens
new questions and generates new challenges. First, we highlight the need to develop new causal

297
methods to dissect oscillatory contributions of network nodes as isolated or integrated systems.
Second, we contribute to the field a panoply of novel non frequency-specific stimulation
patterns to induce rather unexplored patterns of cortical activity and neural coding (other than
the well-studied local frequency-specific neural oscillations) to manipulate visually guided
behaviors. Last but not least, we underline the importance of a refined characterization of the
sensory accompanying effects carried by TMS to design better control conditions for active
stimulation. We are confident that new approaches in the field of NIBS, in particular those
considering multifocal network approaches, the brain state dependency nature of stimulation
and the likely integration of close loop real time monitoring systems, will be able to increase
the specificity of our interventions and address these new challenges in the years to come.

298
REFERENCES
Albouy, P., Weiss, A., Baillet, S., & Zatorre, R. J. (2017). Selective Entrainment of Theta
Oscillations in the Dorsal Stream Causally Enhances Auditory Working Memory
Performance. Neuron, 94, 193-206.e5.
Bartolomeo, P. (2007). Visual neglect. Current Opinion in Neurology, 20, 381–386.
Bartolomeo, P., Chokron, S., & Gainotti, G. (2001). Laterally directed arm movements and
right unilateral neglect after left hemisphere damage. Neuropsychologia, 39, 1013–1021.
Bartolomeo, P., Thiebaut De Schotten, M., & Chica, A. B. (2012). Brain networks of
visuospatial attention and their disruption in visual neglect. Frontiers in Human
Neuroscience, 6.
Bergmann, T. O. (2018). Brain State-Dependent Brain Stimulation. Frontiers in Psychology, 9.
Bichot, N. P., Rossi, A. F., & Desimone, R. (2005). Parallel and Serial Neural Mechanisms for
Visual Search in Macaque Area V4. Science, 308, 529–534.
Bourgeois, A., Chica, A. B., Valero-Cabré, A., & Bartolomeo, P. (2013a). Cortical control of
inhibition of return: Causal evidence for task-dependent modulations by dorsal and
ventral parietal regions. Cortex, 49, 2229–2238.
Bourgeois, A., Chica, A. B., Valero-Cabré, A., & Bartolomeo, P. (2013b). Cortical control of
Inhibition of Return: Exploring the causal contributions of the left parietal cortex. Cortex,
49, 2927–2934.
Busch, N. A., Dubois, J., & VanRullen, R. (2009). The Phase of Ongoing EEG Oscillations
Predicts Visual Perception. Journal of Neuroscience, 29, 7869–7876.
Buschman, T. J., & Miller, E. K. (2007). Top-Down Versus Bottom-Up Control of Attention
in the Prefrontal and Posterior Parietal Cortices. Science, 315, 1860–1862.
Capotosto, P., Babiloni, C., Romani, G. L., & Corbetta, M. (2012). Differential Contribution of
Right and Left Parietal Cortex to the Control of Spatial Attention: A Simultaneous EEG-
rTMS Study. Cerebral Cortex, 22, 446–454.
Capotosto, P., Babiloni, C., Romani, G. L., & Corbetta, M. (2009). Frontoparietal cortex
controls spatial attention through modulation of anticipatory alpha rhythms. The Journal
of Neuroscience, 29, 5863–5872.
Carrasco, M. (2011). Visual attention: The past 25 years. Vision Research, 51, 1484–1525.
Chanes, L., Chica, A. B., Quentin, R., & Valero-Cabré, A. (2012). Manipulation of Pre-Target
Activity on the Right Frontal Eye Field Enhances Conscious Visual Perception in
Humans. PLoS ONE, 7, e36232.

299
Chanes, L., Quentin, R., Tallon-Baudry, C., & Valero-Cabré, A. (2013). Causal Frequency-
Specific Contributions of Frontal Spatiotemporal Patterns Induced by Non-Invasive
Neurostimulation to Human Visual Performance. The Journal of Neuroscience, 33, 5000–
5005.
Chanes, L., Quentin, R., Vernet, M., & Valero-Cabré, A. (2015). Arrhythmic activity in the left
frontal eye field facilitates conscious visual perception in humans. Cortex, 71, 240–247.
Chaumon, M., & Busch, N. A. (2014). Prestimulus Neural Oscillations Inhibit Visual
Perception via Modulation of Response Gain. Journal of Cognitive Neuroscience, 26,
2514–2529.
Chouinard, P. A., Van Der Werf, Y. D., Leonard, G., & Paus, T. (2003). Modulating Neural
Networks With Transcranial Magnetic Stimulation Applied Over the Dorsal Premotor
and Primary Motor Cortices. Journal of Neurophysiology, 90, 1071–1083.
Collins, J. J., Imhoff, T. T., & Grigg, P. (1996). Noise-enhanced tactile sensation. Nature, 383,
770–770.
Corbetta, M., Kincade, J. M., Ollinger, J. M., McAvoy, M. P., & Shulman, G. L. (2000).
Voluntary orienting is dissociated from target detection in human posterior parietal
cortex. Nature Neuroscience, 3, 292–297.
Corbetta, M., Kincade, J. M., & Shulman, G. L. (2002). Neural Systems for Visual Orienting
and Their Relationships to Spatial Working Memory. Journal of Cognitive Neuroscience,
14, 508–523.
Corbetta, M., Patel, G., & Shulman, G. L. (2008). The reorienting system of the human brain:
From environment to theory of mind. Neuron, 58, 306–324.
Corbetta, M., & Shulman, G. L. (2002). Control of goal-directed and stimulus-driven attention
in the brain. Nature Reviews Neuroscience, 3, 201.
Davare, M., Rothwell, J. C., & Lemon, R. N. (2010). Causal Connectivity between the Human
Anterior Intraparietal Area and Premotor Cortex during Grasp. Current Biology, 20, 176–
181.
Downar, J., Crawley, A. P., Mikulis, D. J., & Davis, K. D. (2000). A multimodal cortical
network for the detection of changes in the sensory environment. Nature Neuroscience,
3, 277–283.
Duecker, F., & Sack, A. T. (2013). Pre-Stimulus Sham TMS Facilitates Target Detection. PLoS
ONE, 8, e57765.
Duecker, F., & Sack, A. T. (2015). Rethinking the role of sham TMS. Frontiers in Psychology,
6.

300
Dugué, L., Marque, P., & VanRullen, R. (2011). The phase of ongoing oscillations mediates
the causal relation between brain excitation and visual perception. The Journal of
Neuroscience, 31, 11889–11893.
Dugué, L., Roberts, M., & Carrasco, M. (2016). Attention Reorients Periodically. Current
Biology, 26, 1595–1601.
Dugué, L., & VanRullen, R. (2017). Transcranial Magnetic Stimulation Reveals Intrinsic
Perceptual and Attentional Rhythms. Frontiers in Neuroscience, 11.
Engel, A. K., Fries, P., & Singer, W. (2001). Dynamic Predictions: Oscillations and Synchrony
in Top-down Processing. Nature Reviews Neuroscience, 2, 704–716.
Fiebelkorn, I. C., & Kastner, S. (2019). A Rhythmic Theory of Attention. Trends in Cognitive
Sciences, 23, 87–101.
Fiebelkorn, I. C., Pinsk, M. A., & Kastner, S. (2018). A Dynamic Interplay within the
Frontoparietal Network Underlies Rhythmic Spatial Attention. Neuron, 99, 842-853.e8.
Foxe, J. J., & Snyder, A. C. (2011). The Role of Alpha-Band Brain Oscillations as a Sensory
Suppression Mechanism during Selective Attention. Frontiers in Psychology, 2.
Fries, P. (2005). A mechanism for cognitive dynamics: Neuronal communication through
neuronal coherence. Trends in Cognitive Sciences, 9, 474–480.
Fries, P. (2009). Neuronal Gamma-Band Synchronization as a Fundamental Process in Cortical
Computation. Annual Review of Neuroscience, 32, 209–224.
Fries, P., Reynolds, J. H., Rorie, A. E., & Desimone, R. (2001). Modulation of oscillatory
neuronal synchronization by selective visual attention. Science, 291, 1560–1563.
Gregoriou, G. G., Gotts, S. J., Zhou, H., & Desimone, R. (2009). High-frequency, long-range
coupling between prefrontal and visual cortex during attention. Science, 324, 1207–1210.
Groen, O. van der, & Wenderoth, N. (2016). Transcranial Random Noise Stimulation of Visual
Cortex: Stochastic Resonance Enhances Central Mechanisms of Perception. Journal of
Neuroscience, 36, 5289–5298.
Grosbras, M.-H., & Paus, T. (2002). Transcranial Magnetic Stimulation of the Human Frontal
Eye Field: Effects on Visual Perception and Attention. Journal of Cognitive
Neuroscience, 14, 1109–1120.
Grosbras, M.-H., & Paus, T. (2003). Transcranial magnetic stimulation of the human frontal
eye field facilitates visual awareness. European Journal of Neuroscience, 18, 3121–3126.
Gross, J., Schmitz, F., Schnitzler, I., Kessler, K., Shapiro, K., Hommel, B., & Schnitzler, A.
(2004). Modulation of long-range neural synchrony reflects temporal limitations of visual

301
attention in humans. Proceedings of the National Academy of Sciences, 101, 13050–
13055.
Hipp, J. F., Engel, A. K., & Siegel, M. (2011). Oscillatory Synchronization in Large-Scale
Cortical Networks Predicts Perception. Neuron, 69, 387–396.
Huang, Y., Chen, L., & Luo, H. (2015). Behavioral Oscillation in Priming: Competing
Perceptual Predictions Conveyed in Alternating Theta-Band Rhythms. Journal of
Neuroscience, 35, 2830–2837.
Iliopoulos, F., Nierhaus, T., & Villringer, A. (2014). Electrical noise modulates perception of
electrical pulses in humans: Sensation enhancement via stochastic resonance. Journal of
Neurophysiology, 111, 1238–1248.
Jaegle, A., & Ro, T. (2014). Direct Control of Visual Perception with Phase-specific
Modulation of Posterior Parietal Cortex. Journal of Cognitive Neuroscience, 26, 422–
432.
Kagan, I., Iyer, A., Lindner, A., & Andersen, R. A. (2010). Space representation for eye
movements is more contralateral in monkeys than in humans. Proceedings of the National
Academy of Sciences, 107, 7933–7938.
Kitajo, K., Nozaki, D., Ward, L. M., & Yamamoto, Y. (2003). Behavioral Stochastic Resonance
within the Human Brain. Physical Review Letters, 90.
Klimesch, W., Sauseng, P., & Hanslmayr, S. (2007). EEG alpha oscillations: The inhibition–
timing hypothesis. Brain Research Reviews, 53, 63–88.
Lafon, B., Henin, S., Huang, Y., Friedman, D., Melloni, L., Thesen, T., … Liu, A. A. (2017).
Low frequency transcranial electrical stimulation does not entrain sleep rhythms
measured by human intracranial recordings. Nature Communications, 8, 1–14.
Landau, A. N., & Fries, P. (2012). Attention Samples Stimuli Rhythmically. Current Biology,
22, 1000–1004.
Landau, A. N., Schreyer, H. M., van Pelt, S., & Fries, P. (2015). Distributed Attention Is
Implemented through Theta-Rhythmic Gamma Modulation. Current Biology, 25, 2332–
2337.
Liu, A., Vöröslakos, M., Kronberg, G., Henin, S., Krause, M. R., Huang, Y., … Buzsáki, G.
(2018). Immediate neurophysiological effects of transcranial electrical stimulation.
Nature Communications, 9, 1–12.
Manjarrez, E., Mendez, I., Martinez, L., Flores, A., & Mirasso, C. R. (2007). Effects of auditory
noise on the psychophysical detection of visual signals: Cross-modal stochastic
resonance. Neuroscience Letters, 415, 231–236.

302
Marshall, T. R., O’Shea, J., Jensen, O., & Bergmann, T. O. (2015). Frontal Eye Fields Control
Attentional Modulation of Alpha and Gamma Oscillations in Contralateral
Occipitoparietal Cortex. Journal of Neuroscience, 35, 1638–1647.
Mathewson, K. E., Gratton, G., Fabiani, M., Beck, D. M., & Ro, T. (2009). To see or not to see:
Prestimulus alpha phase predicts visual awareness. The Journal of Neuroscience: The
Official Journal of the Society for Neuroscience, 29, 2725–2732.
Mathewson, K. E., Lleras, A., Beck, D. M., Fabiani, M., Ro, T., & Gratton, G. (2011). Pulsed
Out of Awareness: EEG Alpha Oscillations Represent a Pulsed-Inhibition of Ongoing
Cortical Processing. Frontiers in Psychology, 2.
Moore, T., & Armstrong, K. M. (2003). Selective gating of visual signals by microstimulation
of frontal cortex. Nature, 421, 370–373.
Mori, T., & Kai, S. (2002). Noise-induced entrainment and stochastic resonance in human brain
waves. Physical Review Letters, 88, 218101.
Moss, F., Ward, L. M., & Sannita, W. G. (2004). Stochastic resonance and sensory information
processing: A tutorial and review of application. Clinical Neurophysiology, 115, 267–
281.
Ngo, H.-V. V., Martinetz, T., Born, J., & Mölle, M. (2013). Auditory Closed-Loop Stimulation
of the Sleep Slow Oscillation Enhances Memory. Neuron, 78, 545–553.
Paus, T., Jech, R., Thompson, C. J., Comeau, R., Peters, T., & Evans, A. C. (1997). Transcranial
magnetic stimulation during positron emission tomography: A new method for studying
connectivity of the human cerebral cortex. The Journal of Neuroscience, 17, 3178–3184.
Phillips, S., & Takeda, Y. (2009). Greater frontal-parietal synchrony at low gamma-band
frequencies for inefficient than efficient visual search in human EEG. International
Journal of Psychophysiology, 73, 350–354.
Plewnia, C., Rilk, A. J., Soekadar, S. R., Arfeller, C., Huber, H. S., Sauseng, P., … Gerloff, C.
(2008). Enhancement of long-range EEG coherence by synchronous bifocal transcranial
magnetic stimulation. European Journal of Neuroscience, 27, 1577–1583.
Quentin, R., Chanes, L., Vernet, M., & Valero-Cabre, A. (2014). Fronto-Parietal Anatomical
Connections Influence the Modulation of Conscious Visual Perception by High-Beta
Frontal Oscillatory Activity. Cerebral Cortex, 25, 2095–2101.
Quentin, R., Elkin Frankston, S., Vernet, M., Toba, M. N., Bartolomeo, P., Chanes, L., &
Valero-Cabré, A. (2015). Visual Contrast Sensitivity Improvement by Right Frontal
High-Beta Activity Is Mediated by Contrast Gain Mechanisms and Influenced by Fronto-
Parietal White Matter Microstructure. Cerebral Cortex, 26, 2381–2390.

303
Ro, T., Farnè, A., & Chang, E. (2003). Inhibition of return and the human frontal eye fields.
Experimental Brain Research, 150, 290–296.
Rodriguez, E., George, N., Lachaux, J.-P., Martinerie, J., Renault, B., & Varela, F. J. (1999).
Perception’s shadow: Long-distance synchronization of human brain activity. Nature,
397, 430.
Romei, V., Gross, J., & Thut, G. (2010). On the Role of Prestimulus Alpha Rhythms over
Occipito-Parietal Areas in Visual Input Regulation: Correlation or Causation? Journal of
Neuroscience, 30, 8692–8697.
Romei, V., Thut, G., & Silvanto, J. (2016). Information-Based Approaches of Noninvasive
Transcranial Brain Stimulation. Trends in Neurosciences, 39, 782–795.
Rosanova, M., Casali, A., Bellina, V., Resta, F., Mariotti, M., & Massimini, M. (2009). Natural
Frequencies of Human Corticothalamic Circuits. Journal of Neuroscience, 29, 7679–
7685.
Saalmann, Y. B., Pigarev, I. N., & Vidyasagar, T. R. (2007). Neural mechanisms of visual
attention: How top-down feedback highlights relevant locations. Science, 316, 1612–
1615.
Sauseng, P., Klimesch, W., Stadler, W., Schabus, M., Doppelmayr, M., Hanslmayr, S., …
Birbaumer, N. (2005). A shift of visual spatial attention is selectively associated with
human EEG alpha activity. The European Journal of Neuroscience, 22, 2917–2926.
Shepherd, M., & Müller, H. J. (1989). Movement versus focusing of visual attention.
Perception & Psychophysics, 46, 146–154.
Shulman, G. L., Pope, D. L. W., Astafiev, S. V., McAvoy, M. P., Snyder, A. Z., & Corbetta,
M. (2010). Right Hemisphere Dominance during Spatial Selective Attention and Target
Detection Occurs Outside the Dorsal Frontoparietal Network. Journal of Neuroscience,
30, 3640–3651.
Silvanto, J., Lavie, N., & Walsh, V. (2006). Stimulation of the Human Frontal Eye Fields
Modulates Sensitivity of Extrastriate Visual Cortex. Journal of Neurophysiology, 96,
941–945.
Silvanto, J., Muggleton, N., Lavie, N., & Walsh, V. (2009). The Perceptual and Functional
Consequences of Parietal Top-Down Modulation on the Visual Cortex. Cerebral Cortex,
19, 327–330.
Silvanto, J., Muggleton, N., & Walsh, V. (2008). State-dependency in brain stimulation studies
of perception and cognition. Trends in Cognitive Sciences, 12, 447–454.

304
Silvanto, J., & Pascual-Leone, A. (2008). State-Dependency of Transcranial Magnetic
Stimulation. Brain Topography, 21, 1–10.
Simonotto, E., Riani, M., Seife, C., Roberts, M., Twitty, J., & Moss, F. (1997). Visual
Perception of Stochastic Resonance. Physical Review Letters, 78, 1186–1189.
Smith, D. T., Jackson, S. R., & Rorden, C. (2005). Transcranial magnetic stimulation of the left
human frontal eye fields eliminates the cost of invalid endogenous cues.
Neuropsychologia, 43, 1288–1296.
Srebro, R., & Malladi, P. (1999). Stochastic resonance of the visually evoked potential.
Physical Review E, 59, 2566–2570.
Taylor, P. C. J., Nobre, A. C., & Rushworth, M. F. S. (2007). FEF TMS Affects Visual Cortical
Activity. Cerebral Cortex, 17, 391–399.
Thiebaut de Schotten, M., Dell’Acqua, F., Forkel, S. J., Simmons, A., Vergani, F., Murphy, D.
G. M., & Catani, M. (2011). A lateralized brain network for visuospatial attention. Nature
Neuroscience, 14, 1245–1246.
Thiebaut de Schotten, M., Tomaiuolo, F., Aiello, M., Merola, S., Silvetti, M., Lecce, F., …
Doricchi, F. (2014). Damage to white matter pathways in subacute and chronic spatial
neglect: A group study and 2 single-case studies with complete virtual “in vivo”
tractography dissection. Cerebral Cortex, 24, 691–706.
Thiebaut de Schotten, M., Urbanski, M., Duffau, H., Volle, E., Lévy, R., Dubois, B., &
Bartolomeo, P. (2005). Direct Evidence for a Parietal-Frontal Pathway Subserving Spatial
Awareness in Humans. Science, 309, 2226–2228.
Thut, G. (2014). Modulating Brain Oscillations to Drive Brain Function. PLOS Biology, 12,
e1002032.
Thut, G., Bergmann, T. O., Fröhlich, F., Soekadar, S. R., Brittain, J.-S., Valero-Cabré, A., …
Herrmann, C. S. (2017). Guiding transcranial brain stimulation by EEG/MEG to interact
with ongoing brain activity and associated functions: A position paper. Clinical
Neurophysiology, 128, 843–857.
Thut, G., & Miniussi, C. (2009). New insights into rhythmic brain activity from TMS–EEG
studies. Trends in Cognitive Sciences, 13, 182–189.
Thut, G., Nietzel, A., Brandt, S. A., & Pascual-Leone, A. (2006). Alpha-band
electroencephalographic activity over occipital cortex indexes visuospatial attention bias
and predicts visual target detection. The Journal of Neuroscience, 26, 9494–9502.

305
Thut, G., Schyns, P. G., & Gross, J. (2011). Entrainment of Perceptually Relevant Brain
Oscillations by Non-Invasive Rhythmic Stimulation of the Human Brain. Frontiers in
Psychology, 2.
Thut, G., Veniero, D., Romei, V., Miniussi, C., Schyns, P., & Gross, J. (2011). Rhythmic TMS
Causes Local Entrainment of Natural Oscillatory Signatures. Current Biology, 21, 1176–
1185.
Valero-Cabré, A., Payne, B. R., Rushmore, J., Lomber, S. G., & Pascual-Leone, A. (2005).
Impact of repetitive transcranial magnetic stimulation of the parietal cortex on metabolic
brain activity: A 14C-2DG tracing study in the cat. Experimental Brain Research, 163,
1–12.
Vernet, M., Quentin, R., Chanes, L., Mitsumasu, A., & Valero-Cabré, A. (2014). Frontal eye
field, where art thou? Anatomy, function, and non-invasive manipulation of frontal
regions involved in eye movements and associated cognitive operations. Frontiers in
Integrative Neuroscience, 8, 66.
Vernet, M., Stengel, C., Quentin, R., Amengual, J. L., & Valero-Cabré, A. (2019). Entrainment
of local synchrony reveals a causal role for high-beta right frontal oscillations in human
visual consciousness. Sci Rep, 9, 14510.
Vöröslakos, M., Takeuchi, Y., Brinyiczki, K., Zombori, T., Oliva, A., Fernández-Ruiz, A., …
Berényi, A. (2018). Direct effects of transcranial electric stimulation on brain circuits in
rats and humans. Nature Communications, 9, 483.
Worden, M. S., Foxe, J. J., Wang, N., & Simpson, G. V. (2000). Anticipatory biasing of
visuospatial attention indexed by retinotopically specific alpha-band
electroencephalography increases over occipital cortex. The Journal of Neuroscience, 20,
RC63.
Zeng, F.-G., Fu, Q.-J., & Morse, R. (2000). Human hearing enhanced by noise. Brain Research,
869, 251–255.
Zrenner, C., Belardinelli, P., Müller-Dahlhaus, F., & Ziemann, U. (2016). Closed-Loop
Neuroscience and Non-Invasive Brain Stimulation: A Tale of Two Loops. Frontiers in
Cellular Neuroscience, 10.


