Embed Size (px)
Citation preview

ReseaRch aRticle
▼
http://californiaagriculture.ucanr.edu • JULY–SEPTEMBER 2013 147
Fumigant emission reductions with TIF warrant regulatory changes
by Husein Ajwa, Michael S. Stanghellini,
Suduan Gao, David A. Sullivan, Afiqur Khan,
William Ntow and Ruijun Qin*
With methyl bromide’s phase-out, most growers have turned to alternative fumi-gants, particularly 1,3-dichloropropene (1,3-D) and chloropicrin. These alterna-tives are tightly regulated because they are classified as toxic air contaminants and volatile organic compounds; the latter combine with other substances to produce ground-level ozone (smog). Two ambient air monitoring studies were conducted to evaluate the potential of totally impermeable film (TIF) to reduce emissions from shank applications of chloropicrin and 1,3-D. In 2009, a study demonstrated that TIF reduced chlo-ropicrin and 1,3-D peak emissions by 45% and 38%, respectively, but TIF did not reduce total emissions when it was cut after 6 days. In 2011, increasing the tarp period from 5 to 10 days decreased chloropicrin and 1,3-D peak emissions by 88% and 78%, and their total emissions by 64% and 43%, respectively. Concur-rent dynamic flux chamber results cor-roborated the ambient air monitoring data. These studies provide regulatory agencies with mitigation measures that should allow continued fumigant use at efficacious application rates.
As the availability of methyl bromide diminishes, the use of products con-
taining chloropicrin and 1,3-dichloropro-pene (1,3-D; Telone II) are becoming the new standard fumigant treatments. Vari-ous formulations of them are injected into the soil at depths of 8 to 24 inches using tractor-mounted injection shanks, or they are applied via chemigation, in a drip ir-rigation system.
1,3-D is an excellent nematicide with some broad-spectrum activity, and it is often applied as the sole active ingredient
for crops that are primarily subject to nematode infestation. It is commonly combined with chloropicrin to enhance control of soilborne pathogenic fungi.
Chloropicrin has excellent fungicidal properties with some broad-spectrum activity, and it can be applied as the sole active ingredient for crops that are primarily under disease pressure. Chloropicrin is most often combined with either methyl bromide or 1,3-D to enhance control of other soil pests, such as nema-todes and weeds.
1,3-D is regulated in California on a township cap basis (see page 122). Chloropicrin use, since December 2012, is restricted by U.S. Environmental Protection Agency (US EPA) buffer zone regulations; and all fumigants are limited by the California Department of Pesticide Regulation (DPR) in designated areas with air pollution problems. As part of the 2008 Reregistration Eligibility Decision (RED) for chloropicrin, the US EPA (2009) proposed substantial label changes for chloropicrin to mitigate potential expo-sure resulting from soil fumigation. The new requirements, which took full effect in December 2012, implement nationwide
buffer zones for all chloropicrin prod-ucts. Buffer zones are setback distances between a treated field and any occupied structure, designed to mitigate potential bystander exposure to peak emissions. Also in 2008, the California EPA (Cal EPA) Department of Pesticide Regulation (DPR) issued a series of regulations regarding volatile organic compound (VOC) emis-sions and subsequent limitations on how, when and where certain fumigants can be used (CDPR 2009). The DPR VOC regula-tions address cumulative amount of fumi-gant emissions over several days, rather than the highest emission value from treated fields; some fumigant VOC emis-sions react with nitrous oxide compounds (generated by vehicles, industrial pro-cesses, etc.) and contribute to ground-level ozone, a pollutant that affects the air qual-ity in several air basins in California such as the Sacramento Valley, San Joaquin Valley, Southeast Desert, South Coast, and Ventura County. The regulations on
Online: http://californiaagriculture.ucanr.edu/ landingpage.cfm?article=ca.v067n03p147&fulltext=yes
doi: 10.3733/ca.v067n03p147
Recent studies demonstrate that totally impermeable film (TIF) can significantly reduce peak and total emissions of chloropicrin and 1,3-D when tarping periods are extended from 5 days to 10 days. Above, TIF application at Lost Hills, Kern County.
Mik
e St
angh
ellin
i
* "Ruijun Quin" was corrected to "Ruijun Qin" after press run.

148 CaLifoRnia agRiCULTURE • VoLUME 67, nUMBER 3
Davi
d M
iller
fumigant-use patterns in these VOC non-attainment areas (NAAs) will continue to limit fumigant use in the NAAs.
Field trials conducted in the last few years have evaluated various surface sealing methods or treatments to reduce fumigant emissions during soil fumiga-tion. These include different applica-
tion methods, organic and chemical soil amendments, different tarping materials and supplemental irrigation (water seals) (e.g., Cabrera et al. 2011; Fennimore and Ajwa 2011; Gao et al. 2009, 2011). While several strategies effectively reduce fumigant emissions, some of them are impractical (e.g., lack of water precludes the use of water sealing) or may come at the expense of reduced efficacy if they impede the soil dispersion potential of the fumigant (Hanson et al. in press; Jhala et al. 2012).
The most promising and practical strategy, to date, appears to be the adop-tion of low-permeability tarps, collectively called virtually impermeable films (VIFs). Traditional VIFs contain a nylon vapor-barrier layer; a relatively new type of low-permeability film, totally impermeable
film (TIF), contains an ethyl vinyl alcohol (EVOH) resin vapor-barrier layer.
We collected field data from two tri-als to help regulatory agencies make decisions on the adoption of TIF for soil fumigation. We recorded peak emission levels, which are used to set buffer zones, and total emission levels, which relate to
the VOC regula-tions. The trials included broad-cast applications of chloropicrin, 1,3-dichloropro-pene (1,3-D) and
mixtures of the two (coformulated end-use products).
Materials and methods
We conducted two field trials to evalu-ate the potential of TIF to reduce fumigant peak and total emissions: the first in 2009 near Oxnard, Ventura County, and the second in 2011 near Lost Hills, Kern County. Both sites were located in air basins designated by DPR as VOC non-attainment areas (NAAs), where fumigant use is restricted (see page 122).
All fields were prepared in accordance with the product-labeled mandatory good agricultural practices (GAPs), which are a suite of application guidelines on proper soil preparation, appropriate soil mois-ture, weather considerations, application parameters and other factors. The test
field plots were chosen to reflect represen-tative sandy loam California fumigated soils, typical seasons of application and typical application equipment.
In both trials, chloropicrin and 1,3-D emissions from the broadcast fields were determined by measuring ambient air concentrations in 8 to 16 directions (depending on field size and shape) sur-rounding the field. Measurements were recorded for 6-hour periods for the first 48 hours, then every 12 hours for the re-mainder of the study except during tarp cutting and removal, when the sampling reverted to 6-hour intervals.
Air was pumped through ANASORB CSC (coconut charcoal; SKC tube 226-109) and XAD-4 solid sorbent tubes to cap-ture any 1,3-D and chloropicrin, respec-tively, in the air at each sampling period. Chloropicrin and 1,3-D were extracted from the respective sorbent tubes using analytical methods developed by the CDFA, and both were analyzed by gas chromatography using a micro electron capture detector. The Industrial Source Complex (ISCST3) Dispersion Model was used to determine chloropicrin and 1,3-D flux values using the analytical results coupled with concurrent meteorological data that were collected during air moni-toring. On-site meteorological stations collected relevant data, including wind speed, wind direction, ambient air tem-perature, relative humidity, solar radia-tion and precipitation.
Fumigant permeation through TIF was also determined using the dynamic flux chamber method, whereby flow-through chambers were placed directly on top of the TIF. A constant air flow through the chamber swept the air above the tarp, allowing fumigant emissions passing through the tarp to be trapped at the chamber outlet using XAD-4 resin sampling tubes; these tubes were later extracted and analyzed using gas chro-matography with a micro electron cap-ture detector. The dynamic flux chamber was operated continuously, with 3- to 6-hour intervals between exchanging sampling tubes.
Flux was calculated based on fumigant concentration captured in the chamber, sampling area, sampling time and flow rate. Detailed chamber methodology in-formation can be found in Gao and Wang (2011). The dynamic flux chamber method monitors fumigant emissions at ground
The significant emissions reductions obtained when using TIF should allow regulatory agencies to provide relief to growers.
To monitor fumigant emissions at ground level, researchers used dynamic flux chamber equipment, above, to confirm and interpret the ambient air monitoring data.

http://californiaagriculture.ucanr.edu • JULY–SEPTEMBER 2013 149
level (the tarp-air interface) and was used to help confirm and interpret the ambi-ent air monitoring data — in particular, it increased our confidence in data collected from large fields.
The polyethylene tarp used was a standard commercial broadcast tarp (1-mil high-barrier film by Cadillac Products Packaging Company, Troy, MI) that complied with the methyl bromide tarp permeability requirements of Title 3, California Code of Regulations, Section 6450(e). The TIF, VaporSafe, was manu-factured by Raven Industries (Sioux Falls, SD). In the 2009 trial, the TIF used was an experimental 10.5-foot-wide film. In 2011, the TIF was a 13-foot-wide commercially viable film.
2009 Oxnard trial
Two broadcast application fields, ap-proximately 1 acre each, were separated by several miles to prevent cross-contam-ination. Air sampling was conducted at the beginning of each application (Sept. 10) and continued for 13 days (Sept. 23). Tarp cutting occurred 6 days after ap-plication (Sept. 16). An experimental 50:50 mixture of chloropicrin and 1,3-D was applied in both fields via broadcast shank at a 12-inch injection depth and at a rate of 281.2 pounds of product per acre in Field 1 and 275.0 pounds per acre in Field 2. Field 1 was tarped with 10.5-foot-wide, 1-mil, clear polyethylene film. Field 2 was
tarped with 10.5-foot-wide, 1-mil, clear TIF (table 1).
A certified applicator applied the fumi-gants using a closed, pressurized, winged shank injection system (Noble plow). Soil type in Field 1 (polyethylene tarp) was a Hueneme sandy loam (coarse loamy, mixed, superactive, calcareous, thermic Oxyaquic Xerofluvents). Soil type in Field 2 (TIF) was a Metz loamy sand (sandy, mixed, thermic Typic Xerofluvents).
2011 Lost Hills trial
This study was designed to deter-mine the effectiveness of TIF in reduc-ing emission rates and total mass loss of
chloropicrin and 1,3-D and to show the extent that peaks associated with tarp cut-ting change as a function of tarp deploy-ment period. Comparative emissions data were generated from three 12-inch-deep broadcast shank applications of a 60:40 chloropicrin and 1,3-D co-formulated end-use product (Pic-Clor 60). The three fields were in close proximity to one another to enable concurrent air monitoring and to ensure that meteorological and soil condi-tions were similar.
The applications were made on one 8-acre field (Field 1) and two 2-acre fields (Fields 2 and 3) near Lost Hills on June 4. The two 2-acre fields were separated by approximately 830 feet to prevent cross-contamination. The 8-acre field was at least 4,900 feet from the other fields. Air monitoring was conducted concurrently at each field starting at the beginning of application and continuing until 48 hours after the time of tarp cutting in each field. All fields had the same application sce-nario: Pic-Clor 60 applied via broadcast shank at a 12-inch injection depth with a target rate of 588 pounds of product per acre (equivalent to 350 pounds chlo-ropicrin per acre plus 238 pounds 1,3-D per acre).
Soil type in all three fields was Milham sandy loam (fine loamy, mixed, superactive, thermic Typic Haplargids) except for one corner of Field 1, which contained Kimberlina fine sandy loam (coarse loamy, mixed, superactive, calcare-ous, thermic Typic Torriorthents).
The only major difference between the three fields was the duration of tarp de-ployment. Field 1 was tarped for 16 days,
Data from the Oxnard trial indicate that a longer tarp-covering period than the standard 5 days is needed to reduce emissions associated with tarp cutting. Above, broadcast shank fumigation under TIF, Oxnard, Ventura County, September 2009.
Huse
in A
jwa
TABLE 1. Broadcast shank application scenarios in ambient air monitoring field trials in Oxnard 2009 and Lost Hills 2011
Location Field Soil sealing
method Days totarp cut
Injection depth
Formulated product*application rate
inches lb/acre
Oxnard 1 Polyethylene 6 12 Pic-Clor 50281.2
Oxnard 2 TIF 6 12 Pic-Clor 50275.0
Lost Hills 1 TIF 16 12 Pic-Clor 60571.3
Lost Hills 2 TIF 10 12 Pic-Clor 60547.0
Lost Hills 3 TIF 5 12 Pic-Clor 60593.6
* Pic-Clor 50 is a 50:50 mixture of chloropicrin and 1,3-D. Pic-Clor 60 is a 60:40 mixture of chloropicrin and 1,3-D.
150 CaLifoRnia agRiCULTURE • VoLUME 67, nUMBER 3
Field 2 for 10 days, and Field 3 for 5 days (table 1).
Oxnard trial results
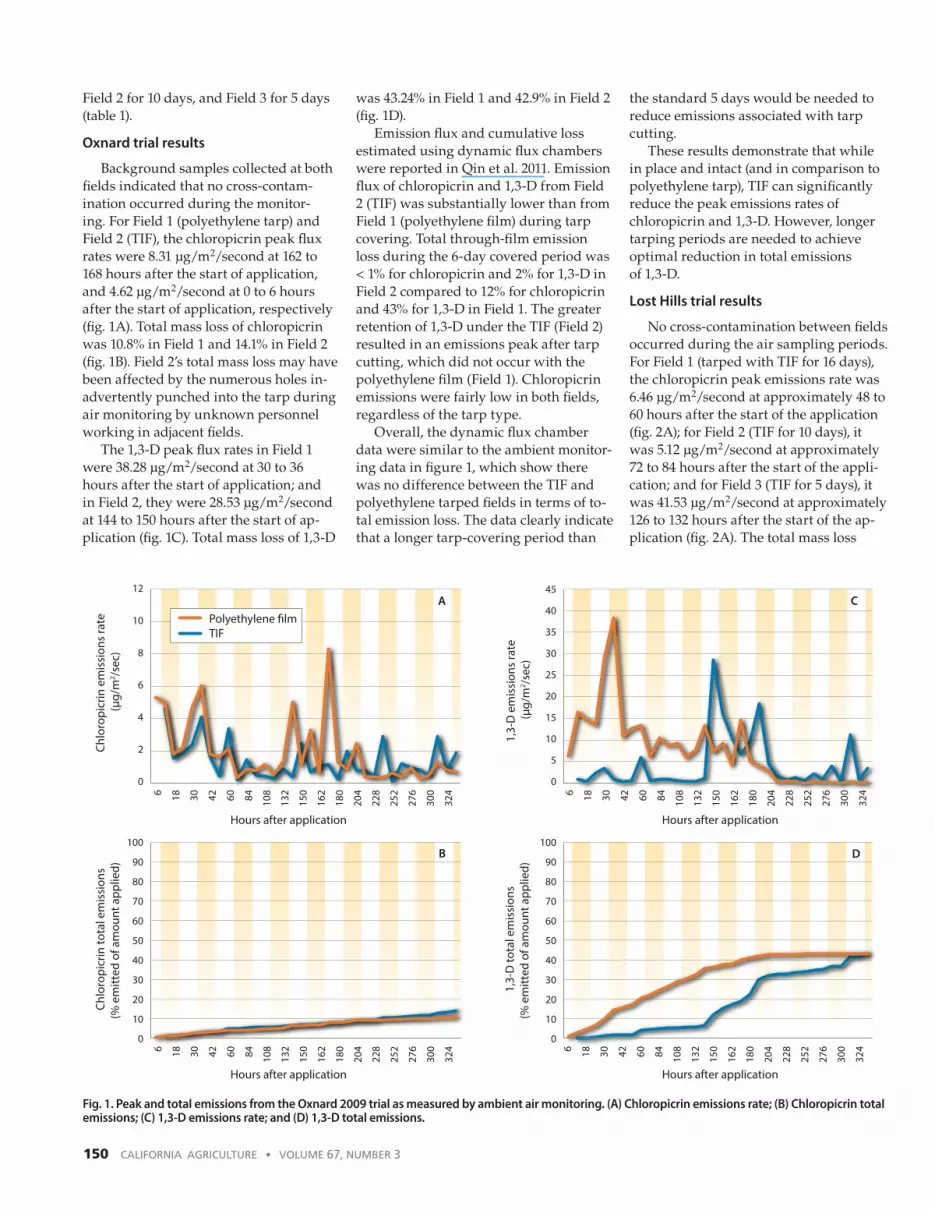
Background samples collected at both fields indicated that no cross-contam-ination occurred during the monitor-ing. For Field 1 (polyethylene tarp) and Field 2 (TIF), the chloropicrin peak flux rates were 8.31 µg/m2/second at 162 to 168 hours after the start of application, and 4.62 µg/m2/second at 0 to 6 hours after the start of application, respectively (fig. 1A). Total mass loss of chloropicrin was 10.8% in Field 1 and 14.1% in Field 2 (fig. 1B). Field 2’s total mass loss may have been affected by the numerous holes in-advertently punched into the tarp during air monitoring by unknown personnel working in adjacent fields.
The 1,3-D peak flux rates in Field 1 were 38.28 µg/m2/second at 30 to 36 hours after the start of application; and in Field 2, they were 28.53 µg/m2/second at 144 to 150 hours after the start of ap-plication (fig. 1C). Total mass loss of 1,3-D
was 43.24% in Field 1 and 42.9% in Field 2 (fig. 1D).
Emission flux and cumulative loss estimated using dynamic flux chambers were reported in Qin et al. 2011. Emission flux of chloropicrin and 1,3-D from Field 2 (TIF) was substantially lower than from Field 1 (polyethylene film) during tarp covering. Total through-film emission loss during the 6-day covered period was < 1% for chloropicrin and 2% for 1,3-D in Field 2 compared to 12% for chloropicrin and 43% for 1,3-D in Field 1. The greater retention of 1,3-D under the TIF (Field 2) resulted in an emissions peak after tarp cutting, which did not occur with the polyethylene film (Field 1). Chloropicrin emissions were fairly low in both fields, regardless of the tarp type.
Overall, the dynamic flux chamber data were similar to the ambient monitor-ing data in figure 1, which show there was no difference between the TIF and polyethylene tarped fields in terms of to-tal emission loss. The data clearly indicate that a longer tarp-covering period than
the standard 5 days would be needed to reduce emissions associated with tarp cutting.
These results demonstrate that while in place and intact (and in comparison to polyethylene tarp), TIF can significantly reduce the peak emissions rates of chloropicrin and 1,3-D. However, longer tarping periods are needed to achieve optimal reduction in total emissions of 1,3-D.
Lost Hills trial results
No cross-contamination between fields occurred during the air sampling periods. For Field 1 (tarped with TIF for 16 days), the chloropicrin peak emissions rate was 6.46 µg/m2/second at approximately 48 to 60 hours after the start of the application (fig. 2A); for Field 2 (TIF for 10 days), it was 5.12 µg/m2/second at approximately 72 to 84 hours after the start of the appli-cation; and for Field 3 (TIF for 5 days), it was 41.53 µg/m2/second at approximately 126 to 132 hours after the start of the ap-plication (fig. 2A). The total mass loss
Fig. 1. Peak and total emissions from the Oxnard 2009 trial as measured by ambient air monitoring. (A) Chloropicrin emissions rate; (B) Chloropicrin total emissions; (C) 1,3-D emissions rate; and (D) 1,3-D total emissions.
6 18 30 42 60 84 108
132
150
162
180
204
228
252
276
300
324
6 18 30 42 60 84 108
132
150
162
180
204
228
252
276
300
324
6 18 30 42 60 84 108
132
150
162
180
204
228
252
276
300
324
6 18 30 42 60 84 108
132
150
162
180
204
228
252
276
300
324
0
5
10
15
20
25
30
35
40
45
0
2
4
6
8
10
12
0
10
20
30
40
50
60
70
80
90
100
0
10
20
30
40
50
60
70
80
90
100
Chlo
ropi
crin
em
issi
ons
rate
(µ
g/m
2 /sec
)Ch
loro
picr
in to
tal e
mis
sion
s(%
em
itted
of a
mou
nt a
pplie
d)
Hours after application Hours after application
Hours after application Hours after application
1,3-
D to
tal e
mis
sion
s(%
em
itted
of a
mou
nt a
pplie
d)
1,3-
D e
mis
sion
s ra
te
(µg/
m2 /s
ec)
A C
B D
Polyethylene �lmTIF

http://californiaagriculture.ucanr.edu • JULY–SEPTEMBER 2013 151
for chloropicrin was 4.5% (Field 1), 3.6% (Field 2) and 10.0% (Field 3) (fig. 2B).
For Field 1 (TIF for 16 days), the 1,3-D peak emissions rate was 6.49 µg/m2/sec-ond at approximately 30 to 36 hours after the start of the application (fig. 2C); for Field 2 (TIF for 10 days), it was 10.63 µg/m2/second at approximately 246 to 252 hours after the start of the application; and for Field 3 (TIF for 5 days), it was 47.29 µg/m2/second at approximately 126 to 132 hours after the start of the application (fig. 2C). The total mass loss for 1,3-D was 10.2% (Field 1), 10.9% (Field 2) and 19.1% (Field 3) (fig. 2D).
Emission flux and total emission loss measured in Field 1 by the dynamic flux chamber method are shown in figure 3 (A-D). Over the 16-day tarp period, cumulative emission losses before tarp cutting were 5.7% for chloropicrin and 7.4% for 1,3-D, respectively (fig. 3B, 3D). A much smaller emissions rate was mea-sured after tarp cutting on this 16-day tarped field than was measured in the 2009 trial, where the TIF was cut after
6 days. Emission losses resulting from tarp cutting in the 2011 trial were 2.1% for chloropicrin and 5.6% for 1,3-D, re-spectively. The total measured emission losses from Field 1 in the 2011 study were 7.8% for chloropicrin and 13.1% for 1,3-D. These measurements generally support the ambient monitoring results (4.5% loss of applied chloropicrin and 10.2% loss of applied 1,3-D).
The results of the Lost Hills study demonstrated that peak and total emis-sions of chloropicrin and 1,3-D under TIF are significantly lower when tarp cutting is extended from 5 days to 10 days. The differences in total emissions when tarps were cut at 10 days versus 16 days after application were negligible.
Significant emission reductions
While in place and intact (deployed in the field), TIF significantly reduces fumi-gant emissions by retaining fumigants under the tarp. These studies corrobo-rate and provide field-scale validation of earlier laboratory work showing the
emissions reduction potential of this film technology. For fumigants like chloropic-rin with short soil half-lives (1 to 2 days), a tarping period of 5 to 6 days should be sufficient for application rates of less than 200 pounds per acre. However, for higher application rates and for fumigants with longer soil half-lives, such as 1,3-D, longer tarp periods are needed to maximize the emissions reduction potential of TIF use.
These results show that peak and to-tal emissions arising from high rates of chloropicrin and 1,3-D applications can be effectively mitigated if the tarping dura-tion of TIF is extended to 10 days. Only nominal benefits would be achieved by extending the tarping period from 10 to 16 days. Although TIF has the ability to re-tain 1,3-D in the soil for a few weeks, the degradation half-life of 1,3-D under field conditions is 5 to 7 days (Ajwa et al. 2003, 2010), and a very small residual concentra-tion, if any, is found in the soil when TIF is removed from the field after 10 days. Also, the final degradation products of 1,3-D are nontoxic (mainly carbon dioxide,
Fig. 2. Peak and total emissions from Lost Hills 2011 trial as measured by ambient air monitoring. (A) Chloropicrin emissions rate; (B) Chloropicrin total emissions; (C) 1,3-D emissions rate; and (D) 1,3-D total emissions.
6 24 42 60 78 96 114
132
150
168
186
204
222
240
258
276
294
312
330
348
366
384
402
420
6 24 42 60 78 96 114
132
150
168
186
204
222
240
258
276
294
312
330
348
366
384
402
420
6 24 42 60 78 96 114
132
150
168
186
204
222
240
258
276
294
312
330
348
366
384
402
420
6 24 42 60 78 96 114
132
150
168
186
204
222
240
258
276
294
312
330
348
366
384
402
420
0
5
10
15
20
25
30
35
40
45
50
0
10
20
30
40
50
60
70
80
90
100
0
5
10
15
20
25
30
35
40
45
50
0
10
20
30
40
50
60
70
80
90
100
1,3-
D to
tal e
mis
sion
s(%
em
itted
of a
mou
nt a
pplie
d)
Chlo
ropi
crin
em
issi
ons
rate
(µ
g/m
2 /sec
)Ch
loro
picr
in to
tal e
mis
sion
s(%
em
itted
of a
mou
nt a
pplie
d)
A C
B D
Hours after application
Hours after application
Hours after application
Hours after application
1,3-
D e
mis
sion
s ra
te
(µg/
m2 /s
ec)
TIF for 5 daysTIF for 10 daysTIF for 16 days

152 CaLifoRnia agRiCULTURE • VoLUME 67, nUMBER 3
water and chlorine) and do not pose risk to humans and the environment (Dungan and Yates 2003).
Emission data obtained from dynamic flux chambers agree with and strongly support the ambient monitoring data. The significant emissions reductions obtained when using TIF should allow regulatory agencies to provide relief to growers by implementing smaller buffer zones, in-creasing the volume of fumigant use and providing growers with greater flexibility in areas with spatially or temporally-based fumigant restrictions where total emissions are of concern.
H. Ajwa is UC Cooperative Extension Soil and Plant Specialist, UC Davis; M.S. Stanghellini is Research Scientist, TriCal, Inc.; S. Gao is Soil Scientist, USDA-ARS; D.A. Sullivan is Certified Consulting Meteorologist, Sullivan Environmental Consulting, Inc.; A. Khan is Postdoctoral Scholar, UC Davis; W. Ntow is Postdoctoral Scholar, UC Davis; and R. Qin is Assistant Project Scientist, UC Davis.** "R. Quin" was corrected to "R. Qin" after press run.
0
10
20
30
40
50
0 24 48 72 96 120
144
168
192
216
240
264
288
312
336
360
384
408
432
Hours after application
0
5
10
15
20
25
30
35
40
45
50
0 24 48 72 96 120
144
168
192
216
240
264
288
312
336
360
384
408
432
Hours after application
0
10
20
30
40
50
60
70
80
90
100
0 24 48 72 96 120
144
168
192
216
240
264
288
312
336
360
384
408
432
Hours after application
0
10
20
30
40
50
60
70
80
90
100
0 24 48 72 96 120
144
168
192
216
240
264
288
312
336
360
384
408
432
1,3-
D e
mis
sion
s ra
te(µ
g/m
2 /sec
) 1,
3-D
tota
l em
issi
ons
(% e
mitt
ed o
f am
ount
app
lied)
Chlo
ropi
crin
em
issi
ons
rate
(µ
g/m
2 /sec
)Ch
loro
picr
in to
tal e
mis
sion
s(%
em
itted
of a
mou
nt a
pplie
d)
Hours after application
A C
B D
Fig. 3. Peak and total emissions from Field 1 (16 days) of Lost Hills 2011 trial as measured by the dynamic flux chamber. (A) Chloropicrin emissions rate; (B) Chloropicrin total emissions; (C) 1,3-D emissions rate; and (D) 1,3-D total emissions.
ReferencesAjwa HA, Klose S, Neilson SD, et al. 2003. Alternatives to methyl bromide in strawberry production in the United States of America and the Mediterranean Region. Phyto-pathol Mediterr 42:220–44.
Ajwa H, Ntow WJ, Qin R, Gao S. 2010. Properties of soil fumigants and their fate in the environment. In: Krieger R (ed.). Hayes’ Handbook of Pesticide Toxicology. San Di-ego: Elsevier Inc. p 315–30.
Cabrera JA, Hanson BD, Abit MJM, et al. 2011. Efficacy of 1,3-dichloropropene plus chloropicrin reduced rates under two different tarps against nematodes, patho-gens and weeds. In: Proc Ann Int Res Conf on MeBr Alternatives and Emission Reductions, Oct. 31−Nov. 2, 2011. San Diego, CA.
[CDPR] California Department of Pesticide Regulation. 2009. Volatile Organic Compound (VOC) Emissions from Pesticides. www.cdpr.ca.gov/docs/emon/vocs/vocproj/vocmenu.htm.
Dungan RS, Yates SR. 2003. Degradation of fumigant pesticides: 1,3-dichloropropene, methyl isothiocya-nate, chloropicrin and methyl bromide. Vadose Zone J 2:279–86.
Fennimore SA, Ajwa H. 2011. Totally impermeable film retains fumigants, allowing lower application rates in strawberry. Calif Agr 65(4):211–5.
Gao S, Hanson BD, Wang D, et al. 2011. Methods evalu-ated to minimize emissions from pre-plant soil fumiga-tion. Calif Agr 65(1):41–6.
Gao S, Qin R, Hanson BD, et al. 2009. Effects of manure and water applications on 1,3-dichloropropene and chloropicrin emission in a field trial. J Agric Food Chem 57:5428−34.
Gao S, Wang D. 2011. Chapter 9: Vapor flux measure-ments – Chamber methods. In: Saponaro S, Sezenna E, Bonomo L (eds.). Vapor Emission to Outdoor Air and Enclosed Spaces for Human Health Risk Assessment: Site Characterization, Monitoring and Modeling. Hauppauge, NY: Nova Science Publishers. p 191–207.
Hanson BD, Gao S, Gerik J, et al. 2013. Preplant 1,3-D treatments test well for perennial crop nurseries, but challenges remain. Calif Agr 67(3): In press. doi: 10.3733/ca.E.v067n03p181
Jhala AJ, Gao S, Gerik JS, et al. 2012. Effects of surface treatments and application shanks on nematode, pathogen and weed control with 1,3-dichloropropene. Pest Manag Sci 68:225–30.
Qin R, Gao S, Ajwa H, et al. 2011. Field evaluation of a new plastic film (Vapor Safe) to reduce fumigant emis-sions and improve distribution in soil. J Environ Qual 40:1195–203.
[US EPA] U.S. Environmental Protection Agency. 2009. Implementation of Risk Mitigation Measures for Soil Fumigant Pesticides. www.epa.gov/oppsrrd1/reregistration/soil_fumigants/#ammendedreds.


