Embed Size (px)
Citation preview

Functional connectivity in the retina at the resolution ofphotoreceptors
Greg D. Field1,*, Jeffrey L. Gauthier1,*, Alexander Sher2,*, Martin Greschner1, TimothyMachado1, Lauren H. Jepson1, Jonathon Shlens1, Deborah E. Gunning3, Keith Mathieson3,Wladyslaw Dabrowski4, Liam Paninski5, Alan M. Litke2, and E.J. Chichilnisky1
1 Systems Neurobiology Laboratory, Salk Institute for Biological Studies, La Jolla, CA 2 SantaCruz Institute for Particle Physics, University of California, Santa Cruz, CA 3 Department ofPhysics and Astronomy, University of Glasgow, Glasgow, UK 4 Faculty of Physics and AppliedComputer Science, AGH University of Science and Technology, 23 30-059, Krakow, Poland 5Department of Statistics and Center for Theoretical Neuroscience, Columbia University, NewYork, NY
AbstractTo understand a neural circuit requires knowing its connectivity. This paper reports measurementsof functional connectivity between the input and ouput layers of the retina at single cell resolutionand its implications for color vision. Multi-electrode technology was employed to recordsimultaneously from complete populations of the retinal ganglion cell types (midget, parasol,small bistratified) that transmit high-resolution visual signals to the brain. Fine-grained visualstimulation was used to identify the location, type and strength of the functional input of each conephotoreceptor to each ganglion cell. The populations of ON and OFF midget and parasol cellseach sampled the complete population of long and middle wavelength sensitive cones. However,only OFF midget cells frequently received strong input from short wavelength sensitive cones. ONand OFF midget cells exhibited a small non-random tendency to selectively sample from eitherlong or middle wavelength sensitive cones, to a degree not explained by clumping in the conemosaic. These measurements reveal computations in a neural circuit at the elementary resolutionof individual neurons.
Color vision requires neural circuitry to compare signals from spectrally distinct cone types.For example, the signature of primate color vision – red-green and blue-yellow coloropponency – implies that neural circuits pit signals from different cone types against oneanother. However, the pattern of connectivity between the (L)ong, (M)iddle, and (S)hortwavelength sensitive cones and various retinal ganglion cell (RGC) types, which determineshow color signals are transmitted in parallel pathways to the brain, remains incompletelyunderstood 1-9. To probe the circuitry for color vision more fully, the pattern of connectivitybetween the full lattice of cone photoreceptors and complete populations of RGCs of severaltypes was measured in primate retina.
Users may view, print, copy, download and text and data- mine the content in such documents, for the purposes of academic research,subject always to the full Conditions of use: http://www.nature.com/authors/editorial_policies/license.html#terms
Contact: E.J. Chichilnisky, Systems Neurobiology, The Salk Institute, 10010 North Torrey Pines Road, La Jolla, CA 92037, [email protected], phone: (858) 453-4100 x1286.*Equal contributions
Author Contributions: G.D.F., J.L.G., A.S., and E.J.C. conceived the experiments. G.D.F., J.L.G., A.S., M.G., J.S., and E.J.C.performed the electrophysiological experiments. G.D.F, J.L.G., A.S., M.G., T.A.M., and L.P., analyzed the data. A.S., D.E.G., K.M.,W.D., A.M.L. provided and supported the large-scale multielectrode array system. G.D.F. and E.J.C. wrote the manuscript.
NIH Public AccessAuthor ManuscriptNature. Author manuscript; available in PMC 2011 April 7.
Published in final edited form as:Nature. 2010 October 7; 467(7316): 673–677. doi:10.1038/nature09424.
NIH
-PA Author Manuscript
NIH
-PA Author Manuscript
NIH
-PA Author Manuscript

Hundreds of RGCs were simultaneously recorded in the peripheral macaque retina usinglarge-scale electrophysiological recordings 10-12. The light responses of each cell werecharacterized by computing the spike-triggered average (STA) of a spatio-temporal whitenoise stimulus (see Methods). From the STA, several features of light response wereidentified, including the spatial receptive field (RF) and the response time course.Classification based on these properties was used to identify functionally distinct RGCclasses (Fig. 1a, center). The RFs of each cell class formed a regular mosaic covering theregion of retina recorded 12-15. This revealed that each functionally defined cell classcorresponded to one RGC type, because the dendrites of each RGC type uniformly tile theretinal surface 16,17. Density and light response properties were used to identify the ON andOFF midget, ON and OFF parasol, and small bistratified cell types, which collectivelyaccount for ∼75% of RGCs 5. In many cases, RF mosaics exhibited few or no gaps,indicating that nearly every cell was recorded.
To resolve the fine structure of RFs, stimuli with 10-fold smaller pixels (5×5 μm) wereused. At this resolution, RFs did not conform to the smooth Gaussian approximation used inFig. 1a (center) and in previous studies 18. Instead, each RF was composed of punctateislands of light sensitivity (Fig. 1a, flanking). The separation between islands was roughlyequal to the spacing of the cone lattice, consistent with the idea that each island reflected thecontribution of a single cone 10,19. To test this hypothesis, locations of islands werecompared to photographs of cone outer segments labeled with peanut agglutinin; a closealignment was observed (Fig. 1b, see Supplementary Methods).
The spectral type of each cone -- (L)ong, (M)iddle, or (S)hort wavelength sensitive -- wasidentified using the relative magnitudes of the three display primaries in the STA at itslocation (Fig. 2a). These values, accumulated across all cones in a recording, formed threedistinct clusters (Fig. 2b) aligned with the spectral sensitivities of the macaque cones(colored lines) 20. S cones were easily identifiable, L and M cones were somewhat less so(Fig. 2b,c) because of their overlapping spectral sensitivities.
The full cone mosaic was visualized by pooling information from all recorded RGCs. Thiswas accomplished by fitting the RFs of all RGCs with a model in which each RF isapproximated by a weighted sum of Gaussian functions centered on the locations of cones(see Supplementary Methods). This approach revealed nearly complete cone mosaics (Fig.2d,e). The relative frequencies of L, M and S cones were in a ratio of roughly 8:4:1 (averageof 6 data sets) 21.
The functional connectivity between each RGC and the cones within its RF was summarizedby assigning an input strength to each cone, equal to the weight in the model fit derivedfrom the STA (see Supplementary Methods). This permitted well-constrained estimation ofthe inputs of weak cones, including those in the RF surround (Fig. 2g), because conelocations were robustly identified using data from multiple cells. The RF of each RGC wassummarized graphically with a collection of radiating lines connecting to cones: thethickness of each line is proportional to the weight, white (black) lines represent the center(surround) of the RF (Fig. 2h). This representation was used to visualize several completemosaics of RGCs receiving input from a complete mosaic of cones (Fig. 3). A total of 1,961RGCs connecting to a total of 17,380 cones in 7 preparations were examined.
These connectivity diagrams provide insight into the specificity of L, M and S cone inputs tothe RGC types mediating high-resolution vision and color vision. This specificity has been asource of controversy in previous work (see Supplementary Discussion).
Previous studies provide conflicting accounts of S cone inputs to midget and parasol cells1,3,4,6,8,22-28. In the present data OFF midget cells frequently received at least one strong
Field et al. Page 2
Nature. Author manuscript; available in PMC 2011 April 7.
NIH
-PA Author Manuscript
NIH
-PA Author Manuscript
NIH
-PA Author Manuscript

functional S cone input, whereas ON midget, ON parasol and OFF parasol cells did so muchless frequently (e.g. see Fig. 3). At the same time, all four RGC types sampled essentiallythe entire mosaic of L and M cones. For example, in one recording an ON midget cellreceived no input from three S cones located within its RF center (Fig. 4a). Yet, two of theseS cones were sampled by nearby OFF midget cells (Fig. 4b,c). On average, S cones werestrongly sampled by OFF midget cells about five-fold more frequently than by ON midgetand parasol cells (Fig. 4d). Additional analysis showed that ON midget cells displayed atendency to sample weakly from S cones (see Supplementary Methods). The sampling of Scones by OFF midget cells confirms a prediction from anatomical work 25: OFF midgetbipolar cells contact S cones in the central retina, therefore, OFF midget RGCs shouldreceive S cone input. The absence of S cone input to parasol cells also confirms recentfindings 6. An important question for future work is whether the S cone signals carried byOFF midget cells contribute to blue-yellow and red-green opponent color vision.
The specificity of L and M cone inputs to peripheral midget cells, which is thought tounderlie red-green opponent color vision, has also been debated 1,8,9,29-39. One studysuggested that midget cells tend to selectively sample from either L or M cones in the RFcenter, producing red-green color opponency by pitting relatively pure L or M cone centersignal against a mixture of L and M cone signals from the surround 2. Another studysuggested that the RF surround may enhance opponency by sampling predominantly fromthe cone type less strongly sampled by the center 7, consistent with previous work 3,39. Yetanother study found no evidence for color opponency in peripheral midget cells 40,suggesting that cone sampling is random in both RF center and surround.
In the present data, a significant fraction of peripheral midget cells exhibited red-green coloropponency (Fig. 4h). Opponency was quantified by calculating the relative strengths of thetotal input from L, M and S cones, obtained with cone-isolating stimuli (see SupplementaryMethods) 1. To examine separately the roles of the RF center and surround in opponency,cones were defined as contributing primarily to the RF center or surround based on the signof their input and their location (see Supplementary Methods). Interestingly, opponency wasoften strong in those midget cells that sampled either L or M cones dominantly orexclusively in the RF center, while in the RF surround cone sampling seemed indiscriminate(e.g. Fig. 4e-g). These observations are consistent with the hypothesis that sampling biastoward either L or M cones in the RF center mediates opponency. However, across thepopulation of midget cells the purity of cone input to the RF center varied widely (e.g. seeFig. 3c-d), raising the alternative possibility of random sampling in both center andsurround.
To test the randomness of L/M cone sampling quantitatively, statistical analysis wasperformed, beginning with cones in the RF center. First, an index of cone input purity wascomputed for all midget cells in each preparation (Fig. 4i, see Supplementary Methods). Thewidth of the distribution of purity indices quantifies the diversity of cone inputs to recordedcells (Fig. 4j, top). The purity indices were then re-computed after artificially and randomlypermuting the identities of L and M cones (Fig. 4j, bottom), while preserving all otheraspects of the data. If connectivity between L/M cones and midget cells were random, thenpermutation of cone identities would not significantly alter the distribution of purity indices.In fact, the distribution was narrower after permutation, and fewer cells with pure L or Mcone centers were observed (index values near ±1). This tendency was statisticallysignificant, and was observed in nearly all of the populations of ON and OFF midget cellsexamined (Fig. 4k). Although these deviations from random connectivity are small, theyimply that the RF centers of midget cells tend to favor inputs from either L or M cones,contributing to red-green opponency. In contrast, the same analysis applied to cones in theRF surround yielded results consistent with the hypothesis of random sampling (Fig. 4l).
Field et al. Page 3
Nature. Author manuscript; available in PMC 2011 April 7.
NIH
-PA Author Manuscript
NIH
-PA Author Manuscript
NIH
-PA Author Manuscript

In principle, the observed tendency toward purity could be produced by clumping in thecone mosaic, i.e. aggregation of cones of the same type. Clumping would increase theproportion of midget cells with centers dominated by one cone type. Evidence for a weakcone clumping was reported in central human retina and peripheral macaque retina 41,42, butthe implications for color opponency in midget cells have not been examinedexperimentally. In the present data, tests for cone clumping on the scale of midget cell RFssuggested a weak tendency toward clumping, in 3 of 7 recordings (see SupplementaryMethods). However, clumping alone cannot account for the observed tendency towardpurity, because artificial cone mosaics with the same degree of clumping reduced purity(Fig. 4m). Thus, the tendency toward purity indicates that midget cells sample L and M coneinputs, through the retinal network, in a selective manner.
Selective sampling could be produced if (1) each midget cell receives inputs from one conetype more frequently than the other, and/or (2) each midget cell weights inputs from onecone type more strongly than the other. Statistical analysis was consistent with both factors.In model (1), the number of cones sampled by each midget cell should be skewed towardone cone type or the other. Therefore, random permutation of L/M cone identities shouldreduce purity, even if the relative weights of different cone inputs to each cell are ignored bybinarizing them. This prediction was confirmed (Fig. 4n). In model (2), the weights on coneinputs to each midget cell should be skewed toward one cone type or the other. Therefore,random permutation of the strength of all the cone inputs within the RF of each midget cellshould reduce purity. This prediction was also confirmed (Fig. 4o), though the effect wasmodest. Control analysis indicated that these findings were not a result of the tapering RFprofile of RGCs or clumping in the cone mosaic (data not shown).
Selective sampling raises questions about the mechanisms by which functional connectivitybetween cones and RGCs is coordinated. The divergence of the L and M conephotopigments in primates is relatively recent 43, and there is little evidence for segregationof L and M cone signals in the retinal circuitry 44. L and M cones are apparentlyindistinguishable both anatomically and histochemically. Furthermore, there is only tentativeanatomical evidence of differences in retinal circuits carrying L and M cone signals 35, incontrast to the strikingly different pathway that conveys S cone signals 45,46. Thus, there isno candidate structural basis for selective sampling. In principle, selective sampling couldarise from activity-dependent adjustment of synaptic inputs. At the eccentricites recorded,midget bipolar cells usually contact only one cone 47, providing an opportunity for midgetRGCs to selectively sample inputs from bipolar cells carrying signals from one cone type.These bipolar cells could be distinguished by the statistics of their responses to naturalscenes 48. The possibility of such an adaptive mechanism is broadly consistent with recentobservations of long-term adaptability in retinal signals 49 and color vision 50.
Methods SummaryExtracellular multi-electrode recordings were obtained from ganglion cells of isolatedretinas obtained from macaque monkeys euthanized in other laboratories 10. Spikes fromseveral hundred cells were segregated offline 11. Reverse correlation of spike times withwhite noise checkerboard stimuli focused on the retina were used to obtain RF maps for allcells (Fig. 1). ON and OFF midget and parasol cells and small bistratified cells wereclassified according to their characteristic light responses and density (Fig. 1) 12,14,15.Locations, spectral sensitivity, and input strengths of L, M and S cones to these cell typeswere obtained from the fine grained RF maps (Figs. 2,3). To test for selective functionalconnectivity, the measured spatial arrangement and input strengths of the three cone types toRGCs were compared to artificially modified representations (Fig. 4).
Field et al. Page 4
Nature. Author manuscript; available in PMC 2011 April 7.
NIH
-PA Author Manuscript
NIH
-PA Author Manuscript
NIH
-PA Author Manuscript

Supplementary MaterialRefer to Web version on PubMed Central for supplementary material.
AcknowledgmentsThis work was supported by the Helen Hay Whitney Foundation (G.D.F.), DFG (M.G.), NIH NRSA(NS054519-01) and Chapman Foundation (J.L.G.), Miller Institute for Basic Research in Science, University ofCA, Berkeley (J.S.), Polish Ministry of Science and Higher Education (W.D.), Burroughs Wellcome Fund CareerAward at Scientific Interface (A.S.), McKnight Foundation (A.M.L. & E.J.C.), NSF Grant PHY-0750525 (A.M.L.),a Sloan Research Fellowship, and NIH Grant EY13150 (E.J.C). We thank C.K. Hulse for technical assistance; M.I.Grivich, D. Petrusca, A. Grillo, P. Grybos, P. Hottowy, and S. Kachiguine for technical development; H. Fox, M.Taffe, E. Callaway and K. Osborn for providing access to retinas; S. Barry for machining; F. Rieke and T.Sejnowski for providing comments on the manuscript. We thank the San Diego Supercomputer Center and the NSF(Cooperative Agreements 05253071 and 0438741) for large scale data storage.
References1. Derrington AM, Krauskopf J, Lennie P. Chromatic mechanisms in lateral geniculate nucleus of
macaque. J Physiol. 1984; 357:241–265. [PubMed: 6512691]
2. Martin PR, Lee BB, White AJ, Solomon SG, Ruttiger L. Chromatic sensitivity of ganglion cells inthe peripheral primate retina. Nature. 2001; 410:933–936. [PubMed: 11309618]
3. Reid RC, Shapley RM. Space and time maps of cone photoreceptor signals in macaque lateralgeniculate nucleus. J Neurosci. 2002; 22:6158–6175. [PubMed: 12122075]
4. Chatterjee S, Callaway EM. S cone contributions to the magnocellular visual pathway in macaquemonkey. Neuron. 2002; 35:1135–1146. [PubMed: 12354402]
5. Dacey, DM. The Cognitive Neurosciences. Gazzaniga, MS., editor. MIT Press; Cambridge, MA:2004. p. 281-301.
6. Sun H, Smithson HE, Zaidi Q, Lee BB. Specificity of cone inputs to macaque retinal ganglion cells.J Neurophysiol. 2006; 95:837–849. [PubMed: 16424455]
7. Buzas P, Blessing EM, Szmajda BA, Martin PR. Specificity of M and L cone inputs to receptivefields in the parvocellular pathway: random wiring with functional bias. J Neurosci. 2006;26:11148–11161. [PubMed: 17065455]
8. Wiesel TN, Hubel DH. Spatial and chromatic interactions in the lateral geniculate body of therhesus monkey. J Neurophysiol. 1966; 29:1115–1156. [PubMed: 4961644]
9. Jacobs GH, De Valois RL. Chromatic opponent cells in squirrel monkey lateral geniculate nucleus.Nature. 1965; 206:487–489. [PubMed: 4953498]
10. Chichilnisky EJ, Baylor DA. Receptive-field microstructure of blue-yellow ganglion cells inprimate retina. Nat Neurosci. 1999; 2:889–893. [PubMed: 10491609]
11. Litke AM, et al. What does the eye tell the brain? Development of a system for the large scalerecording of retinal output activity. IEEE Trans Nucl Sci. 2004; 51:1434–1440.
12. Frechette ES, et al. Fidelity of the ensemble code for visual motion in primate retina. JNeurophysiol. 2005; 94:119–135. [PubMed: 15625091]
13. Devries SH, Baylor DA. Mosaic arrangement of ganglion cell receptive fields in rabbit retina. JNeurophysiol. 1997; 78:2048–2060. [PubMed: 9325372]
14. Chichilnisky EJ, Kalmar RS. Functional asymmetries in ON and OFF ganglion cells of primateretina. J Neurosci. 2002; 22:2737–2747. [PubMed: 11923439]
15. Field GD, et al. Spatial properties and functional organization of small bistratified ganglion cells inprimate retina. J Neurosci. 2007; 27:13261–13272. [PubMed: 18045920]
16. Wassle H, Peichl L, Boycott BB. Dendritic territories of cat retinal ganglion cells. Nature. 1981;292:344–345. [PubMed: 7254331]
17. Dacey DM. The mosaic of midget ganglion cells in the human retina. J Neurosci. 1993; 13:5334–5355. [PubMed: 8254378]
18. Rodieck, RW. The first steps in seeing. Sinauer; Sunderland, MA: 1998.
Field et al. Page 5
Nature. Author manuscript; available in PMC 2011 April 7.
NIH
-PA Author Manuscript
NIH
-PA Author Manuscript
NIH
-PA Author Manuscript

19. Sincich LC, Zhang Y, Tiruveedhula P, Horton JC, Roorda A. Resolving single cone inputs tovisual receptive fields. Nat Neurosci. 2009; 12:967–969. [PubMed: 19561602]
20. Baylor DA, Nunn BJ, Schnapf JL. Spectral sensitivity of cones of the monkey Macaca fascicularis.J Physiol. 1987; 390:145–160. [PubMed: 3443931]
21. Roorda A, Williams DR. The arrangement of the three cone classes in the living human eye.Nature. 1999; 397:520–522. [PubMed: 10028967]
22. Lee BB, Martin PR, Valberg A. The physiological basis of heterochromatic flicker photometrydemonstrated in the ganglion cells of the macaque retina. J Physiol. 1988; 404:323–347. [PubMed:3253435]
23. Kaiser PK, Lee BB, Martin PR, Valberg A. The physiological basis of the minimally distinctborder demonstrated in the ganglion cells of the macaque retina. J Physiol. 1990; 422:153–183.[PubMed: 2352178]
24. Lee BB, Pokorny J, Smith VC, Kremers J. Responses to pulses and sinusoids in macaque ganglioncells. Vision Res. 1994; 34:3081–3096. [PubMed: 7975341]
25. Klug K, Herr S, Ngo IT, Sterling P, Schein S. Macaque retina contains an S-cone OFF midgetpathway. J Neurosci. 2003; 23:9881–9887. [PubMed: 14586017]
26. Tailby C, Szmajda BA, Buzas P, Lee BB, Martin PR. Transmission of blue (S) cone signalsthrough the primate lateral geniculate nucleus. J Physiol. 2008; 586:5947–5967. [PubMed:18955378]
27. Lee SC, Grunert U. Connections of diffuse bipolar cells in primate retina are biased against S-cones. J Comp Neurol. 2007; 502:126–140. [PubMed: 17335043]
28. Solomon SG, Lee BB, White AJ, Ruttiger L, Martin PR. Chromatic organization of ganglion cellreceptive fields in the peripheral retina. J Neurosci. 2005; 25:4527–4539. [PubMed: 15872100]
29. De Valois RL, Abramov I, Jacobs GH. Analysis of response patterns of LGN cells. J Opt Soc Am.1966; 56:966–977. [PubMed: 4959282]
30. de Monasterio FM, Gouras P, Tolhurst DJ. Trichromatic colour opponency in ganglion cells of therhesus monkey retina. J Physiol. 1975; 251:197–216. [PubMed: 810577]
31. Lee BB. Receptive field structure in the primate retina. Vision Res. 1996; 36:631–644. [PubMed:8762295]
32. Dacey DM. Parallel pathways for spectral coding in primate retina. Annu Rev Neurosci. 2000;23:743–775. [PubMed: 10845080]
33. Gegenfurtner KR. Cortical mechanisms of colour vision. Nat Rev Neurosci. 2003; 4:563–572.[PubMed: 12838331]
34. Solomon SG, Lennie P. The machinery of colour vision. Nat Rev Neurosci. 2007; 8:276–286.[PubMed: 17375040]
35. Calkins DJ, Schein SJ, Tsukamoto Y, Sterling P. M and L cones in macaque fovea connect tomidget ganglion cells by different numbers of excitatory synapses. Nature. 1994; 371:70–72.[PubMed: 8072528]
36. Jusuf PR, Martin PR, Grunert U. Random wiring in the midget pathway of primate retina. JNeurosci. 2006; 26:3908–3917. [PubMed: 16611806]
37. Ghosh KK, Goodchild AK, Sefton AE, Martin PR. Morphology of retinal ganglion cells in a newworld monkey, the marmoset Callithrix jacchus. J Comp Neurol. 1996; 366:76–92. [PubMed:8866847]
38. Lennie, P.; Haake, W.; Williams, DR. Computational models of visual processing. Landy, M.;Movshon, JA., editors. MIT Press; 1991. p. 71-82.
39. Reid RC, Shapley RM. Spatial structure of cone inputs to receptive fields in primate lateralgeniculate nucleus. Nature. 1992; 356:716–718. [PubMed: 1570016]
40. Diller L, et al. L and M cone contributions to the midget and parasol ganglion cell receptive fieldsof macaque monkey retina. J Neurosci. 2004; 24:1079–1088. [PubMed: 14762126]
41. Hofer H, Carroll J, Neitz J, Neitz M, Williams DR. Organization of the human trichromatic conemosaic. J Neurosci. 2005; 25:9669–9679. [PubMed: 16237171]
42. Packer OS, Williams DR, Bensinger DG. Photopigment transmittance imaging of the primatephotoreceptor mosaic. J Neurosci. 1996; 16:2251–2260. [PubMed: 8601805]
Field et al. Page 6
Nature. Author manuscript; available in PMC 2011 April 7.
NIH
-PA Author Manuscript
NIH
-PA Author Manuscript
NIH
-PA Author Manuscript

43. Nathans J. The evolution and physiology of human color vision: insights from molecular geneticstudies of visual pigments. Neuron. 1999; 24:299–312. [PubMed: 10571225]
44. Calkins DJ, Sterling P. Evidence that circuits for spatial and color vision segregate at the firstretinal synapse. Neuron. 1999; 24:313–321. [PubMed: 10571226]
45. Kouyama N, Marshak DW. Bipolar cells specific for blue cones in the macaque retina. J Neurosci.1992; 12:1233–1252. [PubMed: 1556594]
46. Dacey DM, Lee BB. The ‘blue-on’ opponent pathway in primate retina originates from a distinctbistratified ganglion cell type. Nature. 1994; 367:731–735. [PubMed: 8107868]
47. Wassle H, Grunert U, Martin PR, Boycott BB. Immunocytochemical characterization and spatialdistribution of midget bipolar cells in the macaque monkey retina. Vision Res. 1994; 34:561–579.[PubMed: 8160377]
48. Wachtler T, Doi E, Lee T, Sejnowski TJ. Cone selectivity derived from the responses of the retinalcone mosaic to natural scenes. J Vis. 2007; 7:6. [PubMed: 17685813]
49. Hosoya T, Baccus SA, Meister M. Dynamic predictive coding by the retina. Nature. 2005; 436:71–77. [PubMed: 16001064]
50. Neitz J, Carroll J, Yamauchi Y, Neitz M, Williams DR. Color perception is mediated by a plasticneural mechanism that is adjustable in adults. Neuron. 2002; 35:783–792. [PubMed: 12194876]
Field et al. Page 7
Nature. Author manuscript; available in PMC 2011 April 7.
NIH
-PA Author Manuscript
NIH
-PA Author Manuscript
NIH
-PA Author Manuscript

Figure 1.Cell type classification and RFs at single cone resolution. (a) RFs of 323 RGCs recordedsimultaneously from isolated macaque retina were measured using reverse correlation withwhite noise stimuli. Central panel: RF radius vs. first principal component of response timecourse; clusters reveal distinct cell types. Surrounding panels: Gaussian fits to RFs of cellsfrom each cluster, superimposed on electrode array outline. Outer panels: fine-grainedspatial RF profiles for highlighted cells. Scale bars: 60 μm. (b) First and second panels showspatial RF profiles of two cells, with putative locations of cones (black dots) identified bythresholding. Third panel shows the putative cone map accumulated across cells. Fourthpanel shows putative cone map overlaid on a photograph of cone outer segments labeledwith peanut agglutinin.
Field et al. Page 8
Nature. Author manuscript; available in PMC 2011 April 7.
NIH
-PA Author Manuscript
NIH
-PA Author Manuscript
NIH
-PA Author Manuscript

Figure 2.Cone type identification and inputs to RGCs. (a) The spectral sensitivity of cones providinginput to two cells is represented by the relative magnitude of the red, green and blue STAvalues at their locations. (b) For every cone in one recording, these values are shown aspoints on a sphere. Colored lines indicate spectral sensitivity of macaque cones. Point colorindicates classification as L (red), M (green), or S (blue). (c) L/M cone discriminabilityquantified by projection along the line joining L and M loci. Bars color indicatesclassification. S cones excluded. (d) Assembled cone mosaic from all RGCs over a region.Cones from (a) are circled. (e) Full mosaic of 2,373 cones from one recording. (f) Conemosaic overlaid on STA, revealing strength of cone inputs. (g) Weaker cone inputs in RFsurround revealed by truncating positive values and renormalizing. (h) Connectivity
Field et al. Page 9
Nature. Author manuscript; available in PMC 2011 April 7.
NIH
-PA Author Manuscript
NIH
-PA Author Manuscript
NIH
-PA Author Manuscript

diagram, with line thickness proportional to strength of each cone input. Surround (black)line thicknesses were increased five-fold relative to center (white) line thicknesses forvisibility.
Field et al. Page 10
Nature. Author manuscript; available in PMC 2011 April 7.
NIH
-PA Author Manuscript
NIH
-PA Author Manuscript
NIH
-PA Author Manuscript
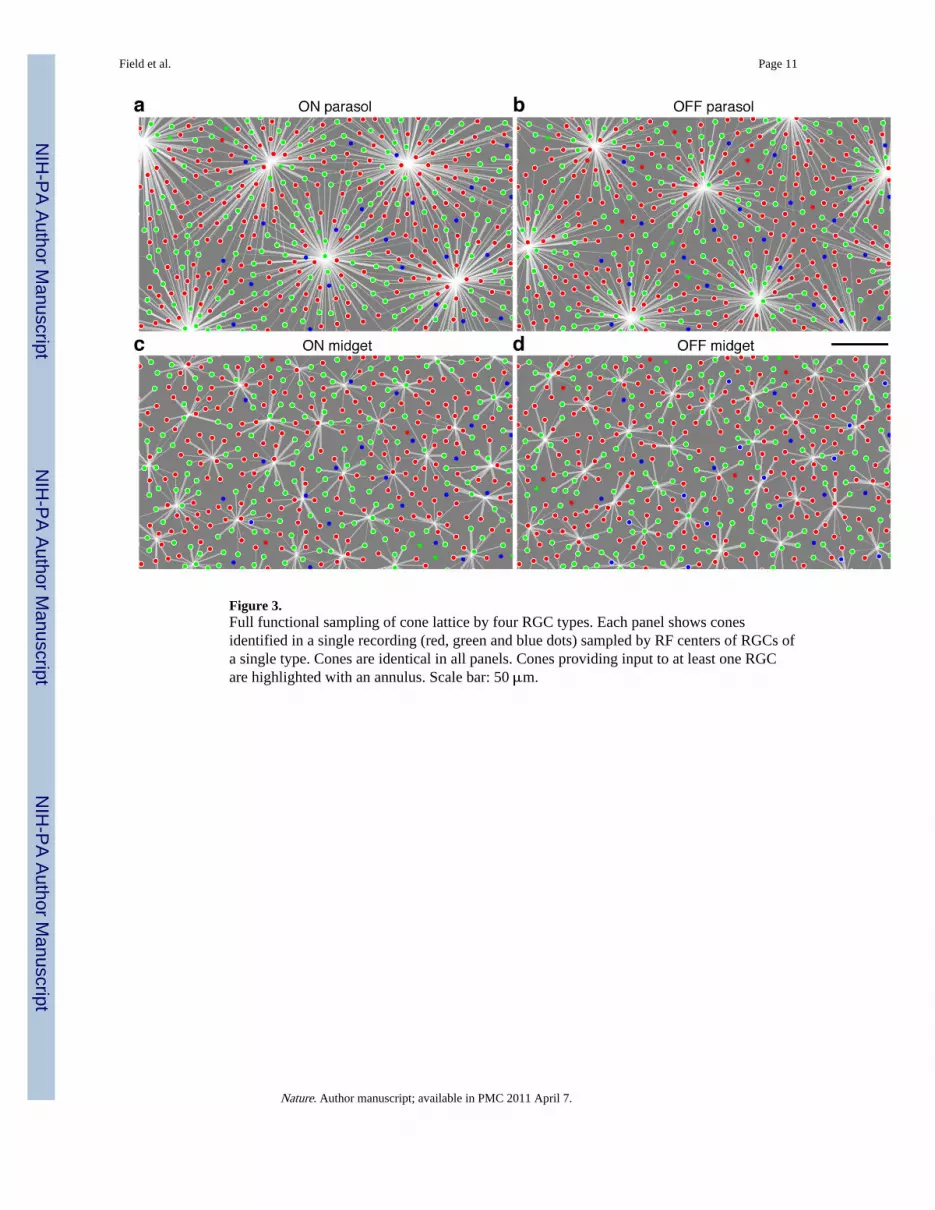
Figure 3.Full functional sampling of cone lattice by four RGC types. Each panel shows conesidentified in a single recording (red, green and blue dots) sampled by RF centers of RGCs ofa single type. Cones are identical in all panels. Cones providing input to at least one RGCare highlighted with an annulus. Scale bar: 50 μm.
Field et al. Page 11
Nature. Author manuscript; available in PMC 2011 April 7.
NIH
-PA Author Manuscript
NIH
-PA Author Manuscript
NIH
-PA Author Manuscript

Figure 4.Cone type specificity. (a) ON midget cell lacking input from nearby S cones (arrows). (b,c)OFF midget cells receiving input from these cones. (d) Frequency of strong S cone samplingby each cell type. (f,g) Two midget cells with relatively pure L/M cone input. (h) Midgetcell with mixed L/M input. (e) Normalized L,M,S cone inputs to all midget cells in onerecording, obtained with cone-isolating stimuli. Abscissa: M/(|L|+|M|+|S|), ordinate: L/(|L|+|M|+|S|). Diagonals: no S cone input. Upper-right and lower-left quadrants: same-sign (non-opponent) L/M input. Lower-right and upper-left quadrants: opposite-sign (opponent) L/Minput. Letters: cells from previous panels. (i) Purity index schematic. (j) (Top) Purity indexfor ON and OFF midget cells in one recording; width (SD) 0.45, 0.44 respectively. (Bottom)Purity index after random permutation of L/M cones; width 0.37±0.04, 0.36±0.04respectively (mean ± 2 SD across permutations). (k) Comparison of purity distribution widthin data and permutations. Each point represents >50 simultaneously recorded ON or OFFmidget cells. Error bars: 1 SD across permutations. (l) As (k), using cones from RFsurround. (m) Using random cone mosaics with clumping matched to data. (n) Usingbinarized cone weights (0,1). (o) Using random permutation of cone weights in RF center.
Field et al. Page 12
Nature. Author manuscript; available in PMC 2011 April 7.
NIH
-PA Author Manuscript
NIH
-PA Author Manuscript
NIH
-PA Author Manuscript