Embed Size (px)
Citation preview
FUNCTIONS AND THEIR REPRESENTATONS
Functions arise whenever one quantity depends on another. Consider the followingfour situations.
A. The area of a circle depends on the radius of the circle. The rule that connectsand is given by the equation . With each positive number there is
associated one value of , and we say that is a function of .
B. The human population of the world depends on the time . The table gives esti-mates of the world population at time for certain years. For instance,
But for each value of the time there is a corresponding value of and we say thatis a function of .
C. The cost of mailing a first-class letter depends on the weight of the letter.Although there is no simple formula that connects and , the post office has arule for determining when is known.
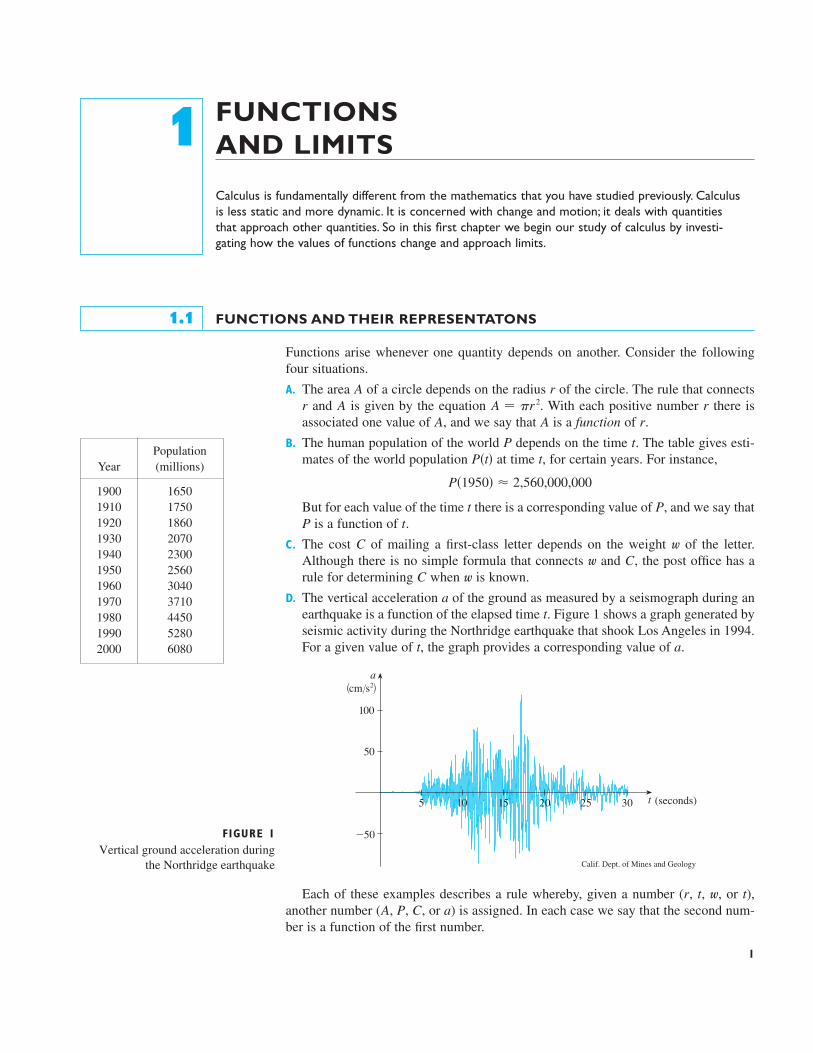
D. The vertical acceleration of the ground as measured by a seismograph during anearthquake is a function of the elapsed time Figure 1 shows a graph generated byseismic activity during the Northridge earthquake that shook Los Angeles in 1994.For a given value of the graph provides a corresponding value of .
Each of these examples describes a rule whereby, given a number ( , , , or ),another number ( , , , or ) is assigned. In each case we say that the second num-ber is a function of the first number.
aCPAtwtr
FIGURE 1Vertical ground acceleration during
the Northridge earthquake
{cm/s@}
(seconds)
Calif. Dept. of Mines and Geology
5
50
10 15 20 25
a
t
100
30
_50
at,
t.a
wCCw
wC
tPP,t
P!1950" # 2,560,000,000
t,P!t"tP
rAArA ! !r 2Ar
rA
1.1
FUNCTIONSAND LIMITS
Calculus is fundamentally different from the mathematics that you have studied previously. Calculusis less static and more dynamic. It is concerned with change and motion; it deals with quantitiesthat approach other quantities. So in this first chapter we begin our study of calculus by investi-gating how the values of functions change and approach limits.
1
1
PopulationYear (millions)
1900 16501910 17501920 18601930 20701940 23001950 25601960 30401970 37101980 44501990 52802000 6080
A function is a rule that assigns to each element in a set exactly oneelement, called , in a set .
We usually consider functions for which the sets and are sets of real numbers.The set is called the domain of the function. The number is the value of at and is read “ of .” The range of is the set of all possible values of as varies throughout the domain. A symbol that represents an arbitrary number in thedomain of a function is called an independent variable. A symbol that representsa number in the range of is called a dependent variable. In Example A, forinstance, is the independent variable and is the dependent variable.
It’s helpful to think of a function as a machine (see Figure 2). If is in the domainof the function then when enters the machine, it’s accepted as an input and themachine produces an output according to the rule of the function. Thus we canthink of the domain as the set of all possible inputs and the range as the set of all pos-sible outputs.
Another way to picture a function is by an arrow diagram as in Figure 3. Eacharrow connects an element of to an element of . The arrow indicates that isassociated with is associated with , and so on.
The most common method for visualizing a function is its graph. If is a functionwith domain , then its graph is the set of ordered pairs
(Notice that these are input-output pairs.) In other words, the graph of consists of allpoints in the coordinate plane such that and is in the domain of .
The graph of a function gives us a useful picture of the behavior or “life history”of a function. Since the -coordinate of any point on the graph is , wecan read the value of from the graph as being the height of the graph above thepoint . (See Figure 4.) The graph of also allows us to picture the domain of on the-axis and its range on the -axis as in Figure 5.
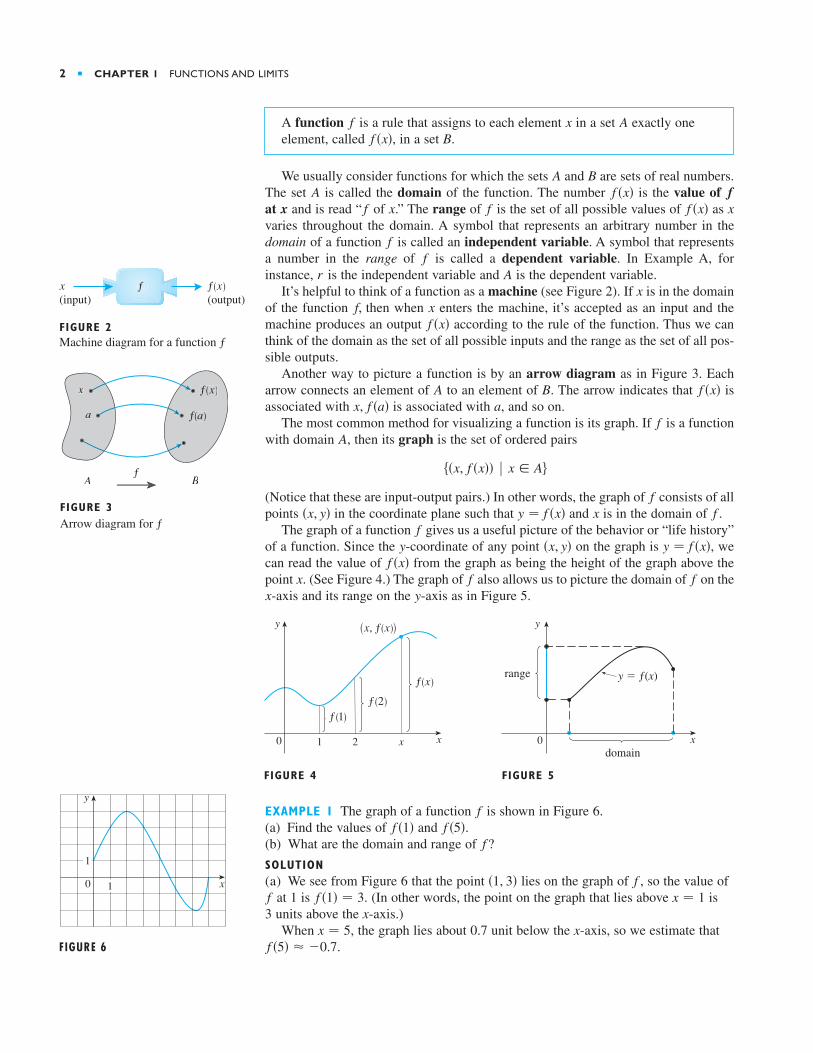
EXAMPLE 1 The graph of a function is shown in Figure 6.(a) Find the values of and .(b) What are the domain and range of ?
SOLUTION(a) We see from Figure 6 that the point lies on the graph of , so the value of
at 1 is . (In other words, the point on the graph that lies above is3 units above the x-axis.)
When , the graph lies about 0.7 unit below the x-axis, so we estimate that.f !5" # "0.7
x ! 5
x ! 1f !1" ! 3ff!1, 3"
ff !5"f !1"
f
0
y ! ƒ(x)
domain
range
FIGURE 4
{x, ƒ}
ƒ
f(1)f(2)
0 1 2 x
FIGURE 5
x
y
x
y
yxffx
f !x"y ! f !x"!x, y"y
ffxy ! f !x"!x, y"
f
$!x, f !x"" % x ! A&
Af
af !a"x,f !x"BA
f !x"xf,
xAr
ff
xf !x"fxfxff !x"A
BA
Bf !x"Axf
2 ■ CHAPTER 1 FUNCTIONS AND LIMITS
FIGURE 2Machine diagram for a function ƒ
x(input)
ƒ(output)
f
fA B
ƒ
f(a)a
x
FIGURE 3Arrow diagram for ƒ
FIGURE 6
x
y
0
1
1
(b) We see that is defined when , so the domain of is the closedinterval . Notice that takes on all values from "2 to 4, so the range of is
■
REPRESENTATIONS OF FUNCTIONS
There are four possible ways to represent a function:
■ verbally (by a description in words) ■ visually (by a graph)■ numerically (by a table of values) ■ algebraically (by an explicit formula)
If a single function can be represented in all four ways, it is often useful to go fromone representation to another to gain additional insight into the function. But certainfunctions are described more naturally by one method than by another. With this inmind, let’s reexamine the four situations that we considered at the beginning of thissection.
A. The most useful representation of the area of a circle as a function of its radius is probably the algebraic formula , though it is possible to compile atable of values or to sketch a graph (half a parabola). Because a circle has to havea positive radius, the domain is , and the range is also .
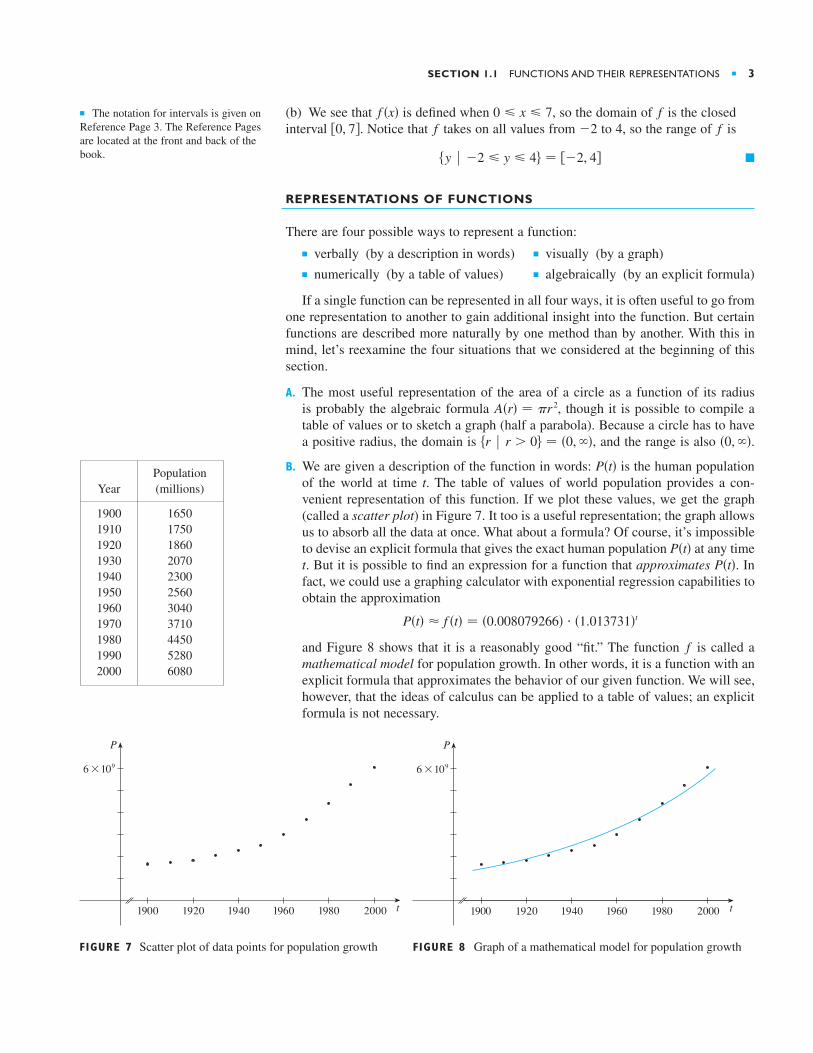
B. We are given a description of the function in words: is the human populationof the world at time t. The table of values of world population provides a con-venient representation of this function. If we plot these values, we get the graph(called a scatter plot) in Figure 7. It too is a useful representation; the graph allowsus to absorb all the data at once. What about a formula? Of course, it’s impossibleto devise an explicit formula that gives the exact human population at any timet. But it is possible to find an expression for a function that approximates . Infact, we could use a graphing calculator with exponential regression capabilities toobtain the approximation
and Figure 8 shows that it is a reasonably good “fit.” The function is called amathematical model for population growth. In other words, it is a function with anexplicit formula that approximates the behavior of our given function. We will see,however, that the ideas of calculus can be applied to a table of values; an explicitformula is not necessary.
FIGURE 8 Graph of a mathematical model for population growthFIGURE 7 Scatter plot of data points for population growth
1900
6x10'
P
t1920 1940 1960 1980 2000 1900
6x10'
P
t1920 1940 1960 1980 2000
f
P!t" # f !t" ! !0.008079266" # !1.013731"t
P!t"P!t"
P!t"
!0, $"$r % r % 0& ! !0, $"
A!r" ! !r 2
$y % "2 & y & 4& ! '"2, 4(
ff'0, 7(f0 & x & 7f !x"
SECTION 1.1 FUNCTIONS AND THEIR REPRESENTATIONS ■ 3
■ The notation for intervals is given on Reference Page 3. The Reference Pagesare located at the front and back of thebook.
PopulationYear (millions)
1900 16501910 17501920 18601930 20701940 23001950 25601960 30401970 37101980 44501990 52802000 6080
The function is typical of the functions that arise whenever we attempt toapply calculus to the real world. We start with a verbal description of a function.Then we may be able to construct a table of values of the function, perhaps frominstrument readings in a scientific experiment. Even though we don’t have com-plete knowledge of the values of the function, we will see throughout the book thatit is still possible to perform the operations of calculus on such a function.
C. Again the function is described in words: is the cost of mailing a first-classletter with weight . The rule that the US Postal Service used as of 2006 is as fol-lows: The cost is 39 cents for up to one ounce, plus 24 cents for each successiveounce up to 13 ounces. The table of values shown in the margin is the most con-venient representation for this function, though it is possible to sketch a graph (seeExample 6).
D. The graph shown in Figure 1 is the most natural representation of the vertical accel-eration function . It’s true that a table of values could be compiled, and it is even possible to devise an approximate formula. But everything a geologistneeds to know—amplitudes and patterns—can be seen easily from the graph. (Thesame is true for the patterns seen in electrocardiograms of heart patients and poly-graphs for lie-detection.)
In the next example we sketch the graph of a function that is defined verbally.
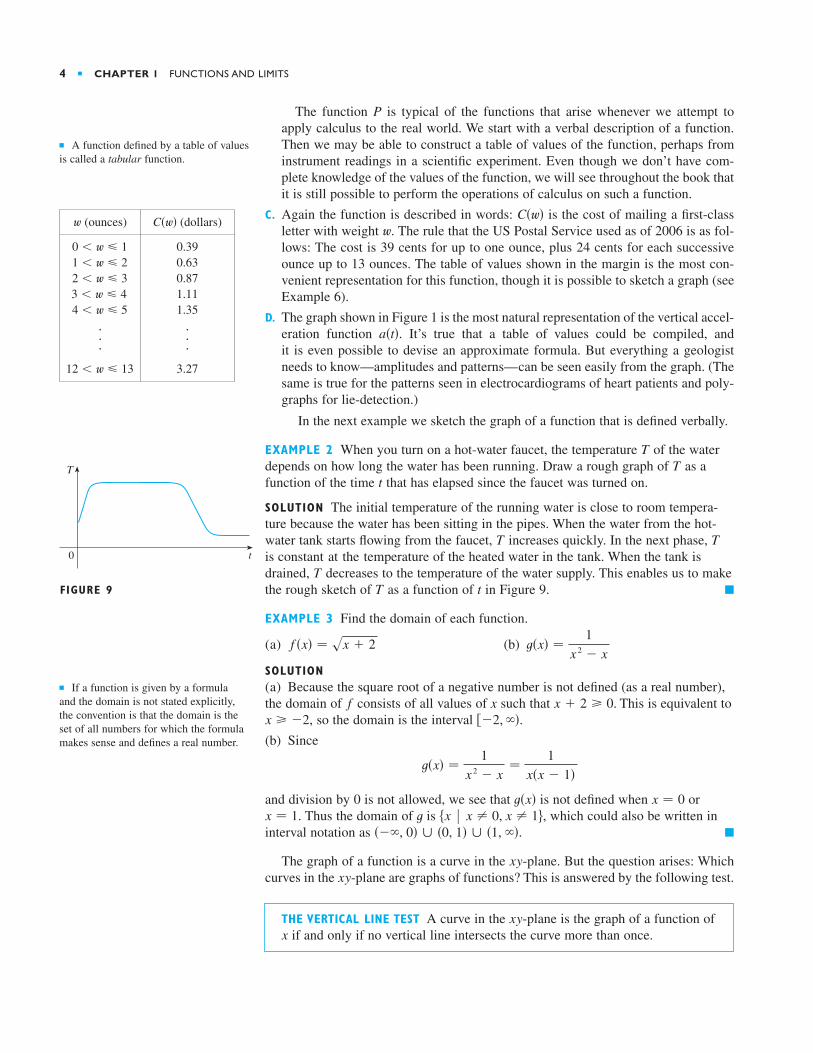
EXAMPLE 2 When you turn on a hot-water faucet, the temperature of the waterdepends on how long the water has been running. Draw a rough graph of as afunction of the time that has elapsed since the faucet was turned on.
SOLUTION The initial temperature of the running water is close to room tempera-ture because the water has been sitting in the pipes. When the water from the hot-water tank starts flowing from the faucet, increases quickly. In the next phase, is constant at the temperature of the heated water in the tank. When the tank isdrained, decreases to the temperature of the water supply. This enables us to makethe rough sketch of as a function of in Figure 9. ■
EXAMPLE 3 Find the domain of each function.
(a) (b)
SOLUTION(a) Because the square root of a negative number is not defined (as a real number),the domain of consists of all values of x such that . This is equivalent to
, so the domain is the interval .
(b) Since
and division by is not allowed, we see that is not defined when or. Thus the domain of is , which could also be written in
interval notation as . ■
The graph of a function is a curve in the -plane. But the question arises: Whichcurves in the -plane are graphs of functions? This is answered by the following test.
THE VERTICAL LINE TEST A curve in the -plane is the graph of a function ofif and only if no vertical line intersects the curve more than once.x
xy
xyxy
!"$, 0" " !0, 1" " !1, $"$x % x " 0, x " 1&tx ! 1
x ! 0t!x"0
t!x" !1
x 2 " x!
1x!x " 1"
'"2, $"x ' "2x ( 2 ' 0f
t!x" !1
x 2 " xf !x" ! sx ( 2
tTT
TT
tT
T
a!t"
wC!w"
P
4 ■ CHAPTER 1 FUNCTIONS AND LIMITS
■ A function defined by a table of valuesis called a tabular function.
(ounces) (dollars)
0.390.630.871.111.35
3.2712 ) w & 13
######
4 ) w & 53 ) w & 42 ) w & 31 ) w & 20 ) w & 1
C!w"w
t
T
0
FIGURE 9
■ If a function is given by a formulaand the domain is not stated explicitly,the convention is that the domain is theset of all numbers for which the formulamakes sense and defines a real number.
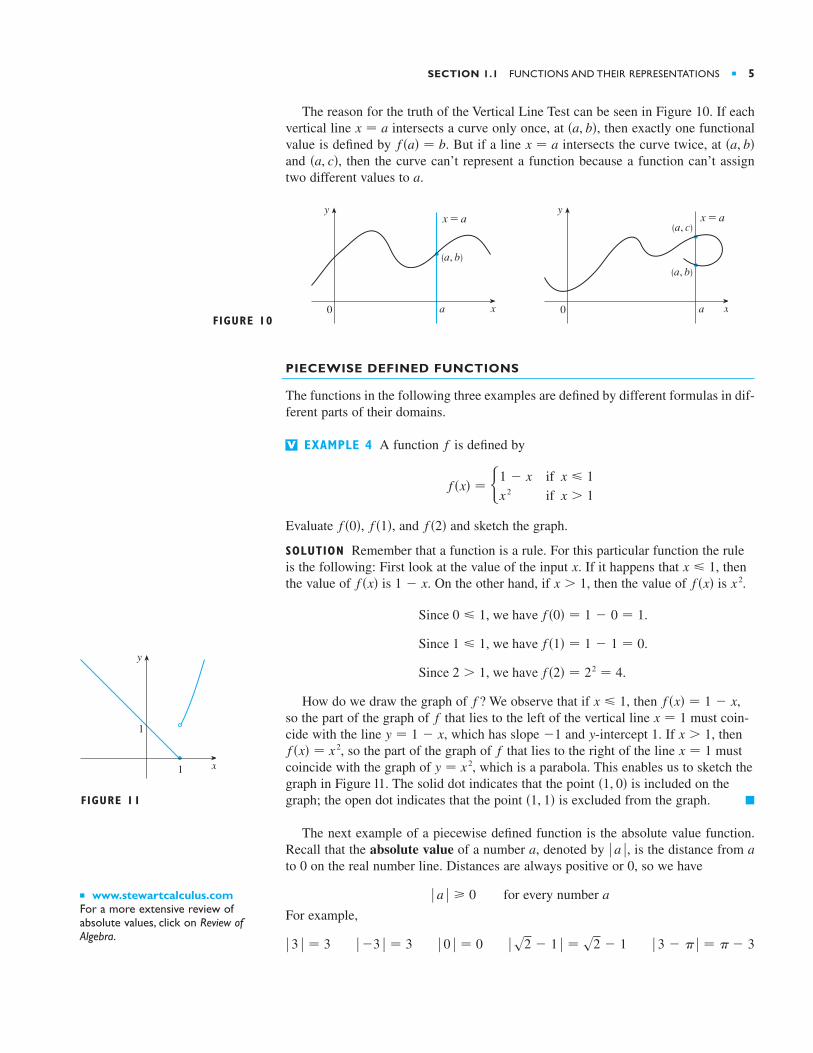
The reason for the truth of the Vertical Line Test can be seen in Figure 10. If eachvertical line intersects a curve only once, at , then exactly one functionalvalue is defined by . But if a line intersects the curve twice, at and , then the curve can’t represent a function because a function can’t assigntwo different values to .
PIECEWISE DEFINED FUNCTIONS
The functions in the following three examples are defined by different formulas in dif-ferent parts of their domains.
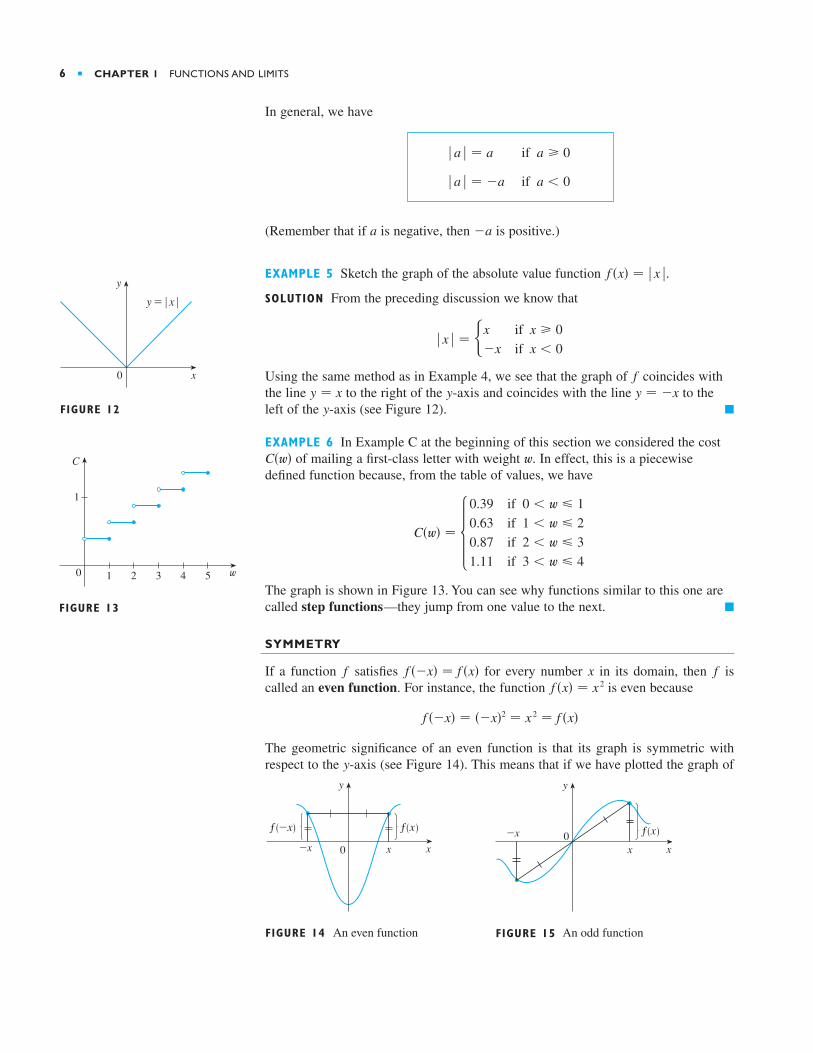
EXAMPLE 4 A function is defined by
Evaluate , , and and sketch the graph.
SOLUTION Remember that a function is a rule. For this particular function the ruleis the following: First look at the value of the input . If it happens that , thenthe value of is . On the other hand, if , then the value of is .
How do we draw the graph of ? We observe that if , then ,so the part of the graph of that lies to the left of the vertical line must coin-cide with the line , which has slope and -intercept 1. If , then
, so the part of the graph of that lies to the right of the line mustcoincide with the graph of , which is a parabola. This enables us to sketch thegraph in Figure l1. The solid dot indicates that the point is included on thegraph; the open dot indicates that the point is excluded from the graph. ■
The next example of a piecewise defined function is the absolute value function.Recall that the absolute value of a number , denoted by , is the distance from to on the real number line. Distances are always positive or , so we have
for every number
For example,
% 3 " ! % ! ! " 3%s2 " 1 % ! s2 " 1% 0 % ! 0% "3 % ! 3% 3 % ! 3
a% a % ' 0
00a% a %a
!1, 1"!1, 0"
y ! x 2x ! 1ff !x" ! x 2x % 1y"1y ! 1 " x
x ! 1ff !x" ! 1 " xx & 1f
Since 2 % 1, we have f !2" ! 22 ! 4.
Since 1 & 1, we have f !1" ! 1 " 1 ! 0.
Since 0 & 1, we have f !0" ! 1 " 0 ! 1.
x 2f !x"x % 11 " xf !x"& 1xx
f !2"f !1"f !0"
f !x" ! )1 " xx 2
if x & 1if x % 1
fV
FIGURE 10a
x=a
(a, b)
0 a
(a, c)
(a, b)
x=a
0 x
y
x
y
a!a, c"
!a, b"x ! af !a" ! b!a, b"x ! a
SECTION 1.1 FUNCTIONS AND THEIR REPRESENTATIONS ■ 5
1
x
y
1
FIGURE 11
■ www.stewartcalculus.comFor a more extensive review ofabsolute values, click on Review of Algebra.
In general, we have
(Remember that if is negative, then is positive.)
EXAMPLE 5 Sketch the graph of the absolute value function .
SOLUTION From the preceding discussion we know that
Using the same method as in Example 4, we see that the graph of coincides withthe line to the right of the -axis and coincides with the line to theleft of the -axis (see Figure 12). ■
EXAMPLE 6 In Example C at the beginning of this section we considered the costof mailing a first-class letter with weight . In effect, this is a piecewise
defined function because, from the table of values, we have
The graph is shown in Figure 13. You can see why functions similar to this one arecalled step functions—they jump from one value to the next. ■
SYMMETRY
If a function satisfies for every number in its domain, then iscalled an even function. For instance, the function is even because
The geometric significance of an even function is that its graph is symmetric withrespect to the -axis (see Figure 14). This means that if we have plotted the graph of
0 x_xf(_x) ƒ
FIGURE 14 An even function
x
y
0x
_x ƒ
FIGURE 15 An odd function
x
yy
f !"x" ! !"x"2 ! x 2 ! f !x"
f !x" ! x 2fxf !"x" ! f !x"f
0.390.630.871.11
if 0 ) w & 1if 1 ) w & 2if 2 ) w & 3if 3 ) w & 4
C!w" !
wC!w"
yy ! "xyy ! xf
% x % ! )x"x
if x ' 0if x ) 0
f !x" ! % x %
"aa
if a ) 0% a % ! "a
if a ' 0% a % ! a
6 ■ CHAPTER 1 FUNCTIONS AND LIMITS
x
y=| x |
0
y
FIGURE 12
FIGURE 13
C
1
1
0 2 3 4 5 w
for , we obtain the entire graph simply by reflecting this portion about the -axis.
If satisfies for every number in its domain, then is called anodd function. For example, the function is odd because
The graph of an odd function is symmetric about the origin (see Figure 15 on page 6).If we already have the graph of for , we can obtain the entire graph by rotat-ing this portion through about the origin.
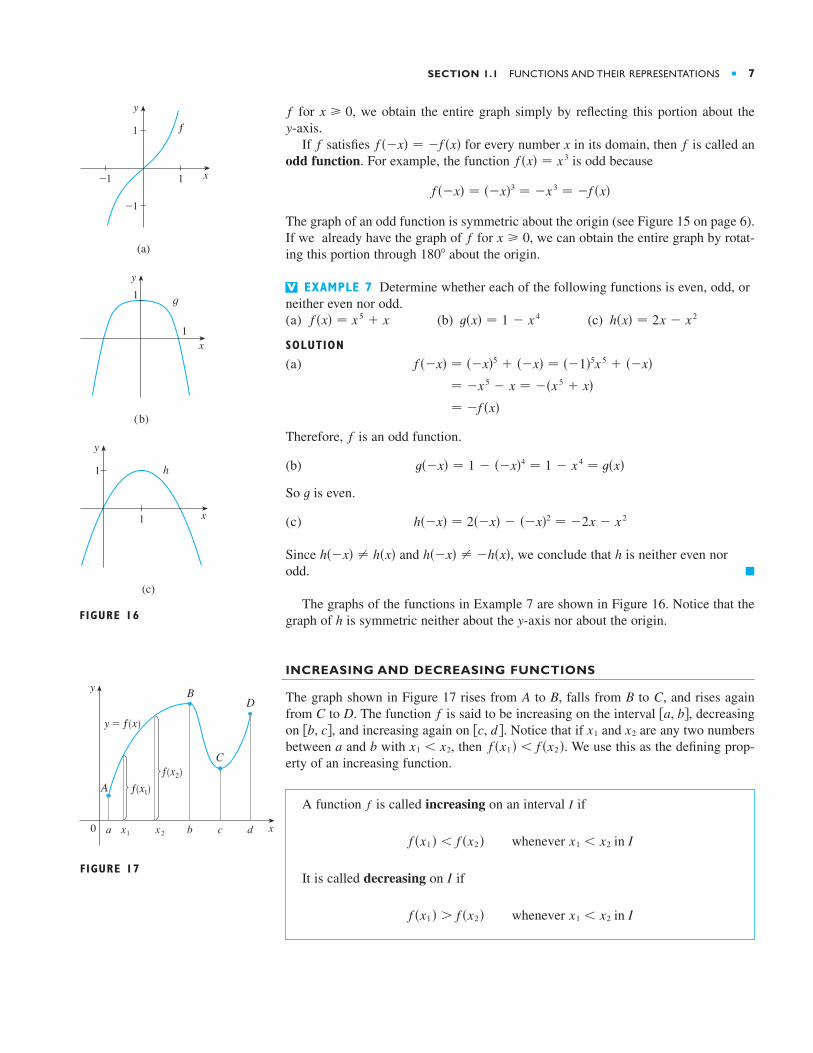
EXAMPLE 7 Determine whether each of the following functions is even, odd, orneither even nor odd.(a) (b) (c)
SOLUTION(a)
Therefore, is an odd function.
(b)
So is even.
(c)
Since and , we conclude that is neither even norodd. ■
The graphs of the functions in Example 7 are shown in Figure 16. Notice that thegraph of h is symmetric neither about the y-axis nor about the origin.
INCREASING AND DECREASING FUNCTIONS
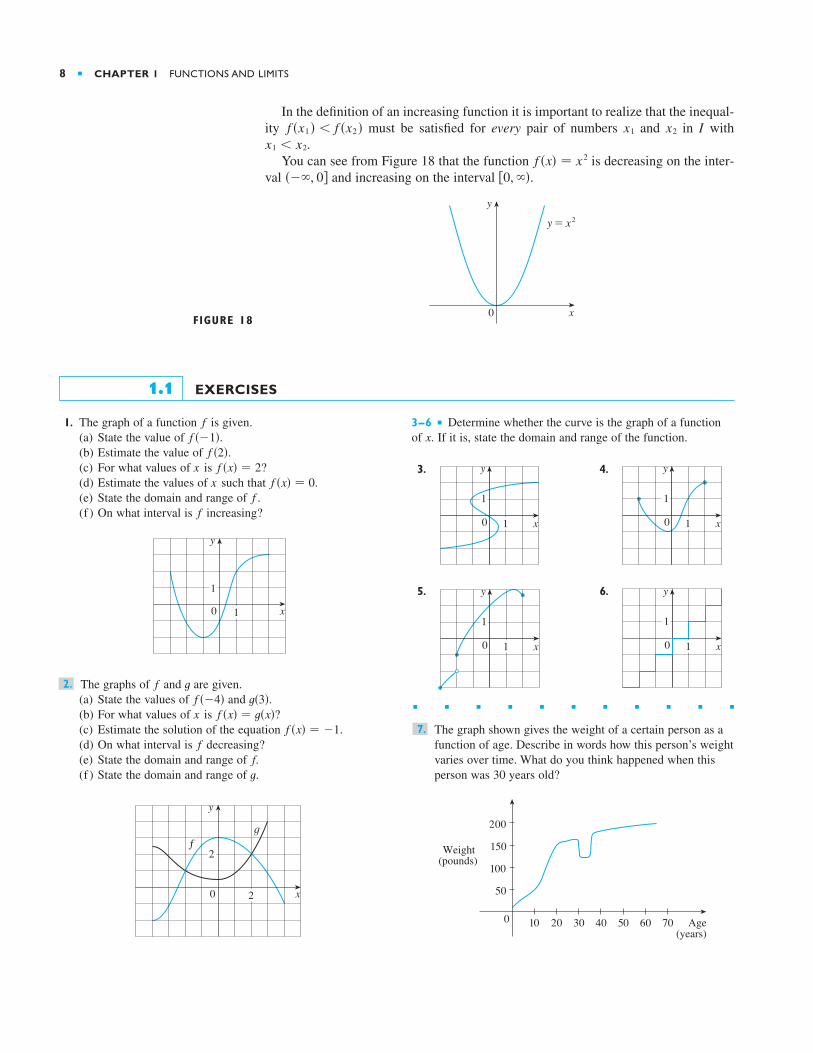
The graph shown in Figure 17 rises from to , falls from to , and rises againfrom to . The function is said to be increasing on the interval , decreasingon , and increasing again on . Notice that if and are any two numbersbetween and with , then . We use this as the defining prop-erty of an increasing function.
A function is called increasing on an interval if
It is called decreasing on if
whenever x1 ) x2 in If !x1 " % f !x2 "
I
whenever x1 ) x2 in If !x1 " ) f !x2 "
If
f !x1 " ) f !x2 "x1 ) x2bax2x1'c, d ('b, c(
'a, b(fDCCBBA
hh!"x" " "h!x"h!"x" " h!x"
h!"x" ! 2!"x" " !"x"2 ! "2x " x 2
tt!"x" ! 1 " !"x"4 ! 1 " x 4 ! t!x"
f
! "f !x"! "x 5 " x ! "!x 5 ( x"
f !"x" ! !"x"5 ( !"x" ! !"1"5x 5 ( !"x"
h!x" ! 2x " x 2t!x" ! 1 " x 4f !x" ! x 5 ( x
V
180*x ' 0f
f !"x" ! !"x"3 ! "x 3 ! "f !x"
f !x" ! x 3fxf !"x" ! "f !x"f
yx ' 0f
SECTION 1.1 FUNCTIONS AND THEIR REPRESENTATIONS ■ 7
1
1 x
y
h
1
1
y
x
g
1
_1
1
y
x
f
_1
(a)
(b)
(c)
FIGURE 16
A
B
C
Dy=ƒ
f(x¡)
a
y
0 xx¡ x™ b c d
FIGURE 17
f(x™)
In the definition of an increasing function it is important to realize that the inequal-ity must be satisfied for every pair of numbers and in with
.You can see from Figure 18 that the function is decreasing on the inter-
val and increasing on the interval .
FIGURE 18 0
y
x
y=≈
'0, $"!"$, 0(f !x" ! x 2
x1 ) x2
Ix2x1f !x1 " ) f !x2 "
8 ■ CHAPTER 1 FUNCTIONS AND LIMITS
3–6 ■ Determine whether the curve is the graph of a functionof . If it is, state the domain and range of the function.
3. 4.
5. 6.
■ ■ ■ ■ ■ ■ ■ ■ ■ ■ ■
The graph shown gives the weight of a certain person as afunction of age. Describe in words how this person’s weightvaries over time. What do you think happened when thisperson was 30 years old?
Age(years)
Weight(pounds)
0
15010050
10
200
20 30 40 50 60 70
7.
y
x0 1
1
y
x0
1
1
y
x0 1
1
y
x0 1
1
x1. The graph of a function is given.
(a) State the value of .(b) Estimate the value of .(c) For what values of is ?(d) Estimate the values of such that .(e) State the domain and range of .(f ) On what interval is increasing?
The graphs of and t are given.(a) State the values of and .(b) For what values of is ?(c) Estimate the solution of the equation .(d) On what interval is decreasing?(e) State the domain and range of (f ) State the domain and range of .
g
x
y
0
f2
2
tf.
ff !x" ! "1
f !x" ! t!x"xt!3"f !"4"
f2.
y
0 x
1
1
ff
f !x" ! 0xf !x" ! 2x
f !2"f !"1"
f
EXERCISES1.1
19–22 ■ Evaluate the difference quotient for the given function.Simplify your answer.
,
20. ,
21. ,
22. ,
■ ■ ■ ■ ■ ■ ■ ■ ■ ■ ■
23–27 ■ Find the domain of the function.
23.
24.
25.
26.
■ ■ ■ ■ ■ ■ ■ ■ ■ ■ ■
28. Find the domain and range and sketch the graph of thefunction .
29–40 ■ Find the domain and sketch the graph of the function.
29. 30.
31. 32.
33. 34.
36.
37.
38.
40.
■ ■ ■ ■ ■ ■ ■ ■ ■ ■ ■
f !x" ! )"13x ( 27 " 2x
if x & "1if % x % ) 1if x ' 1
f !x" ! )x ( 2x 2
if x & "1if x % "1
39.
f !x" ! )3 " 12 x
2x " 5if x & 2if x % 2
f !x" ! )x ( 21 " x
if x ) 0if x ' 0
t!x" ! % x %x 2G!x" !
3x ( % x %x
35.
F!x" ! % 2x ( 1 %t!x" ! sx " 5
H!t" !4 " t 2
2 " tf !t" ! t 2 " 6t
F!x" ! 12 !x ( 3"f !x" ! 5
h!x" ! s4 " x 2
h!x" !1
s4 x 2 " 5x27.
t!u" ! su ( s4 " u
f !t" ! st ( s3 t
f !x" !5x ( 4
x 2 ( 3x ( 2
f !x" !x
3x " 1
f !x" " f !1"x " 1
f !x" !x ( 3x ( 1
f !x" " f !a"x " a
f !x" !1x
f !a ( h" " f !a"h
f !x" ! x 3
f !3 ( h" " f !3"h
f !x" ! 4 ( 3x " x 219.
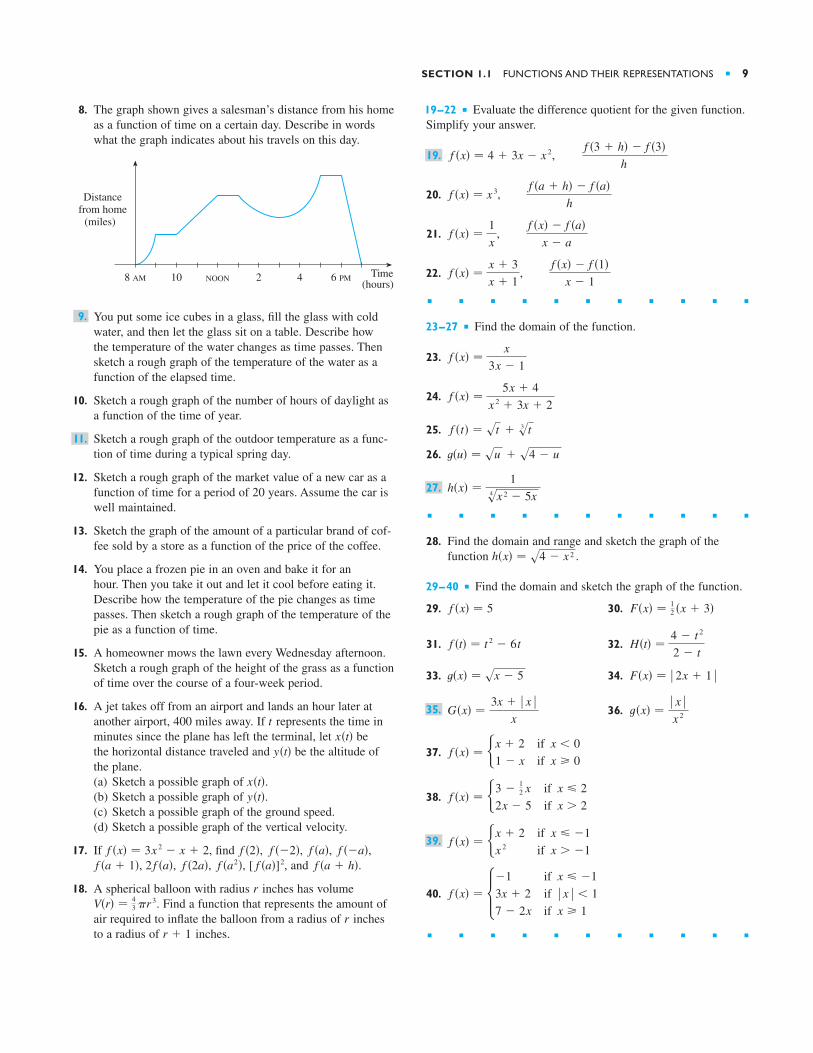
8. The graph shown gives a salesman’s distance from his homeas a function of time on a certain day. Describe in wordswhat the graph indicates about his travels on this day.
You put some ice cubes in a glass, fill the glass with coldwater, and then let the glass sit on a table. Describe how the temperature of the water changes as time passes. Thensketch a rough graph of the temperature of the water as afunction of the elapsed time.
10. Sketch a rough graph of the number of hours of daylight asa function of the time of year.
Sketch a rough graph of the outdoor temperature as a func-tion of time during a typical spring day.
12. Sketch a rough graph of the market value of a new car as afunction of time for a period of 20 years. Assume the car iswell maintained.
13. Sketch the graph of the amount of a particular brand of cof-fee sold by a store as a function of the price of the coffee.
14. You place a frozen pie in an oven and bake it for an hour. Then you take it out and let it cool before eating it.Describe how the temperature of the pie changes as timepasses. Then sketch a rough graph of the temperature of thepie as a function of time.
15. A homeowner mows the lawn every Wednesday afternoon.Sketch a rough graph of the height of the grass as a functionof time over the course of a four-week period.
16. A jet takes off from an airport and lands an hour later atanother airport, 400 miles away. If represents the time inminutes since the plane has left the terminal, let be the horizontal distance traveled and be the altitude ofthe plane.(a) Sketch a possible graph of .(b) Sketch a possible graph of .(c) Sketch a possible graph of the ground speed.(d) Sketch a possible graph of the vertical velocity.
17. If , find , , , ,, , , , and .
18. A spherical balloon with radius inches has volume. Find a function that represents the amount of
air required to inflate the balloon from a radius of inchesto a radius of inches.r ( 1
rV!r" ! 4
3 !r 3r
f !a ( h"[ f !a"]2,f !a2"f !2a"2 f !a"f !a ( 1"f !"a"f !a"f !"2"f !2"f !x" ! 3x 2 " x ( 2
y!t"x!t"
y!t"x!t"
t
11.
9.
8 AM 10 NOON 2 4 6 PM Time(hours)
Distancefrom home
(miles)
SECTION 1.1 FUNCTIONS AND THEIR REPRESENTATIONS ■ 9
stairs. Give two other examples of step functions that arisein everyday life.
53–54 ■ Graphs of and are shown. Decide whether eachfunction is even, odd, or neither. Explain your reasoning.
53. 54.
■ ■ ■ ■ ■ ■ ■ ■ ■ ■ ■
55. (a) If the point is on the graph of an even function,what other point must also be on the graph?
(b) If the point is on the graph of an odd function,what other point must also be on the graph?
56. A function has domain and a portion of its graphis shown.(a) Complete the graph of if it is known that is even.(b) Complete the graph of if it is known that is odd.
57–62 ■ Determine whether is even, odd, or neither. If youhave a graphing calculator, use it to check your answer visually.
57. 58.
59. 60.
61. 62.
■ ■ ■ ■ ■ ■ ■ ■ ■ ■ ■
f !x" ! 1 ( 3x 3 " x 5f !x" ! 1 ( 3x 2 " x 4
f !x" ! x % x %f !x" !x
x ( 1
f !x" !x 2
x 4 ( 1f !x" !
xx 2 ( 1
f
x0
y
5_5
ffff
'"5, 5(f
!5, 3"
!5, 3"
y
x
f
g
y
x
fg
tf
41–44 ■ Find an expression for the function whose graph is thegiven curve.
41. The line segment joining the points and
42. The line segment joining the points and
The bottom half of the parabola
44. The top half of the circle
■ ■ ■ ■ ■ ■ ■ ■ ■ ■ ■
45–49 ■ Find a formula for the described function and state itsdomain.
45. A rectangle has perimeter 20 m. Express the area of therectangle as a function of the length of one of its sides.
46. A rectangle has area 16 m . Express the perimeter of therectangle as a function of the length of one of its sides.
47. Express the area of an equilateral triangle as a function ofthe length of a side.
48. Express the surface area of a cube as a function of itsvolume.
An open rectangular box with volume 2 m has a squarebase. Express the surface area of the box as a function ofthe length of a side of the base.
■ ■ ■ ■ ■ ■ ■ ■ ■ ■ ■
50. A taxi company charges two dollars for the first mile (orpart of a mile) and 20 cents for each succeeding tenth of amile (or part). Express the cost (in dollars) of a ride as afunction of the distance traveled (in miles) for ,and sketch the graph of this function.
In a certain country, income tax is assessed as follows.There is no tax on income up to $10,000. Any income over$10,000 is taxed at a rate of 10%, up to an income of$20,000. Any income over $20,000 is taxed at 15%.(a) Sketch the graph of the tax rate R as a function of the
income I.(b) How much tax is assessed on an income of $14,000?
On $26,000?(c) Sketch the graph of the total assessed tax T as a function
of the income I.
52. The functions in Example 6 and Exercises 50 and 51(a) are called step functions because their graphs look like
51.
0 ) x ) 2xC
349.
2
!x " 1"2 ( y 2 ! 1
x ( !y " 1"2 ! 043.
!6, 3"!"3, "2"!4, "6"!"2, 1"
10 ■ CHAPTER 1 FUNCTIONS AND LIMITS
A CATALOG OF ESSENTIAL FUNCTIONS
In solving calculus problems you will find that it is helpful to be familiar with thegraphs of some commonly occurring functions. These same basic functions are oftenused to model real-world phenomena, so we begin with a discussion of mathematicalmodeling. We also review briefly how to transform these functions by shifting, stretch-ing, and reflecting their graphs as well as how to combine pairs of functions by thestandard arithmetic operations and by composition.
1.2
MATHEMATICAL MODELING
A mathematical model is a mathematical description (often by means of a functionor an equation) of a real-world phenomenon such as the size of a population, thedemand for a product, the speed of a falling object, the concentration of a product ina chemical reaction, the life expectancy of a person at birth, or the cost of emissionreductions. The purpose of the model is to understand the phenomenon and perhapsto make predictions about future behavior.
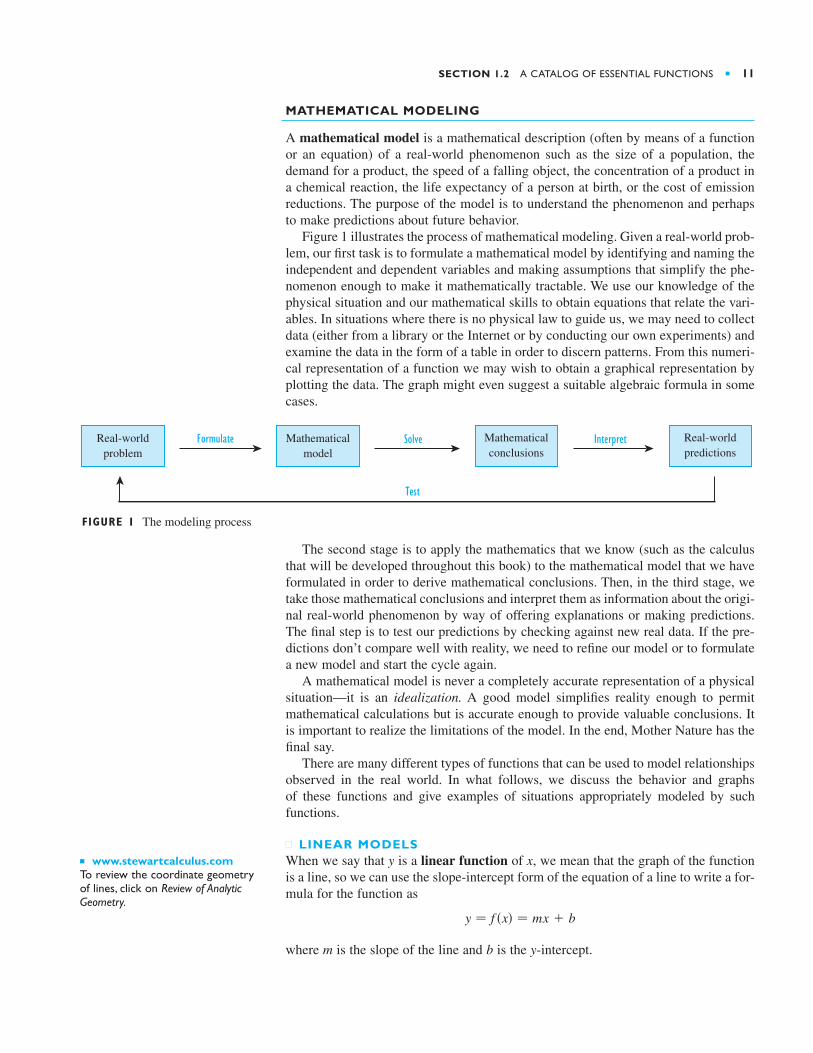
Figure 1 illustrates the process of mathematical modeling. Given a real-world prob-lem, our first task is to formulate a mathematical model by identifying and naming theindependent and dependent variables and making assumptions that simplify the phe-nomenon enough to make it mathematically tractable. We use our knowledge of thephysical situation and our mathematical skills to obtain equations that relate the vari-ables. In situations where there is no physical law to guide us, we may need to collectdata (either from a library or the Internet or by conducting our own experiments) andexamine the data in the form of a table in order to discern patterns. From this numeri-cal representation of a function we may wish to obtain a graphical representation byplotting the data. The graph might even suggest a suitable algebraic formula in somecases.
The second stage is to apply the mathematics that we know (such as the calculusthat will be developed throughout this book) to the mathematical model that we haveformulated in order to derive mathematical conclusions. Then, in the third stage, wetake those mathematical conclusions and interpret them as information about the origi-nal real-world phenomenon by way of offering explanations or making predictions.The final step is to test our predictions by checking against new real data. If the pre-dictions don’t compare well with reality, we need to refine our model or to formulatea new model and start the cycle again.
A mathematical model is never a completely accurate representation of a physicalsituation—it is an idealization. A good model simplifies reality enough to permitmathematical calculations but is accurate enough to provide valuable conclusions. Itis important to realize the limitations of the model. In the end, Mother Nature has thefinal say.
There are many different types of functions that can be used to model relationshipsobserved in the real world. In what follows, we discuss the behavior and graphs of these functions and give examples of situations appropriately modeled by such functions.
■ LINEAR MODELSWhen we say that y is a linear function of x, we mean that the graph of the functionis a line, so we can use the slope-intercept form of the equation of a line to write a for-mula for the function as
where m is the slope of the line and b is the y-intercept.
y ! f !x" ! mx ( b
FIGURE 1 The modeling process
Real-worldproblem
Mathematicalmodel
Real-worldpredictions
Mathematicalconclusions
Formulate InterpretSolve
Test
SECTION 1.2 A CATALOG OF ESSENTIAL FUNCTIONS ■ 11
■ www.stewartcalculus.comTo review the coordinate geometry of lines, click on Review of Analytic Geometry.
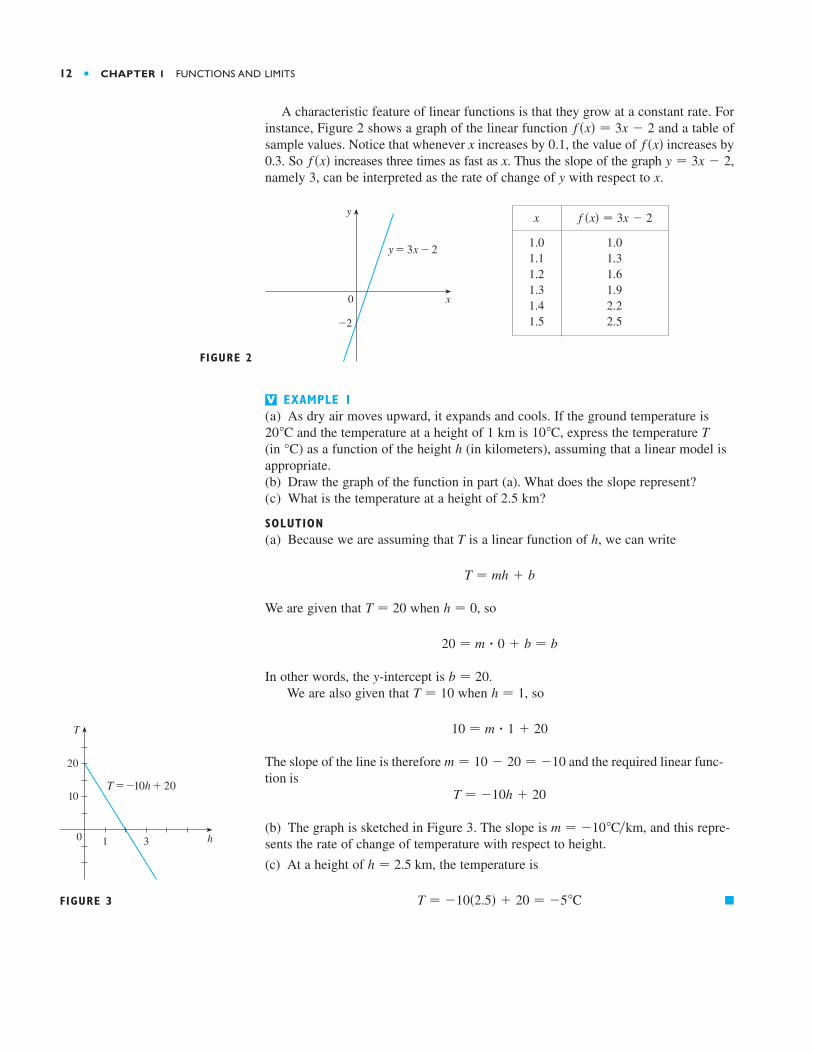
A characteristic feature of linear functions is that they grow at a constant rate. Forinstance, Figure 2 shows a graph of the linear function and a table ofsample values. Notice that whenever x increases by 0.1, the value of increases by0.3. So increases three times as fast as x. Thus the slope of the graph ,namely 3, can be interpreted as the rate of change of y with respect to x.
EXAMPLE 1(a) As dry air moves upward, it expands and cools. If the ground temperature is
and the temperature at a height of 1 km is , express the temperature T(in °C) as a function of the height h (in kilometers), assuming that a linear model isappropriate.(b) Draw the graph of the function in part (a). What does the slope represent?(c) What is the temperature at a height of 2.5 km?
SOLUTION(a) Because we are assuming that T is a linear function of h, we can write
We are given that when , so
In other words, the y-intercept is .We are also given that when , so
The slope of the line is therefore and the required linear func-tion is
(b) The graph is sketched in Figure 3. The slope is , and this repre-sents the rate of change of temperature with respect to height.
(c) At a height of , the temperature is
■T ! "10!2.5" ( 20 ! "5*C
h ! 2.5 km
m ! "10*C*km
T ! "10h ( 20
m ! 10 " 20 ! "10
10 ! m # 1 ( 20
h ! 1T ! 10b ! 20
20 ! m # 0 ( b ! b
h ! 0T ! 20
T ! mh ( b
10*C20*C
V
x
y
0
y=3x-2
_2
FIGURE 2
y ! 3x " 2f !x"f !x"
f !x" ! 3x " 2
12 ■ CHAPTER 1 FUNCTIONS AND LIMITS
x
1.0 1.01.1 1.31.2 1.61.3 1.91.4 2.21.5 2.5
f !x" ! 3x " 2
FIGURE 3
T=_10h+20
T
h0
10
20
1 3
■ POLYNOMIALSA function is called a polynomial if
where is a nonnegative integer and the numbers are constantscalled the coefficients of the polynomial. The domain of any polynomial is
If the leading coefficient , then the degree of the polynomial is . For example, the function
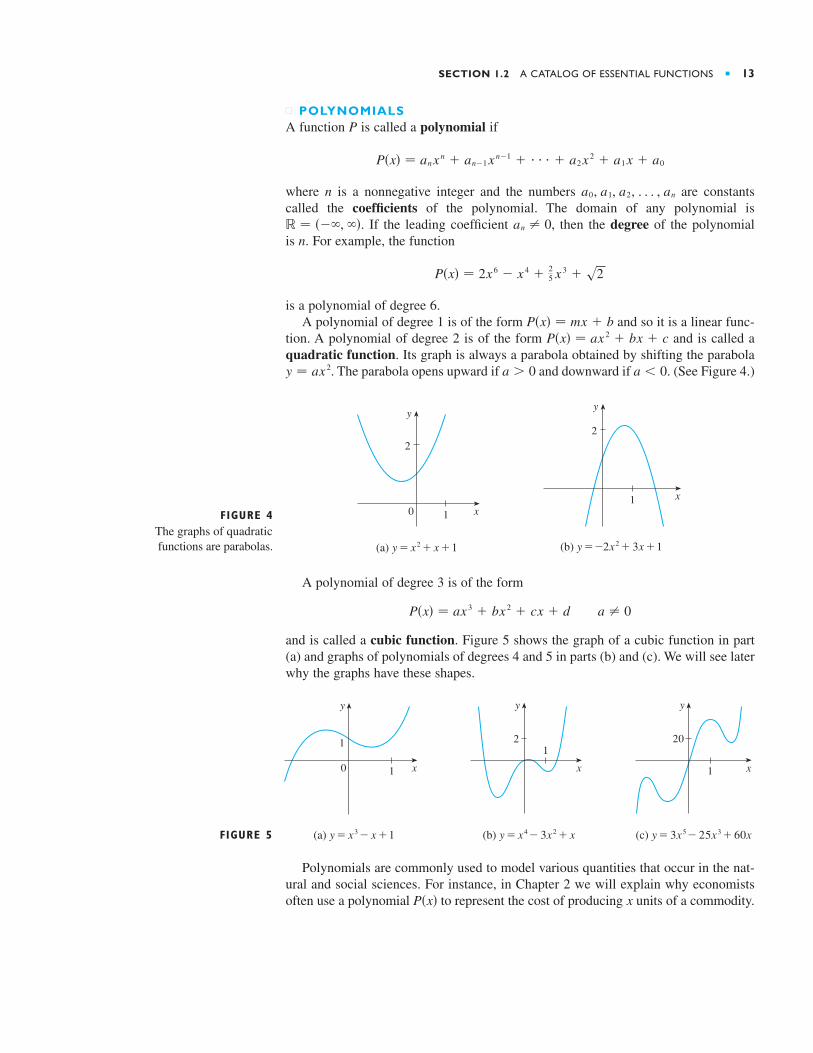
is a polynomial of degree 6.A polynomial of degree 1 is of the form and so it is a linear func-
tion. A polynomial of degree 2 is of the form and is called aquadratic function. Its graph is always a parabola obtained by shifting the parabola
. The parabola opens upward if and downward if . (See Figure 4.)
A polynomial of degree 3 is of the form
and is called a cubic function. Figure 5 shows the graph of a cubic function in part(a) and graphs of polynomials of degrees 4 and 5 in parts (b) and (c). We will see laterwhy the graphs have these shapes.
Polynomials are commonly used to model various quantities that occur in the nat-ural and social sciences. For instance, in Chapter 2 we will explain why economistsoften use a polynomial to represent the cost of producing units of a commodity.xP!x"
FIGURE 5 (a) y=˛-x+1
x
1
y
10
(b) y=x$-3≈+x
x
2
y
1
(c) y=3x%-25˛+60x
x
20
y
1
a " 0P!x" ! ax 3 ( bx 2 ( cx ( d
The graphs of quadratic functions are parabolas.
FIGURE 4 0
y
2
x1
(a) y=≈+x+1
y
2
x1
(b) y=_2≈+3x+1
a ) 0a % 0y ! ax 2
P!x" ! ax 2 ( bx ( cP!x" ! mx ( b
P!x" ! 2x 6 " x 4 ( 25 x 3 ( s2
nan " 0! ! !"$, $".
a0, a1, a2, . . . , ann
P!x" ! anxn ( an"1xn"1 ( # # # ( a2x 2 ( a1x ( a0
P
SECTION 1.2 A CATALOG OF ESSENTIAL FUNCTIONS ■ 13
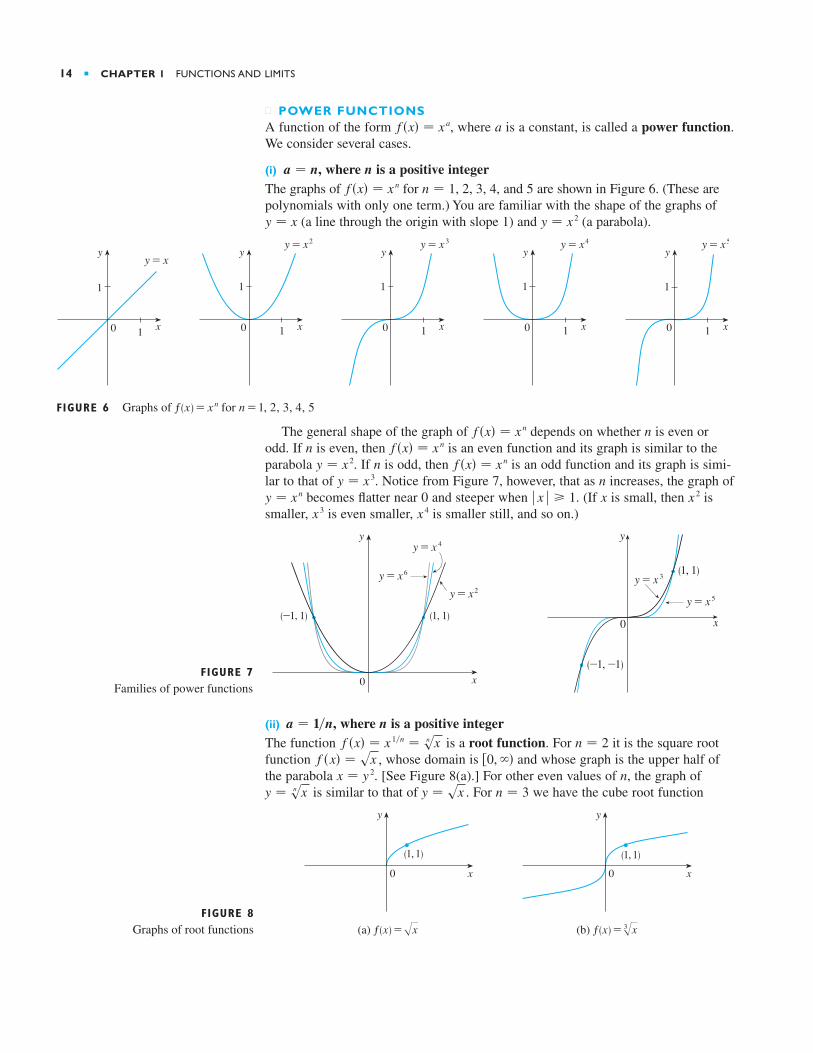
■ POWER FUNCTIONSA function of the form , where is a constant, is called a power function.We consider several cases.
(i) , where n is a positive integerThe graphs of for , and are shown in Figure 6. (These arepolynomials with only one term.) You are familiar with the shape of the graphs of
(a line through the origin with slope 1) and (a parabola).
The general shape of the graph of depends on whether is even orodd. If is even, then is an even function and its graph is similar to theparabola . If is odd, then is an odd function and its graph is simi-lar to that of . Notice from Figure 7, however, that as increases, the graph of
becomes flatter near 0 and steeper when . (If is small, then issmaller, is even smaller, is smaller still, and so on.)
(ii) , where n is a positive integerThe function is a root function. For it is the square rootfunction , whose domain is and whose graph is the upper half ofthe parabola . [See Figure 8(a).] For other even values of n, the graph of
is similar to that of . For we have the cube root function
(b) ƒ=Œ„x
x
y
0(1, 1)
(a) ƒ=œ„x
x
y
0(1, 1)
FIGURE 8Graphs of root functions
n ! 3y ! sxy ! sn xx ! y 2
'0, $"f !x" ! sxn ! 2f !x" ! x 1*n ! sn x
a ! 1*n
y=x$
(1, 1)(_1, 1)
y=x^y=≈
FIGURE 7Families of power functions
(_1, _1)
(1, 1)
0
y
x
x
y
0
y=x#y=x%
x 4x 3x 2x% x % ' 1y ! xn
ny ! x 3f !x" ! xnny ! x 2
f !x" ! xnnnf !x" ! xn
Graphs of ƒ=x n for n=1, 2, 3, 4, 5
x
1
y
10
y=x%
x
1
y
10
y=x#
x
1
y
10
y=≈
x
1
y
10
y=x
x
1
y
10
y=x$
FIGURE 6
y ! x 2y ! x
52, 3, 4n ! 1,f !x" ! xn
a ! n
af !x" ! xa
14 ■ CHAPTER 1 FUNCTIONS AND LIMITS
whose domain is (recall that every real number has a cube root) andwhose graph is shown in Figure 8(b). The graph of for n odd issimilar to that of .
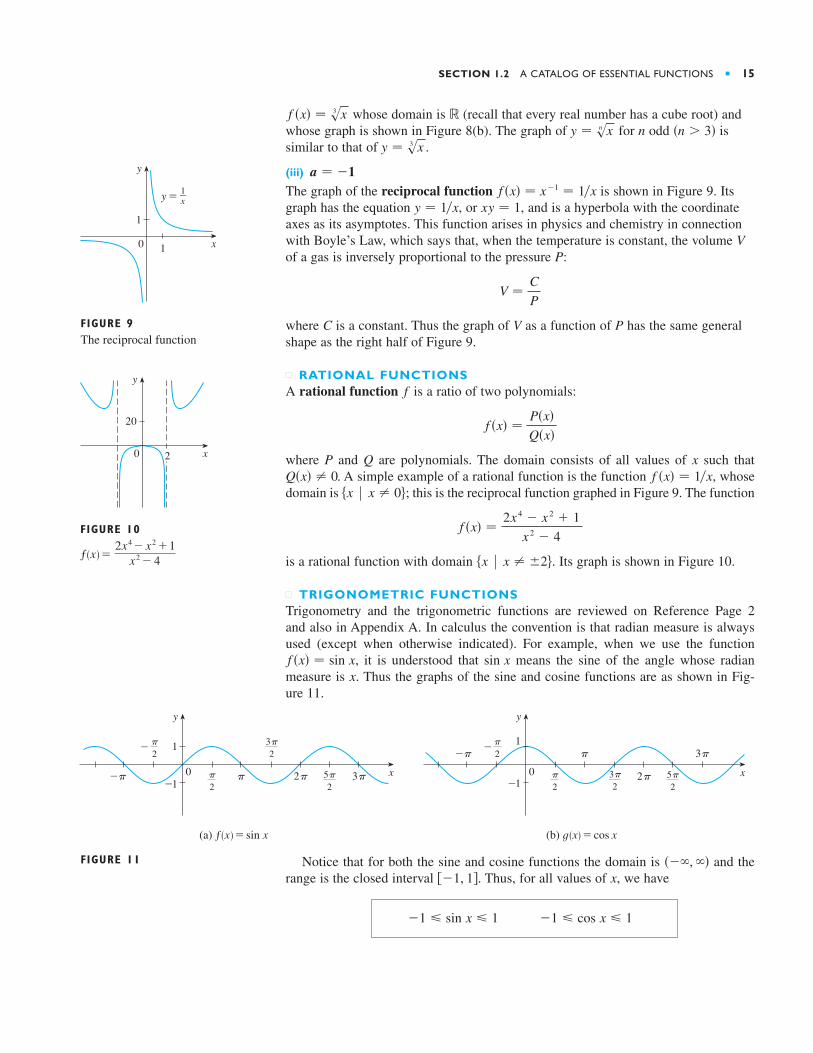
(iii)
The graph of the reciprocal function is shown in Figure 9. Itsgraph has the equation , or , and is a hyperbola with the coordinateaxes as its asymptotes. This function arises in physics and chemistry in connectionwith Boyle’s Law, which says that, when the temperature is constant, the volume of a gas is inversely proportional to the pressure :
where C is a constant. Thus the graph of V as a function of P has the same generalshape as the right half of Figure 9.
■ RATIONAL FUNCTIONSA rational function is a ratio of two polynomials:
where and are polynomials. The domain consists of all values of such that. A simple example of a rational function is the function , whose
domain is ; this is the reciprocal function graphed in Figure 9. The function
is a rational function with domain . Its graph is shown in Figure 10.
■ TRIGONOMETRIC FUNCTIONSTrigonometry and the trigonometric functions are reviewed on Reference Page 2 and also in Appendix A. In calculus the convention is that radian measure is alwaysused (except when otherwise indicated). For example, when we use the function
, it is understood that means the sine of the angle whose radianmeasure is . Thus the graphs of the sine and cosine functions are as shown in Fig-ure 11.
Notice that for both the sine and cosine functions the domain is and therange is the closed interval . Thus, for all values of , we have
"1 & cos x & 1"1 & sin x & 1
x'"1, 1(!"$, $"
(a) ƒ=sin x
π2
5π2
3π2
π2_
x
y
π0_π
1
_1 2π 3π
(b) ©=cos x
x
y
0
1
_1
π_π
2π
3ππ2
5π2
3π2
π2_
xsin xf !x" ! sin x
$x % x " +2&
f !x" !2x 4 " x 2 ( 1
x 2 " 4
$x % x " 0&f !x" ! 1*xQ!x" " 0
xQP
f !x" !P!x"Q!x"
f
V !CP
PV
xy ! 1y ! 1*xf !x" ! x"1 ! 1*x
a ! "1
y ! s3 x!n % 3"y ! sn x
!f !x" ! s3 x
SECTION 1.2 A CATALOG OF ESSENTIAL FUNCTIONS ■ 15
FIGURE 9The reciprocal function
x
1
y
10
y=∆
FIGURE 10
ƒ= 2x$-≈+1≈-4
x
20
y
20
FIGURE 11
or, in terms of absolute values,
Also, the zeros of the sine function occur at the integer multiples of ; that is,
An important property of the sine and cosine functions is that they are periodicfunctions and have period . This means that, for all values of ,
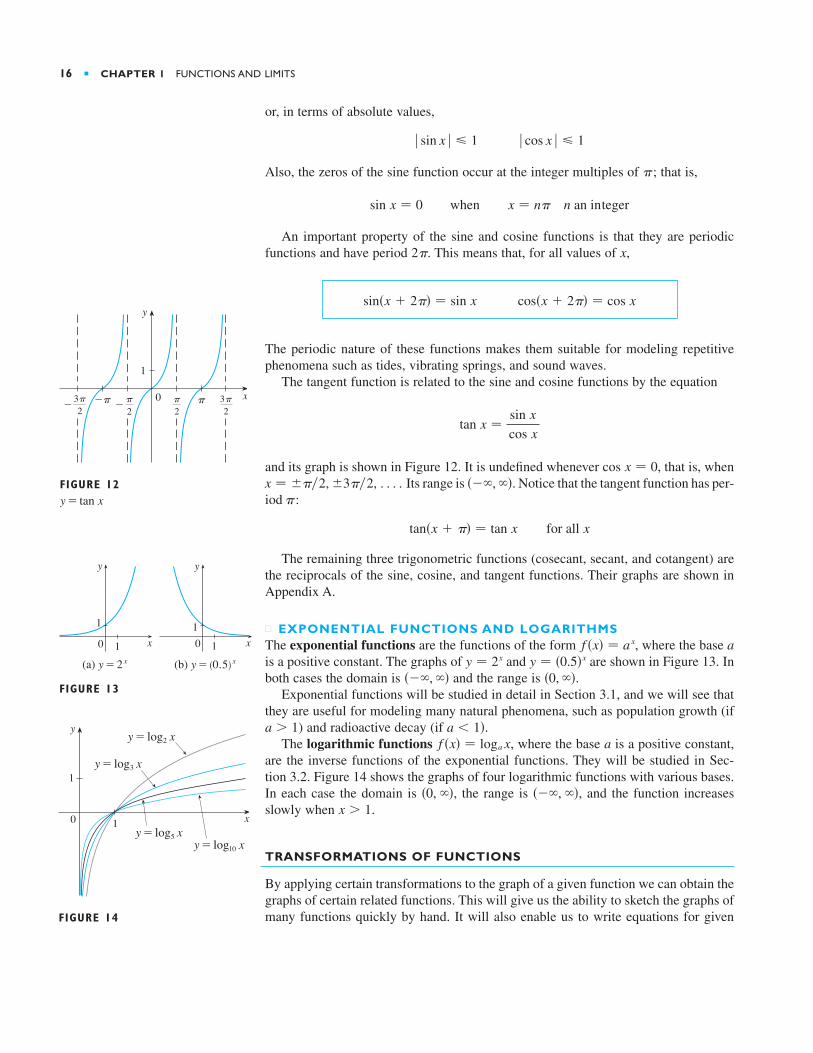
The periodic nature of these functions makes them suitable for modeling repetitivephenomena such as tides, vibrating springs, and sound waves.
The tangent function is related to the sine and cosine functions by the equation
and its graph is shown in Figure 12. It is undefined whenever , that is, when, Its range is . Notice that the tangent function has per-
iod :
The remaining three trigonometric functions (cosecant, secant, and cotangent) are the reciprocals of the sine, cosine, and tangent functions. Their graphs are shown inAppendix A.
■ EXPONENTIAL FUNCTIONS AND LOGARITHMSThe exponential functions are the functions of the form , where the base is a positive constant. The graphs of and are shown in Figure 13. Inboth cases the domain is and the range is .
Exponential functions will be studied in detail in Section 3.1, and we will see thatthey are useful for modeling many natural phenomena, such as population growth (if
) and radioactive decay (if The logarithmic functions , where the base is a positive constant,
are the inverse functions of the exponential functions. They will be studied in Sec-tion 3.2. Figure 14 shows the graphs of four logarithmic functions with various bases.In each case the domain is , the range is , and the function increasesslowly when .
TRANSFORMATIONS OF FUNCTIONS
By applying certain transformations to the graph of a given function we can obtain thegraphs of certain related functions. This will give us the ability to sketch the graphs ofmany functions quickly by hand. It will also enable us to write equations for given
x % 1!"$, $"!0, $"
af !x" ! loga xa ) 1".a % 1
!0, $"!"$, $"y ! !0.5"xy ! 2x
af !x" ! ax
for all xtan!x ( !" ! tan x
!!"$, $"+3!*2, . . . .x ! +!*2
cos x ! 0
tan x !sin xcos x
cos!x ( 2!" ! cos xsin!x ( 2!" ! sin x
x2!
n an integerx ! n!whensin x ! 0
!
% cos x % & 1% sin x % & 1
16 ■ CHAPTER 1 FUNCTIONS AND LIMITS
FIGURE 12y=tan x
x
y
π0_π
1
π 2
3π 2
π 2_3π
2_
FIGURE 14
0
y
1
x1
y=log£ x
y=log™ x
y=log∞ xy=log¡¸ x
FIGURE 13
y
x1
10
y
x1
10(a) y=2® (b) y=(0.5)®
graphs. Let’s first consider translations. If c is a positive number, then the graph ofis just the graph of shifted upward a distance of c units
(because each y-coordinate is increased by the same number c). Likewise, if, where , then the value of at x is the same as the value of at
(c units to the left of x). Therefore, the graph of is just the graphof shifted units to the right.
VERTICAL AND HORIZONTAL SHIFTS Suppose . To obtain the graph of
Now let’s consider the stretching and reflecting transformations. If , then thegraph of is the graph of stretched by a factor of c in the vertical direction (because each y-coordinate is multiplied by the same number c). The graphof is the graph of reflected about the -axis because the point
is replaced by the point . The following chart also incorporates the resultsof other stretching, compressing, and reflecting transformations.
VERTICAL AND HORIZONTAL STRETCHING AND REFLECTINGSuppose . To obtain the graph of
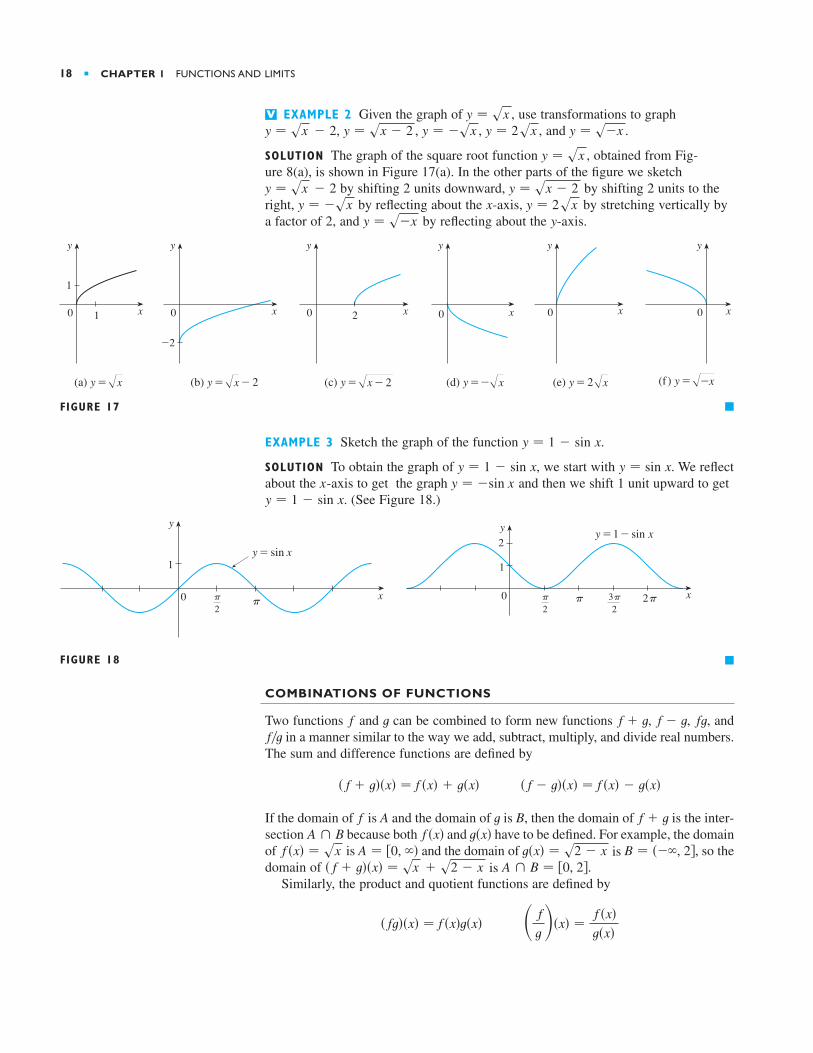
Figure 16 illustrates these stretching transformations when applied to the cosinefunction with . For instance, in order to get the graph of we multi-ply the y-coordinate of each point on the graph of by 2. This means that thegraph of gets stretched vertically by a factor of 2.
FIGURE 16
x
12
y
0
y=cos xy=cos 2x
y=cos x12
x
1
2
y
0
y=2 cos xy=cos x
y= cos x12
1
y ! cos xy ! cos x
y ! 2 cos xc ! 2
y ! f !"x", reflect the graph of y ! f !x" about the y-axis
y ! "f !x", reflect the graph of y ! f !x" about the x-axis
y ! f !x*c", stretch the graph of y ! f !x" horizontally by a factor of c
y ! f !cx", compress the graph of y ! f !x" horizontally by a factor of c
y ! !1*c" f !x", compress the graph of y ! f !x" vertically by a factor of c
y ! cf !x", stretch the graph of y ! f !x" vertically by a factor of c
c % 1
!x, "y"!x, y"xy ! f !x"y ! "f !x"
y ! f !x"y ! cf !x"c % 1
y ! f !x ( c", shift the graph of y ! f !x" a distance c units to the left
y ! f !x " c", shift the graph of y ! f !x" a distance c units to the right
y ! f !x" " c, shift the graph of y ! f !x" a distance c units downward
y ! f !x" ( c, shift the graph of y ! f !x" a distance c units upward
c % 0
cy ! f !x"y ! f !x " c"x " c
ftc % 0t!x" ! f !x " c"
y ! f !x"y ! f !x" ( c
SECTION 1.2 A CATALOG OF ESSENTIAL FUNCTIONS ■ 17
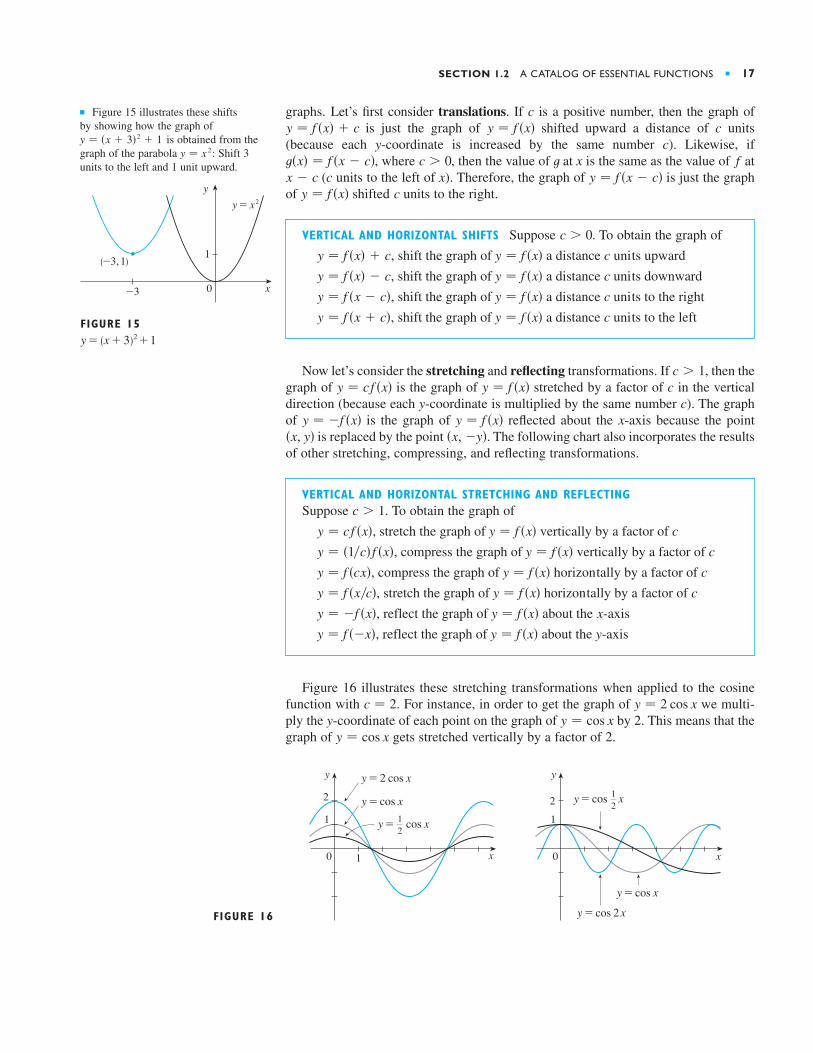
■ Figure 15 illustrates these shifts by showing how the graph of
is obtained from thegraph of the parabola : Shift 3units to the left and 1 unit upward.
y ! x 2y ! !x ( 3"2 ( 1
FIGURE 15y=(x+3)@+1
y
1
0_3
(_3, 1)
y=≈
x
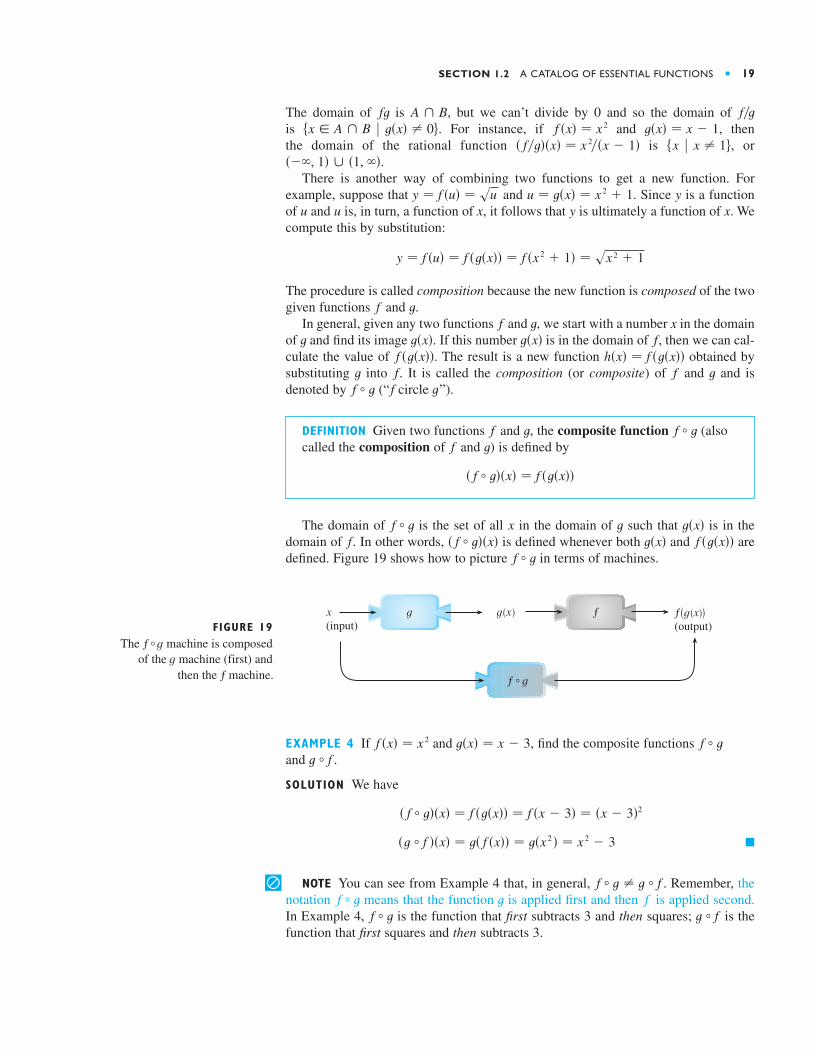
EXAMPLE 2 Given the graph of , use transformations to graph, , , , and .
SOLUTION The graph of the square root function , obtained from Fig-ure 8(a), is shown in Figure 17(a). In the other parts of the figure we sketch
by shifting 2 units downward, by shifting 2 units to theright, by reflecting about the -axis, by stretching vertically bya factor of 2, and by reflecting about the -axis.
■
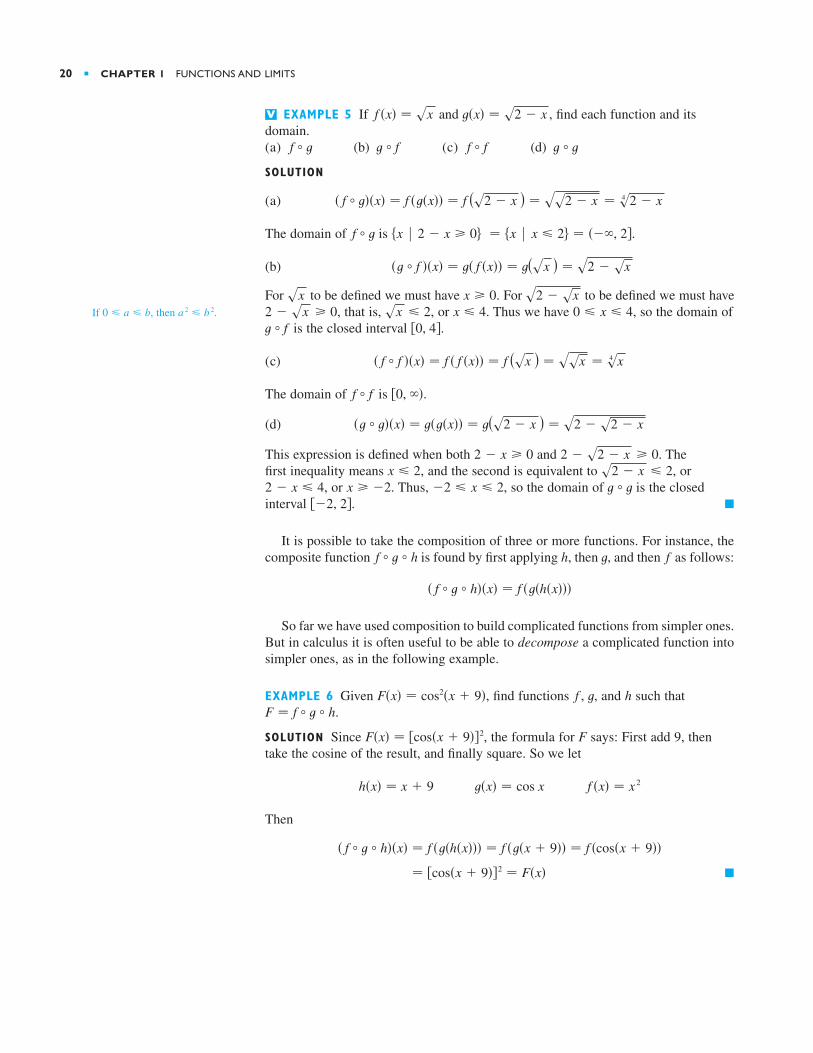
EXAMPLE 3 Sketch the graph of the function .
SOLUTION To obtain the graph of , we start with . We reflectabout the -axis to get the graph and then we shift 1 unit upward to get
(See Figure 18.)
■
COMBINATIONS OF FUNCTIONS
Two functions and can be combined to form new functions , , , andin a manner similar to the way we add, subtract, multiply, and divide real numbers.
The sum and difference functions are defined by
If the domain of is A and the domain of is B, then the domain of is the inter-section because both and have to be defined. For example, the domainof is and the domain of is , so thedomain of is .
Similarly, the product and quotient functions are defined by
+ ft,!x" !
f !x"t!x"
! ft"!x" ! f !x"t!x"
A $ B ! '0, 2(! f ( t"!x" ! sx ( s2 " xB ! !"$, 2(t!x" ! s2 " xA ! '0, $"f !x" ! sx
t!x"f !x"A $ Bf ( ttf
! f " t"!x" ! f !x" " t!x"! f ( t"!x" ! f !x" ( t!x"
f*tftf " tf ( ttf
FIGURE 18
x0
y
1
π2 π
y=sin x
x
1
2y
π0 2π
y=1-sin x
π2
3π2
y ! 1 " sin x.y ! "sin xx
y ! sin xy ! 1 " sin x
y ! 1 " sin x
FIGURE 17
(a) y=œ„x (b) y=œ„-2x (c) y=œ„„„„x-2 (d) y=_œ„x (e) y=2œ„x (f ) y=œ„„_x
0 x
y
0 x
y
0 x
y
20 x
y
_2
0 x
y
1
10 x
y
yy ! s"xy ! 2sxxy ! "sx
y ! sx " 2y ! sx " 2
y ! sx
y ! s"xy ! 2sxy ! "sxy ! sx " 2y ! sx " 2y ! sxV
18 ■ CHAPTER 1 FUNCTIONS AND LIMITS
The domain of is , but we can’t divide by 0 and so the domain of is . For instance, if and , then the domain of the rational function is , or
.There is another way of combining two functions to get a new function. For
example, suppose that and . Since y is a functionof u and u is, in turn, a function of x, it follows that is ultimately a function of x. Wecompute this by substitution:
The procedure is called composition because the new function is composed of the twogiven functions and .
In general, given any two functions and , we start with a number x in the domainof and find its image . If this number is in the domain of , then we can cal-culate the value of . The result is a new function obtained bysubstituting into . It is called the composition (or composite) of and and isdenoted by (“ f circle t”).
DEFINITION Given two functions and , the composite function (alsocalled the composition of and ) is defined by
The domain of is the set of all in the domain of such that is in thedomain of . In other words, is defined whenever both and aredefined. Figure 19 shows how to picture in terms of machines.
EXAMPLE 4 If and , find the composite functions and .
SOLUTION We have
■
| NOTE You can see from Example 4 that, in general, . Remember, thenotation means that the function is applied first and then is applied second.In Example 4, is the function that first subtracts 3 and then squares; is thefunction that first squares and then subtracts 3.
t " ff " tftf " t
f " t " t " f
!t " f "!x" ! t! f !x"" ! t!x 2 " ! x 2 " 3
! f " t"!x" ! f !t!x"" ! f !x " 3" ! !x " 3"2
t " ff " tt!x" ! x " 3f !x" ! x 2
f{©}(output)
x(input)
g g(x) fFIGURE 19
f • g
The f • g machine is composedof the g machine (first) and
then the f machine.
f " tf !t!x""t!x"! f " t"!x"ft!x"txf " t
! f " t"!x" ! f !t!x""
tff " ttf
f " ttfft
h!x" ! f !t!x""f !t!x""ft!x"t!x"t
tftf
y ! f !u" ! f !t!x"" ! f !x 2 ( 1" ! sx 2 ( 1
yu ! t!x" ! x 2 ( 1y ! f !u" ! su
!"$, 1" " !1, $"$x % x " 1&! f*t"!x" ! x 2*!x " 1"
t!x" ! x " 1f !x" ! x 2$x ! A $ B % t!x" " 0&f*tA $ Bft
SECTION 1.2 A CATALOG OF ESSENTIAL FUNCTIONS ■ 19
EXAMPLE 5 If and , find each function and itsdomain.(a) (b) (c) (d)
SOLUTION
(a)
The domain of is .
(b)
For to be defined we must have . For to be defined we must haveIf , then . , that is, , or . Thus we have , so the domain of
is the closed interval .
(c)
The domain of is .
(d)
This expression is defined when both and The first inequality means , and the second is equivalent to , or
, or . Thus, , so the domain of is the closedinterval . ■
It is possible to take the composition of three or more functions. For instance, thecomposite function is found by first applying , then , and then as follows:
So far we have used composition to build complicated functions from simpler ones.But in calculus it is often useful to be able to decompose a complicated function intosimpler ones, as in the following example.
EXAMPLE 6 Given , find functions , , and h such that.
SOLUTION Since , the formula for F says: First add 9, thentake the cosine of the result, and finally square. So we let
Then
■! 'cos!x ( 9"(2 ! F!x"
! f " t " h"!x" ! f !t!h!x""" ! f !t!x ( 9"" ! f !cos!x ( 9""
f !x" ! x 2t!x" ! cos xh!x" ! x ( 9
F!x" ! 'cos!x ( 9"(2
F ! f " t " htfF!x" ! cos2!x ( 9"
! f " t " h"!x" ! f !t!h!x"""
fthf " t " h
'"2, 2(t " t"2 & x & 2x ' "22 " x & 4s2 " x & 2x & 2
2 " s2 " x ' 0.2 " x ' 0
!t " t"!x" ! t!t!x"" ! t(s2 " x ) ! s2 " s2 " x
'0, $"f " f
! f " f "!x" ! f ! f !x"" ! f (sx ) ! ssx ! s4 x
'0, 4(t " f0 & x & 4x & 4sx & 22 " sx ' 0a 2 & b 20 & a & b
s2 " sxx ' 0sx
!t " f "!x" ! t! f !x"" ! t(sx ) ! s2 " sx
! $x % x & 2& ! !"$, 2($x % 2 " x ' 0&f " t
! f " t"!x" ! f !t!x"" ! f (s2 " x ) ! ss2 " x ! s4 2 " x
t " tf " ft " ff " t
t!x" ! s2 " xf !x" ! sxV
20 ■ CHAPTER 1 FUNCTIONS AND LIMITS
(b) What is the slope of the graph and what does it rep-resent? What is the F-intercept and what does it represent?
10. Jason leaves Detroit at 2:00 PM and drives at a constantspeed west along I-96. He passes Ann Arbor, 40 mi fromDetroit, at 2:50 PM.(a) Express the distance traveled in terms of the time
elapsed.(b) Draw the graph of the equation in part (a).(c) What is the slope of this line? What does it represent?
Biologists have noticed that the chirping rate of crickets of a certain species is related to temperature, and the relation-ship appears to be very nearly linear. A cricket produces113 chirps per minute at and 173 chirps per minute at .(a) Find a linear equation that models the temperature T as
a function of the number of chirps per minute N.(b) What is the slope of the graph? What does it represent?(c) If the crickets are chirping at 150 chirps per minute,
estimate the temperature.
12. The manager of a furniture factory finds that it costs $2200to manufacture 100 chairs in one day and $4800 to produce300 chairs in one day.(a) Express the cost as a function of the number of chairs
produced, assuming that it is linear. Then sketch thegraph.
(b) What is the slope of the graph and what does itrepresent?
(c) What is the y-intercept of the graph and what does it represent?
At the surface of the ocean, the water pressure is the sameas the air pressure above the water, . Below the sur-face, the water pressure increases by for every10 ft of descent.(a) Express the water pressure as a function of the depth
below the ocean surface.(b) At what depth is the pressure ?
14. The monthly cost of driving a car depends on the number ofmiles driven. Lynn found that in May it cost her $380 todrive 480 mi and in June it cost her $460 to drive 800 mi.(a) Express the monthly cost as a function of the distance
driven assuming that a linear relationship gives a suit-able model.
(b) Use part (a) to predict the cost of driving 1500 miles permonth.
(c) Draw the graph of the linear function. What does theslope represent?
(d) What does the y-intercept represent?(e) Why does a linear function give a suitable model in this
situation?
d,C
100 lb*in2
4.34 lb*in215 lb*in2
13.
80*F70*F
11.
(a) Find an equation for the family of linear functions withslope 2 and sketch several members of the family.
(b) Find an equation for the family of linear functions suchthat and sketch several members of the family.
(c) Which function belongs to both families?
2. What do all members of the family of linear functionshave in common? Sketch several
members of the family.
3. What do all members of the family of linear functionshave in common? Sketch several members of
the family.
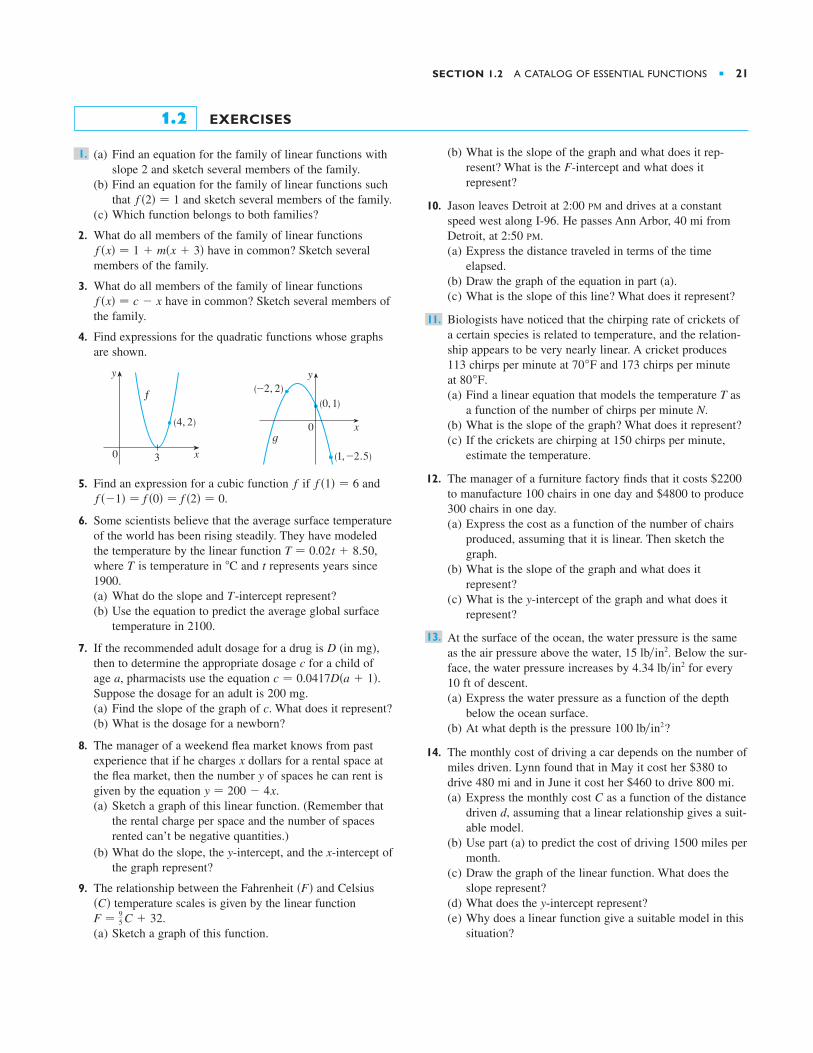
4. Find expressions for the quadratic functions whose graphsare shown.
5. Find an expression for a cubic function if and.
6. Some scientists believe that the average surface temperatureof the world has been rising steadily. They have modeledthe temperature by the linear function ,where is temperature in and represents years since1900.(a) What do the slope and -intercept represent?(b) Use the equation to predict the average global surface
temperature in 2100.
7. If the recommended adult dosage for a drug is (in mg),then to determine the appropriate dosage for a child of age , pharmacists use the equation .Suppose the dosage for an adult is 200 mg.(a) Find the slope of the graph of . What does it represent?(b) What is the dosage for a newborn?
8. The manager of a weekend flea market knows from pastexperience that if he charges dollars for a rental space atthe flea market, then the number of spaces he can rent isgiven by the equation .(a) Sketch a graph of this linear function. (Remember that
the rental charge per space and the number of spacesrented can’t be negative quantities.)
(b) What do the slope, the y-intercept, and the x-intercept ofthe graph represent?
9. The relationship between the Fahrenheit and Celsiustemperature scales is given by the linear function
.(a) Sketch a graph of this function.F ! 9
5 C ( 32!C"
!F"
y ! 200 " 4xy
x
c
c ! 0.0417D!a ( 1"ac
D
T
t*CTT ! 0.02t ( 8.50
f !"1" ! f !0" ! f !2" ! 0f !1" ! 6f
y
(0, 1)
(1, _2.5)
(_2, 2)y
x0
(4, 2)
f
gx0
3
f !x" ! c " x
f !x" ! 1 ( m!x ( 3"
f !2" ! 1
1.
SECTION 1.2 A CATALOG OF ESSENTIAL FUNCTIONS ■ 21
EXERCISES1.2
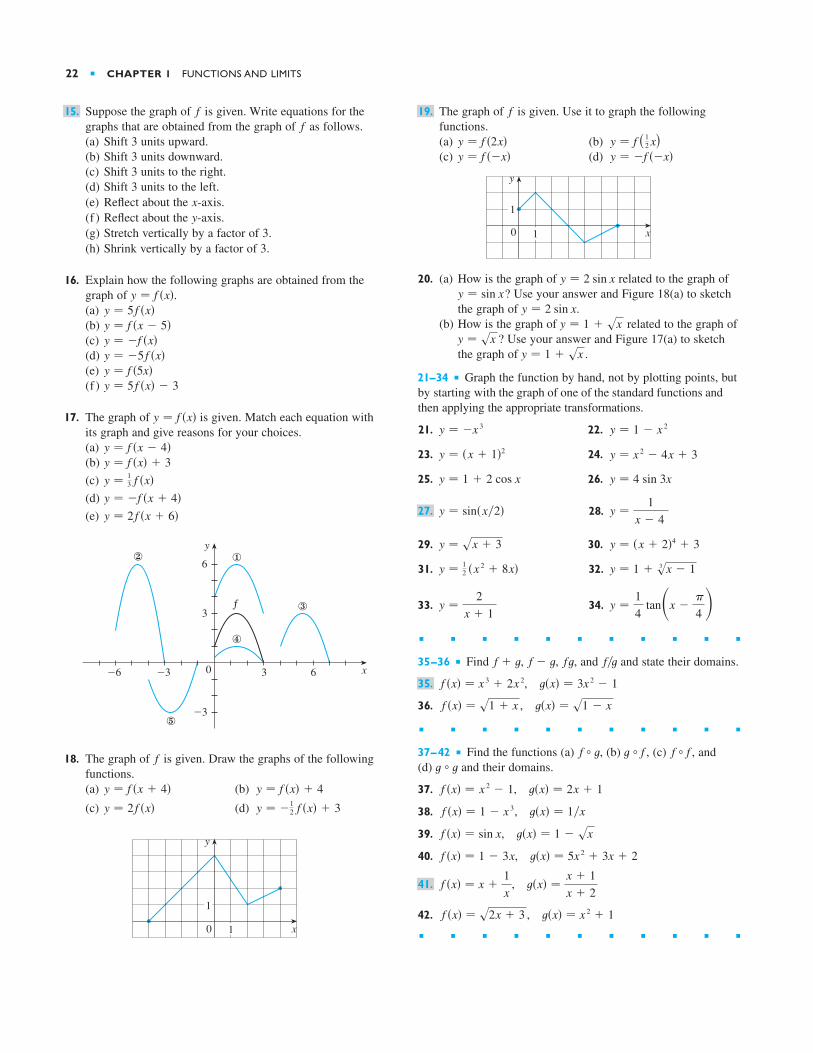
The graph of is given. Use it to graph the following functions.(a) (b)(c) (d)
20. (a) How is the graph of related to the graph of? Use your answer and Figure 18(a) to sketch
the graph of .(b) How is the graph of related to the graph of
? Use your answer and Figure 17(a) to sketchthe graph of .
21–34 ■ Graph the function by hand, not by plotting points, butby starting with the graph of one of the standard functions andthen applying the appropriate transformations.
21. 22.
23. 24.
25. 26.
28.
29. 30.
31. 32.
33. 34.
■ ■ ■ ■ ■ ■ ■ ■ ■ ■ ■
35–36 ■ Find , , , and and state their domains.
,
36. ,
■ ■ ■ ■ ■ ■ ■ ■ ■ ■ ■
37–42 ■ Find the functions (a) , (b) , (c) , and (d) and their domains.
37. ,
38. ,
39. ,
40. ,
,
42. ,
■ ■ ■ ■ ■ ■ ■ ■ ■ ■ ■
t!x" ! x 2 ( 1f !x" ! s2x ( 3
t!x" !x ( 1x ( 2
f !x" ! x (1x
41.
t!x" ! 5x 2 ( 3x ( 2f !x" ! 1 " 3x
t!x" ! 1 " sxf !x" ! sin x
t!x" ! 1*xf !x" ! 1 " x 3
t!x" ! 2x ( 1f !x" ! x 2 " 1
t " tf " ft " ff " t
t!x" ! s1 " xf !x" ! s1 ( x
t!x" ! 3x 2 " 1f !x" ! x 3 ( 2x 235.
f*tftf " tf ( t
y !14
tan+x "!
4 ,y !2
x ( 1
y ! 1 ( s3 x " 1y ! 12 !x 2 ( 8x"
y ! !x ( 2"4 ( 3y ! sx ( 3
y !1
x " 4y ! sin!x*2"27.
y ! 4 sin 3xy ! 1 ( 2 cos x
y ! x 2 " 4x ( 3y ! !x ( 1"2
y ! 1 " x 2y ! "x 3
y ! 1 ( sxy ! sx
y ! 1 ( sxy ! 2 sin x
y ! sin xy ! 2 sin x
x
y
0 1
1
y ! "f !"x"y ! f !"x"y ! f ( 1
2 x)y ! f !2x"
f19.Suppose the graph of is given. Write equations for thegraphs that are obtained from the graph of as follows.(a) Shift 3 units upward.(b) Shift 3 units downward.(c) Shift 3 units to the right.(d) Shift 3 units to the left.(e) Reflect about the -axis.(f ) Reflect about the -axis.(g) Stretch vertically by a factor of 3.(h) Shrink vertically by a factor of 3.
16. Explain how the following graphs are obtained from thegraph of .(a)(b)(c)(d)(e)(f )
17. The graph of is given. Match each equation withits graph and give reasons for your choices.(a)(b)(c)(d)(e)
18. The graph of is given. Draw the graphs of the followingfunctions.(a) (b)
(c) (d)
x
y
0 1
1
y ! "12 f !x" ( 3y ! 2 f !x"
y ! f !x" ( 4y ! f !x ( 4"
f
!@
$
%
#f
y
3
_3
6
0 x3_3_6 6
y ! 2 f !x ( 6"y ! "f !x ( 4"y ! 1
3 f !x"y ! f !x" ( 3y ! f !x " 4"
y ! f !x"
y ! 5 f !x" " 3y ! f !5x"y ! "5 f !x"y ! "f !x"y ! f !x " 5"y ! 5 f !x"
y ! f !x"
yx
ff15.
22 ■ CHAPTER 1 FUNCTIONS AND LIMITS
A stone is dropped into a lake, creating a circular ripple thattravels outward at a speed of .(a) Express the radius of this circle as a function of the
time (in seconds).(b) If is the area of this circle as a function of the radius,
find and interpret it.
56. An airplane is flying at a speed of at an altitude of one mile and passes directly over a radar station at time .(a) Express the horizontal distance (in miles) that the
plane has flown as a function of .(b) Express the distance between the plane and the radar
station as a function of .(c) Use composition to express as a function of .
57. The Heaviside function H is defined by
It is used in the study of electric circuits to represent thesudden surge of electric current, or voltage, when a switchis instantaneously turned on.(a) Sketch the graph of the Heaviside function.(b) Sketch the graph of the voltage in a circuit if the
switch is turned on at time and 120 volts areapplied instantaneously to the circuit. Write a formulafor in terms of .
(c) Sketch the graph of the voltage in a circuit if theswitch is turned on at time seconds and 240 voltsare applied instantaneously to the circuit. Write a for-mula for in terms of . (Note that starting at
corresponds to a translation.)
58. The Heaviside function defined in Exercise 57 can also beused to define the ramp function , which repre-sents a gradual increase in voltage or current in a circuit.(a) Sketch the graph of the ramp function .(b) Sketch the graph of the voltage in a circuit if the
switch is turned on at time and the voltage isgradually increased to 120 volts over a 60-second time interval. Write a formula for in terms of for .
(c) Sketch the graph of the voltage in a circuit if theswitch is turned on at time seconds and the volt-age is gradually increased to 100 volts over a period of 25 seconds. Write a formula for in terms of for .
59. Let and be linear functions with equationsand . Is also a lin-
ear function? If so, what is the slope of its graph?
60. If you invest dollars at 4% interest compounded annually,then the amount of the investment after one year is
. Find , , and .What do these compositions represent? Find a formula forthe composition of copies of .An
A " A " A " AA " A " AA " AA!x" ! 1.04xA!x"
x
f " tt!x" ! m2 x ( b2f !x" ! m1x ( b1
tf
t & 32H!t"V!t"
t ! 7V!t"
t & 60H!t"V!t"
t ! 0V!t"
y ! tH!t"
y ! ctH!t"
t ! 5H!t"V!t"
t ! 5V!t"
H!t"V!t"
t ! 0V!t"
H!t" ! )01
if t ) 0if t ' 0
tsd
st
dt ! 0
350 mi*h
A " rA
tr
60 cm*s55.43–44 ■ Find
43. , ,
44. , ,
■ ■ ■ ■ ■ ■ ■ ■ ■ ■ ■
45–48 ■ Express the function in the form
45. 46.
47.
■ ■ ■ ■ ■ ■ ■ ■ ■ ■ ■
49–51 ■ Express the function in the form
49. 50.
51.
■ ■ ■ ■ ■ ■ ■ ■ ■ ■ ■
52. Use the table to evaluate each expression.(a) (b) (c)(d) (e) (f )
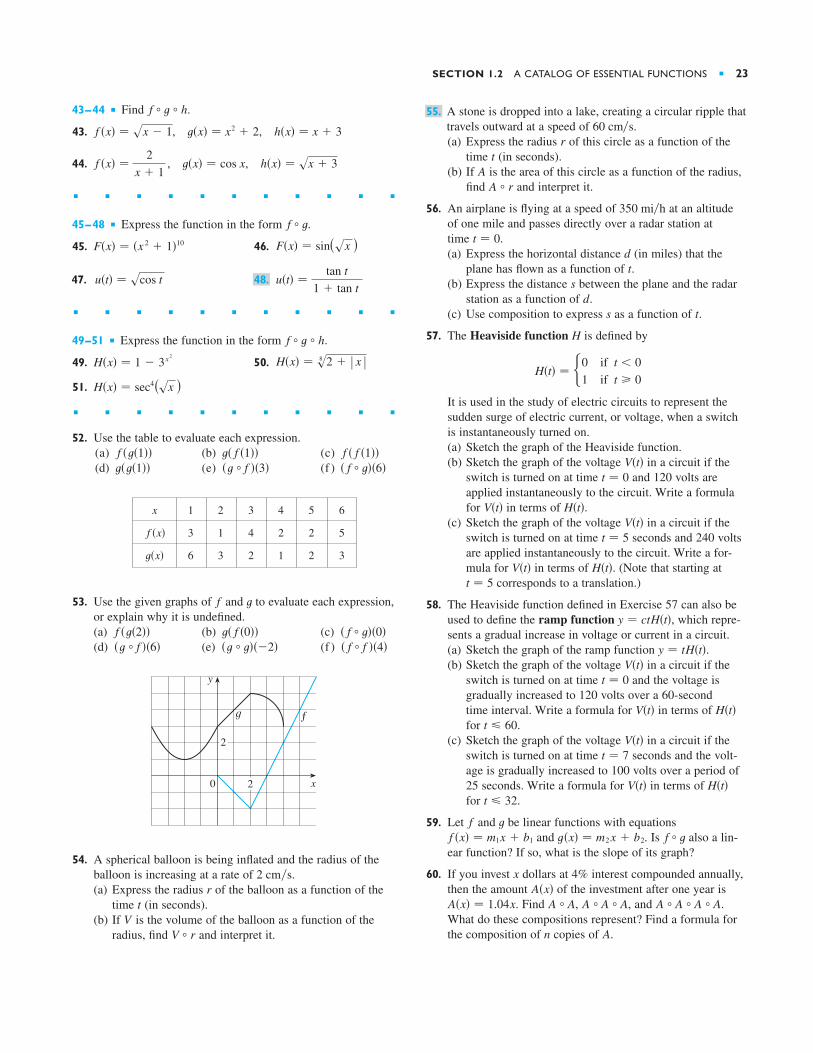
53. Use the given graphs of and to evaluate each expression, or explain why it is undefined.(a) (b) (c)(d) (e) (f )
54. A spherical balloon is being inflated and the radius of theballoon is increasing at a rate of .(a) Express the radius of the balloon as a function of the
time (in seconds).(b) If is the volume of the balloon as a function of the
radius, find and interpret it.V " rV
tr
2 cm*s
x
y
0
fg
2
2
! f " f "!4"!t " t"!"2"!t " f "!6"! f " t"!0"t! f !0""f !t!2""
tf
! f " t"!6"!t " f "!3"t!t!1""f ! f !1""t! f !1""f !t!1""
H!x" ! sec4(sx )H!x" ! s8 2 ( % x %H!x" ! 1 " 3x2
f " t " h.
u!t" !tan t
1 ( tan t48.u!t" ! scos t
F!x" ! sin(sx )F!x" ! !x 2 ( 1"10
f " t.
h!x" ! sx ( 3t!x" ! cos xf !x" !2
x ( 1
h!x" ! x ( 3t!x" ! x2 ( 2f !x" ! sx " 1
f " t " h.
SECTION 1.2 A CATALOG OF ESSENTIAL FUNCTIONS ■ 23
x 1 2 3 4 5 6
3 1 4 2 2 5
6 3 2 1 2 3t!x"
f !x"
61. (a) If and , find afunction such that . (Think about what opera-tions you would have to perform on the formula for toend up with the formula for .)
(b) If and , find afunction such that .
62. If and , find a function suchthat .t " f ! h
th!x" ! 4x " 1f !x" ! x ( 4
f " t ! hth!x" ! 3x 2 ( 3x ( 2f !x" ! 3x ( 5
ht
f " t ! hfh!x" ! 4x 2 ( 4x ( 7t!x" ! 2x ( 1 63. (a) Suppose and are even functions. What can you say
about and ?(b) What if and are both odd?
64. Suppose is even and is odd. What can you say about ?
Suppose t is an even function and let . Is h alwaysan even function?
66. Suppose t is an odd function and let . Is h alwaysan odd function? What if is odd? What if is even?ff
h ! f " t
h ! f " t65.
fttf
tfftf ( ttf
24 ■ CHAPTER 1 FUNCTIONS AND LIMITS
THE LIMIT OF A FUNCTION
Our aim in this section is to explore the meaning of the limit of a function. We beginby showing how the idea of a limit arises when we try to find the velocity of a fallingball.
EXAMPLE 1 Suppose that a ball is dropped from the upper observation deck ofthe CN Tower in Toronto, 450 m above the ground. Find the velocity of the ballafter 5 seconds.
SOLUTION Through experiments carried out four centuries ago, Galileo discoveredthat the distance fallen by any freely falling body is proportional to the square of thetime it has been falling. (This model for free fall neglects air resistance.) If the dis-tance fallen after seconds is denoted by and measured in meters, then Galileo’slaw is expressed by the equation
The difficulty in finding the velocity after 5 s is that we are dealing with a singleinstant of time , so no time interval is involved. However, we can approxi-mate the desired quantity by computing the average velocity over the brief timeinterval of a tenth of a second from to :
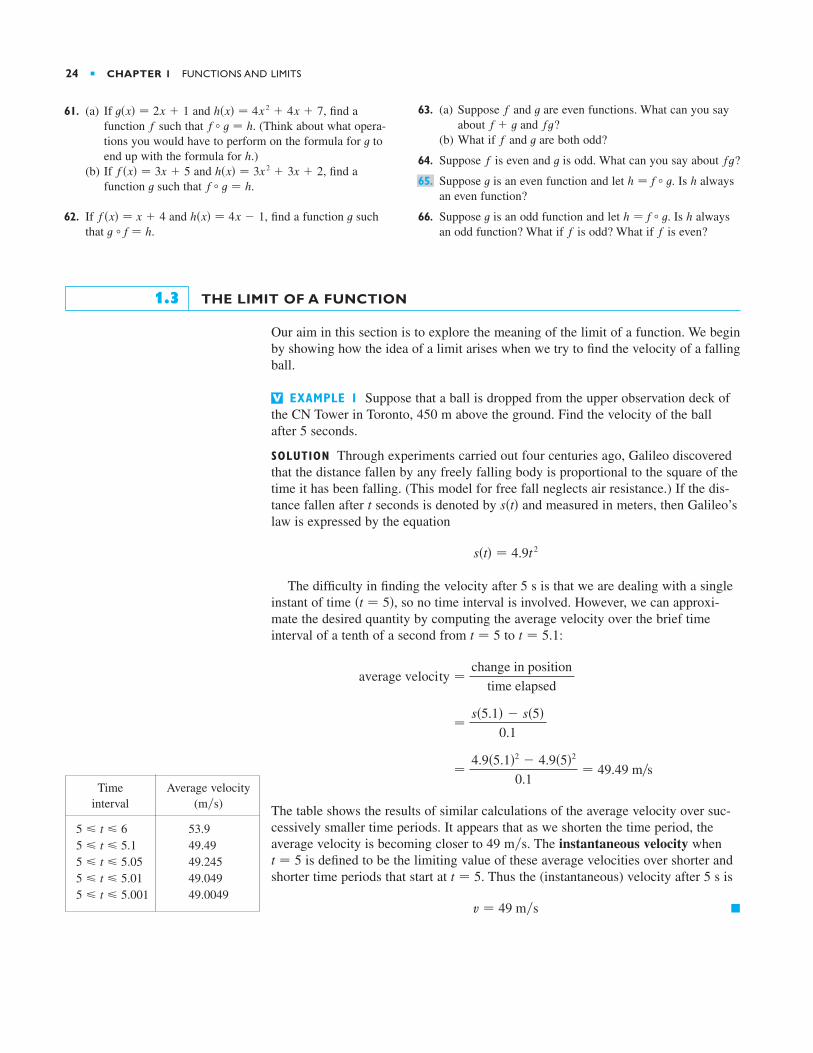
The table shows the results of similar calculations of the average velocity over suc-cessively smaller time periods. It appears that as we shorten the time period, theaverage velocity is becoming closer to 49 m*s. The instantaneous velocity when
is defined to be the limiting value of these average velocities over shorter andshorter time periods that start at . Thus the (instantaneous) velocity after 5 s is
■v ! 49 m*s
t ! 5t ! 5
!4.9!5.1"2 " 4.9!5"2
0.1! 49.49 m*s
!s!5.1" " s!5"
0.1
average velocity !change in position
time elapsed
t ! 5.1t ! 5
!t ! 5"
s!t" ! 4.9t 2
s!t"t
V
1.3
Time Average velocityinterval (m*s)
53.949.4949.24549.04949.00495 & t & 5.001
5 & t & 5.015 & t & 5.055 & t & 5.15 & t & 6


