Embed Size (px)
Citation preview

Future visioning of local climate change: A framework for communityengagement and planning with scenarios and visualisation
Stephen R.J. Sheppard a,*, Alison Shaw a,1, David Flanders a,1, Sarah Burch a,1, Arnim Wiek b,2,Jeff Carmichael c, John Robinson d,3, Stewart Cohen e,4
a CALP, Dept. of Forest Resources Management/Landscape Architecture Program, Forest Sciences Centre, 2045–2424 Main Mall, UBC, Vancouver, BC, V6T 1Z4 Canadab School of Sustainability, Arizona State University, PO Box 875502, Tempe, AZ 85287-5502, USAc Metro Vancouver, 4330 Kingsway, Burnaby, BC, V5H 4G8 Canadad Institute for Resources, Environment and Sustainability, UBC, Aquatic Ecosystem Research Laboratory, 447–2202 Main Mall, Vancouver, BC, V6T 1Z4, Canadae AIRD, Environment Canada, Dept. of Forest Resources Management, Forest Sciences Centre, UBC, 2424 Main Mall, UBC, Vancouver, BC, V6T 1Z4, Canada
1. Introduction
It is now widely recognized that the urgency and depth of the climate change crisis as described by the IntergovernmentalPanel on Climate Change (IPCC) and others (e.g. [1–3]) is still not being reflected in commensurate action to reducegreenhouse gas emissions (GHGs). Neither policy nor behaviour has shifted far enough to move the world on to paths leadingto climate stabilisation. In developing conceptual governance approaches to global stewardship that would address suchmassive problems, Biermann [4] has stressed the need for participatory governance, which is legitimate, effective, and fair.
Futures 43 (2011) 400–412
A R T I C L E I N F O
Article history:
Available online 28 January 2011
A B S T R A C T
There is an urgent need for meaningful information and effective public processes at the
local level to build awareness, capacity, and agency on climate change, and support
planning and decision-making. This paper describes a conceptual framework to meet
these requirements by generating alternative, coherent, holistic climate change scenarios
and visualizations at the local scale, in collaboration with local stakeholders and scientists.
The framework provides a template for a process to integrate emission scenarios with both
mitigation and adaptation strategies, and to link local manifestations of impacts and
responses with global climate change scenarios. The article outlines the empirical
application of this framework in the Local Climate Change Visioning Project in British
Columbia, Canada. The project collaboratively localized, spatialized, and visualized
possible climate change effects and community responses in the community’s ‘backyards’.
The article concludes with lessons learned and suggested principles for future visioning
efforts to engage communities in possible policy and behavioural choices.
� 2011 Elsevier Ltd. All rights reserved.
* Corresponding author. Tel.: +1 604 822 6582; fax: +1 604 822 9106.
E-mail addresses: [email protected] (Stephen R.J. Sheppard), [email protected] (A. Shaw), [email protected] (D. Flanders),
[email protected] (S. Burch), [email protected] (A. Wiek), [email protected] (J. Carmichael), [email protected] (J. Robinson),
[email protected] (S. Cohen).1 Tel.: +1 604 822 6582; fax: +1 604 822 9106.2 Tel.: +1 480 965 2387.3 Tel.: +1 604 822 9188; fax: +1 602 822 9250.4 Tel.: +1 604 822 1635; fax: +1 604 822 9106.
Contents lists available at ScienceDirect
Futures
journa l homepage: www.e lsev ier .com/ locate / fu tures
0016-3287/$ – see front matter � 2011 Elsevier Ltd. All rights reserved.
doi:10.1016/j.futures.2011.01.009

However, the majority of climate change studies have addressed global and national levels, with limited potential for publicinvolvement at the community level. In any city or town, effective solutions will require the combined efforts of all levels ofgovernment, business sectors, individuals, and the collective citizenry acting together. This calls for credible information andpublic processes at the local level to build awareness, capacity, and agency in all sectors of the community, tied to citizenengagement in planning and decision-making on climate change.
Such participatory processes are needed to address a number of barriers (Burch [5]) which contribute to the lack ofeffective action on climate change at the community level. Any process for building awareness of climate change and localcapacity to respond faces challenges stemming from the overwhelming scale of the problem, massive uncertainty, scientificabstraction, and the predominantly global nature of the available modelling and scenarios (Moser and Dilling [6]; Nicholson-Cole [7]). Specific concerns arise because:
� The available scientific data is often too complex to be understandable.� Most of the available information is of a biophysical nature, with few specifics on socio-economic scenarios.� The information is not salient to local users or communities.� There appear to be few effective, structured processes for community outreach linked to planning on climate change yet in
place (Sheppard [8]).
Review of literature and precedents in three relevant fields (integrated assessment of climate change, conventional urbanplanning, and applications of visual media) suggests, in particular, that there are few if any approaches or frameworks for‘‘connecting the dots’’ between global climate science and information on the one hand, and the range of local communityactivities and options on the other. There are few integrated assessment methodologies addressing climate change that bothcross scales from the global to the local and incorporate local level tools such as modelling or visualisation to make theinformation tangible to local users (Holman et al. [9]). Conventional local planning processes as yet seldom incorporateclimate change scenarios systematically or quantitatively (Sheppard [8]), often failing to address the range of responseoptions comprehensively due to ‘silo-thinking’ (Busby [10]). There have been many experiments in applying visual media toplanning processes and some applications have begin to appear in professional practice (Kwartler and Longo [11]), but againthese seldom address integrated aspects of climate change, and where visualisations of climate change have been used[12,13], the links to a participatory planning process and/or the scope has generally been limited.
There is therefore an urgent need for better frameworks, tools and processes to help communities and local agenciesmake sense of and organize emerging information on climate change, to become more informed on local impacts and policychoices related to climate change, and to feed into planning processes. We need a new type of capacity-building process anddecision support tools on climate change.
This paper explores one potential way to meet these needs at the urban or community level, through improved two-waycommunication and information transfer, using a structured future visioning process (Sheppard [8,14]). While visualisationtools are starting to be used more commonly at global and national levels (Dow and Downing [15]; Cook-Anderson [16]),they also offer new and compelling ways to make climate change explicit to local communities, to envisage possiblesolutions, and perhaps to accelerate local capacity-building and policy implementation on climate change. Such methodsmay address in particular two challenges described by Biermann [4]:
� Bridging the gap between formalized analytical models and fuzzy social realities, by making the formal and scientific moresalient to affected stakeholders, and helping to ‘harden up’ the experts’ understanding of community perceptions andattitudes; and� Helping to re-couple the costs of mitigation born by the current generation with the benefits of avoided harm accruing to
future generations, by offering glimpses of possible future scenarios in the community, using visual media which can makethe future seem more ‘real’.
This article first sets out requirements for a new climate change capacity-building process and for innovative decisionsupport tools on climate change using local future scenarios. It then describes a conceptual framework to meetthese requirements, as developed in the Local Climate Change Visioning Project, and applied to a participatory process in casestudies in British Columbia. The conceptual framework was devised as a means for generating alternative climate changescenarios and visualizations at the local scale, in collaboration with local stakeholders and scientists. Details about theempirical applications have been described elsewhere (Shaw et al. [17]; Sheppard et al. [18]). Initial results of these applicationsare summarized, and the article concludes with lessons learned and suggested principles for future visioning efforts.
2. Requirements for effective local engagement, planning, and decision-making on climate change
What are the requirements for an improved process for building both awareness and capacity for developing climatechange solutions at the community level, which fosters action through the urban planning system? A set of general criteriahas been distilled from review of seminal literature on the subject (Moser and Dilling [6]; McKenzie Mohr and Smith [19];Nicholson-Cole [7]; Sterman and Sweeney [20]; Stern [21]; Slovic et al. [22]; Kollmuss and Agyeman [23]; Beierle andCayford [24]). These criteria include generating:
S.R.J. Sheppard et al. / Futures 43 (2011) 400–412 401

� an engaging, accessible process;� understandable information;� salient information for local stakeholders and decision-makers (i.e. linked to things that people can identify with and
which they care about);� appropriate affective responses that are personally relevant and motivating;� salient information for local public and decision-makers (i.e. linked to things that people can identify with and which they
care about).
While the urgency of the problem needs to be conveyed, caution must also be used not to overwhelm the lay-person(Moser and Dilling [6]; Sterman and Sweeney [20]). In order to bolster a sense of agency with climate change in particular, itcan be important both to provide the negative stimulus of impending risks and the positive stimulus of things people can doto adapt to the changing conditions and to reduce the threat through collective mitigation measures.
In the context of community climate change capacity building and planning, these criteria can be integrated andtranslated into three specific requirements, discussed below.
First requirement: Bring the climate change information down to the local level and engage local stakeholders in the process.The local level is critical in many respects: more than 75% of the worldwide carbon emissions can be attributed to cities
and urban areas (Grimm et al. [25]); the community or neighbourhood level is the scale that matters most to decision-makers and the community (Moser and Dilling [6]); and the local community is where ‘the rubber meets the road’ inimplementing GHG emission reductions or adaptation measures through policies and projects.
Over the last few years, research groups have developed approaches for improving the translation and communication ofscientific understanding of global climate change processes, impacts and responses down to the local level (Kok et al. [26];Robinson [27]; Shaw et al. [17]; Sheppard [14]; Tribbia and Moser [28]; van de Kerkhof et al. [29]; White et al. [30]). Variouscitizen-led movements have arisen that are pushing for local action on climate change and related moves towardssustainability and resilience (e.g. Hopkins [31]). Together, these factors represent a massive demand and opportunity forengagement in raising awareness of climate change, building capacity for developing response strategies, and taking actions.
Second requirement: Use holistic scenarios which combine multiple aspects of climate change, for instance: a broad range of
scenario drivers; impacts and responses; and both adaptation and mitigation strategies.Holistic scenarios, as opposed to sectoral or partial scenarios, allow for comprehensively understanding, exploring, and
addressing the complexity of climate change (cf. Wiek and Walter [32]). In particular, the integration of impacts andresponses (interventions) seems to be an important step forward to make climate change scenarios more relevant forplanning and decision-making (Girod et al. [33]; Munasinghe and Swart [34]; Pielke et al. [35]; Raskin [36]).
There are a number of conceptual requirements when designing a scenario-based process for informing and motivatinglay-people, planners, and policy-makers about climate change at the local level. These include:
� Considering a range of distinctly different future scenarios/conditions that provide choices for action with definableconsequences (Sheppard [14]; Nicholson-Cole [7]; Tress and Tress [37]), including low-to high-carbon scenarios.� Integrating various combinations of adaptation and mitigation response options, and not just different levels of climate
change impacts (Munasinghe and Swart [34]).� Projecting an adequate distance into the future (e.g. 2100) to represent the considerable time lags and escalating impacts of
climate change and to reveal costs and/or benefits of adaptation and mitigation efforts over time (Sheppard [14]).� Ensuring that choices comprising each future scenario are simple to understand and few in number, to avoid
unmanageable complexity (Girod et al. [33]; Sheppard [38]).� Representing recognizable or typical local conditions that are meaningful to community members. Incorporating spatial
data that begin to make things ‘concrete’ for participants, can be linked to planning processes, and provide a basis for visualrepresentation.� Making use of best available existing datasets and models that are already in place and/or familiar to stakeholders in the
area.
Third Requirement: Use visual tools to maximize interest and engagement, achieve rapid learning, and foster public interaction
with the emerging action plans and solutions.The form and framing of information can significantly affect awareness levels and even attitudes and emotions
(Nicholson-Cole [7]). Visual communication media in general, and scientific visualisation in particular, have been shown toincrease engagement, enhance learning, and strengthen conceptualization of even complex environmental issues (e.g. Winn[39]; Sheppard and Meitner [40]; Salter [41]).
Sheppard [14] and Nicholson-Cole [7] have argued that landscape visualisation of recognizable places is one medium thatmay have special advantages in getting across useful information and engaging emotions that may be necessary to motivateaction. Using realistic 3D landscape visualisations (pictures of local places under alternative future conditions) can providegreatly increased local salience, linking to people’s attachment to place, perceived quality of life, community identity, andother cherished values (e.g. Lewis and Sheppard [42]). In theory, realistic landscape visualisations applied to climate changeimpacts and responses could meet many or all of the requirements laid out above, and yield several benefits. These include:
S.R.J. Sheppard et al. / Futures 43 (2011) 400–412402

(1) facilitating pragmatic new processes to integrate impacts, adaptation, and mitigation in plausible holistic scenarios thatcan be visualized as alternative community climate futures for local government and stakeholders; (2) testing the socialimpacts of (and barriers to) alternative mitigation and adaptation policies on climate change (e.g. opposition to windfarms orparticular adaptation strategies).
3. Local Climate Change Future Visioning framework
The Local Climate Change Visioning Project (LCCVP) conducted in British Columbia has developed a framework andprototype process that addresses the multiple challenges of localizing climate change scenarios, in the context of communitycapacity building, planning, and decision-making. It attempts to integrate the best available science at global, regional, andlocal scales, local GIS mapping, and stakeholder knowledge to visualize potential climate change impacts in a clear andcompelling way, and to present possible policy and behavioural choices for communities.
This framework appears to be unique in combining all three requirements (described above) for improved publicengagement and community-level decision-making on climate change. Participatory scenario-building with multiplestakeholders and systematic use of science-based 2D and 3D visualisation of climate change impacts and responses at thelocal level are not standard practice in planning or integrated assessment processes known to the authors. Linking globalclimate/socioeconomic scenarios to semi-quantitative regional and local scenarios, and linking these local scenarios to 3Dvisualisations depicting conditions over time is particularly novel. Unlike other hybrid modelling systems which attempt tocross scales and employ participatory integrated assessment (e.g. the Regional Impact Simulator (Holman et al. [9]), thisframework also explicitly integrates both local mitigation and local adaptation, and extends beyond the conventional IPCC(SRES) global scenarios, as explained below.
The aim of this project was two-fold. First, the goal has been to develop a coherent framework and prototype process tolocalize, spatialize, and visualize climate change effects and policy responses at a neighbourhood or community level, i.e. inthe community’s ‘backyards’, looking out as far as 2100. The second related goal has been to test how this framework for avisioning process can be used to develop a holistic and plausible set of alternative futures, in order to build awareness andcapacity within the community by making explicit links between local action and global change. In this way the projectaimed to address the gaps and barriers in applying the concept ‘‘Think globally, act locally’’. It had a pragmatic focus, for use inpractice by local communities and in evaluative research. The project was unusual in quantitatively evaluating outcomes forparticipants in terms of engagement and learning achieved, attitudes affected, and changes in motivation, the first time suchknowledge has been forthcoming with a system like this.
We focus here on the framework, i.e. the substantive choices and processes involved in the research design andengagement efforts. The empirical application to communities in British Columbia has been described elsewhere (Shaw et al.[17]; Sheppard et al. [18]). The next sections describe the two major components of the framework: a scenario ‘‘cube’’ used tostructure and anchor plausible scenarios; and a new type of participatory visioning process which integrates 2D, 3D, and 4Dvisualisation tools to represent those scenarios to the local community. Early results of these applications are thensummarized.
3.1. The scenario cube
The first component of the Local Climate Change Future Visioning framework is a three-dimensional scenario cube(Fig. 1). The cube integrates a spectrum of four distinct emission, impacts, response scenarios or tiers, over a spectrum ofthree distinct time periods, across a spectrum of distinct landscape types or case study communities (in this project twocase-study communities were engaged).
In order to make explicit the links between human choices (i.e. responses to climate change) and key consequences ofthose choices over time, the most important framing dimension (the y-axis in Fig. 1) distinguishes a spectrum of distinctscenarios that demonstrate the effects of different levels of response options (or lack thereof), contributing to greater orlesser anthropogenic GHG emissions and thus climate change impacts. In simple terms, the higher tiers or scenarios on thecube represent more proactive or intensive response levels, particularly in terms of emission reduction. The range ofindicators used to describe these scenarios, in terms of both drivers and outcomes, reflect indicators used in the literatureand for which information is available at global and other scales. They also needed to be comprehensive enough to supportholistic visualizations of local future conditions in the landscape, and be meaningful to local stakeholders. The x-axis used inthe LCCVP is the same as for the IPCC Assessments (2020, 2050, and 2100), covering a span of 3–5 human generations. The z-axis represents possible case studies or localities addressing particular climate change themes. In the LCCVP, two casestudies were developed: the municipalities of Delta and North Vancouver (Metro Vancouver) were chosen for their range oflocal landscapes and community types (e.g. coastal and mountainous respectively) and a range of impact types posed byclimate change (e.g. sea level rise versus snowpack/water supply impacts), to increase the representation of other BCcommunities and test different climate change issues.
Assuming three community case studies, the scenario cube would comprises 36 scenarios, representing four alternativepathways with three time-steps in three locations, each of which is specified by: distinct emissions, impacts, and responses;a point in time; and a fixed local area or neighbourhood. The cube device is used to provide an organizing structure torepresent the multiple possibilities for comparison between scenarios, across timeframes, and between different localities.
S.R.J. Sheppard et al. / Futures 43 (2011) 400–412 403

Key structuring concepts in the cube include the range of emissions scenarios, the inclusion of adaptation with mitigation,and mechanisms for linking the global to the local scenarios.
3.1.1. Range of emission scenarios
Since the magnitude of future climate change is strongly related to the level of carbon emissions chosen, this y-axis of theframework needs to span a wide spectrum of potential emissions, to keep them distinct and to capture the range ofpossibilities. Essentially, this means drawing on the extensive work of the IPCC and its recognized families of scenarios, withattendant quantitative information on various climate change parameters based on multiple models. The LCCVP cubereflects three different levels of emissions scenarios with resulting GHG concentrations and temperature changes at theglobal scale, spread across the four tiers of the y-axis.
The four framing scenarios used for LCCVP (see Shaw et al. [17] for further details), which correspond to the four tiers onthe cube, comprise:
� World 1 – ‘‘Do Nothing’’ scenario acting as a baseline from existing trends, representing a high-carbon world with littleeffective policy or action on climate change, and rapid growth in population (including environmental refugees), economicactivity, GHG emissions, and land use trends until late century when abrupt change occurs (e.g., decline of cheap energyand food supplies). Communities are increasingly at risk from flooding, loss of agricultural productivity, ecological impacts,and traffic congestion). This scenario generally corresponds to global IPCC SRES scenario A2 [43].� World 2 – ‘‘Adapt to Risk’’ scenario, similar to World 1 and with the same GHG emissions profile, but climate change
impacts are anticipated, avoiding unplanned settlement areas, shifting away from the development in areas highlyvulnerable to flooding, and implementing adaptive engineering to protect certain coastal communities. No effectivemitigation is carried out, with most planning going into local adaptation (see below).� World 3 – ‘‘Efficient Development’’ scenario, where population and energy use grows at a slower rate while energy sources
gradually diversify over time, and both mitigation and adaptation are implemented; however, greener development, energyefficiency gains, fuel switching, transportation improvements, and behavioural change are too slow to reverse overall growthin GHG emissions. The significant reduction in the rate of carbon emissions (relative to the baseline tier) occurs as a result of
[()TD$FIG]
Fig. 1. Conceptual framing (‘scenario cube’) for generating local climate change scenarios, addressing specific response profiles (including emission
pathways), timeframes, and case studies from the Local Climate Change Visioning Project in British Columbia.
S.R.J. Sheppard et al. / Futures 43 (2011) 400–412404

global or local trends, including moves towards sustainability, perhaps with limited or implicit policies for climate change,leading to slower climate changes. This scenario generally corresponds to global IPCC SRES scenario B2 [43].� World 4 – ‘‘Deep Sustainability’’ scenario, where significant social changes and policies lead to considerable GHG emissions
reductions and a low-carbon society early in the century. Population growth slows and there is a more regional approach toenergy and food production/security, with new forms of urban design and land-use planning that increase resilience toclimate change impacts and greatly reduce dependency on fossil fuels. This tier of the cube portrays a more proactive set ofpolicies and actions on climate change, leading to greatly reduced climate change emissions relative to today and a pre-determined target of a stabilized concentration of CO2 in the atmosphere. This scenario therefore reflects a ‘backcast’(Robinson [44]) from desired conditions in 2100, rather than an extrapolation of existing trends as in the lowest level in theframework and corresponds generally to global post-SRES scenario B1-450.
The World 1 scenario, when explained or presented to stakeholders, provides the main opportunity to convey theprocesses and mechanisms that underlie the climate change phenomenon; most notably, the linkages between greenhousegas emissions/concentrations (the ‘causes’) and global temperature increases, thermal expansion of the oceans, and manyother impacts (the ‘damage report’). This scenario at the local level illustrates key processes and cycles of importance tostakeholders, such as the process of coastal erosion or ecosystem shift. In effect, these represent the multiple reasons to acton adaptation and mitigation.
In framing the World 4 scenario, it was viewed as essential to make links to explicit mitigation policy and projectdevelopment already in existence around the world (and in the public consciousness) which call for low-carbon or zero carbondevelopment patterns (e.g. Sweden’s zero emission policy, England’s BEDZED development, carbon neutral communities in theUK, etc.). It is therefore considered indefensible only to consider the IPCC reference range of SRES scenarios, none of whichexplicitly consider mitigation policies (IPCC [43]; Girod et al. [33]). Further, it is considered untenable (and publiclyunsupportable) not to include at least one scenario which aims at the stabilization of CO2 concentration and/or temperature oreventual CO2 reduction, also not considered explicitly in the current SRES scenarios. The resulting scenario addresses the needto show, perhaps for the first time for many people, the cumulative effects of such low-carbon development or retrofitting,through intensive large-scale mitigation. The messaging is that these efforts will slow or reduce emissions and delay theimpacts of climate change. This type of semi-quantitative scenario appears to be a missing component in the climate changestory among the scenarios widely available to the public and decisions-makers at the local level.5
It should be noted that this range of emissions does not represent the worst-case emissions commonly projected by theIPCC [45], nor the most optimistic projections available at the time. The choice of actual scenarios at the regional and localscales reflects both the fit with the conceptual framework described above as well as practical considerations such as:
� The need to include both quantified climate and socioeconomic information about scenario futures (both quantified andqualitative storylines) formulated in different global scenarios.� The oppurtunity to link with the emerging Canadian Regional Climate Model for downscaling in the study area; this model
at the time provided data only for the A2 SRES scenario.� The opportunity to take advantage of previous modelling efforts to generate holistic scenarios/narratives for Metro
Vancouver which (1) link with global scenarios and (2) provide some quantified indicators relevant to climate change andMetro Vancouver futures, through the Georgia Basin QUEST modelling (Robinson and Tansey [47]).
3.1.2. Fitting adaptation into the conceptual framework
The need to integrate both mitigation and adaptation measures in response to climate change, requires a more complexdiscussion of the scenarios considered within the cube. Adaptation has generally not yet been closely integrated intoquantified modelling efforts for GHG emissions or global scenarios descriptions (Robinson [48]). The IPCC scenarios do nottake technological, structural, institutional, and behavioural adaptation into consideration. Nevertheless, adaptation is ofgreat importance in regional and local level planning for climate change, and the subject of intensive study and emergingpolicy development in communities and governments across Canada (e.g. Mehdi [49]). Therefore the need to considervarious kinds and levels of adaptation is required within the framework. However, it is currently difficult to relate localadaptation efforts to emission levels or climate change impacts, and so it is difficult to fit adaptation on to a simple y-axis ofemission or mitigation levels in the cube. Ideally, studies such as this would consider a range of adaptation measures at eachof the emissions levels described above, as scenario variants or as the third dimension in the cube, replacing the local casestudy dimension being used here. However, this was beyond the scope of the initial study, and pragmatically, fewcommunities would be able to apply so many scenarios systematically in the real world.
It is already clear from community experience (within and beyond the study team) that some communities willproactively develop adaptation responses as the threats of climate change become clearer (Adger et al. [50]), and probablywith a higher priority at the local funding level than mitigation activities, which have less obvious, immediate, and local
5 The 4th Assessment Report of the IPCC [45] included a ‘‘scenario’’ in the form of a graph showing the effects of a zero-additional emissions line in
comparison with the conventional SRES scenarios, and Andrew Weaver’s [46] range of scenarios include a series of low to high carbon scenarios. Neither of
these was available at the time of the scenario development for the LCCV Project, and they are still not widely supported by climate models worldwide.
S.R.J. Sheppard et al. / Futures 43 (2011) 400–412 405
benefits. Therefore, it is logical to identify a tier in the framework which addresses an adaptation response withoutmitigation, which would illustrate benefits and other implications of adaptation at the local level in comparison with thebaseline situation. In the scenario cube, this meant dividing the SRES A2-type scenario into two tiers at the local level, withand without adaptation (i.e. the bottom two tiers in Fig. 1). World 1 is therefore without any effective climate changepolicies; World 2 targets local adaptation initiatives.
Currently, there are no activities or GHG emissions modelling that we are aware of that accommodate global adaptation(although the possibility for this type of initiative exists). Since there is limited research on the influence of adaptationstrategies on GHG emissions, the assumption is made in World 2 that the proactive adaptation occurring does not greatlyinfluence already high emissions levels. However, in developing Worlds 3 and 4, consideration was given to the synergiesand/or potential conflicts between mitigation and adaptation measures, though this initial study could not quantify theserelationships. Only adaptations that do not contradict the mitigation goals in those tiers were considered in these tiers,assuming that synergistic adaptations would be occurring.
Our overall assumption with respect to the relation between adaptation and mitigation is that the more effectivemitigation there is (globally), the more climate change impacts will be slowed or delayed, and ultimately less pressingadaptations will need to occur. The y-axis on the cube can therefore be considered a rough indicator of the level of human/policy response to both mitigation and adaptation imperatives, acknowledging that more mitigation sooner (globally) leadsto somewhat less adaptive action required over the long term. It is recognized that the time lag between changes inemissions and the earth’s response (in terms of GHG concentrations and subsequent environmental effects such as sea-levelrise) means that some adaptation will be necessary in all scenarios in spite of immediate mitigation efforts (IPCC [2]).However, the cube tiers allow the differences in impact level and therefore possible differences in extent or urgency ofadaptation to be explicitly articulated.
3.1.3. Linking global and local responses through a fair-share mechanism
One of the primary difficulties for this type of ‘localizing’ effort is to develop a framework that provides clear andconsistent linkages across geographic scales. In order to do this, a framework applying to the local scale must account for thegeographic range of information available: much scientific information on climate change is available only at the global level,with fragmented, disparate, or just plain missing research and data at the local community level. This requires regional andlocal information to be interpreted by local experts, decision-makers, and stakeholders for its relevance to and implicationsfor the local landscape, as well as for appropriate local policy and action (e.g. through the planning process).
A more serious conceptual difficulty is linking local responses to global responses and their consequences. Localmitigation efforts in any one location are unlikely to have a significant effect on global or local climate change, since the latteris driven by global GHG concentrations. However, many local communities acting together on mitigation represent perhapsthe major mechanism for GHG reduction globally. Accordingly, as a starting point for the sake of simplicity in presentingscenarios to lay-citizens, this framework assumes a fair-share mechanism that essentially states ‘‘we do what the rest of the
world does on greenhouse gas emissions’’, so that the local mitigation responses are consistent with the matching globalemissions scenarios, resultant GHG concentrations, global temperature differences by 2100, etc.
In the most intensive mitigation scenario (World 4), we diverged somewhat from the simple fair-share assumption oflocal and global parity, by emphasizing the historical equity considerations that Annex 1 countries (OECD, 2004) hold agreater responsibility for cutting greenhouse gas emissions due to their dominance in early century emissions.Consequently, we assumed 60% reduction in GHGs by 2050 (relative to 1990) for the Canadian case study communities, agreater cut than the global reductions considered necessary at the time to achieve the Post-SRES 450 ppm concentrations.
Local scenarios can then be developed through a process of: first, selecting appropriate global emission scenarios andassociated climate change impacts (e.g. from commonly used Global Circulation Models (GCMs)) and socio-economicassumptions; and second, distilling these down to a meaningful and reasonably coherent set of scenarios at the regional andthen local level, incorporating the best available science and information at these levels. The following section provides anover view of how this was done in the two case study communities.
3.2. Local Climate Change Future Visioning Process
The second component of the Local Climate Change Future Visioning framework is a template for a participatory researchprocess (details about empirical applications of this process are described in Shaw et al. [17] and Schroth et al. [51]). Theprocess has been conceptualized in a way that integrates existing local climate change studies and engages climatescientists, local experts, and community stakeholders in a local working group; their role is to help fill key data gaps, developfinal scenarios, and advise on visualisation preparation (Sheppard [8]).
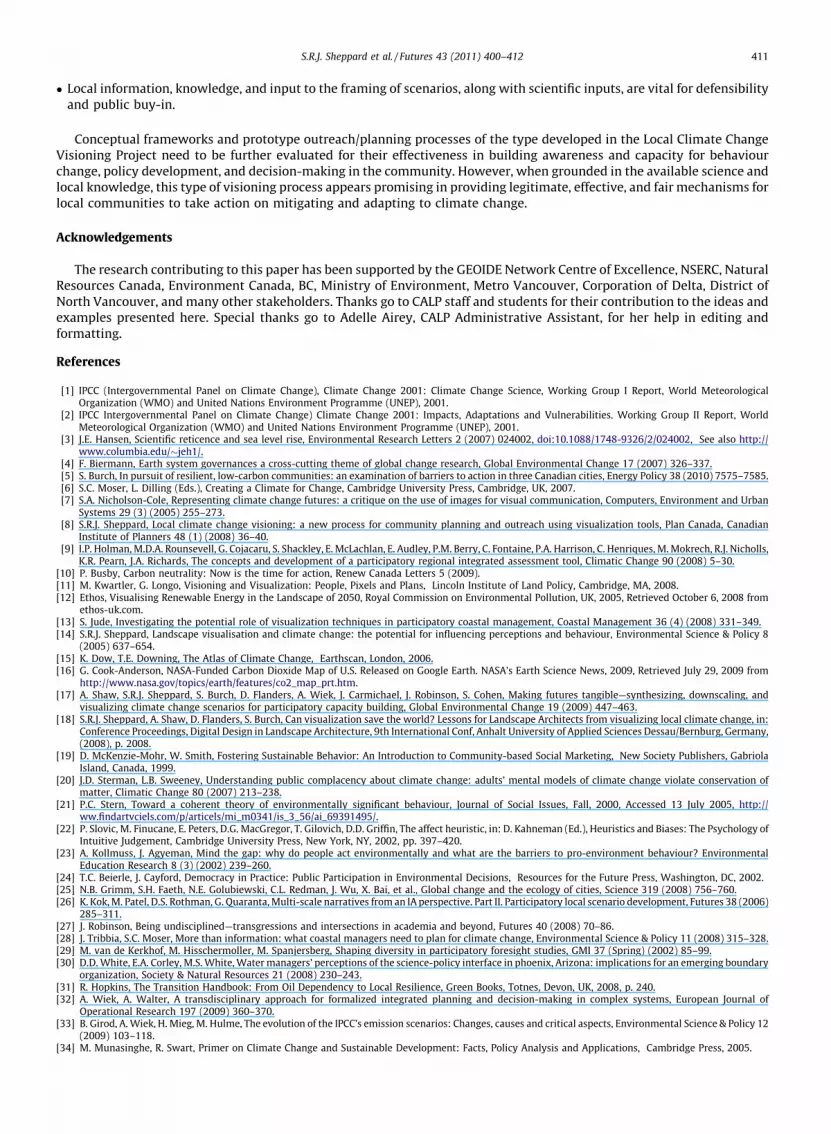
The process builds upon precedents addressing more limited aspects of climate change (e.g. Cohen [52]; Snover et al.[53]), and other modelling-based planning processes using visualization (e.g. Tress and Tress [37]; Sheppard and Meitner[40]). Phase 1 of the visioning process draws on available data, science, models, and best practices, as well as local knowledgeand multidisciplinary expertise, through workshops with scientists, practitioners and community stakeholders (Fig. 2).These stages involve exploration of key climate change processes of concern in the local area, and integrates relevant studiessuch as any local inventories of greenhouse gases, modelling of local climate impacts such as sea-level rise or water-supplyreduction, and early examples of GHG reduction. Products include visioning material for each community or neighbourhood,
S.R.J. Sheppard et al. / Futures 43 (2011) 400–412406

illustrating different adaptation and mitigation strategies arising from the alternative scenarios that can be assessed againstcarbon reduction targets and other key sustainability/feasibility criteria. Together with GIS mapping, photographs of similarconditions elsewhere, explanatory diagrams on key climate change processes, and plausible storylines, computervisualizations are developed to illustrate the scenarios in the community’s neighbourhoods and backyards.
The visualization media can range from simple 2D photorealistic tools like Photoshop to an array of 3D programs such asArcSCENE, Google Earth, Sketch-up, Visual Nature Studio and Community Viz. When showing one or more future conditions(Fig. 3), these become 4D visualisation of community futures. These can make use of increasingly available 3D datasets, butthe preparation of imagery should follow a standard process with agreed decision-rules to ensure defensibility (Sheppard[54]). Input is sought during the process from the local working group on issues such as representative locations for focusareas and viewpoints, themes to be visualized, and important local conditions to be shown.
In Phase 2, the visioning packages can then be presented in various public or planning settings (such as visioning orscenario evaluation workshops) for discussion, learning, and comment, and further refined to develop preferred responsescenarios through community design charrettes or other planning processes. Participants may include upper managementprofessionals, community representatives, elected officials other stakeholder groups, or the general public. Through theimages, participants can learn about important long-term processes, and see, for example, the effects on their community ofunmitigated climate change (e.g. sea-level rise, drought, and increased fire risk) in their lifetime, or the emergence of‘‘complete’’ resilient low-carbon communities with renewable energy, local food production, and sustainable technologies(Fig. 4). The pictures of alternative climate and response scenarios can convey their important holistic nature, e.g. inillustrating synergies and conflicts between adaptation and mitigation such as shading houses with trees to cool them insummer versus placing photovoltaics on roofs for renewable energy production.
[()TD$FIG]
Fig. 2. Summary flowchart for a typical Phase 1 visioning process (scenario development).
[()TD$FIG]
Fig. 3. 3D visualisations of statistically downscaled data for snow pack in Greater Vancouver’s Northshore mountains, showing April 1st median snowline in
2000 (current conditions on right) and 2100 (World 1 [A2] scenario on left).Credit: David Flanders (CALP) and Environment Canada
S.R.J. Sheppard et al. / Futures 43 (2011) 400–412 407

3.3. Case study results of the Local Climate Change Future Visioning Process
Initial results from evaluation of the Phase 2 application of the visioning process in Delta, BC, based on the conceptualframework described in this paper, are summarized briefly here and described further in Sheppard et al. [18], Shaw et al. [55],Burch et al. [56], and forthcoming papers. The products of the visioning process were tested with approximately 100community members in south Delta, recruited from the area depicted in the visualisations and local map material. Visioningworkshops for scenario evaluation were held in the community: these lasted 2–3 h and used a multi-media PowerPointpresentation on two large screens, side-by side, with primarily visual material and verbal commentary illustrating thecontext and scenario results. Evaluation methods used standard social science assessment techniques (e.g. pre-post writtenquestionnaires, written qualitative comments, participant observations, and some follow-up interviews), to determinechanges in participants’ attitudes and knowledge due to the presentations, and their opinions on the process.
The results so far provide evidence to support the effectiveness of alternative climate change scenarios, downscaledclimate information, and geomatics-based visualization technology to deliver engagement, learning, and increased intent toact on climate change issues. The extensive use of realistic visualisations, together with photographs, maps, and certainillustrative charts, maintained high levels of engagement among the participants. The credibility of the visualisation toolsand effectiveness of the visioning process were rated generally as high, though some participants made recommendationsfor enhanced or additional products. The structure of the four worlds proved to be straightforward to understand and wasreadily adopted by the participants during the workshops, with verbal comments reflecting their correct understanding ofthe differing scenario attributes and their consequences for the community.
After seeing the visioning packages, participants indicated a substantial increase in their understanding of the urgency ofresponding to climate change. Awareness of local climate change impacts, and of the types of response options available,increased significantly. The range of feasible adaptation and mitigation solutions illustrated seemed to leave people with asense of the constructive actions that can be taken. Despite a fairly high prior knowledge of and concern over global climatechange, concern about the local effects of climate change significantly increased. Many respondents noted that havinginformation locally contextualized and visualized in alternative futures made the climate change information ‘‘hit home’’.One participant made the impact of the visuals clear, ‘‘I learned how climate change could affect my community in a verygraphic way. Numbers may not stay with me but visuals will.’’ The visioning workshops appeared to alter community
[()TD$FIG]
Fig. 4. 4D visualisations of Scenarios 1–4 in South Delta, BC (from top left to right, to bottom left to right). (a) Scenario 1 illustrates more frequent flooding
and abandonment of houses in 2100; (b) Scenario 2 shows a berm as an adaptation strategy in 2100; (c) Scenario 3 includes incremental retrofits of raised
housing and solar panels in 2100; (d) Scenario 4 depicts more rapid retrofitting and low-carbon redevelopment with energy- and food-producing clusters,
resilient to projected impacts, in 2050.Credit: David Flanders, CALP/DCS/UBC
S.R.J. Sheppard et al. / Futures 43 (2011) 400–412408

participants’ attitudes. Results showed a significant increase in participants’ belief that action taken can significantly reducethe impacts of climate change in the future. There was also a significant increase in the number of participants whopersonally plan to do something about climate change, mostly by changes in personal vehicle use and in the household.Stated willingness to support climate change policies (both mitigation and adaptation) at the local scale increasedsubstantially.
4. Discussion
The framework developed to support scenario development and engagement processes such as that used in the LocalClimate Change Visioning Project, has enabled researchers to articulate the possible effects of different levels of response toclimate change. In effect, it allows us to ‘‘connect the dots’’ between global scenarios and local storylines, and between localactions or policies and their consequences under certain assumptions about future global and local climate conditions. Theframework provides ways not only to consider global climate change and its potential consequences in a structured mannerat the municipal/community scale, but also to encourage new forms of participation that involve local expert andcommunity stakeholders in the knowledge generation process. They enable visioning processes that attempt to buildawareness, capacity, and agency among community members, and thus facilitate better governance and more effective onclimate change. The link to visualization also fosters broader communication of the scenarios as capacity building tools. Assuch, the framework developed meets the core requirements laid out in Section 2.
The application of the framework provides ways to structure the complexity of projected impacts and adaptation/mitigation responses for different communities at the local scale, in a comprehensive but clearly articulated and engagingway. Most communities in the world with planning capabilities, in responding to climate change, will need to conduct somesort of engagement and analysis exercise like this, inside or outside their current planning processes. The importance ofstructured semi-quantitative scenarios is paramount in the process, generating a baseline future that reveals both ‘why’there is a need to respond to climate change at the local level, and the potential ways of responding: these can then be used toselect appropriate local GHG reduction targets, highlight constructive options a community can take, and possible synergiesand trade-offs between diverse adaptation and mitigation strategies.
Pragmatically, the framework proved useful to the LCCVP team in planning strategies and estimating the effort requiredfor preparation and presentation of multiple or sequential images, allowing key comparisons between or within scenarios.The project demonstrated that such a holistic process is workable and effective in a community setting, and compelling 3D/4D visualizations of local climate change scenarios can be developed defensibly. The results of the study support generalarguments in the literature that visual imagery can have a dramatic effect on both awareness and affective response. Wehave found that the most powerful comparisons in informal presentations have been across timeframes (e.g. speeding up thegradually dwindling snowline in North Vancouver, Fig. 3) and across scenarios late in the century where the differences aremost marked (e.g. coastal community alternatives shown in Fig. 4). Results from LCCVP testing sessions suggest thatlocalized visual media in general, and 3D visualisation in particular, can increase engagement, build awareness of complexenvironmental issues related to local climate change, and foster increased support for climate change policy.
Implementation of the LCCVP case studies in Delta and District of North Vancouver required management of acomplicated information chain. Visualisations such as the sea level rise imagery and the snowline retreat imagery werecreated through a collaborative process, linking climate science, physical science, and landscape representation with GIS,remote sensing, and visualization processing, In both cases, the imagery was vetted through the dialogue process with localpartners and government staff, initiating considerable exploration and mutual learning among stakeholders, practitioners,and researchers. The pictures of scenarios were neither the beginning nor the end of the process; they were in the middle,enabling global climate science to be translated into local indicators that could engender a community planning responsethat would not have otherwise occurred; it is though too soon to know if either community will do something different as aresult of their exposure to this visioning process. However, there are some early indications: as a result of the coastal case, forexample, a professional engineer working for the Corporation of Delta has now become active in promoting explicit inclusionof climate change both in coastal planning and within practitioner networks, where engineers are looking for frameworks inorder to explore adaptation alternatives, in the absence of standardized procedures for these new kinds of inputs to decision-making.
Despite the achievements and knowledge gained to date, future research is needed with respect to integrating a morerobust range of (global) input data (beyond IPCC’s 4th Assessment scenarios); securing a more robust level of dataavailability; a differentiation and re-combination of scenarios; more explicit visualisation of underlying climate changeprocesses leading to local effects; and the specific effects of climate change visuals on behavioural and structural change andaction.
Over-reliance on the IPCC SRES scenarios has left a gap in true low-carbon scenarios, until very recently; even the post-SRES stabilization scenarios are not supported in most climate change modelling systems, making it very difficult to linkbetween local low-carbon scenarios and matching global or regional climate impact scenarios. The B1 SRES scenario seemsto be the default ‘‘low’’ carbon scenario used in the literature, even though this is not low-carbon in any real sense and takesus beyond the 2 degree threshold. The lack of solid IPCC intervention scenarios depicting the results of successful mitigation,stabilization, and adaptation, with which to frame regional and local efforts, could be one reason that urban planners havebeen unable to engage in this serious and urgent effort until now. The emergence of a more flexible set of scenarios promised
S.R.J. Sheppard et al. / Futures 43 (2011) 400–412 409

for the IPCC 5th Assessment [57] is a welcome development consistent with the directions embodied in the frameworkdescribed here.
To date, applications of the framework for conceptualizing climate change scenarios have used the fair-share mechanismof parity between global and local response scenarios. A priority for further development of this model would be to relax thissimplifying assumption and include worlds which combine low-carbon local futures with high carbon global futures (in partsuggested by our community participants). One useful benchmark scenario, for example, could show the implications ofceasing all GHG emissions, to provide an anchoring baseline for gauging the effects of theoretically avoidable or discretionaryadditional climate change (as opposed to historically unavoidable climate change).
The complexity of addressing multiple considerations related to climate change and developing the type of frameworkdiscussed above has likely been part of the reason that, until very recently, relatively few municipal or practitioner initiativeshave attempted to generate local climate futures and scenarios. It is therefore no surprise that knowledge of climate changegenerally has not been translated into action or often even planning policy at the local scale. In practice, we have observedthat people want to know what the projected future conditions may look like. However, even with a framework such as thatpresented here and its underlying assumptions, the lack of locally specific climate science and spatial or quantitativescenario modelling (e.g. of hydrology, land use change, soil conditions, transportation options, etc.) remains a majorconstraint. In particular, it is difficult to determine costs, feasibility, and effectiveness of various response options,information which is sorely needed for accelerated decision-making (rather than simply awareness and capacity-building).It is recognized that it is impossible to develop fully integrated multi-criteria models that generate quantitatively holisticand spatial climate change scenarios, at the regional or local level, within the scope of most research projects or planningprocesses. Accordingly, planners will continue to rely on assumptions and risk management approaches in the absence ofhard data, preferably within the structure of climate change planning frameworks such as that described here. However, thepotential of integrative and quantitative planning tools such as Community Viz (Orton Family Foundation [58]) or Elementsof Neighbourhood (Girling et al. [59]) should be further exploited for reducing some of the more important holes in the data.
While our initial LCCVP testing results are encouraging, there is a need for more empirical verification of the effectivenessof such approaches in meeting all the requirements laid out in Section 2 of this paper, and their impact in terms of actuallearning achieved, resulting influences on policy and behaviour, etc. Further testing, replication, and modification of thisframework and other approaches are needed. Visioning processes based on or adapted from the framework presented hereare continuing to be evaluated and documented in forthcoming papers, in several BC communities (Delta, North Vancouver,and Kimberley), with production of an initial guidance manual for local climate change visioning [60]. Parallel studies arealso underway in Clyde River (Nunavut), Toronto, and the Elbow River watershed in Alberta. To date, such studies have beenwell received by the communities and planners, suggesting considerable demand for such information and processes. In BC,this could in part be due to the fact that BC has recently brought in provincial policy and laws mandating GHG reductiontargets a case of life mirroring science, since such measures were not in place when the research scenarios were firstdeveloped.
5. Conclusions
The proposed framework addresses the need for clearer ways to structure public debate on climate change at the locallevel, and to enable more engaging and understandable participatory planning processes. Such visioning processes canbridge the gap between formalized scientific modelling and nuanced social realities in the community. The frameworkdescribed above can be used to incorporate more robust semi-quantitative climate change scenarios that link global scienceto local options, for purposes of awareness, capacity-building, and decision-support. There is considerable potential forvisual learning tools, derived from and illustrating these scenarios, to engage the community in practical visioning processeslike the Local Climate Change Visioning Project. Experience suggests that these processes also force the integration of diversestreams of information from multiple sources and disciplines. Such approaches appear to be a missing component in theclimate change discourse that is generally available to the public and decisions-makers, at the local level at least; it is thuscurrently impossible for most communities to assess their choices in responding to climate change. Based on experience indeveloping a conceptual framework and future scenarios combining local causes, impacts, and responses to climate change,there are a number of principles that can be suggested for other communities, practitioners, and researchers seeking publicengagement in this area:
� Despite its complexity, scientific climate change information can be structured and applied to the community level,through use of coherent scenarios; these need to be localized in order to be ‘‘real’’, understandable, and meaningful tolaypeople.� Climate change scenarios can be spatialized at the local level to allow analysis of climate change impacts, vulnerabilities,
and adaptation/mitigation suitability, making them more likely to be integrated into planning processes.� There is considerable potential value in visualizing local climate change scenarios in order to communicate them and
enhance engagement and learning; they need to disclose the scientific information clearly, contain sufficient realism andvisual drama to attract and retain interest, and be defensible in terms of back-up data and methods.� Local climate change scenarios need to be framed so as to make climate change choices more explicit between alternatives
over the short and long-term, providing clear options for action in the community.
S.R.J. Sheppard et al. / Futures 43 (2011) 400–412410
� Local information, knowledge, and input to the framing of scenarios, along with scientific inputs, are vital for defensibilityand public buy-in.
Conceptual frameworks and prototype outreach/planning processes of the type developed in the Local Climate ChangeVisioning Project need to be further evaluated for their effectiveness in building awareness and capacity for behaviourchange, policy development, and decision-making in the community. However, when grounded in the available science andlocal knowledge, this type of visioning process appears promising in providing legitimate, effective, and fair mechanisms forlocal communities to take action on mitigating and adapting to climate change.
Acknowledgements
The research contributing to this paper has been supported by the GEOIDE Network Centre of Excellence, NSERC, NaturalResources Canada, Environment Canada, BC, Ministry of Environment, Metro Vancouver, Corporation of Delta, District ofNorth Vancouver, and many other stakeholders. Thanks go to CALP staff and students for their contribution to the ideas andexamples presented here. Special thanks go to Adelle Airey, CALP Administrative Assistant, for her help in editing andformatting.
References
[1] IPCC (Intergovernmental Panel on Climate Change), Climate Change 2001: Climate Change Science, Working Group I Report, World MeteorologicalOrganization (WMO) and United Nations Environment Programme (UNEP), 2001.
[2] IPCC Intergovernmental Panel on Climate Change) Climate Change 2001: Impacts, Adaptations and Vulnerabilities. Working Group II Report, WorldMeteorological Organization (WMO) and United Nations Environment Programme (UNEP), 2001.
[3] J.E. Hansen, Scientific reticence and sea level rise, Environmental Research Letters 2 (2007) 024002, doi:10.1088/1748-9326/2/024002, See also http://www.columbia.edu/�jeh1/.
[4] F. Biermann, Earth system governances a cross-cutting theme of global change research, Global Environmental Change 17 (2007) 326–337.[5] S. Burch, In pursuit of resilient, low-carbon communities: an examination of barriers to action in three Canadian cities, Energy Policy 38 (2010) 7575–7585.[6] S.C. Moser, L. Dilling (Eds.), Creating a Climate for Change, Cambridge University Press, Cambridge, UK, 2007.[7] S.A. Nicholson-Cole, Representing climate change futures: a critique on the use of images for visual communication, Computers, Environment and Urban
Systems 29 (3) (2005) 255–273.[8] S.R.J. Sheppard, Local climate change visioning: a new process for community planning and outreach using visualization tools, Plan Canada, Canadian
Institute of Planners 48 (1) (2008) 36–40.[9] I.P. Holman, M.D.A. Rounsevell, G. Cojacaru, S. Shackley, E. McLachlan, E. Audley, P.M. Berry, C. Fontaine, P.A. Harrison, C. Henriques, M. Mokrech, R.J. Nicholls,
K.R. Pearn, J.A. Richards, The concepts and development of a participatory regional integrated assessment tool, Climatic Change 90 (2008) 5–30.[10] P. Busby, Carbon neutrality: Now is the time for action, Renew Canada Letters 5 (2009).[11] M. Kwartler, G. Longo, Visioning and Visualization: People, Pixels and Plans, Lincoln Institute of Land Policy, Cambridge, MA, 2008.[12] Ethos, Visualising Renewable Energy in the Landscape of 2050, Royal Commission on Environmental Pollution, UK, 2005, Retrieved October 6, 2008 from
ethos-uk.com.[13] S. Jude, Investigating the potential role of visualization techniques in participatory coastal management, Coastal Management 36 (4) (2008) 331–349.[14] S.R.J. Sheppard, Landscape visualisation and climate change: the potential for influencing perceptions and behaviour, Environmental Science & Policy 8
(2005) 637–654.[15] K. Dow, T.E. Downing, The Atlas of Climate Change, Earthscan, London, 2006.[16] G. Cook-Anderson, NASA-Funded Carbon Dioxide Map of U.S. Released on Google Earth. NASA’s Earth Science News, 2009, Retrieved July 29, 2009 from
http://www.nasa.gov/topics/earth/features/co2_map_prt.htm.[17] A. Shaw, S.R.J. Sheppard, S. Burch, D. Flanders, A. Wiek, J. Carmichael, J. Robinson, S. Cohen, Making futures tangible—synthesizing, downscaling, and
visualizing climate change scenarios for participatory capacity building, Global Environmental Change 19 (2009) 447–463.[18] S.R.J. Sheppard, A. Shaw, D. Flanders, S. Burch, Can visualization save the world? Lessons for Landscape Architects from visualizing local climate change, in:
Conference Proceedings, Digital Design in Landscape Architecture, 9th International Conf, Anhalt University of Applied Sciences Dessau/Bernburg, Germany,(2008), p. 2008.
[19] D. McKenzie-Mohr, W. Smith, Fostering Sustainable Behavior: An Introduction to Community-based Social Marketing, New Society Publishers, GabriolaIsland, Canada, 1999.
[20] J.D. Sterman, L.B. Sweeney, Understanding public complacency about climate change: adults’ mental models of climate change violate conservation ofmatter, Climatic Change 80 (2007) 213–238.
[21] P.C. Stern, Toward a coherent theory of environmentally significant behaviour, Journal of Social Issues, Fall, 2000, Accessed 13 July 2005, http://ww.findartvciels.com/p/articels/mi_m0341/is_3_56/ai_69391495/.
[22] P. Slovic, M. Finucane, E. Peters, D.G. MacGregor, T. Gilovich, D.D. Griffin, The affect heuristic, in: D. Kahneman (Ed.), Heuristics and Biases: The Psychology ofIntuitive Judgement, Cambridge University Press, New York, NY, 2002, pp. 397–420.
[23] A. Kollmuss, J. Agyeman, Mind the gap: why do people act environmentally and what are the barriers to pro-environment behaviour? EnvironmentalEducation Research 8 (3) (2002) 239–260.
[24] T.C. Beierle, J. Cayford, Democracy in Practice: Public Participation in Environmental Decisions, Resources for the Future Press, Washington, DC, 2002.[25] N.B. Grimm, S.H. Faeth, N.E. Golubiewski, C.L. Redman, J. Wu, X. Bai, et al., Global change and the ecology of cities, Science 319 (2008) 756–760.[26] K. Kok, M. Patel, D.S. Rothman, G. Quaranta, Multi-scale narratives from an IA perspective. Part II. Participatory local scenario development, Futures 38 (2006)
285–311.[27] J. Robinson, Being undisciplined—transgressions and intersections in academia and beyond, Futures 40 (2008) 70–86.[28] J. Tribbia, S.C. Moser, More than information: what coastal managers need to plan for climate change, Environmental Science & Policy 11 (2008) 315–328.[29] M. van de Kerkhof, M. Hisschermoller, M. Spanjersberg, Shaping diversity in participatory foresight studies, GMI 37 (Spring) (2002) 85–99.[30] D.D. White, E.A. Corley, M.S. White, Water managers’ perceptions of the science-policy interface in phoenix, Arizona: implications for an emerging boundary
organization, Society & Natural Resources 21 (2008) 230–243.[31] R. Hopkins, The Transition Handbook: From Oil Dependency to Local Resilience, Green Books, Totnes, Devon, UK, 2008, p. 240.[32] A. Wiek, A. Walter, A transdisciplinary approach for formalized integrated planning and decision-making in complex systems, European Journal of
Operational Research 197 (2009) 360–370.[33] B. Girod, A. Wiek, H. Mieg, M. Hulme, The evolution of the IPCC’s emission scenarios: Changes, causes and critical aspects, Environmental Science & Policy 12
(2009) 103–118.[34] M. Munasinghe, R. Swart, Primer on Climate Change and Sustainable Development: Facts, Policy Analysis and Applications, Cambridge Press, 2005.
S.R.J. Sheppard et al. / Futures 43 (2011) 400–412 411

[35] R. Pielke Jr., T. Wigley, C. Green, Dangerous assumptions, Nature 452 (7187) (2008) 531–532.[36] P. Raskin, The Great Transition Today: A Report from the Future, Tellus Institute, Boston, MA, 2006.[37] B. Tress, G. Tress, Scenario visualisation for participatory landscape planning: a study from Denmark, Landscape and Urban Planning 982 (2002) 1–18.[38] S.R.J. Sheppard, Participatory decision support for sustainable forest management: a framework for planning with local communities at the landscape level,
Canadian Journal of Forest Research 35 (7) (2005) 1515–1526.[39] W. Winn, The impact of three-dimensional immersive virtual environments on modern pedagogy, HITL Technical Report R-97-15, Human Interface
Technology Laboratory, University of Washington, Seattle, WA, 1997.[40] S.R.J. Sheppard, M.J. Meitner, Using multi-criteria analysis and visualization for sustainable forest management planning with stakeholder groups, Forest
Ecology and Management 207 (1–2) (2005) 171–187.[41] J.D. Salter, Designing and testing a prototypical landscape information interface for lay-people, Unpublished Master’s thesis, Faculty of Forestry, University of
British Columbia, Vancouver, 2005.[42] J.L. Lewis, S.R.J. Sheppard, Culture and communication: can landscape visualisation improve forest management consultation with indigenous commu-
nities? Landscape and Urban Planning 77 (2006) 291–313.[43] N. Nakicenovic, R.R. Swart (Eds.), Special Report on Emissions Scenarios (SRES), A Special Report of Working Group III of the IPCC, Cambridge University Press,
Cambridge, UK, 2000.[44] J. Robinson, Future subjunctive: backcasting as social learning, Futures 35 (8) (2003) 839–856.[45] IPCC (Intergovernmental Panel on Climate Change), Core Writing Team, in: R.K. Pachauri, A. Reisinger (Eds.), Climate Change 2007: Synthesis Report,
Contribution of Working Groups I, II and III to the Fourth Assessment Report of the Intergovernmental Panel on Climate Change, IPCC, Geneva, Switzerland,2007, p. 104.
[46] A.J. Weaver, Keeping our Cool: Canada in a Warming World, Penguin Group (Canada), Toronto, Ontario, 2008.[47] J. Robinson, J. Tansey, Co-production, emergent properties and strong interactive social research: the Georgia Basin Futures Project, Science and Public Policy
33 (2006) 151–160.[48] J. Robinson, Climate change and sustainable development: realizing the opportunity, Ambio 35 (1) (2006) 2–8.[49] B. Mehdi (Ed.), Adapting to Climate Change: An introduction for Canadian Municipalities, Canadian Climate Impacts and Adaptation Research Network
(CCIARN), 2006.[50] W.N. Adger, S. Huq, K. Brown, D. Conway, M. Hulme, Adaptation to climate change in the developing world, Progress in Development Studies 3 (2003) 179–
195.[51] O. Schroth, E. Pond, S.R.J. Sheppard, Visioning and virtual globes for climate decision-making in the case study of Kimberley (BC), CALP Working Paper, UBC,
Vancouver, 2009, www.calp.forestry.ca.[52] S.J. Cohen, Scientist-stakeholder collaboration in integrated assessment of climate change: lessons from a case study of Northwest Canada, Environmental
Modelling and Assessment 2 (4) (1997) 281–293.[53] A.K. Snover, L. Whiteley Binder, J. Lopez, E. Willmott, J. Kay, D. Howell, et al., Preparing for Climate Change: A Guidebook for Local, Regional, and State
Governments, Prepared by Climate Impacts Group (Centre for Science in the Earth System), University of Washington, and King County, Washington, inassociation with and published by ICLEI – Local Governments for Sustainability, Oakland, California, 2007.
[54] S.R.J. Sheppard, Guidance for crystal ball gazers: developing a code of ethics for landscape visualization, Landscape & Urban Planning 54 (1–4) (2001) 183–199.
[55] A. Shaw, S.R.J. Sheppard, D. Flanders, S. Burch, A thousand words saved—an empirical study on capacity building with visualized local climate changescenarios, 2008, CALP Working Paper, UBC, Vancouver, www.calp.forestry.ca.
[56] S. Burch, S.R.J. Sheppard, A. Shaw, D. Flanders, Planning for climate change in a flood-prone community: Municipal barriers to policy action and the use ofvisualizations as decision-support tools, Journal of Flood Risk Management 3 (2010) 126–139.
[57] R.H. Moss, J.A. Edmonds, K.A. Hibbard, M.R. Manning, S.K. Rose, D.P. van Vuuren, T.R. Carter, S. Emori, M. Kainuma, T. Kram, G.A. Meehl, J.F.B. Mitchell, N.Nakicenovic, K. Riahi, S. Smith, R.J. Stouffer, A.M. Thomson, J.P. Weyant, T.J. Wilbanks, The next generation of scenarios for climate change research andassessment, Nature 463 (11) (2010) 747–756.
[58] Orton Family Foundation, Community Viz, Manchester Village, VT, 2004.[59] C. Girling, R. Kellett, S. Johnstone, Informing Design Charrettes: tools for participation in neighbourhood-scale planning, Integrated Assessment Journal 6 (4)
(2006) 109–130.[60] E. Pond, O. Schroth, S.R.J. Sheppard, S. Muir-Owen, I. Liepa, C. Campbell, J. Salter, K. Tatebe, D. Flanders, Local Climate Change Visioning and Landscape
Visualizations: Guidance Manual. Collaborative for Advanced Landscape Planning, University of British Columbia, Vancouver, Canada, 2010, www.calp.forestry.ubc.ca/wp-content/uploads/2010/02/CALP-Visioning-Guidance-Manual-Version-1.1.pdf.
S.R.J. Sheppard et al. / Futures 43 (2011) 400–412412


