Embed Size (px)
Citation preview
EXPERIMENT 1
Gamma-Ray Absorption and Counting Statistics
Note: Please read the Radiation Safety Regulations at the back of this book
Introduction
The detecting medium in a scintillation counter is a solid or liquid material called a phosphor,which emits tiny flashes of light (scintillations) when struck by ionising radiations. The flashes areobserved by a photomultiplier which produces an electrical pulse when a light flash falls on it.
In this experiment the phosphor is a 50.8 mm long × 50.8 mm diameter cylindrical crystal ofthallium-activated sodium iodide i.e. NaI(Tl). This material has a density of 3.67 × 10³ kg m−3.Because of this and the high atomic number (Z = 53) of the iodine atoms, γ-rays interact stronglywith the material, resulting in a γ-ray sensitivity very much greater than that of the Geiger-Mullercounter. The crystal is enclosed in an airtight capsule of thin aluminium with diffusely-reflectingsides and a transparent base through which the light of the scintillations emerges. The base is incontact with the face of an 11-stage venetian-blind type photomultiplier.
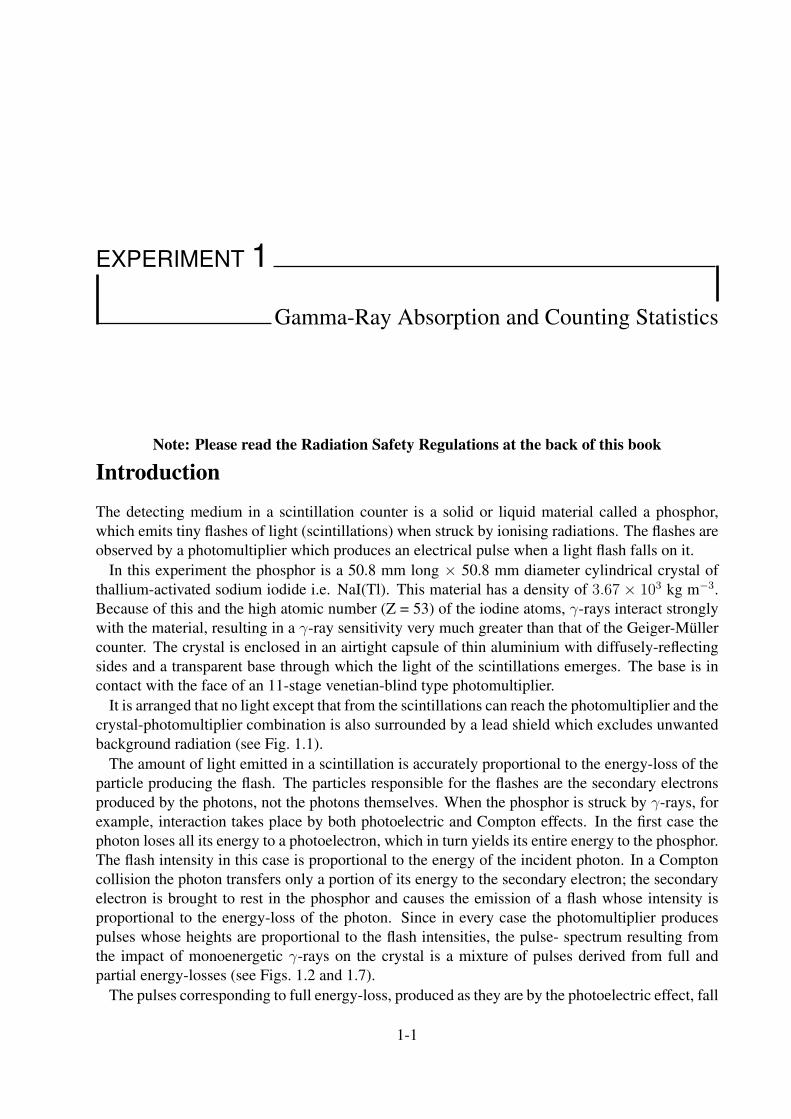
It is arranged that no light except that from the scintillations can reach the photomultiplier and thecrystal-photomultiplier combination is also surrounded by a lead shield which excludes unwantedbackground radiation (see Fig. 1.1).
The amount of light emitted in a scintillation is accurately proportional to the energy-loss of theparticle producing the flash. The particles responsible for the flashes are the secondary electronsproduced by the photons, not the photons themselves. When the phosphor is struck by γ-rays, forexample, interaction takes place by both photoelectric and Compton effects. In the first case thephoton loses all its energy to a photoelectron, which in turn yields its entire energy to the phosphor.The flash intensity in this case is proportional to the energy of the incident photon. In a Comptoncollision the photon transfers only a portion of its energy to the secondary electron; the secondaryelectron is brought to rest in the phosphor and causes the emission of a flash whose intensity isproportional to the energy-loss of the photon. Since in every case the photomultiplier producespulses whose heights are proportional to the flash intensities, the pulse- spectrum resulting fromthe impact of monoenergetic γ-rays on the crystal is a mixture of pulses derived from full andpartial energy-losses (see Figs. 1.2 and 1.7).
The pulses corresponding to full energy-loss, produced as they are by the photoelectric effect, fall
1-1
Experiment 1. Gamma-Ray Absorption and Counting Statistics
Lead Shie ld
Thin Aluminium CrystalL ight Guide
Photomult ipl ier
Figure 1.1: Schematic of photomultiplier and shielding
Figure 1.2: Pulse spectrum resulting from the impact of monoenergetic γ-rays on the crystal
1-2
Experiment 1. Gamma-Ray Absorption and Counting Statistics
Photomult ipl ier
Phosphor
Gamma Radia t ion
Printer Computer
Pre-Amp
DigitalConver ter
High Vol tage
Main Ampl i f ier
Analog to
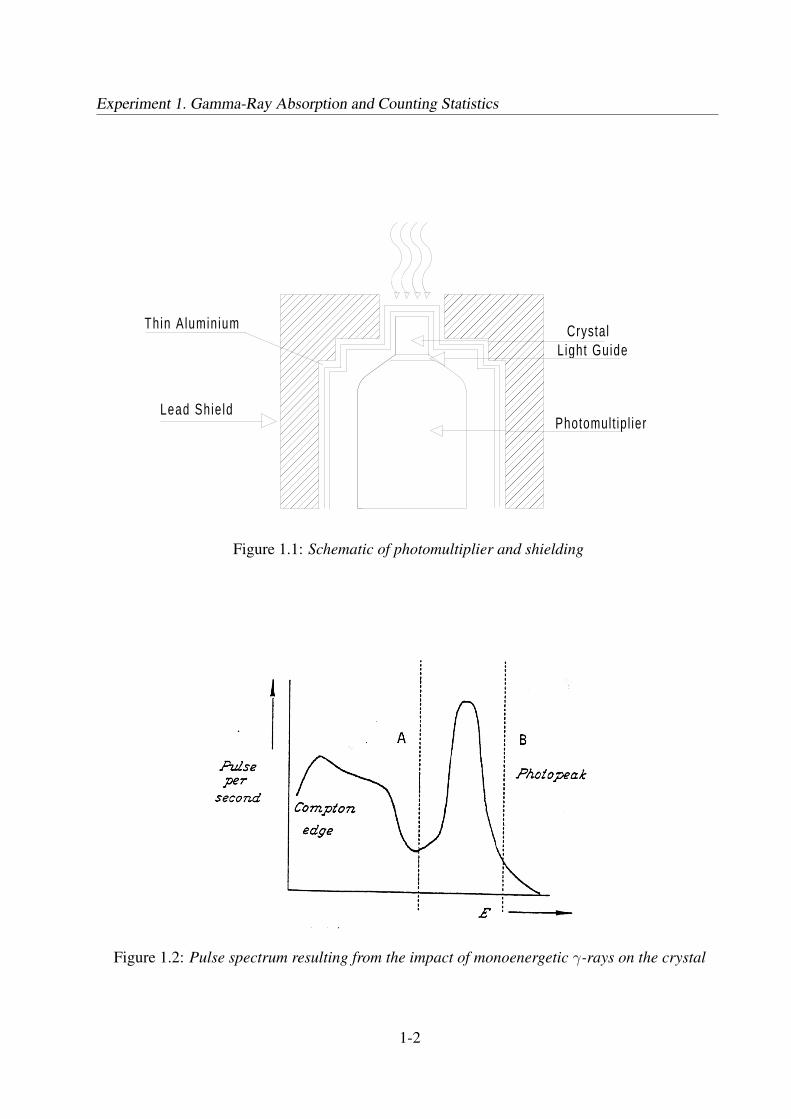
Figure 1.3: Gamma-ray detection system
in a region called the photopeak while the pulses in the Compton ‘tail’ or continuum result fromCompton collisions in which the scattered photon retains a portion of its energy. It is seen thateven in the case of monoenergetic radiation the pulse-spectrum is not simple; when the incidentradiation is heteroenergetic the pulse-spectrum may be very complex indeed.
More details of the processes of photoelectric absorption, Compton scattering and pair produc-tion may be found in the Appendix.
The Gamma-Ray Detection System
The radioactive source used is 137Cs with a half life of 30 years. It was produced as a fissionfragment by the neutron bombardment of 235U. This isotope emits beta rays of energies 512 keV(94.6%) and 1.174 MeV (5.4%) that are absorbed in plastic before reaching the detector as well asthe monoenergetic gamma rays of energy 662 keV.
The apparatus is set up as shown in the block diagram, Fig. 1.3. The high voltage power supply,preamplifier, main amplifier and analog to digital detector are all located in one box beside thecomputer and printer.(CAUTION! Do not switch on until the demonstrator has checked the system).
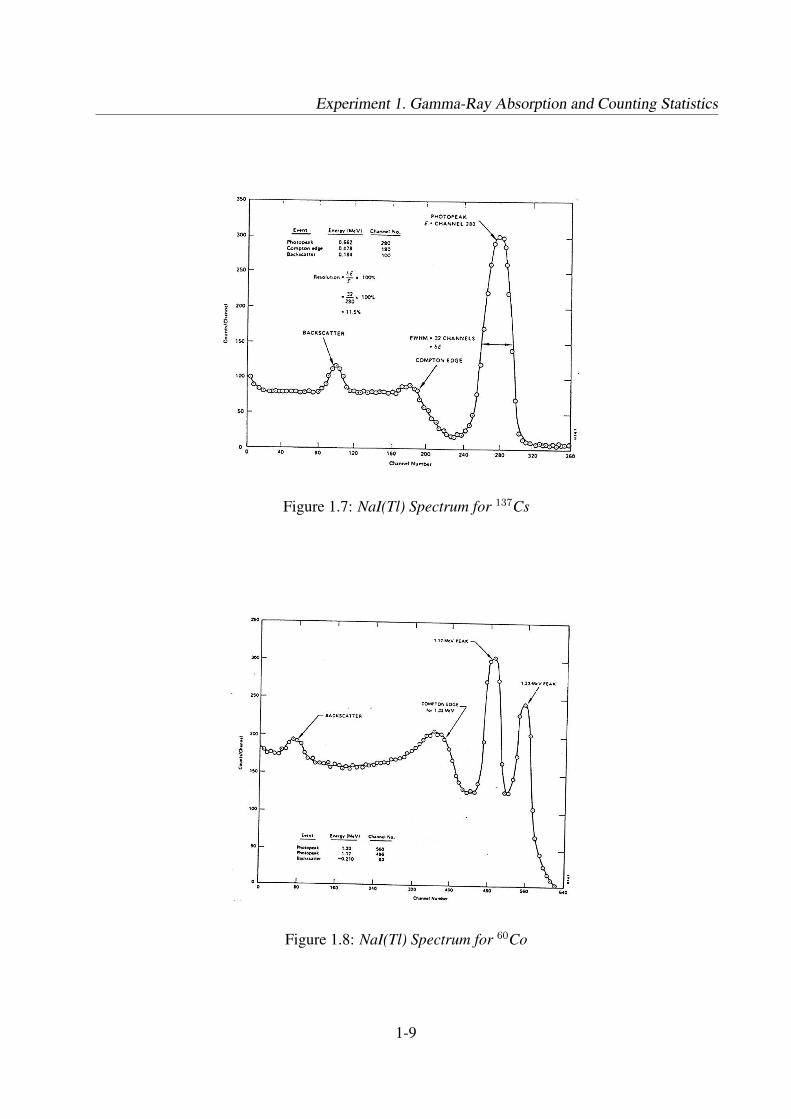
The amplified photomultiplier pulses are digitised using an analog to digital converter and thedigital pulse height is stored in computer memory. The computer memory is configured to place acount in any one of 1020 separate channels according to the digital value of the pulse height. Thesmallest pulse amplitude E is preset and the photopeak should occur somewhere between channels500 and 700. The width of each channel fixes the amplitude range ∆E within which a pulse mustfall if it is to be counted in that channel. The width of each channel is approximately 1 keV. Whenthe photomultiplier produces a pulse whose amplitude is between E and (E + ∆E), the pulse heightanalyser increments by one the count in that channel. Using this method the full spectrum of pulseheights and hence gamma ray energies are recorded and stored. The width of the photopeaks isapproximately 80 channels. The width is determined by the energy resolution (≈ 12%) of thephosphor and not the monoenergetic gamma rays of energy 662 keV.
1-3
Experiment 1. Gamma-Ray Absorption and Counting Statistics
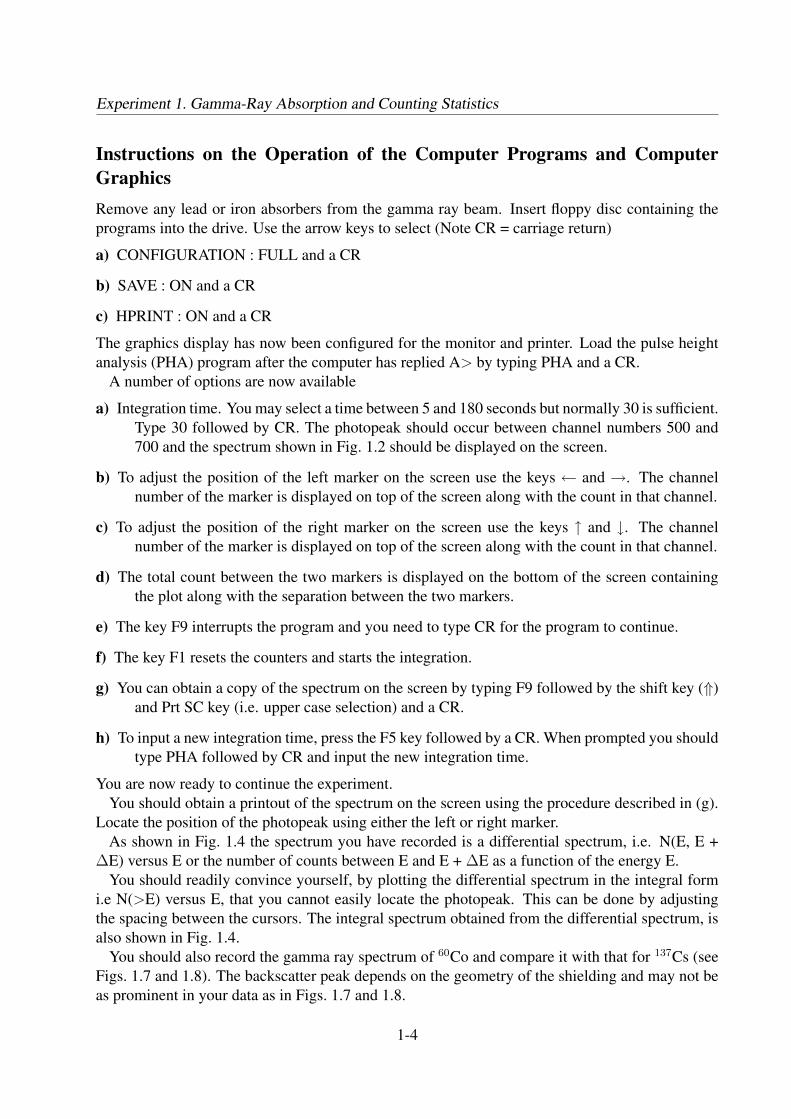
Instructions on the Operation of the Computer Programs and ComputerGraphicsRemove any lead or iron absorbers from the gamma ray beam. Insert floppy disc containing theprograms into the drive. Use the arrow keys to select (Note CR = carriage return)
a) CONFIGURATION : FULL and a CR
b) SAVE : ON and a CR
c) HPRINT : ON and a CR
The graphics display has now been configured for the monitor and printer. Load the pulse heightanalysis (PHA) program after the computer has replied A> by typing PHA and a CR.
A number of options are now available
a) Integration time. You may select a time between 5 and 180 seconds but normally 30 is sufficient.Type 30 followed by CR. The photopeak should occur between channel numbers 500 and700 and the spectrum shown in Fig. 1.2 should be displayed on the screen.
b) To adjust the position of the left marker on the screen use the keys ← and →. The channelnumber of the marker is displayed on top of the screen along with the count in that channel.
c) To adjust the position of the right marker on the screen use the keys ↑ and ↓. The channelnumber of the marker is displayed on top of the screen along with the count in that channel.
d) The total count between the two markers is displayed on the bottom of the screen containingthe plot along with the separation between the two markers.
e) The key F9 interrupts the program and you need to type CR for the program to continue.
f) The key F1 resets the counters and starts the integration.
g) You can obtain a copy of the spectrum on the screen by typing F9 followed by the shift key (⇑)and Prt SC key (i.e. upper case selection) and a CR.
h) To input a new integration time, press the F5 key followed by a CR. When prompted you shouldtype PHA followed by CR and input the new integration time.
You are now ready to continue the experiment.You should obtain a printout of the spectrum on the screen using the procedure described in (g).
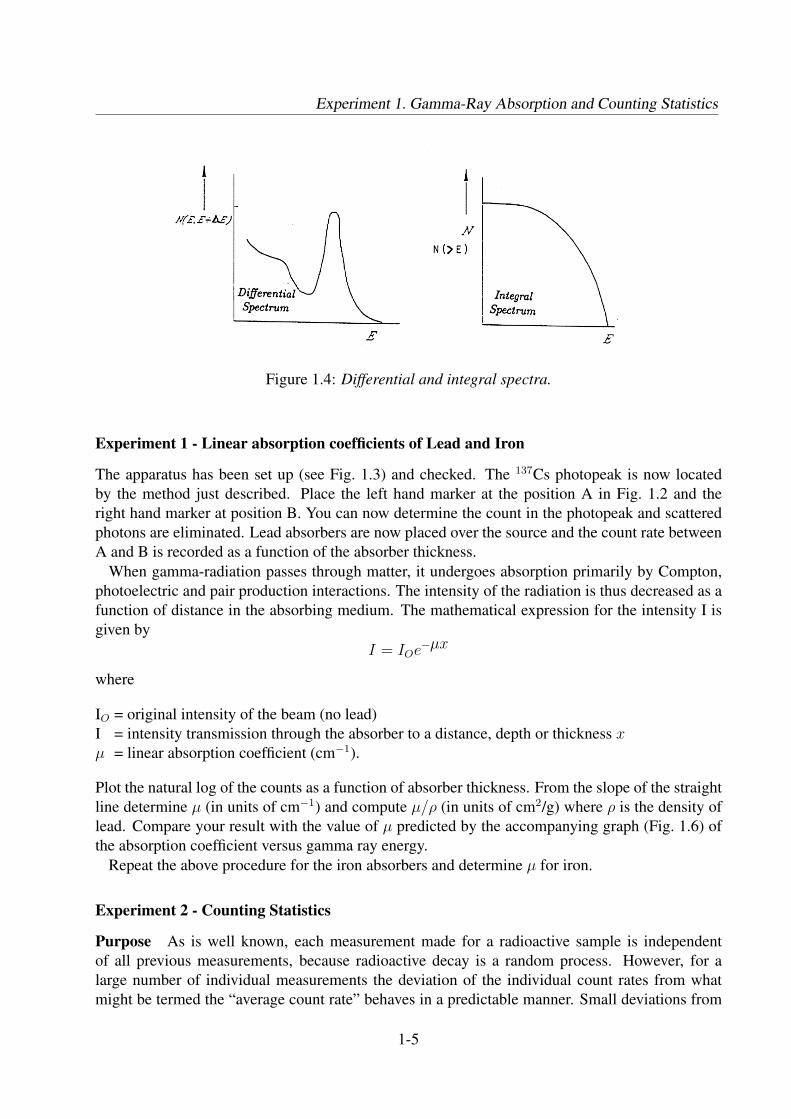
Locate the position of the photopeak using either the left or right marker.As shown in Fig. 1.4 the spectrum you have recorded is a differential spectrum, i.e. N(E, E +
∆E) versus E or the number of counts between E and E + ∆E as a function of the energy E.You should readily convince yourself, by plotting the differential spectrum in the integral form
i.e N(>E) versus E, that you cannot easily locate the photopeak. This can be done by adjustingthe spacing between the cursors. The integral spectrum obtained from the differential spectrum, isalso shown in Fig. 1.4.
You should also record the gamma ray spectrum of 60Co and compare it with that for 137Cs (seeFigs. 1.7 and 1.8). The backscatter peak depends on the geometry of the shielding and may not beas prominent in your data as in Figs. 1.7 and 1.8.
1-4
Experiment 1. Gamma-Ray Absorption and Counting Statistics
Figure 1.4: Differential and integral spectra.
Experiment 1 - Linear absorption coefficients of Lead and Iron
The apparatus has been set up (see Fig. 1.3) and checked. The 137Cs photopeak is now locatedby the method just described. Place the left hand marker at the position A in Fig. 1.2 and theright hand marker at position B. You can now determine the count in the photopeak and scatteredphotons are eliminated. Lead absorbers are now placed over the source and the count rate betweenA and B is recorded as a function of the absorber thickness.
When gamma-radiation passes through matter, it undergoes absorption primarily by Compton,photoelectric and pair production interactions. The intensity of the radiation is thus decreased as afunction of distance in the absorbing medium. The mathematical expression for the intensity I isgiven by
I = IOe−µx
where
IO = original intensity of the beam (no lead)I = intensity transmission through the absorber to a distance, depth or thickness xµ = linear absorption coefficient (cm−1).
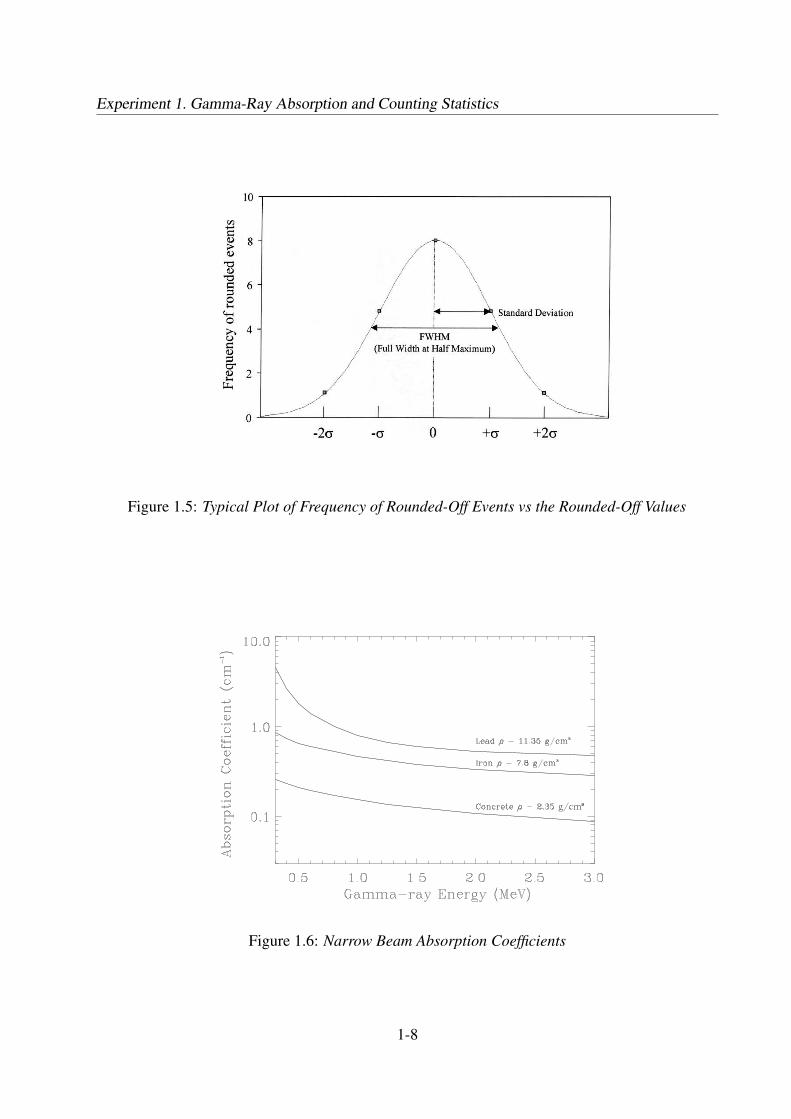
Plot the natural log of the counts as a function of absorber thickness. From the slope of the straightline determine µ (in units of cm−1) and compute µ/ρ (in units of cm2/g) where ρ is the density oflead. Compare your result with the value of µ predicted by the accompanying graph (Fig. 1.6) ofthe absorption coefficient versus gamma ray energy.
Repeat the above procedure for the iron absorbers and determine µ for iron.
Experiment 2 - Counting Statistics
Purpose As is well known, each measurement made for a radioactive sample is independentof all previous measurements, because radioactive decay is a random process. However, for alarge number of individual measurements the deviation of the individual count rates from whatmight be termed the “average count rate” behaves in a predictable manner. Small deviations from
1-5
Experiment 1. Gamma-Ray Absorption and Counting Statistics
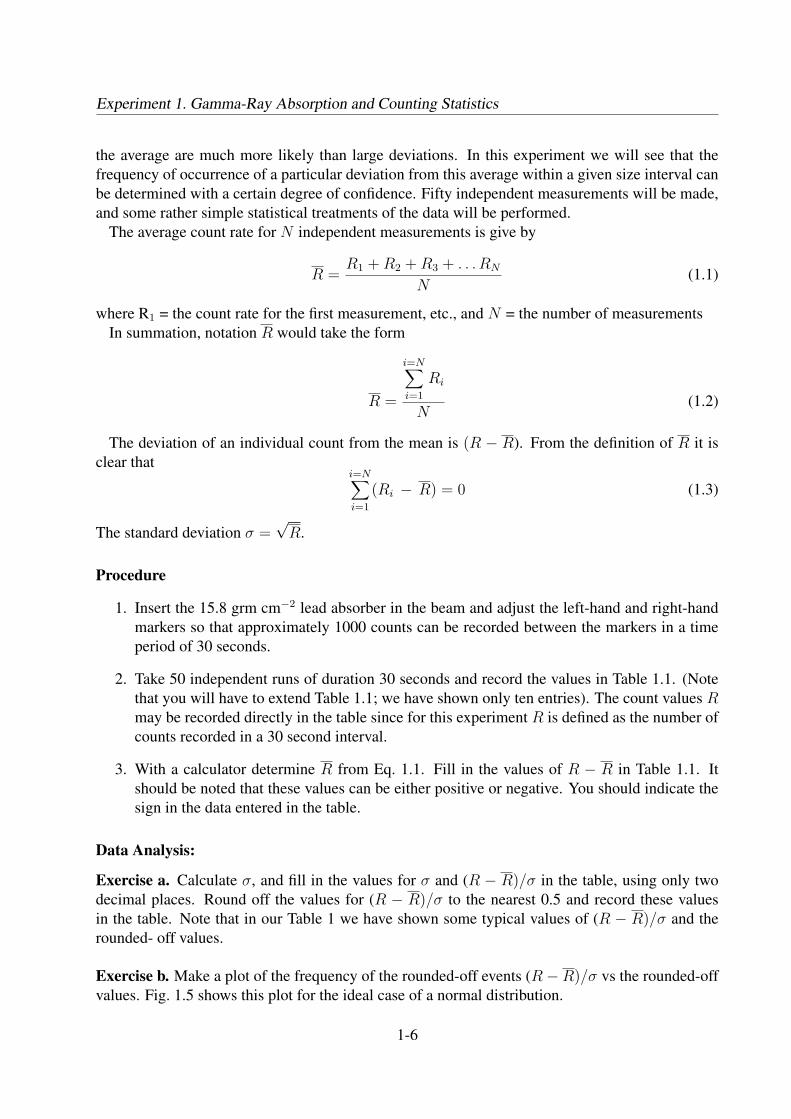
the average are much more likely than large deviations. In this experiment we will see that thefrequency of occurrence of a particular deviation from this average within a given size interval canbe determined with a certain degree of confidence. Fifty independent measurements will be made,and some rather simple statistical treatments of the data will be performed.
The average count rate for N independent measurements is give by
R =R1 + R2 + R3 + . . . RN
N(1.1)
where R1 = the count rate for the first measurement, etc., and N = the number of measurementsIn summation, notation R would take the form
R =
i=N∑
i=1
Ri
N(1.2)
The deviation of an individual count from the mean is (R − R). From the definition of R it isclear that
i=N∑
i=1
(Ri − R) = 0 (1.3)
The standard deviation σ =√
R.
Procedure
1. Insert the 15.8 grm cm−2 lead absorber in the beam and adjust the left-hand and right-handmarkers so that approximately 1000 counts can be recorded between the markers in a timeperiod of 30 seconds.
2. Take 50 independent runs of duration 30 seconds and record the values in Table 1.1. (Notethat you will have to extend Table 1.1; we have shown only ten entries). The count values Rmay be recorded directly in the table since for this experiment R is defined as the number ofcounts recorded in a 30 second interval.
3. With a calculator determine R from Eq. 1.1. Fill in the values of R − R in Table 1.1. Itshould be noted that these values can be either positive or negative. You should indicate thesign in the data entered in the table.
Data Analysis:
Exercise a. Calculate σ, and fill in the values for σ and (R − R)/σ in the table, using only twodecimal places. Round off the values for (R − R)/σ to the nearest 0.5 and record these valuesin the table. Note that in our Table 1 we have shown some typical values of (R − R)/σ and therounded- off values.
Exercise b. Make a plot of the frequency of the rounded-off events (R−R)/σ vs the rounded-offvalues. Fig. 1.5 shows this plot for the ideal case of a normal distribution.
1-6
Experiment 1. Gamma-Ray Absorption and Counting Statistics
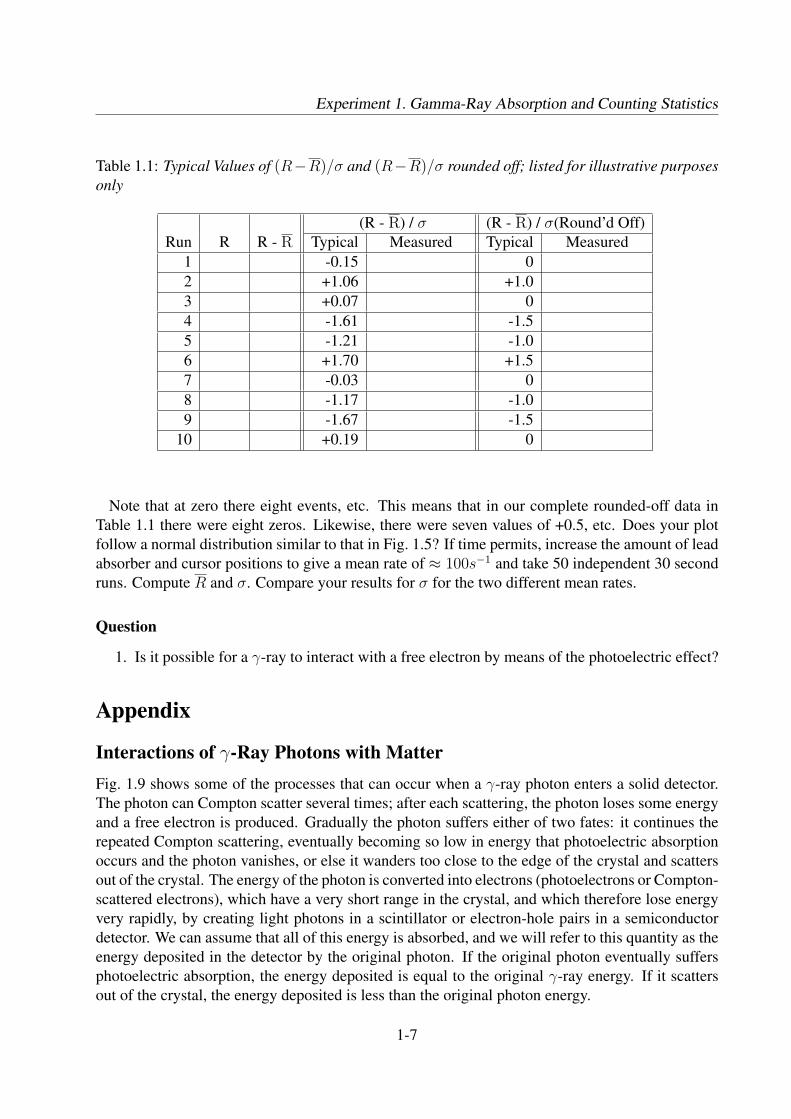
Table 1.1: Typical Values of (R−R)/σ and (R−R)/σ rounded off; listed for illustrative purposesonly
(R - R) / σ (R - R) / σ(Round’d Off)Run R R - R Typical Measured Typical Measured
1 -0.15 02 +1.06 +1.03 +0.07 04 -1.61 -1.55 -1.21 -1.06 +1.70 +1.57 -0.03 08 -1.17 -1.09 -1.67 -1.5
10 +0.19 0
Note that at zero there eight events, etc. This means that in our complete rounded-off data inTable 1.1 there were eight zeros. Likewise, there were seven values of +0.5, etc. Does your plotfollow a normal distribution similar to that in Fig. 1.5? If time permits, increase the amount of leadabsorber and cursor positions to give a mean rate of ≈ 100s−1 and take 50 independent 30 secondruns. Compute R and σ. Compare your results for σ for the two different mean rates.
Question
1. Is it possible for a γ-ray to interact with a free electron by means of the photoelectric effect?
Appendix
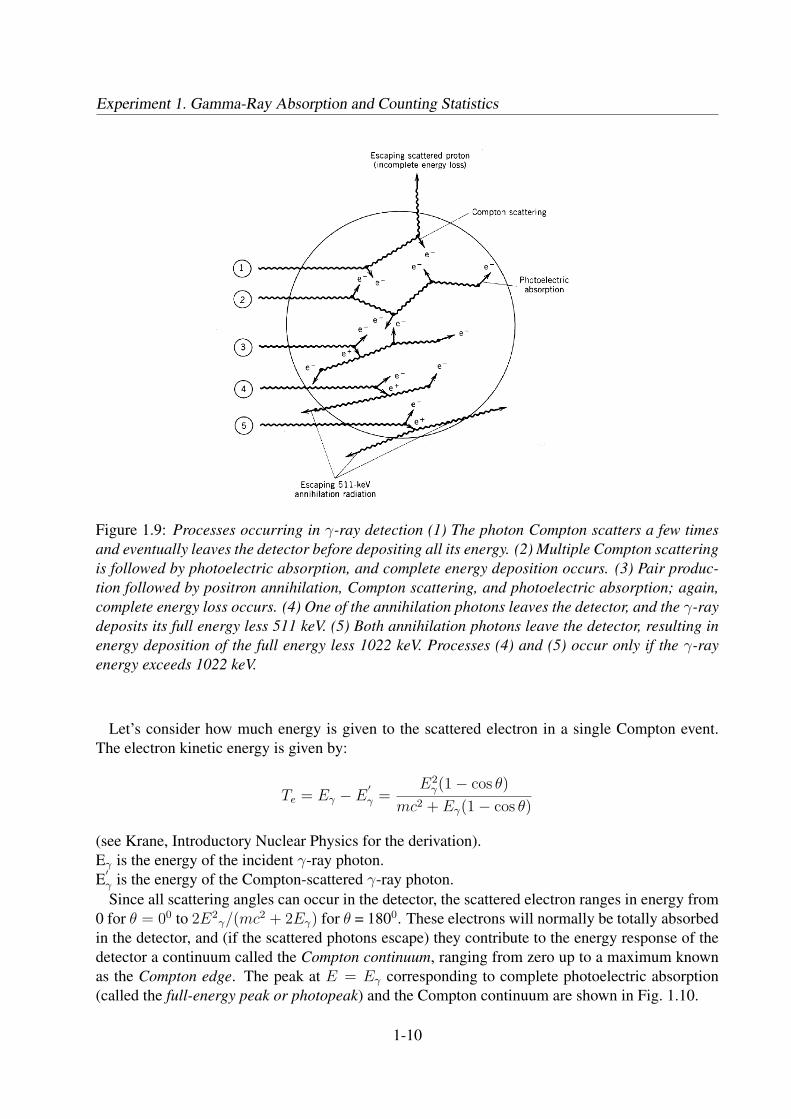
Interactions of γ-Ray Photons with MatterFig. 1.9 shows some of the processes that can occur when a γ-ray photon enters a solid detector.The photon can Compton scatter several times; after each scattering, the photon loses some energyand a free electron is produced. Gradually the photon suffers either of two fates: it continues therepeated Compton scattering, eventually becoming so low in energy that photoelectric absorptionoccurs and the photon vanishes, or else it wanders too close to the edge of the crystal and scattersout of the crystal. The energy of the photon is converted into electrons (photoelectrons or Compton-scattered electrons), which have a very short range in the crystal, and which therefore lose energyvery rapidly, by creating light photons in a scintillator or electron-hole pairs in a semiconductordetector. We can assume that all of this energy is absorbed, and we will refer to this quantity as theenergy deposited in the detector by the original photon. If the original photon eventually suffersphotoelectric absorption, the energy deposited is equal to the original γ-ray energy. If it scattersout of the crystal, the energy deposited is less than the original photon energy.
1-7
Experiment 1. Gamma-Ray Absorption and Counting Statistics
Figure 1.5: Typical Plot of Frequency of Rounded-Off Events vs the Rounded-Off Values
Figure 1.6: Narrow Beam Absorption Coefficients
1-8
Experiment 1. Gamma-Ray Absorption and Counting Statistics
Figure 1.7: NaI(Tl) Spectrum for 137Cs
Figure 1.8: NaI(Tl) Spectrum for 60Co
1-9
Experiment 1. Gamma-Ray Absorption and Counting Statistics
Figure 1.9: Processes occurring in γ-ray detection (1) The photon Compton scatters a few timesand eventually leaves the detector before depositing all its energy. (2) Multiple Compton scatteringis followed by photoelectric absorption, and complete energy deposition occurs. (3) Pair produc-tion followed by positron annihilation, Compton scattering, and photoelectric absorption; again,complete energy loss occurs. (4) One of the annihilation photons leaves the detector, and the γ-raydeposits its full energy less 511 keV. (5) Both annihilation photons leave the detector, resulting inenergy deposition of the full energy less 1022 keV. Processes (4) and (5) occur only if the γ-rayenergy exceeds 1022 keV.
Let’s consider how much energy is given to the scattered electron in a single Compton event.The electron kinetic energy is given by:
Te = Eγ − E′γ =
E2γ(1− cos θ)
mc2 + Eγ(1− cos θ)
(see Krane, Introductory Nuclear Physics for the derivation).Eγ is the energy of the incident γ-ray photon.E′
γ is the energy of the Compton-scattered γ-ray photon.Since all scattering angles can occur in the detector, the scattered electron ranges in energy from
0 for θ = 00 to 2E2γ/(mc2 + 2Eγ) for θ = 1800. These electrons will normally be totally absorbed
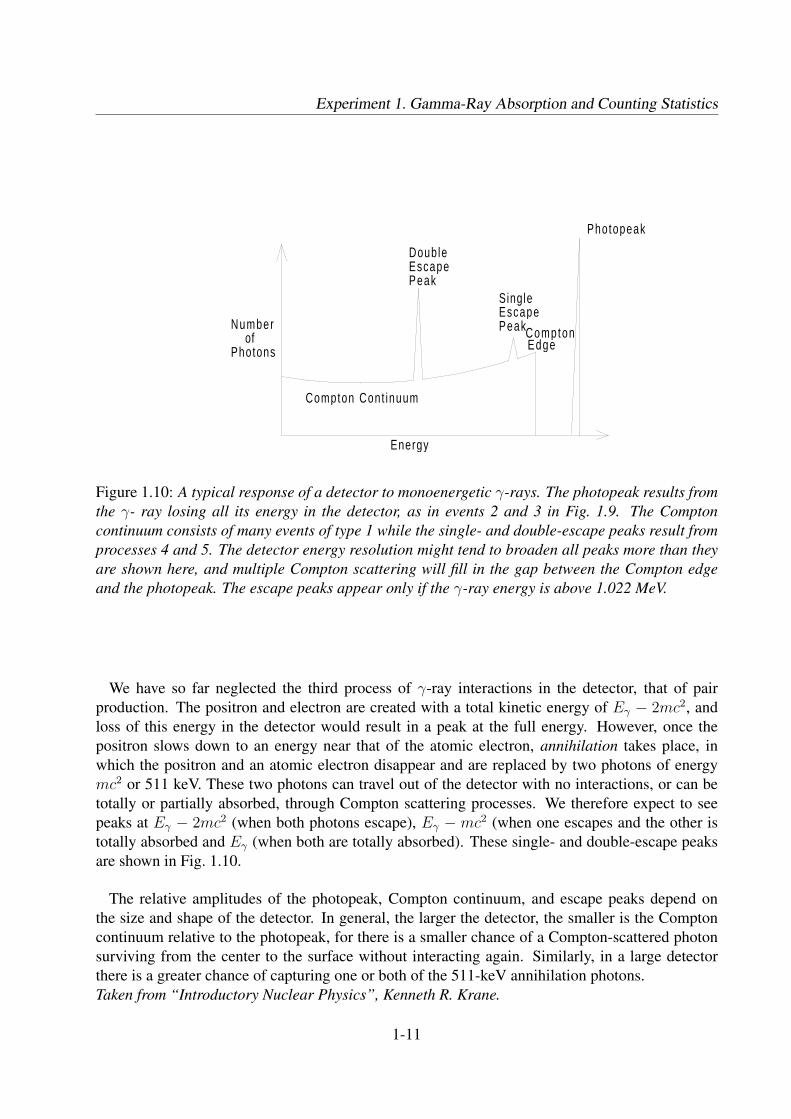
in the detector, and (if the scattered photons escape) they contribute to the energy response of thedetector a continuum called the Compton continuum, ranging from zero up to a maximum knownas the Compton edge. The peak at E = Eγ corresponding to complete photoelectric absorption(called the full-energy peak or photopeak) and the Compton continuum are shown in Fig. 1.10.
1-10
Experiment 1. Gamma-Ray Absorption and Counting Statistics
Energy
Compton Cont inuum
Number
Photons of Edge
Compton
EscapePeak
DoubleEscapePeak
Single
Photopeak
Figure 1.10: A typical response of a detector to monoenergetic γ-rays. The photopeak results fromthe γ- ray losing all its energy in the detector, as in events 2 and 3 in Fig. 1.9. The Comptoncontinuum consists of many events of type 1 while the single- and double-escape peaks result fromprocesses 4 and 5. The detector energy resolution might tend to broaden all peaks more than theyare shown here, and multiple Compton scattering will fill in the gap between the Compton edgeand the photopeak. The escape peaks appear only if the γ-ray energy is above 1.022 MeV.
We have so far neglected the third process of γ-ray interactions in the detector, that of pairproduction. The positron and electron are created with a total kinetic energy of Eγ − 2mc2, andloss of this energy in the detector would result in a peak at the full energy. However, once thepositron slows down to an energy near that of the atomic electron, annihilation takes place, inwhich the positron and an atomic electron disappear and are replaced by two photons of energymc2 or 511 keV. These two photons can travel out of the detector with no interactions, or can betotally or partially absorbed, through Compton scattering processes. We therefore expect to seepeaks at Eγ − 2mc2 (when both photons escape), Eγ − mc2 (when one escapes and the other istotally absorbed and Eγ (when both are totally absorbed). These single- and double-escape peaksare shown in Fig. 1.10.
The relative amplitudes of the photopeak, Compton continuum, and escape peaks depend onthe size and shape of the detector. In general, the larger the detector, the smaller is the Comptoncontinuum relative to the photopeak, for there is a smaller chance of a Compton-scattered photonsurviving from the center to the surface without interacting again. Similarly, in a large detectorthere is a greater chance of capturing one or both of the 511-keV annihilation photons.Taken from “Introductory Nuclear Physics”, Kenneth R. Krane.
1-11
Experiment 1. Gamma-Ray Absorption and Counting Statistics
Reference
1. ‘Introductory Nuclear Physics’, Kenneth R. Krane
WWW :
• Radiation Physics and Radiocarbon Research Lab in UCD - http://www.ucd.ie/ radphys
• Gamma-ray Astronomy - http://imagine.gsfc.nasa.gov/docs/introduction/gamma-information.html
• European Gamm-Ray Mission ‘INTEGRAL’ - http://astro.estec.esa.nl/Integral
1-12