Embed Size (px)
Citation preview

1
GAS CELLS IN BREAD DOUGH
A thesis submitted to The University of Manchester
for the degree of Doctor of Philosophy
in the School of Chemical Engineering and Analytical Science
2013
Linda Trinh
School of Chemical Engineering and Analytical Science
2
Contents
Contents ......................................................................................................2
List of Tables ................................................................................................5
List of Figures ...............................................................................................6
Nomenclature ............................................................................................. 12
Abbreviations ........................................................................................... 12
Notation ................................................................................................. 12
Abstract..................................................................................................... 14
Declaration ................................................................................................. 16
Copyright Statement ..................................................................................... 16
Acknowledgements ....................................................................................... 17
Chapter 1 - Introduction: Understanding bread dough aeration ..................................... 18
Chapter 2 - Bread: Its history, significance and manufacture ....................................... 23
2.1 An introduction to bread ........................................................................... 23
2.1.1 The significance of bread ..................................................................... 23
2.1.2 Industrial breadmaking - the Chorleywood Bread Process .............................. 25
2.1.3 Breadmaking ingredients ...................................................................... 27
2.2 Aeration throughout breadmaking ................................................................ 33
2.2.1 Entrainment and disentrainment of gas .................................................... 33
2.2.2 Parameters during mixing affecting cells in bread dough ............................... 36
2.2.3 Measuring aeration throughout breadmaking .............................................. 39
2.2.4 Quantifying aeration using a population balance model ................................ 45
2.3 Summary of bread’s history, significance and manufacture ................................. 48
Chapter 3 - Experimental methodologies ................................................................ 49
3.1 Outline ................................................................................................. 49
3.2 Materials used ........................................................................................ 49
3.3 Equipment used ...................................................................................... 50
3.3.1 Tweedy 1 mixer ................................................................................. 52
3.3.2 Nikon Metris 225/320kV X-ray CT ............................................................ 54
3.3.3 Farinograph ...................................................................................... 56
3.3.4 Micro-Dough lab ................................................................................. 56
3.3.5 C-Cell ............................................................................................. 56
3.3.6 Texture Analyser ................................................................................ 57
3.4 Analytical techniques used ......................................................................... 58
3.4.1 Determining flour water absorption in the Farinograph ................................. 58
3.4.2 Determining flour water absorption on the Micro-Dough Lab .......................... 58
3.4.3 Measuring dough density ...................................................................... 58
3.4.4 Determining the gas free dough density .................................................... 60
3.4.5 Determining dough voidage ................................................................... 60

3
3.4.6 Specific volume and density of bread ....................................................... 61
3.5 Flour and dough characterisation ................................................................. 61
3.5.1 Flour water absorption ........................................................................ 61
3.5.2 Mixing at constant pressure: gas free dough density ..................................... 63
3.5.3 Dough voidage ................................................................................... 64
3.5.4 Characterisation summary .................................................................... 64
3.6 Additional methodologies ........................................................................... 65
3.6.1 Breadmaking ..................................................................................... 65
3.6.2 X-ray imaging .................................................................................... 65
Chapter 4 - Assessment of the effect of sugar on dough properties during breadmaking
processes ...................................................................................................... 67
4.1 Introduction ........................................................................................... 67
4.2 Interaction of sugar and starch-water mixture ................................................. 67
4.2.1 Method: Interaction of sugar and starch-water mixture ................................. 68
4.2.1 Results and discussion: Interaction of sugar and starch-water mixture .............. 68
4.3 Gas free dough density and voidage of different sugar content doughs ................... 70
4.3.1 Method: Gas free dough density and voidage of different sugar content doughs ... 70
4.3.2 Results: Gas free dough density and voidage of different sugar content doughs ... 71
4.4 Mixing different sugar content doughs in the Farinograph ................................... 74
4.4.1 Method: Mixing different sugar content doughs in the Farinograph ................... 74
4.4.2 Results and discussion: Mixing different sugar content doughs in the Farinograph 76
4.5 The effect of sugar on torque during mixing .................................................... 80
4.5.1 Method: The effect of sugar on torque during mixing ................................... 81
4.5.2 Results and discussion: The effect of sugar on torque during mixing ................. 83
4.6 The effect of mixing speed on aeration of sugared doughs .................................. 86
4.6.1 Method: The effect of mixing speed on aeration of sugared doughs .................. 86
4.6.2 Results and discussion: The effect of mixing speed on aeration of sugared doughs 86
4.7 The effect of sugar on dough stickiness.......................................................... 87
4.7.1 Method: The effect of sugar on dough stickiness ......................................... 87
4.7.2 Results and discussion: The effect of sugar on dough stickiness ....................... 89
4.8 The effect of sugar on dough uniaxial extension ............................................... 91
4.8.1 Method: The effect of sugar on dough uniaxial extension .............................. 91
4.8.2 Results and discussion: The effect of sugar on dough uniaxial extension ............ 94
4.9 ESEM of different sugar content doughs ......................................................... 98
4.9.1 Method: ESEM of different sugar content doughs ......................................... 98
4.9.2 Results and discussion: ESEM of different sugar content doughs ...................... 99
4.10 The effect of sugar on the dynamic dough density during proving ....................... 102
4.10.1 Method: The effect of sugar on the dynamic dough density during proving ....... 102
4.10.2 Results and discussion: The effect of sugar on the dynamic dough density during
proving .................................................................................................. 103

4
4.11 The effect of sugar on finished bread ......................................................... 107
4.11.1 Method: The effect of sugar on finished bread ......................................... 107
4.11.2 Results and discussion: The effect of sugar on finished bread ....................... 109
4.12 Summary ............................................................................................ 124
Chapter 5 - Aeration in bread dough with and without sugar ....................................... 126
5.1 Introduction .......................................................................................... 126
5.2 Aeration of bread dough with and without sugar methodology ............................. 126
5.2.1 Experimental methodology .................................................................. 127
5.2.2 Pressure step change modelling methodology ........................................... 129
5.3 Results and discussion .............................................................................. 129
5.3.1 Experimental results .......................................................................... 130
5.3.2 Pressure step change modelling results ................................................... 140
5.4 Summary .............................................................................................. 143
Chapter 6 - X-ray computerised tomography of bread dough during mixing and proving ...... 145
6.1 Introduction .......................................................................................... 145
6.2 X-ray CT of non-yeasted dough with and without sugar ..................................... 146
6.2.1 Method: X-ray CT of dough with and without sugar ..................................... 146
6.2.2 Results and discussion: X-ray CT of dough with and without sugar ................... 147
6.3 X-ray CT of non-yeasted non-sugar containing bread dough throughout mixing with a
pressure step change .................................................................................... 153
6.3.1 Method: X-ray CT of bread dough without sugar throughout mixing with a pressure
step change ............................................................................................ 153
6.3.2 Results and discussion: X-ray CT of bread dough without sugar throughout mixing
with a pressure step change ........................................................................ 154
6.4 X-ray CT of bread dough during proving ........................................................ 164
6.4.1 Method: X-ray CT of bread dough during proving ........................................ 165
6.4.2 Results and discussion: X-ray CT of bread dough during proving ..................... 167
6.5 Summary .............................................................................................. 185
Chapter 7 - Conclusions and further work .............................................................. 187
7.1 Conclusions ........................................................................................... 187
7.2 Further work ......................................................................................... 188
Chapter 8 - References .................................................................................... 191
Chapter 9 - Appendices .................................................................................... 201

5
List of Tables
Table 2.1 Techniques used for imaging cell size distribution ...................................... 41 Table 3.1 Experimental materials and their procurement sites ................................... 49 Table 3.2 Experimental equipment, their makes and information on use of the equipment 51 Table 3.3 Flours and their corresponding water absorption values. These were determined
from the Micro-Dough Lab, Farinograph and packaging. The final column gives the water
absorption value used in experiments within this thesis, based on these measurements ..... 62 Table 3.4 Formulation used to determine the gas free dough density of a dough made from
flour a.......................................................................................................... 63 Table 3.5 Formulation used to determine the gas free dough density of a dough made from
flour c .......................................................................................................... 63 Table 3.6 Characterisation of flours a and c .......................................................... 64 Table 4.1 Dough formulations used to assess the voidage and gas free dough density of
different sugar content strong flour doughs. .......................................................... 70 Table 4.2 Dough formulations used to assess the voidage and gas free dough density of
different sugar content weak flour doughs ............................................................. 71 Table 4.3 Strong flour dough formulations used in the Farinograph ............................. 76 Table 4.4 Weak flour dough formulations used in the Farinograph ............................... 76 Table 4.5 Dough formulations used for torque measurements during mixing in the Tweedy 1
mixer ........................................................................................................... 82 Table 4.6 Dough formulations and the mixing speeds used to assess aeration of different
sugar content doughs at different mixing speeds ..................................................... 86 Table 4.7 Strong flour dough formulations used to assess the effect of sugar on dough
adhesiveness .................................................................................................. 87 Table 4.8 Texture analyser settings used for dough adhesiveness test .......................... 88 Table 4.9 Strong flour dough formulations used for uniaxial extension of dough ............. 91 Table 4.10 Texture analyser settings used for dough uniaxial extension tests ................. 93 Table 4.11 Strong flour dough formulations used for ESEM experiments ........................ 98 Table 4.12 Strong flour dough formulations used to observe the dynamic dough density
during proving at 38ºC ..................................................................................... 102 Table 4.13 Weak flour dough formulations used to observe the dynamic dough density
during proving at 38ºC ..................................................................................... 103 Table 4.14 Formulations of baked bread loaves ..................................................... 107 Table 5.1 Strong flour dough formulations used to derive entrainment and disentrainment
values from a population balance model on the aeration of bread dough ...................... 127 Table 5.2 Weak flour dough formulations used to derive entrainment and disentrainment
values from a population balance model on the aeration of bread dough ...................... 127 Table 5.3 Weak flour dough formulations used to derive entrainment and disentrainment
values from a population balance model on the aeration of bread dough ...................... 129 Table 5.4 RMSEs for the no breakup population balance fitted to the experimental pressure
step change data ............................................................................................ 140 Table 6.1 Dough formulations used for comparison of 0% and 15% sugar dough via X-ray CT
................................................................................................................. 146 Table 6.2 Formulations and mixing times used for comparison of pressure-vacuum and
constant pressure mixed doughs via X-ray CT ......................................................... 154 Table 6.3 Sample volumes and resolutions for X-ray scans ........................................ 154 Table 6.4 Dough formulation used for X-ray CT of bread dough proving ....................... 165 Table 6.5 Percentage error at different thresholding levels throughout dough proving .... 169

6
List of Figures
Figure 1.1 A selection of some point of difference UK bread products. Products illustrated
include Kingsmill 50:50, for those who want the goodness of wholegrain without its texture,
Hovis British Farmers Loaf, a loaf made with 100% British wheat, Hovis seed sensation,
containing seven seed varieties, Kingsmill Little Big Loaf, full sized bread slices but in a
smaller pack size and Warburtons Sandwich thins, who want less bread in their sandwiches.
.................................................................................................................. 18 Figure 1.2 A selection of bakery snacks available in UK supermarkets. Illustrated include
traditionally seasonal products such as hot cross buns, products released for a specific event,
such as the red nose day doughnuts, world breads such as croissants and brioche, and
traditional UK bakery snacks such as scones and pancakes to name a few. ...................... 19 Figure 2.1 The molecular structure of the dissacharide, sucrose. Sucrose consists of the two
monosaccharides, α-D-glucose and α-D-fructose, linked by a glycosidic bond. .................. 32 Figure 2.2 Unpublished voidage measurements obtained from X-ray CT. The results show the
voidage measured from X-ray CT and the double cup method, illustrating the large disparity
between the measurements. .............................................................................. 45 Figure 3.1 Inside the Tweedy mixer ..................................................................... 52 Figure 3.2 Outside the Tweedy 1 mixer with mixer lid in position ................................ 52 Figure 3.3 Tweedy 1 mixer set up. This shows some of the equipment used alongside the
Tweedy mixer to control dough mixing and record mixing parameters ........................... 53 Figure 3.4 Nikon Metris 225/320kV X-ray CT. The source, manipulator stage and detector
positions can be adjusted to optimise scan settings .................................................. 55 Figure 3.5 Nikon Metris 225/320kV X-ray CT set up. This shows the equipment housed in a
customised bay, whilst control of the equipment is located outside the bay for safety
purposes. ...................................................................................................... 55 Figure 3.6 Texture analyser. A Stable Microsystems instrument used within the food industry
to quantify the texture and physical properties of products. A range of attachments to the
arm and testing bed can be used depending on the property being measured. ................. 57 Figure 3.7 (a) Double cup system, used to measure the dough density through calculations
involving weight measurements of dough in a fluid and air (b) Double cup ..................... 59 Figure 3.8 Protein content vs. water absorption values of flours. 78 values flours are
illustrated, including 75 flours in literature and 3 flours used throughout this thesis. ....... 62 Figure 3.9 Density of doughs made from flour a and c, following mixing at a range of
headspace pressures for 180 s. The data points are the mean of six measurements from an
identical batch of dough. Error bars have been omitted as they are smaller than the markers
used. Linear regression trend lines are shown. ........................................................ 63 Figure 3.10 Gas free dough density of flours from literature and flours a and c............... 64 Figure 4.1 Density of different sugar content strong flour doughs following 180 s of mixing
at different mixer headspace pressures. The data points illustrated are the mean of six
measurements. Error bars have been omitted as they are smaller than the symbols used.
Linear regression lines are shown. ....................................................................... 72 Figure 4.2 Density of different sugar content weak flour doughs following 180 s of mixing at
different mixer headspace pressures. The data points illustrated are the mean of six
measurements. Error bars have been omitted as they are smaller than the symbols used.
Linear regression lines are shown. ....................................................................... 72 Figure 4.3 Voidage of different sugar content strong flour doughs, following 180 s of mixing
at mixer headspace pressures ranging from 0.25 bara to 2.5 bara................................. 73 Figure 4.4 Voidage of different sugar content weak flour doughs, following 180 s of mixing
at mixer headspace pressures ranging from 0.25 bara to 2.5 bara................................. 74 Figure 4.5 A typical Farinogram with significant features annotated ............................ 75 Figure 4.6 (a) 0% sugar strong dough Farinogram (b), 0% sugar weak dough Farinogram ..... 79 Figure 4.7 (a) 5% sugar strong dough Farinogram (b), 5% sugar weak flour dough Farinogram
.................................................................................................................. 79

7
Figure 4.8 (a) 10% sugar strong dough Farinogram (b), 10% sugar weak dough Farinogram .. 79 Figure 4.9 (a) 15% sugar strong dough Farinogram (b), 15% sugar weak dough Farinogram .. 79 Figure 4.10 Mixing time to Farinogram peaks in different sugar content doughs .............. 80 Figure 4.11 Dough consistency at significant times indicated by the Farinogram .............. 80 Figure 4.12 Torque of different sugar content doughs over mixing time whilst mixing at
atmospheric pressure. The torques presented are based on a moving mean of 19 s, taken
from the mean of three experiments. ................................................................... 83 Figure 4.13 Time to reach peak torque in different sugar content doughs. The data points
illustrated are the mean of three measurements. .................................................... 84 Figure 4.14 Peak torque in different sugar content doughs whilst mixing at atmospheric
pressure for 240 s. The data points illustrated are the mean of three measurements. The
error bars presented are one standard deviation on either side of the mean. .................. 84 Figure 4.15 End torque in different sugar content doughs, following mixing at atmospheric
pressure for 240 s. The data points illustrated are the mean of three measurements. The
error bars presented are one standard deviation on either side of the mean. .................. 84 Figure 4.16 Work done at end torque in different sugar content doughs, following mixing at
atmospheric pressure for 240 s. The data points illustrated are the mean of three
measurements. The error bars presented are one standard deviation either side of the mean.
.................................................................................................................. 85 Figure 4.17 Mean mixing speed during 4 minute mixing sessions of different sugar content
doughs. Each data point is an average of 684 data points from three batches of dough. The
error bars presented are one standard deviation either side of the mean. ...................... 85 Figure 4.18 The density of 0% and 15% sugar strong flour dough mixed at different speeds
under atmospheric pressure for the 180 s. The data points presented are the mean of six
measurements from a single dough. Error bars have been omitted as they are smaller than
the markers used. Linear regression trend lines are shown. ........................................ 87 Figure 4.19 Set up for rolling of the dough to obtain the desired thickness .................... 88 Figure 4.20 Texture analyser probing dough sample to assess adhesiveness .................... 88 Figure 4.21 Time and force required for application of 0.98 N of force with a probe to
different sugar content doughs and then to return the probe to starting position. The data
points illustrated are the mean of measurements from three samples from one dough batch.
.................................................................................................................. 90 Figure 4.22 Penetration depth of a probe when applying 0.98 N of force to different sugar
content doughs and distance travelled by the probe on returning to the starting position. The
data points illustrated are the mean of measurements from three samples from one dough
batch. .......................................................................................................... 90 Figure 4.23 Distance travelled by a probe to apply 0.98 N of force to different sugar content
doughs. Each data point illustrated is the mean of three measurements from one dough
batch ........................................................................................................... 90 Figure 4.24 Two piece cylindrical mould used for shaping dough for uniaxial dough extension
experiments .................................................................................................. 92 Figure 4.25 Dough sample prepared for uniaxial extension system. Due to the similarity in
colour of the dough and background, the dough has been marked out in the image. The areas
where cyanoacrylate was applied is highlighted in yellow. ......................................... 92 Figure 4.26 Uniaxial extension system .................................................................. 93 Figure 4.27 Uniaxial extension system in action ...................................................... 93 Figure 4.28 Force involved with time during uniaxial extension of a dough piece at speeds of
6 mms-1. Each point illustrated is a moving average of 60 points. ................................. 95 Figure 4.29 Distances involved with time during the extension of a dough piece at speeds of
6mms-1. Each point illustrated is a moving average of 60 points. .................................. 95 Figure 4.30 Force required to snap different sugar content dough strips during uniaxial
extension of the dough at a speed of 6 mm s-1. The data points illustrated are the mean of
six measurements. The error bars shown are one standard deviation either side of the mean.
.................................................................................................................. 96

8
Figure 4.31 Distance different sugar content dough strips were extended during uniaxial
extension at a speed of 6 mm s-1 before snapping. The data points illustrated are the mean
of six measurements. The error bars shown are one standard deviation either side of the
mean. .......................................................................................................... 96 Figure 4.32 The relationship between the force applied to a dough strip to cause it to snap
and the distance the dough strip is extended before snapping, during uniaxial dough
extension tests in different sugar content doughs .................................................... 97 Figure 4.33 The engineering strain at snapping point on different sugar content doughs
during uniaxial extension tests. The data points illustrated are the mean of six
measurements. The error bars shown are one standard deviation either side of the mean. . 97 Figure 4.34 The stress at snapping point on different sugar content dough strips as they snap
during uniaxial extension tests. The data points illustrated are the mean of six
measurements. The error bars shown are one standard deviation either side of the mean. . 98 Figure 4.35 ESEM micrograph of 0% sugar dough mixed for 230 s with a step change from 1
bara to 0.5 bara at 110 s (a) at 600 x magnification (b) at 1200 x magnification.............. 100 Figure 4.36 ESEM micrograph of 15% sugar dough mixed for 230 s with a step change from 1
bara to 0.5 bara at 110 s (a) at 600 x magnification (b) at 1200 x magnification.............. 101 Figure 4.37 Change in density of different sugar content (a)strong doughs (b) weak doughs,
during proving at 38ºC. The results presented are the mean of four data measurements taken
from two batches of dough. The error bars have been omitted for clarity. .................... 105 Figure 4.38 Proving time required for different sugar content strong and weak flour doughs,
to reach their minimum density. The data points are the mean of four measurements, taken
from two batches of dough. Error bars are one standard deviation either side of the mean.
................................................................................................................. 105 Figure 4.39 Minimum density reached by different sugar content (a) strong doughs (b) weak
doughs when proving at 38ºC. The data points are the mean of four measurements, taken
from two batches of dough. Error bars have been omitted for clarity, as they were smaller
than the markers used ..................................................................................... 106 Figure 4.40 The percentage weight loss of different sugar content loaves as a result of
baking. Each data point is the mean of three measurements from separate loaves. Error bars
are one standard deviation either side of the mean. ................................................ 110 Figure 4.41 The specific volume of different sugar content loaves. Each data point is the
mean of three measurements from separate loaves. The error bars are one standard
deviation either side of the mean. ...................................................................... 111 Figure 4.42 Density of different sugar content doughs mixed in the breadmaker. Each data
point is the mean of six measurements from separate loaves. The error bars are one standard
deviation either side of the mean. ...................................................................... 112 Figure 4.43 Change in density during proving at 38ºC of different sugar content strong flour
doughs mixed in a breadmaker. The results presented are the mean of four data
measurements taken from two batches of dough. The error bars have been omitted for
clarity. ........................................................................................................ 112 Figure 4.44 The relationship between the density of different sugar content doughs
immediately after mixing and their minimum density obtained during proving in breadmaker
and Tweedy loaves. ........................................................................................ 113 Figure 4.45 The relationship between the density of different sugar content doughs
immediately after mixing and their density as finished bread in breadmaker and Tweedy
loaves. Linear regression lines are shown. ............................................................. 114 Figure 4.46 The relationship between the minimum density of different sugar content
doughs obtained during proving and their density as finished bread in breadmaker and
Tweedy loaves ............................................................................................... 114 Figure 4.47 The force required to compress different sugar content loaves by 8 mm. Each
data point is the mean of twelve measurements from three separate loaves. The error bars
are one standard deviation either side of the mean. ................................................ 115

9
Figure 4.48 The relationship between the force required to compress bread 8 mm and the
density of the bread in breadmaker and Tweedy loaves. Linear regression lines are shown.115 Figure 4.49 The number of cells per mm2 in different sugar content (a) breadmaker loaves
(b) Tweedy loaves. Each data point is the mean of nine measurements from three separate
loaves. The error bars presented are one standard deviation either side of the mean. ...... 116 Figure 4.50 The mean cell diameter present in different sugar content (a) breadmaker
loaves (b) Tweedy loaves. Each data point is the mean of nine measurements from three
separate loaves. The error bars presented are one standard deviation either side of the
mean. ......................................................................................................... 117 Figure 4.51 Raw and analysed C-cell cell intensity images of slices of breadmaker produced
bread of different sugar contents ....................................................................... 118 Figure 4.52 Raw and analysed C-cell cell intensity images of slices of Tweedy produced
bread of different sugar contents ....................................................................... 119 Figure 4.53 The relationship between the cell number density and specific volume in
breadmaker and Tweedy loaves. Linear regression lines are shown. ............................. 120 Figure 4.54 The relationship between mean cell diameter and the specific volume of
breadmaker and Tweedy loaves. Linear regression lines are shown. ............................. 120 Figure 4.55 The cell size distribution in different sugar content finished breadmaker loaves.
Each data point is measured from nine slices of bread from three separate mixes. .......... 121 Figure 4.56 The number of cells of different sizes per slice in breadmaker bread. Each data
point is the mean of nine slices of bread from three separate mixes. ........................... 121 Figure 4.57 The cell size distribution in different sugar content finished Tweedy loaves.
Each data point is measured from nine slices of bread from three separate mixes. .......... 122 Figure 4.58 The number of cells of different sizes per slice in Tweedy bread. Each data point
is the average of nine slices of bread from three separate mixes. ............................... 123 Figure 5.1 (a) Voidage at 1 bara of strong and weak flour doughs containing 0%, 7.5% and
15% sugar (b) Gas free dough density of strong and weak flour doughs containing 0%, 7.5%
and 15% sugar ................................................................................................ 130 Figure 5.2 Experimental and model voidages during pressure-vacuum mixing. P1 = 1 bara,
P2 = 0.5 bara. Each data point is from a separate dough mix. (a) strong flour, 0% sugar (b)
weak flour, 0% sugar (c) strong flour, 7.5% sugar (d) weak flour, 7.5% sugar (e) strong flour,
15% sugar (f) weak flour, 15% sugar ..................................................................... 132 Figure 5.3 Experimental and model voidages during pressure-vacuum mixing. P1 = 1 bara,
P2 = 0.25 bara. Each data point is from a separate dough mix. (a) strong flour, 0% sugar (b)
weak flour, 0% sugar (c) strong flour, 7.5% sugar (d) weak flour, 7.5% sugar (e) strong flour,
15% sugar (f) weak flour, 15% sugar ..................................................................... 135 Figure 5.4 Experimental and model voidages during mixing with a pressure step increase
from 1 bara to 2 bara. Each data point is from a separate dough mix. (a) strong flour, 0%
sugar (b) weak flour, 0% sugar (c) strong flour, 7.5% sugar (d) weak flour, 7.5% sugar (e)
strong flour, 15% sugar (f) weak flour, 15% sugar .................................................... 138 Figure 5.5 Initial model voidages of strong and weak flour doughs containing 0%, 5% and 15%
sugar .......................................................................................................... 142 Figure 5.6 (a) Entrainment rate of strong and weak flour doughs containing 0%, 5% and 15%
sugar (b) Disentrainment coefficient of strong and weak flour doughs containing 0%, 5% and
15% sugar ..................................................................................................... 143 Figure 5.7 Ratio of entrainment rate to disentrainment coefficient for strong and weak flour
doughs containing 0%, 7.5% and 15% sugar ............................................................. 143 Figure 6.1 Dough set up for X-ray imaging of static samples ...................................... 147 Figure 6.2 Orthoslice of (a) 0% sugar dough and (b) 15% sugar dough mixed in a Tweedy 1 for
230 s and subjected to a pressure change from 1 to 0.5 bara at 110 s ........................... 148 Figure 6.3 Dough voidage, measured by the double cup method and Avizo via X-ray CT, for
dough containing 0% sugar and 15% sugar, which were each mixed for 230 s in the Tweedy 1
with a pressure step decrease from 1 bara to 0.5 bara at 110 s. .................................. 149

10
Figure 6.4 Number of cells above cut-off per cm3 for dough containing 0% and 15% sugar,
which were each mixed for 230 s in the Tweedy 1 with a pressure step decrease from 1 bara
to 0.5 bara at 110 s. ....................................................................................... 149 Figure 6.5 Mean cell volume above cut-off per cm3 for dough containing 0% and 15% sugar,
which were each mixed for 230 s in the Tweedy 1 with a pressure step decrease from 1 bara
to 0.5 bara at 110 s. ....................................................................................... 150 Figure 6.6(a) The number density per unit volume of different cell volumes (b) The
frequency of different volume cells in a 0% and 15% sugar dough following mixing for 230 s in
a Tweedy 1, with a pressure step decrease from 1 bara to 0.5 bara at 110 s................... 151 Figure 6.7 Cumulative number of cells % above cut-off in 0% and 15% sugar dough following
mixing for 230 s in a Tweedy 1, with a pressure step decrease from 1 bara to 0.5 bara at
110 s ........................................................................................................... 152 Figure 6.8 Cumulative voidage in 0% and 15% sugar dough following mixing for 230 s in a
Tweedy 1, with a pressure step decrease from 1 bara to 0.5 bara at 110 s (a) per unit volume
(b) percentage .............................................................................................. 153 Figure 6.9 Orthoslices of dough with highlighted region size of 60 pixels square (a) Dough
mixed for 110 s at constant pressure of 1 bara. Pixel resolution is 10.8 µm. (b) Dough mixed
for 230 s at constant pressure of 1 bara. Pixel resolution is 8.6 µm. (c) Dough mixed for 230 s
in total: first 110 s at 1 bara, and final 120 s at 0.5 bara. Pixel resolution is 7.1 µm. ....... 156 Figure 6.10 X-ray measured dough voidage of pressure-vacuum mixed dough and constant
pressure mixed dough ...................................................................................... 157 Figure 6.11(a) The number density per unit volume (b) The frequency of different cell
volumes within dough throughout pressure-vacuum mixing. The doughs were mixed at 1 bara
for the first 110 s and 0.5 bara thereafter. ........................................................... 158 Figure 6.12 Cumulative cell percentage for different volume cells within dough throughout
mixing at 1 bara for the first 110 s and 0.5 bara thereafter, and throughout a constant
pressure of 1 bara for 230 s. ............................................................................. 159 Figure 6.13 Cumulative voidage for different cell volumes within dough throughout mixing
at 1 bara for the first 110 s and 0.5 bara thereafter, and the control, which was mixed at a
constant pressure of 1 bara. .............................................................................. 160 Figure 6.14 Number of cells per unit volume at different mixing times, with X-ray CT results
and fitting of the no breakup population balance model of aeration to the experimental
results. Dough was either mixed at a constant pressure of 1 bara or pressure-vacuum mixed
for a total of 230 s, with a pressure step decrease from 1 bara to 0.5 bara at 110 s. ........ 161 Figure 6.15 Dough voidage outside mixer at different mixing times, with X-ray CT and
double cup measurements, and fitting of the no breakup population balance model of
aeration to the experimental results. Dough was either mixed at a constant pressure of 1
bara or pressure-vacuum mixed for a total of 230 s, with a pressure step decrease from 1
bara to 0.5 bara at 110 s. ................................................................................. 163 Figure 6.16 Mean cell volume at different mixing times, with X-ray CT results and fitting of
the no breakup population balance model of aeration to the experimental results. Dough was
either mixed at a constant pressure of 1 bara or pressure-vacuum mixed for a total of 230 s,
with a pressure step decrease from 1 bara to 0.5 bara at 110 s. .................................. 164 Figure 6.17 Dough set up for X-ray imaging during proving ....................................... 165 Figure 6.18 Change in dough volume with proving time. The dough was mixed in a
conventional plenary kitchen mixer and proved at 21.5ºC. ........................................ 168 Figure 6.19 Change in dough voidage with proving time. The dough was mixed in a
conventional plenary kitchen mixer and proved at 21.5ºC. ........................................ 169 Figure 6.20 Orthoslice at (a) 0 min (b) 10 min (c) 20 min (d) 30 min (e) 40 min (f) 50 min (g)
60 min (h) 70 min (i) 85 min (j) 90 min (k) 110 min 9l) 145 min, during proving at 21.5ºC .. 172 Figure 6.21 Two dimensional images of dough slices with some cells highlighted and tracked
throughout dough proving from 0-145 minutes at 21.5ºC .......................................... 173 Figure 6.21 Two dimensional images of dough slices with some cells highlighted and tracked
throughout dough proving from 0-145 minutes at 21.5ºC .......................................... 174

11
Figure 6.21 Two dimensional images of dough slices with some cells highlighted and tracked
throughout dough proving from 0-145 minutes at 21.5ºC .......................................... 175 Figure 6.21 Two dimensional images of dough slices with some cells highlighted and tracked
throughout dough proving from 0-145 minutes at 21.5ºC .......................................... 176 Figure 6.21 Two dimensional images of dough slices with some cells highlighted and tracked
throughout dough proving from 0-145 minutes at 21.5ºC .......................................... 177 Figure 6.21 Two dimensional images of dough slices with some cells highlighted and tracked
throughout dough proving from 0-145 minutes at 21.5ºC .......................................... 178 Figure 6.22 Surfacegen images showing the volume of the dough (blue) and the cells within
it (red) during proving at 0 minutes, 30 minutes, 60 minutes and 140 minutes from left to
right ........................................................................................................... 179 Figure 6.23 Number density of cells at different times whilst proving at 21.5ºC ............. 181 Figure 6.24 Mean cell volume at different times whilst proving at 21.5ºC .................... 181 Figure 6.25 Number density of cells per unit volume at different times whilst proving at
21.5ºC ......................................................................................................... 182 Figure 6.26 Cumulative % voidage of different cell volumes at different times whilst proving
at 21.5ºC ..................................................................................................... 182 Figure 6.27(a) Mean Feret shape of cells at different times whilst proving at 21.5ºC. The
data points are the mean of all cells present at the proving time. Error bars are one standard
deviation on either side of the mean. A linear regression line is shown. (b) Feret shape
distribution of cells per unit area at different times whilst proving at 21.5ºC. The mean cell
Feret shape are based on group sizes of 0.5. The volume is the dough volume at the proving
time.(c) Mean cell Feret shape at different times whilst proving at 21.5ºC (c) Feret shape
distribution of cells at different times whilst proving at 21.5ºC. The mean cell Feret shape
are based on group sizes of 0.5. The volume is the dough volume at the proving time.(c)
Mean cell Feret shape at different times whilst proving at 21.5ºC ............................... 184

12
Nomenclature
Abbreviations
2D Two Dimensional
3D Three Dimensional
4D Four Dimensional
AACC American Association of Cereal Chemists
ANOVA Analysis of Variance
BU Brabender Units
CBP Chorleywood Bread Process
CLSM Confocal Laser Scanning Microscopy
CT Computerised Tomography
DATEM Diacetyl Tartaric Acid Esters of Monoglyceride
ESRF European Synchrotron Radiation Facility
ESEM Environmental Scanning Electron Microscopy
MRI Magnetic Resonance Imaging
NMR Nuclear Magnetic Resonance
RMSE Root Mean Square Error
RPM Revolutions Per Minute
SSL Sodium Stearoyl-2-Lacylate
SEM Scanning Electron Microscopy
TA Texture Analyser
Notation
Cd Probability of a cell being disentrained during a disentrainment event
d Cell diameter (m)
n Number of mol of gas (kg mol)
Nin Number of cells entrained per unit volume of dough per revolution
P Pressure
Pτ Extra mixing pressure
P1 First mixer headspace pressure (bara)
P2 Second mixer headspace pressure (bara)
Pb Pressure inside cell (N m-2)
P∞ Pressure outside cell (N m-2)
r Cell radius (m)
R Universal gas constant (J mol-1 K-1)
T Absolute temperature (K)
V Volume
V’ Compressed volume
Vin Standard entrained cell volume (mm3)
W Mass (g)
We Weber number

13
σ Surface tension (N m-1)
ρ Density (g cm-3)
ρgf Gas free dough density (g cm-3)
τ Shear stress (N m-2)
Φ Voidage
Φstep+ Voidage immediately after the step change
wd Disentrainment frequency per unit volume
ζ Number of mixer revolutions
ζ0 Number of mixer revolutions at initial state

14
Abstract
Gas cells make up a significant proportion of bread’s volume and are responsible for a number
of bread’s characteristics, making their size distribution throughout bread an important
quality parameter. The number and size of cells affect the texture and volume of bread, the
quantity of sauce mopped up, and how bright the bread appears. Gas cells are incorporated
into bread dough during mixing and manipulated throughout the breadmaking process to
obtain the desired cellular structure. Due to the fragile nature of bread dough, obtaining
accurate quantitative data on its cellular structure is challenging. This thesis investigates the
cellular structure of bread, as well as assessing the effect of sugar during breadmaking.
Magnetic resonance imaging (MRI), microscopy and X-ray computerised tomography (X-ray CT)
have been used throughout research in bread dough to visualise dough’s cellular structure. A
non-destructive and non-invasive method giving a high resolution is X-ray CT, in particular
when using a synchrotron light source. However, time on a synchrotron beamline is highly
competitive, and can require applications more than two years in advance. Running costs of
experiments from a synchrotron beamline are also high. This thesis details an alternative X-
ray set-up to accurately visualise dough’s cellular structure using a conventional and
therefore more easily accessible X-ray source.
Three X-ray CT experiments were conducted to investigate dough’s cellular structure
throughout mixing, during proving and in different sugar content doughs. The resolution of
the scans varied from 7-11 µm.
Industrial bread dough mixing is often conducted at a high pressure initially to improve
oxygen availability, followed by a period of partial vacuum to favourably manipulate the cell
size distribution. Using X-ray CT, dough cell size distribution was measured at different points
throughout pressure-vacuum and constant pressure mixing. A simplified population balance
model was fitted to the measured cell size distributions and the validity of the assumptions
within the simplified model explored. It was shown that the dynamic changes in the cell size
distribution within bread dough could be accurately measured during pressure step change
mixing with a non-synchrotron X-ray source. Pressure-vacuum mixing was shown to give a
finer cell distribution than constant pressure mixing and the observed decrease in cell number
density was found to be much more short lived than the decrease in cell size. The model was
found to provide a reasonably accurate characterisation of pressure-vacuum mixing.
X-ray CT was also used to monitor dough’s changing cellular structure during proving by taking
scans every 5 minutes over 145 minutes. Dough voidage increased from 3% to 66%, resulting in
a volume increase from 544 mm3 to 1293 mm3. Cell growth was quickest between 40 and 140
minutes, where a steady increase in volume and significant changes in the cell structure
occurred. A change in voidage distribution was observed, with greater proportions of gas
located in larger cells over time. In addition, over the course of proving cell numbers
dropped, a 156-fold increase in mean cell volume occurred, and mean cell Feret shape
increased from 1.59 to 1.91. This in-situ method of X-ray imaging of bread dough provides

15
higher resolution images than comparable data from conventional X-ray sources. In addition,
the method has proved to be effective in obtaining high resolution and high contrast 3D
images of the cellular structure of dough. This technique will help those wanting to
investigate cellular changes in the dough dynamically, but without the waiting time and
applications that are required with synchrotron X-rays.
On investigating the effect of sugar during breadmaking, sugar was found to increase the gas
free dough density and dough voidage, change the dough’s rheology, increase its proving time
and produce denser bread. Application of a population balance model on the experimental
results indicate that the decrease in steady state voidage as the sugar content increases is a
result of an increase in disentrainment. This was reflected in the X-ray CT of sugared vs. non-
sugared doughs through fewer and smaller cells present in sugared doughs. This is likely to be
a result of a weaker dough structure, making cell rupture more likely. The Chorleywood Bread
Process (CBP) is used industrially worldwide for the production of bread in less time and using
inferior ingredients compared to the traditional bulk fermentation process, making it more
cost effective. These results show that simply extending the pressure vacuum mixing used for
the production of standard bread loaves in the CBP to sugared doughs should be avoided as
aeration of sugared doughs differs to non-sugared doughs. The results suggest that to do so
would be detrimental to the product quality.

16
Declaration
No portion of the work referred to in the thesis has been submitted in support of an
application for another degree or qualification of this or any other university or other
institute of learning.
Copyright Statement
i. The author of this thesis (including any appendices and/or schedules to this thesis) owns
certain copyright or related rights in it (the “Copyright”) and she has given The University of
Manchester certain rights to use such Copyright, including for administrative purposes.
ii. Copies of this thesis, either in full or in extracts and whether in hard or electronic copy,
may be made only in accordance with the Copyright, Designs and Patents Act 1988 (as
amended) and regulations issued under it or, where appropriate, in accordance with licensing
agreements which the University has from time to time. This page must form part of any such
copies made.
iii. The ownership of certain Copyright, patents, designs, trademarks and other intellectual
property (the “Intellectual Property”) and any reproductions of copyright works in the thesis,
for example graphs and tables (“Reproductions”), which may be described in this thesis, may
not be owned by the author and may be owned by third parties. Such Intellectual Property
and Reproductions cannot and must not be made available for use without the prior written
permission of the owner(s) of the relevant Intellectual Property and/or Reproductions.
iv. Further information on the conditions under which disclosure, publication and
commercialisation of this thesis, the Copyright and any Intellectual Property and/or
Reproductions described in it may take place is available in the University IP Policy (see
http://www.campus.manchester.ac.uk/medialibrary/policies/intellectualproperty.pdf), in
any relevant Thesis restriction declarations deposited in the University Library, The University
Library’s regulations (see http://www.manchester.ac.uk/library/aboutus/regulations) and in
The University’s policy on presentation of Theses.

17
Acknowledgements
The years I have spent studying at The University of Manchester have been an enjoyable
experience. I have learnt so much about bread, a product I feel passionate about, and have
met many people who have made this journey possible.
I would first like to thank my supervisor, Peter Martin. His knowledge and experience has
resulted in invaluable guidance, support, and advice. He also generously allowed me to utilise
his population balance model for my work.
I am grateful to have a leading contributor in the field, Grant Campbell, as my co-supervisor.
I would like to express my gratitude to him for his continued support, advice and insight.
Many thanks to Tristan Lowe for training me in using the X-ray equipment, and showing me
the different methods of obtaining quantitative data from Avizo®. Other staff and users at
the Henry Moseley X-ray Imaging Facility have also been instrumental in my progress on X-ray
CT of bread dough, and I am grateful for their help.
Staff within Manchester University that have not been directly involved in my work have also
provided support which I am especially grateful for. I appreciate Patrick Hill’s generosity in
allowing me to use the electron microscope and his time and assistance in running the
experiments. The workshop staff were always so quick to respond to problems I had with
equipment, and never failed to get to the heart of the problem.
During the first year of my PhD I ran some experiments at the Hollings Campus at Manchester
Metropolitan University, providing me with essential water absorption data for my flours, and
an opportunity to practise experimental techniques. Weili Li and the technical staff were very
supportive, and I’d like to express my gratitude towards them.
My friends in chemical engineering have been very supportive throughout my studies, and it’s
reassuring to know when we go through tough times that this is typical of all PhD students!
Playing bridge has been a nice way to get away from it all. Thank you!
Thank you also to all my friends outside of university who have provided emotional support
and listened to me vent my frustration. Andrew Birkin, in particular, has put up with a lot of
this, and supported me unconditionally. Thanks! I’d also like to thank my family for their
unconditional support in my studies and career.
Last but not least, I would like to express my gratitude towards the EPSRC. This project would
not have been possible without their financial support.

18
Chapter 1 - Introduction: Understanding bread dough
aeration
Bread is a versatile and filling food, and is popular worldwide. 99% of UK households buy
bread and the equivalent of almost 12 million loaves are sold daily (Anon, 2012a). 80% of UK
bread is produced in large plant bakeries, 17% in in-store bakeries and the remaining 3% in
craft bakeries (Anon, 2012a). The main players in the plant bakeries are Allied Bakeries, Hovis
and Warburtons. However, the competition to offer cheaper products than own brand
bakeries has resulted in the closure of two Hovis bakeries in 2013. Plant bakeries have been
advised to cut costs and offer a point of difference in their products if they are to compete
against cheaper own brand bakeries (Ruddick, 2012). Bakers are aware of the issue, as
reflected by the point of difference products with value adding attributes on the market,
some of which are illustrated in Figure 1.1. Examples of point of difference products include
(1) white loaves made with 50% wholegrain flour. These offer the desired taste and texture of
white bread with added nutritional benefits. (2) Crustless loaves. This is a convenient product
for consumers (often children) who dislike bread crusts. (3) Loaves made from 100% British
wheat. This appeals to consumers wanting to live more sustainably and support the British
industry.
Figure 1.1 A selection of some point of difference UK bread products. Products illustrated
include Kingsmill 50:50, for those who want the goodness of wholegrain without its texture,
Hovis British Farmers Loaf, a loaf made with 100% British wheat, Hovis seed sensation,
containing seven seed varieties, Kingsmill Little Big Loaf, full sized bread slices but in a
smaller pack size and Warburtons Sandwich thins, who want less bread in their sandwiches.

19
The UK bakery market is worth almost £3.46 billion with bakery snacks and world breads
being the driving growth (Anon, 2012a). Two of the factors driving the trends in bakery
include healthy eating concerns and indulgence (Anon, 2012a). The concerns over healthy
eating are balanced by the desire for pleasure seeking indulgent products. Pleasure seeking
products include continental breakfast products, bakery snacks and international products.
Continental breakfast products are categorised in ‘bakery snacks’, the second largest bread
category, only behind ‘bread’ (Anon, 2012a). There are more than 30 sub categories within
bakery snacks. Some of these are illustrated in Figure 1.2. Research has shown that
indulgence is desirable in bakery snacks to boost the enjoyment factor of the weekend after a
week focused with healthy intentions (Anon, 2012a).
Figure 1.2 A selection of bakery snacks available in UK supermarkets. Illustrated include
traditionally seasonal products such as hot cross buns, products released for a specific event,
such as the red nose day doughnuts, world breads such as croissants and brioche, and
traditional UK bakery snacks such as scones and pancakes to name a few.
Breadmaking processes vary worldwide. The process may involve mechanical dough
development, a long fermentation, the addition of an improver to develop the dough in less
time or the production of a fermenting ‘sponge’ to which other ingredients are later added.
The Chorleywood Bread Process (CBP) is a mechanical dough development process. It
originated in the UK as a solution to producing acceptable quality bread using UK flours,
which have inferior breadmaking qualities compared to imported flours. In the UK, large plant
bakeries and many in-store bakeries produce bread using the CBP. It had also been adopted in

20
a number of countries worldwide. One reason for the widespread uptake of the CBP is that
flour can be processed into a loaf of bread, wrapped, sliced and be ready for sale all within
three and a half hours. This is largely due to the lack of a lengthy bulk fermentation stage.
This lack of fermentation also saves money, as storage space under controlled conditions is
not required. Cost savings are also made by using cheaper lower protein wheat. The CBP also
creates a light and soft bread of consistent quality. Disadvantages of the CBP include the
addition of extra ingredients to create bread of acceptable quality, a lack of flavour, and a
change in texture to traditionally made breads.
To achieve bread of saleable quality, it is important that the number and distribution of cells
present in the crumb is optimum for the characteristics expected of the bread. These cells
originate from gas pockets entrained during mixing and are manipulated throughout the
breadmaking process to achieve bread of desirable characteristics. A high volumed loaf with a
fine crumb structure is a desirable characteristic. As bread is sold by weight, a larger volume
is indicative of more bread and a light texture. Another quality characteristic is bright bread,
in particular in white breads. The orientation of cells revealed on a slice affect how much
light is reflected from them and thus how bright the bread appears. Soft bread is another key
quality characteristic that is perceived by consumers as indicative of fresh bread. These
quality parameters are largely determined by the cell distribution in bread, and affect its
eating qualities, from how “heavy” the bread is, to how well it slices and how well it mops up
a sauce.
This thesis sets out to better understand the breadmaking process as a series of aeration
stages. Within this aim exists a further aim of developing a method of accurately obtaining
the cell size distribution in bread dough at different stages of breadmaking, with the
intention of using the results to validate the assumptions made in an existing published
population balance model on aeration during mixing. In addition, it was mentioned previously
that the two main driving forces in bakery snacks are the indulgence factor and healthy
eating. Low sugar snacks are often perceived as healthy whilst high sugar snacks are viewed
as indulgent. This thesis assesses the effect of sugar in bread dough to better understand its
effects on bread’s structure. This information is useful for developing new bakery products.
Searches through scientific databases to investigate the research conducted on bread dough
aeration found a lack of research on the effect of sugar on aeration in breadmaking.
However, a glance at supermarket bakery aisles reveals that sweetened bread products make
up a large portion of the UK bread market. Examples of these products include fruit loaf,
brioche, doughnuts, Chelsea buns and panettone. The breads are sweetened with some sugar,
and usually either or both dried fruit and icing, or like doughnuts, filled with a sweet paste,
such as jam or custard. Aside from the textural and flavour pleasures in consuming dried
fruit, icing and jam, the additional sweetness they give the product is likely to be required
due to high quantities of sugar in dough making it sticky. A sticky dough is likely to be dense
due to its cohesiveness, and difficult to process due to its adhesiveness. Assessment of the
percentage to flour (Baker’s percentage) of sugar present in sweetened breads in UK

21
supermarkets found the majority to contain less than 5% sugar. Brioche was found to contain
13% sugar based on flour weight, but a number of other ingredients were also present, such as
milk, butter and eggs, such that as a percentage of all the ingredients present the sugar
content was considerably less. Understanding how sugar contributes to the creation of
aerated structures in these products may help reduce the sugar content while retaining the
desirable characteristics of these products, and can also help in the production of more
indulgent breads containing increased quantities of sugar. This thesis reports on a study into
the interrelationship of bread dough aeration with added sugar. As dough aeration and
rheology are interdependent (Campbell, and Martin; 2012; Chin, 2009), and small changes in
cell concentration can affect dough rheology (Chin et al., 2005; Scanlon et al., 2008), sugar’s
effect on dough rheology was also investigated. Rheology is the study of how a material flows
and can be used to characterise and predict dough’s behaviour at different stages of
breadmaking (Dobraszczyk et al., 2001; Campbell and Martin, 2012). Studying dough rheology
is also important as sensory detection of texture is dependent upon its rheological properties
(Daubert and Foegeding, 2003), which changes throughout breadmaking (Dobraszyzck et al.,
2001).
Dough aeration is measured in terms of dough voidage and the distribution of gas within the
dough (Campbell, 1991). The latter is more challenging due to the requirement of a non-
destructive method. Gas cells in bread are important as they make up a large proportion of
bread’s volume and affect bread’s brightness and also its mechanical properties on
consumption, and therefore the hedonic response to the bread. They are worth studying as
different cell size distributions mean different bread properties and therefore determine the
quality and success of the product. By understanding the link between the cell size
distribution and properties of bread, this can help improve existing product and developing
new products. In this thesis, both voidage and cell size distribution are measured using X-ray
CT. This non-invasive method alongside visualisation analysis software enabled quantitative
information on the 3D cellular structure of dough to be derived. Using X-ray CT, the 3D
sample volume was reconstructed, giving voxel dimensions as low as 7 µm. The method
allowed comparison of cell volume distribution during pressure-vacuum mixing to the cell
volume distribution at constant pressure mixing. This gave insight into the effect of pressure-
vacuum mixing on the cell volume distribution and if the observations agree with the theory
of how pressure-vacuum mixing works, as well as improving the accuracy of a population
balance model for aeration during mixing. The in situ X-ray scans during proving allowed
observation of the behaviour of individual cells, cell mechanics and change in cell volume and
shape distribution. These are a few of the parameters which can be obtained via X-ray CT
using conventional X-ray equipment.
The scope of this thesis is as follows: Chapter 2 offers a background to this thesis. It details
the history and significance of bread, and the CBP. As aeration is key to bread’s quality, the
aeration process is explained and methods that have been used to measure it are discussed.
Chapter 3 provides a background to the experiments conducted. It describes the materials

22
used and explains why they were chosen, describes the equipment used and details the
analytical techniques. The flours and doughs used in later experimental chapters are also
characterised here. Chapter 4 presents a range of tests in ten short experimental sections to
investigate the effect of sugar during the breadmaking process. These include assessing the
dough voidage and gas free dough density, its microstructure, specific mixing parameters and
some rheological parameters. In Chapter 5 a population balance model is utilised to compare
the aeration of varying sugar content bread doughs in terms of entrainment and
disentrainment during mixing. Different size and direction step changes are investigated for
three different sugar content doughs to determine why the voidage varies within these
doughs. Chapter 6 continues to investigate sugared doughs through X-ray CT. Chapter 6
consists of three experimental sections: in the first a comparison of the cellular structure of a
sugar containing and non-sugar containing dough is made. Next, the cellular structure of
dough is investigated throughout pressure-vacuum mixing, and the results used to assess the
validity of a population balance model. The work of this Section has been published in the
journal Chemical Engineering Science and can be found in the appendices. Finally, on further
development of the X-ray CT technique, it was then used to investigate the cellular structure
of bread dough in situ during proving. The voidage distribution and cell distribution were
obtained throughout proving and the change in cell shape was quantified. Finally, Chapter 7
concludes this thesis and makes recommendations for how research in this area should be
taken forward.

23
Chapter 2 - Bread: Its history, significance and
manufacture
The introduction outlined the purpose of this thesis, to report novel findings of the
interrelationship between aeration processes in bread manufacture and the role of added
sugar in sweetened breads. This chapter presents an in depth review of the relevant
literature across the scope. The review starts in Section 2.1 presenting an overview of bread
in its historical, social and technological context. Section 2.2 details the aeration
mechanisms, the factors affecting them and the different methods that can be used to
measure aeration throughout the breadmaking process.
2.1 An introduction to bread
This section is an overview of breadmaking and is split into three sections. The first gives a
history of bread and details its significance historically and today. Following this, in Section
2.1.2, the breadmaking process is described with emphasis on the industrial CBP. Finally, in
Section 2.1.3, common breadmaking ingredients are listed and their purpose described.
2.1.1 The significance of bread
The importance of bread is reflected by its use as currency in the Pharaonic period in Egypt,
and the use of the word “bread” as an equivalent to food by Christians who recite the Lord’s
prayer, asking for their “daily bread”. Bread is made from grain and water, and cooked into a
solid mass. There are records of bread consumption from the Neolithic period. During the
Neolithic period, unleavened breads were made from a mixture of cracked grains and water.
Over time a preference developed to pound the grains, until eventually unleavened bread was
made from ground grains and water. Leavened bread is believed to have come about after the
Egyptians forgot about a batch of dough. This resulted in it becoming inoculated with yeast
from the air. The dough was cooked and a more flavoursome, lighter bread was discovered.
Despite the inconvenience of making leavened bread and the reduced product mass due to
yeast metabolism, the art of making leavened bread quickly spread worldwide, a reflection of
its popularity. The popularity of bread has been long standing, although preferences vary
worldwide and amongst individuals.
Bread has played a role in survival for Vikings, warriors and explorers under difficult
conditions (Sonoma, 2008). Cracker-like breads are low in moisture making them light and
compact, thus allowing them to be taken on long journeys without becoming mouldy. Aside
from being a form of nourishment, bread has a religious significance. On Good Friday
Christians traditionally hang a loaf of bread in the house to ward off evil (Davidson, 2006),
and the consumption of hot cross buns is associated with Easter. The cutting of the cross in
the bun was believed to expel the devil (Ingram and Shapter, 1999). These actions are still
carried out today although due to tradition rather than beliefs. Nowadays, tradition also
means ‘luxury’ breads are consumed at special occasions. These include stollen in Germany
for Christmas, hot cross buns in England for Easter, challah for the Jewish Sabbath and pan de

24
mureto for day of the dead in Mexico. The need for bread on special occasions emphasises the
significance of bread in society. Bread is not just consumed on special occasions, however. It
is also a staple and viewed as a necessary everyday food, as reflected by the amalgamation of
ordinary people and politicians to form the Anti-Corn Law League in 1838 in protest against
rising corn prices which caused bread prices to rise (Anon, 2010a).
During Medieval times in Britain, the noble employed workers with the sole task of baking. It
was not just nobility that enjoyed bread, however. Bread was enjoyed across all classes and
the type of bread consumed was indicative of status. Nobility consumed white bread,
tradesman consumed wholemeal bread, and the poor consumed bran bread (Anon, 2012b).
These breads not only varied in appearance but also in firmness, with the noble consuming
the softest and whitest bread. Even during the Second World War the realisation of the
nutritional benefits of wholemeal bread over white did not sway the consumer preference
towards wholemeal bread. It wasn’t until 1984 when ascorbic acid was added to wholemeal
bread resulting in a softer texture that its popularity began to increase. For many years,
white bread was perceived as a superior product, and despite the ban of toxic whitening
substances, bakers continued to add these to their bread. This and the time taken for
wholemeal bread to become popular illustrates the consumer preference of appearance and
texture over health benefits. With this in mind, in 1956 laws were introduced, whereby the
use of all flour for breadmaking other than wholemeal had to be fortified with thiamine,
calcium, iron and nicotinic acid.
Nowadays, the importance of bread is reflected by its consumption worldwide. Not only is it
an affordable form of nourishment for most but it is also a good source of carbohydrates. The
Department of Health recommends a third of the calorific intake is derived from starchy
carbohydrates such as bread, pasta, potatoes and rice. Depending on the country, the
quantity and variety of bread consumed varies. In oriental countries, rice makes up a large
portion of the carbohydrate intake. However, traditional steamed bread and the growing in
popularity western breads are also consumed. In the Middle East, unleavened breads are the
bread of choice. In the UK, bread makes up a large proportion of the starch consumed, and
the preference is white bread which makes up 76% of the bread sold with 50% of bread being
sold as sandwiches (Anon, 2012d). Bread has always been a popular product in the UK. The
Great War was the beginnings of female employment. This meant women had less time to
make bread, increasing the importance of industrially made bread. It became essential that
bread could be made in less time to meet the increasing demands. In the 1960s the lengthy
traditional bulk fermentation process was abandoned in preference for the CBP. The CBP is a
mechanical dough development process with a substantially lower bread production time than
the bulk fermentation process.
Industrially made bread has several advantages over homemade bread, including
convenience, consistency, a longer shelf life, and a regular shape. However, the flavour of
industrially made bread and quality of ingredients is often inferior to homemade bread
(Blythman, 2007). The rising popularity of cookery shows and in particular the baking series,

25
The Great British Bake-Off, has increased the popularity of baking in the UK (Jones, 2012).
This has contributed towards an improved general knowledge of baking and in particular
awareness of the small number of essential ingredients required to produce bread, compared
to that used in industry. This awareness is likely to be responsible for the increased popularity
of artisan bakeries, which produce bread consumers perceive as superior in flavour and
texture compared to industrially produced bread. The growing popularity of artisan bread
reflects the need to tighten the gap between artisan breads and industrially produced breads.
2.1.2 Industrial breadmaking - the Chorleywood Bread Process
Breadmaking is a series of aeration stages (Campbell et al., 1998), where each stage involves
the manipulation retention of the gas cells in a suitable form until the product is baked
(Grenier et al., 2003) to obtain the desired characteristics. There are three main stages in
breadmaking: mixing, proving and baking. These essential breadmaking stages vary from one
product to another.
To begin with, the weighed ingredients, usually flour, water, yeast, salt, vegetable fat and
dough improver, are brought together into a homogenous dough through shearing actions.
During mixing, the dried ingredients become hydrated. For flours produced from a gluten
containing grain, hydration of the protein is particularly important for development of the
viscoelastic properties of the dough. Mixing also inputs heat and mechanical energy into the
dough, through stretching and pulling actions. This helps develop the dough, and form a
gluten network within the dough. When the dough is developed, it becomes a viscoelastic
material, capable of holding expanding cells.
As the dough is mixed, it is folded over itself, trapping pockets of gas between the layers of
the dough. This is the beginning of the gas cells in bread. The cells in bread can make up 80%
of its volume and are essential in determining the characteristics of bread. Mixing is the stage
of breadmaking where bakers have the most control over the cells in bread. Different mixing
actions, mixer blades, mixing time, mixing speed, mixing pressure and the scale of the
equipment can be varied to achieve a different cell volume distribution. As new cells can only
be created from these existing cells, mixing becomes a key stage of breadmaking. It is
believed that 90% of the final bread quality depends upon mixing (Cauvain, 2000). This is also
due to mixing being required to develop the dough in mechanical dough development
processes such as the CBP.
The second stage of the breadmaking process is known as proving or fermentation. During
proving, the dough is left in a warm and humid environment to increase in volume. In order to
achieve a high loaf volume and fine crumb structure, coalescence should be retarded. During
proving the increase in volume is a result of yeast carbon dioxide production. Yeast
metabolise the sugar in the dough and produce carbon dioxide as a waste product via an
enzymic reaction. The carbon dioxide diffuses into the cells and causes them to expand. The
optimum temperature for yeast metabolism is 35-40°C (Cauvain, 2012) with higher
temperatures reducing proving times. Gujral and Singh (1999) found that proving
26
temperatures of up to 50°C are used for industrial breadmaking. The humidity during proving
is also an important parameter. A relative humidity of 85% is used to prevent the surface of
the dough from drying out. Depending on the desired bread characteristics, the proving time
varies. Generally, a shorter proving time results in a finer crumb and a longer proving time
results in a coarser crumb (Zghal et al., 1999) due to the greater degree of coalescence which
occurs on extending the proving time.
During the final stage of breadmaking, the dough is subjected to heat. Depending on the
bread being made, the cooking method will vary. For example, mantou are steamed,
chapattis are heated over a skillet, puris are fried and focaccias are baked. Baking is the most
common method of cooking bread. The heat transforms the dough into an edible product. The
high temperatures cause water to evaporate from the product, resulting in loss of weight
from the product. Evaporation also occurs from the product surface, forming a dry, firm and
crispy crust. The heat deepens the colour of the product into a golden brown colour, develops
flavour and aroma through Maillard reactions (non-enzymic reactions occurring in food when
reducing sugars react with proteins, peptides, amino acids or amines) and changes the
texture of the product through starch gelatinization and protein coagulation.
During baking, the product is subjected to temperatures of 200-230°C. Heat is transferred to
the dough via conduction and convection. The initial increase in temperature, compared to
proving temperatures, results in an increase in yeast carbon dioxide production, up to
temperatures of 55°C (Zhang et al., 2007). This causes a final expansion of the dough volume
by one third (Dobraszczyk et al., 2003) through an increase in cell volume. This activity is
termed oven spring. It occurs until the crust sets and resists expansion of the unbaked portion
of the dough. Despite the resistance created by the crust setting, the cells within the
unbaked portion of the loaf continue to expand (Zhang et al., 2007) leading to coalescence,
which gives bread its interconnected cell structure. Local expansion eventually ceases as a
result of starch gelatinization increasing dough viscosity and decreasing dough extensibility.
Although bread can be made in a number of ways, industrially there are two main methods of
making bread: the bulk fermentation process and the CBP. The bulk fermentation process is
the more time consuming of the two. The dough is mixed at a low speed for approximately 10
minutes. Following this, it undergoes the first of its three proving sessions. The first session
lasts 2-4 hours with mixing part way to subdivide and redistribute the cells, helping achieve a
finer crumb structure in the final loaf. The dough surfaces are then smoothed down and the
dough divided into pieces of the desired weight to undergo intermediate proof. Finally, the
dough is shaped and undergoes its final proof, before being baked. The key feature of the
bulk fermentation process is the long proving times. Compared to the short proving session in
the CBP, the bulk fermentation process is beneficial for flavour development and protein
structure, enabling better retention of gas and retardation of coalescence during proving.
Despite the textural and flavour benefits of the bulk fermentation process, the CBP is
generally used in preference. Advantages of the CBP include a higher yield through less

27
proving and the addition of more water, and cost savings through being able to use lower
quality wheat and less space and time needed, a result of the lack of proving. In the UK,
approximately 80% of the flour is derived from lower protein British wheats (Anon, 2012c),
saving money through lack of imports and the use of a cheaper, lower quality flour (the most
substantial ingredient in terms of quantity). However, to enable processing, the use of these
wheats must be balanced through the addition of extra water and yeast, and unpopular
additives.
Mixing in the CBP occurs at a high speed, imparting 42 kJ kg-1 of energy on the dough in less
than 3 minutes. Through the rapid input of energy into the dough and optimisation of the cell
distribution, the need for lengthy proving is eliminated. The CBP also uses pressure-vacuum
mixing to ensure a fine cell distribution within the dough. The dough is first mixed at a
positive pressure to increase oxygen availability to the dough. This facilitates the action of
the dough improver, ascorbic acid, which helps develop the dough and produce a whiter loaf.
A partial vacuum is then drawn towards the end of mixing. This removes excess air from the
dough and expands the existing cells, allowing the subdivision of cells caused by further
mixing to result in a fine cell distribution.
2.1.3 Breadmaking ingredients
As mentioned in Section 2.1.1, the number of ingredients required to produce bread is small.
The minimal ingredients for leavened bread are flour, water, yeast and salt. Industrial bread
often contains more than a dozen ingredients, however. These ingredients are added to
ensure the efficient processing of the ingredients into a desirable product. Depending on the
product being made, different characteristics are sought and thus the ingredients and
methodology vary. However, there are ingredients common to industrially produced breads.
In this section, breadmaking ingredients are listed and their purpose in the formulation
described.
Flour
Although a variety of cereal grains can be used in baking, wheat flour is most commonly used
as it is the only cereal capable of delivering a highly aerated structure in the baked loaf
(Campbell and Herrero-Sanchez, 2001). This is due to the unique viscoelastic properties of
doughs produced from wheat flour, allowing growth and retention of carbon dioxide in the
dough without cell rupture. These properties arise from the wheat storage protein gluten
which comprises mainly a mixture of water insoluble glutenin and gliadin. The quantity of
gluten and ratio of glutenin to gliadin affects the breadmaking quality of wheat flour,
dramatically changing the dough rheology (Xu et al., 2007). Glutenin is responsible for the
strength and elasticity of the dough, and therefore cell retention. Gliadin is responsible for
the extensibility and viscosity of the dough, and therefore cell expansion. The ratio of
glutenin to gliadin is important for the dough’s viscoelasticity. In wheat flour this ratio is
approximately 1:1. In other cereal grains the ratio differs, and less gluten is present, making
bread from these grains less desirable and the production of highly aerated loaves difficult.
Cauvain and Young (2006) noted that protein quality is not as essential in the CBP compared
28
to other breadmaking processes, due to the high level of oxidants used and the short
processing time. This enables use of lower quality European wheats containing approximately
3% less protein than the hard winter wheats of North America and Canada. The quality of
bread produced from lower quality wheats can also be boosted by adding vital wheat gluten.
Flours containing a higher proportion of protein have improved viscoelastic properties and
produce breads of a larger volume and better quality (Cauvain and Young., 2006), making
them desirable for breadmaking. A protein content of 11% or more is considered high and the
flour termed strong. Strong flours are reputed to absorb more water, give less aeration and
produce doughs of a lower gas free dough density (Campbell et al., 1993; Campbell et al.,
2001; Dobraszczyk et al., 2001; Chiotellis and Campbell, 2003b; Chin, 2003; Sroan and
MacRitchie, 2008). An investigation of 74 flours into the relationship between protein content
and water absorption, presented in Figure 3.8, does not illustrate a relationship between
these two parameters, however. This is likely to be due to the small number of flours in
relation to the number of flours that exist, and the other parameters affecting water
absorption, discussed later in this thesis.
The degree of enzyme activity in the flour is important since the flour starches need to be
broken down into sugars through yeast enzymic action to provide a sugar the yeast can
metabolise. Too much enzyme activity results in too much sugar and not enough starch
present, giving the final bread a poor texture, and too little results in low carbon dioxide
production, giving a loaf of low volume.
Flour also contains 1-1.5% lipids. The lipids present and their quantity varies across different
flours. These surface active components will differ in polarity and saturation. In the
quantities present they do not affect dough rheology (Sroan and MacRitchie, 2009), but do
affect the volume and crumb structure (MacRitchie and Gras, 1973; Sroan and MacRitchie,
2008) by affecting the stability of the liquid lamellae around the gas cells. Sroan and
MacRitchie (2008) noted that the stability of the liquid lamellae is one of two factors that
determine the degree of expansion of the dough through controlling disproportionation and
coalescence. The other factor is the dough’s rheology. However, despite the occurrence of
disproportionation being widely accepted, no evidence has been published proving it takes
place.
Water
Water binds the dry ingredients together to form a dough. It is important that the optimal
quantity of water is used to ensure the ingredients are properly bound and optimally
dispersed. The CBP requires more water than other breadmaking processes due to the partial
vacuum mixing drying out the dough (Cauvain and Young, 2007), and a softer dough being
necessary for processing in the machinery (Cauvain and Young, 2006). The optimal water
content for breadmaking varies from one flour to the next, and can be determined using a
Farinograph. Factors believed to affect the water absorption of the flour include the quantity
of damaged starch present, and the flour’s protein, moisture, pentosan and bran content
(Cauvain and Young, 2006). Using 2% less water than the optimum results in reduced carbon

29
dioxide production in the dough during proving, producing a loaf of lower volume (Rasanen et
al., 1997). Findings from Chin et al. (2005) agree with this. It is not just the carbon dioxide
production that is affected by insufficient water but also retention of carbon dioxide
(Peighambardoust et al., 2010) due to inadequate gluten hydration.
On the other hand, an excessive level of water results in a more extensible and very sticky
dough (Spies, 1997), causing processing difficulties.
Although the quantity of water added to bread dough varies, depending on the flour used,
dough formulation and processing method, 60% of the flour weight is the general proportion
added. However, it is not just the water content in foods that affect its properties but also
the water activity, aw, which depends upon the form in which the water exists in the product,
and is determined by the ingredient formulation. Water in food exists in three general forms:
(1) free, unbound water, (2) free, immobilised water, and (3) chemically bound water.
Water activity is an important parameter for determining moisture movement within the
dough and can affect microbial growth, enzyme activity, and chemical activity within the
dough (Pennington and Baker, 1990). It is a significant parameter in the investigation of the
effect of sugar in bread dough. By definition, water activity is the vapour pressure of water in
the product divided by the vapour pressure of pure water at the same temperature. Water
activity ranges from 0 to 1 and can also be referred to as the amount of free water in the
product or the amount of water not bound to food molecules. Bread dough and bread have a
water activity of approximately 0.95 (Czuchajowska et al., 1989; Dairy Research and
Information Centre, 2013). On investigating the effect of sugar on the water activity of bread
Czuchajowska et al. (2004) found this figure decreases on addition of sugar. Sugar has a
hygroscopic nature (Tlapale-Valdivia et al., 2010) and is known to cause a significant
reduction in the water activity of food products, due its solubility and relatively small
molecular size (Pennington and Baker, 1990).
Yeast
Yeast are microorganisms. They require warmth, moisture and food to reproduce. In the CBP,
the yeast species, Saccharomyces cerevisiae, is commonly used. There are an unlimited
number of Saccharomyces cerevisiae strains, and several thousand varieties are used in
baking (Anon, 1996a). These strains differ in sugar tolerance, growth rate and sensitivity to
different chemicals. Manufacturers will select the yeast strain or combination of yeast strains
based on the suitability to the breadmaking process and product being made. Yeast used in
the British bread industry is typically fast acting because of the short timescale of the CBP.
Saccharomyces cerevisiae are facultative anaerobes. Facultative anaerobes can metabolise
both aerobically and anaerobically, favouring aerobic metabolism if sufficient quantities of
oxygen are present. In the CBP, Saccharomyces cerevisiae is added at 2.5% of the flour
weight. This is greater than the quantity which would be added in traditional breadmaking
and is necessary to ensure adequate carbon dioxide production due to the lack of proving in
the CBP.

30
It is well known that yeast produce carbon dioxide which causes the cells in bread dough to
expand. The carbon dioxide is produced as yeast ferment glucose. Unless sugar is added,
glucose is entirely derived from flour. Wheat flour contains approximately 1% of fermentable
carbohydrates which are readily available for yeast fermentation. The remainder is derived
from amylase action on the flour starches.
Yeast production of carbon dioxide occurs in several stages. Equation (1) is the net chemical
reaction of yeast fermentation of glucose,
C6H12O6 2C2H5OH + 2CO2 (1)
where C6H12O6 is glucose, C2H5OH is ethanol and CO2 is carbon dioxide. Ethanol and carbon
dioxide gas are the main products of yeast metabolism. In addition to these, yeast also
produce flavour and aroma compounds, and hydrogen peroxide, which results in a more
elastic dough (Mirsaeerghazi et al., 2008).
The concentration of other ingredients in the dough can inhibit yeast carbon dioxide
production. Too much sugar, salt, alcohol or fat reduces the rate at which the bread rises
(Gujral and Singh, 1999; Chin et al., 2005; Spaull and Bruce-Gardyne, 2003; McGee, 2004).
The authors recommend increasing the quantity of yeast present if high quantities of the
above ingredients are present.
Yeast is available in different forms for baking. These include compressed, dried, creamed,
and liquid form. In industrial breadmaking, liquid or creamed yeast are commonly used due to
ease of pumping.
Salt
Salt serves a number of functions in bread. It tightens the gluten network and increases dough
stability through allowing hydrophobic and hydrophilic interactions to occur between gluten
molecules (Belitz, 2007). Salt flavours the bread, reduces the action of proteolytic enzymes
which otherwise damage the gluten (Davidson, 2006) and increases the bread’s volume
(McGee, 2004; Cauvain, 2000). Salt is normally added at the start of mixing, and it is
important that the particle size is small enough to completely dissolve during mixing.
However, some bakers choose to delay the addition of salt, resulting in more extensible
dough through a greater degree of protein hydration (Cauvain, 2000).
Vegetable fat
Fat is added to bread via two routes. The first is as a component of flour, where fat is
typically present at 1-2%, and the second is as an ingredient itself. Vegetable fat is used over
animal fat, allowing vegans to consume the product. Vegetable fat consists of a mixture of
different triacylglycerols of which the quantity and combination are responsible for its
physical properties.
Typically, vegetable fat is added in quantities of up to 5% of the flour weight, with more fat
required when using wholemeal flours (Cauvain and Young, 2007). The addition of fat has

31
numerous benefits in bread. The first being it delays staling by coating starch granules and
postponing moisture release. Secondly, fat lubricates dough, helping it pass more easily
through equipment (Anon, 2012c). Thirdly, the crumb colour is improved due to greater light
reflection, a result of an increased number of small cells surviving baking. Finally, fat crystals
stabilise cells by forming a layer around them with protein (Li et al., 2004). This allows the
cells to expand without rupturing and prevents coalescence, through transfer of interfacial
material to the cell surface during baking (Brooker, 1996). This enables the production of a
high volume bread with a fine crumb (McGee, 2004; Cauvain and Young, 2006). To ensure the
last two benefits, it is crucial that 5% of the fat is solid at proving temperature (Dobraszczyk
et al., 2001; Gan et al., 1995; Brooker, 1996). The use of lower melting point fats results in
the fat crystals melting during proving, reducing the availability for adsorption to cells. In
addition, shortenings containing many small fat crystals are superior to those containing
larger fat crystals (Brooker, 1996; Cauvain and Young, 2006). They increase the number of
small cells that survive baking, and thereby contribute towards the crumb quality. Thus, the
crystal structure of the solid proportion of lipids present is an important parameter (Pareyt et
al., 2011). Although fat is beneficial for the quality of bread, too much fat stops the
formation of the long gluten strands necessary for dough expansion (Davidson, 2006).
Dough improver
Dough improvers are chemicals which are added to the traditional dough mix to give bread
characteristics which are desirable and otherwise difficult to achieve. Dough improvers
consist of surfactants, oxidants and reductants.
Surfactants are molecules which lower the surface tension between a hydrophobic and
hydrophilic interface by congregating at the interface. In bread, this may be the gas-water
interface or the fat-water interface. This stabilises the cells. Benefits of surfactants in bread
include retarding retrogradation, improving loaf fineness and increasing loaf volume, without
affecting the gas free dough density (Campbell et al., 2001; Junge et al., 1981). As the
surface tension is reduced, the thermodynamic benefit of coalescence is also reduced, thus
delaying coalescence (Campbell et al., 2001). Surfactants used in breadmaking include
diacetyl tartaric acid esters of monoglyceride (DATEM) and sodium stearoyl-2-lactylate (SSL).
Oxidants are used to improve the gas retention properties in the dough through enhancing
gluten reformation (Anon, 1996c). This is done through increasing the number of sulfhydryl
links, resulting in increased dough strength and bread of a greater volume. The oxidants used
worldwide range and examples include ascorbic acid, potassium bromate, azodicarbonamide
and potassium iodate. The oxidant used depends upon what is permitted in each country and
the stage of breadmaking for which the oxidising properties are required. In the UK, ascorbic
acid is used at a concentration of 75-300ppm. The occurrence of its oxidising action during
mixing is optimal, due to competition with yeast for oxygen. Chemically, ascorbic acid is a
reducing agent. It requires oxygen and ascorbic acid oxidase to convert into the oxidising
agent, dehydroascorbic acid. Thus, the effectiveness of ascorbic acid depends largely on the
oxygen incorporated from the air during mixing. Ascorbic acid aids dough development and

32
increases loaf volume (Belitz et al., 2004; Cauvain, 2000; Anon, 2002), as well as improving
the crumb structure and softness (Anon, 2002).
Reducing agents are used to weaken the dough or to change its rheology, so the dough can be
moulded without any structural damage. They may also be used when a very high protein
flour causes difficulty in fully developing the dough. In reducing the energy required to
develop the dough, the final dough temperature can also be reduced. Achieving an optimal
dough temperature following mixing is another reason reducing agents may be used. An
example of a reducing agent is L-cysteine.
Other dough improvers include acetic acid and lactic acid, which extend the shelf life of
bread. However, too much acid can have detrimental effects on the dough, due to the acids
reacting with flour proteins and yeast, inhibiting yeast metabolism (Gujral and Singh, 1999).
Sugar
Sucrose is the most common sugar added to bread. Sucrose, also known as saccharose, is
usually extracted from sugar beet or sugar cane. It is a disaccharide comprising the two
monosaccharides α-D-glucose and α-D-fructose, shown in Figure 2.1.
Figure 2.1 The molecular structure of the dissacharide, sucrose. Sucrose consists of the two
monosaccharides, α-D-glucose and α-D-fructose, linked by a glycosidic bond.
Addition of sugar may be in either the crystalline or liquid form. When added as a solid, the
sugar dissolves in the water during mixing. At 25C 65 g of sucrose dissolves in 100 g water
and the solubility increases at higher temperatures (Belitz et al., 2004). Sugar is not essential
in bread, although its presence can be beneficial. Benefits include: an attractive brown
colour, sweetness, tenderisation and moisture preservation through moisture absorption
(McGee, 2004), and acceleration of yeast carbon dioxide production with 1-2% sugar.
Too much sugar, however, has a negative effect on bread. At concentrations greater than
10%, sugar weakens the gluten network; sugar binds with the water, preventing gluten from
binding to it (McGee, 2004). If insufficient quantities of water are present, yeast cells may
also dehydrate. Yeast activity is also inhibited by high sugar levels. Adding more yeast
OH
CH2OH
OH OH
H
H H
O
CH2OH
CH2OH
H
H
H
HO
OH
O O
α-D-Fructose α-D-Glucose

33
(Cauvain and Young, 2006), or allowing the dough more time to rise can solve this problem
(Spaull and Bruce-Gardyne, 2003). However, extending the proving time defeats the main
advantage of the CBP over the bulk fermentation process.
2.2 Aeration throughout breadmaking
A significant proportion of bread’s volume is gas. As a result, the characteristics of bread are
largely determined by its gas cells. Controlling the aeration of bread dough during each stage
of breadmaking is therefore important in achieving the desired characteristics in bread. Their
volume, orientation and quantity play an important role in the texture of the bread
(Campbell et al., 1999) and their eating qualities, such as their ability to mop up a sauce,
which is dependent upon surface area. The space they occupy and their influence on the
surrounding matrix also affects the crumb structure (Cauvain et al., 1999). During the
different breadmaking stages, gas is entrained and disentrained. Retention of entrained gas is
important and relies on the cells being stable. Cell stability is determined by their mechanics,
which are described in Section 2.2.1. This section also explains how gas is entrained and
disentrained in the dough, as well as giving examples of other aerated foods. Section 2.2.2
describes how adjusting the mixing parameters can affect bread dough aeration. In Section
2.2.3 methods of measuring the aeration of bread dough are described. Finally, this section is
summarised in Section 2.2.4.
2.2.1 Entrainment and disentrainment of gas
Aeration of foods is a popular process, mainly due to its textural benefits (Campbell and
Mougeout, 1999), and also due to the financial benefits of selling the consumer more air for
their money. As well as bread, aerated foods include beer, ice cream, chocolate (Aero, Milky
Way, Wispa), and soufflés, to name a few. Aerated chocolate can be marketed to the calorie
conscious as light, and aerated drinks have the appeal of fizziness.
The method of aeration varies depending on the product. Methods used to aerate food
include (1) steam generation, which causes thermal expansion of gas within cells, (2)
whipping of low-medium viscosity liquids to traps air, (3) use of chemical raising agents, (4)
rapid dry heating to cause surface blistering, and (5) gas injection. Bread dough is a high
viscosity paste and is aerated through mixing and fermentation.
The structure of bread depends on the creation of gas cells during mixing and the effect of
subsequent processing on manipulation and retention of these cells. The cells are
incorporated during mixing, as the rough layers of dough fold over itself, enveloping pockets
of gas with diameters on the micrometre scale. These gas pockets become the gas cell nuclei
for the carbon dioxide generated by yeast to diffuse into and expand. However, not all cells
will expand. A large number of cells incorporated during mixing are not visible in the final
bread, as they do not grow or are physically unstable (Vliet, 1999). Shimiya and Nakamukra
(1997) suggested that cells smaller than 100 µm in diameter during baking dissolved into the
aqueous phase and concluded that cells must reach a critical size to expand. This is why it is
vital that a sufficient number of gas cells of optimal size distribution are created during

34
mixing. Another is yeast cannot create new gas cells (Baker and Mize, 1941). Equation (2), the
Laplace-Young equation, explains this:
b
(2)
where:
Pb = pressure inside the cell (N m-2)
P∞ = pressure outside the cell (N m-2)
σ = surface tension (N m-1)
r = cell radius (m)
The pressure inside the cell is greater than the pressure outside the cell, and the smaller the
cell, the greater its internal pressure. If yeast were to generate a new cell, the starting
radius would be zero, so the yeast would have to generate an infinite amount of pressure to
create a new cell.
Initially the gas cells are largely full of nitrogen due to nitrogen’s low solubility in water,
compared to carbon dioxide and oxygen. During proving, yeast generate carbon dioxide,
creating a concentration gradient which aids the diffusion of carbon dioxide into cells. Carbon
dioxide is high soluble, and diffuses into the aqueous phase until saturation is achieved.
As yeast ferment, the carbon dioxide concentration increases, expanding cells through the
pressure generated inside them. The relationship between these parameters is governed by
the ideal gas law (3):
PV = nRT (3)
where:
P = absolute pressure (N m-2)
V = volume of gas (m3)
n = number of mol of gas (kg mol)
R = universal gas constant (8.31 J mol-1 K-1)
T = absolute temperature (K)
It is not just the growth of the cells that is important, but also the rate at which the cells
grow. To obtain a regular crumb, it is crucial that the cells grow at roughly the same rate
(Vliet, 1999).
Once cells are entrained in the dough, there are a number of forces which determine whether
they break up. The ratio of forces acting on breaking the cell to the surface tension which
stabilises it is given by the Weber number.
(4)
where:

35
We = Weber number
τ = Shear stress (N m-2)
d = cell diameter (m)
σ = Surface tension (N m-1)
Depending on the processing factors and the ingredients used, the maximum stable cell
diameter will vary. Cell breakup occurs when the forces tending to rupture the cell are
greater than the forces stabilising it.
The rheology of the dough is also key in retaining the cells and achieving high quality bread. A
high viscosity dough is required to prevent the ascent of cells and an extensible dough is
required to prevent cell rupture and to allow the dough to rise on baking.
Campbell and Shah (1999) demonstrated that both entrainment and disentrainment of gas
occurs throughout mixing. Disentrainment occurs as the mixer blade cuts through the dough
and ruptures existing cells (Campbell, 1991). In proving and baking, gas continues to be
disentrained. This generally occurs once the cells have significantly increased in volume and
are no longer stable and break up
Cell coalescence is the fusion of cells caused by rupture of the dough film between them.
Rupture of a dough film is caused by development of weak spots resulting from local thinning
(Vliet et al., 1992; Vliet, 1999). The resistance of these dough films against biaxial extension
determines the stability of the dough films against coalescence. Excessive coalescence causes
a large loss of gas, resulting in a large loss in loaf volume. Coalescence is the main instability
mechanism that occurs at the end of proving and during early stages of baking (Vliet, 1999)
due to increased carbon dioxide production by yeast and the formation of steam causing cell
expansion. Coalescence does not occur during mixing due to the cells being too small.
It is mostly accepted that cell disproportionation occurs at the later stages of proving and
during baking. Cell disproportionation is the diffusion mechanism through which gas is driven
from smaller cells to larger cells by Laplace pressure, the difference between the internal
and external pressure of the cell. As the Laplace pressure is greater in smaller cells than
larger cells, and gas solubility is greater at higher pressures, gas diffuses across the
concentration gradient. This self-accelerating process results in the growth of large cells at
the expense of smaller cells. The rate of disproportionation increases as the smaller cells
shrink and their internal pressure increases. However, it has also been argued that
disproportionation is unlikely, as gas from the cells would have to diffuse across the more
concentrated dough matrix (Dobraszczyk et al., 2001).
Dobraszczyk et al. (2001) found the strain hardening properties of a material to affect cell
rupture. The authors found that doughs with a higher strain hardening value have a greater
failure strain, meaning they will inflate to a larger volume before rupturing. Strain hardening
is therefore an important parameter for determining the stability of expanding cells. Strain
36
hardening is responsible for the increase in stiffness as strain increases. It stabilises regions of
the cell wall that have been subjected to localised thinning, prolonging time to rupture.
2.2.2 Parameters during mixing affecting cells in bread dough
Mixing is the stage where bakers have the most control over the gas cells in bread dough.
Bakers vary the different parameters to optimise the gas cell distribution in order to achieve
the desired final product. The factors during mixing that affect the cells in bread doughs can
be divided into two groups. The first is the ingredients and the second the processing. In
Section 2.1.3, brief descriptions of the ingredient factors affecting the cells in bread were
given. This section describes the processing factors.
Gases
The use of different mixer headspace compositions produce bread of differing characteristics,
due to the different solubilities of gases and the dough chemistry. Gases which have been
used to fill the mixer headspace include oxygen, nitrogen, carbon dioxide, a mixture of these
gases in the form of air and in other proportions. Doughs can also be mixed in the absence of
gas, such as under vacuum, although mixing entirely under vacuum produces extremely dense
dough (Baker and Mize, 1937). In addition, the gas composition can be changed during mixing,
to achieve the desired effect on cell size distribution, as is done in the CBP. This alters the
cellular structure to that which would have been obtained from mixing under a single gas
composition (Martin et al., 2008).
For the UK manufacture of bread via the CBP, oxygen is essential for the oxidation of ascorbic
acid for dough development, helping the dough expand without rupture (Baker, 1941).
Oxygen also improves the crumb structure and bread volume. In Cauvain and Young (2006), it
was shown that Collins (1986) found on mixing different ratios of oxygen and nitrogen an
increase in bread volume, up to a concentration of 60% oxygen. Mixing under an atmosphere
of pure oxygen, however, is detrimental towards the crumb quality. It produces a coarse
bread, resembling that of vacuum mixed doughs (Chamberlain and Collins, 1979). This is due
to the yeast carrying out large quantities of aerobic respiration and producing more carbon
dioxide. This causes the cells present to coalesce or breakup (Baker and Mize, 1941).
As with oxygen, mixing dough under an atmosphere of pure carbon dioxide results in a dense
dough, and produces loaves of low volume with a coarse crumb (Martin et al., 2008). The
authors also noted that the absence of carbon dioxide limits dough development. However,
the high solubility of carbon dioxide gives the advantage of gas transfer to and from the cells
and dough matrix on altering the pressure, thus enabling more control of the gas distribution.
Nitrogen is an essential gas during mixing, required for fine crumbed bread and yeast
metabolism. Mixing under an atmosphere of pure nitrogen, however, has undesirable effects.
It results in the production of a soft and sticky dough which is difficult to handle and dense
when baked (Chin, 2003; Baker and Mize, 1937). This is due to the absence of oxygen.

37
The effect of different gases and their proportions illustrate the importance of mixer
atmosphere in the processing of bread and determining its characteristics. In the CBP, air is
used as the mixer atmosphere for the majority of the mixing process. Air contains a
combination of gases which produce bread of acceptable quality. There is also no cost
associated with air, compared to use of alternative gases.
Pressure
The pressure in the mixer affects the number and volume of cells in the dough. This is due to
gas solubility being affected by pressure. Solubility of gases increases at higher pressures,
thus at higher pressures there is an increased quantity of gas in the mixer headspace and thus
the dough. On the other hand, at lower pressures, fewer cells are incorporated into the
dough, resulting in less surface area for carbon dioxide diffusion during proving causing loss of
a greater quantity of carbon dioxide to the atmosphere (Campbell et al., 1998; Shah et al.,
1999). This produces denser bread (Chin et al., 2005) with a coarser crumb (Martin et al.,
2008).
The two extremes of pressure are a high pressure and vacuum. The number of cells in dough
following mixing is proportional to the mixing pressure (Campbell, 1998). In the CBP, mixing
begins at a positive pressure under air. This increases the oxygen concentration in the mixer
(Chamberlain and Collins, 1979) and the quantity of gas entrained in the dough, resulting in
the formation of a greater number of new cells within the dough (Campbell, 1991). Mixing at
a lower pressure, results in fewer cells and thus lower gas retention (Campbell et al., 1998;
Campbell, 1991). This can result in a finer texture, due to there being fewer cells initially and
so coalescence less likely to occur. Mixing under vacuum results in a coarse bread of low
volume (Baker and Mize, 1937). The gas cells are few and large. This is due to the removal of
gas, which is necessary in creating the gas nuclei during mixing. The lack of oxygen also
affects the chemistry of the dough. Pressure-vacuum mixing, however, produces a fine
crumb. It causes the expansion of cells under the reduced pressure, allowing them to be
subdivided into more cells (Hoseney, 1985). As mixing continues, the cell volume tends
towards its new steady state.
The mixing pressure does not just affect the gas solubility and availability, it also affects the
time to dough development and the dough consistency. When mixing at higher pressures,
oxygen availability is increased, reducing the mixing time and work input required to achieve
dough development (Chin and Campbell, 2005a). The dough consistency changes depending
on the mixing pressure, due to lower pressures drying out the dough. Therefore, the lower
the mixing pressure, the more water that must be added to the dough.
These factors highlight the importance of mixing pressure in obtaining desirable dough
characteristics.

38
Dough development
One of the aims of mixing is dough development. When a dough is fully developed, all the
flour particles should be hydrated (Hoseney, 1985), the dough should be viscoelastic with its
gas content at the dough’s maximum capacity and gas cells should be retained without
rupture. To develop a dough, energy must be input to the dough.
Every flour has a critical amount of work required for dough development that will produce
the best bread. Mixing speed and time are the two main factors which determine the work
input on dough. Kilborn and Tipples (1972) found however, that whilst the mixing speed can
be used to compensate for the mixing time, the adverse is not the case. They found that each
flour has a minimum mixing speed, known as the critical mixing speed, below which dough
development cannot be achieved, regardless of the level of work input. This is due to mixing
simultaneously aligning and misaligning molecules within dough. Mixing below the critical
mixing speed facilitates misalignment of concatenations (Dobraszczyk et al., 2001) and
produces a soft and sticky dough lacking spring. Bread made from this dough is inconsistent,
has a reduced volume, and is generally of lower quality. It is agreed that increasing mixing
speed for a set mixing time increases dough aeration through greater efficiency, producing
loaves of greater volume (Campbell et al., 1993, Campbell et al., 1998; Campbell et al.,
2001, Chin, 2003; Chin and Campbell, 2005b). In addition, mixing at higher speeds means less
time is needed to reach peak dough development. To continue mixing once peak development
is reached is termed unmixing. It is detrimental and results in the dough reverting to having
the appearance of underdeveloped dough (Kilborn and Tipples, 1972; Cauvain, 2000).
Unmixing induces stress on gluten molecules, overstretches them and causes them to
disintegrate (Spaull and Bruce-Gardyne, 2003). This produces a wet and sticky dough
(Hoseney, 1985) of lower extensibility and elasticity (Calderón-Domínguez et al., 2008). A
reduction in dough extensibility reduces its ability to withstand the increasing pressure of
growing cells.
As mentioned above, of the two main factors that affect dough development, mixing speed is
the more important factor. The mixing time should be chosen around the critical mixing
speed. Factors to consider when deciding upon the mixing time include: (1) a mixing time
corresponding to dough development, (2) mixing conditions to allow entrainment of an
optimum cell volume distribution, and (3) an optimal dough temperature at the end of mixing
for optimal further processing.
With this section in mind, it is vital that bakeries optimise the mixing speed and time for each
dough formulation they use, in order to fully develop each dough.
Mixing Scale
Dough aeration increases on scale-up, resulting in an increased quantity of gas in the dough
(Campbell and Shah, 1999; Chin, 2003; Martin et al., 2004b). Martin et al. (2004b) found that
by changing the mixing scale whilst maintaining other parameters, the dough contained the
same numbers of cells with a different volume of gas. The effects of mixing scale are

39
important to bear in mind, as due to cost, convenience and availability, mixing in this PhD
took part in a scaled down version of the industrial Tweedy mixer. These differ in scale by a
factor of 600.
Mixer Design
The mixer design affects the mixing action. The mixing action is dependent on the shape of
the mixer bowl, the blade geometry, the mixing speed and the rheology of the dough. The
mixing action is important for dough development, as this is how the energy is transferred
into the dough and also determines the dough rheology, which in turn affects dough aeration.
Mixing actions which rub, cut or tear the dough damage it and should only be used if this
damage is corrected later on in the breadmaking (Baker, 1941). Desirable mixing actions
include folding, stretching and squeezing the dough. The type of mixing action used affects
the density of the dough (Peighambardoust et al., 2010) and the cell volume distribution in
the dough (Campbell et al., 1991).
Therefore, the quantity of gas incorporated, dough rheology and dough development depends
on the mixer action and design. This again emphasises the importance of each detail during
mixing on the cellular structure of the dough.
2.2.3 Measuring aeration throughout breadmaking
Bread dough aeration is an important quality parameter. Studies using a range of
methodologies have been conducted investigating bread dough aeration at the different
stages of breadmaking. These are detailed in this section. As the gas contribution towards the
voidage is located in cells and its distribution is important, both voidage and cell size
distribution in dough have been investigated. Whilst obtaining an accurate voidage
measurement is relatively simple, obtaining the cell size distribution has proved challenging
due to dough being opaque and its fragile structure requiring careful handling in order not to
alter the cell size distribution (Bellido et al., 2006; Wagner et al., 2008a).
Literature shows that the use of density measurements is the most common method of
determining bread dough aeration. This method has developed since 1946 when Baker and
Mize measured the displacement of known weights of dough with oil. Since then, methods
used include placing dough into liquids of known densities to find that of which the dough is
neutrally buoyant (Campbell, 1991; Campbell et al., 1993), with some researchers freezing
their dough beforehand for convenience and ease of handling, with the belief that dough
structure is little influenced by freezing (Scanlon et al., 2008). This is unlikely, however, due
to the thermal stresses induced by water as it freezes (Whitworth and Alava, 1999). Since
2001 the double cup method has been a popular method of determining dough density
(Campbell et al., 2001; Chiotellis and Campbell, 2003; Chin et al., 2004; Martin et al., 2008).
The double cup method was used for work in this thesis and is detailed in Section 3.4.3. It is
convenient and has the advantages of being accurate, quick, simple, requiring no sample
preparation and enabling measurements to be taken dynamically.

40
Dynamic measurements of dough aeration have also been monitored using a
rheofermentometer with a gasometer unit recording carbon dioxide pressures (Shah et al.,
1999) and through collection of the carbon dioxide produced (Peighambardoust et al., 2009).
Every method has its pros and cons. For example, the rounding of the small samples in the
method used by Peighambardoust et al. (2009) is likely to have caused loss of gas, impairing
the accuracy of the results. Advantages of this method includes ease of obtaining the
equipment, and the small sample size requiring only a small quantity of ingredients, which
can be useful if working with rare flour varieties or scarce quantities of flour.
Change in dough volume has been monitored via digital image analysis to determine changes
in dough voidage (Shehzad et al., 2010). Models have also been developed to determine
dough aeration, based on experimental results. Elmehdi (2003) developed a model based on
the non-invasive technique, ultrasound. Velocity and attenuation of ultrasonic waves through
the dough was plotted as a function of proving time. Changes in the velocity and attenuation
coefficient illustrated the potential of low frequency ultrasound in detecting changes in the
dough structure. Shah et al. (1999) developed a model for proving, enabling carbon dioxide
production and cell growth to be investigated. However, the cell size distribution,
coalescence, yeast kinetics and dough properties were ignored, resulting in an overestimation
in cell growth. This model was later extended by Campbell and Herrero-Sanchez (2001) to
incorporate a range of cell size distributions. Although the model generated improved results,
a number of simplifying assumptions had been made. Huang and Kokini (1999) and Martin et
al. (2004a) also developed models for dough aeration. Martin et al. (2004a) used a population
balance model to model bubble entrainment, disentrainment and break up over the whole
duration of mixing. Understanding these parameters enables improved control of mixing,
helping deliver the desired structures in breads. The authors solved their population balance
model for different cell breakup scenarios: various breakup, no breakup and instantaneous
breakup, although they concluded from the results that the instantaneous breakup model
could not quantitatively describe the results throughout the whole mixing process. However,
good agreement was found between their no breakup and various breakup model with
experimental results. Their no breakup population balance model is used in Chapter 5 of this
thesis to assess the effect of sugar on bread dough aeration. It uses voidage measurements
from experiments to assess the degree of entrainment and disentrainment during mixing and
was developed to account for the experimental voidage changes during mixing following a
pressure step change. A detailed description of the model is given in Section 2.2.4.
Gas production has also been monitored throughout baking using a gas analyser equipped with
an infrared detector in the oven (Zhang et al. 2007; 2008). Magnetic resonance imaging (MRI)
has proved a popular technique for monitoring dynamic processes (Grenier et al., 2003; Zhang
et al., 2007; Wagner et al., 2008a; Guio et al., 2009). It is based on nuclear magnetic
resonance (NMR) and relies on energy absorption and emission. Researchers have distributed
microcapsules throughout the dough and related changes in their positions to the structural

41
changes in dough. However, use of microcapsules throughout dough can interfere with cell
mechanics and heat and mass exchange (Wagner et al., 2003).
An established method of determining the aeration of finished bread is through density
measurements using the seed displacement method (Calderón-Domínguez et al., 2008).
Although time consuming, this method is simple and inexpensive.
As mentioned previously, accurately determining cell sizes in bread dough has proved a
challenging task. Over the years, the methodology for determining cell sizes in dough has
advanced significantly. Higher resolutions are now obtained, using non-destructive and non-
invasive techniques. Table 2.1 lists some resolutions and cell densities obtained using
different imaging techniques on bread dough from some publications which are discussed in
this section. Some variation is expected amongst the observed cell densities due to the
different techniques used, their resolutions and differences in ingredient formulations and
dough processing.
Table 2.1 Techniques used for imaging cell size distribution
Authors, year Technique Resolution (µm) Cell density
Carlson and Bohlin,
1978 Light microscopy 90 87600 cm-3
Bloksma, 1990 Microscopy - 105-108 cm-3
Campbell et al., 1991 Microscopy 39 78500 cm-3
Campbell et al., 1991 Microscopy 39 33 100 cm-3
Shimiya and
Nakamura, 1997
Optical microscopy,
light microscopy 3, 40 300 cm-3
Whitworth and Alava,
1999 Optical microscopy 28 -
Whitworth and Alava,
1999 SEM 50-3500 -
Whitworth and Alava,
1999 X-ray CT 1000 -
Bellido et al., 2006 X-ray CT 10 30410 cm-3
Bellido et al., 2006 X-ray CT 10 56540 cm-3
Whitworth, 2008 X-ray CT 680 -
Babin et al., 2008 X-ray CT 15 -
Turbin-Orger et al.,
2012
X-ray CT on
synchrotron 5 -
Ultrasound is an example of a non-invasive technique that has been used to measure the cell
size distribution in bread dough (Leroy et al., 2008; Scanlon et al., 2008). Through use of
different ultrasonic frequencies, different structural features can be detected, and cell sizes
can be determined. This is due to the large density difference between the dough matrix and
cells, and the ease in propagation of ultrasonic waves depending on material density. Cell

42
size determination relies upon the dependency of characteristic resonance frequency on cell
size. Although ultrasound is non-invasive, like microscopic techniques, preparation of the
sample can alter its structure. Microscopy was the first technique used in literature to
measure cell size distribution in bread dough. Using light microscopy, a resolution of 90 µm
was obtained (Carlson and Bohlin, 1978). Cells as small as 5 µm in diameter have now been
reliably detected (Turbin-Orger, 2012) and it is likely that smaller cells exist, thus the cell
size distribution obtained from Carlson and Bohlin would have been inaccurate, due to a
significant number of undetected cells.
There are many types of microscopy and although they can be used to visualise structures
which cannot be seen by the unaided human eye, the use of 2D images are not as useful as 3D
images. In 1991, Campbell et al. noted that when measuring the cell diameter from a 2D
image, the diameter is likely to be underestimated, due to the likelihood of cells being sliced
off centre, thus the authors extended Carlson and Bohlin’s method to take this into account;
the addition of a stereological technique was used to reconstruct the true cell size from the
2D images. The authors were able to measure cells as small as 39 µm in diameter, and found
a mean cell diameter of 71 µm and 89 µm in food processor and Tweedy 10 dough
respectively and noted the observed voidage was always lower than density measurements.
This is likely due to the resolution causing both smaller and larger cells to be missed.
Campbell et al., (1991) used the technique of digital imaging to obtain the cell size
distribution within their dough samples. Digital imaging techniques are popular due to their
speed, reduced difficulties in quantifying structural features (Falcone et al., 2006). and
reduced susceptibility to human error (Sapirstein, 1999; Zghal et al., 1999, Bellido et al.,
2009; Pérez-Nieto et al., 2010). Unfortunately, they have the disadvantage of thresholding
deviations having a significant effect on results (Sapirstein, 1999).
Scanning electron microscopy (SEM) has also been used to obtain cell size distributions
(Whitworth and Alava, 1999; Calderón-Domínguez et al., 2008; Baron and Butler, 2008).
Electron microscopy focuses a beam of electrons onto the sample. Through emission and
reflection of the sample surface, the topography of the dough can be obtained. Confocal laser
scanning microscopy (CLSM) is another method which uses microscopes to visualise bread
dough structure (Dürrenburger et al., 2001; Li et al., 2004; Upadhyay et al., 2012). The
sample is uniformly illuminated and images are taken from one focal plane, which can be
assembled to give the 3D structure of the dough. Thin sections of thick samples can be
imaged with CLSM. However, only cells close to the surface can be visualised and it is possible
that the cell size distribution here differs to the bulk of the dough (Deshlahra et al., 2009). In
addition, samples need to be treated for visualisation, which although useful for highlighting
certain components can alter their structure. Shimiya and Nakamura (1997) used optical
microscopy and stereomicroscopy to investigate cell size distribution in bread dough,
obtaining resolutions of 3 µm and 40 µm, respectively. 3 µm is the lowest 2D resolution of
bread dough imaging published to date. However, their methodology sacrificed precision.
Dough samples were compressed between glass slides. Preparation of their dough most likely

43
altered cell volumes, caused some cell rupture, and led to a number of cells being
undetected, as reflected by the lower cell number they detected compared to others. This
illustrates the necessity of a non-destructive method for obtaining the cell size distribution in
bread dough.
In 2006, Falcone et al. published a review on techniques used to study the microstructure of
food. They illustrated the wide range of techniques that have been used and showed how
choice of techniques depended upon the product being investigated i.e. how fragile it is and
whether it is susceptible to the technique. The authors highlighted that preparation of
samples for microscopic techniques frequently result in artefacts, thus they recommended
that more than one microscopic technique is used in obtaining results. With this in mind and
the generation of 2D images, micrographs cannot accurately represent the cell size
distributions in bread dough, as reflected by the increasing popularity of X-ray imaging seen
in the increase in number and development of synchrotron facilities worldwide. X-ray CT is
based on the contrast in X-ray images, arising from differences in density within samples. X-
rays are passed through an object from different angles, producing images that show the
density differences at different points throughout the sample. These images, known as
orthoslices, can be stacked up using a technique called X-ray CT to generate a 3D distribution
of material density within the object. Currently, sub-micron resolution is attainable in the
laboratory. However, high resolutions are at the expense of a longer acquisition time and
smaller sample sizes, and must be achieved without compromising the field of view. X-ray CT
is used in many applications including medicine, material science, geology, biology, chemical
engineering and also food, mainly to study the microstructure of aerated food products and
its relation to the properties of these products. Some foods investigated include ice cream,
dairy samples and dried vegetables (Dalen, 2012); chocolate (Frisullo, 2010), processed meat
(Frisullo, 2009), and bread (Whitworth an Alava, 1999; Falcone, 2005; Bellido, 2006; Babin,
2006; 2008, Whitworth, 2008; Turbin-Orger, 2012). Lim and Barigou (2004) listed some of the
advantages of X-ray CT over microscopy. These include (1) samples can be visualised in their
natural state at atmospheric pressure, preventing sample preparation artefacts, (2) high
spatial resolution, and (3) 3D details of the inner microstructure as opposed to surface
structure can be captured. Synchrotron light consists of beams of X-rays, infrared and
ultraviolet light, combined into an intense light. This intense light is generated by
synchrotron beamlines, through use of particle accelerators, which cause the electrons to
change direction. Synchrotron X-rays have all the benefits of X-rays over microscopic
techniques, as well as the advantage of being able to image a larger range of materials and
sample thicknesses than conventional sources, and produce images of higher resolution and
contrast. Through using coherence and phase contrast branches of synchrotron beamlines, it
is possible to obtain resolutions beyond the limitations of the detector and X-ray optics, and
obtain better contrast, enabling features of similar density to be distinguished.
Researchers investigating bread dough aeration have used X-rays to obtain detailed
information on the cellular structure of bread dough during proving (Turbin-Orger et al.,

44
2012), and both proving and baking (Whitworth and Alava, 1999; Babin et al., 2006; 2008,
Whitworth, 2008), on dough generally (Whitworth and Alava, 1999) and finished bread
(Falcone et al., 2005). Babin et al. (2006) observed little change in the cell structure and cell
wall structure during baking and illustrated the significance of proving on the cell structure of
bread.
In recent years, the synchrotron has been used to probe into the dynamic structure of dough
(Babin et al., 2006; 2008; Turbin-Orger et al., 2012). Although researchers using this
technique have published the cell size distributions of dough samples, they have not utilised
the synchrotron to its full capacity and provided cell size in terms of mean diameter, as
opposed to volume. Cell volume is more representative of cell size than cell diameter, as
images of cells show cells to range from spherical to ellipsoid in shape (Babin et al., 2006;
2008; Bellido et al., 2006).
The use of conventional X-ray CT to visualise the microstructure of dough has cost and
availability advantages over synchrotron light. Like the synchrotron, conventional X-ray scans
are a non-destructive and non-invasive method of determining the microstructure of dough.
Conventional X-ray sources can also produce high resolution and contrast images, enabling the
dough voidage, the number of cells and their volume and the distance between cells to be
determined, and visualisation of cell interaction and dynamic processes through fast X-ray CT
(Whitworth and Alava, 1999; Whitworth, 2008). The authors obtained a resolution of 1 mm
and 0.7 mm respectively – much lower than the resolution X-ray CT is capable of obtaining,
illustrating the importance of the instrument used and the sample set up. One problem with
using X-ray CT to visualise dough microstructure is the micrometre scale diameters of the
cells means detection of the smallest cells requires the dough sample to be on the millimetre
scale size. Therefore in order to obtain a more representative insight into the microstructure,
either experimental repeats, or the scanning of a range of sizes of dough samples is
necessary.
Attempts to quantify the microstructure of dough throughout mixing using X-ray CT were
previously made by a research group at the University of Manchester. The group looked at cell
size distribution and voidage distribution in both single pressure doughs and doughs subjected
to pressure-vacuum mixing. Their results were not published due to the large disparity
between the density measurements obtained via the double cup method and X-ray CT. This is
illustrated in Figure 2.2, where some of their results are presented. The research group
experimented with their sample set up and X-ray settings, but felt the root of their problem
was the sample handling. They felt the sample was compressed a lot to get it into the sample
holder, resulting in a non-representative dough sample. This illustrates the challenge
encountered when handling the fragile dough samples, and highlights that quantitative
information obtained from published X-ray CT work, like other methods relies upon a suitable
method of sample preparation.

45
Figure 2.2 Unpublished voidage measurements obtained from X-ray CT. The results show the
voidage measured from X-ray CT and the double cup method, illustrating the large disparity
between the measurements.
As well as X-ray CT, the degree of aeration in finished bread can be analysed through digital
imaging software such as the C-Cell imaging system which investigates the bread crumb
structure (Sroan and MacRitchie, 2008; Martin et al., 2008b; Whitworth, 2008). The C-Cell
imaging system was developed by the Campden and Chorleywood Food Research Association
for evaluation of bread. It is quick and easy to use and produces consistent results. It was
used for work conducted within this thesis and is detailed in Section 3.3.5.
2.2.4 Quantifying aeration using a population balance model
The population balance model published by Martin et al. (2004a) was the first model that
enabled prediction of the voidage response to pressure step changes and thus enable design
of pressure-vacuum mixing procedures. The model was also the first to provide a reliable
measurement of the gas entrainment rate into the dough and therefore the oxygen available
for dough chemistry. However, a limitation of the model is that only a small number of
standard estimated cell sizes were used in the model. Section 6.3 in this thesis applies the
cell sizes obtained from X-ray tomography to assess the validity of this model. This section
describes the model. The scenarios to which the model can be applied, some equations in the
model, how parameters within it relate to the experiments and the assumptions made on
application of the model are also discussed.
One of three scenarios can be made to which the model can be applied: the two extremes:
instantaneous cell breakup and no cell breakup, and the option in between, variable cell
breakup, which is the most realistic situation. Results published by Martin et al. (2004a)
showed the instantaneous breakup model did not representatively model the aeration process
throughout the whole mixing process. The other two scenarios showed a good fit to
experimental results, with the no breakup model simplifying the equations involved, thus this
option was used to model aeration in the three different sugar content doughs.

46
Ρdough
Ρgf
The no breakup model is based on the assumption that no cell breakup occurs over the mixing
session and therefore the number of cells is constant over the step change.
It is important to model the ex-situ dough properties as these are the dough conditions for
the next stage of the breadmaking process. For ex-situ measurements the dough is at
atmospheric pressure and therefore density and voidage measurements are taken at
atmospheric pressure. Dough voidage and density are related using the gas free dough
density, as seen in Equation (5).
Φoutside = 1- (5)
where Φoutside is the dough voidage outside the mixer, and ρdough (g cm-3) and ρgf (g cm-3) are
the dough density and dough voidage respectively.
However, if the dough was mixed at a different pressure, the dough experiences an almost
instantaneous change in external pressure on removal from the mixer to atmospheric
pressure.
Cells will respond to a change in external pressure. The pressure of a bubble of radius r with
a dough height of z above it, is the sum of four components: the external pressure, P, the
hydrostatic pressure, pgz, the effect of surface tension, σ, Pσ = 2σ/r, and the extra pressure
due to the stresses generated by mixing, Pτ. The hydrostatic pressure is negligible given the
size of the dough piece. Campbell et al., (1998) estimate the surface tension pressure to be
0.016 bar, and the extra mixing pressure to be 2 bar throughout mixing and zero as soon as
mixing comes to an end. The extra mixing pressure only occurs in dough regions experiencing
large rates of deformation, compressing cells in these regions until the deforming regions
move on and the region returns to ambient pressure. During pressure vacuum mixing, the
headspace pressure is changed from one pressure P1 to another pressure, P2, and on removal
of the dough to atmospheric pressure, Patm. This occurs within a couple of seconds (Martin et
al., 2004a). The proportion of cells compressed is assumed to be insufficient to affect the
mean dough voidage. Equation (6) takes into account this step change and relates the
voidages before and after the step change using the ideal gas law:
insideatm2
inside
atm
2outside
1/1
PPP
P (6)
where Φinside is the dough voidage inside the mixer, Patm is the atmospheric pressure (bara), P2
is the second mixing pressure (bara) and Φoutside is the dough voidage outside the mixer.
The model involves a mass balance of dough aeration, where the net birth rate of cells
depends upon (a) incorporation of cells through entrainment; (b) loss of cells through
disentrainment; (c) loss of cells through breakup; (d) incorporation of cells through larger
cells breaking up into smaller ones. Gas is entrained when two dough surfaces come into

47
contact, trapping gas between them. The model assumes this is independent of other
conditions and therefore the number of cells entrained per volume per revolution, Nin, is
constant. There are three stages of cell break up as proposed by Campbell et al. (1998) based
on the experimental finding that the number of cells per volume of dough, is approximately
proportional to the mixing pressure: (a) entrained cells have the same pressure as the
headspace and a volume independent of the headspace; (b) all cells are compressed to the
same volume by any change in mixing pressure; (c) compressed cells break up into cells of
constant volume and the number of cells depends upon the compressed volume. Equation (7)
expresses the ratio of the compressed cell volume at pressure P + Pτ to the uncompressed
volume at pressure P:
(7)
If Pτ is large and constant compared with P, then the number of cells per unit volume is
approximately proportional to P.
It is assumed here that only small regions of the dough are stressed and break up only occurs
in these regions. The release of stress from these regions immediately results in the cells
returning to their original pressure and expanding.
It was hypothesised for design of the model that the probability of cell breakup and
disentrainment phenomena is proportional to cell volume, with disentrainment being more
likely in larger cells. The model makes a series of additional assumptions for simplicity and its
functioning: (1) cells are evenly distributed throughout the dough during mixing, (2) cell
growth does not occur, (3) mixing is rate-independent, (4) the only significant property of a
cell is its volume, (5) the pressure change occurs instantaneously (6). All cells have the same
volume, Vin, regardless of headspace pressure, and (7) coalescence is negligible because of
the high viscosity of the continuous phase and the relatively low voidage.
The model is fitted to the results through and using Solver in Microsoft Excel to minimise the
root of the mean of the squares of absolute errors (RMSE) by changing the parameters: initial
voidage, entrainment rate and disentrainment coefficient.
The model fitting for the no breakup model following a step change is based on Equation (8):
where the first term on the right hand side of the equation models the voidage contribution
of cells entrained after the step change and the second term the voidage contribution prior to
the step change. The nomenclature for Equation (8) is as follows:
Φ dough voidage (volume of gas per unit volume of dough)
NinVin Φ = (1-e-VinwdCd(ζ-ζ0)) + Φstep+e-(P1/P2)VinwCd(ζ-ζ0)
VinwdCd
(8)

48
Nin number of cells entrained per unit volume per revolution
Vin standard entrained cell volume (mm3)
wd disentrainment frequency per unit volume
Cd cell disentrainment probability constant of proportionality
ζ number of mixer revolutions
ζ0 number of mixer revolutions at initial state
P1 first mixer headspace pressure
P2 second mixer headspace pressure
Φstep+ voidage immediately after the pressure step change
2.3 Summary of bread’s history, significance and manufacture
Bread is an aerated food made from a mixture of grains and liquid, and is consumed
worldwide. Its microstructure determines its characteristics and plays a significant role in its
popularity amongst consumers. Different bread products are purchased for their qualities
which are dependent upon their cell size distributions. Ciabatta is enjoyed for the large cells
which can hold pools of olive oil, and sandwich bread is enjoyed for being soft and uniform, a
result of the many small cells that make up the product. The aerated structure of bread
begins during mixing and changes over the breadmaking process. It is important to determine
the cell size distributions following different processing parameters and ingredients to
understand the links between the processing variations, cell size distribution and quality of
the final bread produced. A large number of techniques have been used over the years to
measure dough voidage and investigate its microstructure, both statically and dynamically.
Recent years have seen an advance in the study of the fragile material through use of non-
invasive and non-destructive methods, at increasingly high resolutions. In 2012, a publication
detailed the observation of cells as small as 5 µm in diameter using X-ray CT via a
synchrotron. This is the highest resolution of 3D bread dough imaging to date and although
the resolution was not high enough to conclude that cells smaller than this exist, this and
other benefits of the technique highlights the superiority of X-ray imaging via a synchrotron
beamline over other imaging techniques.

49
Chapter 3 - Experimental methodologies
3.1 Outline
Chapter 3 is the first experimental chapter in this thesis and is present to ease reading of the
upcoming experimental chapters through presenting material that would otherwise be
repeated throughout this thesis. This chapter is divided into four main sections: Section 3.2
and Section 3.3 list the materials and equipment used, respectively. Section 3.4 describes the
analytical techniques used throughout this thesis. Section 3.5 characterises the flour and
dough formulations used throughout this thesis.
3.2 Materials used
The materials used for this thesis and their procurement sites are presented in Table 3.1. Due
to experiments having been performed on different formulation doughs, their quantities for
each experiment are detailed in the relevant experiment.
Table 3.1 Experimental materials and their procurement sites
Material Procurement site
Flour a, 10.1% protein 3663, High Wycombe, UK
Flour b, 10.4% protein 3663, High Wycombe, UK
Flour c, 11% protein 3663, High Wycombe, UK
Flour d, 11.5% protein 3663, High Wycombe, UK
Flour e, 15% protein Waitrose, Berkshire, UK
Water University of Manchester, Manchester, UK
Sugar Tate & Lyle, London, UK
Salt Sainsburys, Holborn, UK
Cornflour Sainsburys, Holborn, UK
Fresh yeast Sainsburys, Holborn, UK
Quick yeast Doves Farm, Berkshire, UK
Sunflower oil Waitrose, Berkshire, UK
Vegetable fat Trex, Liverpool, UK
Ascorbic acid Holland & Barretts, Nuneaton, UK
Dough improver CSM, Manchester, UK
Bread loaves Supermarkets, UK
5 cs Silicone oil Basildon Chemicals, Oxon, UK
Five flours were used due to their differing protein contents. Their protein contents were
10.1%, 10.4%, 11%, 11.5% and 15%, according to packaging, corresponding to flour a, b, c, d
and e, respectively. Technically, flours a and b are classified as weak flours, and flours c, d

50
and e as strong flours, due to their protein contents. Note that although five flours were
used, these were not simultaneously compared on each occasion. Initially two flours were
procured, flours a and c, their packaging labelled as plain flour and strong white flour. These
are generally referred to as “weak” and “strong” flour respectively. Experiments were usually
conducted on both flours to test that the results were not just applicable to that flour.
Sufficient flour from the same batch was procured for all experiments in this study. This plan
eliminated the need for multiple flour characterisations and ensured that flours with identical
properties, the deterioration associated with age aside, were used throughout all
experiments. However, an equipment fault led to the repeat of a series of experiments, thus
more flour was procured. Flours b and d were brought to replace flours a and c. These were
the plain and strong flours sold by the food wholesaler 3663 at the time. Flour e was chosen
for its very high protein content, typical of a superior hard wheat grown in Canada, and used
for the fast X-ray imaging of bread dough proving described in Section 6.4 to ensure
representative visualisation of proving.
Fresh yeast was initially used in experiments due to it most closely matching the yeast used
for industrial breadmaking, in terms of confidence levels of active yeast. However, due to
fresh yeast being difficult to obtain, and its carbon dioxide producing properties not required
in all experiments, it was later eliminated from the dough formulation. When yeast was
required in the proving experiment described in Section 6.4, convenient quick yeast was used.
Within each formulation, although the sugar content changes, the quantities of the other
ingredients remain the same, and each formulation is presented on the basis of the sugar
content as a Baker’s percentage. Changing the quantity of water in proportion to the quantity
of sugar was considered to ensure gluten hydration and the relatively soft dough
characteristic of CBP doughs. The concern of the addition of water increasing dough stickiness
and causing processing difficulties, and how much the water content should be increased to
take into account the increasing sugar levels then arose. It is known that when increasing the
salt concentration during industrial manufacturing of bread, water levels are increased
(Hirning, 2010). However, the function of salt in a dough formulation differs to that of sugar
and therefore how the water levels are adjusted may vary. In a study on the effect of bran
levels during breadmaking processes, Campbell et al. (2008a) substituted weight for weight,
flour with bran, as wheat bran was found to increase water absorption. Measuring the water
absorption for each formulation would have been one method of determining how much water
should be added to compensate for the increased sugar levels. However, access to equipment
capable of this was not readily available.
3.3 Equipment used
Equipment used in the experiments described in Chapters 3-6 are listed in Table 3.2. Note not
every piece of equipment is listed. Standard equipment such as stopwatches and razor
blades, for example, have not been included in Table 3.2.

51
Table 3.2 Experimental equipment, their makes and information on use of the equipment
Equipment used Information
Tweedy 1 Mixer See Section 3.3.1
Nikon Metris 225/320kV X-ray CT See Section 3.3.2
Brabender Farinograph See Section 3.3.3
Newport Scientific Micro-Dough Lab See Section 3.3.4
Calibre C-Cell CC200.05 See Section 3.3.5
Stable Micro Systems TA.XT. Plus
Texture Analyser See Section 3.3.6
FEI Quanta 200 Environmental
Scanning Electron Microscope A type of scanning electron microscope
Kenwood Chef Classic KM336 Kitchen planetary mixer
Hinari Homebaker Breadmaker
Simon Rotary Test Baking Oven
Fischer Scientific ET100 Water Bath
Ohaus Explorer® Pro Mass Balance Accurate to nearest 0.01 g, used for weighing of salt,
ascorbic acid and dough improver
Mettler PE 6000 Mass Balance Accurate to nearest 0.1 g, used for weighing materials
not weighed on the Ohaus Explorer® Pro mass balance

52
3.3.1 Tweedy 1 mixer
The Tweedy 1 mixer is a scaled down version of the Tweedy mixer, the key component of the
CBP. It is used to produce bread industrially in numerous countries worldwide, including the
UK, New Zealand and Australia. Its name, “Tweedy 1”, is based on its capacity of 1 lb of
flour. The key feature of the mixer is its fast mixing speed, capable of producing a
homogeneous and developed dough in less than 5 minutes. In a typical low speed mixer, this
would take approximately 10 minutes. The Tweedy 1 mixer is illustrated in Figures 3.1 to 3.3.
Figure 3.1 Inside the Tweedy mixer
Figure 3.2 Outside the Tweedy 1 mixer with mixer lid in position
126 mm
135 mm
baffle
mixer blade
neoprene seal
clamp
valve attachment
point

53
Figure 3.3 Tweedy 1 mixer set up. This shows some of the equipment used alongside the
Tweedy mixer to control dough mixing and record mixing parameters
The mixer blade sits in the bottom of the mixer bowl. It is attached to a centrally rotating
spindle and consists of an octagonal base with two helical paddles. The shape of the blade
ensures a good shearing action during mixing. There are three baffles in the mixer bowl. Their
presence creates an obstruction, helping rotate the dough and ensuring thorough mixing. The
top of the mixer bowl is lined with neoprene. This ensures an airtight environment when the
lid shown in Figure 3.2 is fully clamped onto the mixer bowl. An airtight environment is
essential in maintaining the headspace pressure. To alter the headspace pressure or
composition, a gas pipeline must be attached to an attachment point. The degree the valves
are open affect the rate the headspace composition and pressure are altered. The pressure
gauge and gas flow monitor attached to the mixer allow the pressure and gas flow rate in the
mixer to be monitored.
The Tweedy 1 mixer is linked to a data acquisition computer, illustrated in Figure 3.3. Using
this set up measurements of the mixing speed, torque and time can be recorded.
The speed at which the Tweedy 1 mixer operates can be varied using the speed control box.
The speed settings range from 0-50, where 50 is equivalent to approximately 77 rad s-1.
Unless otherwise stated, the speed setting of 45 was used, equating to a nominal speed of
approximately 70 rad s-1. This speed was a compromise for ensuring long term care of the
mixer, whilst using a high but not maximum mixing speed.
When operating the Tweedy 1, the liquid was first put into the mixer bowl, followed by the
dry ingredients due to mixing being more efficient than when loading the mixer bowl in the
reverse order.
mixer
spindle
gas flow
monitor
pressure gauge
data
acquisition
computer
speed
control
box

54
Each dough made in the Tweedy 1 mixer was based on a loading of 400 g of flour. A test
series of doughs were developed according to their work input after mixing under these
conditions.
Unless otherwise stated, each dough was mixed for 3 minutes and at a pressure of 1 bara. For
the doughs tested, this was found to be sufficient time to develop the dough based on the
work input. All pressure step changes occurred within 3 s.
Occasionally in the Tweedy mixer the dough ingredients are not mixed fully into a dough or
the mixing pattern will differ to that of the norm. In a normal mixing pattern, a single dough
ball is kneaded as it rotates around the mixer bowl between the mixer blade and wall, with
the helical impeller mixing downwards. The dough mix will differ from the norm when the
mixing pattern is such that the dough spins around with the blade at the top of the mixer, or
when a proportion of the dough ingredients stick onto the sides of the mixer and are not
incorporated into the dough. When these problems occurred the batch of dough was
discarded and another batch made, to avoid anomalous results.
3.3.2 Nikon Metris 225/320kV X-ray CT
The Nikon Metris 225/320 kV X-ray CT (XT H 225) is housed in a customised bay with the
Manchester X-ray Imaging Facility at the University of Manchester. It is illustrated in Figures
3.4 and 3.5. This X-ray equipment was used for scanning bread dough, as after mixing cell
sizes are on the micrometre scale (Whitworth and Alava, 1999), the resolution the X TH 225
achieves. The resolution of the other X-ray equipment at the facility meant the XT H 225 was
best suited to the scale of the features to be detected within bread dough samples. The high
resolution is due to the large detector (2K x 2K Perkin Elmer 1621-16-bit amorphous silicon
flat-panel detector with 200 micron pixel pitch). With the appropriate X-ray settings and
sample volume, a sample resolution of 3 µm can be achieved. This was not possible with the
bread dough samples used, however. In addition, the detector allows fine differences in
contrast to be detected. This enables detection of a number of features which would not
have been seen on the standard Nikon Metris 225 kV X-ray CT instrument.

55
Figure 3.4 Nikon Metris 225/320kV X-ray CT. The source, manipulator stage and detector
positions can be adjusted to optimise scan settings
Figure 3.5 Nikon Metris 225/320kV X-ray CT set up. This shows the equipment housed in a
customised bay, whilst control of the equipment is located outside the bay for safety
purposes.
source
detector
manipulator
stage
acquisition computer
XT H225 housed in
a customised bay stage adjustor joysticks

56
The target material within the source is interchangeable to ensure the highest X-ray density
for the energy range is used for the sample material. This ensures the best signal and contrast
for the material. With these target materials, an energy range of 40-230 kV can be obtained,
allowing the scanning of biological materials through to dense metals. For the X-ray imaging
conducted within this thesis, either molybdenum or tungsten was the target material used.
When imaging static dough, molybdenum was used, and when imaging dynamic dough,
tungsten was used. Different target materials were used due to the differing densities of the
glass and plastic sample holders.
The large walk-in bay and heavy duty sample manipulator means samples as large as 1 m in
diameter and 1 kg in weight can be imaged. The material to be scanned sits upon the heavy
duty rotating manipulator stage. The stage position can be adjusted using a series of
joysticks. The stage also allows for attachments of specialist rigs, enabling the addition of
another dimension to the scan. As the sample is scanned, the scan data is collected on an
acquisition PC.
3.3.3 Farinograph
The Farinograph is a mixer commonly used worldwide to determine flour quality through
dough consistency measurements on dough as it is mixed. The torque is measured on the
sigma shaped paddles of the mixing blade, and graphically recorded as a function of time by a
pen actuated by a system of levers. The axes on the graph paper are time and Brabender
units, which is essentially the torque. From the curve produced, information such as the flour
water absorption, flour hydration time, dough breakdown, stability and development time,
and mixing tolerance index can be derived.
3.3.4 Micro-Dough lab
The Micro-Dough lab is a mixer with the loading capacity of a dough made from 4 g of flour. It
is used to determine the quality and processing characteristics of flour and dough from torque
measurements. Its small sample volume requirement has the advantage that very small
quantities of material are required to determine flour quality and processing characteristics.
The Micro-Dough Lab has a sigma shaped mixing paddle, which mixes the dough at the chosen
speed ranging from 0-200 rpm. It can be programmed to mimic the Farinograph method of
determining water absorption and has the advantages of more precise temperature control
and automated water delivery to the sample.
3.3.5 C-Cell
The C-Cell is a digital imaging system used throughout the bread industry worldwide to
objectively analyse the crumb structure of bread. It is used as a quality control tool and to
assess newly developed products. The C-Cell was used with software version 2.0 (Calibre
Control International, Warrington, UK). Individual slices of bread were placed onto a black
tray in the instrument and illuminated to contrast the cells and the cell walls. An image of
the bread was then acquired and analysed by the C-Cell. Alternative images were produced
from the original image, on parameters that determine bread’s quality. These details include

57
the brightness, shape and coarseness of the bread, and the shape, size, number, and
orientation of cells within the bread. The number of cells, their shape and size, determines
the structure of the bread, and therefore its eating characteristics. How these cells are then
distributed affects the coarseness of bread, as well as crumb brightness, which is dependent
upon cell orientation and crumb structure.
The advantages of the C-Cell are its ease and speed of use. Results can be obtained within
seconds. The digital imaging system also means consistent results are obtained. The
disadvantages are that the resolution of the C-Cell is no greater than that of the human eye
and the cell characteristics provided are based on a 2D image.
3.3.6 Texture Analyser
The texture analyser is used throughout the food industry to measure the sensory qualities of
food using a range of probes and attachments. These probes are attached to either the
testing bed or the arm of the texture analyser, depending on the test being conducted. The
texture analyser is illustrated in Figure 3.6.
Figure 3.6 Texture analyser. A Stable Microsystems instrument used within the food industry
to quantify the texture and physical properties of products. A range of attachments to the
arm and testing bed can be used depending on the property being measured.
probe
testing
bed
arm
control
panel

58
The texture analyser is used to compare the characteristics of one product to another and to
determine quantitatively the customer’s product perception. A number of characteristics can
be quantified with the texture analyser. These include the elasticity of a material, its
cohesiveness, and firmness. Being mechanical, consistency and non-subjectiveness make it
advantageous over human judgements. The product to be analysed is placed on the testing
bed or on an attachment on the testing bed, and the test parameters controlled from
Exponent T.A. software (Stable Microsystems, Surrey, UK) on a connected computer. The
texture analyser works by collecting data on the force, distance and time for an action such
as lowering the probe to penetrate the product, before returning to its initial position. This
data can be collected at a rate of up to 500 points a second, thus providing detailed
information.
3.4 Analytical techniques used
There are several analytical techniques used throughout the course of this PhD. These
techniques are described within Section 3.4 and referred to in later sections of this thesis.
3.4.1 Determining flour water absorption in the Farinograph
The flour water absorption was used to determine the optimal quantity of water required by
the flour to form a dough and assess the mixing pattern of different sugar content doughs.
The value of the flour water absorption obtained for each flour was used to determine the
quantity of water used to make up doughs from this flour. Water absorptions of flours were
determined according to AACC method 54-21.01.
3.4.2 Determining flour water absorption on the Micro-Dough Lab
As mentioned in Section 3.4.1, flour water absorption is used to determine the optimal
quantity of water required by the flour to form a dough. The Micro-Dough Lab was used in
addition to the Farinograph to obtain another measurement of water absorption from
different equipment. This allowed the mean of the two values to be taken, providing a more
accurate value.
The method used to determine the water absorption of the flour using the Micro-Dough Lab
was as follows: 4 g of flour was loaded into the Micro-Dough Lab mixing bowl. An estimate of
the flour’s water absorption value was input into the Micro-Dough Lab software. The Micro-
Dough Lab heated up and added a quantity of water, based on the estimate, to the flour
through a syringe. The flour and water were mixed, as the Micro-Dough Lab software
recorded the torque, and utilised the values to derive the flour’s water absorption. This was
repeated until the estimated water absorption value matched that of the quantity of water
required.
3.4.3 Measuring dough density
Dough density depends upon the density of the dough matrix and the quantity of gas in the
cells. The double cup system described below was used to measure the dough density, due to
it being a cheap, convenient and established method, having been used by numerous

59
wair x woil
wair - woil = ρdough
researchers for more than a decade (Campbell et al., 2001; Martin et al., 2004a; Chin and
Campbell, 2005a; Ktenioudaki et al., 2009).
As the cell volume distribution varies throughout the dough, to obtain a representative
density value, six samples were taken from each dough mix. The dough pieces, each
approximately 10 g in weight were carefully cut from different regions of the dough ball and
the density of each piece individually determined using the double cup system shown in
Figure 3.7(a). The mean of the six values was then taken as the density of the dough.
The double cup system consists of the double cup in Figure 3.7(b), held up on a stand, so the
top cup is exposed to air and the bottom cup immersed in silicone oil in a jacketed beaker.
Note the slightly larger and gently rounded anti-float cup over the bottom cup. This allows
the weight of materials less dense than silicone oil to be taken and avoids exerting strain on
the sample. The weight was read from the mass balance the beaker is sat on.
(a) (b)
Figure 3.7 (a) Double cup system, used to measure the dough density through calculations
involving weight measurements of dough in a fluid and air (b) Double cup
The beaker was connected to a water bath and filled with silicone oil. Silicone oil was chosen
as it is safe, non-wetting and non-dissolving of the dough. The water bath was set at 32.5°C.
This ensured that by the time the water reached the jacketed beaker, its temperature was
30°C. 30°C is the temperature of industrially made bread after mixing, and also the
temperature of the dough (±2°C) following mixing. This desired temperature was achieved
through adjusting the temperature of the water used in dough formulations using ice.
The dough samples were weighed on the top cup in air and then on the bottom cup in silicone
oil and its weight in both recorded. Using the weight of the dough in air, in silicone oil and
the density of silicone oil at 30°C, the density of the dough was determined using Equation
(9),
(9)

60
where ρdough (g cm-3) and ρoil (g cm-3) are the density of the dough and oil respectively and wair
(g) and woil (g) are the weight of the dough in air and oil respectively. This method is referred
to throughout this thesis as the double cup method.
3.4.4 Determining the gas free dough density
At the macroscopic level bread dough consists of two components: the gas which makes up
the cells and the dough matrix. The gas free dough density (ρgf) is the density of the dough
matrix. To determine the gas free dough density, six doughs were made in the Tweedy 1
mixer, through mixing at a range of pressures for 3 minutes, and their densities determined
using the double cup method. The pressures used were: 0.25 bara, 0.5 bara, 1 bara, 1.5 bara,
2 bara and 2.5 bara. Mixing at these pressures was conducted in a random order to minimise
run order artefacts. Compressed air was used to achieve the desired pressures and a flow rate
of approximately 10-15 L min-1 was maintained throughout mixing. Prior to beginning each
mixing session the headspace atmosphere was first obtained and held for 30 s by flushing with
compressed air or a vacuum line, depending on the mixing pressure.
When the density of the mixed dough at the different pressures was obtained, a graph was
produced with density plotted against pressure. The gas free dough density was obtained by
extrapolating to a pressure of zero bara.
3.4.5 Determining dough voidage
The dough voidage is the quantity of gas present within the dough. When mixing under
pressure or vacuum the dough voidage will differ if the dough is inside the mixer, and on
removal of the dough from the mixer, due to differences in pressure; dough is subjected to a
pressure step change on removal from the mixer to atmospheric pressure. The voidage
measurement outside the mixer is generally used, as further breadmaking processes occur at
atmospheric pressure. The voidage outside the mixer is determined from the dough’s density
measured outside the mixer and the gas free dough density. The gas free dough density was
obtained using the methodology in Section 3.4.4. These values were then input into Equation
(5) in Section 2.2.4.
When dough undergoes a sudden pressure change, both its voidage at the time inside and
outside the mixer are used to quantify the voidage change caused by the pressure change.
When pressure changes occur inside the mixer, this affects aeration of the dough; a sudden
pressure change causes a sudden change in dough voidage. To quantify the change, the
voidage inside the mixer is taken as the new voidage, and for voidage measurements after
this time, the voidage inside the mixer is used. In this thesis, all pressure change
experimental doughs begin from atmospheric pressure mixing. From beginning mixing at
atmospheric pressure, the relationship between the voidage inside and outside of the mixer is
given in Equation (6) in Section 2.2.4.

61
3.4.6 Specific volume and density of bread
The specific volume is the ratio of the volume of a material to its mass. To determine the
specific volume and density of bread AACC Method 10-05.01 was used.
These were determined in triplicate using the seed displacement method and Equations (10)
and (11).
w
VlumeSpecificVo (10)
The density of bread was calculated through Equation (4),
ρ = (11)
where ρ is the density (g cm-3) and V (cm3) and w (g) are the volume and mass of the bread
respectively.
3.5 Flour and dough characterisation
Flour characterisation is carried out to compare the two main flours used throughout this
thesis, to ensure different flours have been chosen, thus allowing generalisation of results. In
this section, flours a and c are characterised in terms of their water absorption and gas free
dough density. The gas free dough density was also measured in doughs made from flours b
and d. These results are presented in Section 4.3, as the doughs were made containing
different quantities of sugar for the purpose of comparing the gas free dough density of
different sugar content doughs.
3.5.1 Flour water absorption
Ideally the optimal quantity of water required to form a dough would have been determined
for all five flours used. However, due to no access to the required equipment, the water
absorption values were only obtained for flours a and c. For flours b and d, identical values to
flours a and c were used, and for flour e, the recommended water content according to the
packaging was used.
The water absorption of flour depends upon its protein content and the amount and type of
grinding performed during milling of the wheat (Campbell et al., 2012), which dictates the
starch damage. Damaged starch absorbs twice its own weight of water, in comparison to
undamaged starch, which absorbs approximately 40% its weight in water (Cauvain and Young,
2004).
High protein content flours generally absorb more water. The protein content and water
absorption values of 3 of the flours used and 75 flours derived from lists of experimentally
assessed flours in six publications (Zounis and Quail, 1997; Räsänen et al., 1997; Chin and
Campbell, 2005; Bellido et al., 2006; Dobraszczyk and Salmanowicz, 2008; Sroan et al.,
2009;) are presented in Figure 3.8. A range of water absorption values for flours with
different protein contents is illustrated. It does not show a correlation between protein
V
w

62
content and water absorption, suggesting that starch damage is a larger factor in influencing
water absorption. Different protein content flours were used for experiments within this
thesis regardless, as flours as sold on the basis of their protein content. For the three flours
used, a positive correlation can be seen between protein content and water absorption.
With a large range of water absorption for flours containing different amounts of protein, and
no trend seen in Figure 3.8, this is why with no equipment available for measuring water
absorption, the same water absorption values were used for flours b and d, to the plain and
strong flours, a and c, rather than estimating based on protein content.
Figure 3.8 Protein content vs. water absorption values of flours. 78 values flours are
illustrated, including 75 flours in literature and 3 flours used throughout this thesis.
The water absorption values for flours a and c obtained using the Farinograph and Micro-
Dough Lab, and the water absorption values consequently used for experiments, are displayed
in Table 3.3. The methodology is detailed in Sections 3.4.1 and 3.4.2.
Table 3.3 Flours and their corresponding water absorption values. These were determined
from the Micro-Dough Lab, Farinograph and packaging. The final column gives the water
absorption value used in experiments within this thesis, based on these measurements
Flour (protein content) Farinograph (%) Micro-Dough Lab (%) Water absorption
value used (%)
Flour a (10.1%) 55±0.5 57.5±0.3 56.25
Flour b (10.4%) - - 56.25
Flour c (11%) 58±0.5 58.0±0.3 58.00
Flour d (11.5%) - - 58.00
Flour e (15%) - - 66.60
Both methods give a lower water absorption in flour a than c, where in flour c a water
absorption value of 58% was found via both methods. When taking into account the error,
R² = 0.1457
0
10
20
30
40
50
60
70
80
7 9 11 13 15 17
Wate
r abso
rpti
on (
%)
Protein content (%)
Literature
Flour a
Flour c
Flour e

63
however, the values given by the Micro-Dough Lab suggest the same water absorption
between the two flours.
3.5.2 Mixing at constant pressure: gas free dough density
The methodology described in Section 3.4.4, was used to determine the gas free dough
density. The gas free dough density was obtained for flours a and c, and a number of doughs
throughout this thesis. This section only details the gas free dough density of flours a and c,
as the gas free dough densities of flours b, d and e were not needed. The gas free dough
density of the other doughs investigated are detailed in the appropriate chapter. Tables 3.4
and 3.5 list the formulation used to determine the gas free dough density of flours a and c
respectively.
Table 3.4 Formulation used to determine the gas free dough density of a dough made from
flour a
Ingredients Quantity (g) Quantity (%)
Flour a (10.1%) 400
64.0
Water 225 36.0
Table 3.5 Formulation used to determine the gas free dough density of a dough made from
flour c
Ingredients Quantity (g) Quantity (%)
Flour c (11%) 400
63.3
Water 232 36.7
Figure 3.9 shows the dough density of the two doughs over a range of pressures. It shows the
same gas free dough density to five significant figures, 1.2603 g cm-3, for doughs made using
only flour and water.
Figure 3.9 Density of doughs made from flour a and c, following mixing at a range of
headspace pressures for 180 s. The data points are the mean of six measurements from an
identical batch of dough. Error bars have been omitted as they are smaller than the markers
used. Linear regression trend lines are shown.
p = -0.084P + 1.2603
p = -0.0772P + 1.2603
1.00
1.05
1.10
1.15
1.20
1.25
1.30
0 0.5 1 1.5 2 2.5
Dough d
ensi
ty o
uts
ide m
ixer
(g
cm
-3)
Mixer headspace pressure (bara)
flour a
flour c

64
Figure 3.10, compares the gas free dough density of the two flours to those obtained from
publications where they have been experimentally derived using the same technique (Chin et
al., 2004; Martin et al., 2004a; Martin et al., 2004b). For the four flours from literature, as
the protein content increases, the gas free dough density decreases. Although, the flours used
do not lie on the line of best fit, considering the small number of literature values used, the
gas free dough density obtained are reasonable for the protein content of the flours.
Figure 3.10 Gas free dough density of flours from literature and flours a and c.
3.5.3 Dough voidage
The methodology used in Section 3.4.5, was used to determine the voidage of a number of
doughs throughout this thesis, including those of flours a and c, formulated in Tables 3.4 and
3.5 respectively. Table 3.6 shows the values used to calculate the dough voidage, and the
dough voidage for both flours.
Table 3.6 Characterisation of flours a and c
ρdough (g cm-3) ρgf (g cm-3) Φ
Flour a (10.1%) 1.1697 1.2603 0.0675
Flour c (11%) 1.1752 1.2603 0.0719
The dough produced from flour c has a greater voidage than the dough produced from flour
a. These dough voidages have not been compared to literature values, as there are a number
of variables such as the mixer blade, speed, pressure and mixing time, which affect the dough
voidage, thus preventing direct comparisons from being made.
3.5.4 Characterisation summary
Characterisation of flours a and c found both flours to have the same gas free dough density.
Flour a had a lower water absorption value and a lower voidage. This voidage difference
shows these flours to behave differently and therefore deemed them suitable for drawing
generalisations for wheat flour doughs.
1.24
1.25
1.26
1.27
1.28
1.29
0 5 10 15
ρgf (g
cm
-3)
Protein content (%)
literature
flour a
flour c

65
3.6 Additional methodologies
In Chapter 4 of this thesis, bread is made using both a breadmaker and a Tweedy mixer to
illustrate the effect of sugar on different quality parameters in baked bread. The two
breadmaking methods used described in this Section, with details of the methodology used for
X-ray CT in Chapter 6.
3.6.1 Breadmaking
This section describes the breadmaking techniques used in Section 4.11 to make breadmaker
loaves and Tweedy loaves.
For loaves made in the breadmaker, water at 35±2°C was first poured into the breadmaker
tin. The yeast was then crumbled up and the vegetable fat broken into small pieces and these
alongside the remaining ingredients put into the breadmaker baking tin, and the ingredients
levelled off for more efficient mixing. The bread was made using the medium setting for basic
bread. As soon as the bread was cooked, it was removed from the breadmaker and put onto a
cooling rack. Three loaves of each recipe formulation were made.
For bread made in the Tweedy 1 mixer, the ingredients were mixed for three minutes at a
speed of 77 rad s-1, with the water at 35±2°C. Following mixing, the dough was put into a
Pyrex bowl. All exposed surfaces of the dough were greased with vegetable fat and the bowl
covered with a damp tea towel to prevent the dough from drying out. It was proved for 60
minutes at 39°C in Gallenkamp oven 300 plus series (Weiss Technik UK, Leicestershire, UK)
over a bowl of water, which was present to create a humid atmosphere. The dough was then
knocked back (kneaded briefly) and 500±1 g of the dough was shaped and put into a greased
1 lb baking tin, covered with a damp tea towel and proved again for 25 minutes over a bowl
of water. Finally, the dough was baked in a Simon Rotary Test Baking Oven (Henry Simon LTD,
Stockport, UK) for 25 minutes at 450°F. Immediately following baking, the bread was turned
out onto a cooling rack. Three loaves of each recipe formulation were made.
3.6.2 X-ray imaging
X-ray CT is used in Chapter 6, for three separate experiments. Bread dough samples were
imaged following mixing for a specific length of time. In each of the experiments, there is
some variation amongst the X-ray settings and also the processing of the data, in order to
obtain the appropriate data at the optimum settings for each experiment.
In a test to assess if the dough voidage was altered in preparing it for X-ray CT, a dough was
made up and its density measured from six samples using the double cup method. Another six
samples from the dough were then put into the tubing as done for the X-ray imaging
experiments and their densities measured using the double cup method. By subtracting the
density of the tubing from the measured densities, the density of the prepared dough could
then be calculated. Assessment of sample preparation altering the dough voidage found the
sample preparation method to be non-destructive of the dough, giving accurate density
measurements.

66
For the investigations in Section 6.2 and 6.3, following mixing, a dough piece approximately
10 g in weight was cut from the dough and its voidage determined from the double cup
method. The voidage was later compared to the voidage obtained via X-ray CT to determine
if the dough preparation procedures involved in X-ray CT altered its voidage.
Dough pieces approximately 1.3 cm3 in volume was then cut from the batch of the dough and
imaged in tubing. A sufficient dough quantity was inserted in the tube to ensure it would not
slump during imaging. Following preparation, the dough samples were placed on the Nikon
Metris 225/320 kV CT system rotation stage and imaged in a customised bay. Full details of
the sample set-up are given in the corresponding sections of this thesis.
Following X-ray imaging, the images were reconstructed using a reconstruction algorithm on
the software Nikon Metris CTPro 3D (Metris XT 2.2, version 2.2.4365.28608). The algorithm
was devised by staff at the Manchester X-ray Imaging Facility at the University of Manchester.
The Manchester X-ray imaging facility is a world renowned UK leading X-ray imaging facility
which collaborates with the UK synchrotron facility, Diamond Light Source in Oxfordshire.
The reconstructed images were then analysed and processed in Avizo Fire. Sections 6.2 and
6.3 were processed in Avizo Fire 6.3.1 and Section 6.4 in Avizo Fire 7.1 (Visualization Sciences
Group, Bordeaux, France). For the doughs presented in Sections 6.2 and 6.3, a volume was
cropped from the reconstructed data, resulting in a sample size of approximately 1.2 cm3.
The dough towards the bottom of the tube was not analysed due to the possibility of
compression altering the cellular structure. The edges of the dough sample also were not
used, to avoid edge artefacts. The dough matrix and cells were segmented based on greyscale
values. Once segmented, material statistics was run to quantify the volume of each material
present and 3D volume in quantification was used to obtain the number and volumes of cells
within the samples. The cell volumes were processed in Microsoft Office Excel and a 5 voxel
cell diameter size, equating to a sphere size of 65 cubic voxels used as a cut-off point to
ensure cells were identified with high confidence and false identifications (from noise and
artefacts) were not made. This cut-off size is based on cell sizes in orthoslices and ESEM
images in Section 4.9. Note the smallest cells at this stage of breadmaking are the least
important in the breadmaking process due to their small voidage contribution and their high
internal pressure limiting growth during proving and baking (Shah et al., 1998). The cell
volume distribution, cell number density, mean cell volume, cumulative cell percentage and
cumulative voidage per unit volume were then calculated for the doughs. Cell number density
is used to take into account the differences in sample sizes. The distribution of cell sizes is
also presented to enable any cells that skew the data to be identified.
The procedure used for the 3D scan in Section 6.4 differ more to those of the 2D scans in
Section 6.2 and 6.3 and are explained in Section 6.4.1 for ease of the reader.

67
Chapter 4 - Assessment of the effect of sugar on dough
properties during breadmaking processes
4.1 Introduction
The addition of sugar to bakery products increases their appeal by increasing the indulgence
factor of the product. Currently the widely available sweetened breads have their sweetness
boosted by the addition of glazes, fillings and dried fruit. It is thought that one reason the
addition of pure sugar as a sweetener is limited is it creates a sticky product, which causes
processing difficulties in industry. Another is pressure from the Food Standards Agency to
reduce cases of coronary heart disease, obesity and dental decay resulting from high fat and
sugar diets (Sheehy et al., 2008). This Chapter uses ten short experimental sections to
investigate the effects of sugar during the breadmaking process to better understand how
sugar affects the phenomena that contribute to the creation of bread structure at different
stages. Section 4.2 uses a simplified dough comprising starch and water, with the addition of
different quantities of sugar to assess changes in the mixture’s properties. In Section 4.3
different sugar content doughs are characterised in terms of their gas free dough density and
voidage. Section 4.4 assesses how the properties of the dough change during mixing through
torque measurements in a Farinograph. Section 4.5 continues from Section 4.4 in assessing
how the properties of the dough change during mixing through torque measurements in a
Tweedy 1 mixer. In Section 4.6 the effect of mixing speed on aeration of different sugar
content doughs is assessed. Section 4.7 assesses the stickiness of different sugar content
doughs using a texture analyser. As the expansion capacity of the dough is key to loaf volume,
the extensibility of different sugar content doughs is assessed in Section 4.8, again using a
texture analyser. In Section 4.9, dough microstructures from 0% and 15% sugar dough are
compared using micrographs obtained via environmental scanning electron microscopy
(ESEM). The effect of sugar during proving is assessed via dynamic density measurements of
yeasted doughs of varying sugar contents in Section 4.10. Finally, in Section 4.11, the effect
of sugar on baked bread is assessed, through a number of tests on quality parameters. The
findings from these ten sections are then summarised in Section 4.12. Further work is also
carried out within this thesis on the effect of sugar during the breadmaking process. This
work includes an extensive investigation into the aeration of sugared doughs via a population
balance model in Chapter 5, and X-ray CT of sugared bread doughs in Section 6.2. These
investigations have not been located in this chapter as they are more extensive than these
preliminary studies.
4.2 Interaction of sugar and starch-water mixture
The main component of flour is starch and therefore the interaction of sugar with starch-
water mixture was investigated as a simplified dough system to determine if sugar has an
effect on the behaviour of bread doughs. This was done initially to avoid wasting time on the
design and execution of more elaborate experiments if this experiment found sugar not to

68
have an effect. It was expected that sugar would affect the simplified dough system and that
the observed effects would have been greater with more sugar, due to its hygroscopic nature.
Higher viscosity doughs were also expected with larger quantities of sugar due to the
increased weight of solids to liquids.
The source of the starch used in the simplified dough system was cornflour, as its protein
content is negligible, and therefore any differences observed amongst the different sugar
content mixtures are likely to be reflected in wheat flour doughs. With starch being the main
component of flour, the effect of sugar on protein was not investigated.
4.2.1 Method: Interaction of sugar and starch-water mixture
To simplify the effect of sugar in bread dough, investigations were carried out in a simplified
dough system, comprising cornflour and water. 130 g of water was added to 180 g of cornflour
and between 0 to 27 g of sugar in a bowl. This equated to between 0% and 8% sugar in
proportion to all the ingredients. This water content was chosen through trial and error, and
was the quantity of water in the absence of sugar that enabled display of the typical
behaviour associated with starch slurries. Four doughs were made, each of different sugar
concentrations. These sugar concentrations were 0%, 5%, 10% and 15% of the flour weight, all
of which were completely soluble in water. 15% sugar was used as the extreme as it is more
than the quantities commonly used for the industrial production of sweetened bread. 0%
sugar was used as a control, and 5% and 10% were used as in-between values. By using these
in-between values it was possible to determine if any effects observed with sugar were
gradual or sudden with the addition of a specific quantity of sugar.
Following production of each batch, the mix was prodded, stirred at different speeds and the
bowl tilted, as observations of the mixtures response were noted.
4.2.1 Results and discussion: Interaction of sugar and starch-water mixture
As the sugar content of the dough increased from 0% to 5% to 10% to 15%, the properties of
the cornflour mixture changed in proportion to this. At 0% sugar, the mixture was thixotropic.
On application of sudden force to the mixture, it resembled a solid by resisting flow and
displaying an elastic response. It was not possible to stir the mixture and following stirring
attempts, none of the mixture stuck to the stirrer. However, application of more gradual
force to the fluid enabled penetration of the stirrer and resulted in a light coating on it. In
addition, on tilting the bowl, it flowed as a viscous fluid.
At the other extreme, the mixture containing 15% sugar flowed readily as a low viscosity fluid
without obvious thixotropic or yield stress properties. The mixture flowed when tilting the
bowl, could be stirred and did not display an elastic response under application of sudden or
gradual force. Following application of force with the stirrer, it became covered in the
mixture.
The properties of the mixture at 5% and 10% sugar lay between these two extremes. This
suggests that the influence of sugar on dough is in proportion with the quantity of sugar

69
present, rather than suddenly at the presence of a set amount of sugar in the dough. The
behaviour of the cornflour and sugar mixtures varied between that of solids and liquids. In
solids the molecules are closely packed and held in a fixed position thus they cannot move
between each other. On the other hand, the molecules in liquids are less tightly packed,
enabling some movement between each other. Cornflour is also known as corn starch. Starch
consists of two components: amylose and amylopectin. These are long chains of sugar, which
adhere strongly to another and cannot move past another, thus starch is a solid. When water
is added to cornflour, it lubricates the starch chains and enables them to slide past another,
behaving like a liquid. On applying force to the mixture, water is squeezed out from the
chains, and they revert to a solid (Crane, 2012). When the force is released, water seeps
between the chains, enabling them to move again.
Observations of the mixtures showed that starch does not dissolve in water at ambient
temperatures. Sucrose, in the quantities added, was fully soluble at room temperatures and
therefore as well as acting as a lubricant, increased the volume, though not the quantity of
fluid present. Sugar would have also lowered the water activity of the mixture (Pennington
and Baker, 1990). The water activity of a wheat flour bread dough is approximately 0.95 and
decreases significantly on addition of sugar. For example, a high sugar product such as jam
has a water activity of 0.75-0.8 (Pennington and Baker, 1990). The largest component of
wheat flour is starch, and although the proportions of the two glucans from which the starch
is comprised will vary between corn starch and wheat starch, it is expected that the water
activity of the cornflour mixture is similar to that of bread dough. It is expected therefore
that on addition of sugar, the mixture would become less fluid, as opposed to more fluid, as
observed. It is known that when mixing the water and starch, a proportion of the starch
granules absorb water and swell (Belitz et al., 2004). The addition of sugar interferes with
the absorbance of water by starch, therefore the starch molecules in the sugar containing
mixtures will be smaller. The most likely explanation of the observed behaviour is that the
water activity of the starch mixture is reduced on addition of sugar resulting in the reduced
swelling of the suspended starch chains, which increases flow in the mixture. Increased flow
is generally associated with lower viscosity solutions. Kim and Walker (1992) found the larger
the starch particles the higher the viscosity of the solution.
Due to the similarities between a starch-water mixture and wheat flour dough, and the
observations made in this section, it is expected that the physical properties of a wheat flour
dough will change on addition of sugar. The results suggest that despite the increase in the
ratio of weight of solids to weight of liquids, the viscosity of wheat flour dough will be
reduced on addition of sugar due to less swelling of starch particles,. As dough viscosity is
known to be linked to dough rheology and aeration, sugar is expected to affect these
parameters.

70
4.3 Gas free dough density and voidage of different sugar content
doughs
Section 2.2 discussed the insight offered by measuring dough voidage throughout the
breadmaking process. However, calculation of this requires both knowledge of the dough
density and gas free dough density. The double cup system has been extensively used for
accurate and precise dough density measurements, and by extrapolating density pressure
plots to zero pressure the dough gas free density can be obtained (Campbell et al., 1993).
This section presents data from a study of dough sugar content and dough density over
controlled mixer headspace pressures. Voidage and gas free dough density measurements are
common in literature investigating the aeration of bread dough, and simple and cheap
methods of characterising the dough. By varying the sugar content of the doughs in the
following experiment and in incrementing quantities, the overall effect of sugar on bread
dough aeration could be observed and how different quantities of sugar affect bread dough
aeration could also be determined. It was expected that doughs would become less aerated
on increasing the sugar content due to a greater proportion of solids to liquids meaning
formation of a more viscous dough, making entrainment of gas through enveloping pockets of
gas more difficult. The hygroscopic nature of sugar would also mean there is less water
available for protein hydration and therefore dough development, required for retaining cells
within the dough.
4.3.1 Method: Gas free dough density and voidage of different sugar content doughs
The dough density and voidage of different sugar content doughs were determined and
compared. Doughs were made containing between 0% and 15% sugar and either strong or
weak flour. Their formulations are provided in Tables 4.1 and 4.2. Their gas free dough
density and voidage were determined according to the methods in Section 3.4.4 and 3.4.5
respectively.
Table 4.1 Dough formulations used to assess the voidage and gas free dough density of
different sugar content strong flour doughs.
0% sugar 1.5% sugar 5% sugar 10% sugar 15% sugar
Ingredient Quantity (g / %)
Water 232.0 / 35.7 232.0 / 35.4 232.0 / 34.7 232.0 / 33.7 232.0 / 32.7
Sugar 0.0 / 0.00 6.0 / 0.916 20.0 / 2.99 40.0 / 5.80 60.0 / 8.46
Salt 7.2 / 1.10 7.2 / 1.10 7.2 / 1.08 7.2 / 1.04 7.2 / 1.02
Flour c (11%) 400.0 / 61.6 400.0/ 61.1 400.0 / 59.8 400.0 / 58.0 400.0 / 56.4
Fresh yeast 10.0 / 1.54 10.0 / 1.53 10.0 / 1.49 10.0 / 1.45 10.0 / 1.41
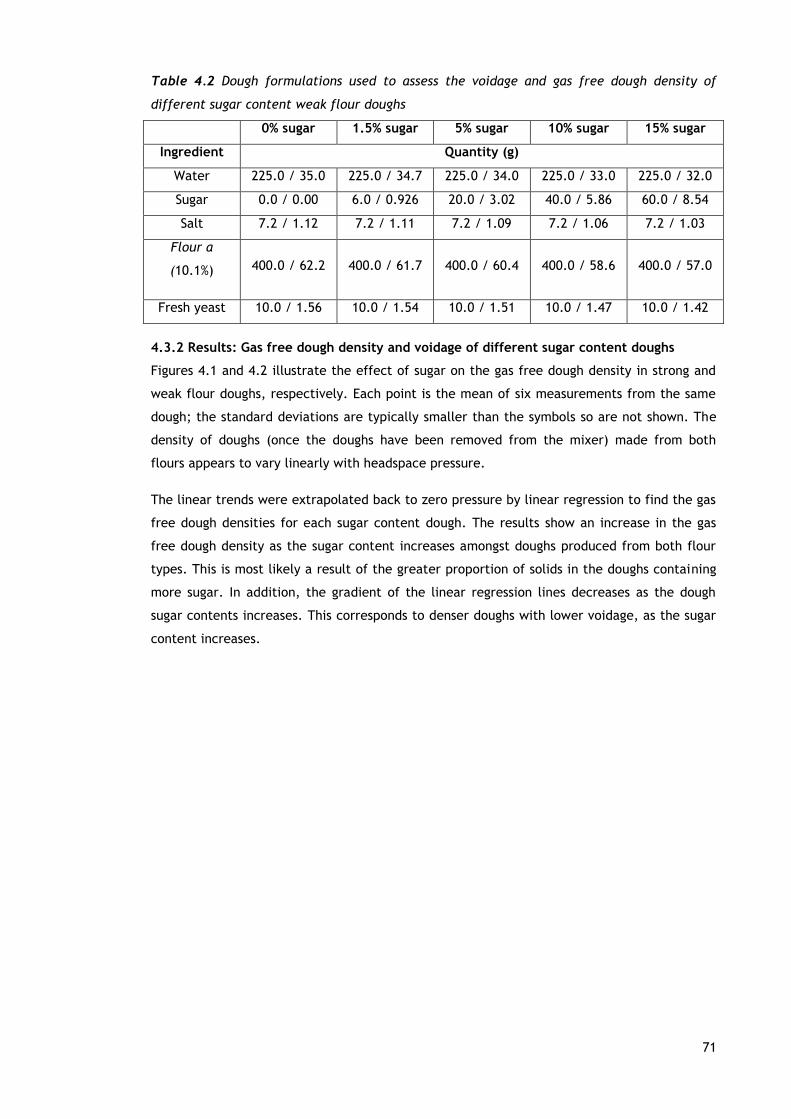
71
Table 4.2 Dough formulations used to assess the voidage and gas free dough density of
different sugar content weak flour doughs
0% sugar 1.5% sugar 5% sugar 10% sugar 15% sugar
Ingredient Quantity (g)
Water 225.0 / 35.0 225.0 / 34.7 225.0 / 34.0 225.0 / 33.0 225.0 / 32.0
Sugar 0.0 / 0.00 6.0 / 0.926 20.0 / 3.02 40.0 / 5.86 60.0 / 8.54
Salt 7.2 / 1.12 7.2 / 1.11 7.2 / 1.09 7.2 / 1.06 7.2 / 1.03
Flour a
(10.1%) 400.0 / 62.2 400.0 / 61.7 400.0 / 60.4 400.0 / 58.6 400.0 / 57.0
Fresh yeast 10.0 / 1.56 10.0 / 1.54 10.0 / 1.51 10.0 / 1.47 10.0 / 1.42
4.3.2 Results: Gas free dough density and voidage of different sugar content doughs
Figures 4.1 and 4.2 illustrate the effect of sugar on the gas free dough density in strong and
weak flour doughs, respectively. Each point is the mean of six measurements from the same
dough; the standard deviations are typically smaller than the symbols so are not shown. The
density of doughs (once the doughs have been removed from the mixer) made from both
flours appears to vary linearly with headspace pressure.
The linear trends were extrapolated back to zero pressure by linear regression to find the gas
free dough densities for each sugar content dough. The results show an increase in the gas
free dough density as the sugar content increases amongst doughs produced from both flour
types. This is most likely a result of the greater proportion of solids in the doughs containing
more sugar. In addition, the gradient of the linear regression lines decreases as the dough
sugar contents increases. This corresponds to denser doughs with lower voidage, as the sugar
content increases.

72
Figure 4.1 Density of different sugar content strong flour doughs following 180 s of mixing
at different mixer headspace pressures. The data points illustrated are the mean of six
measurements. Error bars have been omitted as they are smaller than the symbols used.
Linear regression lines are shown.
Figure 4.2 Density of different sugar content weak flour doughs following 180 s of mixing at
different mixer headspace pressures. The data points illustrated are the mean of six
measurements. Error bars have been omitted as they are smaller than the symbols used.
Linear regression lines are shown.
1.05
1.10
1.15
1.20
1.25
1.30
0.0 0.5 1.0 1.5 2.0 2.5
Densi
ty o
f dough o
uts
ide m
ixer
(g c
m-3
)
Mixer headspace pressure (bara)
0.0% sugar
1.5% sugar
5.0% sugar
10.0% sugar
15.0% sugar
1.05
1.10
1.15
1.20
1.25
1.30
0 0.5 1 1.5 2 2.5
Densi
ty o
f dough o
uts
ide m
ixer
(g c
m-3
)
Mixer headspace pressure (bara)
0.0% sugar
1.5% sugar
5.0% sugar
10.0% sugar
15.0% sugar
1.2652
1.2861
1.2614 1.2620 1.2663
1.2737
1.2868
1.2614
1.2774 1.2822

73
Figures 4.3 and 4.4 illustrate the change in voidage in different sugar content doughs over
mixer headspace pressures ranging from 0.25 bara to 2.5 bara. Dough voidage at different
sugar contents is similar between the two flours at positive mixing pressures. When mixing
under partial vacuum however, the strong flour doughs had a lower voidage. In Figure 4.3
voidage appears to be linearly proportional to the sugar content, with a decrease in voidage
as sugar content increases at higher pressures and less of a relationship between the two at
lower pressures, as expected with there being less gas available for entrainment during
mixing. For the weak flour dough in Figure 4.4 dough voidage increases as the sugar content
increases from 0% to 5%, and decreases at increasing sugar contents. These results suggest
that sugar affects dough aeration during mixing and it is possible that a small quantity of
sugar produces doughs of a lower voidage. Entrainment and disentrainment of gas during
mixing is investigated in Chapter 5. In addition, the results show that the higher the mixer
headspace pressure, the greater the voidage across doughs made from both flours and of all
sugar content investigated. This is due to more air entering the mixer headspace and
therefore the dough when mixing at higher pressures.
Figure 4.3 Voidage of different sugar content strong flour doughs, following 180 s of mixing
at mixer headspace pressures ranging from 0.25 bara to 2.5 bara.
0
0.02
0.04
0.06
0.08
0.1
0.12
0.14
0.16
0.18
0 5 10 15
Void
age o
uts
ide m
ixer
Sugar content (%)
0.25 bara
0.5 bara
1 bara
1.5 bara
2 bara
2.5 bara

74
Figure 4.4 Voidage of different sugar content weak flour doughs, following 180 s of mixing
at mixer headspace pressures ranging from 0.25 bara to 2.5 bara.
The results show that dough density increases on increasing the sugar content, due to both a
decrease in voidage and an increase in the gas free dough density. The increased sugar
concentration in the free water phase, and therefore increased solution density, will lead to
the higher gas free dough density. However, the decrease in voidage with sugar content must
be due to the aeration processes during mixing. It remains to be seen later in the thesis how
this decrease in initial dough voidage arises in terms of the relative rates of entrainment and
disentrainment of gas during mixing, and how it relates to sweetened bakery products.
4.4 Mixing different sugar content doughs in the Farinograph
The Farinograph is a specialised bakery tool used worldwide to measure flour properties and
processing characteristics from torque measurements. In this section, the Farinograph curves
(Farinograms) produced from four different sugar content doughs are used to compare their
mixing behaviour and development. The torque at different times and significant stages
during mixing are investigated to determine dough strength, and the times to reach
significant stages during mixing to indicate the required mixing time. It was expected that
increasing the sugar content would increase the quantity of solids to liquids present and
therefore form a mass quicker, but require more time to reach development due to the lower
availability of water for gluten hydration. It was expected that the torque at the end of
mixing would increase with sugar, due to more resistance from the larger quantities of solids
present.
4.4.1 Method: Mixing different sugar content doughs in the Farinograph
The mixing characteristics of dough containing different sugar quantities were determined
through mixing different sugar content doughs in the Farinograph following the standard AACC
method (54-21). In Figure 4.5, a typical Farinogram with key areas of interest highlighted is
presented. The Farinogram was created by an analogue torque measurement using a pivoted
marker pen on a moving reel of graph paper for a standard mixing time. The paper was
0
0.02
0.04
0.06
0.08
0.1
0.12
0.14
0.16
0.18
0 5 10 15
Void
age o
uts
ide m
ixer
Sugar content (%)
0.25 bara
0.5 bara
1 bara
1.5 bara
2 bara
2.5 bara

75
aligned such that mixing starts at time zero on the recording. The y-axis is curved due to the
pivoted recorder and is in Brabender Units (B.U.) which is proportional to the mixer drive
shaft torque.
Figure 4.5 A typical Farinogram with significant features annotated
The dough development time is the time from the start of mixing, at 0 minutes, to the point
on the curve immediately prior to the first signs of weakening. If two peaks are observed,
then the second peak is used to determine the development time, as the first peak is usually
caused by flour hydration. The Farinograph determines the dough development time accurate
to 30 s. This is not very accurate considering the length of time required for dough
development, but was adequate for determining if a difference exists between the different
sugar content doughs investigated.
The arrival time indicates the point of flour hydration, and the departure time is the point at
which the dough begins to break down and become overdeveloped. The difference between
the arrival and departure time is termed stability time. It is the time that the dough
maintains its maximum consistency and is indicative of dough strength. The Farinograph
determines stability time accurate to 60 s.
Eight doughs were mixed in the Farinograph and Farinograms obtained for each. Their
formulations are presented in Tables 4.3 and 4.4.
departure time
dough development time
arrival time
mixing time
(minutes)
over developed dough

76
Table 4.3 Strong flour dough formulations used in the Farinograph
Quantity of Ingredients (g / %)
Ingredient 0% sugar 5% sugar 10% sugar 15% sugar
Flour c (11%) 300.0 / 5.93 300.0 / 57.6 300.0 / 56.0 300.0 / 54.5
Vegetable fat 15.0 / 2.97 15.0 / 2.88 15.0 / 2.80 15.0 / 2.72
Salt 4.5 / 0.890 4.5 / 0.865 4.5 / 0.840 4.5 / 0.817
Fresh yeast 6.0 / 1.19 6.0 / 1.15 6.0 / 1.12 6.0 / 1.09
Ascorbic acid 6.0 / 1.19 6.0/ 1.15 6.0 / 1.12 6.0 / 1.09
Water 174.0 / 34.4 174.0 / 33.4 174.0 / 32.5 174.0 / 31.6
Sugar 0.0 / 0.00 15.0 / 2.88 30.0 / 5.60 45.0 / 8.17
Table 4.4 Weak flour dough formulations used in the Farinograph
Quantity of Ingredients (g / %)
Ingredient 0% sugar 5% sugar 10% sugar 15% sugar
Flour a (10.1%) 300.0 / 59.9 300.0 / 58.2 300.0 / 56.6 300.0 / 55.0
Vegetable fat 15.0 / 3.00 15.0 / 2.91 15.0 / 2.83 15.0 / 2.75
Salt 4.5 / 0.899 4.5 / 0.873 4.5 / 0.848 4.5 / 0.825
Fresh yeast 6.0 / 1.20 6.0 / 1.16 6.0 / 1.13 6.0 / 1.10
Ascorbic acid 6.0 / 1.20 6.0 / 1.16 6.0 / 1.13 6.0 / 1.10
Water 169.0 / 33.8 169.0 / 32.8 169.0 / 31.9 169.0 / 31.0
Sugar 0.0 / 0.00 15.0 / 2.91 30.0 / 5.66 45.0 / 8.25
For the formulations in Tables 4.3 and 4.4, the water content was determined using the
Farinograph and Micro-Dough Lab. The quantity and proportions of the other ingredients, with
the exception of sugar, were those recommended by the Farinograph guide. For this reason,
the proportions differ to those used in other formulations within this thesis, but all
formulations are within the normal proportion ranges used in industrial bread dough
formulations.
4.4.2 Results and discussion: Mixing different sugar content doughs in the Farinograph
In Figures 4.6-4.9, the Farinograms for the strong and weak flour doughs containing 0%, 5%,
10% and 15% sugar are presented respectively. Each experiment was conducted in triplicate
and peaks were found to be repeatable to within 20 Brabender units and 30 s. Therefore,
only single representative Farinograms are presented for each formulation.
In the sugar contents investigated, typical features of a Farinogram were not observed
beyond a sugar content of 5%. The Farinograms also differ in their shape, in terms of the
number of peaks and the dough consistency amongst the eight doughs investigated. Dough
formulations containing 0% and 5% sugar produced one peak and those containing 10% and 15%
sugar produced two peaks during mixing in the Farinogram. The times these peaks occurred
are presented in Figure 4.10.When taking into account the error of the Farinogram, there are
no differences between the times that the peaks occurred in the strong and weak flour

77
doughs. There is strong correlation between the shape of the curve of the strong and weak
flour doughs of the same sugar content, suggesting a similar effect of sugar on doughs
produced from both flour types. All doughs drop in torque towards the end of the mixing
session and the weak flour doughs generally had a lower torque throughout mixing suggesting
they were less viscous than the strong flour doughs. This is illustrated in figure 4.11. Figure
4.11 also illustrates that the doughs containing more sugar had a greater torque during
mixing. This is likely to be due to the greater quantity of solids compared to liquids in the
dough. The change in dough consistency with time over the mixing session is a result of
changes occurring to the dough, through the mixing action of the Farinograph and the
increase in dough temperature caused by mixing.
Figure 4.6 illustrates the Farinograms of the two non-sugar containing doughs. The peak
representing the dough development time occurs within 0.5 minutes at 520 B.U. There is then
a clear dip in the curve, as the dough consistency is reduced. As mixing of this dough
continues, the dough consistency continues to drop. The dough consistency drops to 410 B.U.
in the strong flour dough and 430 B.U. in the weak flour dough.
Figure 4.7 illustrates the Farinograms of the two doughs containing 5% sugar. The dough
development time represented by the peak occurs in the first minute of mixing. In both
doughs the torque then decreases for the next 2 minutes to 440 B.U., before increasing again.
In the strong flour dough it appears as though the dough consistency drops after 10 minutes of
mixing, although this is not clear from the curve. In the weak flour dough, the dough
consistency appears to drop after 9 minutes of mixing. Note the difference in peaks between
Figures 4.6 and 4.7-4.9, with Figures 4.7-4.9, the dough containing more sugar, having a less
defined peak and also a higher torque at the end of the mixing time. This lack of peak and
increase in torque with mixing time becomes more defined as the sugar content of the dough
increases. These differences amongst the Farinograms illustrate that the presence of sugar
affects the mixing of dough and the dough properties. However, the presence of sugar in the
dough produces curves where the interpretations of the peaks are unclear because they do
not follow convention. The change in torque with sugar is likely to be due to sugar slowing
down or limiting the breakdown and hydration of flour components by the mixer blade.
The addition of sugar does not appear to have affected the dough formation time. All doughs,
regardless of sugar content, appear to have formed within 1 minute. Although the solid to
liquid ratio increases on increasing the sugar content, it is likely that on increasing the sugar
content, the mix becomes mores sticky, through formation of a syrup, enabling a dough of
higher solids content to form within a similar time frame.
Two peaks are exhibited in some of the results. Calderón-Domínguez et al. (2003; 2008) also
found two peaks were expressed during the mixing of sweet yeasted doughs in the
Farinograph, and believed the second peak, as highlighted in Figure 4.8 (a), to be the one
indicative of an optimum developed dough. The authors also found significant differences in
the Farinograms of sweet yeasted doughs and non-sugar yeasted doughs. In addition, the

78
authors measured dough development time on the Farinograph in terms of the time taken to
reach a certain dough consistency, and found a longer mixing time for development of
sugared doughs. In the doughs investigated in this section, 500 B.U. units was not always
reached. It is possible that through significant extension of the mixing time, as found by
Calderón-Domínguez et al. (2003) that peak torque would be reached. As the curve shape
following extended mixing times varies from that of a typical Farinogram, however, the peak
torque in this case may not represent the dough development time.
During mixing of bread dough in industrial bread production, the mixer action will differ from
that in the Farinograph, and mixing will most likely occur in a Tweedy mixer. Although the
mixing characteristics will differ, the Farinograms produced show differences in behaviour in
the different sugar content doughs, which are likely to be reflected across different mixers.
Section 4.5 uses torque measurements to assess the effect of different quantities of sugar
during mixing in the Tweedy 1 mixer.

79
(a) (b)
Figure 4.6 (a) 0% sugar strong dough Farinogram (b), 0% sugar weak dough Farinogram
(a) (b)
Figure 4.7 (a) 5% sugar strong dough Farinogram (b), 5% sugar weak flour dough Farinogram
(a) (b)
Figure 4.8 (a) 10% sugar strong dough Farinogram (b), 10% sugar weak dough Farinogram
(a) (b)
Figure 4.9 (a) 15% sugar strong dough Farinogram (b), 15% sugar weak dough Farinogram
dough development time, 1 min
dough development time, 0.5min dough development time, 0.5min
dough development time, 1 min
Optimum development point, as suggested by
Calderón-Domínguez et al., 2008

80
Figure 4.10 Mixing time to Farinogram peaks in different sugar content doughs
Figure 4.11 Dough consistency at significant times indicated by the Farinogram
4.5 The effect of sugar on torque during mixing
Section 4.4 in this chapter used torque measurements from doughs mixed in a Faringraph to
assess how sugar affects their processing characteristics. The torque can also be measured
during mixing in the Tweedy 1 mixer. The Farinograph uses torque measurements to
determine dough development time, a key processing characteristic. However, the dough
development time differs from one mixer to another, in particular when comparing a
standard mixer to a high speed mixer such as the Tweedy, which can mix dough to
development to a third to half of the time required in a standard mixer.
The Tweedy 1 has a unique mixing action. Due to the large quantity of air space in the mixer
bowl, its rotor action does not reflect changes in dough consistency like the Farinograph.
Initially the ingredients are mixed at the bottom of the mixer bowl. As the dough develops, it
becomes elastic and moves to the top of the bowl. Here, it interacts with the mixer blade
differently and the mixing action changes (Chin and Campbell, 2005).
In this section, the torque is used to assess significant points during mixing in the Tweedy 1
mixer. Particular attention is paid to the peak and end torque, two parameters which can
0
1
2
3
4
5
6
7
8
9
0 5 10 15
Tim
e (
min
ute
s)
Sugar content (%)
strong flour, 1st peak
weak flour, 1st peak
strong flour, 2nd peak
weak, 2nd peak
350
370
390
410
430
450
470
490
510
530
550
0 5 10 15
Dough c
onsi
stency (
bra
bender
unit
s)
Sugar content (%)
Strong flour, 1st peak
Strong flour, 2nd peak
strong flour, 12 minutes
Weak flour, 1st peak
Weak flour, 2nd peak
Weak flour, 12 minutes

81
easily be derived following mixing in the Tweedy 1 mixer. It is expected that torque
measurements in the Tweedy mixer will show when a solid mass occurs, and this will be
quicker in doughs containing more sugar due to a larger quantity of solids to liquids, and also
due to sugar dissolving into the water and creating a sticky syrup that helps bind the
ingredients together.
4.5.1 Method: The effect of sugar on torque during mixing
Measuring the torque in the Tweedy 1 is advantageous to measuring it in the Farinograph due
to the Tweedy 1 being a scaled down version of the high speed CBP mixers. This makes the
results obtained from the Tweedy 1 more relevant to the CBP. The main differences between
mixing in the Tweedy 1 and the Farinograph are the faster mixing speed and the large air
space in the Tweedy mixer.
The formulations used to assess torque during mixing of different sugar content doughs are
given in Table 4.5. Following work on the Farinograph, Calderón-Domínguez (2003) suggested
an increase in sugar increased the dough development time. Experimental results in Section
4.3.2 suggest this may not be the case as results did not follow convention and thus were
difficult to interpret. Taking this into account, the doughs were mixed for an extended time
of 4 minutes, as opposed to the 3 minutes that the majority of doughs throughout this thesis
were mixed for, and the torque in the Tweedy 1 monitored over the mixing session.

82
Table 4.5 Dough formulations used for torque measurements during mixing in the Tweedy 1
mixer
0%
sugar
2%
sugar
4%
sugar
6%
sugar
8%
sugar
10%
sugar
12%
sugar
14%
sugar
16%
sugar
Ingredient Quantity (g / %)
Flour d
(11.5%)
400.00
/ 60.7
400.00
/ 59.9
400.00
/ 59.2
400.00
/ 58.5
400.00
/ 57.9
400.00
/ 57.2
400.00
/ 56.6
400.00
/ 55.9
400.00
/ 55.3
Salt 7.20 /
1.09
7.20 /
1.08
7.20 /
1.07
7.20 /
1.05
7.20 /
1.04
7.20 /
1.03
7.20 /
1.02
7.20 /
1.01
7.20 /
1.00
Sugar 0.00 /
0.00
8.00 /
1.19
16.00 /
2.37
24.00 /
3.51
32.00 /
4.63
40.00 /
5.72
48.00 /
6.79
56.00 /
7.83 64.00 /
8.85
Vegetable
fat
20.00 /
3.03
20.00 /
3.00
20.00 /
2.96
20.00 /
2.93
20.00 /
2.89
20.00 /
2.86
20.00 /
2.83
20.00 /
2.80
20.00 /
2.77
Ascorbic
acid
0.03 /
0.00455
0.03 /
0.00450
0.03 /
0.00444
0.03 /
0.00439
0.03 /
0.00434
0.03 /
0.00429
0.03 /
0.00424
0.03 /
0.00419
0.03 /
0.00415
Water 232.00
/ 35.2
232.00
/ 34.8
232.00
/ 34.4
232.00
/ 34.0
232.00
/ 33.6
232.00
/ 33.2
232.00
/ 32.8
232.00
/ 32.4
232.00
/ 32.1
Each experiment was conducted in triplicate and anomalous readings that were a result of
electrical spikes removed. The mean values for each time was calculated and a moving mean
of 19 s was taken for the torque measurements throughout mixing. (The time on the software
was out by 3 s per minute, with 57 s on the software being equivalent to 60 s in real time.)
This moving mean was chosen as it divided into the mixing time to give a whole number, and
is not too long that it would obscure the data, or too short that the data would not be
smoothed out.
The peak torque and torque at the end of mixing (end torque) are considered key parameters
during mixing. These points can be identified using the Tweedy mixer and data acquisition
computer, allowing comparison in the different sugar content doughs.
In non-mechanical dough development processes, the peak torque can be interpreted as the
point of optimum dough development. However, the point of optimum dough development is
disputed amongst researchers, and in a mechanical dough development process such as the
CBP, energy input is a common measure of dough development.
The parameters which were assessed included: peak torque, end torque, work done after 240
s, and mean mixing speed. The peak torque is the highest torque prior to its decrease during
mixing. The end torque is the torque at the end of the mixing session. The mixing speed for
each sugar content was calculated as the mean of the mixing speed over the whole duration
of the three mixing sessions. Blade revolutions were not calculated, as it is a function of time

83
and mixing speed, and thus the mixing speed is indicative of the blade revolutions over the
240 s mixing session.
4.5.2 Results and discussion: The effect of sugar on torque during mixing
In the Tweedy mixer, torque is indicative of how the dough interacts with the mixer blade. In
Figure 4.12 the torque traces of different sugar content doughs are presented. The shape of
the curve is similar amongst all sugar contents. The torque increases for the first 80-120 s,
and slowly declines thereafter. This increase in torque corresponds with the formation of a
solid mass, the dough, with the peak torque being when the dough has formed. The results
show less time is required to form a dough on increasing the sugar content. These times are
illustrated in Figure 4.13. The decrease in time with increasing sugar is likely to be due to
sugared doughs forming a solid mass quicker due to their adhesive properties. In addition, the
peak and end torque appear to decrease as the sugar content increases. These are examined
more closely later in this section.
Figure 4.12 Torque of different sugar content doughs over mixing time whilst mixing at
atmospheric pressure. The torques presented are based on a moving mean of 19 s, taken
from the mean of three experiments.
Figure 4.13 shows the mixing time required to reach peak torque in the different sugar
content doughs. It illustrates a gradual decline from 142 s in the non-sugar containing dough
to 44 s in the 16% sugar containing dough. This is as expected due to the sugar dissolving into
the water to create a sticky liquid, which helps bind the ingredients together in a shorter
length of time.
0.0
0.5
1.0
1.5
2.0
2.5
3.0
0 50 100 150 200 250
Torq
ue (
N m
)
Mixing time (s)
0%
2%
4%
6%
8%
10%
12%
14%
16%

84
Figure 4.13 Time to reach peak torque in different sugar content doughs. The data points
illustrated are the mean of three measurements.
Figure 4.14 shows the peak torque during mixing of different sugar content doughs. The
results show an increase in torque up to a sugar content of 1.5% sugar, a drop in torque to
3.05 Nm at 4% sugar, before the torque increases again to 3.04 Nm at 6% sugar and decreases
as the sugar content increases beyond this. These results suggest that the peak torque, the
torque of the dough on its formation, decreases on increasing the sugar content beyond 5%.
The end torque presented in Figure 4.15 follows a similar trend. This reflects the results seen
in Section 4.5.
Figure 4.14 Peak torque in different sugar content doughs whilst mixing at atmospheric
pressure for 240 s. The data points illustrated are the mean of three measurements. The
error bars presented are one standard deviation on either side of the mean.
Figure 4.15 End torque in different sugar content doughs, following mixing at atmospheric
pressure for 240 s. The data points illustrated are the mean of three measurements. The
error bars presented are one standard deviation on either side of the mean.
R² = 0.8127
0
20
40
60
80
100
120
140
160
0 5 10 15T
ime p
eak t
orq
ue i
s re
ached (
s)
Sugar content (%)
2.7
2.8
2.9
3.0
3.1
3.2
0 5 10 15
Peak t
orq
ue (
N m
)
Sugar content (%)
2.152.202.252.302.352.402.452.502.552.60
0 5 10 15
End t
orq
ue (
N m
)
Sugar content (%)

85
In Figure 4.16 the work done over the mixing session in different sugar content doughs is
presented. The results do not show a trend. Section 4.4 suggesting sugar containing doughs
have a higher consistency led to the expectation that more work would be done in a given
time in doughs containing more sugar. It may be that a trend was not observed due to the
small number of measurements and the 4°C end temperature range of the dough, which can
affect work.
Figure 4.16 Work done at end torque in different sugar content doughs, following mixing at
atmospheric pressure for 240 s. The data points illustrated are the mean of three
measurements. The error bars presented are one standard deviation either side of the mean.
The speed with which mixing in the Tweedy mixer occurs depends upon the mixing speed set
on the system and the resistance exhibited by the dough mass in the mixer. The mixer speed
was set to the same value for each dough. In Figure 4.17 the mixing speed during mixing of
different sugar content doughs are illustrated. The results show a range of mixing speeds for
each sugar content dough and no change in the mixing speed with sugar content, despite the
lower torque with increased sugar. This finding illustrates that the torque in the Tweedy
mixer differs to conventional torque measurements. Although the dough exhibited greater
resistance to mixing in Section 4.4 on addition of sugar, the torque measurement in the
Tweedy mixer does not correspond to this.
Figure 4.17 Mean mixing speed during 4 minute mixing sessions of different sugar content
doughs. Each data point is an average of 684 data points from three batches of dough. The
error bars presented are one standard deviation either side of the mean.
The results in this section show a quicker formation of a solid mass with an increase in dough
sugar content and a difference during the mixing of the different sugar content doughs,witth
torque decreasing as the sugar content increases beyond 5%, a reflection of the differences
in dough rheology.
30000
40000
50000
60000
70000
0 5 10 15
Work
(J k
g-1
)
Sugar content (%)
60
65
70
75
80
85
0 5 10 15
Mix
ing s
peed (
rad s
-1)
Sugar content (%)

86
4.6 The effect of mixing speed on aeration of sugared doughs
Section 2.2.2 discussed the importance of mixing speed on dough development. Chin and
Campbell (2005) found that dough aeration is greater at faster mixing speeds. This sections
tests if this also applies to sugar containing doughs. It is important to know this, as mixing at
a higher speed for less time is more efficient and therefore will save time and money. It was
expected that mixing at a higher speed would be more efficient in sugared doughs, also.
4.6.1 Method: The effect of mixing speed on aeration of sugared doughs
Figure 4.17 of Section 4.5 showed that on changing the dough’s sugar content between 0% and
15%, the set mixing speed was not affected. It was hypothesized that over a set mixing time,
increasing the mixing speed increases dough aeration, due to the occlusion of more gas.
Doughs containing 0% and 15% sugar were mixed in the Tweedy 1 at different speeds for 180 s
and their density determined using the double cup method. The formulation of the doughs
and the mixing speeds used are presented in Table 4.6.
Table 4.6 Dough formulations and the mixing speeds used to assess aeration of different
sugar content doughs at different mixing speeds
0% sugar dough
formulation
15% sugar dough
formulation Mixing speed (rad s-1)
Ingredient Quantity (g / %)
40, 47, 54, 62, 70, 77
Flour c (11%) 400.00 / 59.8 400.00 / 54.9
Water 232.00 / 34.7 232.00 / 31.8
Sugar 0.00 / 0.00 60.00 / 8.23
Salt 7.20 / 1.08 7.20 / 0.99
Ascorbic acid 0.03 / 0.00448 0.03 / 0.00411
Vegetable fat 20.00 / 2.99 20.00 / 2.74
Fresh yeast 10.00 / 1.49 10.00 / 1.37
4.6.2 Results and discussion: The effect of mixing speed on aeration of sugared doughs
Figure 4.18 shows the density of the 0% and 15% sugar dough mixed at different speeds.
Consistent with previous results in this thesis, the 15% sugar dough is denser at all mixing
speeds. The results show a decrease in density following mixing at higher speeds over the set
mixing time in both doughs. This is likely to be due more mixer blade revolutions in the
mixing time and thus more gas is entrained in the dough. These results illustrate that higher
mixing speeds are more efficient. It was also noted in Chapter 2 that it was necessary to mix
above a critical mixing speed to develop the dough. The data points for each sugar content
dough also lie on lines of matching gradient, suggesting that dough density is proportional to
the mixing speed.

87
Figure 4.18 The density of 0% and 15% sugar strong flour dough mixed at different speeds
under atmospheric pressure for the 180 s. The data points presented are the mean of six
measurements from a single dough. Error bars have been omitted as they are smaller than
the markers used. Linear regression trend lines are shown.
4.7 The effect of sugar on dough stickiness
Dough stickiness depends upon both its cohesive and adhesive properties. Increased quantities
of sugar are likely to increase the stickiness of dough and earlier results in this chapter
suggest they may help doughs form in less time. Increased cohesion may make portioning of
the dough during production difficult and increased adhesion may cause a number of
processing difficulties, such as yield loss and factory downtime from dough sticking to
equipment, which increases production costs. This section investigates how dough
adhesiveness changes with sugar and as a result, the quantity of sugar that can be processed
in a Tweedy 1 mixer, based on the basic dough ingredients used.
4.7.1 Method: The effect of sugar on dough stickiness
Doughs with sugar contents ranging from 0-20% were mixed in the Tweedy 1, and prepared for
analysis in the texture analyser. Table 4.7 details the formulation of these doughs.
Table 4.7 Strong flour dough formulations used to assess the effect of sugar on dough
adhesiveness
0%
sugar
1.5%
sugar
5%
sugar
10%
sugar
15%
sugar
16%
sugar
17%
sugar
18%
sugar
19%
sugar
20%
sugar
Ingredient Quantity (g / %)
Flour c (11%) 400.00
/ 60.7
400.00
/ 60.1
400.00
/ 58.9
400.00
/ 57.2
400.00
/ 55.6
400.00
/ 55.3
400.00
/ 55.0
400.00
/ 54.7
400.00
/ 54.5
400.00
/ 54.1
Vegetable fat 20.00 /
3.03
20.00 /
3.00
20.00 /
2.94
20.00 /
2.86
20.00 /
2.78
20.00 /
2.77
20.00 /
2.75
20.00 /
2.74
20.00 /
2.72
20.00 /
2.71
Salt 7.20 /
1.09
7.20 /
1.08
7.20 /
1.06
7.20 /
1.03
7.20 /
1.00
7.20 /
1.00
7.20 /
1.00
7.20 /
0.985
7.20 /
0.980
7.20 /
0.974
Ascorbic acid 0.03 /
0.00455
0.03 /
0.00451
0.03 /
0.00442
0.03 /
0.00448
0.03 /
0.00417
0.03 /
0.00415
0.03 /
0.00413
0.03 /
0.00410
0.03 /
0.00408
0.03 /
0.00406
Sugar 0.00 /
0.00
6.00 /
0.902
20.00 /
2.94
40.00 /
5.72
60.00 /
8.34
64.00 /
8.85
68.00 /
9.35
72.00 /
9.85
76.00 /
10.3
80.00 /
10.8
Water 232.00
/ 35.2
232.00
/ 34.9
232.00
/ 34.2
232.00
/ 33.2
232.00
/ 32.3
232.00
/ 32.1
232.00
/ 31.9
232.00
/ 31.7
232.00
/ 31.6
232.00
/ 31.4
p = -0.0004s + 1.1817 R² = 0.8264
p = -0.0004s + 1.2078 R² = 0.8495
1.14
1.15
1.16
1.17
1.18
1.19
1.20
40 50 60 70 80
Densi
ty o
uts
ide m
ixer
(g
cm
-3)
Mixing speed (rads-1)
0% sugar15% sugarLinear (0% sugar)Linear (15% sugar)

88
Following mixing under atmospheric pressure for three minutes, the dough was rolled to a
thickness of 11 mm. This is illustrated in Figure 4.19. This thickness was used to ensure a
sufficient depth of dough was present for application of force with the texture analyser
probe.
Figure 4.19 Set up for rolling of the dough to obtain the desired thickness
A circular cutter of 50 mm in diameter was then used to obtain three samples from each
dough formulation. The base of the texture analyser was lightly dusted with flour to prevent
the dough from sticking to it. The three dough samples were individually placed onto the base
and a flat ended cylindrical probe penetrated the dough, under the adhesive test programme
on the texture analyser. This is illustrated in Figure 4.20 and the settings used are presented
in Table 4.8.
Figure 4.20 Texture analyser probing dough sample to assess adhesiveness
Table 4.8 Texture analyser settings used for dough adhesiveness test
Texture Analyser Setting
Pre-test speed 1 mm s-1
Test speed 1 mm s-1
Post-test speed 5 mm s-1

89
Applied force 0.98 N
Return distance 10 mm
Contact time 2 s
Trigger force 5 g
4.7.2 Results and discussion: The effect of sugar on dough stickiness
The results of the investigation of sugar on dough stickiness are presented in Figures 4.21 to
4.23. Although investigations were carried out for doughs containing up to 20% sugar,
experimental results were not obtained for the 20% sugar dough as adhesion of the dough to
the surface and rolling pin prevented it from being rolled out.
Figure 4.21 shows the time taken to apply 0.98 N of force via a probe into the dough, removal
of the probe from the dough and its return to starting position. The y-axis for force has
negative and positive values, depending upon the direction the probe was moving and the
force applied. Downwards movements towards the dough are expressed in negative units, and
the converse applies for the upwards movement of the probe. Figure 4.21 shows the
application of the 0.98 N force, followed by some multidirectional movement in force as it
penetrates the dough, and then a sudden decrease in the force as the probe returns to its
starting position. Another instability in force is then observed. It is the two instabilities that
are relevant to the dough’s adhesive properties. The first is due to the resistance to removal
resulting from the dough’s adhesive properties. The second is also due to dough stuck on the
end of the probe, and any force seen to act on the dough at the end of the experimental time
is due to dough stuck at the end of the probe. Following removal of the probe and at the end
of the experimental time there appears to be some residual force on the probe for the
experiment of the 19% sugar after 22 s.
For all doughs, the time required for removal of the probe from the dough is approximately 2
s. It was expected that this would increase as the sugar content increased. Figure 4.21 shows
an increase in time taken to apply 0.98 N of force to the dough with an increase in sugar. This
is most likely due to a more deformable and therefore softer dough. Figure 4.22 shows the
distance the probe travelled to apply 0.98 N of force with time in the different sugar content
doughs. Figure 4.22 shows a penetration depth ranging from 8-14 mm and times ranging from
11 to 21 s. It shows that the distance the probe travels to apply a force of 0.98 N increases
with sugar again suggesting the dough is more deformable with sugar. This distance is better
illustrated in Figure 4.23. Note the dough was only rolled to a depth of 11 mm. The greater
dough penetration depth observed is due to the dough relaxing and suggests the dough should
have been rested after mixing. Although the possible penetration depth differed, this should
not have affected tests for dough stickiness, as sufficient depth was present for application of
0.98 N.
Observations found increased stickiness during handling and Figure 4.21 found doughs with
increasing sugar contents were more likely to stick to the probe at the end of the experiment
than doughs containing lesser quantities of sugar. The results also indicated a decrease in

90
dough firmness as sugar content increased. These results are in agreement with the
observations made in Section 4.2.
Figure 4.21 Time and force required for application of 0.98 N of force with a probe to
different sugar content doughs and then to return the probe to starting position. The data
points illustrated are the mean of measurements from three samples from one dough batch.
Figure 4.22 Penetration depth of a probe when applying 0.98 N of force to different sugar
content doughs and distance travelled by the probe on returning to the starting position. The
data points illustrated are the mean of measurements from three samples from one dough
batch.
Figure 4.23 Distance travelled by a probe to apply 0.98 N of force to different sugar content
doughs. Each data point illustrated is the mean of three measurements from one dough
batch
-1
-0.8
-0.6
-0.4
-0.2
0
0.2
0.4
0 5 10 15 20 25
Forc
e (
N)
Time (s)
0% sugar
1.5% sugar
5% sugar
10% sugar
15% sugar
16% sugar
17% sugar
18% sugar
19% sugar
-10
-5
0
5
10
15
20
0 5 10 15 20 25Dis
tance (
mm
)
Time (s)
0% sugar
1.5% sugar
5% sugar
10% sugar
15% sugar
16% sugar
17% sugar
18% sugar
19% sugar
R² = 0.9068
6
8
10
12
14
16
0 5 10 15 20Dis
tance t
ravelled t
o a
pply
0.9
8 N
of
forc
e (
mm
)
Sugar content (%)

91
4.8 The effect of sugar on dough uniaxial extension
The limit of expansion is directly related to rupture of cells and loss of gas (Dobraszczyk et
al., 2001). Cells in dough expand during proving and baking. This occurs biaxially, thus a
representative method of determining dough extensibility is to inflate the dough. Sheets of
dough were inflated using a texture analyser and the pressure required to inflate the dough
measured. However, it was found that the texture analyser frequently could not generate
sufficient pressure to rupture the cell, or during inflation the dough would slip out from the
plates that were holding it down. Thus a uniaxial extension method adapted from that used
by Charalambides et al. (2006) was utilised. The force and distance the dough could be
extended before snapping was measured, with expectations that sugar containing doughs,
having received less gluten hydration and therefore not being as viscoelastic, would snap at
less distance and force.
4.8.1 Method: The effect of sugar on dough uniaxial extension
This section looks into the rheology of bread dough using stress and strain during dough
extension. Dough extensibility is an indicator of its elasticity. Measurements of dough
extensibility are useful for estimating proving and baking performance. Measurements of
force, distance and time were taken during a tension test on the dough using the texture
analyser. The extensibility of four sugar contents strong flour doughs was investigated. Their
formulations are given in Table 4.9.
Table 4.9 Strong flour dough formulations used for uniaxial extension of dough
0% sugar 7.5% sugar 15% sugar 17% sugar
Ingredient Quantity (g / %)
Flour c (11%) 400.00 / 60.7 400.00 / 58.0 400.00 / 55.6 400.00 / 55.0
Vegetable fat 20.00 / 3.03 20.00 / 2.90 20.00 / 2.78 20.00 / 2.75
Salt 7.20 / 1.09 7.20 / 1.04 7.20 / 1.00 7.20 / 0.990
Ascorbic acid 0.03 / 0.00455 0.03 / 0.00435 0.03 / 0.00417 0.03 / 0.00413
Water 232.00 / 35.2 232.00 / 33.66 232.00 / 32.3 232.00 / 31.9
Sugar 0.00 / 0.00 30.00 / 4.35 60.00 / 8.34 68.00 / 9.35
Two batches of dough were made from each formulation and three 8 g samples cut from each
dough, resulting in six measurements on each dough formulation. The dough samples were
hand rolled into a cylindrical shape and inserted into a cylindrical mould with the internal
length of 25 mm and width of 10 mm. The cylindrical mould is illustrated in Figure 4.20. It is
a two piece hollowed out cylinder, allowing the dough sample to sit along its centre. The
dough sample size was chosen as it would fill a greater space than that in the mould.
Therefore, once sat in the mould there were no obvious air gaps, and all samples were
consistent in dimension.

92
Figure 4.24 Two piece cylindrical mould used for shaping dough for uniaxial dough extension
experiments
The excess dough in the mould extruded from the ends and between the two halves of the
mould. The extruded ends were each flattened with a 200 g weight, which sat on the dough
ends for 30 minutes as the dough rested. This formed handles from which the dough could be
gripped. To ensure the flattened ends were equal in length and width, after 30 minutes, a
rectangular stencil was placed over the ends, and the excess dough removed using a sharp
knife. Hot air from a hairdryer was blasted at each dough end for 4 minutes to dry it out,
preventing stretching during extension. This comprised of 2 minutes on each side of the
dough. As drying out the dough can weaken it, a thin line of cyanoacrylate was squeezed
along the edges of where the dough would be gripped, as highlighted in Figure 4.21. A
rectangular stencil with 1 mm gaps every 1.5 mm and red liquid food colouring was used to
mark the dough so uniformity of the extension could be observed. The colouring was then left
to dry for 5 minutes.
Figure 4.25 Dough sample prepared for uniaxial extension system. Due to the similarity in
colour of the dough and background, the dough has been marked out in the image. The areas
where cyanoacrylate was applied is highlighted in yellow.
Using the rectangular dough ends, the dough was clamped onto the uniaxial extension device
on the texture analyser and a tension test run. The dough was extended by upwards
movement of the top clamp. The experimental set up is illustrated in Figures 4.22 and 4.23
and the settings are presented in Table 4.10.
Once the results were obtained, the shear stress and engineering strain on the dough when it
snapped was calculated. Shear stress is experienced when a force acts parallel to the sample
surface. The stress was calculated by dividing the force required to snap the dough by the
cyanoacrylate

93
size of the area being extended. Engineering strain is experienced when a stress acts
perpendicular to the sample surface. The strain was calculated by dividing the change in
length of the dough sample by its length prior to extension.
Table 4.10 Texture analyser settings used for dough uniaxial extension tests
Texture analyser parameter Texture analyser setting
Test mode Tension
Pre-test speed 6 mm s-1
Test speed 6 mm s-1
Post-test speed 6 mm s-1
Target mode Distance
Distance 400 mm
Trigger type Auto (force)
Trigger Force 59 mN
Break mode Level
Break sensitivity 29 mN
Break detect Stop
Stop plot at Start position
Tare mode Auto
Figure 4.26 Uniaxial extension system
Figure 4.27 Uniaxial extension system in action

94
A weakness in the methodology was noted. It was not possible to measure the degree of
clamping and hence the dough pieces were clamped to different extents. If clamped too
loosely, the dough sample would fall out or be pulled out from the clamp during the test and
if clamped too tightly, the sample would snap around the area of clamping. The different
degrees of clamping affect the stress placed on the dough and can affect the force required
to snap the dough. This limits reliability of the results and illustrates that the methodology
requires further development. The learning points can be utilised in developing a new
method. To improve the methodology, the dough could be extended horizontally with the
bulk of the dough resting on a surface to prevent stress on the dough. Horizontal extension
rather than vertical would ensure less force was placed on the lower parts of the dough, and
less dough present through slumping on the lower half of the dough. Pulling at both ends of
the dough would also provide a more uniform force throughout the dough, as would clamping
dough ends to the same degree. An alternative method approved by the AACC of determining
dough extensibility is through use of the Brabender Extensograph. This involves holding a strip
of dough horizontally at both ends, and measuring the resistance on pulling the dough
downwards with a hook.
4.8.2 Results and discussion: The effect of sugar on dough uniaxial extension
The methodology used to obtain these results requires further development to conclude. In
addition trends were not expressed in the results presented in Figures 4.24-4.28.
It is known that during cell expansion, local thinning can occur, therefore it was expected
that weaker areas of the dough exist and extension of the dough strips would not be uniform.
It was expected that on increasing the sugar content of the dough, the gluten would not
develop sufficiently and thus reduce the viscoelastic properties of the dough. Previous results
in this chapter show sugar containing doughs to have a lower viscosity. This would result in
the doughs being able to withstand less force and extension prior to snapping.
Observation of the marked lines on the dough strips showed a lack of uniform extension in the
dough samples. Due to the requirement of further development in the methodology,
measurements of the uniformity during extension were not assessed.
Figure 4.24 shows the force applied to each dough to snap it. As the sugar content increased,
less force was required to snap the dough. This is most likely due to sugar weakening the
dough structure, through preventing sufficient hydration of the proteins in the flour.
Insufficient hydration causes less viscoelasticity, resulting in less elasticity reflected
resistance during extension. The overlap in the error bars presented within the results and
other results within this section reflect the difficulty in repeatability in the method and
illustrate a need to further refine the method.

95
Figure 4.28 Force involved with time during uniaxial extension of a dough piece at speeds of
6 mms-1. Each point illustrated is a moving average of 60 points.
Figure 4.29 Distances involved with time during the extension of a dough piece at speeds of
6mms-1. Each point illustrated is a moving average of 60 points.
-0.05
0
0.05
0.1
0.15
0.2
0.25
0.3
0.35
0.4
0 10 20 30 40 50 60
Forc
e (
N)
Time (s)
0% sugar
7.5% sugar
15% sugar
17% sugar
190
210
230
250
270
290
310
0 10 20 30 40 50 60
Dis
tance (
mm
)
Time (s)
0% sugar
7.5% sugar
15% sugar
17% sugar

96
Figure 4.30 Force required to snap different sugar content dough strips during uniaxial
extension of the dough at a speed of 6 mm s-1. The data points illustrated are the mean of
six measurements. The error bars shown are one standard deviation either side of the mean.
Figure 4.25 shows the distance each sugar content dough is stretched before snapping. The
results do not show a trend between the distance stretched before snapping and sugar
content. It was hypothesized that the doughs containing more sugar would be less extensible.
Again this is due to sugar interfering with gluten hydration and therefore development, and
resulting in reduced viscoelastic properties.
Figure 4.31 Distance different sugar content dough strips were extended during uniaxial
extension at a speed of 6 mm s-1 before snapping. The data points illustrated are the mean
of six measurements. The error bars shown are one standard deviation either side of the
mean.
Figure 4.26 illustrates the relationship between the force applied to different sugar content
doughs to snap them and the distance these doughs will stretch before they snap. The results
do not show a trend amongst distance travelled before snapping and force applied to snap the
dough, although it is difficult to tell with just four points and scatter amongst the results. It
was expected that as the force applied to the dough increased, the distance the dough could
be stretched before it snapped would also increase. This was expected as a weaker dough
should snap under less force and therefore be stretched less before snapping than stronger
doughs. It was expected that sugar containing doughs would be weaker than non-sugar
containing doughs.
60
80
100
120
140
0 2 4 6 8 10 12 14 16 18Forc
e a
pplied t
o s
nap
dough (
N)
Sugar content (%)
75
100
125
150
175
0 2 4 6 8 10 12 14 16 18
Dis
tance s
tretc
hed
befo
re s
nap (
mm
)
Sugar Content (%)
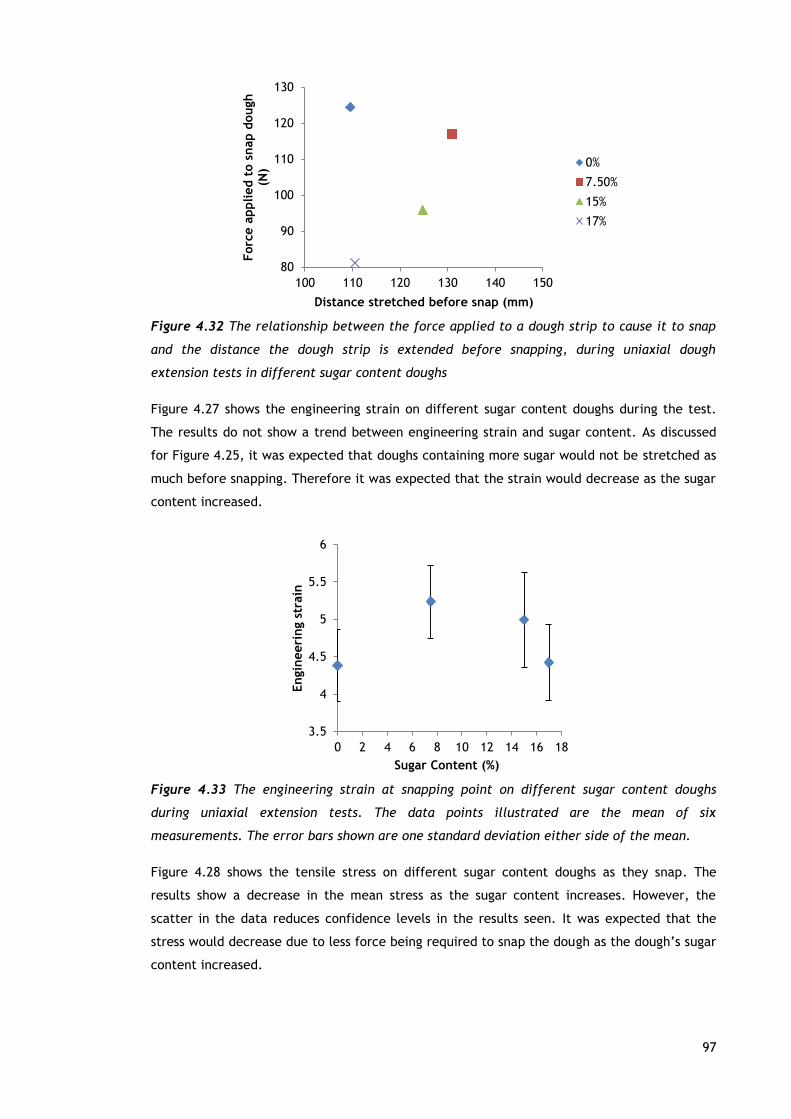
97
Figure 4.32 The relationship between the force applied to a dough strip to cause it to snap
and the distance the dough strip is extended before snapping, during uniaxial dough
extension tests in different sugar content doughs
Figure 4.27 shows the engineering strain on different sugar content doughs during the test.
The results do not show a trend between engineering strain and sugar content. As discussed
for Figure 4.25, it was expected that doughs containing more sugar would not be stretched as
much before snapping. Therefore it was expected that the strain would decrease as the sugar
content increased.
Figure 4.33 The engineering strain at snapping point on different sugar content doughs
during uniaxial extension tests. The data points illustrated are the mean of six
measurements. The error bars shown are one standard deviation either side of the mean.
Figure 4.28 shows the tensile stress on different sugar content doughs as they snap. The
results show a decrease in the mean stress as the sugar content increases. However, the
scatter in the data reduces confidence levels in the results seen. It was expected that the
stress would decrease due to less force being required to snap the dough as the dough’s sugar
content increased.
80
90
100
110
120
130
100 110 120 130 140 150
Forc
e a
pplied t
o s
nap d
ough
(N)
Distance stretched before snap (mm)
0%
7.50%
15%
17%
3.5
4
4.5
5
5.5
6
0 2 4 6 8 10 12 14 16 18
Engin
eeri
ng s
train
Sugar Content (%)

98
Figure 4.34 The stress at snapping point on different sugar content dough strips as they snap
during uniaxial extension tests. The data points illustrated are the mean of six
measurements. The error bars shown are one standard deviation either side of the mean.
4.9 ESEM of different sugar content doughs
Microscopy is commonly used to view the microstructure of bread dough. There are many
types of microscopy. Environmental Scanning Electron Microscopy (ESEM) is a type of SEM.
Using a focused beam of electrons, detailed micrographs were obtained of doughs containing
0% and 15% sugar. ESEM was used instead of SEM, as SEM requires samples to be electrically
conductive and completely dry, therefore the dough would first have to be dried, altering its
structure. ESEM employs modest gas pressures, allowing the dough to be scanned in its
natural state, and does not require the dough to be coated in a conductive material which
may conceal surface features. The microstructures of sugar and non-sugar containing doughs
were compared using a FEI Quanta 200 (Hillsboro, Oregon, USA). This was carried out to help
understand how the differences in structure affect the differences observed in sugar
containing and non-sugar containing doughs throughout the thesis.
4.9.1 Method: ESEM of different sugar content doughs
For this experiment, a gas pressure of 0.88 Torr was created in the sample chamber using
water vapour. The dough formulations used are given in Table 4.11.
Table 4.11 Strong flour dough formulations used for ESEM experiments
0% sugar 15% sugar
Ingredient Quantity (g / %)
Flour c (11%) 400.00 / 59.7 400.00 / 54.9
Water 232.00 / 34.7 232.00 / 31.8
Salt 7.20 / 1.08 7.20 / 0.99
Ascorbic acid 0.03 / 0.00448 0.03 / 0.00411
Sugar 0.00 / 0.00 60.00 / 8.23
Vegetable fat 20.00 / 2.99 20.00 / 2.74
Yeast 10.00 / 1.49 10.00 / 1.37
0.08
0.10
0.12
0.14
0.16
0.18
0.20
0 2 4 6 8 10 12 14 16 18Str
ess
(N
mm
-2)
Sugar Content (%)

99
These doughs were subjected to a pressure step decrease from 1 bara to 0.5 bara to mimic
CBP doughs and match the doughs presented in this thesis. The step change occurred after
110 s of mixing, and mixing continued for 230 s.
Following mixing, a dough sample approximately 10 g in mass was cut off with a razor blade
and frozen in liquid nitrogen. A hammer was used to fracture the sample and a fragment of
dough was placed into the ESEM and a scan run.
4.9.2 Results and discussion: ESEM of different sugar content doughs
Figures 4.35 and 4.36 are ESEM micrographs of fractured frozen dough samples containing 0%
and 15% sugar, following 230 s of mixing with a pressure step decrease at 110 s from 1 bara to
0.5 bara. These are shown at two magnifications: 600 and 1200 times. At this level of
magnification, different features in the dough can be identified. These include the gluten
network, starch granules and gas cells. The gluten network is the wispy material scattered
throughout the dough. Two types of starch granules are apparent, one which is ellipsoid in
shape and the other spherical in shape. The gas cells are the sunken ellipsoid holes scattered
throughout the dough and can be seen to range in diameter from 9-54 µm. The gas cells are
similar in size to the starch granules, and it may be the case that some of the cells are
recesses left by starch granules during fracturing.
When comparing the micrographs from the two dough formulations, differences can be seen
in the gluten. In Figure 4.35 showing the micrographs for the non-sugar containing dough, the
gluten strands are consistently distributed across the micrograph. However, in Figure 4.36,
the micrographs for the dough containing 15% sugar, although the gluten has formed a
connected network, it is intermittent throughout the dough matrix. A poorly formed gluten
veil exists along the left hand side of Figure 4.36(b), and gluten is scattered elsewhere
amongst the dough matrix, with areas existing with no significant quantities of gluten. This
suggests the ingredients were not uniformly mixed and the dough was not developed. The
connected network is a result of disulphide bonds between glutenin and gliadin and a sign of
dough development. It is likely that the presence of sugar meant insufficient water was
present to hydrate all the ingredients and distribute them uniformly throughout the dough
mass. Sugars are smaller in size than starch. Sugars have a large surface area to size ratio,
enabling them to dissolve fast during mixing, and prevent hydration of proteins and thus
formation of gluten.

100
Figure 4.35 ESEM micrograph of 0% sugar dough mixed for 230 s with a step change from 1
bara to 0.5 bara at 110 s (a) at 600 x magnification (b) at 1200 x magnification
(a)
(b)
Starch granule
Cell
Gluten veil

101
Figure 4.36 ESEM micrograph of 15% sugar dough mixed for 230 s with a step change from 1
bara to 0.5 bara at 110 s (a) at 600 x magnification (b) at 1200 x magnification
(b)
(a)
Starch granule
Cell
Gluten veil

102
4.10 The effect of sugar on the dynamic dough density during
proving
In Section 2.2.2, the double cup method of measuring density was introduced. The technique
was later explained in Section 3.4.3 and has so far been used in this thesis for static
measurements of dough density. This technique can also be used to monitor the dynamic
dough density (Mousia et al., 1997; Chiotellis and Campbell, 2003), as done in this section to
assess how sugar affects proving rates and the expansion capacity of bread dough. The
proving rate is important, as a longer proving time costs more money. The expansion capacity
is important as it is a measure of the dough’s viscoelastic properties, and the final volume of
the bread. It was expected that the presence of some sugar would increase proving rates, due
to the immediate supply of substrate available for yeast metabolism, and larger quantities of
sugar would induce osmotic stress on the yeast, slowing down metabolism and therefore rates
of bread dough proving. Expansion capacity of bread is expected to decrease with more
sugar, due to less of the flour proteins becoming hydrated and therefore the doughs having
lower viscoelastic properties.
4.10.1 Method: The effect of sugar on the dynamic dough density during proving
The effect of sugar on proving time and dough expansion capacity was determined through
dynamic dough density measurements via the double cup method. The minimum dough
density and time taken to reach minimum density during proving, were compared for strong
and weak flour doughs containing different quantities of sugar. The dough formulations used
are given in Tables 4.12 and 4.13.
Table 4.12 Strong flour dough formulations used to observe the dynamic dough density
during proving at 38ºC
0% sugar 1.5% sugar 5% sugar 10% sugar 15% sugar
Ingredient Quantity (g / %)
Flour c (11%) 400.0 / 61.4 400.0 / 60.9 400.0 / 59.6 400.0 / 57.9 400.0 / 56.2
Salt 7.2 / 1.11 7.2 / 1.10 7.2 / 1.07 7.2 / 1.04 7.2 / 1.01
Dough
improver 2.0 / 0.307 2.0 / 0.304 2.0 / 0.298 2.0 / 0.289 2.0 / 0.281
Water 232.0 / 35.6 232.0 / 35.3 232.0 / 34.6 232.0 / 33.6 232.0 / 32.6
Fresh yeast 10.0 / 1.54 10.0 / 1.52 10.0 / 1.49 10.0 / 1.45 10.0 / 1.41
Sugar 0.0 / 0.00 6.0 / 0.913 20.0 / 2.98 40.0 / 5.79 60.0 / 8.44

103
Table 4.13 Weak flour dough formulations used to observe the dynamic dough density
during proving at 38ºC
0% sugar 1.5% sugar 5% sugar 10% sugar 15% sugar
Ingredient Quantity (g / %)
Flour a
(10.1%) 400.0 / 62.1 400.0 / 61.5 400.0 / 60.2 400.0 / 58.5 400.0 / 56.8
Salt 7.2 / 1.12 7.2 / 1.11 7.2 / 108.4 7.2 / 1.05 7.2 / 1.02
Dough
improver 2.0 / 0.310 2.0 / 0.308 2.0 / 0.301 2.0 / 0.292 2.0 / 0.284
Water 225.0 / 34.9 225.0 / 34.6 225.0 / 33.9 225.0 / 32.9 225.0 / 32.0
Fresh yeast 10.0 / 1.55 10.0 / 1.54 10.0 / 1.51 10.0 / 1.46 10.0 / 1.42
Sugar 0.0 / 0.00 6.0 / 0.923 20.0 / 3.01 40.0 / 5.85 60.0 / 8.52
To prepare the dough, following mixing it was rolled out to a thickness of 11 mm and a cutter
used to obtain two 23 mm in circular diameter samples. Each sample was swivelled for 30 s in
a lightly floured conical flask to smooth out any damage on the outer dough edges to avoid
unrepresentative loss of gas. The dough’s weight in air was taken, before it underwent
proving in the double cup system. Proving took place at 38◦C to mimic proving temperatures.
The double cup system recorded the dough’s weight in silicone oil every 10 s. Recording took
place digitally using Labview 7 Express (National Instruments, Newbury, Berkshire, UK) until
the dough’s weight began to increase, and thus loss of gas was greater than that entrained in
the cells through yeast carbon dioxide production. Four sets of measurements were carried
out on each dough formulation, using two batches of dough. The mean of the four
measurements was used to provide the results below.
4.10.2 Results and discussion: The effect of sugar on the dynamic dough density during
proving
In Figure 4.37 the change in density over proving time for strong and weak flour doughs of
different sugar contents are presented. For all doughs, the density decreases slowly initially
before the rate picks up and slows down as it approaches a minimum and then increases. The
changes in density observed agree with voidage measurements via X-ray CT during proving in
Section 6.4.2.
There are three reasons why the initial drop in density is slower. The first is the cells in the
dough are smaller and therefore more difficult to inflate. Secondly, the carbon dioxide
generated by the yeast dissolves in the liquid phase of the dough before entering the bubbles;
it takes time for the carbon dioxide concentration to build up sufficiently for rapid bubble
growth. Finally, it is also slower initially as the dough temperature is lower and therefore
yeast activity is slower. The dough leaves the mixer at 30◦C, whereas the temperature in the
experimental set up is 38◦C. With the small sample size used, the temperature of the dough
quickly increases with time, until it reaches 38◦C. It is known that the initial rate is not slower
104
due to yeast activation rates, as fresh yeast was used. Unlike dried yeast, fresh yeast does
not require hydration for activation.
The rate the density drops decreases as the density approaches the minimum due to the
presence of larger cells (a result of cell growth and coalescence, as seen in Section 6.4.2)
rupturing and causing loss of gas from the dough. As this occurs, cells continue to grow from
yeast carbon dioxide production. After the accelerated decrease in dough density, the rate
the density falls slows down as it approaches minimum density. The minimum density is
reached when the viscoelastic properties of the dough have reached its limit for the total
quantity of gas which can be retained. From this point, although the yeast continue to
produce carbon dioxide, a greater quantity of gas than that which diffuses into the cells
escapes from the dough as the cells breakup, resulting in an increase in dough density. The
density of the dough continues to increase as proving continues, slowing down as the dough’s
gas free density is approached. With the large surface area of the dough pieces, loss of gas
from the dough samples is quicker than would occur in standard loaf sizes. Comparison to the
results in Section 6.4.2, also show a higher proving rate in these samples, despite the larger
dough samples used in the dynamic dough density measurements via the double cup. This is
likely to be a result of higher proving temperatures increasing yeast carbon dioxide rates.
Figure 4.38 shows the time taken to reach minimum density during proving in different sugar
content strong and weak flour doughs. An increase in proving time with increased sugar
quantities is seen in agreement with Williams and Pullen (2007). The doughs containing 1.5%
sugar are an exception to this, and reach minimum density in less time than the other doughs.
The quickest proving rate was expected in the 1.5% sugar dough. This proportion of sugar is
regularly used in industrial breadmaking to accelerate proving. Yeast use sugar as a substrate,
so the addition of a small quantity of sugar to the dough accelerates carbon dioxide
production rates. This is because there is an immediate supply available for yeast
metabolism. When sugar is not added, there is some sugar present from starches within the
flour, although the majority of these starches must first be broken down through enzymic
activity. This effect is only true when small proportions of sugar are added. Lallemand
(1996b) recommend 20% of the yeast weight of sugar is added to the dough formulation to
avoid the lag phase. In the case of the dough formulation used here, this would be equivalent
to 2% sugar. This is reflected in the overlap of lines between the 0%, 1.5% and 5% sugar
doughs in Figure 4.37 around when the minimum density is reached. As seen by the addition
of 10% and 15% sugar, increased quantities of sugar slow down yeast carbon dioxide
production and therefore the proving rate of bread dough. This is likely to be true also in
higher quantities of sugar than those investigated.
The observed reduction in proving rate with sugar could be due to a number of reasons: 1.
Cells are smaller and therefore more difficult to inflate, as suggested in Section 6.2.2. 2. The
increased ethanol production as a result of increased quantities of sugar creates a toxic
environment (Carlson et al., 1991). It is known that the rate of carbon dioxide production is
reduced by approximately 20% at ethanol concentrations of 4%, and 1 g of sugar yields 0.5 g

105
ethanol (Anon, 1996b). 3. The proportion of yeast present in the dough decreases as the sugar
content increases, resulting in less carbon dioxide production in relation to the quantity of
dough present. 4. Yeast became stressed due to the increased osmotic pressure on them, a
result of the reduced water activity in the dough. It is known that sugar is one of the main
characteristics that affects yeast performance and different strains are used worldwide to
enable production of typical bread varieties of the respective country (Anon, 1996a). In
addition, the presence of more sugar does not increase the rate at which yeast can digest this
sugar. Thus once sufficient quantities of sugar are provided for yeast to begin metabolising
immediately, more sugar is surplus. These results suggest that more appropriate strains of
yeast are available for producing sweetened breads via the CBP; the slow carbon dioxide rate
associated with the yeast strain used would incur increased production costs in sweetened
doughs.
The results in Figure 4.38 also show that the minimum density was reached quicker in the
weak flour doughs than the strong. This was as expected, as the lower gluten content of weak
flour doughs means their viscoelastic properties and hence gas retaining capacity is lower.
Figure 4.37 Change in density of different sugar content (a)strong doughs (b) weak doughs,
during proving at 38ºC. The results presented are the mean of four data measurements taken
from two batches of dough. The error bars have been omitted for clarity.
Figure 4.38 Proving time required for different sugar content strong and weak flour doughs,
to reach their minimum density. The data points are the mean of four measurements, taken
from two batches of dough. Error bars are one standard deviation either side of the mean.
0.0
0.2
0.4
0.6
0.8
1.0
1.2
1.4
0 25 50 75 100 125 150
Densi
ty (
g c
m-3
)
Proving time (minutes)
0% sugar
1.5% sugar
5% sugar
10% sugar
15% sugar
0.0
0.2
0.4
0.6
0.8
1.0
1.2
1.4
0 25 50 75 100 125 150
Densi
ty (
g c
m-3
)
Proving time (minutes)
0% sugar
1.5% sugar
5% sugar
10% sugar
15% sugar
50
70
90
110
130
150
0 5 10 15
Tim
e t
o m
inim
um
densi
ty
(min
ute
s)
Sugar content (%)
strong
weak
(a) (b)

106
Figure 4.39 shows the minimum density reached during proving of the different sugar content
strong and weak flour doughs respectively. The results do not show a trend between dough
minimum density and sugar content, and doughs from the two flours illustrate a different
result. The strong flour dough shows a decrease in the minimum density up to a sugar content
of 10%. An increase in sugar to 15% sees the dough minimum density increase to a value
greater than all of the other sugar contents. In the weak flour dough, the minimum density
increases from a sugar content of 0% to 1.5% before decreasing to a sugar content of 10% and
increasing as the dough sugar content increases to 15%. In the weak flour dough there is a
greater difference in the minimum density between the different sugar content doughs than
the strong flour doughs. This is likely to be due to the weak flour doughs being less stable. It
was expected that the minimum density of the doughs during proving would be greater (more
dense) in the doughs containing more sugar, due to their higher gas free dough densities,
lower voidage and the expectation that a proportionally lower gluten content and most likely
insufficient dough development, would result in lower viscoelastic properties and gas
retaining capacity of the dough. The results show that the quantity of sugar present in the
dough affects proving through extension of the proving time, which adds to the cost of bread
production. The minimum density of doughs reached upon proving was not affected by the
sugar content.
Figure 4.39 Minimum density reached by different sugar content (a) strong doughs (b) weak
doughs when proving at 38ºC. The data points are the mean of four measurements, taken
from two batches of dough. Error bars have been omitted for clarity, as they were smaller
than the markers used
0.2
0.25
0.3
0.35
0.4
0.45
0 2 4 6 8 10 12 14 16
Min
imum
Densi
ty (
g c
m-3
)
Sugar Content (%)
0% Sugar1.5% Sugar5% Sugar10% Sugar15% Sugar
0.2
0.25
0.3
0.35
0.4
0.45
0 2 4 6 8 10 12 14 16
Min
imum
Densi
ty (
g c
m-3
)
Sugar Content (%)
0% Sugar1.5% Sugar5% Sugar10% Sugar15% Sugar
(a) (b)

107
4.11 The effect of sugar on finished bread
Baking is the third and final stage of the three main breadmaking stages. The heat transferred
leads to gas expansion and liquid vaporisation which causes further expansion of the dough
volume and changes the dough into an edible and appealing product. This section investigates
the effect of sugar on the baking of bread and on the characteristics of the finished bread.
Bread made using a Tweedy mixer and a breadmaker were assessed. Industrially made bread
is typically made in a Tweedy mixer, but by carrying out investigations on both pieces of
equipment, the investigation becomes more interesting and the effect of sugar can be
observed. Characteristics such as loss of water during baking, loaf firmness, loaf volume and
the cell size distributions within the cells were investigated. These are expected to differ in
different sugar content doughs, and it is expected that the different processing will lead to
differences in results between the breadmaker and Tweedy loaves.
4.11.1 Method: The effect of sugar on finished bread
Table 4.14 gives the formulations for the assessed laboratory made loaves.
Table 4.14 Formulations of baked bread loaves
0% sugar 1.5% sugar 5% sugar 10% sugar 15% sugar 17% sugar
Ingredient Quantity (g / %)
Flour a
(10.1%)
400.00 /
59.8
400.00 /
59.2
400.00 /
58.0
400.00 /
56.4
400.00 /
54.9
400.00 /
54.1
Vegetable
fat
20.00 /
2.99
20.00 /
2.96
20.00 /
2.90
20.00 /
2.82
20.00 /
2.74
20.00 /
2.71
Salt 7.20 / 1.08 7.20 / 1.07 7.20 / 1.04 7.20 / 1.02 7.20 /
0.987
7.20 /
0.975
Ascorbic
acid
0.03 /
0.00448
0.03 /
0.00444
0.03 /
0.00435
0.03 /
0.00423
0.03 /
0.00411
0.03 /
0.00406
Water 232.00 /
34.7
232.00 /
34.4
232.00 /
33.7
232.00 /
32.7
232.00 /
31.8
232.00 /
31.4
Sugar 0.00 / 0.00 6.00 /
0.889
20.00 /
2.90
40.00 /
5.64
60.00 /
8.23
69.00 /
9.34
Fresh yeast 10.00 /
1.49
10.00 /
1.48
10.00 /
1.45
10.00 /
1.41
10.00 /
1.37
10.00 /
1.35
Loaves of bread were made using either the breadmaker, or mixed in the Tweedy 1 and
proved and baked, as detailed in Section 3.6.1. Two methods were used to determine if the
effects of sugar were evident in both methods and how they varied between the methods.
In addition, three separate batches of the dough were made in the breadmaker for
assessment of dough density immediately after mixing via the double cup system.

108
Once the loaves were cool, they were weighed and the difference in weight before and after
baking was calculated as a percentage.
One parameter which can affect the final bread quality is the proving time. As seen in
Section 4.10, proving time should be extended when increasing the sugar content of dough. In
these experiments proving time was kept constant; each dough was proved for an hour,
regardless of the sugar content. Thus it is likely that the sugar containing doughs were
underproved, and the degree to which each dough was proved decreased as the sugar content
increased. Proving each dough for a different length of time in accordance to the dough’s
sugar content would have solved that problem. The results in Section 4.10 differ in the
experimental conditions but could be used as a guideline to the proving time. However,
varying the proving time creates another variable.
The specific volume of the loaves was determined using the methodology in Section 3.4.6.
Following this each loaf was sliced transversely to a thickness of 15 mm using a serrated knife
to ensure an even surface. Testing of the crumb structure and firmness was conducted on the
three most central slices of the loaf.
The crumb structure was assessed using the C-Cell imaging system (Calibre Control
International, Warrington, UK). Raw images were generated of the three most central slices
from the different loaves and analysed images, focusing on the cell sizes. The C-Cell cell
image is coloured in blue, with smaller cells being dark blue in colour and larger cells being
lighter blue in colour. Those highlighted in red are holes, where holes are three times the
standard deviation of the mean cell size. The cell number and size were the parameters of
interest. Two parameters were output as measurements of cell size. These were cell volume
and cell diameter. The C-Cell calculates the cell volume from 2D measurements of cell area
and the estimated depth from the shadow cast into each cell. The volume of each cell is
estimated through backwards calculations of the cell area. Cell diameter was used in
preference to cell volume as an indication of cell size, as this is more accurate than using
values obtained through estimation. A test was carried out to compare the difference in the
given cell diameter and using backwards calculations of the cell volume to determine the
diameter. The cell diameter was found to vary by less than 5%. This suggests the accuracy of
the given C-Cell diameter is within 5%.
When presenting the number of cells, these are presented both as the number of cells of
different sizes alone, and also the number of cells per square millimetre. The former is to
present the full cell size distribution and enable any cells that skew the data to be identified
and the latter the same, but should be more representative, taking into account the
dimensions of the bread slices used.
The firmness was determined using the texture analyser. A flat ended cylindrical probe was
pushed into the bread, and the force required to compress the bread by 8 mm whilst
penetrating the dough at 2 mm s-1 was measured. Single factor ANOVA tests at a 95%
significance level were carried out on all test results.

109
4.11.2 Results and discussion: The effect of sugar on finished bread
In this section measurements of a range of parameters from laboratory made bread and
purchased baked goods are presented respectively.
The weight of a bread product before and after baking changes as a result of moisture loss.
The high temperatures cause the water in the product to evaporate and diffuse into the
atmosphere. As the product cools down, it continues to lose moisture as steam. The
proportion of water lost during breadmaking is important as it determines the final product
weight. Bread is sold by weight, so a significant loss of moisture decreases profit margins. An
investigation was carried out to determine whether the addition of sugar to a bread dough
formulation would affect the quantity of water lost from the product. It was hypothesised
that the addition of sugar would result in less moisture loss from the dough, due to 1. A crust
forming earlier and slowing down moisture loss, and 2. Sugar increasing the temperature at
which water evaporates. As the cooking time of the loaf was only 25 minutes, the window for
which a crust would form was small, thus only a small difference in moisture loss is expected.
Figure 4.40 shows the relationship between the sugar content of the dough and the grams of
liquid lost per gram of solid from baking each loaf The proportion of weight loss in doughs
produced from both methodologies increases up to a sugar content of 1.5% and then
decreases up to a sugar content of 10%. The proportion of weight loss in the loaves then
increases, although the size of the increase is twice as large in the breadmaker loaves. From
a sugar content of 15% to 17% the weight loss in the breadmaker loaves increases, and that in
the Tweedy loaves decreases. The results do not show a relationship between sugar content
and weight loss during baking, but differences are exhibited in the breadmaking methods.
There are a number of reasons why this may be the case: loaf size and in particular their
surface area and the baking conditions, such as temperature, how heat is distributed and
transferred to the dough, are factors that affect evaporation from the product surface.
The results do not agree with the hypothesis. It is likely that the consistent proving time
meant sugar containing loaves had a lower volume and surface area, which countered the
effect of reduced water loss expected with earlier crust formation and elevated evaporation
temperatures.
The results show moisture loss is also consistently higher in the breadmaker loaves. This is
most likely due to differences in surface area, the heat exposure time, the baking
temperature, and the heat transfer method. For both cooking methods the product is cooked
via conduction and convection, although convection plays a bigger role in the production of
the Tweedy loaves, due to a larger quantity of hot air surrounding the loaves. This
accelerates the cooking time of the loaf and explains why the length of the baking operation
is greater in the breadmaker. Water evaporates at 100◦C, and this temperature increases on
addition of sugar. The longer the length of time bread is exposed to these temperatures, the
more water that is lost from the dough. The dough was also present in the breadmaker for
longer as the temperature in the breadmaker increased from the proving to baking

110
temperature, whereas for the Tweedy loaves, the dough was put into a pre-heated oven.
These results do not show a relationship between weight loss during baking and sugar
content.
Figure 4.40 The percentage weight loss of different sugar content loaves as a result of
baking. Each data point is the mean of three measurements from separate loaves. Error bars
are one standard deviation either side of the mean.
The specific volume of different sugar content loaves produced using both methods was
determined. Due to the increased dough density following mixing (Section 3.4) and
requirement for longer proving times (Section 4.10) it was hypothesized that the specific
volume of the baked bread would decrease as the sugar content increased. Figure 4.41 shows
the specific volume of different sugar content loaves made using the two methodologies. The
Tweedy and breadmaker loaves show opposing trends. The Tweedy loaves show a general
decrease in the specific volume as the sugar content increases, and the breadmaker loaves
show an increase. However, there is also a lot of scatter in the results, in particular those of
the breadmaker, making it difficult to identify with confidence if a trend exists. In Tweedy
loaves an increase in the specific volume was observed as the sugar content increased from
0% to 1.5%. From a sugar content of 1.5% to 17%, the specific volume decreased from
approximately 3.7 cm3 g-1 to 2.7 cm3 g-1. For the breadmaker loaves, a decrease of
approximately 0.1 cm3 g-1 in the specific volume was seen as the sugar content increased from
0% to 1.5%. The specific volume continued to increase up to a sugar content of 10%. At 15%
sugar, the specific volume dropped by approximately 0.3 cm3 g-1 and increased as the sugar
content increased to 17%. ANOVA tests on the loaves from both methodologies found a
significant difference between the specific volume of different sugar content loaves.
The results exhibited in the Tweedy loaves were in line with the hypothesis, showing a
reduction in the specific volume of bread as the sugar content increased. An additional reason
why sugar may reduce the specific volume of bread is dough development is likely to be
0.06
0.08
0.1
0.12
0.14
0.16
0.18
0 5 10 15 20
g w
ate
r lo
ss /
g s
olids
Sugar content (%)
Breadmaker
Tweedy

111
reduced, thus reducing the viscoelastic properties of the dough and making cell rupture more
likely. It remains unclear why the specific volume of the breadmaker loaves increased with
sugar, but is most likely related to the methodology. However, it is expected and was found
that the increased dough density and increased proving time found in the Tweedy mixer
would also apply to loaves produced in the breadmaker, regardless of the differences in
methodology. These results are illustrated in Figures 4.42 and 4.43, respectively. Figure 4.42
shows the dough density outside the mixer following mixing, and Figure 4.43 shows the
proving time of the dough mixed in the breadmaker. As with the Tweedy loaves, regardless of
the dough’s sugar content and weight, the same proving time and conditions were used in all
of the breadmaker loaves. The proving time and conditions used for breadmaking were
according to the breadmaker programme set for a basic loaf. ANOVA tests at 95% significance
level and the contrasting trends expressed by loaves of both methodologies suggest that sugar
affects the specific volume, and the opposing trends are a result of the methodology.
Industrial bread is made in a scaled up version of the Tweedy 1 mixer used. Upscaling
increases dough aeration during mixing (Martin et al., 2004b). It is assumed this is consistent
with the sugar content, thus it is likely that the trend expressed in the experimental results
from the Tweedy 1 would resemble those in the CBP.
Although bread is sold by weight, consumers use the loaf’s volume as an indication of its
value for money. This is a reason why the specific volume of the bread is important. The
specific volume also impacts on the eating characteristics of the bread. Unless a denser bread
is desired, increasing the sugar content has a negative effect on the specific volume of bread.
Figure 4.41 The specific volume of different sugar content loaves. Each data point is the
mean of three measurements from separate loaves. The error bars are one standard
deviation either side of the mean.
2.5
3
3.5
4
4.5
0 5 10 15 20
Specif
ic v
olu
me (
cm
3 g
-1)
Sugar content (%)
Breadmaker
Tweedy
Linear(Breadmaker)
Linear (Tweedy)

112
Figure 4.42 Density of different sugar content doughs mixed in the breadmaker. Each data
point is the mean of six measurements from separate loaves. The error bars are one standard
deviation either side of the mean.
Figure 4.43 Change in density during proving at 38ºC of different sugar content strong flour
doughs mixed in a breadmaker. The results presented are the mean of four data
measurements taken from two batches of dough. The error bars have been omitted for
clarity.
Specific volume and density are related parameters quantifying the weight and space
occupied by the dough. Figure 4.44 illustrates the relationship between dough density
following mixing and proving. Figure 4.44 shows the Tweedy doughs to be less dense than the
breadmaker doughs, implying greater aeration in the Tweedy mixer. However, no relationship
can be seen between the density of the dough immediately following mixing and the
minimum density of the dough obtained during proving. This finding reflects the well known
point of the cell size distribution and gas holding capacity being responsible for the voidage of
the final bread. The relationship between specific volume and the cell sizes and number
density in the bread loaves made are explored later in this section.
1.17
1.18
1.19
1.2
1.21
1.22
1.23
1.24
0 5 10 15 20
Dough d
ensi
ty (
g c
m-3
) Sugar Content (%)
0.4
0.6
0.8
1.0
1.2
0 2000 4000
Densi
ty (
g c
m-3
)
Time (s)
0% dough density1.5% dough density5% dough density10% dough density15% dough density

113
Figure 4.44 The relationship between the density of different sugar content doughs
immediately after mixing and their minimum density obtained during proving in breadmaker
and Tweedy loaves.
The relationship between dough density following mixing and the density of the breadmaker
and Tweedy loaves are illustrated in Figure 4.45. The results show opposing trends for
breadmaker and Tweedy loaves. In Tweedy loaves, as the dough density following mixing
increases, the density of the bread increases. In breadmaker loaves, as the density following
mixing increases, the density of the bread increases. Although it is easy to assume that a
denser dough will lead to a denser bread, there is no reason for this expectation, as it is the
size and number of cells and manipulation of them throughout the breadmaking process which
indicates the bread’s final density. However, the trends observed highlight that trends can
exist within a set methodology and suggest the differences observed between the breadmaker
and Tweedy loaves are due to differences in the methodology. The factor most likely to have
caused the observed differences is the mixing. Tweedy mixers operate at a high speed, and
entrain a greater volume of air in a finer distribution than doughs mixed in a conventional
mixer for the same time. The opposing trends are likely to be a result of mixing affecting the
cell distribution. It is known that in the breadmaker dough, doughs following mixing are
denser with more sugar. The differences in distribution will have an effect at later stages of
breadmaking and on the final bread.
0.25
0.35
0.45
0.55
1.16 1.18 1.20 1.22
Min
imum
pro
of
densi
ty (
g c
m-3
)
Dough density outside mixer following mixing (g cm-3)
Breadmaker
Tweedy
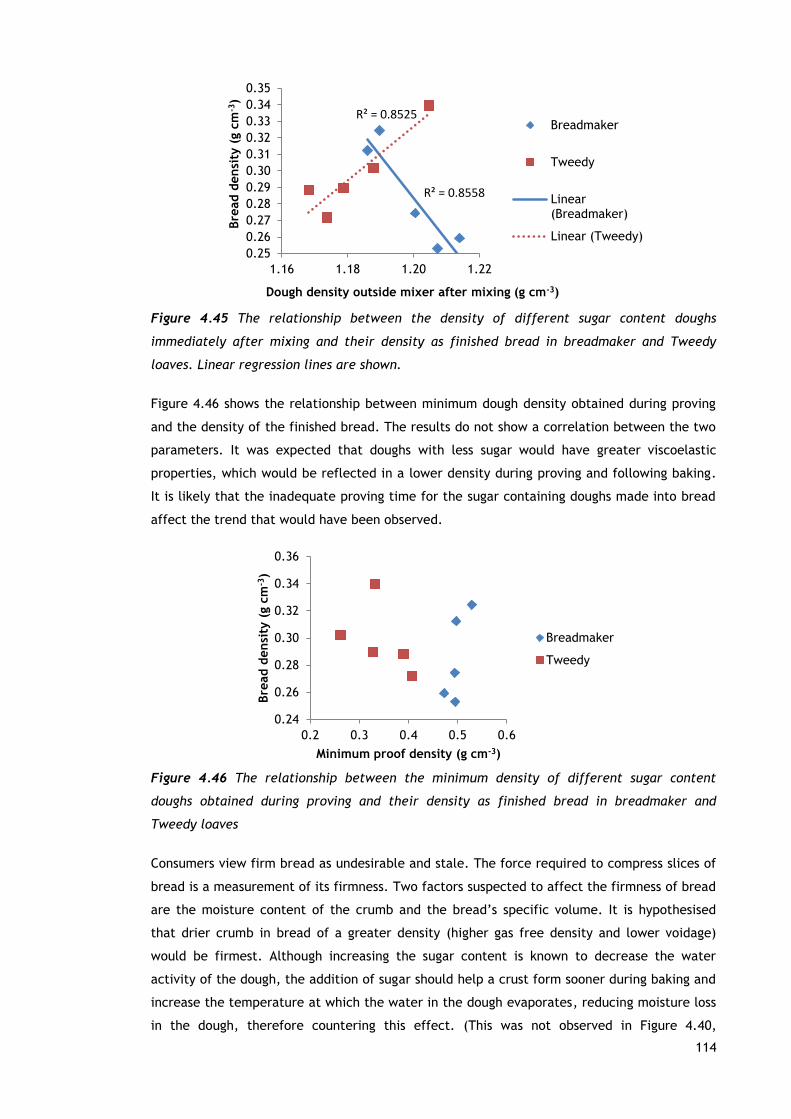
114
Figure 4.45 The relationship between the density of different sugar content doughs
immediately after mixing and their density as finished bread in breadmaker and Tweedy
loaves. Linear regression lines are shown.
Figure 4.46 shows the relationship between minimum dough density obtained during proving
and the density of the finished bread. The results do not show a correlation between the two
parameters. It was expected that doughs with less sugar would have greater viscoelastic
properties, which would be reflected in a lower density during proving and following baking.
It is likely that the inadequate proving time for the sugar containing doughs made into bread
affect the trend that would have been observed.
Figure 4.46 The relationship between the minimum density of different sugar content
doughs obtained during proving and their density as finished bread in breadmaker and
Tweedy loaves
Consumers view firm bread as undesirable and stale. The force required to compress slices of
bread is a measurement of its firmness. Two factors suspected to affect the firmness of bread
are the moisture content of the crumb and the bread’s specific volume. It is hypothesised
that drier crumb in bread of a greater density (higher gas free density and lower voidage)
would be firmest. Although increasing the sugar content is known to decrease the water
activity of the dough, the addition of sugar should help a crust form sooner during baking and
increase the temperature at which the water in the dough evaporates, reducing moisture loss
in the dough, therefore countering this effect. (This was not observed in Figure 4.40,
R² = 0.8558
R² = 0.8525
0.25
0.26
0.27
0.28
0.29
0.30
0.31
0.32
0.33
0.34
0.35
1.16 1.18 1.20 1.22
Bre
ad d
ensi
ty (
g c
m-3
)
Dough density outside mixer after mixing (g cm-3)
Breadmaker
Tweedy
Linear(Breadmaker)
Linear (Tweedy)
0.24
0.26
0.28
0.30
0.32
0.34
0.36
0.2 0.3 0.4 0.5 0.6
Bre
ad d
ensi
ty (
g c
m-3
)
Minimum proof density (g cm-3)
Breadmaker
Tweedy

115
however.) In this thesis, the moisture content of bread was not determined, but density was
presented previously in this section, and the relationship between loaf density and firmness is
investigated later in this section.
Figure 4.47 shows the force required to compress different sugar content loaves by 8 mm. As
with other results in this section, opposite trends are found in the loaves produced from both
methodologies. As the sugar content increases, an increase was observed in the firmness in
Tweedy loaves and a decrease in the breadmaker loaves. ANOVA tests found a significant
difference between the firmness of the different sugar content loaves. These results show
that production of sweetened bread with mixing in the Tweedy mixer can produce firmer
bread, which consumer’s may perceive as unattractive.
Figure 4.47 The force required to compress different sugar content loaves by 8 mm. Each
data point is the mean of twelve measurements from three separate loaves. The error bars
are one standard deviation either side of the mean.
In Figure 4.48, the relationship between bread density and the firmness of the crumb is
presented. The results show an increase in firmness as the density of the loaves increased in
both the Tweedy and breadmaker loaves. More resistance to force is expected in denser
loaves due to both the presence of fewer gas cells and a denser crumb.
Figure 4.48 The relationship between the force required to compress bread 8 mm and the
density of the bread in breadmaker and Tweedy loaves. Linear regression lines are shown.
0
1
2
3
4
5
6
7
8
9
10
0 5 10 15 20
Forc
e t
o c
om
pre
ss 8
mm
(N
)
Sugar content (%)
Breadmaker
Tweedy
Linear(Breadmaker)
Linear (Tweedy)
R² = 0.8527
R² = 0.8954
0.24
0.26
0.28
0.3
0.32
0.34
0.36
0.38
0 2 4 6 8 10
Bre
ad d
ensi
ty (
g/c
m3)
Force to compress 8 mm (N)
Breadmaker
Tweedy
Linear(Breadmaker)Linear(Tweedy)

116
The distribution of air in bread is determined by the volume and number of cells (these are
interconnected in bread). This is important in determining the eating characteristics of the
bread. Different distributions are desirable depending on the eating characteristics sought.
For example, the Mexican tortilla contains extremely small cells distributed amongst the flat
bread, allowing it to be wrapped around different fillings without altering the bread’s
texture. The gas cells in Italian ciabatta are comprised mainly of large cells. These give
ciabatta a light and airy texture, as opposed to dense rye bread which contains few cells, all
of which are considerably smaller in size.
In Figure 4.49, the relationship between sugar content and cell number density of the
different sugar content loaves are illustrated. Figure 4.49 shows an increase from
0.6 cells mm-2 in non-sugar containing Tweedy mixer made bread to 0.64 cells mm-2 in bread
containing 1.5% sugar. An increase to 5% sugar sees the cell density drop to 0.52 cells mm-2
before gradually increasing to 0.56 cells mm-2, as the sugar content increases to 17%. In the
breadmaker loaves the cell density decreases from 0.62 cells mm-2 to 0.58 cells mm-2 as the
sugar content increases from 0% to 10%. On increasing the sugar content to 15% and then 17%
the cell density increases to 0.64 cells mm-2 and 0.67 cells mm-2, respectively. The results and
ANOVA tests show differences between cell number density in different sugar content loaves,
with a suggestion when considering both sets of data that as the sugar content increases, the
number of gas cells decreases and then increases. These differences are expected to have a
significant effect on an individual’s perception of the loaf. With differences having been
observed in loaf specific volume (Figure 4.41) and force to compress the bread (Figure 4.47)
it was expected that differences in the cell number density would have been observed. The
observed differences found previously may also be due to differences in cell size. Cell size
distribution is investigated later in this chapter.
Figure 4.49 The number of cells per mm2 in different sugar content (a) breadmaker loaves
(b) Tweedy loaves. Each data point is the mean of nine measurements from three separate
loaves. The error bars presented are one standard deviation either side of the mean.
Figure 4.50 shows the mean cell diameter of the different sugar content breadmaker and
Tweedy loaves. Both figures show an initial increase in mean cell diameter and then decrease
as the sugar content increases. For the breadmaker loaves, in Figure 4.50(a) from a sugar
0.50
0.55
0.60
0.65
0.70
0 5 10 15 20
Num
ber
of
cells
per
mm
2
Sugar content (%)
0.50
0.55
0.60
0.65
0.70
0 5 10 15 20
Num
ber
of
cells
per
mm
2
Sugar content (%) (a) (b)
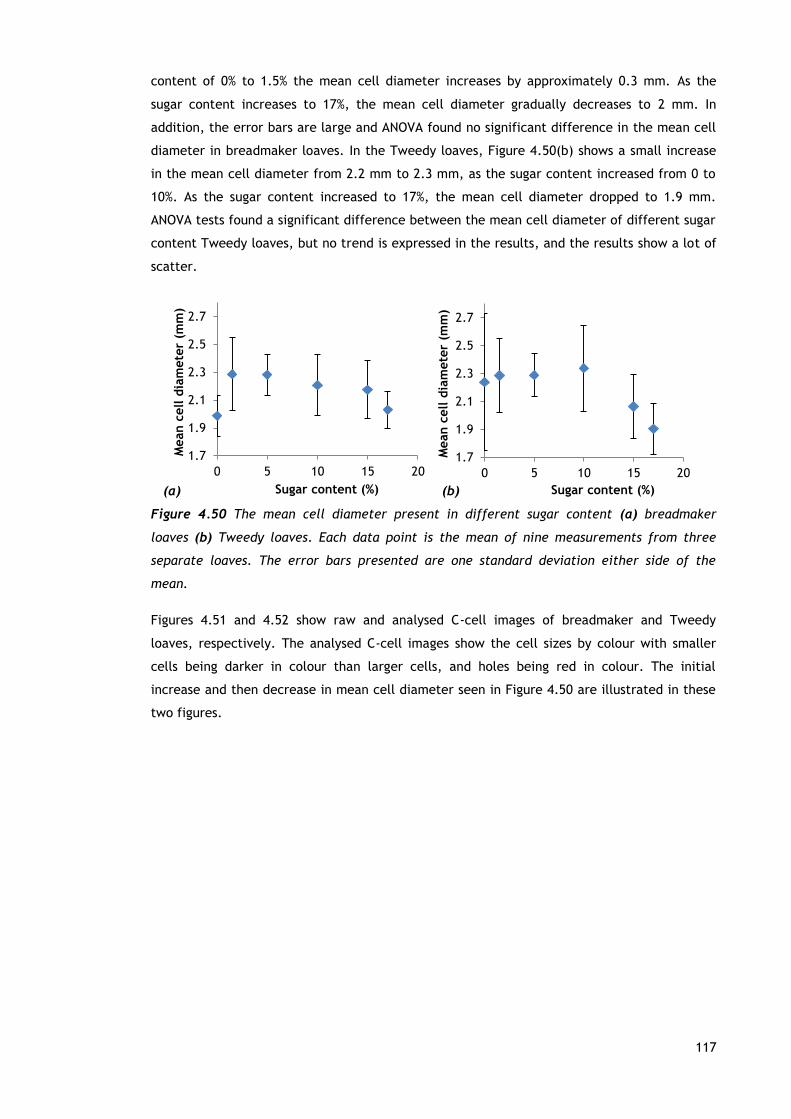
117
content of 0% to 1.5% the mean cell diameter increases by approximately 0.3 mm. As the
sugar content increases to 17%, the mean cell diameter gradually decreases to 2 mm. In
addition, the error bars are large and ANOVA found no significant difference in the mean cell
diameter in breadmaker loaves. In the Tweedy loaves, Figure 4.50(b) shows a small increase
in the mean cell diameter from 2.2 mm to 2.3 mm, as the sugar content increased from 0 to
10%. As the sugar content increased to 17%, the mean cell diameter dropped to 1.9 mm.
ANOVA tests found a significant difference between the mean cell diameter of different sugar
content Tweedy loaves, but no trend is expressed in the results, and the results show a lot of
scatter.
Figure 4.50 The mean cell diameter present in different sugar content (a) breadmaker
loaves (b) Tweedy loaves. Each data point is the mean of nine measurements from three
separate loaves. The error bars presented are one standard deviation either side of the
mean.
Figures 4.51 and 4.52 show raw and analysed C-cell images of breadmaker and Tweedy
loaves, respectively. The analysed C-cell images show the cell sizes by colour with smaller
cells being darker in colour than larger cells, and holes being red in colour. The initial
increase and then decrease in mean cell diameter seen in Figure 4.50 are illustrated in these
two figures.
1.7
1.9
2.1
2.3
2.5
2.7
0 5 10 15 20
Mean c
ell d
iam
ete
r (m
m)
Sugar content (%)
1.7
1.9
2.1
2.3
2.5
2.7
0 5 10 15 20
Mean c
ell d
iam
ete
r (m
m)
Sugar content (%) (a) (b)

118
Breadmaker Raw Cells
Figure 4.51 Raw and analysed C-cell cell intensity images of slices of breadmaker produced
bread of different sugar contents
0%
5%
10%
17%
0%
5%
10%
17%

119
Tweedy Raw Cells
Figure 4.52 Raw and analysed C-cell cell intensity images of slices of Tweedy produced
bread of different sugar contents
0%
5%
10%
17%
0%
5%
10%
17%

120
The specific volume of a loaf is largely dependent upon its cell size distribution. Figure 4.53
illustrates the relationship between specific volume and cell number density. There is scatter
in the results but they show a negative correlation between the cell density and specific
volume in both breadmaker and Tweedy loaves. A positive correlation was expected. The
observed negative correlation is most likely a result of differences in cell size. The
relationship between specific volume and mean cell diameter is illustrated in Figure 4.54.
Figure 4.54 shows no trend in the relationship between the mean cell diameter in the
breadmaker loaves and specific volume. A positive correlation is seen between the two
parameters in the Tweedy loaves. However, there is a lot of scatter in the results. Together
these results show that in the breadmaker loaves, cell number had a larger effect on the
specific volume than mean cell diameter, which was found not to have an effect, and the
specific volume in the Tweedy loaves was affected by both parameters. Another factor known
to affect the specific volume of these loaves is the gas free dough density, which was found
to increase as sugar content increased.
Figure 4.53 The relationship between the cell number density and specific volume in
breadmaker and Tweedy loaves. Linear regression lines are shown.
Figure 4.54 The relationship between mean cell diameter and the specific volume of
breadmaker and Tweedy loaves. Linear regression lines are shown.
R² = 0.802
R² = 0.6618
2.5
2.7
2.9
3.1
3.3
3.5
3.7
3.9
0.5 0.6 0.7
Specif
ic V
olu
me (
cm
3 g
-1)
Number of cells per mm2
Breadmaker
Tweedy
Linear (Breadmaker)
Linear (Tweedy)
R² = 0.0026
R² = 0.806
2.5
2.7
2.9
3.1
3.3
3.5
3.7
3.9
4.1
1.8 2 2.2 2.4
Specif
ic v
olu
me (
cm
3g
-1)
Mean cell diameter (mm)
Breadmaker
Tweedy
Linear (Breadmaker)
Linear (Tweedy)

121
Figures 4.55 and 4.56 illustrate the cell size distribution in breadmaker loaves. In Figure 4.55
this is presented as the number of cells per mm2, and in Figure 4.56 as the mean number of
cells per slice, thus not taking into account the differences in the slice areas, but allowing
closer inspection to the raw data. The results show that as the cell size increases the cell
density decreases. In addition, the results show little difference between the different sugar
content doughs up to a mean cell diameter of 3 mm, but following this, as the cells increase
in size, a difference in the cell density can be seen. Although a difference exists between the
cell size distribution in the different sugar content doughs, a relationship between sugar
content and cell size distribution is not seen in the results.
Figure 4.55 The cell size distribution in different sugar content finished breadmaker loaves.
Each data point is measured from nine slices of bread from three separate mixes.
Figure 4.56 The number of cells of different sizes per slice in breadmaker bread. Each data
point is the mean of nine slices of bread from three separate mixes.
1.E-06
1.E-05
1.E-04
1.E-03
1.E-02
1.E-01
1.E+00
0 3 6 9 12 15
Cell d
ensi
ty (
Num
ber
of
cells
per
mm
2)
Mean cell diameter (mm)
0% sugar
1.5% sugar
5% sugar
10% sugar
15% sugar
17% sugar
0.1
1
10
100
1000
10000
0 5 10 15
Mean n
um
ber
of
cells
per
slic
e
Cell size (mm)
0%
1.50%
5%
10%
15%
17%

122
Figures 4.57 and 4.58 illustrate the cell size distribution for different sugar content Tweedy
loaves. In Figure 4.57, these are presented as the cell density of different diameter cells and
in Figure 4.58, as the average number of different diameter cells within each slice of bread.
As in the breadmaker loaves, as the cell size increases, the cell density decreases and the cell
size distribution is similar up to a mean cell diameter of 3 mm. However, in the Tweedy
loaves it can be seen that up to a mean cell diameter of 3 mm there are more cells in the
dough containing 17% sugar, followed by the dough containing 15% sugar. As the cell size
increases from 3 mm to the maximum mean cell diameter detected of 17 mm, differences in
the cell size distribution can then be seen amongst the different sugar content loaves. The
results show a weak trend between cell size distribution and sugar content, although the
scatter in the data makes it difficult to conclude if the observations are noise or trends.
Throughout the data it can be seen that as the sugar content increases the cell density
decreases. Comparison of the cell size distribution in the 0% and 15% sugar Tweedy loaves
(constant pressure mixed) to the cell size distribution in the 0% and 15% sugar pressure-
vacuum mixed doughs obtained in the dough via X-ray CT in Section 6.2 are in agreement. In
both cases they show the 15% sugar dough having a larger number of smaller cells and fewer
bigger cells. As the effect of sugar on the cell size distribution are in agreement despite
different mixing processes and additional breadmaking stages, the results suggest that in the
quantities studied, sugar’s effect on the dough is larger than the effect of the other processes
used to make this bread. However, as the X-ray dough comparison of sugared versus non-
sugared doughs was only conducted on one dough sample, a conclusion cannot be drawn.
Figure 4.57 The cell size distribution in different sugar content finished Tweedy loaves.
Each data point is measured from nine slices of bread from three separate mixes.
1.E-06
1.E-05
1.E-04
1.E-03
1.E-02
1.E-01
1.E+00
0 3 6 9 12 15
Cell d
ensi
ty (
Num
ber
of
cells
per
mm
2)
Mean cell diameter (mm)
0% sugar
1.5% sugar
5% sugar
10% sugar
15% sugar
17% sugar

123
Figure 4.58 The number of cells of different sizes per slice in Tweedy bread. Each data point
is the average of nine slices of bread from three separate mixes.
The work on laboratory made loaves shows that sugar affects the quality parameters of
finished bread loaves, and that there is a correlation between some of these parameters.
However, the opposite results obtained through using two different methodologies emphasises
the importance of the methodology in achieving the desired result. The results show that a
balance must be achieved between the ingredients, methodology and the numerous
characteristics which are indicative of quality.
0.1
1
10
100
1000
10000
0 5 10 15
Avera
ge n
um
ber
of
cells
per
slic
e
Cell size (mm)
0%
1.50%
5%
10%
15%
17%

124
4.12 Summary
This Chapter assessed the effect of sugar throughout the breadmaking process using a range
of tests on both strong and weak flour doughs. Observations of sugar’s effect on starch water
mixture showed that sugar affects its interaction, and justified studying the effect of sugar
throughout the breadmaking process. The experiment also found that the addition of sugar
meant doughs were less elastic and less viscous. It is suspected that the former is due to
reduced gluten formation due to the reduction in proportion of ingredients other than sugar
which were present, and in particular water which is needed for hydration of gluten to create
its viscoelastic properties, and the latter is due to reduced swelling of the starch granules.
The reduced viscosity of the mixture will affect the rheology of the dough and therefore its
aeration. Reduced aeration was found in sugared doughs, in terms of both the dough voidage
and gas free dough density. This is undesirable, as denser bread means less value for money
and is generally firmer in texture, which is perceived as stale and unfresh. The change in
dough rheology that caused the changes in its aeration were reflected in the differences in
torque during mixing in both the Farinograph and the Tweedy mixer. These mixers
demonstrated that doughs formed in less time on increasing the sugar content and the
Farinograph showed doughs to have a higher consistency with more sugar, suggesting they
were stiffer. Formation of doughs in less time is likely to be due to the increased adhesive
properties of the dough observed during investigation of the adhesiveness of different sugar
content doughs. The formation of a dough in less time is beneficial as it cuts down on
production time and therefore costs. Given the results seen in this chapter, a small quantity
of sugar (less than 5%) added to the dough would decrease processing time and therefore
costs, as well as adding to the flavour of bread.
Micrographs of the dough revealed that the gluten veil had not properly formed in the sugar
containing dough, most likely a result of insufficient mixing and development of the dough,
due to reduction in the proportions of ingredients other than sugar and insufficient quantities
of water and a to disperse and hydrate the ingredients. It is important that the gluten veil is
developed as it enables cells within the dough to retain more gas and therefore helps produce
a loaf of greater volume.
The proving time of the dough was found to increase on increasing the sugar content of the
dough in both breadmaker and Tweedy mixed produced dough, except with the addition of
1.5% sugar where the proving time was found to decrease. However, the minimum density
reached during proving was not affected in the dough formulations used under the conditions
assessed. It is likely that increasing the water content to compensate for the lower water
activity would have improved the viscoelastic property of the dough and resulted in a
difference in the proving capacity of the dough.
Different parameters were assessed in finished bread made using a Tweedy mixer and
breadmaker, and contrasting trends were found in a number of parameters in both methods,
showing that sugar does affect the quality parameters investigated and the methodology uses
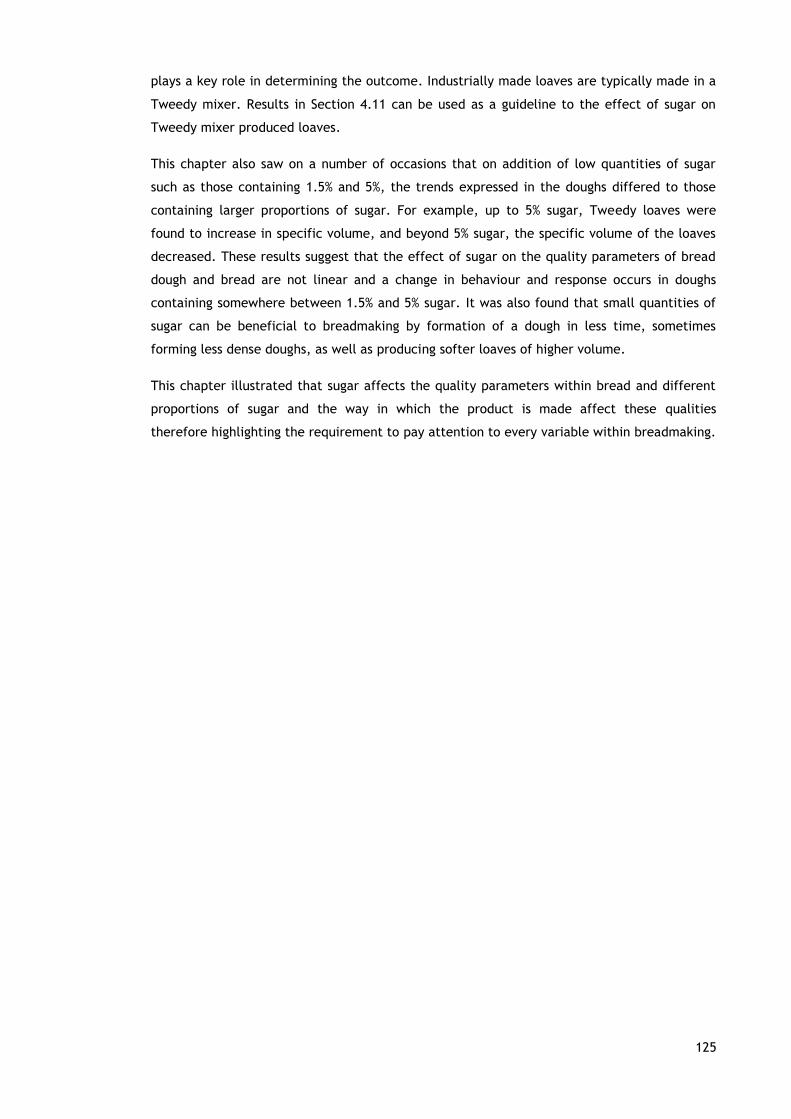
125
plays a key role in determining the outcome. Industrially made loaves are typically made in a
Tweedy mixer. Results in Section 4.11 can be used as a guideline to the effect of sugar on
Tweedy mixer produced loaves.
This chapter also saw on a number of occasions that on addition of low quantities of sugar
such as those containing 1.5% and 5%, the trends expressed in the doughs differed to those
containing larger proportions of sugar. For example, up to 5% sugar, Tweedy loaves were
found to increase in specific volume, and beyond 5% sugar, the specific volume of the loaves
decreased. These results suggest that the effect of sugar on the quality parameters of bread
dough and bread are not linear and a change in behaviour and response occurs in doughs
containing somewhere between 1.5% and 5% sugar. It was also found that small quantities of
sugar can be beneficial to breadmaking by formation of a dough in less time, sometimes
forming less dense doughs, as well as producing softer loaves of higher volume.
This chapter illustrated that sugar affects the quality parameters within bread and different
proportions of sugar and the way in which the product is made affect these qualities
therefore highlighting the requirement to pay attention to every variable within breadmaking.

126
Chapter 5 - Aeration in bread dough with and without
sugar
5.1 Introduction
Pressure-vacuum mixing is frequently practised in the CBP to produce bread of a fine cell
distribution, a desirable quality in bread. Sugar containing CBP doughs made in the Tweedy
mixer are generally mixed at atmospheric pressure to the required work input (Cauvain and
Young, 2006). As pressure-vacuum mixing is known to benefit the structure of non-sugar
containing doughs, it would be interesting to determine if pressure-vacuum mixing benefits
sugar containing doughs. This can be done through assessing the dough voidage following
mixing. However, aeration of bread dough during mixing is a dynamic process; gas is
simultaneously entrained and disentrained from the dough, and cells within the dough
breakup and coalesce. Even following completion of mixing, removal of dough from the mixer
that was mixed under pressure or vacuum affects its voidage, due to the pressure step change
which occurs. The population balance model of dough aeration during mixing developed by
Martin et al. (2004) implements a step change, which is a generic approach of characterising
dynamic systems. Through using the model, values for cell entrainment and disentrainment in
bread dough during mixing can be conveniently derived from the developed and available
model. Use of a population balance model also gives general insight into the aeration
processes in doughs of different sugar contents which will be true across all types of mixer.
An investigation into pressure-vacuum mixing can also help determine the optimal time for
which vacuum mixing should be used. Pressure-vacuum mixing for too short a time is likely to
produce dough of fewer cells due to the lack of subdivision of expanded cells. On the other
hand, pressure-vacuum mixing for too long may be detrimental towards the dough voidage
and also has cost implications, from drawing a vacuum and the wear on the vacuum pump.
The aim of this Chapter is to assess the differences in the aeration of different sugar content
doughs during mixing.
5.2 Aeration of bread dough with and without sugar methodology
Bread is not the only food that has been studied using a population balance model. Jang et al.
(2005) used a population balance model to study the whipping of gelatin solutions and
aqueous emulsions, using microscopy to measure cell size distributions. Casenave et al.
(2012) used a population balance model to study the crystallisation of ice crystal size
distribution in ice cream. This thesis uses a population balance model to study the aeration of
bread dough during mixing.
The methodology used to investigate the aeration of bread dough containing varying
quantities of sugar involves two elements: an experimental methodology and a pressure step
change modelling methodology to which the experimental results are applied. Section 5.2.1

127
discusses the experimental methodology and Section 5.2.2 the pressure step change
modelling methodology.
5.2.1 Experimental methodology
A series of strong and weak flour doughs containing 0%, 7.5% and 15% were characterised in
terms of their gas free dough density and voidage, using the method in Section 3.5.
Strong and weak flour doughs containing 0%, 7.5% and 15% sugar were made in the Tweedy 1
mixer. 17 doughs from each sugar content and flour were made, with each being mixed to
different times, as detailed below in this section, and their voidage calculated from density
measurements using the double cup method. Tables 5.1 and 5.2 give the formulations of the
strong and weak flour doughs respectively.
Table 5.1 Strong flour dough formulations used to derive entrainment and disentrainment
values from a population balance model on the aeration of bread dough
0% sugar 7.5% sugar 15% sugar
Ingredient Quantity (g / %)
Flour d (11.5%) 400.00 / 60.7 400.00 / 58.0 400.00 / 55.6
Vegetable fat 20.00 / 3.03 20.00 / 2.90 20.00 / 2.90
Salt 7.20 / 1.09 7.20 / 1.04 7.20 / 1.00
Ascorbic acid 0.03 / 0.00455 0.03 / 0.00435 0.03 / 0.00417
Water 232.00 / 35.2 232.00 / 33.7 232.00 / 32.3
Sugar 0.00 / 0.00 30.00 / 4.35 60.00 / 8.34
Table 5.2 Weak flour dough formulations used to derive entrainment and disentrainment
values from a population balance model on the aeration of bread dough
0% sugar 7.5% sugar 15% sugar
Ingredient Quantity (g/ %)
Flour b (10.4%) 400.00 / 61.3 400.00 / 58.6 400.00 / 56.2
Vegetable fat 20.00 / 3.07 20.00 / 2.93 20.00 / 2.81
Salt 7.20 / 1.10 7.20 / 1.06 7.20 / 1.01
Ascorbic acid 0.03 / 0.00460 0.03 / 0.00440 0.03 / 0.00421
Water 225.00 / 34.5 225.00 / 33.0 225.00 / 31.6
Sugar 0.00 / 0.00 30.00 / 4.40 60.00 / 8.42
A sugar content of 15% was used, due to this exceeding the greatest quantity of sugar found
in supermarket bread products, and mixing in the Tweedy mixer still being effective. It was
observed that the presence of too much sugar in the dough caused it to spin around with the
mixing blade, as opposed to being turned and folded onto itself. A sugar content of 0% was
used. This sugar content is typical of industrial bread and reflects the results of
unadulterated bread. 7.5% sugar was used as the third sugar content due to it being midway
between the two extremes, thus enabling insight into whether trends observed in the 15%

128
sugar dough are observed with half of the sugar content, and therefore if the effect of sugar
is gradual or sudden once a threshold is met.
17 separate mixes were used for each of the six dough formulations and mixing parameters.
Their mixing times were 90, 100, 105, 110, 115, 120, 130, 140, 150, 160, 170, 180, 190, 200,
210, 220, and 230 s, with a pressure step change occurring at 110 s. These were conducted in
a random order to minimise run artefacts. The shortest and longest mixing times were chosen
as 90 s is sufficient time for the ingredients to form a dough and after 230 s the dough should
have reached its steady state voidage.
A series of doughs underwent a pressure step increase or pressure step decrease during
mixing to assess the effect of sugar on dough aeration dynamics. For the pressure step
increase experiments the pressure was increased from 1 bara to 2 bara. For the pressure step
decrease experiments, in order to quantify the differences in dough aeration over different
sized pressure changes, the pressure was decreased from 1 bara to 0.5 bara and also 1 bara to
0.25 bara for the mixing sessions. These mixing conditions are presented in Table 5.3.

129
Table 5.3 Weak flour dough formulations used to derive entrainment and disentrainment
values from a population balance model on the aeration of bread dough
Dough Mixing time (s) Mixer pressure (bara)
Strong flour, 0% sugar
90, 100, 105, 110, 115, 120,
130, 140, 150, 160, 170, 180,
190, 200, 210, 220, 230
1 to 2
(Pressure step increase)
P1/P2 = 0.5 Strong flour, 7.5% sugar,
Strong flour, 15% sugar
1 to 0.5
(Smaller pressure step decrease)
P1/P2 = 2 Weak flour, 0% sugar
Weak flour, 7.5% sugar
1 to 0.25
(Larger pressure step decrease)
P1/P2 = 4 Weak flour, 15% sugar
5.2.2 Pressure step change modelling methodology
The no break up model described in Section 2.2.4 was simultaneously fitted to each set of
experimental voidages for the six dough formulations presented in Table 5.3 for the three
pressure step changes for each dough formulation (varying in flour type and sugar content),
producing one set of parameters for the three different step changes. The results were fitted
by changing the parameters: initial voidage, entrainment rate and disentrainment coefficient.
This cross-fitting reduces the problem of carrying forward experimental errors, which occurs
with direct model fittings to experimental results. In direct fittings, the initial voidage,
entrainment rate and disentrainment coefficient were fitted through minimising the absolute
error to that set of experimental voidages alone, rather than three sets of experimental
voidages at once. Figures showing direct individual model fittings to each set of experimental
voidages are also presented. This ideally would have produced aeration parameters similar
showing the same trend as the cross-fitted model, amongst the three different sugar content
doughs. However, due to scatter amongst the experimental results, the same trend was not
observed, and cross-fitting of the model was found to be more appropriate in this case.
5.3 Results and discussion
This section is split into two: Section 5.3.1 details the experimental results, their
interpretation and discussion and Section 5.3.2 details the results of the modelling.

130
5.3.1 Experimental results
Figure 5.1 shows the characterisation of the strong and weak flour doughs of varying sugar
contents used in this study. The dough voidage at 1 bara is illustrated in Figure 5.1 (a) and
the gas free dough density is illustrated in Figure 5.1 (b). Figure 5.1 (a) shows a decrease in
dough voidage as sugar content increases in doughs produced from both flour types, with a
larger difference in voidage of different sugar content doughs in the weak flour doughs. This
suggests that sugar has a greater effect on weak flour doughs than strong. Figure 5.1 (b)
shows an increase in the gas free dough density as the sugar content increases in the strong
flour doughs. In the weak flour doughs, as the sugar content increases from 0% to 7.5%, the
gas free dough density drops from 1.2627 g cm3 to 1.2590 g cm3, before increasing to
1.2709 g cm3 as the sugar content increases to 15%. These results are in agreement with those
in Section 4.3, which showed an increase in gas free dough density and a decrease in voidage
as sugar content increased, with a larger difference in dough voidage of the weak flour
doughs than strong.
Figure 5.1 (a) Voidage at 1 bara of strong and weak flour doughs containing 0%, 7.5% and
15% sugar (b) Gas free dough density of strong and weak flour doughs containing 0%, 7.5%
and 15% sugar
In this section, the model fitting to the experimental results is illustrated alongside the
experimental results for convenience and practicality and only the experimental results are
discussed. The model fitting and further results relating to the modelling are discussed in
Section 5.3.2.
Figure 5.2 shows the in-situ dough voidages over mixing of the six pressure-vacuum mixed
doughs with P1/P2 = 2. (a) to (f) are the cross fittings and (g) to (l) the direct fittings. The
results show the same trend among the two flour types and the three sugar concentrations.
They show a sudden increase in voidage on reducing the pressure, a result of cell expansion.
The dough voidage then falls over the next 20-40 s and stays fairly constant throughout the
remaining duration of the mixing session, as it approaches steady state voidage. These
observations are consistent with previous comparable studies reported by Martin et al.
(2004a) and Campbell et al. (2008b).
0.050
0.055
0.060
0.065
0.070
0 5 10 15
Void
age a
t 1 b
ara
Sugar content (%)
Strong flour doughsWeak flour doughs
1.255
1.260
1.265
1.270
1.275
0 5 10 15
ρgf (g
cm
-3)
Sugar content (%)
Strong flour doughsWeak flour doughs
(a) (b)

131
Although the same trend is exhibited among the six doughs, their response to pressure-
vacuum mixing differs in the extent of the immediate effect on voidage of drawing a vacuum,
how quickly they change in response to the vacuum, their steady state voidages reached and
the scatter among the data points.
The strong flour doughs reach steady state voidage more quickly than the weak flour doughs,
have a higher steady state voidage and also show less scatter in their results after drawing a
vacuum. It is likely that the scatter is a result of the weaker structure of the lower protein
doughs making it less stable and thus more prone to change.
In non-sugar containing doughs, the voidage of the dough following pressure-vacuum mixing
prior to the step change and at the end of the mixing session are similar. However, on
addition of sugar, the results show that the higher the sugar content in the dough the quicker
and larger the drop in voidage following application of a vacuum and the lower the steady
state voidage. This suggests that the size to which the cells expand once a vacuum is drawn
makes them more likely to be disentrained from the dough. This could be due to the cells
being more likely to disentrain in the sugared doughs due to the reduced viscoelastic
properties of sugared doughs and the cells being larger.
Although there is some scatter in the data, the 0%, 7.5% and 15% sugar strong doughs appear
to approach a steady state voidage of 0.065, 0.060 and 0.055, respectively. As mentioned
previously, the weak flour results exhibit more scatter. The steady state voidage the 0%, 7.5%
and 15% weak flour doughs appear to approach are 0.072, 0.058 and 0.042, respectively.
These results suggest that pressure-vacuum mixing is detrimental towards the dough voidage,
and therefore should not be used for the production of sugared breads. The results also
suggest that mixing for less time under vacuum in the 0% sugar dough would be financially
beneficial and not compromise the cell distribution, as steady state voidage may have been
reached before the end of the mixing session.

132
(a) (b)
(c) (d)
(e) (f)
Figure 5.2 Experimental and model voidages during pressure-vacuum mixing. P1 = 1 bara,
P2 = 0.5 bara. Each data point is from a separate dough mix. (a) strong flour, 0% sugar (b)
weak flour, 0% sugar (c) strong flour, 7.5% sugar (d) weak flour, 7.5% sugar (e) strong flour,
15% sugar (f) weak flour, 15% sugar
0.03
0.05
0.07
0.09
0.11
0.13
80 130 180 230
Void
age i
nsi
de m
ixer
Mixing time (s)
experimentalmodel
0.03
0.05
0.07
0.09
0.11
0.13
80 130 180 230
Void
age i
nsi
de m
ixer
Mixing time (s)
experimentalmodel
0.03
0.05
0.07
0.09
0.11
0.13
80 130 180 230
Void
age insi
de m
ixer
Mixing time (s)
experimentalmodel
0.03
0.05
0.07
0.09
0.11
0.13
80 130 180 230
Void
age i
nsi
de m
ixer
Mixing time (s)
experimentalmodel
0.03
0.05
0.07
0.09
0.11
0.13
80 130 180 230
Void
age i
nsi
de m
ixer
Mixing time (s)
experimentalmodel
0.03
0.05
0.07
0.09
0.11
0.13
80 130 180 230
Void
age i
nsi
de m
ixer
Mixing time (s)
experimentalmodel
0%
sugar
7.5
% s
ugar
15%
sugar
Strong Weak CROSS FITTED
133
(g) (h)
(i) (j)
(k) (l)
Figure 5.2 Experimental and model voidages during pressure-vacuum mixing. P1 = 1 bara,
P2 = 0.5 bara. Each data point is as from a separate dough mix. (g) strong flour, 0% sugar (h)
weak flour 0% sugar (i) strong flour, 7.5% sugar (j) weak flour 7.5% sugar (k) strong flour,
15% sugar (f) weak flour, 15% sugar
0.03
0.05
0.07
0.09
0.11
0.13
80 130 180 230
Void
age Insi
de M
ixer
Mixing time (s)
experimental
model
0.03
0.05
0.07
0.09
0.11
0.13
80 130 180 230
Void
age Insi
de M
ixer
Mixing time (s)
experimental
model
0.03
0.05
0.07
0.09
0.11
0.13
80 130 180 230
Void
age Insi
de M
ixer
Mixing time (s)
experimental
model
0.03
0.05
0.07
0.09
0.11
0.13
80 130 180 230
Void
age Insi
de M
ixer
Mixing time (s)
experimental
model
0.03
0.05
0.07
0.09
0.11
0.13
80 130 180 230
Void
age i
nsi
de m
ixer
Mixing time (s)
Experimental
model
0.03
0.05
0.07
0.09
0.11
0.13
80 130 180 230
Void
age Insi
de M
ixer
Mixing time (s)
experimental
model
0%
sugar
7.5
% s
ugar
15%
sugar
Strong Weak DIRECTLY FITTED

134
Figure 5.3 shows the in-situ dough voidages over mixing of the six pressure-vacuum mixed
doughs with P1/P2 = 4. Figure 5.3 (a) to (f) are the cross fittings and figures 5.3 (g) to (l) are
the direct fittings. The results show the same trend in the two flour types and the three sugar
concentrations. They show a sudden increase in voidage on reducing the pressure, as a result
of cell expansion. The dough voidage falls over the next 20-30 s and stays constant throughout
the remaining duration of the mixing session, as it approaches steady state voidage.
As in the smaller pressure step down experiment, the six results exhibit the same trend in
their voidage response to the pressure change. However, the extent and speed of the
immediate effect on voidage of drawing a vacuum, the steady state voidages reached and the
scatter amongst each set of results differ. As found in Figure 5.2, in the larger pressure step
down experiment, the strong flour doughs also have a higher steady state voidage than weak
flour doughs and there is less scatter amongst the voidage in the strong flour doughs.
For the doughs containing no sugar, the results show little change in voidage prior to
application of a vacuum and at the end of the mixing session. The effect of vacuum mixing on
the sugar containing doughs differs, causing a drop in voidage below that prior to application
of a vacuum and a lower voidage at the end of the mixing session in the sugar containing
doughs. Although there is some scatter in the data, the 0%, 7.5% and 15% sugar strong doughs
appear to approach a steady state voidage of 0.060, 0.047 and 0.050, respectively. As
mentioned previously, the weak flour results exhibit more scatter. The steady state voidage
the 0%, 7.5% and 15% weak flour doughs appear to be approaching are 0.069, 0.035 and 0.026,
respectively. These effects become more significant as the sugar content increases over the
doughs investigated. As in Figure 5.2, these results illustrate that pressure-vacuum mixing is
detrimental to the voidage in sugar containing doughs, producing doughs of lower voidage
than constant pressure mixing at atmospheric pressure.
Differences were observed on comparison of Figures 5.2 and 5.3, the dough responses to the
two different sized pressure step changes during pressure-vacuum mixing. To begin with, the
larger pressure step change mixes in Figure 5.3 caused a greater increase in voidage on
application of a vacuum. Following application of a vacuum, the approach to steady state
voidage was quicker with a larger pressure step change. The voidage at the end of the mixing
sessions was higher in the doughs mixed with a smaller pressure step change. A larger change
in voidage was expected in the doughs subjected to a greater step change due to the effect
of a larger sudden pressure change on the dough, and as the partial vacuum drawn is greater,
more gas drawn out from the dough. However, as noted previously, the end voidage of
pressure-vacuum mixed non-sugar dough was not affected by the step change. Section 4.4
showed that the presence of sugar in the dough formulation affects its gas free dough density
and voidage. These results further illustrate that sugar affects dough aeration during mixing
and show that pressure-vacuum mixing reduces the dough voidage, and the larger the step
change and the sugar content, the lower the end voidage. The modelling results in Section
5.3.2 look into entrainment and disentrainment rates of gas within the different doughs,
helping explain the possible causes of the observed differences in aeration.

135
(a) (b)
(c) (d)
(e) (f)
Figure 5.3 Experimental and model voidages during pressure-vacuum mixing. P1 = 1 bara,
P2 = 0.25 bara. Each data point is from a separate dough mix. (a) strong flour, 0% sugar (b)
weak flour, 0% sugar (c) strong flour, 7.5% sugar (d) weak flour, 7.5% sugar (e) strong flour,
15% sugar (f) weak flour, 15% sugar
0
0.05
0.1
0.15
0.2
0.25
80 130 180 230
Void
age i
nsi
de m
ixer
Mixing time (s)
experimentalmodel
0
0.05
0.1
0.15
0.2
0.25
80 130 180 230
Void
age i
nsi
de m
ixer
Mixing time (s)
experimentalmodel
0
0.05
0.1
0.15
0.2
0.25
80 130 180 230
Void
age i
nsi
de m
ixer
Mixing time (s)
experimentalmodel
0
0.05
0.1
0.15
0.2
0.25
80 130 180 230
Void
age i
nsi
de m
ixer
Mixing time (s)
experimentalmodel
0
0.05
0.1
0.15
0.2
0.25
80 130 180 230
Void
age i
nsi
de m
ixer
Mixing time (s)
experimentalmodel
0
0.05
0.1
0.15
0.2
0.25
80 130 180 230
Void
age i
nsi
de m
ixer
Mixing time (s)
experimentalmodel
Strong Weak
0%
sugar
7.5
% s
ugar
15%
sugar
CROSS FITTED

136
(g) (h)
(i) (j)
(k) (l)
Figure 5.3 Experimental and model voidages during pressure-vacuum mixing. P1 = 1 bara,
P2 = 0.25 bara. Each data point is as from a separate dough mix. (g) strong flour, 0% sugar (h)
weak flour 0% sugar (i) strong flour, 7.5% sugar (j) weak flour 7.5% sugar (k) strong flour,
15% sugar (l) weak flour, 15% sugar
0.00
0.05
0.10
0.15
0.20
0.25
80 130 180 230
Void
age Insi
de M
ixer
Mixing time (s)
experimental
model
0.00
0.05
0.10
0.15
0.20
0.25
80 130 180 230
Void
age Insi
de M
ixer
Mixing time (s)
experimental
model
0.00
0.05
0.10
0.15
0.20
0.25
80 130 180 230
Void
age Insi
de M
ixer
Mixing time (s)
experimental
model
0.00
0.05
0.10
0.15
0.20
0.25
80 130 180 230
Void
age Insi
de M
ixer
Mixing time (s)
experimental
model
0.00
0.05
0.10
0.15
0.20
0.25
80 130 180 230
void
age Insi
de M
ixer
Mixing time (s)
experimental
model
0.00
0.05
0.10
0.15
0.20
0.25
80 130 180 230
Void
age Insi
de M
ixer
Mixing time (s)
experimental
model
Strong Weak
0%
sugar
7.5
% s
ugar
15%
sugar
DIRECTLY FITTED

137
Figure 5.4 shows the in-situ dough voidages over mixing of the six doughs mixed with a
pressure step increase from 1 bara to 2 bara. (a) to (f) are the cross-fittings and (g) to (l) the
direct fittings. The results show the same trend among the two flour types and the three
sugar concentrations. They show a sudden decrease in voidage on reducing the pressure, a
result of cell compression. The dough voidage then rises over the mixing session as it
approaches steady state, and the cells relax.
The six doughs exhibit the same trend in respond to the pressure step up. Their response to
the dual pressure mixing differs however, in the time taken to reach steady state voidage and
the steady state voidage reached, in particular the difference in voidage at the start and end
of the mixing session. On increasing the sugar content of the dough, the steady state voidage
is reached sooner and is lower. The 0% sugar doughs do not appear to have reached steady
state voidage over the mixing session, and there is uncertainty to whether the 7.5% sugar
doughs reach steady state voidage over the mixing session. This suggests the doughs were not
mixed for long enough. However, this problem is unavoidable, as longer mixing sessions
increase the temperature within the mixer, producing a sticky dough, which does not follow
the conventional Tweedy mixing action. Amongst the six dough formulations, the increase in
voidage from prior to the step change to after the step change becomes lesser, changing from
an increase in dough voidage to a decrease in dough voidage, although it is difficult to
determine the extent of these voidage differences amongst the different sugar content
doughs due to steady state voidage having not been reached during the mixing session. This
observation may be due to an increased likelihood of cell rupture in the sugar containing
doughs following a pressure step change which weakens cell stability. These results illustrate
that the presence of sugar in the dough formulation affects dough aeration.
In agreement with Martin et al. (2004a) and Chin et al. (2003), the voidage following a
pressure step increase changes less rapidly than the voidage following a pressure step
decrease.

138
(a) (b)
(c) (d)
(e) (f)
Figure 5.4 Experimental and model voidages during mixing with a pressure step increase
from 1 bara to 2 bara. Each data point is from a separate dough mix. (a) strong flour, 0%
sugar (b) weak flour, 0% sugar (c) strong flour, 7.5% sugar (d) weak flour, 7.5% sugar (e)
strong flour, 15% sugar (f) weak flour, 15% sugar
0.02
0.03
0.04
0.05
0.06
0.07
0.08
80 130 180 230
Void
age i
nsi
de m
ixer
Mixing time (s)
experimentalModel
0.02
0.03
0.04
0.05
0.06
0.07
0.08
80 130 180 230
Void
age i
nsi
de m
ixer
Mixing time (s)
experimentalModel
0.02
0.03
0.04
0.05
0.06
0.07
0.08
80 130 180 230
Void
age i
nsi
de m
ixer
Mixing time (s)
experimentalModel
0.02
0.03
0.04
0.05
0.06
0.07
0.08
80 130 180 230
Void
age i
nsi
de m
ixer
Mixing time (s)
experimentalModel
0.02
0.03
0.04
0.05
0.06
0.07
0.08
80 130 180 230
Void
age i
nsi
de m
ixer
Mixing time (s)
experimentalModel
0.02
0.03
0.04
0.05
0.06
0.07
0.08
80 130 180 230
Void
age i
nsi
de m
ixer
Mixing time (s)
experimentalModel
15%
sugar
7.5
% s
ugar
0%
sugar
Strong Weak CROSS FITTED

139
(g) (h)
(i) (j)
(k) (l)
Figure 5.4 Experimental and model voidages during mixing with a pressure step increase
from 1 bara to 2 bara. Each data point is as from a separate dough mix. (g) strong flour, 0%
sugar (h) weak flour 0% sugar (i) strong flour, 7.5% sugar (j) weak flour 7.5% sugar (k) strong
flour, 15% sugar (l) weak flour, 15% sugar
0.02
0.03
0.04
0.05
0.06
0.07
0.08
80 130 180 230
Void
age Insi
de M
ixer
Mixing time (s)
experimental
Model0.02
0.03
0.04
0.05
0.06
0.07
0.08
80 130 180 230
Void
age Insi
de M
ixer
Mixing time (s)
experimental
Model
0.02
0.03
0.04
0.05
0.06
0.07
0.08
80 130 180 230
Void
age Insi
de M
ixer
Mixing time (s)
experimental
model0.02
0.03
0.04
0.05
0.06
0.07
0.08
80 130 180 230
Void
age Insi
de M
ixer
Mixing time (s)
experimental
model
0.02
0.03
0.04
0.05
0.06
0.07
0.08
80 130 180 230
Void
age Insi
de M
ixer
Mixing time (s)
experimental
model0.02
0.03
0.04
0.05
0.06
0.07
0.08
80 130 180 230
Void
age Insi
de M
ixer
Mixing time (s)
experimental
model
15%
sugar
7.5
% s
ugar
0%
sugar
Strong Weak DIRECTLY FITTED

140
5.3.2 Pressure step change modelling results
This section discusses the model fitting to each of the six dough formulations, followed by the
aeration parameters given by the model for the pressure step change dough mixes.
The model fittings are presented alongside the experimental results in Figures 5.2-5.4 located
in Section 5.3.1 of this chapter. As expected when fitting a model to experimental results
that exhibit some scatter and more so when cross-fitting a model to three sets of
experimental results exhibiting some scatter, there is some deviation in the model fitting to
the data sets. However, the model fittings appear to be representative of the experimental
results and follow the same general trend as the experimental data. Differences in the model
and experimental results include a tendency for the voidage to continue to increase at the
end of the mixing session in the pressure step decrease models including on the occasions
where the experimental data appears to reach a steady state. Another difference between
the experimental and model results is the inaccuracy in the model’s voidage prediction prior
to the step change, which is largely due to the scatter in the experimental results. In
Table 5.4, the RMSE for each of the model fittings are presented. The table shows that
overall the model shows a good fit to the experimental data, despite differences in the dough
formulations, indicating the model’s applicability to the data. As expected a better fit is
observed for direct fitting of the model to the results, compared to cross fitting. These can
be seen on direct comparison of the figures illustrating the two different fittings of results.
Table 5.4 RMSEs for the no breakup population balance fitted to the experimental pressure
step change data
Dough Formulations Pressure Step
Change
RMSE
(cross fitted data)
RMSE
(directly fitted data)
Strong, 0%
P1 = 1, P2 = 0.5 0.000583 0.000529
P1 = 1, P2 = 0.25 0.00113 0.00107
P1 = 1, P2 = 2 0.000253 0.000128
Weak, 0%
P1 = 1, P2 = 0.5 0.00106 0.000881
P1 = 1, P2 = 0.25 0.00158 0.00134
P1 = 1, P2 = 2 0.000393 0.000092
Strong, 7.5%
P1 = 1, P2 = 0.5 0.000252 0.000214
P1 = 1, P2 = 0.25 0.00116 0.00115
P1 = 1, P2 = 2 0.000197 0.000083
Weak, 7.5%
P1 = 1, P2 = 0.5 0.000767 0.000480
P1 = 1, P2 = 0.25 0.00296 0.00115
P1 = 1, P2 = 2 0.000334 0.000680
Strong, 15%
P1 = 1, P2 = 0.5 0.000515 0.000302
P1 = 1, P2 = 0.25 0.000727 0.000634
P1 = 1, P2 = 2 0.000152 0.000102
Weak, 15%
P1 = 1, P2 = 0.5 0.00192 0.000409
P1 = 1, P2 = 0.25 0.00324 0.00231
P1 = 1, P2 = 2 0.000413 0.000115

141
Figure 5.5 illustrates the initial voidage of the strong and weak flour doughs of different sugar
contents, as predicted by the model. The results show an initial voidage ranging from 0.058 to
0.078 amongst the six dough formulations. These are reasonable and in the same magnitude
as those in literature (Campbell and Shah, 1999; Whitworth and Alava, 1999; Martin et al.,
2008). The results show an increase in voidage in both the strong and weak flour doughs as
the sugar content increases. This differs to the voidage measurements of different sugar
content doughs presented in Section 4.3 and Figure 5.1, which showed a decrease in voidage
as dough sugar content increased. Inspection of Figures 5.2-5.4 explains why. The figures
show a tendency to under predict initial voidages in dough containing 0% sugar, and over
predict initial voidages in dough containing 15% sugar, with predictions of the voidage of the
7.5% sugar doughs being inbetween. Inspection of the figures show that this is not likely to be
due to error in the model, but experimental error. The experimental results should show a
consistent and steady voidage prior to the step change, rather than the decrease in voidage
observed in Figure 5.2 (a) for example.
Figure 5.6 (a) and (b) show the entrainment rate and disentrainment coefficient of the six
doughs, respectively. Note the difference in scale along the vertical axis between the figures
for the entrainment rate and disentrainment coefficient – the disentrainment coefficient is
consistently higher than the entrainment rate by a factor of 10 - 20. In Figure 5.6 (a) it can be
seen that in the strong flour dough, the entrainment rate increases from 0.00114 rev-1 to
0.00125 rev-1 to 0.00139 rev-1, as the sugar content increases from 0% to 7.5% to 15%. For the
weak flour dough, as the sugar content increases from 0% to 7.5% to 15%, the entrainment
rate decreases from 0.00113 rev-1 to 0.000953 rev-1, before increasing to 0.00128 rev-1. It was
expected that the same trend would have been expressed in doughs produced from the two
flour types. The 7.5% weak flour dough does not fit in with the trend expressed by the other
five dough formulations. Inspection of the results show a poor fit following the step change,
for the pressure step increase experiment and the pressure step decrease from 1 bara to
0.5 bara. It is likely that the scatter amongst the later time in the pressure step decrease
experiment has resulted in the poor model fitting of the pressure step increase experiment,
which is largely responsible for giving the entrainment rate. Therefore it can be argued that
the result for the entrainment rate for the 7.5% weak flour dough is not likely to be
representative, and it is likely that entrainment is fairly constant, though increases a small
degree as the sugar content increases.
A consistent trend can be observed in Figure 5.6 (b) which illustrates the change in
disentrainment coefficient with sugar content. The disentrainment rate of gas in dough
depends upon the disentrainment coefficient, cell size and quantity of gas in the dough. The
figure shows an increase in the disentrainment coefficient as the sugar content increases in
both the strong and weak flour doughs. This is also seen in Figures 5.2-5.4, where the model
results show a steeper gradient following the step change in the sugar containing doughs. This
suggests that as the sugar content of the dough increases cells are more likely to break up
and become disentrained from the dough. The probability of cell break up increases when

142
cells are larger or when the dough structure is weaker. It is possible that either both or just
the latter is the case, as it is suspected that the addition of sugar prevents the gluten in the
dough from fully developing due to competition with the flour proteins for water. A more
developed dough will have improved viscoelastic properties. Section 4.2 found sugar
containing doughs to be less viscous, however. As the pressure step change generally causes a
decrease in voidage in the sugar containing doughs, which is not observed in the non-sugar
containing doughs, it is likely that the change in pressure further weakens the dough
structure due to the stress applied on the dough, which would not have been observed
following constant pressure mixing.
The ratio of the entrainment rate to disentrainment coefficient is the steady state voidage.
This is presented in Figure 5.7 for the strong and weak flour doughs of different sugar
contents. The results show a decrease in the steady state voidage as the sugar content
increases amongst doughs produced from both flours, which Figure 5.6 shows is a result of the
increase in disentrainment coefficient. The range of steady state voidages in the weak flour
doughs is greater than the range in the strong flour doughs. These results suggest that the
effect of sugar on steady state voidage is greater in weak flour doughs than strong. This can
be expected due to the lower gluten content and therefore weaker structure of weak flour
doughs, making retention of cells more difficult.
The steady state voidages for the no sugar dough found are of the same magnitude as the
figures obtained by Martin et al. (2004) on application of the no breakup model to
experimental data for the same size pressure step change in doughs of non-sugar containing
doughs of differing formulation.
Figure 5.5 Initial model voidages of strong and weak flour doughs containing 0%, 5% and 15%
sugar
0.050
0.055
0.060
0.065
0.070
0.075
0.080
0 5 10 15
Init
ial void
age
Sugar content (%)
strong weak

143
(a) (b)
Figure 5.6 (a) Entrainment rate of strong and weak flour doughs containing 0%, 5% and 15%
sugar (b) Disentrainment coefficient of strong and weak flour doughs containing 0%, 5% and
15% sugar
Figure 5.7 Ratio of entrainment rate to disentrainment coefficient for strong and weak flour
doughs containing 0%, 7.5% and 15% sugar
5.4 Summary
Chapter 5 set out to investigate the aeration of different sugar content doughs during mixing.
Entrainment rates and disentrainment coefficients were calculated through application of a
population balance model on different size and direction pressure changes. The investigation
found that in non-sugar containing doughs pressure-vacuum mixing did not decrease the end
voidage, and when mixing with a pressure step increase, the dough voidage increases over the
mixing session. Therefore a negative voidage response was not observed when mixing with a
pressure step change in non-sugar containing doughs. However, in the sugar containing doughs
investigated, an increase in sugar content resulted in a lower steady state voidage following
pressure-vacuum mixing, and when mixing with a pressure step increase, the increase in
voidage observed decreased as the sugar content increased, to the extent that at 15% sugar
dough voidage decreased over the mixing session. It is suspected that the compression of the
cells during the step change reduces cell stability and makes cells more likely to rupture.
0.0009
0.0010
0.0011
0.0012
0.0013
0.0014
0 5 10 15
v (
rev
-1)
Sugar content (%)
strongweak
0.014
0.019
0.024
0.029
0 5 10 15
k (
rev
-1)
Sugar content (%)
strongweak
0.04
0.05
0.06
0.07
0.08
0.09
0 5 10 15
v/k
Sugar content (%)
strong weak

144
The population balance model of aeration described the experimental data well, and
highlighted a decrease in steady state voidage as the sugar content increased, indicating that
dual pressure mixing reduces the voidage in sugar containing doughs, with a greater effect on
weak flour doughs than strong. Entrainment rate was found to be fairly constant with sugar
content, and the disentrainment coefficient showed that the reduction in steady state
voidage was due to an increase in the disentrainment coefficient as the dough’s sugar content
increased. For increased disentrainment of gas in the dough, cells must be more likely to
rupture. Cell rupture involves loss of gas from the dough into the atmosphere. Disentrainment
of gas occurs when cell rupture occurs at the edges of the dough. These results suggest the
dough structure is weaker with increased quantities of sugar. Chapter 4 suggests this could be
due to the gluten being less well developed, most probably due to the increased proportion of
sugar and decreased proportion of other ingredients. Sections 4.2 and 4.8 also found sugar
containing doughs to be less elastic, again suggesting that they are structurally weaker.
Section 6.2 uses X-ray CT to assess the microstructure of sugared and non-sugared doughs,
which may help better understand why disentrainment is more likely in sugared doughs.
This chapter concludes that pressure-vacuum mixing should not simply be extended from non-
sugared to sugared doughs as these display different aeration characteristics during mixing.
The chapter illustrates that the population balance model can be applied to sugared doughs
as well as non-sugared doughs, thus demonstrating its suitability to a range of scenarios.

145
Chapter 6 - X-ray computerised tomography of bread
dough during mixing and proving
6.1 Introduction
It has been argued that mixing is the most important stage of breadmaking (Cauvain, 2000),
as this is the stage when cells are initially incorporated into the dough. The cell volume
distribution (number of cells and their volume) changes over the breadmaking process and the
final cell volume distribution is responsible for the final bread’s voidage. This Chapter uses X-
ray CT to investigate changes in dough cellular structure during mixing and proving.
Understanding how variations in processing and ingredients affect the microstructure can help
achieve better control of the final product structure.
Developing this technique to obtain clear and representative images of high resolution
required trying out a number of X-ray sample set-ups. Tubing of different sizes and materials
were investigated for use as a sample container during the scans, as well as different methods
of obtaining a dough sample and inserting it into the tubing without damaging the dough
piece. Published literature which has used conventional X-ray imaging to probe into the
cellular structure of bread has illustrated the difficulty in obtaining a high resolution and
handling the sample and setting up the scans to obtain representative samples. X-ray imaging
has been used to probe into both the static (Whitworth and Alava, 1999; Bellido et al., 2006;
Whitworth, 2008) and dynamic (Babin et al., 2006; 2008; Turbin-Orger et al., 2012) structure
of bread dough due to its non-invasive and non-destructive nature , necessary for obtaining
accurate information on a fragile material such as bread dough. X-ray studies using more
reliable methods have been conducted using synchrotrons. Babin et al. (2006; 2008)
investigated dough proving using synchrotron beamline BM05 at the European Synchrotron
Radiation Facility (ESRF), Grenoble. Despite the use of superior imaging equipment, the voxel
resolution of their scans was 15 µm3. This is lower than the 10 µm3 voxel resolution obtained
by Bellido et al. (2006) using a medical X-ray source. Turbin-Orger et al., (2012) also
investigated dough proving using synchrotron beamline BM05, obtaining a voxel resolution of 5
µm3. This is the highest resolution reported for the 3D imaging of bread dough to date. Using
a conventional X-ray source in the methods described below, voxel resolutions as low as 7.1
µm3 were obtained on dough samples with an initial volume 2-5 times larger than those
investigated using a synchrotron, therefore enabling better representation of the dough
sample.
Following this introduction are three experimental sections based on the use of X-ray CT:
Section 6.2 investigates the cellular structure of bread dough with and without sugar, with
the aim of understanding why sugared doughs have a lower voidage. Section 6.3 investigates
the transient behaviour of pressure-vacuum mixed doughs and uses cell sizes to assess the
validity of a simplified population balance model. Section 6.4 investigates the changes in the

146
dough cellular structure during proving. The results from these three sections are then
summarised in Section 6.5.
6.2 X-ray CT of non-yeasted dough with and without sugar
In this thesis an extensive investigation into the effect of sugar throughout the breadmaking
process was conducted. This section continues to investigate the effect of sugar on bread
dough, to help understand why the presence of sugar in the dough formulation resulted in
dough of lower voidage. The cellular structure of two doughs are investigated: one containing
0% sugar and the other 15% sugar.
6.2.1 Method: X-ray CT of dough with and without sugar
The cell distribution of non-yeasted doughs containing 0% sugar and 15% sugar were
compared. Table 6.1 shows the formulation of the two doughs used in this experiment. Both
doughs were mixed in the Tweedy 1 for 230 s with a pressure step change from 1 bara to 0.5
bara after 110 s to mimic mixing in industrial breadmaking.
Table 6.1 Dough formulations used for comparison of 0% and 15% sugar dough via X-ray CT
0% sugar 15% sugar
Ingredient Quantity (g/ %)
Flour c (11%) 400.00 / 60.7 400.00 / 55.6
Water 232.00 / 35.2 232.00 / 32.3
Sugar 0.00 / 0.00 60.00 / 8.34
Salt 7.20 / 1.09 7.20 / 1.00
Ascorbic acid 0.03 / 0.00349 0.03 / 0.00417
Vegetable fat 20.00 / 3.03 20.00 / 2.78
A dough piece was then carefully inserted into a glass tube. The tube had an internal
diameter of 10 mm and a wall thickness of 0.5 mm. Cling film was stuffed into the top of the
tube to minimise dehydration. The tube was wedged into some oasis foam which was held
onto the X-ray sample holder using double sided sticky tape. The dough set up is illustrated in
Figure 6.1.

147
Figure 6.1 Dough set up for X-ray imaging of static samples
Molybdenum was used as the target material and a current of 280 uA and a voltage of 50 kV
used. The sample was rotated 360º and 2001 projections were obtained over approximately a
50 minute scan.
The voxel resolution of the 0% and 15% sugar dough was 9.06 µm3 and 8.83 µm3 respectively.
6.2.2 Results and discussion: X-ray CT of dough with and without sugar
In Figure 6.2 orthoslices of dough containing no sugar and 15% sugar, which were mixed for
230 s and subjected to a pressure step change from 1 bara to 0.5 bara at 110 s are presented.
The voxel resolution of the scans differs by 0.23 µm3. Examination of the orthoslices shows
two main differences between doughs: (1) cells in the 15% sugar dough are smaller. This
lowers the contrast of the smaller cells to the dough matrix, reducing confidence in their
identification, hence use of the voxel cut-off size. (2) In the 15% sugar dough, a greater
quantity of wispy grey marks can be seen. These marks are not likely to be tiny folds in the
dough, as folds in the dough have a different appearance and generally result in gas occlusion
between the folds. It is possible that these marks are ingredients that have not been fully
mixed in and broken up, as water quantities were not sufficient to mix in the solids. It is also
possible that these are artefacts from having not allowed the dough to relax following mixing,
or artefacts from reconstruction of the images.
cling film
dough sample
oasis foam
X-ray sample holder

148
Figure 6.2 Orthoslice of (a) 0% sugar dough and (b) 15% sugar dough mixed in a Tweedy 1 for
230 s and subjected to a pressure change from 1 to 0.5 bara at 110 s
The voidage derived from the double cup method and X-ray CT are presented in Figure 6.3.
Both the voidage before and after the voxel cut-off size for the X-ray CT results are
presented. According to all of the voidage measurements, the 0% sugar dough has a higher
voidage than the 15% sugar dough. The double cup measured the voidage of the 0% sugar
dough to be 3.75% and that of the 15% sugar dough to be 2.34%. This lower voidage of sugared
doughs is in agreement with voidage measurements in Section 4.3 and Chapter 5. The results
also show that the X-ray voidages are lower than the double cup voidages. This is likely to be
a result of the contrast and resolution, although voidage variation amongst different areas of
the dough is also likely to have an effect. The voidage difference before and after the cut-off
vary from 6% in the 0% sugar dough to 17% in the 15% sugar dough, a reflection of the
differences in the detected cell volumes in the two samples. Also, note that the X-ray voidage
without the cut-off is closer to the double cup voidage than the X-ray voidage with the cut-
off, suggesting that a number of the cell volumes not included in the count are from cells
which are present, rather than noise. The voidage differences between the double cup
method and X-ray method show that X-ray CT is capable of providing fairly accurate voidage
measurements. More voidage comparisons through the two methodologies are made later in
this chapter.
a b
2 mm
100 µm
100 µm

149
Figure 6.3 Dough voidage, measured by the double cup method and Avizo via X-ray CT, for
dough containing 0% sugar and 15% sugar, which were each mixed for 230 s in the Tweedy 1
with a pressure step decrease from 1 bara to 0.5 bara at 110 s.
The cell number density in the two doughs above the cut-off size are presented in Figure 6.4.
It is expected that use of the voxel cut-off will have a larger effect on the cell number than
on dough voidage, and this can be seen on comparison of Figure 6.4 to Figure 6.3. Thus
although these results have been illustrated, in reality they represent the minimum number
of cells per mm3 detected in the two doughs.
Figure 6.4 shows the 15% sugar dough contained 70 cells mm-3, which is 30% less cells mm-3
than the non-sugar dough, which contained 100 cells mm-3. This is greater than the cell
number density observed by Bellido et al. (2006) via X-ray CT, who found 30-56 cells mm-3 in
their two doughs studied and achieved a voxel resolution of 10 µm3. Differences in dough
formulation, mixer choice and sample preparation are expected to result in differences in cell
number. The mixer used in Bellido et al.’s study operated at a constant pressure, rather than
pressure-vacuum, therefore in theory should have occluded fewer cells over the mixing time.
When preparing the sample, Bellido et al. (2006) squashed their 0.5 g sample between two
plates and anisotropy analysis suggested that dough structure was altered. In addition it is
possible that squashing of the small sample size resulted in some cell rupture.
Figure 6.4 Number of cells above cut-off per cm3 for dough containing 0% and 15% sugar,
which were each mixed for 230 s in the Tweedy 1 with a pressure step decrease from 1 bara
to 0.5 bara at 110 s.
1.9
2.4
2.9
3.4
3.9
0 5 10 15V
oid
age o
uts
ide m
ixer
(%)
Sugar content (%)
X-ray with cut-off
X-ray without cut-off
double cup
65
70
75
80
85
90
95
100
105
0 5 10 15
Cell d
ensi
ty a
bove c
ut-
off
(cells
mm
-3)
Sugar Content (%)

150
As mentioned previously in this thesis, the addition of sugar to bread dough decreases the
water concentration of the dough. Upadhyay et al. (2012) used CLSM to investigate the mean
cell diameter of doughs in a range of dough formulations and found that on decreasing the
water concentration from 80% to 40%, cell diameters decreased from 22.8 µm to 16.8 µm. The
addition of 15% sugar to the dough formulation would cause a 2.4% decrease in water
concentration, which if in agreement, should see a decrease in mean cell size.
By using a cell cut-off size, results showing the mean cell volume in dough samples are likely
to be inaccurate, due to exclusion of cells below the cut-off size. The mean cell volume for
the 0% and 15% sugar doughs are presented in Figure 6.5. The results show the 0% sugar dough
to have a 17% larger volume than the 15% sugar dough. The 0% sugar dough was found to have
a mean cell volume of 330000 µm3 and the 15% sugar dough was found to have a mean cell
volume of 280000 µm3. On backwards calculation from the volume of a sphere, cells within
the 17% sugar dough have a mean diameter 2.8 µm larger than the non-sugar containing
doughs. This larger cell diameter of the non-sugar containing dough is in agreement with
Upadhyay et al. (2012). A lower mean cell volume may be the cause of the increased proving
time seen in sugared doughs in Section 4.10. In addition, a lower cell volume suggests the
cells in sugared doughs breakup more readily and thus gas is more likely to be lost from the
dough. This is supported by application of the population balance model to the strong flour
doughs in Chapter 5 showing an increase in the disentrainment coefficient in strong flour
doughs as the sugar content increased.
Figure 6.5 Mean cell volume above cut-off per cm3 for dough containing 0% and 15% sugar,
which were each mixed for 230 s in the Tweedy 1 with a pressure step decrease from 1 bara
to 0.5 bara at 110 s.
Figure 6.6 shows the cell size distribution in the 0% and 15% sugar dough. The cell volume
distribution above the voxel cut-off size for the two doughs is illustrated in Figure 6.6(a). In
Figure 6.6(b) the frequency of cells in the whole analysed sample size is illustrated. Figure
6.6 shows that as the cell volume increases, the number of cells rapidly decreases. It had
been observed on numerous occasions when handling dough that fewer larger cells exist in
doughs than smaller cells, so this was expected. Figure 6.6(b) illustrates that some data
points are comprised from just one cell. The results also show a larger cell number density
280000
290000
300000
310000
320000
330000
340000
0 5 10 15
Mean c
ell v
olu
me a
bove
cut-
off
(µm
3)
Sugar content (%)

151
per unit volume in the smallest eight categories of cell volumes in the 15% sugar dough than
the 0% sugar dough. Following this, there are fewer smaller cells in the 15% sugar dough.
The cell size distribution disagrees with the cell distribution Bellido et al. (2006) found
through micro CT. The authors did not find a decrease in cell number as cell size increased.
The authors found the cell size distribution was skewed towards the smaller cells with cell
number density greatest at a cell size of approximately 70 µm in diameter. The authors
reconstruction of cell sizes from individual orthoslices rather than thresholding the dough
sample will have affected their measured diameters. Even with use of a voxel cut-off size in
Figure 6.5, larger cell number densities were found at smaller cell sizes. It is likely that their
method of sample preparation resulted in the rupture of a significant number of cells that
were below this size and also rupture of larger cells
Figure 6.6(a) The number density per unit volume of different cell volumes (b) The
frequency of different volume cells in a 0% and 15% sugar dough following mixing for 230 s in
a Tweedy 1, with a pressure step decrease from 1 bara to 0.5 bara at 110 s
1.E-13
1.E-12
1.E-11
1.E-10
1.E-09
1.E-08
1.E-07
1.E-06
1.E-05
1.E-04
1.E-03
1.E-02
1.E+04 1.E+05 1.E+06 1.E+07 1.E+08 1.E+09 1.E+10
Cell n
um
ber
densi
ty a
bove c
ut
off
per
unit
volu
me (
mm
-3 µ
m-3
)
Mean cell volume (µm3)
0% sugar
15% sugar
1
10
100
1000
10000
100000
1000000
1000 10000 100000 100000010000000100000000 1E+09 1E+10
Fre
quency
Mean cell volume (µm3)
0% sugar
15% sugar
(a)
(b)
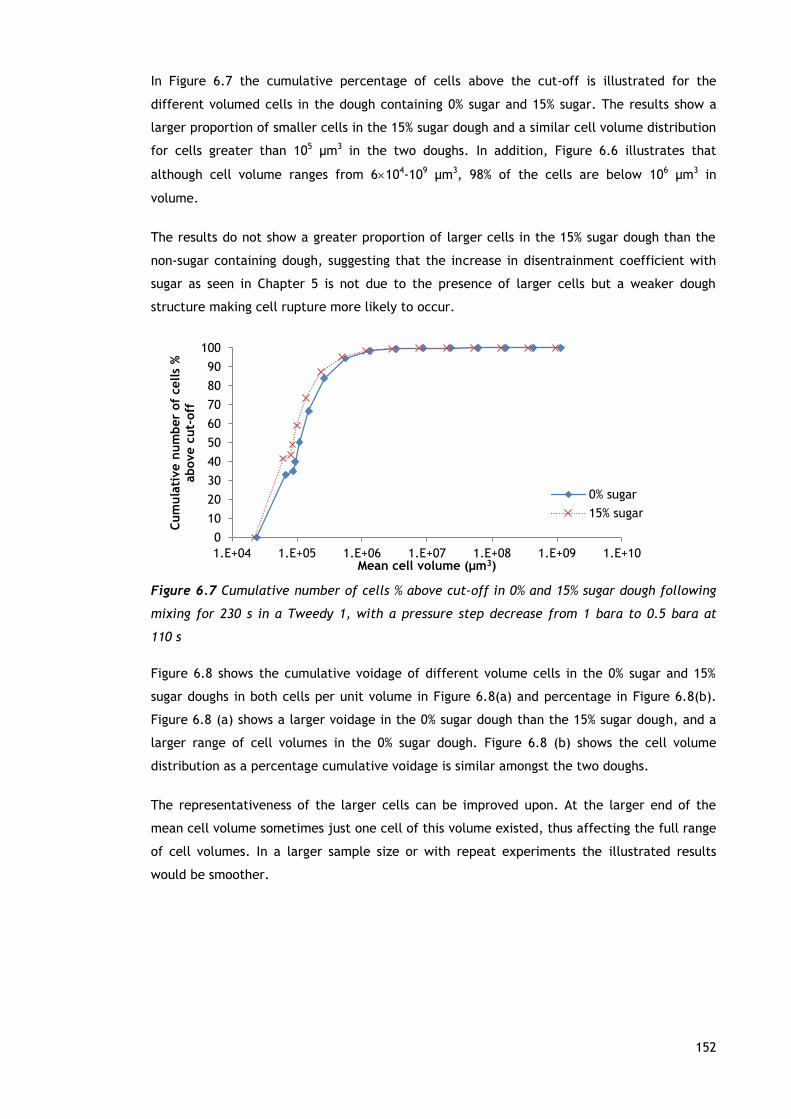
152
In Figure 6.7 the cumulative percentage of cells above the cut-off is illustrated for the
different volumed cells in the dough containing 0% sugar and 15% sugar. The results show a
larger proportion of smaller cells in the 15% sugar dough and a similar cell volume distribution
for cells greater than 105 µm3 in the two doughs. In addition, Figure 6.6 illustrates that
although cell volume ranges from 6104-109 µm3, 98% of the cells are below 106 µm3 in
volume.
The results do not show a greater proportion of larger cells in the 15% sugar dough than the
non-sugar containing dough, suggesting that the increase in disentrainment coefficient with
sugar as seen in Chapter 5 is not due to the presence of larger cells but a weaker dough
structure making cell rupture more likely to occur.
Figure 6.7 Cumulative number of cells % above cut-off in 0% and 15% sugar dough following
mixing for 230 s in a Tweedy 1, with a pressure step decrease from 1 bara to 0.5 bara at
110 s
Figure 6.8 shows the cumulative voidage of different volume cells in the 0% sugar and 15%
sugar doughs in both cells per unit volume in Figure 6.8(a) and percentage in Figure 6.8(b).
Figure 6.8 (a) shows a larger voidage in the 0% sugar dough than the 15% sugar dough, and a
larger range of cell volumes in the 0% sugar dough. Figure 6.8 (b) shows the cell volume
distribution as a percentage cumulative voidage is similar amongst the two doughs.
The representativeness of the larger cells can be improved upon. At the larger end of the
mean cell volume sometimes just one cell of this volume existed, thus affecting the full range
of cell volumes. In a larger sample size or with repeat experiments the illustrated results
would be smoother.
0
10
20
30
40
50
60
70
80
90
100
1.E+04 1.E+05 1.E+06 1.E+07 1.E+08 1.E+09 1.E+10
Cum
ula
tive n
um
ber
of
cells
%
above c
ut-
off
Mean cell volume (µm3)
0% sugar
15% sugar

153
Figure 6.8 Cumulative voidage in 0% and 15% sugar dough following mixing for 230 s in a
Tweedy 1, with a pressure step decrease from 1 bara to 0.5 bara at 110 s (a) per unit volume
(b) percentage
The results in Figures 6.7-6.8 show that although the smallest cells make up the largest
proportion of cells, their contribution towards the dough voidage following mixing is small,
compared to larger cells. 98% of the cells are below 106 µm3 in volume. However, in the 0%
sugar dough, these 98% of cells only make up 61% of the voidage and in the 15% sugar dough,
they only make up 56% of the voidage. The effect on voidage of smaller cells also justifies
using a voxel cut-off point to increase confidence levels.
6.3 X-ray CT of non-yeasted non-sugar containing bread dough
throughout mixing with a pressure step change
Pressure step changes in the form of pressure-vacuum mixing are used in the bread industry
to favourably manipulate the cell size distribution in the final bread. The theory is that the
pressure drop expands the cells, allowing them to be subdivided. However, this theory has
not been proved. Obtaining the cell size distribution in a dynamic process is essential for
understanding and improving control of opaque fluids such as bread dough. In this section, the
cell size distribution throughout a pressure-vacuum mixed dough is compared to the cell size
distribution in a control to test if the theory is true. The cell size distributions are also used
to test the validity of the simplified no breakup population balance model, which makes a
number of invalid assumptions.
6.3.1 Method: X-ray CT of bread dough without sugar throughout mixing with a pressure
step change
X-ray CT was conducted on five non-yeasted pressure-vacuum mixed doughs and one constant
pressure mixed dough. The dough formulations were identical amongst the six doughs, which
varied in their processing. Once samples were obtained from each dough, the dough was
discarded, and fresh batches made for the outstanding mixing times. For the pressure-vacuum
0.0E+00
5.0E+06
1.0E+07
1.5E+07
2.0E+07
2.5E+07
3.0E+07
3.5E+07
1.E+04 1.E+06 1.E+08 1.E+10
Cum
ula
tive v
oid
age p
er
unit
volu
me
(µm
3 m
m-3
) above c
ut-
off
Mean cell volume (µm3)
0% sugar
15% sugar
0
10
20
30
40
50
60
70
80
90
100
1.E+04 1.E+06 1.E+08 1.E+10
Cum
ula
tive v
oid
age a
bove c
ut-
off
(%
)
Mean cell volume (µm3)
0% sugar
15% sugar
(a) (b)

154
mixed doughs, their times under vacuum varied. Mixing was carried out in the Tweedy 1 at
1 bara for the first 110 s and then at 0.5 bara for the remainder of the mixing time, with total
mixing times of 110 s, 130 s, 150 s, 180 s and 230 s, to measure transient behaviour. A dough
mixed at a constant pressure of 1 bara for 230 s was made as a control. The six dough
formulations and their mixing times are given in Table 6.2.
Table 6.2 Formulations and mixing times used for comparison of pressure-vacuum and
constant pressure mixed doughs via X-ray CT
Ingredient Quantity (g / %) Mixing time (s)
Flour c (11%) 400.00 / 60.7
110, 130, 150, 180, 230 –
pressure-vacuum mix
230 – constant pressure mix
Water 232.00 / 35.2
Vegetable fat 20.00 / 3.03
Salt 7.20 / 1.09
Ascorbic acid 0.03 / 0.00455
The current range for the six samples was 200-285 uA and the voltage range was 50-65 kV.
The sample was rotated 360º and 1801 projections were obtained over approximately a 45
minute scan. On reconstruction of the dough, the voxel resolutions and sample sizes
presented in Table 6.3 were obtained. The 5 voxel in diameter cut-off equated to sample
diameters of 35-54 µm in the 5 samples.
Table 6.3 Sample volumes and resolutions for X-ray scans
Dough Resolution (µm3) Sample volume (cm3)
110 s 10.8 1.26
130 s 8.4 1.12
150 s 9.0 1.32
180 s 7.1 1.26
230 s 7.1 1.08
230 s, no step change 8.6 1.22
The voidages obtained from X-ray CT were input into the no breakup population balance
model described in Chapter 5, and the model was then fitted to the experimental results to
assess its applicability to the scenario given the simplifying assumptions made. The chosen
entrained bubble size was selected to give model agreement to the data at time 110 s.
6.3.2 Results and discussion: X-ray CT of bread dough without sugar throughout mixing
with a pressure step change
Figure 6.9 show orthoslices for doughs mixed at a constant pressure of 1 bara for 110 s and
230 s, and a pressure vacuum mixed dough that was mixed for a total of 230 s and underwent
a pressure step decrease from 1 bara to 0.5 bara at 110 s. The cell size distribution for the
110 s and 230 s 1 bara cases look similar at first inspection. However, it appears that the

155
dough which experienced a step change has a significantly different cell size distribution –
with fewer and possibly smaller cells.
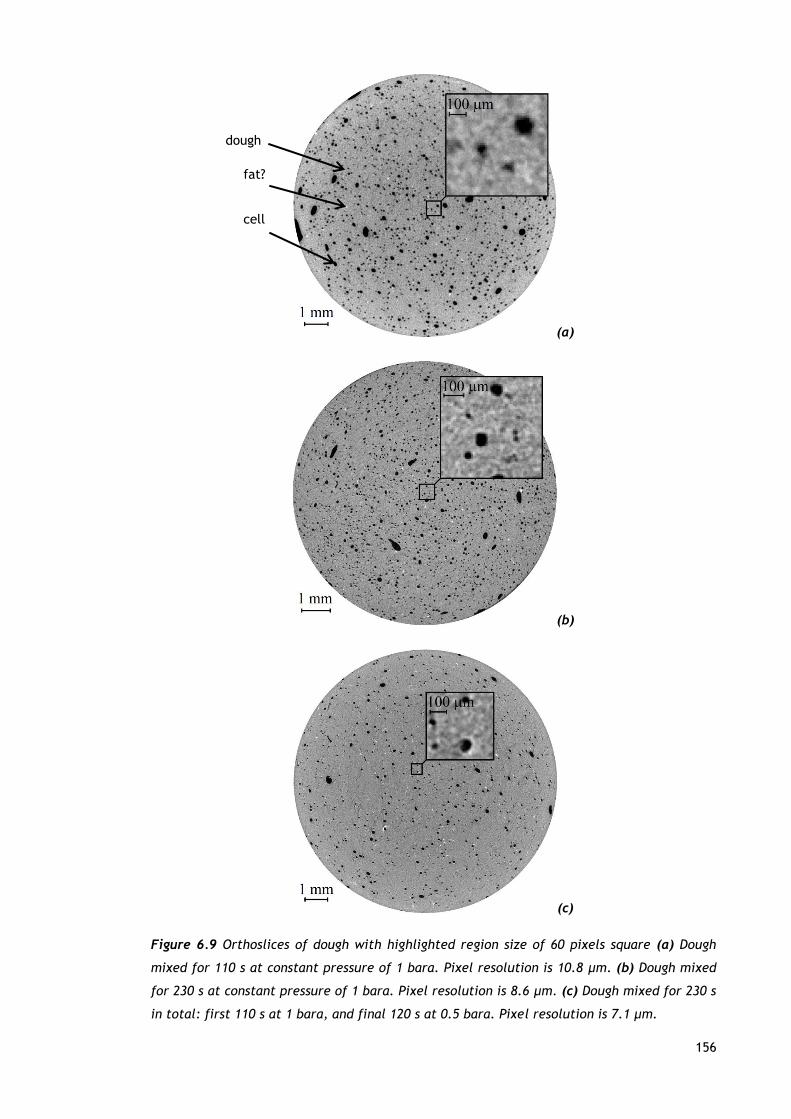
156
(a)
(b)
(c)
Figure 6.9 Orthoslices of dough with highlighted region size of 60 pixels square (a) Dough
mixed for 110 s at constant pressure of 1 bara. Pixel resolution is 10.8 µm. (b) Dough mixed
for 230 s at constant pressure of 1 bara. Pixel resolution is 8.6 µm. (c) Dough mixed for 230 s
in total: first 110 s at 1 bara, and final 120 s at 0.5 bara. Pixel resolution is 7.1 µm.
fat?
cell
dough

157
Figure 6.10 illustrates the measured differences in voidage amongst the six dough samples
with and without a cut-off. With exception of the constant pressure mixed control sample
where the measured voidages differed by 11%, the voidage of the other five samples with and
without a cut-off were within 6% of each other. The larger voidage difference observed in the
230 s constant pressure mixed dough is due to a larger proportion of the voidage being
comprised from cells smaller than the cut-off. The 110 s constant pressure mixed dough also
has a larger proportion of its voidage comprised from cells smaller than the cut-off size than
the pressure-vacuum mixed doughs.
Whilst the effect of using a cut-off has a small effect on voidage, parameters which depend
upon the number of cells will be affected, and it must be remembered that these parameters
are above the cut-off point.
Figure 6.10 X-ray measured dough voidage of pressure-vacuum mixed dough and constant
pressure mixed dough
In Figure 6.11 the cell volume distributions for the doughs are the different mixing times are
presented. Figure 6.11(a) presents these are the cell number density and figure 6.11(b) as the
number of cells in each scanned dough sample. The figures show a decrease in the number
density of cells per unit volume as the mean cell volume increases, with some of the data
points representing the mean cell volumes being comprised from just one cell. No trend in
the cell volume distribution is noted prior to cells of the mean volume of 106 µm3. For cells
greater than this in volume, however, it can be seen that the trend shifts to the left as the
mixing time increases. As the mixing time increases, the number density of cells per unit
volume decreases in the pressure-vacuum mixed doughs with time. It was hypothesized that
this would occur due to cell breakup. The control dough, although containing a greater
number of cells, has a similar cell volume distribution to the other constant pressure mixed
dough, which was mixed for 110 s.
1.8
2.8
3.8
4.8
5.8
6.8
7.8
8.8
100 120 140 160 180 200 220 240
Void
age o
uts
ide m
ixer
(%)
Mixing time (s)
with cut-offwithout cut-offwith cut-off, constant pressure/controlwithout cut-off, constant pressure/control

158
Figure 6.11(a) The number density per unit volume (b) The frequency of different cell
volumes within dough throughout pressure-vacuum mixing. The doughs were mixed at 1 bara
for the first 110 s and 0.5 bara thereafter.
In Figures 6.12 and 6.13 the cumulative percentage of cells and voidage are presented against
mean cell volume respectively, to further illustrate the cell volume distribution. Figure 6.12
shows a change in the cell volume distribution throughout mixing, with the trend shifting to
the left roughly with time, and similarity in the distribution of the two constant pressure
mixes. Figure 6.12 also illustrates that throughout mixing approximately half of the cells are
of a volume of approximately 104 µm3 despite the maximum detected cell volume being
approximately 1010 µm3. It is beneficial at this stage of the breadmaking process to have a
significant proportion of cells of a smaller volume, to delay coalescence and produce bread of
desirable qualities. The cell size distributions are typically sigmoidal in shape in agreement
with Turbin-Orger et al. (2012).
1.E-13
1.E-12
1.E-11
1.E-10
1.E-09
1.E-08
1.E-07
1.E-06
1.E-05
1.E-04
1.E-03
1.E-02
1.E+04 1.E+05 1.E+06 1.E+07 1.E+08 1.E+09 1.E+10
Num
ber
densi
ty o
f cells
above c
ut-
off
per
unit
volu
me (
mm
-3 µ
m-3
)
Mean cell volume (µm3)
110 s constant pressure
130 s
150 s
180 s
230 s
230 s constant pressure/control
1
10
100
1000
10000
100000
1000000
1.E+03 1.E+04 1.E+05 1.E+06 1.E+07 1.E+08 1.E+09 1.E+10 1.E+11
Fre
quency
Mean cell volume (µm3)
110 s130 s150 s180 s230 s230 s, constant P
(a)
(b)

159
In Figure 6.13 the higher voidage in the constant pressure mixed doughs compared to the
pressure-vacuum mixed doughs is clear. The two doughs show a similar voidage distribution
profile. In addition, it was noted above that half of the cells are smaller than 104 µm3 in
volume. Figure 6.13 shows that despite them making up a significant proportion of the cells,
their voidage contribution is less than 10% in all of the mixes. This emphasises the importance
of the larger cells in the dough voidage contribution at this stage of the breadmaking process.
This is in agreement with Sapirstein et al., (1999). The authors noted that the majority of
cells are smaller in size than the mean cell size within the dough. Campbell et al. (1991), also
noted the small contribution of smaller cells towards the dough voidage.
In Figure 6.13, some of the data points amongst the largest cell volumes are comprised of a
single cell. Note that in this experiment a single large cell alone does not skew the dough
voidage. This suggests that for the investigation of cell volume distribution following mixing,
the sample sized used is suitable. However, the large gap in the cell volumes observed
amongst the larger dough sizes suggests that the full range of larger cell sizes is not detected
in this sample size, and it would be beneficial to increase the sample size or carry out
repeats.
Figure 6.12 Cumulative cell percentage for different volume cells within dough throughout
mixing at 1 bara for the first 110 s and 0.5 bara thereafter, and throughout a constant
pressure of 1 bara for 230 s.
0
10
20
30
40
50
60
70
80
90
100
1.E+04 1.E+05 1.E+06 1.E+07 1.E+08 1.E+09 1.E+10
Cum
ula
tive n
um
ber
of
cells
% a
bove c
ut-
off
Mean cell volume (µm3)
110 s constant pressure
130 s
150 s
180 s
230 s
230 s constant pressure/control

160
Figure 6.13 Cumulative voidage for different cell volumes within dough throughout mixing
at 1 bara for the first 110 s and 0.5 bara thereafter, and the control, which was mixed at a
constant pressure of 1 bara.
Figure 6.14 shows the measured and modelled number of cells per volume of dough at
different mixing times during constant pressure mixing and pressure-vacuum mixing. The
number density ranged from 57 to 120 cells per mm3; these are the same order of magnitude
as those reported by Dobraszczyk et al. (2001), Martin et al. (2004a) and Bellido (2006). The
results show a decrease in the cell density immediately following the pressure step-decrease,
then increase again above the initial level by the end of the mix, with the cell density being
lower than that for the constant pressure mixed dough at 230 s.
0.E+00
1.E+07
2.E+07
3.E+07
4.E+07
5.E+07
6.E+07
7.E+07
8.E+07
9.E+07
1.E+04 1.E+05 1.E+06 1.E+07 1.E+08 1.E+09 1.E+10
Cum
ula
tive v
oid
age p
er
unit
volu
me (
µm
3 m
m-3
)
Mean cell volume (µm3)
110 s constant pressure130 s150 s180 s230 s230 s constant pressure/control

161
Figure 6.14 Number of cells per unit volume at different mixing times, with X-ray CT results
and fitting of the no breakup population balance model of aeration to the experimental
results. Dough was either mixed at a constant pressure of 1 bara or pressure-vacuum mixed
for a total of 230 s, with a pressure step decrease from 1 bara to 0.5 bara at 110 s.
Figure 6.15 illustrates the model fitting to the dough voidage, and the voidage of the
pressure-vacuum mixed dough in Chapter 5 (the flours used in the dough formulations differ).
It is presented to illustrate how the voidage of the dough outside the mixer changes
throughout pressure-vacuum mixing, as limited resources meant the voidage limited the
number of points for which data collection via X-ray CT took place. It shows that on
application of a vacuum, gas is drawn from the dough causing the voidage to decrease
rapidly, until about 140 s when the voidage begins to level off. The voidage of the dough
decreases prior to drawing a vacuum and earlier than expected in this dough. This is likely to
be due to anomalous results from an unrepresentative mixing pattern session in the Tweedy
mixer.
In Chapter 5, both strong and weak flour doughs were pressure-vacuum mixed, and the results
showed a shared trend in the two flour types. This indicates that the effect of pressure-
vacuum mixing is expressed amongst different flour types, and thus the dough from Chapter 5
can be used to represent the trend which will occur during pressure-vacuum mixing of the X-
ray dough. Differences are expected amongst the voidage in the doughs and the extent of the
effect of drawing a vacuum.
Figure 6.15 shows the voidage of the different doughs. It shows the voidage of the pressure-
vacuum mixed X-ray dough to be lower than the voidage of the strong flour dough from
Chapter 5 and the change in dough voidage between the doughs share the same trend. Note
at t = 180 s and t = 230 s, the double cup and X-ray voidages measured are from different
batches of dough, with a slight difference in formulation. Measured % differences between
voidages of dough from an identical batch found the measurements to be within 7% of each
50
70
90
110
130
150
170
190
80 100 120 140 160 180 200 220 240
Num
ber
of
cells
per
unit
volu
me (
mm
3)
Mixing time (s)
P (bara): 1 10.5 X-ray: Model:

162
other. The shared trend and closeness in voidage between the two methods gives confidence
in the X-ray CT methodology. The control shows a different voidage to the pressure-vacuum
mixed doughs and a higher voidage than all doughs. It was expected that the control would
show a higher voidage as it was mixed at a higher pressure for longer, allowing more gas to be
entrained into the dough. However, the voidage of the control dough is higher than expected.
This may be due to a variety of reasons including the voidage variation from one batch of
dough to another, the variation in voidage throughout the dough, the age of the dough
causing it to behave differently, and the dough following a different mixing pattern in the
Tweedy mixer. The trend in voidage change expressed in X-ray CT measurements reflects the
voidage change which occurs throughout pressure-vacuum mixing and shows the sensitivity of
the X-ray CT methodology to these changes.
Differences in voidage between the double cup voidage measurements and X-ray voidage
measurements may be due to a number of reasons. It is expected that voidage measurements
obtained through X-ray CT are less accurate due to the smaller sample size, use of just one
sample to measure voidage as opposed to six, more handling and the effect of labelling at
different thresholding levels.
In Figure 6.15, the model was fitted to the data by selecting a suitable volume for entrained
cells (700516 µm3, equivalent to a spherical cell of diameter of 109 µm) which meant the
voidage such that the model and voidage measurements agreed at mixing time 110 s. The
value chosen was the mean cell volume at 110 s. The model trends for mixing times after this
point are only dependent on the parameters fitted to the dough voidage data – the model was
not fitted to the number density or mean cell volume. With this in mind, the fit of the model
is encouraging as it displays the same trends. In addition, the RMSNE for the model fitting to
the experimental results was 0.549. Note the model under predicts the number density. This
may be a result of neglecting any cell break-up.
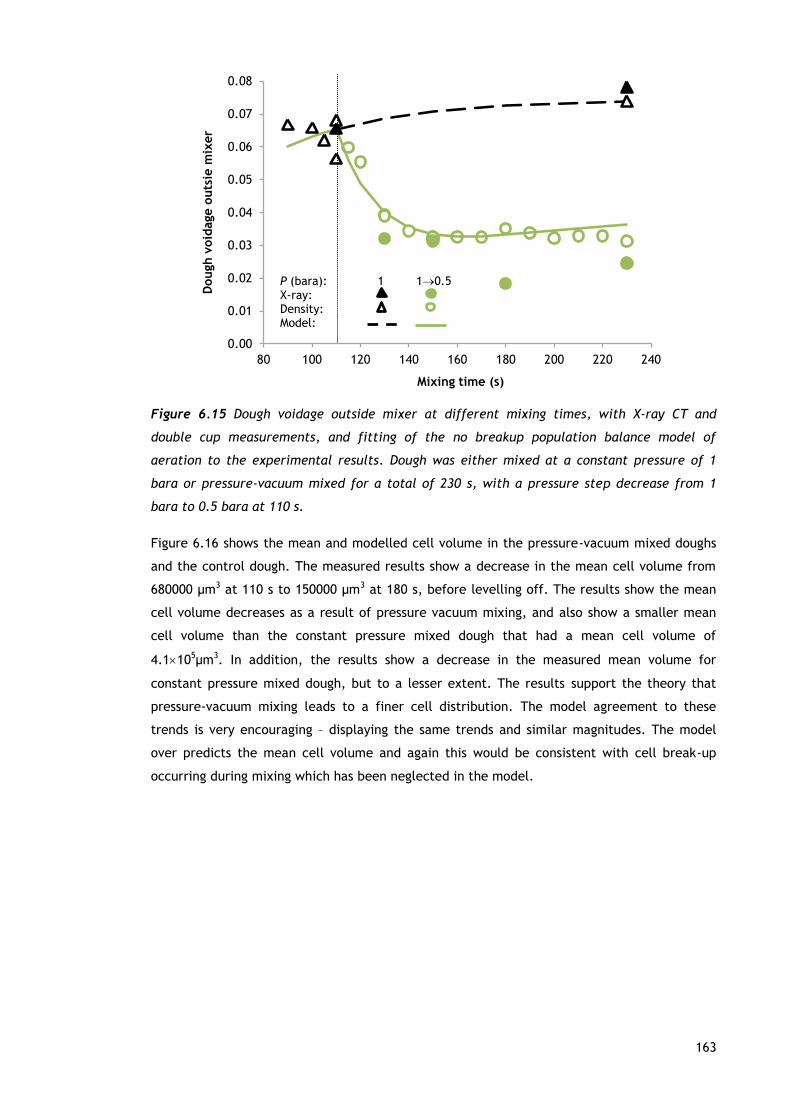
163
Figure 6.15 Dough voidage outside mixer at different mixing times, with X-ray CT and
double cup measurements, and fitting of the no breakup population balance model of
aeration to the experimental results. Dough was either mixed at a constant pressure of 1
bara or pressure-vacuum mixed for a total of 230 s, with a pressure step decrease from 1
bara to 0.5 bara at 110 s.
Figure 6.16 shows the mean and modelled cell volume in the pressure-vacuum mixed doughs
and the control dough. The measured results show a decrease in the mean cell volume from
680000 µm3 at 110 s to 150000 µm3 at 180 s, before levelling off. The results show the mean
cell volume decreases as a result of pressure vacuum mixing, and also show a smaller mean
cell volume than the constant pressure mixed dough that had a mean cell volume of
4.1105µm3. In addition, the results show a decrease in the measured mean volume for
constant pressure mixed dough, but to a lesser extent. The results support the theory that
pressure-vacuum mixing leads to a finer cell distribution. The model agreement to these
trends is very encouraging – displaying the same trends and similar magnitudes. The model
over predicts the mean cell volume and again this would be consistent with cell break-up
occurring during mixing which has been neglected in the model.
0.00
0.01
0.02
0.03
0.04
0.05
0.06
0.07
0.08
80 100 120 140 160 180 200 220 240
Dough v
oid
age o
uts
ie m
ixer
Mixing time (s)
P (bara): 1 10.5 X-ray: Density: Model:

164
Figure 6.16 Mean cell volume at different mixing times, with X-ray CT results and fitting of
the no breakup population balance model of aeration to the experimental results. Dough was
either mixed at a constant pressure of 1 bara or pressure-vacuum mixed for a total of 230 s,
with a pressure step decrease from 1 bara to 0.5 bara at 110 s.
Good agreement is shown between the dough voidage, cell number density and mean cell
volume for the model, although simplifying assumptions such as a small number of discrete
cell sizes were made. The model predicts the significant processing effect of vacuum mixing,
showing the reduction in cell number density and volume, using just dough voidage
measurements. It demonstrated that the decrease in number density is much more short lived
than the decrease in size which is permanent. The model is fitted to voidage data using only
three parameters, which are inexpensively obtainable from dough density measurements.
Therefore the no cell breakup model has been shown to provide a practical and reasonably
accurate characterisation of pressure vacuum mixing, and confirms that the simplifying
assumptions made in the model are reasonable. This enables use of the model to estimate
aeration rates, oxygen availability and optimal time for pressure-vacuum mixing to achieve
the desired final cell size distribution in bread dough.
6.4 X-ray CT of bread dough during proving
During each stage of the breadmaking process, aeration processes occur that changes dough’s
structure. Proving largely forms the cellular structure of bread dough (Dobraszczyk et al.,
2001), a result of carbon dioxide produced from yeast diffusing into cells. During this dynamic
process, the cell size distribution changes through their cell growth, interaction and rupture,
making the process interesting to study. Observations of this process also enable improved
understanding of the proving process to help obtain the desired final cellular structure. In
addition, the dynamic results were to be used for development of a faster reconstruction
algorithm.
0
1
2
3
4
5
6
7
8
80 100 120 140 160 180 200 220 240
Mean C
ell v
olu
me (
µm
3)
Mixing time (s)
P (bara): 1 10.5 X-ray: Model:
x100000

165
6.4.1 Method: X-ray CT of bread dough during proving
Dough was made up in a kitchen planetary mixer to the formulation shown in Table 6.4, and
analysed through X-ray CT.
Table 6.4 Dough formulation used for X-ray CT of bread dough proving
Ingredient Quantity (g / %)
Flour e (15%) 200.0 / 58.0
Salt 3.6 / 1.04
Water, 38°C 133.0 / 38.6
Quick yeast 2.0 / 0.58
Sugar 6.0 / 1.74
The dry ingredients were mixed together for 30 s on mixer setting 1 to ensure thorough
distribution of the ingredients. Water was then added over a period of 30 s and the mixer
speed setting increased to 2. The dough was then mixed for a further 5 minutes. A dough
piece approximately 1 g in weight was carefully cut from the dough using a razor blade. It
was rounded to smooth out any damaged edges and coated in sunflower oil to prevent it from
drying out before being put into a plastic tube glued onto a sample holder. Cling film was
used as a bung at the top of the tube to stop the sample from drying out. This set up is
illustrated in Figure 6.17.
Figure 6.17 Dough set up for X-ray imaging during proving
The sample was placed on the Nikon Metris 225/320 kV CT system rotation stage and imaged
in a customised bay. The sample to source distance was 51 mm and the sample to detector
distance was 1007 mm. The temperature in the custom bay was 21.5°C. This is lower than
industrial proving temperatures, but had to be maintained for complete functioning of the
dough
cling film
X-ray sample holder

166
equipment. This temperature is also advantageous for X-ray CT of dough proving, as the
changes in the dough occur over a longer duration, thus fewer changes occur over each scan
time, resulting in clearer images and enabling easier reconstruction of the data set.
During analysis the sample was rotated 360o for 1.5 minutes, collecting 400 projections per
scan with a voxel size of 10.23 µm3. The experiment took place over 150 minutes, acquiring a
new scan every 5 minutes. This duration was to ensure sufficient time to document changes
and took into account the proving temperature. For the X-ray CT analysis an accelerating
voltage of 65 kV, current of 400 uA, exposure time of 250 ms, target material of tungsten and
a gain of 2 was used for each projection.
For development of a fast reconstruction algorithm, two dough samples were imaged under
this set up and another two with a similar set-up, collecting 800 projections over a 3 minute
scan.
The data set with 400 projections per scan was used for visualisation of proving, due to
proving being a dynamic process and thus this data set should be less blurred than the data
set with 800 projections per scan (which has the advantage of capturing more detail). The
images were then reconstructed on Nikon Metris CTPro 3D (Metris XT 2.2, version
2.2.4365.28608) and the voxel size of 10.2 µm3 obtained. As with Section 6.1 and Section 6.2,
it is difficult to identify with confidence features at the lower end of the resolution.
However, as the dough is monitored over time, all of the identified cells have been included
for analysis. Following reconstruction, the data was processed and analysed in Avizo Fire 7.1
(Visualization Sciences Group, Bordeaux, France). Not every scan was analysed, due to the
large number of scans conducted and the requirement of sufficient time between scans to
observe changes in the bread dough. The scans were analysed for dough volume and
proportion of cells present at the following times: 0, 5, 10, 20, 30, 40, 50, 60, 70, 80, 90,
100, 110, 120, 130, 140, 145 minutes. More detailed information of different features of the
dough’s cellular structure was then acquired at the appropriate times. This quantitative
information includes cell volume distribution, cell number density, mean cell volume,
cumulative cell percentage and cumulative voidage per unit volume. Cell number density is
used to take into account the differences in sample sizes. The distribution of cell sizes is also
presented to enable any cells that skew the data to be identified.
Two filters were applied to the data, a median filter followed by an anisotropic diffusion
filter. The median filter is a noise reduction filter. It operates by sorting voxels according to
their grayscale value. The anisotropic filter is a smoothing filter. It preserves strong edges of
voxels and enhances their contrast. Following filtering the cells and dough matrix were
segmented based on their greyscale values, and Material Statistics run on the segmented
dough to quantify cell and dough matrix proportions. The quantification tool was used for
calculation of cell numbers and volumes, and their Feret shape. Feret shape is defined as
1/minimum diameter divided into the maximum diameter at 90ᴏ. Feret shape and cell
volumes and numbers were processed in Microsoft Office Excel, where cells were grouped

167
according to volume, to give the cell volume distribution, and the voidage contribution of the
groups of cell volumes calculated.
In addition, the yeast activation time was determined by mixing 2 g of the yeast with 133 g of
water that was at 38ºC. The time required to observe bubbling in the mix was determined as
the yeast activation time.
6.4.2 Results and discussion: X-ray CT of bread dough during proving
The purpose of the work in this section was for development of a fast reconstruction
algorithm for 4D scans and to conduct a comparison illustrating the benefits of the fast
reconstruction algorithm compared to the standard reconstruction algorithm. Data was
obtained and the algorithm was to be developed using this data by a research group within
the School of Mathematics at the University of Manchester. This data has been given to the
research group and is still in development. If successful, it will enable reconstructions in less
time through use of every nth image.
The yeast activation time was determined as 5 minutes. Mixing of the dough took 6 minutes.
Including the set up time, the hydration time of the yeast on running the scan was 7 minutes,
meaning the yeast were active on running the scan.
Figure 6.18 shows the change in dough volume as it proves. In the first 20 minutes, a slow
increase in dough volume is observed. The dough volume increases from 544 mm3 to 555 mm3.
The rate the dough volume increases then accelerates, before peaking and most likely
levelling off at 1293 mm3 at 140 minutes, although it is difficult to say for certain as this
trend is only seen from one data point. The volume increases more than 100% over the
proving time due to expansion of cells within the dough through yeast carbon dioxide
production. The increase in volume is slow initially due to the requirement of larger pressures
to increase the small cell volumes. As the cells increase in volume, it becomes easier for the
pressure inside the cell generated through carbon dioxide production to overcome the
pressure outside the cell, resulting in quicker cell expansion. As the cells grow, interaction
with neighbouring cells through coalescence and disproportion occurs, resulting in fewer but
larger cells. However, their stability in the dough is reduced as they increase in volume,
hence the levelling off in volume observed from 140 minutes. The likely levelling off is also
likely to be due to the doughs viscoelastic properties having reached its limit, therefore
preventing further expansion of cells. The large cell volume, their proximity to the dough
edges and the thinner cell walls seen in Figure 6.20(l), the orthoslice image at the end of the
scan, support this. Had more scans been conducted and the results analysed, the dough
volume most likely would have decreased soon after. The dough reaching its minimum density
indicates overproving. To obtain a high volume loaf, the minimum density should be attained
during baking. If the proved dough was baked, there would have been no expansion capacity
left for oven spring and a large proportion of cells in the dough would rupture prior to the
structure being set. This would cause significant loss of gas to the atmosphere and result in
collapse of the loaf.

168
Figure 6.18 Change in dough volume with proving time. The dough was mixed in a
conventional plenary kitchen mixer and proved at 21.5ºC.
In Figure 6.19, the dough voidage over the proving time is illustrated. It shows a slow increase
in the proportion of cells in the first 20 minutes, with the voidage increasing from 2.7% to
4.9%. The proportion of cells then increases up to 130 minutes and levels off at 66%. The
results suggest the dough was over proved. At 145 minutes, 66% of the dough volume is gas,
yet bread is approximately 70% gas and baking is known to be responsible for more than 4% of
the gas in bread. The trend in Figure 6.19 is as expected and was previously explained in
reference to Figure 6.18. The observed trends in voidage change over proving match those
obtained by Babin et al. (2006) and Shehzad et al. (2010).
The trend observed in Figure 6.19 was expected to match the trend in Figure 6.18, due to
changes in the proportion of cells in the dough being responsible for the change in dough
volume. Two differences are expressed in the trends in Figures 6.18 and 6.19: the time the
peak occurs and the smoothness of the curve. In Figure 6.18 the peak occurs at 140 minutes,
whereas in Figure 6.19 it occurs at 130 minutes. There are two possible reasons for this
discrepancy. The first being that between 130 and 145 minutes, cell growth and breakup
occur at the same rate. The second is segmentation errors, although this is unlikely due to
the voidage at these times. However, the segmentation errors are likely to be responsible for
Figure 6.18 being smoother than Figure 6.19. These errors are created from the method of
determining volume and voidage. Volume measurements are more accurate than voidage
measurements, due to the cells being selected from the dough volume. As the voidage
changes between scans, the grayscale levels within each image changes, so thresholding to
the same grayscale levels was not feasible. This meant the cells were prone to over and under
thresholding. In Table 6.5, the % error in voidages given by Avizo at different proving times,
when using a thresholding value of +/-2 of the value used, are given. The errors were
determined intermittently to illustrate its changes relative to proving times. Errors decrease
as the proving time increases due to the increase in the cell to dough matrix ratio, and
increase in cell volume creating a greater contrast to the dough matrix.
0
200
400
600
800
1000
1200
1400
0 20 40 60 80 100 120 140
Dough v
olu
me (
mm
3)
Proving time (minutes)

169
Figure 6.19 Change in dough voidage with proving time. The dough was mixed in a
conventional plenary kitchen mixer and proved at 21.5ºC.
Table 6.5 Percentage error at different thresholding levels throughout dough proving
Time (minutes) % error when using
thresholding value +2
% error when using
thresholding value -2
0 10.90 8.90
40 11.60 9.35
70 6.76 5.88
145 2.24 2.08
Non-filtered orthoslices at different stages of proving are presented in Figure 6.20. These are
one dimensional images of the dough at different times during the scan. The same orthoslice
number is presented in each figure to more effectively illustrate changes in the dough. These
are organised chronologically from left to right and top to bottom. The volume of the dough
and proportion of cells within it increases with time. A perspective of the extent of volume
increase can be seen by comparison of the dough volume against the straw. Initially,
approximately a sixth of the straw is in contact with the dough and the dough largely consists
of dough matrix. Approximately half way through the scan, contact is made with the whole
straw perimeter, and by the end of the scan, the dough largely consists of gas. The
orthoslices also show an increasingly irregular cell shape with time, in agreement with Babin
et al. (2006; 2008). The figures show that the cells do not have a preference for location with
the centre of each dough piece. Figure 6.20(a) shows fewer cells than all the prospective
times. None of the cells appear to be in direct contact with each other. From Figure 6.20(a)-
6.20(d), growth, an increase in the number of cells and their proximity, can be observed. As
yeast cannot generate new cells (Baker and Mize, 1941), these cells must have been present
at the start of the proving, but below resolution size. The resolution of the scan was 10.2 µm.
From this we know that cells smaller than 10.2 µm in diameter are entrained by the dough,
and that they grow and contribute towards the final dough voidage. This also means voidage
measurements are underestimated, as all the cells within the dough were not detected.
However, it is likely that prior to their expansion, cells below 10.2 µm in diameter make a
negligible contribution towards the dough voidage. This is in agreement with Babin et al.
0
10
20
30
40
50
60
70
0 20 40 60 80 100 120 140
Void
age (
%)
Proving time (minutes)

170
(2008) who found that growth of initially detected cells has a significantly greater voidage
contribution than growth of previously undetected cells during proving.
The changes between the orthoslices at different proving times become greater with time, a
result of yeast carbon dioxide production and cell kinetics. This makes it challenging to track
individual cells between scans as time proceeds and the dough structure rapidly changes. The
orthoslices illustrate the rapid and significant changes in structure from 30 to 110 minutes
and the interaction of larger cells with each other after 110 minutes.
Examination of the cells seen in Figure 6.20(i) and 6.20(j), orthoslices obtained within 5
minutes of each other at a highly dynamic stage of proving, illustrates some of the cell
mechanics. Changes in cell volume and number can be seen through cell growth and
interaction. Some cells within these figures have been labelled to further illustrate some
changes which occur. Cells A and B are examples of cells that coalesce. Cell C illustrates the
non-spherical shape of a cell and the changes observed over 5 minutes are likely to be a
result of the changes in dough volume altering the cells position within the dough. Cell D is
likely to have broken up, hence its presence in Figure 6.20 (i) and not (j). Cells breakup under
high strain conditions on the cell wall and when the viscoelastic properties of the dough are
no longer sufficient to retain the gas. Coalescence and cell breakup occur throughout proving,
and in particular at later stages of proving when the cells are close enough to interact with
each other, larger and thus less stable and more prone to change. Note that in support of the
views of Dobraszczyk et al. (2001), disproportionation was not observed amongst these
orthoslices. It is highly likely that if disproportionation did occur within cells, it would have
been noticed amongst these orthoslices. Note also that no mention of observations of
disproportionation have been made in published work where dough proofing was visualised.
Figures 6.20(k) and 6.20(l) illustrate a number of very large cells within the dough and some
located within the dough perimeter. This extent of proving is undesirable in breadmaking.
Here the dough consists mainly of gas in large cells and some support from the surrounding
dough matrix. The fact that this dough contains a large quantity of gas contained within
mainly large cells suggests it has high strain hardening properties and is good for
breadmaking. Note also the polyhedral cell shapes seen in Figures 6.20(k) and (l). Figure
6.20(k) contains 60% gas. Vliet et al. (1992) noted that above 70% gas, cells begin to deform
each other strongly and start taking on a polyhedral shape. It is likely that there will be some
variation in this figure, depending upon the dough’s rheology.
Dough orthoslices can also be used to track the position of cells throughout dynamic
processes. Work on tracking individual cells to monitor their growth, change in position,
orientation, shape and interaction with neighbouring cells was conducted using visualisation
tools by an individual from The University of Manchester’s School of Material Sciences.
However, this work was not complete at the time of writing this thesis.

171
(a) (b)
(c) (d)
(e) (f)
0 min
10 min
20 min 30 min
40 min 50 min

172
(g) (h)
(i) (j)
(k) (l)
Figure 6.20 Orthoslice at (a) 0 min (b) 10 min (c) 20 min (d) 30 min (e) 40 min (f) 50 min (g)
60 min (h) 70 min (i) 85 min (j) 90 min (k) 110 min 9l) 145 min, during proving at 21.5ºC
In Figure 6.21, two dimensional images of the dough at different proving times are illustrated.
These illustrate the change in height of the dough sample and also suggest that the
constraints created by the sample container affect the shape of the cells, causing them to
favour upwards growth. It is likely that these constraints are also present in industrial
breadmaking where dough is proved and then baked in a tin. Cells are also highlighted in the
figure to illustrate how they change throughout the process.
B B C C
A A
D
85 min 90 min
110 min 145 min
60 min 70 min

173
Figure 6.21 Two dimensional images of dough slices with some cells highlighted and tracked throughout dough proving from 0-145 minutes at 21.5ºC
23.8 mm 24.2 mm 24.2 mm
0 minutes 10 minutes 20 minutes

174
Figure 6.22 Two dimensional images of dough slices with some cells highlighted and tracked throughout dough proving from 0-145 minutes at 21.5ºC
24.2 mm 25.0 mm 26.2 mm
30 minutes 50 minutes 40 minutes

175
Figure 6.23 Two dimensional images of dough slices with some cells highlighted and tracked throughout dough proving from 0-145 minutes at 21.5ºC
28.7 mm
30.2 mm
27.5 mm
60 minutes 80 minutes 70 minutes

176
Figure 6.24 Two dimensional images of dough slices with some cells highlighted and tracked throughout dough proving from 0-145 minutes at 21.5ºC
37.4 mm 35.0 mm
33.1 mm
90 minutes 110 minutes 100 minutes

177
Figure 6.25 Two dimensional images of dough slices with some cells highlighted and tracked throughout dough proving from 0-145 minutes at 21.5ºC
41.9 mm 41.0 mm 39.2 mm
120 minutes 140 minutes 130 minutes

178
Figure 6.26 Two dimensional images of dough slices with some cells highlighted and tracked throughout dough proving from 0-145 minutes at 21.5ºC
41.8 mm
145 minutes

179
Figure 6.27 Surfacegen images showing the volume of the dough (blue) and the cells within it (red) during proving at 0 minutes, 30 minutes, 60 minutes and
140 minutes from left to right
HEIG
HT
12 mm
8 mm
0 minutes 30 minutes 60 minutes 140 minutes TIME
16 mm

180
In Figure 6.22, images of the dough volume following 0, 30, 60 and 140 minutes of proving are
presented. These illustrate how the dough volume changes as a result of its composition.
Coloured in blue is the dough matrix and in red the cells. The figure shows the folds within
the dough and the dough shape clearly and dough sides supported by tubing can be seen
through the shape of the dough piece. The dough volume increases over the images, with the
volume increase largely occurring in height. This is due to the tubing restricting expansion of
the dough in other directions. At 0 minutes and 30 minutes, the number of cells in the dough
allows the depth of the cells to be seen. By 60 minutes the change in dough composition
makes it difficult to identify individual cells in the image and determine their location within
the volume. At 0 minutes, it can be seen that a range of cell shapes and volumes have been
entrained in the dough. On the left hand side of the dough piece there is also an L-shaped
cell. This is likely an envelope of gas formed during mixing that has not had as much breakup
from the mixer blade as the other envelopes of gas. The range in cell sizes and shapes can
also be seen in the figure. The figure also shows that although the dough volume fills up with
gas cells, there are relatively few cells at the edges and in particular at the top of the dough
volume, compared to the centre of the dough piece. There are several possible reasons for
this. Firstly, carbon dioxide molecules are likely to diffuse to nearby cells which are less
likely to be those on the dough edge. Secondly, cells are less likely to occur at the top edge
of the dough due to gravity. Also, because of gravity, cells higher up in the dough will be less
stable, and therefore more likely to rupture. Thirdly and most likely, most commonly, when
gas diffuses to the edge of the dough and in particular the top of the dough when proofed in a
container, the dough matrix between the cell and atmosphere may thin and rupture, enabling
the escape of cells into the atmosphere.
Figure 6.23 shows the cell number density observed in the dough volume at different times
during proving. The graph shows an increase from approximately 20000 cells cm-3 at 0
minutes, to 54000 cells cm-3 at 30 minutes. The number of cells then decreases over the
mixing session to less than 3500 cells cm-3. The increase in observed cells in the first 30
minutes cannot be due to the evolution of more cells. The increase is due to growth of cells
previously below the resolution, as suggested by Figure 6.24 which shows a growth in cell
volume with proving time. Between 0 and 145 minutes the mean cell volume increases by
almost 156 times. As there were a large number of smaller undetected cells, in particular at
earlier stages of proving, the increase in mean cell volume is likely to be underestimated.
Other authors (Babin et al., 2008; Calderón-Domínguez et al., 2008) also found a decrease in
cell number and an increase in mean cell size after longer proving times.
It is likely that the observed cell number density is lower than actual cell number density at
all points, but more accurate at later stages as cells below resolution size interact with large
neighbouring cells, and fewer cells below the resolution size are present. It was expected
that with time, growth of the cells would cause them to coalesce and therefore the cell
number density to decrease. The increase in cell volume over proving is illustrated in Figure
6.24. It shows a significant increase in mean cell volume over time.

181
Figure 6.28 Number density of cells at different times whilst proving at 21.5ºC
Figure 6.29 Mean cell volume at different times whilst proving at 21.5ºC
Figure 6.25 illustrates the cell number density per unit volume at different times during
proving. A reduction in cell number density per unit volume is observed with an increase in
cell volume. This is as expected due to less space being available for larger cells and the
reduced stability of larger cells. Figure 6.24 also shows a change in the cell volume
distribution with time. An increase in the number density of cells per unit volume of the full
range of cell volumes from 0 to 30 minutes is observed. Following this, the number density of
cells per unit volume decreases with time. The former is due to the resolution and growth of
the cells enabling them to be detected at 30 minutes. The decrease in number density of
cells per unit volume observed after 30 minutes is due to cell breakup and coalescence. These
cell mechanics are reflected in the existence of larger cell volumes at 70 and 145 minutes.
With the exception of the number density per unit volume of the cells around the resolution
size the trend in the data sets is as expected.
0
10000
20000
30000
40000
50000
60000
0 25 50 75 100 125 150
Cell d
ensi
ty (
cells
cm
-3)
Proving time (minutes)
1.21x10⁶
2.87x10⁷
1.89x10⁹
8.91x10⁶
1.67x10⁸
6.15x10⁷
0
50000000
100000000
150000000
200000000
0 25 50 75 100 125 150
Mean c
ell v
olu
me (
µm
3)
Proving time (minutes)

182
Figure 6.30 Number density of cells per unit volume at different times whilst proving at
21.5ºC
Figure 6.25 shows the cumulative percentage voidage of the different cell volumes for
different proving times. The data sets at 0 and 30 minutes, and 70 and 145 minutes, share
similarities, a reflection of the resemblance in voidage distribution at these times. At 0 and
30 minutes the voidage is distributed over a similar range of cell volumes. However, at later
stages of proving, gas tends towards larger cells. At 70 minutes less than 4% of the voidage
contribution is from cells smaller than 3x109 µm3, and at 140 minutes the voidage contribution
is less than 1%, compared to 25% at 50 minutes and 100% at 0 minutes. This quantitative data
illustrates how quickly the voidage distribution changes over proving and highlights the timing
at which significant changes in structure occur.
Figures 6.24 and 6.25 illustrate that a large number of cells does not necessarily mean a large
proportion of gas.
Figure 6.31 Cumulative % voidage of different cell volumes at different times whilst proving
at 21.5ºC
1.E-11
1.E-10
1.E-09
1.E-08
1.E-07
1.E-06
1.E-05
1.E-04
1.E-03
1.E-02
1.E-01
1.E+00
5.E+04 5.E+06 5.E+08 5.E+10
Num
ber
densi
ty o
f cells
per
unit
volu
me (
µm
-1 c
m-3
)
Mean cell volume (µm3)
0 minutes
30 minutes
70 minutes
145 minutes
0
10
20
30
40
50
60
70
80
90
100
5.E+04 5.E+06 5.E+08 5.E+10
Cum
ula
tive %
void
age
Mean cell volume (µm3)
0 minutes
30 minutes
40 minutes
50 minutes
70 minutes
145 minutes

183
Figure 6.26 illustrates the change in Feret shape of cells at different proving times. Figure
6.26(a) illustrates how the mean cell Feret shape changes, Figure 6.26(b) illustrates the cell
Feret shape distribution through frequency per unit volume of different cell Feret shapes at
different proving times and Figure 6.26 (c) the Feret shape of cells at different proving times.
Figure 6.26(a) shows that in contrast to literature descriptions (Campbell et al., 1991; Bellido
et al., 2006; Turbin-Orger et al., 2012), cells are on average non-spherical in shape when
entrained. This shows cell volume to be more representative of cell size than cell diameter.
In Figure 6.26(a) an increase in mean Feret shape from 1.59 to 1.91 can be observed, implying
cells become less spherical and more irregular, a result of the increasing interaction of cells
with each other over the proving time. As the shape of the gas cells deviate more from a
sphere, they become less stable, as the forces acting on the cell become more unbalanced.
The restriction to the direction of cell growth created by using a sample container is also
likely to contribute towards the increase in Feret shape observed with time. Figure 6.26(a)
also shows the decrease in the standard deviation of the cell Feret shape with proving time.
The decrease in standard deviation illustrates that as proving time increases, there is less
deviation in cell Feret shape. This is due to coalescence increasing the irregularity of the cell
shapes, making the cells more elongated than the cell shapes entrained during mixing. In
addition, when cells increase in size, it becomes easier for pixels to accurately follow the
circular contours of the cell (Bellido et al., 2006). The number of cells were reduced as
proving time increased. There is a lot of scatter in the data but single factor ANOVA tests
confirm at a 95% confidence level that a significant difference exists between the cell Feret
shapes at different proving times.
In Figure 6.26(b) the frequency per unit volume of groups of Feret shape of a range of 0.5 at
different proving times is illustrated. The range of Feret shapes is smallest at 0 minutes, with
a maximum mean cell Feret shape of 5.75. Literature has found that cell shape becomes less
spherical over the breadmaking process (Babin et al., 2006; Babin et al., 2008). Figure
6.26(b) shows that at the most dynamic times during the proving session, 30-120 minutes, the
maximum cell Feret shape increases to approximately 14.75. The maximum cell Feret shape
at 145 minutes is approximately 10.75. This data point is made up from one cell as
demonstrated in Figure 6.26 (c). This reduction in cell Feret shape late into the proving time
is likely to be due to cells having had more time to reach a stable shape of lower Feret
number or rupturing if unstable. Figure 6.26(b) also shows a greater number of cells with a
smaller Feret shape at the start of the proving session than as proving progresses. This is due
to there being fewer cells as they grow and interact with each other and become less
spherical. As proving time progresses, the number of cells per unit volume decreases and the
likelihood of the presence of cells with a larger Feret shape increases.

184
(a)
(b)
(c)
Figure 6.32(a) Mean Feret shape of cells at different times whilst proving at 21.5ºC. The
data points are the mean of all cells present at the proving time. Error bars are one standard
deviation on either side of the mean. A linear regression line is shown. (b) Feret shape
distribution of cells per unit area at different times whilst proving at 21.5ºC. The mean cell
Feret shape are based on group sizes of 0.5. The volume is the dough volume at the proving
time.(c) Mean cell Feret shape at different times whilst proving at 21.5ºC (c) Feret shape
1.00
1.20
1.40
1.60
1.80
2.00
2.20
2.40
0 50 100 150
Mean c
ell F
ere
t sh
ape
Proving time (minutes)
1.E-04
1.E-03
1.E-02
1.E-01
1.E+00
1.E+01
1.E+02
0 5 10 15
Cell d
ensi
ty (
cells
mm
-3)
Mean cell Feret shape
0 minutes 30 minutes
50 minutes 70 minutes
120 minutes 145 minutes
1
10
100
1000
10000
100000
0 2 4 6 8 10 12 14 16
Fre
quency
Mean cell Feret shape
0 min
30 min
50 min
70 min
120 min
145 min

185
distribution of cells at different times whilst proving at 21.5ºC. The mean cell Feret shape
are based on group sizes of 0.5. The volume is the dough volume at the proving time.(c)
Mean cell Feret shape at different times whilst proving at 21.5ºC
6.5 Summary
Work in this Chapter investigates the cellular structure of dough during mixing and proving,
with variations in the dough formulation, and fits a population balance model to the
measured cell size distributions. This confirmed validity of the model, and thus can be used
to improve the understanding of the dynamics of aeration during bread dough mixing. Cell
volume distribution in bread dough was presented, which is more representative than the 2D
measurements of cell size typically published in academic papers, due to the non-spherical
shape of cells.
To summarise this Chapter’s results, Section 6.2 investigated the cellular structure of dough
with and without sugar. The results agreed with previous chapters, showing the sugared
dough to have a lower voidage, and suggested this may be due to the smaller cell size and
number. This observation is also the likely cause for a lower specific volume and greater
firmness in finished Tweedy loaves, as a sufficient number of cells which are large enough to
inflate must be present. It is likely that the higher disentrainment rates observed in Chapter 5
in sugared doughs and in particular sugared dough made from weak flours are due to a weaker
dough structure, making retention of bubbles more difficult.
In Section 6.3 an investigation was carried out into the dynamics of aeration and the change
in cellular structure of the dough during pressure-vacuum mixing. This is the first time X-ray
CT has been utilised to image changes in an opaque fluid during processing and the results
integrated into a population balance model. The results support the no breakup population
balance model previously reported by Martin et al. (2004a), as a reasonably accurate
representation of the dynamics of aeration in bread dough, and demonstrates the model can
give useful interpretations of the aeration process during pressure step change mixing, using
just dough voidage measurements. In addition, the results found that over time in pressure-
vacuum mixing, there are more cells of a smaller volume. This corresponds to the theory of
pressure-vacuum mixing leading to a fine cell distribution, and due to increased cell breakup
with time during mixing following expansion of cells on drawing a vacuum.
Finally, in Section 6.4, an investigation was carried out into the dough cellular structure
throughout proving. The results showed the potential of a conventional X-ray source in
monitoring in-situ changes in the dough. Cell volume, shape, number and dough voidage were
monitored using sample volumes larger than those in comparable studies (Babin et al., 2006;
2008; Turbin-Orger et al., 2012), therefore allowing larger cells to form and be detected, and
giving more representative quantitative data. This technique would be useful for monitoring
the proving of yeasted bakery products to obtain the optimum proving time for the desired
dough structure.

186
The three experiments in this Chapter illustrate the potential of X-ray CT in accurately
determining dough voidage and illustrate a small proportion of the range of information that
can be obtained on the cellular structure of dough using the technique.
The methodology developed from the conventional X-ray source obtained voxel resolutions
greater than published work on dough samples imaged via X-ray CT and comparable to
synchrotron X-ray sources. A 4D scan of proving dough, however, illustrated that the
resolution was not high enough to detect all cells. This highlighted the incredibly small size of
entrained cells and suggests that obtaining the cell size distribution via X-ray CT cannot get
more accurate if representative dough samples are to be used.
The developed methodology illustrated that although it is known that synchrotron X-rays can
obtain superior images to conventional X-ray sources, it is possible to image bread dough to a
quality capable of obtaining accurate voidages, and that both 3D and 4D information could be
obtained using conventional X-ray sources. Experimental work using a conventional X-ray
source has some advantages over experimental work carried out on synchrotron beamlines.
These include decreased set up time and costs, and increased availability.

187
Chapter 7 - Conclusions and further work
7.1 Conclusions
This thesis has investigated the effect of sugar on the aeration of bread dough, assessed the
validity of an existing simplified population balance model of bread dough aeration and
demonstrated the suitability of a non-synchrontron X-ray source to accurately investigate the
microstructure of bread dough in both 3D and 4D processes. A literature review was first
presented, discussing the significance of bread, its key ingredients, how it is made industrially
and aeration during breadmaking. As the cells in bread are the subject of this thesis, how
they are formed and how they change throughout the breadmaking process were explained,
alongside a summary of published methods on investigating bread dough aeration.
Little work has been published on the effect of sugar on bread dough aeration, yet sugar
containing breads make up a large proportion of the bread market, and a better
understanding of its effect on bread will widen the opportunity for product development. The
results show that extension of the industrial methodologies used on non-sugar containing
formulations to sugared formulations was detrimental to the quality parameters of bread
dough and bread, producing products with undesirable qualities and therefore that would be
difficult to market. The presence of sugar changed dough aeration during mixing, by reducing
the steady state voidage and increasing the gas free dough density, as a result of greater
disentrainment during mixing. This is likely to be due to the weaker gluten structure within
the dough, as reflected by the lower elasticity of sugared doughs. Assessment of a sugared
dough found it contained fewer and smaller cells following mixing, compared to a non-
sugared dough. This is likely to be responsible for the increase in specific volume and firmness
of bread. Sugar was also found to increase dough proving time, most likely due to the osmotic
stress applied to yeast, hence use of different strains of yeast worldwide depending on the
type of bread being made. The results suggested that dual pressure and in particular
pressure-vacuum mixing of sugared doughs would not produce bread dough with a finer cell
distribution, but instead produce denser dough. Dense bread is perceived by consumers as
undesirable.
X-ray CT was used to measure voidage and obtain cell size distribution throughout dough
samples. Voidage is important as it is a measure of how much gas is in the dough and
therefore its volume. Cell size distribution is important as these determine the quality
parameters in a loaf, and can be the difference in texture between rye bread and UK
sandwich bread. A comparison of the dough voidage obtained through X-ray CT and the
established double cup method found X-ray CT to produce reliable although less convenient
voidage measurements. The X-ray set up enabled the generation of high resolution and
contrast images, easing the dough segmentation process using digital image analysis. This
technique provides images non-invasively and can be utilised for future analysis of bread
dough microstructure, helping understand the link between ingredients and processing, the
structure and quality parameters.

188
In Section 6.2 pressure-vacuum mixing was shown to lead to a finer cell distribution, and the
decrease in number density following pressure-vacuum mixing was found to be much more
short-lived than the decrease in size, which was permanent. Cumulative voidage data was
fitted to the simplified no breakup population balance model of aeration. The simplified
model and experimental results showed good agreement, reflecting the robustness of the
model. The model can be applied using only voidage data, making it useful for providing
interpretations of the aeration process.
Having established a method of viewing the internal structure of bread dough, this method
was utilised again to view the microstructure of bread dough during proving. Quantitative
information and images of the dough were generated to get a full picture of the dough
proving process, from immediately after mixing to the levelling off of cell proportion and
volume. An increase in cell number over the first 0.5 hour of proving was found. This
highlighted an insufficient resolution size for detection of all cells, and indicated the large
range of cell nucleation volumes. Results showed an increased in both dough and cell volume,
increase in cell Feret shape, and increase in dough voidage throughout the process.
Chapter 6 illustrated the potential of X-ray CT in monitoring both static and dynamic changes
in dough structure, and discussed advantages of its use over synchrotron.
7.2 Further work
Investigations of the effect of sugar in bread highlighted the detrimental effects of simply
extending existing methodologies from non-sugar containing formulations to sugar containing
formulations, in particular in terms of loaf aeration. It also suggested the presence of
insufficient water prevented optimal development of sugared doughs. It would be interesting
to investigate the effect of sugar on optimally developed doughs. This would require
adjusting the water content according to the quantity of sugar present and determining the
quantity of work required to develop each dough, and mixing to this work input. ESEM
micrographs should be used to confirm development of the gluten matrix. Working through
each stage of the breadmaking process, from mixing to proving to baking, each process should
be optimised for each dough to determine if use of the CBP would be feasible for the
production of a high quality sweetened bread product. Optimisation of each stage would
involve assessment of key quality parameters at that stage. Quality parameters would include
product appearance (colour, volume, shape), cell volume distribution and eating qualities
(firmness, resilience, flavour). It would be useful to measure a number of quality parameters
throughout the process and determine if a quantity of sugar exists whereby the negative
effects on quality are no longer acceptable. The negative effects should be monitored both
experimentally and subjectively, as detection thresholds will vary between humans and
machinery. Subjective methods would involve consumer panels. It is important that the
flavour of bread, especially in terms of sweetness is assessed subjectively, as although it may
be possible to process bread with 40% sugar for example, this may not be a desirable product.
In addition, preferences vary across individuals.

189
This thesis assessed the effect of sugar on bread dough and bread through measuring a range
of parameters throughout the breadmaking process. The sugar used was in solid form, and as
noted in Section 4.4, during the mixing process, the sugar first dissolves into the water to
form a syrup, which is mixed with the other ingredients to form a solid mass. If a liquid sugar
was used, this should be a more efficient process, as dissolving the sugar is not necessary.
Solid sugar is also abrasive, and could damage the starch in the dough, increasing the dough’s
necessary water absorption for development. It would be interesting to compare the
differences in the processing of sweetened bread using both a solid and liquid sugar. It is
hypothesised that both would produce a denser dough and loaf, when added in certain
quantities in certain dough formulations. However, the production of sweetened breads
through using a liquid sugar, compensating for increased water levels by reducing quantities
of water would be more practical industrially and produce better quality loaves due to lower
levels of starch damage (Cauvain and Young, 2004) Quality indicators associated with
increased levels of starch damage include larger cell sizes and greying of the dough matrix.
As artificial sweeteners are generally sweeter than sucrose, less of it would be required to
sweeten breads. Its use as an ingredient in bread could be investigated as an alternative to
sugar. Natural sweeteners, such as agave syrup and honey, could also be investigated. An
interesting natural sweetener to investigate in sweetened breads would be the calorie free
leaves of the stevia plant. Stevia is 250-300 times sweeter than sucrose (Food Standards
Agency, 2013) so only a small amount of the product would be required, and it is
hypothesized that the detrimental effects on the quality of bread would not be observed with
the addition of finely ground leaves. It can be expected that bread’s appearance may take on
a hint of green, depending on the quantity added. Although green bread is associated with
mouldy bread, if marketed cleverly, a light green bread can be desirable, as seen in oriental
countries where green tea bread is popular. However, although stevia is accepted, widely
used and available in numerous countries worldwide, in the UK its use and to specified levels
only is currently limited only to certain foods by law.
This thesis detailed a non-invasive and non-destructive method to investigate dough cellular
structure dynamically. To obtain a more detailed and accurate picture of dough
microstructure, it is important to ensure all the cells are detected. To complete this task X-
ray CT of bread dough on the nanometre scale could be combined with X-ray CT on the
micrometre scale, using two pieces of X-ray equipment. This is a challenging task as detection
of smaller cells generally requires the use of smaller samples, which reduces the
representativeness of the sample. However, it would determine the smallest cell nucleation
volume and the minimum cell volume for growth, two parameters which could not be
determined from this work, and are not known.
In the X-ray proving experiment, the results showed the dough to be overproved, but not to
the extent that a significant proportion of the cells had begun to collapse and reduce its
voidage. Although over proving is not desirable or beneficial in breadmaking, it would have

190
been interesting to capture how the cells collapse, and whether the collapse of a large cell
would lead to an onset of cell collapse from surrounding cells.
Further work should include completion of the cell tracking. This would enable one to
determine with confidence if disproportionation, a process disputed amongst some leading in
the field, occurs within cells. Development of the fast reconstruction algorithm should also be
completed to hasten the time consuming reconstruction process. The quality of results from
the different dough proving data sets obtained via X-ray CT can then be compared.

191
Chapter 8 - References
Anonymous, 1996a. ‘Yeast characteristics’, Lallemand Baking update, 1 (3)
Anonymous, 1996b. ‘Yeast activation on a water brew’, Lallemand Baking Update, 1 (19)
Anonymous, 1996c, ‘Continuous mix’, Lallemand Baking Update, 2 (2)
Anonymous, 2012. ‘Facts about bread in the UK’, Flour advisory bureau, accessed 27
September 2012, from
<http://www.fabflour.co.uk/content/1/31/facts-about-bread-in-the-uk.html>
Anonymous, 2010a. ‘Free trade, charitism and the anti-corn law league’, Manchester UK,
accessed 23 March 2010, from
<http://www.manchester2002-uk.com/history/victorian/Victorian2.html>
Anonymous, 2010b. ‘Factsheet No. 3 The British Bakery market’, accessed 25 February 2013,
from
<http://www.bakersfederation.org.uk/images/pdfs/media-and-resources/the-british-bakery-
market.pdf>
Anonymous, 2012a. ‘About the bread industry’, Federation of bakers, accessed 27 September
2012, from
<http://www.bakersfederation.org.uk/the-bread-industry/about-the-bread-industry.html>
Anonymous, 2012b. ‘Medieval times’, Federation of bakers, accessed 21 November 2012, from
<http://www.bakersfederation.org.uk/the-bread-industry/history-of-bread/medieval-
times.html
Anonymous, 2012c. ‘Factsheet No. 7 How bread is made’, Federation of bakers, accessed 22
November 2012, from
<http://www.bakersfederation.org.uk/images/pdfs/the-bread-industry/how-bread-is-
made.pdf>
Anonymous, 2012d. ‘About the eatwell plate’, Department of health, accessed 20 November
2012, from
<http://www.dh.gov.uk/health/2012/06/about-the-eatwell-plate/>
Anonymous, 2013a. ‘Steviol glycosides’, Food Standards Agency, accessed 12 February 2013,
from
<http://www.food.gov.uk/policy-advice/additivesbranch/stevia#.URoatWc01cA>
Anonymous, 2013b. ‘Market snapshot’, Federation of Bakers, accessed 25 February 2013, from
<http://www.bakersfederation.org.uk/the-bread-industry/industry-facts/2012-01-23-15-53-
01.html>

192
Anonymous, 2013c. ‘Water activity in food’, Dairy Research and Information Centre,
University of California, David, accessed 12 March 2013, from
< http://drinc.ucdavis.edu/dairychem4_new.htm>
Babin P., Della Valle G., Chiron H., Cloetens P., Hoszowska J., Pernot P., Réguerre A.L., Salvo
L., Dendievel R., 2006. Fast X-ray tomography analysis of cell growth and foam setting during
breadmaking, Journal of Cereal Science, 43, pp. 393-397
Babin P., Della Valle G., Chiron H., Cloetens P., Hoszowska J., Pernot P., Réguerre A.L., Salvo
L., Dendievel R., 2008. In situ fast X-ray tomography study of the evolution of cellular
structure in bread dough during proving and baking, in G.M. Campbell, M.G. Scanlon, and D.L.
Pyle (eds.), Cells in Food 2 Novelty, Health and Luxury, Eagan press, USA, pp. 265-272
Baker J.C., Mize M.D., 1937. Mixing doughs in vacuum and in the presence of various gases,
Cereal Chemistry, 14, pp. 721-734
Baker J.C., Mize M.D., 1941. Origin of the gas cell, Cereal Chemistry, 18, pp. 19-34
Baker J.C., 1941. The structure of the gas cell in bread dough, Cereal Chemistry, 18, pp. 34-
41
Baker J.C., Mize M.D., 1946. Gas occlusion during dough mixing, Cereal Chemistry, 23, pp.
39-51
Belitz H.D., Grosch W., Schieberle P., 2004. Food Chemistry, Springer-Verlag Berlin
Heidelberg New York, pp. 320, 712-743, 862
Bellido G.G., Scanlon M.G., Page J.H., Hallgrimmson B., 2006. The cell size distribution in
wheat flour dough, Food Research International, 39, pp. 1058-1066
Bellido G.G., Scanlon M.G., Page J.H., 2009. Measurement of dough specific volume in
chemically leavened systems, Journal of Cereal Science, 49, pp. 212-218
Blythman J., 2007, ‘Why home-baked is best’, Guardian, accessed 23 March 2010, from
< http://www.guardian.co.uk/lifeandstyle/2007/nov/24/foodanddrink.baking2>
Calderón-Domínguez G., Neyra-Guevara M., Farrera-Rebollo R., Arana-Erasquin R., Mora-
Escobedo R., 2003. Structural and farinographic changes during mixing of a yeast sweet
dough, Nahrung, 47, pp. 312-319
Calderón-Domínguez G., Chanona-Pérez J., Ramos-Cruz A.L., López-Lara I., Tlapale-Valdivia
A.D., Gutiérrez-López G.F., 2008. Fractal and image analysis of Mexican sweet bread cell
distribution: Influence of fermentation and mixing time, in G.M. Campbell, M.G. Scanlon, and
D.L. Pyle (eds.), Cells in Food 2 Novelty, Health and Luxury, Eagan press, USA, pp. 73-81
Campbell G.M., 1991. The aeration of bread dough during mixing, PhD Thesis, University of
Cambridge, UK

193
Campbell G.M., Rielly C.D., Fryer P.J., Sadd P.A., 1991. The measurement of cell size
distributions in an opaque food fluid, TransIChemE, 69 (C), pp. 67-76
Campbell G.M., Rielly C.D., Fryer P.J., Sadd P.A., 1993. Measurement and interpretation of
dough densities, Cereal Chemistry, 70 (5), pp. 517-521
Campbell G.M., Rielly C.D., Fryer P.J., Sadd P.A., 1998. Aeration of bread dough during
mixing: effect of mixing dough at a reduced pressure, Cereal Foods World, 43 (3), pp. 163-
167
Campbell G.M., Shah P., 1999. Entrainment and disentrainment of air during bread dough
mixing, and their effect on scale-up of dough mixers, in G.M. Campbell, C. Webb, S.S.
Pandiella and K. Niranjan (eds.), Cells in Food, Eagan press, USA, pp. 11-20
Campbell G.M., Mougeot E., 1999. Creation and characterisation of aerated food products,
Trends in Food Science and Technology, 10, pp. 283-296
Campbell G.M., Herrero-Sanchez R., Payo-Rodriguez R., Merchan M.L., 2001. Measurement of
dynamic dough density and effect of surfactants and flour type on aeration during mixing and
gas retention during proofing, Cereal Chemistry, 78 (3), pp. 272-277
Campbell G.M., Herrero-Sanchez R., 2001. Cell growth during proving of bread dough:
simulation and experimental validation of the effect of proving temperature, Proceedings of
6th World Congress of Chemical Engineering, University of Melbourne, Melbourne, Austrialia
Campbell G.M., Ross M., Motoi L., 2008a. Bran in bread: Effects of particle size and level of
wheat and oat bran on mixing, proving and baking, in G.M. Campbell, M.G. Scanlon, and D.L.
Pyle (eds.), Cells in Food 2 Novelty, Health and Luxury, Eagan press, USA, pp. 337-354
Campbell G.M., Koh K.C., Keung Y.M., Morgenstern M.P., 2008b. Effect of wheat bran particle
size on aeration of bread dough during mixing, in G.M. Campbell, M.G. Scanlon, and D.L. Pyle
(eds.), Cells in Food 2 Novelty, Health and Luxury, Eagan press, USA, pp. 355-368
Campbell G.M., Martin P.J., 2012. Bread Aeration and dough rheology: an introduction, in
S.P. Cauvain (eds.), Breadmaking improving quality (2nd edition), Woodhead publishing,
Cambridge, UK, pp. 299-336
Campbell G.M., Webb C., Owens G.W., 2012. Milling and flour quality, in S. Cauvain (eds.),
Breadmaking Improving Quality (2nd edition), Woodhead Publishing, Cambridge, UK, pp. 188-
215
Carlson T., Bohlin L., 1978. Free surface energy in the elasticity of wheat flour dough, Cereal
Chemistry, 55, pp. 539-544
Carlson H.N., Degn H., Lloyd D., 1991. Effect of alcohols on the respiration and fermentation
of aerated suspensions of baker’s yeast, Journal of General Microbiology, 137, pp. 2879-2883

194
Casenave C., Dochain D., Alvarez G., Benkhelifa H., Flick D., Leducq D., 2012. Steady-state
and stability analysis of a population balance based non-linear ice cream crystallisation
model, 2012 American Control Conference, Fairmont Queen Elizabeth, Montréal, Canada, pp.
6461-6466
Cauvain S. P., Whitworth M. B., Alava, J. B., 1999. The evolution of cell structure in bread
doughs and its effect on bread structure in G.M. Campbell, C.Webb, S.S. Pandiella and
K.Niranjan (eds.), Cells in Food, Eagan press, USA, pp. 85-88
Cauvain S.P., 2000. It’s got form, European Baker, 38, pp. 24-28
Cauvain S.P., Young L.S., 2004. Baking Problems Solved, Woodhead Publishing Limited,
Abington, Cambridge, UK, pp. 25
Cauvain S.P., Young L.S., 2006. The Chorleywood Bread Process, Woodhead Publishing
Limited, Abington, Cambridge, UK.
Cauvain S.P., 2012. Breadmaking: An overview, in S.P. Cauvain (eds.), Breadmaking improving
quality, 2nd edition, Woodhead publishing, Cambridge, UK, pp. 9-29
Chamberlain N., Collins T.H., 1979. The Chorleywood Bread Process: The roles of oxygen and
nitrogen, The Bakers Digest, 53, pp. 18-24
Charalambides M.N., Wanigasooriya L., William J.G., S.M. Goh, Chakrabati S., 2006. Large
deformation extensional rheology of bread dough, Rheologica Acta, 46 (2), pp. 239-248
Chin N.L., 2003, Bread dough aeration and rheology during mixing, PhD Thesis, University of
Manchester, UK
Chin N.L., Martin P.J, Campbell G.M., 2004. Aeration during bread dough mixing I. Effect of
direction and size of a pressure step change during mixing on the turnover of gas, Food and
Bioproducts Processing, 82 (C4), pp. 261-267
Chin N.L., Campbell G.M., Thompson F., 2005. Characterisation of bread doughs with
different densities, salt contents and water levels using microwave power transmission
measurements, Journal of Food Engineering, 70, pp. 211-217
Chin N.L., Campbell G.M., 2005a. Dough aeration and rheology: part 1. Effects of mixing
speed and headspace pressure on mechanical development of bread dough, Journal of the
Science of Food and Agriculture, 85, pp. 2184-2193
Chin N.L., Campbell G.M., 2005b. Dough aeration and rheology: part 2. Effects of flour type,
mixing speed and total work input on dough aeration and rheology of bread dough, Journal of
the Science of Food and Agriculture, 85, pp. 2194-2202

195
Chin N.L., Tan L.H., Yusof Y.A., Rahman R.A., 2009. Relationship between aeration and
rheology of breads, Journal of Texture Studies, 40, pp. 727-738
Chiotellis E., Campbell G.M., 2003. Proving of bread dough II Measurement of gas production
and retention, Institution of Chemical Engineers, 81 (C), pp. 207-216
Crane B., ‘Ask a scientist – solids, liquids and something inbetween’, Cornell Centre for
Materials Research, accessed 16 January 2012, from
<http://www.ccmr.cornell.edu/education/ask/index.html?quid=14>
Czuchajowska Z., Pomeranz Y., Jeffers H.C., 1989. Water activity and moisture content of
dough and bread, Cereal Chemistry, 66 (2), pp. 128-132
Dalen G.V., 2012. A study of bubbles in food by X-ray tomography and image analysis,
Microscopy and Analysis, 26 (2), pp. S8-S12
Daubert C.T., Foegeding E.A., 2003. Rheological principles for food analysis, in S.S. Nielsen,
Food Analysis, 3rd Edition, Kluwer Academic/Plenum Publishers, New York, pp. 503-516
Davidson A., 2006, The Oxford companion to food, Oxford University Press Inc, New York, pp.
96-102
Dobraszczyk B.J., Campbell G.M., Gan Z., 2001. Bread – a unique food, in B.J. Dobraszczyk
and D.A.V. Dendy, (eds.), Cereals and Cereal Products: Technology and Chemistry, Aspen
Publishers, USA, pp. 182-232
Dobraszczyk B.J., Smewing J., Albertini M., Maesmans G., Schofield J.D., 2003. Extensional
rheology and stability of gas cell walls in bread doughs at elevated temperatures in relation
to breadmaking performance, American Association of Cereal Chemists, 80 (20), pp. 218-224
Dobraszczyk B.J., Salmanowicz B.P., 2008. Comparison of predictions of baking volume using
large deformation rheological properties, Journal of Cereal Science, 47, pp. 292-301
Dürrenburger M.B., Handschin S., Conde-Petit B., Escher F., 2001. Visualization of food
structure by confocal laser scanning microscopy (CLSM), Lebensmittel-Wissenschaft und-
Technologie, 34, pp. 11-17
Elmehdi H.M., Page J.H., Scanlon M.G., 2003. Monitoring dough fermentation using acoustic
waves, Institution of Chemical Engineers, 81 (C), pp. 217-223
Falcone P.M., Baiano A., Zanini F., Mancuni L., Tromba G., Dreossi D., Montari F., Scuor N.,
Del Nobile M.A., 2005. Three-dimensional quantitative analysis of bread crumb by X-ray
microtomography, Food Engineering and Physical Properties, 70 (3), pp. 265-272
Falcone P.M., Baiano A., Conte M., Mancini L., Tromba G., Zanini F., Del Nobile M.A., 2006.
Imaging techniques for the study of food microstructure: a review, Advances in Food and
Nutrition Research, 51, pp. 205-263

196
Frisullo P., Laverse J., Marino R., Del Nobile N.A., 2009. X-ray computed tomography to study
processed meat microstructure, Journal of Food Engineering, 94, pp. 283-289
Frisullo P., Lacciardello F., Muratore G., Del Nobile N.A., 2010. Microstructural
characterisation of multiphase chocolate using X-ray microtomography, Journal of Food
Science, 75 (7), pp. 469-476
Gan Z., Ellis P.R., Schofield J.D., 1995. Mini review gas cell stabilisation and gas retention in
wheat bread dough, Journal of Cereal Science, 21, pp. 215-230
Grenier A., Lucas T., Collewet G., Le Bail A., 2003. Assessment by MRI of local porosity in
dough during proving. Theoretical considerations and experimental validation using a spin-
echo sequence, Magnetic Resonance Imaging, 21, pp. 1071-1086
Gujral H.S., Singh N., 1999. Effect of additives on dough development, gaseous release and
breadmaking properties, Food Research International, 32, pp. 691-697
Guio F.D., Musse M., Benoit-Cattin H., Lucas T., Davenel A., 2009. Magnetic resonance
imaging method based on magnetic susceptibility effects to estimate cell size in alveolar
products: Application to bread dough during proving, Magnetic Resonance Imaging, 27, pp.
577-585
Hirning J., 2010. The significance of salt in bread dough processing, and compensating the
effects of reduced salt levels by use of a novel dough additive, Masters dissertation,
University of Manchester, UK
Hoseney R.C., 1985. The mixing phenomenon, Cereal Foods World, 30 (7), pp. 453-457
Huang H., Kokini J.L., 1999. Prediction of dough volume development which considers the
biaxial extensional growth of cells, in G.M. Campbell, C. Webb, S.S. Pandiella and K. Niranjan
(eds.), Cells in Food, Eagan press, USA, pp. 113-119
Jang W., Nikolov A., Wasan D.T., Chen, K., Campbell, B., 2005. Prediction of the cell size
distribution during aeration of food products, Industrial and Engineering Chemistry Research
44, pp. 1296-1308.
Jones T., 2012. ‘The great British bake graph! Trend timeline reveals how our love of home
baking has risen and flopped each decade since the 1900s (and we are now baking more than
ever)’, Mail Online, accessed 4 January 2013, from
<http://www.dailymail.co.uk/femail/article-2218486/The-Great-British-Bake-Graph-Trend-
timeline-reveals-love-home-baking-risen-flopped-decade-1900s-baking-EVER.html>
Junge R.C., Hoseney R.C., Varriano-Marston E., 1981. Effect of surfactants on air
incorporation in dough and the crumb grain of bread, Cereal Chemistry, 58, pp. 338-342
Kim C.S., Walker C.E., 1992. Interactions between starches, sugars and emulsifiers in high-
ratio cake model systems, Cereal Chemistry, 69 (2), pp. 206-212

197
Kilborn R.H., Tipples K.H., 1972. Factors affecting mechanical dough development. I. Effect
of mixing intensity and work input, American Association of Cereal Chemists, 49, pp. 34-47
Ktenioudaki A., Butler F., Gonzales-Barron U., Mc Carthy U., Gallagher E., 2009. Monitoring
the dynamic dough density of wheat dough during fermentation, Journal of Food Engineering,
95 (2), pp. 332-338
Le-Bail A., Grenier A., Hayert M., Davenel A., Lucas T., 2008. Impact of freezing rate of bread
dough on dough expansion during fermentation. Use of MRI to assess local porosity, in G.M.
Campbell, M.G. Scanlon, and D.L. Pyle (eds.), Cells in Food 2 Novelty, Health and Luxury,
Eagan press, USA, pp. 231-239
Leroy V., Fan Y., Strybulevych A.L., Bellido G.G., Page J.H., Scanlon M.G., 2008. Investigating
the cell size distribution in dough using ultrasound, in G.M. Campbell, M.G. Scanlon, and D.L.
Pyle (eds.), Cells in Food 2 Novelty, Health and Luxury, Eagan press, USA, pp. 51-61
Li W., Dobraszczyk B.J., Wilde P.J., 2004. Surface properties and locations of gluten proteins
and lipids revealed using confocal scanning laser microscopy in bread dough, Journal of
Cereal Science, 39, pp. 403-411
Lim K.S., Barigou M., 2004. X-ray micro-computed tomography of cellular food products, Food
Research International, 37 (10), pp. 1001-1012
MacRitchie F., Gras P.W, 1973. The role of flour lipids in baking, Cereal Chemistry, 50, pp.
292-302
Martin P.J., Chin N.L, Campbell G.M., 2004a. Aeration during bread dough mixing II: a
population balance model of aeration. Food and Bioproducts Processing, 82 (C4), pp. 268-281
Martin P.J., Chin N.L., Campbell G.M., Morrant C.J., 2004b. Aeration during bread dough
mixing III. Effect of scale up. Food and Bioproducts Processing, 82 (4), pp. 282-290
Martin P.J., Tassell A., Wiktorowicz R., Morrant C.J., Campbell G.M., 2008, Mixing bread
doughs under highly soluble gas atmospheres and the effects on bread crumb texture:
Experimental results and theoretical interpretation, in G.M. Campbell, M.G. Scanlon, and D.L.
Pyle (eds.), Cells in Food 2 Novelty, Health and Luxury, Eagan press, USA, pp. 197-206
McGee H., 2004, McGee on food and cooking, Hodder & Stoughton, London, pp. 516-550
Miraeedghazi H., Emam-Djomeh Z., Mousavi S.Y.A., 2008. Rheometric measurement of dough
rheological characteristics and factors affecting it, International Journal of Agriculture and
Biology, 10, pp. 112-119
Mousia Z., Campbell G.M., Pandiella S.S., Webb C. Effect of fat level, mixing pressure and
temperature on dough expansion capacity during proving, Journal of Cereal Science, 46 (2),
pp. 139-147

198
Pareyt B., Finnie S.M., Putseys J.A., Delcour J.A., 2011. Lipids in bread making: Sources,
interactions and impact on bread quality, Journal of Cereal Science, 54 (3), pp. 266-279
Peighambardoust S.H., Fallah E., Hamer R.J., van der Goot A.J., 2010. Aeration of bread
dough influenced by different way of processing, Journal of Cereal Science, 51 (1), pp. 89-95
Pennington N.L., Baker C.W., 1990. SUGAR A users guide to sucrose, Van Nostrand Reinhold,
New York, USA, pp. 168
Pérez-Nieto A., Chanona-Pérez J.J., Farrera-Rebollo R.R., Gutierréz-López G.F., Alamilla-
Beltrán L., Calderón-Domínguez G., 2010, Image analysis of structural changes during baking,
Food Science and Technology, 43, pp. 535-543
Räsänen J., Laurikainen T., Autio K., 1997. Fermentation stability and pore size distribution
of frozen prefermented lean wheat doughs, Cereal Chemistry, 74 (1), pp. 56-62
Ruddick G., 2012. ‘Britain’s bread industry turns stale’, Telegraph, accessed 25 February
2013, from
<http://www.telegraph.co.uk/finance/newsbysector/retailandconsumer/9717321/Britains-
bread-industry-turns-stale.html>
Sapirstein H. D., 1999. The imaging and measurement of cells in bread, in G.M. Campbell, C.
Webb, S.S. Pandiella and K. Niranjan (eds.), Cells in Food, Eagan press, USA, pp. 233-243
Scanlon M.G., Elmehdi H.M., Leroy V., Page J.H., 2008. Using ultrasound to probe nucleation
and growth of cells in bread dough and to examine the resulting cellular structure of bread
crumb, in G.M. Campbell, M.G. Scanlon, and D.L. Pyle (eds.), Cells in Food 2 Novelty, Health
and Luxury, Eagan press, USA, pp. 217-230
Shah P., Campbell G.M., McKee S.L., Rielly C.D., 1998. Proving of bread dough: modelling the
growth of individual bubbles, Food and Bioproducts Processing, 76, pp. 73-79
Shah P., Campbell G.M., Dale C., Rudder A., 1999. Modelling cell growth during proving of
bread dough: predicting the output from the chopin rheofermentometer, in G.M. Campbell,
C. Webb, S.S. Pandiella and K. Niranjan (eds.), Cells in Food, Eagan press, USA, pp. 95-106
Sheehy C., McNeil G., Masson L., Craig L., Macdiarmid J., Holmes B., Nelson M., 2008, ‘Survey
of sugar intake among children in Scotland’, Food Standards Agency, accessed 29 April 2013
from,
<http://www.food.gov.uk/multimedia/pdfs/publication/surveyofsugarscotland0308.pdf>
Shehzad A., Chiron H., Della Valle G., Kansou K., Ndiaye A., Réguerre A.L., 2010. Porosity and
stability of bread dough during proofing determined by video image analysis for different
compositions and mixing conditions, Food Research International, 43, pp. 1999-2005

199
Shimiya Y., Nakamura K., 1997. Changes in size of gas cells in dough and bread during
breadmaking and calculation of critical size of gas cells that expand, Journal of Texture
Studies, 28, pp. 273-288
Skaf A., Nassar G., Lefebvre F., Nongaillard B., 2009. A new acoustic technique to monitor
bread dough during the fermentation phase, Journal of Food Engineering, 93, pp. 365-378
Sonoma W., 2008, A Taste of the World, Gold Street Press, San Francisco, pp.16-19
Spaull S., Bruce-Gardyne L., 2003. Leith’s technique bible, Bloomsberry Publishing Plc.,
London, pp. 117-126
Spies R., 1997, Application of rheology in the bread industry, in H. Faridi and J.M. Faubion
(eds.), Dough Rheology and Baked Product Texture, CBS Press, Huston, USA, pp. 343-361
Sroan B.S., MacRitchie F., 2008. Mechanism of gas cell stability in breadmaking, in G.M.
Campbell, M.G. Scanlon, D.L. Pyle, K. Niranjan (eds.), Cells in Food 2 Novelty, Health and
Luxury, Eagan press, USA, pp. 299-306
Sroan B.S., Bean S.R., MacRitchie F., 2009. Mechanism of gas cell stabilization in
breadmaking. I. The primary gluten-starch matrix, Journal of Cereal Science, 49, pp. 32-40
Tlapale-Vladivia A.D., Chanona-Pérez J., Mora-Escobedo R., Farrera-Rebollo R.R., Gutiérrez-
Lopez G.F., Calderón-Domínguez G., 2010. Dough and crumb grain changes during mixing and
fermentation and their relation with extension properties and bread quality of yeasted sweet
dough, International Journal of Food Science and Technology, 45, pp. 530-539
Turbin-Orger A., Boller E., Chaunier L., Chiron H., Della Valle G., Réguerre A.-L., 2012.
Kinetics of cell growth in wheat flour dough during proofing studied by computed X-ray micro-
tomography, Journal of Cereal Science, 56, pp. 676-683
Upadhyay R., Ghosal D., Mehra A., 2012. Characterisation of bread dough: Rheological
properties and microstructure, Journal of Food Engineering, 109, pp. 104-113
Vliet T.V., Janssen A.M., Bloksma A.H., Walstra P., 1992. Strain hardening of dough as a
requirement for gas retention, Journal of Texture Studies, 23, pp. 439-460
Vliet T.V., 1999. Physical factors determining gas cell stability in a dough during bread
making, in G.M. Campbell, C. Webb, S.S. Pandiella and K. Niranjan (eds.), Cells in Food,
Eagan press, USA, pp. 121-127
Wagner M., Quellec S., Trystram G., Lucas T., 2008a. MRI evaluation of local expansion in
bread crumb during baking, Journal of Cereal Science, 48, pp. 213-223
Wagner M.J., Loubat M., Sommier A., Ray D.L., Collewet G., broyart B., Quinard Ho., Davenel
A., Tystam G., Lucas T., 2008b. MRI study of bread baking: experimental device and MRI
signal analysis, International Journal of Food Science and Techonology, 43, pp. 1129-1139

200
Whitworth M.B., Alava J.M., 1999. The imaging and measurement of cells in bread doughs, in
G.M. Campbell, C. Webb, S.S. Pandiella and K. Niranjan (eds.), Cells in Food, Eagan press,
USA, pp. 221-231
Whitworth M.B., 2008. X-ray tomography of structure formation in bread and cakes during
baking, in G.M. Campbell, M.G. Scanlon, D.L. Pyle, K. Niranjan (eds.), Cells in Food 2
Novelty, Health and Luxury, Eagan press, USA, pp. 273-285
Williams T., Pullen G., 2007. Functional ingredients, in S.P. Cauvain, L. Young (eds.),
Technology of breadmaking, Springer, New York, USA, pp. 51-91
Xu J., Bietz J. A., Carriere C. J., 2007. Viscoelastic properties of wheat gliadin and glutenin
suspensions, Food Chemistry, 101, pp. 1025-1030
Zhang L., Lucas T., Doursat C., Flick D., Wagner M., 2007. Effects of crust constraints on
bread expansion and CO2 release, Journal of Food Engineering, 80, pp. 1302-1311
Zhang L., Lucas T., Doursat C., Flick D., Le Ray D., 2008. CO2 release during baking as a
response parameter for monitoring the cell opening, in G.M. Campbell, M.G. Scanlon, D.L.
Pyle, K. Niranjan (eds.), Cells in Food 2 Novelty, Health and Luxury, Eagan press, USA, pp.
287-297
Zhgal M.C., Scanlon M.G., Sapirstein H.D., 1999. Prediction of bread crumb density by digital
image analysis, Cereal Chemistry, 76 (5), pp. 734-742
Zounis S., Quail K.J., 1997. Predicting test bakery requirements from laboratory mixing tests,
Journal of Cereal Science, 25, pp. 185-196

201
Chapter 9 - Appendices
Chapter 4, Section 4.10: Sugar content of strong flour doughs and proving time ANOVA: Single Factor SUMMARY – strong dough proving time
Groups Count Sum Average Variance
Column 1 4 19150 4787.499 194826.4
Column 2 4 18429.99 4607.498 186896.6 Column 3 4 20720 5179.999 315335.6 Column 4 4 26750 6687.499 101625.3
Column 5 4 29180 7295 1299355
ANOVA
Source of Variation SS df MS F P-value F crit
Between Groups 23260
550 4 5815138 13.85851 6.33E-05 3.055568
Within Groups 62941
17 15 419607.8
Total
29554667 19
Chapter 4, Section 4.10: Sugar content of weak flour doughs and proving time ANOVA: Single Factor
SUMMARY – weak dough proving time
Groups Count Sum Average Variance
Column 1 4 18050 4512.499 1766091 Column 2 4 14400 3599.999 96866.29 Column 3 4 20410.01 5102.502 368760.4 Column 4 4 23439.99 5859.996 216202.2
Column 5 4 30439.99 7609.998 426062.7
ANOVA
Source of Variation SS df MS F P-value F crit
Between Groups 36768036 4 9192009 15.99176 2.75E-05 3.055568
Within Groups 8621948 15 574796.6
Total 45389984 19

202
Chapter 4, Section 4.10: Sugar content of strong flour doughs and minimum density during proving ANOVA: Single Factor
SUMMARY – strong min density
Groups Count Sum Average Variance
Column 1 4 1.358733 0.339683 0.000574 Column 2 4 1.335755 0.333939 0.000237 Column 3 4 1.284426 0.321107 0.000169 Column 4 4 1.227356 0.306839 0.000428
Column 5 4 1.308217 0.327054 7.64E-05
ANOVA
Source of Variation SS df MS F P-value F crit
Between Groups 0.002568 4 0.000642 2.163744 0.122918 3.055568
Within Groups 0.004451 15 0.000297
Total 0.007019 19
Chapter 4, Section 4.10: Sugar content of weak flour doughs and minimum density during proving ANOVA: Single Factor SUMMARY – weak min density
Groups Count Sum Average Variance Column 1 4 1.560026 0.390007 0.001573 Column 2 4 1.631859 0.407965 0.000747 Column 3 4 1.312778 0.328195 0.000219 Column 4 4 1.308471 0.327118 0.000221 Column 5 4 1.32872 0.33218 0.000183
ANOVA Source of Variation SS df MS F P-value F crit
Between Groups 0.024102 4 0.006026 10.23575 0.000335 3.055568
Within Groups 0.00883 15 0.000589
Total 0.032932 19
Chapter 4, Section 4.11: Sugar content of Tweedy loaves and baked loaf density ANOVA: Single Factor
SUMMARY – Tweedy baked loaf density
Groups Count Sum Average Variance
Column 1 12 1551.669 129.3057 53.71515 Column 2 12 1420.827 118.4023 13.76411 Column 3 12 1534.834 127.9028 103.4158 Column 4 12 1630.529 135.8774 98.77615 Column 5 12 1825.377 152.1148 70.11095
Column 6 12 1986.395 165.5329 81.25851
ANOVA
Source of Variation SS df MS F P-value F crit
Between Groups 18278.3 5 3655.66 52.09463 1.33E-21 2.353809
Within Groups 4631.448 66 70.17345
Total 22909.75 71

203
Chapter 4, Section 4.11: Sugar content of breadmaker loaves and baked loaf density ANOVA: Single Factor SUMMARY – breadmaker baked loaf density
Groups Count Sum Average Variance
Column 1 12 2176.197 181.3497 64.17362
Column 2 12 2237.102 186.4251 64.67389 Column 3 12 1974.809 164.5674 67.7955 Column 4 12 1906.354 158.8628 201.4206 Column 5 12 1985.529 165.4608 7.115154
Column 6 12 2053.163 171.0969 23.68894
ANOVA
Source of Variation SS df MS F P-value F crit
Between Groups 6766.984 5 1353.397 18.93446 1.25E-11 2.353809
Within Groups 4717.545 66 71.47796
Total 11484.53 71
Chapter 4, Section 4.11: Sugar content of Tweedy loaves and percentage baking loss ANOVA: Single Factor SUMMARY – Tweedy baking loss
Groups Count Sum Average Variance
Column 1 3 31.12 10.37333 2.140133
Column 2 3 38.68 12.89333 2.216933 Column 3 3 34.82 11.60667 0.194133 Column 4 3 30.06 10.02 0.1596 Column 5 3 31.18 10.39333 2.090533
Column 6 3 27.02 9.006667 2.164933
ANOVA
Source of Variation SS df MS F P-value F crit
Between Groups 27.48551 5 5.497102 3.678522 0.029953 3.105875
Within Groups 17.93253 12 1.494378
Total 45.41804 17
Chapter 4, Section 4.11: Sugar content of breadmaker loaves and percentage baking loss ANOVA: Single Factor
SUMMARY – breadmaker baking loss
Groups Count Sum Average Variance
Column 1 3 39.74 13.24667 0.052633 Column 2 3 44.57 14.85667 1.932233 Column 3 3 38.91 12.97 0.4489 Column 4 3 35.29 11.76333 22.44053 Column 5 3 37.43 12.47667 0.262033
Column 6 3 40.16 13.38667 0.124033
ANOVA
Source of Variation SS df MS F P-value F crit
Between Groups 16.14007 5 3.228013 0.766738 0.591129 3.105875
Within Groups 50.52073 12 4.210061
Total 66.6608 17

204
Chapter 4, Section 4.11: Sugar content of Tweedy loaves and force to compress 8mm ANOVA: Single Factor
SUMMARY – Tweedy force to compress
Groups Count Sum Average Variance
Column 1 36 10.99059 0.305294 0.004753 Column 2 36 8.414772 0.233744 0.001132 Column 3 36 12.15846 0.337735 0.013043 Column 4 36 13.04535 0.362371 0.004555 Column 5 36 14.08538 0.39126 0.001474
Column 6 36 19.01092 0.528081 0.010857
ANOVA
Source of Variation SS df MS F P-value F crit
Between Groups 1.751862 5 0.350372 58.69757 4.93E-38 2.257066
Within Groups 1.253514 210 0.005969
Total 3.005376 215
Chapter 4, Section 4.11: Sugar content of breadmaker loaves and force to compress 8mm ANOVA: Single Factor
SUMMARY – breadmaker force to compress
Groups Count Sum Average Variance
Column 1 36 29.29136 0.813649 0.029446 Column 2 36 28.33854 0.787182 0.05168 Column 3 36 24.29368 0.674824 0.017607 Column 4 36 14.19311 0.394253 0.013441 Column 5 36 18.72415 0.520115 0.005811
Column 6 36 17.99092 0.499748 0.017907
ANOVA
Source of Variation SS df MS F P-value F crit
Between Groups 5.17328 5 1.034656 45.6829 8.55E-32 2.257066
Within Groups 4.756216 210 0.022649
Total 9.929496 215
Chapter 4, Section 4.11: Sugar content of Tweedy loaves and cell number density ANOVA: Single Factor
SUMMARY – Tweedy cell no. density
Groups Count Sum Average Variance
Column 1 9 5.547518 0.616391 0.003211 Column 2 8 4.795611 0.599451 0.001274 Column 3 9 5.202921 0.578102 0.000574 Column 4 9 5.184047 0.576005 0.002942 Column 5 9 5.793435 0.643715 0.001761
Column 6 9 6.049647 0.672183 0.000904
ANOVA
Source of Variation SS df MS F P-value F crit
Between Groups 0.064730874 5 0.012946 7.238651 4.27E-05 2.412837
Within Groups 0.084058507 47 0.001788
Total 0.148789381 52

205
Chapter 4, Section 4.11: Sugar content of breadmaker loaves and cell number density ANOVA: Single Factor
SUMMARY – Breadmaker cell number density
Groups Count Sum Average Variance
Column 1 9 5.45422 0.606024 0.000284
Column 2 9 5.747389 0.638599 0.000734 Column 3 9 4.697214 0.521913 0.000681 Column 4 9 4.778154 0.530906 0.002037 Column 5 9 4.971743 0.552416 0.000994
Column 6 9 5.045997 0.560666 0.000705
ANOVA
Source of Variation SS df MS F P-value F crit
Between Groups 0.092030771 5 0.018406 20.32562 7.75E-11 2.408514
Within Groups 0.043467079 48 0.000906
Total 0.13549785 53
Chapter 4, Section 4.11: Sugar content of Tweedy loaves and mean cell diameter ANOVA: Single Factor SUMMARY – Tweedy cell diameter
Groups Count Sum Average Variance
Column 1 9 20.155 2.239444 0.238627
Column 2 8 18.286 2.28575 0.069009 Column 3 9 20.594 2.288222 0.023837 Column 4 9 21.043 2.338111 0.113322 Column 5 9 18.577 2.064111 0.051539
Column 6 9 17.131 1.903444 0.032514
ANOVA
Source of Variation SS df MS F P-value F crit
Between Groups 1.259744911 5 0.251949 2.845323 0.02521 2.412837
Within Groups 4.161777278 47 0.088548
Total 5.421522189 52
Chapter 4, Section 4.11: Sugar content of breadmaker loaves and mean cell diameter ANOVA: Single Factor SUMMARY – breadmaker cell diameter
Groups Count Sum Average Variance
Column 1 9 17.873 1.985889 0.021098
Column 2 9 16.486 1.831778 0.014625 Column 3 9 20.544 2.282667 0.021507 Column 4 9 19.857 2.206333 0.047755 Column 5 9 19.57 2.174444 0.043094
Column 6 9 18.265 2.029444 0.017275
ANOVA
Source of Variation SS df MS F P-value F crit
Between Groups 1.249425648 5 0.249885 9.067259 4.03E-06 2.408514
Within Groups 1.322834889 48 0.027559
Total 2.572260537 53

206
Chapter 5 Section 5.3.1 Raw data used to plot Figure 5.2 CROSS
FIT,
1→0.5
bara
Exp. voidage Model
voidage Exp. voidage
Model
voidage Exp. voidage
Model
voidage Exp. voidage
Model
voidage Exp. voidage
Model
voidage Exp. voidage
Model
voidage
Time
(s) 0% sugar, strong
0%
sugar,
strong
7.5% sugar,
strong
7.5%
sugar,
strong
15% sugar,
strong
15%
sugar,
strong
0% sugar, weak
0%
sugar,
weak
7.5% sugar,
weak
7.5% sugar,
weak
15% sugar,
weak
15%
sugar,
weak
90 0.0668±0.00206 0.0582 0.0697±0.00713 0.0677 0.0649±0.00379 0.0678 0.0657±0.00384 0.0607 0.0579±0.00368 0.0610 0.0678±0.00597 0.0776
100 0.0658±0.00172 0.0600 0.0642±0.00308 0.0669 0.0695±0.00662 0.0648 0.0684±0.00285 0.0633 0.0576±0.00140 0.0601 0.0643±0.00117 0.0696
105 0.0621±0.00441 0.0608 0.0706±0.00482 0.0665 0.0617±0.00471 0.0636 0.0696±0.00383 0.0645 0.0616±0.00219 0.0597 0.0624±0.00376 0.0664
110 0.0565±0.00831 0.0615 0.0660±0.00307 0.0662 0.0636±0.00312 0.0625 0.0616±0.00257 0.0656 0.0570±0.00211 0.0593 0.0698±0.00214 0.0636
110 0.107±0.0148 0.116 0.124±0.00539 0.124 0.120±0.00551 0.118 0.116±0.00455 0.123 0.108±0.00377 0.112 0.130±0.00375 0.120
115 0.113±0.0117 0.104 0.112±0.00537 0.108 0.0870±0.00456 0.0977 0.125±0.0106 0.112 0.110±0.00532 0.0987 0.110±0.0109 0.0960
120 0.105±0.0156 0.0941 0.102±0.00955 0.0948 0.0910±0.0136 0.0830 0.110±0.0124 0.104 0.0960±0.0152 0.0879 0.0936±0.0110 0.0790
130 0.0756±0.00563 0.0798 0.0720±0.00453 0.0768 0.0737±0.0129 0.0642 0.0654±0.00362 0.0900 0.0792±0.0200 0.0721 0.0822±0.00725 0.0581
140 0.0663±0.00558 0.0706 0.0653±0.00334 0.0660 0.0643±0.00163 0.0547 0.0739±0.00404 0.0808 0.0589±0.00766 0.0619 0.0667±0.00901 0.0477
150 0.0626±0.00546 0.0649 0.0632±0.00543 0.0599 0.0551±0.00468 0.0502 0.0710±0.00332 0.0747 0.0495±0.00601 0.0555 0.0486±0.00875 0.0430
160 0.0630±0.00795 0.0616 0.0576±0.00590 0.0567 0.0511±0.00293 0.0486 0.0753±0.00635 0.0709 0.0515±0.0100 0.0517 0.0527±0.00103 0.0413
170 0.0626±0.00404 0.0560 0.0532±0.00524 0.0554 0.0533±0.00546 0.0483 0.0693±0.00440 0.0687 0.0551±0.0151 0.0496 0.0349±0.00604 0.0410
180 0.0676±0.0162 0.0594 0.0532±0.00384 0.0550 0.0501±0.00682 0.0488 0.0720±0.00860 0.0677 0.0477±0.0343 0.04863 0.0471±0.0110 0.0413
190 0.0653±0.00510 0.0594 0.0561±0.00505 0.0554 0.0514±0.00608 0.0495 0.0693±0.00763 0.0674 0.0509±0.00869 0.0483 0.0402±0.00920 0.0418
200 0.0622±0.00749 0.0599 0.0572±0.00362 0.0560 0.0535±0.00456 0.0503 0.0701±0.0108 0.0676 0.0572±0.00226 0.0484 0.0450±0.0101 0.0424
210 0.0635±0.00330 0.0606 0.0625±0.00837 0.0567 0.0543±0.00305 0.0511 0.0702±0.00266 0.0682 0.0522±0.00524 0.0488 0.0387±0.00948 0.0430
220 0.0637±0.00501 0.0614 0.0659±0.0149 0.0575 0.0509±0.00474 0.0518 0.0709±0.00577 0.0690 0.0619±0.0195 0.0493 0.0435±0.00375 0.0434
230 0.0605±0.00452 0.0623 0.0563±0.0134 0.0583 0.0580±0.0134 0.0523 0.0721±0.00365 0.0699 0.0625±0.0210 0.0499 0.0402±0.00948 0.0438

207
Chapter 5 Section 5.3.1 Raw data used to plot Figure 5.2 DIRECT
FIT,
1→0.5
bara
Exp. voidage Model
voidage Exp. voidage
Model
voidage Exp. voidage
Model
voidage Exp. voidage
Model
voidage Exp. voidage
Model
voidage Exp. voidage
Model
voidage
Time
(s) 0% sugar, strong
0%
sugar,
strong
7.5% sugar,
strong
7.5%
sugar,
strong
15% sugar,
strong
15%
sugar,
strong
0% sugar, weak
0%
sugar,
weak
7.5% sugar,
weak
7.5% sugar,
weak
15% sugar,
weak
15%
sugar,
weak
90 0.0668±0.00206 0.0598 0.0697±0.00713 0.0689 0.0649±0.00379 0.0642 0.0657±0.00384 0.0625 0.0579±0.00368 0.0597 0.0678±0.00597 0.0733
100 0.0658±0.00172 0.0616 0.0642±0.00308 0.0682 0.0695±0.00662 0.0632 0.0684±0.00285 0.0656 0.0576±0.00140 0.0601 0.0643±0.00117 0.0691
105 0.0621±0.00441 0.0624 0.0706±0.00482 0.0678 0.0617±0.00471 0.0627 0.0696±0.00383 0.0669 0.0616±0.00219 0.0603 0.0624±0.00376 0.0673
110 0.0565±0.00831 0.0632 0.0660±0.00307 0.0675 0.0636±0.00312 0.0623 0.0616±0.00257 0.0682 0.0570±0.00211 0.0605 0.0698±0.00214 0.0656
110 0.107±0.0148 0.119 0.124±0.00539 0.127 0.120±0.00551 0.117 0.116±0.00455 0.128 0.108±0.00377 0.114 0.130±0.00375 0.123
115 0.113±0.0117 0.106 0.112±0.00537 0.109 0.0870±0.00456 0.101 0.125±0.0106 0.112 0.110±0.00532 0.100 0.110±0.0109 0.108
120 0.105±0.0156 0.0960 0.102±0.00955 0.0958 0.0910±0.0136 0.0881 0.110±0.0124 0.101 0.0960±0.0152 0.0892 0.0936±0.0110 0.0960
130 0.0756±0.00563 0.0811 0.0720±0.00453 0.0773 0.0737±0.0129 0.0707 0.0654±0.00362 0.0843 0.0792±0.0200 0.0736 0.0822±0.00725 0.0772
140 0.0663±0.00558 0.0718 0.0653±0.00334 0.0666 0.0643±0.00163 0.0607 0.0739±0.00404 0.0750 0.0589±0.00766 0.0640 0.0667±0.00901 0.0643
150 0.0626±0.00546 0.0661 0.0632±0.00543 0.0607 0.0551±0.00468 0.0552 0.0710±0.00332 0.0701 0.0495±0.00601 0.0584 0.0486±0.00875 0.0555
160 0.0630±0.00795 0.0629 0.0576±0.00590 0.0578 0.0511±0.00293 0.0526 0.0753±0.00635 0.0680 0.0515±0.0100 0.0554 0.0527±0.00103 0.0497
170 0.0626±0.00404 0.0614 0.0532±0.00524 0.0566 0.0533±0.00546 0.0516 0.0693±0.00440 0.0674 0.0551±0.0151 0.0541 0.0349±0.00604 0.0459
180 0.0676±0.0162 0.0609 0.0532±0.00384 0.0565 0.0501±0.00682 0.0515 0.0720±0.00860 0.0679 0.0477±0.0343 0.0536 0.0471±0.0110 0.0435
190 0.0653±0.00510 0.0611 0.0561±0.00505 0.0570 0.0514±0.00608 0.0520 0.0693±0.00763 0.0688 0.0509±0.00869 0.0539 0.0402±0.00920 0.0421
200 0.0622±0.00749 0.0617 0.0572±0.00362 0.0577 0.0535±0.00456 0.0527 0.0701±0.0108 0.0700 0.0572±0.00226 0.0544 0.0450±0.0101 0.0414
210 0.0635±0.00330 0.0625 0.0625±0.00837 0.0586 0.0543±0.00305 0.0535 0.0702±0.00266 0.0712 0.0522±0.00524 0.0551 0.0387±0.00948 0.0411
220 0.0637±0.00501 0.0634 0.0659±0.0149 0.0594 0.0509±0.00474 0.0542 0.0709±0.00577 0.0724 0.0619±0.0195 0.0559 0.0435±0.00375 0.0411
230 0.0605±0.00452 0.0643 0.0563±0.0134 0.0602 0.0580±0.0134 0.0549 0.0721±0.00365 0.0735 0.0625±0.0210 0.0567 0.0402±0.00948 0.0413

208
Chapter 5 Section 5.3.1 Raw data used to plot Figure 5.3 CROSS
FIT,
1→0.25
bara
Exp. Voidage Model
voidage Exp. Voidage
Model
voidage Exp. voidage
Model
voidage Exp. voidage
Model
voidage Exp. voidage
Model
voidage Exp. voidage
Model
voidage
Time
(s) 0% sugar, strong
0%
sugar,
strong
7.5% sugar,
strong
7.5%
sugar,
strong
15% sugar,
strong
15%
sugar,
strong
0% sugar, weak
0%
sugar,
weak
7.5% sugar,
weak
7.5% sugar,
weak
15% sugar,
weak
15%
sugar,
weak
90 0.0668±0.00206 0.0582 0.0697±0.00713 0.0677 0.0649±0.00379 0.0678 0.0657±0.00384 0.0607 0.0579±0.0107 0.0610 0.0678±0.00597 0.0776
100 0.0658±0.00172 0.0560 0.0642±0.00308 0.0669 0.0695±0.00662 0.0648 0.0684±0.00285 0.0633 0.0576±0.00406 0.0601 0.06439±0.0117 0.0696
105 0.0621±0.00441 0.0608 0.0691±0.00438 0.0665 0.0712±0.0113 0.0636 0.0696±0.00383 0.0645 0.0616±0.00624 0.0597 0.0624±0.00376 0.0664
110 0.0565±0.00437 0.0615 0.0660±0.00307 0.0662 0.0636±0.00312 0.0625 0.0616±0.00257 0.0656 0.0570±0.00211 0.0593 0.0698±0.00214 0.0636
110 0.193±0.0127 0.208 0.220±0.00852 0.221 0.214±0.00878 0.211 0.208±0.0127 0.219 0.195±0.00613 0.201 0.231±0.00587 0.214
115 0.161±0.0217 0.155 0.161±0.0119 0.154 0.123±0.0597 0.133 0.189±0.0297 0.171 0.161±0.0354 0.147 0.119±0.0319 0.127
120 0.112±0.0306 0.119 0.0892±0.0106 0.111 0.0822±0.0322 0.0882 0.130±0.0176 0.136 0.112±0.0232 0.109 0.0366±0.0186 0.0799
130 0.0697±0.00763 0.0758 0.0755±0.0230 0.0658 0.0518±0.0122 0.0492 0.0751±0.00516 0.0911 0.0415±0.00771 0.0665 0.0465±0.0194 0.0417
140 0.0521±0.0166 0.0564 0.0529±0.00642 0.0487 0.0419±0.00319 0.0391 0.0745±0.0205 0.0684 0.0437±0.0228 0.0475 0.0317±0.0126 0.0330
150 0.0606±0.0190 0.0488 0.0496±0.00609 0.0438 0.0458±0.00246 0.0385 0.0678±0.00568 0.0579 0.0302±0.0207 0.0401 0.0222±0.0922 0.0329
160 0.0566±0.0141 0.0469 0.0545±0.0143 0.0439 0.0500±0.0373 0.0407 0.0612±0.0256 0.0539 0.0281±0.0201 0.0382 0.0351±0.0260 0.0350
170 0.0625±0.0152 0.0477 0.0541±0.00860 0.0458 0.0307±0.0150 0.0433 0.0702±0.0136 0.0534 0.0530±0.0322 0.0387 0.0317±0.0205 0.0372
180 0.0598±0.0248 0.0497 0.0474±0.0101 0.0482 0.0430±0.0215 0.0456 0.0652±0.00660 0.0547 0.0168±0.00492 0.0402 0.0405±0.0192 0.0391
190 0.0499±0.00914 0.0520 0.0558±0.0217 0.0506 0.0400±0.0103 0.0476 0.0615±0.00474 0.0568 0.0383±0.00492 0.0421 0.0270±0.0134 0.0405
200 0.0551±0.00669 0.0543 0.0524±0.0143 0.0527 0.0455±0.0331 0.0492 0.0550±0.0125 0.0592 0.0268±0.00791 0.0439 0.0330±0.0121 0.0417
210 0.0539±0.00880 0.0565 0.0474±0.00552 0.0545 0.0447±0.0267 0.0504 0.0719±0.0127 0.0615 0.0484±0.0368 0.0455 0.0322±0.0246 0.0426
220 0.0604±0.0120 0.0584 0.0459±0.0101 0.0560 0.0560±0.0220 0.0513 0.0678±0.00907 0.06381 0.0303±0.00860 0.0469 0.0448±0.0264 0.0432
230 0.0512±0.0139 0.0601 0.0472±0.00503 0.0573 0.0457±0.0111 0.0521 0.0664±0.00715 0.0659 0.0256±0.00935 0.0482 0.0268±0.0136 0.0437

209
Chapter 5 Section 5.3.1 Raw data used to plot Figure 5.3 DIRECT
FIT,
1→0.25
bara
Exp. Voidage Model
voidage Exp. Voidage
Model
voidage Exp. Voidage
Model
voidage Exp. Voidage
Model
voidage Exp. Voidage
Model
voidage Exp. Voidage
Model
voidage
Time
(s)
0% sugar,
strong
0%
sugar,
strong
7.5% sugar,
strong
7.5%
sugar,
strong
15% sugar,
strong
15%
sugar,
strong
0% sugar, weak
0%
sugar,
weak
7.5% sugar,
weak
7.5%
sugar,
weak
15% sugar,
weak
15% sugar,
weak
90 0.0668±0.00206 0.0560 0.0697±0.00713 0.0683 0.0649±0.00379 0.0709 0.0657±0.00384 0.0590 0.0579±0.0107 0.0653 0.0678±0.00597 0.0867
100 0.0658±0.00172 0.0583 0.0642±0.00308 0.0672 0.0695±0.00662 0.0664 0.0684±0.00285 0.0628 0.0576±0.00406 0.0616 0.06439±0.0117 0.0727
105 0.0621±0.00441 0.0594 0.0691±0.00438 0.0667 0.0712±0.0113 0.0645 0.0696±0.00383 0.0645 0.0616±0.00624 0.0600 0.0624±0.00376 0.0673
110 0.0565±0.00437 0.0604 0.0660±0.00307 0.0662 0.0636±0.00312 0.0629 0.0616±0.00257 0.0661 0.0570±0.00211 0.0584 0.0698±0.00214 0.0628
110 0.193±0.0127 0.204 0.220±0.00852 0.221 0.214±0.00878 0.212 0.208±0.0127 0.221 0.195±0.00613 0.199 0.231±0.00587 0.211
115 0.161±0.0217 0.152 0.161±0.0119 0.153 0.123±0.0597 0.129 0.189±0.0297 0.171 0.161±0.0354 0.144 0.119±0.0319 0.112
120 0.112±0.0306 0.116 0.0892±0.0106 0.109 0.0822±0.0322 0.0828 0.130±0.0176 0.136 0.112±0.0232 0.107 0.0366±0.0186 0.0640
130 0.0697±0.00763 0.0744 0.0755±0.0230 0.0637 0.0518±0.0122 0.0454 0.0751±0.00516 0.0915 0.0415±0.00771 0.0624 0.0465±0.0194 0.0326
140 0.0521±0.0166 0.0560 0.0529±0.00642 0.0474 0.0419±0.00319 0.0370 0.0745±0.0205 0.0698 0.0437±0.0228 0.0420 0.0317±0.0126 0.02866
150 0.0606±0.0190 0.0491 0.0496±0.00609 0.0431 0.0458±0.00246 0.0373 0.0678±0.00568 0.0603 0.0302±0.0207 0.0334 0.0222±0.0922 0.0302
160 0.0566±0.0141 0.0478 0.0545±0.0143 0.0436 0.0500±0.0373 0.0398 0.0612±0.0256 0.0573 0.0281±0.0201 0.0304 0.0351±0.0260 0.0324
170 0.0625±0.0152 0.0490 0.0541±0.00860 0.0457 0.0307±0.0150 0.0424 0.0702±0.0136 0.0576 0.0530±0.0322 0.0300 0.0317±0.0205 0.0343
180 0.0598±0.0248 0.0512 0.0474±0.0101 0.0481 0.0430±0.0215 0.0446 0.0652±0.00660 0.0595 0.0168±0.00492 0.0308 0.0405±0.0192 0.0360
190 0.0499±0.00914 0.0536 0.0558±0.0217 0.0505 0.0400±0.0103 0.0463 0.0615±0.00474 0.0620 0.0383±0.00492 0.0319 0.0270±0.0134 0.0369
200 0.0551±0.00669 0.0561 0.0524±0.0143 0.0526 0.0455±0.0331 0.0477 0.0550±0.0125 0.0648 0.0268±0.00791 0.0332 0.0330±0.0121 0.0374
210 0.0539±0.00880 0.0583 0.0474±0.00552 0.0543 0.0447±0.0267 0.0487 0.0719±0.0127 0.0675 0.0484±0.0368 0.0344 0.0322±0.0246 0.0379
220 0.0604±0.0120 0.0602 0.0459±0.0101 0.0557 0.0560±0.0220 0.0495 0.0678±0.00907 0.0699 0.0303±0.00860 0.0355 0.0448±0.0264 0.0382
230 0.0512±0.0139 0.0619 0.0472±0.00503 0.0569 0.0457±0.0111 0.0501 0.0664±0.00715 0.0722 0.0256±0.00935 0.0364 0.0268±0.0136 0.0385

210
Chapter 5 Section 5.3.1 Raw data used to plot Figure 5.4 CROSS
FIT,
1→2
bara
Exp. Voidage Model
voidage Exp. Voidage
Model
voidage Exp. Voidage
Model
voidage Exp. Voidage
Model
voidage Exp. Voidage
Model
voidage Exp. Voidage
Model
voidage
Time
(s) 0% sugar, strong
0%
sugar,
strong
7.5% sugar,
strong
7.5% sugar,
strong
15% sugar,
strong
15%
sugar,
strong
0% sugar, weak
0%
sugar,
weak
7.5% sugar,
weak
7.5% sugar,
weak 15% sugar, weak
15% sugar,
weak
90 0.0668±0.00206 0.0582 0.0697±0.00713 0.0677 0.0649±0.00379 0.0678 0.0657±0.00206 0.0607 0.0579±0.00368 0.0610 0.0678±0.00597 0.0776
100 0.0658±0.00172 0.0560 0.0642±0.00308 0.0669 0.0695±0.00662 0.0648 0.0684±0.00153 0.0633 0.0576±0.00140 0.0601 0.0644±0.00117 0.0696
105 0.0621±0.00441 0.0608 0.0669±0.0114 0.0665 0.0617±0.00471 0.0636 0.0696±0.00206 0.0645 0.0616±0.00219 0.0597 0.0624±0.00376 0.0664
110 0.0565±0.00831 0.0615 0.0660±0.00307 0.0662 0.0636±0.00312 0.0625 0.0616±0.00257 0.0656 0.0570±0.00211 0.0593 0.0698±0.00214 0.0636
110 0.0291±0.00441 0.0317 0.0341±0.00164 0.0342 0.0328±0.00166 0.0323 0.0318±0.00137 0.0339 0.0293±0.00111 0.0305 0.03615±0.00115 0.03286
115 0.0376±0.00274 0.0359 0.0396±0.0104 0.0385 0.0367±0.00192 0.0368 0.0382±0.00122 0.0382 0.0319±0.00269 0.0338 0.0343±0.00401 0.0366
120 0.0380±0.00329 0.0397 0.0363±0.00393 0.0423 0.0379±0.00357 0.0407 0.0373±0.0147 0.04215 0.0359±0.00453 0.0368 0.0341±0.00339 0.03966
130 0.0439±0.00169 0.0464 0.0421±0.00174 0.0487 0.0482±0.00402 0.0468 0.0465±0.00925 0.0492 0.0450±0.00358 0.0418 0.0442±0.0123 0.0443
140 0.0501±0.00237 0.0518 0.0496±0.00190 0.0537 0.0457±0.00185 0.0512 0.0496±0.00126 0.0551 0.0437±0.00450 0.0459 0.0449±0.00381 0.0473
150 0.0509±0.00252 0.0563 0.0537±0.00812 0.0576 0.0516±0.00968 0.0543 0.0577±0.00353 0.0602 0.0489±0.00280 0.0491 0.0417±0.00460 0.0493
160 0.0562±0.00311 0.0600 0.0555±0.00361 0.0605 0.0552±0.00482 0.0564 0.0570±0.000980 0.0645 0.0533±0.00225 0.0517 0.0461±0.00414 0.0504
170 0.0591±0.00278 0.0630 0.0605±0.00611 0.0628 0.0576±0.00120 0.0578 0.0618±0.00161 0.0681 0.0545±0.00470 0.0537 0.0482±0.00495 0.0510
180 0.0614±0.00236 0.0655 0.0612±0.00395 0.0644 0.0552±0.00295 0.0587 0.0648±0.00391 0.0711 0.0575±0.0575 0.0553 0.0510±0.00454 0.0512
190 0.0648±0.00166 0.0674 0.0652±0.00637 0.0656 0.0554±0.00198 0.0592 0.0688±0.00399 0.0737 0.0620±0.00152 0.0566 0.0532±0.00429 0.05111
200 0.0670±0.00160 0.0690 0.0689±0.00218 0.0665 0.0536±0.00198 0.0594 0.0702±0.00191 0.0758 0.0632±0.00476 0.05759 0.0562±0.00443 0.0509
210 0.0687±0.00230 0.0702 0.0718±0.00417 0.0671 0.0604±0.00178 0.0594 0.0734±0.00393 0.0776 0.0668±0.00548 0.0581 0.0505±0.00204 0.0505
220 0.0691±0.00194 0.0712 0.0693±0.00354 0.0674 0.0615±0.00220 0.0593 0.0746±0.00480 0.0790 0.0693±0.00630 0.0586 0.0536±0.00254 0.0501
230 0.0741±0.00697 0.0719 0.0682±0.00204 0.0676 0.0580±0.00388 0.0591 0.0785±0.00565 0.0802 0.0643±0.00219 0.0590 0.0571±0.00304 0.0497

211
Chapter 5 Section 5.3.1 Raw data used to plot Figure 5.4 DIRECT
FIT,
1→2
bara
Exp. Voidage Model
voidage Exp. Voidage
Model
voidage Exp. Voidage
Model
voidage Exp. Voidage
Model
voidage Exp. Voidage
Model
voidage Exp. Voidage
Model
voidage
Time
(s)
0% sugar,
strong
0%
sugar,
strong
7.5% sugar,
strong
7.5%
sugar,
strong
15% sugar,
strong
15%
sugar,
strong
0% sugar, weak
0%
sugar,
weak
7.5% sugar,
weak
7.5% sugar,
weak 15% sugar, weak
15%
sugar,
weak
90 0.0668±0.00206 0.0615 0.0697±0.00713 0.0657 0.0649±0.00379 0.0675 0.0657±0.00206 0.0638 0.0579±0.00368 0.0568 0.0678±0.00597 0.0673
100 0.0658±0.00172 0.0627 0.0642±0.00308 0.0664 0.0695±0.00662 0.0651 0.0684±0.00153 0.0657 0.0576±0.00140 0.058217222 0.0644±0.00117 0.0663
105 0.0621±0.00441 0.0633 0.0669±0.0114 0.0667 0.0617±0.00471 0.0640 0.0696±0.00206 0.0666 0.0616±0.00219 0.0589 0.0624±0.00376 0.0659
110 0.0565±0.00831 0.0638 0.0660±0.00307 0.0670 0.0636±0.00312 0.0631 0.0616±0.00257 0.0674 0.0570±0.00211 0.0595 0.0698±0.00214 0.0655
110 0.0291±0.00441 0.0330 0.0341±0.00164 0.0347 0.0328±0.00166 0.0326 0.0318±0.00137 0.0349 0.0293±0.00111 0.0307 0.03615±0.00115 0.0339
115 0.0376±0.00274 0.0361 0.0396±0.0104 0.0376 0.0367±0.00192 0.0361 0.0382±0.00122 0.0379 0.0319±0.00269 0.0336 0.0343±0.00401 0.0355
120 0.0380±0.00329 0.0390 0.0363±0.00393 0.0403 0.0379±0.00357 0.0391 0.0373±0.0147 0.0407 0.0359±0.00453 0.0363 0.0341±0.00339 0.0370
130 0.0439±0.00169 0.0443 0.0421±0.00174 0.045279 0.0482±0.00402 0.0443 0.0465±0.00925 0.0459 0.0450±0.00358 0.0413 0.0442±0.0123 0.0399
140 0.0501±0.00237 0.0489 0.0496±0.00190 0.0496 0.0457±0.00185 0.0483 0.0496±0.00126 0.0507 0.0437±0.00450 0.0457 0.0449±0.00381 0.0424
150 0.0509±0.00252 0.0529 0.0537±0.00812 0.0534 0.0516±0.00968 0.0513 0.0577±0.00353 0.0549 0.0489±0.00280 0.0496 0.0417±0.00460 0.0447
160 0.0562±0.00311 0.0564 0.0555±0.00361 0.0568 0.0552±0.00482 0.0537 0.0570±0.000980 0.0588 0.0533±0.00225 0.0530 0.0461±0.00414 0.0468
170 0.0591±0.00278 0.0595 0.0605±0.00611 0.0597 0.0576±0.00120 0.0554 0.0618±0.00161 0.0622 0.0545±0.00470 0.0560 0.0482±0.00495 0.0486
180 0.0614±0.00236 0.0622 0.0612±0.00395 0.0623 0.0552±0.00295 0.0566 0.0648±0.00391 0.0653 0.0575±0.0575 0.0587 0.0510±0.00454 0.0503
190 0.0648±0.00166 0.0645 0.0652±0.00637 0.0645 0.0554±0.00198 0.0575 0.0688±0.00399 0.0681 0.0620±0.00152 0.0610 0.0532±0.00429 0.0518
200 0.0670±0.00160 0.0665 0.0689±0.00218 0.0665 0.0536±0.00198 0.0581 0.0702±0.00191 0.0707 0.0632±0.00476 0.0630 0.0562±0.00443 0.0531
210 0.0687±0.00230 0.0682 0.0718±0.00417 0.0681 0.0604±0.00178 0.0585 0.0734±0.00393 0.0729 0.0668±0.00548 0.0647 0.0505±0.00204 0.0543
220 0.0691±0.00194 0.0697 0.0693±0.00354 0.0696 0.0615±0.00220 0.0587 0.0746±0.00480 0.0749 0.0693±0.00630 0.0663 0.0536±0.00254 0.0553
230 0.0741±0.00697 0.0710 0.0682±0.00204 0.0709 0.0580±0.00388 0.0588 0.0785±0.00565 0.0767 0.0643±0.00219 0.0676 0.0571±0.00304 0.0562

212
Chapter 6, Section 6.4: Proving time and cell Feret shape ANOVA: Single Factor
SUMMARY – cell Feret shape
Groups Count Sum Average Variance
Column 1 10868 17243.30062 1.586612129 0.210107028
Column 2 30853 49593.65622 1.607417633 0.22283754
Column 3 18215 30435.66041 1.670911908 0.307204607
Column 4 11248 20587.82498 1.830354283 0.526072662
Column 5 4094 7378.394077 1.802245744 0.515014314
Column 6 4497 8588.786736 1.909892536 0.763354092
ANOVA
Source of Variation SS df MS F P-value F crit
Between Groups 811.4804126 5 162.2960825 493.9340438 0 2.214211546
Within Groups 26210.37438 79769 0.32857845
Total 27021.85479 79774

213

214

215

216

217

218

219

220


