Embed Size (px)
Citation preview

POLİTEKNİK DERGİSİ
JOURNAL of POLYTECHNIC
ISSN: 1302-0900 (PRINT), ISSN: 2147-9429 (ONLINE)
URL: http://dergipark.org.tr/politeknik
Gaz nitrasyon yapılan 4140 çeliğinin minimum kalıntı gerilim ve maksimum aşınma dayanımı için işlem parametrelerinin optimizasyonu
Optimization of processing parameters for
minimum residual stress and maximum wear
resistance during gas nitration of 4140 steel
Yazar(lar) (Author(s)): Sibel TÜZÜNER1*, Ali Baran METİN2, Ebru SARALOĞLU GÜLER3, Tuğçe
ŞAHİN4
ORCID1*: 0000-0002-6907-2198
ORCID2: 0000-0001-9648-1774
ORCID3: 0000-0002-3732-1268
ORCID4: 0000-0002-6908-2310
Bu makaleye şu şekilde atıfta bulunabilirsiniz(To cite to this article): Tüzüner S., Metin A. B. and
Saraloğlu Güler E., “Optimization of processing parameters for minimum residual stress and maximum
wear resistance during gas nitration of 4140 steel”, Journal of Polytechnic, *(*): *, (*).
Erişim linki (To link to this article): http://dergipark.org.tr/politeknik/archive
DOI: 10.2339/politeknik.993934

Optimization of Processing Parameters for Minimum Residual
Stress and Maximum Wear Resistance During Gas Nitration of
4140 Steel
Highlights Nitration process using different processing parameters
Measurement of wear resistance by pin on disc tribometer
60% increase in wear resistance of 4140 steel
Graphical Abstract The optimized parameters of temperature, time and gas flow; rate resulted in minimum residual stress and maximum
wear resistance during the nitration process (see Table 1 Sample 3).
Table 1. Nitration Parameters, Values and Measurement Results
Sample Temperature
[°C]
Time
[h]
Flow Rate
[m3/h]
Mean Coefficient of
Friction
Amount of Wear *(10-5)
[mm3/n/m]
Hardness
[HV0.5]
[MPa]
3 470 12 9 0.685 1.573 581.2 -267.6
Aim The aim of this study is to increase the wear resistance together with minimum residual stress in the material by
nitration of the threaded parts.
Design & Methodology By determining the nitration parameters, the hardness and layer measurements of the samples were made and the
microscope images were examined. Wear test was done using pin on disc tribometer and residual stress values were
measured by XRD method.
Originality In this study; different from the literature, the effect of three parameters on material properties was observed by
studying three different values of these parameters.
Findings As a result of the experiments and measurements, the sample that provides the "max. wear resistance and min. residual
stress" values, which is the aim of the study, was determined as sample number 3. The threaded part was manufactured
by using these test parameters.
Conclusion As a result of all experiments, regression equations were created and it was determined that the most effective
parameter is flow rate. After nitrocarburization, which is one of the surface treatments applied in HIDROMEK, the
wear amount of the material was minimized by applying nitration with optimized parameters. Finally, the wear
resistance is increased by 60%.
Declaration of Ethical Standards The author(s) of this article declare that the materials and methods used in this study do not require ethical committee
permission and/or legal-special permission.

Politeknik Dergisi, 2022; 25(2) : 909-920 Journal of Polytechnic, 2022; 25(2): 909-920
909
Optimization of Processing Parameters for Minimum
Residual Stress and Maximum Wear Resistance During
Gas Nitration of 4140 Steel
Araştırma Makalesi / Research Article
Sibel TÜZÜNER*, Ali Baran METİN, Ebru SARALOĞLU GÜLER, Tuğçe ŞAHİN
Engineering Faculty, Department of Mechanical Engineering, Başkent University, Ankara, Turkey
(Geliş/Received : 10.09.2021 ; Kabul/Accepted : 12.02.2022 ; Erken Görünüm/Early View : 28.02.2022)
ABSTRACT
Several surface treatments has been applied to the 4140 specimens which are exposed to frictional conditions like gears in order to
increase the wear resistance and hardness. Nitration is a common method to improve the hardness of the surfaces. However, the
parameters must be chosen wisely. The parameters of temperature, time, flow rate during nitration of SAE 4140 steels were
optimized in this study. The ranges for the parameters are selected as 470⁰C - 520⁰C - 570⁰C, 7h - 9h - 12h and 6m3/h - 7.5m3/h -
9m3/h for temperature, time and flow rate respectively. Residual stress, hardness and wear resistance were measured for the specific
experiments together with microscopic observations. The nitration process of the threaded part was completed using the optimized
parameters. As a result of the study, it was observed that the maximum wear resistance and minimum residual stress values was
obtained by the parameters of 470⁰C, 12h, 9m3/h.
Keywords: Gas Nitration, SAE 4140 steel, wear resistance, residual stress, microhardness.
Gaz Nitrasyon Yapılan 4140 Çeliğinin Minimum
Kalıntı Gerilim ve Maksimum Aşınma Dayanımı İçin
İşlem Parametrelerinin Optimizasyonu
ÖZ
Dişliler gibi sürtünme koşullarına maruz kalan 4140 çeliği numunesinin aşınma direncini ve sertliğini arttırmak için çeşitli yüzey
işlemleri uygulanmıştır. Nitrasyon, yüzeylerin sertliğini iyileştirmek için yaygın bir yöntemdir. Ancak, parametreler dikkatli bir
şekilde seçilmelidir. Bu çalışmada SAE 4140 çeliklerinin nitrasyonu sırasında sıcaklık, zaman, debi parametreleri optimize
edilmiştir. Parametre aralıkları sıcaklık, zaman ve debi için sırasıyla 470⁰C - 520⁰C - 570⁰C, 7sa – 9sa – 12sa and 6m3/sa - 7.5m3/sa
- 9m3/sa olarak seçilmiştir. Mikroskobik gözlemlerle birlikte spesifik deneyler için kalıntı gerilim, sertlik ve aşınma direnci
ölçülmüştür. Optimize edilmiş parametreler kullanılarak dişli parçanın nitrasyon işlemi tamamlanmıştır.Çalışma sonucunda
maksimum aşınma direnci ve minimum kalıntı gerilim değerlerinin 470⁰C, 12sa, 9m3/sa parametreleri ile elde edildiği
gözlemlenmiştir.
Anahtar Kelimeler: Gaz Nitrasyon, SAE 4140 çeliği, aşınma direnci, kalıntı gerilim, mikrosertlik.
1. INTRODUCTION
Nowadays, many heat treatment techniques are used to
improve mechanical properties such as high wear and
corrosion resistance and fatigue resistance expected from
machine elements [1]. Nitriding has been widely used in
applications since hardening the surfaces of many
metallic machine parts, especially steel is necessary in
order to increase their wear and fatigue resistance [2].
The nitriding process, first developed in the early 1900s.
It has been continued to play an important role in many
industrial applications. Along with the derivative
nitrocarburizing process, nitriding is frequently used in
the industries of aircraft, bearings, automotive, textile,
and turbine generation systems. The secret of the
nitriding process is that it does not require a phase change
from ferrite to austenite, or a change from austenite to
martensite. In other words, the steel remains in the ferrite
phase (or cementite, depending on alloy composition)
during the whole procedure. Furthermore, no subsequent
transformation from austenite to martensite occurs
because only free cooling takes place [3]. This means that
the molecular structure of the ferrite (body-centered
cubic, or bcc, lattice) does not change its configuration or
grow into the face-centered cubic (fcc) lattice that is
characteristic phase of austenite, as does in case of
carburizing. Comparatively low temperatures are used in
this process since no quenching is required and this will
end up with no volume changes, less distortion and low
amount of deformation than either carburizing or
conventional hardening. Some growth occurs as a result
*Sorumlu Yazar (Corresponding Author)
e-posta: [email protected]
Sibel TÜZÜNER, Ali Baran METİN, Ebru SARALOĞLU GÜLER, Tuğşe ŞAHİN / POLİTEKNİK DERGİSİ, Politeknik Dergisi, 2022 ; 25(2) : 909-920
910
of nitriding, but volumetric changes are relatively small
[3,4].
Nitriding can be done in a nitrogen-containing gas, solid
or liquid medium. Industrial, automotive or aerospace
gears are often gas nitrided. Recently, computer-
controlled gas nitriding has been used [5]. Gas nitriding
is a case-hardening process whereby nitrogen is
introduced into the surface of a solid ferrous alloy by
holding the metal at a suitable temperature (below Ac1,
for ferritic steels) in contact with a nitrogenous gas,
usually ammonia [4]. Gears to be nitrided are placed in
an airtight container or oven and an atmosphere of
ammonia (NH3) is supplied continuously while the
temperature is raised and held between 470 and 570 °C
(878 and 1058 °F) to produce the best combination of
surface hardness and case depth. At this temperature,
NH3 breaks down into atomic nitrogen and hydrogen
[5,6].
According to the following reaction:
2NH3→2N + 3H2 [5]
Here, the aim is to increase the solubility of nitrogen in
α-Fe and to increase the nitrogen content of other
elements such as Fe, Al, Cr, Mo, etc., that may present in
the composition of the steel and by increasing nitrogen
partial pressure. So the formation of hard
nitride/carbonitride layer is provided due to the nitrogen
affinity of the elements. Depending on the diffusion
conditions, these nitrides/carbonitrides can form either at
grain boundaries or present as massive precipitates
[2,5,7].
Gas nitriding is the best method for homogeneous
nitriding of complex shaped parts [8]. Studies have been
carried out about gas nitration with different parameters
in literature. Gas nitriding was applied to AISI 4140 steel
at a temperature range of 480⁰C and 590⁰C and a nitration
thickness of 12 µm – 0.75 mm was achieved [9]. AISI
253MA stainless steel samples were nitrided at 450°C for
8, 16 and 24 hours, and the highest hardness value and
the best wear resistance were obtained in the nitrided
sample when the nitration time is 24 hours. [10].
Therefore, the optimization is a critical issue to control
the thickness of the nitration layer and so the hardness
and the wear resistance of the nitride steel. In this study,
the ranges for the parameters that are 470⁰C - 520⁰C -
570⁰C, 7h - 9h - 12h and 6m3/h - 7.5m3/h - 9m3/h for
temperature, time and flow rate were covered,
respectively. As a result, the values of residual stress,
hardness and wear resistance were measured to compare.
2.MATERIAL AND METHOD
2.1 Materials
4140 steel is a highly preferred material in the industry
with its high toughness and favorable hardening
performance [11]. SAE 4140 steel, whose chemical
analysis is given in Table 2, was used in the study as the
substrate. OBLF Emission Spectrometer analyzer was
used for chemical analysis detection. It can be used to
determine the chemical composition of materials from
their spectrums with the spectral analysis method [12].
Table 2 also includes the min and max weight amounts
of the elements given for the SAE 4140 in SAE standard
[13].
2.2 Heat Treatment
10 samples of rolled SAE 4140 with the diameters of 30
mm and lengths of 500 mm were prepared. The samples
were preheated up to 500 °C. Then, austenitizing was
applied to the specimens for 2 hours at 840°C in
atmosphere-controlled furnaces. After that the samples
are exposed to water and they are immersed in oil bath at
a temperature of 60°C. Then the samples were cleaned in
a vacuum washing machine using solvent chemicals to
remove oil. They were left to cool at room temperature.
Then the samples were tempered at 630°C for 1 hour.
After tempering, the samples were cleaned again in
vacuum washing machine and nitration process was
applied.
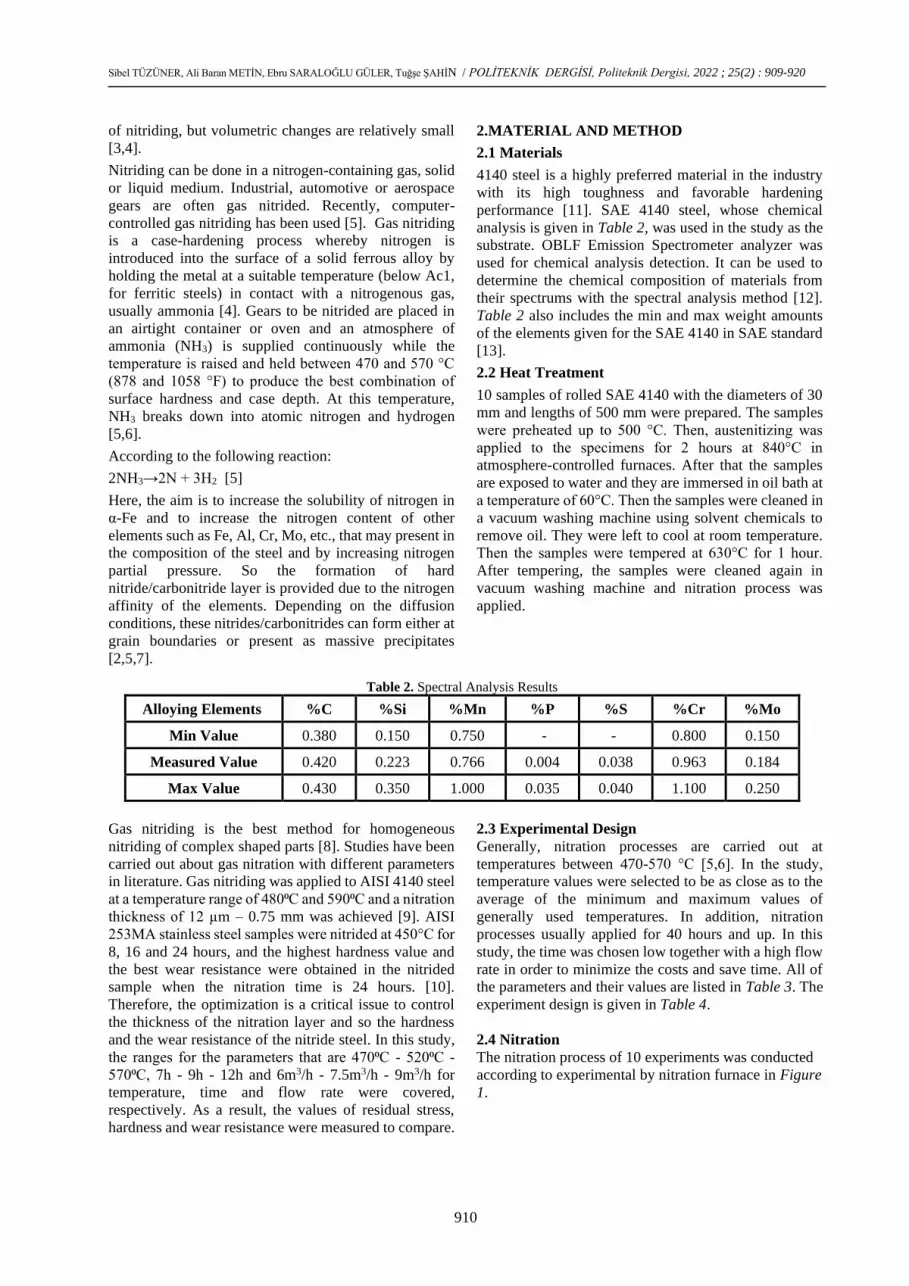
2.3 Experimental Design
Generally, nitration processes are carried out at
temperatures between 470-570 °C [5,6]. In the study,
temperature values were selected to be as close as to the
average of the minimum and maximum values of
generally used temperatures. In addition, nitration
processes usually applied for 40 hours and up. In this
study, the time was chosen low together with a high flow
rate in order to minimize the costs and save time. All of
the parameters and their values are listed in Table 3. The
experiment design is given in Table 4.
2.4 Nitration
The nitration process of 10 experiments was conducted
according to experimental by nitration furnace in Figure
1.
Table 2. Spectral Analysis Results
Alloying Elements %C %Si %Mn %P %S %Cr %Mo
Min Value 0.380 0.150 0.750 - - 0.800 0.150
Measured Value 0.420 0.223 0.766 0.004 0.038 0.963 0.184
Max Value 0.430 0.350 1.000 0.035 0.040 1.100 0.250

GAZ NİTRASYON YAPILAN 4140 ÇELİĞİNİN MİNİMUM KALINTI GERİLİM VE MAKSİM … Politeknik Dergisi, 2022; 25 (2) : 909-920
911
Figure 1. IPSEN Nitration Furnace
IPSEN brand single chamber type VDR(N)-1714-E
vacuum nitration furnace was used in the study. The
furnace measures 900 mm x 1200 mm x 900 mm (W x L
x H) and has a loading capacity of up to 1500 kg. The
operating temperature of the oven is between 150°C -
750°C. VDR nitriding furnace works with full
automation system.
2.5 Hardness
After the nitration process, surface hardness, White layer
Hardness and Thickness, Hard Tissue Hardness and
Depth and Core Hardness values are measured by
“Mitutoyo Vickers Micro Hardness Device”. A load of
20 grams was applied when measuring the hardness from
the core region, and 500 grams was applied when
measuring the hardness from the material surface. In both
cases, the load application time was 30 seconds. Then,
microscope images of each sample were taken by
“Optical Microscope.
Table 3. Nitration Parameters and Their Values (Heating Rate
= 14 C/min)
Nitration
Parameters Value 1 Value 2 Value 3
Temperature [°C] 470 520 570
Time [h] 7 9 12
Flow Rate [m3/h] 6 7.5 9
Table 4. Total Experiment Design
Number of
Experiment
s
Temperatur
e [°C] Time [h]
Flow Rate
[m3/h]
1 470 7 6
2 470 9 7.5
3 470 12 9
4 520 7 7.5
5 520 9 9
6 520 12 6
7 570 7 9
8 570 9 6
9 570 12 7.5
10 570 12 6
2.6 Wear Resistance
Figure 2. Tribometer Device
The wear resistance measurements were conducted for
the maximum and minimum values of the previously
determined parameters shown in Table 5 and also
fractional factorial design is used in order to keep the
number of experiments low.
The number of experiments was reduced to "22 = 4" by
Fractional Factorial Design listed in Table 6. Wear
measurements of 4 samples given in Table 6 were
conducted by the pin-on-disc tribometer (Figure 2).
Whose details are given in the Table 8. The wear test
samples have a diameter of 28 mm and a height of 5 mm.
Table 5. Parameter Values for Wear Test
Nitration Parameters Value 1 Value 2
Temperature [°C] 470 570
Time [h] 7 12
Flow Rate [m3/h] 6 9
Table 6. Experimental Design for Wear Tests
Number of
Experiments
Temperature
[°C] Time [h]
Flow Rate
[m3/h]
1 470 7 6
2 470 12 9
3 570 7 9
4 570 12 6
Sibel TÜZÜNER, Ali Baran METİN, Ebru SARALOĞLU GÜLER, Tuğşe ŞAHİN / POLİTEKNİK DERGİSİ, Politeknik Dergisi, 2022 ; 25(2) : 909-920
912
2.7 Residual Stress
The residual stress values of two samples (3 and 10) with
maximum wear resistance were measured by X-ray
diffraction method with the XRD device given in Figure
3.
Figure 3. Residual Stress Measurement with XRD Method
Stresstech G2R X-Stress 3000 XRD device was used for
residual stress measurement. Electropolishing device
used for layer removal is LectroPOL-5. Depth
measurements were taken with a Mitutoyo digital depth
gauge. The range that can be measured for residual stress
is determined as "200 - 250 micron" for these samples. In
this value range determined by removing the layer with
the electro-polishing method, measurements were taken
from sample 10 at a depth of 212.5 microns and from
sample 3 at a depth of 219.0 microns. This depth
difference can be tolerated, as these depths are performed
at specified intervals and in micron units.
In order to interpret the effect of different values of the
parameters on the result, "Regression Analysis" was
performed in the Minitab program. The equations created
as a result of the analysis were examined through the
main effect graphs.
3.RESULTS AND DISCUSSION
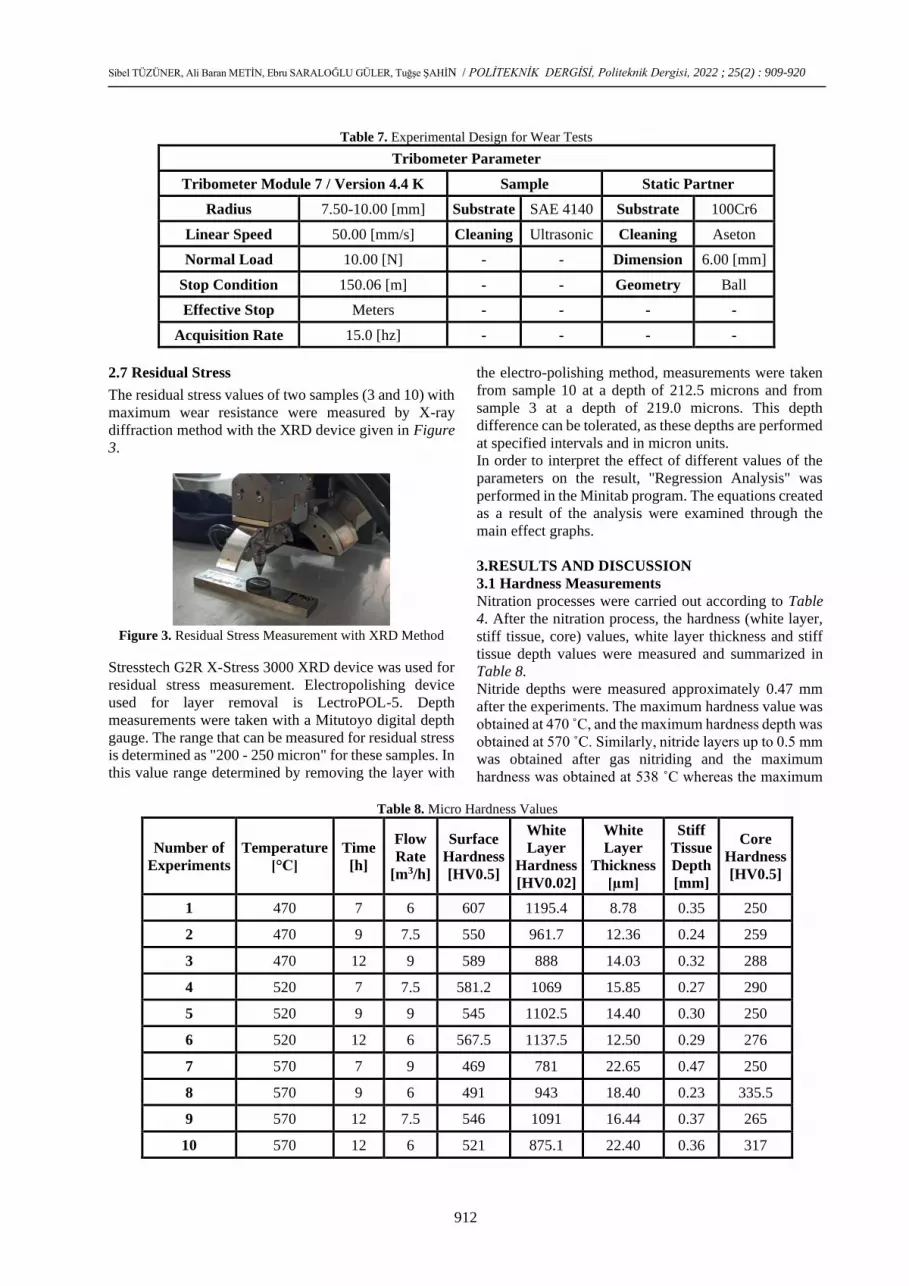
3.1 Hardness Measurements
Nitration processes were carried out according to Table
4. After the nitration process, the hardness (white layer,
stiff tissue, core) values, white layer thickness and stiff
tissue depth values were measured and summarized in
Table 8.
Nitride depths were measured approximately 0.47 mm
after the experiments. The maximum hardness value was
obtained at 470 ̊ C, and the maximum hardness depth was
obtained at 570 ˚C. Similarly, nitride layers up to 0.5 mm
was obtained after gas nitriding and the maximum
hardness was obtained at 538 ˚C whereas the maximum
Table 7. Experimental Design for Wear Tests
Tribometer Parameter
Tribometer Module 7 / Version 4.4 K Sample Static Partner
Radius 7.50-10.00 [mm] Substrate SAE 4140 Substrate 100Cr6
Linear Speed 50.00 [mm/s] Cleaning Ultrasonic Cleaning Aseton
Normal Load 10.00 [N] - - Dimension 6.00 [mm]
Stop Condition 150.06 [m] - - Geometry Ball
Effective Stop Meters - - - -
Acquisition Rate 15.0 [hz] - - - -
Table 8. Micro Hardness Values
Number of
Experiments
Temperature
[°C]
Time
[h]
Flow
Rate
[m3/h]
Surface
Hardness
[HV0.5]
White
Layer
Hardness
[HV0.02]
White
Layer
Thickness
[µm]
Stiff
Tissue
Depth
[mm]
Core
Hardness
[HV0.5]
1 470 7 6 607 1195.4 8.78 0.35 250
2 470 9 7.5 550 961.7 12.36 0.24 259
3 470 12 9 589 888 14.03 0.32 288
4 520 7 7.5 581.2 1069 15.85 0.27 290
5 520 9 9 545 1102.5 14.40 0.30 250
6 520 12 6 567.5 1137.5 12.50 0.29 276
7 570 7 9 469 781 22.65 0.47 250
8 570 9 6 491 943 18.40 0.23 335.5
9 570 12 7.5 546 1091 16.44 0.37 265
10 570 12 6 521 875.1 22.40 0.36 317

GAZ NİTRASYON YAPILAN 4140 ÇELİĞİNİN MİNİMUM KALINTI GERİLİM VE MAKSİM … Politeknik Dergisi, 2022; 25 (2) : 909-920
913
nitride depth was obtained at 650 ˚C. The results were
compatible with the claim of hardness value decreased
with increasing temperature and the depth [14].
In the study, when the 8th and 10th experiments, in which
the temperature and flow values are constant, are
examined as a result of the hardness measurements, the
surface hardness and the hard tissue depth decrease as the
time decreases. Similar to a study that has a result of
hardness values and hardness depths decrease in short
processing times and low temperatures, since diffusion
becomes difficult [2]
3.2 Microstructure
After the hardness measurements, the microscope images
of the samples were taken that show the layers formed
after nitration in Figures 4 - 13.
The formation of nitrided zones begins from a series of
nucleated growth sites on the steel surface. These
nucleation growth areas are referred to as the "white
layer" [15].
The white layer, the outermost nitride layer, name with
nital (3-5% HNO3 + alcohol) appear white after etching
because of the area. White layer hard, brittle and is
resistant to wear. In this layer, γ' (Fe4N) and ε (Fe2N and
Fe3N) phases or a mixture thereof. γ' (Fe4N) has a face
centered cubic (Fe4N) structure. while ε (Fe2-3N) has a
hexagonal structure. Also, the white layer mechanical
properties, the presence of these phases depending on the
amount and the thickness of the layer largely depends. In
the white layer, the γ' (Fe4N) phase formation, due to its
soft and ductile nature, low wear resistance, impact
resistant. While it is preferred in applications, ε (Fe2-3N)
phase formation, high wear resistance it is preferred in
the parts that are desired to be [16]. The region just below
the white layer is called the "diffusion zone". This region
consists of stable nitrides formed by the reaction of
nitrogen with nitride-forming elements. The region
below the diffusion zone is the core of the steel, usually
composed of tempered martensite [15]. The core region
is below the diffusion region and tempered martensite is
1.Experiment
Figure 4. Microscope Image and Hardness-Depth Graph Resulting from Exp-1
Micro Hardness Values;
• White Layer Hardness: 1195.4/0.02/30/HV
• White Layer Thickness: 8.78 µm
• Surface Hardness: 607/0.5/30/HV
• Stiff Tissue Hardness: 307/0.5/30/HV
• Stiff Tissue Depth: 0.35 mm
• Core Hardness: 250/0.5/30/HV
2.Experiment
Figure 5. Microscope Image and Hardness-Depth Graph Resulting from Exp-2
Micro Hardness Values;
• White Layer Thickness: 12.36 µm
• White Layer Hardness: 961.7/0.02/30/HV
• Surface Hardness: 550/0.5/30/HV
• Stiff Tissue Hardness: 306/0.5/30/HV
• Stiff Tissue Depth: 0.24 mm
• Core Hardness: 259/0.5/30/HV

Sibel TÜZÜNER, Ali Baran METİN, Ebru SARALOĞLU GÜLER, Tuğşe ŞAHİN / POLİTEKNİK DERGİSİ, Politeknik Dergisi, 2022 ; 25(2) : 909-920
914
observed in this region. Microscope images of the
samples were made with device “OLYMPUS GX41” and
photos were taken with magnification “x50 & x100”.
3. Experiment
Figure 6. Microscope Image and Hardness-Depth Graph Resulting from Exp-3
Micro Hardness Values;
• White Layer Thickness: 14.03 µm
• White Layer Hardness: 888/0.02/30/HV
• Surface Hardness: 589/0.5/30/HV
• Stiff Tissue Hardness: 333/0.5/30/HV
• Stiff Tissue Depth: 0.32 mm
• Core Hardness: 288/0.5/30/HV
4. Experiment
Figure 7. Microscope Image and Hardness-Depth Graph Resulting from Exp-4
Micro Hardness Values;
• White Layer Thickness: 15.85 µm
• White Layer Hardness: 1069/0.02/30/HV
• Surface Hardness: 581.2/0.5/30/HV
• Stiff Tissue Hardness: 337/0.5/30/HV
• Stiff Tissue Depth: 0.27 mm
• Core Hardness: 290/0.5/30/HV
5. Experiment
Figure 8. Microscope Image and Hardness-Depth Graph Resulting from Exp-5
Micro Hardness Values;
• White Layer Thickness: 14.4 µm
• White Layer Hardness: 1102.5/0.02/30/HV
• Surface Hardness: 545/0.5/30/HV
• Stiff Tissue Hardness: 305/0.5/30/HV
• Stiff Tissue Depth: 0.30 mm
• Core Hardness: 250/0.5/30/HV

GAZ NİTRASYON YAPILAN 4140 ÇELİĞİNİN MİNİMUM KALINTI GERİLİM VE MAKSİM … Politeknik Dergisi, 2022; 25 (2) : 909-920
915
6. Experiment
Figure 9. Microscope Image and Hardness-Depth Graph Resulting from Exp-6
Micro Hardness Values;
• White Layer Thickness: 12.5 µm
• White Layer Hardness: 1137.5/0.02/30/HV
• Surface Hardness: 567.5/0.5/30/HV
• Stiff Tissue Hardness: 323/0.5/30/HV
• Stiff Tissue Depth: 0.29 mm
• Core Hardness: 276/0.5/30/HV
7. Experiment
Figure 10. Microscope Image and Hardness-Depth Graph Resulting from Exp-7
Micro Hardness Values;
• White Layer Thickness: 22.65 µm
• White Layer Hardness: 781/0.02/30/HV
• Surface Hardness: 469/0.5/30/HV
• Stiff Tissue Hardness: 300/0.5/30/HV
• Stiff Tissue Depth: 0.47 mm
• Core Hardness: 250/0.5/30/HV
8. Experiment
Figure 11. Microscope Image and Hardness-Depth Graph Resulting from Exp-8
Micro Hardness Values;
• White Layer Thickness: 18.4 µm
• White Layer Hardness: 943/0.02/30/HV
• Surface Hardness: 491/0.5/30/HV
• Stiff Tissue Hardness: 385/0.5/30/HV
• Stiff Tissue Depth: 0.23 mm
• Core Hardness: 335.5/0.5/30/HV

Sibel TÜZÜNER, Ali Baran METİN, Ebru SARALOĞLU GÜLER, Tuğşe ŞAHİN / POLİTEKNİK DERGİSİ, Politeknik Dergisi, 2022 ; 25(2) : 909-920
916
9. Experiment
Figure 12. Microscope Image and Hardness-Depth Graph Resulting from Exp-9
Micro Hardness Values;
• White Layer Thickness: 16.44 µm
• White Layer Hardness: 1091/0.02/30/HV
• Surface Hardness: 546/0.5/30/HV
• Stiff Tissue Hardness: 322/0.5/30/HV
• Stiff Tissue Depth: 0.37 mm
• Core Hardness: 265/0.5/30/HV
10. Experiment
icro Hardness Values;
• White Layer Thickness: 22.4 µm
• White Layer Hardness: 875.1/0.02/30/HV
• Surface Hardness: 521/0.5/30/HV
• Stiff Tissue Hardness: 377/0.5/30/HV
• Stiff Tissue Depth: 0.36 mm
• Core Hardness: 317/0.5/30/HV
3.3 Wear Test Results
Figure 14. Microscope images taken from different parts of the 1st sample as a result of wear

GAZ NİTRASYON YAPILAN 4140 ÇELİĞİNİN MİNİMUM KALINTI GERİLİM VE MAKSİM … Politeknik Dergisi, 2022; 25 (2) : 909-920
917
As a result of the wear test performed with the parameters specified in Table 7, the amount of wear for the test sample “1” was
measured as 43.470 x 10⁻⁵ mm3/n/m.
Figure 15. Microscope images taken from different parts of the 3rd sample as a result of wear
As a result of the wear test performed with the parameters specified in Table 7, the amount of wear for the test sample “3” was
measured as 1.573 x 10⁻⁵ mm3/n/m.
Figure 16. Microscope images taken from different parts of the 7th sample as a result of wear
As a result of the wear test performed with the parameters specified in Table 7, the amount of wear for the test sample “7” was
measured as 4.280 x 10⁻⁵ mm3/n/m.
Figure 17. Microscope images taken from different parts of the 10th sample as a result of wear
As a result of the wear test performed with the parameters specified in Table 7, the amount of wear for the test
sample “10” was measured as 2.341 x 10⁻⁵ mm3/n/m.

Sibel TÜZÜNER, Ali Baran METİN, Ebru SARALOĞLU GÜLER, Tuğşe ŞAHİN / POLİTEKNİK DERGİSİ, Politeknik Dergisi, 2022 ; 25(2) : 909-920
918
Wear value is inversely proportional to wear resistance
as seen in Table 9, the best wear resistance was observed
in samples 3 and 10.
Due to the low hardness, hard wear are observed on the
surface [17]. Similar to Topcu's study, the results of wear
tests of 3rd,7th and 10th experiments it can be concluded
that the hardness is inversely proportional to the amount
of wear. Except the 1st experiment. The 1st sample was
worn more than the other samples. That the reason can be
attributed to the high hardness leads to brittleness, thus
causing fracture and loss of material.
3.4 Residual Stress Test Results
The results of residual stresses are listed in Table 10. A
compressive stress of 267.6 MPa at a depth of 219
microns from the surface in the 3rd test sample and a
compressive stress of 289.3 MPa at a depth of 212.5
microns in the 10th test sample were found for SAE 4140
steel. Similarly, it was mentioned that the compressive
stress increases as the temperature value increased [18].
It was also found that the tensile residual stress measured
on the surface of the (12 HRC) AISI 4140 steel sample
as 211 MP at a depth of 0.03 mm from the surface [19].
3.5 Minitab Analysis
"Regression Analysis" was performed in Minitab
program to interpret the effect of different values of
parameters on the result. The regression equation for the
hardness value is givens. While performing this analysis,
the "White layer hardness" parameter as the "Response"
value, and the "Temperature, Time and Flow" parameter
values, which are the nitration parameters of the study, as
the "Predictor" value and given in Table 3. The created
equation is;
“White Layer Hardness = 1968 - 1.18 Temperature -
3.4 Time- 42.2 Flow”
In order to interpret the equation created as a result of the
regression analysis more clearly, the hardness values and
the main effect graph in the Anova module of the Minitab
program were created (Figure 18).
Figure 18. Main Effects Plot for White Layer Hardness
The hardness and depth of hardness values are decreased
at short processing times and at low temperatures since
the diffusion becomes difficult. At high temperatures
(over 500 °C), a decrease in hardness is observed due to
the formation of coarse precipitates [20]. As a result of
the Minitab studies given in Figure 18, the hardness
values generally increased at temperature up to 520 °C,
and decreased after 520 ° C.
The same analysis was made for the white layer thickness
values, and the "White Layer Thickness" parameter as the
"Response" value, and the nitration parameters of the
study, "Temperature, Time and Flow" parameters, as the
"Predictor" value. The created equation is;
Table 9. Parameters and Results for Wear Test
Sample Temperature
[°C]
Time
[h]
Flow Rate
[m3/h]
Mean Coefficient
of Friction
Amount of
Wear *(10-5)
[mm3/n/m]
Hardness
[HV0.5]
1 470 7 6 0.625 43.470 607
3 470 12 9 0.685 1.573 581.2
7 570 7 9 0.550 4.280 469
10 570 12 6 0.721 2.341 521
Table 10. Measured Results of Residual Stress
Sample Temperature [°C] Time [h] Flow Rate [m3/h] [MPa]
3 470 12 9 -267.6
10 570 12 6 -289.3

GAZ NİTRASYON YAPILAN 4140 ÇELİĞİNİN MİNİMUM KALINTI GERİLİM VE MAKSİM … Politeknik Dergisi, 2022; 25 (2) : 909-920
919
“White Layer Thickness (µm) = -36.1 + 0.0873
Temperature – 0.013 Time + 0.838 Flow”
In order to interpret the equation created as a result of the
regression analysis more clearly, the white layer
thickness values and the main effect graph in the Anova
module of the Minitab program were created (Figure 19).
Figure 19. Main Effects Plot for White Layer Thickness
The analysis for the White Layer Hardness and white
layer thickness were made for the wear values, and the
"Response" value was added to the "Wear Value"
parameter, and the "Predictor" value was the nitration
parameters of the study, "Temperature, Time and Flow”
parameters are entered. The created equation is;
“Wear Value x (10-5) = 204.4 - 0.1921 Temperature-
4.384 Time - 6.660 Flow”
Among these parameters, it has been observed that the
parameter that affects the wear value the most is the flow
parameter.
In order to interpret the equation created as a result of the
regression analysis more clearly, the wear values and the
main effect graph in the Anova module of the Minitab
program were created (Figure 20).
Figure 20. Main Effects Plot for Wear Value
In general, it is expected that the wear value will increase
as the friction coefficient increases [18]. However, in this
study, the non-planarity of the test samples and the
presence of traces on the sample surface due to the
cutting process during the sample preparation process
caused the correct ratio between the friction coefficient
and the wear value to not be fully achieved. Therefore,
maximum wear could not be obtained in the sample with
the maximum average friction coefficient in the study.
In the white layer hardness, analysis and the least
affecting parameter is the temperature parameter.
As a result of the wear measurements, the samples with
the highest and lowest wear resistance were the sample
of the 3rd Experiment, and 1st Experiment, respectively.
As can be seen from the test parameters and the
regression equation, the flow parameter has a significant
effect on the strength.
It was observed that the two samples with the highest
wear resistance were the 3rd Experiment and 10th
Experiment samples, respectively. When the test
parameters of these two samples were examined, it was
determined that the flow rate parameter had more effect
on the strength value than the temperature.
Residual stresses of test samples 3 and 10 were measured
by X-ray diffraction method in order to correlate the
residual stresses between the two samples with the best
wear resistance so to reach the aim of the project that is
maximum wear resistance and minimum residual stress.
As a result of the measurements listed in Table 10,
compressive stresses were 276.6 MPa in experiment 3,
and 289.3 MPa in experiment 10, respectively.
In conclusion, experiment 3 provides both the maximum
wear resistance and the minimum residual stress value.
4.CONCLUSIONS
• In this study; the effect of nitration parameters
on material properties was observed by using 3
different parameters and different values of
these parameters.
• After all the experiments and measurements
were completed, the data was evaluated by the
Minitab program and regression equations were
generated. It was observed that the flow rate was
the most effective parameter.
• As a result of the study, the highest surface and
white layer hardness was obtained in the 1st
Experiment.
• The sample with the highest wear resistance was
obtained in the 3rd Experiment, and the lowest
one was obtained in the 1st Experiment.
• The sample with the lowest residual stress value
was obtained in the 3rd Experiment.
• Based on these results, the sample that provides
the "maximum wear resistance and minimum
residual stress" values, which is the aim of the
study, was determined as number 3.
• The application of nitration by the optimum
parameters specified in this study increased the
wear resistance of the material by 60%.
ACKNOWLEDGMENT
This study was carried out at Hidromek Component
Factory. So, we would like to thank HIDROMEK for
their support in the realization of this study, and

Sibel TÜZÜNER, Ali Baran METİN, Ebru SARALOĞLU GÜLER, Tuğşe ŞAHİN / POLİTEKNİK DERGİSİ, Politeknik Dergisi, 2022 ; 25(2) : 909-920
920
TUBITAK BIDEB for their support within the scope of
TUBITAK 2209-B Industry-Oriented Undergraduate
Research Projects Support Program.
DECLARATION OF ETHICAL STANDARDS
The author(s) of this article declare that the materials and
methods used in this study do not require ethical
committee permission and/or legal-special permission.
AUTHORS’ CONTRIBUTIONS
Sibel TÜZÜNER: Performed the experiments and wrote
the manuscript.
Ali Baran METİN: Performed the experiments and
wrote the manuscript.
Ebru SARALOĞLU GÜLER: Helped with article
layout.
Tuğçe ŞAHİN: Helped with article layout.
CONFLICT OF INTEREST
There is no conflict of interest in this study.
REFERENCES
[1] Kaplan Y., Yildirim A., Aksoz S., “The Effect of
Oxidation Process After Nitrocarburization on
Tribological Properties of AISI 4140 Steel”, Journal
of Polytechnic, 23(4): 1357-1362, (2020)
[2] Polat S., Atapek S.H., Topac H., “Microstructural
Characterization on AISI 4140 and DIN 1.2344 Steels
Surface Hardened by Gas Nitration”, 6th
International Advanced Technologies Symposium
(IATS’11), Elazig Turkey, 498-502, (2011).
[3] Mcquaid H.W., Ketcham W.J., “Practical Nitriding
and Ferritic Nitrocarburizing”, Source Book on
Nitriding, ASM International, Ohio USA, (2003).
[4] ASM International Handbook Committee, “Gas
Nitriding of Steels”, Metals Handbook, ASM
International, Vol.4 Heat Treating, 880-882, (1999).
[5] Rakhit A.K., “Nitriding Gears”, Heat Treatment of
Gears, ASM International, USA, (2000).
[6] BS EN 10085, “Nitriding Steel Technical
Delivery Conditions”, (2001).
[7] Peng D. Q., Kim T. H., Chung J. H., Park J. K.,
“Development of nitride-layer of AISI 304 austenitic
stainless steel during high-temperature ammonia gas-
nitriding”, Applied Surface Science, 256: 7522-7529,
(2010).
[8] Hernandez, M. H. S. M., Staia, M. H. & Puchi-
Cabrera, E. S., “Evaluation of microstructure and
mechanical properties of nitrided steels”, Surface
and Coating Technologies, 202, 1935-1943, (2008).
[9] Yaman O., “Assesment of the Nitriding Process
Parameters to Improve the Wear Resistance of
Selected Steels”, M.Sc., Bogazici University
Mechanical Engineering, (2009).
[10] Sree, K. R., Reddy, G. K., Aishwarya, K., Devi, E.
N., & Subbiah, R., “New Insights of Wear Behavior
Analysis on Low Temperature Treated AISI 253MA
Stainless Steel Material by Gas Nitriding Process”,
E3S Web of Conferences ICMED (Vol. 184, p.
01003), (2020).
[11] Pinar M.A., Firat K., “Optimization of Surface
Roughness Performance in the Turning of AISI
4140 Steel with Multi Directional Cutting Tool”,
Journal of Polytechnic, 19(4): 491-498, (2016)
[12] Wang S., Wang Y., Liu C., & Mazumder J., “In-Situ
Monitoring on Micro-Hardness of Laser Molten
Zone on AISI4140 Steel by Spectral Analysis”,
Scientific Reports, 10(1): 1-12, (2020)
[13] SAE J 1268, “Standard Alloy H Steels”, (2010).
[14] Porter D.A., Easterling K.E., “Phase
Transformations in Metals and Alloys 4th Edition”,
CRC Press, USA, (2021).
[15] Korkmaz. K, “Effects of The White Layer Formed
by Gas Nitriding on The Wear Behavior of
Nitriding Steel”, M.Sc., Gebze Technical
University Department of Materials Science and
Engineering, (2020).
[16] Holm, T., Sproge, L., “Nitriding and
Nitrocarburizing”, Furnace Atmospheres 3, AGA,
SWE, (1996).
[17] Topcu S., “Determination of Wear Behavior of
Plasma Nitrided Steels Under Different
Conditions”, M.Sc., Uludag University Institute of
Science Department of Mechanical Engineering,
(2010).
[18] Gecu R., “Investigation of Residual Stress and
Hardness Changes in Gas Nitrided 31CrMoV9
Steel by Indentation Method”, M.Sc., Istanbul
Technical University Metallurgical and Materials
Engineering Department Materials Engineering
Program, (2014).
[19] Subasi M., Karatas C., “Investigation of the Effect
of Different Hardnesses Obtained in AISI 4140
Steel on Residual Stress”, Journal of Polytechnic,
14(4): 289-295, (2011).
[20] Asan N.O., “Improving the Surface Properties with
Nitrogen Diffusion to the Steel Surface”, M.Sc.,
Yıldız Technical University Metallurgical and
Materials Engineering, (2004).


