Embed Size (px)
Citation preview
Ausrralian Journal of Ecology (1993) 18, 181-191
T h e biodiversity of arthropods from Australian rainforest canopies: General introduction, methods, sites and ordinal results
R. L. KITCHING,l* J. M. BERGELSON,Zt M. D. LOWMAN,3* S. McINTYREl A N D G. CARRUTHERS' Departments of 1Ecosystem Management and 3Botany, University of New England, Armidale, NSW 2351, Australia, and 2Department of Zoology, University of Oxfmd, South Parks Rd, Oxford OX1 3PS, UK
Abstract The arthropod assemblages occurring in the canopies of tropical, subtropical and cool temperate sites have been sampled using a pyrethrum knockdown technique. Details of the techniques used and the climate and vegetation of the areas studied are presented together with an analysis of the distribution of individual arthropods across Orders. An approach using generalized linear modelling partitioned the variance in numbers among sites within forest types and across the three forest types. The effects of both these components were significant. The differences between the ordinal signatures of each forest type are discussed and a number of hypotheses proposed to account for these differences, based on knowledge of the biology of the groups concerned. For the tropical and subtropical sites a comparison was made between samples collected in the low to mid-canopy with ones collected in the high canopy. Numbers of both insects and non-insects collected differed significantly with height in the subtropical forest and the distribution of insects across Orders was also significantly different in this forest type. In the tropical forests numbers of insects differed significantly between the two strata but neither the numbers of non-insects nor the ordinal profiles of either insects or non-insects were shown to be significantly different.
INTRODUCTION
There has been considerable interest in the arthro- pod fauna that occurs in rainforest canopies recently. Erwin's (1982) hypotheses concerning the total number of species of tropical forest arthro- pods, which were based on his studies of Coleop- tera in Panamanian canopies, have been followed by further studies in the Neotropics (Adis et al. 1984, Erwin 1983,1990), Borneo (Stork 1987a, b), Seram (Stork 1988) and Sulawesi (Stork & Brendell 1990, Hammond 1990). Considerable debate has ensued over estimates of the size of the global arthropod fauna (May 1988, Wilson 1988, Stork 1988, Monteith 1990, Gaston 1991, Erwin 1991, Hodkinson & Casson 1991) with panicipants argu- ing fiercely over the various multipliers involved in
*Present address: School of Australian Environmental Studies, G r f i t h University, Nathan, Qld 41 11, Australia.
tPresent address: Departmcnt of Biology, Washington Univer- sity, St Louis, MO 63130, USA.
*Present address: Department of Biology, Williams College, Williamstown, MA 01267, USA.
Accepted for publication June 1992.
each estimate. T h e actual database on which these generalizations are based is small, perhaps reflect- ing the difficulty in generating appropriate field data.
While the actual number of species in canopy faunas remains ambiguous, their speciosity has become apparent with the application of tech- niques involving insecticidal knockdown of canopy faunas. This method, pioneered by workers such as Roberts (1973) and Southwood (e.g. Southwood et al. 1982), enables large mixed samples of arthro- pods to be obtained from forest canopies using either fogging devices or a variety of spraying machines, from aerosol cans to orchardists' back- pack dispensers. Samples can then be returned to the laboratory and sorted both taxonomically (usually to 'morphospecies') and ecologically (to guilds). T h e recent interest in the canopy fauna of rainforests stems from the studies of Erwin (1983, 1990), who applied fogging techniques in selected Neotropical forests.
T h e arthropods from Australian rainforest cano-
1 8 2 R. L. K I T C H I N G E T A L .
pies have received little attention to date, although the knockdown technique has been used in dry Australian sclerophyll woodlands (Majer & Recher 1988) and Tasmanian temperate rainforests (Yen & Lillywhite 1990). Nevertheless, Australia pres- ents to the rainforest ecologist a unique oppor- tunity to relate arthropod numbers and diversity to the gradient of climatic conditions and floral com- plexity evident between tracts of rainforest from the tropical north of Queensland to the cool, temperate regions of Tasmania.
This paper is the first in a projected series which describes the results of knockdown sampling of arthropods from canopies of cool temperate, trop- ical and subtropical rainforests. General methods and descriptions of study sites are presented together with results and analyses at the level of the Order. In particular, the role of within and be- tween forest type variation is examined, and upper and lower canopy layers are compared. More detailed results on particular Orders and/or forest types will be presented in subsequent papers.
METHODS
Subtropical and tropical sites
In subtropical and tropical forests, 10 X 10 m plots were established in forest and a 'column' of canopy sampled. Sites were selected for study on the basis of canopy structure, tree species composition and accessibility. T h e need to transport considerable amounts of equipment and to find appropriate, high horizontal branches (see below) precluded randomization of sites within the study areas. However, a spread of locations within each forest type was achieved and the locations and intersite distances of each were recorded.
At each site a rope was attached to a pulley over a high central branch after initial access had been gained by catapulting a lead weight and fishing line over the branch. A cats-cradle of lighter ropes was then erected at head height over the area of the plot and a number of circular, cotton collecting fun- nels, each 0.5 m2, were hung throughout the plot. Generally, 10 funnels were used, with minor vari- ation in this number resulting from individual situations and logistic vicissitudes. A collecting vial containing ethanol was inserted into the apex of each funnel.
A pyrethroid insecticide, Pyrethrins 2ELTM, delivered using a Stihl SG-17TM backpack mister,
was used in all cases. T h e insecticide, in con- centrated form, comprised natural pyrethrins at 20 g L-1 with piperonyl butoxide at 80 g L-1. This mixture was diluted in.water at the rate of 1.25 L to 9 L of water. T h e mister has a range of 6.2 m in still conditions. Two separate samples were taken at each site; the first, delivered from the ground, focused on the understorey from 2 to 6 m in height, and the second, delivered after the sprayer had been hauled into the canopy using the suspended rope, focused on the high canopy. We refer to these as low and high sprays. The exact height of the high sample reflected the height of the canopy at particular sites, being some 8-10 m below the top of the canopy in most cases. There was no physical overlap between the target areas of the two sprays. The two sprays at each site were separated by at least 24 h, each occurred early in the morning in windless conditions and lasted for approximately 5 min. Arthropods were brushed into the collecting vials in each funnel between 1 and 3 h after each spraying event. In a pilot study in which trays were exposed after spraying for 4 h, we found that 63% of arthropods collected fell from the canopy within 1 h, 78% within 2 h and 90% after 3 h. Vials were collected and sorted to the ordinal level in a field laboratory.
A vegetation transect, 30 X 4 m, was run through all nine sites in the subtropical forest and five of the six in the tropical situation. All plants greater than 1 m in height were identified, and their positions and heights measured. A detailed profile diagram was then constructed. For the tropical sites, a complete survey of all woody plants greater than 1.5 m in height in the 10 X 10 m plot was also made.
All samples were taken in the wet season. Results reported here are from nine sites located in the subtropical rainforest adjacent to Lamington National Park, southeast Queensland, collected in December 1989 and January 1990; and, an ad- ditional six sites in the tropical forests around Cape Tribulation, north Queensland, collected in Janu- ary 1991. Descriptions of the sites are presented below.
Cool temperate sites
Five trees were sampled in the Styx River State Forest, east of Armidale, in February 1990. Notho- fagus mooreiis by far the most abundant tree species in this forest. Individual trees of this species were
B I O D I V E R S I T Y O F A R T H R O P O D S 1 8 3
sampled by suspending 10 collecting funnels within the canopy of each tree. Other details of the spraying events were as for the subtropical and tropical forests.
STUDY SITES AND VEGETATION
Tropical forest
All tropical sites are located close to Cape Tribu- lation (16"04'S, 145"28'E) in north Queensland. The first two sites sampled are located on the
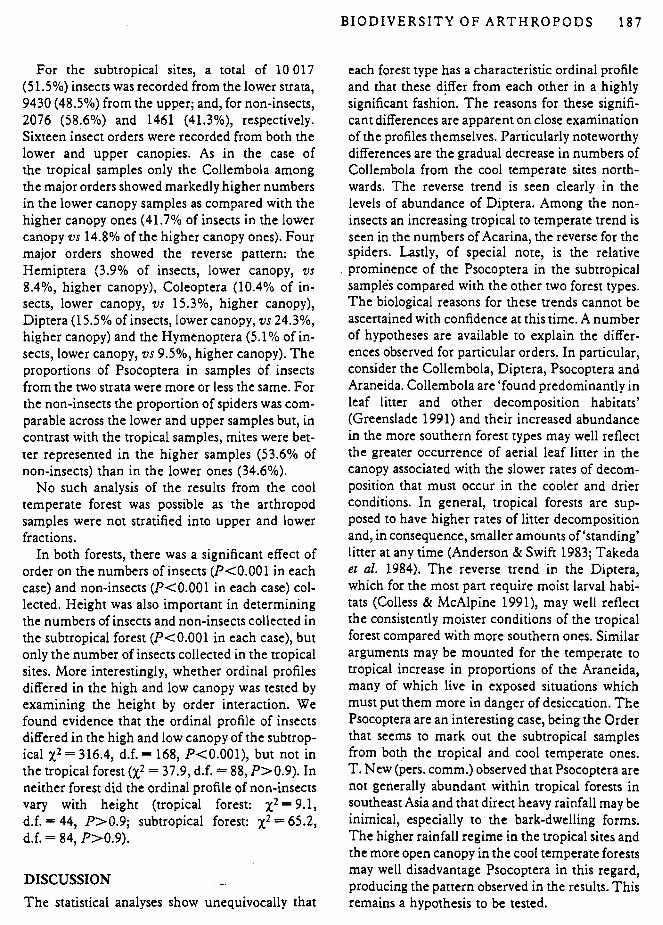
J F M A M J J A S O N D
1"
J F M A M J J A S O N D
J F M A M J J A S O N D
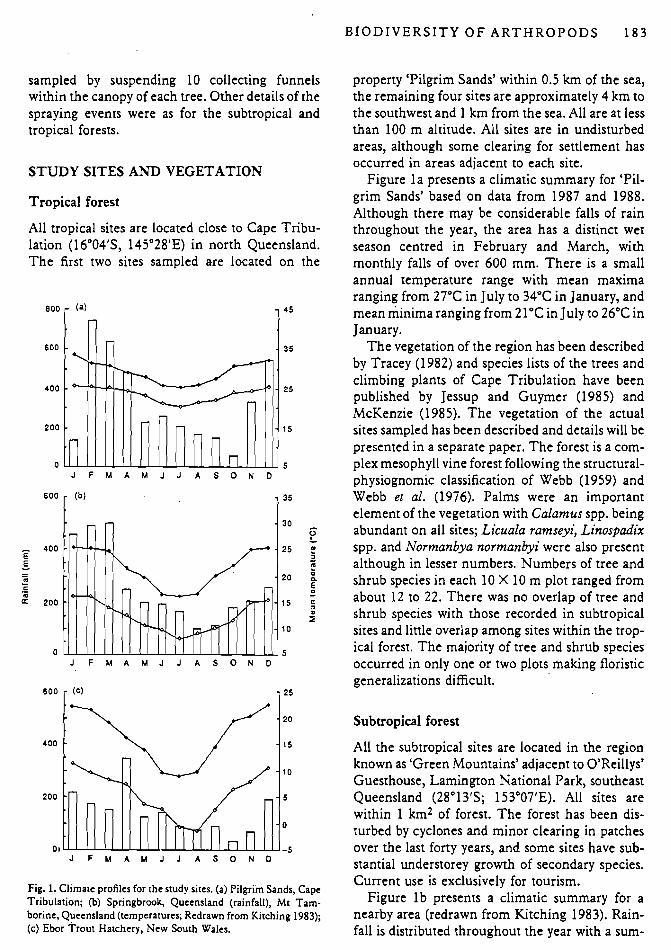
Fig. 1. Climate profiles for the study sites. (a) Pilgrim Sands, Cape Tribulation; (b) Springbrook, Queensland (rainfall), Mt Tam- borine, Queensland (temperatures; Redrawn from Kitching 1983); (c) Ebor Trout Hatchery, New South Wales.
property 'Pilgrim Sands' within 0.5 km of the sea, the remaining four sites are approximately 4 km to the southwest and 1 km from the sea. All are at less than 100 m altitude. All sites are in undisturbed areas, although some clearing for settlement has occurred in areas adjacent to each site.
Figure l a presents a climatic summary for 'Pil- grim Sands' based on data from 1987 and 1988. Although there may be considerable falls of rain throughout the year, the area has a distinct wet season centred in February and March, with monthly falls of over 600 mm. There is a small annual temperature range with mean maxima ranging from 27°C in July to 34°C in January, and mean minima ranging from 2 1°C in July to 26°C in January.
The vegetation of the region has been described by Tracey (1982) and species lists of the trees and climbing plants of Cape Tribulation have been published by Jessup and Guymer (1985) and McKenzie (1985). The vegetation of the actual sites sampled has been described and details will be presented in a separate paper. The forest is a com- plex mesophyll vine forest following the structural- physiognomic classification of Webb (1959) and Webb et al. (1976). Palms were an important element of the vegetation with Calamus spp. being abundant on all sites; Licuala ramseyi, Linospadix spp. and Normanbya normanbyi were also present although in lesser numbers. Numbers of tree and shrub species in each 10 X 10 m plot ranged from about 12 to 22. There was no overlap of tree and shrub species with those recorded in subtropical sites and little overlap among sites within the trop- ical forest. The majority of tree and shrub species occurred in only one or two plots making floristic generalizations difficult.
Subtropical forest
All the subtropical sites are located in the region known as 'Green Mountains' adjacent to O'Reillys' Guesthouse, Lamington National Park, southeast Queensland (28'13's; 153'07'E). All sites are within 1 km* of forest. The forest has been dis- turbed by cyclones and minor clearing in patches over the last forty years, and some sites have sub- stantial understorey growth of secondary species. Current use is exclusively for tourism.
Figure l b presents a climatic summary for a nearby area (redrawn from Kitching 1983). Rain- fall is distributed throughout the year with a sum-
1 8 4 R. L. K I T C H I N G E T A L .
mer peak in February and March (ca 500 mrn per month) and a winter minimum in August (ca 100 mm per month). Mean maximum tempera- tures range from 16°C in July to 25°C in January, and mean minima from 8°C in July to 16°C in January.
The vegetation of the region has been described by McDonald and Whiteman (1979) and McDon- ald and Thomas (1990). The forest is a complex notophyll vine forest following the classification of Webb (1959), and a 'Subtropical Rainforest, Agyrodendron actinophyllum alliance, Suballiance 1 1 (Caldcluvia-Cryptocarya erythroxylon-Orites- Melicope octandra-Acmena ingens)' of Floyd (1990). Floyd (1990) gives detailed floristic information on the same vegetation type from the adjacent Border Ranges National Park, in New South Wales. A total of 74 woody species was recorded from the transects taken through the sites. Their canopies were varied but were dominated by species such as Geossois benthamii, Lophostemon conferta, Agy- rodendron actinophyllum, Ficus watkinsiana, Baloghia lucida and Pseudowienmannia lachno- carpa. The commonest understorey species were Acradenia euodizj5ormis, Synoum glandulosum, Dysoxylon rubrum, Wilkeia spp. and Triunia youngiana.
Cool temperate forest
The sites are located in the Styx River State Forest (3V3 l'S, 152"17'E) of northern New South Wales, 53 km east of the city of Armidale. Their altitude is approximately 1100 m. All sites are in undisturbed areas.
Figure l c presents a climatic summary for the 1988-91 period based on data collected at the Ebor Trout Hatchery, a few kilometres west of the study site. Rainfall is, overall, somewhat less than at the other sites, with no marked peaks. Average monthly totals vary from 34.8 mm in August to 342.5 mm in April. In general, the late summer months are the wettest. Mean maximum tempera- tures range from 9.l0C in July to 22.8"C in Decem- ber, and mean minima from - 1.2"C in July to 1 1.4"C in January.
The vegetation of the region has been described by Floyd (1990). The forest is a microphyll fern forest following the structural-physiognomic classification of Webb et d. (1976). Floyd (1990) described it as 'cool temperate rainforest of the
Nothofagus mmei alliance, Nothofagus-Ceratopeta- lum suballiance'. The canopy is a virtual mono- culture of Nothofagus moorei with Ceratopetalum apetalum in gaps and in the understorey. Other common trees include Doryphora sassaftar, Cald- cluvia paniculosa and Quintinia sieberi (Floyd 1990).
Analysis
The original data sets for each site contained 32 categories comprising 22 orders of insects and 10 orders of non-insectan arthropods. Many of these categories occurred very rarely and, accordingly, some were combined for statistical analysis. The resulting 14 categories, based for the most part on combining closely related groups, were as follows: Collembola; Blattoid-Orthopteroids (Orthoptera, Phasmatodea, Blattodea, Isoptera, Embioprera, Plecoptera, Dermaptera, Mantodea - referred to in the figures as Orthopteroids); Psocoptera; other Hemipteroids (Homoptera, Heteroptera, Thy- sanoptera); Coleoptera; Diptera; Lepidoptera; Hymenoptera; other Insects (Megaloptera, Neur- optera, Strepsiptera, Mecoptera and Trichoptera); Araneae; Acarina; 'other Arachnids' (Opiliones, Scorpiones, Pseudoscorpiones, Onychophora); Myriapoda (Chilopoda and Diplopoda); and Crus- tacea (Isopoda and Amphipoda).
Structured multinomial logit models were fitted separately to the insect data and to the non-insect data using the GLIMTM package for generalized linear modelling. The purpose of this analysis was to investigate differences in the frequency distri- bution of individuals among orders (henceforth, 'ordinal profile'). For these analyses, the response variable was the number of individuals in each order at each sampling site. For comparisons of one forest type with another, this required sum- ming the samples from the high and low canopy in the tropical and subtropical sites. A separate analy- sis using the same approach was carried out in order to compare the arthropod assemblages from the high canopy with that from the low canopy for the tropical and subtropical sites. Because unequal numbers of funnels were used in the different forest types and in different sites within each forest, the counts were standardized, in each case, as the number of individuals per funnel.
The models that were fitted considered that counts fell on a logarithmic scale (log link function
B I O D I V E R S I T Y O F A R T H R O P O D S 1 8 5
in GLIMTM) and that errors followed a Poisson distribution (Aitken er d. 1989). Assessment of normal probability plots verified that these as- sumpuons were appropriate. For the first analysis, categories designating the orders, the forest types and the sampling sites were used as the predictor variables. Sampling sites were nested within forest. In order to assess whether the ordinal profile varied across forests and/or across sampling sites within forests, the relevant terms were the inter- actions between order and forest or order and site, respectively.
As indicated above, for both the uopical and sub- tropical forests, separate samples were collected in the low and the high canopy at each site. For each of these forest types, statistical analysis of the pat- tern of occurrence of orders between the two strata were carried out by fitting additional multinomial logit models to the insect and non-insect results. The effects of order, height and the height by order interaction were added sequentially. Again, the number of individuals per order per funnel was used as the response variable. The counts were as- sessed on a logarithmic scale (log link function in GLIMTM) and errors followed a Poisson distri- bution. The predictor variables were categories designating the orders and the height of the col- lecting hoop. Heights were nested in the sampling sites so that pairs were considered jointly. When determining whether the ordinal profile differed between the two height categories, the relevant term was the interaction between order and height.
RESULTS
Figure 2 presents a summary of the results from the uopical and the subtropical sites. Results from the cool temperate forest at the Styx River site are presented in Figure 3.
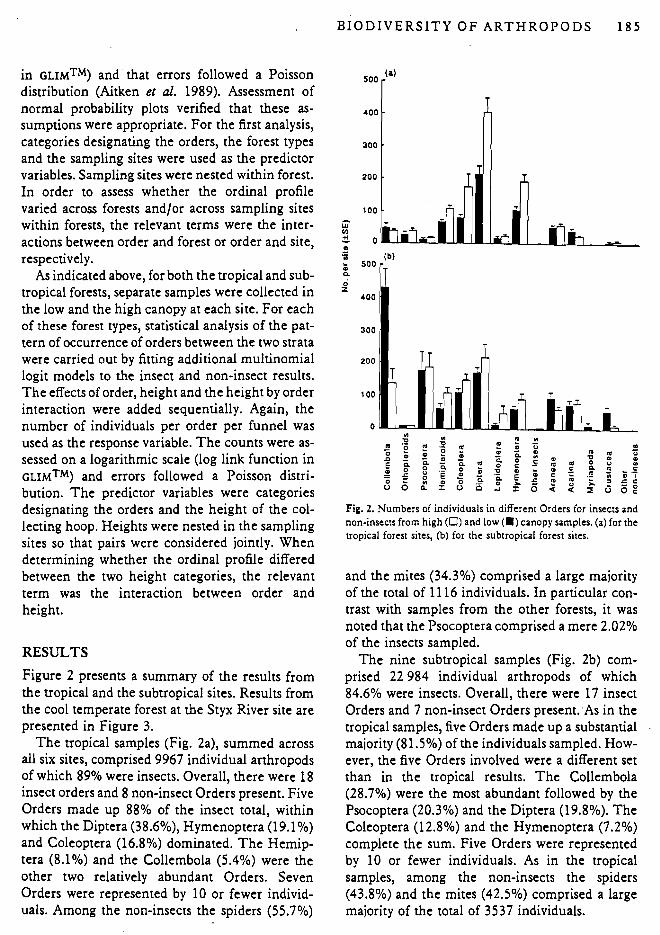
The uopical samples (Fig. 2a), summed across all six sites, comprised 9967 individual arthropods of which 89% were insects. Overall, there were 18 insect orders and 8 non-insect Orders present. Five Orders made up 88% of the insect total, within which the Diptera (38.6%), Hymenoptera (19.1%) and Coleoptera (16.8%) dominated. The Hemip- tera (8.1%) and the Collembola (5.4%) were the other two relatively abundant Orders. Seven Orders were represented by 10 or fewer individ- uals. Among the non-insects the spiders (55.7%)
Fig. 2. Numbers of individuals in different Orders for insects and non-insects from high (0) and low (m) canopy samples. (a) for the tropical forest sites, (b) for the subtropical forest sites.
and the mites (34.3%) comprised a large majority of the total of 11 16 individuals. In particular con- trast with samples from the other forests, it was noted that the Psocoptera comprised a mere 2.02% of the insects sampled.
The nine subtropical samples (Fig. 2b) com- prised 22 984 individual arthropods of which 84.6% were insects. Overall, there were 17 insect Orders and 7 non-insect Orders present:As in the tropical samples, five Orders made up a substanual majority (81.5%) of the individuals sampled. How- ever, the five Orders involved were a different set than in the tropical results. The Collembola (28.7%).were the most abundant followed by the Psocoptera (20.3%) and the Diptera (19.8%). The Coleoptera (12.8%) and the Hymenoptera (7.2%) complete the sum. Five Orders were represented by 10 or fewer individuals. As in the tropical samples, among the non-insects the spiders (43.8%) and the mites (42.5%) comprised a large majority of the total of 3537 individuals.
1 8 6 R. L. K I T C H I N G E T A L .
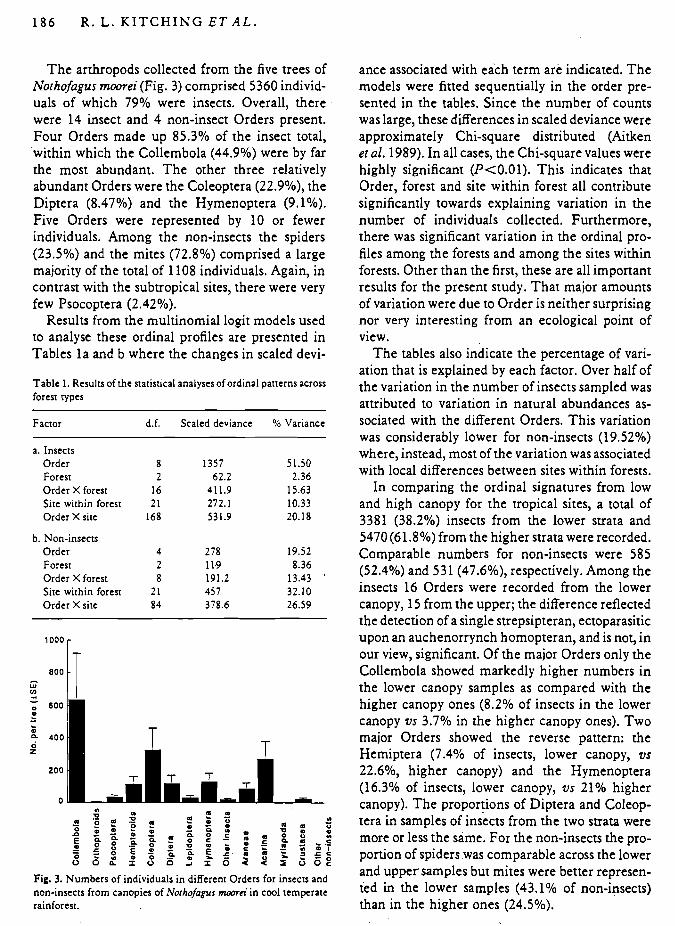
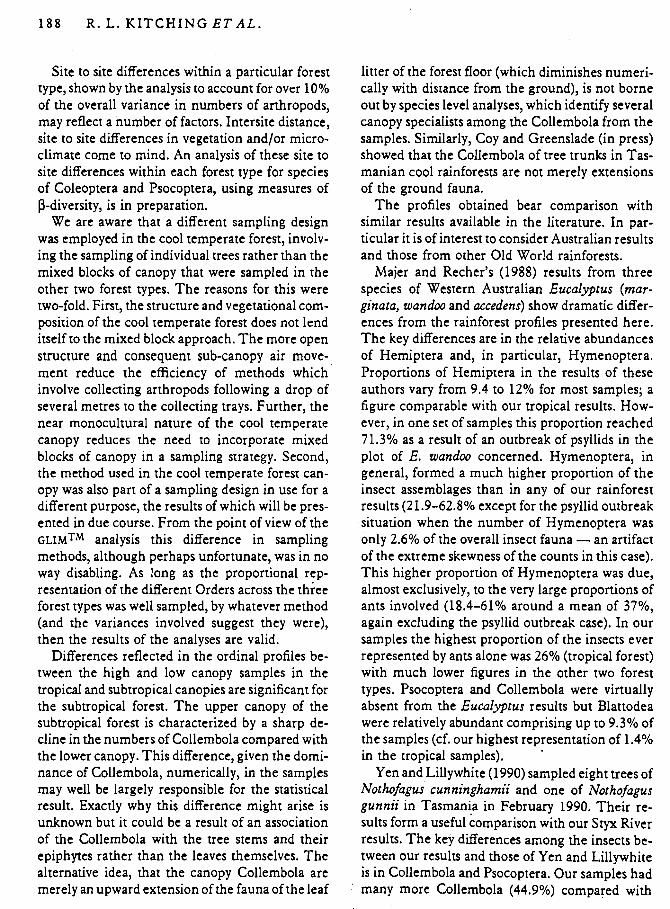
T h e arthropods collected from the five trees of Nothofagus moorei (Fig. 3) comprised 5360 individ- uals of which 79% were insects. Overall, there were 14 insect and 4 non-insect Orders present. Four Orders made up 85.3% of the insect total, 'within which the Collembola (44.9%) were by far the most abundant. The other three relatively abundant Orders were the Coleoptera (22.9%), the Diptera (8.47%) and the Hymenoptera (9.1%). Five Orders were represented by 10 or fewer individuals. Among the non-insects the spiders (23.5%) and the mites (72.8%) comprised a large majority of the total of 1108 individuals. Again, in contrast with the subtropical sites, there were very few Psocoptera (2.42%).
Results from the multinomial logit models used to analyse these ordinal profiles are presented in Tables l a and b where the changes in scaled devi-
Table l. Results of the statistical analyses of ordinal patterns across forest types
Factor d.f. Scaled deviance % Variance
a. Insects Order 8 1357 51.50 Forest 2 62.2 2.36 Order X forest 16 411.9 15.63 Site within forest 21 272.1 10.33 Order X site 168 531.9 20.18
b. Non-insects Order 4 278 19.52 Forest 2 119 8.36 Order X forest 8 191.2 13.43 '
Site within forest 21 45 7 32.10 Order X site 84 378.6 26.59
Fig. 3. Numbers of individuals in different Orders for insects and non-insects from canopies of Norhofagus moora' in cool temperate rainforest.
ance associated with each term are indicated. The models were fitted sequentially in the order pre- sented in the tables. Since the number of counts was large, these differences in scaled deviance were approximately Chi-square distributed (Aitken et al. 1989). In all cases, the Chi-square values were highly significant (P(0.01). This indicates that Order, forest and site within forest all contribute significantly towards explaining variation in the number of individuals collected. Furthermore, there was significant variation in the ordinal pro- files among the forests and among the sites within forests. Other than the first, these are all important results for the present study. That major amounts of variation were due to Order is neither surprising nor very interesting from an ecological point of view.
The tables also indicate the percentage of vari- ation that is explained by each factor. Over half of the variation in the number of insects sampled was attributed to variation in natural abundances as- sociated with the different Orders. This variation was considerably lower for non-insects (19.52%) where, instead, most of the variation was associated with local differences between sites within forests.
In comparing the ordinal signatures from low and high canopy for the tropical sites, a total of 3381 (38.2%) insects from the lower strata and 5470 (61.8%) from the higher strata were recorded. Comparable numbers for non-insects were 585 (52.4%) and 531 (47.6%), respectively. Among the insects 16 Orders were recorded from the lower canopy, 15 from the upper; the difference reflected the detection of a single strepsipteran, ectoparasitic upon an auchenorrynch homopteran, and is not, in our view, significant. Of the major Orders only the Collembola showed markedly higher numbers in the lower canopy samples as compared with the higher canopy ones (8.2% of insects in the lower canopy v s 3.7% in the higher canopy ones). Two major Orders showed the reverse pattern: the Hemiptera (7.4% of insects, lower canopy, v s 22.6%, higher canopy) and the Hymenoptera (16.3% of insects, lower canopy, v s 21% higher canopy). The proportions of Diptera and Coleop- tera in samples of insects from the two strata were more or less the same. For the non-insects the pro- portion of spiders was comparable across the lower and upper samples but mites were better represen- ted in the lower samples (43.1% of non-insects) than in the higher ones (24.5%).
B I O D I V E R S I T Y O F A R T H R O P O D S 187
For the subtropical sites, a total of 10 017 (51.5%) insects was recorded from the lower strata, 9430 (48.5%) from the upper; and, for non-insects, 2076 (58.6%) and 1461 (41.3%), respectively. Sixteen insect orders were recorded from both the lower and upper canopies. As in the case of the tropical samples only the Collembola among the major orders showed markedly higher numbers in the lower canopy samples as compared with the higher canopy ones (41.7% of insects in the lower canopy us 14.8% of the higher canopy ones). Four major orders showed the reverse pattern: the Hemiptera (3.9% of insects, lower canopy, us 8.4%, higher canopy), Coleoptera (10.4% of in- sects, lower canopy, us 15.3%, higher canopy), Diptera (15.5% of insects, lower canopy, us 24.3%, higher canopy) and the Hymenoptera (5.1% of in- sects, lower canopy, us 9.5%, higher canopy). The proportions of Psocoptera in samples of insects from the two strata were more or less the same. For the non-insects the proportion of spiders was com- parable across the lower and upper samples but, in contrast with the tropical samples, mites were bet- ter represented in the higher samples (53.6% of non-insects) than in the lower ones (34.6%).
No such analysis of the results from the cool temperate forest was possible as the arthropod samples were not stratified into upper and lower fractions.
In both forests, there was a significant effect of order on the numbers of insects (P<0.001 in each case) and non-insects (P<0.001 in each case) col- lected. Height was also important in determining the numbers of insects and non-insects collected in the subtropical forest (P t0 .001 in each case), but only the number of insects collected in the tropical sites. More interestingly, whether ordinal profiles differed in the high and low canopy was tested by examining the height by order interaction. We found evidence that the ordinal profile of insects differed in the high and low canopy of the subtrop- ical x2 = 316.4, d.f. = 168, P<0.001), but not in the tropical forest ( ~ 2 = 37.9, d.f. = 88, P>0.9). In neither forest did the ordinal profile of non-insects vary with height (tropical forest: x2=9.1, d.f. = 44, P>0.9; subtropical forest: x2 = 65.2, d.f. = 84, P>0.9).
DISCUSSION .-.
T h e statistical analyses show unequivocally that
each forest type has a characteristic ordinal profile and that these differ from each other in a highly significant fashion. The reasons for these signifi- cant differences are apparent on close examination of the profiles themselves. Particularly noteworthy differences arethe gradual decrease in numbers of Collembola from the cool temperate sites north- wards. The reverse trend is seen clearly in the levels of abundance of Diptera. Among the non- insects an increasing tropical to temperate trend is seen in the numbers of Acarina, the reverse for the spiders. Lastly, of special note, is the relative
. prominence of the Psocoptera in the subtropical samples compared with the other two forest types. The biological reasons for these trends cannot be ascertained with confidence at this time. A number of hypotheses are available to explain the differ- ences observed for particular orders. In particular, consider the Collembola, Diptera, Psocoptera and Araneida. Collembola are 'found predominantly in leaf litter and other decomposition habitats' (Greenslade 199 1) and their increased abundance in the more southern forest types may well reflect the greater occurrence of aerial leaf litter in the canopy associated with the slower rates of decom- position that must occur in the cooler and drier conditions. In general, tropical forests are sup- posed to have higher rates of litter decomposition and, in consequence, smaller amounts of 'standing' litter at any time (Anderson & Swift 1983; Takeda et al. 1984). The reverse trend in the Diptera, which for the most part require moist larval habi- tats (Colless & McAlpine 1991), may well reflect the consistently moister conditions of the tropical forest compared with more southern ones. Similar arguments may be mounted for the temperate to tropical increase in proportions of the Araneida, many of which live in exposed situations which must put them more in danger of desiccation. T k e Psocoptera are an interesting case, being the Order that seems to mark out the subtropical samples from both the tropical and cool temperate ones. T. New (pers. comm.) observed that Psocoptera are not generally abundant within tropical forests in southeast Asia and that direct heavy rainfall may be inimical, especially to the bark-dwelling forms. The higher rainfall regime in the tropical sites and the more open canopy in the cool temperate forests may well disadvantage Psocoptera in this regard, producing the pattern observed in the results. This remains a hypothesis to be tested.
1 8 8 R. L. K I T C H I N G E T A L .
Site to site differences within a particular forest type, shown by the analysis to account for over 10% of the overall variance in numbers of arthropods, may reflect a number of factors. Intersite distance, site to site differences in vegetation and/or micro- climate come to mind. An analysis of these site to site differences within each forest type for species of Coleoptera and Psocoptera, using measures of P-diversity, is in preparation.
We are aware that a different sampling design was employed in the cool temperate forest, involv- ing the sampling of individual trees rather than the mixed blocks of canopy that were sampled in the other two forest types. The reasons for this were two-fold. First, the structure and vegetational com- position of the cool temperate forest does not lend itself to the mixed block approach. The more open structure and consequent sub-canopy air move- ment reduce the efficiency of methods which involve collecting arthropods following a drop of several metres to the collecting trays. Further, the near monocultural nature of the cool temperate canopy reduces the need to incorporate mixed blocks of canopy in a sampling strategy. Second, the method used in the cool temperate forest can- opy was also part of a sampling design in use for a different purpose, the results of which will be pres- ented in due course. From the point of view of the GLIMTM analysis this difference in sampling methods, although perhaps unfortunate, was in no way disabling. As long as the proportional rep- resentation of the different Orders across the three forest types was well sampled, by whatever method (and the variances involved suggest they were), then the results of the analyses are valid.
Differences reflected in the ordinal profiles be- tween the high and low canopy samples in the tropical and subtropical canopies are significant for the subtropical forest. The upper canopy of the subtropical forest is characterized by a sharp de- cline in the numbers of Collembola compared with the lower canopy. This difference, given the domi- nance of Collembola, numerically, in the samples may well be largely responsible for the statistical result. Exactly why this difference might arise is unknown but it could be a result of an association of the Collembola with the tree stems and their epiphytes rather than the leaves themselves. The alternative idea, that the canopy Collembola are merely an upward extension of the fauna of the leaf
litter of the forest floor (which diminishes numeri- cally with distance from the ground), is not borne out by species level analyses, which identify several canopy specialists among the Collembola from the samples. Similarly, Coy and Greenslade (in press) showed that the Collembola of tree trunks in Tas- manian cool rainforests are not merely extensions of the ground fauna.
The profiles obtained bear comparison with similar results available in the literature. In par- ticular it is of interest to consider Australian results and those from other Old World rainforests.
Majer and Recher's (1988) results from three species of Western Australian Eucalyptus (mar- ginata, wandoo and accedens) show dramatic differ- ences from the rainforest profiles presented here. The key differences are in the relative abundances of Hemiptera and, in particular, Hymenoptera. Proportions of Hemiptera in the results of these authors vary from 9.4 to 12%' for most samples; a figure comparable with our tropical results. How- ever, in one set of samples this proportion reached 71.3% as a result of an outbreak of psyllids in the plot of E. wandoo concerned. Hymenoptera, in general, formed a much higher proportion of the insect assemblages than in any of our rainforest results (21.9-62.8% except for the psyllid outbreak situation when the number of Hymenoptera was only 2.6% of the overall insect fauna - an artifact of the extreme skewness of the counts in this case). This higher proportion of Hymenoptera was due, almost exclusively, to the very large proportions of ants involved (18.4-61% around a mean of 37%, again excluding the psyllid outbreak case). In our samples the highest proportion of the insects ever represented by ants alone was 26% (tropical forest) with much lower figures in the other two forest types. Psocoptera and Collembola were virtually absent from the Eucalyptus results but Blattodea were relatively abundant comprising up to 9.3% of the samples (cf. our highest representation of 1.4% in the tropical samples).
Yen and Lillywhite (1990) sampled eight trees of Nothofagus cunninghamii and one of Nothofagus gunnii in Tasmania in February 1990. Their re- sults form a useful comparison with our Styx River results. The key differences among the insects be- tween our results and those of Yen and Lillywhite is in Collembola and Psocoptera. Our samples had many more Collembola (44.9%) compared with
the Tasmanian data (3.4% for N. cunninghamii, 19.9% for N. gunnii) and many fewer Psocoptera (2.4% compared with 24% for N. cunninghamii and 27.8% for N. gunnii). In other respects our insect results were not greatly dissimilar to those for N. cunninghamii. The N. gunnii comparison is less useful, being based on only a single Tasmanian sample. Whether the different profiles represent a seasonal and/or locational difference cannot be dif- ferentiated at this stage. A January sample taken in another northern New South Wales site (the results of which are not presented here) showed reduced Collembola proportions (2.2%) but no corresponding increase in Psocoptera proportions (3.8%), suggesting that although there obviously are important seasonal changes taking place this is unlikely to account for the differences observed between our insect results and those of Yen and Lillywhite (1990). For non-insects, our results and the Tasmanian ones for N. cunninghamii are remarkably similar (Araneida: our results 23S0/o, Tasmanian results 23.8%; Acarina: our results 72.8%, Tasmanian results 73.5%).
Basset's (1990) results from individuals of the tree Argyrodendron acrinophyllum, from subnopi- cal rainforest near Brisbane, on first sight seem to provide a better comparison, at least with our sub- tropical results. However, he was using restricted canopy fogging (RCF), a method which involves fumigating enclosed branches with carbon diox- ide, rather than pyrethrum knockdown. Further, he did not count Collembola or Acari, two of the most abundant groups in our subtropical samples. He obtained high proportions (41.9%) of usually sessile psyllids (Homoptera), which are almost ab- sent from our samples. This may well be-a result of the difference between his sampling procedure and ours. However, even excluding his psyllid counts and recalculating proportions for our samples after removing the Collembola counts, his proportions of other orders still differ markedly from ours. In terms of the proportions represented by each order, we encountered many more Diptera than he did (27.6% compared with 2.7%), more Psocoptera (28.4% compared with 14.5%) and fewer Coleoptera (17.9% compared with 26.8%). We are confident that these differences are also methodological. The manoeuvring of plastic sheeting involved before RCF would undoubtedly disturb many of the highly mobile Diptera; the
B I O D I V E R S I T Y O F A R T H R O P O D S 189
method does not sample tree trunks, habitat for most of the Psocoptera; and the higher proportion of Coleoptera is adequately accounted for given the undersampling of these other two major groups.
Lastly, the results of Stork and Brendell (1990) for tropical canopies at a variety of altitudes in northern Sulawesi provide a useful comparison, especially for our tropical results. These authors used pyrethrum knockdown methods as we did, although they used a fogging device in contrast to our mister. Their results for the Diptera are most instructive. The range of proportions for this order in their samples ranged from 43% to 70.3% with the proportion diminishing with altitude. Their lowland results show an even larger proportior, of Diptera (70.3%) than our tropical samples (39.8%) and it seems that the diminution with increasing altitude at the one latitude in Sulawesi is recapitu- lated with increasing latitude in our results. Our tropical results also show a consistently higher pro- portion of Coleoptera than do Stork and Brendell (1990; 15.2% compared with their highest figure of 9.1%), but again this may be an artifact resulting from the higher proportions of Diptera in their samples which necessarily must diminish the proportions of other orders.
Many further questions are engendered by our results. Two in particular will bear investigation. First, all the results presented here were collected during the summer wet seasons in each forest type. Further, in all three cases, the seasons concerned were actually wet in contrast to the most recent (1991-92) season, for example, in which widc- spread drought produced a substantial impact on the vegetation of the tropical and subtropical can- opies at our study sites. Further, we have no knowl- edge of the way in which these profiles might differ between seasons even in a 'typical' year. In ad- dition, we cannot assume that the results from each forest type presented here are representative of the type in each case. We know from other results (Yen & Lillywhite 1991, Kitching unpublished) that ordinal profiles can differ substantially from one patch of Norhofagus forest to another, even over short distances. We have no information on this aspect for tropical or subtropical forests.
Study of the patterns of biodiversity and the mechanisms that underlie them at the ordinal, familial and specific levels across Australian forest canopies remains in its infancy and yet such results
190 R. L. K I T C H I N G E T A L .
are potentially of significance for making informed conservation decisions on a variety of issues. The absence of invertebrate diversity data, particularly from Australian tropical ecosystems, both in gen- eral (Haynes et al. 1991) and with respect to par- ticular conservation debates (Stewart er al. 1991), has been commented upon recently. Our present contribution is to be regarded as a first necessary step in redressing these omissions.
ACKNOWLEDGEMENTS
The research described in this paper was funded by the Australian Research Council and Earthwatch (Australia). The participation of Dr Bergelson was made possible through a Visiting Fellowship gen- erously awarded by the Department of Ecosystem Management at the University of New England. J.B. is currently a Richard Lounsebery Fellow of the Life Sciences Research Foundation, and Fellow of Worcester College, Oxford.
The authors are grateful to Associate Professor H. Recher and Professor D. Harmsen for com- ments upon an earlier draft of the paper. Research assistance for the project was ably provided by Ms Heather Mitchell and many Earthwatch volun- teers, and technical assistance by Mr W. Upjohn.
We are grateful to many people for making this work possible. The O'Reilly family allowed us to work on their property at Green Mountains and provided us with hospitality and assistance during our field work. In particular Mr Peter O'Reilly helped with tree identification. The Truelove family and Mr P. Shears allowed us use of their land at Cape Tribulation. The Cape Tribulation community have been invariably hospitable; in addition to those already mentioned, Mr Hans Neeuenhausen, Ms Esther Cullen, Mr Wilhelm Ryckers and Dr and Mrs H. Spenser have been particularly helpful over the years of our work. Lastly, we thank the Forestry Commission of New South Wales for issuing us with permits to work in the Styx River State Forest.
REFERENCES Adis J., Lubin Y. D. & Montgomery G. G. (1984) Arthropods from
the canopy of inundated and terra firme forests near Manaos, Brazil, with critical considerations of the Pyrethrum-fogging technique. Srudieson NeorropicalFaunn and Environment 19, 223-36.
Aitken M., Anderson D., Francis B. & Hinde J. (1989) Statistical Modelling in GLIM. Oxford University Press, Oxford.
Anderson J. M. & Swift M. J. (1983) Decomposition in tropical forests. In: Tropical Rain Forests: Ecology andManagement (ed. S. L. Sutton,T. C. Whitmore &A. C. Chadwick) pp. 287-309. Blackwell Scientific Publications, Oxford.
Basset Y. (1990) The arboreal fauna of the rainforest tree Argyrodmdron uctinophyllum as sampled with renriaed can- opy fogging: Composition of the Fauna. Entomologist 109, 173-83.
Colless D. H. & McAlpine D. K. (1991) Diptera (Flies). In: Insects of Australia, Vol. 2, 2nd edn, pp. 717-86. Melbourne Uni- versity Press, Carlton.
Coy R. & Greenslade P. (in press) A survey of invertebrates in Tasmanian rainforests. Tasmanian National Rainforest Con- servation Program Technical Report No. 9, Tasmanian Department of Parks, Wildlife and Heritage, Hobart.
Erwin T. L. (1982) Tropical forests: Their richness in Coleoptera and other species. Coleopterists Bull. 36, 74-5.
.Erwin T. L. (1983) Beetles and other arthropods of the tropical forest canopies at Manaos, Brazil, sampled with insecticidal fogging techniques. In: Tropical Rain Forests: Ecologv and Management, (ed. S. L. Sutton, T. C. Whitmore &A. C. Chad- wick) pp. 59-75. Blackwell Scientific Publications, Oxford.
Erwin T . L. (1990) Canopy arthropod biodiversity: A chronology of sampling techniques and results. Revista Peruana de Entomologia 32, 71 -7.
Erwin T. L. (1991) How many species are there?: Revisited. Con- sew. Biol. 5 , 330-3.
Floyd A. G. (1990)Australian Rainforests in Xew South Wales, Vol. 2. Surrey Beatty, Chipping Norton, NSW.
Gaston K. J. (1991) The magnitude of global insect species richness. Consm. Biol. 5, 283-96.
Grcenslade P. J. (1991) Collembola (Springtails). In: Inrecrs ofAus- tralia, Vol. 1, 2nd edn, pp. 252-64. Melbourne University Press, Carlton.
Hammond P. M. (1990) Insect abundance and diversity in Dumoga-Bone National park, North Sulawesi, with special reference to the beetle fauna of lowland rainforest in the Toraut region. In: Insects and the Rain Forest of South East Asia (Wallacea) (ed. W. J. Knight and J. D. Holloway) pp. 197-260. Royal Entomological Society of London, London.
Haynes C. D., Ridpath M. G. & Williams M. A. J. (1991) (ed.) Monswnal Ausrmlia: Landscape, Ecology and Man i n rhe Northern Lourlands. Balkema, Amsterdam and Brookfield.
Hodkinson I. D. e( Casson D. (1991) A lesser predilection for bugs: Hemiptera (Insects) diversity in tropical rain forests. Biol. 3. Linn. Soc. 43, 101-9.
Jessup L. W. & Guymer G. P. (1 985) Vascular plants recorded from the Cape Tribulation area. Qld Not. 26, 2-19.
Kitching R. L. (1983) Community structure in water-filled tree- holes in Europe and Australia - comparisons and specu- lations. In: Phytorelmata Terrestrial Plants a Hosts for Aquatic Insecr Communiries (ed. H. Frank and P. Lounibos) pp. 205-22. Plexus, Medford, New Jersey.
Majer J. D. & Recher H. F. (1988) Invertebrate communities on Western Australian eucalypts: A comparison of branch clipping and chemical knockdown procedures. Ausr. 3. Ecol. ' 13, 269-78.
May R. M. (1988) How many species are there on Earth? Scirnce 241, 1441-9.
McDonald W. J. F. & Thomas, M. B. (1990) Flora of Lamington National Park, 2nd edn. Queensland Department of Primary Industries, Brisbane.
B I O D I V E R S I T Y O F A R T H R O P O D S 191
McDonald W. J. F. & Whiteman W. G. (1979) Morelon Bay Veg- e m w n Map Serier Murwillumbah Queensland Depanment of Primary Industries, Brisbane.
McKenzie F. (1985) Climbing plants from 'Pilgrim Sands', Cape Tribulation. Qld Not. 26, 20-5.
Monteith G. B. (1990) Rainforest insects: biodiversity, bioguessti- mation, or just hand-waving? Mynnecia 26, 93-5.
Roberts H. R. (1973) Arboreal Onhoptera in the rain forests of Costa Rica collected with insecticide: A report on the grass- hoppen (Acrididae), including new spec~es. Proc. Acad. of Narl Sci. Philadelphia 125, 46-66.
Southwood T. R. E., Moran V. C. & Kennedy C. E. J. (1982) The assessment of arboreal insect fauna - comparisons of knock- down sampling and faunal lists. Ecol. Enromol. 7, 331-40.
Stewart D. G., McColl G. D. & Kitching R. L. (1991) Kakadu Conservarion Zone Inquiry, Final Report, Vol. 1. Resource Assessment Commission, Australian Government Publishing Service, Canberra.
Stork N. E. (1987a) Guild structure of arthropods from Bornean rain forest trees. Ecol. Enromol. 12, 69-80.
Stork N. E. (1987b) Arthropod faunal similarity of Bornean rain forest trees. Ecol. Entomol. 12, 219-26.
Stork N. E. (1988) Insect diversity: facts, fiction and speculation. Biol. 3. Linn. SM. 35, 321-37.
Stork N. E. & Brendell M. J. D. (1990) Variation in the insect fauna of Sulawesi trees with season, altitude and forest type. In: Insecrs and rhe Rain Foresr of Sourh Easl Asia (Wallacea) (ed. W. J . Knight and J. D. Holloway) pp. 173-90. Royal Ento- mological Society of London, London.
Takeda H., Prachaiyo B. & Tsutsumi T. (1984) Comparison of decomposition rates of several tree leaf litter in north-east Thailand. Jap. J. Ecol. 34, 31 1-19.
Tracey J. G. (1982) The Vegeration of the Humid Tropical Region of Norrh Queensland. CSIRO Division of Plant Industry, Melbourne.
Webb L. J. (1959) A physiognomic classification of Australian rain forests. 3. Ecol. 47, 55 1-70.
Webb L. J., Tracey J. G. & Williams W. T. (1976) The value of structural features in tropical forest typology. Ausr. 3. Ecol. 1, 3-28.
Wilson E. 0. (1988) The current state of biodiversity, In: Bio- div;rsiry (ed. E. 0. Wilson) pp. 3-18. National Academy Press, Washington.
Yen A. L. & Lillywhite P. K. (1990) A Preliminary Repon into the Invenebrates collected from the Canopy of Tasmanian Rain- forest Trees, with special reference to the Myrtle Beech. Unpublished Report to the Tasmanian Department of Parks, Wildlife and Hcritagc, Hobart.


