Embed Size (px)
Citation preview
IN DEGREE PROJECT COMPUTER ENGINEERING,FIRST CYCLE, 15 CREDITS
, STOCKHOLM SWEDEN 2020
Generation of random numbers from the text found in tweets
LUKAS GUTENBERG
EMIL OLIN
KTH ROYAL INSTITUTE OF TECHNOLOGYSCHOOL OF ELECTRICAL ENGINEERING AND COMPUTER SCIENCE

Generation of randomnumbers from the text foundin tweets
LUKAS GUTENBERG AND EMIL OLIN
Degree Project in Computer ScienceDate: 23rd August 2020Supervisor: Jörg ConradExaminer: Pawel HermanSchool of Electrical Engineering and Computer ScienceSwedish title: Slumptalsgenerering från texten i tweets

iii
AbstractRandom numbers are integral to many areas of computer science, it is used ineverything from video games to encryption of important messages and simu-lations. These numbers are often generated by mathematical algorithms andit is highly important for these generators to generate numbers that are trulyrandom and unpredictable, as patterns, cycles or other discrepancies might atworst cause serious security flaws that can be exploited. Random numbers canalso be generated with the aid of a source of entropy, for this report the sourceused was the text found on the social media site Twitter to see if text is a goodsource of randomness. A data analysis on a sample of the text was made thatshowed some inherent structure in the text that could be removed to improvethe randomness. Multiple generators were then made to further analyse thebehaviour of the text and to find possible implementations for a good randomnumber generator.
We found that generators that only took the characters one by one to builda random number did not produce random enough numbers so some kind of atransformation involving multiple characters was necessary. The type of gen-erator that performed the best was an implementation of a linear congruentialmethod random number generator where the additive part varied with inputfrom the text. This generator performed, in the randomness testing, compar-ably to an implementation of Mersenne Twister showing that with the rightimplementation it is possible to generate good random numbers from the textfound on social media. The limiting factors are that the generation of the ran-dom numbers is dependent on the speed at which it is possible to access newdata and a security risk from the potential to tamper with the data sent to thegenerator.
iv
SammanfattningSlumptal används inom många områden av datavetenskap, det används inomallt ifrån spel till kryptering av viktiga meddelanden och simuleringar. Dessaslumptal är ofta genererade av matematiska algoritmer och det är viktigt attdessa generatorer generar tal som är så slumpmässiga och oförutsägbara sommöjligt, då mönster, cykler eller andra avvikelser kan orsaka allvarliga säker-hetsbrister som kan bli utnyttjade. Slumptal kan även genereras med hjälp aven källa till entropi och för den här rapporten så användes text hämtat ifråndet sociala mediet Twitter. En dataanalys på ett urval av texten gjordes somvisade vissa inbyggda mönster i texten som kunde tas bort för att förbättra hurslumpmässig datan var. Ett flertal slumptalsgeneratorer skapades sedan för attytterligare analysera beteendet hos datan och för att hitta möjliga implemen-tationer till en bra slumptalsgenerator.
Vi fann att generatorer som enbart tog karaktärerna en för en från textenför att bygga ett slumptal inte producerade tillräckligt slumpmässiga tal, så nå-gon form av transformation med flera karaktärer från texten behövdes. Typenav generator som presterade bäst var en implementation av en linjär kongru-ensgenerator där den additiva delen varierade med indata från texten. Den härgeneratorn presterade, i slumptalstesten, jämförbart med en implementationav Mersenne Twister vilket visar att med rätt implementation så är det möj-ligt att generera bra slumptal från texten från social media. De begränsandefaktorerna är att genereringen av slumptalen beror på hastigheten att få tag påny data och en säkerhetsrisk i att datan som sänds till generatorn skulle kunnavara manipulerat.
Contents
1 Introduction 11.1 Research Question . . . . . . . . . . . . . . . . . . . . . . . 11.2 Scope . . . . . . . . . . . . . . . . . . . . . . . . . . . . . . 2
2 Background 32.1 Creating random numbers . . . . . . . . . . . . . . . . . . . . 3
2.1.1 Pseudo random number generators . . . . . . . . . . . 32.1.2 True random number generators . . . . . . . . . . . . 4
2.2 Random number generators . . . . . . . . . . . . . . . . . . . 42.2.1 middle square method . . . . . . . . . . . . . . . . . 52.2.2 Linear Congruential Method . . . . . . . . . . . . . . 52.2.3 Mersenne Twister . . . . . . . . . . . . . . . . . . . . 6
2.3 Testing of randomness . . . . . . . . . . . . . . . . . . . . . 62.3.1 Chi-Squared . . . . . . . . . . . . . . . . . . . . . . 72.3.2 Runs test . . . . . . . . . . . . . . . . . . . . . . . . 72.3.3 Randomness testing suites . . . . . . . . . . . . . . . 82.3.4 Graphical tests . . . . . . . . . . . . . . . . . . . . . 8
2.4 UTF-8 . . . . . . . . . . . . . . . . . . . . . . . . . . . . . . 92.5 Human randomness . . . . . . . . . . . . . . . . . . . . . . . 10
3 Methods 113.1 Downloading tweets and data analysis . . . . . . . . . . . . . 113.2 Algorithm construction . . . . . . . . . . . . . . . . . . . . . 123.3 Testing . . . . . . . . . . . . . . . . . . . . . . . . . . . . . . 13
3.3.1 Small crush . . . . . . . . . . . . . . . . . . . . . . . 133.3.2 Rabbit testing battery . . . . . . . . . . . . . . . . . . 153.3.3 Simple chi-squared . . . . . . . . . . . . . . . . . . . 163.3.4 Graphic test . . . . . . . . . . . . . . . . . . . . . . . 17
v
vi CONTENTS
4 Results 184.1 Data analysis . . . . . . . . . . . . . . . . . . . . . . . . . . 18
4.1.1 Tweets per second . . . . . . . . . . . . . . . . . . . 184.1.2 Character and bit analysis . . . . . . . . . . . . . . . 194.1.3 Median . . . . . . . . . . . . . . . . . . . . . . . . . 20
4.2 Chi-squared . . . . . . . . . . . . . . . . . . . . . . . . . . . 214.3 Small crush . . . . . . . . . . . . . . . . . . . . . . . . . . . 224.4 rabbit . . . . . . . . . . . . . . . . . . . . . . . . . . . . . . 234.5 Graphical tests . . . . . . . . . . . . . . . . . . . . . . . . . 25
5 Discussion 285.1 Data analysis . . . . . . . . . . . . . . . . . . . . . . . . . . 285.2 Simple generators . . . . . . . . . . . . . . . . . . . . . . . . 295.3 LCM generators . . . . . . . . . . . . . . . . . . . . . . . . . 305.4 Reference generators and graphical test . . . . . . . . . . . . . 315.5 Ethical aspects . . . . . . . . . . . . . . . . . . . . . . . . . 325.6 Sustainability . . . . . . . . . . . . . . . . . . . . . . . . . . 325.7 Limitations . . . . . . . . . . . . . . . . . . . . . . . . . . . 335.8 Retrospective . . . . . . . . . . . . . . . . . . . . . . . . . . 33
6 Conclusion 34
Bibliography 35
Chapter 1
Introduction
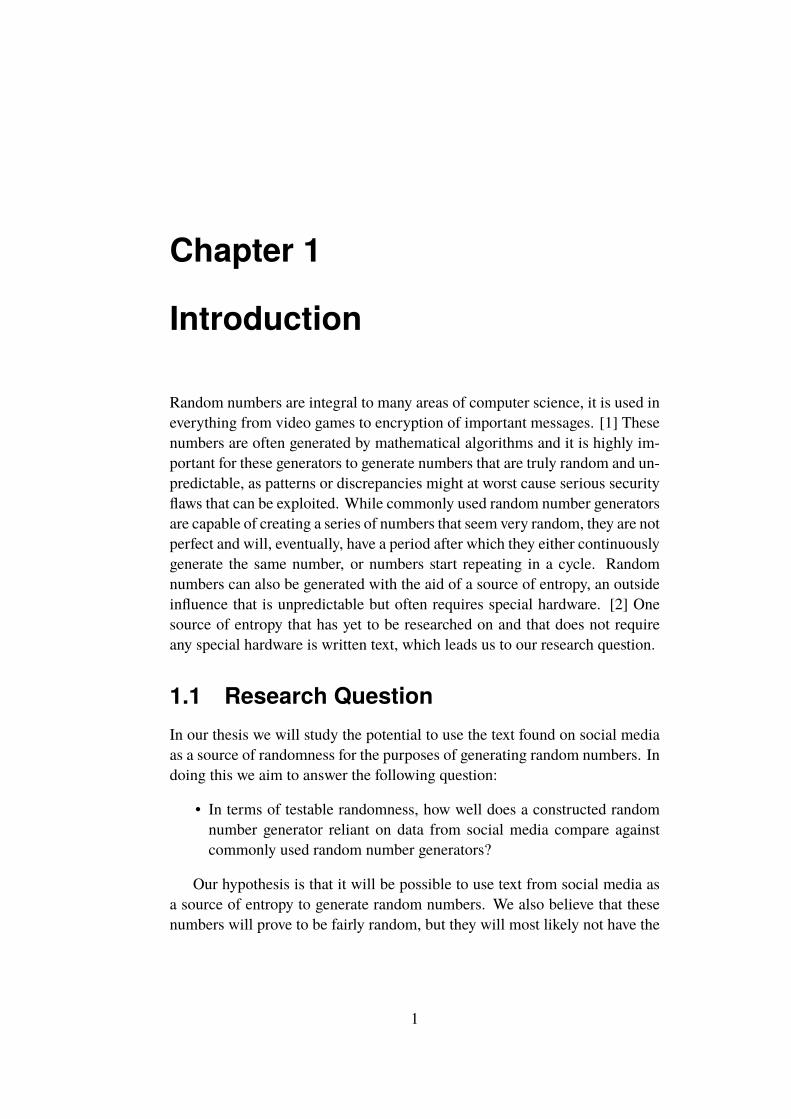
Random numbers are integral to many areas of computer science, it is used ineverything from video games to encryption of important messages. [1] Thesenumbers are often generated by mathematical algorithms and it is highly im-portant for these generators to generate numbers that are truly random and un-predictable, as patterns or discrepancies might at worst cause serious securityflaws that can be exploited. While commonly used random number generatorsare capable of creating a series of numbers that seem very random, they are notperfect and will, eventually, have a period after which they either continuouslygenerate the same number, or numbers start repeating in a cycle. Randomnumbers can also be generated with the aid of a source of entropy, an outsideinfluence that is unpredictable but often requires special hardware. [2] Onesource of entropy that has yet to be researched on and that does not requireany special hardware is written text, which leads us to our research question.
1.1 Research QuestionIn our thesis we will study the potential to use the text found on social mediaas a source of randomness for the purposes of generating random numbers. Indoing this we aim to answer the following question:
• In terms of testable randomness, how well does a constructed randomnumber generator reliant on data from social media compare againstcommonly used random number generators?
Our hypothesis is that it will be possible to use text from social media asa source of entropy to generate random numbers. We also believe that thesenumbers will prove to be fairly random, but they will most likely not have the
1
2 CHAPTER 1. INTRODUCTION
same quality as the numbers generated from the random number generatorsused in modern programs. We also believe that this type of random numbergeneration will be vulnerable to attacks or events that flood the data sourcewith very similar or the same type of data, which happened when twitter gotits current tweets per second record. [3]
1.2 ScopeIn this paper the scope will be limited by the generators constructed to beingat the most advanced linear congruential methods with some simpler methodsthat directly look at the bit values of characters in the input text. We havelimited it in this way as the number of ways to generate random numbers istoo large to test every conceivable method. As there is an infinite amount ofpossible tests of randomness we have limited the testing to tests from a knownrandomness testing suite, a graphical test and a simple chi-square test. [4, p.2]In doing the testing this way, it becomes possible to compare any constructedgenerator with generators tested in other research. For the data analysis thefocus will lie on character to character patterns and we will not consider wholewords, sentences, or series of sentences.
Chapter 2
Background
When discussing random number generators it is more important to look athow random a series of numbers appears to be rather than if it truly is random.This is because true randomness is incredibly hard to achieve and patterns tendto appear.[1] Therefore, this chapter will go through the two different groups arandom number generator can belong to, different methods by which randomnumbers can be generated, and how testing is done to analyse the randomnessof the methods. Furthermore it will also explain the character encoding systemUTF-8 as that is the way the data retrieved was encoded and that causes certainpatterns to appear.
2.1 Creating random numbersRandom number generators exist in two groups; true random number generat-ors TRNGs and pseudo random number generators PRNGs. This separationis done to differentiate between true randomness from series of numbers thatseem random but in reality isn’t. [2]
2.1.1 Pseudo random number generatorsA PRNG creates random numbers through algorithms which gives a seriesof random numbers that seem random but in reality isn’t. This is due to thenature of algorithms being deterministic and if the same input is given thesame output will be received. In return this method is fast and easy to useas it only requires some maths and it is possible to recreate the same randomsequence if needed. [2]
For the most part this method works well and gives, what seems to the
3
4 CHAPTER 2. BACKGROUND
human eye, a completely random sequence of numbers. In reality there are anumber of flaws with it where the most severe is that after a while, numberseither start repeating in a cycle or the same number starts returning repeatedly,making it meaningless to continue generating numbers with the generator. Itis also possible to predict what the next number will be if the algorithm andthe starting value is known which creates a large security flaw. Furthermore, alot of algorithms tend to generate numbers that are correlated, grouping themin different ways, which can be hard to spot without rigorous testing. Whilesome of these flaws can and have been resolved, the method will always bedeterministic. [2]
2.1.2 True random number generatorsA TRNG creates random numbers not through algorithms, but by observingphenomena in the physical world. This creates true randomness that can’t bepredicted, which is the difference between it and the PRNGs. The phenom-ena being observed can be almost anything that has some randomness in it thatcannot be predicted, spanning from a simple coin toss to radioactive decay or awall filled with lava lamps. The big advantage this method has over the PRNGsis that there is no correlation between the numbers, making it impossible to ac-curately predict the next one. This method also has a few weaknesses, mainlytime and the tendency for the numbers not to have a uniform distribution. [2]
To observe a phenomenon in the physical world it first needs to happen,which usually takes a fair bit of time. This makes most TRNGs fairly slow touse and therefore bad when a large number of random numbers are needed ina short time frame. There is also the risk of having different probability fordifferent outcomes of the phenomenon, which requires post processing to bedone before the data can be used. The equipment needed is also a weaknessas you for example need a coin to flip or a piece of radioactive material tomeasure, limiting the places TRNGs can be used. [2]
2.2 Random number generatorsThere exist many different implementations of RNGs with different pros andcons, here we will discuss a few PRNGs in greater detail.
CHAPTER 2. BACKGROUND 5
2.2.1 middle square methodThis method was developed in 1946 by John von Neumann as an alternative tomechanical methods. The method works by taking a number and squaring it,extracting the amount of digits the original number had from the middle of thenew number and using that as the next number in the cycle. This was one ofthe earliest methods to create a series of random numbers with an algorithm.While it statistically is a good random number generator it has a tendency toeither get stuck in a loop of numbers or degrade and only start showing zeroes,showing that it is unreliable but can be used with the right amount of digitsand a well chosen starting value. [1]
2.2.2 Linear Congruential MethodAmethod that has seen a large amount of use is the linear congruential method,first introduced by D. H. Lehmer in 1949. In this method we have a startingvalue X0 that we multiply with a multiplier a and then add a constant c. Thisnew number is then put through a modulusm which gives us the next numberin the series (2.1). The final part is an initial seedX0 that can be taken from anexternal source of entropywith a TRNG. Important here is that all the variablesare greater than zero and that the modulus is the largest value. [1]
Xn+1 = (aXn + c) mod m, n ≥ 0 (2.1)
While this method will always result in a loop, the length depending on thevalues of the parameters, the addition of a constant prevents it from getting intoa loop where it is only repeating zeroes. This method is interesting due to thespeedup that is possible if themodulus is set to the word length of the computerit is running on, circumventing the slow division operation by making use ofoverflow. A speedup is also possible by removing the constant at the cost ofperiod length. [1]
In 1988 S. Park and K. Miller published a paper where they explain theneed for a "minimal standard" RNG after observing a large amount of poorlymade RNGs being created and used. [5] They explain that this standard shouldalways be used unless access to a RNG that is, through rigorous testing, knownto be better is available. Their proposal for the "minimal standard" is a con-figuration of the linear congruential method using the parameters a = 48271
and m = 231 − 1. This configuration satisfies three criteria that they set upas necessary for a RNG; The first criteria are that the PRNG produces a fullperiod so that all numbers in the range will be generated. The second is that
6 CHAPTER 2. BACKGROUND
the sequence generated is random without some obvious pattern. The finalcriteria is for the generator be efficiently implemented with 32-bit arithmetic,which is satisfied withm = 231 − 1.
2.2.3 Mersenne TwisterTheMersenne Twister is a PRNGproposed byM.Matsumoto and T.Nishimurain 1998 and is the default PRNG in MATLAB and Microsoft excel [6] [7]. Ithas a period of 219937−1which is longer than many of the PRNGs that precedeit. The underlying mathematics are based on defining a series of xi through arecurrence relation in an twist transformation with an invertible matrix. Theequation for the algorithm is (2.2)
xk+n := xk+m ⊕ ((xuk||xlk+1)A) k = 0, 1, . . . (2.2)
wheren is the degree of recurrence,m is an offset in the recurrence relationdefining x, 1 ≤ m < n and u, l denote the upper and lower bits of xk andxk+1. The || means to concatenate and ⊕ is bitwise XOR. The algorithm hasthe restriction that 2nw−r−1 is a prime number wherew is the word size and ris the separation point of one word. The value for these coefficients is definedin the implementation presented by Matsumoto and Nishimura. [8]
2.3 Testing of randomnessProving that a sequence of numbers from a RNG is random can be done eitherempirically, through statistical tests on the generated numbers, or through the-oretical means that concern the specifics of the way the numbers were gener-ated. The theoretical way to prove the randomness of a TRNG can be done bydescribing the physical processes that give rise to the generated numbers. Thetheoretical way for a PRNG would be with a well described algorithm wherethe probabilities are known.
Due to randomness being able to be described in terms of probability itbecomes possible to do statistical tests on randomly generated sequences. Thismakes it so that it is possible to predict the likely results of a test before it hasbeen conducted by using the probability for the distribution. It is thereforepossible to set up a null hypothesis that a sequence is random and then rejectit if a statistical test can find some pattern. The alternative hypothesis is thatthe sequence isn’t random. In testing a reference statistic is chosen as a pointof comparison that is used to confirm or reject the null hypothesis.
CHAPTER 2. BACKGROUND 7
In some cases a test may conclude that a sequence is not random when itactually is. The level of significance for these tests denoted α will commonlybe 0.01 and is fixed before the test is conducted. A test may also in some casesaccept a sequence as random when it should not. This type of error denotedβ is not a fixed value in testing and can be hard to calculate. As such the testsfound in testing suites have been designed to minimise the risk of this type oferror. [9]
2.3.1 Chi-SquaredThe Chi-squared test is a very common test and is done by comparing the dis-tribution of observed events over a series of intervals against expected values.With a null hypothesis of the sequence having a uniform distribution the ex-pected values would be that the same amount of numbers fall in each of theintervals. If the distribution of the observed numbers differ significantly fromthe expected values we can reject the null hypothesis. [1] The formula for thestatistical computation is the equation (2.3)
χ2c =
k∑i=1
(oi − ei)2
ei(2.3)
where k is the number of intervals, oi is the amount of numbers that fellinto the ith interval and ei is the expected amount in the ith interval. With anindependent random sequence of numbers with uniform distribution χ2
c willhave k − 1 degrees of freedom. Large values of χ2
c make cause for rejectingthe null hypothesis meaning that the sequence isn’t random. Small values ofχ2c is also a cause for rejecting the null hypothesis as a perfect result is not to
be expected with randomness. [10]
2.3.2 Runs testA sequence of uninterrupted increasing or decreasing numbers in a larger se-quence is a run. The runs test looks at the number of various lengths of runsand compares against a reference distribution. The reference distribution forruns tests is a χ2 distribution. The equation for the test statistics for runs testare (2.4) [9]
Z =R−RsR
(2.4)
8 CHAPTER 2. BACKGROUND
Where R is the observed number of runs and R is the expected number ofruns and can be calculated by the equation (2.5). sR is the standard deviant forthe number of runs and is calculated in (2.6).
R =2n1n2
n1 + n2
+ 1 (2.5)
s2R =2n1n2(2n1n2 − n1 − n2)
(n1 + n2)2(n1 + n2 − 1)(2.6)
Where n1 is the amount of increases and n2 are the amount decreases inthe sequence. The null hypothesis that the sequence is random can be rejectedif |Z| > Z1−a/2
2.3.3 Randomness testing suitesThere are many different ways to test the randomness of a RNG and even if itPasses a few, there is no guarantee that it actually generates random numbers.In practice, after about six different tests an RNG can be considered randomuntil proven otherwise. As some tests can be considered superior to others wewill be including some of the tests recommended by Donald Knuth. [1]
The DIEHARD test suite created by George Marsaglia is a series of teststhat supplemented the tests suggested by Donald Knuth in The Art of Com-puter Programming. The fifteen tests are limited to only working on 32-bitnumbers.[4] The TestU01 test suite started as an implementation of the teststhat Donald Knuth suggested and were later expanded to include 160 tests.These tests consists of general implementations of classical statistical tests,tests proposed in the literature surrounding randomness testing and some testsoriginal to TestU01.[4]
2.3.4 Graphical testsIn some cases the computational statistical evaluation tests are unable to findthe statistical flaws in the sequences. In these cases graphical tests can still findpotential patterns. The disadvantage of using graphical tests is that they can’tbe automated in the same way as the computational tests can be. They insteadmust be manually evaluated. This however can also be considered a strengthas it allows for humans to easier visualise the randomness of a sequence ofnumbers and better understand how random it is without having to analyse alarge amount of tests. They are, for example, able to show which numbers agenerator more commonly generates.
CHAPTER 2. BACKGROUND 9
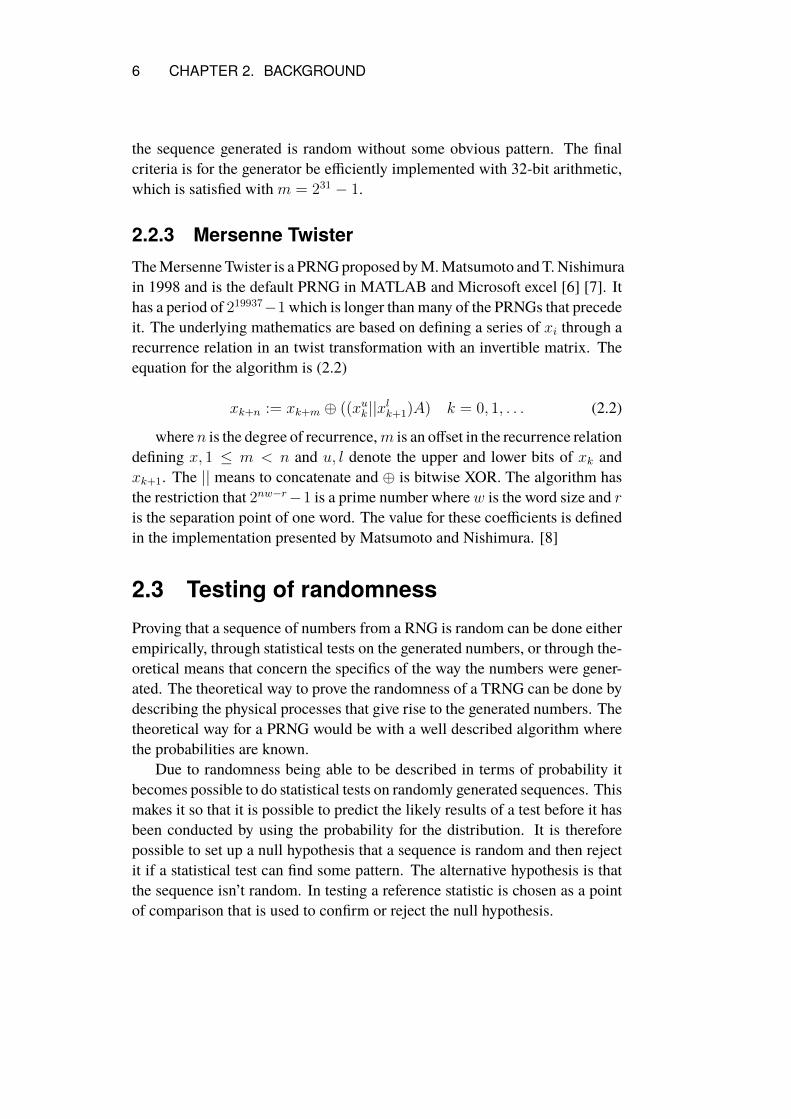
(a) failing plane distribution test (b) passing plane distribution test
Figure 2.1: Example of a failing and passing plane distribution test
Plane distribution tests
Taking am×m plane and form∗m/2 numbers plotting the sequence accord-ing to (εi, εi+1) and then looking at the resulting graph.[11]. If the elementsin the sequence are independent of each other the graph will appear chaotic.If the elements have some interdependence some patterns will arise allowingus to conclude that the sequence isn’t random. In figure (2.1) a passing planedistribution test is shown on the right and a failing one on the left. The leftone comes from a LCM and the right one from a Mersenne Twister.
2.4 UTF-8The text taken from twitter as a source of randomness is encoded in UTF-8and therefore a short description of UTF-8 is necessary as it in some caseswas the reason for why a pattern was appearing.
UTF-8 is a part of the Unicode character encoding system and is used toefficiently store text. [12] It is built to accommodate as many of the worldslanguages as possible and still be backwards compatible with ASCII, an olderencoding standard. To be able to do this the byte size of a UTF-8 charactervaries between one and four bytes with the most significant bits in the mostsignificant byte indicating the size. The lower bytes in a multi byte characterall start with a 1 at their most significant bit. This range of byte sizes makesit possible to encode a large amount of characters and most of the worlds lan-guages are included in the system. One byte size characters contain lower- anduppercase Latin characters, numbers, and some special characters in a way that
10 CHAPTER 2. BACKGROUND
makes it backwards compatible with ASCII. Two bytes size characters, in con-junction with one byte, contains most of the modern-use scripts for exampleextended Latin, Arabic, and Greek. Three bytes size characters contains theBasicMultilingual Plane which includes most characters in common use. Thisincludes most Chinese, Japanese, and Korean characters, most mathematicalnotations and different types of punctuation. The four bytes size characterscontains some less used characters, historic scripts, some mathematical sym-bols, and emojis.
2.5 Human randomnessAs this paper deals with the extraction of randomness from human behaviourit is relevant to look at previous research dealing with whether it is possible todo so. In a paper written by Figurska et al. they found that humans could notconsciously generate random numbers when asked to. The experiment con-sisted of asking people to generate and dictate numbers that they perceivedas random for a period of ten minutes. They found that their sample size of37 people was not enough to draw positive conclusions on the quality of ran-domness required by modern cryptography applications but they showed thatrelatively short sequences of numbers generated by humans are biased. [13]
In a paper written by Halprin and Naor they found that it is possible touse human gameplay as a source of entropy. They found this by creating agame, recording the points on the screen that players clicked on as a sourceof entropy and using it to generate random numbers. They also found thatcompared with playing the game, asking participants to just click randomlyon the screen ended up with them clicking in patterns. The results form thispaper suggest that it is possible to extract randomness from human behaviourif the participants are unaware that the randomness is the focus. [14]
Chapter 3
Methods
The project began with a literature study of how random number generationwork, commonly used random number generators, testing of random numbergenerators, and possible earlier projects. Afterwards a choice had to be madeabout which source of data to choose from, the requirements being that iseasy to access, readily available, and there being a large data flow. As suchtwitter was chosen due to fulfilling all of these requirements with it’s developerfriendly system. [15]
The code for this project was written in C and python and can be foundat [16] along with the data from twitter used to generate the random numbersused in the testing.
3.1 Downloading tweets and data analysisTwitter has a website for developers where it is possible to register and receivekeys for their api, allowing access to the data in their database with no morethan one connection at a time. [15] To get a stream of public tweets the sampledstream function from Twitter Developer Labs were used. This function givesabout one percent of all new public tweets as they happen in JSON format fromwhich the text of the tweets can then be extracted. The code that was used todownload the tweets originates from example code in the documentation andwas modified as needed. A large amount of tweets were downloaded to workwith locally due to the large amount of characters needed for testing, the abilityto test several versions on the same data, and the connection restrictions of thedatabase.
The data analysis was done iteratively during the entire project and it beganwith analysing the amount of available data by counting the amount of tweets
11
12 CHAPTER 3. METHODS
per second to see if there was enough data to generate the random numbernecessary for the testing. This was first done by accessing the data from thewebsite Internet Live Stats [17] but the data was assumed to be false due to thelack of variation over time. Therefore a new program was created that readsthe data stream directly and counts the tweets for 30 seconds, calculating anaverage. The program was run for 7 days, measuring every 30 minutes.
The primary focus of the data analysis was the actual text in the tweetsas that is what was converted to the random numbers. A program was createdthat read the data stream tweet by tweet and counted the amount of tweets, totalamount of characters, average amount of characters per tweet, the amount ofcharacters of the different byte sizes, chains of the same character, bit changes,and bit chains. A program was also created to get the median value of thedifferent byte lengths.
3.2 Algorithm constructionDuring the project, a total of six different generators were created and tested.They will be listed as pairs of two due to similarities between them.
The first two generators, BitPerByte andBitPerUtf, were fairly naive simplytaking the least significant bit from each byte and utf-8 character respectively.This was done 32 times, bitwise left shifting to make room for the newest biteach time to create a random 32 bit number.
The next two generators created, LessThanByte and LessThanUtf, madeuse of value comparison. The first generator LessThanByte created a 32 bitnumber by taking in 32 bytes and for each one comparing the value of thebyte with half of its potential value. If byte i was greater than half, a one wasinserted at position i in the number. The second generator LessThanUtf con-structed a 32 bit number from comparing 32 utf-8 characters with the medianfor that byte size. If character i was less than the median for its size a 1 wasinserted at bit i in the number.
The final two generators created were largely based on the linear congru-ential method in that they at each call for a new number multiplied and addedto the same random number. The first of these generators was the MulAddUtfgenerator that for each new random number generated took in utf-8 charac-ters and multiplied it with the random number and then added that charac-ter to the number. For each random number produced by the generator 32characters were used. The second linear congruential method based generatorLCMAddUtf had a fixed multiplier of 11 and added the 5 least significant bitsof each utf-8 character. These five bits were found to be the ones that varied
CHAPTER 3. METHODS 13
the greatest in the data analysis. The amount of characters used for each newnumber was 13.
3.3 TestingThe randomness testing was done by running the bbattery_SmallCrush andbbattery_Rabbit testing batteries from the testU01 testing suite on the outputfrom the generators. In addition to the generators described above three refer-ence generators were used as points of comparison. The reference generatorswere the testU01 implementation of the Mersenne twister, a LCM generatorwith the values specified in the minimal standard and a LCM with the samemultiplier, 11, as LCMAddUtf and a constant of 7. To make the LCM as sim-ilar to LCMAddUtf as possible it also ran 13 times between each new numberproduced. Both of the LCM generators had the word size as modulo. In addi-tion to the testing batteries from testU01 a regular chi-squared test as well asa graphical test were done.
In an effort to speed up the testing, all of the random numbers were gener-ated before the testing. This was done for both the reference generators and theones working from twitter data. The speedup came from reducing the amountof times that the generators need to connect and disconnect to the twitter apias this was the most time consuming part of the generation. As such the timeneeded to generate the random numbers was not considered in the testing. Theamount of numbers generated for the tests were 52e + 6 as this was the max-imum amount of numbers that any one test in bbattery_SmallCrush needed.[4,p.143] This is a sufficiently large amount as same numbers could be reusedbetween tests and a lower amount of numbers might not expose any longercycles that the generators might produce.
3.3.1 Small crushThe first testing battery from testU01 used was the bbattery_SmallCrush bat-tery consists of these ten tests.[4, p.143] For some of the tests the battery didmultiple runs with different input parameters for dimensions and sizes. A testwas said to fail if its p-value fell outside of the interval [0.001,0.999].
1. smarsa-BirthdaySpacings is a variation of the collision test that com-pares observed value with the expected Poisson distribution.[4, p.114-115]
14 CHAPTER 3. METHODS
2. sknuth-Collision applies the collision test that counts the amount oftimes the same number appears when only picking a small amount ofthem.[4, p.112]
3. sknuth-Gap counts the number of times a sequence of successive val-ues fall outside a specified interval and compares observed against theexpected chi-squared statistic.[4, p.111]
4. sknuth-SimpPoker, simplified poker, is a test that compares observedamount of distinct integers in a series of groups against the chi-squaredstatistic.[4, p.111]
5. sknuth-CouponCollector is a test that counts how many numbers ina interval must be generated before all the values in the interval havebeen generated. Repeating this gives an observed outcome that can becompared against the expected chi-squared statistic.[4, p.111]
6. sknuth-MaxOft is a test that generates groups of values and finds themaximum value for each group. This is compared to the observed valueswith a chi-squared test as well as with an Anderson-Darling test. For thechi-squared test the values are partitioned into categories.[4, p.112]
7. svaria-WeightDistrib is a test that generates a number of uniform valuesand computes how many fall into a interval, in repeatedly doing thisgetting an observed distribution that with a chi-squared test is comparedwith the expected binomial distribution.[4, p.118]
8. smarsa-MatrixRank is a test that fills a square matrix with randombits and computes the rank. With multiple matrices generated compareobserved ranks with the expected chi-squared statistic.[4, p.115]
9. sstring-HammingIndep is a test that computes the Hamming weightsfor successive blocks of bits and counts the number of occurrences ofeach possibility and compares the counts with the expected chi-squaredstatistic.[4, p.128-129]
10. swalk-RandomWalk1 is a test that generates a random walk based onsome of the bits in random numbers. Interpreting a 0 as a move to theleft and a 1 as a move to the right. The final positions are compared withthe expected chi-squared statistic.[4, p.120]
CHAPTER 3. METHODS 15
3.3.2 Rabbit testing batteryThe second testing battery bbattery_Rabbit was made up of the followingseries of tests.[4, p.152-153] For some of the tests the battery did multipleruns with different input parameters for dimensions and sizes. A test was saidto fail if its p-value fell outside of the interval [0.001,0.999].
1. smultin-MultinomialBitsOver is a power divergence test that comparesthe observed values with normal distribution if the values are sparse andchi-square if they are not.[4, p.104]
2. snpair-ClosePairsBitMatch is a test that generates points on a hypercube, divides it into sections and computes the minimum distance forany two points in the sections and compares these values with the ex-pected statistic.[4, p.109]
3. svaria-AppearanceSpacings is a test that takes a block of random num-bers and concatenates the most significant bits together and then findsthe number of blocks generated since the most recent occurrence of thesame block in the sequence. This is then compared with the expectednormal distribution.[4, p.119]
4. scomp-LinearComp is a test that looks at the number of jumps in lin-ear complexity for a sequence of bits and the size of these jumps whenan additional bit is added to the sequence. The number of jumps arecompared with a normal distribution and the size of the jumps with thechi-squared statistic.[4, p.123]
5. scomp-LempelZiv is a test that look for distinct patterns in strings ofrandom numbers by running the Lempel-Ziv compression algorithm onit. The ability of the string to compress is compared with the standardnormal distribution.[4, p.124]
6. sspectral-Fourier1 is a test that looks at deviations from expected val-ues in a discrete Fourier transformation.[4, p.125]
7. sspectral-Fourier3 is a variation of sspectral-Fourier1.[4, p.126]
8. sstring-LongestHeadRun is a test that for a number of blocks of ran-dom numbers finds the longest run of successive 1’s in each block andcounts the amount of times the different lengths have appeared. It thencompares this with the expected chi-squared statistic.[4, p.127]
16 CHAPTER 3. METHODS
9. sstring-PeriodsInStrings is a test that looks for periods in strings andcounts the amount of correlations between them, comparing this amountwith the expected chi-squared statistic.[4, p.127]
10. sstring-HammingWeight is a test that examines the proportions of 1’sin blocks of random numbers and compares the number of blocks havingeach value with the expected chi-square.[4, p.128]
11. sstring-HammingCorr is a test that looks for correlation of the Ham-ming weight of successive blocks of bits and compares this with thenormal distribution.[4, p.128]
12. sstring-HammingIndep is a test that computes the Hamming weightsfor successive blocks of bits and counts the number of occurrences ofeach possibility, comparing the counts with the expected chi-squaredstatistic.[4, p.128-129]
13. sstring-AutoCor is a test that measures the auto correlation in bits forblocks of randomnumbers and compareswith the normal distribution.[4,p.130]
14. sstring-Run is a run test that runs two tests simultaneously. It finds nruns of successive 1’s and n runs of successive 0’s for a total of 2n runsand compares the length of them with the chi-squared distribution. Italso looks at the total number of bits required to get 2n runs. [4, p.129]
15. smarsa-MatrixRank is a test that fills a square matrix with randombits and computes the rank. With multiple matrices generated compareobserved ranks with the expected chi-squared statistic.[4, p.115]
16. swalk-RandomWalk1 is a test that generates a random walk based onsome of the bits in random numbers. Interpreting a 0 as a move to theleft and a 1 as a move to the right. The final positions are compared withthe expected chi-squared statistic.[4, p.120]
3.3.3 Simple chi-squaredThe simple chi-square test partitioned the random numbers by converting thenumber to a double, dividing it with 232 − 1, multiplying with the number ofpartitions and removing the decimal. With this partitioning the first partitioncontained numbers between 0 and (232 − 1)/(the number of partitions). The

CHAPTER 3. METHODS 17
number of partitions used in the testing were 100 and as such the degrees offreedom for the corresponding chi-squared statistic was 99.
3.3.4 Graphic testFor the graphical test a 1000x1000 pixel image were created by taking in 32-bitnumbers and with modulo fitting them into the size. The points were createdwith the formula (mk−1,mk). This was done for 10002/2 numbers per imagecreated as that amount populated the image sufficiently.
Chapter 4
Results
4.1 Data analysis
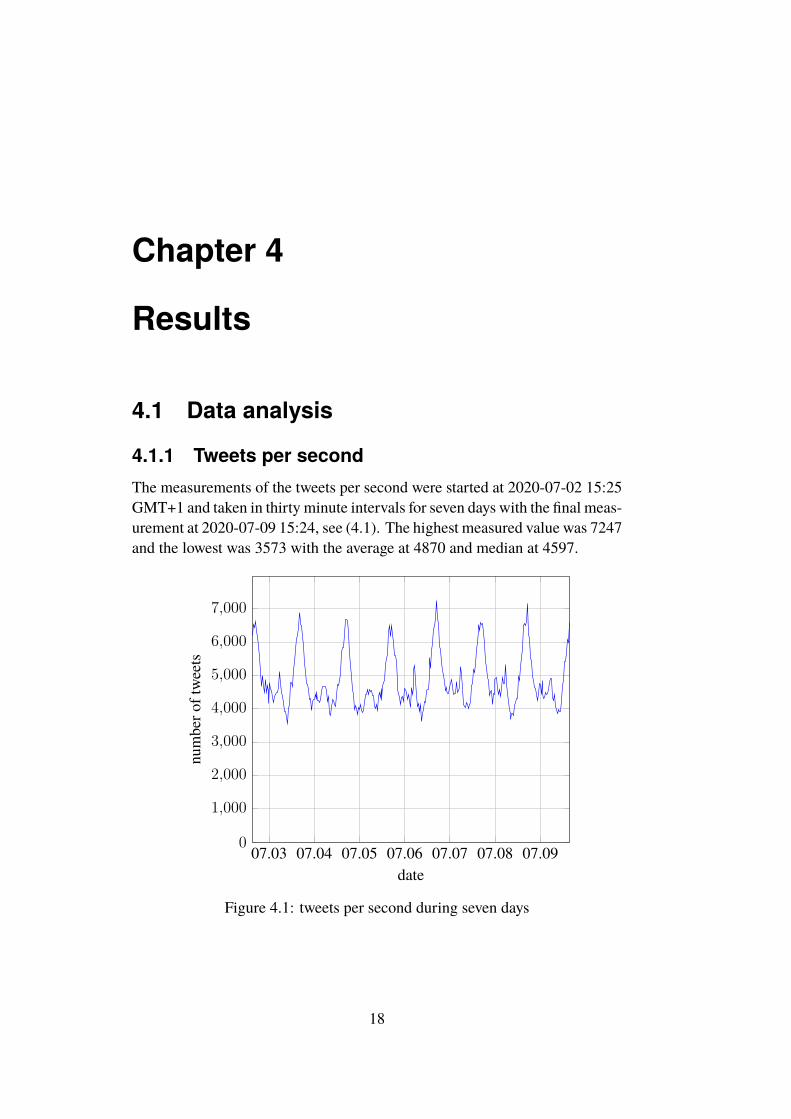
4.1.1 Tweets per secondThe measurements of the tweets per second were started at 2020-07-02 15:25GMT+1 and taken in thirty minute intervals for seven days with the final meas-urement at 2020-07-09 15:24, see (4.1). The highest measured value was 7247and the lowest was 3573 with the average at 4870 and median at 4597.
07.03 07.04 07.05 07.06 07.07 07.08 07.090
1,000
2,000
3,000
4,000
5,000
6,000
7,000
date
numbero
ftweets
Figure 4.1: tweets per second during seven days
18
CHAPTER 4. RESULTS 19
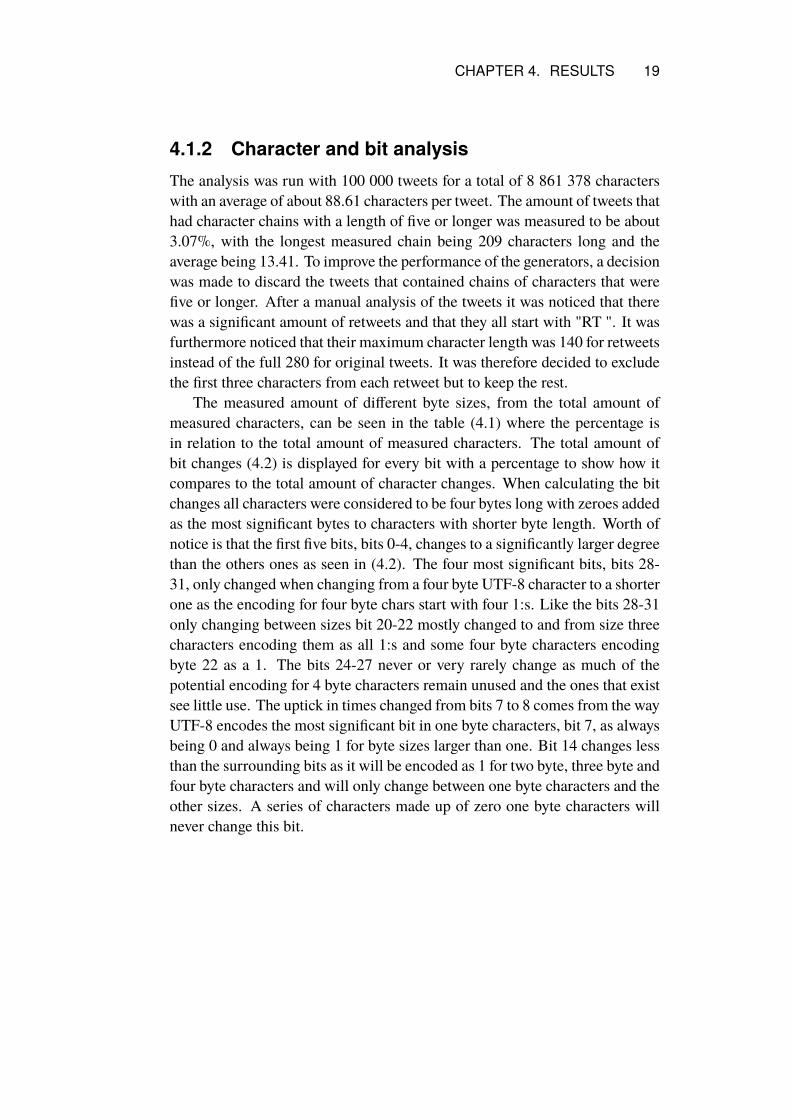
4.1.2 Character and bit analysisThe analysis was run with 100 000 tweets for a total of 8 861 378 characterswith an average of about 88.61 characters per tweet. The amount of tweets thathad character chains with a length of five or longer was measured to be about3.07%, with the longest measured chain being 209 characters long and theaverage being 13.41. To improve the performance of the generators, a decisionwas made to discard the tweets that contained chains of characters that werefive or longer. After a manual analysis of the tweets it was noticed that therewas a significant amount of retweets and that they all start with "RT ". It wasfurthermore noticed that their maximum character length was 140 for retweetsinstead of the full 280 for original tweets. It was therefore decided to excludethe first three characters from each retweet but to keep the rest.
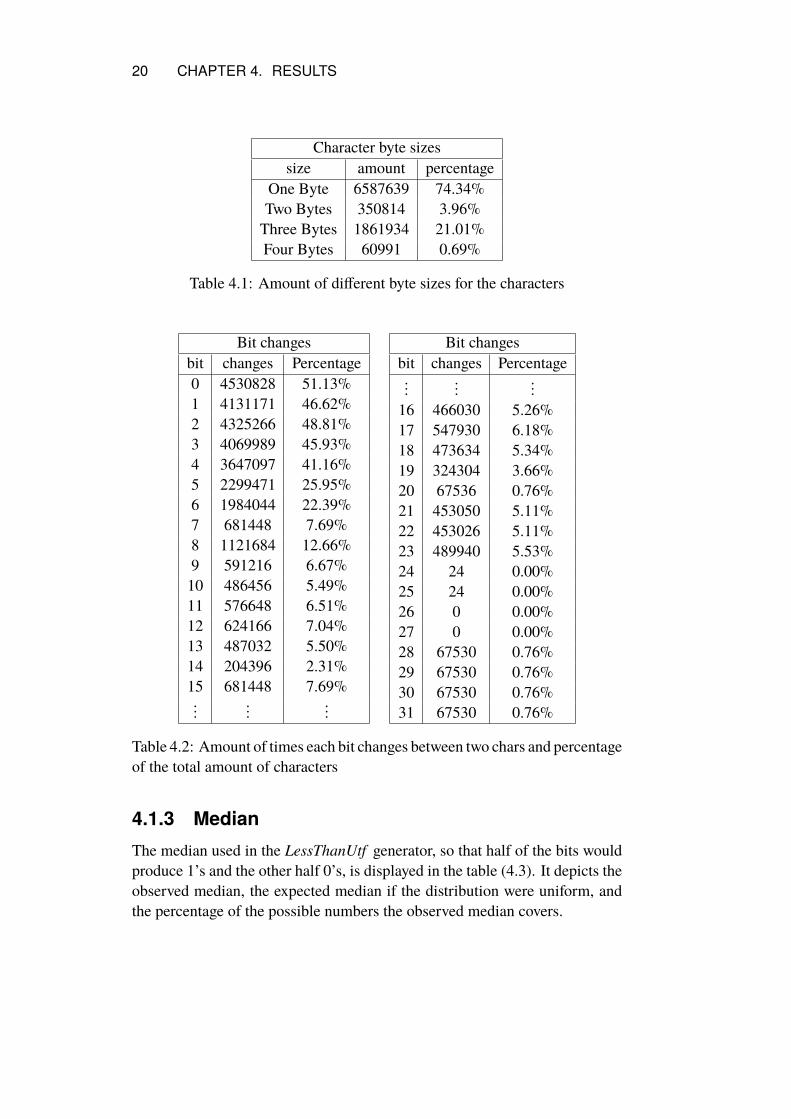
The measured amount of different byte sizes, from the total amount ofmeasured characters, can be seen in the table (4.1) where the percentage isin relation to the total amount of measured characters. The total amount ofbit changes (4.2) is displayed for every bit with a percentage to show how itcompares to the total amount of character changes. When calculating the bitchanges all characters were considered to be four bytes long with zeroes addedas the most significant bytes to characters with shorter byte length. Worth ofnotice is that the first five bits, bits 0-4, changes to a significantly larger degreethan the others ones as seen in (4.2). The four most significant bits, bits 28-31, only changed when changing from a four byte UTF-8 character to a shorterone as the encoding for four byte chars start with four 1:s. Like the bits 28-31only changing between sizes bit 20-22 mostly changed to and from size threecharacters encoding them as all 1:s and some four byte characters encodingbyte 22 as a 1. The bits 24-27 never or very rarely change as much of thepotential encoding for 4 byte characters remain unused and the ones that existsee little use. The uptick in times changed from bits 7 to 8 comes from the wayUTF-8 encodes the most significant bit in one byte characters, bit 7, as alwaysbeing 0 and always being 1 for byte sizes larger than one. Bit 14 changes lessthan the surrounding bits as it will be encoded as 1 for two byte, three byte andfour byte characters and will only change between one byte characters and theother sizes. A series of characters made up of zero one byte characters willnever change this bit.
20 CHAPTER 4. RESULTS
Character byte sizessize amount percentage
One Byte 6587639 74.34%Two Bytes 350814 3.96%Three Bytes 1861934 21.01%Four Bytes 60991 0.69%
Table 4.1: Amount of different byte sizes for the characters
Bit changesbit changes Percentage0 4530828 51.13%1 4131171 46.62%2 4325266 48.81%3 4069989 45.93%4 3647097 41.16%5 2299471 25.95%6 1984044 22.39%7 681448 7.69%8 1121684 12.66%9 591216 6.67%10 486456 5.49%11 576648 6.51%12 624166 7.04%13 487032 5.50%14 204396 2.31%15 681448 7.69%...
......
Bit changesbit changes Percentage...
......
16 466030 5.26%17 547930 6.18%18 473634 5.34%19 324304 3.66%20 67536 0.76%21 453050 5.11%22 453026 5.11%23 489940 5.53%24 24 0.00%25 24 0.00%26 0 0.00%27 0 0.00%28 67530 0.76%29 67530 0.76%30 67530 0.76%31 67530 0.76%
Table 4.2: Amount of times each bit changes between two chars and percentageof the total amount of characters
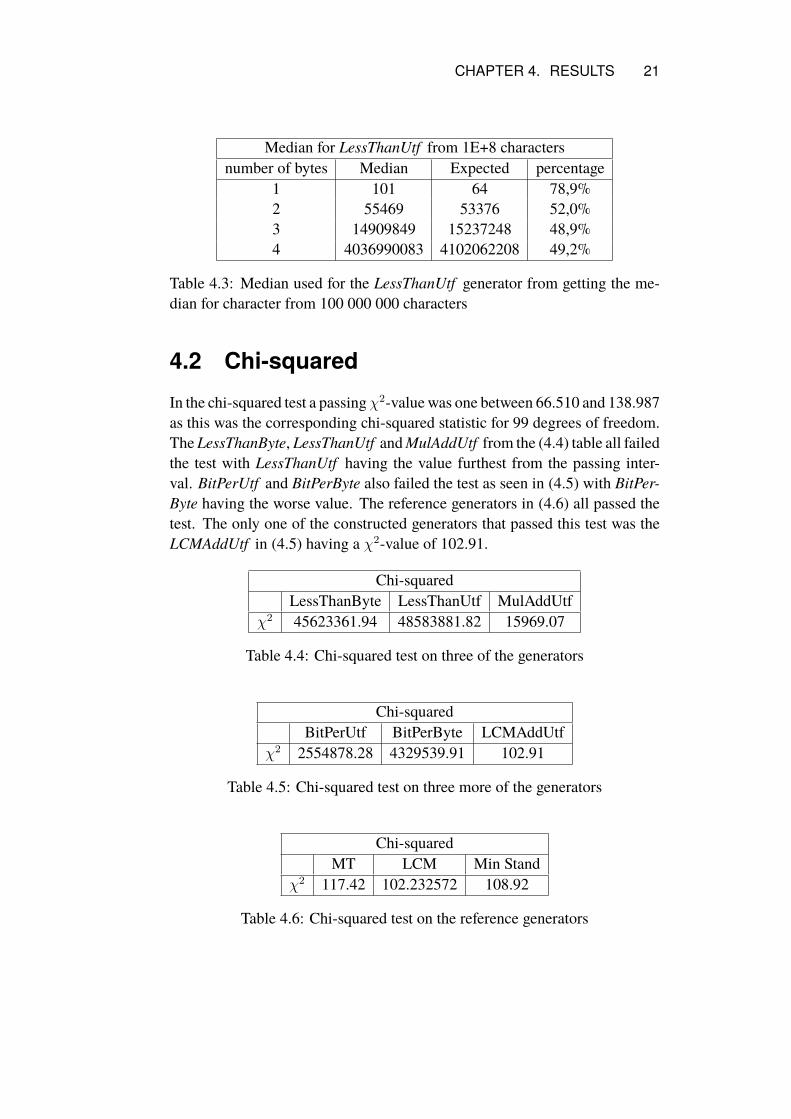
4.1.3 MedianThe median used in the LessThanUtf generator, so that half of the bits wouldproduce 1’s and the other half 0’s, is displayed in the table (4.3). It depicts theobserved median, the expected median if the distribution were uniform, andthe percentage of the possible numbers the observed median covers.
CHAPTER 4. RESULTS 21
Median for LessThanUtf from 1E+8 charactersnumber of bytes Median Expected percentage
1 101 64 78,9%2 55469 53376 52,0%3 14909849 15237248 48,9%4 4036990083 4102062208 49,2%
Table 4.3: Median used for the LessThanUtf generator from getting the me-dian for character from 100 000 000 characters
4.2 Chi-squaredIn the chi-squared test a passingχ2-value was one between 66.510 and 138.987as this was the corresponding chi-squared statistic for 99 degrees of freedom.The LessThanByte, LessThanUtf andMulAddUtf from the (4.4) table all failedthe test with LessThanUtf having the value furthest from the passing inter-val. BitPerUtf and BitPerByte also failed the test as seen in (4.5) with BitPer-Byte having the worse value. The reference generators in (4.6) all passed thetest. The only one of the constructed generators that passed this test was theLCMAddUtf in (4.5) having a χ2-value of 102.91.
Chi-squaredLessThanByte LessThanUtf MulAddUtf
χ2 45623361.94 48583881.82 15969.07
Table 4.4: Chi-squared test on three of the generators
Chi-squaredBitPerUtf BitPerByte LCMAddUtf
χ2 2554878.28 4329539.91 102.91
Table 4.5: Chi-squared test on three more of the generators
Chi-squaredMT LCM Min Stand
χ2 117.42 102.232572 108.92
Table 4.6: Chi-squared test on the reference generators
22 CHAPTER 4. RESULTS
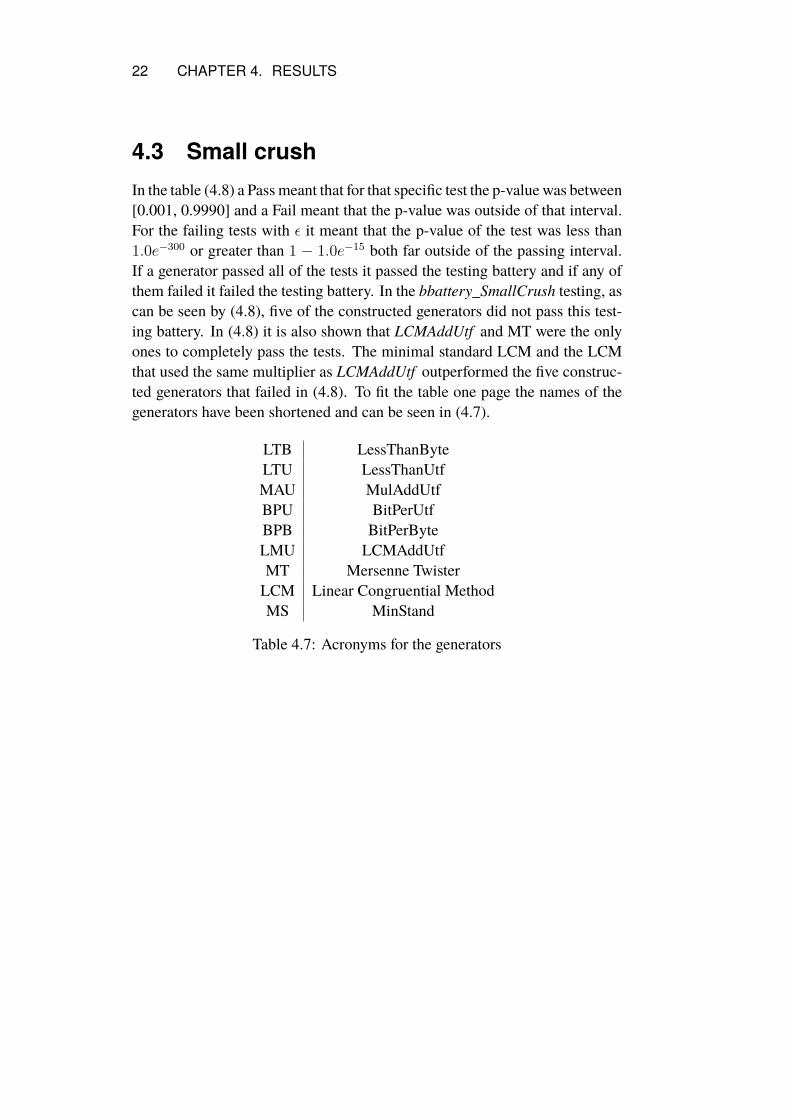
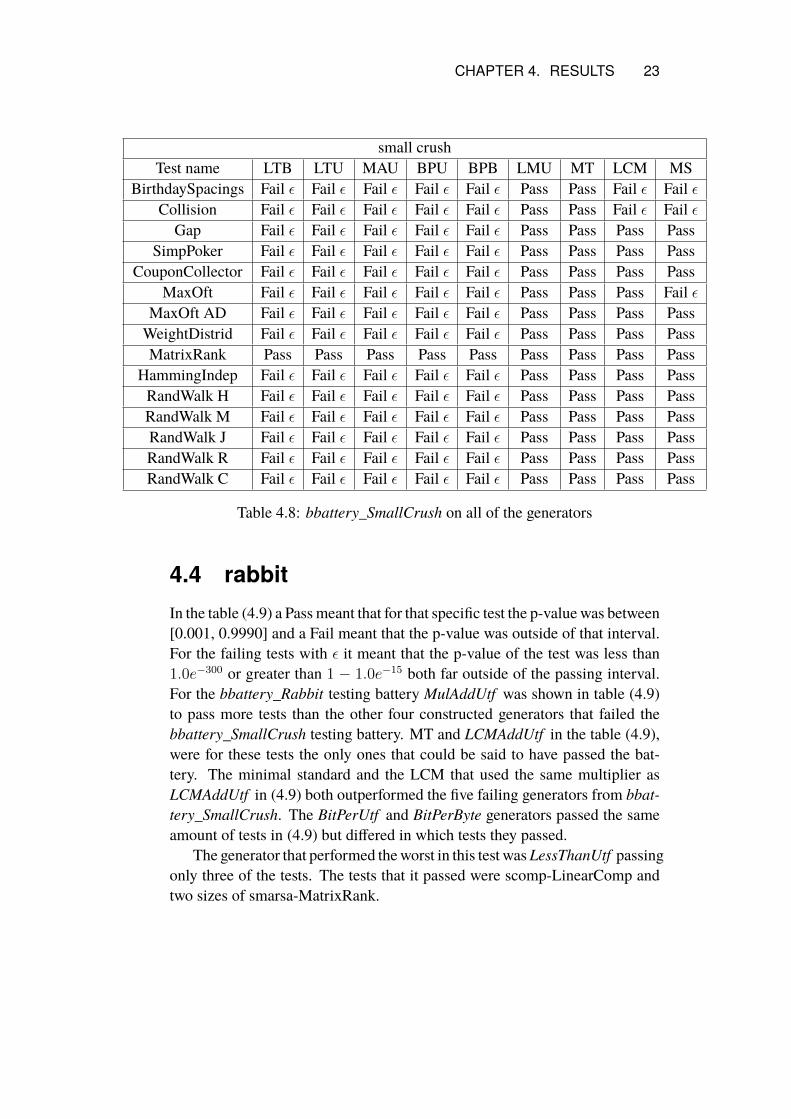
4.3 Small crushIn the table (4.8) a Pass meant that for that specific test the p-value was between[0.001, 0.9990] and a Fail meant that the p-value was outside of that interval.For the failing tests with ε it meant that the p-value of the test was less than1.0e−300 or greater than 1 − 1.0e−15 both far outside of the passing interval.If a generator passed all of the tests it passed the testing battery and if any ofthem failed it failed the testing battery. In the bbattery_SmallCrush testing, ascan be seen by (4.8), five of the constructed generators did not pass this test-ing battery. In (4.8) it is also shown that LCMAddUtf and MT were the onlyones to completely pass the tests. The minimal standard LCM and the LCMthat used the same multiplier as LCMAddUtf outperformed the five construc-ted generators that failed in (4.8). To fit the table one page the names of thegenerators have been shortened and can be seen in (4.7).
LTB LessThanByteLTU LessThanUtfMAU MulAddUtfBPU BitPerUtfBPB BitPerByteLMU LCMAddUtfMT Mersenne TwisterLCM Linear Congruential MethodMS MinStand
Table 4.7: Acronyms for the generators
CHAPTER 4. RESULTS 23
small crushTest name LTB LTU MAU BPU BPB LMU MT LCM MS
BirthdaySpacings Fail ε Fail ε Fail ε Fail ε Fail ε Pass Pass Fail ε Fail εCollision Fail ε Fail ε Fail ε Fail ε Fail ε Pass Pass Fail ε Fail ε
Gap Fail ε Fail ε Fail ε Fail ε Fail ε Pass Pass Pass PassSimpPoker Fail ε Fail ε Fail ε Fail ε Fail ε Pass Pass Pass Pass
CouponCollector Fail ε Fail ε Fail ε Fail ε Fail ε Pass Pass Pass PassMaxOft Fail ε Fail ε Fail ε Fail ε Fail ε Pass Pass Pass Fail ε
MaxOft AD Fail ε Fail ε Fail ε Fail ε Fail ε Pass Pass Pass PassWeightDistrid Fail ε Fail ε Fail ε Fail ε Fail ε Pass Pass Pass PassMatrixRank Pass Pass Pass Pass Pass Pass Pass Pass Pass
HammingIndep Fail ε Fail ε Fail ε Fail ε Fail ε Pass Pass Pass PassRandWalk H Fail ε Fail ε Fail ε Fail ε Fail ε Pass Pass Pass PassRandWalk M Fail ε Fail ε Fail ε Fail ε Fail ε Pass Pass Pass PassRandWalk J Fail ε Fail ε Fail ε Fail ε Fail ε Pass Pass Pass PassRandWalk R Fail ε Fail ε Fail ε Fail ε Fail ε Pass Pass Pass PassRandWalk C Fail ε Fail ε Fail ε Fail ε Fail ε Pass Pass Pass Pass
Table 4.8: bbattery_SmallCrush on all of the generators
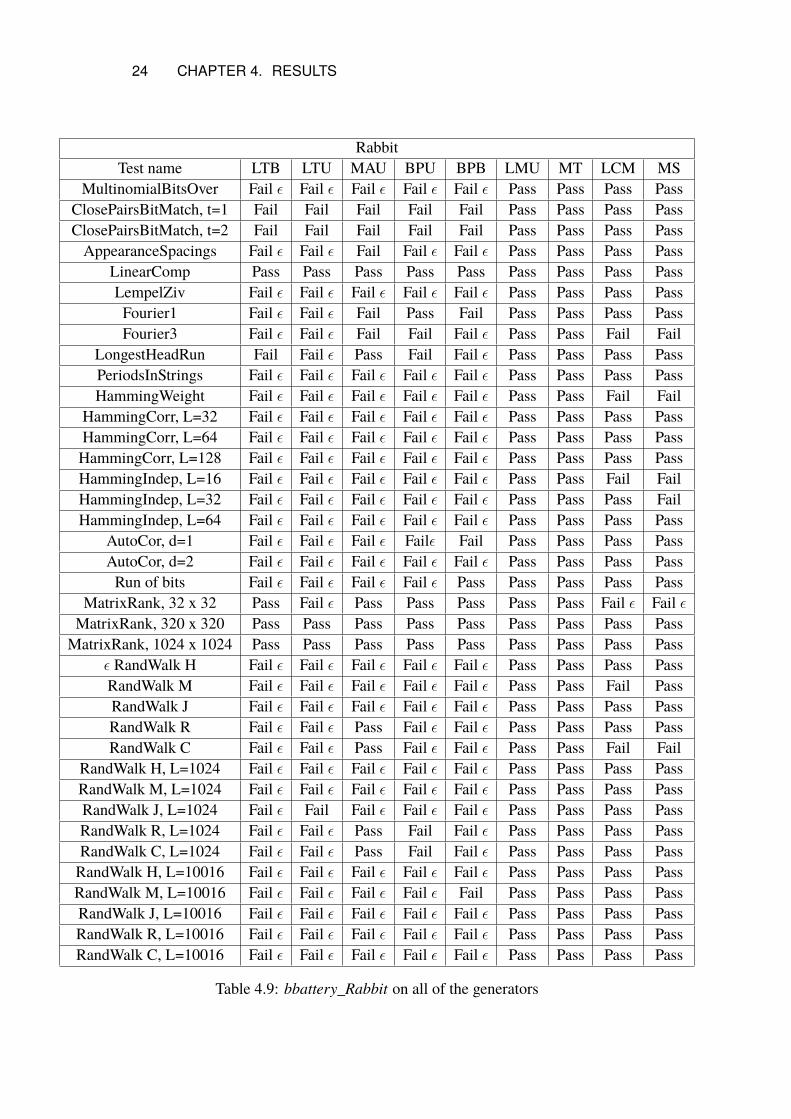
4.4 rabbitIn the table (4.9) a Pass meant that for that specific test the p-value was between[0.001, 0.9990] and a Fail meant that the p-value was outside of that interval.For the failing tests with ε it meant that the p-value of the test was less than1.0e−300 or greater than 1 − 1.0e−15 both far outside of the passing interval.For the bbattery_Rabbit testing battery MulAddUtf was shown in table (4.9)to pass more tests than the other four constructed generators that failed thebbattery_SmallCrush testing battery. MT and LCMAddUtf in the table (4.9),were for these tests the only ones that could be said to have passed the bat-tery. The minimal standard and the LCM that used the same multiplier asLCMAddUtf in (4.9) both outperformed the five failing generators from bbat-tery_SmallCrush. The BitPerUtf and BitPerByte generators passed the sameamount of tests in (4.9) but differed in which tests they passed.
The generator that performed theworst in this test was LessThanUtf passingonly three of the tests. The tests that it passed were scomp-LinearComp andtwo sizes of smarsa-MatrixRank.
24 CHAPTER 4. RESULTS
RabbitTest name LTB LTU MAU BPU BPB LMU MT LCM MS
MultinomialBitsOver Fail ε Fail ε Fail ε Fail ε Fail ε Pass Pass Pass PassClosePairsBitMatch, t=1 Fail Fail Fail Fail Fail Pass Pass Pass PassClosePairsBitMatch, t=2 Fail Fail Fail Fail Fail Pass Pass Pass PassAppearanceSpacings Fail ε Fail ε Fail Fail ε Fail ε Pass Pass Pass Pass
LinearComp Pass Pass Pass Pass Pass Pass Pass Pass PassLempelZiv Fail ε Fail ε Fail ε Fail ε Fail ε Pass Pass Pass PassFourier1 Fail ε Fail ε Fail Pass Fail Pass Pass Pass PassFourier3 Fail ε Fail ε Fail Fail Fail ε Pass Pass Fail Fail
LongestHeadRun Fail Fail ε Pass Fail Fail ε Pass Pass Pass PassPeriodsInStrings Fail ε Fail ε Fail ε Fail ε Fail ε Pass Pass Pass PassHammingWeight Fail ε Fail ε Fail ε Fail ε Fail ε Pass Pass Fail Fail
HammingCorr, L=32 Fail ε Fail ε Fail ε Fail ε Fail ε Pass Pass Pass PassHammingCorr, L=64 Fail ε Fail ε Fail ε Fail ε Fail ε Pass Pass Pass PassHammingCorr, L=128 Fail ε Fail ε Fail ε Fail ε Fail ε Pass Pass Pass PassHammingIndep, L=16 Fail ε Fail ε Fail ε Fail ε Fail ε Pass Pass Fail FailHammingIndep, L=32 Fail ε Fail ε Fail ε Fail ε Fail ε Pass Pass Pass FailHammingIndep, L=64 Fail ε Fail ε Fail ε Fail ε Fail ε Pass Pass Pass Pass
AutoCor, d=1 Fail ε Fail ε Fail ε Failε Fail Pass Pass Pass PassAutoCor, d=2 Fail ε Fail ε Fail ε Fail ε Fail ε Pass Pass Pass PassRun of bits Fail ε Fail ε Fail ε Fail ε Pass Pass Pass Pass Pass
MatrixRank, 32 x 32 Pass Fail ε Pass Pass Pass Pass Pass Fail ε Fail εMatrixRank, 320 x 320 Pass Pass Pass Pass Pass Pass Pass Pass PassMatrixRank, 1024 x 1024 Pass Pass Pass Pass Pass Pass Pass Pass Pass
ε RandWalk H Fail ε Fail ε Fail ε Fail ε Fail ε Pass Pass Pass PassRandWalk M Fail ε Fail ε Fail ε Fail ε Fail ε Pass Pass Fail PassRandWalk J Fail ε Fail ε Fail ε Fail ε Fail ε Pass Pass Pass PassRandWalk R Fail ε Fail ε Pass Fail ε Fail ε Pass Pass Pass PassRandWalk C Fail ε Fail ε Pass Fail ε Fail ε Pass Pass Fail Fail
RandWalk H, L=1024 Fail ε Fail ε Fail ε Fail ε Fail ε Pass Pass Pass PassRandWalk M, L=1024 Fail ε Fail ε Fail ε Fail ε Fail ε Pass Pass Pass PassRandWalk J, L=1024 Fail ε Fail Fail ε Fail ε Fail ε Pass Pass Pass PassRandWalk R, L=1024 Fail ε Fail ε Pass Fail Fail ε Pass Pass Pass PassRandWalk C, L=1024 Fail ε Fail ε Pass Fail Fail ε Pass Pass Pass PassRandWalk H, L=10016 Fail ε Fail ε Fail ε Fail ε Fail ε Pass Pass Pass PassRandWalk M, L=10016 Fail ε Fail ε Fail ε Fail ε Fail Pass Pass Pass PassRandWalk J, L=10016 Fail ε Fail ε Fail ε Fail ε Fail ε Pass Pass Pass PassRandWalk R, L=10016 Fail ε Fail ε Fail ε Fail ε Fail ε Pass Pass Pass PassRandWalk C, L=10016 Fail ε Fail ε Fail ε Fail ε Fail ε Pass Pass Pass Pass
Table 4.9: bbattery_Rabbit on all of the generators
CHAPTER 4. RESULTS 25
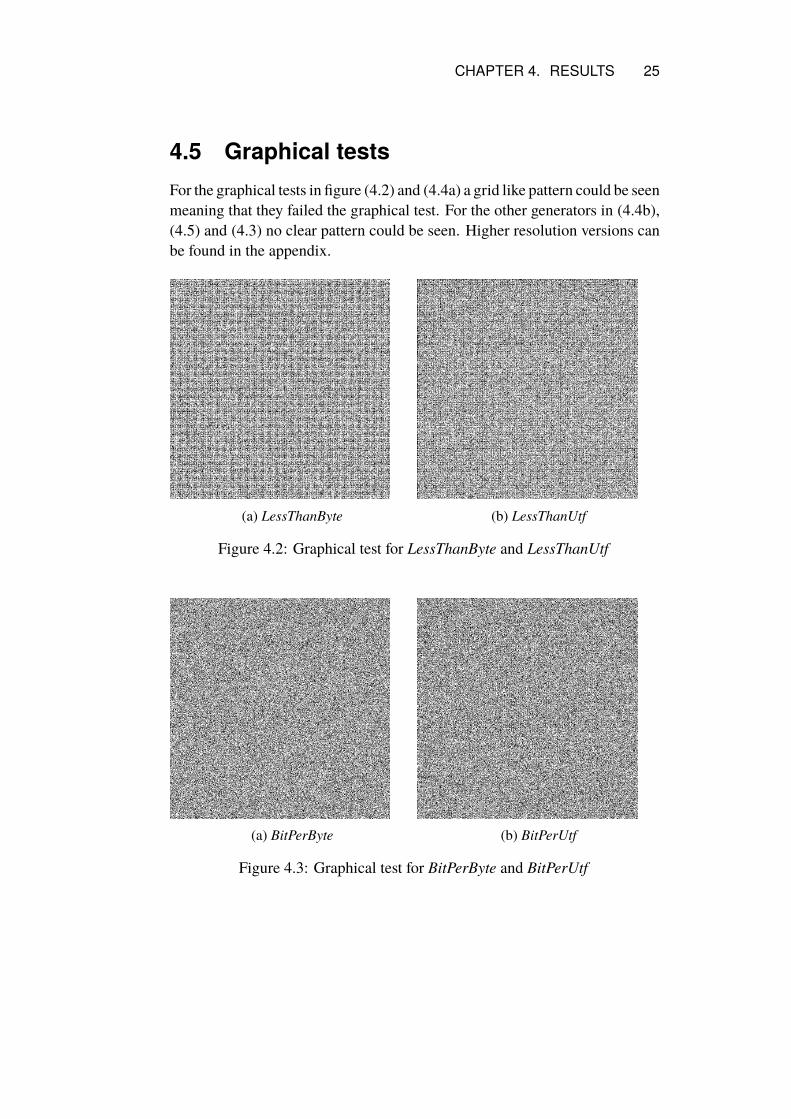
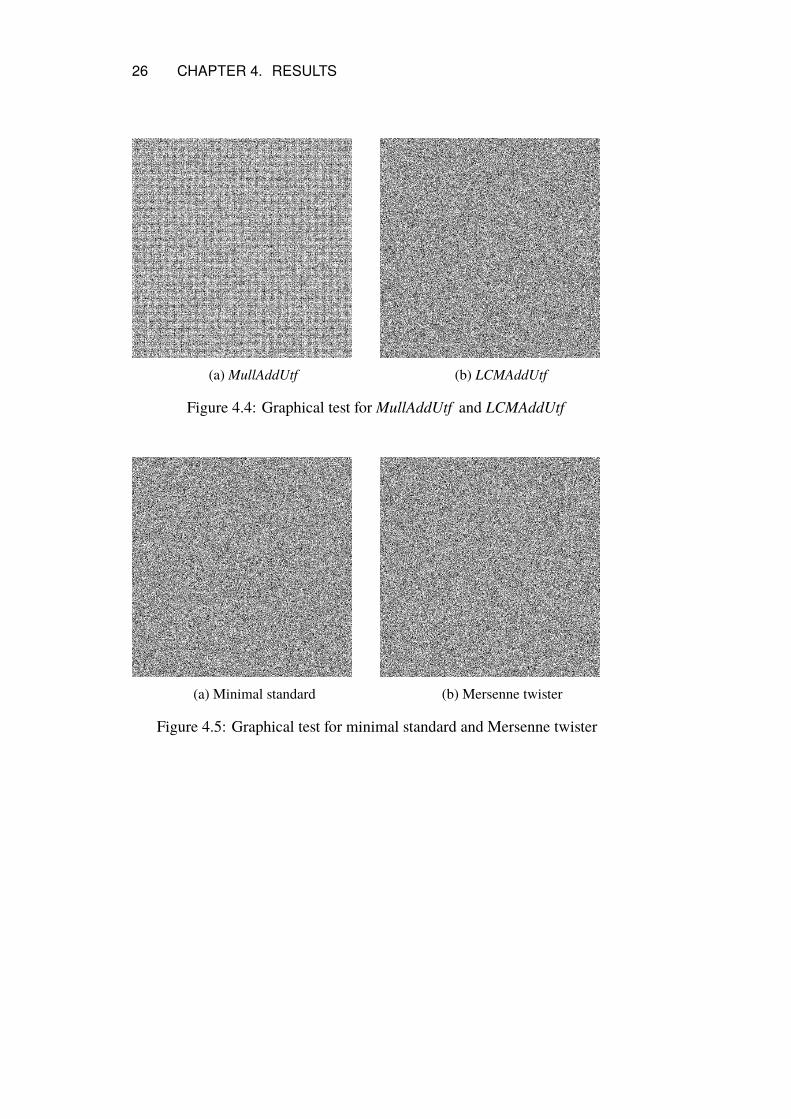
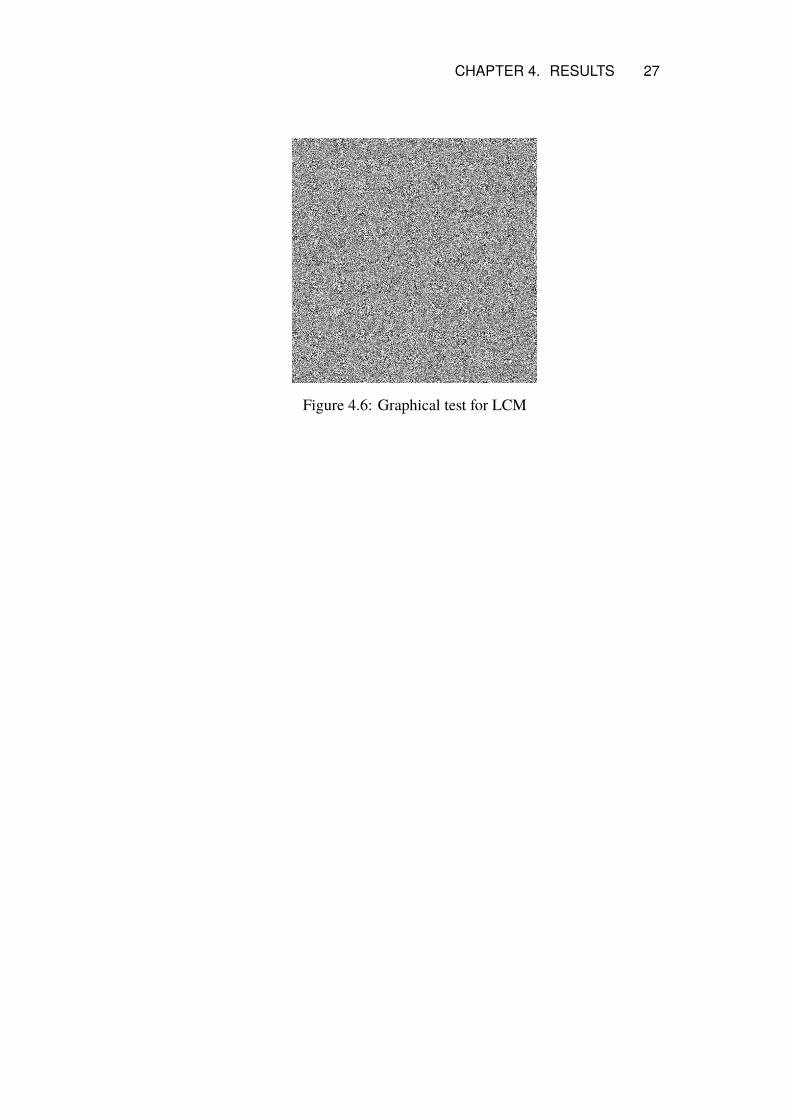
4.5 Graphical testsFor the graphical tests in figure (4.2) and (4.4a) a grid like pattern could be seenmeaning that they failed the graphical test. For the other generators in (4.4b),(4.5) and (4.3) no clear pattern could be seen. Higher resolution versions canbe found in the appendix.
(a) LessThanByte (b) LessThanUtf
Figure 4.2: Graphical test for LessThanByte and LessThanUtf
(a) BitPerByte (b) BitPerUtf
Figure 4.3: Graphical test for BitPerByte and BitPerUtf
26 CHAPTER 4. RESULTS
(a) MullAddUtf (b) LCMAddUtf
Figure 4.4: Graphical test for MullAddUtf and LCMAddUtf
(a) Minimal standard (b) Mersenne twister
Figure 4.5: Graphical test for minimal standard and Mersenne twister
CHAPTER 4. RESULTS 27
Figure 4.6: Graphical test for LCM
Chapter 5
Discussion
Text is, by definition, structured. Words are characters combined together toformmeaning and sentences are words combined together to share knowledge.There is, however, also randomness involved. It is not possible to predict asentence from one word and neither is it possible to predict a word from onecharacter, in the same way we can’t predict what two different persons willwrite. To take a large amount of structured text and turn it into random num-bers requires that we extract the randomness from the text without introducingany new structure or maintaining the structure already present while doing it.
5.1 Data analysisA lot of the data analysis gave results within expectations; there were a largedifference in amount of characters between the different character sizes em-pathising one byte, where the Latin alphabet is, and three bytes, where mostChinese, Japanese, andKorean characters are.[12] Therewere also some chainsof characters that were numerous and long enough to warrant the removal ofchains in general, as it is detrimental for the randomness if the same characterappears many times in a row. The decision about keeping the retweets andonly removing "RT " was made with the reasoning that it would be enoughspace between each retweet and the original tweet for the repetition not tomatter. More surprising was the quick drop off in the amount of bit changes(4.2) for even the lower bits with the sixth one already significantly droppingoff in the amount of changes. This shouldn’t have come as a surprise though,considering most of the characters in a language are close to each other in theencoding, meaning you only have to count up or down a small amount to reachthem which does not change the more significant bits.
28
CHAPTER 5. DISCUSSION 29
The tweets per second changes a fair bit during each day with a high activ-ity period and a low activity period where the high activity period has nearlydouble the activity than the low activity period. This is most likely due to Twit-ter being used mainly by people communicating with the Latin alphabet (4.1)and being spread out unevenly across the worlds different time-zones. Thismeans that with one percent of the tweets with the average length of 88,61we get between around 3000 and 6000 characters each second which results inbetween 230 and 460 randomnumbers per second using LCMAddUtf. This canbe increased further either by accessing more data or by reducing the amountof characters for each number, losing quality in the process.
The median (4.1) that was calculated for LessThanUtf is no surprise either,the large percentage in one byte characters is due to the small letters of thealphabet having very high values and the large amount of low values that aren’tused.
Removing the bits 7, 14 and 21-31 that come from the encoding of the bytesizes would help in removing some of the structure that comes from the waythe data is encoded. Doing this would likely improve all of the constructedgenerators.
5.2 Simple generatorsThe inherent structure of text can be seen by BitPerByte and BitPerUtf failingin most of the tests even when the bit changes in table (4.2) suggest that theyshould change often. BitPerByte andBitPerUtf can be said to be the generatorsclosest to simply taking the raw text as a random number and therefore in largeparts maintain most of the structure in the text. This means that even thoughthere is a fairly even spread of 1’s and 0’s according to the bit changes table(4.2), the way that they switch between each other creates patterns that thegenerators perpetuate. These two generators are very similar as the distributionof byte sizes for the characters in the data set, as seen in the (4.1) table, hasa distribution with single byte chars making up 74% of the total amount ofcharacters. The result of these generators did not come as a surprise but merelyconfirmed the suspicion that simply taking the bits is not enough to generategood random numbers.
The generators that performed the worst are LessThanUtf and LessThan-Byte, they got the worst χ2-values by an order of magnitude and they barelycompleted any tests. These generators are also very similar in how they func-tion due to the distribution of the different byte sizes and while the byte versionperformed better due to it using the bits that vary the most, they both showed
30 CHAPTER 5. DISCUSSION
some serous weaknesses. The larger cross like pattern in the (4.2b) figurecomes from having produced a lot of the number 232−1 and due to the graph-ical test using modulo 1000 to fit all the different numbers in the graph, 232−1
becoming 295. Less visible in the figure is the line at the top and left edgescorresponding to the number 0 also being too common of a number to appear.The reason that the LessThanUtf generator creates these two numbers made upof only one or zero value bits is likely from character sets where all charactersfall on one side of the median, something that should be especially commonfor the three byte characters that contain several widely used languages. Thismeans that if a tweet in that language is in the set of tweets, all numbers gen-erated from it risks having the same value. An example of this would be thecapital letters in the Latin alphabet, which will all produce a one if used.
These four generators shows that to create a good random number gener-ator from text, it isn’t enough to simply take the data character by character,there needs to be an interaction between the characters that can remove thestructures of the text.
5.3 LCM generatorsThe simplest solution to making the characters interact with each other wouldbe to multiply the numbers together and add amodulo to keep the values down,plus some addition to prevent zero propagation. This is exactly what the linearcongruential method does and the resulting generator, MulAddUtf, gave us theresult that has been the hardest to interpret due to it performing significantlyworse than expected. After confirming that the cause was not due to usingthe same character both for multiplying and adding the only possible explan-ation for this behaviour is due to the LCM methods heavy reliance on a goodmultiplier to generate a good series of random numbers. Bad multipliers havea tendency to quickly degenerate a LCM random number generator into shortcycles or simply zeroes if there is no constant involved. [1] The varying size ofthe multiplier could perhaps cause interfere with the cycling of the numbers,introducing patterns from the text and, due to some character values not havingcharacters associated with them, having a hard time creating some values.
This promoted the creation of a simplified version of the same generator,the LCMAddUtf, which is by far the best performing generator. It completedall of the tests in the testing suites and was the only one of the constructedgenerators that got a passing χ2-value, making it an actually usable randomnumber generator. These results do in part adhere to the conclusions fromHalprin and Naor in the possibility to extract randomness from human beha-
CHAPTER 5. DISCUSSION 31
viour when humans are not intentionally trying to be random. [14] As oursource of data is not reliant on single individuals our results like the conclu-sion by Figurska et al. is not enough to conclude whether individual humansare capable of generating random numbers. [13]
With the other generators there was a set amount of characters that neededto be used for the creation of each number, 32 characters were needed to gen-erate a 32 bit number. By making use of multiplication, a smaller amount ofcharacters could be used to reach higher value numbers and the number ofcharacters could also be varied to find the amount that worked the best. As ageneral rule, the performance decreased the fewer characters that were usedwhich ended with the failing example from (2.1), where only one characterwas used per number. The LCM that uses the same multiplier performed sig-nificantly worse in the tests than LCMAddUtf when run the same amount oftimes between giving each number. It would be possible to improve this gen-erator by using a better multiplier to start with instead of the arbitrarily chosenone of 11.
5.4 Reference generators and graphical testThe reference generators all performed as expected, the Mersenne Twister per-formed the best and completed all the tests while the LCM generators showedtheir inherent weaknesses and failed several tests. The minimal standard LCMperformed better than the other LCM when that one only ran once per num-ber but when it generated the same amount of numbers between each outputas LCMAddUtf the generators were almost equal in performance. The reasonfor this is most likely that when using a small multiplier it creates a series ofnumbers that rises slowly before resetting due to modulo. This creates a seriesof numbers where the most significant bits stay unchanged for a prolongedperiod. This can be alleviated by making the generator run multiple times be-fore giving the next number so that it more quickly starts producing numberswhere more of the bits are in use.
The graphical tests were made as a visual representation of the randomnessto make it easier for humans to see how the randomness actually comparesbetween generators. The images should be viewed in terms of lines, whereeach line represents how often a group of numbers, based on modulo 1000,follow after some other numbers. If a line has a lot of points in it, that numberhas been generated many times in conjunction with a lot of other differentnumbers. Larger gaps of white means that those numbers have a hard timebeing generated after one another, showing that the numbers are generated in
32 CHAPTER 5. DISCUSSION
a pattern. In the graphical test the smaller grid like pattern visible in (4.4a)and (4.2) likely means that there are some numbers that the generators aremore likely to generate than others. The reason those numbers are unlikely togenerate is probably due to there not being the necessary character values inthe input text, as some characters are used more often than others.
5.5 Ethical aspectsIf this method of generating random numbers from text written on social me-dia, in this case twitter, see more general use it can give the owners of the socialmedia the potential to influence any system using the service. This, however,can only be done if they are aware that someone is requesting text from thesocial media for the purpose of generating random numbers. As they havecontrol over the flow of data they have the ability to tamper with it and supplydata to the generator that produces a known set of numbers. But the owners ofthe social media aren’t the only ones that have the ability to influence the con-tents of the data sent. If a malicious actor that knew that some target was goingto generate random numbers at some specific time, that actor could flood thesocial media with specific data to make the generator produce a known set ofnumbers. It is also possible to collect all of the data from the social media forsome time span and then from that data find all of the possible numbers thatcould have been generated during that time, putting encrypted systems at risk.
5.6 SustainabilityIn using random number generators reliant on data from social media, therewill be an increase in energy usage compared to using locally run PRNGs.This increase comes from the energy used in communicating with the serverwhere the data is fetched as well as the electricity that the server itself uses. It isalso worth mentioning that these methods make use of existing infrastructureso no new hardware will be necessary to create initially and they might evendecrease the need for hardware if a version replaces some TRNGs. Thesemethods would still increase the server demand for the services which couldcause a need for expansion of the server capacity, necessitating new hardwareto be created. As such these methods would likely have a negative impact interms of sustainability but could also have a positive effect depending on howthey are used.
CHAPTER 5. DISCUSSION 33
5.7 LimitationsAs there is an infinite amount of possible random number generators, the onesconstructed are not the only ways to try to extract randomness from text. Theconstructed versions are therefore not the definite way and some, for othersobvious, ways to generate random numbers have not been considered in thispaper. As well as there being an infinite amount of possible random numbergenerators there is an infinite amount of possible ways to test the randomnessof them and there can therefore be some test or set of tests that would disprovethe randomness for the generators used. [4, p.2]
The data that was used by the generators was downloaded at one time andused repeatedly for the rest of the project. This means that data from only asmall time period from one day was analysed and worked on, which meansthat it is possible that another result would have been achieved if the data hadbeen taken during another time of the day. This is especially relevant for thedistribution of the different byte-sizes, as those are dependent on the languagesused. Different parts of the world uses different languages and the distributionof byte-sizes should therefore be different depending on the time of the day.
In conducting the tests the way we did, by generating all of the randomnumbers before the tests and reading from the files that contained the num-bers, there was a problem of generating files large enough for the larger testingbatteries in testU01. There was also a limitation of time with the larger testsin testU01 taking upwards of 8 hours to complete for one generator.
5.8 RetrospectiveWhile the fundamental approach of doing a data analysis, constructing therandom number generators, using randomness testing to determine the qualityof the generators and where we got the data from was good, there are somechanges we would make were we to do this again. The first change we wouldmake would be to have done a more thorough analysis of the data earlier in theproject and not have it grow organically as we thought we needed it. While wedo not believe we missed anything of relevance in the final analysis, if we hadgotten some of the information earlier a lot of time could have been savedwhencreating the generators. As for the testing we could likely have found a wayto use the bbattery_Crush or potentialy bbattery_BigCrush instead as they aremore thorough in the testing than bbattery_SmallCrush and bbattery_Rabbit.
Chapter 6
Conclusion
Using text as a source of entropy in the generation of random numbers hasshown to be a possible method but not without weaknesses. Testing showedthat when used as a varying additive part in a linear congruential method ran-dom number generator, this source of entropy has the ability to generate num-bers with quality comparable to the well used modern pseudo random numbergenerator Mersenne Twister. When using a live feed from twitter as the sourceof text, this method will never lose its randomness and enter a loop in the sameway that a pseudo random number generator does, but in return it is dependenton the speed at which it can receive data from the source. As such the moredata that is available the faster the generation of new numbers will be. Thesource is, however, also a point of weakness in the generator as data that hasbeen tampered with or that is not varied enough risks losing the randomnessof the random number generation. The implementations done in this reportare not the most efficient ones and with future research and testing a bettermethod can most likely be found.
34
Bibliography
[1] Donald E Knuth. Art of computer programming, volume 2: Seminumer-ical algorithms. 3rd ed. Addison-Wesley Professional, 2014. Chap. 3.
[2] Helmut G Katzgraber. ‘Random numbers in scientific computing: Anintroduction’. In: arXiv preprint arXiv:1005.4117 (2010).
[3] Raffi Krikorian. ‘New Tweets per second record, and how!’ In: TwitterEngineering (16th Aug. 2013). url: https://blog.twitter.com/engineering/en_us/a/2013/new-tweets-per-second-record-and-how.html (visited on 03/08/2020).
[4] Pierre L’Ecuyer and Richard Simard. ‘TestU01: AC library for empir-ical testing of random number generators’. In: ACM Transactions onMathematical Software (TOMS) 33.4 (2007), pp. 1–40.
[5] Stephen K. Park and Keith W. Miller. ‘Random number generators:good ones are hard to find’. In: Communications of the ACM 31.10(1988), pp. 1192–1201.
[6] MATLAB. version 9.8.0.1323502 (R2020a). Natick,Massachusetts: TheMathWorks Inc., 2020.
[7] Guy Mélard. ‘On the accuracy of statistical procedures in MicrosoftExcel 2010’. In: Computational statistics 29.5 (2014), pp. 1095–1128.
[8] Makoto Matsumoto and Takuji Nishimura. ‘Mersenne twister: a 623-dimensionally equidistributed uniform pseudo-random number gener-ator’. In: ACM Transactions on Modeling and Computer Simulation(TOMACS) 8.1 (1998), pp. 3–30.
[9] Andrew Rukhin et al. A statistical test suite for random and pseudor-andom number generators for cryptographic applications. Tech. rep.Booz-allen and hamilton inc mclean va, 2001.
[10] James EGentle.Random number generation and Monte Carlo methods.Springer Science & Business Media, 2006.
35
36 BIBLIOGRAPHY
[11] I. Chugunkov and R.Muleys. ‘Pseudorandom numbers generators qual-ity assessment using graphic tests’. In: Proceedings of the 2014 IEEENW Russia Young Researchers in Electrical and Electronic Engineer-ing Conference. 2014, pp. 8–13.
[12] the Unicode Consortium. ‘The Unicode Standard’. Version 13.0. In:Mountain view, CA (2020).
[13] Małgorzata Figurska, Maciej Stańczyk and Kamil Kulesza. ‘Humanscannot consciously generate randomnumbers sequences: Polemic study’.In: Medical hypotheses 70.1 (2008), pp. 182–185.
[14] Ran Halprin and Moni Naor. ‘Games for extracting randomness’. In:Proceedings of the 5th Symposium on Usable Privacy and Security.2009, pp. 1–12.
[15] Twitter Developer. Twitter.url:https://developer.twitter.com/en/docs (visited on 20/07/2020).
[16] Lukas Gutenberg and Emil Olin. tweetRng. 2020. url: https : / /github.com/emilOlin/TweetRng/tree/v1.0.
[17] Internet Live Stats. Real Time Statistics Project. url: https://www.internetlivestats.com/one-second/ (visited on 20/07/2020).


www.kth.se
TRITA -EECS-EX-2020:685