Embed Size (px)
Citation preview
Genetic Control of Organ Shape and Tissue PolarityAmelia A. Green1¤, J. Richard Kennaway2, Andrew I. Hanna2, J. Andrew Bangham2*, Enrico Coen1*
1 Department of Cell and Developmental Biology, John Innes Centre, Norwich, United Kingdom, 2 University of East Anglia, School of Computing Sciences, Norwich,
United Kingdom
Abstract
The mechanisms by which genes control organ shape are poorly understood. In principle, genes may control shape bymodifying local rates and/or orientations of deformation. Distinguishing between these possibilities has been difficultbecause of interactions between patterns, orientations, and mechanical constraints during growth. Here we show how acombination of growth analysis, molecular genetics, and modelling can be used to dissect the factors contributing to shape.Using the Snapdragon (Antirrhinum) flower as an example, we show how shape development reflects local rates andorientations of tissue growth that vary spatially and temporally to form a dynamic growth field. This growth field is underthe control of several dorsoventral genes that influence flower shape. The action of these genes can be modelled byassuming they modulate specified growth rates parallel or perpendicular to local orientations, established by a few keyorganisers of tissue polarity. Models in which dorsoventral genes only influence specified growth rates do not fully accountfor the observed growth fields and shapes. However, the data can be readily explained by a model in which dorsoventralgenes also modify organisers of tissue polarity. In particular, genetic control of tissue polarity organisers at ventral petaljunctions and distal boundaries allows both the shape and growth field of the flower to be accounted for in wild type andmutants. The results suggest that genetic control of tissue polarity organisers has played a key role in the development andevolution of shape.
Citation: Green AA, Kennaway JR, Hanna AI, Bangham JA, Coen E (2010) Genetic Control of Organ Shape and Tissue Polarity. PLoS Biol 8(11): e1000537.doi:10.1371/journal.pbio.1000537
Academic Editor: Ottoline Leyser, University of York, United Kingdom
Received June 14, 2010; Accepted September 28, 2010; Published November 9, 2010
Copyright: � 2010 Green et al. This is an open-access article distributed under the terms of the Creative Commons Attribution License, which permitsunrestricted use, distribution, and reproduction in any medium, provided the original author and source are credited.
Funding: This work was funded by the BBSRC (BB/F005997/1). The funders had no role in study design, data collection and analysis, decision to publish, orpreparation of the manuscript.
Competing Interests: The authors have declared that no competing interests exist.
Abbreviations: v, rotation rate for a region; h, the principal orientation of growth for a region; A surface, one surface of the canvas; B surface, the other surfaceof the canvas; GPT-framework, Growing Polarised Tissue framework; GRN, Gene Regulatory Network; Kmax, growth rate along the principal orientation of growthfor a region; Kmin, growth rate perpendicular to the principal orientation of growth for a region; Knor, specified growth rate in tissue thickness for a region; Kpar,specified growth rate for a region, in the plane of the canvas, parallel to the local polarity; Kper, specified growth rate for a region, in the plane of the canvas,perpendicular to the local polarity; KRN, growth rate (K) Regulatory Network; LTS, LATERALS (an identity factor in the corolla model); OPT, Optical ProjectionTomography; +organiser, a region of the canvas that organises polarity with arrows pointing away from it; 2organiser, a region of the canvas that organisespolarity with arrows pointing towards it; POL, POLARISER (a signalling factor in the GPT-framework that is used to implement polarity propagation—the gradientof POL defines local polarity); PRN, Polarity Regulatory Network.
* E-mail: [email protected] (EC); [email protected] (JAB)
¤ Current address: Department of Systems Biology, Harvard Medical School, Boston, Massachusetts, United States of America
Introduction
Changes in tissue shape during development may involve
growth, cell rearrangements, or a combination of the two. In the
case of plants, where cells are held in place by their walls, shape
changes arise purely through differential growth [1–3]. Thus,
plants provide a simplified system for studying the genetic control
of shape. Typically, plant tissues do not grow equally in all
directions but preferentially along particular orientations. In
principle, genes may therefore influence plant shape by modifying
rates and/or orientations of growth [4]. Separating these two
aspects is critical for understanding how genes control shape, yet it
is often difficult to achieve because of the mechanical constraints
that arise from tissue connectedness. For example, enhanced
growth of one tissue region may lead to bending and distortions of
nearby connected tissue. These deformations will influence local
orientations, which in turn influence growth and so further
deformations [5]. One way to dissect these interactions is to
incorporate proposed gene mechanisms within models of growing
tissue. By comparing the output of such models with experimental
data on gene expression patterns, growth dynamics, and shape in
wild-type and mutant backgrounds, various hypotheses for how
genes control shape can be evaluated. Here we apply this
approach to the Antirrhinum (Snapdragon) corolla, which has the
advantage of representing a complex shape for which molecular
genetic and growth data can be readily obtained.
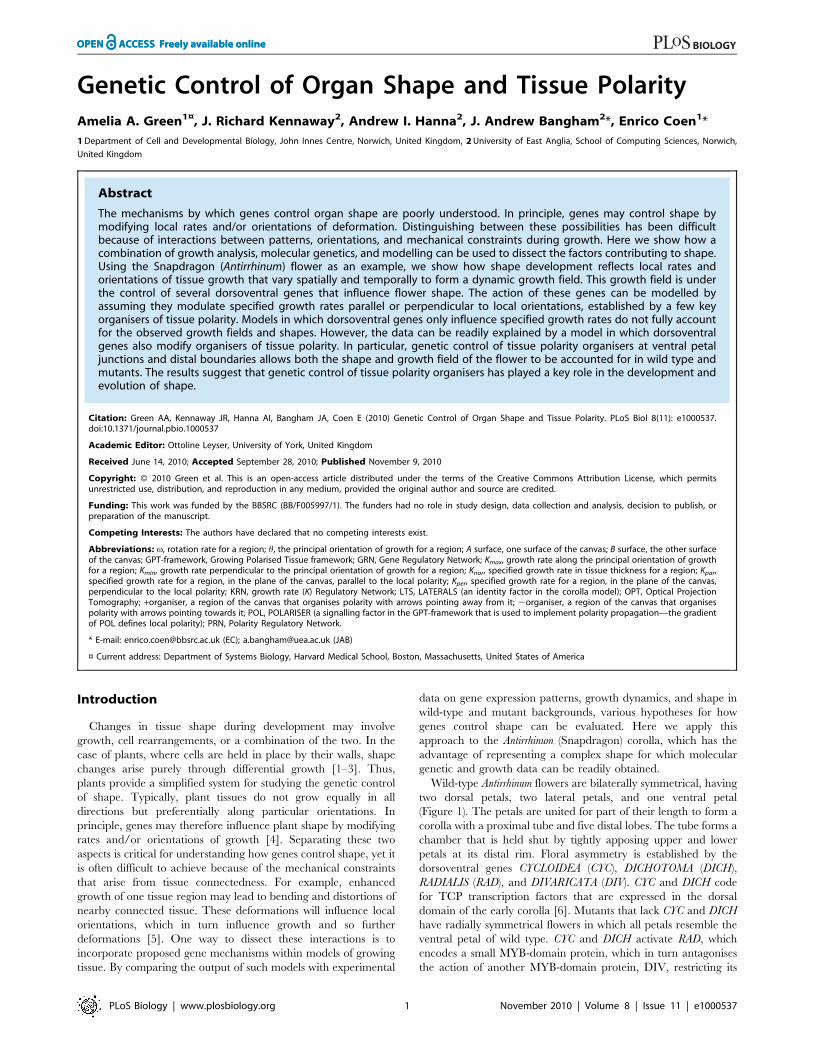
Wild-type Antirrhinum flowers are bilaterally symmetrical, having
two dorsal petals, two lateral petals, and one ventral petal
(Figure 1). The petals are united for part of their length to form a
corolla with a proximal tube and five distal lobes. The tube forms a
chamber that is held shut by tightly apposing upper and lower
petals at its distal rim. Floral asymmetry is established by the
dorsoventral genes CYCLOIDEA (CYC), DICHOTOMA (DICH),
RADIALIS (RAD), and DIVARICATA (DIV). CYC and DICH code
for TCP transcription factors that are expressed in the dorsal
domain of the early corolla [6]. Mutants that lack CYC and DICH
have radially symmetrical flowers in which all petals resemble the
ventral petal of wild type. CYC and DICH activate RAD, which
encodes a small MYB-domain protein, which in turn antagonises
the action of another MYB-domain protein, DIV, restricting its
PLoS Biology | www.plosbiology.org 1 November 2010 | Volume 8 | Issue 11 | e1000537
activity to the ventral and lateral domains [7–10]. The
combinatorial effects of the various genes on the final shape of
each region of the corolla have been defined through shape
analysis of multiple different mutant and over-expression back-
grounds (the topic of the accompanying article [11]).
Growth and development of the Antirrhinum corolla has been
studied using a combination of scanning electron microscopy [12]
and computational clonal analysis [13]. Clonal analysis utilises a
temperature-sensitive transposon [14] that can be induced to excise
from a flower pigmentation gene at defined stages of development.
By comparing large numbers of clones induced at a range of stages,
it is possible to compute rates and orientations of growth of the
dorsal lobe. The results suggest that dorsal lobe shape depends
largely upon how growth orientations are coordinated and
maintained in the petal. This type of analysis has so far been
restricted to a flattened dorsal lobe, so it is unclear how genes control
growth of the entire corolla, yielding the complex 3-D flower form.
Here we show that the corolla undergoes a series of shape
changes in 3-D, captured using optical projection tomography
(OPT) [15–17]. Computational clonal analysis shows that these
morphogenetic events are associated with a growth field that
changes as the flower develops. Flower shape and the growth field
are both altered in reproducible ways in dorsoventral mutants.
These observations can be partially accounted for by models in
which dorsoventral genes modulate specified growth rates along
orientations specified by two organisers of tissue polarity, located
at the proximal and distal boundaries of the corolla. The
organisers anchor the pattern of tissue polarity and thus determine
the principal orientations of specified growth. However, such
models do not readily account for the observed growth
orientations and shape of the lower palate and dorsal lobes. These
data can be much more easily explained by models in which
dorsoventral genes also modulate organisers of tissue polarity. In
particular, DIV is proposed to control the activity of an organiser
of tissue polarity at an internal boundary between ventral and
lateral petals, and DICH modulates distal organiser activity. With
these additional assumptions, the models generate growth fields
and 3-D shapes in wild-type and mutant backgrounds that match
observed data. Thus, our combined experimental and modelling
approach suggests that genes control tissue shape not only by
modulating specified growth rates but also by influencing
organisers of tissue polarity and orientations of growth. We
propose that effects on tissue polarity have played a key role in the
evolution of shapes, such as the closed Snapdragon flower, and
thus provide a general mechanism for the generation of complex
forms.
Results
Key Morphogenetic Changes during CorollaDevelopment
As a first step to understanding how dorsoventral genes determine
flower shape, we defined the key morphogenetic changes during
corolla development. Flower buds were imaged at a series of
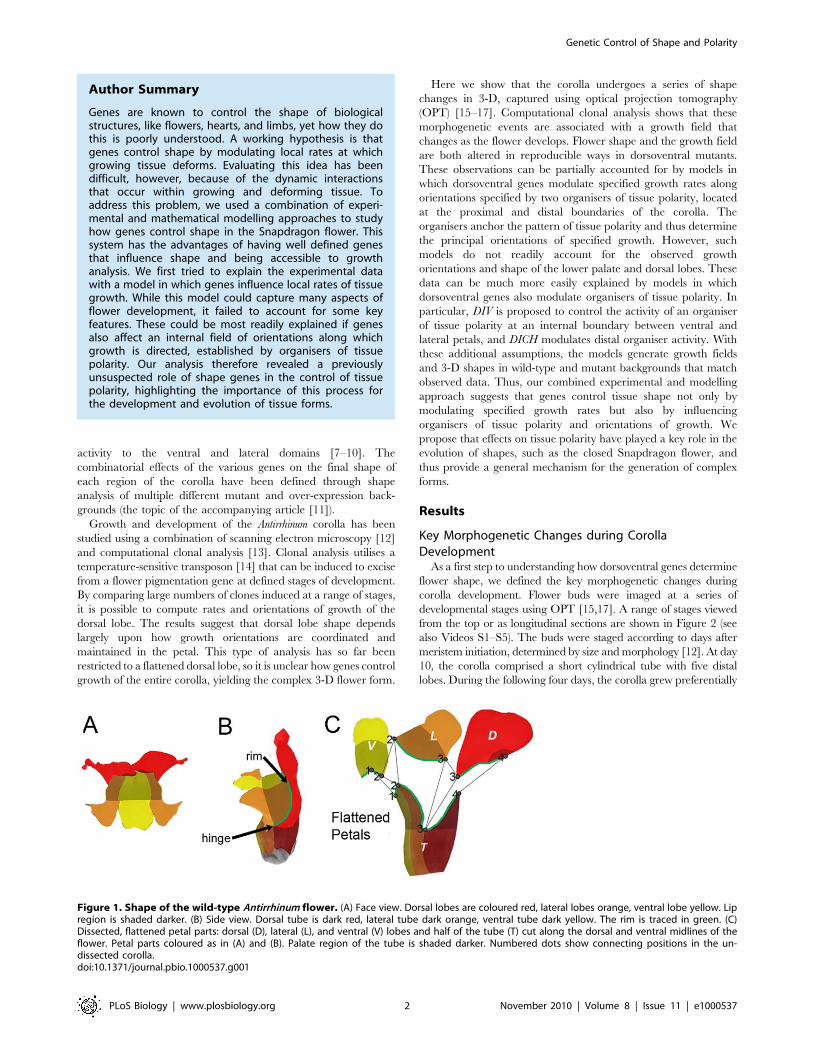
developmental stages using OPT [15,17]. A range of stages viewed
from the top or as longitudinal sections are shown in Figure 2 (see
also Videos S1–S5). The buds were staged according to days after
meristem initiation, determined by size and morphology [12]. At day
10, the corolla comprised a short cylindrical tube with five distal
lobes. During the following four days, the corolla grew preferentially
Figure 1. Shape of the wild-type Antirrhinum flower. (A) Face view. Dorsal lobes are coloured red, lateral lobes orange, ventral lobe yellow. Lipregion is shaded darker. (B) Side view. Dorsal tube is dark red, lateral tube dark orange, ventral tube dark yellow. The rim is traced in green. (C)Dissected, flattened petal parts: dorsal (D), lateral (L), and ventral (V) lobes and half of the tube (T) cut along the dorsal and ventral midlines of theflower. Petal parts coloured as in (A) and (B). Palate region of the tube is shaded darker. Numbered dots show connecting positions in the un-dissected corolla.doi:10.1371/journal.pbio.1000537.g001
Author Summary
Genes are known to control the shape of biologicalstructures, like flowers, hearts, and limbs, yet how they dothis is poorly understood. A working hypothesis is thatgenes control shape by modulating local rates at whichgrowing tissue deforms. Evaluating this idea has beendifficult, however, because of the dynamic interactionsthat occur within growing and deforming tissue. Toaddress this problem, we used a combination of experi-mental and mathematical modelling approaches to studyhow genes control shape in the Snapdragon flower. Thissystem has the advantages of having well defined genesthat influence shape and being accessible to growthanalysis. We first tried to explain the experimental datawith a model in which genes influence local rates of tissuegrowth. While this model could capture many aspects offlower development, it failed to account for some keyfeatures. These could be most readily explained if genesalso affect an internal field of orientations along whichgrowth is directed, established by organisers of tissuepolarity. Our analysis therefore revealed a previouslyunsuspected role of shape genes in the control of tissuepolarity, highlighting the importance of this process forthe development and evolution of tissue forms.
Genetic Control of Shape and Polarity
PLoS Biology | www.plosbiology.org 2 November 2010 | Volume 8 | Issue 11 | e1000537
along the proximodistal axis and arched over the centre of the flower
(Figure 2, days 12, 14). The ventral tube became strongly curved
during this period and formed a fold at its boundary with the lobe,
termed the rim (white arrows in Figure 2, lower panel). A further
fold, in the opposite direction, also formed more distally within the
ventral lobe (green arrow). During the following stages the flower
continued to grow preferentially along the proximodistal axis, and
the ventral tube gradually became stretched and less curved
(Figure 2, days 17, 20). Towards the end of development, the flower
opened through the petal lobes bending back (Figure 2, day 24).
Thus, corolla morphogenesis can be divided into two broad phases:
an early phase when the ventral tube becomes strongly curved and
folded back at the rim, and a later phase when the ventral tube
stretches out.
Clonal Analysis and Estimation of Growth ParametersAlthough OPT data give an overview of changing corolla
geometry, a full description of corolla morphogenesis requires the
growth for each region of the tissue sheet to be determined. Four
local parameters are needed to describe the growth of a sheet in 2-
D: the principal orientation of growth (h), growth rate along this
orientation (Kmax), growth rate perpendicular to this (Kmin), and
rotation rate (v). The values of these parameters for all regions
over time define a dynamic growth tensor field [18]. We have used
computational clonal analysis previously to estimate these
parameters for the Antirrhinum dorsal petal lobe [13]. Here we
extended this approach to the entire corolla.
For this analysis we used a temperature sensitive transposon that
can excise during development of the flower to give pigmented
clones [13,14,19]. Clones were induced at a range of develop-
mental stages using temperature pulses and then visualised in
flattened petals from mature flowers (Figure 1C). Clones from
multiple flowers were then superimposed and warped to the
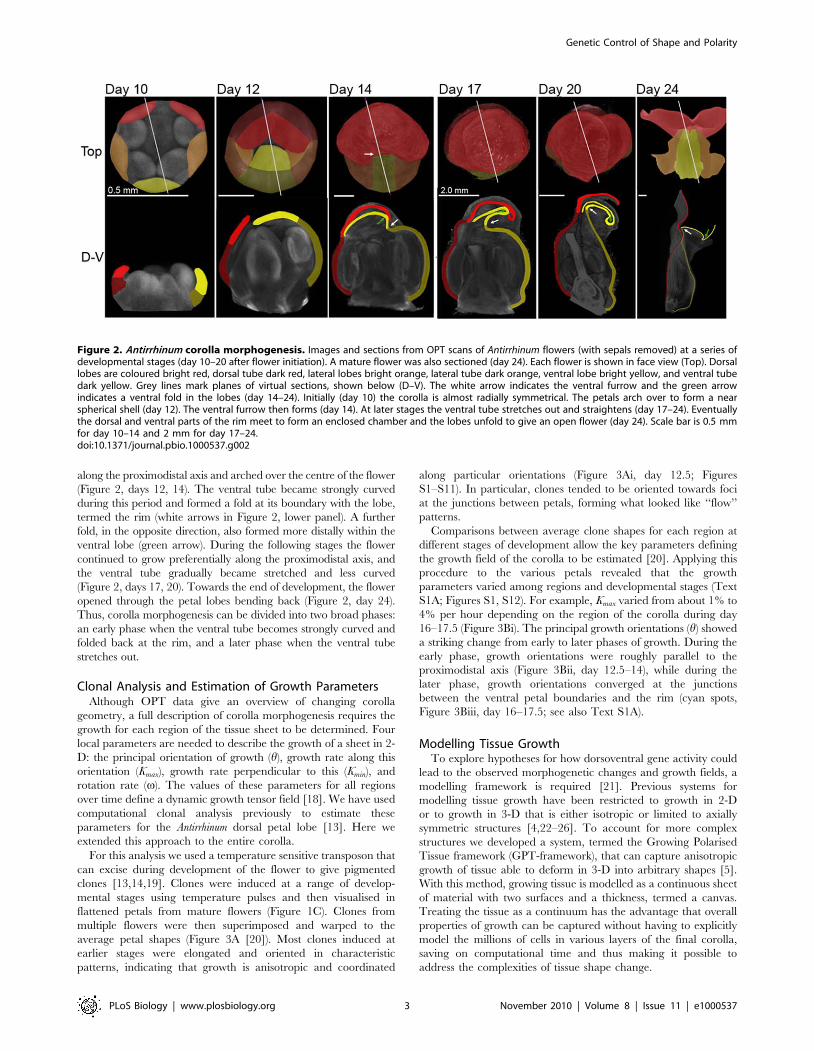
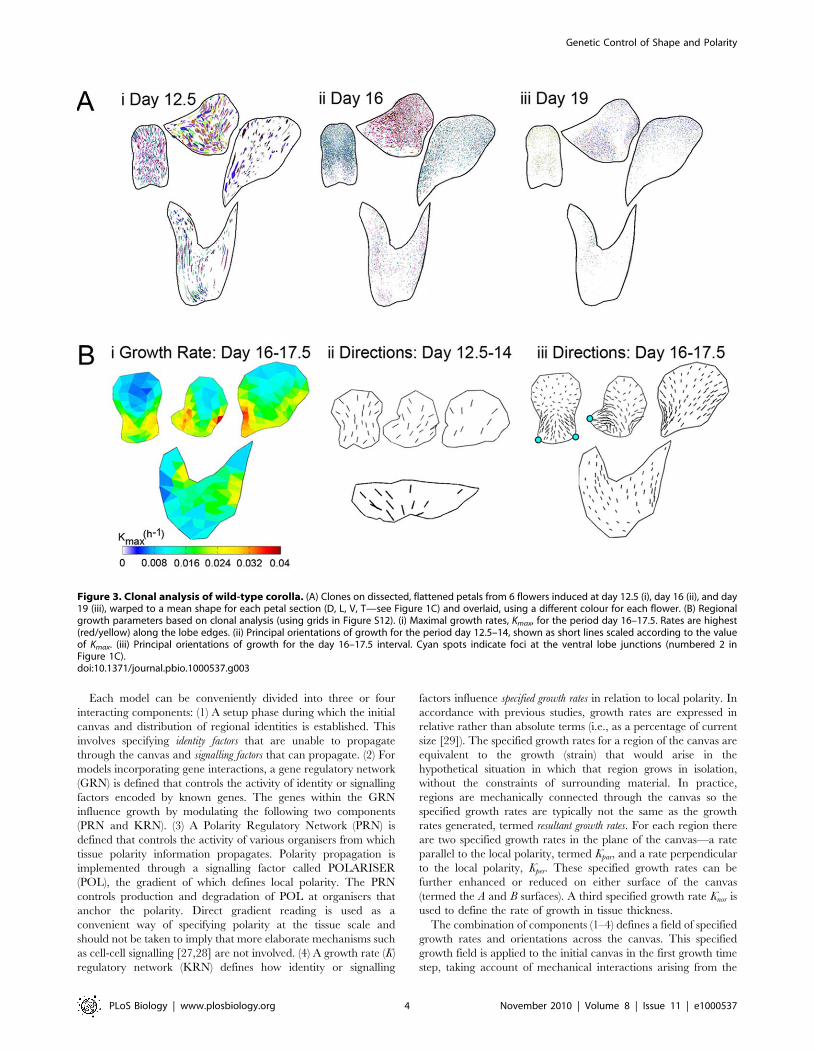
average petal shapes (Figure 3A [20]). Most clones induced at
earlier stages were elongated and oriented in characteristic
patterns, indicating that growth is anisotropic and coordinated
along particular orientations (Figure 3Ai, day 12.5; Figures
S1–S11). In particular, clones tended to be oriented towards foci
at the junctions between petals, forming what looked like ‘‘flow’’
patterns.
Comparisons between average clone shapes for each region at
different stages of development allow the key parameters defining
the growth field of the corolla to be estimated [20]. Applying this
procedure to the various petals revealed that the growth
parameters varied among regions and developmental stages (Text
S1A; Figures S1, S12). For example, Kmax varied from about 1% to
4% per hour depending on the region of the corolla during day
16–17.5 (Figure 3Bi). The principal growth orientations (h) showed
a striking change from early to later phases of growth. During the
early phase, growth orientations were roughly parallel to the
proximodistal axis (Figure 3Bii, day 12.5–14), while during the
later phase, growth orientations converged at the junctions
between the ventral petal boundaries and the rim (cyan spots,
Figure 3Biii, day 16–17.5; see also Text S1A).
Modelling Tissue GrowthTo explore hypotheses for how dorsoventral gene activity could
lead to the observed morphogenetic changes and growth fields, a
modelling framework is required [21]. Previous systems for
modelling tissue growth have been restricted to growth in 2-D
or to growth in 3-D that is either isotropic or limited to axially
symmetric structures [4,22–26]. To account for more complex
structures we developed a system, termed the Growing Polarised
Tissue framework (GPT-framework), that can capture anisotropic
growth of tissue able to deform in 3-D into arbitrary shapes [5].
With this method, growing tissue is modelled as a continuous sheet
of material with two surfaces and a thickness, termed a canvas.
Treating the tissue as a continuum has the advantage that overall
properties of growth can be captured without having to explicitly
model the millions of cells in various layers of the final corolla,
saving on computational time and thus making it possible to
address the complexities of tissue shape change.
Figure 2. Antirrhinum corolla morphogenesis. Images and sections from OPT scans of Antirrhinum flowers (with sepals removed) at a series ofdevelopmental stages (day 10–20 after flower initiation). A mature flower was also sectioned (day 24). Each flower is shown in face view (Top). Dorsallobes are coloured bright red, dorsal tube dark red, lateral lobes bright orange, lateral tube dark orange, ventral lobe bright yellow, and ventral tubedark yellow. Grey lines mark planes of virtual sections, shown below (D–V). The white arrow indicates the ventral furrow and the green arrowindicates a ventral fold in the lobes (day 14–24). Initially (day 10) the corolla is almost radially symmetrical. The petals arch over to form a nearspherical shell (day 12). The ventral furrow then forms (day 14). At later stages the ventral tube stretches out and straightens (day 17–24). Eventuallythe dorsal and ventral parts of the rim meet to form an enclosed chamber and the lobes unfold to give an open flower (day 24). Scale bar is 0.5 mmfor day 10–14 and 2 mm for day 17–24.doi:10.1371/journal.pbio.1000537.g002
Genetic Control of Shape and Polarity
PLoS Biology | www.plosbiology.org 3 November 2010 | Volume 8 | Issue 11 | e1000537
Each model can be conveniently divided into three or four
interacting components: (1) A setup phase during which the initial
canvas and distribution of regional identities is established. This
involves specifying identity factors that are unable to propagate
through the canvas and signalling factors that can propagate. (2) For
models incorporating gene interactions, a gene regulatory network
(GRN) is defined that controls the activity of identity or signalling
factors encoded by known genes. The genes within the GRN
influence growth by modulating the following two components
(PRN and KRN). (3) A Polarity Regulatory Network (PRN) is
defined that controls the activity of various organisers from which
tissue polarity information propagates. Polarity propagation is
implemented through a signalling factor called POLARISER
(POL), the gradient of which defines local polarity. The PRN
controls production and degradation of POL at organisers that
anchor the polarity. Direct gradient reading is used as a
convenient way of specifying polarity at the tissue scale and
should not be taken to imply that more elaborate mechanisms such
as cell-cell signalling [27,28] are not involved. (4) A growth rate (K)
regulatory network (KRN) defines how identity or signalling
factors influence specified growth rates in relation to local polarity. In
accordance with previous studies, growth rates are expressed in
relative rather than absolute terms (i.e., as a percentage of current
size [29]). The specified growth rates for a region of the canvas are
equivalent to the growth (strain) that would arise in the
hypothetical situation in which that region grows in isolation,
without the constraints of surrounding material. In practice,
regions are mechanically connected through the canvas so the
specified growth rates are typically not the same as the growth
rates generated, termed resultant growth rates. For each region there
are two specified growth rates in the plane of the canvas—a rate
parallel to the local polarity, termed Kpar, and a rate perpendicular
to the local polarity, Kper. These specified growth rates can be
further enhanced or reduced on either surface of the canvas
(termed the A and B surfaces). A third specified growth rate Knor is
used to define the rate of growth in tissue thickness.
The combination of components (1–4) defines a field of specified
growth rates and orientations across the canvas. This specified
growth field is applied to the initial canvas in the first growth time
step, taking account of mechanical interactions arising from the
Figure 3. Clonal analysis of wild-type corolla. (A) Clones on dissected, flattened petals from 6 flowers induced at day 12.5 (i), day 16 (ii), and day19 (iii), warped to a mean shape for each petal section (D, L, V, T—see Figure 1C) and overlaid, using a different colour for each flower. (B) Regionalgrowth parameters based on clonal analysis (using grids in Figure S12). (i) Maximal growth rates, Kmax, for the period day 16–17.5. Rates are highest(red/yellow) along the lobe edges. (ii) Principal orientations of growth for the period day 12.5–14, shown as short lines scaled according to the valueof Kmax. (iii) Principal orientations of growth for the day 16–17.5 interval. Cyan spots indicate foci at the ventral lobe junctions (numbered 2 inFigure 1C).doi:10.1371/journal.pbio.1000537.g003
Genetic Control of Shape and Polarity
PLoS Biology | www.plosbiology.org 4 November 2010 | Volume 8 | Issue 11 | e1000537
interconnectedness of the tissue (modelled according to elasticity
theory [5]). This leads to a slight deformation of the canvas
(resultant growth field) and its associated identity and signalling
factors. The concentrations of signalling factors are then further
adjusted according to their propagation and decay rates. The
deformed canvas and expression pattern provide the starting point
for the next time step and the same sequence of events is iterated.
Models were constrained by several bodies of experimental data:
OPT images of developing buds, clonal analysis of growth in wild
type and mutants, shape analysis of a range of mutants and over-
expression lines, and gene expression patterns in wild-type and
mutant backgrounds. The aim of the modelling was not to capture
every experimental detail but the overall trends observed.
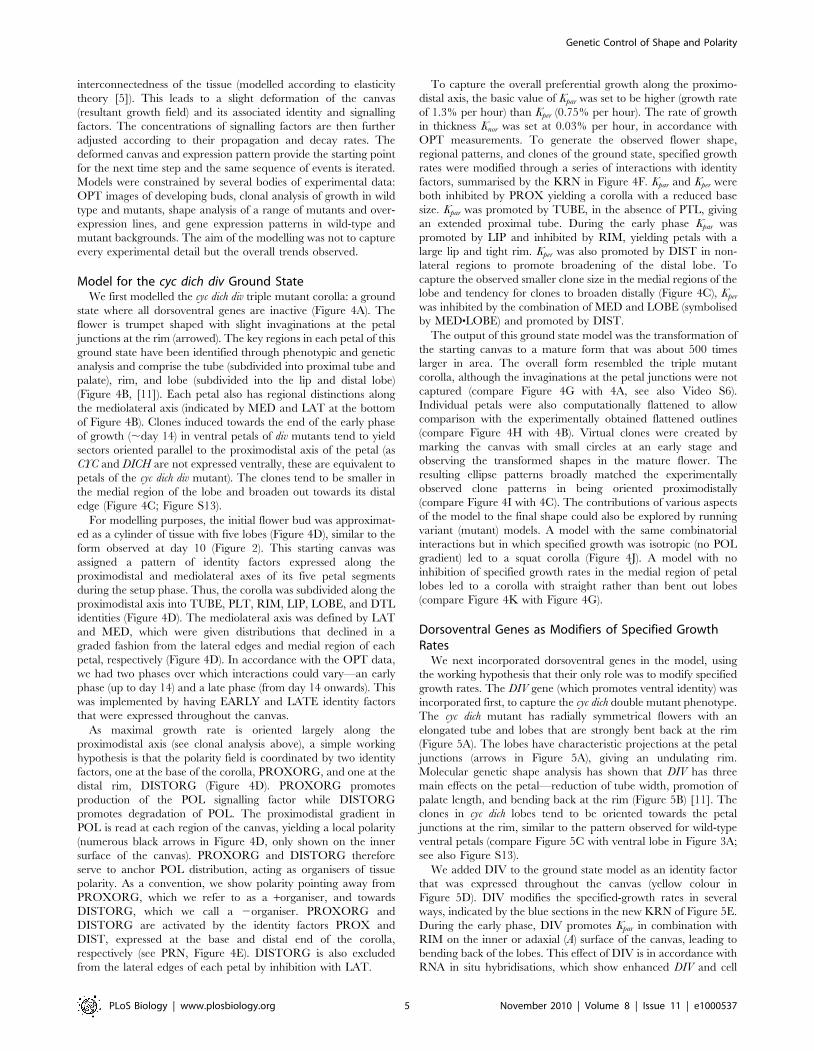
Model for the cyc dich div Ground StateWe first modelled the cyc dich div triple mutant corolla: a ground
state where all dorsoventral genes are inactive (Figure 4A). The
flower is trumpet shaped with slight invaginations at the petal
junctions at the rim (arrowed). The key regions in each petal of this
ground state have been identified through phenotypic and genetic
analysis and comprise the tube (subdivided into proximal tube and
palate), rim, and lobe (subdivided into the lip and distal lobe)
(Figure 4B, [11]). Each petal also has regional distinctions along
the mediolateral axis (indicated by MED and LAT at the bottom
of Figure 4B). Clones induced towards the end of the early phase
of growth (,day 14) in ventral petals of div mutants tend to yield
sectors oriented parallel to the proximodistal axis of the petal (as
CYC and DICH are not expressed ventrally, these are equivalent to
petals of the cyc dich div mutant). The clones tend to be smaller in
the medial region of the lobe and broaden out towards its distal
edge (Figure 4C; Figure S13).
For modelling purposes, the initial flower bud was approximat-
ed as a cylinder of tissue with five lobes (Figure 4D), similar to the
form observed at day 10 (Figure 2). This starting canvas was
assigned a pattern of identity factors expressed along the
proximodistal and mediolateral axes of its five petal segments
during the setup phase. Thus, the corolla was subdivided along the
proximodistal axis into TUBE, PLT, RIM, LIP, LOBE, and DTL
identities (Figure 4D). The mediolateral axis was defined by LAT
and MED, which were given distributions that declined in a
graded fashion from the lateral edges and medial region of each
petal, respectively (Figure 4D). In accordance with the OPT data,
we had two phases over which interactions could vary—an early
phase (up to day 14) and a late phase (from day 14 onwards). This
was implemented by having EARLY and LATE identity factors
that were expressed throughout the canvas.
As maximal growth rate is oriented largely along the
proximodistal axis (see clonal analysis above), a simple working
hypothesis is that the polarity field is coordinated by two identity
factors, one at the base of the corolla, PROXORG, and one at the
distal rim, DISTORG (Figure 4D). PROXORG promotes
production of the POL signalling factor while DISTORG
promotes degradation of POL. The proximodistal gradient in
POL is read at each region of the canvas, yielding a local polarity
(numerous black arrows in Figure 4D, only shown on the inner
surface of the canvas). PROXORG and DISTORG therefore
serve to anchor POL distribution, acting as organisers of tissue
polarity. As a convention, we show polarity pointing away from
PROXORG, which we refer to as a +organiser, and towards
DISTORG, which we call a 2organiser. PROXORG and
DISTORG are activated by the identity factors PROX and
DIST, expressed at the base and distal end of the corolla,
respectively (see PRN, Figure 4E). DISTORG is also excluded
from the lateral edges of each petal by inhibition with LAT.
To capture the overall preferential growth along the proximo-
distal axis, the basic value of Kpar was set to be higher (growth rate
of 1.3% per hour) than Kper (0.75% per hour). The rate of growth
in thickness Knor was set at 0.03% per hour, in accordance with
OPT measurements. To generate the observed flower shape,
regional patterns, and clones of the ground state, specified growth
rates were modified through a series of interactions with identity
factors, summarised by the KRN in Figure 4F. Kpar and Kper were
both inhibited by PROX yielding a corolla with a reduced base
size. Kpar was promoted by TUBE, in the absence of PTL, giving
an extended proximal tube. During the early phase Kpar was
promoted by LIP and inhibited by RIM, yielding petals with a
large lip and tight rim. Kper was also promoted by DIST in non-
lateral regions to promote broadening of the distal lobe. To
capture the observed smaller clone size in the medial regions of the
lobe and tendency for clones to broaden distally (Figure 4C), Kper
was inhibited by the combination of MED and LOBE (symbolised
by MED&LOBE) and promoted by DIST.
The output of this ground state model was the transformation of
the starting canvas to a mature form that was about 500 times
larger in area. The overall form resembled the triple mutant
corolla, although the invaginations at the petal junctions were not
captured (compare Figure 4G with 4A, see also Video S6).
Individual petals were also computationally flattened to allow
comparison with the experimentally obtained flattened outlines
(compare Figure 4H with 4B). Virtual clones were created by
marking the canvas with small circles at an early stage and
observing the transformed shapes in the mature flower. The
resulting ellipse patterns broadly matched the experimentally
observed clone patterns in being oriented proximodistally
(compare Figure 4I with 4C). The contributions of various aspects
of the model to the final shape could also be explored by running
variant (mutant) models. A model with the same combinatorial
interactions but in which specified growth was isotropic (no POL
gradient) led to a squat corolla (Figure 4J). A model with no
inhibition of specified growth rates in the medial region of petal
lobes led to a corolla with straight rather than bent out lobes
(compare Figure 4K with Figure 4G).
Dorsoventral Genes as Modifiers of Specified GrowthRates
We next incorporated dorsoventral genes in the model, using
the working hypothesis that their only role was to modify specified
growth rates. The DIV gene (which promotes ventral identity) was
incorporated first, to capture the cyc dich double mutant phenotype.
The cyc dich mutant has radially symmetrical flowers with an
elongated tube and lobes that are strongly bent back at the rim
(Figure 5A). The lobes have characteristic projections at the petal
junctions (arrows in Figure 5A), giving an undulating rim.
Molecular genetic shape analysis has shown that DIV has three
main effects on the petal—reduction of tube width, promotion of
palate length, and bending back at the rim (Figure 5B) [11]. The
clones in cyc dich lobes tend to be oriented towards the petal
junctions at the rim, similar to the pattern observed for wild-type
ventral petals (compare Figure 5C with ventral lobe in Figure 3A;
see also Figure S13).
We added DIV to the ground state model as an identity factor
that was expressed throughout the canvas (yellow colour in
Figure 5D). DIV modifies the specified-growth rates in several
ways, indicated by the blue sections in the new KRN of Figure 5E.
During the early phase, DIV promotes Kpar in combination with
RIM on the inner or adaxial (A) surface of the canvas, leading to
bending back of the lobes. This effect of DIV is in accordance with
RNA in situ hybridisations, which show enhanced DIV and cell
Genetic Control of Shape and Polarity
PLoS Biology | www.plosbiology.org 5 November 2010 | Volume 8 | Issue 11 | e1000537
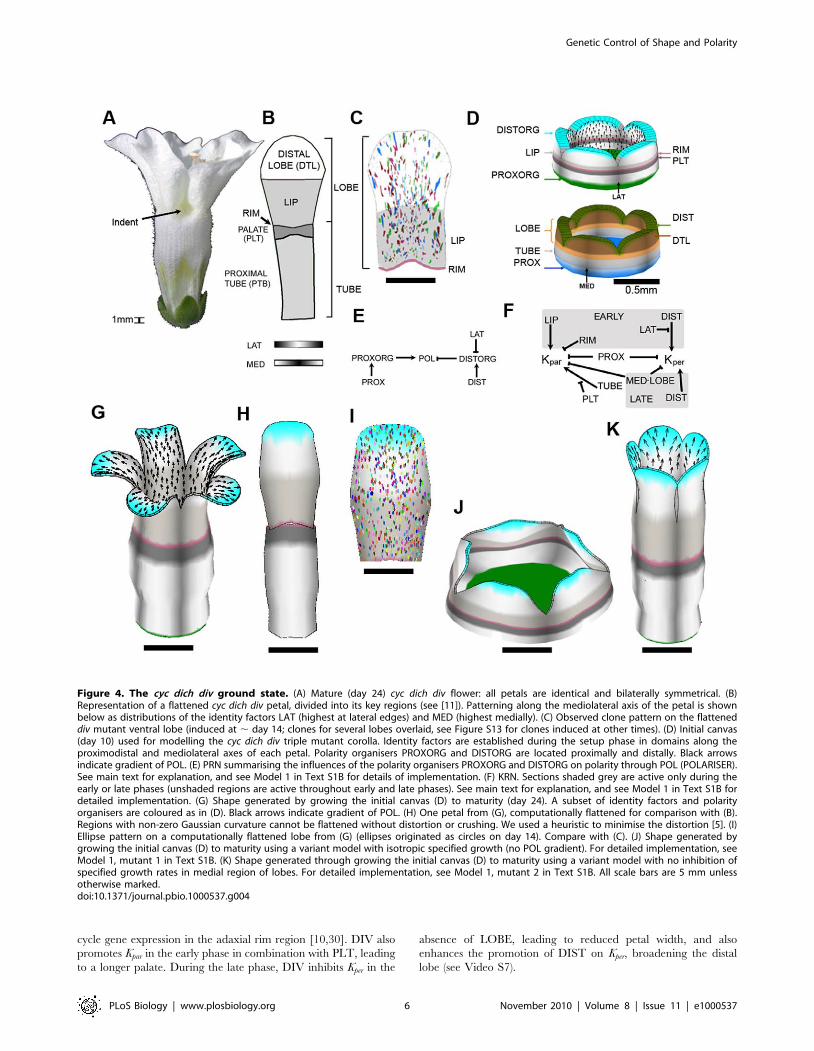
cycle gene expression in the adaxial rim region [10,30]. DIV also
promotes Kpar in the early phase in combination with PLT, leading
to a longer palate. During the late phase, DIV inhibits Kper in the
absence of LOBE, leading to reduced petal width, and also
enhances the promotion of DIST on Kper, broadening the distal
lobe (see Video S7).
Figure 4. The cyc dich div ground state. (A) Mature (day 24) cyc dich div flower: all petals are identical and bilaterally symmetrical. (B)Representation of a flattened cyc dich div petal, divided into its key regions (see [11]). Patterning along the mediolateral axis of the petal is shownbelow as distributions of the identity factors LAT (highest at lateral edges) and MED (highest medially). (C) Observed clone pattern on the flatteneddiv mutant ventral lobe (induced at , day 14; clones for several lobes overlaid, see Figure S13 for clones induced at other times). (D) Initial canvas(day 10) used for modelling the cyc dich div triple mutant corolla. Identity factors are established during the setup phase in domains along theproximodistal and mediolateral axes of each petal. Polarity organisers PROXORG and DISTORG are located proximally and distally. Black arrowsindicate gradient of POL. (E) PRN summarising the influences of the polarity organisers PROXORG and DISTORG on polarity through POL (POLARISER).See main text for explanation, and see Model 1 in Text S1B for details of implementation. (F) KRN. Sections shaded grey are active only during theearly or late phases (unshaded regions are active throughout early and late phases). See main text for explanation, and see Model 1 in Text S1B fordetailed implementation. (G) Shape generated by growing the initial canvas (D) to maturity (day 24). A subset of identity factors and polarityorganisers are coloured as in (D). Black arrows indicate gradient of POL. (H) One petal from (G), computationally flattened for comparison with (B).Regions with non-zero Gaussian curvature cannot be flattened without distortion or crushing. We used a heuristic to minimise the distortion [5]. (I)Ellipse pattern on a computationally flattened lobe from (G) (ellipses originated as circles on day 14). Compare with (C). (J) Shape generated bygrowing the initial canvas (D) to maturity using a variant model with isotropic specified growth (no POL gradient). For detailed implementation, seeModel 1, mutant 1 in Text S1B. (K) Shape generated through growing the initial canvas (D) to maturity using a variant model with no inhibition ofspecified growth rates in medial region of lobes. For detailed implementation, see Model 1, mutant 2 in Text S1B. All scale bars are 5 mm unlessotherwise marked.doi:10.1371/journal.pbio.1000537.g004
Genetic Control of Shape and Polarity
PLoS Biology | www.plosbiology.org 6 November 2010 | Volume 8 | Issue 11 | e1000537
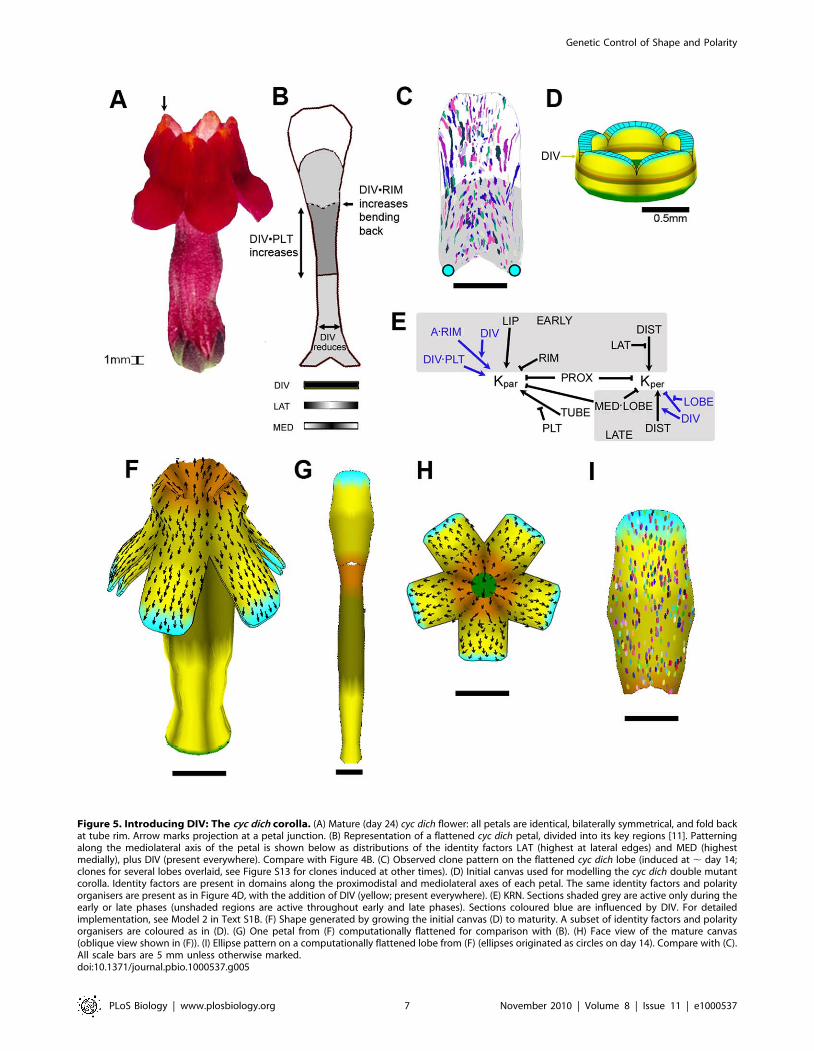
Figure 5. Introducing DIV: The cyc dich corolla. (A) Mature (day 24) cyc dich flower: all petals are identical, bilaterally symmetrical, and fold backat tube rim. Arrow marks projection at a petal junction. (B) Representation of a flattened cyc dich petal, divided into its key regions [11]. Patterningalong the mediolateral axis of the petal is shown below as distributions of the identity factors LAT (highest at lateral edges) and MED (highestmedially), plus DIV (present everywhere). Compare with Figure 4B. (C) Observed clone pattern on the flattened cyc dich lobe (induced at , day 14;clones for several lobes overlaid, see Figure S13 for clones induced at other times). (D) Initial canvas used for modelling the cyc dich double mutantcorolla. Identity factors are present in domains along the proximodistal and mediolateral axes of each petal. The same identity factors and polarityorganisers are present as in Figure 4D, with the addition of DIV (yellow; present everywhere). (E) KRN. Sections shaded grey are active only during theearly or late phases (unshaded regions are active throughout early and late phases). Sections coloured blue are influenced by DIV. For detailedimplementation, see Model 2 in Text S1B. (F) Shape generated by growing the initial canvas (D) to maturity. A subset of identity factors and polarityorganisers are coloured as in (D). (G) One petal from (F) computationally flattened for comparison with (B). (H) Face view of the mature canvas(oblique view shown in (F)). (I) Ellipse pattern on a computationally flattened lobe from (F) (ellipses originated as circles on day 14). Compare with (C).All scale bars are 5 mm unless otherwise marked.doi:10.1371/journal.pbio.1000537.g005
Genetic Control of Shape and Polarity
PLoS Biology | www.plosbiology.org 7 November 2010 | Volume 8 | Issue 11 | e1000537
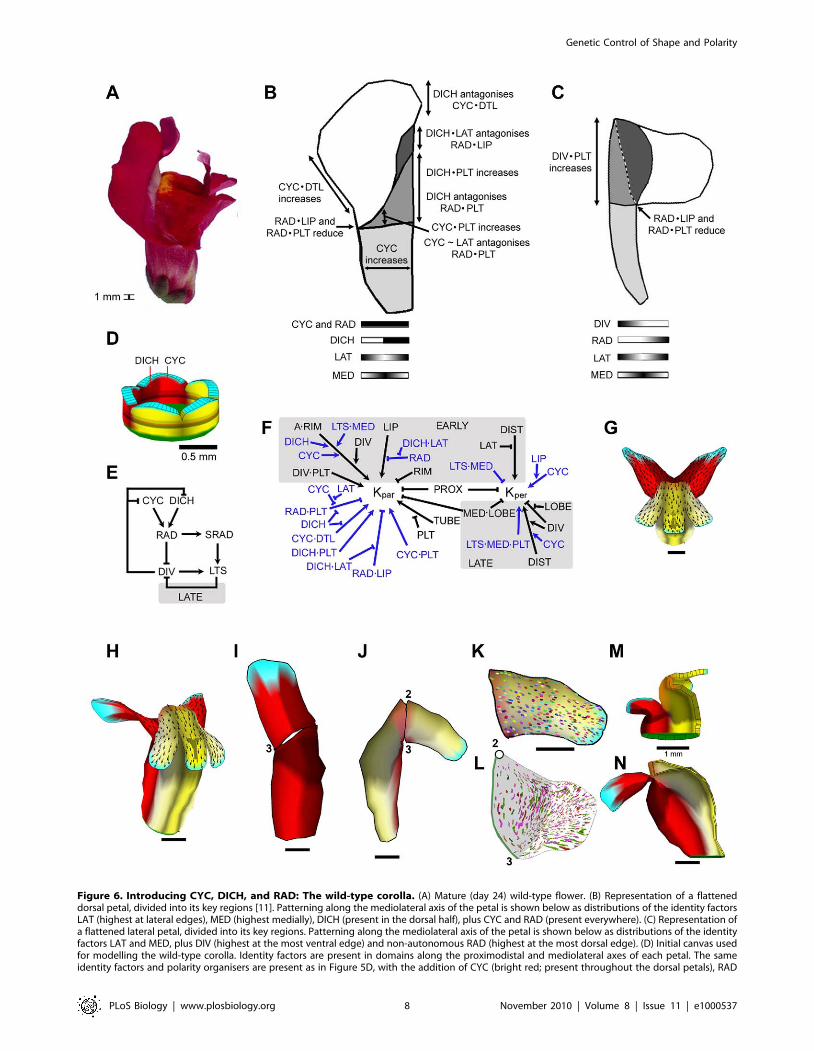
Figure 6. Introducing CYC, DICH, and RAD: The wild-type corolla. (A) Mature (day 24) wild-type flower. (B) Representation of a flatteneddorsal petal, divided into its key regions [11]. Patterning along the mediolateral axis of the petal is shown below as distributions of the identity factorsLAT (highest at lateral edges), MED (highest medially), DICH (present in the dorsal half), plus CYC and RAD (present everywhere). (C) Representation ofa flattened lateral petal, divided into its key regions. Patterning along the mediolateral axis of the petal is shown below as distributions of the identityfactors LAT and MED, plus DIV (highest at the most ventral edge) and non-autonomous RAD (highest at the most dorsal edge). (D) Initial canvas usedfor modelling the wild-type corolla. Identity factors are present in domains along the proximodistal and mediolateral axes of each petal. The sameidentity factors and polarity organisers are present as in Figure 5D, with the addition of CYC (bright red; present throughout the dorsal petals), RAD
Genetic Control of Shape and Polarity
PLoS Biology | www.plosbiology.org 8 November 2010 | Volume 8 | Issue 11 | e1000537
The resulting corolla and flattened petal shapes (Figure 5F–I)
broadly resemble those for the cyc dich double mutant (Figure 5A–
C), although the periodic projections at the rim are not captured.
A more significant discrepancy between the model and real
corollas is that the ellipse patterns in the lobes did not have
orientations that diverged outwards towards foci at petal junctions
as observed for clones (compare Figure 5I and 5C).
To capture wild-type development, CYC, DICH, and RAD (three
genes known to promote dorsal identity) were next incorporated in
the model. Wild-type flowers show marked dorsoventral asymme-
try (Figure 6A). The effect of each dorsoventral gene on different
petal regions of the mature dorsal and lateral petals has been
established through shape analysis of various mutant and over-
expression lines (Figure 6B,C) [11]. In accordance with observed
expression patterns [6], the CYC identity factor was activated in
two adjacent petals of the starting canvas defining the dorsal
domain, while DICH was expressed in the most dorsal half of
these petals (Figure 6D). Subsequent interactions between the
dorsoventral genes were modelled through a GRN based on
known gene interactions (Figure 6E). CYC and DICH activate
RAD, while RAD inhibits DIV activity [7]. This gives a wild type
with CYC, DICH, and RAD in the dorsal petals and DIV activity
restricted to the lateral and ventral petals. Since the rad mutant is
known to have a strongly ventralised phenotype [7], we also
assumed that RAD protects CYC and DICH from inhibition by
DIV through an inhibitory loop (although other formulations
might be possible). The non-autonomous effect of the dorsal
identity genes on lateral petals [7] was implemented by RAD
activating production of a signalling factor called SRAD that could
propagate into the lateral domain. Together with DIV, SRAD
activates an identity factor LATERALS (LTS). LTS in turn
inhibits DIV at later stages, accounting for the observed later
restriction of DIV expression to more ventral regions [10].
CYC, DICH, and RAD have been shown to have several region-
specific effects on mature corolla shape (Figure 6B and C) [11]. To
account for these effects, we incorporated CYC, DICH, and RAD
identity factors into the KRN, such that they influenced Kpar and
Kper in a way that was likely to create the observed effects on shape
and size (blue sections of Figure 6F, see legend for details). With
these interactions, the canvas grew to form a flower that resembled
wild type in some but not all respects (Figure 6G–N, see also
Videos S8, S9). One of the major discrepancies was that the ellipse
patterns did not match the pattern of clones observed experimen-
tally. In particular, ellipses near the rim of the lateral petal lobes
were oriented along the proximodistal axis rather than parallel to
the rim (compare Figure 6K with 6L). Another major problem was
that the ventral tube bulged out and did not form an elongated
palate. This was because after the ventral tube arched over during
early stages (Figure 6M), it continued to arch over during later
stages (Figure 6N) rather than straightening out as observed
experimentally (Figure 2, day 20). Finally, the dorsal petal lobes
became splayed out (Figure 6G) through differential growth of the
dorsal palate, rather than remaining together as observed in wild
type flowers.
To address the discrepancy between modelled and observed
clone patterns, we modified the KRN so that the specified growth
in the medial region of the lateral and ventral lips was mainly
perpendicular rather than parallel to the POL gradient during
later stages (Figure 7A). This reduced the arching of the tube
(Figure 7B,C) and led to ellipses being elongated parallel to the rim
in medial regions of the lateral lobes (Figure 7D). However, the
flower did not close, and the lobe shape and ellipse patterns did
not capture the observed ‘‘flow’’ pattern of clones. Thus, by
assuming that dorsoventral genes influence specified growth rates
alone, we were unable to arrive at a simple model that could
account for the wild-type shape and growth field. Although our
findings do not preclude the possibility that a pattern of specified
growth rates might be found that would account for the data, they
indicate that such a system would not be straightforward.
Interactions between Dorsoventral Genes and PolarityOrganisers
As an alternative way of addressing the discrepancies between
the model and observed shapes and clonal patterns, we explored
hypotheses in which the dorsoventral genes influenced organiser
activity as well as specified growth rates. Clonal analysis shows that
principal orientations of growth tend to become reoriented during
the late phase of development towards foci at the ventral petal lobe
junctions (Figure 3Biii). We therefore postulated an additional
organiser of tissue polarity, CENORG, activated at these foci
during the late phase. CENORG was activated by the combina-
tion of DIV, PLT, and RIM (see modified PRN, Figure 7E). We
assumed that CENORG promoted degradation of POL during
the late phase. The resulting POL deficit around the petal
junctions reoriented the polarity field (Figure 7G, compare ii with
i). Thus, CENORG acts as a 2organiser, with polarity arrows
being drawn towards it. To account for the elongated clones
observed in the medial lip and palate of the lateral petals, we also
assumed that identity factors enhance specified growth rates in
these regions during the late phase (see modification to KRN in
Figure 7F).
The pattern of ellipses generated by the model showed a good
match with those observed experimentally. In particular, ellipses in
the lip region of the wild-type lateral lobes were oriented parallel
to the tube rim, while more distal ellipses were oriented
proximodistally, similar to the observed ‘‘flow’’ pattern (compare
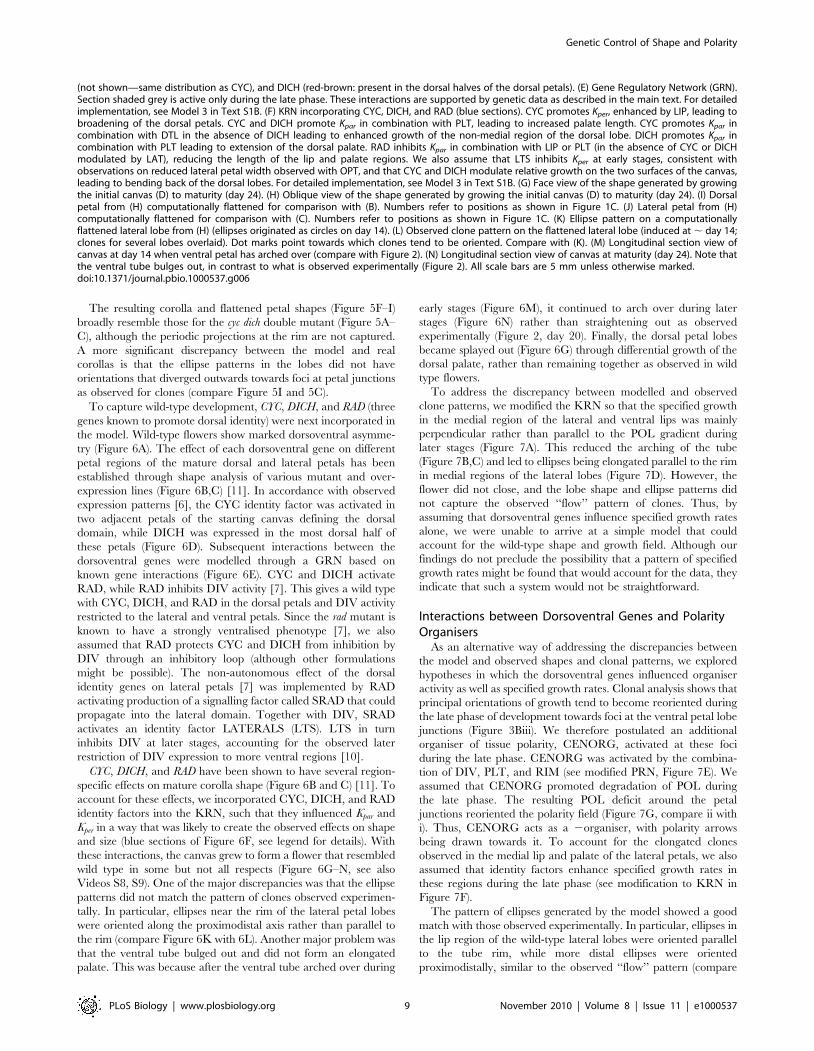
(not shown—same distribution as CYC), and DICH (red-brown: present in the dorsal halves of the dorsal petals). (E) Gene Regulatory Network (GRN).Section shaded grey is active only during the late phase. These interactions are supported by genetic data as described in the main text. For detailedimplementation, see Model 3 in Text S1B. (F) KRN incorporating CYC, DICH, and RAD (blue sections). CYC promotes Kper, enhanced by LIP, leading tobroadening of the dorsal petals. CYC and DICH promote Kpar in combination with PLT, leading to increased palate length. CYC promotes Kpar incombination with DTL in the absence of DICH leading to enhanced growth of the non-medial region of the dorsal lobe. DICH promotes Kpar incombination with PLT leading to extension of the dorsal palate. RAD inhibits Kpar in combination with LIP or PLT (in the absence of CYC or DICHmodulated by LAT), reducing the length of the lip and palate regions. We also assume that LTS inhibits Kper at early stages, consistent withobservations on reduced lateral petal width observed with OPT, and that CYC and DICH modulate relative growth on the two surfaces of the canvas,leading to bending back of the dorsal lobes. For detailed implementation, see Model 3 in Text S1B. (G) Face view of the shape generated by growingthe initial canvas (D) to maturity (day 24). (H) Oblique view of the shape generated by growing the initial canvas (D) to maturity (day 24). (I) Dorsalpetal from (H) computationally flattened for comparison with (B). Numbers refer to positions as shown in Figure 1C. (J) Lateral petal from (H)computationally flattened for comparison with (C). Numbers refer to positions as shown in Figure 1C. (K) Ellipse pattern on a computationallyflattened lateral lobe from (H) (ellipses originated as circles on day 14). (L) Observed clone pattern on the flattened lateral lobe (induced at , day 14;clones for several lobes overlaid). Dot marks point towards which clones tend to be oriented. Compare with (K). (M) Longitudinal section view ofcanvas at day 14 when ventral petal has arched over (compare with Figure 2). (N) Longitudinal section view of canvas at maturity (day 24). Note thatthe ventral tube bulges out, in contrast to what is observed experimentally (Figure 2). All scale bars are 5 mm unless otherwise marked.doi:10.1371/journal.pbio.1000537.g006
Genetic Control of Shape and Polarity
PLoS Biology | www.plosbiology.org 9 November 2010 | Volume 8 | Issue 11 | e1000537
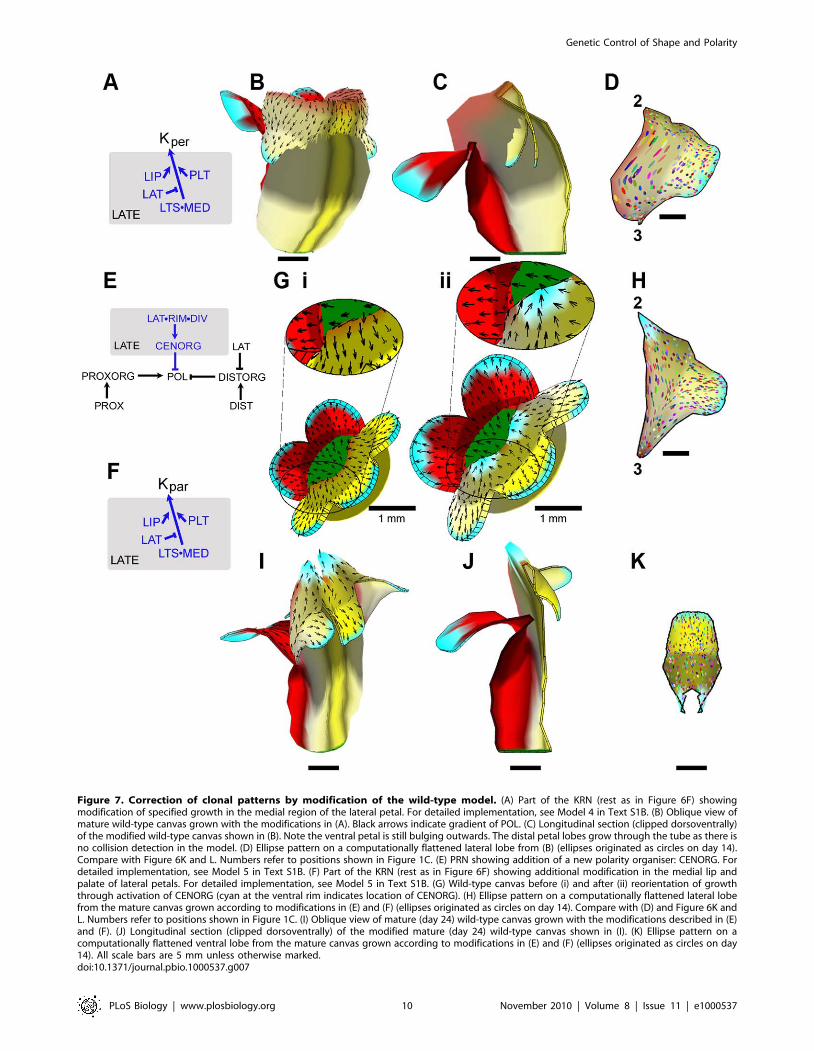
Figure 7. Correction of clonal patterns by modification of the wild-type model. (A) Part of the KRN (rest as in Figure 6F) showingmodification of specified growth in the medial region of the lateral petal. For detailed implementation, see Model 4 in Text S1B. (B) Oblique view ofmature wild-type canvas grown with the modifications in (A). Black arrows indicate gradient of POL. (C) Longitudinal section (clipped dorsoventrally)of the modified wild-type canvas shown in (B). Note the ventral petal is still bulging outwards. The distal petal lobes grow through the tube as there isno collision detection in the model. (D) Ellipse pattern on a computationally flattened lateral lobe from (B) (ellipses originated as circles on day 14).Compare with Figure 6K and L. Numbers refer to positions shown in Figure 1C. (E) PRN showing addition of a new polarity organiser: CENORG. Fordetailed implementation, see Model 5 in Text S1B. (F) Part of the KRN (rest as in Figure 6F) showing additional modification in the medial lip andpalate of lateral petals. For detailed implementation, see Model 5 in Text S1B. (G) Wild-type canvas before (i) and after (ii) reorientation of growththrough activation of CENORG (cyan at the ventral rim indicates location of CENORG). (H) Ellipse pattern on a computationally flattened lateral lobefrom the mature canvas grown according to modifications in (E) and (F) (ellipses originated as circles on day 14). Compare with (D) and Figure 6K andL. Numbers refer to positions shown in Figure 1C. (I) Oblique view of mature (day 24) wild-type canvas grown with the modifications described in (E)and (F). (J) Longitudinal section (clipped dorsoventrally) of the modified mature (day 24) wild-type canvas shown in (I). (K) Ellipse pattern on acomputationally flattened ventral lobe from the mature canvas grown according to modifications in (E) and (F) (ellipses originated as circles on day14). All scale bars are 5 mm unless otherwise marked.doi:10.1371/journal.pbio.1000537.g007
Genetic Control of Shape and Polarity
PLoS Biology | www.plosbiology.org 10 November 2010 | Volume 8 | Issue 11 | e1000537
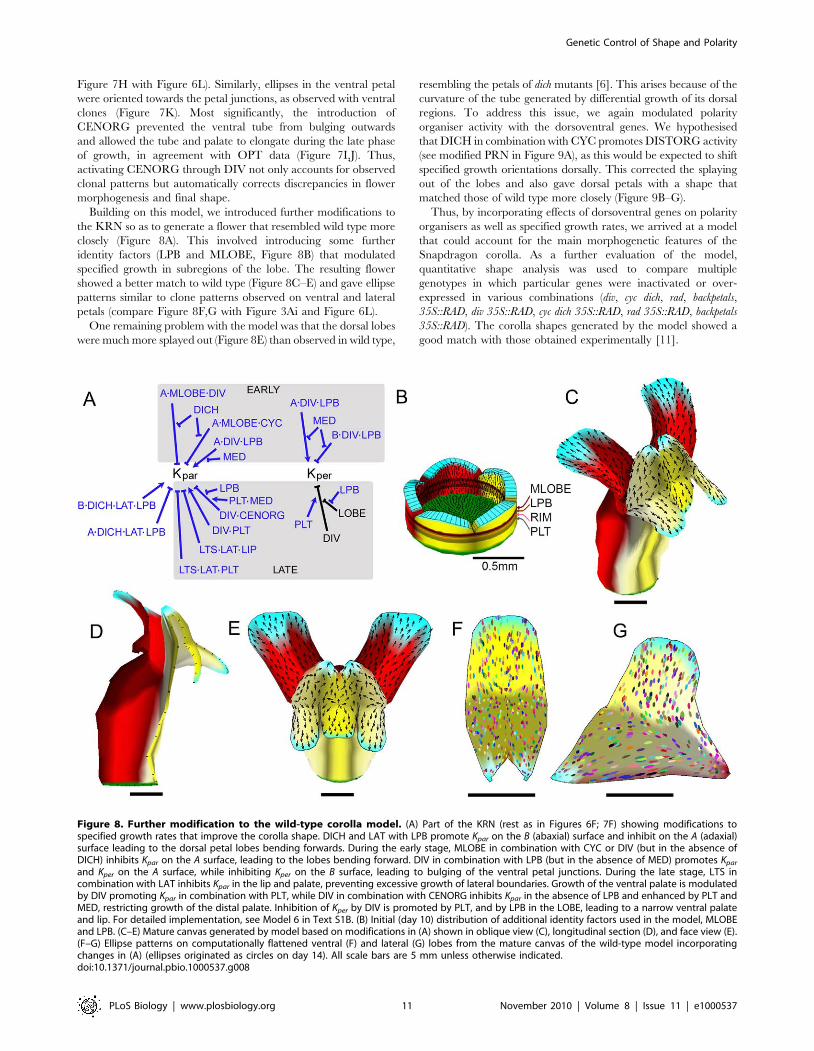
Figure 7H with Figure 6L). Similarly, ellipses in the ventral petal
were oriented towards the petal junctions, as observed with ventral
clones (Figure 7K). Most significantly, the introduction of
CENORG prevented the ventral tube from bulging outwards
and allowed the tube and palate to elongate during the late phase
of growth, in agreement with OPT data (Figure 7I,J). Thus,
activating CENORG through DIV not only accounts for observed
clonal patterns but automatically corrects discrepancies in flower
morphogenesis and final shape.
Building on this model, we introduced further modifications to
the KRN so as to generate a flower that resembled wild type more
closely (Figure 8A). This involved introducing some further
identity factors (LPB and MLOBE, Figure 8B) that modulated
specified growth in subregions of the lobe. The resulting flower
showed a better match to wild type (Figure 8C–E) and gave ellipse
patterns similar to clone patterns observed on ventral and lateral
petals (compare Figure 8F,G with Figure 3Ai and Figure 6L).
One remaining problem with the model was that the dorsal lobes
were much more splayed out (Figure 8E) than observed in wild type,
resembling the petals of dich mutants [6]. This arises because of the
curvature of the tube generated by differential growth of its dorsal
regions. To address this issue, we again modulated polarity
organiser activity with the dorsoventral genes. We hypothesised
that DICH in combination with CYC promotes DISTORG activity
(see modified PRN in Figure 9A), as this would be expected to shift
specified growth orientations dorsally. This corrected the splaying
out of the lobes and also gave dorsal petals with a shape that
matched those of wild type more closely (Figure 9B–G).
Thus, by incorporating effects of dorsoventral genes on polarity
organisers as well as specified growth rates, we arrived at a model
that could account for the main morphogenetic features of the
Snapdragon corolla. As a further evaluation of the model,
quantitative shape analysis was used to compare multiple
genotypes in which particular genes were inactivated or over-
expressed in various combinations (div, cyc dich, rad, backpetals,
35S::RAD, div 35S::RAD, cyc dich 35S::RAD, rad 35S::RAD, backpetals
35S::RAD). The corolla shapes generated by the model showed a
good match with those obtained experimentally [11].
Figure 8. Further modification to the wild-type corolla model. (A) Part of the KRN (rest as in Figures 6F; 7F) showing modifications tospecified growth rates that improve the corolla shape. DICH and LAT with LPB promote Kpar on the B (abaxial) surface and inhibit on the A (adaxial)surface leading to the dorsal petal lobes bending forwards. During the early stage, MLOBE in combination with CYC or DIV (but in the absence ofDICH) inhibits Kpar on the A surface, leading to the lobes bending forward. DIV in combination with LPB (but in the absence of MED) promotes Kpar
and Kper on the A surface, while inhibiting Kper on the B surface, leading to bulging of the ventral petal junctions. During the late stage, LTS incombination with LAT inhibits Kpar in the lip and palate, preventing excessive growth of lateral boundaries. Growth of the ventral palate is modulatedby DIV promoting Kpar in combination with PLT, while DIV in combination with CENORG inhibits Kpar in the absence of LPB and enhanced by PLT andMED, restricting growth of the distal palate. Inhibition of Kper by DIV is promoted by PLT, and by LPB in the LOBE, leading to a narrow ventral palateand lip. For detailed implementation, see Model 6 in Text S1B. (B) Initial (day 10) distribution of additional identity factors used in the model, MLOBEand LPB. (C–E) Mature canvas generated by model based on modifications in (A) shown in oblique view (C), longitudinal section (D), and face view (E).(F–G) Ellipse patterns on computationally flattened ventral (F) and lateral (G) lobes from the mature canvas of the wild-type model incorporatingchanges in (A) (ellipses originated as circles on day 14). All scale bars are 5 mm unless otherwise indicated.doi:10.1371/journal.pbio.1000537.g008
Genetic Control of Shape and Polarity
PLoS Biology | www.plosbiology.org 11 November 2010 | Volume 8 | Issue 11 | e1000537
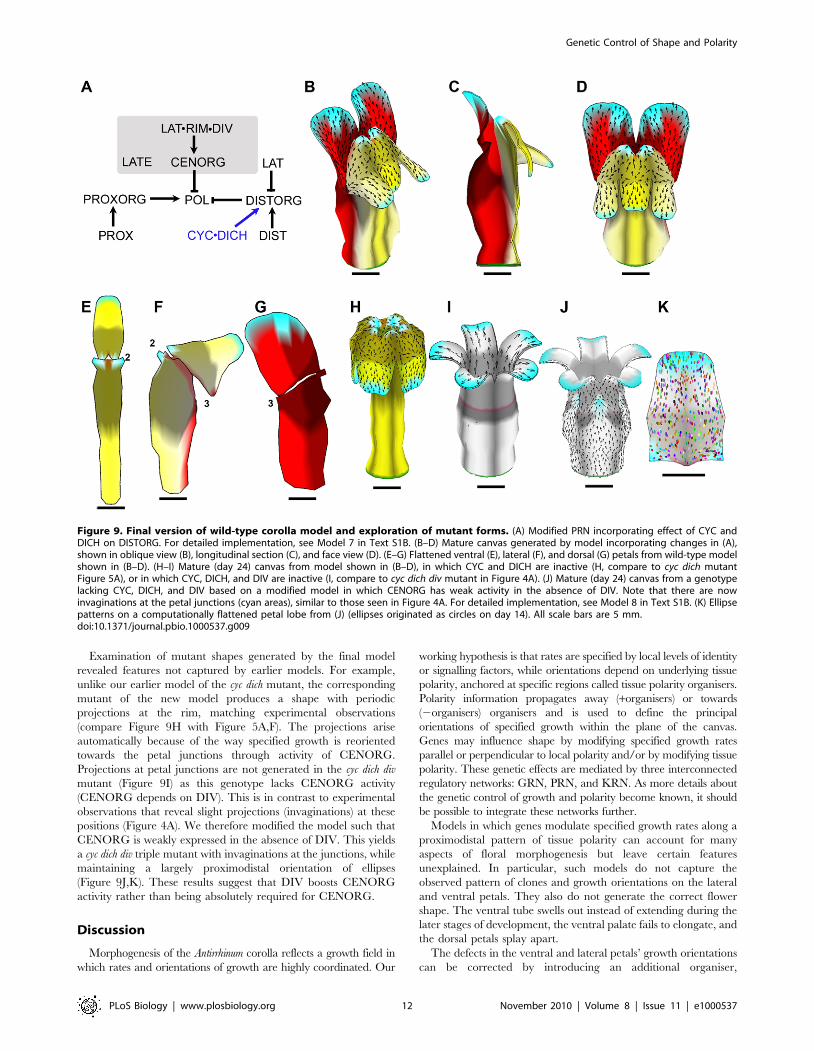
Examination of mutant shapes generated by the final model
revealed features not captured by earlier models. For example,
unlike our earlier model of the cyc dich mutant, the corresponding
mutant of the new model produces a shape with periodic
projections at the rim, matching experimental observations
(compare Figure 9H with Figure 5A,F). The projections arise
automatically because of the way specified growth is reoriented
towards the petal junctions through activity of CENORG.
Projections at petal junctions are not generated in the cyc dich div
mutant (Figure 9I) as this genotype lacks CENORG activity
(CENORG depends on DIV). This is in contrast to experimental
observations that reveal slight projections (invaginations) at these
positions (Figure 4A). We therefore modified the model such that
CENORG is weakly expressed in the absence of DIV. This yields
a cyc dich div triple mutant with invaginations at the junctions, while
maintaining a largely proximodistal orientation of ellipses
(Figure 9J,K). These results suggest that DIV boosts CENORG
activity rather than being absolutely required for CENORG.
Discussion
Morphogenesis of the Antirrhinum corolla reflects a growth field in
which rates and orientations of growth are highly coordinated. Our
working hypothesis is that rates are specified by local levels of identity
or signalling factors, while orientations depend on underlying tissue
polarity, anchored at specific regions called tissue polarity organisers.
Polarity information propagates away (+organisers) or towards
(2organisers) organisers and is used to define the principal
orientations of specified growth within the plane of the canvas.
Genes may influence shape by modifying specified growth rates
parallel or perpendicular to local polarity and/or by modifying tissue
polarity. These genetic effects are mediated by three interconnected
regulatory networks: GRN, PRN, and KRN. As more details about
the genetic control of growth and polarity become known, it should
be possible to integrate these networks further.
Models in which genes modulate specified growth rates along a
proximodistal pattern of tissue polarity can account for many
aspects of floral morphogenesis but leave certain features
unexplained. In particular, such models do not capture the
observed pattern of clones and growth orientations on the lateral
and ventral petals. They also do not generate the correct flower
shape. The ventral tube swells out instead of extending during the
later stages of development, the ventral palate fails to elongate, and
the dorsal petals splay apart.
The defects in the ventral and lateral petals’ growth orientations
can be corrected by introducing an additional organiser,
Figure 9. Final version of wild-type corolla model and exploration of mutant forms. (A) Modified PRN incorporating effect of CYC andDICH on DISTORG. For detailed implementation, see Model 7 in Text S1B. (B–D) Mature canvas generated by model incorporating changes in (A),shown in oblique view (B), longitudinal section (C), and face view (D). (E–G) Flattened ventral (E), lateral (F), and dorsal (G) petals from wild-type modelshown in (B–D). (H–I) Mature (day 24) canvas from model shown in (B–D), in which CYC and DICH are inactive (H, compare to cyc dich mutantFigure 5A), or in which CYC, DICH, and DIV are inactive (I, compare to cyc dich div mutant in Figure 4A). (J) Mature (day 24) canvas from a genotypelacking CYC, DICH, and DIV based on a modified model in which CENORG has weak activity in the absence of DIV. Note that there are nowinvaginations at the petal junctions (cyan areas), similar to those seen in Figure 4A. For detailed implementation, see Model 8 in Text S1B. (K) Ellipsepatterns on a computationally flattened petal lobe from (J) (ellipses originated as circles on day 14). All scale bars are 5 mm.doi:10.1371/journal.pbio.1000537.g009
Genetic Control of Shape and Polarity
PLoS Biology | www.plosbiology.org 12 November 2010 | Volume 8 | Issue 11 | e1000537
CENORG, promoted by DIV at the rim and lateral petal
boundaries. As well as capturing growth orientations, this
modification has the striking effect of correcting the defect in
flower shape, by straightening out the ventral tube and allowing
the palate to elongate. This effect on shape reflects the way tissue
polarity interacts with the specified growth rates to enhance or
reduce tissue curvature [5]. In the case of the Antirrhinum flower,
proximodistal orientations combined with differential growth lead
to arching over of the ventral tube during early stages of
development. This effect is then counteracted during later stages
by CENORG reorienting polarity, allowing the tube and palate to
extend as observed. Introduction of CENORG also accounts for
the outgrowths observed at ventral petal junctions in wild type and
cyc dich mutants. Similar but smaller protrusions are formed at the
ventral petal junctions in div mutants, suggesting that DIV
enhances CENORG rather than being absolutely required for
its activity. Thus, the combination of growth analysis and
modelling allows the biological significance of the observed clonal
patterns to be understood: they reflect the requirement for growth
to be reoriented to establish an elongated ventral tube and palate.
Genetic modulation of polarity organisers may also be involved
in preventing the dorsal petal lobes from splaying out. A model in
which DICH enhances the activity of the distal organiser produces
a shape with the dorsal petals held close together. As with
CENORG, this effect arises because of the way polarity
orientations can counteract curvature induced by differential
growth. A model incorporating the effects of DIV and DICH on
polarity, as well as specified growth rates, generates a shape and
growth field that shows good agreement with experimental data.
The model is also supported by quantitative comparisons between
predicted shapes and those observed for a range of mutant and
over-expression genotypes [11].
Cellular Basis of Tissue GrowthIn principle, specification of growth orientation for a region
(e.g., a cell) requires specification of axiality but not necessarily
polarity, as local extension may be a bidirectional rather than
unidirectional process (axiality can be adequately described with a
line, whereas polarity requires a single-headed arrow [5]). In this
respect, growth is similar to stress, which has local axiality but no
intrinsic polarity. This has led to the suggestion that stresses, rather
than molecular signalling mechanisms, may play the key role of
organising growth orientations during development [31]. There is
also evidence for stresses affecting local growth orientations
through changes in the cytoskeleton [21,32]. However, the
morphogenetic possibilities for stress-based systems are con-
strained by growth orientations being coupled to differential
specified growth rates (which lead to stresses). We therefore favour
a model based on tissue polarity as this has greater flexibility for
generating tissue shapes [5].
Several cellular processes might underlie the propagation of
tissue polarity. One is that cells measure the gradient of a diffusing
molecule. However, such gradients may be difficult to detect as the
tissue grows and gradients become shallower. If there is a limit on
the size of gradient that can be read, the pattern of orientations
would be disrupted in regions far from the organisers, where the
gradient is shallowest. This problem might be circumvented by
fixing the polarity after it falls below a threshold value and/or by
local cell-cell signalling. Cell-cell polarity propagation systems
have been described for animal tissues [27,28]. In plants, polar
distribution of molecules, such as PIN auxin transporters, indicates
that cell polarity is also prevalent [33,34]. Moreover, a site of high
auxin concentration has been proposed to act as an organiser of
polarity and pattern for the root [35]. However, it is currently
unclear how PIN localisation is established or propagated. An
attractive hypothesis is that whatever is controlling the orientation
of PINs is also controlling the orientations of specified growth.
This hypothesis would predict that PIN orientations should
converge or diverge at positions where tissue polarity organisers
are located. Such PIN polarity patterns are observed at the
proximal and distal boundaries of organs [36], consistent with the
locations of PROXORG and DISTORG in our model.
Although stresses may not play the primary role in overall
coordination of growth orientations, they nevertheless play an
integral part of growth because morphogenesis is a mechanical
process [21,37]. In the case of plants, growth is driven by the
continuous expansive turgor pressure within each cell [38]. The
resulting stresses are counterbalanced by the cell wall, comprising
cellulose microfibrils embedded in a matrix of complex polysac-
charides. Breaking or loosening bonds in the wall allows it to
stretch in particular orientations, leading to growth [39]. New
material is then inserted in the walls to maintain their thickness
and strength [23]. A specified growth rate in a particular
orientation, as implemented in our model, therefore corresponds
to selective weakening or strengthening in particular orientations
(determined by cell polarity), followed by insertion of material to
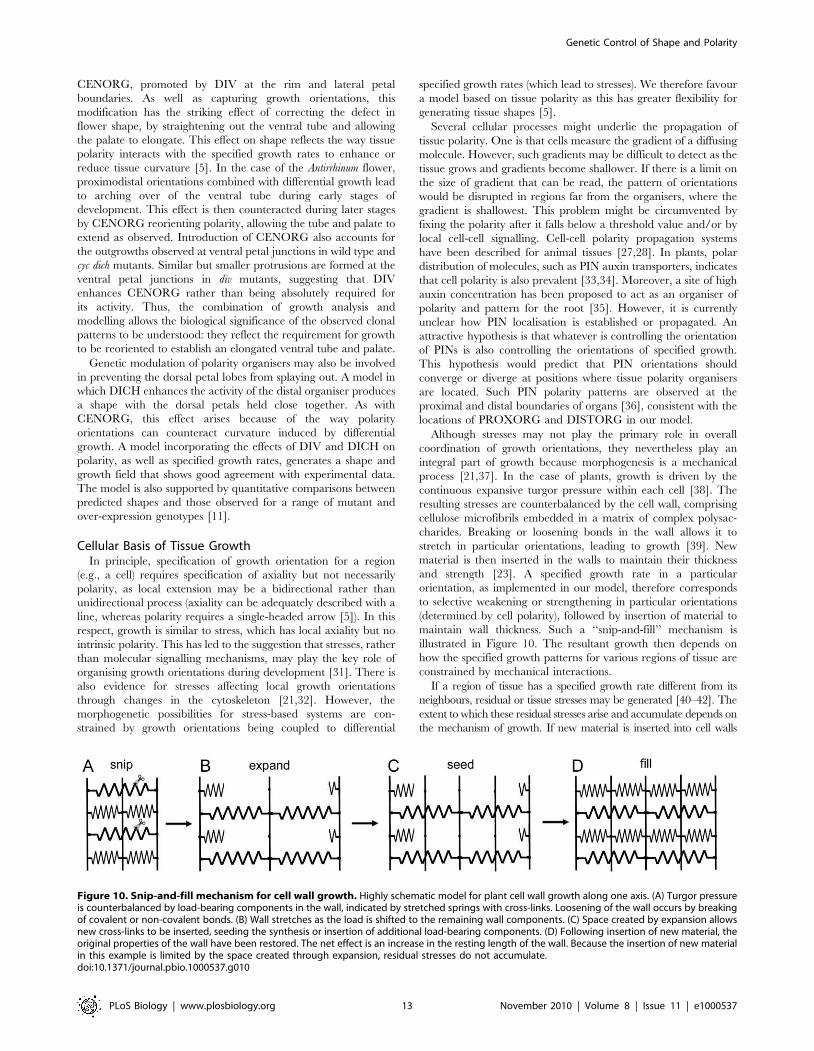
maintain wall thickness. Such a ‘‘snip-and-fill’’ mechanism is
illustrated in Figure 10. The resultant growth then depends on
how the specified growth patterns for various regions of tissue are
constrained by mechanical interactions.
If a region of tissue has a specified growth rate different from its
neighbours, residual or tissue stresses may be generated [40–42]. The
extent to which these residual stresses arise and accumulate depends on
the mechanism of growth. If new material is inserted into cell walls
Figure 10. Snip-and-fill mechanism for cell wall growth. Highly schematic model for plant cell wall growth along one axis. (A) Turgor pressureis counterbalanced by load-bearing components in the wall, indicated by stretched springs with cross-links. Loosening of the wall occurs by breakingof covalent or non-covalent bonds. (B) Wall stretches as the load is shifted to the remaining wall components. (C) Space created by expansion allowsnew cross-links to be inserted, seeding the synthesis or insertion of additional load-bearing components. (D) Following insertion of new material, theoriginal properties of the wall have been restored. The net effect is an increase in the resting length of the wall. Because the insertion of new materialin this example is limited by the space created through expansion, residual stresses do not accumulate.doi:10.1371/journal.pbio.1000537.g010
Genetic Control of Shape and Polarity
PLoS Biology | www.plosbiology.org 13 November 2010 | Volume 8 | Issue 11 | e1000537
according to the extent of resultant growth, then the original properties
of the wall will be restored and residual stresses will not accumulate.
Such a process is captured in our model by relieving residual stresses
and strains following the acquisition of new material in the canvas at
each growth step. This means that there is effectively feedback between
residual stresses and growth. We propose that the previously described
feedback from stress orientations to growth [32] relates to this process
of stress adjustment, rather than playing a primary role of specifying
growth orientations during morphogenesis. It is also possible that
residual stresses may accumulate during some stages of development.
For example, the mature Antirrhinum corolla is held tightly shut by
expansive forces in the ventral tube that are balanced by the apposing
dorsal corolla. These residual stresses can be revealed by cutting the
mature corolla and observing it spring into a new shape. Such forces
may arise during the later stages of growth and could be modelled by
allowing residual stresses to accumulate to a specified degree.
Evolution of ShapeDorsoventral flower asymmetry is a common feature of the
Lamiales (the Order to which Antirrhinum belongs). However, the
formation of flowers that have a closed mouth with a hinged palate
(known as the personate form) is restricted to a small but diverse
clade within the Lamiales [43]. The Antirrhinum corolla model
indicates that a key step in the evolution of personate flowers may
have been bringing tissue polarity organisers under the control of
genes like DIV and DICH. In particular, the formation of a hinged
lower palate matching the upper corolla depends on promotion of
CENORG by DIV. It is possible that equivalent morphogenetic
changes could have been brought about through changes in
patterns of specified growth rates rather than tissue polarity.
However, modulating tissue polarity may provide a simpler
developmental mechanism for some coordinated changes in form
and may therefore have been favoured during evolution. Other
evolutionary innovations, such as formation of flower spurs [44],
may also involve genes influencing organisers of tissue polarity.
Thus, changes in polarity as well as specified growth rates may
play a key part in the evolution of complex morphologies.
Materials and Methods
Plant MaterialAntirrhinum majus wild type (JIC Stock 7) and div-13, cyc-608 dich-
718, and cyc-608 dichG div-80 mutants were grown in the
greenhouse at the John Innes Centre. For clonal analysis, plants
carrying a transposon at PALLIDA were grown at 25uC in constant
light [13]. Excision of the transposon was induced by moving the
plants to 15uC for 24 h. The developmental stage of a bud at the
time of induction was determined by matching bud size and
morphology with a standard time course [12].
3-D Imaging and AnalysisFlower buds with sepals removed were collected at various
developmental stages and stored in 100% ethanol. Buds were
prepared for OPT as described previously [17]. Scanning and
reconstructions were performed using a Bioptonics OPT Scanner
3001 or a prototype OPT Scanner at the John Innes Centre. 3-D
images were analysed using UFEEL software [45], with a 3-D
screen and SensAble PHANToM Omni haptic device. UFEEL
was also used to measure distances, including lengths and
thicknesses of the tube and lobe.
Clonal AnalysisTo record clone patterns, petal parts (Figure 1C) were separated
and flattened between microscope slides. Their adaxial surfaces
were then imaged using a Kodak DCS Pro 14N camera with a
Nikon Nikkor AF 60 f/2.8D lens. Images for each petal part and
induction stage were warped to the appropriate mean shape.
Clone patterns were segmented and edited using Sector Analysis
Toolbox software (available on demand), which was based on
principles outlined in [20]. This software also allowed growth
parameters to be extracted for each region (for further details, see
Text S1A).
Supporting Information
Figure S1 Clonal patterns and growth data for wild-typeshaped petals, relates to Figure 3. (A–E) Clones on petals of
several flowers induced at a range of stages: (A) 300 h (day 12.5),
(B) 340 h (day 14), (C) 380 h (day 16), (D) 420 h (day 17.5), and (E)
460 h (day 19), warped to a mean petal shape and overlaid, with a
different colour used for clones from each petal (see Figure 3A).
Two versions (i and ii) are shown at each stage, made by
overlaying separate sets of clone images. (F–I) Principal directions
of growth for periods: (F) 300–340 h (day 12.5–14), (G) 340–380 h
(day 14–16), (H) 380–420 h (day 16–17.5), and (I) 420–460 h (day
17.5–19), shown as short lines scaled according to the value of Kmax
within each period (see Figure 3B). (J–M) Maximal growth rates
(Kmax) calculated for periods: (J) 300–340 h (day 12.5–14), (K) 340–
380 h (day 14–16), (L) 380–420 h (day 16–17.5), and (M) 420–
460 h (day 17.5–19). Scale above (J) is used for (J–M).
Found at: doi:10.1371/journal.pbio.1000537.s001 (10.01 MB
TIF)
Figure S2 Higher resolution version of Figure S1A(clones at 300 h/day 12.5).
Found at: doi:10.1371/journal.pbio.1000537.s002 (9.03 MB
TIF)
Figure S3 Higher resolution version of Figure S1A(clones at 300 h/day 12.5).
Found at: doi:10.1371/journal.pbio.1000537.s003 (9.02 MB TIF)
Figure S4 Higher resolution version of Figure S1B(clones at 340 h/day 14).
Found at: doi:10.1371/journal.pbio.1000537.s004 (8.99 MB TIF)
Figure S5 Higher resolution version of Figure S1B(clones at 340 h/day 14).
Found at: doi:10.1371/journal.pbio.1000537.s005 (9.03 MB TIF)
Figure S6 Higher resolution version of Figure S1C(clones at 380 h/day 16).
Found at: doi:10.1371/journal.pbio.1000537.s006 (9.07 MB TIF)
Figure S7 Higher resolution version of Figure S1C(clones at 380 h/day 16).
Found at: doi:10.1371/journal.pbio.1000537.s007 (9.15 MB TIF)
Figure S8 Higher resolution version of Figure S1D(clones at 420 h/day 17.5).
Found at: doi:10.1371/journal.pbio.1000537.s008 (9.04 MB TIF)
Figure S9 Higher resolution version of Figure S1D(clones at 420 h/day 17.5).
Found at: doi:10.1371/journal.pbio.1000537.s009 (9.07 MB TIF)
Figure S10 Higher resolution version of Figure S1E(clones at 460 h/day 19).
Found at: doi:10.1371/journal.pbio.1000537.s010 (9.03 MB TIF)
Figure S11 Higher resolution version of Figure S1E(clones at 460 h/day 19).
Found at: doi:10.1371/journal.pbio.1000537.s011 (9.07 MB TIF)
Genetic Control of Shape and Polarity
PLoS Biology | www.plosbiology.org 14 November 2010 | Volume 8 | Issue 11 | e1000537
Figure S12 Grids used for clonal analysis of wild-typepetals, relates to Figure 3 and Tables S1,S2. (A–D) Grids
used for the period 300–340 h: (A) Dorsal lobe, (B) Lateral lobe,
(C) Ventral lobe, and (D) Half tube. (E–H) Grids used for the
period 340–380 h: (E) Dorsal lobe, (F) Lateral lobe, (G) Ventral
lobe, and (H) Half tube. (I–L) Grids used for the period 380–
420 h: (I) Dorsal lobe, (J) Lateral lobe, (K) Ventral lobe, and (L)
Half tube. (M–P) Grids used for the period 420–460 h: (M) Dorsal
lobe, (N) Lateral lobe, (O) Ventral lobe, and (P) Half tube.
Found at: doi:10.1371/journal.pbio.1000537.s012 (4.82 MB
TIF)
Figure S13 Clonal patterns for dorsoventral mutantpetals, relates to Figures 4 and 5. (A–E) Clones on lobes
from several cyc dich double mutant flowers induced at a range of
stages: (A) 300 h (day 12.5), (B) 330 h (day 14), (C) 350 h (day 15),
(D) 380 h (day 16), and (E) 400 h (day 17) (note that
developmental timing does not correlate perfectly with wild type),
warped to a mean lobe shape and overlaid, with a different colour
used for clones from each petal. (F–J) Clones on ventral lobes (in
which cyc and dich are inactive) from several div mutant flowers
induced at a range of stages: (F) 300 h (day 12.5), (G) 340 h (day
14), (H) 380 h (day 16), (I) 420 h (day 17.5), and (J) 440 h (day 18)
(note that developmental timing does not correlate perfectly with
wild type), warped to a mean lobe shape and overlaid, with a
different colour used for clones from each petal.
Found at: doi:10.1371/journal.pbio.1000537.s013 (2.85 MB
TIF)
Table S1 Average sector ellipses by region (relates toFigure 3). An Excel table showing the lengths of the major axis
(Emaj) and minor axis (Emin) and the orientation (h) for the average
sector ellipse for each region (see Figure S12; h is given in radians
relative to the x-axis) for each stage (300 h, 340 h, 380 h, 420 h,
and 460 h). There are two sets of data for the middle stages (340 h,
380 h, and 420 h), corresponding to the optimal grids for the two
relevant growth steps. The sheets ‘‘Dorsal,’’ ‘‘Lateral,’’ ‘‘’’Ven-
tral,’’ and ‘‘Tube’’ each give the average sector ellipse information
for the named petal section.
Found at: doi:10.1371/journal.pbio.1000537.s014 (0.14 MB
XLS)
Table S2 Growth data for each region (relates toFigure 3). An Excel table showing the growth along the principal
direction of growth (Kmax), the growth perpendicular to that within
the plane of the petal surface (Kmin), the anisotropy (Kmax/Kmin), and
the orientation (h) of the principal direction of growth for each
region (see Figure S12) for each step (300–340 h, 340–380 h, 380–
420 h, and 420–460 h). The sheets ‘‘Dorsal,’’ ‘‘Lateral,’’ ‘‘Ven-
tral,’’ and ‘‘Tube’’ each give the growth data for the named petal
section.
Found at: doi:10.1371/journal.pbio.1000537.s015 (0.13 MB
XLS)
Text S1 (A) Data on clonal analysis. (B) Snapdragon model.
Found at: doi:10.1371/journal.pbio.1000537.s016 (0.09 MB PDF)
Video S1 OPT image of flower bud at day 10 (relates toFigure 2).Found at: doi:10.1371/journal.pbio.1000537.s017 (0.68 MB
MOV)
Video S2 OPT image of flower bud at day 12 (relates toFigure 2).Found at: doi:10.1371/journal.pbio.1000537.s018 (1.03 MB
MOV)
Video S3 OPT image of flower bud at day 14 (relates toFigure 2).
Found at: doi:10.1371/journal.pbio.1000537.s019 (1.18 MB
MOV)
Video S4 OPT image of flower bud at day 17 (relates toFigure 2).
Found at: doi:10.1371/journal.pbio.1000537.s020 (1.78 MB
MOV)
Video S5 OPT image of flower bud at day 20 (relates toFigure 2).
Found at: doi:10.1371/journal.pbio.1000537.s021 (1.28 MB
MOV)
Video S6 Growth model of the cyc dich div triplemutant (scale constant throughout). LIP in light grey,
PLT in dark grey, 2organisers in cyan, +organiser in green.
Coloured circles (virtual clones) induced at about 14 d (relates to
Figure 4).
Found at: doi:10.1371/journal.pbio.1000537.s022 (1.31 MB
MOV)
Video S7 Growth model of the cyc dich double mutant(scale constant throughout). LIP in light grey, PLT in dark
grey, DIV in yellow, 2organisers in cyan, +organiser in green.
Coloured circles (virtual clones) induced at about 14 d (relates to
Figure 5).
Found at: doi:10.1371/journal.pbio.1000537.s023 (1.05 MB
MOV)
Video S8 First growth model of wild-type corolla (scaleconstant throughout). LIP in light grey, PLT in dark grey,
DIV in yellow, CYC in red, DICH in brown, 2organisers in cyan,
+organiser in green. Coloured circles (virtual clones) induced at
about 14 d (relates to Figure 6 and to Model 3 in Text S1B).
Found at: doi:10.1371/journal.pbio.1000537.s024 (1.11 MB
MOV)
Video S9 Final growth model of wild-type corolla (scaleconstant throughout). Factors shown as in Video S8. Coloured
circles (virtual clones) induced at about 14 d (relates to Figure 9
and to Model 7 in Text S1B).
Found at: doi:10.1371/journal.pbio.1000537.s025 (1.33 MB
MOV)
Acknowledgments
We thank Przemyslaw Prusinkiewicz, Mark Matthews, Pavol Federl, and
Anne-Gaelle Rolland-Lagan for their inspiration in the early phase of this
project and Christophe Godin and Jerome Chopard for helpful discussions.
Thanks to Jennifer Pateman, Karen Lee, and Johann Strasser for enabling
preparation, analysis, and visualisation of OPT data, and to Jerome
Avondo for technical advice. We also thank Lucy Copsey and Min-Long
Cui for their help with plant material and Xana Rebocho and Pierre
Barbier de Reuille for comments on the manuscript. We would like to
dedicate this article to the memory of Chris Lamb, the late director of the
John Innes Centre, in recognition of the support and guidance he has given
over many years.
Author Contributions
The author(s) have made the following declarations about their
contributions: Conceived and designed the experiments: AAG JAB EC.
Performed the experiments: AAG JRK JAB EC. Analyzed the data: AAG
JRK JAB EC. Contributed reagents/materials/analysis tools: JRK AIH.
Wrote the paper: AAG JAB EC.
Genetic Control of Shape and Polarity
PLoS Biology | www.plosbiology.org 15 November 2010 | Volume 8 | Issue 11 | e1000537
References
1. Dervaux J, Amar MB (2008) Morphogenesis of growing soft tissues. Physical
Review Letters 101: 068101.2. Goriely A, Amar MB (2007) On the definition and modeling of incremental,
cumulative, and continuous growth laws in morphoelasticity. Biomechanics andModeling in Mechanobiology 6: 298–296.
3. Lindenmayer A (1984) Models for plant tissue development with cell divisionorientation regulated by preprophase bands of microtubules. Differentiation 26:
1–10.
4. Coen E, Rolland-Lagan A-G, Matthews M, Bangham JA, Prusinkiewicz P(2004) The genetics of geometry. PNAS 101: 4728–4735.
5. Kennaway JR, Coen E, Green AA, Bangham JA (2010) Generation of diversebiological forms through combinatorial interactions between tissue polarity and
growth. manuscript submitted.
6. Luo D, Carpenter R, Copsey L, Vincent C, Clark J, et al. (1999) Control oforgan asymmetry in flowers of Antirrhinum. Cell 99: 367–376.
7. Corley SB, Carpenter R, Copsey L, Coen E (2005) Floral asymmetry involves aninterplay between TCP and MYB transcription factors in Antirrhinum. PNAS 102:
5068–5073.
8. Costa MMR, Fox S, Hanna AI, Baxter C, Coen E (2005) Evolution ofregulatory interactions controlling floral asymmetry. Development 132:
5093–5101.9. Almeida J, Rocheta M, Galego L (1997) Genetic control of flower shape in
Antirrhinum majus. Development 124: 1387–1392.10. Galego L, Almeida J (2002) Role of DIVARICATA in the control of dorsoventral
asymmetry in Antirrhinum flowers. Genes & Development 16: 880–891.
11. Cui M-L, Copsey L, Green AA, Bangham JA, Coen E (2010) Quantitativecontrol of organ shape by combinatorial gene activity. PLoS Biology 10(11):
e1000538. doi:10.1371/journal.pbio.1000538.12. Vincent CA, Coen ES (2004) A temporal and morphological framework for
flower development in Antirrhinum majus. Canadian Journal of Botany/Revue
Canadienne de Botanique 82: 681–690.13. Rolland-Lagan A-G, Bangham JA, Coen E (2003) Growth dynamics underlying
petal shape and asymmetry. Nature 422: 161–163.14. Harrison BJ, Fincham JRS (1964) Instability at the PAL locus in Antirrhinum
Majus.I. Effects of environment on frequencies of somatic and germinalmutation. Heredity 19: 237–242.
15. Sharpe J, Ahlgren U, Perry P, Hill B, Ross A, et al. (2002) Optical projection
tomography as a tool for 3D microscopy and gene expression studies. Science296: 541–545.
16. Boot MJ, Westerberg CH, Sanz-Esquerro J, Cotterell J, Schweitzer R, et al.(2008) In vitro whole-organ imaging: 4D quantification of growing mouse limb
buds. Nature Methods 5: 609–612.
17. Lee K, Avondo J, Morrison H, Blot L, Stark M, et al. (2006) Visualising plantdevelopment and gene expression in three dimensions using Optical Projection
Tomography. Plant Cell 18: 2145–2156.18. Hejnowicz Z, Romberger JA (1984) Growth tensor of plant organs. Journal of
Theoretical Biology 110: 93–114.19. Vincent CA, Carpenter R, Coen ES (1995) Cell lineage patterns and homeotic
gene activity during Antirrhinum flower development. Current Biology 5:
1449–1458.20. Rolland-Lagan A-G, Coen E, Impey SJ, Bangham JA (2005) A computational
method for inferring growth parameters and shape changes during developmentbased on clonal analysis. Journal of Theoretical Biology 232: 157–177.
21. Hamant O, Traas J, Boudaoud A (2010) Regulation of shape and patterning in
plant development. Curr Opin Genet Dev 20: 1–6.22. Dupuy L, Mackenzie J, Rudge T, Haseloff J (2008) A system for modelling cell-
cell interactions during plant morphogenesis. Annals of Botany 101: 1255–1265.23. Dumais J, Shaw SL, Steele CR, Long SR, Ray PM (2006) An anisotropic-
viscoplastic model of plant cell morphogenesis by tip growth. International
Journal of Developmental Biology 50: 209–222.
24. de Boer MJM, Fracchia D, Prusinkiewicz P (1992) A model for cellular
development in morphogenetic fields In: Rozenberg G, Salomaa A, eds.
Lindenmayer systems. Berlin: Springer. pp 351–370.
25. Prusinkiewicz P, Lindenmayer A (1990) The algorithmic beauty of plants: New
York: Springer Verlag.
26. Roeder AH, Chickarmane V, Cunha A, Obara B, Manjunath BS, et al. (2010)
Variability in the control of cell division underlies sepal epidermal patterning in
Arabidopsis thaliana. PLoS Biol 8: e1000367. doi:10.1371/journal.
pbio.1000367.
27. Le Garrec J-F, Lopez P, Kerszberg M (2006) Establishment and maintenance of
planar epithelial cell polarity by asymmetric cadherin bridges: a computer
model. Developmental Dynamics 235: 235–246.
28. Zallen JA (2007) Planar polarity and tissue morphogenesis. Cell 129: 1051–1063.
29. Richards OW, Kavanagh AJ (1943) The analysis of the relative growth gradients
and changing form of growing organisms: Illustrated by the Tobacco leaf. The
American Naturalist 127: 385–399.
30. Gaudin V, Lunness PA, Fobert PR, Towers M, Riou-Khamlichi C, et al. (2000)
The expression of D-CYCLIN genes defines distinct developmental zones in
snapdragon apical meristems and is locally regulated by the CYCLOIDEA gene.
Plant Physiology 122: 1137–1148.
31. Nakielski J (2008) The tensor-based model for growth and cell divisions of the
root apex. I. The significance of principal directions. Planta 228: 179–189.
32. Hamant O, Heisler MG, Jonsson H, Krupinski P, Uyttewaal M, et al. (2008)
Developmental patterning by mechanical signals in Arabidopsis. Science 322:
1650–1655.
33. Grebe M (2004) Ups and downs of tissue and planar polarity in plants. Bioessays
26: 719–729.
34. Dhonukshe P, Tanaka H, Goh T, Ebine K, Mahonen AP, et al. (2008)
Generation of cell polarity in plants links endocytosis, auxin distribution and cell
fate decisions. Nature 456: 962–966.
35. Sabatini S, Beis D, Wolkenfelt H, Murfett J, Guilfoyle T, et al. (1999) An auxin-
dependent distal organizer of pattern and polarity in the Arabidopsis root. Cell
99: 463–472.
36. Reinhardt D, Pesce ER, Stieger P, Mandel T, Baltensperger K, et al. (2003)
Regulation of phyllotaxis by polar auxin transport. Nature 426: 255–260.
37. Lecuit T, Lenne P-F (2007) Cell surface mechanics and the control of cell shape,
tissue patterns and morphogenesis. Nature Reviews Molecular Cell Biology 8:
633–644.
38. Peters WS, Tomos AD (1996) The history of tissue tension. Annals of Botany 77:
657–665.
39. Cosgrove D (2005) Growth of the plant cell wall. Nature Reviews Molecular Cell
Biology 6: 850–861.
40. Vandiver R, Goriely A (2008) Tissue tension and axial growth of cylindrical
structures in plants and elastic tissues. Europhysics Letters 84: 58004.
41. Rodriguez EK, Hoger A, McCulloch AD (1994) Stress-dependent finite growth
in soft elastic tissues. Journal of Biomechanics 27: 455–467.
42. Hejnowicz Z, Sievers A (1996) Tissue stresses in organs of herbaceous plants III.
Elastic properties of tissues of sunflower hypocotyle and origin of tissue stresses.
Journal of Experimental Botany 47: 519–528.
43. Weberling F (1992) Morphology of flowers and inflorescences. Cambridge:
Cambridge University Press.
44. Hodges SA, Arnold ML (1995) Spurring plant diversification: Are floral nectar
spurs a key evolutionary innovation? Proceedings of the Royal Society of
London, Series B: Biological Sciences 262: 343–348.
45. Southam P, Strasser J, Lee K, Avondo J, Bangham A (2009) UFEEL: using
haptics and stereo to place landmarks in three-dimensional volumetric images.
International Conference on Image Processing Cairo.
Genetic Control of Shape and Polarity
PLoS Biology | www.plosbiology.org 16 November 2010 | Volume 8 | Issue 11 | e1000537


