Embed Size (px)
Citation preview
Euphytica 105: 25–32, 1999.© 1999Kluwer Academic Publishers. Printed in the Netherlands.
25
Genetic relationship among 19 accessions of six species ofChenopodiumL., by Random Amplified Polymorphic DNA fragments (RAPD)
Paulo M. Ruas1,2,∗, Alejandro Bonifacio1,3, Claudete F. Ruas1,2, Daniel J. Fairbanks1 &William R. Andersen11 Department of Botany and Range Science, Brigham Young University, Provo, Utah, U.S.A.;3 Bolivian Institute ofAgriculture Technology (IBTA), Bolivia;2 Universidade Estadual de Londrina, Londrina, Paran´a, Brazil; (∗ authorand address for correspondence: Departamento de Biologia Geral, Universidade Estadual de Londrina, Londrina,Parana, Brazil – 86051-990)
Received 22 January 1998; accepted 23 July 1998
Key words: Chenopodium,genetic relationship, molecular markers, RAPD
Summary
The RAPD technique was used to identify genetic relationships in 19 accessions, including six species of thegenusChenopodium. A dendrogram was constructed using UPGMA from 399 DNA markers. The moleculardata clustered species and accessions into five different groups. Group 1 with three cultivated varieties ofC.nuttalliae, Group 2 included eight cultivars and two wild varieties ofC. quinoa, Group 3 withC. berlandieriandC. album, Group 4 with two accessions ofC. pallidicaule, and Group 5 with 2 accessions ofC. ambrosioides.The polymorphic patterns generated by RAPD profiles showed different degrees of genetic relationship among thespecies studied. A low level of intraspecific variation was found within the accessions ofC. quinoa, C. nuttalliae,andC. pallidicaule. The RAPD markers were found to be a useful tool for detecting genetic variation within thegenusChenopodium.
Introduction
The genusChenopodium(Chenopodiaceae) comprisesabout 250 species (Giusti, 1970) that includes herba-ceous, suffrutescent, and arborescent perennials, al-though most of the species are colonizing annuals, dis-tributed in the Americas, Asia, and Europe. The genusis characterized by small perfect or rarely unisexualflowers with the perianth five-parted, rarely three orfour parted or lobed. The flowers have five or fewerstamens and have didymous or oblong anthers. Thestyle usually has two to five stigmas (Standley, 1916).Six species ofChenopodiumare considered here (Ta-ble 1) three of which have economical importance, i.e.,C. quinoa, C. pallidicaule, andC. nuttalliae.
Chenopodium quinoais utilized for human con-sumption as a grain crop, and the whole plant isused for animal feed in Bolivia, Peru, Ecuador, andColumbia. This species is native to South America andit has been introduced in the United States and Eu-
rope, mainly in England and Denmark.Chenopodiumquinoahas been used, on a very small scale, in theUnited States and England, for human consumption,and in Denmark, beyond of being used as grain crop,it is also used for animal feed. There is no clearinformation about the domestication ofC. quinoa;however, it is supposed that this species was domes-ticated in different times and localities, such as Peru(5000 B.C.), Chile (3000 B.C.), and Bolivia (750 B.C.)by old civilizations. Following the Spanish conquest,the cultivation ofC. quinoawas discouraged, possiblybecause of its importance in Inca society and religiousbelief (Galwey et al., 1990). Nowadays,C. quinoahas been exploited both as human food and as animalfeedstuff due to its high level of lysine and methioninewhich usually show low content in cereal grains andlegumes. Other importance of this crop is its adap-tation to marginal soils with problems of stoniness,poor drainage or excessively free drainage, low natural
euph4774.tex; 4/11/1998; 13:46; p.1
MENNEN/SCHRIKS:TYPESET: Pips Nr.:186410; Ordernr.:233571-mc (euphkap:bio2fam) v.1.1
26
fertility or pH values as low as 4.8, such as found inEcuador and Peru, and as high as 8.5, such as in theBolivian salars (Tapia, 1979).
Chenopodium pallidicauleis a grain and foragecrop that was domesticated in the Andes and whosecultivation is still confined to that region. This speciesis less important thanC. quinoafor human consump-tion. However, it has a better resistance to drought andpests therefore, it could be exploited for gene transfer.
Chenopodium nuttalliaeis another species withrelative importance for human food and it has beenused as a spinach-like vegetable and also as a graincrop in Mexico. Standley (1931) considered thisspecies to be conspecific withC. quinoa. This treat-ment led to the suggestion thatC. nuttalliae mayactually represent a pre-Columbian introduction ofC.quinoafrom South America (Standley & Steyermark,1949; Dressler, 1953). However, other authors (Hun-ziker, 1952; Simmonds, 1965; Heiser & Nelson, 1974)have concluded thatC. nuttalliaeis a distinct species.
Chenopodium albumis a wild species that occursas a cosmopolitan weed distributed throughout theAmerican Continent and the Himalayan region. Thisspecies is a weed of corn, beans, barley, wheat, andother important crop plantations.
Chenopodium ambrosioidesis native to Peru, Bo-livia, northern Chile, and Argentina. This species hasbeen found as a weed plant in California, CentralAmerica, and in many parts of Europe, Asia, andAfrica.
The knowledge of the genetic diversity inChenopodiumis still limited, being based mainly onmorphological characters. More detailed genetic stud-ies have been carried out inC. quinoa, which hasthe most important agronomic properties within thegenus.
Wilson (1988a, 1988b) reported allozyme analy-sis applied to domesticated and wild collections ofC.quinoa from the Andes. Those studies have shownthat wild and crop populations share a low level ofallozyme variation with no distinction between sym-patric domesticated and free-living populations. Onthe other hand, free living Andean populations sharewith domesticated populations a wide range of varia-tion in fruit size and shape. In addition, based on pat-terns of allozyme and leaf-shape variation it was foundthat Andean cultivars are more closely allied to An-dean weeds than to cultivars of the Chilean low lands(Wilson & Manhart, 1993). The pattern of relationshipbetween crop and wild populations led to the hypoth-esis that the crop/weed complex ofC. quinoafrom the
Andes may be considered as a monophyletic systempossibly derived from human-mediated dispersal andgenetic manipulation (Wilson, 1990).
Recently, genetic polymorphism in many plantgenera has been documented through various finger-printing systems, including isozyme analyses, restric-tion fragment length polymorphism (RFLP), and ran-dom amplified polymorphic DNAs (RAPD). Whileisozyme analyses and RFLP are highly reproducible,they also reveal relatively little polymorphism. TheRAPD technique (Williams et al., 1990), on the otherhand, has provided high levels of polymorphism, al-though in some species, it can be less reproducible. Inspite of this disadvantage, polymorphism detected byRAPD has proven to be useful for identifying inter-and intraspecific genetic variation in several differ-ent groups of plants. Fairbanks et al. (1993) appliedthe RAPD technique to detect DNA polymorphism inquinoa and several other species.
In this investigation, the RAPD technique is em-ployed for identifying DNA polymorphisms in 19 ac-cessions ofChenopodium, thereby assessing the utilityof RAPD markers for systematic studies and breedingprograms.
Material and methods
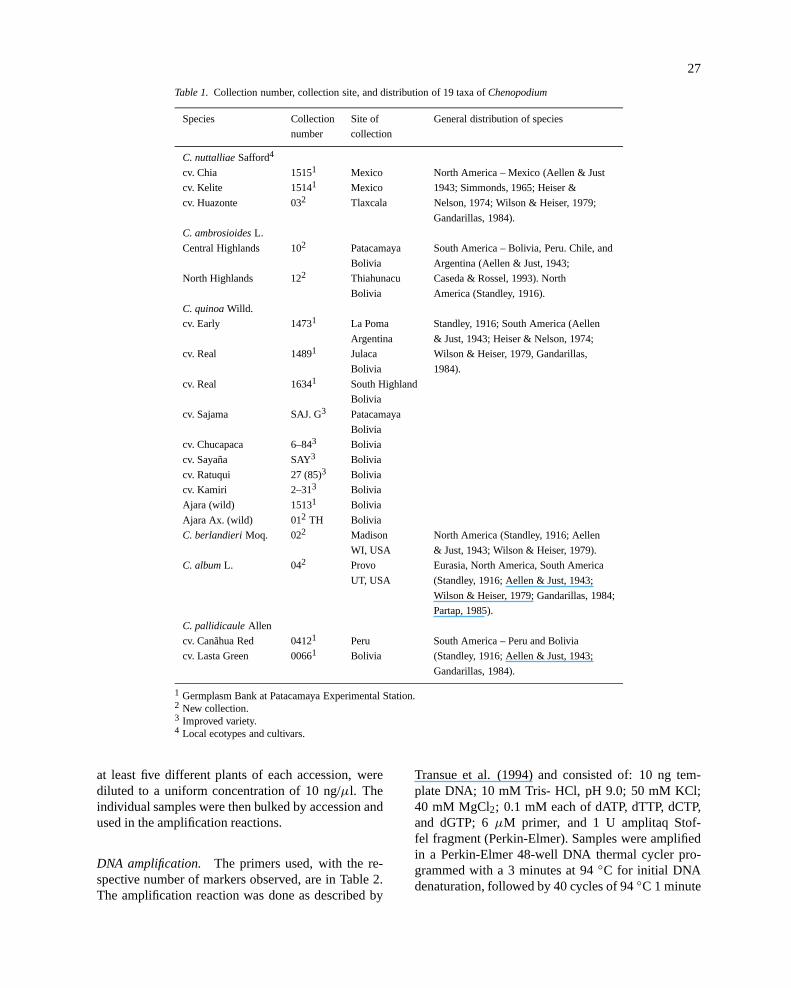
Plant materials. The 19 accessions comprising sixspecies and including many cultivars ofChenopodiumare described in Table 1.
DNA extraction. The procedure described in Della-porta et al. (1983), with minor modifications, was usedfor DNA extraction as follow: Approximately 0.5 gof leaf tissue was ground in 1.5 ml extraction buffer(10 mM Tris, pH 8.0; 50 mM EDTA, pH 8.0; 50 mMNaCl) after which, 100µl 20% sodium dodecyl sul-fate (SDS), and 5µl-mercaptoethanol were addedand the suspension was incubated at 68◦C for 20minutes. Following incubation, 500µl 5 M potassiumacetate was added and the mixture was centrifuged at13000 Xg in a microcentrifuge for 6 minutes. The pel-let was discarded and one volume of isopropanol wasadded to the supernatant to precipitate the DNA. Thesuspended DNA was centrifuged for 3 minutes and thepellet DNA was air dried and then suspended in 100µlof TE pH 8.0 (10 mM Tris; 0.5 mM EDTA, pH 8.0).DNA concentration was estimated using a BeckmanDU 640 spectrophotometer, according to the manu-facturer’s instructions. DNA samples, obtained from
euph4774.tex; 4/11/1998; 13:46; p.2
27
Table 1. Collection number, collection site, and distribution of 19 taxa ofChenopodium
Species Collection Site of General distribution of species
number collection
C. nuttalliaeSafford4
cv. Chia 15151 Mexico North America – Mexico (Aellen & Just
cv. Kelite 15141 Mexico 1943; Simmonds, 1965; Heiser &
cv. Huazonte 032 Tlaxcala Nelson, 1974; Wilson & Heiser, 1979;
Gandarillas, 1984).
C. ambrosioidesL.
Central Highlands 102 Patacamaya South America – Bolivia, Peru. Chile, and
Bolivia Argentina (Aellen & Just, 1943;
North Highlands 122 Thiahunacu Caseda & Rossel, 1993). North
Bolivia America (Standley, 1916).
C. quinoaWilld.
cv. Early 14731 La Poma Standley, 1916; South America (Aellen
Argentina & Just, 1943; Heiser & Nelson, 1974;
cv. Real 14891 Julaca Wilson & Heiser, 1979, Gandarillas,
Bolivia 1984).
cv. Real 16341 South Highland
Bolivia
cv. Sajama SAJ. G3 Patacamaya
Bolivia
cv. Chucapaca 6–843 Bolivia
cv. Sayaña SAY3 Bolivia
cv. Ratuqui 27 (85)3 Bolivia
cv. Kamiri 2–313 Bolivia
Ajara (wild) 15131 Bolivia
Ajara Ax. (wild) 012 TH Bolivia
C. berlandieriMoq. 022 Madison North America (Standley, 1916; Aellen
WI, USA & Just, 1943; Wilson & Heiser, 1979).
C. albumL. 042 Provo Eurasia, North America, South America
UT, USA (Standley, 1916; Aellen & Just, 1943;
Wilson & Heiser, 1979; Gandarillas, 1984;
Partap, 1985).
C. pallidicauleAllen
cv. Canãhua Red 04121 Peru South America – Peru and Bolivia
cv. Lasta Green 00661 Bolivia (Standley, 1916; Aellen & Just, 1943;
Gandarillas, 1984).
1 Germplasm Bank at Patacamaya Experimental Station.2 New collection.3 Improved variety.4 Local ecotypes and cultivars.
at least five different plants of each accession, werediluted to a uniform concentration of 10 ng/µl. Theindividual samples were then bulked by accession andused in the amplification reactions.
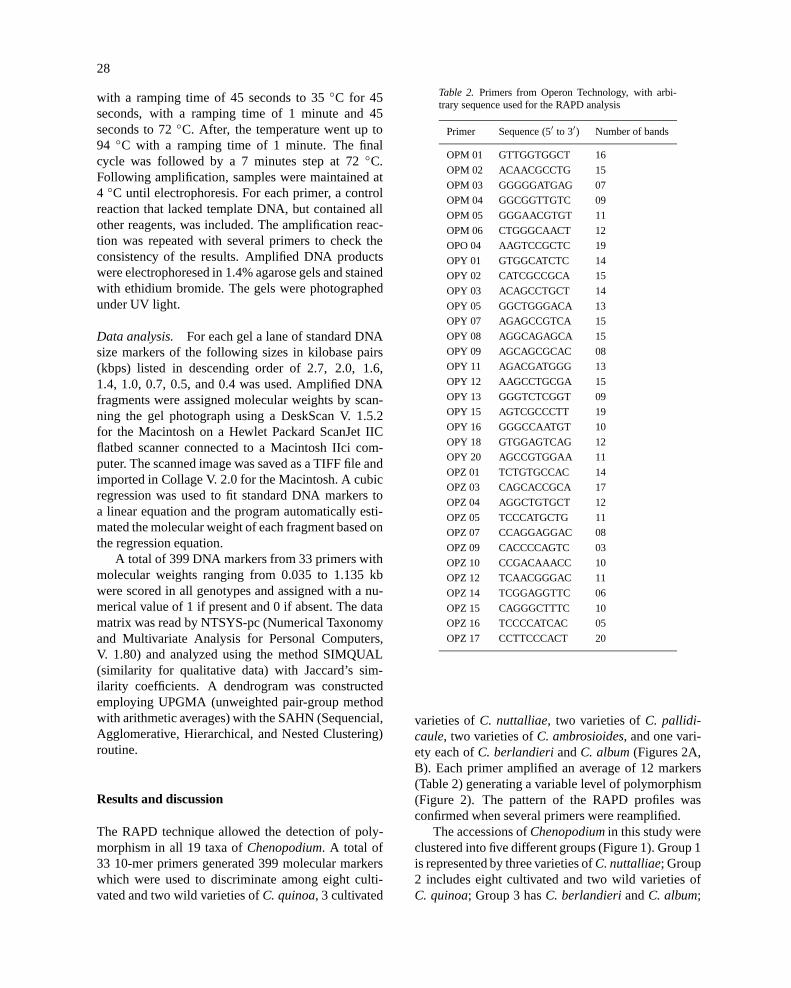
DNA amplification. The primers used, with the re-spective number of markers observed, are in Table 2.The amplification reaction was done as described by
Transue et al. (1994) and consisted of: 10 ng tem-plate DNA; 10 mM Tris- HCl, pH 9.0; 50 mM KCl;40 mM MgCl2; 0.1 mM each of dATP, dTTP, dCTP,and dGTP; 6µM primer, and 1 U amplitaq Stof-fel fragment (Perkin-Elmer). Samples were amplifiedin a Perkin-Elmer 48-well DNA thermal cycler pro-grammed with a 3 minutes at 94◦C for initial DNAdenaturation, followed by 40 cycles of 94◦C 1 minute
euph4774.tex; 4/11/1998; 13:46; p.3
28
with a ramping time of 45 seconds to 35◦C for 45seconds, with a ramping time of 1 minute and 45seconds to 72◦C. After, the temperature went up to94 ◦C with a ramping time of 1 minute. The finalcycle was followed by a 7 minutes step at 72◦C.Following amplification, samples were maintained at4 ◦C until electrophoresis. For each primer, a controlreaction that lacked template DNA, but contained allother reagents, was included. The amplification reac-tion was repeated with several primers to check theconsistency of the results. Amplified DNA productswere electrophoresed in 1.4% agarose gels and stainedwith ethidium bromide. The gels were photographedunder UV light.
Data analysis. For each gel a lane of standard DNAsize markers of the following sizes in kilobase pairs(kbps) listed in descending order of 2.7, 2.0, 1.6,1.4, 1.0, 0.7, 0.5, and 0.4 was used. Amplified DNAfragments were assigned molecular weights by scan-ning the gel photograph using a DeskScan V. 1.5.2for the Macintosh on a Hewlet Packard ScanJet IICflatbed scanner connected to a Macintosh IIci com-puter. The scanned image was saved as a TIFF file andimported in Collage V. 2.0 for the Macintosh. A cubicregression was used to fit standard DNA markers toa linear equation and the program automatically esti-mated the molecular weight of each fragment based onthe regression equation.
A total of 399 DNA markers from 33 primers withmolecular weights ranging from 0.035 to 1.135 kbwere scored in all genotypes and assigned with a nu-merical value of 1 if present and 0 if absent. The datamatrix was read by NTSYS-pc (Numerical Taxonomyand Multivariate Analysis for Personal Computers,V. 1.80) and analyzed using the method SIMQUAL(similarity for qualitative data) with Jaccard’s sim-ilarity coefficients. A dendrogram was constructedemploying UPGMA (unweighted pair-group methodwith arithmetic averages) with the SAHN (Sequencial,Agglomerative, Hierarchical, and Nested Clustering)routine.
Results and discussion
The RAPD technique allowed the detection of poly-morphism in all 19 taxa ofChenopodium. A total of33 10-mer primers generated 399 molecular markerswhich were used to discriminate among eight culti-vated and two wild varieties ofC. quinoa, 3 cultivated
Table 2. Primers from Operon Technology, with arbi-trary sequence used for the RAPD analysis
Primer Sequence (5′ to 3′) Number of bands
OPM 01 GTTGGTGGCT 16
OPM 02 ACAACGCCTG 15
OPM 03 GGGGGATGAG 07
OPM 04 GGCGGTTGTC 09
OPM 05 GGGAACGTGT 11
OPM 06 CTGGGCAACT 12
OPO 04 AAGTCCGCTC 19
OPY 01 GTGGCATCTC 14
OPY 02 CATCGCCGCA 15
OPY 03 ACAGCCTGCT 14
OPY 05 GGCTGGGACA 13
OPY 07 AGAGCCGTCA 15
OPY 08 AGGCAGAGCA 15
OPY 09 AGCAGCGCAC 08
OPY 11 AGACGATGGG 13
OPY 12 AAGCCTGCGA 15
OPY 13 GGGTCTCGGT 09
OPY 15 AGTCGCCCTT 19
OPY 16 GGGCCAATGT 10
OPY 18 GTGGAGTCAG 12
OPY 20 AGCCGTGGAA 11
OPZ 01 TCTGTGCCAC 14
OPZ 03 CAGCACCGCA 17
OPZ 04 AGGCTGTGCT 12
OPZ 05 TCCCATGCTG 11
OPZ 07 CCAGGAGGAC 08
OPZ 09 CACCCCAGTC 03
OPZ 10 CCGACAAACC 10
OPZ 12 TCAACGGGAC 11
OPZ 14 TCGGAGGTTC 06
OPZ 15 CAGGGCTTTC 10
OPZ 16 TCCCCATCAC 05
OPZ 17 CCTTCCCACT 20
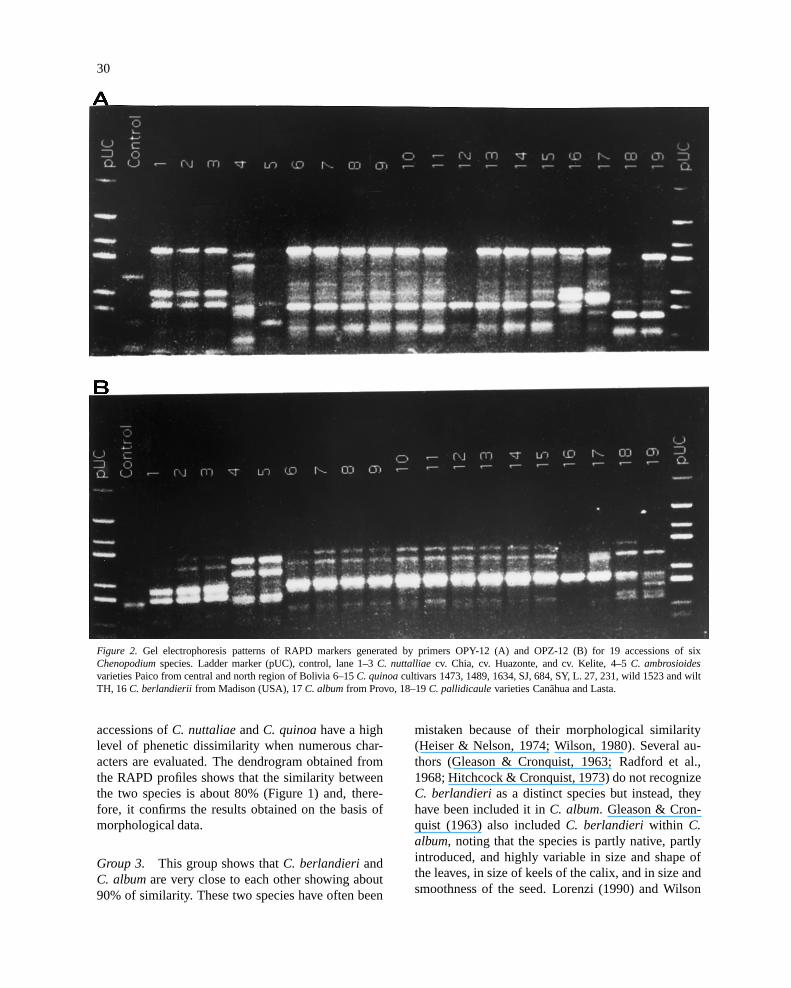
varieties ofC. nuttalliae, two varieties ofC. pallidi-caule, two varieties ofC. ambrosioides, and one vari-ety each ofC. berlandieriandC. album(Figures 2A,B). Each primer amplified an average of 12 markers(Table 2) generating a variable level of polymorphism(Figure 2). The pattern of the RAPD profiles wasconfirmed when several primers were reamplified.
The accessions ofChenopodiumin this study wereclustered into five different groups (Figure 1). Group 1is represented by three varieties ofC. nuttalliae; Group2 includes eight cultivated and two wild varieties ofC. quinoa; Group 3 hasC. berlandieriandC. album;
euph4774.tex; 4/11/1998; 13:46; p.4
29
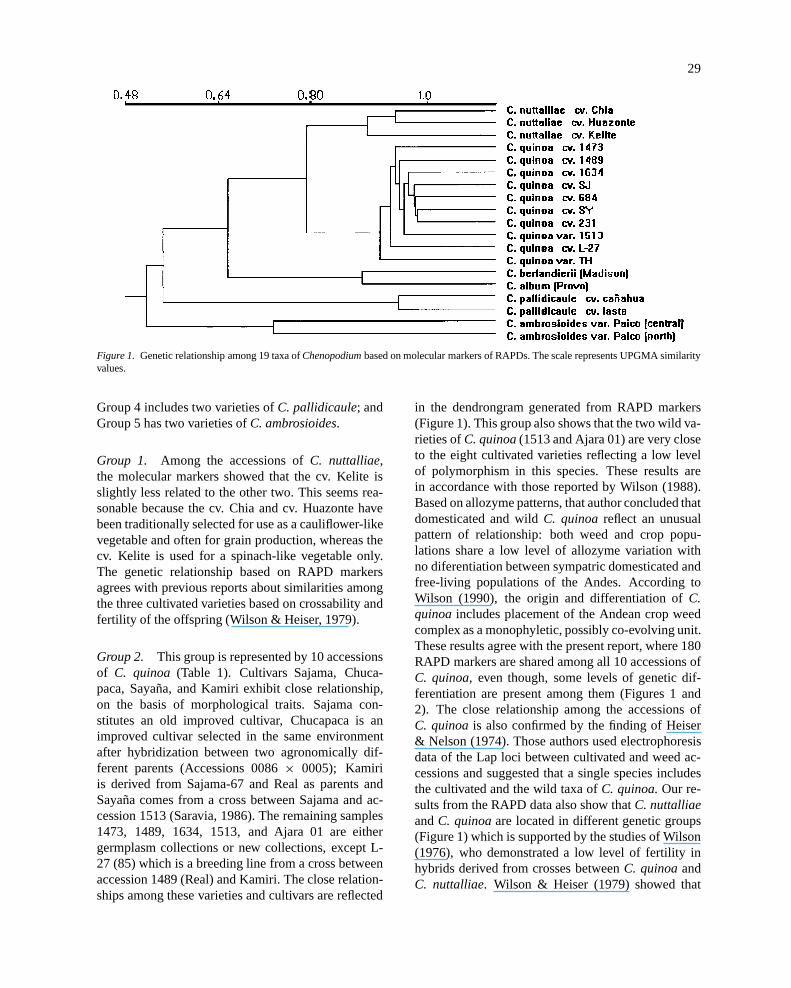
Figure 1. Genetic relationship among 19 taxa ofChenopodiumbased on molecular markers of RAPDs. The scale represents UPGMA similarityvalues.
Group 4 includes two varieties ofC. pallidicaule; andGroup 5 has two varieties ofC. ambrosioides.
Group 1. Among the accessions ofC. nuttalliae,the molecular markers showed that the cv. Kelite isslightly less related to the other two. This seems rea-sonable because the cv. Chia and cv. Huazonte havebeen traditionally selected for use as a cauliflower-likevegetable and often for grain production, whereas thecv. Kelite is used for a spinach-like vegetable only.The genetic relationship based on RAPD markersagrees with previous reports about similarities amongthe three cultivated varieties based on crossability andfertility of the offspring (Wilson & Heiser, 1979).
Group 2. This group is represented by 10 accessionsof C. quinoa (Table 1). Cultivars Sajama, Chuca-paca, Sayaña, and Kamiri exhibit close relationship,on the basis of morphological traits. Sajama con-stitutes an old improved cultivar, Chucapaca is animproved cultivar selected in the same environmentafter hybridization between two agronomically dif-ferent parents (Accessions 0086× 0005); Kamiriis derived from Sajama-67 and Real as parents andSayaña comes from a cross between Sajama and ac-cession 1513 (Saravia, 1986). The remaining samples1473, 1489, 1634, 1513, and Ajara 01 are eithergermplasm collections or new collections, except L-27 (85) which is a breeding line from a cross betweenaccession 1489 (Real) and Kamiri. The close relation-ships among these varieties and cultivars are reflected
in the dendrongram generated from RAPD markers(Figure 1). This group also shows that the two wild va-rieties ofC. quinoa(1513 and Ajara 01) are very closeto the eight cultivated varieties reflecting a low levelof polymorphism in this species. These results arein accordance with those reported by Wilson (1988).Based on allozyme patterns, that author concluded thatdomesticated and wildC. quinoareflect an unusualpattern of relationship: both weed and crop popu-lations share a low level of allozyme variation withno diferentiation between sympatric domesticated andfree-living populations of the Andes. According toWilson (1990), the origin and differentiation ofC.quinoa includes placement of the Andean crop weedcomplex as a monophyletic, possibly co-evolving unit.These results agree with the present report, where 180RAPD markers are shared among all 10 accessions ofC. quinoa, even though, some levels of genetic dif-ferentiation are present among them (Figures 1 and2). The close relationship among the accessions ofC. quinoais also confirmed by the finding of Heiser& Nelson (1974). Those authors used electrophoresisdata of the Lap loci between cultivated and weed ac-cessions and suggested that a single species includesthe cultivated and the wild taxa ofC. quinoa.Our re-sults from the RAPD data also show thatC. nuttalliaeandC. quinoaare located in different genetic groups(Figure 1) which is supported by the studies of Wilson(1976), who demonstrated a low level of fertility inhybrids derived from crosses betweenC. quinoaandC. nuttalliae. Wilson & Heiser (1979) showed that
euph4774.tex; 4/11/1998; 13:46; p.5
30
Figure 2. Gel electrophoresis patterns of RAPD markers generated by primers OPY-12 (A) and OPZ-12 (B) for 19 accessions of sixChenopodiumspecies. Ladder marker (pUC), control, lane 1–3C. nuttalliae cv. Chia, cv. Huazonte, and cv. Kelite, 4–5C. ambrosioidesvarieties Paico from central and north region of Bolivia 6–15C. quinoacultivars 1473, 1489, 1634, SJ, 684, SY, L. 27, 231, wild 1523 and wiltTH, 16C. berlandierii from Madison (USA), 17C. albumfrom Provo, 18–19C. pallidicaulevarieties Canãhua and Lasta.
accessions ofC. nuttaliaeandC. quinoahave a highlevel of phenetic dissimilarity when numerous char-acters are evaluated. The dendrogram obtained fromthe RAPD profiles shows that the similarity betweenthe two species is about 80% (Figure 1) and, there-fore, it confirms the results obtained on the basis ofmorphological data.
Group 3. This group shows thatC. berlandieriandC. albumare very close to each other showing about90% of similarity. These two species have often been
mistaken because of their morphological similarity(Heiser & Nelson, 1974; Wilson, 1980). Several au-thors (Gleason & Cronquist, 1963; Radford et al.,1968; Hitchcock & Cronquist, 1973) do not recognizeC. berlandierias a distinct species but instead, theyhave been included it inC. album. Gleason & Cron-quist (1963) also includedC. berlandieri within C.album, noting that the species is partly native, partlyintroduced, and highly variable in size and shape ofthe leaves, in size of keels of the calix, and in size andsmoothness of the seed. Lorenzi (1990) and Wilson
euph4774.tex; 4/11/1998; 13:46; p.6
31
(1991) treated both taxa asC. berlandieri.The resultsobtained with RAPD markers perfectly agree that bothtaxa could be classified as the same species. RAPDmarkers also show that the taxa namedC. albumandC. berlandierihave only about 68% of genetic rela-tionship with C. quinoa. This result agrees with thedata of Wilson (1980) based on pollen stainabilitywhich showed that the percentage of sterility was highin berlandieri-quinoahybrids and that they did not setfruit after self-pollination.
Group 4. The two accessions ofC. pallidicaule,Canãhua and Lasta, are very close to each other, asshown by the RAPD profiles (Figure 1). However, spe-cific markers for each variety were found (Figure 2).On the other hand, these accessions ofC. pallidicauleexhibit high levels of genetic dissimilarity when theyare compared withC. quinoaand the other species.
Group 5. The dendrogram generated from RAPDdata clustered the accessions ofC. ambrosioideswithonly 75% similarity, even though they can not beseparated by morphological characteristics. Both ac-cessions represent new collections, of supposedly thesame cultivar, which were recently introduced fromdifferent locations to the Germplasm Bank of Quinoa,at Patacamaya Experimental Station. The different ori-gins may explain the genetic dissimilarity betweenthese two collections, which exhibit the highest levelof intraspecific polymorphism when compared to anyother taxa analyzed (Figure 1).
The patterns of polymorphism generated by RAPDmarkers show different degrees of genetic relationshipamong the species involved in this study. The prox-imity among some species, such asC. quinoaandC.nuttalliae(Figure 1) enhances the possibility of intro-gressing some favorable traits that are present in onespecies and are lacking in others. For instance, mildewdisease resistance genes are present inC. nuttalliaeand could be introgressed toC. quinoaby crossingthese species and backcrossing to restore the fertil-ity. The same procedure might allow the transfer ofseed characteristics fromC. quinoa into C. nuttal-liae mainly to C. nuttalliaecv. Chia, increasing theeconomic value ofC. nuttaliae. In addition, current ex-periments on interspecific hybridization show that F1hybrids fromC. quinoa× C. nuttalliaeperform betterthan F1 hyhrids fromC. quinoa× C. berlandieri.
The comparative analyses of RAPD profiles revealthat low levels of intraspecific variation is found withinaccessions ofC. quinoa, C. nuttalliae,andC. pallidi-
caule. On the other hand, high levels of polymorphismwere observed among all the species studied suggest-ing that RAPD markers could represent a useful toolfor the evaluation of the genetic variation present indifferent species and accessions ofChenopodium.
Acknowledgements
The authors thank the College of Biology and Agri-culture of Brigham Young University, Provo, Utah,B.H.P. Utah International, the Universidade Estadualde Londrina, and the Conselho Nacional de Desen-volvimento Científico e Tecnológico-CNPq, Brazil fortheir financial support.
References
Aellen, P. & T. Just, 1943. Key of the American species of the genusChenopodiumL. American Midland Naturalist 30: 46–76.
Caseda, F. & J. Rossel, 1993. Flora medicinal native y cosmovisioncampesina en comunidades de Puno. Universidad Nacional delAltiplano, Puno, Peru, pp. 41–42.
Dellaporta, S.L., J. Wood & J.B. Hicks, 1983. A plant DNAMinipreparation: Version II. Pl Mol Biol Rep 1: 19–21.
Dressler, R.L., 1953. The pre-Columbian cultivated plants of Mex-ico. Bot Mus Leafl 16: 115–172.
Fairbanks, D.J., A. Waldrigues, C.F. Ruas, P.M. Ruas, P.J. Maughan,L.R. Robison, W.R. Andersen, C.R. Riede, C.S. Panley, L.G.Caetano, O.M.N. Arantes, M.H. Fungaro, M.C. Vidotto & S.E.Jankevicius, 1993. Efficient characterization of biological diver-sity using field DNA extraction and RAPD markers. Brazil J ofGenetics 16: 11–33.
Galwey, N.W., C.L.A. Leakey, K.R. Price & G.R. Fenwick, 1990.Chemical composition and nutritional characteristics of quinoa(Chenopodium quinoaWilld). Food Science and Nutrition 42:245–261.
Gandarillas, H., 1984. Obtencion experimental ofChenopodiumquinoaWilld. La Paz, Bolivia. Ministerio de asuntos Campesinosy Agropecuarios, IBTA-CIID Canada, Unidad de ComunicacionTecnica, 22 pp.
Giusti, L., 1970. El generoChenopodiumin Argentina I. Numerode cromosomos. Darwiniana 16: 98–105.
Gleason, H.A. & A. Cronquist, 1963. Manual of vascular plantsof Northeastern of United States and adjacent Canada. VanNostrand Reenhold, Princeton.
Heiser, C.B. & B.D. Nelson, 1974. On the origin of the cultivatedchenopods (Chenopodium). Genetics 78: 503–505.
Hitchcock, C.L. & A. Cronquist, 1973. Flora of the Pacific north-west. Univ of Washington Press, Seattle.
Hunziker, A.T., 1952. Los pseudocereales de la agricultura indigenain America. Mus Bot Cordoba, Publ Mex 3
Lorenzi, H., 1990. Manual de identificação e controle de plan-tas daninhas: Plantio direto e convencional. Piracicaba, Brazil,Grafica Elisabete, 3th ed. 272 p.
Partap, T., 1985. The Himalayan grain chenopods. I. Distributionand ethnobotany. Agric Ecosystems Environ 14: 185–199
euph4774.tex; 4/11/1998; 13:46; p.7
32
Radford, A.E., H.E. Ahles & C.R. Bell, 1968. Manual of the vascu-lar flora of the Carolinas. Univ of North Carolina Press, ChapelHill.
Saravia, R., 1986. Origen de las variedades de quinua Chuca-paca, Huaranga y Kamiri. Congreso Internacional de SistemasAgropecuarios Andinos 7mo, Puno, Peru.
Simmonds, N.W., 1965. The grain chenopods of the tropicalAmerican highlands. Econ Bot 19: 223–235.
Standley, P.C., 1916. Chenopodiales. Chenopodiaceae. North Amer-ican Flora Vol. 21, Part 1: 1–72.
Standley, P.C., 1931. The Chenopodiaceae of northwestern SouthAmerica. Field Mus Nat Hist Bot Ser 11: 115–126.
Standley, P.C. & J.A. Steyermark, 1949. Flora of Guatemala.Fieldiana Bot 24: 4–6.
Tapia, M., 1979. Quinua y Kamiria: cultivos andinos. CIID, Bogota.Transue, D.K., D.J. Fairbanks, L.R. Robinson & W.R. Andersen,
1994. Species identification of RAPD analysis of grain Amaranthgenetic resources. Crop Sci 34: 1385–1389.
Williams, J.G.K., A.E. Kubelik, K.J. Levak, J.A. Rafalski &S.C. Tingey, 1990. DNA polymorphisms amplified by arbitraryprimers are useful as genetic markers. Nucleic Acids Res 18:6531–6535.
Wilson, H.D., 1976. Genetic control and distribution of leucineaminopeptidase in the cultivated chenopods (Chenopodiaceae)and related weed taxa. Biochemical Genetics 14: 913–919.
Wilson, H.D., 1980. Artificial hybridization among species ofChenopodium. Syst Bot 5: 253–263.
Wilson, H.D., 1988a. Quinua biosystematic I: free-living popula-tions. Econ Bot 42: 461–477.
Wilson, H.D., 1988b. Quinea biosystematic II: free-living popula-tions. Econ Bot 42: 478–494.
Wilson, H.D., 1990. Gene flow in squash species. Bioscience 40:449–455.
Wilson, H.D., 1991. Genetic variation among South American pop-ulations of tetraploidChenopodiumsect.Chenopodiumsubsect.Cellulata.Systematic Bot 6: 380–398.
Wilson, H.D. & C.B. Heiser, 1979. The origin and evolutionaryrelationships of ‘Huazontte’ (Chenopodium nuttalliaeSafford),domesticated chenopod of Mexico. Amer J Bot 66: 198–206.
Wilson, H. & J. Manhart, 1993. Crop/weed gene flow:Chenopodium quinoaWilld. and C. berlandieri Moq. TheorAppl Genet 86: 642–648.
euph4774.tex; 4/11/1998; 13:46; p.8


