Embed Size (px)
Citation preview
This Provisional PDF corresponds to the article as it appeared upon acceptance. Copyedited andfully formatted PDF and full text (HTML) versions will be made available soon.
The role of transposable elements in the evolution of non-mammalianvertebrates and invertebrates
Genome Biology 2010, 11:R59 doi:10.1186/gb-2010-11-6-r59
Noa Sela ([email protected])Eddo Kim ([email protected])
Gil Ast ([email protected])
ISSN 1465-6906
Article type Research
Submission date 17 March 2010
Acceptance date 2 June 2010
Publication date 2 June 2010
Article URL http://genomebiology.com/2010/11/6/R59
This peer-reviewed article was published immediately upon acceptance. It can be downloaded,printed and distributed freely for any purposes (see copyright notice below).
Articles in Genome Biology are listed in PubMed and archived at PubMed Central.
For information about publishing your research in Genome Biology go to
http://genomebiology.com/info/instructions/
Genome Biology
© 2010 Sela et al. , licensee BioMed Central Ltd.This is an open access article distributed under the terms of the Creative Commons Attribution License (http://creativecommons.org/licenses/by/2.0),
which permits unrestricted use, distribution, and reproduction in any medium, provided the original work is properly cited.
1
The role of transposable elements in the evolution of non-mammalian
vertebrates and invertebrates
Noa Sela1,2
, Eddo Kim1
and Gil Ast1
1Department of Human Molecular Genetics, Sackler Faculty of Medicine, Tel Aviv
University, Tel Aviv 69978, Israel
2 Currently at the Department Biology I, Ludwig-Maximilians-University Munich
(LMU) Großhaderner Str. 2, D-82152, Planegg-Martinsried, Germany
Correspondence should be addressed to Gil Ast:
Emails:
2
Abstract
Background: Transposable elements (TEs) have played an important role in the
diversification and enrichment of mammalian transcriptomes through various
mechanisms such as exonization and intronization (the birth of new exons/introns
from previously intronic/exonic sequences, respectively), and insertion into first and
last exons. However, no extensive analysis has compared the effects of TEs on the
transcriptomes of mammalian, non-mammalian vertebrates and invertebrates.
Results: We analyzed the influence of TEs on the transcriptomes of five species,
three invertebrates and two non-mammalian vertebrates. Compared to previously
analyzed mammals, there were lower levels of TE introduction into introns,
significantly lower numbers of exonizations originating from TEs and a lower
percentage of TE insertion within the first and last exons. Although the transcriptomes
of vertebrates exhibit a significant level of exonizations of TEs, only anecdotal cases
were found in invertebrates. In vertebrates, as in mammals, the exonized TEs are
mostly alternatively spliced, indicating selective pressure maintains the original
mRNA product generated from such genes.
Conclusions: Exonization of TEs is wide-spread in mammals, less so in non-
mammalian vertebrates, and very low in invertebrates. We assume that the
exonization process depends on the length of introns. Vertebrates, unlike
invertebrates, are characterized by long introns and short internal exons. Our results
suggest that there is a direct link between the length of introns and exonization of TEs
and that this process became more prevalent following the appearance of mammals.
3
Background
Transposable elements (TEs) are mobile genetic sequences that comprise a large
fraction of mammalian genomes: 45%, 37% and 55% of the human, mouse and
opossum genomes are made up of these elements, respectively [1-6]. TEs are
distinguished by their mode of propagation. Short interspersed repeat elements
(SINEs), long interspersed repeat elements (LINEs) and retrovirus-like elements with
long-terminal repeats (LTRs) are propagated by reverse transcription of an RNA
intermediate. In contrast, DNA transposons move through a direct ‘cut-and-paste’
mechanism [7]. TEs are not just "junk" DNA but rather are important players in
mammalian evolution and speciation through mechanisms such as exonization and
intronization [8-11]. Alternative splicing of exonized TEs can be tissue specific [12,
13] and exonization contributes to the diversification of genes after duplication [14].
Most exonized TEs are alternatively spliced, which allows the enhancement of
transciptomic and proteomic diversity while maintaining the original mRNA product
[9-11, 15, 16]. Exonization can take place following insertion of a TE into an intron.
However, the majority of invertebrate introns are relatively short [17] and are under
selection to remain as such due to the intron definition mechanism by which they are
recognized [18-21]. Thus, there is presumably a selection against TE insertion into
such introns. However, with the presumed transition from intron to exon definition
during evolution [20, 22], introns were freed from length constraints. This reduced the
selection against insertion of TE into introns and a large fraction of mammalian
introns contain TEs, although only a small fraction are exonized [16]. For the most
part, TEs have not been inserted within internal coding exons; they are found in first
4
and last exons and in untranslated regions (UTRs), apparently the outcome of coding
constraints [16].
The impact of TEs on the genomes of human [8-11, 16, 23-26], dog [4, 5], cow [3],
mouse [16] and opossum [6, 27] has been extensively studied. Bejerano and
colleagues have shown that SINE elements that were active in non-mammalian
vertebrates during the Silurian period are the source of ultra-conserved elements
within mammalian genomes [28]. However, with this exception there have been no
systematic large-scale analyses of the impact of TEs on the transcriptomes of non-
mammalian genomes. To address this issue we compiled a dataset of all TE families
in the genomes of chicken (Gallus gallus), zebrafish (Danio rerio), sea squirt (Ciona
intestinalis), fruit fly (Drosophila melanogaster) and nematode (Caenorhabditis
elegans). We examined the location of each TE with respect to annotated genes. We
found that the percentage of TEs within transcribed regions of these non-mammalian
vertebrates and invertebrates is much lower than the percentage observed within
mammals. We also found evidence for TE exonization in all species we examined.
However, the magnitude of this process differed among the tested organisms; we
detected a substantially higher level of exonizations in vertebrates (G. gallus and D.
rerio) compared to invertebrates (D. melanogaster and C. elegans). There is a higher
abundant of TEs in intronic sequences and introns are much larger in vertebrates than
in invertebrates, suggesting that TEs located in long introns provide fertile ground for
testing new exons via the exonization process. Overall, the results we present suggest
that TE exonization is a mechanism for transcriptome enrichment not only in
mammals, but also in non-mammalian vertebrates as well as in invertebrates, albeit to
a lesser extent.
5
Results
Genome-wide analysis of TE insertions within the transcriptomes of five non-
mammalian species
To evaluate the effect of TEs on the transcriptomes of non-mammals, we analyzed the
genomes of five non-mammalian vertebrates and invertebrates: Gallus gallus, Danio
rerio, Ciona intestinalis, Drosophila melanogaster and Caenorhabditis elegans. To
calculate the total number of TEs in each genome, the number of TEs in introns, and
the number of TEs present within mRNA molecules, we downloaded EST and cDNA
alignments and repetitive element annotations for these five genomes from the
University of California Santa Cruz (UCSC) genome browser [24] (see Materials and
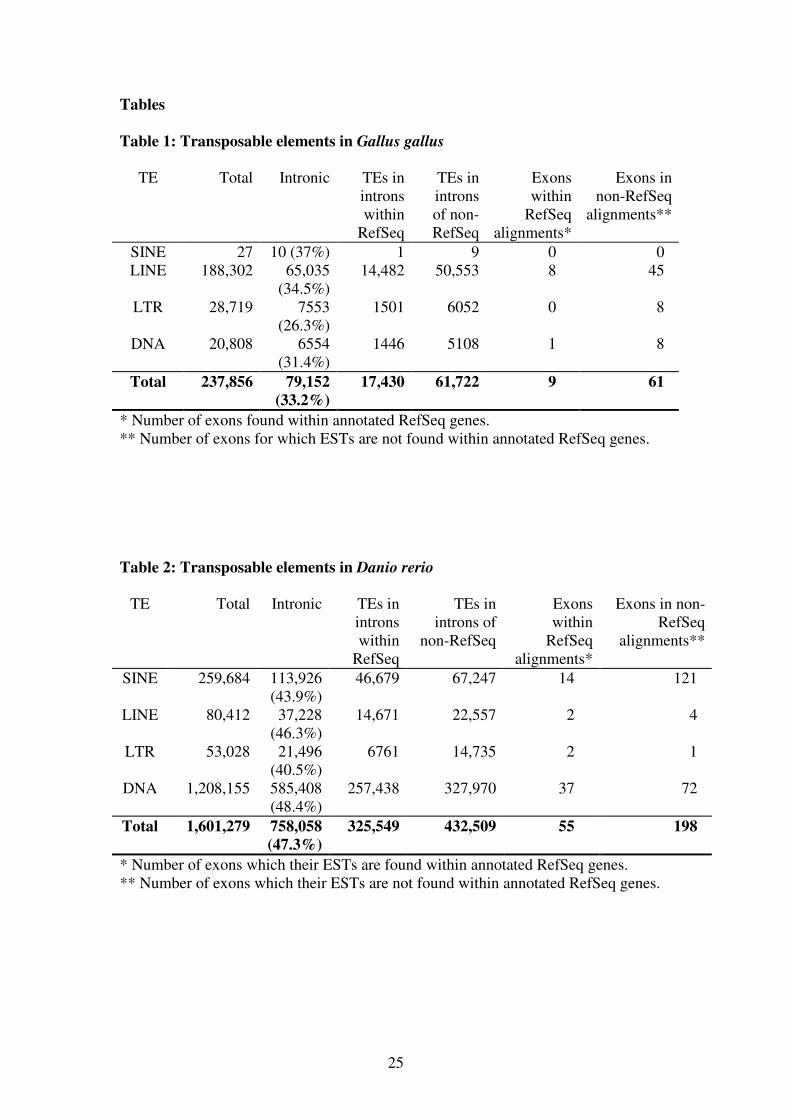
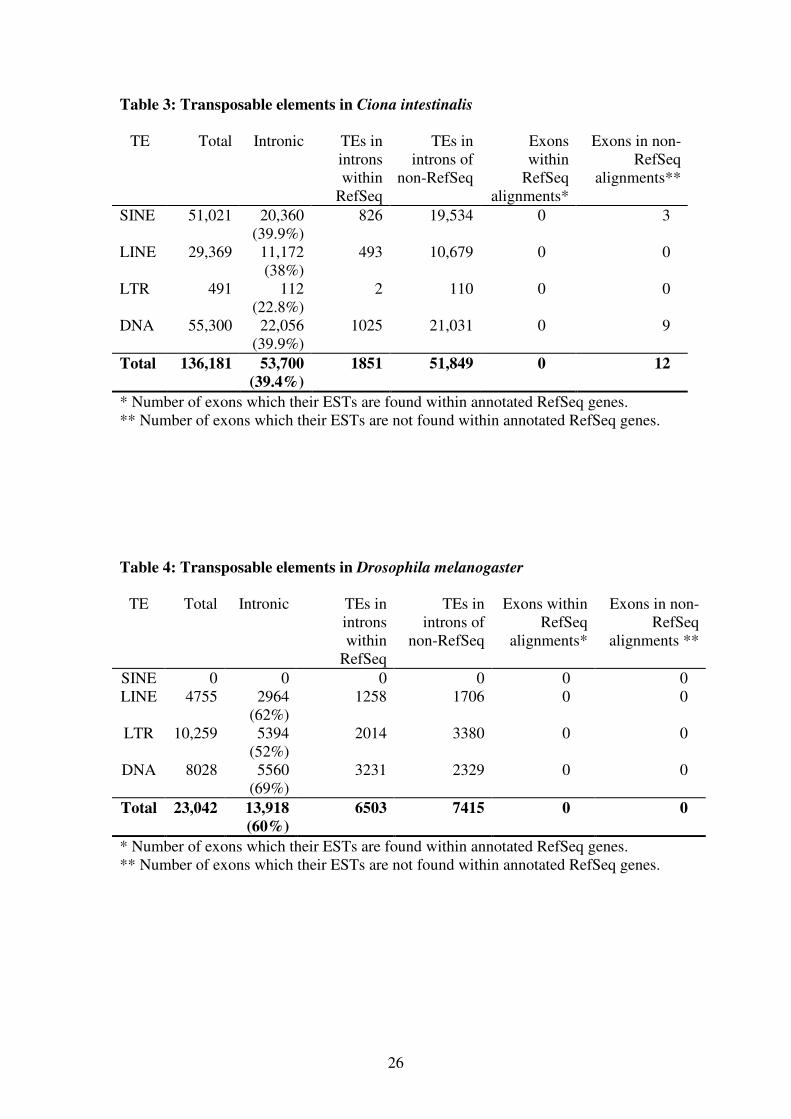
Methods and also [29]). Tables 1, 2, 3, 4 and 5 summarize our analyses for each of
these species.
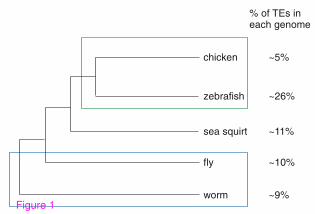
TEs have altered the transcriptomes of mammals and the examined non-mammalian
genomes differently. First, the portion of the genome covered by TEs differs
dramatically. In mammalian genomes, TEs occupy between 37% and 52% of the
genome [1-6, 30]. In the five evaluated non-mammalian genomes, TEs account for
approximately 10% of the genome sequence, with the exception of Danio rerio,
where TEs occupy 26.5% (Figure 1). The second important difference is related to the
types of TEs observed. In mouse and human, SINEs are the most abundant TEs. In the
Gallus gallus genome, LINEs (belonging to the family of CR1 repeats) account for
79% of all TEs. In the Danio rerio genome, more than 75% of TEs are DNA
transposons; whereas in D. melanogaster, LTRs are the most abundant TEs
accounting for 44% of the elements observed. Finally, DNA transposons account for
6
95% of TEs in C. elegans. These differences have influenced the transcriptomes of
non-mammals: in contrast to SINEs, which are non-autonomous mobile elements that
do not encode for proteins, all other families of TEs are autonomous and contain at
least one open reading frame.
Insertion of TEs within intronic sequences
Deeper analysis of the non-mammalian genomes revealed that TEs are less likely to
be fixed within transcribed regions relative to orthologous regions in human and
mouse [16]. In Gallus gallus, Danio rerio and Ciona intestinalis, 33.2%, 47.3% and
39.4% of TEs reside within introns, respectively, whereas in the human genome,
~60% of TEs reside within introns [16] (χ2, p-value = 0, for a comparison of TEs
either in Gallus gallus, Danio rerio, or Ciona intestinalis, versus human). In the
genome of Drosophila melanogaster, the fraction of intronic TEs is 60%, similar to
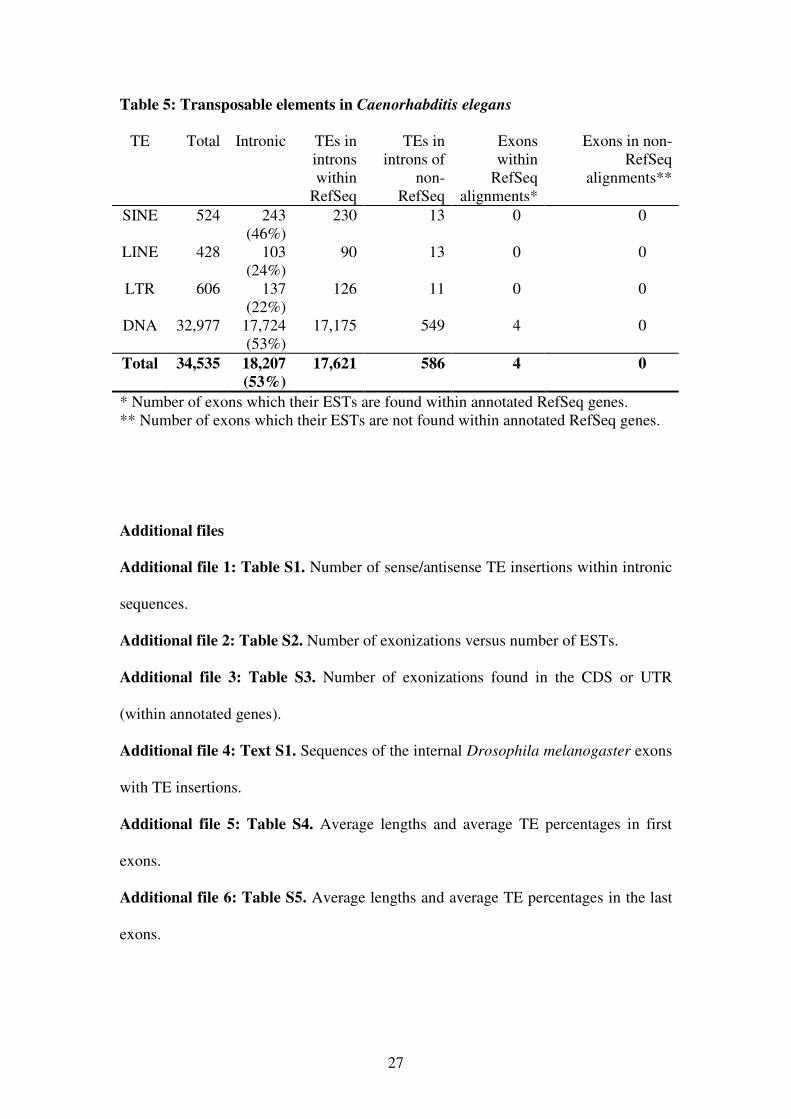
that of mammals (χ2, p-value = 0.3 compared with human); in C. elegans 53% of TEs
reside within intronic sequences, significantly lower compared to human (χ2, p-value
= 1.1e-42). Among all TEs, LTRs have the lowest insertion levels within intronic
sequences compared to other TE families in all genomes analyzed (Tables 1, 2, 3, 4,
and 5) as was also observed for human and mouse [16]. The lower level of invasion of
TEs within intronic sequences in D. melanogaster may be due in part to the fact that a
large fraction of TEs in Drosphila are LTR sequences that have a lower tendency
than other TE families to reside within introns [16, 31].
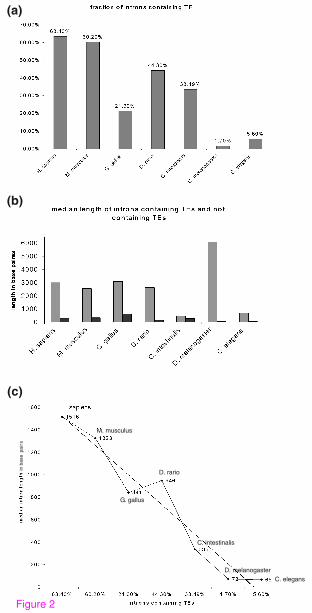
We next evaluated the TE distribution and determined the length of introns that
contain TEs (Figure 2). We analyzed all intronic sequences of human (total of
184,145 introns), mouse (total of 177,766 introns), Gallus gallus (total of 167,626
7
introns), Danio rerio (total of 194,221 introns), Ciona intestinalis (total of 34,328
introns), Drosophila melanogaster (total of 41,145 introns) and C. elegans (total of
98,695 introns) for TE insertions to determine the percentage of TE-containing introns
(Figure 2A). The fraction of the introns that contain TEs in the non-mammalian
vertebrates Gallus gallus and Danio rerio is 21.3% and 44.3%, respectively,
substantially lower than that of mammals (63.4% and 60.2% in human and mouse,
respectively). The fraction of introns containing TEs in the deuterostome C.
intestinalis is 33.4%, very similar to the percentage in non-mammalian vertebrates. In
contrast, the fraction of introns that contain TEs in invertebrates Drosophila
melanogaster and C. elegans is 1.7% and 5.6%, respectively. These results indicate
that only a very small portion of introns in invertebrates contain TEs (2-5%)
compared to 20-40% of introns in non-mammalian vertebrates and ~60% in
mammals.
We also examined the average length of introns containing TEs. In C. elegans the
median length of an intron containing a TE is ~700 bp (after subtracting TE length,
the median intron size is 477 bp), compared to ~3000 bp in human, mouse, chicken
and zebrafish. The median length of introns that contain TEs in the fruit fly is around
6000 bp (after subtracting the TE length, the median intron length is 5822 bp),
whereas the median length of introns in fruit fly is only 72 bp [17] (Figure 2B and
2C). Therefore, the introns in fruit fly that contain TEs are presumably under different
selective pressure than the vast majority of introns in this organism; we assume that
these TE-containing introns are not selected via the intron definition mechanism [19].
In general, we found a positive correlation between the fraction of introns containing
8
TEs and median length of introns (Figure 2C), implying that TE insertions have
played a role in the evolution of intron size.
Previous analysis of human and mouse transcriptomes revealed that there is a biased
insertion and fixation of some families of TEs within intronic sequences [16]: L1 and
LTRs are most often fixed in their antisense orientation relative to the mRNA
molecule. Our current analysis also revealed a bias toward antisense fixations of LTR
sequences within G. gallus, D. rerio and D. melanogaster genomes (Supplementary
table S1 in Additional file 1). This biased insertion is also correlated with a lower
tendency of LTRs to reside within intronic sequences relative to other families of TEs
(see Tables 1, 2, 3, 4 and 5 for data on non-mammalian genomes and [16] for data on
human and mouse). A bias toward antisense orientation was also observed for DNA
transposons in G. gallus and D. melanogaster and for LINEs in D. melanogaster.
These biased insertions are presumably due to potential for co-transcription of TEs
that already contain coding sequences. Insertion in a sense orientation would
introduce another promoter into the transcribed region, which is likely to be
deleterious and therefore selected against.
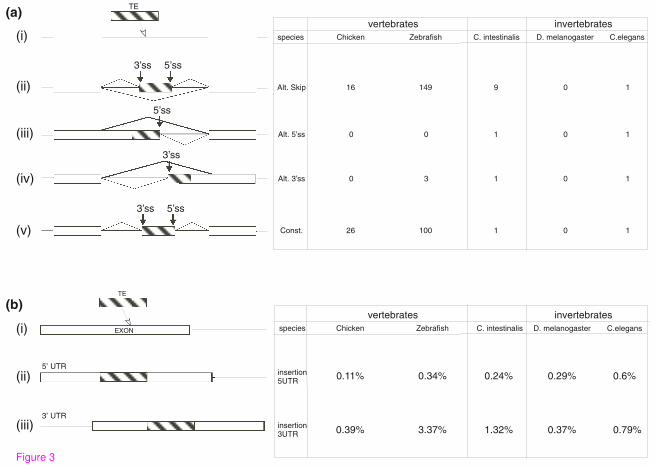
Exonizations within vertebrates and invertebrates
In mammals, new exonizations resulting from TEs are mostly alternatively spliced
cassette exons [10, 11, 15, 16, 26, 32, 33]. In non-mammalian genomes, the level of
alternative splicing is lower than that of mammals, with the exception of chicken
where levels of alternative splicing are comparable to those in human [34]. We
analyzed the splicing patterns of the TE-derived exons in the four non-mammalian
species that contain TE-derived exons; the analysis was based on alignment data
9
between EST/cDNA sequences and their corresponding genomic regions. The TE-
derived exons in Danio rerio, C. intestinalis and C. elegans were predominantly
alternatively spliced (Figure 3), a phenomenon similar to that found in mammals,
suggesting that similar evolutionary constraints (reviewed in [22, 26, 35]) affect
exonizations of mammals and species outside the mammalian class. In D.
melanogaster, there are no exonized TEs in which one of the splice site results from
the TE sequence. G. gallus is an exception: In this species many TE exonizations
were constitutively spliced. However, this observation may be a result of a
substantially lower number of ESTs available for G. gallus (Supplementary table S2
in Additional file 2). Without sufficient EST data, identification of alternatively
spliced exons is difficult and exons may be mistakenly classified as constitutively
spliced. We will need to re-evaluate this statement once additional EST coverage
becomes available for G. gallus.
The majority of TE exonizations occur in genomic loci that are not annotated as genes
by the RefSeq [36, 37] or Ensembl [38, 39] databases. It may be that these genes are
species-specific and are not annotated due to a lack of homologs; alternatively, these
may be non-protein coding genes. Of the exonizations found in annotated genes, 66-
87% are found within the coding sequence (Supplementary table S3 in Additional file
3). Exonizations in non-mammals frequently disrupted the open reading frame of a
protein, similar to results previously reported for human and mouse. In G. gallus, D.
rerio and C. intestinalis only 38% to 50% of the exonized TEs have lengths divisible
by three and therefore maintain the original coding sequence (Supplementary table S3
in Additional file 3).
10
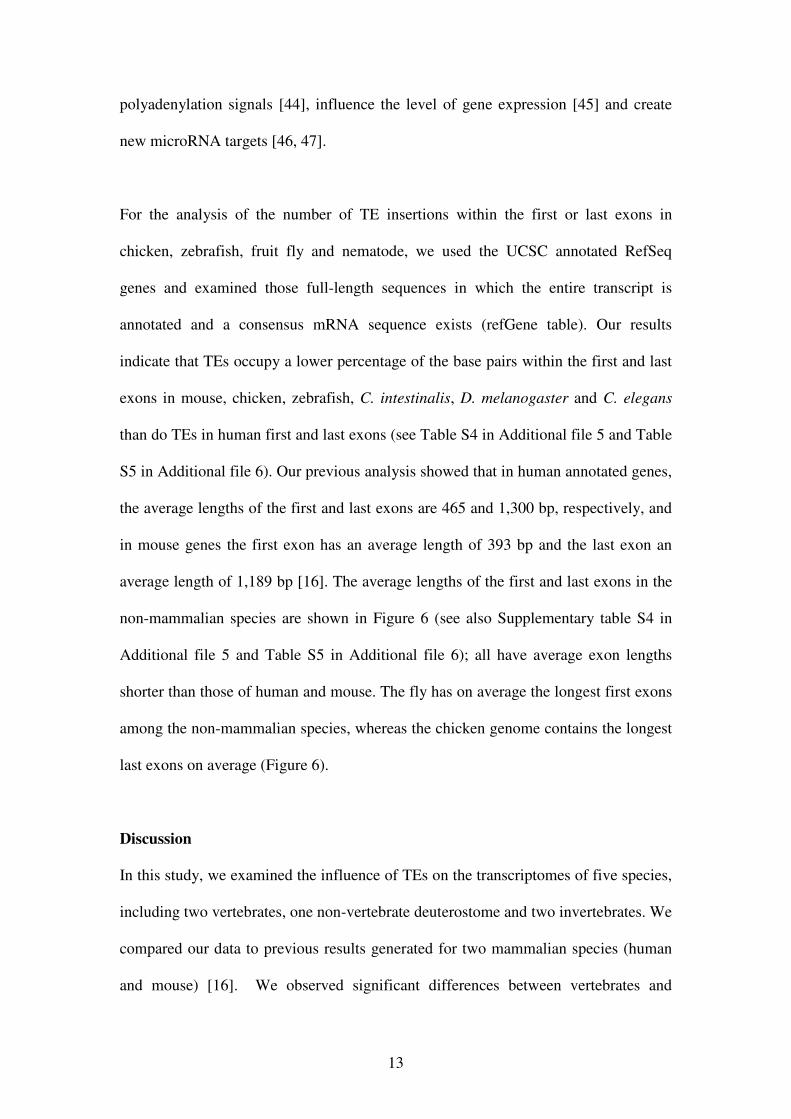
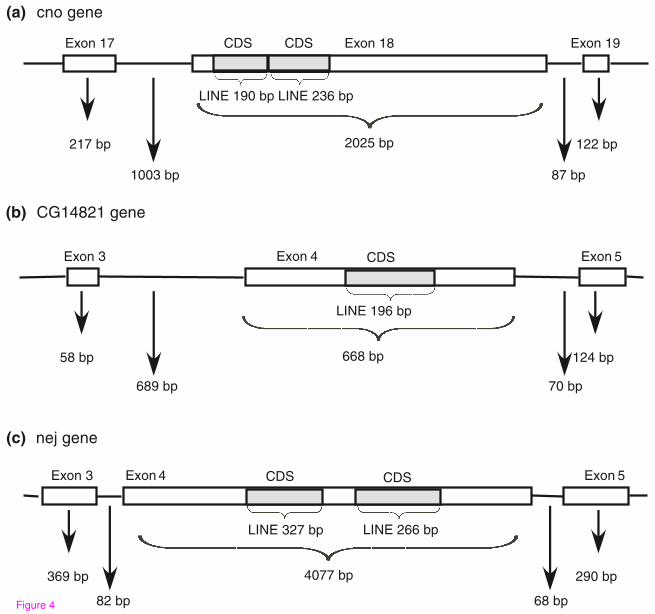
In D. melanogaster, we found no evidence for exonizations using current ESTs or
cDNA. We did identify three cases in which TEs were inserted into internal exons, all
within the coding sequence (see Figure 4, and also Supplementary text S1 in
Additional file 4 for exon sequences). In these cases, the length of the inserted TEs
(LINEs) was found to be divisible by three and the sequences did not contain stop
codons. Thus, the insertion of these TEs into the coding exons did not alter the
reading frame of the downstream exons, but rather added new amino acid sequence to
the proteins. These insertions result in extremely long exons (668, 2025 and 4077 bp).
One of these exons is flanked by very short introns (82 and 68 bp for the upstream
and downstream introns, Figure 4C) and two are flanked by a short downstream intron
and a long upstream intron (85 and 70 bp for the downstream introns and 1003 and
689 bp for the upstream introns, Figure 4 A and B). In mammals, no evidence was
found for TE insertions into coding exons [15, 16]. We assume that this difference
between mammals and Drosophila is due to the fact that in D. melanogaster the
intron definition mechanism is dominant, which allows the lengthening of exons in a
short-intron environment [19].
We have recently shown evidence for transduplication of protein coding genes within
DNA transposons in C. elegans [40]. In this analysis, we found that DNA transposons
have also influenced the coding sequence of C. elegans genes by means of
exonization. One such example is an alternatively spliced exon of 73 bp in the CDS
of a hypothetical protein (Y71G12A.2). The accession number of the RefSeq
sequence that contains the exonization is [NM_058514]; the accession number of the
RefSeq sequence without the exonization is [NM_001129082] (both RefSeq mRNA
sequences have been reviewed). The gene is conserved within nematodes (C. remanei,
11
C. briggsae, C. brenneri and C. japonica). It should be noted that only a single C.
elegans individual has been sequenced and this event might be restricted to this
individual. However, this event does suggest that an exonization mechanism operates
in nematodes.
New exonizations resulting from TEs were found in non-vertebrate deuterostome C.
intestinalis (9 exonizations, Table 3) and in much larger quantities in vertebrates (70
in G. gallus and 253 in D. rerio, Tables 1 and 2, respectively). The number of
exonizations was not directly correlated to the number of ESTs available for each
genome, suggesting that our results reflect a true difference in the extent of
exonization across organisms. There are 599,785 ESTs for G. gallus, 1,380,071 ESTs
for D. rerio, 1,205,674 ESTs for C. intestinalis, 573,981 ESTs for D. melanogaster
and 352,044 ESTs for C. elegans (Table S4 in Additional file 5). The majority of
exonizations found in G. gallus result from the CR1 LINE element, which is the most
abundant TE within the G. gallus genome.
In the zebrafish genome, like that of mammals, the most abundant TEs are SINE
elements. About 68% (77,436 copies) of zebrafish TEs are intronic SINEs that belong
to the HE1 family of SINEs; these HE1 SINEs comprise almost 10% of the zebrafish
genome [41]. The HE1 are tRNA-derived SINEs with a consensus sequence of 402 bp
long found also in elasmobranches (the subclass of cartilaginous fish) [42]. The HE1
family is the oldest known family of SINEs, dated to 200 million years ago [42]. The
HE1 SINEs were previously shown to be the source of mutational activity in the
zebrafish genome and have been used as a tool for characterization of zebrafish
populations [41]. SINEs have resulted in a substantial number of new exons (135
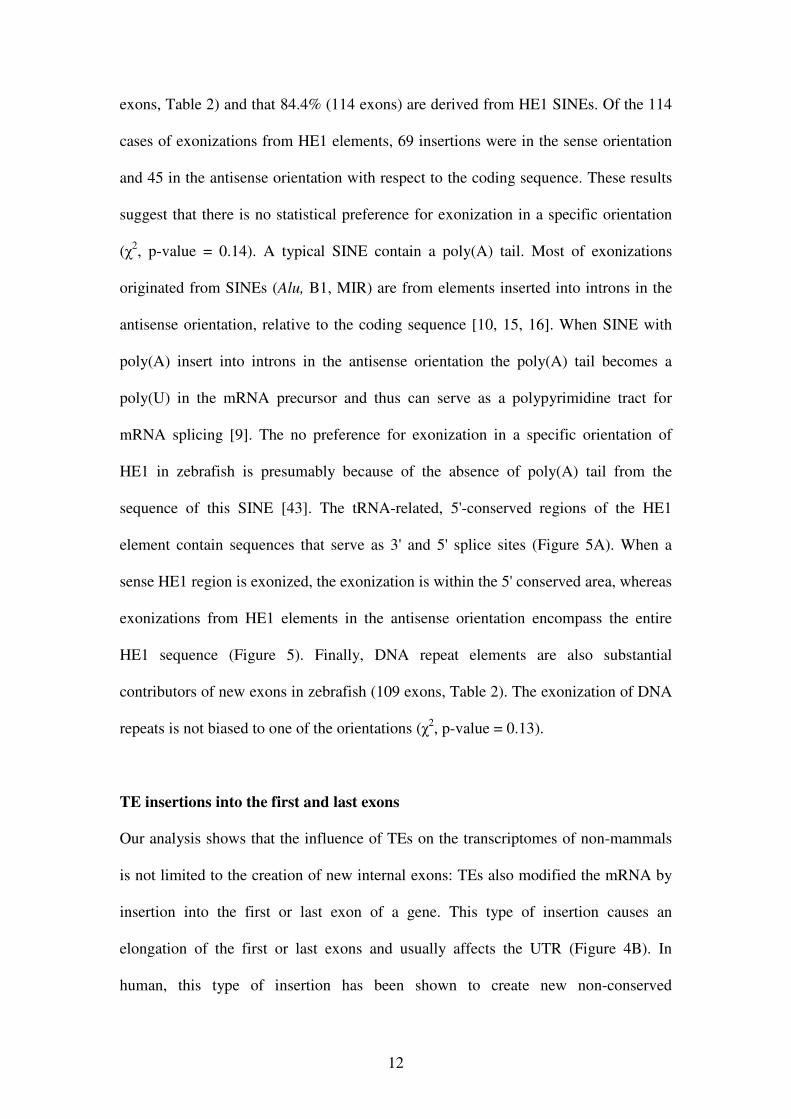
12
exons, Table 2) and that 84.4% (114 exons) are derived from HE1 SINEs. Of the 114
cases of exonizations from HE1 elements, 69 insertions were in the sense orientation
and 45 in the antisense orientation with respect to the coding sequence. These results
suggest that there is no statistical preference for exonization in a specific orientation
(χ2, p-value = 0.14). A typical SINE contain a poly(A) tail. Most of exonizations
originated from SINEs (Alu, B1, MIR) are from elements inserted into introns in the
antisense orientation, relative to the coding sequence [10, 15, 16]. When SINE with
poly(A) insert into introns in the antisense orientation the poly(A) tail becomes a
poly(U) in the mRNA precursor and thus can serve as a polypyrimidine tract for
mRNA splicing [9]. The no preference for exonization in a specific orientation of
HE1 in zebrafish is presumably because of the absence of poly(A) tail from the
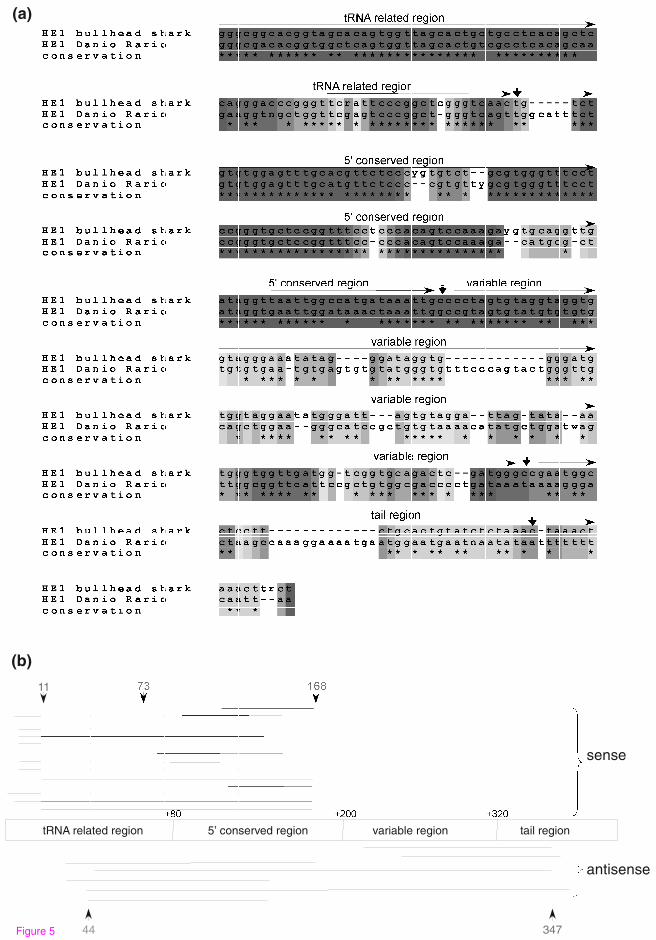
sequence of this SINE [43]. The tRNA-related, 5'-conserved regions of the HE1
element contain sequences that serve as 3' and 5' splice sites (Figure 5A). When a
sense HE1 region is exonized, the exonization is within the 5' conserved area, whereas
exonizations from HE1 elements in the antisense orientation encompass the entire
HE1 sequence (Figure 5). Finally, DNA repeat elements are also substantial
contributors of new exons in zebrafish (109 exons, Table 2). The exonization of DNA
repeats is not biased to one of the orientations (χ2, p-value = 0.13).
TE insertions into the first and last exons
Our analysis shows that the influence of TEs on the transcriptomes of non-mammals
is not limited to the creation of new internal exons: TEs also modified the mRNA by
insertion into the first or last exon of a gene. This type of insertion causes an
elongation of the first or last exons and usually affects the UTR (Figure 4B). In
human, this type of insertion has been shown to create new non-conserved
13
polyadenylation signals [44], influence the level of gene expression [45] and create
new microRNA targets [46, 47].
For the analysis of the number of TE insertions within the first or last exons in
chicken, zebrafish, fruit fly and nematode, we used the UCSC annotated RefSeq
genes and examined those full-length sequences in which the entire transcript is
annotated and a consensus mRNA sequence exists (refGene table). Our results
indicate that TEs occupy a lower percentage of the base pairs within the first and last
exons in mouse, chicken, zebrafish, C. intestinalis, D. melanogaster and C. elegans
than do TEs in human first and last exons (see Table S4 in Additional file 5 and Table
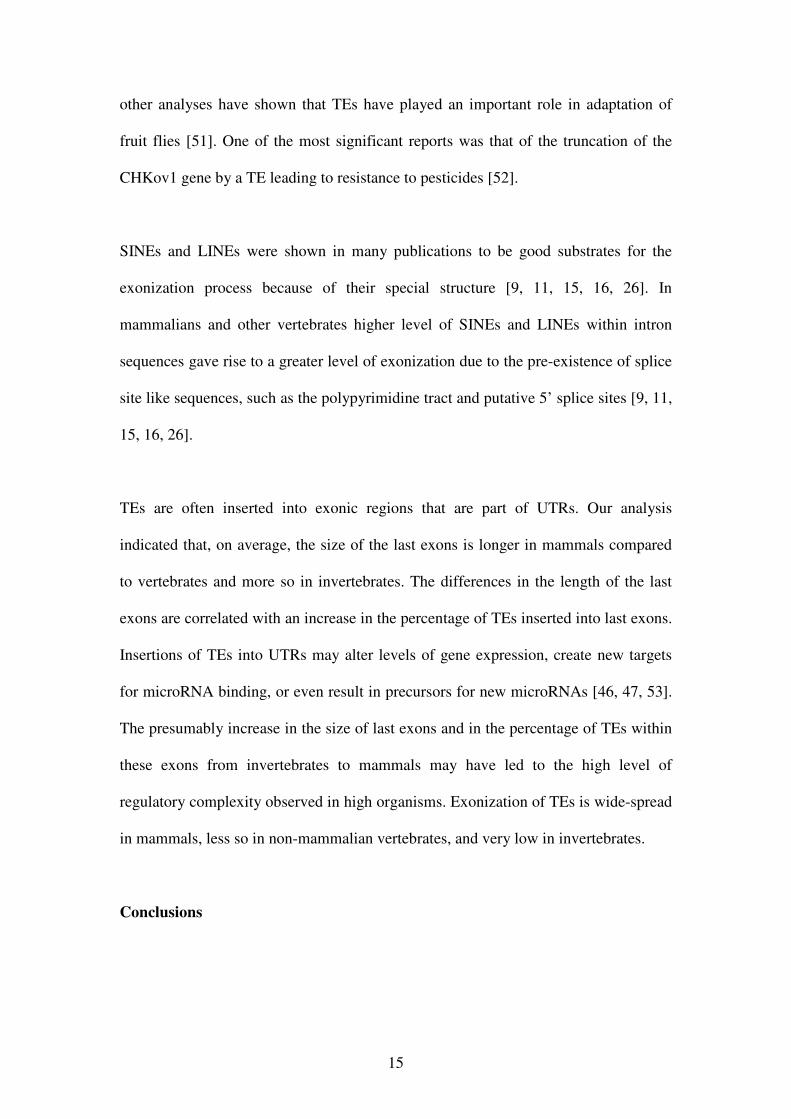
S5 in Additional file 6). Our previous analysis showed that in human annotated genes,
the average lengths of the first and last exons are 465 and 1,300 bp, respectively, and
in mouse genes the first exon has an average length of 393 bp and the last exon an
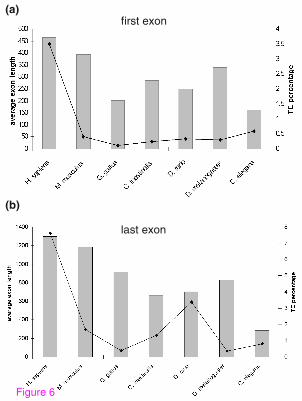
average length of 1,189 bp [16]. The average lengths of the first and last exons in the
non-mammalian species are shown in Figure 6 (see also Supplementary table S4 in
Additional file 5 and Table S5 in Additional file 6); all have average exon lengths
shorter than those of human and mouse. The fly has on average the longest first exons
among the non-mammalian species, whereas the chicken genome contains the longest
last exons on average (Figure 6).
Discussion
In this study, we examined the influence of TEs on the transcriptomes of five species,
including two vertebrates, one non-vertebrate deuterostome and two invertebrates. We
compared our data to previous results generated for two mammalian species (human
and mouse) [16]. We observed significant differences between vertebrates and
14
invertebrates regarding the exonizations that have resulted from TE insertion. In
chicken and zebrafish, we found dozens of exonizations: 70 exons were a result of TE
insertions in G. gallus and 153 in D. rerio. Lower on the evolutionary tree, TEs were
much less frequently exonized, if at all. In the deuterostome C. intestinalis, we found
only 12 exons that resulted from TEs and none were observed in D. melanogaster and
C. elegans.
The prevalence of exonizations within human and mouse (around 1800 new exons in
human and around 500 new exons in mouse [16]) is mainly attributed to the existence
of very large introns and the dominance of the exon definition mechanism for splice
site selection in mammals [48]. Invertebrates, in contrast, have short introns and long
exons [17]. The transition from the intron definition mechanism used by invertebrates
to that of exon definition during evolution presumably reduced selective pressure on
intron length, which probably allowed insertion of TEs into intron sequences without
deleterious consequences [48, 49]. As could be expected due to the difference in the
length of introns, the numbers of TEs located in intron sequences is substantially
lower in the non-mammalian genomes compared to mammalian genomes. One might
expect that in organisms where the splicing machinery functions via the intron
definition mechanism, insertion of TEs into the longer coding exons would be
prevalent. However, only three cases of such insertions were detected in the D.
melanogaster genome, suggesting that this mechanism of transcriptome enrichment is
evolutionary unfavorable. It is likely that TE insertions into coding exons are not
propagated as these events would alter the coding sequence immediately upon
insertion. A previous genome-wide analysis of TEs in Drosophila and their
association with gene location found a small number of fixed TEs [50]. However
15
other analyses have shown that TEs have played an important role in adaptation of
fruit flies [51]. One of the most significant reports was that of the truncation of the
CHKov1 gene by a TE leading to resistance to pesticides [52].
SINEs and LINEs were shown in many publications to be good substrates for the
exonization process because of their special structure [9, 11, 15, 16, 26]. In
mammalians and other vertebrates higher level of SINEs and LINEs within intron
sequences gave rise to a greater level of exonization due to the pre-existence of splice
site like sequences, such as the polypyrimidine tract and putative 5’ splice sites [9, 11,
15, 16, 26].
TEs are often inserted into exonic regions that are part of UTRs. Our analysis
indicated that, on average, the size of the last exons is longer in mammals compared
to vertebrates and more so in invertebrates. The differences in the length of the last
exons are correlated with an increase in the percentage of TEs inserted into last exons.
Insertions of TEs into UTRs may alter levels of gene expression, create new targets
for microRNA binding, or even result in precursors for new microRNAs [46, 47, 53].
The presumably increase in the size of last exons and in the percentage of TEs within
these exons from invertebrates to mammals may have led to the high level of
regulatory complexity observed in high organisms. Exonization of TEs is wide-spread
in mammals, less so in non-mammalian vertebrates, and very low in invertebrates.
Conclusions
16
Our results suggest that there is a direct link between the length of introns and
exonization of TEs and that this process became more prevalent following the
appearance of mammals.
Materials and methods
Dataset of TEs within coding regions of five species
Chicken (galGal3, May 2006), zebrafish (danRer4, March 2006), fruit fly (dm2, April
2004), C. elegans (ce2, March 2004) and sea squirt (ci2, March 2005) genome
assemblies were downloaded, along with their annotations, from the UCSC genome
browser database [24, 54]. EST and cDNA mappings were obtained from
chrN_intronEST and chrN_mrna tables, respectively. TE mappings data were
obtained from chrN_rmsk tables and TE sequences were retrieved from genomic
sequences using the mapping data. A TE was considered intragenic if there was no
overlap with ESTs or cDNA alignments; it was considered intronic if it was found
within an alignment of an EST or cDNA defined as an intronic region. Finally, a TE
was considered exonized if it was found within an exonic part of an EST or cDNA
(except the first or last exon of the EST/cDNA), and possessed canonical splice sites.
Next, we associated the intronic and exonized TEs with genomic positions of protein-
coding genes by comparisons with RefSeq [55] gene tables from the UCSC table
browser [54]. Positions of the TE hosting intron/exon and the mature mRNA were
calculated using the gene tables. Association of the gene to the mRNA and protein
accessions and to descriptions from RefSeq and Swiss-Prot was done through the
kgXref and refLink tables in the UCSC genome browser database [54]. All data used
has been published [22, 29].
17
Analysis of retroelement insertions within the first and last exons and assessment
of untranslated region fraction in known genes
The tables refGene and refLink were used to examine the relative lengths of the UTRs
and the coding sequences (CDSs) within chicken, zebrafish, sea squirt, fruit fly and
nematode genes and to find the first and last exons. The analysis of TE content was
done using the RepeatMasker software [38] and repbase [56, 57].
Estimation of the fraction of TEs within introns
We determined the TE fraction within intronic sequences using the UCSC genome
browser and GALAXY [54, 58, 59]. Introns of chicken (G. gallus, Build 1.1),
zebrafish (D. rerio, release Zv4), C. elegans (Release 2003) and D. melanogaster
(Build 4.1) were extracted from the Exon-Intron Database [60], [61]. When
alternatively spliced isoforms of the same gene were present, only the first annotated
isoform was extracted; all other isoforms were excluded in order to avoid redundancy.
The analysis of the TE content was done using RepeatMasker software and repbase
[56, 57]. In the case of C. intestinalis, the analysis of 34,328 intronic sequences was
done using the GALAXY server [59] and UCSC genome browser tables [54].
Statistical analysis
For the comparative analysis of insertions within introns of various species we used a
contingency table χ2 test. In cases where the contingency table was a 2×2 table, the
Fisher's exact test was used. To assess the tendency of exonizations to occur within
UTRs we used the goodness-of-fit χ2 test. The null hypothesis was the fraction of the
UTR and CDS within the RefSeq gene list of chicken, zebrafish, sea squirt, fruit fly
18
and C. elegans. The calculation of p values for differences between two populations
was measured according to the data distribution. The Kolmogorov-Smirnov test was
used to test for normal distribution. The t-test was used to calculate statistical
differences.
Abbreviations
TE: transposable element; LTR: long interspersed repeat; SINE: short interspersed
element; LINE: long interspersed element; MIR: mammalian interspersed repeat;
CDS: coding sequence; UTR: untranslated region; EST: Expressed sequence tag;
cDNA: complementary DNA; Refseq: reference sequence.
Authors’ contributions
NS carried out the computational analysis. NS and GA conceived of the study. EK
gave professional advice regarding interpretation of results. NS, EK and GA drafted
the manuscript.
Acknowledgments
The authors thank Wojciech Makalowski and Gyorgy Abrusan for stimulating
discussions. This work was supported by the Cooperation Program in Cancer
Research of the Deutsches Krebsforschungszentrum (DKFZ) and Israel’s Ministry of
Science and Technology (MOST) and by a grant from the Israel Science Foundation
(40/05), ICRF, DIP and EURASNET. NS is supported by the LMU excellence
fellowship.
19
References
1. Lander ES, Linton LM, Birren B, Nusbaum C, Zody MC, Baldwin J, Devon
K, Dewar K, Doyle M, FitzHugh W, Funke R, Gage D, Harris K, Heaford A,
Howland J, Kann L, Lehoczky J, LeVine R, McEwan P, McKernan K,
Meldrim J, Mesirov JP, Miranda C, Morris W, Naylor J, Raymond C, Rosetti
M, Santos R, Sheridan A, Sougnez C, et al: Initial sequencing and analysis
of the human genome. Nature 2001, 409:860-921.
2. Waterston RH, Lindblad-Toh K, Birney E, Rogers J, Abril JF, Agarwal P,
Agarwala R, Ainscough R, Alexandersson M, An P, Antonarakis SE, Attwood
J, Baertsch R, Bailey J, Barlow K, Beck S, Berry E, Birren B, Bloom T, Bork
P, Botcherby M, Bray N, Brent MR, Brown DG, Brown SD, Bult C, Burton J,
Butler J, Campbell RD, Carninci P, Cawley S, et al: Initial sequencing and
comparative analysis of the mouse genome. Nature 2002, 420:520-562.
3. Almeida LM, Silva IT, Silva WA, Jr., Castro JP, Riggs PK, Carareto CM,
Amaral ME: The contribution of transposable elements to Bos taurus gene
structure. Gene 2007, 390:180-189.
4. Wang W, Kirkness EF: Short interspersed elements (SINEs) are a major
source of canine genomic diversity. Genome Res 2005, 15:1798-1808.
5. Cordaux R, Batzer MA: Teaching an old dog new tricks: SINEs of canine
genomic diversity. Proc Natl Acad Sci U S A 2006, 103:1157-1158.
6. Gentles AJ, Wakefield MJ, Kohany O, Gu W, Batzer MA, Pollock DD, Jurka
J: Evolutionary dynamics of transposable elements in the short-tailed
opossum Monodelphis domestica. Genome Res 2007, 17:992-1004.
7. Hedges DJ, Batzer MA: From the margins of the genome: mobile elements
shape primate evolution. Bioessays 2005, 27:785-794.
8. Deininger PL, Batzer MA: Mammalian retroelements. Genome Res 2002,
12:1455-1465.
9. Lev-Maor G, Sorek R, Shomron N, Ast G: The birth of an alternatively
spliced exon: 3' splice-site selection in Alu exons. Science 2003, 300:1288-
1291.
10. Sorek R, Ast G, Graur D: Alu-containing exons are alternatively spliced.
Genome Res 2002, 12:1060-1067.
11. Sorek R, Lev-Maor G, Reznik M, Dagan T, Belinky F, Graur D, Ast G:
Minimal conditions for exonization of intronic sequences: 5' splice site
formation in alu exons. Mol Cell 2004, 14:221-231.
12. Lin L, Shen S, Tye A, Cai JJ, Jiang P, Davidson BL, Xing Y: Diverse splicing
patterns of exonized Alu elements in human tissues. PLoS Genet 2008,
4:e1000225.
13. Mersch B, Sela N, Ast G, Suhai S, Hotz-Wagenblatt A: SERpredict:
detection of tissue- or tumor-specific isoforms generated through
exonization of transposable elements. BMC Genet 2007, 8:78.
14. Amit M, Sela N, Keren H, Melamed Z, Muler I, Shomron N, Izraeli S, Ast G:
Biased exonization of transposed elements in duplicated genes: A lesson
from the TIF-IA gene. BMC Mol Biol 2007, 8:109.
15. Krull M, Petrusma M, Makalowski W, Brosius J, Schmitz J: Functional
persistence of exonized mammalian-wide interspersed repeat elements
(MIRs). Genome Res 2007.
20
16. Sela N, Mersch B, Gal-Mark N, Lev-Maor G, Hotz-Wagenblatt A, Ast G:
Comparative analysis of transposed elements' insertion within human
and mouse genomes reveals Alu's unique role in shaping the human
transcriptome. Genome Biol 2007, 8:R127.
17. Schwartz SH, Silva J, Burstein D, Pupko T, Eyras E, Ast G: Large-scale
comparative analysis of splicing signals and their corresponding splicing
factors in eukaryotes. Genome Res 2008, 18:88-103.
18. Alekseyenko AV, Kim N, Lee CJ: Global analysis of exon creation versus
loss and the role of alternative splicing in 17 vertebrate genomes. Rna
2007, 13:661-670.
19. Fox-Walsh KL, Dou Y, Lam BJ, Hung SP, Baldi PF, Hertel KJ: The
architecture of pre-mRNAs affects mechanisms of splice-site pairing. Proc
Natl Acad Sci U S A 2005, 102:16176-16181.
20. Roy M, Kim N, Xing Y, Lee C: The effect of intron length on exon creation
ratios during the evolution of mammalian genomes. Rna 2008.
21. Talerico M, Berget SM: Intron definition in splicing of small Drosophila
introns. Mol Cell Biol 1994, 14:3434-3445.
22. Ast G: How did alternative splicing evolve? Nat Rev Genet 2004, 5:773-782.
23. Deininger PL, Moran JV, Batzer MA, Kazazian HH, Jr.: Mobile elements
and mammalian genome evolution. Curr Opin Genet Dev 2003, 13:651-658.
24. Deininger PL, Batzer MA: Alu repeats and human disease. Mol Genet
Metab 1999, 67:183-193.
25. Lev-Maor G, Sorek R, Levanon EY, Paz N, Eisenberg E, Ast G: RNA-
editing-mediated exon evolution. Genome Biol 2007, 8:R29.
26. Sorek R: The birth of new exons: mechanisms and evolutionary
consequences. Rna 2007, 13:1603-1608.
27. Gu W, Ray DA, Walker JA, Barnes EW, Gentles AJ, Samollow PB, Jurka J,
Batzer MA, Pollock DD: SINEs, evolution and genome structure in the
opossum. Gene 2007, 396:46-58.
28. Bejerano G, Lowe CB, Ahituv N, King B, Siepel A, Salama SR, Rubin EM,
Kent WJ, Haussler D: A distal enhancer and an ultraconserved exon are
derived from a novel retroposon. Nature 2006, 441:87-90.
29. UCSC genome browser [http://genome.ucsc.edu]
30. Levy A, Sela N, Ast G: TranspoGene and microTranspoGene: transposed
elements influence on the transcriptome of seven vertebrates and
invertebrates. Nucleic Acids Res 2008, 36:D47-52.
31. Mandal PK, Kazazian HH, Jr.: SnapShot: Vertebrate transposons. Cell
2008, 135:192-192 e191.
32. Levy A, Schwartz S, Ast G: Large-scale discovery of insertion hotspots and
preferential integration sites of human transposed elements. Nucleic Acids
Res, 38:1515-1530.
33. Krull M, Brosius J, Schmitz J: Alu-SINE exonization: en route to protein-
coding function. Mol Biol Evol 2005, 22:1702-1711.
34. Zhang XH, Chasin LA: Comparison of multiple vertebrate genomes
reveals the birth and evolution of human exons. Proc Natl Acad Sci U S A
2006, 103:13427-13432.
35. Kim E, Magen A, Ast G: Different levels of alternative splicing among
eukaryotes. Nucleic Acids Res 2007, 35:125-131.
36. Catania F, Lynch M: Where do introns come from? PLoS Biol 2008, 6:e283.
37. NCBI Reference Sequence [http://www.ncbi.nlm.nih.gov/refseq/]
21
38. Sayers EW, Barrett T, Benson DA, Bryant SH, Canese K, Chetvernin V,
Church DM, DiCuccio M, Edgar R, Federhen S, Feolo M, Geer LY, Helmberg
W, Kapustin Y, Landsman D, Lipman DJ, Madden TL, Maglott DR, Miller V,
Mizrachi I, Ostell J, Pruitt KD, Schuler GD, Sequeira E, Sherry ST, Shumway
M, Sirotkin K, Souvorov A, Starchenko G, Tatusova TA, et al: Database
resources of the National Center for Biotechnology Information. Nucleic
Acids Res 2009, 37:D5-15.
39. Ensembl [www.ensembl.org]
40. Spudich G, Fernandez-Suarez XM, Birney E: Genome browsing with
Ensembl: a practical overview. Brief Funct Genomic Proteomic 2007,
6:202-219.
41. Sela N, Stern A, Makalowski W, Pupko T, Ast G: Transduplication resulted
in the incorporation of two protein-coding sequences into the Turmoil-1
transposable element of C. elegans. Biol Direct 2008, 3:41.
42. Izsvak Z, Ivics Z, Garcia-Estefania D, Fahrenkrug SC, Hackett PB: DANA
elements: a family of composite, tRNA-derived short interspersed DNA
elements associated with mutational activities in zebrafish (Danio rerio). Proc Natl Acad Sci U S A 1996, 93:1077-1081.
43. Ogiwara I, Miya M, Ohshima K, Okada N: Retropositional parasitism of
SINEs on LINEs: identification of SINEs and LINEs in elasmobranchs. Mol Biol Evol 1999, 16:1238-1250.
44. Gal-Mark N, Schwartz S, Ram O, Eyras E, Ast G: The pivotal roles of TIA
proteins in 5' splice-site selection of alu exons and across evolution. PLoS
Genet 2009, 5:e1000717.
45. Lee JY, Ji Z, Tian B: Phylogenetic analysis of mRNA polyadenylation sites
reveals a role of transposable elements in evolution of the 3'-end of genes. Nucleic Acids Res 2008, 36:5581-5590.
46. Chen LL, DeCerbo JN, Carmichael GG: Alu element-mediated gene
silencing. Embo J 2008, 27:1694-1705.
47. Smalheiser NR, Torvik VI: Mammalian microRNAs derived from genomic
repeats. Trends Genet 2005, 21:322-326.
48. Smalheiser NR, Torvik VI: Alu elements within human mRNAs are
probable microRNA targets. Trends Genet 2006, 22:532-536.
49. Berget SM: Exon recognition in vertebrate splicing. J Biol Chem 1995,
270:2411-2414.
50. Ram O, Ast G: SR proteins: a foot on the exon before the transition from
intron to exon definition. Trends Genet 2007, 23:5-7.
51. Franchini LF, Ganko EW, McDonald JF: Retrotransposon-gene associations
are widespread among D. melanogaster populations. Mol Biol Evol 2004,
21:1323-1331.
52. Gonzalez J, Petrov DA: The adaptive role of transposable elements in the
Drosophila genome. Gene 2009, 448:124-133.
53. Aminetzach YT, Macpherson JM, Petrov DA: Pesticide resistance via
transposition-mediated adaptive gene truncation in Drosophila. Science
2005, 309:764-767.
54. Kedde M, Agami R: Interplay between microRNAs and RNA-binding
proteins determines developmental processes. Cell Cycle 2008, 7:899-903.
55. Kuhn RM, Karolchik D, Zweig AS, Trumbower H, Thomas DJ,
Thakkapallayil A, Sugnet CW, Stanke M, Smith KE, Siepel A, Rosenbloom
KR, Rhead B, Raney BJ, Pohl A, Pedersen JS, Hsu F, Hinrichs AS, Harte RA,
22
Diekhans M, Clawson H, Bejerano G, Barber GP, Baertsch R, Haussler D,
Kent WJ: The UCSC genome browser database: update 2007. Nucleic
Acids Res 2007, 35:D668-673.
56. Pruitt KD, Tatusova T, Maglott DR: NCBI reference sequences (RefSeq): a
curated non-redundant sequence database of genomes, transcripts and
proteins. Nucleic Acids Res 2007, 35:D61-65.
57. TranspoGene Website [http://TranspoGene.tau.ac.il]
58. RepeatMasker. In Book RepeatMasker (Editor ed.^eds.). City.
59. Jurka J: Repbase update: a database and an electronic journal of
repetitive elements. Trends Genet 2000, 16:418-420.
60. Jurka J, Kapitonov VV, Pavlicek A, Klonowski P, Kohany O, Walichiewicz J:
Repbase Update, a database of eukaryotic repetitive elements. Cytogenet
Genome Res 2005, 110:462-467.
61. Galaxy [http://main.g2.bx.psu.edu/]
62. Giardine B, Riemer C, Hardison RC, Burhans R, Elnitski L, Shah P, Zhang Y,
Blankenberg D, Albert I, Taylor J, Miller W, Kent WJ, Nekrutenko A:
Galaxy: a platform for interactive large-scale genome analysis. Genome
Res 2005, 15:1451-1455.
63. The Exon-Intron Database
[http://hsc.utoledo.edu/depts/bioinfo/database.html]
64. Shepelev V, Fedorov A: Advances in the Exon-Intron Database (EID).
Brief Bioinform 2006, 7:178-185.
65. Dehal P, Satou Y, Campbell RK, Chapman J, Degnan B, De Tomaso A,
Davidson B, Di Gregorio A, Gelpke M, Goodstein DM, Harafuji N, Hastings
KE, Ho I, Hotta K, Huang W, Kawashima T, Lemaire P, Martinez D,
Meinertzhagen IA, Necula S, Nonaka M, Putnam N, Rash S, Saiga H, Satake
M, Terry A, Yamada L, Wang HG, Awazu S, Azumi K, et al: The draft
genome of Ciona intestinalis: insights into chordate and vertebrate
origins. Science 2002, 298:2157-2167.
66. Biemont C, Vieira C: Genetics: junk DNA as an evolutionary force. Nature
2006, 443:521-524.
23
Figure legends
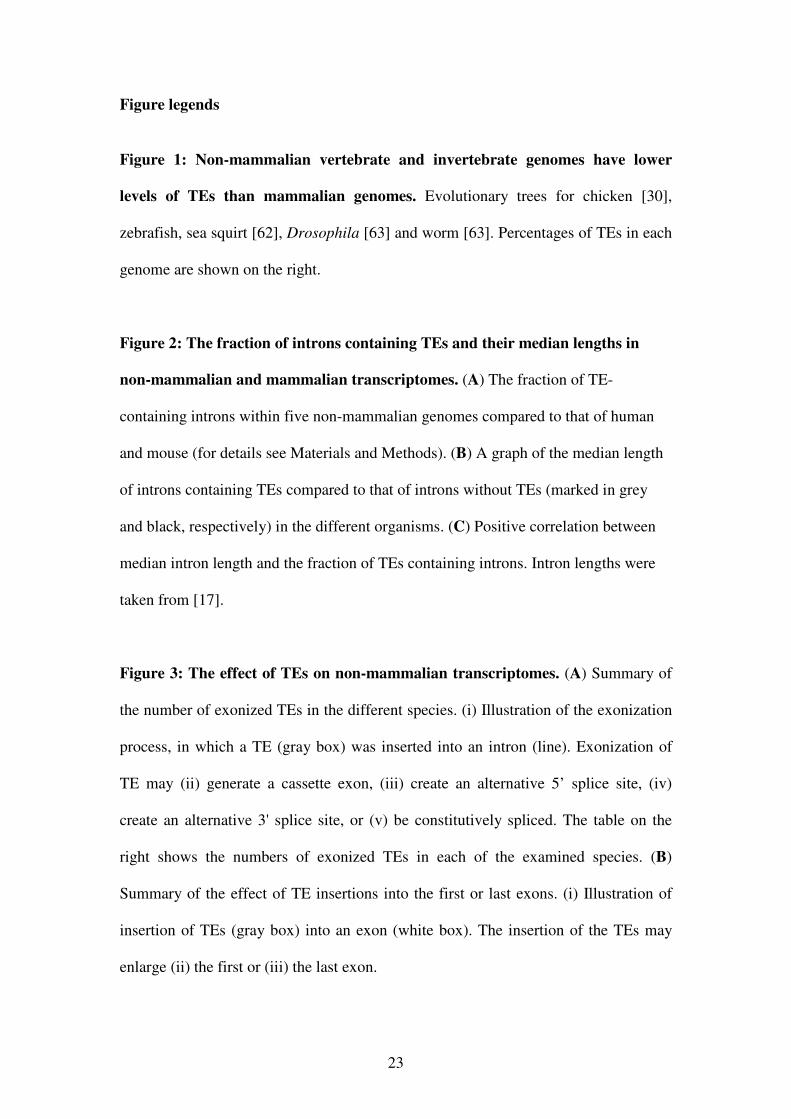
Figure 1: Non-mammalian vertebrate and invertebrate genomes have lower
levels of TEs than mammalian genomes. Evolutionary trees for chicken [30],
zebrafish, sea squirt [62], Drosophila [63] and worm [63]. Percentages of TEs in each
genome are shown on the right.
Figure 2: The fraction of introns containing TEs and their median lengths in
non-mammalian and mammalian transcriptomes. (A) The fraction of TE-
containing introns within five non-mammalian genomes compared to that of human
and mouse (for details see Materials and Methods). (B) A graph of the median length
of introns containing TEs compared to that of introns without TEs (marked in grey
and black, respectively) in the different organisms. (C) Positive correlation between
median intron length and the fraction of TEs containing introns. Intron lengths were
taken from [17].
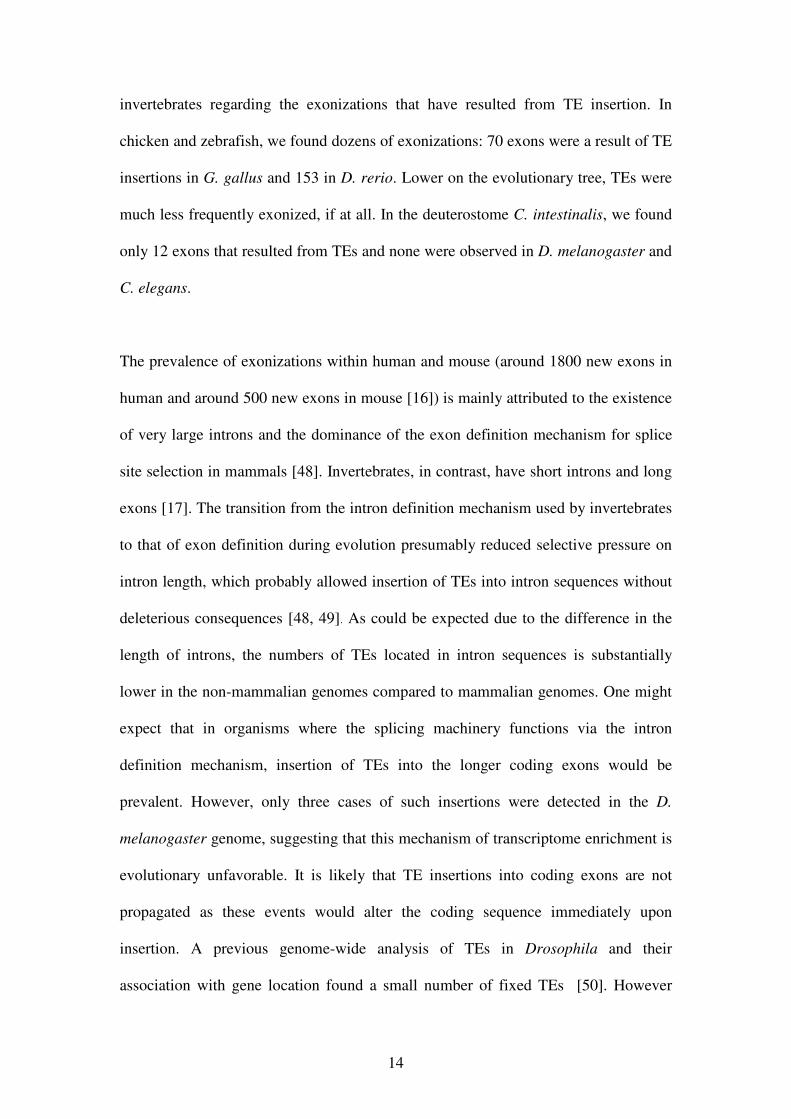
Figure 3: The effect of TEs on non-mammalian transcriptomes. (A) Summary of
the number of exonized TEs in the different species. (i) Illustration of the exonization
process, in which a TE (gray box) was inserted into an intron (line). Exonization of
TE may (ii) generate a cassette exon, (iii) create an alternative 5’ splice site, (iv)
create an alternative 3' splice site, or (v) be constitutively spliced. The table on the
right shows the numbers of exonized TEs in each of the examined species. (B)
Summary of the effect of TE insertions into the first or last exons. (i) Illustration of
insertion of TEs (gray box) into an exon (white box). The insertion of the TEs may
enlarge (ii) the first or (iii) the last exon.
24
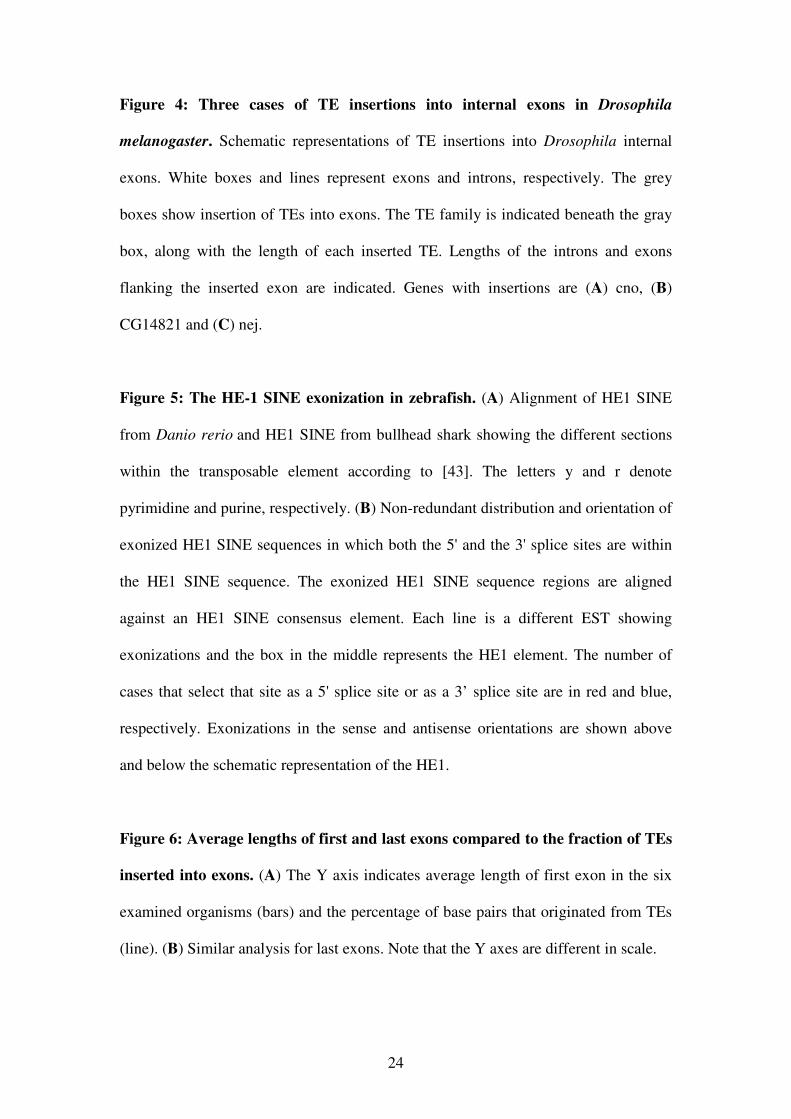
Figure 4: Three cases of TE insertions into internal exons in Drosophila
melanogaster. Schematic representations of TE insertions into Drosophila internal
exons. White boxes and lines represent exons and introns, respectively. The grey
boxes show insertion of TEs into exons. The TE family is indicated beneath the gray
box, along with the length of each inserted TE. Lengths of the introns and exons
flanking the inserted exon are indicated. Genes with insertions are (A) cno, (B)
CG14821 and (C) nej.
Figure 5: The HE-1 SINE exonization in zebrafish. (A) Alignment of HE1 SINE
from Danio rerio and HE1 SINE from bullhead shark showing the different sections
within the transposable element according to [43]. The letters y and r denote
pyrimidine and purine, respectively. (B) Non-redundant distribution and orientation of
exonized HE1 SINE sequences in which both the 5' and the 3' splice sites are within
the HE1 SINE sequence. The exonized HE1 SINE sequence regions are aligned
against an HE1 SINE consensus element. Each line is a different EST showing
exonizations and the box in the middle represents the HE1 element. The number of
cases that select that site as a 5' splice site or as a 3’ splice site are in red and blue,
respectively. Exonizations in the sense and antisense orientations are shown above
and below the schematic representation of the HE1.
Figure 6: Average lengths of first and last exons compared to the fraction of TEs
inserted into exons. (A) The Y axis indicates average length of first exon in the six
examined organisms (bars) and the percentage of base pairs that originated from TEs
(line). (B) Similar analysis for last exons. Note that the Y axes are different in scale.
25
Tables
Table 1: Transposable elements in Gallus gallus
TE Total Intronic TEs in
introns
within
RefSeq
TEs in
introns
of non-
RefSeq
Exons
within
RefSeq
alignments*
Exons in
non-RefSeq
alignments**
SINE 27 10 (37%) 1 9 0 0
LINE 188,302 65,035
(34.5%)
14,482 50,553 8 45
LTR 28,719 7553
(26.3%)
1501 6052 0 8
DNA 20,808 6554
(31.4%)
1446 5108 1 8
Total 237,856 79,152
(33.2%)
17,430 61,722 9 61
* Number of exons found within annotated RefSeq genes.
** Number of exons for which ESTs are not found within annotated RefSeq genes.
Table 2: Transposable elements in Danio rerio
TE Total Intronic TEs in
introns
within
RefSeq
TEs in
introns of
non-RefSeq
Exons
within
RefSeq
alignments*
Exons in non-
RefSeq
alignments**
SINE 259,684 113,926
(43.9%)
46,679 67,247 14 121
LINE 80,412 37,228
(46.3%)
14,671 22,557 2 4
LTR 53,028 21,496
(40.5%)
6761 14,735 2 1
DNA 1,208,155 585,408
(48.4%)
257,438 327,970 37 72
Total 1,601,279 758,058
(47.3%)
325,549 432,509 55 198
* Number of exons which their ESTs are found within annotated RefSeq genes.
** Number of exons which their ESTs are not found within annotated RefSeq genes.
26
Table 3: Transposable elements in Ciona intestinalis
TE Total Intronic TEs in
introns
within
RefSeq
TEs in
introns of
non-RefSeq
Exons
within
RefSeq
alignments*
Exons in non-
RefSeq
alignments**
SINE 51,021 20,360
(39.9%)
826 19,534 0 3
LINE 29,369 11,172
(38%)
493 10,679 0 0
LTR 491 112
(22.8%)
2 110 0 0
DNA 55,300 22,056
(39.9%)
1025 21,031 0 9
Total 136,181 53,700
(39.4%)
1851 51,849 0 12
* Number of exons which their ESTs are found within annotated RefSeq genes.
** Number of exons which their ESTs are not found within annotated RefSeq genes.
Table 4: Transposable elements in Drosophila melanogaster
TE Total Intronic TEs in
introns
within
RefSeq
TEs in
introns of
non-RefSeq
Exons within
RefSeq
alignments*
Exons in non-
RefSeq
alignments **
SINE 0 0 0 0 0 0
LINE 4755 2964
(62%)
1258 1706 0 0
LTR 10,259 5394
(52%)
2014 3380 0 0
DNA 8028 5560
(69%)
3231 2329 0 0
Total 23,042 13,918
(60%)
6503 7415 0 0
* Number of exons which their ESTs are found within annotated RefSeq genes.
** Number of exons which their ESTs are not found within annotated RefSeq genes.
27
Table 5: Transposable elements in Caenorhabditis elegans
TE Total Intronic TEs in
introns
within
RefSeq
TEs in
introns of
non-
RefSeq
Exons
within
RefSeq
alignments*
Exons in non-
RefSeq
alignments**
SINE 524 243
(46%)
230 13 0 0
LINE 428 103
(24%)
90 13 0 0
LTR 606 137
(22%)
126 11 0 0
DNA 32,977 17,724
(53%)
17,175 549 4 0
Total 34,535 18,207
(53%)
17,621 586 4 0
* Number of exons which their ESTs are found within annotated RefSeq genes.
** Number of exons which their ESTs are not found within annotated RefSeq genes.
Additional files
Additional file 1: Table S1. Number of sense/antisense TE insertions within intronic
sequences.
Additional file 2: Table S2. Number of exonizations versus number of ESTs.
Additional file 3: Table S3. Number of exonizations found in the CDS or UTR
(within annotated genes).
Additional file 4: Text S1. Sequences of the internal Drosophila melanogaster exons
with TE insertions.
Additional file 5: Table S4. Average lengths and average TE percentages in first
exons.
Additional file 6: Table S5. Average lengths and average TE percentages in the last
exons.
chicken
zebrafish
sea squirt
fly
worm
~5%
~26%
~11%
~10%
~9%
% of TEs in each genome
Figure 1
(a)
M. musculus
G. gallus
D. rario
D. melanogaster
C. elegans
C. intestinalis
(b)
in b
ase
pa
irs
(c)
Figure 2
5’ss3’ss
(i)
(ii)
(iii)
5’ss
3’ss
(iv)
5’ss3’ss
(v)
(i)
(ii)
EXON
TE
(a)
(b)
vertebrates invertebrates
Chicken Zebrafishspecies
Alt. 5’ss
Alt. 3’ss
Const.
Alt. Skip
D. melanogaster C.elegansC. intestinalis
vertebrates invertebrates
Chicken Zebrafishspecies
insertion 5UTR
(iii) insertion 3UTR
TE
5’ UTR
3’ UTR
D. melanogaster C.elegansC. intestinalis
1
1
1
1
0
0
0
0
9
1
1
1
16
0
0
26
3
0
149
100
0.6%
0.79%0.37%
0.29%0.24%
1.32%
0.34%
3.37%
0.11%
0.39%
Figure 3
Exon 17 Exon 18 Exon 19
2025 bp 122 bp217 bp
LINE 236 bp LINE 190 bp
(a) cno gene
CDS CDS
(b)
Exon 3 Exon Exon 5
668 bp 124 bp58 bp
LINE 196 bp
CDS
CG14821 gene
(c)
Exon 3 Exon Exon 5
4077 bp 290 bp369 bp
LINE 327 bp
CDS
nej gene
CDS
LINE 266 bp
1003 bp 87 bp
70 bp689 bp
68 bp82 bp
4
4
Figure 4
tRNA related region 5’ conserved region variable region tail region
tRNA related region
+80 +200 +320
44
sense
antisense
11
347
(a)
(b)
Figure 5
(a)
(b)
first exon
last exon
Figure 6

Additional files provided with this submission:
Additional file 1: Table S1.doc, 55Khttp://genomebiology.com/imedia/1525618400368484/supp1.docAdditional file 2: Table S2.doc, 27Khttp://genomebiology.com/imedia/1309074752368484/supp2.docAdditional file 3: Table S3.doc, 26Khttp://genomebiology.com/imedia/1351015203368484/supp3.docAdditional file 4: Additional data 4.doc, 27Khttp://genomebiology.com/imedia/2031870622401653/supp4.docAdditional file 5: Additional data 5.doc, 63Khttp://genomebiology.com/imedia/1439336664401653/supp5.docAdditional file 6: Additional data 6.doc, 27Khttp://genomebiology.com/imedia/1128600809401653/supp6.doc


