Embed Size (px)
Citation preview

Genome-Wide Scan for Estimated GFR in Multi-Ethnic Diabetic Populations: The Family Investigation of Nephropathy and Diabetes
Jeffrey R. Schelling, M.D., Hanna E. Abboud, M.D., Susanne B. Nicholas, M.D., Ph.D., Madeleine V. Pahl, M.D., John R. Sedor, M.D., Sharon G. Adler, M.D., Nedal H. Arar, Ph.D.,
Donald W. Bowden, Ph.D., Robert C. Elston, Ph.D., Barry I. Freedman, M.D., Katrina A.B. Goddard, Ph.D., Xiuqing Guo, Ph.D., Robert L. Hanson, M.D., M.P.H., Eli Ipp, M.D., Sudha K. Iyengar, Ph.D., Gyungah Jun, M.S., W.H. Linda Kao, Ph.D., Balakuntalam S. Kasinath, M.D., Paul L. Kimmel, M.D., Michael J. Klag, M.D., M.P.H., William C. Knowler, M.D., Dr.P.H., Robert G. Nelson, M.D., Ph.D.,
Rulan S. Parekh, M.D., M.S., Shannon R. Quade, M.S., Stephen S. Rich, Ph.D., Mohammed F. Saad, M.D., Marina Scavini, M.D., Michael W. Smith, Ph.D., Kent Taylor, Ph.D.,
Cheryl A. Winkler, Ph.D., Philip G. Zager, M.D., and Vallabh O. Shah, Ph.D., on behalf of the Family Investigation of Nephropathy and Diabetes Research Group*
* Member affiliations in Appendix A.
Running Title: Diabetic Nephropathy, eGFR and Genome Scan
Corresponding Author: Dr. Sudha Iyengar
Department of Epidemiology and Biostatistics Case Western Reserve University
Wolstein Research Building, Rm # 1300 10900 Euclid Avenue
Cleveland, OH 44106-7281 Email: [email protected]
This study was supported by the National Institutes of Health – National Institute of Diabetes, Digestive and Kidney Diseases U01 Grant
Received for publication 15 March 2007 and accepted in revised form 8 October 2007.
Diabetes Publish Ahead of Print, published online November 14, 2007
Copyright American Diabetes Association, Inc., 2007
Diabetic Nephropathy, eGFR and Genome Scan
ABSTRACT Objective: Diabetic nephropathy (DN), the most common cause of end stage renal disease, aggregates in families and specific ethnic groups. Deconstructing DN into intermediate, quantitative phenotypes may increase feasibility of detecting susceptibility loci by genetic screens. Glomerular filtration rate (GFR), which characterizes DN, was employed as a quantitative trait in a preliminary whole genome scan. Research Design and Methods: Estimated GFR (eGFR) was calculated for 882 diabetic sib pairs (mean age 57 years) of African American (25.6% of total), American Indian (8.6%), European American (14.2%), and Mexican American (51.6%) descent enrolled in the initial phase of the Family Investigation of Nephropathy and Diabetes (FIND). A whole genome scan was performed using 404 microsatellite markers (average spacing = 9 cM) and model-free linkage analysis. Results: For all ethnicities combined, strong evidence for linkage was observed on chromosomes 1q43 (P = 3.6 x 10⁻³), 7q36.1 (P = 2.1 x 10⁻⁴), 8q13.3 (P = 4.6 x 10⁻⁴) and 18q23.3 (P = 2.7 x 10⁻³) . Mexican American families, which comprised the major ethnic subpopulation in FIND, contributed to linkage on chromosomes 1q43, 2p13.3, 7q36.1, 8q13.3, and 18q23.3, whereas African American and American Indian families displayed linkage peaks on chromosomes 11p15.1 and 15q22.3, respectively. Conclusions: We have demonstrated multiple chromosomal regions linked to eGFR in a multiethnic collection of families ascertained by a proband with diabetic nephropathy. Identification of genetic variants within these loci that are responsible for the linkage signals could lead to predictive tests or novel therapies for subsets of patients at risk for DN. KEY WORDS. eGFR, diabetic nephropathy, renal failure, genetic, ESRD
2

Diabetic Nephropathy, eGFR and Genome Scan
nd stage renal disease (ESRD) is the final outcome for multiple chronic kidney diseases (CKD), including one-third of
patients with type 1 and type 2 diabetes. Nearly 45% of incident ESRD cases in the U.S. are due to diabetic nephropathy (DN) (
3
www.usrds.org/2005/pdf/02_incid_prev_05), and less than 5% of ESRD cases are caused by Mendelian inheritance of known susceptibility genes. ESRD is therefore considered a complex disease in the remaining 95% of cases, with hereditary and environmental factors contributing to clinical outcomes. Evidence to support a genetic component to DN is abundant, including concordance of DN between diabetic sibs (1;2), as well as clustering of DN within families and specific ethnic groups (3-5).
Whole genome screens have been conducted to identify DN genes in Pima Indian and African American (AA) populations (6;7), and each study employed composite phenotype definitions for DN. These screens have yielded candidate loci, but no major susceptibility genes to date. A potential disadvantage of this study design is that establishing a categorical phenotype definition can be difficult, and inaccurate phenotype classification can reduce the likelihood of identifying candidate loci. An alternative approach is measurement of a quantitative trait, which represents an intermediate phenotype to predict an aspect of the complex disease. Although intermediate, quantitative traits may also be heterogeneous, some potential advantages to this strategy are that these traits may be more proximal to underlying genes that regulate CKD, controlled by fewer loci, affected by fewer environmental factors, and more likely to reflect disease pathophysiology (8-10). Importantly, analysis using continuous, quantitative traits can increase power to detect genetic effects. Although most often applied to model organisms, this strategy has been successfully implemented to identify complex human disease loci (8;11-14).
Several groups have assessed heritability (h2) of eGFR as a quantitative trait. Hunt et al reported h2 = 0.33, 0.36, and 0.53 for three successive creatinine clearance examinations in a healthy Utah pedigree (15). These investigators
subsequently analyzed GFR estimates from a similar (healthy, European American [EA]) population at three time points over a 10 year period, demonstrating h2 ranging from 0.25 to 0.31 (16). DeWan et al calculated heritability of 0.17 in AA and 0.18 in EA hypertensive cohorts (17). In the Framingham Heart Study, Fox et al determined that eGFR heritability was 0.36 (18). In a study of type 2 diabetic EA subjects, Langefeld et al calculated h2 of eGFR, by MDRD equation, to be 0.75 after adjusting for age, gender, blood pressure, medications, and hemoglobin A1c (HbA1c) levels (19). Bochud et al estimated heritability in families with hypertension, similarly adjusting for age and gender, and revealing h2 = 0.41 for inulin clearance, 0.52 for creatinine clearance, and 0.82 for creatinine clearance estimated by the Cockcroft-Gault formula (20). More recently, the Joslin group demonstrated significant eGFR heritability (h2 = 0.45) in families enriched for type 2 diabetes (21). Collectively, these data indicate that GFR is heritable, and it is reasonable to screen for genes regulating GFR and/or renal disease progression.
Many of these heritability studies simultaneously demonstrated linkage with quantitative eGFR phenotypes. In the HyperGEN study involving 1,100 hypertensive EA and AA subjects, a locus on 3q27 was identified (17). Follow-up studies by this same group, with added subjects and denser genotyping, revealed linkage to 3p (22) and 7q (23) in the AA cohort. In two studies by Hunt et al, which examined pedigrees from EA families in Utah, loci on chromosome 2q21.3 (16) and 10q23.3 (15) were identified. The Framingham Heart Study identified linkage on chromosomes 3q26.3 with creatinine clearance and on 4q23.3 with eGFR (18). However, these populations were largely devoid of diabetic subjects and mean eGFR of the study populations were in the normal range. The FIND consortium was established to identify DN susceptibility genes in four ethnic groups (Hispanic American [HA], AA, EA and American Indian [AI]) (24). In contrast to other studies, families were ascertained for diabetic ESRD or severe DN and many participants have low eGFR. A whole
E

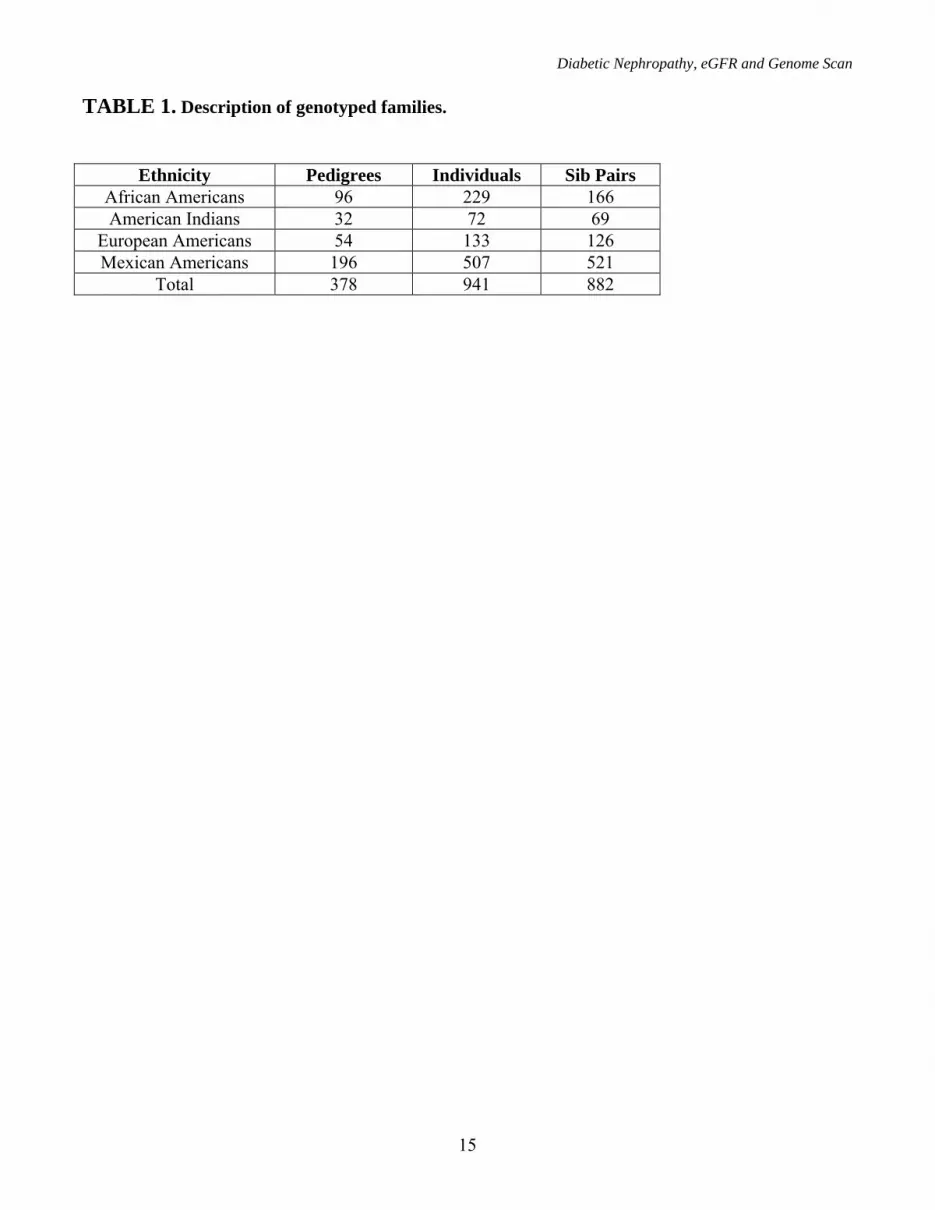
Diabetic Nephropathy, eGFR and Genome Scan genome scan was performed with microsatellite markers. Here, we report the results of a linkage analysis of eGFR. RESEARCH DESIGN AND METHODS Study Population. The FIND family study population and study design have been described in detail (24). Briefly, samples were collected from the eight participating investigation centers. The predominant recruitment strategy in the family-based linkage portion of FIND was to enroll probands with DN, as well as diabetic sibs with or without DN. A total of 941 subjects, comprising 882 sib pairs were included in this analysis (Table 1). Approval for recruitment was obtained from Institutional Review Boards at each participating institution. Subjects were recruited and samples collected according to the declaration of Helsinki principles, and a certificate of confidentiality was filed at the National Institutes of Health. Diabetes definition. Diabetes was self-reported and corroborated in most subjects by prevalent treatment with insulin and/or oral hypoglycemic agents. Diabetes duration was obtained from the medical history, and confirmed by medical record review. In diabetic patients not treated with hypoglycemic agents, diabetes was diagnosed by HbA1c screening and fasting plasma glucose confirmation at study entry. Subjects with HbA1c >7.0 were considered diabetic, whereas those with HbA1c <6.0% were considered non-diabetic. Subjects with HbA1c concentration in the range from >6.0% to <7.0% underwent fasting plasma glucose and/or oral glucose tolerance testing. Assay results for diabetes diagnosis were interpreted according to American Diabetes Association criteria (25). Subjects with either type 1 or type 2 diabetes were included, though nearly all enrollees were believed to have type 2 diabetes (Knowler,WC, Ipp,E, for the FIND Research Group. J.Am.Soc.Nephrol. 16:149A, 2005). Proband phenotype criteria. Detailed criteria have been published previously (24). Briefly, parameters for inclusion in the FIND family study required diagnoses of DN, as defined by (1) kidney biopsy revealing DN plus overt proteinuria (>0.5 g protein/g creatinine), or (2)
ESRD due to DN, as defined by (a) onset of diabetes ≥5 years prior to renal replacement therapy plus diabetic retinopathy (documented microaneurysms, proliferative diabetic retinopathy, macular edema or prior retinal laser photocoagulation), or (b) onset of diabetes ≥5 years prior to renal replacement therapy with documented proteinuria (>3.0 g protein/g creatinine) or (c) diabetic retinopathy with proteinuria (>3.0 g protein/g creatinine), or (3) CKD due to DN (but not yet ESRD), based upon either (a) diabetic retinopathy with proteinuria (>1.0 g protein/g creatinine) or (b) diabetes duration ≥10 years with proteinuria (>3.0 g protein/g creatinine). Demographic and clinical characteristics are shown in Table 2. Diabetic sib phenotype criteria. Diabetic sibs were considered to be either affected or unaffected by DN. Criteria for sibs affected for DN include: (1) kidney biopsy consistent with DN or (2) microalbuminuria (>30 mg albumin/g creatinine) or (3) serum creatinine concentration ≥1.6 mg/dl for men, ≥1.4 mg/dl in women. Diabetic sibs were classified as unaffected by DN by virtue of diabetes duration ≥10 years, serum creatinine concentration <1.6 mg/dl (for men), <1.4 mg/dl (for women) and urine albumin:creatinine <30 mg/g). Diabetic sibs with normal urine albumin excretion and diabetes duration <10 years were considered indeterminate, but included in the linkage analysis. Glomerular filtration rate estimation (eGFR). For most subjects, eGFR was calculated by modified MDRD equation (26): eGFR (ml/min/1.73m2) = 186 x (Plasma creatinine)- 1.154 x (Age)- 0.203 x (0.742 if female) x (1.210 if African American). eGFR was assumed to be 5.0 ml/min/1.73m2 for patients receiving hemodialysis or transplant recipients (n = 333). Genotyping and analytic methods. Genotyping and linkage analyses were conducted on 882 diabetic sib pairs. DNA was extracted for genotyping from either lymphoblast cell lines or leukocyte buffy coats. Genotyping was performed at the Center for Inherited Disease Research (CIDR), including 404 microsatellite markers on 22 autosomes and 2 sex chromosomes, using the
4

Diabetic Nephropathy, eGFR and Genome Scan Marshfield Genetics version 8 marker set from Research Genetics, with an average marker spacing of 9 cM. All computer programs noted below are part of the S.A.G.E. (27) program package. Differences between groups (probands versus affected sibs, unaffected versus affected sibs) were tested allowing for a sibling correlation, as implemented in ASSOC, using two-sided tests. Mendelian inconsistencies were identified with the MARKERINFO program. No departure from Hardy–Weinberg proportions was observed at any marker at a 1% significance level. Maximum likelihood estimation was performed with the FREQ program to estimate separate marker allele frequencies in all four ethnic groups (AA, EA, AI, MA). Before performing linkage analyses, errors in relationship specification were identified with the program RELTEST, using the entire genome scan. Multipoint identity by descent allele (IBD) sharing estimates were computed using the program GENIBD for each of the four ethnic groups. Linkage analyses were conducted with eGFR as a quantitative trait and the Haseman-Elston (HE) regression linkage test (within the program SIBPAL), using multipoint IBD sharing estimates. SIBPAL performs linear regression modeling of sib pair traits as a function of marker allele IBD sharing. With this method, a weighted average of the squared mean-corrected trait sum and minus the squared trait difference was used as the dependent variable, the regression allowing for the non-independence of sib pairs and the non-independence of squared trait sums and differences (28). For regions suggestive of linkage, asymptotic p-values from the HE test were validated by obtaining empirical p-values in SIBPAL. To do this we permute the allele sharing among the sibling pairs within each sibship and across all sibships of the same size. For each permutation we recalculate the test statistic to generate a distribution of test statistics. We determine the proportion of the replicates that are equal to or more extreme than the original test statistic and report this as the empirical p-value. Based on the settings used in SIBPAL for the number of permutations, the empirical p-value is estimated to be within 20% of the true value with a 95% confidence level.
Quantitative eGFR was evaluated according to two different models. In the first model, the co-variates diabetes duration, angiotensin converting enzyme (ACE) inhibitor or angiotensin receptor blocker (ARB) use, body mass index (BMI) and hemoglobin A1c (HbA1c) concentration were incorporated. In the second model, a linear regression was performed prior to linkage and only co-variates that were significant at the 5% level (diabetes duration and ACE inhibitor or ARB use) were employed. A separate linkage analysis was performed for each ethnicity, and p-values were combined across ethnicities according to Fisher’s method (29). The Fisher meta-analysis technique was utilized because it was not necessarily valid to treat all of the ethnic groups as a single sample owing to allele frequency and demographic differences. To corroborate pooled results obtained with Fisher’s method, we also calculated a weighted average of the HE regression coefficients, with weights inversely proportional to the estimated variances of the coefficients, as well as analyzing together the combined ethnicities, with membership in ethnic group included in the HE regression as covariates (30). RESULTS
Subjects were enrolled and samples collected from 378 families (Table 1); 52% were MA (196 pedigrees), 25% AA (96 pedigrees), 14% EA (54 pedigrees), and 9% American Indian (AI) (32 pedigrees). As previously reported (30), AA probands had significantly lower male:female ratio and higher BMI compared to the other groups (Table 2). Otherwise, probands had similar demographic characteristics among the four ethnic groups.
Within the 378 FIND families, diabetic sibs were enrolled and classified as probands, sibs affected with DN, sibs unaffected by DN, or sibs with insufficient diabetes duration to meet unaffected sib criteria. Demographic and clinical data are shown for each of these groups in Table 2. Of note, unaffected sibs were significantly older than probands or affected sibs, and probands had significantly younger age of onset and shorter diabetes duration than unaffected sibs. As expected, mean eGFR was markedly lower in
5

Diabetic Nephropathy, eGFR and Genome Scan probands than in other groups (Table 2), especially if winsorized (at 5 ml/min/1.73 m2) eGFR values were used for probands and affected sibs with ESRD (data not shown).
Because eGFR decline characterizes and predicts DN, eGFR derived from the MDRD equation was employed in the quantitative trait linkage analysis. The mean eGFR value for the entire population was 77.5 + 32.4 ml/min/1.73 m2 when ESRD subjects were excluded from the calculation and 56.8 + 43.9 ml/min/1.73 m2 when winsorized eGFR values were included for ESRD subjects. Data obtained from the entire population (882 diabetic sib pairs), analyzed using eGFR as a quantitative trait according to the first model (adjusted for co-variates diabetes duration, ACE inhibitor/ARB use, BMI and HbA1c), yielded suggestive evidence for linkage using multipoint IBD estimates on chromosomes 1q43, 7q36.1, 8q13.3, 11p15.1, and a broad peak on 18q13-21 and 20p12.2 (not shown). MA families, which comprise the majority of the families, predominantly contributed to the 1q, 7q, 8q, 18q and 20p linkage peaks. In the ethnic specific analysis of MAs, peaks on 8q (nominal p = 8.70 x 10⁻⁶) and 18q (nominal p = 6.40 x 10⁻⁶) reached Lander-Kruglyak threshold for significant linkage (31).
Although BMI has been implicated as an independent risk factor for ESRD (32), it was not a statistically significant co-variate in the regression analysis of either the total or ethnic specific samples in this study. In addition, HbA1c is not considered a reliable measure of blood glucose control in ESRD patients (33). Therefore, the linkage analysis was repeated after adjusting only for diabetes duration and ACE inhibitor/ARB use. In these analyses, suggestive evidence for linkage in the entire population persisted at 1q43, 7q36.1, 8q13.3, 11p15.1 and 18q22.3 (Figure 1 and Table 3), as well as at 2p13.3. As seen in Figure 1 and Table 3, the MAs primarily contributed to the linkage signals on chromosomes 1q, 2p, 7q, 8q and 18q, while AA and AI families contributed to linkage peaks on 11p and 15q22.3, respectively.
Linkage results are shown for eGFR in ethnic-specific diabetic populations (Figure 2). Data are presented without co-variate adjustment (baseline
model), as well as with pair-mean diabetes duration and ACE inhibitor/ARB used as covariates (adjusted model). For all chromosome regions displayed, co-variate adjustments resulted in increased evidence for linkage. DISCUSSION
In the current report, several major chromosomal intervals, the most prominent at 1q43, 7q36.1, 8q13.3 and 18q23.3 significantly contributed to eGFR phenotype. The findings were influenced primarily by MAs, which comprised the largest subpopulation in our cohort. The 1q locus appears to be unique, with no obvious overlap with previous DN genome scans (Table 4). As discussed in more detail below, the 18q23.3 peak replicated our prior findings in FIND (30) based on a composite DN definition that included criteria other than eGFR (24). Interestingly, the 7q peak was not detected in the FIND population DN scan (30), and the locus on 8q showed modest support, but was not sufficient to meet Lander-Kruglyak evidence for significance (31). Taken together, because there are few common linkage peaks between the two FIND analyses, we speculate that GFR and other aspects of the DN phenotype may be regulated by different genes. However, our failure to replicate these DN linkage signals from FIND or from other collections of DN patients may reflect the modest sample size used in this study (see power analysis in Appendix B), as well as the differences in the phenotypes and ascertainment strategies (34).
Several studies have identified 7q susceptibility loci in scans employing DN phenotypes defined by albuminuria (6;35), and a very recent genome scan of eGFR demonstrated linkage to 7q37 in African Americans (23) (Table 4). Krolewski et al analyzed albuminuria as a quantitative trait, and discovered a linkage peak at 7q36.2, which yielded a LOD score in excess of 3.0 (35). Despite the difference in phenotype definitions, the 7q peak described by Krolewski et al is replicated in our study (Table 4), and coincides with the locus for the NOS3 gene (36-38). In the genome scan involving the Pima Indian population, a single peak of linkage was
6

Diabetic Nephropathy, eGFR and Genome Scan identified at 7q33 (6), which is considerably more centromeric.
The MA cohort also exhibited linkage at 18q23, consistent with linkage peaks in genome scans for type 2 diabetes (39) and DN (7;40) in EA and AA populations, as well as the FIND linkage scan for a composite DN phenotype (30). In addition, Ewens et al found three polymorphisms in the BCL2 gene, which resides at 18q21.33, which were significantly associated with DN in EA families (41). Although EA and AA families did not contribute significantly to the 18q peak in this study (Figure 1), the data from all studies collectively suggest the presence of race-independent diabetes and DN genes in this region. Of note, our peak is centered approximately 900 kb from the carnosinase gene (CNDP1; Table 4). Polymorphisms in CNDP1 have been associated with resistance to DN in EAs (42;43).
Of the few whole genome scans for eGFR that have been conducted, overlap between chromosome regions identified, including the results described in this study, is limited. The first scan by Hunt et al identified linkage of creatinine clearance to chromosome 10 in families from Utah, which were ascertained for cardiovascular disease risk and with relatively normal GFR (15). A second scan by the same group, which analyzed three creatinine-based GFR estimates (by MDRD equation) over a 10 year period, showed linkage to chromosome 2q, but only for the third examination (16). DeWan et al analyzed creatinine clearance, but in a mixed AA and EA population ascertained for hypertension and at increased risk for cardiovascular diseases. These investigators identified linkage with chromosome 3q27, but not chromosomes 2 or 10 (17). Fox et al employed multipoint variance component linkage analysis in 330 families from the community-based Framingham Heart Study offspring cohort, using a 10-cM genome-wide scan, for serum creatinine, eGFR, and creatinine clearance measured from 1998 to 2001 (18). eGFR was estimated using the simplified MDRD equation, and creatinine clearance was estimated using the Cockcroft-Gault equation. The peak LOD scores for serum creatinine, eGFR, and creatinine clearance were 2.28 at 176 cM on
chromosome 4, 2.19 at 78 cM on chromosome 4, and 1.91 at 103 cM on chromosome 3, respectively. This group recently reported the results of linkage analysis with 11,200 markers in this same cohort. A marker (rs10489578), near 1q43 peak in the FIND genome scan, was linked to both eGFR (LOD 3.08) and serum creatinine (LOD 3.35) (44). Finally, Placha et al reported a genome scan of eGFR, estimated by serum cystatin C, MDRD and Cockroft-Gault equations, in 63 extended Caucasian pedigrees (406 individuals with type 2 diabetes, 428 without diabetes) with normal eGFR values (21). This group detected strong evidence for linkage among diabetic relatives on chromosome 2q, and suggestive evidence on 10q, in proximity to the region previously identified by Hunt et al (15) and 18p. When diabetic and non-diabetic relatives were combined in the analysis, evidence for linkage was also found on chromosome 7p. Linkage peaks in the current study may not replicate previous findings owing to differences in ethnic composition of the populations studied, and relatively modest sizes of most prior studies. In contrast to earlier reports, the FIND study ascertained for subjects with diabetes and renal insufficiency.
Another difference between prior eGFR genetics studies and this study is the method of GFR estimation. We chose the MDRD equation to estimate GFR because serum creatinine was easily obtained for all study subjects, and it is currently the most accurate creatinine-based index of eGFR (45). This formula was originally derived from a study population of 1,628 predominantly Caucasian patients with multiple causes of CKD (26) and has subsequently been validated in AA (46) and AI cohorts (Nelson,RG, Greene,T, Beck,GJ, Van Lente, F, Wang, X, Knowler, WC. J.Am.Soc.Nephrol. 14:134A, 2003). In several recent reports, accuracy of the equation was analyzed in patients with relatively normal GFR (47), as well as in patients with diabetes (48). Each concluded that the MDRD study underestimated GFR in the normal range. However, our cohort has a relatively depressed mean eGFR, approaching the range in the population from which the formula was derived. Furthermore, statistical analyses for genetic
7

Diabetic Nephropathy, eGFR and Genome Scan studies rely upon phenotype ranking. Therefore, to the extent that the MDRD equation uniformly underestimates the absolute GFR value, the rank order is unlikely to change, and thus, one would expect the results to be unaffected. The definitive study, which includes the entire FIND family sample with approximately four times as many participants, is ongoing. In this analysis, a SNP genotyping platform will replace the microsatellite technology.
A potential limitation of this study is that eGFR was determined on the basis of a single random sample collection. Although validation with serial measures would be ideal, quality control studies demonstrated negligible variability on repeat creatinine measurement of the same serum sample (data not shown or Parekh et al, unpublished data). An additional point is that we ascertained for DN according to criteria that included diabetes duration. It is therefore possible that we omitted subjects with the most severe eGFR phenotypes, who may have died prior to achieving duration criteria. It has been suggested that such a study design may bias results toward discovery of survival, rather than disease genes (49). Selection bias in relation to the participating centers and subsequently enrolled diabetic sib pairs cannot be ruled out. Finally, data were adjusted for a number of confounding variables, such as diabetes duration, antihypertensive therapy, BMI and HbA1c concentration, but other potentially relevant parameters, such as blood pressure and cardiovascular diseases, were not available. Like many common diseases, DN is caused by a combination of genetic and environmental risk factors. Both linkage and association designs have been used to identify common disease genes. Linkage studies are not as powerful as association studies for identification of genes contributing to risk for common, complex diseases, which are caused by variants with effect sizes on the order of odds ratios of 1.15-1.4. FIND was initiated when whole genome association studies were not feasible. At that time, family-based study designs had the advantage of searching the whole genome in an unbiased manner without predetermining the identity of specific candidates and association designs were
only used to evaluate candidate disease gene. Given recent successes in gene mapping for common disease using whole genome association, the FIND consortium is now also performing a whole genome association. The results of linkage analysis reported in this paper will be valuable in the analyses of whole genome association data and should accelerate identification of genetic variants that regulate DN pathogenesis.
In conclusion, several linkage peaks for eGFR were identified from the multi-ethnic FIND cohort, which represents the largest DN genetics study to date. After adjustment for diabetes duration and ACE inhibitor/ARB use, the peaks on chromosomes 1q43, 7q36.1 and 8q21.3 are very close to attaining Lander-Kruglyak significance for linkage (31) within the MA cohort, and achieve genome-wide significance at the 5% level, strongly suggesting that unique DN alleles cluster within these loci. We speculate that fine mapping, candidate gene and sequencing analyses should permit identification of mutations within these loci, which could ultimately lead to specific predictive tests and/or therapies for a subset of patients with DN. Further studies investigating the association of GFR and genetic loci in large US populations of patients with diabetic kidney disease will be necessary to confirm the findings. ACKNOWLEDGMENTS We kindly thank all FIND participants. This study was supported by the research grant U01DK57292-05 from the National Institute of Diabetes and Digestive and Kidney Diseases (NIDDK) and, in part, by the Intramural Research Program of the NIDDK. This project has been funded in whole or in part with federal funds from The National Cancer Institute, National Institutes of Health, under contract N01-CO-12400. The content of this publication does not necessarily reflect the views or policies of the Department of Health and Human Services, nor does mention of trade names, commercial products, or organizations imply endorsement by the U.S. Government. This Research was supported, in part, by the Intramural Research Program of the NIH, National Cancer Institute,
8

Diabetic Nephropathy, eGFR and Genome Scan
9
Center for Cancer Research. This work was supported by the National Center for Research Resources for the General Clinical Research Center (GCRC) grants: Case Western Reserve University M01-RR-000080; Wake Forest University M01-RR-07122; Harbor-UCLA Medical Center M01-RR-00425; College of Medicine - University of California Irvine M01-RR-00827-29; University of New Mexico HSC M01-RR-00997; Frederic C. Bartter M01-RR-01346. Genotyping was performed by the Center
for Inherited Disease Research (CIDR). CIDR is fully funded through a federal contract from the National Institutes of Health to the Johns Hopkins University; contract number N01-HG-65403. The results of this analysis were obtained by using the S.A.G.E. package of genetic epidemiology software, which is supported by a U.S. Public Health Service Resource Grant (RR03655) from the National Center for Research Resources.
Diabetic Nephropathy, eGFR and Genome Scan
10
REFERENCES 1. Seaquist,ER, Goetz,FC, Rich,S, Barbosa,J: Familial clustering of diabetic kidney disease.
Evidence for genetic susceptibility to diabetic nephropathy. N Engl J Med 320:1161-1165, 1989 2. Quinn,M, Angelico,MC, Warram,JH, Krolewski,AS: Familial factors determine the development
of diabetic nephropathy in patients with IDDM. Diabetologia 39:940-945, 1996 3. Nelson,RG, Newman,JM, Knowler,WC, Sievers,ML, Kunzelman,CL, Pettitt,DJ, Moffett,CD,
Teutsch,SM, Bennett,PH: Incidence of end-stage renal disease in type 2 (non-insulin-dependent) diabetes mellitus in Pima Indians. Diabetologia 31:730-736, 1988
4. Covic,AMC, Iyengar,SK, Olson,JM, Sehgal,AR, Constantiner,M, Jedrey,C, Kara,M, Sabbagh,E, Sedor,JR, Schelling,JR: A family-based strategy to identify genes for diabetic nephropathy. Am J Kidney Dis 37:638-647, 2001
5. Satko,SG, Langefeld,CD, Daeihagh,P, Bowden,DW, Rich,SS, Freedman,BI: Nephropathy in siblings of African Americans with overt type 2 diabetic nephropathy. Am J Kidney Dis 40:489-494, 2002
6. Imperatore,G, Hanson,RL, Pettitt,DJ, Kobes,S, Bennett,PH, Knowler,WC: Sib-pair linkage analysis for susceptibility genes for microvascular complications among Pima Indians with type 2 diabetes. Pima Diabetes Genes Group. Diabetes 47:821-830, 1998
7. Bowden,DW, Colicigno,CJ, Langefeld,CD, Sale,MM, Williams,A, Anderson,PJ, Rich,SS, Freedman,BI: A genome scan for diabetic nephropathy in African Americans. Kidney Int 66:1517-1526, 2004
8. Ghosh,S, Schork,NJ: Genetic analysis of NIDDM. The study of quantitative traits. Diabetes 45:1-14, 1996
9. Carlson,CS, Eberle,MA, Kruglyak,L, Nickerson,DA: Mapping complex disease loci in whole-genome association studies. Nature 429:446-452, 2004
10. Lander,ES, Schork,NJ: Genetic dissection of complex traits. Science 265:2037-2048, 1994 11. Pratley,RE, Thompson,DB, Prochazka,M, Baier,L, Mott,D, Ravussin,E, Sakul,H, Ehm,MG,
Burns,DK, Foroud,T, Garvey,WT, Hanson,RL, Knowler, WC, Bennett,PH, Bogardus,C: An autosomal genomic scan for loci linked to prediabetic phenotypes in Pima Indians. J Clin Invest 101:1757-1764, 1998
12. Rotter,JI, Bu,X, Cantor,RM, Warden,CH, Brown,J, Gray,RJ, Blanche,PJ, Krauss,RM, Lusis,AJ: Multilocus genetic determinants of LDL particle size in coronary artery disease families. Am J Hum Genet 58:585-594, 1996
13. Fogarty,DG, Rich,SS, Hanna,L, Warram,JH, Krolewski,AS: Urinary albumin excretion in families with type 2 diabetes is heritable and genetically correlated to blood pressure. Kidney Int 57:250-257, 2000
14. Mahtani,MM, Widen,E, Lehto,M, Thomas,J, McCarthy,M, Brayer,J, Bryant, Chan,G, Daly,M, Forsblom,C, Kanninen,T, Kirby,A, Kruglyak,L, Munnelly,K, Parkkonen,M, Reeve-Daly,MP, Weaver,A, Brettin,T, Duyk,G, Lander,ES, Groop,LC: Mapping of a gene for type 2 diabetes associated with an insulin secretion defect by a genome scan in Finnish families. Nature Genetics 14:90-94, 1996
15. Hunt,SC, Hasstedt,SJ, Coon,H, Camp,NJ, Cawthon,RM, Wu,LL, Hopkins,PN: Linkage of creatinine clearance to chromosome 10 in Utah pedigrees replicates a locus for end-stage renal disease in humans and renal failure in the fawn-hooded rat. Kidney Int 62:1143-1148, 2002
16. Hunt,SC, Coon,H, Hasstedt,SI, Cawthon,RM, Camp,NJ, Wu,LL, Hopkins,PN: Linkage of serum creatinine and glomerular filtration rate to chromosome 2 in Utah pedigrees. Am J Hypertens 17:511-515, 2004

Diabetic Nephropathy, eGFR and Genome Scan
11
17. DeWan,AT, Arnett,DK, Atwood,LD, Province,MA, Lewis,CE, Hunt,SC, Eckfeldt,J: A genome scan for renal function among hypertensives: the HyperGEN study. Am J Hum Genet 68:136-144, 2001
18. Fox,CS, Yang,Q, Cupples,LA, Guo,CY, Larson,MG, Leip,EP, Wilson,PW, Levy,D: Genomewide linkage analysis to serum creatinine, GFR, and creatinine clearance in a community-based population: the Framingham Heart Study. J Am Soc Nephrol 15:2457-2461, 2004
19. Langefeld,CD, Beck,SR, Bowden,DW, Rich,SS, Wagenknecht,LE, Freedman,BI: Heritability of GFR and albuminuria in Caucasians with type 2 diabetes mellitus. Am J Kidney Dis 43:796-800, 2004
20. Bochud,M, Elston,RC, Maillard,M, Bovet,P, Schild,L, Shamlaye,C, Burnier,M: Heritability of renal function in hypertensive families of African descent in the Seychelles (Indian Ocean). Kidney Int 67:61-69, 2005
21. Placha,G, Poznik,GD, Dunn,J, Smiles,A, Krolewski,B, Glew,T, Puppula,S, Schneider,J, Rogus,JJ, Rich,SS, Duggirala,R, Warram,JH, Krolewski,AS: A genome-wide linkage scan for genes controlling variation in renal function estimated by serun cystatin C levels in extended families with type 2 diabetes. Diabetes 55:3358-3365, 2006
22. DeWan,AT, Arnett,DK, Miller,MB, Peacock,JM, Atwood,LD, Province,MA, Lewis,CE, Hunt,SC, Eckfeldt,JH: Refined mapping of suggestive linkage to renal function in African Americans: the HyperGEN study. Am J Hum Genet 71:204-205, 2002
23. Leon,JM, Freedman,BI, Miller,MB, North,KE, Hunt,SC, Eckfeldt,JH, Lewis,CE, Kraja,AT, Djousse,L, Arnett,DK: Genome scan of glomerular filtration rate and albuminuria: the HyperGEN study. Nephrol Dial Transplant 22:763-771, 2006
24. Knowler,WC, Coresh,J, Elston,RC, Freedman,BI, Iyengar,SK, Kimmel,PL, Olson,JM, Plaetke,R, Sedor,JR, Seldin,MF: The Family Investigation of Nephropathy and Diabetes (FIND): design and methods. J Diabetes Complications 19:1-9, 2005
25. Report of the Expert Committee on the Diagnosis and Classification of Diabetes Mellitus. Diabetes Care 20:1183-1197, 1997
26. Levey,AS, Bosch,JP, Lewis,JB, Greene,T, Rogers,N, Roth,D: Modification Diet Renal Dis Study Grp: A more accurate method to estimate glomerular filtration rate from serum creatinine: A new prediction equation. Ann Intern Med 130:461-470, 1999
27. S.A.G.E. Statistical Analysis for Genetic Epidemiology v5.0. (4.4), 2003 28. Shete,S, Jacobs,KB, Elston,RC: Adding further power to the Haseman and Elston method for
detecting linkage in larger sibships: weighting sums and differences. Hum Hered 55:79-85, 2003 29. Elston,RC: On Fisher's method of combining P-values. Biometrical J 33:339-345, 1991 30. Iyengar,SK, Abboud,HE, Goddard,KA, Saad,MF, Adler,SG, Arar,NH, Bowden,DW,
Duggirala,R, Elston,RC, Hanson,RL, Ipp,E, Kao,L, Kimmel,PL, Klag,MJ, Knowler,WC, Nelson,RG, Nicholas,SB, Pahl,MV, Parekh,RS, Rasooly,RS, Rich,SS, Scavini,M, Schelling,JR, Sedor,JR, Sehgal,AR, Shah,VO, Smith,MW, Winkler,CA, Zager,PG, Freedman,BI: Genome-Wide Scans for Diabetic Nephropathy and Albuminuria in Multi-Ethnic Populations: The FIND Study. Diabetes 56:1577-1585, 2006
31. Lander,E, Kruglyak,L: Genetic dissection of complex traits: guidelines for interpreting and reporting linkage results. Nat Genet 11:241-247, 1995
32. Hsu,CY, McCulloch,CE, Iribarren,C, Darbinian,J, Go,AS: Body mass index and risk for end-stage renal disease. Ann Intern Med 144:21-28, 2006
33. Hsu,CY, Vittinghoff,E, Lin,F, Shlipak,MG: The incidence of end-stage renal disease is increasing faster than the prevalence of chronic renal insufficiency. Ann Intern Med 141:95-101, 2004

Diabetic Nephropathy, eGFR and Genome Scan
12
34. Iyengar,SK, Freedman,BI, Sedor,JR: Mining the genome for susceptibility to diabetic nephropathy: the role of large-scale studies and consortia. Semin Nephrol 27:208-222, 2007
35. Krolewski,AS, Poznik,GD, Placha,G, Canani,L, Dunn,J, Walker,W, Smiles,A, Krolewski,B, Fogarty,DG, Moczulski,D, Araki,S, Makita,Y, Ng,DP, Rogus,J, Duggirala,R, Rich,SS, Warram,JH: A genome-wide linkage scan for genes controlling variation in urinary albumin excretion in type II diabetes. Kidney Int 69:129-136, 2006
36. Zanchi,A, Moczulski,DK, Hanna,LS, Wantman,M, Warram,JH, Krolewski,AS: Risk of advanced diabetic nephropathy in type 1 diabetes is associated with endothelial nitric oxide synthase gene polymorphism. Kidney Int 57:405-413, 2000
37. Asakimori,Y, Yorioka,N, Taniguchi,Y, Ito,T, Ogata,S, Kyuden,Y, Kohno,N: T-786-->C polymorphism of the endothelial nitric oxide synthase gene influences the progression of renal disease. Nephron 91:747-751, 2002
38. Liu,Y, Burdon,KP, Langefeld,CD, Beck,SR, Wagenknecht,LE, Rich,SS, Bowden,DW, Freedman,BI: T-786C polymorphism of the endothelial nitric oxide synthase gene is associated with albuminuria in the diabetes heart study. J Am Soc Nephrol 16:1085-1090, 2005
39. Sale,MM, Freedman,BI, Langefeld,CD, Williams,AH, Hicks,PJ, Colicigno,CJ, Beck,SR, Brown,WM, Rich,SS, Bowden,DW: A genome-wide scan for type 2 diabetes in African-American families reveals evidence for a locus on chromosome 6q. Diabetes 53:830-837, 2004
40. Vardarli,I, Baier,LJ, Hanson,RL, Akkoyun,M, Fischer,C, Rohmeiss,P, Basci,A, Bartram,CR, Van der Woude,FJ, Janssen,B: Gene for susceptibility to diabetic nephropathy in type 2 diabetes maps to 18q22.3-23. Kidney Int 62:2176-2183, 2002
41. Ewens,KG, George,RA, Sharma,K, Ziyadeh,FN, Spielman,RS: Assessment of 115 candidate genes for diabetic nephropathy by transmission/disequilibrium test. Diabetes 54:3305-3318, 2005
42. Janssen,B, Hohenadel,D, Brinkkoetter,P, Peters,V, Rind,N, Fischer,C, Rychlik,I, Cerna,M, Romzova,M, De Heer,E, Baelde,H, Bakker,SJ, Zirie,M, Rondeau,E, Mathieson,P, Saleem,MA, Meyer,J, Koppel,H, Sauerhoefer,S, Bartram,CR, Nawroth,P, Hammes,HP, Yard,BA, Zschocke,J, Van der Woude,FJ: Carnosine as a protective factor in diabetic nephropathy: association with a leucine repeat of the carnosinase gene CNDP1. Diabetes 54:2320-2327, 2005
43. Freedman,BI, Hicks,PJ, Sale,MM, Pierson,ED, Langefeld,CD, Rich,SS, Xu,J, McDonough,C, Janssen,B, Yard,BA, Van der Woude,FJ, Bowden,DW: A leucine repeat in the carnosinase gene CNDP1 is associated with diabetic end-stage renal disease in European Americans. Nephrol Dial Transplant 2007
44. Hwang,SJ, Yang,Q, Meigs,JB, Pearce,EN, Fox,CS: A genome-wide association for kidney function and endocrine-related traits in the NHLBI's Framingham Heart Study. BMC Med Genet 8:In press, 2007
45. Stevens,LA, Coresh,J, Greene,T, Levey,AS: Assessing kidney function--measured and estimated glomerular filtration rate. N Engl J Med 354:2473-2483, 2006
46. Lewis,J, Agodoa,L, Cheek,D, Greene,T, Middleton,J, O'Connor,D, Ojo,A, Phillips,R, Sika,M, Wright,J, Jr.: Comparison of cross-sectional renal function measurements in african americans with hypertensive nephrosclerosis and of primary formulas to estimate glomerular filtration rate. Am J Kidney Dis 38:744-753, 2001
47. Rule,AD, Larson,TS, Bergstralh,EJ, Slezak,JM, Jacobsen,SJ, Cosio,FG: Using serum creatinine to estimate glomerular filtration rate: accuracy in good health and in chronic kidney disease. Ann Intern Med 141:929-937, 2004
48. Vervoort,G, Willems,HL, Wetzels,JF: Assessment of glomerular filtration rate in healthy subjects and normoalbuminuric diabetic patients: validity of a new (MDRD) prediction equation. Nephrol Dial Transplant 17:1909-1913, 2002
Diabetic Nephropathy, eGFR and Genome Scan
13
49. Rogus,JJ, Warram,JH, Krolewski,AS: Genetic studies of late diabetic complications: the overlooked importance of diabetes duration before complication onset. Diabetes 51:1655-1662, 2002
Diabetic Nephropathy, eGFR and Genome Scan
14
APPENDIX A Members of the Family Investigation of Nephropathy and Diabetes Research Group Genetic Analysis and Data Coordinating Center, Case Western Reserve University, Cleveland, Ohio: SK Iyengar*, RC Elston**, KAB Goddard**, JM Olson**, S Ialacci#, C Fondran, A Horvath, G Jun, K Kramp, SRE Quade, M Slaughter, E Zaletel. Participating Investigation Centers: Case Western Reserve University, Cleveland, OH: JR Sedor*, JR Schelling**, AR Sehgal**, A Pickens#, L Humbert, L Goetz-Fradley. Harbor-University of California Los Angeles Medical Center: S Adler*, HE Collins-Schramm** §, E Ipp**, H Li** §, M Pahl**†, MF Seldin** §, J LaPage#, B Walker#, C Garcia, J Gonzalez, L Ingram-Drake. Johns Hopkins University, Baltimore, MD: M Klag*, R Parekh*, L Kao**, L Meoni**, T Whitehead, J Chester#. National Institute of Diabetes and Digestive and Kidney Diseases, Phoenix, AZ: WC Knowler*, RL Hanson**, RG Nelson**, J Wolford**, L Jones#, R Juan, R Lovelace, C Luethe, LM Phillips, J Sewemaenewa, I Sili, B Waseta. University of California, Los Angeles, CA: MF Saad*, SB Nicholas*, X Guo**, J Rotter**, K Taylor**, D Wang**, M Budgett, F Hariri#. University of New Mexico, Albuquerque, NM: P Zager*, V Shah**, M Scavini**, A Bobelu#. University of Texas Health Science Center at San Antonio, San Antonio, TX: H Abboud*, N Arar**, R Duggirala**, BS Kasinath**, R Plaetke**, M Stern**, C Jenkinson**, C Goyes#, V Sartorio, T Abboud, L Hernandez. Wake-Forest University, Winston-Salem, NC: BI Freedman* ‡, DW Bowden**, SC Satko**, SS Rich**, S Warren#, S Viverette, G Brooks, R Young, M Spainhour. Laboratory of Genomic Diversity, National Cancer Institute, Frederick MD: C Winkler*, MW Smith**, M Thompson, R Hanson#, B Kessing. National Institute of Diabetes and Digestive and Kidney Diseases program office: JP Briggs, PL Kimmel, R Rasooly. External Advisory Committee: D Warnock (chair), R Chakraborty, GM Dunston, SJ O’Brien (ad hoc), R Spielman. * Principal Investigator ** Co-investigator # Program Coordinator § University of California, Davis, CA † University of California, Irvine, CA ‡ Study Chair
Diabetic Nephropathy, eGFR and Genome Scan
15
TABLE 1. Description of genotyped families.
Ethnicity Pedigrees Individuals Sib Pairs
African Americans 96 229 166 American Indians 32 72 69
European Americans 54 133 126 Mexican Americans 196 507 521
Total 378 941 882

Diabetic Nephropathy, eGFR and Genome Scan
16
TABLE 2. Description of genotyped participants by phenotype.
Probands Affected sibs Unaffected sibs Sibs, diabetes <10 yrs P-value† P-value§
Number 347 360 146 88
Male, N (% of phenotype group) 169 (48.7) 165 (45.8) 43 (29.5) 29 (33.0) <0.0001 0.001
Age, years (SD) 57 (10.7) 57 (11.0) 59 (10.0) 54 (10.9) 0.141 0.143
Ethnicity, N (% of phenotype group) 0.322 0.047
African American 89 (25.6) 90 (25.0) 32 (21.9) 18 (20.5)
American Indian 30 (8.6) 34 (9.4) 7 (4.8) 1 (1.1)
European American 49 (14.2) 41 (11.4) 27 (18.5) 16 (18.2)
Mexican American 179 (51.6) 195 (54.2) 80 (54.8) 53 (60.2)
ESRD, N (% of phenotype group) 282 (80.8) 51 (13.6) 0 (0.0) 0 (0.0) <0.0001 <0.0001
Diabetes diagnosis age, years (SD) 34 (12.3) 41 (13.0) 42 (11.5) 52 (11.4) <0.0001 0.657
Diabetes duration, years (SD) 23 (8.4) 17 (9.4) 17 (7.0) 3.2 (2.6) <0.0001 0.443
BMI, kg/m2 (SD) 30 (7.2) 32 (9.1) 32 (7.3) 33 (7.8) 0.014 0.578
Hemoglobin A1c, % (SD) * 7.8 (1.8) 8.6 (2.5) 7.8 (2.0) 7.6 (1.8) 0.651 0.0008
Serum creatinine, mg/dl (SD) * 2.4 (1.4) 1.7 (1.3) 1.0 (0.2) 1.0 (0.2) <0.0001 <0.0001
Blood urea nitrogen, mg/dl (SD) * 43.1 (22.7) 25.5 (18.9) 15.7 (4.9) 14.1 (4.4) <0.0001 <0.0001
Urine albumin:creatinine ratio, g/g (SD) * 2.1 (1.9) 1.2 (1.1) 0.01 (0.01) 0.01 (0.01) <0.0001 <0.0001
Urine protein:creatinine ratio, g/g (SD) * 4.5 (4.3) 2.7 (5.1) 0.2 (0.2) 0.1 (0.1) <0.0001 <0.0001
eGFR, ml/min/1.73 m2 (SD) * 40.6 (27.9) 72.3 (37.3) 85.6 (24.5) 94.6 (24.2) <0.0001 0.008
* Data exclude subjects with ESRD † Comparison between probands and unaffected sibs § Comparison between affected and unaffected sibs Abbreviations: ESRD, end stage renal disease; BMI, body mass index; eGFR, GFR estimated by the MDRD equation

Diabetic Nephropathy, eGFR and Genome Scan
17
TABLE 3. Linkage analysis results for eGFR with nominal significance.
Chromosome Flanking Markers* Ethnicity cM† LOD-1
Coordinates Nominal p-
value§Empirical p-value§
LOD Score#
1 D1S235 D1S1609 MA 259 233,960,389-
242,132,680 3.45x10⁻⁵ 5.99x10⁻⁵ 3.78
All 3.63x10⁻³ 6.65x10⁻³ 1.87
2 D2S1352 D2S441 MA 82 50,687,218-
68,092,661 2.17x10⁻⁴ 3.80x10⁻⁴ 3.02
All 7.59x10⁻² 9.47x10⁻³ 1.73
7 D7S3070 D7S3058 MA 170 151,198,047-
154,198,999 2.68x10⁻⁵ 2.00x10⁻⁵ 4.23
All 2.06x10⁻⁴ 2.02x10⁻⁴ 3.28
8 D8S1136 D8S1119 MA 93 66,230,599-
87,241,316 2.81x10⁻⁵ 3.99x10⁻⁵ 3.95
All 4.60x10⁻⁴ 7.52x10⁻⁴ 2.75
11 D11S1981 D11S348 AA 20 17,042,780-
24,077,587 6.95x10⁻⁴ 2.29x10⁻³ 2.30
All 1.10x10⁻² 2.93x10⁻² 1.29
15 D15S1507 D15S131 AI 58 63,127,063-
68,971,161 5.65x10⁻⁴ 4.20x10⁻⁴ 2.98
All 3.31x10⁻³ 3.98x10⁻³ 2.08
18 D18S1371 D18S1390 MA 120 71,239,736-
75,953-069 1.70x10⁻⁴ 3.77x10⁻³ 2.10
All 2.67x10⁻³ 2.24x10⁻² 1.40
* For peaks at an exact marker location (chromosomes 1 and 8), flanking markers are on either side of the peak marker. If
the most significant p-value was not at a marker (chromosomes 2, 7, 11, 15 and 18), then the markers closest to the peak are defined as the flanking markers.
† Chromosomal positions correspond to the Marshfield map. Coordinate base pairs obtained from www.ensembl.org. § The nominal p-values from SIBPAL assume the regression coefficients are normally distributed; empirical p-values were
obtained using a permutation test with sufficient permutations to ensure with 95% confidence of being within 1.2 fold of the true p-value, with up to 50,000 replicate permutations.
# Calculated from the Empirical p-value according to the formula lod = Φ-1(1-½ p)/ 2 loge(10), where Φ is the distribution function of a chi-square variable with 1 degree of freedom.
Abbreviations: cM, centimorgan; MA, Mexican American; AA, African American; AI, American Indian; NA, not applicable

Diabetic Nephropathy, eGFR and Genome Scan
18
TABLE 4. Comparison with other DN and DN-related genome scans and candidate gene studies Cytogenetic locus Gene name Phenotype Marker/SNP ID Physical distance (Mb) Reference
1q43 DN/eGFR D1S547 240
2p13.3 DN/eGFR D2S441 68
7q36.1 DN/eGFR D7S3070 151 7q33 DN D7S500 135 (6) 7q34 eGFR 138 (23) 7q36 NOS3 DN,ESRD 150 (36-38)
7q36.2 DN/Ualb D7S798 152 (35) GATA30D09N 153
8q13.3 DN/eGFR D8S2324 74
11p15.1 DN/eGFR D11S348 18 11p13 CAT DN rs1049982 34 (41)
rs560807 rs12594610
15q22.3 DN/eGFR D15S131 69 15q22.33 SMAD3 DN rs4776890 65 (41)
rs12594610 15q25.3 DN D15S996 89 (30)
18q22.3 DN/eGFR D18S1371 71 18q21.33 BCL2 DN rs1481031 59 (41)
rs12457700 rs2062011
18q22.3-q23 DN D18S58 70 (40) 18q22.3 CNDP1 DN D18S880 70 (42;43) 18q22.3 Diabetes D18S1371 71 (39) 18q22.3 DN D18S1371 71 (30)
Loci and associated data identified in this study are shown in bold font. Abbreviations: DN, diabetic nephropathy, as defined by composite phenotype parameters; Ualb, urine albumin; eGFR, estimated GFR by MDRD equation, Ualb, urine albumin excretion, SNP, single nucleotide polymorphism; Mb, megabases; NOS3, nitric oxide synthase-3 gene; CAT, catalase gene; SMAD3, mothers against decapentaplegic 3 gene; BCL2, B-cell leukemia/lymphoma 2 gene; CNDP1, carnosinase gene.

Diabetic Nephropathy, eGFR and Genome Scan
19
FIGURE LEGENDS Figure 1. Multipoint results of the genome wide linkage scan for eGFR on 22 autosomes after adjusting for co-variates diabetes duration and ACE inhibitor or ARB use. For each chromosome, genetic distance (cM) is plotted on the X-axis against –log10 (p-value) on the Y-axis with corresponding LOD score scale. Data are presented for each ethnicity separately and ethnicity-combined analyses. Lower horizontal dotted lines represent suggestive evidence (p = 7.4 x 10⁻⁴) and upper horizontal lines show threshold for evidence (p = 2.2 x 10⁻⁵) of linkage by Lander-Kruglyak criteria (31). Figure 2. Detailed genome scans for linkage with eGFR. A, Chromosomes 1, 2, 7, 8 and 18 data for MA; B, chromosome 11 for AA; C, chromosome 15 for AI. Curves representing data adjusted for the co-variates diabetes duration and ACE inhibitor/ARB use are shown with solid lines, whereas curves for unadjusted data are shown with broken lines. Chromosomal position in cM is shown along upper X-axis, microsatellite marker locations are shown along lower X-axis, and –log p-values are shown along Y-axis with corresponding LOD score scale. Lower horizontal dotted lines represent suggestive evidence (p = 7.4 x 10⁻⁴) and upper horizontal lines show threshold for evidence (p = 2.2 x 10⁻⁵) of linkage by Lander-Kruglyak criteria (31).

Diabetic Nephropathy, eGFR and Genome Scan
20
FIGURE 1

Diabetic Nephropathy, eGFR and Genome Scan
21
FIGURE 2


![[Diabetic nephropathy and cardiac disease]](https://img.pdfslide.net/doc/110x75/634dfd2d92e70b3087022c72/diabetic-nephropathy-and-cardiac-disease.jpg)


