Embed Size (px)
Citation preview

GENOMICS-BASED ANALYSIS OF ANTIBODY RESPONSE TO
SHEEP RED BLOOD CELLS IN CHICKENS
TUOYU GENG
Dissertation submitted to the Faculty of the Virginia Polytechnic Institute and State University in
partial fulfillment of the requirements for the degree of
DOCTOR OF PHILOSOPHY
In
Animal and Poultry Sciences
Dr. Edward J. Smith, Chairman
Dr. Bennet Cassell
Dr. Eric M. Hallerman
Dr. Malcolm Potts
Dr. M.A. Saghai Maroof
Dr. Zhijian Tu
May 18, 2007
Blacksburg, Virginia
Keywords: Antibody Response to Sheep Red Blood Cells, Gallus gallus,
Quantitative Trait Locus
Copyright 2007, TUOYU GENG

ii
GENOMICS-BASED ANALYSIS OF ANTIBODY RESPONSE TO
SHEEP RED BLOOD CELLS IN CHICKENS
By
Tuoyu Geng
(ABSTRACT)
Immune response provides vertebrates an important mechanism to fight pathogens and to
reduce the incidence of diseases. Defining the molecular basis of antibody response may
facilitate genetic improvement in the immune response of animals to pathogens. For almost 4
decades, antibody titers in response to challenge by sheep red blood cells (anti-SRBC) have
provided an investigative tool in the efforts to define molecular mechanisms that underlie
vertebrate immune response. The overall objective of this dissertation research was to identify
DNA markers associated with anti-SRBC response in chickens. Specific objectives were: to
develop a resource population for QTL analysis for anti-SRBC, to identify DNA markers and
genes associated with primary anti-SRBC, and to evaluate the allelic frequencies in non-selected
chicken populations of candidate markers associated with either high or low anti-SRBC response.
These objectives tested the hypothesis that genetic control of a chicken’s response to SRBC is
polygenic. The resource population developed consisted of F1, backcross, and F2 derived from
reciprocal crosses of birds from parental lines in the 28th generation of divergent selection for
low (L) and high (H) anti-SRBC. The mean anti-SRBC titers of the parental lines were
significantly different, with 11.5 for H and 2.6 for L (P<0.05). That for the 4 groups of F2
progeny ranged from 6.3 to 7.5, while those of the 8 groups of backcross progeny ranged from
3.9 to 13.3. Four of 555 random primers used to screen the parental H and L anti-SRBC lines

iii
were informative by amplifying seven line-specific fragments (P<0.0025). Each of the 7 line-
specific fragments was converted to a sequence characterized amplified region (SCAR) within
which single nucleotide polymorphisms (SNPs) were identified and tested for association with
anti-SRBC. Only two of the seven SCARs in the parental lines were associated (P<0.05) with
anti-SRBC level in the backcross resource population. Additionally, from analysis of the parental
L and H anti-SRBC lines using microarrays, a total of 57 line-specific SNPs were also identified.
Twenty of the line-specific SNPs were in and/or near genes previously reported to have
immunity-related function. Microarray-based gene expression profiling of pooled RNA samples
from L and H anti-SRBC birds identified three differentially expressed genes. In summary, this
dissertation describes resources that include candidate SCARs and SNPs as well as differentially
expressed genes that may be useful for the identification of genes that underlie antibody response.
Keywords: Antibody Response to Sheep Red Blood Cells, Gallus gallus, Quantitative Trait
Locus

iv
ACKNOWLEDGEMENTS
I would like to express my deepest thanks to my advisor, Dr. Ed Smith, for providing me
the opportunity to pursue my Ph.D. degree at Virginia Tech and to work in your laboratory as a
visiting scientist and a research associate before my Ph.D. program. Thank you for your strong
academic and financial support. Thank you for allowing me to participate in multiple projects in
addition to my dissertation research, which greatly expanded my scientific knowledge and skills.
I also thank you for giving me very useful guidance, respect and freedom, a lot of timely help
and encouragement, and some philosophy of life that will benefit my scientific life and beyond.
All you did has contributed to my growth into a scientifically independent and innovative person.
I wish to thank the other members of my committee, including Drs. Bennet Cassell,
Malcolm Potts, M. A. Saghai-Maroof and Zhijian Tu, with a great sense of gratitude for serving
on my graduate committee and giving me a plenty of support, help, encouragement and advice. I
especially thank Dr. M.A. Saghai-Maroof for giving me free access to your staff and equipment
in your laboratory for help with my microarray experiment. Special thanks also extend to Dr.
Bennet Cassell and Dr. Zhijian Tu for serving as my referees during my job search.
I also would like to thank Dr. Eric Hallerman for your willingness to be my proxy
committee member since Dr. Malcolm Potts was out of the country.
I am grateful to Thomas O’Hare for developing the resource population of chickens and
identifying one line-specific RAPD fragment for my dissertation research.
I wish to thank many people who gave me support and help in different ways. I especially
thank Dr. Ruslan Biyashev, Cassie Sather, Kathryn MacKinnon and Dr. Joan Burnside for
technical support with Chicken13k microarray experiment, Dr. Amy Brunner, Elizabeth
Etherington and Dr. Chieh-Ting Wang for help with the use of nano-spectrometer, Drs. Curtis

v
Novak and Audrey McElroy for making feed formula and allowing me to use your facility on the
farm and to collect blood from your Cobb chickens, Drs. Asim Esen and Farooqahmed Kittur for
help with learning ELISA, Dr. Paul Siegel, Barbara Self and Christa Honaker for help with
antibody titration, Dr. Dave Notter, Kathryn MacKinnon and Randy Borg for help with sheep
blood collection, Drs. Hans Cheng and Dr. Jerry Dodgson for coordinating microarray-based
SNP genotyping, Dr. Eric Wong for allowing me to access equipment in your lab, Kwaku
Gyenai, Curt Porterfield, Dale Shumate, Xiaojing Guan, Jun Xu and Dr. Haitham Yakout for
taking care of my birds and help with sample collection, Drs. Larry A. Kuehn and Ina Hoeschele
for statistical consultation, Barbara Devinney and Dr. Pradeepa for proof reading, and Dr. Kenny
Webb, Ellie Stephens, Cindy Hixon and Rita Harris for your administrative support.
I am also grateful to the Virginia Agricultural Council for providing partial financial
support, to Adam Jerauld, Megan Ferringer and Dr. Clive Evans in VBI Core Laboratory for
determining the quality and concentration of my RNA samples with BioAnalyzer and performing
GeneChip assays with those samples, and to staff at Illumina, Inc. for performing microarray-
based SNP genotyping assays with my chicken DNA samples.
I appreciate the friendship from Davida Kamara, Xiaojing Guan, Kwaku Gyenai and Jun
Xu. Thank you for your support, help and encouragement. I also appreciate the chance to interact
with my lab-mates and students working in the lab because I learned something new from you as
I provided you with some technical support and consultation.
Last, my deepest thanks go to my parents, my wife, my brother and my daughter. Thank
you all for love, support and encouragement no matter what situation I am in and no matter what
decision I make.

vi
DEDICATION
To my wife, Yan Jiang, and my daughter, Tianren Grace Geng

vii
TABLE OF CONTENTS Page
ABSTRACT.................................................................................................................................ii ACKNOWLEDGEMENTS.......................................................................................................iv DEDICATION............................................................................................................................vi TABLE OF CONTENTS..........................................................................................................vii ABBREVIATIONS....................................................................................................................xi LIST OF TABLES....................................................................................................................xiii LIST OF FIGURES....................................................................................................................xv
CHAPTER 1: Introduction......................................................................................................1
CHAPTER 2: Review of literature.........................................................................................6
2.1 Introduction........................................................................................................................6 2.2 The domestic chicken.........................................................................................................9
2.2.1 The chicken as a food animal.......................................................................................9 2.2.2 The chicken as a model for study vertebrate immune response.................................10
2.3 The immune system..........................................................................................................11 2.3.1 The innate immune system.........................................................................................11 2.3.2 The adaptive immune system.....................................................................................14
2.3.2.1 Antibody-mediated immunity.............................................................................15 2.3.2.2 Cell-mediated immunity.....................................................................................16
2.3.3 Innate and adaptive immunity....................................................................................18 2.3.3.1 Links formed by dendritic cell............................................................................18 2.3.3.2 Links formed by the complement system...........................................................20
2.3.4 Characteristics and dynamics of antibody mediated immunity..................................21 2.3.5 The association of AMI with disease resistance.........................................................23
2.4 Chicken resource populations for QTL analysis ..........................................................27 2.4.1 Quantitative trait locus………………………………................................................27 2.4.2 The chicken as a model for QTL analysis in vertebrates............................................27 2.4.3 Inbred lines versus divergently selected lines.............................................................29
2.4.3.1 Inbred lines..........................................................................................................29 2.4.3.2 Divergently selected lines....................................................................................31
2.4.4 Genetic lines divergently selected for anti-SRBC.......................................................32
viii
2.5 Approaches to identification of QTLs.............................................................................34 2.5.1 Structural genomics-based approaches.......................................................................35
2.5.1.1 Genetic markers...................................................................................................35 2.5.1.2 Genetic map.........................................................................................................42 2.5.1.3 Linkage-based QTL mapping..............................................................................43 2.5.1.4 Linkage disequilibrium........................................................................................48 2.5.1.5 LD-based mapping..............................................................................................50
2.5.1.5.1 LD-based association study.........................................................................50 2.5.1.5.2 LD-based QTL fine mapping......................................................................51
2.5.2 Functional genomics-based approaches .....................................................................53 2.5.2.1 Microarray-based expression profiling...............................................................53 2.5.2.2 Variability in microarray analysis ......................................................................54 2.5.2.3 Microarray data analysis ....................................................................................57
2.5.2.3.1 Low-level analysis .....................................................................................57 2.5.2.3.2 High-level analysis ....................................................................................58
2.5.2.4 Microarray-based identification of QTL for immune responses........................60 2.5.3 In-silico genomics-based approaches.........................................................................61
2.5.3.1 In-silico genomics...............................................................................................61 2.5.3.2 In-silico genomics-based identification of QTL for immune responses............61
2.6 Molecular basis of antibody-mediated immunity.........................................................62 2.6.1 Genes associated with antibody-mediated immunity................................................62 2.6.2 Genetic markers associated with antibody-mediated immunity................................62
2.7 Summary of the literature review..................................................................................63
CHAPTER 3: Development and characterization of resource populations for QTL mapping.....................................................................................................................................65
3.1 Abstract............................................................................................................................65 3.2 Introduction….................................................................................................................66 3.3 Materials and Methods...................................................................................................67
3.3.1 Animals and crosses..................................................................................................67 3.3.2 Preliminary assessment of the usefulness of the resource population......................68 3.3.3 Statistical analysis.....................................................................................................69
3.4 Results and Discussion...................................................................................................69 3.4.1 Phenotypes in the resource population.....................................................................69

ix
3.4.2 Informativeness of the resource population................................................................70
CHAPTER 4: Identification of candidate DNA markers associated with primary antibody response to sheep red blood cells in chicken......................................................75
4.1 Abstract..............................................................................................................................75 4.2 Introduction.......................................................................................................................76 4.3 Materials and Methods.....................................................................................................77
4.3.1 Animals, DNA samples, and template preparation.....................................................77 4.3.2 Randomly amplified polymorphic DNA (RAPD) analysis.........................................78 4.3.3 SNP analysis................................................................................................................78 4.3.4 Bioinformatics analysis...............................................................................................79 4.3.5 Statistical analysis.......................................................................................................79
4.4 Results................................................................................................................................80 4.4.1 Sequence analysis and mapping..................................................................................80 4.4.2 SNP analysis................................................................................................................82 4.4.3 Bioinformatics analysis...............................................................................................82
4.5 Discussion...........................................................................................................................83
CHAPTER 5: RFLP-based analysis of candidate markers for antibody production in different populations..........................................................................................................110
5.1 Abstract............................................................................................................................110 5.2 Introduction.....................................................................................................................111 5.3 Materials and Methods...................................................................................................112
5.3.1 Animals and genomic DNA......................................................................................112 5.3.2 Candidate markers associated with anti-SRBC titers................................................112 5.3.3 Restriction fragment length polymorphism..............................................................113
5.4 Results and Discussion...................................................................................................113
CHAPTER 6: Microarray-based SNP analysis of chickens identified as either high or low anti-SRBC response..................................................................................................117
6.1 Abstract...........................................................................................................................117 6.2 Introduction....................................................................................................................118 6.3 Materials and Methods..................................................................................................119
6.3.1 Animals and DNA samples......................................................................................119

x
6.3.2 Microarray-based SNP analysis................................................................................120 6.3.3 Bioinformatics analysis............................................................................................120
6.4 Results and Discussion....................................................................................................121 6.4.1 SNP typing assays.....................................................................................................121 6.4.2 SNPs associated with anti-SRBC titers.....................................................................121 6.4.3 Candidate genes for anti-SRBC titers.......................................................................122
CHAPTER 7: Microarray-based differential expression analysis of low and high anti-SRBC titers......................................................................................................................132
7.1 Abstract...........................................................................................................................132 7.2 Introduction....................................................................................................................134 7.3 Materials and Methods..................................................................................................136
7.3.1 Animals and tissue collection...................................................................................136 7.3.2 Total RNA isolation and pooling.............................................................................137 7.3.3 Microarray assay......................................................................................................137 7.3.4 Microarray data analysis..........................................................................................138 7.3.5 Bioinformatics analysis............................................................................................139
7.4 Results.............................................................................................................................139 7.4.1 Anti-SRBC titers......................................................................................................139 7.4.2 Quality profile of raw data.......................................................................................139 7.4.3 Differentially expressed genes.................................................................................140
7.5 Discussion.......................................................................................................................141
OVERALL SUMMARY.........................................................................................................152 LITERATURE CITED............................................................................................................155 VITA..........................................................................................................................................188

xi
ABBREVIATIONS
Ab Antibody
AFLP Amplified fragment length polymorphism
ALV Avian leukosis virus
AMI Antibody-mediated immunity
ANOVA Analysis of variance
Anti-SRBC Antibody response to sheep red blood cell
APC Antigen presenting cell
BC Backcross
BLAST Basic local alignment search tool
CD cluster designation
cDNA Complementary DNA
cM centiMorgan
CMI Cell-mediated immunity
DC Dendritic cell
DE Differentially expressed
EST Expressed sequence tag
FDR False discovery rate
GLM General linear model
GO Gene ontology
H High antibody response to sheep red blood cell
IBD Identical by descent
Ig Immunoglobulin
IL Interleukin
L Low antibody response to sheep red blood cell
LD linkage disequilibrium
LOD Logarithm of odds
Mb Mega-base
mDC Matured dendritic cell
MDV Marek’s disease virus

xii
MHC Major histocompatibility complex
mRNA Message RNA
NIL Near-isogenic line
PCR Polymerase chain reaction
PD Protein Domain
PRR Pattern recognition receptor
QTL Quantitative trait locus
RAPD Randomly amplified polymorphic DNA
RFLP Restriction fragement length polymorphism
Rfp Restriction fragement pattern
RH Radiation hybridization
RIL Recombinant inbred line
RIR Rhode Island Red chicken
RT-PCR Reverse transcription-polymerase chain reaction
SCAR Sequence characterized amplified region
SNP Single nucleotide polymorphism
SRBC Sheep red blood cell
SSR Simple sequence repeat
STS Sequence-tagged site
Tc Cytotoxic T cell
TDT Transmission disequilibrium test
Th Helper T cell
TLR Toll-like receptor
VDJ Variable-Diversity-Joining
VNTR Variable number of tandem repeats
WPR White Plymouth Rock chicken

xiii
LIST OF TABLES
Table 3.1. Means and standard deviations of antibody response by birds in the high-, low-,
backcross-, and F2-resource populations five days post-injection of sheep red blood cells…....72
Table 3.2. Allele frequencies of candidate microsatellite markers that were previously identified
as associated with immune response.............................................................................................73
Table 4.1. Size and frequency distribution of selected RAPD fragment in the parental lines......87
Table 4.2. Sequence characterized amplified region candidate DNA markers for anti-SRBC….88
Table 4.3. Single nucleotide polymorphism within and around sequence characterized amplified
regions and the associations of the SNPs with anti-SRBC in the resource populations...............89
Table 4.4. The differences in anti-SRBC titers between genotypes of selected SNP for each
candidate marker in the backcross population..............................................................................92
Table 4.5. Genotypes of the candidate markers in the East Lansing reference mapping panel....93
Table 4.6. Typing scores of candidate markers associated with antibody titers to sheep red blood
cells using radiation hybrid panel..................................................................................................94
Table 4.7. Pairwise linkage disequilibrium analysis in backcross population..............................95
Table 4.8. Case-control based association analyses of each SNP and haplotype with anti-SRBC
titers in backcross population........................................................................................................97
Table 4.9. Candidate genes located near each candidate DNA marker.........................................99

xiv
Table 5.1. Characteristics and population frequency distribution of variant nucleotides in six
chicken DNA sequences..............................................................................................................115
Table 6.1. The informative SNPs that had at least one allele for each SNP being line-
specific.........................................................................................................................................124
Table 6.2. The characteristics of the line-specific SNPs that were line-specific for both lines
.....................................................................................................................................................128
Table 6.3. Distributions of SNPs with different characteristics over the chicken
chromosomes...............................................................................................................................131
Table 7.1. The summary of mean anti-SRBC titers for the chickens challenged with
SRBC..........................................................................................................................................145
Table 7.2. The quality profile of the raw data from the microarray experiments.......................146
Table 7.3. Characteristics of genes that were differentially expressed between high and low
antibody-producing chickens......................................................................................................147
Table 7.4. Characteristics of genes that were differentially expressed between non-challenge and
average anti-SRBC groups of chickens......................................................................................148
Table 7.5. Gene classification test of the genes differentially expressed between high and low
antibody-producing chickens......................................................................................................149
Table 7.6. Gene class test of the genes differentially expressed between non-challenge and
average anti-SRBC groups of chickens......................................................................................150

xv
LIST OF FIGURES
Figure 3.1. Resource population development scheme.................................................................74
Figure 4.1. Summary of procedures in the study of RAPD- and SCAR-based QTL analysis for
anti-SRBC response.....................................................................................................................100
Figure 4.2. Line-specific RAPD fragment detected within DNA pools and individual samples
from birds with low and high antibody response using random primer......................................101
Figure 4.3. A CONSED-generated trace and alignment showing a single nucleotide
polymorphism detected in a candidate DNA marker in the parental lines..................................102
Figure 4.4. Genotype frequency of the representative SNP varying with different phenotypes-
high antibody titers and low antibody titers................................................................................103
Figure 4.5. The chromosomal location of marker VTC02..........................................................104
Figure 4.6. The chromosomal location of marker VTC06..........................................................105
Figure 4.7. Sample of gel pattern for radiation hybridization mapping of one candidate marker
using the RH panel......................................................................................................................106
Figure 4.8. The pairwise linkage disequilibriums between SNPs within each candidate marker
and flanking sequences...............................................................................................................107
Figure 4.9. An example of permutation test on the case-control association analysis of each
marker and haplotype with anti-SRBC titers.............................................................................109
Figure 5.1. SYBR green-stained agarose gel patterns of PCR-RFLP genotypes based on the
variant nucleotide in each of the 6 loci analyzed.......................................................................116

1
CHAPTER 1
Introduction
Focus on agricultural and biomedical studies has shifted from analysis of monogenic to
polygenic traits. Although new analytical tools and genomic data have emerged in the post-
Human Genome Project era, identification of genes underlying polygenic traits remains a
significant challenge. This is probably because identification and characterization of most genes
with small effects are complicated by multiple influences of genetic and environmental noise,
epistasis, and epigenetics (Andersson and Georges, 2004).
An economically important trait in livestock and poultry for which gene identification
continues to be a challenge is immune response, which can be either cellular or humoral. The
primary effectors of cellular immunity are various immune cells, including neutrophils and
cytotoxic T cells (Faurschou and Borregaard, 2003; Bleackley, 2005; Waterhouse et al., 2004),
while those for humoral immunity are antibodies (Harnett et al., 2005). This dissertation research
focused on humoral or antibody response, a polygenic trait (Feingold et al., 1976; Biozzi et al.,
1979; Gross and Siegel, 1980).
Antibodies provide vertebrates an important mechanism to resist invasions and infections
from diverse pathogens. Therefore, a strong antibody-producing ability could have important
implications in animal agriculture and human medicine. Antibody response includes different
cellular and molecular components, as well as cross-communication with cell-mediated
immunity, suggesting that the underlying mechanism is complex. Efforts have focused on
defining the molecular basis of this mechanism in different animals, including chickens (Berek,
1989; Brunner et al., 1995; George et al., 1992; Becker et al., 2005). Identification of the

2
polygenes or quantitative trait loci (QTL) associated with antibody response to SRBC, as
proposed here, will provide a foundation to significantly advance these efforts.
Antibody levels are important dynamic parameters of immune response as they partially
reflect the potential of an animal to resist pathogen infection. The evidence that antibody level is
controlled by multiple genes, thus leading it to the possibility of improvement by selection, has
been based on work in diverse species including mouse (Feingold et al., 1976; Biozzi et al., 1979;
Ibanez et al., 1988), chicken (Siegel and Gross, 1980; Van der Zijpp et al., 1983), and guinea pig
(Ibanez et al., 1980). In addition to many reports on the genetics of immune response, some
genomic studies have described candidate DNA markers associated with antibody production in
lines divergently selected for high or low levels of antibodies produced in response to a
challenge by heterogeneous erythrocytes such as sheep red blood cells (Puel et al., 1995, 1996).
Compared to specific antigens such as a virus or bacterium, use of heterogeneous
erythrocytes in antibody response-related studies has two distinct advantages. First,
heterogeneous erythrocytes are multi-determinant and strongly immunogenic antigens. This
heterogeneity increases the likelihood of identifying more QTLs associated with antibody
production. Studies in mice involving heterogeneous erythrocytes described by Puel et al. (1995,
1996), for example, reported genes including background genes unlinked to immunomodulatory
genes at the major histocompatibility complex (MHC) and the immunoglobulin heavy chain (Igh)
loci that appeared to influence antibody response. Second, selection for antibody response to
heterogeneous erythrocytes may improve general natural disease resistance of vertebrates. This is
supported by the observation that selection for antibody response to heterogeneous erythrocytes
was correlated with disease resistance to multiple pathogens (Gross et al., 1980).

3
Genetic lines divergently selected for high or low antibody titers to SRBC (anti-SRBC)
have been established in both mouse (Biozzi et al., 1972; Feingold et al., 1976), chicken (Siegel
and Gross, 1980; Van der Zijpp et al., 1983), and guinea pig (Ibanez et al., 1980). These lines
provide unique resources for dissecting the molecular basis of antibody response. This is because
selection leads to fixation or near fixation of a favorable allele and the flanking regions in the
selected populations or lines (Andersson and Georges, 2004; Siegel et al., 2006). This change in
allelic frequency due to selection facilitates the identification of QTLs associated with the
selected trait through linkage analysis or linkage disequilibrium (LD)-analysis. For example,
from screening mice divergently selected for high or low anti-SRBC titers, Puel et al. (1995,
1996) described several chromosomal regions containing QTL with significant effect on anti-
SRBC as well as genes located in MHC and Igh loci. However, linkage analysis only narrows the
location of a QTL to a region containing numerous genes, but rarely leads to the identification of
the causative genes for the trait.
The limitations of linkage analysis for QTL identification are believed to be overcome by
LD, as it has been shown to facilitate the identification of QTLs with small effects as well as a
higher statistical power (Risch and Merikangas, 1996). Based on frequency differences, genes
that affect a trait of interest may be identified through LD-based QTL mapping (Keightley et al.,
1993). Genome-wide scanning tools also have been used in LD-based identification of QTLs or
genetic markers associated with QTLs. Although the LD-based approaches are advantageous in
mapping efficiency, their use in QTL mapping in livestock and poultry remains limited.
A tool that has been used to search for markers associated with QTLs in genome-wide
scans is the randomly amplified polymorphic DNA (RAPD) technique. First described by
Williams et al. (1990), RAPD involves the use of arbitrary primers to amplify DNA fragments

4
when they bind to a DNA template. Using RAPD in a genome-wide scan, Martin et al. (1991)
and Gu et al. (1998) identified markers linked to a Pseudomonas resistance gene in tomato and to
progressive rod-cone degeneration in dogs, respectively.
Microarray-based expression profiling is another genome-wide analysis tool that has
recently been used for QTL analysis. It enables parallel comparisons of gene expression levels
on a genome scale. Combining microarray analysis with QTL analysis may facilitate the
identification of causative genes from candidate markers for the selected phenotype. For example,
Buhr et al. (2006) identified three major candidate genes for experimental inflammatory bowel in
human using this approach. To our knowledge, microarray-based transcription profiling for
antibody response to SRBC in vertebrates has not been described. Such a study may facilitate
identification of genes influencing anti-SRBC titers by complementing linkage- and LD-based
QTL analysis.
To date, anti-SRBC candidate genes reported from previous investigations have not
provided markers with a universal appeal or that are informative in other chicken populations
(Yonash et al., 2001; Siwek et al., 2003; Zhou et al., 2003). Therefore, this dissertation research
had, as its primary objective, the identification of candidate markers associated with the level of
anti-SRBC titers in the chicken. To accomplish this objective, an appropriate resource population
was necessary. The first part of the dissertation describes this resource and its use to discover
candidate markers for anti-SRBC. In the second part, the genome distribution of the candidate
markers was determined using genetic and radiation hybridization mapping approaches. Further,
the markers were evaluated in backcross population and PCR-RFLP methods were developed for
genotyping 30 birds from each of 7 other chicken populations with one of the informative SNPs
within the markers. In the final part of the dissertation, randomly bred birds were evaluated

5
through microarray-based gene expression QTL analysis for association of levels of anti-SRBC
titers with candidate markers identified in the resource population. The dissertation research is
primarily a resource-driven project, although it is based on the hypothesis that differences among
chickens for anti-SRBC titers are polygenic. The dissertation will describe the resources that
could provide a foundation for improving the natural immune capacity of chicken and thus
reduce the use of antibiotics and the susceptibility to unknown pathogens.

6
CHAPTER 2
Review of literature
2.1 Introduction
The chicken (Gallus gallus) is important both to agriculture as a food animal and to
biomedical science as a model for biomedical research, respectively. After beef cattle and hog,
the chicken is the third largest food animal in consumption and gross farm receipts. As a model
organism, the chicken has provided important insights into vertebrate biology that includes
genetics and developmental biology (Osterrieder et al., 2006; Dupin et al., 1998; Mello and Tuan,
1998; Pain et al., 1996). For example, the chicken has been used as a model for investigating the
heredity of spontaneous autoimmune thyroiditis (Cole, 1966; Cole et al., 1968), genetic
dwarfism (Hull and Harvey, 1999), and vertebrate limb development (Tickle, 2004). The
chicken’s use as a model organism is due to several advantages including a short generation
interval, large family size, and extensive published knowledge about its physiology, nutritional
requirements, and genetics. Discoveries about the chicken’s immune response, the primary goal
of this dissertation, may prove applicable to other vertebrates.
The immune system is of primary importance in vertebrates, including the chicken,
because of its significant impact on general well-being and productivity. It is a critical part of the
defense mechanism of vertebrates against pathogens. Immune response is the function of the
immune system, which is either innate or adaptive. The innate immune system is characterized
by quick response with low level of specificity for antigen recognition. Inflammation is one of
the mechanisms used by the innate immune system to control the spread of pathogens. It mainly
relies on the functions of neutrophils and mononuclear phagocytes. In contrast, the adaptive
immune system has a mechanism to mount stronger and more efficient immune response to the

7
invading pathogens. This is because the B and T lymphocytes, which form the cellular
components of immune response, have the ability to recognize specific antigens. B cells are
primarily responsible for antibody-mediated immunity, although one important mechanism by
which they are activated requires the function of helper T cells (Holdsworth et al., 1999; Infante-
Duarte and Kamradt, 1999; Mitchison et al., 1999; Berenson et al., 2004). In comparison, T cells
are the major effectors of cell-mediated immunity. Although the innate and adaptive immune
systems have separate mechanisms and distinctive features for fighting pathogens, they are
interconnected by dendritic cells, the professional antigen presenting cells, and/or by the
complement system. Both systems contribute to natural disease resistance of vertebrates. Several
genetic factors influencing both antibody response and disease resistance have been identified,
including the major histocompatibility complex, immunoglobulin, cytokines and endogenous
viral genes.
Divergently selected lines that originate from a non-inbred base population provide
unique resources for studying the molecular basis of quantitative traits like immune response.
Compared to inbred lines, the commonly-used resource populations, the divergently selected
lines provide some advantages for QTL mapping. One advantage is that QTLs associated with
the selected trait could be directly identified based on the difference in allelic frequency of
markers between the divergently selected lines. This is because selection could lead to fixation or
near-fixation of a favorable allele and an unfavorable and its flanking regions in each of the
respective lines (Andersson and Georges, 2004). If appropriate genome-wide scan tools, such as
RAPD, are employed to screen for line-specific or nearly line-specific markers, the QTLs under
strong selection could be identified without using linkage analyses. Another advantage is that
most QTLs that underlie a selected trait could be identified because the divergently selected lines

8
that originate from a non-inbred base population generally do not have the problems associated
with inbreeding. For example, it is possible for a QTL to be non-polymorphic or marginally
different in gene effect between inbred lines because inbreeding greatly reduces polymorphism.
Experimental lines of both mice and chickens divergently selected for high or low anti-
SRBC response have been developed. The mouse lines have been used for identification of QTL
or DNA markers associated with anti-SRBC. However, this study was based on linkage analysis.
One of the shortcomings of linkage-based QTL analysis is that it cannot provide information
about the precise location of a QTL. Linkage disequilibrium-based QTL mapping, which utilizes
LD resulted from historical recombination events to map QTL, may be better in QTL mapping
efficiency. For example, it can be used for identifying QTLs with small effects, QTL fine-
mapping, and increasing the power of QTL detection given a small sample size (Risch and
Merikangas, 1996).
In addition to structural genomics approaches, functional and in-silico genomics also
have been used for QTL analysis. In the functional genomics, microarray-based transcription
profiling provides a powerful tool for QTL identification. However, this technology is still
developing. Issues of concern that relate to variability and data analysis should be considered
carefully in microarray experiments focused on identifying QTLs. In comparison with the
experimental approaches mentioned above, the in silico genomics-based analysis provides a
convenient approach for transferring QTL information from one species to another.
In this review, the roles of the chicken as a food animal and a model animal for immune-
related QTL analysis are discribed. Emphasis will be on recent findings from genomics
investigations that appear to increase our understanding of the molecular mechanisms that
underlie vertebrate immune response, especially the regulation of antibody levels. The review

9
includes a discussion of the value of resource populations to mapping of QTLs associated with
economically important traits in livestock and poultry. This will be followed by a review of
genomics-based approaches for QTL analysis. The limits of the new and old QTL analysis
methods will be discussed. Specific reports from published QTL analysis investigations of anti-
SRBC response will be summarized.
2.2 The domestic chicken
2.2.1 The chicken as a food animal
The chicken (Gallus gallus) is raised both for meat and egg, making it the most
significant avian food species. Several characteristics of the chicken contribute to its importance
as the foremost poultry and egg bird. First, chicken meat and eggs provide one of the most
important sources of animal protein for the human population worldwide. In 2005, chicken meat
accounted for about 41% of meat produced in the United States with per capita consumption of
approximately 45 kilograms of chicken meat. During that period, about 14 kilograms of eggs per
capita were consumed (United States Department of Agriculture, 2006). Similar growth in
chicken meat and egg consumption was observed in developing countries. In China, for example,
a significant fraction of meat consumed in 2005 was poultry, at 19%. The per capita
consumption in 2005 was about 10 kilograms of poultry meat and 21 kilograms of eggs
(Ministry of Agriculture, PRC, 2005).
Second, the market share for chicken meat and eggs continues to grow. Broiler
production in the U.S. grew by 33% in the last decade to about 35 billion pounds in 2005
(Department of Agriculture, US, 2006), while the growth in China was similar at about 29%
(Ministry of Agriculture, PRC, 2005). This growth is expected to continue. According to Global

10
Food Outlook 2020 (Rosegrant et al., 2001), increasing demand for high quality protein in the
developing world is expected to be one of the most important trends in the future of agriculture
with chicken meat expected to be at the forefront of the demand.
A third advantage of the chicken is that establishing a functional production operation is
usually more cost-effective than for other major meat animals. Finally, cattle and swine, the
other major meat animal species with which chicken competes for consumer demand, are not
compatible with certain religious practices, whereas chicken consumption appears to be nearly
universal.
2.2.2 The chicken as a model for vertebrate immune response
The chicken has been used a s a unique model organism for studying immune response
due to the following immune-related features. First, the chicken has bursa of Fabricius, the site of
maturation of B lymphocytes first described by Cooper et al. (1966). It is a distinct immune
organ, which provides an easy opportunity to study B cells and B cell-related antibody response.
Second, the generation of immunoglobulin diversity in the chicken provides an example
illustrating that the regulation of immune response at the DNA level is different between birds
and mammals. In the chicken, immunoglobulin diversity mainly results from somatic mutation
(probably via gene conversion using sequences from flanking pseudogenes) other than the
variable-diversity-joining (VDJ) recombination mechanisms that predominate in mammals
(Reynaud et al., 1994). Last, as critical component of immune response, the major
histocompatibility complex, represents in the chicken a “minimal essential MHC” because it
only spans 92 kilobases, while its counterpart in the human, denoted HLA for human leukocyte
antigen, spans 3.6 megabases.
11
2.3 The immune system
The immune system is a set of mechanisms that protects an organism from invasion or
infection by identifying and killing foreign or foreign-like substances, including pathogens such
as bacteria, viruses and fungi, as well as offer protection from parasites (Accolla, 2006). Immune
response is broadly defined as the defense of the host as a result of its immune system to
pathogens and parasites. Because pathogens are diverse and continue to evolve new ways to
avoid detection by the immune system, it is extremely difficult for host organisms to defend
themselves from invasions and infections by pathogens (Essex, 1997; Fleck, 2004). A
sophisticated and evolving mechanism is required for performing this task successfully.
Vertebrates have developed such a mechanism-the immune system. The system can be either
innate or adaptive. Innate and adaptive immune systems are interconnected and function in
different ways. Improving innate and adaptive immune response simultaneously or separately
may increase a species’ natural disease resistance (Pitcovski et al., 2001; Pevzner et al. 1981;
Bajaj-Elliott and Turner, 2005; Yuan and Walker, 2004).
2.3.1 The innate immune system
The innate immune system is an evolutionarily ancient form of host defense against
infection, providing a quick response with low antigen-specificity. It employs multiple
mechanisms to recognize and control the spread of pathogens, including humoral and chemical
barriers such as inflammation, and cellular barriers (Hackett, 2003). The humoral and chemical
barriers involve many humoral factors such as mucosal secretions and serum factors including
complement, certain cytokines and natural immunoglobulins. The cellular barriers rely on the
functions of the cells, including natural killer cells, macrophages, dendritic cells (DCs) and
granulocytes (Hackett, 2003).

12
Innate immune defense is quickly activated when pathogens break through host surface
barriers. The latter includes mechanical (e.g., skin), chemical (e.g., lysozyme, phospholipase A,
defensins), and biological (commensal flora, pH) barriers. When exogenous immune-related
mediators are released from locally damaged tissue (Gallucci and Matzinger, 2001), they interact
with histiocytes (macrophages and neutrophils), dendritic cells, and mast cells at the site of
injury. The interactions subsequently result in the production of endogenous mediators. The
immune defense system recruitment is then promoted by the endogenous mediators through
inflammation, which is characterized by locally increased endothelium permeabilization,
concomitant with upregulation of integrin and other adhesion molecule expression on the
endothelium. Histiocytes and other leukocytes are subsequently recruited from the blood to the
endothelium by chemokines released from the endothelium (Mackay, 2001; Murdoch and Finn,
2000). Among the recruited leukocytes, neutrophils and monocytes are typically the dominant
migratory leukocytes in the innate defense responses (Murdoch and Finn, 2000).
Neutrophils (or polymorphonuclear neutrophilic granulocytes) and mononuclear
phagocytes (monocytes and macrophages) are central to the acute inflammatory reaction
(Kobayashi et al., 2005), and have a wide distribution throughout the body tissues and organs.
Neutrophils are the most abundant type of phagocyte, normally representing 50% to 60% of the
total circulating leukocytes. They are key effector cells of the innate immune system (Faurschou
and Borregaard, 2003). When they migrate to sites of infection, they are activated and a cascade
of defense mechanisms is initiated. Neutrophils recognize and engulf pathogens, and
subsequently kill and degrade pathogens via the production and finely tuned release of reactive
oxygen species (superoxide, hydrogen peroxide, and hypochlorous acid) and antimicrobial and
proteolytic granule proteins, which are delivered to the phagosomes and to the extracellular

13
environment (Segal, 2005; Faurschou and Norregaard, 2003). In addition, activated neutrophils
synthesize chemokines and cytokines, which recruit and regulate the inflammatory responses of
other effector cells including macrophages, T cells, and neutrophils themselves (Theilgaard-
Monch et al, 2004). Finally, activated neutrophils initiate an apoptotic program, which facilitates
resolution of inflammation and prevents tissue damage caused by necrotic cell lysis, and spilling
of cytotoxic effector proteins and reactive oxygen species to the extracellular environment
(Kobayashi et al., 2003a, b).
The mononuclear phagocytes (macrophages and monocytes), including DCs, are also
important to the innate defense response. One important role of the macrophage is the removal of
necrotic debris from the site of infection. Macrophages also present antigenic molecules of
pathogens to a helper T cell and play a role in cell-mediated immunity. This presentation is done
after pathogens are engulfed and digested by macrophages. In this process, antigenic peptides
generated from the digested pathogens are integrated into the cell membrane and displayed by
attaching them to MHC class II molecules (Brode and Macary, 2004). The role of macrophages
as antigen presenting cells (APCs) sets up a link between the innate and adaptive immune system.
Although macrophages had been considered to be APCs, the principal APCs are the DCs
(Steinman, 1991). In contrast to other cells that can function as APCs (e.g., macrophages and B
cells), the main function of DCs is antigen presentation (Banchereau et al., 2000; Steinman,
1991). Dendritic cells are the major link between the innate and adaptive immune systems, as
they present antigen to T cells, one of the key cell types of the adaptive immune system.
Together, a variety of cellular and humoral components with different functions endow
the innate immune system with power to fight invading pathogens. However, the ability to

14
distinguish pathogens from self is a prerequisite for immune system to function beneficially to
the host.
The innate immune system distinguishes pathogens from self with pattern recognition
receptors (PRRs) that recognize pathogen-associated molecular patterns (Hoffmann and
Reichhart, 2002; Janeway and Medzhitov, 2002). The latter is the structural motifs shared by
related species of microbes. These motifs include cell walls, components of microbial
membranes, DNA and proteins. PRRs are highly conserved and exist before the evolutionary
divergence of the plant and animal kingdoms (Hoffmann and Reichhart, 2002). Therefore, they
only recognize a fixed structural motif and do not undergo rearrangement.
Toll-like receptors (TLRs) are one important category of PRRs (Mukhopadhyay et al.,
2004). They mediate ligand-binding specificity. Intracellular signaling pathways are initiated by
their bindings to the corresponding ligands. As the consequences of TLR activation, antigen
presentation, phagocytosis and apoptosis (cell death) are induced. TLRs also induce expression
of a number of inflammatory cytokines and chemokines and rapidly alter cell trafficking and
recruitment. In addition, TLR activation promotes DC maturation by upregulation of MHC
proteins and costimulatory molecules, thus providing the two necessary signals for T cell
activation. Other PRRs include mannan-binding lectin, C-reactive protein, serum amyloid
protein, macrophage mannose receptor, and macrophage scavenger receptor (Mukhopadhyay et
al., 2004).
2.3.2 The adaptive immune system
When pathogens break through the innate immune system, the adaptive immune system
will be activated and mount stronger and more efficient attacks on the invading pathogens.
Unlike innate immunity, adaptive immunity is a slow response with high antigen-specificity. It

15
requires the recognition of specific antigens during antigen presentation. Antigen specificity
allows for the generation of responses that are tailored to specific pathogens or pathogen-infected
cells. The capacity for adaptive immunity relies on its highly specialized systemic cells and
processes that eliminate pathogenic challenges.
Lymphocytes including B cells and T cells are the effector cells of the adaptive immune
system. Both types of cells are derived from the same pluripotential stem cells, and they are
indistinguishable from one another until after they are activated. B cells play roles in the humoral
immunity (or antibody-mediated immunity, AMI), whereas T cells primarily involve cell-
mediated immunity (CMI) (Harnett et al., 2005).
2.3.2.1 Antibody-mediated immunity
The principal function of B cells is to make antibodies (Abs) against soluble antigens. B
cells are activated and differentiated into plasma B cells, which in turn secret Abs as the major
effector molecules of antibody-mediated immunity, when pathogens evade from innate immune
response. However, this differentiation requires not only antigen recognition, but also T cell
dependent or independent activation (Balazs et al., 2002; Bernard et al., 2005). Each B cell has a
unique receptor protein (B cell receptor) on its surface that will bind to one particular antigen.
The B cell receptor is a membrane-bound immunoglobulin, which involvs B cell activation.
Once a B cell encounters its cognate antigen and receives an additional signal from a helper T
cell, B cell will be activated and differentiated into Ab-producing cell (McHeyzer-Williams,
2003).
The activated B cells also differentiated into memory B cells, which are long-lived cells.
Memory B cells provide the adaptive immune system with the ability to mount a quick Ab
response specific to the pathogen presented in primary infection if the same pathogen is

16
encountered. This ability is attributable to their specific recognition of the antigen and to their
quick proliferation, which leads to a new generation of Ab-producing plasma cells.
The mechanisms by which B cells are activated can be classified into T cell-independent
and T cell-dependent activation. During T-cell dependent activation, a processed antigen is
presented by an APC presents to a helper T (Th) cell, which is subsequently primed by the
presentation (Konig et al., 2002; McHeyzer-Williams et al., 2006). If a B cell processes and
presents the same antigen with a class II MHC protein to the primed Th cell, the T cell releases
cytokines that activate the B cell (Janeway et al., 2001). Although most antigens are T-cell
dependent, B cells are also activated through PRRs in the absence of T cell help. During the T
cell-independent activation, antigen is presented in a way that causes cross-linking of antibodies
on the surface of B cells. B cell activation then may either proceed directly or undergo an
intermediate differentiation step.
2.3.2.2 Cell-mediated immunity (CMI)
T cells play a central role in CMI, which does not involve antibodies (Erf, 2004;
Bleackley, 2005; Walter and Santamaria, 2005; Waterhouse et al., 2004). T cells travel to and
develop in the thymus. They can be distinguished by the presence of T cell receptor on their cell
surface. T cells are divided into several subsets, including cytotoxic T cells (Tc cells), helper T
cells (Th cells), memory T cells, regulatory T cells, natural killer T cells and γδ T cells (Williams
and Bevan, 2007; Street and Mosmann, 1991). Among these subsets, Tc cells are the major type
of T cells responsible for antigen-specific CMI (Moser and Eberl, 2007).
Cytotoxic T cells derive from double-positive T cells that have both the CD4 (cluster
designation 4 ) and CD8 co-receptors (Oehen and Brduscha-Riem, 1998; Blanco et al., 2005).
The double-positive T cells (CD4+CD8+) first are exposed to a wide variety of self-antigens in

17
the thymus. The strength of their binding to MHC-presented self-antigens determines if these
cells will survive or not (Kaufman et al., 1992). If it is too strong, the cells will undergo
apoptosis because their propensity to become autoreactive, which could lead to autoimmunity.
This process is called negative selection. If the binding is too weak, the cells will undergo
positive selection, in which apoptosis is initiated because it is difficult for them to recognize
MHC-protein complexes. Those cells that survive positive and negative selections differentiate
into single-positive T cells (either CD4+ or CD8+). This differentiation is dependent on whether
their receptors recognize an MHC class I-presented antigen (CD8) or an MHC class II-presented
antigen (CD4). Only the CD8+ T cells that will mature into cytotoxic T cells after their receptors
bind to a class I restricted antigen (Oehen and Brduscha-Riem, 1998).
The activation of Tc cells is dependent on several simultaneous interactions between
molecules expressed on the surface of the T cell and molecules on the surface of the APC. An
interaction is between the TC cell receptor and a peptide-bound MHC class I molecule on the
antigen presenting cell. Another interaction is between the CD8 coreceptor and the class I MHC
molecule (Rock and Shen, 2005), which may stablize the interaction between the TC cell receptor
and a peptide-bound MHC class I molecule. The two interactions form the first signal for the T
cell activation. The interaction between the CD28 molecule on the T cell and either CD80 or
CD86 on the surface of the antigen presenting cell forms the second signal. CD80 and CD86 are
costimulators of T cell activation. The second signal can be assisted by stimulating the Tc cell
with cytokines released from helper T cells. The activated Tc cells undergo clonal expansion with
the help of interleukin-2, which is a growth and differentiation factor for T cells. Once Tc cells
are exposed to infected/dysfunctional somatic cells, they release cytotoxins that form pores in the
target cell's plasma membrane and cause ions and water to flow into the target cell. This

18
eventually leads to the expansion and lysis of the target cell. Tc cells also release granzyme to
target and destroy infected somatic cells because granzyme can enter the target cells via the
perforin-formed pore and induce apoptosis by activation of caspases (Ashton-Rickardt, 2005).
2.3.3 Innate and adaptive immunity
2.3.3.1 Links formed by dendritic cells
As mentioned above, dendritic cells, as professional APCs, are the major link between
innate and adaptive immunity (Groothuis and Neefjes, 2005; Heath et al., 2004; Brode and
Macary, 2004). This link is established by multiple interactions of DCs with Th cells, Tc cells and
B cells in either an MHC- dependent or independent manner (Corthay, 2006).
Dendritic cells can internalize antigen, or cells such as tumor, virus-infected, and
apoptotic cells (Banchereau et al., 2000). The internalized material is degraded into antigenic
peptides within the endosomal system. There are two options to process the antigenic peptides,
which involves either MHC class II or MHC class I molecules (Guermonprez et al., 2002;
Steinman et al., 1999; Thery and Amigorena, 2001). In the former case, the antigenic peptide-
containing endosomal structures fuse with specialized structures that contain MHC class II
molecules. The antigenic peptides then interact with the MHC class II molecules, which is
capable of recognizing the peptide amino acid sequence. These peptide-loaded MHC class II
molecules are subsequently transferred to the cell surface, where they are stably expressed - an
important characteristic of a mature DC (mDC; Pieters, 2000). When the muature dendritic cells
encounter naive CD4+ T cells, the first signaling pathway will be activated by the interaction
between the T cell receptors and the peptide-bound MHC class II molecules. As a result of this
activation, the naive CD4+ T cells will mature into Th cells (Malnati et al., 1992). The second
signaling pathway that is also necessary for maturation of the CD4+ T cells into Th cells is

19
activated by the interaction between CD28 on the CD4+ T cell and the proteins CD80 or CD86
on the professional APCs. The CD4+ T cells can differentiate into Type 1 (Th1) and Type 2 (Th2)
helper T cells in the process of maturation (Holdsworth et al., 1999; Infante-Duarte and Kamradt,
1999; Mitchison et al., 1999; Berenson et al., 2004). This differentiation is based on the specific
cytokines they produce. Th1 cells produce interferon-gamma and tumor necrosis factor beta,
which induce the proliferation of Tc cells. In comparison, Th2 cells produce interleukin- 4, 5 and
13, which induce B cell Ab class switching and increase Ab production by stimulating B cells
into proliferation (Becker et al., 2005). Th2 cells, therefore, are considered necessary for the full
maturation of the humoral immune system.
If the internalized material is transferred to the cytosol for processing, the latter case, the
antigenic peptides will bind to MHC class I molecules of DCs and be presented on the cell
surface to Tc lymphocytes (Brode and Macary, 2004; Heath et al., 2004; Thery and Amigorena,
2001). This process is critically important in defending against intracellular pathogens such as
viruses and certain bacteria. The antigen-bound MHC class I molecules then interact with the T
cell receptors on the naïve CD8+ T cells in a similar way as the antigen-bound MHC class II
molecules do (Melief, 2003). This interaction stimulates the naïve Tc cells to mature into effector
cells. Similarly, the additional involvement of costimulatory receptors is required to stablize the
interaction between the DCs and the Tc lymphocytes (Sproul et al., 2000).
DCs also interact with B cells in a MHC-independent manner. DCs can directly cluster
with B cells in vivo (Kushnir et al., 1998) and take part in B cell activation through antigen
delivery (Litinskiy et al., 2002; Ludewig et al., 2000). The DC-B cell interaction leads to the
differentiation of B cell into Ab-producing cells in a T cell-independent style (Balazs et al., 2002;

20
MacPherson et al., 1999). This interaction does not need a processed antigen and the
involvement of MHC.
2.3.3.2 Links formed by the complement system
The serum complement (C) system is a major component of innate immunity. It not only
participates in inflammation, but also enhances adaptive immunity by releasing cleavage
products that interact with surface receptors on both B and T cells (Reid and Porter, 1981;
Fearon and Carroll, 2000). These receptors include specific Ab and innate recognition proteins
such as TLRs (Janeway and Medzhitov, 1999; Barton and Medzhitov, 2002), manna-binding
lectin (Epstein et al. 1996), ficolins (Matsushita and Fujita, 2002), C-reactive protein (Szalai et
al., 1997), C1q (Korb and Ahearn, 1997; Taylor et al., 2000) and natural immunoglobulin M
(IgM; Boes et al., 1998; Baumgarth et al. 2000; Reid et al., 1997; Toapanta and Ross, 2006).
The early reports of binding of complement 3 to circulating lymphocytes (Dukor et al.,
1971) and follicular dendritic cells within lymphoid follicles (Papamichail et al., 1975) indicated
the involvement of the complement system in adaptive immunity. Complement 3 is the central
component shared by the three different activation pathways of the complement system,
including classical, lectin and alternative. Complement enhances B cell immunity primarily via
complement receptors CD21 and CD35, both of which binds the complement 3 products
including iC3b, C3d,g and C3d (Molina et al. 1994). The two receptors are both expressed
mainly on B cells and follicular dendritic cells. On B cells, CD21, CD19 and CD81 can form a
receptor complex that is able to co-engage with B cell antigen receptor (Matsumoto et al., 1991).
This coengagement can lower the threshold of B cell activation, and provides an important
survival signal for the cognate B cells when the C3d-coated antigen is uptaken (Carter and
Fearon, 1992). In addition, complement enhances B cell immunity by localizing antigen to

21
follicular dendritic cells within lymphoid follicles (Fang et al. 1998; Kemper and Atkinson, 2007;
Sahu and Lambris, 2001).
The complement system also may play a role in T cell immunity to a specific antigen. Its
role reflects on the ability to mark the antigen as foreign and to be recognized by specific
receptors. In addition, the chemoattractant receptors C3aR and C5aR, which are the byproducts
of complement activation, may alter T cell responses. However, early studies that examined the
function of complement in T cell priming suggested that the involvement of complement in B
cell immunity was more important than that in T cell immunity (Isaak et al., 2006; Korthauer et
al., 1993; Krummel and Macara, 2006).
2.3.4 Characteristics and dynamics of antibody-mediated immunity
Specific immune responses are the major type of AMI, in which antibodies produced by
plasma cells attach to invading microorganisms and mark them for destruction or prevent them
from infecting cells (Butler, 1998; Doria and Frasca; 1997). Their general characteristics include
self/non-self discrimination, memory, and specificity. Specific Ab responses can be divided into
primary Ab response and secondary Ab response. Primary response refers to the first time a host
is exposed to the antigen. Antibodies made upon first exposure to an antigen are mostly of the
class IgM. Secondary response refers to subsequent exposure. The class IgG antibodies are
dominant in the secondary response. Therefore, immunoglobulin antibodies undergo a process
called Ab class switch from primary to secondary Ab response. In addition, affinity maturation
occurs during the secondary response, in which the IgG Ab increases its affinity to the antigen
progressively, especially after low doses of antigen. This phenomenon could be explained by
either clonal selection or somatic mutations in which the antibodies are fine-tuned to be of higher
affinity after Ab class switch (Janeway et al., 2004).

22
The primary Ab response also is different from the secondary Ab responses in kinetics. In
the primary response, there is an initial lag phase when no Ab can be detected after the first
challenge with antigen. In this phase, the antigen is recognized as foreign, and the cells start
proliferation and differentiation in response to the antigen. The duration of this phase varies with
the antigen used, but it is usually 5-7 days (Biozzi et al. 1972; van der zijpp et al. 1983b). The lag
phase is followed by exponential phase, in which the Ab titer rises logarithmically to a plateau.
In the log phase, the B cells differentiate into Ab-producing plasma cells. The plateau phase
subsequently is reached as Ab synthesis is balanced by Ab decay so that there in no net increase
in Ab concentration. During this phase, the antibodies bind to the antigen or are naturally
decomposed, and subsequently are cleared from circulation. The last phase of the primary Ab
response is called the decline phase, in which the degradation of Ab exceeds its synthesis. As a
result, the level of Ab may reach baseline levels. In contrast, the lag phase is shorter and the
plateau and decline phases are extended in the secondary response. In the plateau phase, the
secondary response is more rapid than the primary response, and the plateau of Ab titer is
typically 10 times higher. Unlike the primary response, the decline phase in the secondary
response is not quick and Ab may persist for long time, even a lifetime.
Evidence has shown that the dynamics of Ab response are influenced by age (Ubosi et al.,
1985b; Doria and Frasca, 1997), antigen type and dosage (Boa-Amponsem et al. 1998a; van der
Zijpp, 1983a; Boa-Amponsem et al. 1997b; Ubosi et al. 1985a), and genetic factors (Biozzi et al.
1972; Siegel and Gross, 1980). The phenomenon of the dynamics of Ab response being under
genetic control has led scientists to dissect the molecular basis of the genetic control using
several dynamic parameters of primary Ab response. For example, Ab production to SRBC has
been used as a parameter of Ab response competence for dissecting the molecular basis of the

23
genetic control underlying the dynamics of primary Ab response (Puel et al. 1995, 1996).
Compared to CMI, Ab response appears to be more accessible to genetic analysis because its
kinetics can easily be studied quantitatively and qualitatively by reliable parameters.
2.3.5 The association of AMI with disease resistance
The control and prevention of infectious diseases is an important issue in the animal
production industry because a large portion of profits continues to be lost due to frequent
outbreak of infectious diseases. For example, bird influenza has led to catastrophe in the poultry
industry in certain countries, and has not been well controlled yet. Use of vaccination and
antibiotics and improvement of sanitary conditions has been contributing to disease control and
prevention, but applications of these means not only have a huge cost, but also bring about
complications. For example, the prophylactic use of antibiotics may lead to the development of
drug-resistant bacteria, which could harm humans and farm animals in the future. Such an issue
has put animal production into a dilemma. Improving natural disease resistance among animals
may provide a promising approach to eliminating this dilemma (Colditz et al., 1996; Lillehoj,
1994).
Results from several studies suggest that animal natural resistance to infectious diseases
is associated with the level of Ab production (Gross et al., 1980; Siegel et al., 1982; Pitcovski et
al., 1987; Yamamoto et al., 1991; Leitner et al., 1992; Pinard et al., 1993; Yonash et al., 1996).
For example, disease resistance was different between lines of chickens divergently selected for
high (H) and low (L) antibody titers to SRBC. The H line of chickens was more resistant to
Mycoplasma gallisepticum, Eimeria necatrix and feather mites, but was more susceptible to
Escherichia coli and Straphylococus aureus infections than the L line of chickens in the 3rd
generation of selection (Gross et al., 1980). The subsequent observations in the 10th and 11th
24
generations of selection indicated that the H lines also was more resistant to Eimeria tenella than
the L lines in both natural and controlled exposures (Martin et al, 1986). In addition, Martin et al.
(1989) observed that the 12th generations of the H line of chicks were more resistant to a natural
exposure to Marek’s disease than the L line of chicks.
Several genetic factors influencing both Ab response and disease resistance have been
identified in the chicken. The MHC, the B complex in the chicken, is composed of heterodimeric
transmembrane glycoproteins that are essential in the presentation of antigens to T lymphocytes
(Kroemer et al., 1990; Plachy et al., 1992). The MHC molecules can be divided into class I (B-F),
class II (B-L), and class IV (B-G) in the chicken. The MHC system has been associated with
antibody response (Dunnington et al., 1984, 1996; Kean et al. 1994a; van der Zijpp et al., 1987;
Loudovaris et al., 1996). This is suggested by the difference in allelic frequencies for the B
system between H and L lines. It was shown that B21 haplotype was dominant in the H line,
while B13 haplotype was near-fixed in the L line. However, it is evident that although there is a
genetic association between the B system and antibody production to SRBC, the situation is
complex. This was indicated by a replicated selection experiment for anti-SRBC response. In this
experiment, changes in gene frequencies of B21 were only observed in one of the H replicates
after five generations of selection; similar situations were also observed in the L replicates.
Evidence shows that the MHC is also closely associated with resistance or susceptibility
differences to a number of diseases in the chicken (Lamont, 1998). Comprehensive reviews of
the MHC linkage with differences in disease resistance to different classes of pathogens have
been given in several papers: resistance to viral infection (Bumstead, 1998; Gavora and Spencer,
1979; Kaufman et al., 1992; Longenecker et al., 1977; Pinard et al. 1993; White et al. 1994; Yoo
and Sheldon, 1992), resistance to bacterial infections (Cotter et al., 1992; Guillot et al., 1995;

25
Siegel et al., 1993), and resistance to protozoal infection (Caron et al., 1997; Lillehoj, 1994; Uni
et al., 1995). The most explicit case regarding the linkage of MHC and disease resistance or
susceptibility is that the difference in resistance to Marek’s disease virus (MDV) between MHC
haplotypes is related to the level of class I molecule expression rather than its specificity
(Kaufman et al., 1996). Chicken strains carrying MHC haplotypes that express fewer class I
molecules, such as B21 strains, are resistant to MDV, while those that abundantly express class I
molecules, such as B19, are most susceptible (Gavora and Spencer, 1979).
Class IV MHC has been exclusively reported in avian species, as has Rfp-Y, the MHC-
linked gene that is recognized by DNA restriction fragment patterns (Rfp) of the MHC class I, II
and IV genes in one MHC haplotype (Briles et al., 1993; Miller et al., 1994). Although the
location of the gene is within the MHC gene regions, its function is not clear. Compared to the
class I, II and IV gene regions, only limited rfp-Y polymorphisms have been identified. However,
rfp-Y may be associated with Ab response, since it was observed that one of the three
polymorphisms of rfp-Y occurred in significantly different frequencies between lines divergently
selected for a multitrait index that contained a parameter for Ab response (Lakshmanan and
Lamont, 1998). Rfp polymorphisms have been reported to be correlated with differences in
resistance to pathogens, especially MDV (Lakshmanan and Lamont, 1998; Wakenell et al., 1996).
Antibody response also is influenced by immunoglobulin genes (Butler, 1998; Rees and
Nordskog, 1981). Immunoglobulins are membrane receptor proteins on the B cell membrane or
are secreted into circulation and onto mucosal surfaces by plasma cells as antibodies. The
diversity and the amount of immunoglobulins are important factors in resistance and
susceptibility to infectious pathogens (Butler, 1998). Therefore, immunoglobulin genes link Ab
response with disease resistance.

26
Cytokines also play important roles in both Ab response and disease resistance. Th2 is
one of the two main cytokine families produced by the helper CD4+ T cells (Infante-Duarte and
Kamaradt, 1999; Lunney, 1998; Street and Mosmann, 1991). The Th2 cytokines such as
interleukins-4, -5, -6 and -10 stimulate the Ab response (Infante-Duarte and Kamaradt, 1999).
The differentiation of a progenitor T helper cell into the Th2 helper cell has a critical impact on
the pattern of immune response and subsequently on disease development (Finkelman et al.,
1997; Holdsworth et al., 1999).
Finally, the endogenous viral (ev) genes may contribute to both Ab response and disease
resistance. It was found that ev6 and ev9 differ in frequency between lines divergently selected
for a multitrait index containing a parameter for Ab response (Lamont et al., 1992), and both
were at lower frequency in the lines selected for high immunoresponsiveness. The ev genes may
express viral envelope glycoproteins like gp85, which block the receptor sites evoking resistance
against exogenous infection with the avian leukosis virus (ALV) subtype that needs the specific
receptor (Smith et al., 1991). Such receptor saturation or blockage also limits the congenital
transmission of the virus (Smith et al., 1990). For instance, the ev6-carrying chicken lines
express ALV-E envelope glycoproteins, and so are resistant to ALV subtype E infection (Smith
et al., 1990).
In addition to natural disease resistance, immune responses including AMI also play
important roles in other biological phenomena including aging and longevity (Doria and Frasca,
1997, 2000), allergy/hypersensitivity (Blumenthal, 2004), reactions to transplantation (Sims et al.,
2001), autoimmunity (Turesson, 2004), stress/neuroendocrine responses (Petrovsky, 2001;
Dhabhar, 2002) and animal production (Pinard-van der Laan, 2002). The importance of immune

27
responses has driven efforts to more fully describe and to understand the molecular basis of
vertebrate immune responses.
2.4 Chicken resource populations for QTL analysis
2.4.1 Quantitative trait locus
Most economically important phenotypes, including production traits and complex
genetic diseases, comprise a continuous distribution of measurable characters. These phenotypes
are called quantitative traits by geneticists. In contrast to Mendelian (single-gene) traits,
quantitative traits are typically affected by multiple loci or genes called quantitative trait loci
(QTLs). Identification of QTLs can help us to understand the genetic control of quantitative traits
underlain by the QTLs. However, it is well demonstrated that it is challenging to locate QTLs
and estimate QTL effects. This is because quantitative traits can be influenced by environmental
and genetic noise in addition to the polygenic mode of inheritance (Andersson and Georges,
2004). A variety of QTL mapping methods have been invented aiming to meet this challenge.
QTL mapping means identification of QTL location and estimation of QTL effects with known
genetic markers or genes based on demonstration of statistical significance. However, use of
appropriate resource populations is a prerequisite for QTL mapping. Crosses derived from inbred
lines and divergently selected lines are the most commonly used resource populations for QTL
mapping.
2.4.2 The chicken as a model for QTL analysis in vertebrates
The chicken has long been an ideal and tractable model for genetic studies of biological
questions of broad implications. Our understanding of the mechanisms of inheritance was
significantly advanced by the classic work of Bateson in the chicken. Use of the chicken as a

28
model species also has extended beyond these genetic studies. Chicken has emerged as a model
for QTL analysis in vertebrates. This is mainly because of the relative ease of developing
appropriate resource populations for QTL analysis. Populations with wide phenotypic or genetic
variation are critical to the success of QTL analysis. Long-term artificial selection has developed
many breeds and experimental lines of chickens with highly varied traits, such as the meat-type
and egg-type strains. No other agricultural animal has been phenotyped and selected as
intensively as the chicken. Correspondingly, the list of quantitative traits of interest in the
chicken extends from production characteristics, such as growth, meat quality, and egg
production, to other traits such as behavioral and immune-related traits because of concern for
animal health, the environment and disease resistance (Burt, 2002). The chicken also is unique
among major agricultural species in that a number of highly inbred lines are available for many
traits for which inbred mouse lines also exist.
The high-resolution chicken genetic map also provides an advantage for using the
chicken as an animal model for QTL analysis. The current chicken genetic linkage map, initiated
early in the last century (Hutt, 1949), now has 2,499 genetic markers with a total coverage of
about 4,718 centimorgan (updated 11/2005, Bitgood and Somes, 1993; Groenen et al., 2000).
This advantage is further enhanced with the release of the chicken genomic DNA sequence
(International Chicken Genome Sequencing Consortium, 2004). Though only a draft, the chicken
sequence provides a resource for rapidly moving from candidate marker to a candidate gene in
QTL analysis.
In addition, the chicken reproduces rapidly and has large brood sizes, enabling several
generations of large families to be generated in a reasonable time frame. The chicken, therefore,
provides an ideal model for genetic mapping and QTL analysis among agricultural animals.

29
Various resource populations of chickens, including inbred lines and divergently selected lines,
have been developed for QTL analysis.
2.4.3 Inbred lines versus divergently selected lines
2.4.3.1 Inbred lines
Inbred lines are animals of a particular species that are nearly identical to each other in
genotype due to long-term inbreeding. Twenty generations of brother-sister mating will lead to
lines that are roughly 98% genetically identical. Usually, such lines are considered as inbred
lines. The advantages of using inbred lines include simple bi-allelic segregation at both QTL and
genetic markers, full information about the linkage phase of genes at the marker loci and QTL,
and versatility of the experimental design for both detection of marker-QTL linkage and
estimation of genetic parameters defining genetic effects at the QTL (Soller et al., 1976). The
basic experimental designs for QTL mapping that are appropriate for crosses between inbred
lines include those with generations of backcross, test cross, F2 and recombinant inbred lines
(Weller, 2001).
Inbred lines not only can be used for QTL mapping in backcross and F2 designs through
linkage analysis that provides rough information about QTL location, they also can be used for
QTL fine-mapping through linkage disequilibrium (LD) analysis using recombinant inbred lines
(RILs) and near-isogenic lines (NILs) that are derived from inbred lines. An recombinant inbred
line is derived from two inbred lines by crossing the lines and subsequent repeated selfing or
sibling mating (Singer et al., 2004; Nadeau et al., 2000; Bailey, 1981; Taylor et al., 1977). Its
genome is mosaic of the parental genomes. The higher density of breakpoints in RILs makes
high resolution of QTL mapping possible (Broman, 2005). Other advantages from RILs include
the option to propagate them eternally as inbred lines, genotyping for each strain needs to be

30
done only once, and phenotypic data from multiple individuals can be used to reduce individual,
environmental, and measurement variability. In general, each RIL has several genomic fragments
introgressed from parental lines, and both parental genotypes have equal chance on average to be
contained in the introgressed fragments. The multiple introgressions in each RIL make genetic
interactions between loci detectable. However, the genetic interactions may reduce the power to
detect QTL. This situation could become worse if recombination frequencies are unequal
throughout the genome, and lethality or reduced fitness of particular genotypes lead to
segregation distortions. Moreover, QTLs with small additive effects may not be detected because
they could be masked by QTLs with large effects (Gupta, 2002; Ungerer et al., 2003). However,
the limitations in QTL mapping analysis with RILs caused by the masking effects of major QTL
and the epistatic interactions of multiple QTL can be greatly overcome by using NIL populations.
A NIL is developed through repeated backcrossing and extensive genotyping (Keurentjes
et al., 2007). Such populations consist of lines that have a single or a small number of
introgression fragments in the genome. These fragments are resulted from introgressing a donor
genome into an otherwise homogeneous genetic background (Brouwer and St. Clair, 2004;
Caballero et al., 1995). While NILs and RILs are both immortal experimental populations and
share some advantages, there are differences between them. In contrast to RILs, the presence of a
single introgression segment in each NIL can increase the power to detect small effect QTL
(Kaeppler, 1997). However, NILs do not accommodate testing for genetic interactions because
most of the genetic background is identical within NIL populations. Therefore, NILs and RILs
are relatively complementary to each other in QTL mapping analysis.

31
2.4.3.2 Divergently selected lines
Inbred lines are widely used in the mouse and rat, but rarely used in other vertebrate
animals due to infeasibility of development of inbred lines. In the chicken, genetic lines selected
for specific traits frequently are used for QTL identification, although several inbred lines of
chicken have been used for identification of genes influencing resistance to avian tumors (Bacon,
2000).
Development of divergently selected lines mostly starts from a non-inbred base or
founding population in which individuals share the same genetic background, followed by a
programmed selection and breeding scheme where repeated assortative matings are applied and
inbreeding is generally restricted. Long-term divergent selection for a given quantitative trait
would lead to a significant phenotypic difference between the selection lines (Bunger et al.,
2001). The phenotypic divergence could be explained by the progressive accumulation, in each
line, of multiple genes endowed with coherent additive effects on the selected trait of interest.
When the limit of response to selection is reached, the relevant genes can be considered to be
fixed at homozygosity (Andersson and Georges, 2004; Siegel et al., 2006). Therefore, QTLs
associated with the selected lines could be identified directly based on allelic frequency
differences between divergently selected lines (Keightley et al., 1993). However, the frequency
differences alone should not be considered a definite proof of a QTL identification because such
differences are only suggestive of changing frequencies of alleles of the QTLs as a result of
selection. Other factors such as genetic drift and founder effects also can contribute to allele
frequency changes (Goodnight, 1988). Fortunately, the putative QTLs can be verified by the use
of segregating populations derived from the divergently selected lines, such as backcross and
intercross (F2) populations.

32
Although divergently selected lines that orginiate from a non-inbred population have the
limitations mentioned above, their unique characteristics make them superior to inbred lines in
some aspects. For example, some QTLs for a trait may be not polymorphic between inbred lines
used for QTL mapping because inbreeding can dramatically decrease DNA polymorphism (Jain
and Jain, 1969). These QTLs cannot be identified using map-based approaches because allelic
polymorphism is a prerequisite for map-based QTL identification. The chance for a QTL being
polymorphic between inbred lines depends on the phenotypic difference of the trait of interest
between the inbred lines used. Moreover, even if a QTL is polymorphic between inbred lines, it
may still not be identified. This is because many alleles could have no or marginal differences in
their effects on the trait of interest due to synonymous or non-critical mutations (Duret, 2002;
Ohta and Ina, 1995). Inbred lines may not differ at marker loci. In contrast, the divergently
selected lines generally do not have these problems. In addition, other relevant advantages from
the divergently selected lines include the usefulness in estimating the number of QTLs for a trait
and evaluating the correlated selection responses.
2.4.4 Genetic lines divergently selected for anti-SRBC
Divergent selection for Ab production to a variety of antigens has been performed in
many species of vertebrate animals, but mainly in the mouse and the chicken. Sheep red blood
cell is one of the most frequently used antigens for the following reasons. First, SRBC is a non-
pathogenic antigen. Environmental microbes do not interfere with measurement of Ab response
to SRBC. Second, SRBC is a multi-determinant and strongly immunogenic antigen (Fukuda,
1993; Chasis and Mohandas, 1992; Lowe, 2001; Cartron et al., 1998). The main reason for
choosing SRBC as the selected antigen is that background genes, which are not linked to
immune response genes at MHC and Igh loci, were shown to contribute to Ab production (Peul

33
et al., 1995, 1996). Third, the methods used to measure Ab levels and to detect the specific Ab-
producing cells in the SRBC-triggered immune response have been established. The parameters
of the response are also well documented. Lastly, selection for Ab production to SRBC has been
considered an attractive approach to improve general enhanced disease resistance to multiple
pathogens (Gross et al., 1980). Among the lines divergently selected for Ab production to SRBC,
the classic ones are the Biozzi lines of mouse and the Siegel lines of chicken (Biozzi et al., 1972;
Siegel and Gross, 1980).
The Biozzi lines of mouse were initiated from a founding population of outbred albino
mouse (Biozzi et al. 1972, Feingold et al. 1976). Based on anti-SRBC Ab titers, mice with the
extreme phenotypes, in upward or downward directions, were selected to make assortative
matings. This selection for H and L anti-SRBC was repeated for successive generations until
maximal divergence of the two lines was achieved. As the results of the successive selections,
the intensity of Ab response became persistent in the L line by the 14th generation and in the H
line by the 18th generation. Also, the range of individual variability decreased progressively
throughout the selective breeding (Biozzi et al., 1972). The interline separation appeared to have
reached its maximal extent around the 16th-18th generations, which clearly indicates that Ab
production is determined by the cumulative effects of several quantitative genes. Moreover, the
big change in frequency distribution of anti-SRBC titers from the starting population to the 20th
generation of the mouse population suggested a high degree of homogeneity has been achieved.
Further, it implies that all the genes responsible for Ab production have segregated in each line
by the 20th generation and can be considered homozygous. In addition, the heritability (h2) of the
trait was between 0.18 and 0.36 in the 14th -17th generations. The number of loci that regulate the
quantitative Ab response was estimated to be about 10 loci (Feingold et al., 1976).

34
The same selection strategy was applied to the chicken. The Cornell Randombred White
Leghorn population (King et al., 1959) was the base stock. Innoculations of 0.1mL of a 0.25%
suspension of SRBC via the brachial vein were administrated when chicks were between 41 and
51 days of age. Antibody titers to SRBC were determined 5 days post-inoculation using
hemagglutination procedures, with titers expressed as log2 of the reciprocal of the highest
dilution in which there was hemagglutination. It was shown that response to selection was
immediate (Siegel and Gross, 1980). Frequency distributions of Ab titers in the divergent lines
changed dramatically across generations (Martin et al., 1990). Bimodality, which is evident in
both lines through the 10th generation, almost disappeared by the 14th generation, although there
was still minor overlap in frequency distributions of the lines. Realized heritabilities for the 10th
generation through 14th generation were 0.25 and 0.23 for high and low antibody response,
respectively.
2.5 Approaches to identification of QTLs
Detection of QTLs has become one of the most popular topics since the late 1980s,
although the basic principles and methodology have been around since the 1920s, almost
immediately after the demonstration of the chromosomal theory of inheritance and Fisher’s
polygenic theory of quantitative variance. This delay was mainly due to the lack of segregating
genetic markers in species of interest. Before 1980, the genetic markers available were related to
morphology, blood groups, and biochemical polymorphisms. These were insufficient to provide
complete genome coverage. In addition, most markers were bi-allelic with one allele
predominating in the population, and many displayed complete dominance. These markers were
not optimal for QTL detection. With the advent of DNA-level genetic markers in the early 1980s,

35
and especially microsatellite markers in the 1990s, the problem with limited availability of
suitable genetic markers has been resolved. It is now clear that a genetic map saturated with
polymorphic codominant Mendelian markers can be generated for almost any species. Currently,
a map-based approach, as one of structural genomics-based approaches for QTL identification,
has become routine. Although these classic approaches continue to play an important role in
QTL identification, functional genomics and comparative/in silico genomics-based approaches
have emerged and have been demonstrated to be efficient in QTL analysis. The following
sections will illustrate these approaches.
2.5.1 Structural genomics-based approaches
Structural genomics refers to the analysis of the constitution and structure of
chromosomes rather than proteins. As a branch of genomics, structural genomics has an
indisputable role in biological research. Although structural genomics has reached the level of
whole genome sequencing, genetic markers and genetic mapping, which were developed at an
earlier stage of structural genomics, are still important components of structural genomics. They
have important implications in QTL analysis.
2.5.1.1 Genetic markers
A genetic DNA marker is a segment of DNA that can be identified and tracked. A marker
can be a gene, or it can be some section of DNA with an unknown function. The properties of a
genetic marker include locus specificity, polymorphism in the studied population, and easy
genotyping. The quality of a genetic marker is typically measured by its level of heterozygosity
in the given population and polymorphism information content (Botstein et al., 1980).
There are several criteria for categorizing genetic markers. First, there are three types of
markers based on location, Types I, II and III (Groenen et al., 2000; Weber and May, 1989;

36
O’Brien et al., 1999). Type I markers are within coding regions of genes, such as some
restriction fragment length polymorphisms (RFLPs). Type II markers are within noncoding DNA
sequences, such as microsatellites or simple sequence repeats (SSR, Weber and May, 1989).
Type III markers are within either coding or noncoding DNA sequences, such as single
nucleotide polymorphisms (SNPs, O’Brien et al., 1999). In the chicken, the number of the Type I
markers is approximately 350 (Groenen et al., 2000). In the past, Type I markers were not
thought to have extensive applications in QTL mapping, due to the laborious RFLP analysis and
the limited number of RFLPs that were observed within Type I loci. However, with the isolation
of almost 400,000 expressed sequence tags (ESTs) and the identification of novel genetic
polymorphisms in these genes, Type I markers are expected to have a wider application in
chicken genomics and QTL identification than they had in the past. In contrast, Type II markers
have received considerably more attention than Type I markers, and have been the marker of
choice for genetic mapping and QTL searches. This is because Type II markers are highly
polymorphic and are easily genotyped by PCR-based assays. As Type III markers, SNPs are the
most common form of genetic variation in the genome (Wang et al., 1998; Dawson, 1999). High-
resolution genetic maps based on SNPs are currently under development for several of the
human chromosomes (Mullikin et al., 2000; Taillon-Miller and Kwok, 2000). SNPs are excellent
genetic markers for mapping studies.
The second criterion for categorizing genetic markers is based on whether there is prior
knowledge about the marker sequence (Dodgson et al., 1997; Weber and May, 1989). In this
scheme, genetic markers can be classified as either clone/sequence-based or fingerprint markers.
The fingerprint markers do not require prior knowledge of the marker sequence and include
random amplified polymorphic DNA (RAPD, Williams et al., 1990), amplified fragment length

37
polymorphisms (AFLP, Vos et al., 1995), and minisatellites or variable number of tandom
repeats (VNTR, Jeffreys et al., 1985). In contrast, the clone/sequence-based markers either
require the isolation of a cloned DNA fragment or require marker sequence determination and
include SSRs, RFLPs, sequence-tagged sites (STSs), and ESTs.
Last, based on the type of information genetic markers provide, genetic markers can be
divided into three categories: the biallelic dominant markers such as RAPDs and AFLPs, the
biallelic codominant markers such as RFLPs and SNPs, and the multiallelic codominant markers
such as VNTRs and SSRs (Dodgson et al., 1997; Weber and May, 1989).
In the following paragraphs, only RAPD, RFLP, SSR and SNP markers will only be
described in detail and other genetic markers will be omitted due to less involvement in this
dissertation research and less frequencies of use.
Random amplified polymorphic DNA is synthesized in a polymerase chain reaction
(PCR) with a single arbitrary primer (8- to 12-mer oligonucleotide; Williams et al., 1990). The
annealing temperature is generally lower for RAPD than for regular PCR. A spectrum of DNA
fragments may be generated with an arbitrary primer. The resulting fragments can easily be
separated on an agarose gel by electrophoresis. Among them, one or more fragments may be
polymorphic and can be genetically mapped.
The advantages of RAPD are its simplicity, rapidity, and ability to generate numerous
polymorphisms (Chen and Leibenguth, 1995). RAPDs are also fairly evenly distributed over the
genome (Levin et al., 1994; Chen and Leibenguth, 1995). Therefore, it has been a powerful
technique for genetic analysis (Chapco et al., 1992; Kiss et al., 1993; Landry et al., 1993; Wight
et al., 1993; Williams et al., 1990). There is evidence indicating that RAPD technique is a useful
tool for identifying putative QTLs at genome-wide scale. For example, Martin et al. (1991) and

38
Gu et al. (1998) used the technique to identify markers linked to a Pseudomonas resistant gene in
the tomato and a RAPD-derived marker linked to progressive rod-cone degeneration in dogs,
respectively.
The advantage of this method is attributable in part to the short length and arbitrariness of
primer used in the RAPD-PCR. The major limitation of RAPDs is their dependence on the exact
PCR conditions applied. Reproducibility problems may arise from this dependence (Dodgson et
al., 1997). Another shortcoming of RAPD markers is that they rely on bi-allelic dominance,
which reduces their efficiency in population genetic studies (Lewis and Snow, 1992; Lynch and
Milligan, 1994; Harris, 1999). However, these drawbacks of RAPD markers can be overcome by
converting them into sequence characterized amplified regions (SCARs) because the SCARs can
be amplified with site-specific primers that are designed using RAPD marker sequences (Martin
et al., 1991; Gu et al., 1998).
Restriction fragment length polymorphism (RFLP) markers were the first generation of
DNA markers for different organisms including human, chicken, turkey and bovine (Strachan
and Read, 1999; Vignal et al., 2002; Weissenbach, 1998). RFLPs can result either from a point
mutation creating or destroying a restriction site or from insertions or deletions altering the
length of a given restriction fragment. RFLPs are time- and labor- consuming markers. However,
this shortcoming is now becoming less problematic because the combination of PCR with RFLP
greatly simplifies RFLP technique. In a PCR-RFLP, a sequence containing the variable
restriction site is amplified by PCR, the amplicon is then subject to digestion with restriction
endonucleases, and the restriction pattern of the amplicon is visualized by electrophoresis on a
gel (Strachan and Read, 1999). In addition, the fundamental limitation of RFLP markers is their
low informativeness because RFLPs are generally bi-allelic codominant markers.

39
The second generation of DNA marker-based maps involved simple sequence repeats
(SSRs). Microsatellites are loci present in nuclear DNA that consist of repeating units of 1-6 base
pairs in length (Turnpenny and Ellard, 2005). The repeating units can occur 5 to 100 times (Litt
and Luty, 1989; Tautz, 1989; Weber and May, 1989; Dodgson et al., 1997). Microsatellites owe
their variability to an increased rate of mutation compared to other selectively neutral regions of
DNA. These high rates of mutation can be explained most frequently by slipped strand
mispairing (slippage) during DNA replication on a single DNA double helix. Mutation also may
occur during recombination during meiosis (Blouin et al., 1996; Hughes et al., 1993).
Microsatellite markers often present high levels of inter- and intra-species
polymorphisms, particularly when tandem repeats number is ten or greater (Queller et al., 1993).
Microsatellites have been referred to as the second generation of DNA markers for gene-
mapping studies because they are typically selectively neutral, co-dominant, and highly
polymorphic. At least 959 microsatellites have been recorded on the chicken consensus map
(update 2005, Groenen et al., 2000). The density of genetic markers identified for the chicken is
sufficient to allow genome-wide screening for QTL in well-defined, large, family-pedigreed
experimental populations. In addition, a microsatellite locus usually have multiple alleles. Thus,
genotypes within pedigrees are often informative, and a particular allele could be traced back to
its progenitor. This is the reason why microsatellites are frequently used in population genetic
studies, paternity determination, and recombination mapping. Microsatellites can be amplified
with primers for their flanking regions using PCR. The flanking sequences are obtained from
cloning and subsequent sequencing of DNA segments containing microsatellites. Although
microsatellites are versatile molecular markers, performing high-throughput genotyping for

40
microsatellites, as for SNPs, seems infeasible. This may restrict the use of microsatellites in
large-scale research.
Single nucleotide polymorphisms arise from single nucleotide substitutions (transitions
are more frequent than transversions) or single nucleotide insertions/deletions. SNPs can occur in
genes (promoter, exons or introns) and intergenic regions. The SNPs within the coding
sequences are categorized as either synonymous (does not result in an amino acid change) or
non-synonymous (results in an amino acid change). Non-synonymous SNPs are of interest due to
their potential effects on protein expression and, ultimately, the phenotype. About 26 to 32% of
non-synonymous SNPs are predicted to affect protein function (Chasman and Adams, 2001). In
contrast, synonymous SNPs probably have minimal effects on gene expression. However, both
synonymous and non-synonymous SNPs are valuable tools as genetic markers in mapping
studies.
Single nucleotide polymorphisms are very abundant in the genome. For instance, in
humans, it has been estimated that there is one SNP per 1,000 to 2,000 bases of genomic DNA.
A total of 2.8 million SNPs were identified and mapped in the chicken by the International
Chicken Polymorphism Map Consortium (Wong et al., 2004). Smith et al. (2001) estimated that
the frequency of SNPs in EST-targeted genomic DNA was 1 per 470 bases. This abundance
combined with large-scale automation of SNP genotyping makes SNPs the third generation of
genetic markers (Collins et al., 1997; Wang et al., 1998), although SNPs are less informative,
like other biallelic markers. The abundance also makes fine-mapping studies and population-
based studies that require linkage disequilibrium analysis possible. A high density of genetic
markers is the prerequisite for linkage disequilibrium.

41
The distribution of SNPs in the genome can sometimes be clustered although random
(Feder et al., 1996). The distribution of SNPs forms the basis of molecular haplotypes (Johnson
et al., 2001). An advantage of using haplotype-tagging SNPs is that it may be possible to detect
trait associations that would not otherwise be observed unless the gene were evaluated as a
functional unit, rather than evaluating individual SNP markers. Identification of haplotype-
tagging SNPs also would reduce the costs of genotyping, by typing for molecular haplotypes
rather than individual SNPs within a gene.
Single nucleotide polymorphisms can be discovered or detected through multiple
approaches. The optimal approach is to perform a comparative analysis of the DNA sequences
from different individuals to identify nucleotide variations. However, this approach is laborious
and expensive, and there is a chance that a SNP may not be identified within the tested
individuals. Single-stranded conformational polymorphism, PCR-RFLP, melting temperature
statistics (denaturing-HPLC), pyrosequencing, in-silico EST data mining, and microarray-based
genotyping are some other options. Development of microarray-based SNP genotyping
contributes to the popularity of using SNPs as genetic markers in biological research. This
technique is based on oligonucleotide hybridization analysis. It allows quick and large-scale
genotyping of SNPs. However, this technique can be prohibitively expensive for typical
laboratories. The high cost of SNP detection often limits its use.
As discussed below, genetic markers have many applications in agriculture and biological
fields. Some typical applications include generation and integration of genome maps (e.g.,
genetic maps); population genetics and ecological studies (e.g., genetic diversity); identification
of genes underlying monogenic and polygenic traits; marker-assisted selection; parentage control
and individual identification; and phylogenetics (e.g., estimation of genetic distance).

42
2.5.1.2 Genetic map
Generation of a genetic map is one of the most important applications of genetic markers.
A genetic map or linkage map is a map of a genome that shows the relative positions rather than
physical locations of the genes and/or markers on the chromosomes. A genetic map is generated
based on genetic distance between markers, which is estimated from the frequencies of
recombination between markers during crossover of homologous chromosomes (Collard et al.,
1998). The higher the frequency of recombination between two genetic markers, the greater the
physical distance between them, and vice versa. In other words, the chance of a crossover
producing recombination between the markers is directly related to the distance between two
markers. As stated in the Mendel's Second Law (the law of independent assortment),
chromosomes assort randomly into gametes during meiosis. Thus, the independently assorting
markers that are located on different chromosomes will have a recombination frequency of 50%.
However, markers on the same chromosome are not always true for the Mendel's Second Law. If
two markers that are closely located on the same chromosome, they will have a recombination
frequency of less than 50% due to non-independent assortment. This is because the genetic
markers are linked on the same chromosome. Genetic linkage means the likelihood for alleles of
two genetic markers on the same chromosome to be inherited together is higher than that for
those on different chromosomes. Genetic linkage is measured by recombination frequency, and
can be calculated as the percentage of the offspring with new combinations of alleles, which are
different from the combinations inherited from the parents. The tighter the linkage between
markers, the lower the recombination frequency, and vice versa. It is also true that the tighter the
linkage, the smaller the physical distance, because of the relationship of recombination frequency

43
with physical distance between genetic markers. In a genetic mapp, a 1% recombination
frequency is equalivalent to 1 map unit (m.u.) or 1 centimorgan (cM).
Genetic maps make feasible a wide range of studies, including mapping and positional
cloning of monogenic traits, linkage-based QTL analysis (or genetic dissection of polygenic
traits), construction of genomic-wide physical maps, rapid marker-assisted construction of
congenic strains, and evolutionary comparisons (Copeland et al., 1993a,b).
2.5.1.3 Linkage-based QTL mapping
A genetic map is essential for linkage-based QTL analysis. The principle behind this
analysis is that the inheritance pattern of a QTL can be tracked by genetic markers that are linked
to the QTL (Knapp et al., 1990; Ferreira, 2004; Tanksley, 1993). This is because the linkage
between a QTL and a genetic marker can be indicated by stastistically testing the association
between the genetic marker and any quantitative trait influenced by the QTL. The association
between the marker and phenotype is related to the recombination frequency between the QTL
and the marker, which is dependent upon the distance or the degree of linkage between them.
Therefore, the location of a QTL can be narrowed down by the linkage-based analysis.
Conceptually, there are three steps in the linkage-based analysis: screen the whole
genome using a dense set of genetic markers; calculate linkage statistic for each marker; and
identify the genomic regions indicated by linkage statistic that shows a significant deviation from
what is expected from random assortment.
In practice, interval mapping is often used for linkage-based QTL analysis (Haley and
Knott, 1992; Jensen, 1989). This is because single- and two- marker QTL linkage mapping are
not efficient when compared to interval mapping. Single marker-based analysis cannot reveal the
position and effect of a QTL except knowing there is a QTL linked to the marker (Darvasi and

44
Weller, 1992; Lander and Botstein, 1989). Two-marker based analysis, however, gives some
information about position but too little to be useful. In contrast, interval mapping utilizes
information from the markers flanking each interval, for example, every 1 cM, to evaluate
support for the existence of a QTL (Haley and Knott, 1992; Jensen, 1989). Therefore, it gives
more precise information about a QTL than single- or two-marker approaches. In interval
mapping analysis, the maximum likelihood (ML) method is used to evaluate, for each putative
QTL position, the log of the ratio of the maximum of the likelihood function under the null
hypothesis of no segregating QTL to the maximum of the likelihood function under the
alternative hypothesis of a QTL segregating at that position, given the marker and phenotypic
data (Jansen, 1993; Kao et al., 1999). This provides a logarithm of odds (LOD) score for each
putative QTL position. The putative position with the highest LOD score is the most likely
position of the QTL (Weller, 1986, 2001). An alternative is to use a regression approach, which
gives a high-quality approximation to the ML methods (Xu, 1995, 1998).
In a linkage-based QTL analysis, a question that remains thorny is what standard should
be used for declaring linkage. This is an issue because the test statistic used in the analysis
fluctuates substantially just by chance across an entire genome scan. A lax standard usually leads
to a large amount of false positive linkage claims. Contrarily, if the standard is too stringent, if
will be similarly risky because many false negatives may be found. Therefore, it is essential to
use an appropriate standard that can minimizing these two risks, and the assertions in a linkage
analysis will stand the test of time. However, meeting this need requires both a mathematical
understanding of how often positive results will occur just by chance and a value judgment about
the relative costs of false positives and false negatives (Chen and Storey, 2006; Dalmasso et al.,
2005).

45
The importance of distinguishing between point-wise significance levels and genome-
wide significance levels is another important issue in linkage-based QTL analysis. The point-
wise significance level is the probability that an extreme deviation would occur at a specific
locus just by chance. The genome-wide significance level is the probability that a deviation
would happen somewhere in a whole genome. The former concerns a single test of the null
hypothesis of no linkage; the latter involves fishing over a large number of tests to find the most
significant result. There are three techniques to solve the problem related to multiple tests in the
interval mapping, namely, Bonferroni correction, permutation tests, and use of the false
discovery rate (FDR).
For a linkage-based QTL analysis, the power to detect and locate QTLs depends on: 1)
the ability of the analysis to separate the QTL effect from environmental and other effects, which
determines the accuracy with which QTL effects are estimated; 2) the number of recombination
events in the resource population. The structure of the resource population has an important
influence on the power of QTL detection. Studies on humans, large animals, and trees have used
existing populations (Diez-Tascon et al., 2001; Luo, 1998; Spelman, et al., 1996). Segregating
populations in the existing populations are sought by examining the numbers of full-sib or half-
sib families and by use of the grand-daughter population in the grand-daughter design, for
example. In comparison, studies on small animals such as chickens and mice for which selection
is feasible usually use inbred lines and divergent lines. These lines are used to generate
segregating populations such as backcross, F2, test cross, and recombinant inbred lines. The F2
and backcross designs have led to successful QTL mapping in a number of mammalian species.
QTL detection experiments are expensive. The cost of genotyping is often the largest cost
in the experiment. Therefore, strategies that either reduce the number of genotypings or increase
46
the power to detect QTLs with the same amount of genotyping information have been proposed.
These strategies include selective genotyping, selective DNA pooling, and sequential sampling.
Selective genotyping is a method of QTL mapping in which the analysis of linkage
between markers and QTLs is carried out by genotyping only individuals from the high and low
tails of the phenotypic trait distribution in the population (Darvasi and Soller, 1992). In half-sib
designs, the selective genotyping usually is done within each sire family. Individuals deviating
the most from the mean are selected for genotyping. They are more informative than those with
average phenotypes. This is because QTL genotype can be more clearly inferred from
phenotype in these individuals.
In the selective pooling technique, linkage between a marker and a QTL is determined
based on allele frequency difference at the marker between the pooled DNA samples of the
extreme high and low phenotypic groups of offspring (Darvasi and Soller, 1994; Lipkin et al.,
1998). In other words, if the genetic marker is linked to a QTL affecting the quantitative trait,
one allele at the marker loci will have a higher frequency in the high tail, and the alternative
allele will have higher frequency in the low tail. This technique has several difficulties that are
needed to overcome, such as accurate quantification of individual DNA samples for making the
pooled DNA samples, and removal of ‘shadow’ bands when segregating microsatellite markers
by electropherosis (Darvasi and Soller, 1994; Lipkin et al., 1998). In addition, this technique
only has the power to detect QTLs affecting the trait, for which the pooled DNA samples were
made. The power to detect QTLs underlying other traits will be much lower, unless there is a
high genetic correlation between the traits. In practice, the pooled DNA samples must be
replicated to increase the accuracy of results, which increases the number of genotypings
required.

47
In the sequential sampling technique, a small sample is genotyped at the outset rather
than a sample large enough to obtain a desired statistical power for all markers in the preliminary
step (Motro and Soller, 1993). Further genotyping is not done for those markers that either
clearly show significant or non-significant effect. Additional individuals will be genotyped only
for those markers that display marginal significance. By this method, it is possible to reduce by
nearly half the total number of genotypings of a single trait required.
In the linkage-based QTL analysis, the researcher should be aware of several issues. First,
a QTL may not be a gene. This is suggested by recent analysis of mouse genome. For the mouse,
the coding part of the genome is relatively small (~1.5% of the genome, Waterston et al., 2002).
However, the latest estimates indicated that about 5% of the mouse genome is under selection on
average (Waterston et al., 2002). This implies that there are many non-coding sequences under
selective control. Provided this, it appears that many QTLs are likely to located outside of the
coding regions across the genome. An example is the callipyge trait in sheep, probably caused by
a long-range control element within the DLK-GTL2 imprinted domain (Freking et al., 2002;
Georges et al., 2003). A second area of concern is that a genetic effect in a chromosomal region
rather than a single gene is mapped. The chromosomal region may consist of many linked genes.
Therefore, a single, large effect locus might contain several small-effect genes or genes that have
opposing effects on a phenotype, and the linkage may break up in subsequent generations. Third,
a QTL may be imprinted and therefore may not be detected by assuming Mendelian inheritance.
Fourth, a particular effect may be overestimated since the QTL effect is made up of both a true
effect and environmental error, and the QTLs which exceed the significance threshold are more
likely to have received a favorable environmental error component. Georges et al. (1995)
demonstrated that the overestimation of QTL effects is more evident for QTLs with small effects

48
and for experiments with smaller numbers of animals, using simulation. Last, QTL detection
experiments do not detect epistatic interaction between loci.
Finally, it is well-known that linkage-based mapping of QTL is a rather crude tool
(Devlin and Risch, 1995). On average, a 10 cM chromosomal segment will have about 200 genes,
and 107 base pairs. Although it would seem that increasing the density of markers genotyped
should increase the resolution of a QTL’s location, this is true only up to a point. For most
practical situations, reducing marker spacing below 20 cM does not increase QTL resolution
(Darvasi et al., 1993). This is because the accuracy of locating a QTL depends on the frequency
of recombination observable in the genotyped progeny. Linkage analysis requires a large number
of progeny to position QTLs with any precision; such numbers are often beyond the reproductive
capacity of the target species or resources of the experimenter. The selective phenotyping
technique may increase mapping accuracy marginally. The rationale for selective phenotyping is
that once a QTL is mapped to a given interval, only recombinant individuals within that interval
contribute to further mapping accuracy. Thus, the total number of phenotypes determined can be
reduced by only phenotyping progeny with recombinations within the confidence interval. In
comparison, linkage disequilibrium-based approaches which will be discussed in the following
sections are efficient for QTL fine mapping.
2.5.1.4 Linkage disequilibrium
Linkage disequilibrium (LD), also known as allelic association, is defined as the non-
random association of alleles between two loci (Hendrick, 2000). It means that two alleles at
adjacent loci are inherited together more often than the expected when they were segregated
independently in the population. This definition does not help illustrate the distinction between
linkage and LD mapping. In fact, LD between a marker and a QTL is required if the QTL is to be

49
detected in either sort of analysis. Even so, it is not hard to distinguish linkage analysis from LD
analysis. Linkage analysis only considers the LD existing within families or within an F2
population and broken down by crossover after only a few generations. Therefore, only the
recent recombinations in the population are used in linkage analysis, and the LD may extend for
tens of cM. In contrast, LD mapping requires a marker allele to be in LD with a QTL allele
across the entire population through many generations. To be a property of the whole population,
the association must have persisted for a considerable number of generations, so the marker(s)
and QTLs must be closely linked. LD mapping uses the historical recombinations in the
population.
Because the classic definition is not particularly illuminating with respect to the causes of
LD, Hayes et al. (2003) introduced an alternative multilocus definition, in which LD is defined
as the chromosome segment identity. In this definition, an ancestor’s chromosomes are broken
down by recombinations in each generation, and as a result, only small regions on the
chromosomes of current descendants of the ancestor can be traced back to the chromosomes of
the common ancestor after many generations. These chromosomal regions are therefore identical
by descent (IBD). In other words, the alleles at different loci on these regions are in LD. Many
factors may cause LD, including migration, genetic drift, mutation, selection, small effective
population size, or other genetic events that the population experiences (Lander and Schork,
1994; Hedrick, 2000). For example, in human and livestock populations, small effective
population size is generally implicated as a key cause of LD. Selection is another important
cause of LD. Selection is likely to have a stronger impact on LD around specific genes than that
on other genomic regions.

50
2.5.1.5 LD-based mapping
While linkage analysis still has a part to play to meet our needs for QTL identification, a
shift from linkage analysis to association study has taken place for several reasons (Reich et al.,
2001). First, genetic variation with small or moderate effects on phenotypes is more likely to be
detected by LD-based association studies than by linkage analysis, as noted by Risch and
Merikangas (1996). Second, LD analysis provides a useful approach for QTL fine mapping.
Small segments of chromosome descended from the same common ancestor in the current
population, implied by existence of LD, is an important factor in QTL fine mapping. In addition,
if LD contains genetic variants within a gene, a genome-wide LD analysis will provide extra
benefits to QTL mapping. This is because variants with known biological functions can be
examined in such a LD analysis, and the number of genes that can be examined generally is not
an issue. Last, LD has the advantage of reducing the number of genotyped variants because
variants in strong LD are likely to be inherited together and one can use a subset of tagging
markers as proxies for the entire set.
2.5.1.5.1 LD-based association study
Genetic association studies are used to determine the association between a genetic
marker and a disease or trait. If the association is present, a particular allele of the marker will be
more likely to exist in an individual carrying the trait than expected by chance. The major
designs for LD-based association studies include case-control design and family-based design (or
transmission disequilibrium test, TDT) (Weller, 2001).
Case-control studies are a classical tool for studying associations between genes/markers
and phenotypes such as a disease, trait, or other condition (Risch and Teng, 1998; Teng and
Risch, 1999; Chen et al., 2004). In case-control studies, the cases are those who have the disease

51
or trait under study, and the controls are those who are either unaffected or randomly selected
from the population (Kirkwood, 1988). The allele or genotype frequency of a marker then is
compared between the cases and controls. If there is a difference in the allele or genotype
frequency of the marker between the two groups, it indicates that the variation increasing the
likelihood of the trait may be associated with the genetic marker. One problem with the case-
control design is that allele and genotype frequencies vary between populations under different
conditions. If the case and control populations are not well identified for the conditions, then the
confounding effects of population stratification may lead to a false positive association. In other
words, a phenotype-marker association can arise simply as a consequence of population structure,
rather than as a consequence of linkage or LD.
The potential confounding effects caused by population stratification could be avoided in
a family-based association study. In this study, the parents are used as controls for the case that is
their affected offspring (Mitchell, 2000; Deng and Chen, 2001). The most commonly used test is
the TDT. The TDT compares the number of times a marker allele is transmitted versus not
transmitted from a parent heterozygote for the marker to an affected offspring. Under the
hypothesis of no linkage or LD, these values should be equal. In other words, there is an equal
chance for the alleles of the genetic marker under test to be transmitted from a heterozygous
parent to the offspring. This null hypothesis can be tested by the Chi-square test (Mitchell, 2000;
Deng and Chen, 2001).
2.5.1.5.2 LD-based QTL fine mapping
LD has been successfully used for mapping genes underlying genetic disorders in
association studies (Hastbacka et al., 1992; Kestila et al., 1994; Lehesjoki et al., 1993; Kaplan et
al., 1995). In addition to association studies, however, LD also has an important role in QTL fine

52
mapping, especially for those traits with continuous distributions of phenotypes (Xiong and Guo,
1997).
LD-based QTL fine mapping involves the use of different types of populations including
outbred populations (e.g., the human and the cow) and structured experimental populations (e.g.
the mouse). The existence of LD is the prerequisite for their use in QTL fine mapping. Mapping
resolution is mainly related to the level of LD. When LD is low, high-resolution mapping is
achievable. However, the extent of recombination in the population is the determining factor for
the level of LD. In structured experimental populations, such as advanced intercross lines
(Darvasi and Soller, 1995), recombinant inbred lines (Taylor, 1978), and near isogenic lines, the
recombinations result from repeated crossings. In contrast, in outbred population, the
recombinations are historically accumulated.
Methods for LD-based QTL mapping are still being developed. The most frequently used
methods include identity by descent-based mapping in outcrossed populations (e.g.,
granddaughter design, Riquet et al., 1999) and haplotype-based LD mapping (Meuwissen and
Goddard, 2000). In addition, Xiong et al. (2002) proposed phenotypic selection and haplotype
LD mapping as two strategies for increasing the probability of detecting LD.
In summary, linkage and LD analyses are usually used for QTL mapping. Linkage
mapping is appropriate for low resolution mapping to localize trait loci to broad chromosomal
regions within a few cM, and it is based on family data. LD mapping, on the other hand, is useful
in QTL fine mapping, and it is based on both population and family data (Mitchell, 2000; Deng
and Chen, 2001). Discovery of SNPs provides a tremendous opportunity for multipoint fine
mapping.

53
2.5.2 Functional genomics-based approaches
Functional genomics is a branch of genomics that studies the biological function of genes
and their products (Yaspo, 2001). It utilizes a wide-ranging set of biological techniques to
convert molecular information contained in a genome sequence into information on gene
functions and effects. In a broad sense, functional genomics involves transcriptomics, proteomics,
and metabolomics.
Biological techniques used in transcriptomics can be categorized into single gene and
genome-wide techniques (Hiendleder et al., 2005). The former includes northern blotting,
RNAse protection assay, reverse transcription PCR (semi-quantitative RT-PCR and quantitative
RT-PCR), knock-outs, knock-ins, and tagged and untagged mutagenesis. Genome-wide
techniques include differential display, representational difference analysis, suppression
subtractive hybridization, serial analysis of gene expression, and DNA microarrays (Schena et al.,
1998). Only DNA microarrays for gene expression profiling, which support high throughput and
automation, will be described here.
2.5.2.1 Microarray-based expression profiling
Microarray-based expression profiling has developed into a method for identifying
differentially expressed genes (Hardiman, 2004; Mandruzzato, 2007). The basic concepts about
microarray analysis have been previously outlined by Murphy (2002). The DNA probes that are
complementary to the genes of interest are immobilized on a surface at defined positions. DNA
targets that are reversely transcribed from the sample transcriptome are fluorescently labelled,
eluted over the immobilized surface where the probes are located, and hybridized with probes.
The presence of bound DNA is detected by the fluorescence emitted from the immobilized
surface using specialized scanners. The fluorescent signal is captured and converted into data
54
that can be analyzed using sophisticated software. A DNA microarray featuree generally is
performed on a space of 200 microns or less in diameter. It has two basic formats, cDNA
microarray and oligonucleotide microarray, based on the types of probes used. In a cDNA
microarray, the probes are derived from many different types of mRNAs using reverse
transcriptase, and have longer pieces of DNA than oligonucleotide probes used in an
oligonucleotide microarray (Hughes et al., 2001). These cDNAs can be spotted onto the
chips/glass slides using robotics, and adhered to the glass slides by covalent bonding or
electrophoretic bonding (poly-L-lysine coated plates) or fixed to the glass slides by ultraviolet
irradiation. In contrast, in oligonucleotide microarrays (e.g. Affymetrix array), probes are shorter
pieces of DNA (Dalma-Weiszhausz et al., 2006). They are synthesized either in situ (on the chip)
or by conventional DNA synthesis techniques and later applied to the chips. The
oligonucleotides synthesized in situ are manufactured by light-directed chemical synthesis,
which combines photolithography and solid phase DNA synthesis (Fodor et al., 1993; Pease et
al., 1994). Synthesis proceeds by the use of photochemically removable protecting groups on the
5’ end of a growing oligonucleotide, and a photolithographic mask is used to specify which spots
are deprotected for the next round of synthesis.
2.5.2.2 Variability in microarray analysis
The underlying principle for the microarray technique is hybridizaton, which is simple to
understand. Yet, the microarray technique is not simple to perform, as it is very sensitive to the
influence of many variables that may lead to low reproducibility of microarray-based analysis.
Therefore, it is necessary to validate the results from micoarray analysis using an alternative
method, such as quantitative RT-PCR, Northern blots, or ribonuclease protection assays.

55
In microarray analysis, the sources of variability are: 1) biological variability, 2)
variability in sample preparation (total RNA isolation as well as labeling), and 3) variability in
the system (instruments and arrays, Brown et al., 2004; Chen et al., 2004; Huang et al., 2003).
Among these, the system noise is negligible. This is because that standardized processes that are
involved in a microarray experiment, such as hybridization, washing, staining, and scanning, as
well as the quality controls in manufacturing processes generally make system noise insignificant
when compared with other sources of variation (Altman, 2005; Spruill et al., 2002; Sievertzon et
al., 2006). Obviously, the standardized processes include regular calibrations of all equipment
used in a microarray experiment to ensure accuracy. Technical replicates usually are used to
evaluate technical variation including that caused by system noise. Controlling the variability
from sample preparation is the next challenge. The variability from sample preparation could be
large and unnecessary. Careful technique and well-planned procedures can greatly reduce the
source of variation. During sample preparation, it should be guaranteed that all RNA samples
hybridized to the gene expression arrays meet assay quality standards (Dumur et al., 2004). It is
necessary that all initial total RNA be examined on an agarose gel for the ribosomal RNA bands.
Non-distinct ribosomal RNA bands imply poor quality of RNA sample. The poor quality
generally is due to RNA degradation. The use of RNA sample with poor quality can lead to
failure of a microarray experiment. A 260/280 absorbance reading is another measurement of
RNA quality. The 260/280 ratios ranging from 1.8 to 2.1 are acceptable. Ratios < 1.8 suggest
protein contamination. Ratios > 2.1 suggest degraded RNA and/or excess free nucleotides.
In the second step of sample preparation, reduction in process variability also helps
minimize variability in microarray results. A considerable source of variation in the labeling
process may come from operator-to-operator differences. Care should be taken in the reverse

56
transcription and labeling protocols. Consistency in these processes can reduce potential
variability in a microarray experiment. Minimizing such variability could be achieved by the
following common practices: 1) process all RNAs in a batch; 2) use reagents with the same lots;
3) prepare reagent master mixes; and 4) let a single scientist responsible for all the bench
manipulations. However, often this is not practical, as some experiments can be quite large and
occur over an extended period of time. Thus, it is important to determine and reduce variations in
the process of sample preparation, both within and between the bench scientists (Dumur et al.,
2004).
The last source of variability is biological variation. Unlike technical variation, biological
variation is system dependent and may be more difficult to control, and sometimes be beyond
control. However, there are methods for handling such variation. First, controlling as many
variables as possible is the best choice. Second, if some factors are beyond control, then
randomize them. When replication is sufficient, random selection can limit the impact of the
uncontrollabe factor on the data. Stratification and strata-weighing of the data in the final
analysis also help mitigate the impact. In addition, a pilot study is very helpful in this situation
because it will give some important information for judging the design of real experiment.
It is worth noting that pooling mRNA from biological replicates can reduce the biological
variability among arrays. Many investigators favor this strategy because sample size can be
increased without purchasing more microarrays. However, some potential problems caused by
mRNA pooling should be realized by investigators (Kerr, 2003; Churchill, 2002; Kendziorski et
al., 2003, 2005). First, pooling is not always beneficial. For example, in the context of
classification, pooling impairs the ability to assess inter-individual variation and covariation.
Second, it is impossible to estimate variance with one pool per group. The variance is required
57
for inference testing. Third, even one outlier sample can yield misleading results. Finally, the
measurements avaraged by sample pooling do not necessarily correspond to mathematical
averages of individual measurements, although pooled sample is made from individual samples
(Kendziorski et al., 2005). Nevertheless, pooling is beneficial if the only goal of a microarray
experiment is to identifydifferentially expressed genes. It is ture especially when biological
variation is higher than measurement error, and when biological samples are not expensive
compared with array cost (Kendziorski et al., 2005).
2.5.2.3 Microarray data analysis
Once the variations mentioned above are well-managed, translating image information
from a microarray experiment into biological meaning becomes the most important step for
microarray analysis. A variety of statistical methods for low- and high-level analyses has been
developed to meet this need (Pan, 2002; Chen, 2007).
2.5.2.3.1 Low-level analysis
The low-level analysis, or data preprocessing, includes image analysis (e.g., image
segmentation and background correction), scaling/normalization, filtration and data
transformation (Allison et al. (2002). In cDNA microarrays, background correction is done by
subtracting the nonspecific signal from the spot signal. In contrast, Affymetrix data are
proprocessed with the use of the perfect match and mismatch probes. Normalization in both
cases makes different microarrays comparable. It involves standardizing microarray data to a
certain intensity value. There are multiple options for choosing the value, such as the overall
intensity of the microarray and the intensity of housekeeping genes. For negative normalization
controls, target sequences acquired from a different organism are usually used. Microarray data
are then log-transformed to improve the characteristics of the distribution of expression

58
intensities. The aim of the low-level analysis is to remove systematic variation across arrays and
to allow comparisons between microarray experiments.
2.5.2.3.2 High-level analysis
High-level analysis is then applied to the data resulting from low-level analysis. This
often is called data mining. This analysis mainly includes identification of the differentially
expressed genes, classification analysis (or pattern identification), and interpretation of gene
functions.
Fold change in expression was the first method used to evaluate whether genes are
differentially expressed. However, it is considered to be an inadequate test statistic (Hsiao et al.,
2004; Miller and Galecki, 2001), because it does not utilize variance to evaluate the associated
level of confidence (Hsiao et al., 2004; Budhraja et al., 2003). In other words, using fold change
only is not valid method for differential expression analysis.
The invalidness of fold change has led to the development of other methods that can
minimize inferential errors – type I error (false positive error) and type II error (false negative
error). The commonly used methods include t-test, ANOVA, logistic regression, and survival
analysis. Because microarrays involve multiple testing, α-values should be adjusted. Bonferroni
correction may be one of the options for the adjustment. However, because there are thousands
of genes simultaneously tested in a microarray experiment, it appears impossible to identify
differentially expressed genes that can reach the significance adjusted by Bonferroni correction.
Therefore, less conservative correction methods are needed (Draghici, 2002). False discovery
rate (FDR) is the approach that is commonly used in microarray analysis. It was proposed by
Benjamini and Hochberg (1995). Subsequently, new methods, including mixture-model
methods (Allison et al., 2002; Do et al., 2005; Pounds and Morris, 2003; Datta and Datta, 2005)
59
have been developed to improve the original one (Allison et al., 2002; Tsai et al., 2003; Hsueh et
al., 2003; Van der Lann et al., 2004). In these methods, genes are treated as two types - one
represents those genes that are differentially expressed, and the other(s) represents the genes that
are not differentially expressed (Allison et al., 2002). These methods are much more powerful
than the original one. They estimate a ‘gene-specific’ FDR, which is explained as the Bayesian
probability of identifying a false differentially-expressed gene (Benjamini et al., 2001; Benjamini
and Yekutieli, 2005; Dalmasso et al., 2005). Trying to maintain low FDRs often leads to low
power to detect differential expression. Small sample sizes may make this situation worse.
Obtaining a long list of differentially expressed genes, convincingly, is an initial success.
However, this may confuse the investigators if these unorganised findings are not further
interpreted. Analytic tools have been developed to meet the interpretive challenge posed by the
long list of differentially expressed genes. Gene-class testing is one of the tools and has been
widely accepted. Gene classes are usually based on gene ontology (GO) categories. There are
several gene-class testing methods and software packages available (Osier et al., 2004; Khatri et
al., 2002; Pavlidis et al., 2002, 2004). The principle behind most of the methods is based on
statistic test to compare the number of ‘significant’ genes in a class with the number of genes
expected under a particular null hypothesis. However, the null hypotheses are often poorly
defined. In addition, how to handle multiple testing causes another problem with gene class
testing analysis (Osier et al., 2004).
Classification analysis is an important part of data mining in a microarray experiment.
This analysis aims to place objects into pre-existing categories (supervised classification) or a set
of categories that previously are not available (unsupervised classification). Many classification
algorithms have been developed for microarray data analysis. These algorithms divide genes or

60
samples into groups or clusters based on maximum similarity. They enable the identification of a
gene signature or informative gene subsets. Clustering analysis is the frequently used method for
unsupervised classification (Eisen et al., 1998). It can be divided into hierachical and
nonhierarchical clustering. Most clustering analysis techniques are hierarchical. In hierachical
clustering analysis, the number of nested classes is increased in the resulted classification. In
comparison, nonhierarchical clustering analysis, such as k-means clustering (Varela et al., 2002),
divides objects into different clusters without specifying the relationship between or among
individual elements. Moreover, a self-organizing map is a neural-network-based divisive
clustering approach (Tamayo et al., 1999). It assigns genes to a series of classifications based on
the similarity of their expression vectors to reference vectors. Principal component analysis is
also a powerful technique for analyzing gene expression data when combined with classification
technique. This analysis requires the investigator to specify the number of clusters. In addition,
linear discriminant analysis is an approach for supervised classification. In this approach, a
training set that consists of all classes of interest is used to set up a model, then the model is used
to classify an unknown sample and place it clearly into one of the established classes (Hakak et
al., 2001).
Last but not least, microarray data need to be interpreted within the context of gene
function and the functional relationships between genes. The development of a gene ontology
database helps relate microarray data to existing biological knowledge.
2.5.2.4 Microarray-based identification of QTL for immune responses
Microarray technology has been used for identification of candidate genes involved in
immune responses in model and farm animals. For example, Hutton et al. (2004) used the Incyte
mouse GEM1 cDNA array to build a gene expression database from genes expressed in 65

61
diverse mouse tissues, including approximately 10% of immune tissues. As a result, 360 genes
were identified as highly expressed only in mouse immune-specific tissues. The genes identified
were candidate immune response genes in mice. Another example is the study conducted in
chickens by Liu et al. (2001) for identification of candidate genes for Marek’s disease resistance
and susceptibility. In their results, 15 candidate immune response genes were identified.
2.5.3 In-silico genomics-based approaches
2.5.3.1 In-silico genomics
Just as its name implies, in-silico genomics is an interdisciplinary combination of
computer science and genomics. It may overlap with comparative genomics because they both
perform studies based on sequence similarity.
The prerequisites for conducting in-silico genomics studies are a variety of well-
established databases and bioinformatics tools. Based on the resources, in-silico genomics
functions at a variety of levels (genomic DNA, mRNA, protein). The strategy that is often used
in in-silico genomics is a similarity search. The similarity stems either from the relative stability
of intra-species inheritance or from inter-species evolutionary conservation (such as a homolog
and other conserved elements). The Basic Local Alignment Search Tool (BLAST) is one of the
bioinformatics tools that was developed for similarity search. The structure and function of a
given DNA sequence could be predicted based on the similarity between the query sequence and
subject sequence whose structure and function are known.
2.5.3.2 In-silico genomics-based identification of QTL for immune responses
With the increasing availability of sequences, expressed and genomic, a comparative
genomics-based approach also provides an opportunity to identify immune response genes using
bioinformatics tools. Despite the fact that this approach can not generate a new list of candidate

62
genes, it provides an easy and feasible approach to transferring information from species to
species. For example, Smith et al. (2004) used an in-silico approach to identify potential chicken
orthologues for human immune-related sequences. A total of 185 immune-related sequences
were found, 95 of which may represent sequences of genes not previously present in
GenBank/EMBL nucleotide and protein databases.
2.6 Molecular basis of antibody-mediated immunity
2.6.1 Genes associated with antibody-mediated immunity
To date, several causative genes that are involved in Ab production have been identified
in animals, including the mouse. These genes can be roughly divided into four groups as follows.
First, the genes controlling basal immunoglobulin level and/or Ab production, such as the genes
btk (Scher, 1982; Tsukada et al., 1993; Vetrie et al., 1993), gp39 (Aruffo et al., 1993; Kroczek et
al., 1994; Notarangelo et al., 1992), Rag (Taccioli and Alt, 1995) and ada (Abbott et al., 1986;
Gossage et al., 1993; Woloschak et al., 1987; Gossage et al., 1993). Second, MHC locus immune
response genes. Third, Igh locus immune response genes. Last, genes at other loci, such as IR-2
(Roopenian et al., 1993), Thy1 (Young et al., 1976) and minor histocompatibility loci (Gasser et
al., 1974). It has been observed that the effects of some of these genes can be strongly modulated
by their interactions with background genes (generally standing for genes unlinked to MHC or
Igh loci). Unfortunately, the background genes are mostly unknown.
2.6.2 Genetic markers associated with antibody-mediated immunity
Experimental data have revealed that immune response genes at MHC and Igh loci
account for approximately 10% to 15% of the variation of Ab production, respectively. This
suggests that non-MHC and non-Igh genes collectively should have a large influence on the
63
regulation of Ab production. It is possible to identify these genes with genetic markers. In fact,
this identification has been made in both mice and chickens using genetic lines divergently
selected for anti-SRBC response levels. In mice, Peul et al. (1995, 1996) conducted a genome-
wide scan for genes or markers associated with anti-SRBC titers using Biozzi mice that express
divergently selected anti-SRBC levels. Their results suggest that in addition to
immunomodulatory genes over MHC and Igh regions, some unknown immunomodulatory genes
were located near other markers, including D4Mit31, D6Mit5, D8Mit57, D10Mit14 and
D18Mit19 over distinct chromosomal segments. Their contributions to anti-SRBC variation
ranged from 3% to 13%. Similar studies also were conducted in chickens. Siwek et al. (2003)
identified several markers associated with anti-SRBC titers on chicken chromosomes 3, 5, 6, 9,
10, 15, 16, 23 and 27 using F2 birds produced by egg-laying chickens selected for high or low
anti-SRBC levels. In addition, Yonash et al. (2001) reported that ADL0146 on chromosome 2
was associated with variation of anti-SRBC level in segregating populations originated from
crosses between broiler lines divergent for high and low Ab response to E. coli.
2.7 Summary of the literature review
The literature review discussed some features of the chicken that are related to its roles as
a food animal in agriculture and a model animal for studying vertebrate immune response. Two
types of resource populations for QTL identification including inbred lines and divergently
selected lines also were compared in terms of advantages and shortcomings. Emphasis has been
placed on the recent understanding of immune response, and on the technical problems and
switches in genomics-based approaches for QTL identification.

64
The understanding of immune response was greatly deepened by many new findings.
These findings were mostly concentrated on the mechanisms that underlie immune response,
such as how immune response is activated, how a pathogen is recognized, how immune cells
differentiate and mature after activation, and how major cellular and molecular components of
immune response interact with each other. The understanding of the relations between natural
disease resistance and immune response also was increased by identification of genes that
underlie both traits. However, understanding of the molecular basis for the mechanisms that
underlie immune response remains limited, although a few genes and genetic markers associated
with immune response have been identified. Identification of new genes and genetic markers is
essential for defining the molecular basis of immune response. Classic and new genomics-based
analytic approaches, such as linkage analysis, LD analysis, genome-wide expression profiling,
and in-silico genomics-based analysis have been developed to meet this challenging task. Use of
divergently-selected lines may facilitate this process. Genetic lines divergently selected for anti-
SRBC response have been developed, which provide a useful resource for identification of
associated genes or genetic markers. These genes or genetic markers will contribute to the
understanding of the molecular basis of immune response. In the following chapters of this
dissertation, the identification of genes and genetic markers associated with anti-SRBC response
will be described.

65
CHAPTER 3
Development and characterization of resource populations for QTL mapping
3.1 Abstract
Divergently selected lines and segregating crosses derived from them constitute a useful
resource for the identification of quantitative trait loci (QTLs) for economically important traits.
The objective of this project was to develop a resource population for the identification of
genetic markers associated with antibody response to sheep red blood cells (anti-SRBC) in
chickens. Birds from the 28th generation of lines divergently selected for high (H) or low (L)
anti-SRBC titers were used as parental lines to develop reciprocal crosses, including F1, F2 and
backcross (BC). As expected, the long-term selection for anti-SRBC caused significant
phenotypic divergence (p<0.05) of the H and L lines, with the mean anti-SRBC titers of 11.5 for
H and 2.6 for L. The data suggest that frequencies of alleles that underlie antibody response to
SRBC have differentiated between the lines. Candidate marker analysis also supported this
hypothesis. Heterosis for anti-SRBC response was not significant (p>0.05). The mean anti-
SRBC titers of the 4 groups of F2 progeny ranged from 6.3 to 7.5, while those of the 8 groups of
BC progeny ranged from 3.9 to 13.3, suggesting that alleles that influence anti-SRBC titers were
segregating in the resource population. In addition, phenotypic data from the resource population
showed no significant sex, reciprocal, or maternal effects, making it appropriate for use in QTL
analysis.
Keywords: antibody response, Gallus gallus, resource population, selection

66
3.2 Introduction
Divergently selected lines have been widely used for QTL analysis in animals, including
swine (Kadarmideen and Janss, 2007), chicken (Yonash et al., 2001; Lagarrigue et al., 2006) and
mouse (Puel et al., 1996; Horvat et al., 2000; Keightley et al., 1993). Selection leads to
phenotypic divergence if a trait has moderate to high heritability. The increasing use of these
lines for QTL analysis is probably because frequencies of alleles at most QTLs that underlie a
selected trait differentiate due to selection. This results in the fixation or near-fixation of the
favorable or unfavorable alleles (Andersson and Georges, 2004). Keightley et al. (1993)
demonstrated that some QTL locations could be directly identified from marker allele frequency
differences between divergently selected lines. Divergently selected lines also can be used to
generate segregating populations, such as F2 and backcross, for linkage-based QTL mapping or
validation of candidate markers.
The level of antibody production is a quantitative trait with moderate heritability
(Feingold et al., 1976; van der Zijpp et al., 1980; Pinard et al., 1992). Specific estimates of
heritability range from 0.18 to 0.36. Response to divergent selection for anti-SRBC titers
supports that anti-SRBC level is a polygenic trait (Siegel and Gross, 1980; van der Zijpp et at.,
1980, 1983). The phenotypic divergence between the selected lines implies differentiation of
allele frequencies at QTLs associated with anti-SRBC response in the two lines. It has been
demonstrated that different MHC alleles, which are critical for antibody response, differentiated
in the divergently selected anti-SRBC lines (Dunnington et al., 1984; van der Zijpp et al., 1987;
Martin et al., 1990). The genetic architecture of anti-SRBC response, i.e., the heritability,
heterosis, maternal and sex effects, in the resource population derived from the selected lines has
been characterized (Boa-Amponsem et al., 1997). The effect of heterosis on anti-SRBC response

67
has not been consistent in the literature (Siegel et al., 1982; Ubosi et al., 1985a; Pinard and van
der Zijpp, 1993; Boa-Amponsem et al., 1997).
Genetic lines divergently selected for high (H) or low (L) antibody titers in primary anti-
SRBC response have been established for mouse (Feingold et al., 1976). These lines have been
used for the identification of QTL associated with anti-SRBC titers (Puel et al., 1995, 1996).
Similar lines also have been established in the chicken (Siegel and Gross, 1980; Van der Zijpp et
al., 1983), although they have not been used for QTL analysis. Useful resource populations for
QTL mapping consist of parental lines and crosses including F1, F2 and backcross populations.
The objective of this study was to develop a resource population that could be a resource for
mapping QTLs associated with anti-SRBC levels in the chicken. The utility of the resource
population was initially examined by testing for the distribution of candidate markers associated
with antibody titers, is described by Kaiser and Lamont (2002) and Kaiser et al. (2002).
3.3 Materials and Methods
3.3.1 Animals and crosses
The experimental lines originated from a random-bred White Leghorn foundation stock.
The anti-SRBC levels of the lines and the divergent selection program have previously been
described (Siegel and Gross, 1980). Briefly, birds between 41 and 51 days of age were selected
for high or low antibody titers 5 days after a single intravenous injection of 0.1mL of a 0.25%
suspension of SRBC. Anti-SRBC titers were determined by haemoagglutination assay, in which
anti-serum that underwent 2-fold dilution multiple times was put into v-bottomed 96-well plate
containing a 0.25% suspension of SRBC, and then this mixture was incubated at 37˚C for 4 hrs
for antibody titer reading. Titers were expressed as log2 of the reciprocal of the highest dilution

68
in which there was hemagglutination. In this experiment, birds from the 28th generation of this
two-way selection experiment and crosses derived from them were used. The mating scheme for
the crosses is shown in Figure 3.1. In this scheme, F1 progeny, HL and LH, were generated by
reciprocal crosses of birds from the 28th generation of the selected lines, H(♀)×L(♂) and
L(♀)×H(♂), respectively. The F1 progeny were intercrossed {LH(♀)×LH(♂),
HL(♀)×HL(♂),HL(♀)×LH (♂) and LH(♀)×HL(♂) } to generate 4 groups of F2 progeny, giving
rise to LHLH, HLHL, HLLH and LHHL stocks, respectively. The F1 progeny also were
reciprocally backcrossed to each of the parental lines {LH(♂)×L(♀), HL(♀)×L(♂), L(♀)×LH(♂),
L(♀)×HL(♂), HL(♀)×H(♂), LH(♀)×H(♂), H(♀)×LH(♂) and H(♀)×HL(♂)} to generate 8
groups of backcross progeny, including LHLL, HLLL, LLLH, LLHL, HLHH, LHHH, HHLH
and HHHL stocks, respectively.
3.3.2 Preliminary assessment of the usefulness of the resource population
Previously described microsatellite markers shown to segregate with antibody titers in
other populations were tested for association with anti-SRBC in our resource population.
Genomic DNA isolated from 48 birds per selected line (H and L) was used as a template in PCR
as described by Smith et al. (2000). The markers, previously shown to be associated with
antibody response to Salmonella enterica vaccine, include ADL020, ADL138 and ADL198
(Kaiser and Lamont, 2002; Kaiser et al., 2002). Primers previously described by Kaiser and
coworkers (Kaiser and Lamont, 2002; Kaiser et al., 2002) were used for amplification, and the
products were analyzed on an ABI377 automated sequencer (PE biosystems) using GeneScan
3.1 software (Applied Biosystems).

69
3.3.3 Statistical analysis
The GLM procedure of SAS was used to evaluate sex and line differences in anti-SRBC
titers within and between the selected lines. Pair-wise differences among the mean anti-SRBC
titers of the H, L, backcross (BC), F1, and F2 stocks were tested for significance using the
Student’s t test. Heterosis, reciprocal cross effect, maternal effect, and recombination effect also
were assessed. Frequency of each microsatellite allele was calculated, and statistical significance
of allele frequency differences between the parental lines was evaluated by the χ2-test.
3.4 Results and Discussion
3.4.1 Phenotypes in the resource population
The mean anti-SRBC titers in the 28th generation produced by the birds used from the H
and L lines were 11.5 and 2.6, respectively (Table 3.1). This result is consistent with previous
reports (Boa-Amponsem et al., 1997), suggesting additive genetic variation for primary antibody
response to SRBC at 5 days post-injection. This result also suggests that alleles associated with
anti-SRBC response in these lines were differentiated. This differentiation is expected, as
previous investigations showed that the L line reached a plateau in anti-SRBC response and did
not overlap with the H line after 14th generations of selection (Martin et al., 1990). In addition,
there was no difference in the mean anti-SRBC titers between sexes (data not shown), which is
consistent with previous reports (Siegel and Gross, 1980; Boa-Amponsem et al., 1997). Thus, the
mean anti-SRBC titers for each line shown in Table 3.1 is the average of the two sexes.
The mean anti-SRBC titers of F1 progeny produced by reciprocal matings were 7.8 and
8.3 (Table 3.1, Figure 3.1). The mean anti-SRBC titers of F2 and BC progeny were dependent on
the types of crosses used for their generation, which classified F2 and BC progeny into 4 and 8

70
groups, respectively. The mean anti-SRBC titers of the 4 groups of F2 progeny ranged from 6.3
to 7.5, while those of the 8 groups of BC progeny ranged from 3.9 to 13.3 (Table 3.1, Figure 3.1).
All crosses except HHHL backcross progeny fell within the range of the selected lines. The rank
of each cross for the mean anti-SRBC titers varied with the amount of genetic elements inherited
from the respective selected lines. For example, the more inheritance from the H line, the higher
the mean anti-SRBC titers of the cross. This result suggested that alleles influencing anti-SRBC
titers that segregate in the F2 and BC progeny would be appropriate for validation of candidate
markers associated with the trait.
The F1 birds had higher, but not significantly different mean anti-SRBC titers from the
parental average (p>0.05), suggesting lack of heterosis for anti-SRBC titers. This is consistent
with some (Pinard and van der Zijpp, 1993) but not all previous studies (Siegel et al., 1982; Boa-
Amponsem et al., 1997). In addition, the reciprocal cross effect (HL-LH) and the maternal
effects (LL F1- F1LL or HH F1-F1HH) were not significant (p>0.05).
3.4.2 Informativeness of the resource population
The three candidate microsatellite markers, including ADL020, ADL138 and ADL198,
exhibited significantly different allele frequencies between the selected lines (p<0.001), with
some alleles being line-specific (Table 3.2). For example, a 94 bp allele at ADL020 was detected
only in the L line while a 106 bp allele was observed only in the H line. This observation is
consistent with earlier reports of segregation of MHC alleles with anti-SRBC response
(Dunnington et al., 1984; van der Zijpp et al., 1987; Martin et al., 1990). Moreover, because at
least one marker, ADL198, is not located near either the MHC or the Igh loci, the selected lines
could prove useful for identification of non-MHC/Igh genes that significantly influence anti-
SRBC titers. Because candidate markers were previously shown to be associated with antibody

71
response to Salmonella enterica vaccine (Kaiser and Lamont, 2002; Kaiser et al., 2002), genes
influencing antibody production in response to SRBC may be similar to those for anti-
Salmonella enterica antibody production. This hypothesis is supported by observations that
chicken lines with elevated antibody titers to one antigen had high antibody responses to other
antigens (Heller et al., 1992; Yunis et al., 2002). Genetic markers like these prove useful in
marker-assisted selection for improving general disease resistance in animals.

72
Table 3.1 Means and standard devations of antibody response by chickens in the high (H)-, low
(L)-, backcross (BC)-, and F2-resource populations five days post-injection of sheep red blood
cells (SRBCs)
Population/na Classificationb Mean ±SDc
Selected/138 L 2.6±1.11d
Selected/120 H 11.5±2.83f
F1/70 LH 7.8±0.96e
F1/65 HL 8.3±1.51e
BC2/57 LHLL 3.9±1.51d
BC2/44 HLLL 4.6±1.68de
BC2/53 LLLH 4.8±1.27de
BC2/48 LLHL 5.9±2.06e
BC1/43 HLHH 10.4±2.45f
BC1/59 LHHH 10.5±3.33f
BC1/59 HHLH 10.5±3.59f
BC1/24 HHHL 13.3±4.43f
F2/39 LHLH 6.3±2.44e
F2/38 HLHL 6.4±2.12e
F2/40 LHHL 7.1±1.85e
F2/42 HLLH 7.5±2.23e a n is the number of birds from which antibody response to SRBC was determined. b H and L represent the parental lines divergently selected for high (H) and low (L) anti-SRBC
titers, respectively. HL and LH in the F1 population represent birds produced by H(♀)×L(♂) and
L(♀)×H(♂) crosses, respectively. LHLL, HLLL, LLLH, LLHL, HLHH, LHHH, HHLH and
HHHL in BC population represent birds produced by LH(♀)×L(♂), HL(♀)×L(♂), L(♀)×LH(♂),
L(♀)×HL(♂), HL(♀)×H(♂), LH(♀)×H(♂), H(♀)×LH(♂) and H(♀)×HL(♂) crosses,
respectively. LHLH, HLHL, LHHL and HLLH in the F2 population represent birds produced by
LH(♀)×LH(♂), HL(♀)×HL(♂), LH(♀)×HL(♂) and HL(♀)×LH (♂) crosses, respectively. c Values within the column of antibody titers (log2 transformed) with no common superscript
differ significantly (p<0.05).

73
Table 3.2 Allelic frequencies of candidate microsatellite markers that were previously identified
as associated with immune response
Marker ADL020 ADL138 ADL198
Allele (bp)a 94, 98, 106d 113, 119 115, 117, 119, 123
H/n=48b 0.00, 0.61, 0.39e 0.56, 0.44 0.97, 0.03, 0.00, 0.00
L/n=48c 0.13, 0.87, 0.00 1, 0.00 0.24, 0.05, 0.66, 0.05
χ2/p-value 53.4/<0.001 53.8/<0.001 110.7/<0.001 a Alleles at each candidate microsatellite marker locus indicated by the size of the allele in base-
pairs (bp). The candidate markers were associated with antibody titers to S. enterica, which was
described by Kaiser and coworkers (2002). b,c Allele frequencies estimated from 48 individuals in each selected line. H and L represent the
chicken lines divergently selected for high or low antibody titers to sheep red blood cells,
respectively. d,e The sizes of the alleles at each candidate marker and their corresponding frequencies in the
selected lines.

74
Figure 3.1 Resource population development scheme. The diagram above illustrates the mating
scheme for the development of crosses. The crosses including F1, F2 and backcross (BC) were
developed from the parental lines (P). Each cross has reciprocal matings. The rectangles and the
ovals represent male and female bird, respectively. H and L represent the lines divergently
selected for high or low antibody titers to sheep red blood cells, respectively, or represent genetic
elements inherited from each of the lines.
75
CHAPTER 4
Identification of candidate DNA markers associated with primary antibody
response to sheep red blood cells in chicken
4.1 Abstract
Randomly amplified polymorphic DNA analysis provides a technically easy, rapid, and
inexpensive method for conducting a genome-wide scan to identify markers associated with
QTLs using divergently selected lines. Here, I describe DNA markers associated with levels of
antibody titers produced in response to a challenge by sheep red blood cells (anti-SRBC). Five
hundred and fifty five random primers were used in the preliminary screening of DNA pools
established from chickens divergent for level of antibody titers. The resulted informative random
primers were further evaluated on 48 individual DNA samples from each of the divergent anti-
SRBC lines. Six of them amplified line-specific RAPD fragments. Seven SCAR markers were
converted from the line-specific fragments amplified by 4 of the random primers. These SCAR
markers were on chicken chromosomes 1 (2 markers), 2 (2), 4 (1), 8 (1), and 13 (1), which was
determined by genetic and physical mappings. Fifty-two SNPs were detected in the SCAR
markers and their flanking regions. The subsequent SNP-QTL analysis indicated that the allelic
frequencies of the SCAR markers were significantly different (p<0.0025) between the parental
lines, although only two of them were confirmed in the segregating population (p<0.05). The
candidate markers will be useful in efforts to understand the genetic control of humoral immune
response and to develop breeding programs of marker-assisted selection for antibody production
in chickens.
Keywords: DNA markers, Gallus gallus, humoral immunity, SNP (single nucleotide
polymorphism)

76
4.2 Introduction
Public health concerns about the use of antibiotics in livestock and poultry feed have
increased interest in raising animals with strong natural immunity (The New York Times,
February 10, 2002). One approach for identifying and raising animals with strong natural
capacity to resist diverse pathogens is by the use of genetic markers. Increased disease resistance
may allow reduced use of antibiotics in animal feed. Studies have shown that genetic factors
associated with humoral immune response including those related to antibody production are
involved in animal’s disease resistance (Gross et al., 1980; Plant & Glynn, 1982; Siqueira et al.,
1985; Martin et al., 1986; Stiffel et al., 1987; Gross et al., 2002; Yunis et al., 2002). However,
identifying the genetic factors is challenging in vertebrates because the level of humoral immune
response or antibody production is a quantitative trait controlled by multiple genes (Feingold et
al., 1976; Biozzi et al., 1979; Ibanez et al., 1988). As a result, knowledge about the molecular
basis of the trait remains limited.
Experimental populations in both the mouse (Biozzi et al., 1972; Feingold et al., 1976)
and chicken (Siegel & Gross, 1980) that showed divergence in antibody levels in response to
sheep red blood cells (anti-SRBC) have been used to identify genetic markers associated with
genes that influence antibody production. In the mouse, selected lines divergent for antibody
titers were used by Puel et al. (1995, 1996, 1998) to identify and characterize genetic markers for
quantitative trait loci (QTLs) associated with anti-SRBC. The reciprocal backcrosses of the
mouse lines also were used to confirm the association of Igh gene and the major
histocompatibility complex (MHC) with anti-SRBC response. The non-MHC and Igh genes,
however, accounted for about 40% of phenotypic variation observed in antibody levels in the
segregating population.

77
As in the mouse, DNA markers associated with antibody response have previously been
reported for the chicken (Yonash et al., 2001; Siwek et al., 2003; Zhou et al., 2003). In laying
hens, Siwek et al. (2003) used an F2 population developed from a cross between chickens
divergent for high or low anti-SRBC titers to detect a total of six QTLs associated with anti-
SRBC titers on different chicken chromosomes. Other chicken populations also have been used
in the search for QTLs associated with primary anti-SRBC, including meat-type chickens
(Yonash et al., 2001; Zhou et al., 2003). For example, Yonash et al. identified a QTL on
chromosome 2 using broiler lines divergently selected for antibody production to E. Coli vaccine
(Yonash et al., 2001). However, this QTL was different from that identified by Siwek et al.
(2003). This difference in identification of candidate markers may be due partially to the use of
different population, which have their own characteristics, such as different breeds and the
subjects of different selection programs. These results collectively suggest that more work will
be needed for identification of candidate DNA markers or QTLs responsible for antibody
production.
4.3 Materials and Methods
4.3.1 Animals, DNA samples, and template preparation
The resource population consisting of the divergently selected lines and the crosses
derived from these was used, which has been described in Chapter 3. In the preliminary analysis,
20 birds from each of the selected lines (H and L) were used to create two DNA pools according
to Smith et al. (2002). The pools and 2 individual DNA samples from each of the selected lines
then were used to screen for line-specific DNA fragments. Primers revealing line-specific
fragments were further tested on 48 birds from each of the H and L lines. Thirty-two birds from

78
each of the backcross 1 and 2 (BC1 and BC2) populations generated from matings of F1s to H and
L line birds, respectively, also were used to test primers that revealed line-specific fragments.
4.3.2 Randomly amplified polymorphic DNA (RAPD) analysis
Blood was collected from each bird into tubes containing 0.5M EDTA by brachial
venipuncture. Genomic DNA was isolated from 50 ul aliquots of each sample using a standard
salt-precipitation procedure (Bartlett et al., 1996). Genomic DNA samples were dried down and
dissolved in sterile water to a concentration of 50ng/ul.
A total of 555 10-base random primers (Operon Technologies) were used in the initial
screening of DNA pools from the selected lines to identify informative primers that reveal H or L
line-specific DNA fragments. Each amplification reaction was in a final volume of 10uL
containing: 10 mM Tris-HCl (pH 8.3), 50 mM KCl, 1.5 mM MgCl2, 0.001% gelatin, 75 ng
template DNA, 40 ng primer, 200 uM of each dNTP and 1 unit of Amplitaq DNA polymerase
(Applied Biosystems Inc.). The PCR was carried out in a PTC100 (MJ Research) thermal cycler
using the following cycling conditions: initial denaturation at 95°C for 5 minutes, followed by 34
cycles of denaturation at 94°C for 1 minute, annealing at 35°C for 45 seconds, and extension at
72°C for 2 minutes, then a final extension at 72°C for 5 minutes.
4.3.3 SNP analysis
The RAPD fragments that were line-specific on both DNA pools and individual
samples were gel-purified using the Qiaquick Gel Extraction kit (Qiagen Ltd.), cloned in the TA
cloning kit (Invitrogen), and sequenced using the BigDye cycle sequencing kit as previously
described (Smith et al., 2000). One kilo-base (kb) length of sequences that are 5 kb and 10 kb
up- or down-stream of the sequenced DNA fragments were also retrieved from chicken genome
sequence through Chicken Genome Browser Gateway on the webpage:

79
http://genome.ucsc.edu/cgi-bin/hgGateway. Primers were designed from each sequence for PCR
using PRIMER 3 (Rozen & Skaletsky, 2000). Amplicons produced using each pair of primers
were scanned for SNPs by sequencing with the use of bioinformatics tools Phred, Phrap and
Consed (Gordon et al., 1998). Genotyping of the backcross panel for informative SNPs within
each sequence was done by re-sequencing as previously described (Nickerson et al., 1998; Smith
et al., 2000).
For the genetic mapping, the parental samples of the East Lansing chicken genetic
mapping reference panel (Crittenden et al., 1993) were used to evaluate the informativeness of
the SNPs identified within each RAPD amplicon designated as a putative DNA marker. Markers
with informative SNPs, or those for which the sire and dam had different genotypes, were
mapped by multipoint linkage analysis (Cheng et al., 1995). For the radiation hybridization (RH)
mapping, PCR was carried out as suggested by Morisson et al. (2002) using the same primers
and conditions used for the sequence-based genetic mapping.
4.3.4 Bioinformatics analysis
The sequences of the RAPD fragments were used to determine their chromosomal
locations based on sequence alignment against the Gallus gallus genome sequence, which is
available at: http://genome.ucsc.edu/cgi-bin/hgBlat?command=start. The candidate genes at or
near these sequences, which have known or putative functions related to immune response, were
searched for using the Map Viewer tool available on the webpage of the National Center for
Biotechnology Information.
4.3.5 Statistical analysis
The statistical significance of allele frequency difference at each candidate DNA marker
locus between the selected lines was evaluated by the χ2-test. The association of each marker

80
with anti-SRBC titers in the backcross population was tested using the GLM procedure of SAS.
In the GLM analysis, the main effects mating type (BC1 and BC2) and each SNP were tested
without consideration of any interaction terms. The effect of sex was not included because it was
not significant (p>0.05).
Haploview3.32 (http://www.broad.mit.edu/mpg/haploview/) was used to test Hardy-
Weinberg Equilibrium of each SNP, calculate pairwise LD between SNPs, construct haplotypes,
and perform case-control association studies for both single markers and haplotypes using
pedigree information from the BC1 and BC2 populations. A total of 64 individuals from the
backcrosses was used in the analysis. These individuals were grouped into 26 families based on
parental origin. Case-control association studies were performed separately for each of the two
backcross populations by converting anti-SRBC titers into two dummy values, ‘1’ for ‘Control’
and ‘2’ for ‘Case’. Individuals with anti-SRBC titers >9 in BC1 or <6 in BC2 were labeled as
‘Case’, while the rest were labeled as ‘Control’. Here, the cutting-offs were set to make the
numbers of ‘Case’ and ‘Control’ roughly equal. Hardy-Weinberg equilibrium was tested for each
of the single SNP markers and halpotypes before case-control study was performed. The
significance of association between anti-SRBC titers and single marker/haplotype was estimated
by Chi-square test. A permutation test also was performed with 1000 permutations to obtain a
measure of significance corrected for multiple testing biases.
4.4 Results
4.4.1 Sequence analysis and mapping
About 6 RAPD fragments on average were amplified by each of 555 random primers
(data not shown). Out of the 555 random primers tested, six amplified line-specific fragments in
81
the pooled and individual DNA samples (Table 4.1, Figure 4.1). The estimated sizes of the line-
specific fragments that were amplified by the 6 primers ranged from 500 bp to 1200 bp.
Frequencies of the line-specific fragments ranged from 51-96%. Seven sequence characterized
amplified region (SCAR) markers were converted from the line-specific RAPD fragments
amplified by 4 random primers because they had higher frequencies (Table 4.2). Each of the
SCAR marker sequences was submitted to GenBank, and was assigned an accession number
(Table 4.2).
Within the SCARs and their flanking regions, 52 SNPs were identified using the selected
lines (H and L) and the East Lasing (EL) genetic mapping reference panel (Table 4.3, Figure 4.2).
The 6 SNPs detected in the East Lansing population were used to map the SCARs by linkage
analysis. Two SCARs, VTC02 (or VPI0004) and VTC06 (or VPI0005), were assigned to the
consensus linkage groups GGA4 and GGA8 with LOD scores of 11.1 and 13.2, respectively
(Table 4.5, Figure 4.4, Figure 4.5). However, VTC03 was unlinked (Table 4.5), and the other
putative markers did not have an informative polymorphism in the East Lansing reference
mapping panel. Sequence alignment of the 7 SCARs against the chicken genome sequence
deposited in GenBank showed similarities to chicken chromosomes 1, 2, 4, 8, and 13 (Table 4.2).
In radiation hybridization mapping (Figure 4.4), VTC03 was linked to MCW153, LEI248,
MCW087, MCW027 and MCW009 on chromosome 2 with LOD>=6, which was consistent with
the result from sequence alignment of the marker. However, VTC02 only was linked to
MCW0131 on chromosome 2 with a LOD>=6, which was not consistent with its genetic
mapping data (GGA4). Other markers also were not mapped. These cases occurred probably
because of the low-resolution chicken radiation hybridization map at that time (Table 4.6, Figure
4.6).

82
4.4.2 SNP analysis
Allele frequencies between H and L birds for some of the SNPs identified in the SCAR
markers were significantly different (p<0.0025) (Table 4.3, Figure 4.3). Three markers, including
VTC02, VTC04 and VTC06, also were significantly (p<0.05) associated with anti-SRBC
response in the backcross population based on the GLM analysis (Table 4.3).
The pairwise LDs between the SNPs with LOD scores are shown in Table 4.7. Few SNPs
were not in Hardy-Weinberg Equilibrium (data not shown). Based on the pairwise LDs between
SNPs, LDs were plotted and haplotypes with frequencies were constructed in the backcross
populations (Figure 4.7). The case-control association studies indicated that VTC01 and VTC03
in BC2 and VTC04 and VTC06 in BC1 were significantly associated with anti-SRBC titers
(p<0.05) (Table 4.8, Figure 4.8), which was partially consistent with the GLM analysis.
The differences in anti-SRBC titers among genotypes of selected SNP for each of the
candidate markers indicated that the alleles G at VTC02S5, G at VTC03S1, C at VTC04S1, C at
VTC05S1 and T at VTC07S1 were significantly associated with QTL alleles that have negative
effects on anti-SRBC titers, while the alternative alleles had increasing effects (p<0.01) (Table
4.4).
4.4.3 Bioinformatics analysis
Bioinformatics analysis indicated that there were 18 immune response-related genes
located near (<2.5 Mb) the SCAR markers (Table 4.9). These genes include those close to
VTC01 (TCF7, LTC4S and CD74), VTC02 (C1QTNF7, LOC428465 and CYTL1), VTC03
(LOC420912, cadherin and CDH10), VTC04 (LOC428465, LOC428464, RCJMB04_3g3,
LOC420756 and LOC420755), VTC05 (BTG1 and SOCS2), VTC06 (BCL10), and VTC07
(CD99). The distances from their corresponding SCAR markers ranged from 111 kb to 2,250 kb.

83
4.5 Discussion
In this study, seven line-specific DNA fragments were identified in the selected lines
through an approach that combines LD-based analysis with RAPD-based genome-wide scan
(Table 4.2, Figure 4.1). The principle behind this is that a QTL associated with the selected trait
could be identified based on allele frequency differences of QTL and DNA markers that are in
LD with the QTL among divergently selected lines (Keightley et al., 1993). In divergently
selected lines, the favorable alleles of QTLs and their flanking regions under strong selection
could be fixed or near-fixed (Andersson and Georges, 2004; Siegel et al., 2006). In this study,
the divergently selected lines used were developed from 28 generations of selection for high or
low anti-SRBC titers. As indicated in Chapter 3, most of QTLs associated with anti-SRBC
response were differentially accumulated in the lines.
Due to randomness of primer sequences used in a RAPD-PCR reaction, the RAPD
technique provides an effective approach to genome-wide screening for differentially-
accumulated alleles at QTLs or neighboring marker loci. In this study, 555 random 10-mer oligo-
nucleotide primers were used to screen for informative markers. This amount of random primers
provides a theoretically estimated coverage of 40 Mb of genome sequence, which accounts for
about 3.3% of the whole chicken genome (about 1.2×10⁹), assuming that the number of
detectable amplicons generated for each primer is about 6 on average, as indicated by the present
work. This means the chicken genome was scanned for candidate QTLs/markers at a ratio of one
examined base to 30 unexamined bases.
Bioinformatics analysis of these 7 line-specific fragments indicated that they are located
near immune response related-genes (Table 4.9). More importantly, several genes including

84
MHC class II (CD74), complement component (C1QTNF7), and T-cell receptor (LOC428464,
LOC428465) are known to play roles in antibody response (Malnati et al., 1992; Pieters, 2000;
Mukhopadhyay et al., 2004; Reid and Porter, 1981; Fearon and Carroll, 2000). This list of genes
provided a resource to identify causative genes that underlie antibody response. However, this
study did not identify an Igh gene that can influence anti-SRBC titers (Puel et al., 1996). This
failure to discover QTLs with major effect is probably because the number of primers used was
limited compared to the size of chicken genome. The number of QTLs identified by RAPD
technique should be increased with the amount of random primers used in the RAPD-based
genome scan.
Although a selective sweep could cause allele frequency differences at a QTL and its
neighboring marker loci, other factors, such as small population size and genetic drift, could also
contribute to it. To exclude this possibility from this study, the backcross population was used as
a segregating population to validate the 7 informative markers derived from the line-specific
fragments through linkage analysis. The principle behind this is that if a marker is truly linked to
a QTL, the association between the marker and the trait affected by the QTL will still exist in
linkage analysis. In contrast, if a marker is not linked to a QTL and the association between the
marker and the trait affected by the QTL is due to genetic drift, the association will disappear in
linkage analysis. Two statistical methods, the GLM procedure of SAS and case-control
association analysis, were employed, because the former is based on analysis of variance, while
the latter is based on the Chi square test. They may provide different statistical power in different
experimental designs. In this study, 5 of the informative markers were validated by at least one
of the two methods. VTC04 and VTC06 were validated by both of the methods. Moreover, it is
interesting to note that VTC01 and VTC03 were validated only in BC2 while VTC04 and VTC06

85
were only validated in BC1 by case-control association analysis. This phenomenon may be
because the genetic makeup of different populations may influence QTL expression and
detection power. This was supported by the observation that association tests were confounded
by population stratification (Risch and Merikangas, 1997). In addition, haplotypes constructed in
this study were used to test their associations with anti-SRBC titers in addition to single markers.
It has been shown that using haplotypes in association studies may improve statistical power
(Zhang et al., 2002).
The candidate markers identified in this study were all different from those previously
reported by other investigators (Yonash et al., 2001; Siwek et al., 2003; Zhou et al., 2003). One
interpretation for the uniqueness of our candidate markers is that the resource population used in
this study was different from those used in other studies. Studies of QTL identification in other
animal species indicated that the characteristics of resource population, such as breed and mating
scheme, could affect the power of QTL detection (Rupp & Boichard, 2003; Schulman et al.,
2004). Some QTLs can be detected easily in one population but not in another population.
Another interpretation is that the approach for QTL identification in this study was different from
those in other studies.
Different from previous studies using linkage analysis-based approaches, this study used
an approach that combined the advantages of LD-based analysis with RAPD technique.
Compared to linkage-based analysis, LD-based analysis was more efficient in QTL identification.
For example, LD-based analysis could identify QTLs with small effects, finely map a QTL, and
increase the power of QTL detection at a given sample size (Risch and Merikangas, 1996). This
is because LD-based analysis takes advantage of historical recombination in a population. In
contrast, linkage-based analysis can only identify QTLs with moderate to major effect, and its
86
mapping efficiency is readily affected by genetic and environmental noise (Andersson and
Georges, 2004). For example, Crawford et al. (2006) discovered only a single QTL associated
with nematode parasite resistance in sheep despite the moderate heritability of this trait and large
scale of this study. Apparently, most of the genes that control the trait have relatively small effect.
Moreover, Risch and Merikangas (1996) and Mathew (2001) found that results from linkage-
based analysis were difficult to replicate. In addition, linkage-based analysis is an insensitive
QTL mapping tool because it can only map a QTL to a large chromosomal region in which tens
of genes may reside (Darvasi et al., 1993). Therefore, this study may be more efficient with more
confidence in QTL identification than previous studies.

87
Table 4.1 Size and frequency distributions of selected RAPD fragments in the parental lines.
Primera Sequenceb Size (bp)c Frequencyd
H L
Hokie1 5'-TGCGCCCTTC-3' 800 0 76
Hokie2 5'-GATGACCGCC-3' 1200 96 0
Hokie3 5'-CTCACGTTGG-3' 500 0 87
Hokie4 5'-ACATCGCCCA-3' 560, 580 81, 0 0, 82
Hokie5 5'-CTGATACGCC-3' 1050 51 0
Hokie6 5'-CAGACAAGCC-3' 800 0 68
a The name of the random primer used.
b The sequence of the random primer used.
c The estimated size of the selected RAPD fragment.
d % of birds in the parental line with the selected RAPD fragment.

88
Table 4.2 Sequence characterized amplified region (SCAR) candidate DNA markers for anti-
SRBC response.
Markera/primerb Sizec (bp) Accession Numberd Chromosome:Coordinatese
VTC01/Hokie1 868 AY435424 Chr13:15,192,367-15,193,230
VTC02/Hokie2 1148 AY435425 Chr4:79,574,744-79,575,886f
VTC03/Hokie3 511 AY435426 Chr2:74,967,060-74,967,568
VTC04/Hokie4 600 AY435427 Chr2:50,346,631-50,347,236
VTC05/Hokie4 581 AY435428 Chr1:46,425,852-46,426,431
VTC06/Hokie4 489 AY435429 Chr8:19,189,926-19,190,404f
VTC07/Hokie4 528 AY435430 Chr1:131,019,193-131,019,716
a Locus identification for the SCAR marker that was developed from the line-specific RAPD
fragment.
b Sequence of the random primer used to develop the SCAR markers.
c The size of each SCAR marker in base pair (bp).
d GenBank accession number for the consensus DNA sequence of the SCAR marker.
e Chromosomal coordinates of the markers within the genomic DNA sequence
(http://genome.ucsc.edu/cgi-bin/hgGateway).
f VTC02 and VTC06 were also mapped by linkage analysis to MCW0098 and VTG2 with LOD
scores of 11.1 and 13.2, respectively, using the East Lansing reference panel (Cheng et al., 1995).

89
Table 4.3 Single nucleotide polymorphism (SNPs) within and around sequence characterized
amplified regions (SCARs) and the associations of the SNPs with anti-SRBC in the resource
populations.
SNP IDa Contextb Populationc Allelic frequencyd backcorss
H/n L/n χ2/p-value p-value/ne
VTC01u10S1 attgtttgg(C/T)gctgaagttga H and L
VTC01u10S2 taccagtcccta(A/G)tact H and L
VTC01S1 caatt(C/T)acctggaga H and L .013/40 .203/32 14.7/<.001 .098/61
VTC01S2 agacactc(C/T)tgactgtgtaccc H and L
VTC01S3 tctcttg(C/T)ccattt H and L
VTC01S4 ccatttgtagg(C/T)aaagctggaa H and L
VTC01S5 cccttaggaaac(C/G)acagtattt H and L
VTC01S6 gctcctttctc(G/T)gcaaca H and L
VTC01d5S1 tgtggaaaca(A/G)cacacagaa H and L
VTC01d5S2 aggggtgagg(C/T)tctgctgcc H and L
VTC02u10S1 ggctgagagctg(A/G)ttttct H and L .008/61
VTC02u10S2 ccc(A/G)taaccaaaactaaac H and L
VTC02u10S3 ggtggtttggc(A/G)tgatttata H and L .048/61
VTC02S1 tgtttct(C/T)cttgctg H and L/EL
VTC02S2 gacac(TG/CA)attttc H and L
VTC02S3 ctcctg(A/T)gggctg H and L
VTC02S5 cacaa(A/G)ccatg H and L .708/48 .000/48 105/<.001 .013/61
VTC02S6 aagtt(G/T)aaatac H and L
VTC02S7 tttaatga(A/C)ttcagaa H and L
VTC02S8 actta(G/T)tagtcaa H and L .014/61
VTC02S9 gcttg(A/G)ggctgt H and L
VTC02S10 gcaaa(C/T)cactttt H and L
VTC02S11 tcacc(A/G)gctttcc H and L
VTC02S12 tgttc(C/T)gtggct EL

90
Continued
SNP IDa Contextb Populationc Allelic frequencyd backcross
H/n L/n χ2/p-value p-value/ne
VTC02S13 tgcag(C/T)gaagct EL
VTC02d10S1 gaccaaata(C/T)gtaagttgta H and L
VTC03u10S1 ctgaattatca(A/G)cttaccat H and L
VTC03S1 tgctgt(A/G)tgtac H and L .990/48 .340/47 90.3/<.001
VTC03S2 aatagtg(A/T)aatcaga H and L
VTC03S3 atac(A/G)cagagatt EL
VTC03S4 gcatc(C/G)tgagctt EL
VTC03d5S1 tggtggtaa(C/G)atactcatca H and L
VTC04u10S1 aagcaccc(A/T)atcttagtct H and L
VTC04u10S2 gcttacaaga(A/G)aatattaa H and L .020/62
VTC04u10S3 tcttgctctt(C/T)aatgtataata H and L .002/62
VTC04u10S4 gtgtttcaata(A/T)aagaaatt H and L .002/62
VTC04u10S5 ctgcatattc(A/T)aatctgac H and L
VTC04S1 ttgta(C/T)cttatt H and L .000/48 .833/45 134/<.001
VTC04S2 tgaggg(A/G)catgatg H and L
VTC04d10S1f catcttcatg(C/T)caaagacctgc H and L .041/62
VTC05u5S1/S2 ttattaaaaaaaa(A/T)a(A/T)a H and L
VTC05S1 gagactt(CT/GC)acttcaa H and L .777/47 1.00/48 24.1/<.001 .067/58
VTC05d10S1 aaaggagattct(C/T)ttagctg H and L
VTC06u10S1 cttggc(A/G)aa(A/G)aaacaa H and L .083/49
VTC06u10S2 gaaccatc(C/T)ttacactactcaa H and L
VTC06S1 aca(A/G)acacagctt H and L
VTC06S2 aactgga(C/T)gtaaaaaac H and L .750/48 .533/46 9.68/<.025 .060/49
VTC06S3 aaaa(C/T)cttgagtatctcc EL
VTC06d5S1 aaaggaaatatc(A/T)tttctttt H and L .005/61
VTC06d5S2 aatgactcct(G/T)agttaagatt H and L .005/61
VTC07S1 agagtatccat(C/T)aagagctg H and L 1.00/48 .787/47 22.8/<.001

91
a SNP name was based on the following rule: the first five letters/digits are used for the identity
of each SCAR marker described in this study, the six letter and the following digit(s) mean SNPs
were identified in the flanking sequences that are 5 or 10kb up (u)- or down (d)- stream of the
markers, and the letter ‘s’ and the following digit(s) represent SNP name. b Sequence context in which SNP was detected. Each SNP is highlighted by upper case letters. c Populations in which SNPs were detected. H and L represented the lines divergently selected
for high and low anti-SRBC, respectively (see Chapter 3); EL represents East Lansing genetic
mapping reference panel. d The frequency is that of the allele in bold for each SCAR with significance between the selected
lines, H and L, indicated by Chi-square test statistic and p-value, correspondingly. n, the number
of birds genotyped for the SNP tested. e p-values indicate the statistical significance of association of each SCAR with anti-SRBC titers
in backcross population (see Chapter 3); only the SNPs with p-value of less than 0.10 are listed.
n, the number of birds used in the analysis. f An insertion/deletion polymorphism, which was assigned as VTC04d10P1, was detected nearby
the SNP.

92
Table 4.4 Differences in anti-SRBC titers between genotypes of selected SNPs for each
candidate marker in the backcross population
SNP IDa Genotype(nb) Mean±SDc F-value/p-value
VTC01S1 CC(0) - 0.89/0.3484 CT(20) 8.94±3 TT(41) 8±3.54
VTC02S5 AA(6) 12.5±2.35 12.90/<0.0001
AG(19) 9.47±3.13 GG(36) 6.78±2.82
VTC03S1 AA(16) 11±3.1 11.41/<0.0001 AG(32) 7.75±2.94 GG(14) 6.07±2.67
VTC04S1 CC(21) 5.9±1.87 15.77/<0.0001 CT(24) 8.25±3.31 TT(17) 11±2.89
VTC05S1 CC(51) 7.8±3.31 11.41/0.0013 CG(7) 12.1±1.86 GG(0) -
VTC06S2 CC(17) 8.82±3.59 1.09/0.3459 CT(28) 7.61±3.4 TT(4) 6.5±1.0
VTC07S1 CC(40) 9.13±3.35 5.47/0.0067 CT(17) 6.47±2.87 TT(3) 5.33±.577
a SNP identities are as in Table 4.3. b The number of birds with the genotype indicated before it. c The mean and standard deviation of anti-SRBC titers for each genotype.

93
Table 4.5 Genotypes of the candidate markers in the East Lansing reference mapping panel East Lansing mapping panel VTC02 VTC03 VTC06
Bird ID# Bird Type SNP1 SNP1 SNP2 SNP3 SNP1 10394 sire T A/T A/G C/G T 24000 sire C/T A/T A/G C/G C/T 31821 dam C A A C C 31824 dam C A A C C 31830 dam C A A C C 31838 dam C A A C C 521A1 progeny C/T A A C C/T 520B1 progeny C/T A A C C/T 526C1 progeny C A/T A/G C/G C/T 520D1 progeny C A A C C 520E1 progeny C A/T A/G C/G C/T 520F1 progeny C A A C C/T 524A1 progeny C A/T A/G C/G C/T 521B1 progeny C/T A A C C/T 524C1 progeny C/T A/T A/G C/G C 521D1 progeny C A A C C 524B1 progeny C/T A A C C/T 521F1 progeny C/T A A C C 526B1 progeny C A A C C 520C1 progeny C/T A A C C/T 524D1 progeny C/T A/T A/G C/G C 520J1 progeny C A A C C 520K1 progeny C/T A/T A/G C/G C 520R1 progeny C A/T A/G C/G C 520H1 progeny C/T A/T A/G C/G C/T 520I1 progeny C A A C C/T 520P1 progeny C A A C C 520W1 progeny C A A C C 520X1 progeny C A A C C 521C1 progeny C A A C C/T 521E1 progeny C/T A A C C/T 520T1 progeny C A/T A/G C/G C/T 520S1 progeny C A/T A/G C/G C 521W1 progeny C/T A A C . 520G1 progeny C A A C C 521K1 progeny C/T A A C C 521L1 progeny C A/T A/G C/G C/T 521M1 progeny C A A C C/T 521N1 progeny C A/T A/G C/G C/T 520U1 progeny C/T A/T A/G C/G C 521I1 progeny C/T A/T A/G C/G C 521T1 progeny C/T A/T A/G C/G C 521P1 progeny C A/T A/G C/G C 521G1 progeny C A/T A/G C/G C 521U1 progeny C A A C C/T 521V1 progeny C/T A/T A/G C/G C/T 521Q1 progeny C A/T A/G C/G C 521R1 progeny C/T A A C C/T 521H1 progeny C A/T A/G C/G C 520V1 progeny C A/T A/G C/G C/T 526D1 progeny C A A C C 520L1 progeny C A A C C 520M1 progeny C/T A/T A/G C/G C 526A1 progeny C/T A/T A/G C/G C 521J1 progeny C/T A/T A/G C/G C 520N1 progeny C/T A A C C 521S1 progeny C A A C C 520A1 progeny C/T A A C C/T
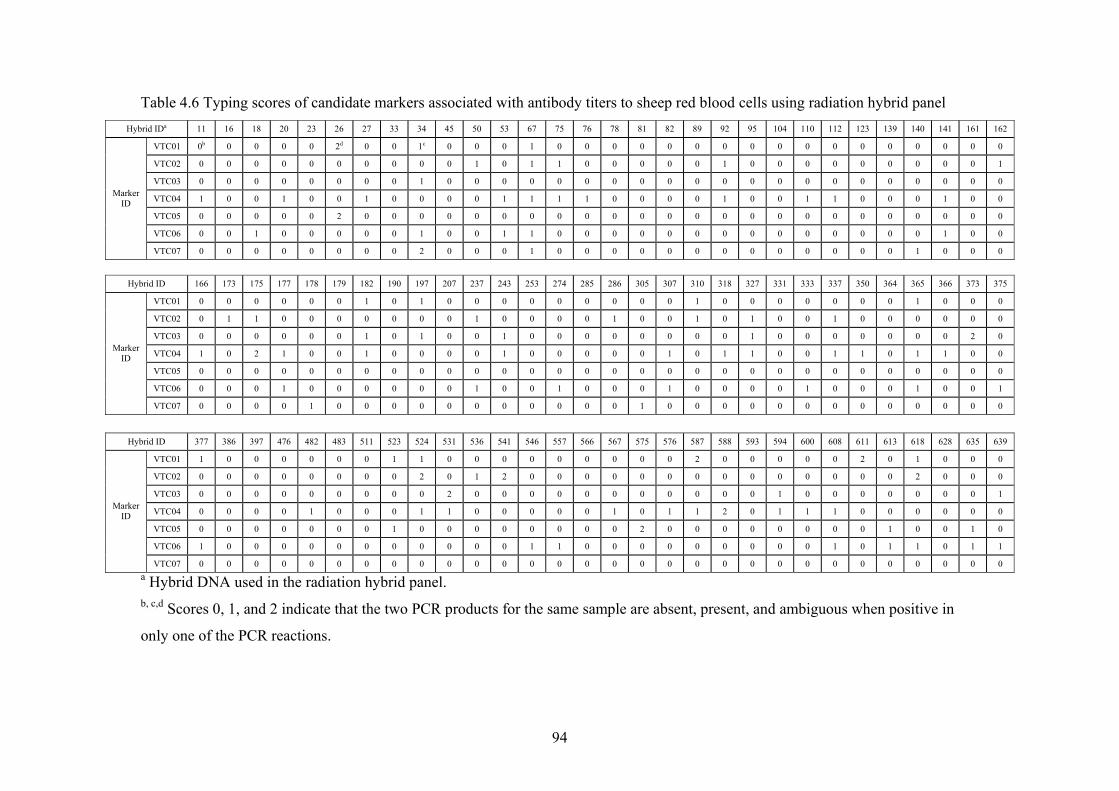
94
Table 4.6 Typing scores of candidate markers associated with antibody titers to sheep red blood cells using radiation hybrid panel Hybrid IDa 11 16 18 20 23 26 27 33 34 45 50 53 67 75 76 78 81 82 89 92 95 104 110 112 123 139 140 141 161 162
VTC01 0b 0 0 0 0 2d 0 0 1c 0 0 0 1 0 0 0 0 0 0 0 0 0 0 0 0 0 0 0 0 0
VTC02 0 0 0 0 0 0 0 0 0 0 1 0 1 1 0 0 0 0 0 1 0 0 0 0 0 0 0 0 0 1
VTC03 0 0 0 0 0 0 0 0 1 0 0 0 0 0 0 0 0 0 0 0 0 0 0 0 0 0 0 0 0 0
VTC04 1 0 0 1 0 0 1 0 0 0 0 1 1 1 1 0 0 0 0 1 0 0 1 1 0 0 0 1 0 0
VTC05 0 0 0 0 0 2 0 0 0 0 0 0 0 0 0 0 0 0 0 0 0 0 0 0 0 0 0 0 0 0
VTC06 0 0 1 0 0 0 0 0 1 0 0 1 1 0 0 0 0 0 0 0 0 0 0 0 0 0 0 1 0 0
Marker ID
VTC07 0 0 0 0 0 0 0 0 2 0 0 0 1 0 0 0 0 0 0 0 0 0 0 0 0 0 1 0 0 0
Hybrid ID 166 173 175 177 178 179 182 190 197 207 237 243 253 274 285 286 305 307 310 318 327 331 333 337 350 364 365 366 373 375
VTC01 0 0 0 0 0 0 1 0 1 0 0 0 0 0 0 0 0 0 1 0 0 0 0 0 0 0 1 0 0 0
VTC02 0 1 1 0 0 0 0 0 0 0 1 0 0 0 0 1 0 0 1 0 1 0 0 1 0 0 0 0 0 0
VTC03 0 0 0 0 0 0 1 0 1 0 0 1 0 0 0 0 0 0 0 0 1 0 0 0 0 0 0 0 2 0
VTC04 1 0 2 1 0 0 1 0 0 0 0 1 0 0 0 0 0 1 0 1 1 0 0 1 1 0 1 1 0 0
VTC05 0 0 0 0 0 0 0 0 0 0 0 0 0 0 0 0 0 0 0 0 0 0 0 0 0 0 0 0 0 0
VTC06 0 0 0 1 0 0 0 0 0 0 1 0 0 1 0 0 0 1 0 0 0 0 1 0 0 0 1 0 0 1
Marker ID
VTC07 0 0 0 0 1 0 0 0 0 0 0 0 0 0 0 0 1 0 0 0 0 0 0 0 0 0 0 0 0 0
Hybrid ID 377 386 397 476 482 483 511 523 524 531 536 541 546 557 566 567 575 576 587 588 593 594 600 608 611 613 618 628 635 639
VTC01 1 0 0 0 0 0 0 1 1 0 0 0 0 0 0 0 0 0 2 0 0 0 0 0 2 0 1 0 0 0
VTC02 0 0 0 0 0 0 0 0 2 0 1 2 0 0 0 0 0 0 0 0 0 0 0 0 0 0 2 0 0 0
VTC03 0 0 0 0 0 0 0 0 0 2 0 0 0 0 0 0 0 0 0 0 0 1 0 0 0 0 0 0 0 1
VTC04 0 0 0 0 1 0 0 0 1 1 0 0 0 0 0 1 0 1 1 2 0 1 1 1 0 0 0 0 0 0
VTC05 0 0 0 0 0 0 0 1 0 0 0 0 0 0 0 0 2 0 0 0 0 0 0 0 0 1 0 0 1 0
VTC06 1 0 0 0 0 0 0 0 0 0 0 0 1 1 0 0 0 0 0 0 0 0 0 1 0 1 1 0 1 1
Marker ID
VTC07 0 0 0 0 0 0 0 0 0 0 0 0 0 0 0 0 0 0 0 0 0 0 0 0 0 0 0 0 0 0 a Hybrid DNA used in the radiation hybrid panel. b, c,d Scores 0, 1, and 2 indicate that the two PCR products for the same sample are absent, present, and ambiguous when positive in
only one of the PCR reactions.

95
Table 4.7 Pairwise linkage disequilibrium (LD) analysis in backcross population Locus1 Locus2 D' LOD Distance (bp)a VTC01u10S2 VTC01u10S1 1.0 0.93 190 VTC01u10S2 VTC01S2 1.0 0.86 11885 VTC01u10S2 VTC01S1 1.0 12.05 11979 VTC01u10S2 VTC01d5S1 1.0 14.56 16711 VTC01u10S2 VTC01d5S2 1.0 4.63 16735 VTC01u10S1 VTC01S2 0.938 12.62 11695 VTC01u10S1 VTC01S1 1.0 0.82 11789 VTC01u10S1 VTC01d5S1 1.0 0.89 16521 VTC01u10S1 VTC01d5S2 1.0 7.98 16545 VTC01S2 VTC01S1 1.0 0.74 94 VTC01S2 VTC01d5S1 1.0 0.82 4826 VTC01S2 VTC01d5S2 0.908 4.85 4850 VTC01S1 VTC01d5S1 1.0 12.96 4732 VTC01S1 VTC01d5S2 1.0 5.04 4756 VTC01d5S1 VTC01d5S2 1.0 4.63 24 VTC02u10S1 VTC02u10S3 1.0 2.81 244 VTC02u10S1 VTC02S5 0.885 9.28 11208 VTC02u10S1 VTC02S8 0.902 12.91 11653 VTC02u10S1 VTC02d10S1 0.911 15.37 22469 VTC02u10S3 VTC02S5 1.0 2.15 10964 VTC02u10S3 VTC02S8 1.0 3.14 11409 VTC02u10S3 VTC02d10S1 1.0 2.9 22225 VTC02S5 VTC02S8 1.0 18.65 445 VTC02S5 VTC02d10S1 1.0 17.19 11261 VTC02S8 VTC02d10S1 1.0 22.36 10816 VTC03u10S1 VTC03S1 1.0 27.03 10901 VTC03u10S1 VTC03d5S1 1.0 24.78 17082 VTC03S1 VTC03d5S1 1.0 24.78 6181 VTC04u10S5 VTC04u10S4 1.0 0.88 37 VTC04u10S5 VTC04u10S3 1.0 0.88 175 VTC04u10S5 VTC04u10S2 1.0 2.41 207 VTC04u10S5 VTC04u10S1 1.0 3.99 264 VTC04u10S5 VTC04S2 1.0 3.8 10995 VTC04u10S5 VTC04S1 1.0 4.01 11114 VTC04u10S4 VTC04u10S3 1.0 13.42 138 VTC04u10S4 VTC04u10S2 1.0 1.51 170 VTC04u10S4 VTC04u10S1 1.0 1.68 227 VTC04u10S4 VTC04S2 1.0 1.79 10958 VTC04u10S4 VTC04S1 1.0 1.88 11077 VTC04u10S3 VTC04u10S2 1.0 1.51 32 VTC04u10S3 VTC04u10S1 1.0 1.68 89 VTC04u10S3 VTC04S2 1.0 1.79 10820 VTC04u10S3 VTC04S1 1.0 1.88 10939 VTC04u10S2 VTC04u10S1 1.0 17.26 57 VTC04u10S2 VTC04S2 0.911 13.4 10788 VTC04u10S2 VTC04S1 0.872 12.62 10907

96
Continued VTC04u10S1 VTC04S2 0.966 23.44 10731 VTC04u10S1 VTC04S1 0.965 22.62 10850 VTC04S2 VTC04S1 1.0 29.13 119 VTC05u5S1 VTC05S1 1.0 2.74 5406 VTC05u5S1 VTC05d10S1 0.955 15.79 15151 VTC05S1 VTC05d10S1 1.0 3.27 9745 VTC06u10S2 VTC06u10S1 1.0 19.96 60 VTC06u10S2 VTC06S2 0.877 3.06 11428 VTC06u10S2 VTC06d5S1 0.861 2.61 16808 VTC06u10S2 VTC06d5S2 0.853 2.42 17000 VTC06u10S1 VTC06S2 1.0 4.22 11368 VTC06u10S1 VTC06d5S1 1.0 3.75 16748 VTC06u10S1 VTC06d5S2 1.0 3.56 16940 VTC06S2 VTC06d5S1 1.0 2.43 5380 VTC06S2 VTC06d5S2 1.0 2.08 5572 VTC06d5S1 VTC06d5S2 1.0 20.66 192 a the distance in base pair is between two SNPs.

97
Table 4.8 Case-control-based association analyses of each SNP and haplotype with anti-SRBC titers in the backcross population. Association testsa permutation testsb Name Alellec/Hapl.(Freq.)d Case, Control Ratios Chi square p-value Chi Square p-value (BC2) VTC01u10S2 A 26:0, 28:6 5.098 0.024 5.098 0.0760 VTC01S1 T 26:0, 27:7 6.06 0.0138 6.06 0.0220 VTC01d5S1 A 26:0, 26:6 5.438 0.0197 5.438 0.0330 (BC2) VTC02d10S1 T 26:0, 31:5 3.928 0.0475 3.928 0.0730 (BC2) VTC03u10S1 A 21:5, 20:14 3.279 0.0702 3.279 0.0520 VTC03S1 G 21:5, 20:14 3.279 0.0702 3.279 0.0520 VTC03d5S1 G 21:5, 19:15 4.106 0.0427 4.106 0.0310 VTC03Block 1 AGG(0.667) 21.0 : 5.0, 19.0 : 15.0 4.106 0.0427 4.106 0.0310 VTC03Block 1 GAC(0.317) 5.0 : 21.0, 14.0 : 20.0 3.279 0.0702 3.279 0.0520 (BC1) VTC04u10S4 A 43:1, 14:4 6.857 0.0088 6.857 0.0300 VTC04u10S3 T 43:1, 14:4 6.857 0.0088 6.857 0.0300 VTC04u10S2 G 34:10, 7:11 8.403 0.0037 8.403 0.0070 VTC04Block1 GTG(0.661) 34.0 : 10.0, 7.0 : 11.0 8.403 0.0037 8.403 0.0070 VTC04Block1 ATG(0.081) 1.0 : 43.0, 4.0 : 14.0 6.857 0.0088 6.857 0.0300 (BC1) VTC06d5S1 A 27:17, 5:13 5.77 0.0163 5.77 0.0150 VTC06d5S2 T 26:16, 5:13 5.876 0.0153 5.876 0.0150 VTC06Block1 AT(0.516) 27.0 : 17.0, 5.0 : 13.0 5.77 0.0163 5.77 0.0150 VTC06Block1 TG(0.484) 17.0 : 27.0, 13.0 : 5.0 5.77 0.0163 5.77 0.0150 a The case-control association analyses of each SNP and haplotype with anti-SRBC titers were done in two types of backcross
populations, BC1 and BC2, which were generated by backcrossing F1 to the high and low anti-SRBC lines, respectively. Anti-SRBC
titers were dummied into two values, ‘1’ for ‘Control’ and ‘2’ for ‘Case’. Individuals with anti-SRBC titers >9 in BC1 or <6 in BC2

98
were labeled as ‘Case’, while the rest were labeled as ‘Control’. A total of 64 individuals from 26 families in the backcross were used.
Significance of association was estimated by Chi-square test. b Permutation test also was performed in order to obtain a measure of significance corrected for multiple testing bias. In the present
experiment, the number of permutation was 1000. c The allele for each SNP used for association study. d Haplotype (Hapl.) was constructed using Haplotype3.32 (http://www.broad.mit.edu/mpg/haploview/). The haplotypes for each
marker were visualized in Figure 4.7. The frequency (freq.) of each haplotype also was calculated and indicated.
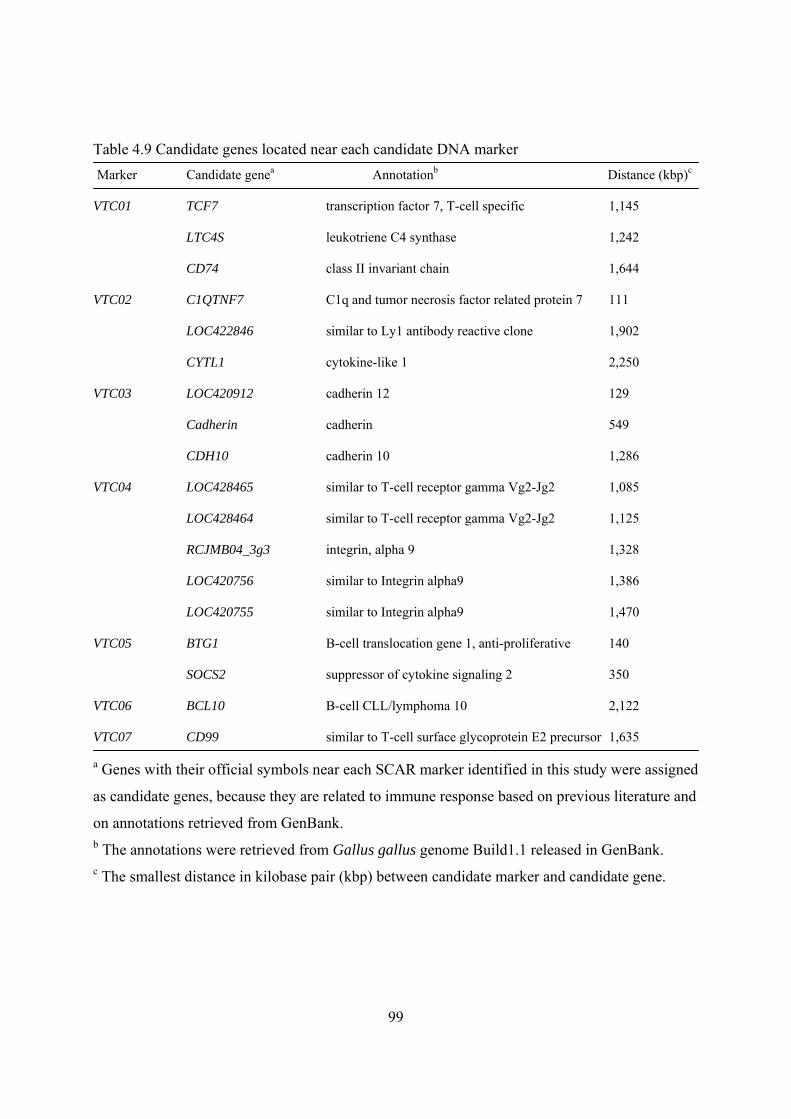
99
Table 4.9 Candidate genes located near each candidate DNA marker Marker Candidate genea Annotationb Distance (kbp)c
VTC01 TCF7 transcription factor 7, T-cell specific 1,145
LTC4S leukotriene C4 synthase 1,242
CD74 class II invariant chain 1,644
VTC02 C1QTNF7 C1q and tumor necrosis factor related protein 7 111
LOC422846 similar to Ly1 antibody reactive clone 1,902
CYTL1 cytokine-like 1 2,250
VTC03 LOC420912 cadherin 12 129
Cadherin cadherin 549
CDH10 cadherin 10 1,286
VTC04 LOC428465 similar to T-cell receptor gamma Vg2-Jg2 1,085
LOC428464 similar to T-cell receptor gamma Vg2-Jg2 1,125
RCJMB04_3g3 integrin, alpha 9 1,328
LOC420756 similar to Integrin alpha9 1,386
LOC420755 similar to Integrin alpha9 1,470
VTC05 BTG1 B-cell translocation gene 1, anti-proliferative 140
SOCS2 suppressor of cytokine signaling 2 350
VTC06 BCL10 B-cell CLL/lymphoma 10 2,122
VTC07 CD99 similar to T-cell surface glycoprotein E2 precursor 1,635
a Genes with their official symbols near each SCAR marker identified in this study were assigned
as candidate genes, because they are related to immune response based on previous literature and
on annotations retrieved from GenBank. b The annotations were retrieved from Gallus gallus genome Build1.1 released in GenBank. c The smallest distance in kilobase pair (kbp) between candidate marker and candidate gene.

100
A)
2 H individuals Pooled H (from 20 individuals) 48 H individuals 555 random primers informative primers
2 L individuals Pooled L (from 20 individuals) 48 L individuals
B) Line-specific RAPD fragments Physical mapping (RH and sequence alignment) Cloned in TA cloning vector Designing new primers Sequencing SCAR markers Searching for immune response related genes at or near (<2.5 Mb) the SCAR markers C) Re-sequencing SCARs and 1 kb of flanking sequences SNP detection using EL 5 or 10 kb up- and down-stream of each SCAR mapping reference panel SNP detection using the resource population Genetic mapping by that consists of H and L lines and backcross (BC) linkage analysis
Difference of allele frequency between H and L Association analysis in BC Chi-square test (n=48/line) GLM and Haploview (n=64)
Figure 4.1 Summary of procedures in the study of RAPD- and SCAR-based QTL analysis for
anti-SRBC response. A) Screening for random primers that amplify line-specific RAPD
fragments. B) Converting RAPD fragments into sequence characterized amplified region (SCAR)
markers. C) SNP analysis.

101
(A) (B) M CTL L L H H L L L M L L H H H M H H ladder 1500bp 800bp 600bp 500bp 400bp Figure 4.2 Line-specific RAPD fragment detected within (A) DNA pools and (B) individual
samples from chickens with low (L) and high (H) antibody response using random primer
Hokie3. The control (CTL) DNA sample was made by mixing equal amounts of DNA from the
two DNA pools. M: DNA ladder.

102
(A)
(B)
Figure 4.3 A CONSED-generated trace (A) and alignment (B) showing a single nucleotide
polymorphism (A/G) at position 205 (vertical white lines in trace A) detected in a candidate
DNA marker, VTC02, in the parental lines. The sample IDs are shown on the right of panel B,
with the first letter ‘a’ to ‘d’ for H line and ‘e’ to ‘h’ for L line.

103
Figure 4.4 Genotype frequencies of the representative SNP at VTC02 varying with different
phenotypes - high (H) and low (L) antibody titers.

104
Figure 4.5 The chromosomal location of marker VTC02 (or VPI0004). This marker was mapped between MCW0098 and UMA4.034,
with LOD scores of 11.1 and 7.3, respectively.

105
Figure 4.6 The chromosomal location of marker VTC06 (or VPI0005). This marker was mapped between VTG2 and MCW0160, with
LOD scores of 13.2 and 10.3, respectively.
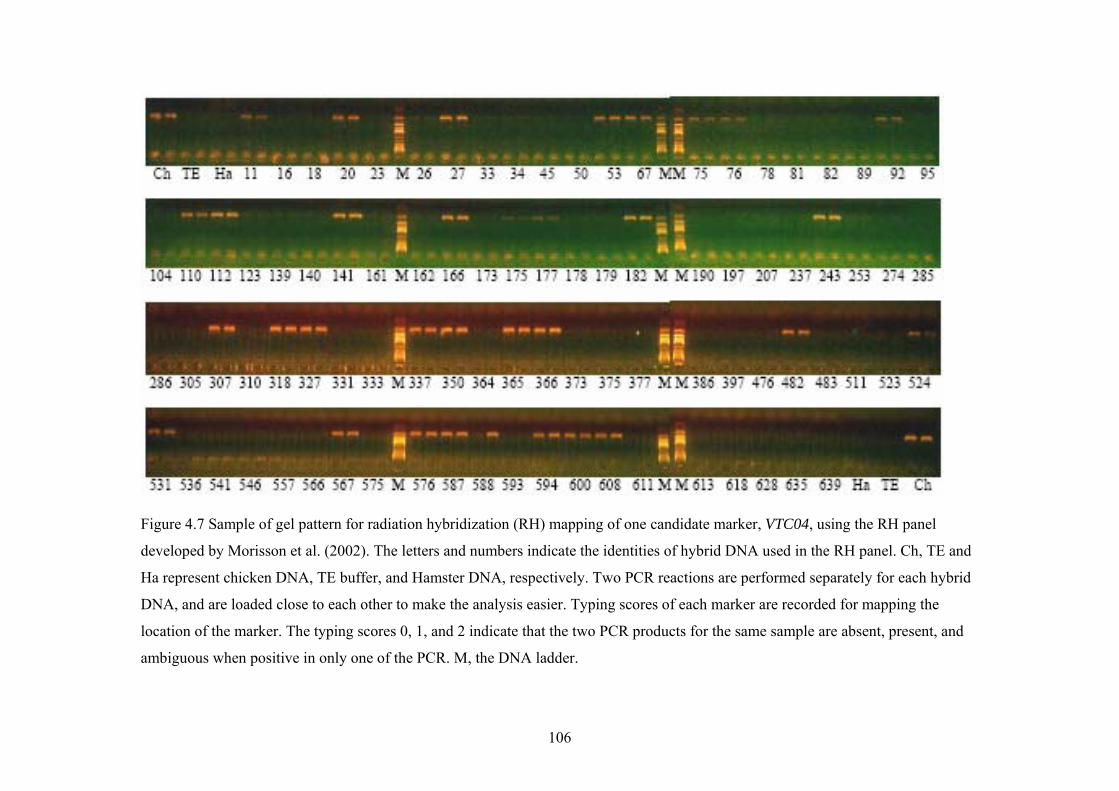
106
Figure 4.7 Sample of gel pattern for radiation hybridization (RH) mapping of one candidate marker, VTC04, using the RH panel
developed by Morisson et al. (2002). The letters and numbers indicate the identities of hybrid DNA used in the RH panel. Ch, TE and
Ha represent chicken DNA, TE buffer, and Hamster DNA, respectively. Two PCR reactions are performed separately for each hybrid
DNA, and are loaded close to each other to make the analysis easier. Typing scores of each marker are recorded for mapping the
location of the marker. The typing scores 0, 1, and 2 indicate that the two PCR products for the same sample are absent, present, and
ambiguous when positive in only one of the PCR. M, the DNA ladder.

107
(A) (B)
(C) (D)
(E) (F)
Figure 4.8 Pairwise linkage disequilibria (LDs) between SNPs within each candidate marker and
flanking sequences are plotted by Haploview3.32 (http://www.broad.mit.edu/mpg/haploview/)
and shown in panels A to F for VTC01 to VTC06, respectively. The haplotype block(s) for each

108
marker constructed by Haploview3.32 using genotype and pedigree information from the
backcross population are also shown beside the LD plots. In each LD plot, the white bar
represents one of the chicken chromosomes, marked by the SNPs within the candidate marker
and flanking sequences based on their locations on v2.1 draft assembly of chicken genome,
which were determined by using genome browser tool-BLAT (http://genome.ucsc.edu/cgi-
bin/hgBlat?command=start). The color scheme for the LD plot is as follows: blue for D’=1 with
LOD<2, bright red for D’=1 with LOD ≥2, and shades of red for D’<1 with LOD ≥2. The
number on the shades of red indicates the D’ value for the pairwise LD between the SNPs. Each
haplotype is composed by one allele of the SNPs contained in the block, with its frequency
beside.

109
Figure 4.9 An example of a permutation test on the case-control association analysis of each
marker and haplotype with anti-SRBC titers. In this example, a permutation Chi-square was
estimated for VTC03, which is compared with the observed Chi-square to determine the p-values
for the marker.

110
CHAPTER 5
RFLP-based analysis of candidate markers for antibody production in different
populations
5.1 Abstract
The genetic improvement of livestock and poultry for natural disease resistance is an
important goal in animal production. Obviously, at least two benefits can be gained from raising
animals with strong natural disease resistance. The first is the direct improvement of animal
health, while the second involves the indirect improvement of human health through minimizing
the use of antibiotics in animal production. Often, however, disease resistance is a function of
many genes that contribute to general or specific immune response to pathogens. Therefore,
identification of quantitative trait loci associated with immune response can facilitate the
accomplishment of this goal. Previously, I identified seven marker loci putatively associated with
anti-SRBC response in chickens. Here, I describe a PCR-RFLP method for genotyping chickens
for SNPs shown to segregate with anti-SRBC titers. Thirty birds from each of seven random-
bred populations, including 3 non-commercial strains and 4 commercial lines of chickens, were
genotyped for a selected SNP at 6 loci. The allele frequency distributions of the 6 SNPs in the
the populations that were not directly selected for anti-SRBC provide additional support that the
association of candidate SNPs with anti-SRBC shown in previous study (Chapter 4) may not be
due to the effect of genetic drift. This study provides practical methods for future utilization of
these loci to evaluate birds for immune response.
Key words: Antibody response, PCR-RFLP, SNPs, Gallus gallus

111
5.2 Introduction
Genetic markers have applications in evaluation of genetic diversity, QTL mapping,
marker-assisted selection, phylogenetics and other marker-based genomic studies. One factor
that affects their applications is the cost and time taken in genotyping genetic markers. A variety
of methods have been developed for genotyping SNP markers, including sequencing, single-
stranded conformational polymorphism, pyrosequencing, melting temperature statistics
(denaturing-HPLC), in silico EST data mining, microarray-based genotyping, and PCR-RFLP.
PCR-RFLP is one of the cost-effective and time-effective methods for SNP genotyping.
Another factor that affects the utility of a genetic marker is the universality of the genetic
marker among different populations. Chicken breeds were developed for different purposes and
were subject to both natural and artificial selection. They generally have large phenotypic and
genetic differentiation among them. The universality of a genetic marker could be affected by the
differential selection. The universality could be evaluated by determining the allele distributions
of genetic markers in the populations.
I previously identified seven markers associated with anti-SRBC response in the White
Leghorn chickens divergently selected for high or low anti-SRBC titers. These genetic markers
may be used for improving natural disease resistance because evidence indicated that antibody
production was associated with disease resistance of vertebrates (Gross et al., 1980, 2002). Here,
a PCR-RFLP method for genotyping a selected SNP at each locus was developed. The
universality of each candidate genetic marker was evaluated in 7 random-bred populations,
including 4 commercial strains and 3 traditional breeds, using the PCR-RFLP method. The PCR-
RFLP method developed here allows relatively rapid and less costly genotyping of chickens for
the variant nucleotides.

112
5.3 Materials and Methods
5.3.1 Animals and genomic DNA
Four commercial lines and 3 traditional breeds of chicken were used in this experiment.
The commercial strains are ISA-A, ISA-C, ISA-D and Cobb500, while the traditional breeds
include Rhode Island Red (RIR), White Plymouth Rock (WPR) and Araucona. All populations
except Cobb500 have previously been described (Smith et al., 2002). Cobb500 is a commercial
broiler line from Tyson Foods Company. Genomic DNA from 30 individual birds of each
population, isolated from red blood cells by the protocol previously described (Smith et al.,
1996), was used in the PCR-RFLP analysis at each marker locus.
5.3.2 Candidate markers associated with anti-SRBC titers
The six candidate markers associated with anti-SRBC titers were previously identified in
the lines divergently selected for high or low anti-SRBC titers (See Chapter 3 and Chapter 4).
Each of them was derived from a unique RAPD fragment that was subsequently sequenced by a
standard method. Each sequence was submitted to GenBank and has been assigned Accession
Numbers (Table 5.1). The chromosomal location of each sequence was determined using BLAT
(http://genome.ucsc.edu/cgi-bin/hgBlat) to search the recently-released chicken DNA sequence
(Table 5.1).
Primers were designed from each of the marker sequences using the Primer 3 software
(Rozen and Skaletsky, 2000). The sequences of the primers for each locus, presented in Table
5.1, were used to produce an amplicon of 200 to 600 bp. PCR was performed in a total of 25 µl
using 50 ng of genomic DNA, 1× standard PCR buffer containing 2 mM MgCl2 (pH 8.7), 200
µM each dNTP, 50 ng of each primer and 2.5 U of Taq DNA polymerase (Fisher Scientific, Inc.

113
MO). Amplification was carried out in a Mastercycler (Brinkmann, Westbury, NY) under the
following cycling conditions: 95°C for 5 min for initial denaturation; 38 cycles of 95°C for 45
sec, annealing temperature that ranged from 60°C~64°C for 45 sec, and 72°C for 45 sec; and a
final extension at 72°C for 7 min.
5.3.3 Restriction fragment length polymorphism
Single nucleotide polymorphisms within each marker were previously identified in the
resource population (See Chapter 4). Only those located within each amplicon mentioned above
were used to scan for the presence of a naturally-occuring restriction site using the web-based
program Cutter (http://www.justbio.com). For each locus, 10 µL of PCR product was digested in
a final volume of 15 µL with 10 U of the restriction enzyme and incubated at 37ºC for 4 hours.
The digested PCR product was separated by regular electrophoresis with a 2% agarose gel
containing SYBR green dye (Molecular Probes, Inc.). Based on the digestion pattern (Figure 5.1),
the genotype of individual birds were determined and recorded. Allele frequencies in each
population of chicken then were calculated.
5.4 Results and Discussion
Presented in Figure 5.1 is an example of the restriction patterns observed from the PCR-
RFLP analysis at each locus. Allele frequencies of each candidate marker are shown in Table 5.1.
The estimates of variation in the 7 populations were similar to those previously reported (Smith
et al., 2000) using re-sequencing data and SNP analysis of ESTs from different loci. On average,
2.7 of the 6 markers were not or were minimally polymorphic for each population and 2.3 of 7
populations were not or were minimally heterozygous for each marker. The degree of
polymorphism of the markers in these populations ranked from low to high is as follows: VTC06,

114
VTC01, VTC04, VTC07, and (VTC02, VTC03). The degree of heterozygosity of the populations
is arranged from low to high as follows: White Plymouth Rock, (ISA-A, ISA-D and Cobb500),
Rhode Island Red (RIR), ISA-C, and Araucona (data not shown).
The loss of polymorphism or heterozygosity at the candidate marker loci in these
populations might reflect a breeding history in which antibody production was selected upon as a
correlated response to selection for other traits. This inference is supported by the observations
that selection on anti-SRBC titers was correlated with selection on production traits and disease
resistance in the chicken (Pinard-van der Laan et al., 1998; Lamont et al., 2003; Kean et al.,
1994). Because the utility of a marker is dependent on its polymorphism in a population, the data
for the candidate markers suggested that the markers could prove useful in marker-assisted
selection for antibody response in only some populations provided associations of the markers
with antibody response are confirmed. In other words, the evaluation on the universality of the
candidate markers in this study provides information useful for possible future use. In addition,
because PCR-RFLP represents a rapid and cost-effective tools for genotyping a population, the
established PCR-RFLP methods for the candidate markers would increase the utility of the
markers in a marker-assisted breeding program for immune response.

115
Table 5.1 Characteristics and population frequency distribution of variant nucleotides in six chicken DNA sequences.
Allele Frequency5 Sequence ID
Accession Number/ size1
Chromosomal location 2 Primers Restriction
Endonuclease3 SNP(RFL)4 A C D Cobb RIR WPR Arau
VTC01 AY435424/ 207
Chromosome 13: 15192367-15193230
F:aaccccagcttgaaaacaga R:gccagctgtctgcttaacac HphI A,G
(41,166) 0.02 0.32 0.05 0.68 0.00 0.02 0.70
VTC02 AY435425/ 576
Chromosome 4: 79574744-79575886
F:ttggaaagcttggcactttt R:ctgctcgtgcaatcagaaga EcoRI A,C
(166,415) 0.27 0.25 0.65 0.23 0.35 0.00 0.27
VTC03 AY435426/ 258
Chromosome 2: 74967060-74967568
F:ctgcagtgcaaaaggttcac R:aattggagcgagacagatgg Hpy8I A,G
(66,177) 0.37 1.00 0.57 0.38 0.55 0.46 0.70
VTC04 AY435427/ 265
Chromosome 2: 50346631-50347236
F:aaggctgtaaggctgtaacaca R:gaatcttgagaggttcacacagg Csp6I C,T
(41,187) 0.77 0.32 0.00 0.02 0.10 0.00 0.30
VTC06 AY435429/ 358
Chromosome 8: 19189926-19190404
F:aggagacctgtgcagaatgg R:atgttctttcatgcatcccc BmfI C,T
(82,276) 0.02 0.10 0.00 0.02 0.02 0.04 0.32
VTC07 AY435430/ 389
Chromosome 1: 131019193-131019716
F:ccaaactacccaaaagaggg R:agagagcaggtgtgagaagc Hpy188III C,T
(30,124) 1.00 0.73 0.37 0.00 0.08 0.37 0.57
1 Genbank accession number and size in base pairs of the DNA sequence. 2 BLAT- based chromosomal assignment of the DNA sequence. 3 Restriction endonuclease used for digestion of the DNA sequence. The recognition sequence of each of these enzymes was natural at
the SNP location. 4 The alleles of the SNP at the restriction enzyme site, RFL refers to the size, in base pairs, of the fragments produced from the
restriction digestion. 5 Frequency of the italicized SNP allele in the seven populations which include 30 individual birds for each. A, C, D, Cobb, RIR,
WPR and Arau represent commercial lines (ISA A,C and D) from Merial Ltd. Company, commercial line Cobb500 from Tyson Foods
company, Rhode Island Red chicken, White Plymouth Rock and Araucona, respectively.

116
VTC07 VTC06 VTC04 VTC03 VTC02 VTC01 M 1 2 3 C 2 3 C M 1 2 3 C 1 C 3 2 M 1 2 3 C 1 2 3 C M Size(bp) 800 400 200 Figure 5.1 SYBR green-stained agarose gel patterns of PCR-RFLP genotypes showing the
variant nucleotides at each of the 6 loci analyzed. The digested patterns labeled as VTC01-07
were generated from digestions of PCR products using enzymes described in Table 1. Lanes
identified as M and C represent 1 Kb DNA ladder and control (undigested PCR product from
each locus) samples, respectively. For each locus, lanes labeled as 1, 2, and 3 represent a
digested pattern of an amplicon of a homozygote (restriction site on both chromosomes),
heterozygote (restriction site on only one chromosome) and homozygote (no restriction site) bird,
respectively.
117
CHAPTER 6
Microarray-based SNP analysis of chickens identified as
either high or low anti-SRBC response
6.1 Abstract
Microarrays provide a powerful tool to conduct a genome-wide scan for candidate DNA
markers associated with a quantitative trait. Here, the Illumina SNP analysis array was used to
search for SNPs associated with anti-SRBC response in the chicken. Because of cost limitation,
only 9 birds, including 4 identified as low antibody producing and 5 as high, were used. A total
of 2,733 SNPs were identified and validated. Fifty-seven of the informative SNPs appeared to be
line-specific and were mostly located on different chromosomes including chromosome 1 (8
SNPs), 2 (9), 4 (6), 15 (4), 16 (4), and Z (11). Twenty of the line-specific SNPs were within or
near (<2 Mb) the genes previously reported to have immune-related function. In addition to the
novel candidate markers, the results appeared to validate 6 of 7 candidate markers previously
identified by us through other genome analysis methods. These findings may provide a useful
resource for identifying genes that control humoral immunity in chickens.
Key words: Single nucleotide polymorphism, humoral immune response, Gallus gallus

118
6.2 Introduction
Heritable variations analyzed through DNA analysis provide the genomics community
with a resource that facilitates phenotype:genotype assignment. A major resource in this effort is
expected to be single nucleotide polymorphisms (SNPs). SNPs are abundant in most genomes,
including the chicken, where they occur at a frequency of 1 every 470 bp (Smith et al., 2000 and
Wong et al., 2004). In humans, it has been estimated that the SNP frequency is 0.05% to 0.1% in
genes, though higher in intergenic regions and introns. Several efforts for SNP discovery have
been described, yielding 2.8 million SNPs in the chicken (Wong et al., 2004), in the human
(Wang et al., 1998) and in other species. Besides their abundance, SNPs have become DNA
markers of choice for the third generation of genome maps because of their compatibility with
automation and high throughput analysis. This compatibility facilitates high-resolution genome-
wide scans for genes underlying various biological traits, especially polygenic traits. In addition,
because non-synonymous SNPs located in coding sequences in many genomes, including
chicken, have been sequenced and annotated, investigations with these SNPs may have the
advantage of supporting a candidate-gene study.
The interest in LD-based genome-wide association studies using highly dense arrays of
SNPs is increasing. One reason is that association studies have greater power than linkage
analysis in detecting genes or QTLs underlying polygenic traits, especially those with small
effects on the traits (Risch and Merikangas, 1996). Use of divergently selected lines for a
polygenic trait may facilitate QTL identification since selection would make QTLs associated
with the trait more detectable by causing allele frequency differentiation among the lines. That is,
QTLs could be identified through LD-based approaches based on frequency changes of marker
alleles under selection, although some limits should be considered and carefully checked prior to

119
conclusions (Keightley and Bulfield, 1993). Experimental lines divergently selected for anti-
SRBC have been established (Siegel and Gross, 1980; Van der Zijpp et al., 1983). These lines
provide a unique resource for identification of QTLs influencing anti-SRBC titers.
Antibody response is one of the important mechanisms by which vertebrates fight
pathogens. Evidence has shown that the capacity of animals for anti-SRBC response is
associated with natural disease resistance (Gross et al., 1980, 2002). Identification of QTL
associated with anti-SRBC response may have implications for genetic improvement of disease
resistance. Genetic control of anti-SRBC is polygenic (Feingold et al., 1976; Biozzi et al., 1979;
Gross and Siegel, 1980). Several QTLs responsible for anti-SRBC titers were identified using
lines of mice divergently selected for anti-SRBC response through linkage analysis (Puel et al.,
1995, 1996). These QTLs not only included immunomodulatory genes at MHC and Igh loci, but
also included some unknown immunomodulatory genes located on several distinct chromosomal
segments. Similarly, Siwek et al. (2003) identified several markers associated with anti-SRBC
response on chromosomes 3, 5, 6, 9, 10, 15, 16, 23 and 27 by linkage-based QTL analysis using
F2 birds produced by egg-laying chickens divergently selected for anti-SRBC response. However,
the knowledge about QTLs influencing anti-SRBC response remains limited. In this paper, I
study the distribution of QTLs associated with the trait on a genome-wide scale through LD-
based analysis.
6.3 Materials and Methods
6.3.1 Animals and DNA samples
The establishment of genetic lines divergently selected for anti-SRBC titers was
described in the Chapter 3. The 28th generation used in this experiment had mean anti-SRBC

120
titers of 11.5 and 2.6 for the H and L lines, respectively. Five unrelated individuals from the H
line and four individuals from the L line were used. Genomic DNA was extracted from a whole
blood samples collected from each individual using a protocol previously described (Smith et al.,
1996). Each DNA sample was quantified and diluted to a concentration of 100 ng/ul. These
samples were subsequently used for microarray-based SNP typing.
6.3.2 Microarray-based SNP analysis
A GoldenGate assay (Illumina, http://www.illumina.com/pages.ilmn?ID=11) developed
by Illumina Corp. (San Diego, CA) was used. The microarrays used in this study were
fabricated by Illumina Corp. Each microarray has a capacity for typing 3,072 SNPs. The probes
on these microarrays were designed with input sequences downloaded from chicken SNP
database. The input sequences are genomic DNA containing the SNPs, which were selected to be
equally distributed throughout the chicken genome. The probes laid down on the microarray are
oligos. Illumina Corp. performed the microarray-based SNP typing assays and reported the data
to me. The procedures used for performing microarray experiment are described in GoldenGate
Assay Workflow (www.snp-facility.med.uu.nl/pdf/goldengate_assay_final.pdf). The quality of
these typing assays was evaluated by a number of procedures including sample success rate,
locus success rate, call rate for genotypes, and reproducibility.
6.3.3 Bioinformatics analysis
After the typing assay, SNPs with only one allele per line were considered as candiate
markers associated with anti-SRBC response. The immune response-related genes at or near (<2
Mb) each candidate marker was searched for using the locus name of the SNP to query against
chicken SNP database in GenBank.

121
6.4 Results and Discussion
6.4.1 SNP typing assays
The sample success rate was 100%. The genotype call rate was 99.60%. The
reproducibility was 100%. The locus success rate was 88.96%, meaning that 2733 of 3072 loci
were successfully genotyped. These parameters collectively indicated high quality of microarray-
based SNP typing assays.
6.4.2 SNPs associated with anti-SRBC titers
A total of 191 informative SNPs were identified as having at least one allele that was
line-specific. Their distributions are shown in Table 6.1 and summarized in Table 6.3. They
could be classified into three types of SNPs, including those located within or close to QTLs, not
close to QTLs but being in LD with QTLs, and false positive. Among the informative SNPs, 57
appeared to be line-specific for both alleles (Table 6.2, Table 6.3). These SNPs might be strongly
associated with anti-SRBC response. Bioinformatics analysis indicated that most of them were
on chromosomes 1(8 SNPs), 2(9), 4(6), 15(4), 16(4), and Z(11). This distribution appeared to
agree with my previous study (Chapter 4) in which 7 line-specific markers identified through
RAPD-based approach were on the chromosomes 1(2 independent markers), 2(2), 4(1), 8(1), and
13(1). In fact, 6 of the 7 candidate markers were validated by this study (Table 6.2). This
distribution also was supported by the study in which 2 independent QTLs influencing anti-
SRBC titers were on chromosome 2 (Yonash et al., 2001). However, QTLs identified by Siwek
et al. (2003) were on the chromosomes 3, 5, 6, 9, 10, 15, 16, 23 and 27, with 1 QTL per
chromosome. Zhou et al. (2003) reported 4 QTLs associated with anti-SRBC response on
chromosomes 3, 5, 6 and Z, separately. Results seem not to agree among studies about the
distributions of most QTLs. This discrepancy is probably caused by use of different resource

122
population (e.g., White Leghorn vs. ISA, meat-type vs. egg-type) and approaches (e.g., linkage-
based analysis vs. LD-based analysis) for QTL identification. Such a phenomenon was also
observed in other animal species (Rupp & Boichard, 2003; Schulman et al., 2004). In addition,
since MHC and Igh genes reside on chicken chromosomes 1, 13, 15, 16, 17 and 18, as indicated
by searching the chicken genome with Map Viewer (http://www.ncbi.nlm.nih.gov/mapview/),
the results of this study was also partially supported.
6.4.3 Candidate genes for anti-SRBC titers
The line-specific SNPs subsequently were used to search for immune response-related
genes at or near them based on current annotation of chicken genome. This bioinformatics
analysis indicated that 37 line-specific SNPs reside in known or hypothetical genes (Table 6.2),
20 of which were within or near (<2 Mb) immune response-related genes. In particular, some of
these genes, such as MHC, toll-like receptors, complement component, and immunoglobulin, are
known to involve antibody response (Malnati et al., 1992; Puel et al., 1996; Pieters, 2000;
Mukhopadhyay et al., 2004; Reid and Porter, 1981; Fearon and Carroll, 2000; Butler, 1998; Rees
and Nordskog, 1981). For example, snp-368-18-5079-S-3 was within a gene similar to class II
histocompatibility antigen M-beta chain 1. Snp-29-306-157307-S-2 was near toll-like receptor 7.
Snp-202-52-51925-S-1 resides in a gene similar to complement component 6.
In summary, the present study outlines the distributions of putative QTLs associated with
anti-SRBC titers in chicken through LD-based analysis using divergently selected lines. It also
provides a resource for future identification of causative genes. It is now clear that LD-based
high-resolution whole-genome QTL analysis can prove successful (Ozaki et al., 2002; Klein et
al., 2005; Maraganore et al., 2005), although the major locus sometimes could be missed (Conley
et al., 2005; Rivera et al., 2005). Therefore, this preliminary study may be considered useful for

123
identification of QTLs associated with anti-SRBC response using a microarray-based genotyping
approach. However, it is obvious that this study is very limited. First, only a small number of
individuals from each line were examined. Second, the SNPs on the microarray were not
haplotype-tagged SNPs. The SNP density in the Illumina chicken microarray was limited for
determining precise locations of candidate genes. Last, the results were only based on frequency
changes of SNPs and did not utilize any family-based information, which may lead to some false
positive detections.

124
Table 6.1 Informative SNPs that had at least one allele that was line-specific.
Allele Genotype Chr Locus name
A B Hb (Mc)
H (M)
H (Fc)
H (F)
H (M)
Lb (F)
L (F)
L (F)
L (M)
1 snp-120-149-1449-S-2 C G BB BB BB BB BB AA AA AA AA 1 snp-104-32-4713-S-3 A G AB BB BB AB BB AA AA AA AA 1 snp-169-85-6362-S-3 A G BB BB BB BB BB AA AA AA AA 1 snp-167-56-17685-S-3 A G AA AA AA AA AA BB BB BB BB 1 snp-6-599-22146-S-2 A C BB BB BB BB BB AA AA AA AA 1 snp-6-490-4449-S-1 A G AB BB AB AB AB AA AA AA AA 1 snp-6-336-15036-S-1 A G BB AB AB BB AB AA AA AA AA 1 snp-6-308-57894-S-3 A G BB BB BB BB BB AB AA AB AA 1 snp-6-244-21245-S-3 A G BB BB BB BB BB AB AA AA 1 snp-36-75-2425-S-2 A G BB AB BB AB BB AA AA AA AA 1 snp-36-82-43632-S-2 A C AA AB AA AB AA BB BB BB BB 1 snp-7-58-355-S-1 A G BB BB BB BB BB AA AB AB AA 1 snp-7-85-3009-S-1 A G BB BB BB BB BB AA AB AB AA 1 snp-7-171-6691-S-2 C G BB BB BB BB BB AA AA AA AA 1 snp-7-194-27006-S-1 A G BB BB BB BB BB AA AA AA AA 1 snp-7-208-26246-S-2 A G AA AA AA AB AB BB BB BB BB 1 snp-7-278-21366-S-2 A G BB AB BB BB BB AA AA AA AA 1 snp-7-701-17073-S-3 A G BB BB BB BB AB AB AA AB AB 1 snp-56-112-23112-S-1 A G AB BB BB BB BB AA AA AA AA 1 snp-29-214-17765-S-3 A C AA AB AA AA AA BB BB BB BB 1 snp-29-292-10583-S-2 A G AA AB AA AA AA BB BB BB BB 1 snp-29-306-157307-S-2 A G BB BB BB BB BB AA AA AA AA 1 snp-287-27-28163-S-2 A G BB BB BB BB BB AB AB AA AA 1 snp-14-113-36609-S-1 A G AA AA AA AA AA AB BB BB BB 1 snp-14-60-77306-S-2 A C AA AA AA AA AB BB BB BB BB 1 snp-14-51-64946-S-1 A G BB BB BB BB AB AA AA AA AA 1 snp-23-159-68423-S-1 C G AA AA AA AA AB BB BB BB BB 1 snp-23-208-36692-S-1 A G AA AA AA AA AA BB BB BB BB 1 snp-23-272-12919-S-3 A G AA AA AA AA AB BB BB BB BB 1 snp-23-325-119425-S-2 A G BB BB AB BB BB AA AA AA AA 1 snp-23-342-18608-S-2 A G BB BB AB BB BB AA AA AA AA 1 snp-143-37-75034-S-2 A G BB BB BB BB BB AB AB AB AA 2 snp-2-682-159806-S-2 A G AA AA AA AA AA AB AB BB AB 2 snp-2-655-11730-S-3 A G BB BB BB BB BB AA AA AA AB 2 snp-2-637-25815-S-3 A G AA AA AA AA AA BB BB BB AB 2 snp-2-569-7651-S-2 A C BB BB BB BB BB AA AA AB AB 2 snp-2-517-8510-S-3 A G BB BB BB BB BB AA AB AB AB 2 snp-2-31-74623-S-1 A G AA AA AA AA AA BB BB BB AB 2 snp-5-177-14435-S-2 A C BB BB BB BB BB AA AA AA AA 2 snp-5-213-47708-S-3 A G AA AA AA AA AA BB BB BB BB 2 snp-5-236-875-S-1 A G BB BB BB BB BB AA AA AA AA 2 snp-5-296-38423-S-2 A G AB AA AA AA AA BB BB BB BB 2 snp-5-352-47450-S-2 A G AB AA AA AA AA BB BB BB 2 snp-5-355-27176-S-1 A G AA AA AA AA AA BB BB BB BB 2 snp-5-512-42242-S-3 C G AB AA AA AA AA BB BB BB BB 2 snp-5-524-143622-S-1 A G AB BB BB BB BB AA AA AA AA 2 snp-5-614-24216-S-3 A G BB BB BB BB BB AA AA AA AA 2 snp-40-25-19645-S-2 A G BB BB BB BB BB AA AA AA 2 snp-40-38-1472-S-1 A G BB BB AB BB BB AA AA AA 2 snp-40-83-7191-S-2 A C BB BB BB BB BB AB AB AA AA

125
2 snp-40-160-66815-S-3 A G BB BB BB BB BB AA AA AA AA 2 snp-74-198-33913-S-1 A G AA AA AA AA AA BB AB BB BB 2 snp-210-32-2556-S-1 A C AA AA AA AA AA BB AB AB BB 2 snp-12-590-15828-S-2 A G BB BB BB BB BB AB AA AB AA 2 snp-51-101-82939-S-3 A G AB AB BB AB AB AA AA AA AA 2 snp-89-2-3894-S-3 A C AA AA AA AA AB BB BB BB BB 2 snp-122-75-4354-S-3 A G BB AB BB AB AB AA AA AA AA 2 snp-396-14-12780-S-2 A C BB BB BB BB BB AB AA AA AB 2 snp-21-111-17815-S-1 A G BB BB BB BB BB AA AA AA AA 2 snp-21-212-3930-S-2 A G BB BB BB AB AB AA AA AA AA 2 snp-267-21-1300-S-3 A G AA AA AA AA AA BB BB AB AB 2 snp-72-239-3872-S-3 A G BB BB BB BB BB AA AA AA AA 2 snp-72-205-2923-S-2 A G AA AA AA AA AA BB BB AB AB 3 snp-116-10-4254-S-2 A G AA AA AA AA AA AB BB AB BB 3 snp-17-121-94490-S-1 A T AA AA AA AA AA BB AB BB BB 3 snp-0-92-22510-S-1 A G AA AA AA AA AA BB AB BB BB 3 snp-0-134-12128-S-2 A T BB BB BB BB BB AA AB AA AA 3 snp-0-167-68075-S-1 C G BB BB BB BB BB AA AB AA AB 3 snp-0-194-2943-S-2 A G AB AB AB AB AB BB BB BB BB 3 snp-0-1110-55891-S-3 A C BB AB BB AB BB AA AA AA AA 4 snp-11-433-51531-S-1 A G AA AA AA AA AA BB BB BB AB 4 snp-11-408-32771-S-2 A C AB AA AA AB AA BB BB BB BB 4 snp-11-342-8379-S-1 A C AA AA AA AA AA BB BB BB BB 4 snp-11-315-8528-S-1 A G AA AA AA AA AA AB BB BB BB 4 snp-28-138-3569-S-2 A T AA AA AA AA AA BB AB AB AB 4 snp-28-198-10894-S-3 A G AA AA AA AA AA BB AB AB AB 4 snp-28-234-5414-S-3 A G BB BB BB BB BB AA AB AB AB 4 snp-28-391-75742-S-3 A G BB AB AB AB AB AA AA AA AA 4 snp-3-35-18005-S-1 A G AB AB BB BB BB AA AA AA AA 4 snp-3-177-39024-S-2 A G AA AA AA AA AA BB BB BB BB 4 snp-3-450-40809-S-3 A G AB AA AB AA AA BB BB BB BB 4 snp-3-533-48073-S-2 A C AB AA AB AA AA BB BB BB BB 4 snp-32-262-34508-S-1 A G BB BB BB BB BB AA AA AA 4 snp-32-93-10050-S-3 C G AB AA AB AA AA BB BB BB BB 4 snp-32-88-51840-S-1 A G AB BB AB BB BB AA AA AA AA 4 snp-85-157-3063-S-2 A G AA AA AA AA AA BB BB BB BB 4 snp-31-128-4930-S-2 A G AA AA AA AA AA BB AB AB 4 snp-31-121-188387-S-1 A G BB BB BB BB BB AA AA AA AA 5 snp-45-70-11096-S-2 A C AB AA AA AA AA BB BB BB 5 snp-1-1277-8367-S-1 A G AB AB AA AA AB BB BB BB BB 5 snp-1-1234-21449-S-3 A G AB AB AA AA AB BB BB BB BB 5 snp-1-1081-19826-S-2 A G AB AB BB BB BB AA AA AA AA 5 snp-1-1043-1874-S-3 A G AB AB AA AA AA BB BB BB BB 5 snp-1-1005-6873-S-1 C G AB AB AB AB AB AA AA AA 5 snp-1-387-47907-S-1 A G BB BB BB BB BB AA AA AA AB 5 snp-1-311-52989-S-2 A G AB AA AB AA AA BB BB BB BB 5 snp-887-1-10069-S-3 C G BB BB BB BB BB AA AA AA AA 6 snp-22-96-1675-S-1 A G AA AA AA AB AA BB BB BB BB 7 snp-54-40-87969-S-3 A G AA AA AA AA AA BB BB BB BB 7 snp-13-374-46199-S-1 A C AA AB AA AB AA BB BB BB BB 7 snp-13-217-56582-S-3 A G BB BB BB BB BB AA AA AA AA 7 snp-13-214-10867-S-1 A G BB BB BB BB BB AA AA AB AA 7 snp-13-200-129407-S-1 A C AA AA AA AA AA BB BB AB BB 9 snp-25-236-42194-S-1 A G AA AA AA AB AA BB BB BB BB 9 snp-41-278-18296-S-1 A G AA AB AA AA AA BB BB BB AB 10 snp-155-83-3333-S-2 A C BB BB BB BB BB AB AB AB AB

126
10 snp-70-40-54351-S-2 A G AA AA AA AA AA BB AB AB AB 10 snp-110-94-5270-S-2 A G AA AA AA AA AA BB BB BB BB 11 snp-100-92-1971-S-2 A G BB BB BB AB AB AA AA AA AA 11 snp-92-37-163457-S-3 A G AB AB AA AB AA BB BB BB BB 11 snp-142-64-19874-S-1 A C AA AA AA AA AA BB AB AB AB 11 snp-198-31-4076-S-2 A G BB AB BB BB BB AA AA AA AA 11 snp-107-121-2306-S-1 A G AA AA AA AA AA BB BB BB BB 11 snp-256-1-8355-S-2 A G BB BB BB BB AB AA AA AA AA 11 snp-236-22-4791-S-3 A G AB AA AB AA AB BB BB BB BB 11 snp-156-3-11066-S-3 A G BB BB BB AB BB AA AA AA AA 12 snp-132-21-325303-S-3 A G BB BB AB BB BB AA AA AA AA 12 snp-132-21-335311-S-1 A G AA AA AB AA AA BB BB BB BB 12 snp-16-398-135819-S-2 A T AB BB AB BB BB AA AA AA AA 12 snp-16-64-13646-S-1 A G AB AA AA AA AB BB BB BB BB 12 snp-16-14-84888-S-1 A C AB AB AB BB BB AA AA AA AA 12 snp-49-27-3062-S-1 A G AA AA AA AA AA AB BB AB BB 13 snp-39-143-39018-S-1 A G AA AB AB AB AB BB BB BB BB 13 snp-66-103-27705-S-1 A G AA AA AA AA AA BB AB BB BB 13 snp-66-15-18385-S-2 A G AA AA AA AA AA AB AB AB AB 13 snp-66-14-2353-S-3 A G BB BB BB BB BB AA AA AA AA 13 snp-572-1-2764-S-2 A G AA AA AA AA AA AB AB BB BB 14 snp-30-85-2617-S-3 A G BB BB BB BB BB AA AA AA AA 14 snp-48-169-11772-S-1 C G BB BB BB AB AB AA AA AA AA 15 snp-37-53-28251-S-3 A G BB BB BB BB BB AA AA AA AA 15 snp-37-87-2401-S-3 A G AA AA AA AA AA BB BB BB BB 15 snp-37-104-26184-S-2 A G AA AA AA AA AA AB BB AB 15 snp-37-113-8486-S-1 A G AA AA AA AA AA BB BB BB BB 15 snp-37-140-21234-S-1 A C BB BB BB BB BB AA AB AA AA 15 snp-37-156-6426-S-2 A G BB BB BB BB BB AA AA AA AA 15 snp-37-205-190496-S-3 A G AA AA AB AA AA BB BB BB BB 15 MIF-chr15-8037672 A G AB AA AB AB AA BB BB BB BB 16 snp-368-3-6764-S-1 A G AA AA AA AA AA BB BB BB BB 16 snp-368-9-6157-S-3 A G AA AA AA AA AA BB BB BB BB 16 snp-368-12-1015-S-2 C G AA AA AA AA AA BB BB BB BB 16 snp-368-18-5079-S-3 A G BB BB BB BB BB AA AA AA AA 17 snp-237-54-4101-S-1 A G AB AB BB BB BB AA AA AA AA 18 snp-24-14-6303-S-3 A G AA AA AA AA AA BB BB BB BB 18 snp-24-94-11012-S-3 A G BB BB BB BB BB AA AA AA AA 18 snp-24-191-26961-S-2 A G BB AB BB BB AB AA AA AA AA 18 snp-24-241-10560-S-3 A C AB AB BB BB BB AA AA AA AA 19 snp-19-482-44615-S-3 C G AA AA AA AA AA BB BB BB BB 19 snp-19-480-15842-S-1 A C AA AA AA AA AA BB BB AB AB 19 snp-19-411-14335-S-3 A C BB BB BB BB BB AA AA AB AB 19 snp-19-295-13420-S-3 A G AA AA AA AA AA AB BB BB BB 20 snp-18-218-9766-S-1 A G AA AA AA AA AA BB AB BB BB 20 snp-108-15-32457-S-3 A G AA AA AA AB AA BB BB BB BB 20 snp-108-46-330-S-1 A G AA AB AB AB AB BB BB BB BB 21 snp-52-144-62576-S-1 A G BB AB AB AB BB AA AA AA 21 snp-52-144-82459-S-2 A G BB AB AB AB BB AA AA AA 21 snp-123-54-6694-S-2 A G AB AB AB AB AA BB BB BB BB 21 snp-123-50-16015-S-1 A G AB AB AB AB BB AA AA AA AA 21 snp-123-41-212-S-1 A G AB AB AB AB BB AA AA AA AA 24 snp-50-79-3667-S-1 A G AA AA AA AA AA AB BB BB BB 24 snp-50-156-15077-S-1 A C AA AA AA AA AA BB BB AB BB 24 snp-50-179-22444-S-1 A G AA AB AA AA AB BB BB BB BB 24 snp-50-214-42265-S-2 A C BB BB BB BB BB AB AB AA AB

127
24 snp-50-240-64873-S-1 A G AA AA AA AA AA AB AB AB 24 snp-119-7-889-S-3 A G BB AB BB BB AB AA AA AA AA 24 snp-119-129-10358-S-2 A G AA AA AA AA AA BB AB BB BB 24 snp-119-145-11226-S-1 A C BB BB BB BB BB AA AA AA AA 26 snp-65-234-365-S-2 A G BB BB BB AB BB AA AA AA AA 26 snp-65-229-2506-S-2 A G AA AB AA AB AB BB BB BB BB 26 snp-65-42-18041-S-1 A G BB BB BB BB BB AA AA AA AA 27 snp-463-23-5865-S-2 A G AB AB AB AB BB AA AA AA AA 27 snp-571-3-9920-S-1 A G AB AB AB AB AB AA AA AA AA 28 snp-149-59-3939-S-3 A G AA AA AA AA AA BB BB AB AB 28 snp-114-27-25093-S-2 A C BB BB BB AB BB AA AA AA AA 28 snp-114-27-1537-S-3 A G AA AA AA AB AA BB BB BB BB Z snp-220-54-9693-S-1 A G AA AA AA AA AA BB BB BB BB Z snp-78-392-18578-S-2 A G AA AA AA AA AA BB BB BB BB Z snp-78-582-5659-S-1 A G AA AA AA AA AA BB BB BB BB Z snp-202-52-51925-S-1 A G AA AA AA AA AA BB BB BB Z snp-115-435-2924-S-2 A T BB BB BB BB BB AA AA AA Z snp-115-277-4143-S-2 A G AA AA AA AA AA BB BB BB AB Z snp-135-307-8072-S-2 A C AA AA AA AA AA BB BB BB BB Z snp-126-212-2996-S-3 A G BB BB BB BB BB AA AA AA AA Z snp-135-2-1768-S-2 A G BB BB BB BB BB AA AA AA AA Z snp-154-65-70-S-1 A G AA AA AA AA AA BB BB BB BB Z snp-154-6-2743-S-2 A C BB BB BB BB BB AA AA AA AA Z snp-234-103-29625-S-2 A T AA AA AA AA AA BB BB BB BB
UNa snp-4211-3-1618-S-1 A G BB BB BB BB BB AA AB AB AA UN snp-289-3-2451-S-1 A C AA AA AA AA AA BB BB BB UN snp-163-26-6430-S-2 A G BB BB BB BB BB AA AA AA AA UN snp-126-116-7856-S-2 A G BB BB BB BB BB AA AA AA AA UN snp-2347-3-303-S-1 A G AA AA AA AA AA AB BB BB
a UN indicates the SNP has not been mapped to one of 39 pairs of chicken chromosomes. b H and L indicate that individuals examined were from lines of chicken divergently selected for
high or low antibody titers to sheep red blood cells, respectively. c M and F indicate that individuals examined are male or female, respectively.

128
Table 6.2 Characteristics of SNPs that were specific for both lines.
Allelea Chr Accession number
H L Annotated genec Gene ID
1 snp-120-149-1449-S-2 G C SEMA3A, sema domain, immunoglobulin domain (Ig) d 395825 1 snp-169-85-6362-S-3 G A SEMA3C, sema domain, immunoglobulin domain (Ig) d 374090 1 snp-167-56-17685-S-3 A G LOC427852, hypothetical gene, close to SEMA3E d 427852
1 snp-6-599-22146-S-2 C A RCJMB04_20b4, similar to hypothetical protein, close to interferon-related developmental regulator 1 d 417776
1 snp-7-171-6691-S-2 (VTC05)b G C - - 1 snp-7-194-27006-S-1 G A similar to RNA polymerase III subunit 2 418071 1 snp-29-306-157307-S-2 (VTC07)b G A similar to hypothetical protein, close to toll-like receptor 7 d 418636 1 snp-23-208-36692-S-1 A G similar to Propionyl-Coenzyme A carboxylase, close to integrin, beta-like 1 418774 2 snp-5-177-14435-S-2 C A similar to hypothetical protein FLJ22419, close to p300/CBP-associated factor 420651 2 snp-5-213-47708-S-3 A G - - 2 snp-5-236-875-S-1 G A leucine rich repeat containing 3B 420657
2 snp-5-355-27176-S-1 A G acyl-Coenzyme A dehydrogenase family, member 11, close to LOC420688, which is similar to DnaJ (Hsp40) homolog 420689
2 snp-5-614-24216-S-3 (VTC04)b G A GLI-Kruppel family member GLI3, close to inhibin, beta A 420769 2 snp-40-25-19645-S-2 (VTC03)b G A - - 2 snp-40-160-66815-S-3 G A similar to GDP-mannose 4,6-dehydratase, close to interferon regulatory factor 4 d 420890 2 snp-21-111-17815-S-1 G A - -
2 snp-72-239-3872-S-3 G A oxidation resistance 1, close to LOC420265, which is similar to dendritic cell-specific transmembrane protein, and close to IL-4 induced gene d 420270
4 snp-11-433-51531-S-1 A G - - 4 snp-11-342-8379-S-1 A C - - 4 snp-3-177-39024-S-2 A G - - 4 snp-32-262-34508-S-1 G A - - 4 snp-85-157-3063-S-2 (VTC02)b A G - - 4 snp-31-121-188387-S-1 G A - - 5 snp-887-1-10069-S-3 G C RCJMB04_1j22 catalase 423600
7 snp-54-40-87969-S-3 A G phospholipase A2 receptor 1, close to LOC424193, which is similar to lymphocyte antigen 75 precursor d 404304
7 snp-13-217-56582-S-3 G A similar to solute carrier family 35, member F5 424281 10 snp-110-94-5270-S-2 A G similar to FLJ21940 protein 415602 11 snp-107-121-2306-S-1 A G - -

129
13 snp-66-14-2353-S-3 (VTC01)b G A similar to sequestosome 1, close to LTC4S leukotriene C4 synthase d 416284 14 snp-30-85-2617-S-3 G A - - 15 snp-37-53-28251-S-3 G A - - 15 snp-37-87-2401-S-3 A G - - 15 snp-37-113-8486-S-1 A G - - 15 snp-37-156-6426-S-2 G A - - 16 snp-368-3-6764-S-1 A G similar to L-amino acid oxidase, close to B-G MHC class IV antigen d 417039
16 snp-368-9-6157-S-3 A G similar to butyrophilin 1, B locus, close to LOC417046, which is similar to IgV-region-like B-G antigen d 417045
16 snp-368-12-1015-S-2 A G B-lec protein, close to LOC417046, which is similar to IgV-region-like B-G antigen d 404776
16 snp-368-18-5079-S-3 G A similar to class II histocompatibility antigen M beta chain 1, close to LOC417046, which is similar to IgV-region-like B-G antigen d 417051
18 snp-24-14-6303-S-3 A G similar to DKFZP566O084 protein, close to LOC417312, which is similar to MAP kinase kinase 4 d 417304
18 snp-24-94-11012-S-3 G A nudE nuclear distribution gene E homolog like 1, close to LOC427792, which is similar to BCL-6 corepressor isoform c d 417317
19 snp-19-482-44615-S-3 C G similar to hypothetical protein FLJ10900 417478 24 snp-119-145-11226-S-1 C A similar to hypothetical protein, close to interleukin 18 d 428255 26 snp-65-42-18041-S-1 G A progastricsin (pepsinogen C), close to BTG family, member 2 d 395690 Z snp-220-54-9693-S-1 A G NFIB nuclear factor I/B 396209 Z snp-78-392-18578-S-2 A G - -
Z snp-78-582-5659-S-1 A G similar to 3-phosphatidylinositol kinase 85K chain alpha, close to LOC431584, which is similar to lymphocyte antigen 64-like protein d 427171
Z snp-202-52-51925-S-1 A G similar to complement component 6 d 431585 Z snp-115-435-2924-S-2 T A similar to nicotinamide nucleotide transhydrogenase 427196 Z snp-135-307-8072-S-2 A C similar to transducin-like enhancer protein 1 427450 Z snp-126-212-2996-S-3 G A ADAMTSL1 ADAMTS-like 1 431603 Z snp-135-2-1768-S-2 G A similar to Death-associated protein kinase 1 431670 Z snp-154-65-70-S-1 A G similar to GTP-binding protein GL1 alpha chain 431611 Z snp-154-6-2743-S-2 C A - - Z snp-234-103-29625-S-2 A T - -
UNe snp-289-3-2451-S-1 A C golgi autoantigen, golgin, subfamily b, macrogolgin 1, close to complement component 7 d 426868 UNe snp-163-26-6430-S-2 G A RNA binding motif protein 13 426924 UNe snp-126-116-7856-S-2 G A - -

130
a Alleles for each single nucleotide polymorphism (SNP) with one allele in the high antibody (H)-producing individuals examined and
with the alternative allele in the low antibody (L)-producing individuals examined, simultaneously. b SNPs located near the candidate markers identified previously (see Chapter 4). c Genes that have been annotated in GenBank. d Candidate genes with known immune response-related functions located within or near (<2Mb) the line-specific SNPs. e UN indicates the SNPs have not been mapped to one of 39 pairs of chicken chromosomes.

131
Table 6.3 Distributions of SNPs with given characteristics over the respective chicken
chromosomes.
Chr/Linkage group Typeda Informativeb Line specificc Candidate gened 1 449 32 8 5 2 321 31 9 2 3 215 7 0 0 4 193 18 6 0 5 147 9 1 0 6 69 1 0 0 7 114 5 2 1 8 86 0 0 0 9 96 2 0 0 10 77 3 1 0 11 64 8 1 0 12 76 6 0 0 13 53 5 1 1 14 51 2 1 0 15 53 8 4 0 16 7 4 4 4 17 47 1 0 0 18 43 4 2 2 19 39 4 1 0 20 51 3 0 0 21 61 5 0 0 22 13 0 0 0 23 9 0 0 0 24 57 8 1 1 25 6 0 0 0 26 35 3 1 1 27 35 2 0 0 28 55 3 0 0
LGE22C19W 1 0 0 0 Z 128 12 11 2 W 8 0 0 0 M 3 0 0 0
UNe 69 5 3 1 Total 2733 191 57 20
a Single nucleotide polymorphisms (SNPs) successfully typed in the Illumina microarray-based
SNP typing assay. b SNPs having at least one allele that was line-specific. c SNPs having one allele in one line and the alternative in another. d SNPs that are line-specific and located within or near immune response related genes. e UN indicates the SNPs have not been mapped to one of 39 pairs of chicken chromosomes.

132
CHAPTER 7
Microarray-based differential expression analysis of low and high anti-SRBC titers
7.1 Abstract
Global expression profiling has been applied to define the molecular bases of a variety of
biological traits through identification of differentially expressed (DE) genes. However, antibody
response, as an important trait in both agriculture and biomedicine, has not yet been investigated
through global expression profiling. Here, I describe for the first time differentially expressed
genes in chickens associated with low or high antibody response based on microarray-based
transcription profiling analysis. One hundred and sixty birds from a random-bred population
were raised, 145 and 15 of which were challenged and not challenged with SRBC, respectively.
In the microarray experiment, 10 non-challenged birds were grouped as N, 10 birds with average
anti-SRBC titers were grouped as A, and 15 birds with extremely high or low anti-SRBC titers
were grouped as H or L, respectively. Pooled RNA samples made from individual RNA samples
for each of the 4 groups were hybridized to Affymetrix chicken GeneChips, with technical
replicates. As a result, only 3 genes were identified as differentially expressed between H and L
chickens. Gene annotation and classification analysis indicated that they probably were genes
influencing chicken anti-SRBC titers. Similarly, 7 genes were differentially expressed between N
and A chickens, with one overlapping with genes differentially expressed between H and L
chickens. Classification test of these genes suggested that the response of the chicken to
intravenous injection of SRBC involved multiple biological processes, including response to
stress or other different stimuli, sugar, carbohydrate or protein binding, and cell or soluble
fraction, in addition to antibody response. In summary, this preliminary study provides

133
information useful for identification of genes underlying antibody response to SRBC and sheds
some light on the mechanism by which vertebrates respond to pathogen challenge.
Keywords: antibody response, Gallus gallus, gene expression, microarray
134
7.2 Introduction
Microarray technology has emerged as a powerful tool for analyzing mRNA abundance
in cells or tissues on a genome-wide scale. Microarray-based transcription profiling analysis has
been applied to many types of biological inquiry (Eisen et al., 1998; Yang et al., 2002; Gasch et
al., 2000; Chen et al., 2003; Golub et al., 1999; Oberthuer et al., 2006). Identification of
candidate genes is an important inquiry. Based on differential expression of genes in cells or
tissues under different conditions, candidate genes responsible for a selected phenotype may be
identified (Der et al., 1998).
Although different types of gene expression arrays are commercially available, the in situ
synthesized oligonucleotide arrays, including the Affymetrix GeneChip, are the most
comprehensive and complex. This is because Affymetrix GeneChip arrays employ unique array
designs in addition to stringent probe selection strategies, including multiple probes for each
gene, pairing of a perfect match probe with a mismatch probe, and automated control of the
experimental process (Budhraja et al., 2003). These aspects of array design bring about high
sensitivity and reproducibility.
Pooling individual samples when carrying out microarray-based transcript profiling
analysis is commonly used for reducing experimental costs and sample variation, although it
could result in loss of information. Kendziorski et al. (2005) evaluated the utility of pooling and
its impact on the efficiency of identifying differentially expressed (DE) genes. They found that
inference for most genes was not adversely affected by pooling. They also recommended that
pooling be done when fewer than three arrays are used for each experimental condition.
Microarray-based gene expression profiling has been used in several immune-associated
studies. For example, Hutton et al. (2004) identified genes preferentially expressed in immune

135
tissues and cell types. Hess et al. (2004) assessed gene expression changes of naive CD4+ T cells
in response to T cell receptor-mediated activation. However, antibody response to heterogeneous
erythrocytes (e.g., SRBC) has not been investigated using microarray-based global transcription
profiling.
Antibody response is a quantitative trait controlled by multiple genes (Feingold et al.,
1976; Biozzi et al., 1979; Siegel and Gross, 1980; Ibanez et al., 1980; Van der Zijpp et al., 1983).
It is an important defense mechanism by which vertebrates fight against invasion and infection
by pathogens. Selection for antibody response may improve vertebrate disease resistance (Gross
et al., 1980). Therefore, identification of genes for antibody response could have important
implications in animal production and biomedicine. Heterogeneous erythrocytes often are used
as a non-specific antigen for dissecting genetic control of antibody response. Mammalian
erythrocytes have a number of membrane proteins on their surface, including glycophorins
(Fukuda, 1993; Chasis and Mohandas, 1992), blood group antigens (Lowe, 2001; Cartron et al.,
1998), and glycosyl phoshatidylinositol. Because heterogeneous erythrocytes are multi-
determinant and strongly immunogenic antigens, it is more likely to identify more of the genes
for antibody response than a specific antigen, such as a virus or a bacterium. This is supported by
the following evidence. First, background genes, unlinked to immunomodulatory genes at MHC
and Igh loci, were shown to contribute to antibody response induced by heterogeneous
erythrocytes (Puel et al., 1995, 1996). Second, it was shown that selection for antibody response
to heterogeneous erythrocytes was correlated with disease resistance to multiple pathogens
(Gross et al., 1980).
Genes or quantitative trait loci for antibody response have been identified by linkage
analysis using experimental lines divergently selected for high or low anti-SRBC response in

136
mouse and chicken (Puel et al., 1995, 1996; Siwek et al.). In addition to major histocompatibility
complex (MHC) and Igh genes, no other genes were identified by these studies, likely because
the regions containing quantitative trait loci are still very large and the exact locations of
candidate genes are not defined. Other approaches including microarray-based gene expression
profiling may facilitate the identification of these candidate genes.
In this study, I identified genes differentially expressed in spleen between chickens
challenged or not challenged with SRBC or between chickens with high and low anti-SRBC
titers using microarray-based transcription profiling. This is the first report on the global gene
expression profiles of antibody response to SRBC in vertebrates and provides several candidate
genes for antibody response.
7.3 Materials and Methods
7.3.1 Animals and tissue collection
A total of 160 1-d-old female chicks were purchased from Fairview Hatchery Company
(http://www.fairviewhatchery.com). These birds were from a random-bred egg production strain
unselected for antibody production called the Best White Leghorn Egg Layer, which has a
medium-size body and lays 300 to 325 white eggs per year. All birds were housed on a wood
chip-covered floor. They did not receive vaccinations and were given access to water and feed ad
libitum. The feed was a pullet starter with 19% crude protein and the required metabolic energy,
which met or exceeded National Research Council 1994 requirements. The feed also was
supplemented with coccidiostat. When chicks were 45-d old, 15 of them, as non-challenged (N)
group, were mock-challenged with 0.1mL of 0.9% saline via the brachial vein, while the rest
were administered with 0.1mL of 0.5% suspension of SRBC. Antibody titers to SRBC were

137
determined 5 days post-injection by hemagglutination assay is described by Siegel and Gross
(1980). Titers were expressed as log2 of the reciprocal of the highest dilution in which there was
hemagglutination. Ten birds with average anti-SRBC titers were grouped as A, and 15 birds with
extremely high or low anti-SRBC titers were grouped as H or L, respectively. The 4 groups of
birds were killed at the next day. Each spleen was immediately collected and put into RnaLater
according to the manufacturer’s instruction (Qiagen Inc., Valencia, CA). All animal protocols
were approved by our Institutional Animal Care and Use Committee.
7.3.2 Total RNA isolation and pooling
Total RNA was extracted from chicken spleen using the RNeasy Mini kit according to
the manufacturer’s recommended protocol (Qiagen Inc., Valencia, CA). The quality of
individual RNA samples was determined using an Agilent BioAnalyzer 2100, and RNA
concentration was determined by nano-drop spectrometer. The RNA samples were treated with
DNase (Qiagen Inc.) to digest genomic DNA. Equal amounts of total RNA from individual
samples then were pooled for each group. within each group were combined. For the N or A
groups, individual RNA samples from 10 birds were used. For the H or L groups, individual
samples from 7 birds and from the rest were used to make 2 pools for each group. The pooled
RNA samples were subjected to assays of quality and quantity.
7.3.3 Microarray assay
GeneChip Chicken Genome Arrays were purchased from Affymetrix (Santa Clara, CA).
Each array contained 32,773 transcripts corresponding to over 28,000 chicken genes
(https://www.affymetrix.com/support/technical/datasheets/chicken_datasheet.pdf). Ten
micrograms of total RNA were labeled and hybridized to the array according to the Affymetrix
protocol (http://www.affymetrix.com/support/technical/manual/expression_manual.affx). Briefly,

138
10µL of the total RNA were converted to double-stranded cDNA using the SuperScript Choice
System (Invitrogen Life Technologies, Carlsbad, CA) and T7-(dT)24 primer (Affymetrix, Santa
Clara, CA). After digestion of double-stranded cDNA, biotin-labeled cRNA was synthesized
from the cDNA with the BioArray High Efficiency RNA Transcript Labeling Kit (Affymetrix,
Santa Clara, CA). The cRNAs then were purified and fragmented to sizes ranging from 35 to 200
bases by incubation at 94˚C for 35 min. Fifteen µg of the fragmented cRNA was hybridized to a
GeneChip at 45˚C with 45 rpm for 16 hours. The GeneChips were washed and stained with
streptavidine-phycoerythrin after hybridization, and the signals were further amplified with
biotinylated antibody, goat IgG, and another staining with streptavidine-phycoerythrin using
Affymetrix Fluidics Station 400 operated by GCOS1.4.0 operation system. Finally, the
GeneChips were scanned with an Agilent GeneArray Scanner 3000. Each pooled RNA sample
was hybridized to two GeneChips for technical duplication.
7.3.4 Microarray data analysis
A DNA Chip Analyzer (dChip, Li and Wong, 2001a, b) was used for low- and high-level
analyses of microarray data. The microarray data initially used by dChip were the *.CEL files
created by Affymetrix Microarray Suite Version 5.0 (MAS5.0, Affymetrix), which contained the
expression ‘signals’ acquired from scanning the GeneChips. The low-level analysis included
image segmentation, background correction, normalization, model-based expression calculation,
and outlier detection. Briefly, the ‘invariant set normalization’ method (Li and Wong, 2001a)
was used to normalize all GeneChips to a baseline chip (LAb2-2), which had the median feature
intensity. Expression level then was calculated using a perfect match-mismatch difference model
(Li and Wong, 2001b). The model is fit iteratively for each probe set with removal of outliers.
The outliers include single, probe, and array outliers (Li and Wong, 2001b). The high-level

139
analysis included identification of DE genes and gene classification with gene ontology (GO) or
protein domain (PD) terms. The DE genes were identified by comparing N with A or L with H
data sets. The comparison criteria included fold-change between the group means (not log
transformed) exceeding 1.3 using the ‘lower 90% confidence bound’ or the difference in
expression values (not log transformed) between the groups exceeding 300. The median false
discovery rate (FDR) was estimated by permutation with n=1000 for multiple-comparison
adjustment (Li and Wong, 2001b).
7.3.5 Bioinformatics analysis
Chromosomal locations of differentially expressed genes were determined using their
accession numbers in GenBank. Briefly, their accession numbers were used to search against the
UniGene database in GenBank for their mRNA sequences, followed by sequence alignments of
these sequences against the assembled chicken genome sequence (May 2006 assembly) using the
BLAT tool, which is available the UCSC genome bioinformatics site:
http://genome.ucsc.edu/cgi-bin/hgBlat?command=start.
7.4 Results
7.4.1 Anti-SRBC titers
The mean anti-SRBC titers (log2-transformed) for the A, L, H, and all the challenged
birds (142 birds except 3 dead) were 7.00, 5.17, 8.37, and 6.78, respectively (Table 7.1). The
ratio of H to L in mean anti-SRBC titers (not log2-transformed) was 9.2.
7.4.2 Quality profile of raw data
Table 7.2 shows the quality profile of the raw data from the microarray experiments. The
unnormalized median intensity, the percentage of present calls, the percentage of array outliers,

140
and the percentage of single outliers ranged from 148 to197, 53.5% to 59%, 0.057% to 1.056%,
and 0.088% to 0.327%, respectively.
7.4.3 Differentially expressed genes
Only 3 genes, including Gga.2929, Gga.4110, and Gga.9239, were identified as
differentially expressed between the H and L groups using the comparison criteria (Table 7.3).
The standard error of the expression level was small when compared with the expression level of
each of these genes (Table 7.3). All of these genes were upregulated in H compared with L. The
fold-changes of expression level of the genes range from 1.51 to 2.04 (Table 7.3). However, the
fold-changes could range from 1.36 to 3.16 with 90% confidence (Table 7.3). The median FDR,
estimated from 1000 times of permutations, was 0 for the three genes, while it was above 25%
when more genes were identified as differentially expressed. Two of the three genes are located
on chromosomes, 15 and 16 with one not mapped (Table 7.3). Gene annotations indicated that
the 3 genes were gamma immunoglobulin heavy (IgG H)-chain 3'-region (HC86) C part,
immunoglobulin (Ig) rearranged lambda-chain mRNA variable (V)-region, and a gene similar to
MHC Rfp-Y class I alpha chain (Table 7.3). A gene class test with GO and PD terms indicated
that Gga. 9239 was identified as an MHC protein with significant enrichment (p<0.002) (Table
7.5).
Similarly, 7 genes, indicated by 9 probe sets, were identified as differentially expressed
between N and A, using the same criteria as for H-L comparison (Table 7.4). However, choosing
the criteria for this comparison was not based on the estimated median FDR because N and A
groups did not have biological replicates, but only technical replicates, and the median FDR
could not be estimated. Interestingly, Gga.2929 was also identified as differentially expressed
between H and L groups; and Gga.9260 was simultaneously identified by 3 different probe sets,

141
including Gga.16267.1.S1_at, Gga.16267.1.S1_s_at, and Gga.9260.1.S1_at. In Affymetrix
GeneChips, the same gene may be represented by different probe sets. This is because some
probe sets are designed using different segments of the same gene. This study gave such an
example. Furthermore, 3 DE genes, including GgaAffy.20099, GgaAffy.13005, and Gga.4942,
were down-regulated with fold-change ranging from -1.87 to -1.43, while the rest were up-
regulated with fold change ranging from 1.5 to 1.97 in the A group when compared with the N
group (Table 7.4). The estimation of the fold-changes with 90% confidence ranged from 1.33 to
2.49 (Table 7.4). Moreover, the genes are located on chromosomes 1 (2 genes), 5(1), 16(1), and
27(2), with two genes unmapped (Table 7.4). In addition, gene annotations indicated that these
genes are heat shock protein 25, heat shock protein 70, lectin-like protein, IgG H-chain 3'-region
(HC86) C part, purinergic receptor P2Y, a gene similar to MHC class I alpha chain, and a gene
similar to copine VII (Table 7.4). A gene class test of these genes indicated that the response of
the chicken to intravenous injection of SRBC involved multiple biological processes, including
antibody response (Table 7.6). In particular, GgaAffy.20099, GgaAffy.13005, Gga.4942,
Gga.9260, Gga.4900, and Gga.16267 were significantly connected to GO terms that included
response to stress or other different stimuli, sugar, carbohydrate or protein binding, and cell or
soluble fraction (p<0.001).
7.5 Discussion
Candidate genes underlying a quantitative trait can be identified by oligo-nucleotide
array-based gene expression analysis (Wayne and McIntyre, 2002; Carr et al., 2007; Scherzer et
al., 2007). The number of the candidate genes can be further reduced when combined with QTL
mapping (Wayne and McIntyre, 2002; de Buhr et al., 2006; Lai et al., 2007; Joe et al., 2005).

142
Identifying genes differentially expressed under different conditions or statuses proves a robust
approach for microarray-based identification of candidate genes (Carr et al., 2007; Yamashita et
al., 2005). In this study, DE genes were identified between the chickens with (A group) or
without (N group) SRBC challenge or between the chickens with high (H group) and low (L
group) anti-SRBC response using Affymetrix GeneChip arrays. The quality of raw data appeared
to be good, which was evidenced by the consistency of the unnormalized median intensities
across arrays, the high percentage of present calls, and the low percentages of single and array
outliers (Table 7.2). It also was supported by the discovery of the DE genes. Among the DE
genes, Gga.2929 and Gga.9260 were simultaneously identified by the two comparisons (H-L and
A-N) and by 3 different probe sets, respectively, although only a few genes were totally
identified (Table 7.3, Table 7.4). For each of them, the direction and level of gene expression
were consistent, and biological or technical variations for gene expression level were small
within each group (Table 7.3, Table 7.4).
In this study, the A-N comparison identified more DE genes than the H-L comparison
(Table 7.3, Table 7.4). The outcome seems reasonable because it is possible for genes to respond
to SRBC challenge without influencing anti-SRBC titers. Therefore, it is suggested that the H-L
comparison is more efficient in the identification of candidate genes influencing antibody titers
than the A-N comparison, although the latter may provide information useful to help us
understand the molecular basis of antibody response to SRBC challenge. The A-N comparison
indicated that antibody response to SRBC challenge involved multiple biological processes in
addition to immune response, including cell or soluble fraction, response to stress or other
different stimuli, and sugar, carbohydrate or protein binding (Table 7.6). Interestingly, genes
including heat shock protein 25 (GgaAffy.20099), heat shock protein 70 (Gga.4942), and

143
purinergic receptor P2Y (GgaAffy.13005), which involve response to stress, were down-
regulated in response to SRBC challenge (Table 7.4). Moreover, these biological processes may
partially agree with the known structure and functions of the spleen (Jeurissen, 1991). The spleen
is one of the secondary lymphoid organs and consists of red pulp and white pulp. The network of
sinusoids in red pulp is populated with macrophages and numerous erythrocytes and is the site
where old red blood cells are destroyed and removed. In comparison, white pulp surrounds the
splenic arteries, forming a periarteriolar lymphoid sheath populated mainly by T lymphocytes.
Clusters of B lymphocytes in the sheath form primary follicles occupying a more peripheral
position (Jeurissen, 1991). Therefore, it is understandable that the functions of spleen are related
to the biological processes including immune response, and the cell or soluble fraction.
In this study, IgG H-chain 3'-region (HC86) C part and genes similar to MHC class I
were identified as DE genes by both comparisons (H-L and A-N), suggesting that they play roles
in response to SRBC challenge and the regulation of anti-SRBC titers (Table 7.3, Table 7.4). The
roles of MHC and Igh genes in the regulation of anti-SRBC titers were previously described by
Puel et al. (1996). However, it is noteworthy that genes similar to MHC class I could be novel
candidate genes since the annotations of these genes were based only on sequence similarity. The
rest of the DE genes were identified by either of the comparisons. The Ig rearranged lambda-
chain mRNA V-region gene was identified only by H-L comparison, suggesting that it may
involve regulation of anti-SRBC titers. Previous studies have shown that Ig genes can influence
antibody response (Butler, 1998; Rees and Nordskog, 1981). In contrast, genes including heat
shock protein 70, purinergic receptor P2Y, heat shock protein 25, lectin-like protein, and a gene
similar to copine VII, were only identified by the A-N comparison. The former 2 genes were

144
previously reported as differentially expressed genes in response to viral infections (Liu et al.,
2001; Ruby et al., 2006; Degen et al., 2006).
In this study, the fold-changes (1.51 to 2.04) of expression of the DE genes were much
smaller than the ratio (9.2) of H to L in mean anti-SRBC titers. This could be explained by
cascade amplification of signaling pathways that involve antibody response to SRBC challenge.
Additionally, the chromosomal locations of all DE genes identified in this study were
partially supported by our previous study (Chapter 5), which also indicated that some of
candidate genes for anti-SRBC were located on chicken chromosomes 1, 15, and 16. One DE
gene, GgaAffx.13005, is about 2 megabase from the candidate marker VTC07, which was
identified using other genomics-based approaches (Chapter 4).
That this study was successful in identification of candidate genes for anti-SRBC
response. However, it was limited by the small numbers of individual birds and arrays used in
this study and by that examination of only one type of lymphoid organ (spleen). Examining more
lymphoid organs (e.g., lymph node and bursa of Fabricius), increasing the number of samples
and microarrays, and increasing time points of examination will increase power for identification
of DE genes and comprehensive understanding of primary antibody response of vertebrates to
SRBC challenge.

145
Table 7.1 Summary of mean anti-SRBC titers for the chickens challenged with SRBC.
Categorya Number of birds Mean ± SDb A 10 7±0.00 L 15 5.17±0.36 H 15 8.37±0.35
All the challenged 142 6.78±0.95 a The birds challenged birds were categorized into average (P), low (L), high (H) groups, and all
the challenged White Leghorn birds. N birds are those not challenged with sheep red blood cells
(SRBC) in the study A, L and H are those showing average, extremely low and high mean anti-
SRBC titers after SRBC challenge, respectively. b The mean anti-SRBC titers has been transformed in log2. SD: standard deviation.

146
Table 7.2 Quality profile of raw data from the microarray experiments.
Array IDa/nb Median Intensityc (unnormalized) P call %d % Array outliere % Single outlierf
N-1/10 153 55.6 1.056 0.327 N-2/10 197 56.3 0.088 0.125 A-1/10 148 57.1 0.864 0.29 A-2/10 196 56.3 0.075 0.115 H1-1/7 155 55.9 0.145 0.142 H1-2/7 158 55.6 0.08 0.123 H2-1/8 180 57 0.182 0.175 H2-2/8 151 59 0.091 0.116 L1-1/7 191 55 0.096 0.118 L1-2/7 163 53.5 0.13 0.141 L2-1/8 188 56.3 0.057 0.093 L2-2/8 172 56.5 0.062 0.088
a Each array was hybridized with pooled RNA sample for each of the groups including non-
challenge (N), average (A), low (L), and high (H). N birds are those not challenged with sheep
red blood cells (SRBC) in the study. A, L and H are those showing average, low and high mean
anti-SRBC titers, respectively. Each pooled RNA sample had technical replicates, which are
indicated by the last digits (1 or 2) in the array identity (ID) numbers. The pooled RNA sample(s)
for each group was made from individual total RNA samples that were extracted from individual
chicken spleen. H and L groups each have 2 pooled samples indicated by the first digits (1 or 2)
in the array identity (ID) numbers. b The number of individual total RNA samples used for making the pooled samples. c The unnormalized median value of fluorescence intensity across each microarray. d The percentage of probe sets called “Present” in an array. A “Present” is assigned using a
Detection p-value, which is evaluated against user-definable cut-offs to determine the Detection
call. The Detection p-value is generated by the Detection algorithm with the use of probe pair
intensities (see Data Analysis Fundamentals, http://www.affymetrix.com/index.affx). e The percentage of probe sets called “Array-outlier” in one array. Array outliers refer to an
unusual probe response pattern in one array, which is different from the probe response pattern
seen in most arrays (http://biosun1.harvard.edu/complab/dchip/manual.htm). f The percentage of “probe pairs” called “Single-outlier” in one array. Single outliers are
identified using absolute residuals. If a data point has its absolute residual exceeding both the
corresponding array-wise residual threshold and the probe-wise residual threshold, it is called as
a single outlier (http://biosun1.harvard.edu/complab/dchip/manual.htm).

147
Table 7.3 Characteristics of genes that were differentially expressed between high (H) and low (L) antibody-producing chickens. Probe set IDa Gene Accession No.b Gene ID Chromosomal location L±SEc H±SEc Fold-Change (Range)d
Gga.2929.1.S1_at IgG H-chain 3'-region (HC86) C part CD737847 CD737847 Unknown 3577.6±156.54 5415.91±162.89 1.51 (1.39~1.65)
Gga.4110.7.S1_s_at Ig rearranged lambda-chain mRNA V-region BM491664 Gga.38 chr15:8,172,126-8,176,698 462.92±97.02 943.94±77.53 2.04 (1.46~3.16)
Gga.9239.1.S1_s_at similar to MHC Rfp-Y class I alpha chain AY257166.1 Gga.9239 chr16:351,719-368,122 1134.18±149.97 2005.32±195.53 1.77 (1.36~2.35)
a Probe set identity on the GeneChip Chicken Genome Arrays (http://www.affymetrix.com/index.affx). b Accession numbers of the differentially expressed genes in GenBank. c Model-based estimate of expression level and standard error (SE) of each transcript in L and H chickens from a commercial White
Leghorn population, using dChip software (http://biosun1.harvard.edu/~cli/dchip2006.exe). d Fold-change is the ratio of the model-based estimate of gene expression level in HAb-producing chickens to that in LAb-producing
chickens. The range of fold-change is defined by 90% confidence bound.

148
Table 7.4 Characteristics of genes that were differentially expressed between non-challenge (N) and average (A) anti-SRBC groups of
chickens. Probe set IDa Gene Accession No.b Gene ID Chromosomal location N±SEc A±SEc Fold-Change (Range)d
GgaAffx.20099.1.S1_at heat shock protein 25 AB154518.1 Gga.985 chr27:4,486,394-4,487,253 737.61±108.7 395.29±42.02 -1.87 (-1.36~-2.49)
Gga.16267.1.S1_at similar to class I alpha chain BU120914 Gga.9260 chr16:291,286-354,282 2145.78±85.02 3286.27±136.24 1.53 (1.39~1.68)
Gga.16267.1.S1_s_at similar to class I alpha chain BU120914 Gga.9260 chr16:291,286-354,282 1373.28±41.71 2184±99.81 1.59 (1.45~1.74)
Gga.4942.1.S1_at heat shock protein 70 BU118554 Gga.4942 chr5:55,409,841-55,412,160 3156.55±102.08 2203±61.72 -1.43 (-1.33~-1.54)
Gga.2929.1.S1_at IgG H-chain 3'-region (HC86) C part CD737847 Gga.2929 unknown 2507.52±212.1 4939.12±57.81 1.97 (1.73~2.29)
Gga.4900.5.S1_at Lectin-like protein BX935608.2 Gga.37935 chr1:16,217-21,161 517.21±67.44 953.18±47.56 1.84 (1.49~2.37)
Gga.9260.1.S1_at similar to class I alpha chain BU201746 Gga.9260 chr16:291,286-354,282 995.82±40.42 1652.43±55.87 1.66 (1.52~1.81)
GgaAffx.13005.1.S1_at purinergic receptor P2Y, G-protein coupled, 8 AJ720902 Gga.19558 chr1:133,187,192-133,213,127 835.2±66.5 473.22±23.84 -1.76 (-1.5~-2.05)
Gga.15701.1.S1_at similar to Copine VII CN224397 Gga.15701 unknown 718.73±29.95 1075.94±43.04 1.5 (1.36~1.65)
a Probe set identity on the GeneChip Chicken Genome Arrays (http://www.affymetrix.com/index.affx). b Accession numbers of the differentially expressed genes in GenBank. c Model-based estimate of expression level and standard error (SE) of each transcript in N and A chickens from a commercial White
Leghorn population, using dChip software (http://biosun1.harvard.edu/~cli/dchip2006.exe). N birds are those not challenged with
sheep red blood cells (SRBC) in the study. A birds are those with average mean anti-SRBC titers. Here, the SEs were estimated from
technical replicates. d Fold-change is the ratio of the model-based estimate of gene expression level in PC chickens to that in NC chickens. The range of
fold-change is defined by 90% confidence bound.

149
Table 7.5 Gene classification test for genes differentially expressed between high (H) and low (L) antibody-producing chickens.
Gene classification (term)a Cluster frequency b Genome frequency of usec p-Valued Genes annotated to the term MHC protein complex (GO) 1:1 17:18040 0.000942 Gga.9239.1.S1_s_at MHC protein, class I (PD) 1:1 32:18220 0.001756 Gga.9239.1.S1_s_at
a Gene classification analysis of the differentially expressed (DE) genes with Gene Ontology (GO) and Protein Domain (PD) terms.
The DE genes used here are those differentially expressed between high (H) and low (L) antibody-producing chickens. b The ratio of the number of the DE genes that are annotated to a gene class term to the number of the DE genes that are annotated to
all gene class terms found by dChip software. c The ratio of the number of genes that are annotated to a gene class term to the number of genes in the database that are annotated to
all gene class terms found by dChip software. The genes used here are retrieved from the annotation CSV file (7/14/06) for the
chicken genome, http://www.affymetrix.com/Auth/analysis/downloads/na22/ivt/Chicken.na22.annot.csv.zip. d The statistical significance for the enrichment of the DE genes assessed by gene classification test with either GO or PD term.

150
Table 7.6 Gene class test of the genes differentially expressed between non-challenge (N) and
average anti-SRBC (A) groups of chickens
Gene Classification (term)a Cluster frequencyb
Genome frequency of usec p-Valued Genes annotated
to the term GgaAffx.20099.1.S1_at cell fraction (GO) 2:5 68:18040 0.000139
Gga.4942.1.S1_at immunological synapse (GO) 1:5 17:18040 0.004703 Gga.9260.1.S1_at
Gga.4900.5.S1_at sugar binding (GO) 2:5 133:18040 0.000532 Gga.9260.1.S1_at
GgaAffx.20099.1.S1_at soluble fraction (GO) 2: 5 19:18040 0.00001 Gga.4942.1.S1_at
GgaAffx.20099.1.S1_at protein folding (GO) 2: 5 155:18040 0.000721 Gga.4942.1.S1_at
GgaAffx.20099.1.S1_at Gga.4942.1.S1_at response to stress (GO) 3: 5 274:18040 0.000034
GgaAffx.13005.1.S1_at immune response (GO) 1: 5 158:18040 0.043036 Gga.9260.1.S1_at
GgaAffx.20099.1.S1_at response to unfolded protein (GO) 2: 5 20:18040 0.000012 Gga.4942.1.S1_at
GgaAffx.20099.1.S1_at response to biotic stimulus (GO) 2: 5 58:18040 0.000101 Gga.4942.1.S1_at
GgaAffx.20099.1.S1_at response to abiotic stimulus (GO) 2: 5 17:18040 0.000008 Gga.4942.1.S1_at Gga.4900.5.S1_at carbohydrate binding (GO) 2: 5 181:18040 0.000981 Gga.9260.1.S1_at
GgaAffx.20099.1.S1_at response to chemical stimulus (GO) 2: 5 73:18040 0.00016 Gga.4942.1.S1_at
GgaAffx.20099.1.S1_at Gga.4942.1.S1_at response to stimulus (GO) 3: 5 389:18040 0.000096
GgaAffx.13005.1.S1_at GgaAffx.20099.1.S1_at response to protein stimulus (GO) 2: 5 20:18040 0.000012
Gga.4942.1.S1_at Glycoside hydrolase, family 31 (PD) 1:6 26:18220 0.008533 Gga.9260.1.S1_at
Heat shock protein Hsp70 (PD) 1:6 27:18220 0.00886 Gga.4942.1.S1_at Gga.16267.1.S1_s_at MHC protein, class I (PD) 2:6 32:18220 0.000045
Gga.9260.1.S1_at Peptidase M1, membrane alanine
aminopeptidase (PD) 1:6 29:18220 0.009513 Gga.9260.1.S1_at
Heat shock protein Hsp20 (PD) 1:6 14:18220 0.004602 GgaAffx.20099.1.S1_at Gga.16267.1.S1_s_at Immunoglobulin-like (PD) 2:6 770:18220 0.023888 Gga.9260.1.S1_at
Copine (PD) 1:6 18:18220 0.005914 Gga.15701.1.S1_at
a Gene classification analysis of the differentially expressed (DE) genes with Gene Ontology
(GO) and Protein Domain (PD) terms. The DE genes are those differentially expressed between
(N) and (A) groups of chickens.

151
b The ratio of the number of the DE genes that are annotated to a gene class term to the number
of the DE genes that are annotated to all gene class terms found by dChip software. c The ratio of the number of genes that are annotated to a gene class term to the number of genes
in the database that are annotated to all gene class terms found by dChip software. The genes
used here are retrieved from the annotation CSV file (7/14/06) for the chicken genome,
http://www.affymetrix.com/Auth/analysis/downloads/na22/ivt/Chicken.na22.annot.csv.zip. d The statistical significance for the enrichment of the DE genes assessed by gene classification test with either GO or PD term

152
OVERALL SUMMARY
In this dissertation research, multiple resources have been developed for defining the
molecular basis of antibody response in chickens. These resources include the resource
population that consists of the divergently selected lines and crosses derived from them,
candidate markers identified by RAPD and SCAR analyses, line-specific SNPs identified by
microarray-based SNP analysis, and candidate genes identified by microarray-based gene
expression analysis.
In the resource population, large phenotypic divergence in the selected lines suggested
that selection has caused differentiation of allele frequencies at QTLs associated with anti-SRBC
response in the lines. This inference was initially supported by the analysis of 3 candidate
markers that were associated with antibody titers to S. enterica, and was further supported by the
RAPD and SCAR analyses and microarray-based SNP analysis.
Using the divergently selected lines, 6 out of 555 random primers were revealed by
RAPD analysis to amplify line-specific RAPD fragments, and 57 line-specific SNPs identified
by microarray-based SNP analysis were primarily on chicken chromosomes 1 (8 SNPs), 2 (9), 4
(6), 15 (4), 16 (4) and Z (11) were. Seven SCAR markers converted from line-specific RAPD
fragments, which were amplified by 4 random primers, were evaluated for their associations with
anti-SRBC response in both the divergently selected lines and the backcross population using
SNPs identified in the markers and flanking regions. The allele frequency of each of the 7 SCAR
markers were significantly different (p<0.0025) between the parental lines, and two of which
were also significantly (p<0.05) associated with anti-SRBC in the backcross population. Their
chromosomal locations were genetically and physically mapped and used for identifying immune
response-related genes. Eighteen immune response-related genes were near the SCAR markers

153
(<2.5 Mb). Moreover, 6 of the SCAR markers were shown to be near (<2 Mb) the line-specific
SNPs that were identified by the microarray-based SNP analysis. In addition, PCR-RFLP
methods were developed for genotyping one informative SNP within each of 6 SCAR markers.
Using these methods, the allele frequency distributions of the informative SNPs were evaluated
in other 7 chicken populations that were not directly selected for antibody response. The results
from the PCR-RFLP analysis suggested that the significant difference in allele frequency of each
SCAR marker between the selected lines was probably not due to genetic drift.
In the microarray-based gene expression analysis, 3 genes were differentially expressed
between chickens identified as high and low anti-SRBC response, and 7 differentially expressed
genes, with Gga.2929 overlapping with the former, were identified between chickens challenged
and non-challenged with SRBC. Among these genes, Gga.Affy.13005 (Purinergic receptor P2Y)
was close (about 2 Mb) to the SCAR marker VTC07 that was identified by RAPD and SCAR
analyses. The chromosomal locations of the differentially expressed genes were on chromosomes
1, 5, 15, 16 and 27, which was partially consistent with the microarray-based SNP analysis.
This dissertation research is resource-driven, although it is based on the hypothesis that
difference among chickens for anti-SRBC titers is polygenic. Candidate markers including SNPs
and differentially expressed genes identified in the dissertation research may provide a resource
for future study of the molecular basis of antibody response to pathogens. However, the
dissertation research was limited in some aspects. First, the number of individuals from
backcross population used for the SCAR-QTL analysis was small. Second, the number of
chickens and the SNP typing capacity of the Illumina microrray (about 1 SNP per 400 kb of
chicken genome) were limited in the microarray-based SNP-QTL analysis. Last, only one type of

154
lymphoid organ was examined, the number of samples analyzed was small, and the result has not
yet confirmed by quantitative RT-PCR, in the microarray-based expression QTL analysis.
In the future, the dissertation research could be further deepened and enhanced by the
following work. First, QTLs underlying anti-SRBC response could be identified through fine-
mapping approaches. Second, quantitative RT-PCR could be used to validate the expression
levels of the differentially expressed genes identified by microarray-based expression QTL
analysis. Third, more differentially expressed genes associated with anti-SRBC response could
be identified by increasing sample size and examining additional lymphoid organs (e.g., bursa of
Fabricius and lymphoid nodule). Last, candidate markers could be validated in other chicken
populations.
155
LITERATURE CITED
Abbott C.M., Skidmore C.J., Searle A.G. & Peters J. (1986) Deficiency of adenosine deaminase in the wasted mouse. Proc Natl Acad Sci U S A, 83, 693-5
Accolla R.S. (2006) Host defense mechanisms against pathogens. Surg Infect (Larchmt), 7 Suppl
2, S5-7 Agriculture P.R.C.D.O. (2005) Annual report of Chinese agricultural progress 2005. Government
Printing Office, Peking Agriculture P.R.C.D.O. (2005) Chinese Agricultural Annual 2005. Government Printing Office,
Peking. Agriculture U.S.D.O. (2006) Agricultural Statistics 2006. Government Printing Office,
Washington, D.C. Allison D.B., Gadbury G.L., Heo M., Fernández J., Lee K.-C., Prolla T.A. & Weindruch R.
(2002) A mixture model approach for the analysis of microarray gene expression data. Comput. Stat. Data Analysis 39, 1-20
Altman N. (2005) Replication, variation and normalisation in microarray experiments. Appl
Bioinformatics, 4, 33-44 Andersson L. & Georges M. (2004) Domestic-animal genomics: deciphering the genetics of
complex traits. Nat Rev Genet, 5, 202-12 Aruffo A., Farrington M., Hollenbaugh D., Li X., Milatovich A., Nonoyama S., Bajorath J.,
Grosmaire L.S., Stenkamp R. & Neubauer M. (1993) The CD40 ligand, gp39, is defective in activated T cells from patients with X-linked hyper-IgM syndrome. Cell, 72, 291-300
Ashton-Rickardt P.G. (2005) The granule pathway of programmed cell death. Crit Rev Immunol,
25, 161-82 Bacon L.D., Hunt H.D. & Cheng H.H. (2000) A review of the development of chicken lines to
resolve genes determining resistance to diseases. Poult Sci, 79, 1082-93 Bailey D.W. (1981) Recombinant inbred strains and bilineal congenic strains. in: The Mouse in
Biomedical Research, edited by Foster H.L., Small J.D. & Fox J. G. Academic Press, New York.
Bajaj-Elliott, M. & M. Turner (2005). Innate immunity in health and disease." Mol Immunol, 42:
857-8.

156
Balazs M., Martin F., Zhou T. & Kearney J. (2002) Blood dendritic cells interact with splenic marginal zone B cells to initiate T-independent immune responses. Immunity, 17, 341-52
Banchereau J., Briere F., Caux C., Davoust J., Lebecque S., Liu Y.J., Pulendran B. & Palucka K.
(2000) Immunobiology of dendritic cells. Annu Rev Immunol, 18, 767-811 Bartlett J., Jones C.P. & Smith E.J. (1996) Linkage analysis among EV1, O and P loci in
chickens. J Hered, 86, 67-70 Barton G.M. & Medzhitov R. (2002) Toll-like receptors and their ligands. Curr Top Microbiol
Immunol, 270, 81-92 Baumgarth N., Herman O.C., Jager G.C., Brown L.E., Herzenberg L.A. & Chen J. (2000) B-1
and B-2 cell-derived immunoglobulin M antibodies are nonredundant components of the protective response to influenza virus infection. J Exp Med, 192, 271-80
Becker C., Wirtz S. & Neurath M.F. (2005) Stepwise regulation of TH1 responses in
autoimmunity: IL-12-related cytokines and their receptors. Inflamm Bowel Dis, 11, 755-64
Benjamini Y., Drai D., Elmer G., Kafkafi N. & Golani I. (2001) Controlling the false discovery
rate in behavior genetics research. Behav Brain Res, 125, 279-84 Benjamini Y. & Hochberg Y. (1995) Controlling the False Discovery Rate: a practical and
powerful approach to multiple testing. Journal of the Royal Statistical Society, 57, 289-300
Benjamini Y. & Yekutieli D. (2005) Quantitative trait Loci analysis using the false discovery
rate. Genetics, 171, 783-90 Berek, C. (1989) Molecular dissection of an antigen-specific immune response. J Autoimmun,
Suppl: 195-201 Berenson L.S., Ota N. & Murphy K.M. (2004) Issues in T-helper 1 development--resolved and
unresolved. Immunol Rev, 202, 157-74 Bernard A., Coitot S., Bremont A. & Bernard G. (2005) T and B cell cooperation: a dance of life
and death. Transplantation, 79, S8-S11 Biozzi G., Mouton D., Heumann A.M., Bouthillier Y., Stiffel C. & Mevel J.C. (1979) Genetic
analysis of antibody responsiveness to sheep erythrocytes in crosses between lines of mice selected for high or low antibody synthesis. Immunology, 36, 427-38
Biozzi G., Stiffel C., Mouton D., Bouthillier Y. & Decreusefond C. (1972) Cytodynamics of the
immune response in two lines of mice genetically selected for "high" and "low" antibody synthesis. J Exp Med, 135, 1071-94

157
Bitgood J.J. & Somes R.G.J. (1993) Genetic Maps, edited by O' Brien, S.J. Cold Spring Harbor
Laboratory Press. Blanco P., Viallard J.F., Pellegrin J.L. & Moreau J.F. (2005) Cytotoxic T lymphocytes and
autoimmunity. Curr Opin Rheumatol, 17, 731-4 Bleackley R.C. (2005) A molecular view of cytotoxic T lymphocyte induced killing. Biochem
Cell Biol, 83, 747-51 Blouin M.S., Parsons M., Lacaille V. & Lotz S. (1996) Use of microsatellite loci to classify
individuals by relatedness. Mol Ecol, 5, 393-401 Blumenthal M. (2004) The immunopathology and genetics of asthma. Minn Med, 87, 53-6 Boa-Amponsem K., Dunnington E.A. & Siegel P.B. (1997) Antibody transmitting ability of hens
from lines of chickens differing in response to SRBC antigen. Br Poult Sci, 38, 480-4 Boa-Amponsem K., Dunnington E.A. & Siegel P.B. (1997) Genetic architecture of antibody
response of chickens to sheep red blood cells. J Anim Breed Genet, 114, 443-8 Boa-Amponsem K., Dunnington E.A. & Siegel P.B. (1998) Diet and humoral responsiveness of
lines of chickens divergently selected for antibody response to sheep red blood cells. Avian Dis, 42, 565-71
Boa-Amponsem K., Larsen C.T., Dunnington E.A., Price S.E., Yang A. & Siegel P.B. (1998)
Mode of inheritance of unselected traits in lines of chickens selected for high or low antibody response to sheep red blood cells. 1. Resistance to marble spleen disease virus and juvenile body weight. Poult Sci, 77, 1073-80
Boes M., Prodeus A.P., Schmidt T., Carroll M.C. & Chen J. (1998) A critical role of natural
immunoglobulin M in immediate defense against systemic bacterial infection. J Exp Med, 188, 2381-6
Botstein D., White R.L., Skolnick M. & Davis R.W. (1980) Construction of a genetic linkage
map in man using restriction fragment length polymorphisms. Am J Hum Genet, 32, 314-31
Briles W.E., Goto R.M., Auffray C. & Miller M.M. (1993) A polymorphic system related to but
genetically independent of the chicken major histocompatibility complex. Immunogenetics, 37, 408-14
Brode S. & Macary P.A. (2004) Cross-presentation: dendritic cells and macrophages bite off
more than they can chew! Immunology, 112, 345-51 Broman K.W. (2005) The genomes of recombinant inbred lines. Genetics, 169, 1133-46

158
Brouwer D.J. & St Clair D.A. (2004) Fine mapping of three quantitative trait loci for late blight
resistance in tomato using near isogenic lines (NILs) and sub-NILs. Theor Appl Genet, 108, 628-38
Brown J.S., Kuhn D., Wisser R., Power E. & Schnell R. (2004) Quantification of sources of
variation and accuracy of sequence discrimination in a replicated microarray experiment. Biotechniques, 36, 324-32
Brunner, M., S. Larsen, et al. (1995). Altered Th1/Th2 balance associated with the
immunosuppressive/protective effect of the H-2Ab allele on the response to allo-4-hydroxyphenylpyruvate dioxygenase. Eur J Immunol, 25: 3285-9
Budhraja V., Spitznagel E., Schaiff W.T. & Sadovsky Y. (2003) Incorporation of gene-specific
variability improves expression analysis using high-density DNA microarrays. BMC Biol, 1, 1
Bumstead N. (1998) Genetic resistance to avian viruses. Rev Sci Tech, 17, 249-55 Bunger L., Laidlaw A., Bulfield G., Eisen E.J., Medrano J.F., Bradford G.E., Pirchner F., Renne
U., Schlote W. & Hill W.G. (2001) Inbred lines of mice derived from long-term growth selected lines: unique resources for mapping growth genes. Mamm Genome, 12, 678-86
Burt D.W. (2004) Application of biotechnology in the poultry industry. World Poult Sci J, 58, 5-
14 Butler J.E. (1998) Immunoglobulin diversity, B-cell and antibody repertoire development in
large farm animals. Rev Sci Tech, 17, 43-70 Caballero A., Keightley P.D. & Hill W.G. (1995) Accumulation of mutations affecting body
weight in inbred mouse lines. Genet Res, 65, 145-9 Caron L.A., Abplanalp H. & Taylor R.L., Jr. (1997) Resistance, susceptibility, and immunity to
Eimeria tenella in major histocompatibility (B) complex congenic lines. Poult Sci, 76, 677-82
Carr, L. G. & Kimpel M. W. (2007) Identification of Candidate Genes for Alcohol Preference by
Expression Profiling of Congenic Rat Strains. Alcohol Clin Exp Res. Carter R.H. & Fearon D.T. (1992) CD19: lowering the threshold for antigen receptor stimulation
of B lymphocytes. Science, 256, 105-7 Cartron J.P., Bailly P., Le Van Kim G., Cherif-Zahar B., Matassi G., Bertrand O. & Colin Y.
(1998) Insights into the structure and function of membrane polypeptides carrying blood group antigens. Vox Sang., 74, 29-64

159
Chapco W., Ashton N.W., Martel R.K., Antonishyn N. & Crosby W.L. (1992) A feasibility study of the use of random amplified polymorphic DNA in the population genetics and systematics of grasshoppers. Genome, 35, 569-74
Chasis J.A. & Mohandas N. (1992) Red blood cell glycophorins. Blood, 80, 1869-79 Chasman D. & Adams R.M. (2001) Predicting the functional consequences of non-synonymous
single nucleotide polymorphisms: structure-based assessment of amino acid variation. J Mol Biol, 307, 683-706
Chen H. & Leibenguth F. (1995) Studies on multilocus fingerprints, RAPD markers, and
mitochondrial DNA of a gynogenetic fish (Carassius auratus gibelio). Biochem Genet, 33, 297-306
Chen J.J., Delongchamp R.R., Tsai C.A., Hsueh H.M., Sistare F., Thompson K.L., Desai V.G. &
Fuscoe J.C. (2004) Analysis of variance components in gene expression data. Bioinformatics, 20, 1436-46
Chen, J. J. (2007) Key aspects of analyzing microarray gene-expression data. Pharmacogenomics,
8, 473-82. Chen L., Goryachev A., Sun J., Kim P., Zhang H., Phillips M.J., Macgregor P., Lebel S.,
Edwards A.M., Cao Q. & Furuya K.N. (2003) Altered expression of genes involved in hepatic morphogenesis and fibrogenesis are identified by cDNA microarray analysis in biliary atresia. Hepatology, 38, 567-76
Chen L. & Storey J.D. (2006) Relaxed significance criteria for linkage analysis. Genetics, 173,
2371-81 Cheng H.H., Levin I., Vallejo R.L., Khatib H., Dodgson J.B., Crittenden L.B. & Hillel J. (1995)
Development of a genetic map of the chicken with markers of high utility. Poult Sci, 74, 1855-74
Chen, W. Y. & Shi Y. Y. (2004) Case-control study and transmission disequilibrium test
provide consistent evidence for association between schizophrenia and genetic variation in the 22q11 gene ZDHHC8. Hum Mol Genet, 13, 2991-5.
Churchill G.A. (2002) Fundamentals of experimental design for cDNA microarrays. Nat Genet,
32 Suppl, 490-5 Coelho A.L., Hogaboam C.M. & Kunkel S.L. (2005) Chemokines provide the sustained
inflammatory bridge between innate and acquired immunity. Cytokine Growth Factor Rev, 16, 553-60

160
Colditz I.G., Watson D.L., Gray G.D. & Eady S.J. (1996) Some relationships between age, immune responsiveness and resistance to parasites in ruminants. Int J Parasitol, 26, 869-77
Cole, R. K. (1966) Hereditary hypothyroidism in the domestic fowl. Genetics, 53, 1021-33 Cole, R. K. & Kite, J. H. (1968) Hereditary autoimmune thyroiditis in the fowl. Science, 160,
1357-8 Cole D.K. & Gao G.F. (2004) CD8: adhesion molecule, co-receptor and immuno-modulator.
Cell Mol Immunol, 1, 81-8 Collard B.C.Y., Jahufer M.Z.Z., Brouwer J.B. & Pang E.C.K. (1998) An introduction to markers,
quantitative trait loci (QTL) mapping and marker-assisted selection for crop improvement: The basic concepts. Euphytica, 142, 169-96
Collins F.S., Guyer M.S. & Charkravarti A. (1997) Variations on a theme: cataloging human
DNA sequence variation. Science, 278, 1580-1 Conley, Y. P & Thalamuthu A. (2005) Candidate gene analysis suggests a role for fatty acid
biosynthesis and regulation of the complement system in the etiology of age-related maculopathy. Hum Mol Genet, 14, 1991-2002.
Cooper M.D., Raymond D.A., Peterson R.D., South M.A. & Good R.A. (1966) The functions of
the thymus system and the bursa system in the chicken. J Exp Med, 123, 75-102 Copeland N.G., Gilbert D.J., Jenkins N.A., Nadeau J.H., Eppig J.T., Maltais L.J., Miller J.C.,
Dietrich W.F., Steen R.G. & Lincoln S.E. (1993a) Genome maps IV 1993. Wall chart. Science, 262, 67-82
Copeland N.G., Jenkins N.A., Gilbert D.J., Eppig J.T., Maltais L.J., Miller J.C., Dietrich W.F.,
Weaver A., Lincoln S.E. & Steen R.G. (1993b) A genetic linkage map of the mouse: current applications and future prospects. Science, 262, 57-66
Corthay A. (2006) A three-cell model for activation of naive T helper cells. Scand J Immunol, 64,
93-6 Cotter P.F., Taylor R.L., Jr. & Abplanalp H. (1992) Differential resistance to Staphylococcus
aureus challenge in major histocompatibility (B) complex congenic lines. Poult Sci, 71, 1873-8
Crawford A.M., Paterson K.A., Dodds K.G., Diez Tascon C., Williamson P.A., Roberts
Thomson M., Bisset S.A., Beattie A.E., Greer G.J., Green R.S., Wheeler R., Shaw R.J., Knowler K. & McEwan J.C. (2006) Discovery of quantitative trait loci for resistance to parasitic nematode infection in sheep: I. Analysis of outcross pedigrees. BMC Genomics, 7, 178

161
Crittende L.B., Provencher L., Santangelo L., Levin I., Abplanalp H., Briles R., Briles W. &
Dodgson J.B. (1993) Characterization of a red jungle fowl by white leghorn reference population for a molecular mapping of the chicken genome. Poult Sci, 72, 334-48
Dalmasso C., Broet P. & Moreau T. (2005) A simple procedure for estimating the false
discovery rate. Bioinformatics, 21, 660-8 Dalma-Weiszhausz D.D., Warrington J., Tanimoto E.Y. & Miyada C.G. (2006) The affymetrix
GeneChip platform: an overview. Methods Enzymol, 410, 3-28 Darvasi A. & Soller M. (1992) Selective genotyping for de- termination of linkage between a
marker locus and a quanti- tative trait locus. Theor Appl Genet, 85, 353-59 Darvasi A. & Soller M. (1994) Selective DNA pooling for determination of linkage between a
molecular marker and a quantitative trait locus. Genetics, 138, 1365-73 Darvasi A. & Soller M. (1995) Advanced intercross lines, an experimental population for fine
genetic mapping. Genetics, 141, 1199-207 Darvasi A., Weinreb A., Minke V., Weller J.I. & Soller M. (1993) Detecting marker-QTL
linkage and estimating QTL gene effect and map location using a saturated genetic map. Genetics, 134, 943-51
Darvasi A. & Weller J.I. (1992) On the use of the moments method of estimation to obtain
approximate maximum likelihood estimates of linkage between a genetic marker and a quantitative locus. Heredity, 68, 43-6
Datta S. & Datta S. (2005) Empirical Bayes screening of many p-values with applications to
microarray studies. Bioinformatics, 21, 1987-94 Dawson E. (1999) SNP maps: more markers needed? Mol Med Today, 5, 419-20 de Buhr M.F., Mahler M., Geffers R., Hansen W., Westendorf A.M., Lauber J., Buer J.,
Schlegelberger B., Hedrich H.J. & Bleich A. (2006) Cd14, Gbp1, and Pla2g2a: three major candidate genes for experimental IBD identified by combining QTL and microarray analyses. Physiol Genomics, 25, 426-34
Degen, W. G. & Smith J. (2006) Molecular immunophenotyping of lungs and spleens in naive
and vaccinated chickens early after pulmonary avian influenza A (H9N2) virus infection. Vaccine, 24, 6096-109.
Deng, H. W. & W. M. Chen (2001). The power of the transmission disequilibrium test (TDT)
with both case-parent and control-parent trios. Genet Res, 78: 289-302.

162
Der S.D., Zhou A., Williams B.R. & Silverman R.H. (1998) Identification of genes differentially regulated by interferon alpha, beta, or gamma using oligonucleotide arrays. Proc Natl Acad Sci U S A, 95, 15623-8
Devlin, B. and N. Risch (1995). A comparison of linkage disequilibrium measures for fine-scale
mapping. Genomics, 29: 311-22. Dhabhar F.S. (2002) Stress-induced augmentation of immune function--the role of stress
hormones, leukocyte trafficking, and cytokines. Brain Behav Immun, 16, 785-98 Diez-Tascon C., Bayon Y., Arranz J.J., De La Fuente F. & San Primitivo F. (2001) Mapping
quantitative trait loci for milk production traits on ovine chromosome 6. J Dairy Res, 68, 389-97
Do K.A., Mueller P. & Tang F. (2005) A nonparametric Bayesian mixture model for gene
expression. J R Stat Soc Ser, 54, 1-18 Dodgson J.B., Cheng H.H. & Okimoto R. (1997) DNA marker technology: a revolution in
animal genetics. Poult Sci, 76, 1108-14 Doria G. & Frasca D. (1997) Genes, immunity, and senescence: looking for a link. Immunol Rev,
160, 159-70 Doria G. & Frasca D. (2000) Genetic factors in immunity and aging. Vaccine, 18, 1591-5 Draghici S. (2002) Statistical intelligence: effective analysis of high-density microarray data.
Drug Discov Today, 7, S55-63 Dukor P., Bianco C. & Nussenzweig V. (1971) Bone marrow origin of complement-receptor
lymphocytes. Eur J Immunol, 1, 491-4 Dumur C.I., Nasim S., Best A.M., Archer K.J., Ladd A.C., Mas V.R., Wilkinson D.S., Garrett
C.T. & Ferreira-Gonzalez A. (2004) Evaluation of quality-control criteria for microarray gene expression analysis. Clin Chem, 50, 1994-2002
Dunnington E.A., Briles R.W., Briles W.E., Gross W.B. & Siegel P.B. (1984) Allelic frequencies
in eight alloantigen systems of chickens selected for high and low antibody response to sheep red blood cells. Poult Sci, 63, 1470-2
Dunnington E.A., Briles W.E., Briles R.W. & Siegel P.B. (1996) Immunoresponsiveness in
chickens: association of antibody production and the B system of the major histocompatibility complex. Poult Sci, 75, 1156-60
Dupin, E., C. Ziller, et al. (1998). The avian embryo as a model in developmental studies:
chimeras and in vitro clonal analysis. Curr Top Dev Biol, 36, 1-35.

163
Duret, L. (2002) Evolution of synonymous codon usage in metazoans. Curr Opin Genet Dev, 12,
640-9. Eisen M.B., Spellman P.T., Brown P.O. & Botstein D. (1998) Cluster analysis and display of
genome-wide expression patterns. Proc Natl Acad Sci U S A, 95, 14863-8 Epstein J., Eichbaum Q., Sheriff S. & Ezekowitz R.A. (1996) The collectins in innate immunity.
Curr Opin Immunol, 8, 29-35 Erf G.F. (2004) Cell-mediated immunity in poultry. Poult Sci, 83, 580-90 Essex, M. (1997) The human immunodeficiency virus (HIV) as a newly evolving pathogen.
Southeast Asian J Trop Med Public Health, Suppl 2, 127-30. Fang Y., Xu C., Fu Y.X., Holers V.M. & Molina H. (1998) Expression of complement receptors
1 and 2 on follicular dendritic cells is necessary for the generation of a strong antigen-specific IgG response. J Immunol, 160, 5273-9
Faurschou M. & Borregaard N. (2003) Neutrophil granules and secretory vesicles in
inflammation. Microbes Infect, 5, 1317-27 Fearon D.T. & Carroll M.C. (2000) Regulation of B lymphocyte responses to foreign and self-
antigens by the CD19/CD21 complex. Annu Rev Immunol, 18, 393-422 Feder J.N., Gnirke A., Thomas W., Tsuchihashi Z., Ruddy D.A., Basava A., Dormishian F.,
Domingo R., Jr., Ellis M.C., Fullan A., Hinton L.M., Jones N.L., Kimmel B.E., Kronmal G.S., Lauer P., Lee V.K., Loeb D.B., Mapa F.A., McClelland E., Meyer N.C., Mintier G.A., Moeller N., Moore T., Morikang E., Prass C.E., Quintana L., Starnes S.M., Schatzman R.C., Brunke K.J., Drayna D.T., Risch N.J., Bacon B.R. & Wolff R.K. (1996) A novel MHC class I-like gene is mutated in patients with hereditary haemochromatosis. Nat Genet, 13, 399-408
Feingold N., Feingold J., Mouton D., Bouthillier Y., Stiffel C. & Biozzi G. (1976) Polygenic
regulation of antibody synthesis to sheep erythrocytes in the mouse: a genetic analysis. Eur J Immunol, 6, 43-51
Ferreira M.A. (2004) Linkage analysis: principles and methods for the analysis of human
quantitative traits. Twin Res, 7, 513-30 Finkelman F.D., Shea-Donohue T., Goldhill J., Sullivan C.A., Morris S.C., Madden K.B., Gause
W.C. & Urban J.F., Jr. (1997) Cytokine regulation of host defense against parasitic gastrointestinal nematodes: lessons from studies with rodent models. Annu Rev Immunol, 15, 505-33

164
Fleck, F. (2004) Avian flu virus could evolve into dangerous human pathogen, experts fear. Bull World Health Organ, 82, 236-7.
Fodor S.P., Rava R.P., Huang X.C., Pease A.C., Holmes C.P. & Adams C.L. (1993) Multiplexed
biochemical assays with biological chips. Nature, 364, 555-6 Freking B.A., Murphy S.K., Wylie A.A., Rhodes S.J., Keele J.W., Leymaster K.A., Jirtle R.L. &
Smith T.P. (2002) Identification of the single base change causing the callipyge muscle hypertrophy phenotype, the only known example of polar overdominance in mammals. Genome Res, 12, 1496-506
Fukuda M. (1993) Molecular genetics of the glycophorin A gene cluster. Semin Hematol, 30,
138-51 Gasch A.P., Spellman P.T., Kao C.M., Carmel-Harel O., Eisen M.B., Storz G., Botstein D. &
Brown P.O. (2000) Genomic expression programs in the response of yeast cells to environmental changes. Mol Biol Cell, 11, 4241-57
Gasser D.L. & Shreffler D.C. (1974) Genetic control of the immune response in mice. V. Minor
genes involved in the response to H-Y and Ea-I antigens. Immunogenetics, 1, 133 Gavora J.S. & Spencer J.L. (1979) Studies on genetic resistance of chickens to Marek's disease--
a review. Comp Immunol Microbiol Infect Dis, 2, 359-71 Georges M., Charlier C. & Cockett N. (2003) The callipyge locus: evidence for the trans
interaction of reciprocally imprinted genes. Trends Genet, 19, 248-52 George, J. & L. Claflin (1992) Selection of B cell clones and memory B cells. Semin Immunol, 4,
11-7. Georges M., Nielsen D., Mackinnon M., Mishra A., Okimoto R., Pasquino A.T., Sargeant L.S.,
Sorensen A., Steele M.R. & Zhao X. (1995) Mapping quantitative trait loci controlling milk production in dairy cattle by exploiting progeny testing. Genetics, 139, 907-20
Golub T.R., Slonim D.K., Tamayo P., Huard C., Gaasenbeek M., Mesirov J.P., Coller H., Loh
M.L., Downing J.R., Caligiuri M.A., Bloomfield C.D. & Lander E.S. (1999) Molecular classification of cancer: class discovery and class prediction by gene expression monitoring. Science, 286, 531-7
Goodnight C.J. (1988) Epistasis and the effect of founder events on the additive genetic variance.
Evolution, 42, 441-54 Gordon D., Abajian C. & Green P. (1998) Consed: a graphical tool for sequence finishing.
Genome Res, 8, 195-202

165
Gossage D.L., Norby-Slycord C.J., Hershfield M.S. & Markert M.L. (1993) A homozygous 5 base-pair deletion in exon 10 of the adenosine deaminase (ADA) gene in a child with severe combined immunodeficiency and very low levels of ADA mRNA and protein. Hum Mol Genet, 2, 1493-4
Groenen M.A., Cheng H.H., Bumstead N., Benkel B.F., Briles W.E., Burke T., Burt D.W.,
Crittenden L.B., Dodgson J., Hillel J., Lamont S., de Leon A.P., Soller M., Takahashi H. & Vignal A. (2000) A consensus linkage map of the chicken genome. Genome Res, 10, 137-47
Groothuis T.A. & Neefjes J. (2005) The many roads to cross-presentation. J Exp Med, 202,
1313-8 Gross W.B., Siegel P.B. & Pierson E.W. (2002) Effects of genetic selection for high or low
antibody response on resistance to a variety of disease challenges and the relationship of resource allocation. Avian Dis, 46, 1007-10
Gross W.G., Siegel P.B., Hall R.W., Domermuth C.H. & DuBoise R.T. (1980) Production and
persistence of antibodies in chickens to sheep erythrocytes. 2. Resistance to infectious diseases. Poult Sci, 59, 205-10
Gu W., Acland G.M., Langston A.A., Ostrander E.A., Aguirre G.D. & Ray K. (1998)
Identification of a RAPD marker linked to progressive rod-cone degeneration in dogs. Mamm Genome, 9, 740-4
Guermonprez P., Valladeau J., Zitvogel L., Thery C. & Amigorena S. (2002) Antigen
presentation and T cell stimulation by dendritic cells. Annu Rev Immunol, 20, 621-67 Guillot J.F., Beaumont C., Bellatif F., Mouline C., Lantier F., Colin P. & Protais J. (1995)
Comparison of resistance of various poultry lines to infection by Salmonella enteritidis. Vet Res, 26, 81-6
Gupta P.K. (2002) Molecular markers and QTL analysis in crop plants. Current Science, 83,
113-4 Hackett C.J. (2003) Innate immune activation as a broad-spectrum biodefense strategy: prospects
and research challenges. J Allergy Clin Immunol, 112, 686-94 Hakak Y., Walker J.R., Li C., Wong W.H., Davis K.L., Buxbaum J.D., Haroutunian V. &
Fienberg A.A. (2001) Genome-wide expression analysis reveals dysregulation of myelination-related genes in chronic schizophrenia. Proc Natl Acad Sci U S A, 98, 4746-51
Haley C.S. & Knott S.A. (1992) A simple regression method for mapping quantitative trait loci
in line crosses using flanking markers. Heredity, 69, 315-24

166
Hardiman G. (2004) Microarray platforms--comparisons and contrasts. Pharmacogenomics, 5, 487-502
Harnett M.M., Katz E. & Ford C.A. (2005) Differential signalling during B-cell maturation.
Immunol Lett, 98, 33-44 Harris S.A. (1999) RAPDs in systematics - a useful methodology? in: Molecular Systematics,
Plant and Evolution, edited by Hollingsworth, P.M., Bateman, R.M., Gornall, R.J. Taylor and Francis, London.
Hastbacka J., de la Chapelle A., Kaitila I., Sistonen P., Weaver A. & Lander E. (1992) Linkage
disequilibrium mapping in isolated founder populations: diastrophic dysplasia in Finland. Nat Genet, 2, 204-11
Hayes B.J., Visscher P.M., McPartlan H.C. & Goddard M.E. (2003) Novel multilocus measure
of linkage disequilibrium to estimate past effective population size. Genome Res, 13, 635-43
Hull, K. L. & S. Harvey (1999) Growth hormone resistance: clinical states and animal models. J
Endocrinol, 163, 165-72. Heath W.R., Belz G.T., Behrens G.M., Smith C.M., Forehan S.P., Parish I.A., Davey G.M.,
Wilson N.S., Carbone F.R. & Villadangos J.A. (2004) Cross-presentation, dendritic cell subsets, and the generation of immunity to cellular antigens. Immunol Rev, 199, 9-26
Hedrick P.W. (2000) Genetics of Population, 2nd ed. Jones and Bartlett. Heller E.D., Leitner G., Friedman A., Uni Z., Gutman M. & Cahaner A. (1992) Immunological
parameters in meat-type chicken lines divergently selected by antibody response to Escherichia coli vaccination. Vet Immunol Immunopathol, 34, 159-72
Hess K., Yang Y., Golech S., Sharov A., Becker K.G. & Weng N.P. (2004) Kinetic assessment
of general gene expression changes during human naive CD4+ T cell activation. Int Immunol, 16, 1711-21
Hiendleder S., Bauersachs S., Boulesteix A., Blum H., Arnold G.J., Frohlich T. & Wolf E. (2005)
Functional genomics: tools for improving farm animal health and welfare. Rev Sci Tech, 24, 355-77
Hoffmann J.A. & Reichhart J.M. (2002) Drosophila innate immunity: an evolutionary
perspective. Nat Immunol, 3, 121-6 Holdsworth S.R., Kitching A.R. & Tipping P.G. (1999) Th1 and Th2 T helper cell subsets affect
patterns of injury and outcomes in glomerulonephritis. Kidney Int, 55, 1198-216

167
Hommel M. & Kyewski B. (2003) Dynamic changes during the immune response in T cell-antigen-presenting cell clusters isolated from lymph nodes. J Exp Med, 197, 269-80
Horvat S., Bunger L., Falconer V.M., Mackay P., Law A., Bulfield G. & Keightley P.D. (2000)
Mapping of obesity QTLs in a cross between mouse lines divergently selected on fat content. Mamm Genome, 11, 2-7
Hsiao A., Worrall D.S., Olefsky J.M. & Subramaniam S. (2004) Variance-modeled posterior
inference of microarray data: detecting gene-expression changes in 3T3-L1 adipocytes. Bioinformatics, 20, 3108-27
Hsueh H.M., Chen J.J. & Kodell R.L. (2003) Comparison of methods for estimating the number
of true null hypotheses in multiplicity testing. J Biopharm Stat, 13, 675-89 Huang S., Qian H.R., Geringer C., Love C., Gelbert L. & Bemis K. (2003) Assessing the
variability in GeneChip data. Am J Pharmacogenomics, 3, 279-90 Hughes C.R., Strassman J.E. & Queller D.C. (1993) Microsatellites and Kinship. Trends in
Ecology and Evolution, 8, 285-8 Hughes T.R., Mao M., Jones A.R., Burchard J., Marton M.J., Shannon K.W., Lefkowitz S.M.,
Ziman M., Schelter J.M., Meyer M.R., Kobayashi S., Davis C., Dai H., He Y.D., Stephaniants S.B., Cavet G., Walker W.L., West A., Coffey E., Shoemaker D.D., Stoughton R., Blanchard A.P., Friend S.H. & Linsley P.S. (2001) Expression profiling using microarrays fabricated by an ink-jet oligonucleotide synthesizer. Nat Biotechnol, 19, 342-7
Hutt F.B. (1949) VI. A tentative chromosome map. in: Genetics of the fowl. McGraw-Hill Book.
Co., Inc., New York. Hutton J.J., Jegga A.G., Kong S., Gupta A., Ebert C., Williams S., Katz J.D. & Aronow B.J.
(2004) Microarray and comparative genomics-based identification of genes and gene regulatory regions of the mouse immune system. BMC Genomics, 5, 82
Ibanez, O. M. & Reis M. S. (1980) Selective breeding of high and low antibody responder lines
of guinea pigs. Immunogenetics, 10, 283. Infante-Duarte C. & Kamradt T. (1999) Th1/Th2 balance in infection. Springer Semin
Immunopathol, 21, 317-38 International Chicken Genome Sequencing Consortium (2004) Sequence and comparative
analysis of the chicken genome provide unique perspectives on vertebrate evolution, Nature, 432:695-716
Isaak A., Prechl J., Gergely J. & Erdei A. (2006) The role of CR2 in autoimmunity.
Autoimmunity, 39, 357-66

168
Jain, S. K. & K. B. Jain (1969) Polymorphism in an inbreeding population under models
involving underdominance. Science, 166, 1294-6. Janeway C.A., Jr. & Medzhitov R. (1999) Lipoproteins take their toll on the host. Curr Biol, 9,
R879-82 Janeway C.A., Travers P., Walport M. & Shlomchik M. (2004) Immunobiology: The immune
system in health and disease. 6th ed., New York, Current Biology Publications. Janeway C.A., Jr. & Medzhitov R. (2002) Innate immune recognition. Annu Rev Immunol, 20,
197-216 Jansen R.C. (1993) Interval mapping of multiple quantitative trait loci. Genetics, 135, 205-11 Jeffreys A.J., Wilson V. & Thein S.L. (1985) Hypervariable 'minisatellite' regions in human
DNA. Nature, 314, 67-73 Jensen J. (1989) Estimation of recombination parameters between a quantitative trait locus (QTL)
and two marker gene loci. Theor. Appl. Genet., 78, 613-18 Jeurissen, S. H. (1991) Structure and function of the chicken spleen. Res Immunol, 142, 352-5. Joe, B. & Letwin N. E. (2005) Transcriptional profiling with a blood pressure QTL interval-
specific oligonucleotide array. Physiol Genomics, 23, 318-26. Johnson G.C., Esposito L., Barratt B.J., Smith A.N., Heward J., Di Genova G., Ueda H., Cordell
H.J., Eaves I.A., Dudbridge F., Twells R.C., Payne F., Hughes W., Nutland S., Stevens H., Carr P., Tuomilehto-Wolf E., Tuomilehto J., Gough S.C., Clayton D.G. & Todd J.A. (2001) Haplotype tagging for the identification of common disease genes. Nat Genet, 29, 233-7
Kadarmideen H.N. & Janss L.L. (2007) Population and systems genetics analyses of cortisol in
pigs divergently selected for stress. Physiol Genomics, 29, 57-65 Kaeppler S.M. (1997) Quantitative trait locus mapping using sets of near-isogenic lines: relative
power comparisons and technical considerations. Theoretical and applied genetics, 95, 384-92
Kaiser M.G., Deeb N. & Lamont S.J. (2002) Microsatellite markers linked to Salmonella
enterica serovar enteritidis vaccine response in young F1 broiler-cross chicks. Poult Sci, 81, 193-201
Kaiser M.G. & Lamont S.J. (2002) Microsatellites linked to Salmonella enterica Serovar
Enteritidis burden in spleen and cecal content of young F1 broiler-cross chicks. Poult Sci, 81, 657-63

169
Kao C.H., Zeng Z.B. & Teasdale R.D. (1999) Multiple interval mapping for quantitative trait
loci. Genetics, 152, 1203-16 Kaplan N.L., Hill W.G. & Weir B.S. (1995) Likelihood methods for locating disease genes in
nonequilibrium populations. Am J Hum Genet, 56, 18-32 Kaufman D.S., Schoon R.A. & Leibson P.J. (1992) Role for major histocompatibility complex
class I in regulating natural killer cell-mediated killing of virus-infected cells. Proc Natl Acad Sci U S A, 89, 8337-41
Kaufman J. & Wallny H.J. (1996) Chicken MHC molecules, disease resistance and the
evolutionary origin of birds. Curr Top Microbiol Immunol, 212, 129-41 Kean R.P., Briles W.E., Cahaner A., Freeman A.E. & Lamont S.J. (1994) Differences in major
histocompatibility complex frequencies after multitrait, divergent selection for immunocompetence. Poult Sci, 73, 7-17
Kean R.P., Cahaner A., Freeman A.E. & Lamont S.J. (1994) Direct and correlated responses to
multitrait, divergent selection for immunocompetence. Poult Sci, 73, 18-32 Keightley P.D. & Bulfield G. (1993) Detection of quantitative trait loci from frequency changes
of marker alleles under selection. Genet Res, 62, 195-203 Kemper C. & Atkinson J.P. (2007) T-cell regulation: with complements from innate immunity.
Nat Rev Immunol, 7, 9-18 Kendziorski C., Irizarry R.A., Chen K.S., Haag J.D. & Gould M.N. (2005) On the utility of
pooling biological samples in microarray experiments. Proc Natl Acad Sci U S A, 102, 4252-7
Kendziorski C.M., Zhang Y., Lan H. & Attie A.D. (2003) The efficiency of pooling mRNA in
microarray experiments. Biostatistics, 4, 465-77 Kerr M.K. (2003) Design considerations for efficient and effective microarray studies.
Biometrics, 59, 822-8 Kestila M., Mannikko M., Holmberg C., Gyapay G., Weissenbach J., Savolainen E.R., Peltonen
L. & Tryggvason K. (1994) Congenital nephrotic syndrome of the Finnish type maps to the long arm of chromosome 19. Am J Hum Genet, 54, 757-64
Keurentjes J.J., Bentsink L., Alonso-Blanco C., Hanhart C.J., Blankestijn-De Vries H., Effgen S.,
Vreugdenhil D. & Koornneef M. (2007) Development of a Near-Isogenic Line Population of Arabidopsis thaliana and Comparison of Mapping Power With a Recombinant Inbred Line Population. Genetics, 175, 891-905

170
Khatri P., Draghici S., Ostermeier G.C. & Krawetz S.A. (2002) Profiling gene expression using onto-express. Genomics, 79, 266-70
King S.C., Carson J.R. & Doolittle D.P. (1959) The Connecticut and Cornell randombred
populations of chickens. World Poult Sci J, 15, 139-59 Kirkwood B.R. (1988) Cohort and Case–Control Studies. Essentials of Medical Statistics.
Blackwell Scientific Publications, Oxford. 173–183 Kiss G.B., Csanadi G., Kalman K., Kalo P. & Okresz L. (1993) Construction of a basic genetic
map for alfalfa using RFLP, RAPD, isozyme and morphological markers. Mol Gen Genet, 238, 129-37
Klein, R. J. & Zeiss C. (2005) Complement factor H polymorphism in age-related macular
degeneration. Science, 308, 385-9. Knapp S.J., Bridges W.C. & Birkes D. (1990) Mapping quantitative trait loci using molecular
marker linkage maps. Theor Appl Genet, 79, 583-92 Kobayashi S.D., Voyich J.M., Burlak C. & DeLeo F.R. (2005) Neutrophils in the innate immune
response. Arch Immunol Ther Exp (Warsz), 53, 505-17 Kobayashi S.D., Voyich J.M. & DeLeo F.R. (2003) Regulation of the neutrophil-mediated
inflammatory response to infection. Microbes Infect, 5, 1337-44 Kobayashi S.D., Voyich J.M., Somerville G.A., Braughton K.R., Malech H.L., Musser J.M. &
DeLeo F.R. (2003) An apoptosis-differentiation program in human polymorphonuclear leukocytes facilitates resolution of inflammation. J Leukoc Biol, 73, 315-22
Konig R., Shen X., Maroto R. & Denning T.L. (2002) The role of CD4 in regulating homeostasis
of T helper cells. Immunol Res, 25, 115-30 Korb L.C. & Ahearn J.M. (1997) C1q binds directly and specifically to surface blebs of
apoptotic human keratinocytes: complement deficiency and systemic lupus erythematosus revisited. J Immunol, 158, 4525-8
Korthauer U., Graf D., Mages H.W., Briere F., Padayachee M., Malcolm S., Ugazio A.G.,
Notarangelo L.D., Levinsky R.J. & Kroczek R.A. (1993) Defective expression of T-cell CD40 ligand causes X-linked immunodeficiency with hyper-IgM. Nature, 361, 539-41
Kroczek R.A., Graf D., Brugnoni D., Giliani S., Korthuer U., Ugazio A., Senger G., Mages H.W.,
Villa A. & Notarangelo L.D. (1994) Defective expression of CD40 ligand on T cells causes "X-linked immunodeficiency with hyper-IgM (HIGM1)". Immunol Rev, 138, 39-59

171
Kroemer G., Bernot A., Behar G., Chausse A.M., Gastinel L.N., Guillemot F., Park I., Thoraval P., Zoorob R. & Auffray C. (1990) Molecular genetics of the chicken MHC: current status and evolutionary aspects. Immunol Rev, 113, 119-45
Krummel M.F. & Macara I. (2006) Maintenance and modulation of T cell polarity. Nat Immunol,
7, 1143-9 Kushnir N., Liu L. & MacPherson G.G. (1998) Dendritic cells and resting B cells form clusters
in vitro and in vivo: T cell independence, partial LFA-1 dependence, and regulation by cross-linking surface molecules. J Immunol, 160, 1774-81
Lagarrigue S., Pitel F., Carre W., Abasht B., Le Roy P., Neau A., Amigues Y., Sourdioux M.,
Simon J., Cogburn L., Aggrey S., Leclercq B., Vignal A. & Douaire M. (2006) Mapping quantitative trait loci affecting fatness and breast muscle weight in meat-type chicken lines divergently selected on abdominal fatness. Genet Sel Evol, 38, 85-97
Lai, C. Q. & Parnell L. D. (2007) Candidate genes affecting Drosophila life span identified by
integrating microarray gene expression analysis and QTL mapping. Mech Ageing Dev, 128, 237-49.
Lakshmanan N. & Lamont S.J. (1998) Rfp-Y region polymorphism and Marek's disease
resistance in multitrait immunocompetence-selected chicken lines. Poult Sci, 77, 538-41 Lamont S.J. (1998) The chicken major histocompatibility complex and disease. Rev Sci Tech, 17,
128-42 Lamont S.J., Chen Y., Aarts H.J., van der Hulst-van Arkel M.C., Beuving G. & Leenstra F.R.
(1992) Endogenous viral genes in thirteen highly inbred chicken lines and in lines selected for immune response traits. Poult Sci, 71, 530-8
Lander E.S. & Botstein D. (1989) Mapping mendelian factors underlying quantitative traits using
RFLP linkage maps. Genetics, 121, 185-99 Lander E.S. & Schork N.J. (1994) Genetic dissection of complex traits. Science, 265, 2037-48 Lehesjoki A.E., Koskiniemi M., Norio R., Tirrito S., Sistonen P., Lander E. & de la Chapelle A.
(1993) Localization of the EPM1 gene for progressive myoclonus epilepsy on chromosome 21: linkage disequilibrium allows high resolution mapping. Hum Mol Genet, 2, 1229-34
Leitner G., Uni Z., Cahaner A., Gutman M. & Heller E.D. (1992) Replicated divergent selection
of broiler chickens for high or low early antibody response to Escherichia coli vaccination. Poult Sci, 71, 27-37
Levin I., Santangelo L., Cheng H., Crittenden L.B. & Dodgson J.B. (1994) An autosomal genetic
linkage map of the chicken. J Hered, 85, 79-85

172
Lewis P.O. & Snow A.A. (1992) Deterministic paternity exclusion using RAPD markers. Mol
Ecol, 1, 155-60 Li C. & Hung Wong W. (2001a) Model-based analysis of oligonucleotide arrays: model
validation, design issues and standard error application. Genome Biol, 2, 32 Li C. & Wong W.H. (2001b) Model-based analysis of oligonucleotide arrays: expression index
computation and outlier detection. Proc Natl Acad Sci U S A, 98, 31-6 Lillehoj H.S. (1994) Analysis of Eimeria acervulina-induced changes in the intestinal T
lymphocyte subpopulations in two chicken strains showing different levels of susceptibility to coccidiosis. Res Vet Sci, 56, 1-7
Lipkin E., Mosig M.O., Darvasi A., Ezra E., Shalom A., Friedmann A. & Soller M. (1998)
Quantitative trait locus mapping in dairy cattle by means of selective milk DNA pooling using dinucleotide microsatellite markers: analysis of milk protein percentage. Genetics, 149, 1557-67
Litinskiy M.B., Nardelli B., Hilbert D.M., He B., Schaffer A., Casali P. & Cerutti A. (2002) DCs
induce CD40-independent immunoglobulin class switching through BLyS and APRIL. Nat Immunol, 3, 822-9
Litt M. & Luty J.A. (1989) A hypervariable microsatellite revealed by in vitro amplification of a
dinucleotide repeat within the cardiac muscle actin gene. Am J Hum Genet, 44, 397-401 Liu H.C., Cheng H.H., Tirunagaru V., Sofer L. & Burnside J. (2001) A strategy to identify
positional candidate genes conferring Marek's disease resistance by integrating DNA microarrays and genetic mapping. Anim Genet, 32, 351-9
Longenecker B.M., Pazderka F., Gavora J.S., Spencer J.L., Stephens E.A., Witter R.L. & Ruth
R.F. (1977) Role of the major histocompatibility complex in resistance to Marek's disease: restriction of the growth of JMV-MD tumor cells in genetically resistant birds. Adv Exp Med Biol, 88, 287-98
Loudovaris T., Mandel T.E. & Charlton B. (1996) CD4+ T cell mediated destruction of
xenografts within cell-impermeable membranes in the absence of CD8+ T cells and B cells. Transplantation, 61, 1678-84
Lowe J.B. (2001) Red cell membrane antigens, in: Molecular Basis of Blood Disease, 3rd ed. .
McGraw-Hill, New York. Ludewig B., Maloy K.J., Lopez-Macias C., Odermatt B., Hengartner H. & Zinkernagel R.M.
(2000) Induction of optimal anti-viral neutralizing B cell responses by dendritic cells requires transport and release of virus particles in secondary lymphoid organs. Eur J Immunol, 30, 185-96
173
Lunney J.K. (1998) Cytokines orchestrating the immune response. Rev Sci Tech, 17, 84-94 Luo Z.W. (1998) Detecting linkage disequilibrium between a polymorphic marker locus and a
trait locus in natural populations. Heredity, 80 ( Pt 2), 198-208 Lynch M. & Milligan B.G. (1994) Analysis of population genetic structure with RAPD markers.
Mol Ecol, 3, 91-9 Mackay C.R. (2001) Chemokines: immunology's high impact factors. Nat Immunol, 2, 95-101 MacPherson G., Kushnir N. & Wykes M. (1999) Dendritic cells, B cells and the regulation of
antibody synthesis. Immunol Rev, 172, 325-34 Malnati M.S., Marti M., LaVaute T., Jaraquemada D., Biddison W., DeMars R. & Long E.O.
(1992) Processing pathways for presentation of cytosolic antigen to MHC class II-restricted T cells. Nature, 357, 702-4
Mandruzzato S. (2007) Technological platforms for microarray gene expression profiling. Adv
Exp Med Biol, 593, 12-8 Maraganore, D. M., M. de Andrade, et al. (2005). High-resolution whole-genome association
study of Parkinson disease. Am J Hum Genet, 77: 685-93. Martin A., Dunnington E.A., Briles W.E., Briles R.W. & Siegel P.B. (1989) Marek's disease and
major histocompatibility complex haplotypes in chickens selected for high or low antibody response. Anim Genet, 20, 407-14
Martin A., Dunnington E.A., Gross W.B., Briles W.E., Briles R.W. & Siegel P.B. (1990)
Production traits and alloantigen systems in lines of chickens selected for high or low antibody responses to sheep erythrocytes. Poult Sci, 69, 871-8
Martin A., Gross W.B., Dunnington E.A., Briles R.W., Briles W.E. & Siegel P.B. (1986)
Resistance to natural and controlled exposures to Eimeria tenella: genetic variation and alloantigen systems. Poult Sci, 65, 1847-52
Martin G.B., Williams J.G. & Tanksley S.D. (1991) Rapid identification of markers linked to a
Pseudomonas resistance gene in tomato by using random primers and near-isogenic lines. Proc Natl Acad Sci U S A, 88, 2336-40
Mathew, C. (2001) Science, medicine, and the future: Postgenomic technologies: hunting the
genes for common disorders. Bmj, 322: 1031-4 Matsumoto A.K., Kopicky-Burd J., Carter R.H., Tuveson D.A., Tedder T.F. & Fearon D.T.
(1991) Intersection of the complement and immune systems: a signal transduction

174
complex of the B lymphocyte-containing complement receptor type 2 and CD19. J Exp Med, 173, 55-64
Matsushita M. & Fujita T. (2002) The role of ficolins in innate immunity. Immunobiology, 205,
490-7 McHeyzer-Williams L.J., Malherbe L.P. & McHeyzer-Williams M.G. (2006) Helper T cell-
regulated B cell immunity. Curr Top Microbiol Immunol, 311, 59-83 McHeyzer-Williams M.G. (2003) B cells as effectors. Curr Opin Immunol, 15, 354-61 Melief C.J. (2003) Mini-review: Regulation of cytotoxic T lymphocyte responses by dendritic
cells: peaceful coexistence of cross-priming and direct priming? Eur J Immunol, 33, 2645-54
Mello, M. A. & R. S. Tuan (1999) High density micromass cultures of embryonic limb bud
mesenchymal cells: an in vitro model of endochondral skeletal development. In Vitro Cell Dev Biol Anim, 35, 262-9.
Meuwissen T.H. & Goddard M.E. (2000) Fine mapping of quantitative trait loci using linkage
disequilibria with closely linked marker loci. Genetics, 155, 421-30 Miller M.M., Goto R., Zoorob R., Auffray C. & Briles W.E. (1994) Regions of homology shared
by Rfp-Y and major histocompatibility B complex genes. Immunogenetics, 39, 71-3 Miller R.A., Galecki A. & Shmookler-Reis R.J. (2001) Interpretation, design, and analysis of
gene array expression experiments. J Gerontol A Biol Sci Med Sci, 56, 52-7 Mitchell, L. E. (2000). Relationship between case-control studies and the
transmission/disequilibrium test. Genet Epidemiol, 19: 193-201. Mitchison N.A., Schuhbauer D. & Muller B. (1999) Natural and induced regulation of Th1/Th2
balance. Springer Semin Immunopathol, 21, 199-210 Molina H., Kinoshita T., Webster C.B. & Holers V.M. (1994) Analysis of C3b/C3d binding sites
and factor I cofactor regions within mouse complement receptors 1 and 2. J Immunol, 153, 789-95
Moser B. & Eberl M. (2007) gammadelta T cells: novel initiators of adaptive immunity.
Immunol Rev, 215, 89-102 Motro U. & Soller M. (1993) Sequential sampling in determining linkage between marker loci
and quantitative trait loci. . Theor. Appl. Genet., 85, 658-64 Mukhopadhyay S., Herre J., Brown G.D. & Gordon S. (2004) The potential for Toll-like
receptors to collaborate with other innate immune receptors. Immunology, 112, 521-30

175
Mullikin J.C., Hunt S.E., Cole C.G., Mortimore B.J., Rice C.M., Burton J., Matthews L.H.,
Pavitt R., Plumb R.W., Sims S.K., Ainscough R.M., Attwood J., Bailey J.M., Barlow K., Bruskiewich R.M., Butcher P.N., Carter N.P., Chen Y., Clee C.M., Coggill P.C., Davies J., Davies R.M., Dawson E., Francis M.D., Joy A.A., Lamble R.G., Langford C.F., Macarthy J., Mall V., Moreland A., Overton-Larty E.K., Ross M.T., Smith L.C., Steward C.A., Sulston J.E., Tinsley E.J., Turney K.J., Willey D.L., Wilson G.D., McMurray A.A., Dunham I., Rogers J. & Bentley D.R. (2000) An SNP map of human chromosome 22. Nature, 407, 516-20
Murdoch C. & Finn A. (2000) Chemokine receptors and their role in inflammation and infectious
diseases. Blood, 95, 3032-43 Murphy D. (2002) Gene expression studies using microarrays: principles, problems, and
prospects. Adv Physiol Educ, 26, 256-70 Nadeau J.H., Singer J.B., Matin A. & Lander E.S. (2000) Analysing complex genetic traits with
chromosome substitution strains. Nat Genet, 24, 221-5 Nickerson D.A., Taylor S.L., Weiss K.M., Clark A.G., Hutchinson R.G., Stengard J., Salomaa V.,
Vartiainen E., Boerwinkle E. & Sing C.F. (1998) DNA sequence diversity in a 9.7-kb region of the human lipoprotein lipase gene. Nat Genet, 19, 233-40
Notarangelo L.D., Duse M. & Ugazio A.G. (1992) Immunodeficiency with hyper-IgM (HIM).
Immunodefic Rev, 3, 101-21 Oberthuer A., Berthold F., Warnat P., Hero B., Kahlert Y., Spitz R., Ernestus K., Konig R., Haas
S., Eils R., Schwab M., Brors B., Westermann F. & Fischer M. (2006) Customized oligonucleotide microarray gene expression-based classification of neuroblastoma patients outperforms current clinical risk stratification. J Clin Oncol, 24, 5070-8
O'Brien S.J., Menotti-Raymond M., Murphy W.J., Nash W.G., Wienberg J., Stanyon R.,
Copeland N.G., Jenkins N.A., Womack J.E. & Marshall Graves J.A. (1999) The promise of comparative genomics in mammals. Science, 286, 458-62, 479-81
Oehen S. & Brduscha-Riem K. (1998) Differentiation of naive CTL to effector and memory CTL:
correlation of effector function with phenotype and cell division. J Immunol, 161, 5338-46
Ohta, T. & Y. Ina (1995) Variation in synonymous substitution rates among mammalian genes
and the correlation between synonymous and nonsynonymous divergences. J Mol Evol, 41, 717-20.
Osier M.V., Zhao H. & Cheung K.H. (2004) Handling multiple testing while interpreting
microarrays with the Gene Ontology Database. BMC Bioinformatics, 5, 124

176
Osterrieder, N. & Kamil J. P. (2006) Marek's disease virus: from miasma to model. Nat Rev Microbiol, 4, 283-94
Ozaki, K. & Ohnishi Y. (2002) Functional SNPs in the lymphotoxin-alpha gene that are
associated with susceptibility to myocardial infarction. Nat Genet, 32, 650-4 Pain, B. & Clark M. E. (1996) Long-term in vitro culture and characterisation of avian
embryonic stem cells with multiple morphogenetic potentialities. Development, 122, 2339-48
Pan, W. (2002) A comparative review of statistical methods for discovering differentially
expressed genes in replicated microarray experiments. Bioinformatics, 18, 546-54. Papamichail M., Gutierrez C., Embling P., Johnson P., Holborow E.J. & Pepys M.B. (1975)
Complement dependence of localisation of aggregated IgG in germinal centres. Scand J Immunol, 4, 343-47
Pavlidis P., Qin J., Arango V., Mann J.J. & Sibille E. (2004) Using the gene ontology for
microarray data mining: a comparison of methods and application to age effects in human prefrontal cortex. Neurochem Res, 29, 1213-22
Pavlidis P., Weston J., Cai J. & Noble W.S. (2002) Learning gene functional classifications from
multiple data types. J Comput Biol, 9, 401-11 Pease A.C., Solas D., Sullivan E.J., Cronin M.T., Holmes C.P. & Fodor S.P. (1994) Light-
generated oligonucleotide arrays for rapid DNA sequence analysis. Proc Natl Acad Sci U S A, 91, 5022-6
Petrovsky N. (2001) Towards a unified model of neuroendocrine-immune interaction. Immunol
Cell Biol, 79, 350-7 Pevzner, I. Y. & Kujdych I. (1981) Immune response and disease resistance in chickens. II.
Marek's disease and immune response to GAT. Poult Sci, 60, 927-32 Pieters J. (2000) MHC class II-restricted antigen processing and presentation. Adv Immunol, 75,
159-208 Pinard M.H., Janss L.L., Maatman R., Noordhuizen J.P. & van der Zijpp A.J. (1993) Effect of
divergent selection for immune responsiveness and of major histocompatibility complex on resistance to Marek's disease in chickens. Poult Sci, 72, 391-402
Pinard M.H., van Arendonk J.A., Nieuwland M.G. & van der Zijpp A.J. (1992) Divergent
selection for immune responsiveness in chickens: estimation of realized heritability with an animal model. J Anim Sci, 70, 2986-93

177
Pinard-van der Laan M.H. (2002) Immune modulation: the genetic approach. Vet Immunol Immunopathol, 87, 199-205
Pinard-Van Der Laan M.H., Monvoisin J.L., Pery P., Hamet N. & Thomas M. (1998)
Comparison of outbred lines of chickens for resistance to experimental infection with coccidiosis (Eimeria tenella). Poult Sci, 77, 185-91
Pitcovski J., Heller D.E., Cahaner A. & Peleg B.A. (1987) Selection for early responsiveness of
chicks to Escherichia coli and Newcastle disease virus. Poult Sci, 66, 1276-82 Plachy J., Pink J.R. & Hala K. (1992) Biology of the chicken MHC (B complex). Crit Rev
Immunol, 12, 47-79 Plant J.E. & Glynn A.A. (1982) Genetic control of resistance to Salmonella typhimurium
infection in high and low antibody responder mice. Clin Exp Immunol, 50, 283-90 Pounds S. & Morris S.W. (2003) Estimating the occurrence of false positives and false negatives
in microarray studies by approximating and partitioning the empirical distribution of p-values. Bioinformatics, 19, 1236-42
Puel A., Groot P.C., Lathrop M.G., Demant P. & Mouton D. (1995) Mapping of genes
controlling quantitative antibody production in Biozzi mice. J Immunol, 154, 5799-805 Puel A., Mevel J.C., Bouthillier Y., Decreusefond C., Fridman W.H., Feingold N. & Mouton D.
(1998) Identification of two quantitative trait loci involved in antibody production on mouse chromosome 8. Immunogenetics, 47, 326-31
Puel A., Mevel J.C., Bouthillier Y., Feingold N., Fridman W.H. & Mouton D. (1996) Toward
genetic dissection of high and low antibody responsiveness in Biozzi mice. Proc Natl Acad Sci U S A, 93, 14742-6
Rees M.J. & Nordskog A.W. (1981) Genetic control of serum immunoglobulin G levels in the
chicken. J Immunogenet, 8, 425-31 Reich D.E., Cargill M., Bolk S., Ireland J., Sabeti P.C., Richter D.J., Lavery T., Kouyoumjian R.,
Farhadian S.F., Ward R. & Lander E.S. (2001) Linkage disequilibrium in the human genome. Nature, 411, 199-204
Reid K.B. & Porter R.R. (1981) The proteolytic activation systems of complement. Annu Rev
Biochem, 50, 433-64 Reid R.R., Prodeus A.P., Khan W., Hsu T., Rosen F.S. & Carroll M.C. (1997) Endotoxin shock
in antibody-deficient mice: unraveling the role of natural antibody and complement in the clearance of lipopolysaccharide. J Immunol, 159, 970-5

178
Reynaud C.A., Bertocci B., Dahan A. & Weill J.C. (1994) Formation of the chicken B-cell repertoire: ontogenesis, regulation of Ig gene rearrangement, and diversification by gene conversion. Adv Immunol, 57, 353-78
Rivera, A. & Fisher S. A. (2005) Hypothetical LOC387715 is a second major susceptibility gene
for age-related macular degeneration, contributing independently of complement factor H to disease risk. Hum Mol Genet, 14, 3227-36
Riquet J., Coppieters W., Cambisano N., Arranz J.J., Berzi P., Davis S.K., Grisart B., Farnir F.,
Karim L., Mni M., Simon P., Taylor J.F., Vanmanshoven P., Wagenaar D., Womack J.E. & Georges M. (1999) Fine-mapping of quantitative trait loci by identity by descent in outbred populations: application to milk production in dairy cattle. Proc Natl Acad Sci U S A, 96, 9252-7
Risch N. & Merikangas K. (1996) The future of genetic studies of complex human diseases.
Science, 273, 1516-7 Risch, N. & K. Merikangas (1997) Genetic analysis of complex diseases. Science, 275, 1329-30 Risch, N. & J. Teng (1998) The relative power of family-based and case-control designs for
linkage disequilibrium studies of complex human diseases I. DNA pooling. Genome Res, 8, 1273-88
Rock K.L. & Shen L. (2005) Cross-presentation: underlying mechanisms and role in immune
surveillance. Immunol Rev, 207, 166-83 Roopenian D.C., Davis A.P., Christianson G.J. & Mobraaten L.E. (1993) The functional basis of
minor histocompatibility loci. J Immunol, 151, 4595-605 Rosegrant M.W., Paisner M.S., Meijer S. & Witcover J. (2001) Global food outlook 2020:
Trends, Alternatives, and Choices. International Food Policy Research Institute, Washington,D.C.
Rozen S. & Skaletsky H. (2000) Primer3 on the WWW for general users and for biologist
programmers. Methods Mol Biol, 132, 365-86 Ruby, T. & Whittaker C. (2006) Transcriptional profiling reveals a possible role for the timing of
the inflammatory response in determining susceptibility to a viral infection. J Virol, 80, 9207-16.
Rupp R. & Boichard D. (2003) Genetics of resistance to mastitis in dairy cattle. Vet Res, 34,
671-88 Sahu A. & Lambris J.D. (2001) Structure and biology of complement protein C3, a connecting
link between innate and acquired immunity. Immunol Rev, 180, 35-48

179
Schena M., Heller R.A., Theriault T.P., Konrad K., Lachenmeier E. & Davis R.W. (1998) Microarrays: biotechnology's discovery platform for functional genomics. Trends Biotechnol, 16, 301-6
Scher I. (1982) The CBA/N mouse strain: an experimental model illustrating the influence of the
X-chromosome on immunity. Adv Immunol, 33, 1-71 Scherzer, C. R. & Eklund A. C. (2007) Molecular markers of early Parkinson's disease based on
gene expression in blood. Proc Natl Acad Sci U S A, 104, 955-60 Schulman N.F., Viitala S.M., de Koning D.J., Virta J., Maki-Tanila A. & Vilkki J.H. (2004)
Quantitative trait Loci for health traits in Finnish Ayrshire cattle. J Dairy Sci, 87, 443-9 Segal A.W. (2005) How neutrophils kill microbes. Annu Rev Immunol, 23, 197-223 Siegel P.B., Gross W.B. & Cherry J.A. (1982) Correlated responses of chickens to selection for
production of antibodies to sheep erythrocytes. Anim Blood Groups Biochem Genet, 13, 291-7
Siegel P.B. & Gross W.G. (1980) Production and persistence of antibodies in chickens to sheep
erythrocytes. 1. Directional selection. Poult Sci, 59, 1-5 Siegel P.B., Larsen A.S., Larsen C.T. & Dunnington E.A. (1993) Research note: resistance of
chickens to an outbreak of necrotic enteritis as influenced by major histocompatibility genotype and background genome. Poult Sci, 72, 1189-91
Siegel, P. B. & Dodgson J. B. (2006) Progress from chicken genetics to the chicken genome.
Poult Sci, 85, 2050-60 Sievertzon M., Nilsson P. & Lundeberg J. (2006) Improving reliability and performance of DNA
microarrays. Expert Rev Mol Diagn, 6, 481-92 Sims T.N., Afrouzian M., Urmson J., Zhu L.F. & Halloran P.F. (2001) The role of the class II
transactivator (CIITA) in MHC class I and II regulation and graft rejection in kidney. Am J Transplant, 1, 211-21
Singer J.B., Hill A.E., Burrage L.C., Olszens K.R., Song J., Justice M., O'Brien W.E., Conti
D.V., Witte J.S., Lander E.S. & Nadeau J.H. (2004) Genetic dissection of complex traits with chromosome substitution strains of mice. Science, 304, 445-8
Siqueira M., Drumond L.S., Gennari M., Ferreira V.C., Reis M.H. & Biozzi G. (1985) Effect of
genetic modification of antibody responsiveness on resistance to Toxoplasma gondii infection. Infect Immun, 48, 298-302
Siwek M., Cornelissen S.J., Nieuwland M.G., Buitenhuis A.J., Bovenhuis H., Crooijmans R.P.,
Groenen M.A., de Vries-Reilingh G., Parmentier H.K. & van der Poel J.J. (2003)

180
Detection of QTL for immune response to sheep red blood cells in laying hens. Anim Genet, 34, 422-8
Smith E., Shi L., Drummond P., Rodriguez L., Hamilton R., Powell E., Nahashon S., Ramlal S.,
Smith G. & Foster J. (2000) Development and characterization of expressed sequence tags for the turkey (Meleagris gallopavo) genome and comparative sequence analysis with other birds. Anim Genet, 31, 62-7
Smith E.J., Fadly A.M. & Crittenden L.B. (1990) Interactions between endogenous virus loci ev6
and ev21. 1. Immune response to exogenous avian leukosis virus infection. Poult Sci, 69, 1244-50
Smith E.J., Fadly A.M., Levin I. & Crittenden L.B. (1991) The influence of ev6 on the immune
response to avian leukosis virus infection in rapid-feathering progeny of slow- and rapid-feathering dams. Poult Sci, 70, 1673-8
Smith E.J., Jones C.P., Bartlett J. & Nestor K.E. (1996) Use of randomly amplified polymorphic
DNA markers for the genetic analysis of relatedness and diversity in chickens and turkeys. Poult Sci, 75, 579-84
Smith E.J., Shi L., Drummond P., Rodriguez L., Hamilton R., Ramlal S., Smith G., Pierce K. &
Foster J. (2001) Expressed sequence tags for the chicken genome from a normalized 10-day-old White Leghorn whole embryo cDNA library: 1. DNA sequence characterization and linkage analysis. J Hered, 92, 1-8
Smith E.J., Shi L. & Smith G. (2002) Expressed sequence tags for the chicken genome from a
normalized 10-day-old white leghorn whole-embryo cDNA library. 3. DNA sequence analysis of genetic variation in commercial chicken populations. Genome, 45, 261-7
Smith J., Speed D., Law A.S., Glass E.J. & Burt D.W. (2004) In-silico identification of chicken
immune-related genes. Immunogenetics, 56, 122-33 Soller M., Brody T. & Genizi A. (1976) On the power of experimental designs for the detection
of linkage between marker loci and quantitative loci in crosses between inbred lines. Theor. Appl. Genet. , 47, 35-39
Spelman R.J., Coppieters W., Karim L., van Arendonk J.A. & Bovenhuis H. (1996) Quantitative
trait loci analysis for five milk production traits on chromosome six in the Dutch Holstein-Friesian population. Genetics, 144, 1799-808
Sporri R. & Reis e Sousa C. (2005) Inflammatory mediators are insufficient for full dendritic cell
activation and promote expansion of CD4+ T cell populations lacking helper function. Nat Immunol, 6, 163-70
Sproul T.W., Cheng P.C., Dykstra M.L. & Pierce S.K. (2000) A role for MHC class II antigen
processing in B cell development. Int Rev Immunol, 19, 139-55

181
Spruill S.E., Lu J., Hardy S. & Weir B. (2002) Assessing sources of variability in microarray
gene expression data. Biotechniques, 33, 916-20, 922-3 Steinman R.M. (1991) The dendritic cell system and its role in immunogenicity. Annu Rev
Immunol, 9, 271-96 Steinman R.M., Inaba K., Turley S., Pierre P. & Mellman I. (1999) Antigen capture, processing,
and presentation by dendritic cells: recent cell biological studies. Hum Immunol, 60, 562-7
Stiffel C., Ibanez O.M., Ribeiro O.G., Decreusefond C., Siqueira M., Mouton D. & Biozzi G.
(1987) Genetic regulation of the specific and non-specific component of immunity. Immunol Lett, 16, 205-17
Strachan T. & Read A.D. (1999) Human Molecular Genetics. in: Molecular Systematics, Plant
and Evolution, 2nd edition. John Wiley and Sons Inc., UK. Street N.E. & Mosmann T.R. (1991) Functional diversity of T lymphocytes due to secretion of
different cytokine patterns. Faseb J, 5, 171-7 Szalai A.J., Agrawal A., Greenhough T.J. & Volanakis J.E. (1997) C-reactive protein: structural
biology, gene expression, and host defense function. Immunol Res, 16, 127-36 Taccioli G.E. & Alt F.W. (1995) Potential targets for autosomal SCID mutations. Curr Opin
Immunol, 7, 436-40 Taillon-Miller P. & Kwok P.Y. (2000) A high-density single-nucleotide polymorphism map of
Xq25-q28. Genomics, 65, 195-202 Tamayo P., Slonim D., Mesirov J., Zhu Q., Kitareewan S., Dmitrovsky E., Lander E.S. & Golub
T.R. (1999) Interpreting patterns of gene expression with self-organizing maps: methods and application to hematopoietic differentiation. Proc Natl Acad Sci U S A, 96, 2907-12
Tanksley S.D. (1993) Mapping polygenes. Annu Rev Genet, 27, 205-33 Tautz D. (1989) Hypervariability of simple sequences as a general source for polymorphic DNA
markers. Nucleic Acids Res, 17, 6463-71 Taylor B.A. (1978) Recombinant inbred strains: use in gene mapping. in: Origins of Inbred Mice,
edited by Morse H.C. . Academic Press, New York. Taylor B.A., Bedigian H.G. & Meier H. (1977) Genetic studies of the Fv-1 locus of mice:
linkage with Gpd-1 in recombinant inbred lines. J Virol, 23, 106-9

182
Taylor P.R., Carugati A., Fadok V.A., Cook H.T., Andrews M., Carroll M.C., Savill J.S., Henson P.M., Botto M. & Walport M.J. (2000) A hierarchical role for classical pathway complement proteins in the clearance of apoptotic cells in vivo. J Exp Med, 192, 359-66
Theilgaard-Monch K., Knudsen S., Follin P. & Borregaard N. (2004) The transcriptional
activation program of human neutrophils in skin lesions supports their important role in wound healing. J Immunol, 172, 7684-93
Teng J. & N. Risch (1999) The relative power of family-based and case-control designs for
linkage disequilibrium studies of complex human diseases. II. Individual genotyping. Genome Res, 9, 234-41
Thery C. & Amigorena S. (2001) The cell biology of antigen presentation in dendritic cells. Curr
Opin Immunol, 13, 45-51 Tickle C. (2004) The contribution of chicken embryology to the understanding of vertebrate limb
development. Mech Dev, 121, 1019-29 Tischfield J.A., Creagan R.P., Nichols E.A. & Ruddle F.H. (1974) Assignment of a gene for
adenosine deaminase to human chromosome 20. Hum Hered, 24, 1-11 Toapanta F.R. & Ross T.M. (2006) Complement-mediated activation of the adaptive immune
responses: role of C3d in linking the innate and adaptive immunity. Immunol Res, 36, 197-210
Tsai C.A., Hsueh H.M. & Chen J.J. (2003) Estimation of false discovery rates in multiple testing:
application to gene microarray data. Biometrics, 59, 1071-81 Tsukada S., Saffran D.C., Rawlings D.J., Parolini O., Allen R.C., Klisak I., Sparkes R.S.,
Kubagawa H., Mohandas T. & Quan S. (1993) Deficient expression of a B cell cytoplasmic tyrosine kinase in human X-linked agammaglobulinemia. Cell, 72, 279-90
Turesson C. (2004) Endothelial expression of MHC class II molecules in autoimmune disease.
Curr Pharm Des, 10, 129-43 Turnpenny P. & Ellard S. (2005) Emery's Elements of Medical Genetics, 12th edition. Elsevier,
London. Ubosi C.O., Dunnington E.A., Gross W.B. & Siegel P.B. (1985a) Divergent selection of
chickens for antibody response to sheep erythrocytes: kinetics of primary and secondary immunizations. Avian Dis, 29, 347-55
Ubosi C.O., Gross W.B. & Siegel P.B. (1985b) Divergent selection of chickens for antibody
production to sheep erythrocytes: age effect in parental lines and their crosses. Avian Dis, 29, 150-8

183
Ungerer M.C., Linder C.R. & Rieseberg L.H. (2003) Effects of genetic background on response to selection in experimental populations of Arabidopsis thaliana. Genetics, 163, 277-86
Uni Z., Sklan D., Haklay N., Yonash N. & Heller D. (1995) Response of three class-IV major
histocompatibility complex haplotypes to Eimeria acervulina in meat-type chickens. Br Poult Sci, 36, 555-61
van der Lann M.J., Dudoit S. & Pollard K.S. (2004) Augmentation procedures for control of the
generalized family-wise error rate and tail probabilities for the proportion of false positives. Stat. Appl. Genet. Mol. Biol., 3, A15
van der Zijpp A.J. (1983) The effect of genetic origin, source of antigen, and dose of antigen on
the immune response of cockerels. Poult Sci, 62, 205-11 van der Zijpp A.J. (1987) Genetic aspects of disease resistance in farm animals. Tijdschr
Diergeneeskd, 112, 927-33 van der Zijpp A.J., Frankena K., Boneschanscher J. & Nieuwland M.G. (1983) Genetic analysis
of primary and secondary immune responses in the chicken. Poult Sci, 62, 565-72 Van Der Zijpp A.J. & Leenstra F.R. (1980) Genetic analysis of the humoral immune response of
White Leghorn chicks. Poult Sci, 59, 1363-9 Varela J.C., Goldstein M.H., Baker H.V. & Schultz G.S. (2002) Microarray analysis of gene
expression patterns during healing of rat corneas after excimer laser photorefractive keratectomy. Invest Ophthalmol Vis Sci, 43, 1772-82
Vetrie D., Vorechovsky I., Sideras P., Holland J., Davies A., Flinter F., Hammarstrom L.,
Kinnon C., Levinsky R. & Bobrow M. (1993) The gene involved in X-linked agammaglobulinaemia is a member of the src family of protein-tyrosine kinases. Nature, 361, 226-33
Vignal A., Milan D., SanCristobal M. & Eggen A. (2002) A review on SNP and other types of
molecular markers and their use in animal genetics. Genet Sel Evol, 34, 275-305 Vos P., Hogers R., Bleeker M., Reijans M., van de Lee T., Hornes M., Frijters A., Pot J.,
Peleman J., Kuiper M. & et al. (1995) AFLP: a new technique for DNA fingerprinting. Nucleic Acids Res, 23, 4407-14
Wakenell P.S., Miller M.M., Goto R.M., Gauderman W.J. & Briles W.E. (1996) Association
between the Rfp-Y haplotype and the incidence of Marek's disease in chickens. Immunogenetics, 44, 242-5
Walter U. & Santamaria P. (2005) CD8+ T cells in autoimmunity. Curr Opin Immunol, 17, 624-
31
184
Wang D.G., Fan J.B., Siao C.J., Berno A., Young P., Sapolsky R., Ghandour G., Perkins N., Winchester E., Spencer J., Kruglyak L., Stein L., Hsie L., Topaloglou T., Hubbell E., Robinson E., Mittmann M., Morris M.S., Shen N., Kilburn D., Rioux J., Nusbaum C., Rozen S., Hudson T.J., Lipshutz R., Chee M. & Lander E.S. (1998) Large-scale identification, mapping, and genotyping of single-nucleotide polymorphisms in the human genome. Science, 280, 1077-82
Waterhouse N.J., Clarke C.J., Sedelies K.A., Teng M.W. & Trapani J.A. (2004) Cytotoxic
lymphocytes; instigators of dramatic target cell death. Biochem Pharmacol, 68, 1033-40 Waterston R.H., Lindblad-Toh K., Birney E., Rogers J., Abril J.F., Agarwal P., Agarwala R.,
Ainscough R., Alexandersson M., An P., Antonarakis S.E., Attwood J., Baertsch R., Bailey J., Barlow K., Beck S., Berry E., Birren B., Bloom T., Bork P., Botcherby M., Bray N., Brent M.R., Brown D.G., Brown S.D., Bult C., Burton J., Butler J., Campbell R.D., Carninci P., Cawley S., Chiaromonte F., Chinwalla A.T., Church D.M., Clamp M., Clee C., Collins F.S., Cook L.L., Copley R.R., Coulson A., Couronne O., Cuff J., Curwen V., Cutts T., Daly M., David R., Davies J., Delehaunty K.D., Deri J., Dermitzakis E.T., Dewey C., Dickens N.J., Diekhans M., Dodge S., Dubchak I., Dunn D.M., Eddy S.R., Elnitski L., Emes R.D., Eswara P., Eyras E., Felsenfeld A., Fewell G.A., Flicek P., Foley K., Frankel W.N., Fulton L.A., Fulton R.S., Furey T.S., Gage D., Gibbs R.A., Glusman G., Gnerre S., Goldman N., Goodstadt L., Grafham D., Graves T.A., Green E.D., Gregory S., Guigo R., Guyer M., Hardison R.C., Haussler D., Hayashizaki Y., Hillier L.W., Hinrichs A., Hlavina W., Holzer T., Hsu F., Hua A., Hubbard T., Hunt A., Jackson I., Jaffe D.B., Johnson L.S., Jones M., Jones T.A., Joy A., Kamal M., Karlsson E.K., Karolchik D., Kasprzyk A., Kawai J., Keibler E., Kells C., Kent W.J., Kirby A., Kolbe D.L., Korf I., Kucherlapati R.S., Kulbokas E.J., Kulp D., Landers T., Leger J.P., Leonard S., Letunic I., Levine R., Li J., Li M., Lloyd C., Lucas S., Ma B., Maglott D.R., Mardis E.R., Matthews L., Mauceli E., Mayer J.H., McCarthy M., McCombie W.R., McLaren S., McLay K., McPherson J.D., Meldrim J., Meredith B., Mesirov J.P., Miller W., Miner T.L., Mongin E., Montgomery K.T., Morgan M., Mott R., Mullikin J.C., Muzny D.M., Nash W.E., Nelson J.O., Nhan M.N., Nicol R., Ning Z., Nusbaum C., O'Connor M.J., Okazaki Y., Oliver K., Overton-Larty E., Pachter L., Parra G., Pepin K.H., Peterson J., Pevzner P., Plumb R., Pohl C.S., Poliakov A., Ponce T.C., Ponting C.P., Potter S., Quail M., Reymond A., Roe B.A., Roskin K.M., Rubin E.M., Rust A.G., Santos R., Sapojnikov V., Schultz B., Schultz J., Schwartz M.S., Schwartz S., Scott C., Seaman S., Searle S., Sharpe T., Sheridan A., Shownkeen R., Sims S., Singer J.B., Slater G., Smit A., Smith D.R., Spencer B., Stabenau A., Stange-Thomann N., Sugnet C., Suyama M., Tesler G., Thompson J., Torrents D., Trevaskis E., Tromp J., Ucla C., Ureta-Vidal A., Vinson J.P., Von Niederhausern A.C., Wade C.M., Wall M., Weber R.J., Weiss R.B., Wendl M.C., West A.P., Wetterstrand K., Wheeler R., Whelan S., Wierzbowski J., Willey D., Williams S., Wilson R.K., Winter E., Worley K.C., Wyman D., Yang S., Yang S.P., Zdobnov E.M., Zody M.C. & Lander E.S. (2002) Initial sequencing and comparative analysis of the mouse genome. Nature, 420, 520-62
Wayne, M. L. & L. M. McIntyre (2002) Combining mapping and arraying: An approach to
candidate gene identification. Proc Natl Acad Sci U S A, 99, 14903-6

185
Weber J.L. & May P.E. (1989) Abundant class of human DNA polymorphisms which can be
typed using the polymerase chain reaction. Am J Hum Genet, 44, 388-96 Weissenbach J. (1998) The Human Genome Project: from mapping to sequencing. Clin Chem
Lab Med, 36, 511-4 Weller J.I. (1986) Maximum likelihood techniques for the mapping and analysis of quantitative
trait loci with the aid of genetic markers. Biometrics, 42, 627-40 Weller J.I. (2001) Quantitative Trait Loci Analysis in Animals. CABI Publishing. White E.C., Briles W.E., Briles R.W. & Taylor R.L., Jr. (1994) Response of six major
histocompatibility (B) complex recombinant haplotypes to Rous sarcomas. Poult Sci, 73, 836-42
Wight C.P., Molnar S.J. & Fedak G. (1993) Identification of an RAPD marker for the crown rust
resistance gene Pc68 in oats. Genome, 36, 818-20 Williams J.G., Kubelik A.R., Livak K.J., Rafalski J.A. & Tingey S.V. (1990) DNA
polymorphisms amplified by arbitrary primers are useful as genetic markers. Nucleic Acids Res, 18, 6531-5
Williams M.A. & Bevan M.J. (2007) Effector and Memory CTL Differentiation. Annu Rev
Immunol, 25, 171-92 Woloschak G.E., Rodriguez M. & Krco C.J. (1987) Characterization of immunologic and
neuropathologic abnormalities in wasted mice. J Immunol, 138, 2493-9 Wong G.K., Liu B., Wang J., Zhang Y., Yang X., Zhang Z., Meng Q., Zhou J., Li D., Zhang J.,
Ni P., Li S., Ran L., Li H., Zhang J., Li R., Li S., Zheng H., Lin W., Li G., Wang X., Zhao W., Li J., Ye C., Dai M., Ruan J., Zhou Y., Li Y., He X., Zhang Y., Wang J., Huang X., Tong W., Chen J., Ye J., Chen C., Wei N., Li G., Dong L., Lan F., Sun Y., Zhang Z., Yang Z., Yu Y., Huang Y., He D., Xi Y., Wei D., Qi Q., Li W., Shi J., Wang M., Xie F., Wang J., Zhang X., Wang P., Zhao Y., Li N., Yang N., Dong W., Hu S., Zeng C., Zheng W., Hao B., Hillier L.W., Yang S.P., Warren W.C., Wilson R.K., Brandstrom M., Ellegren H., Crooijmans R.P., van der Poel J.J., Bovenhuis H., Groenen M.A., Ovcharenko I., Gordon L., Stubbs L., Lucas S., Glavina T., Aerts A., Kaiser P., Rothwell L., Young J.R., Rogers S., Walker B.A., van Hateren A., Kaufman J., Bumstead N., Lamont S.J., Zhou H., Hocking P.M., Morrice D., de Koning D.J., Law A., Bartley N., Burt D.W., Hunt H., Cheng H.H., Gunnarsson U., Wahlberg P., Andersson L., Kindlund E., Tammi M.T., Andersson B., Webber C., Ponting C.P., Overton I.M., Boardman P.E., Tang H., Hubbard S.J., Wilson S.A., Yu J., Wang J. & Yang H. (2004) A genetic variation map for chicken with 2.8 million single-nucleotide polymorphisms. Nature, 432, 717-22

186
Xiong M., Fan R. & Jin L. (2002) Linkage disequilibrium mapping of quantitative trait loci under truncation selection. Hum Hered, 53, 158-72
Xiong M. & S. W. Guo (1997) Fine-scale genetic mapping based on linkage disequilibrium:
theory and applications. Am J Hum Genet, 60, 1513-31 Xu S. (1995) A comment on the simple regression method for interval mapping. Genetics, 141,
1657-9 Xu S. (1998) Further investigation on the regression method of mapping quantitative trait loci.
Heredity, 80, 364-73 Yamamoto Y., Okada I., Matsuda H., Okabayashi H. & Mizutani M. (1991) Genetic resistance to
a Marek's disease transplantable tumor cell line in chicken lines selected for different immunological characters. Poult Sci, 70, 1455-61
Yamashita S. & Wakazono K. (2005) Expression quantitative trait loci analysis of 13 genes in
the rat prostate. Genetics, 171, 1231-8 Yang J.J., Preston G.A., Alcorta D.A., Waga I., Munger W.E., Hogan S.L., Sekura S.B., Phillips
B.D., Thomas R.P., Jennette J.C. & Falk R.J. (2002) Expression profile of leukocyte genes activated by anti-neutrophil cytoplasmic autoantibodies (ANCA). Kidney Int, 62, 1638-49
Yaspo M.L. (2001) Taking a functional genomics approach in molecular medicine. Trends Mol
Med, 7, 494-501 Yonash N., Cheng H.H., Hillel J., Heller D.E. & Cahaner A. (2001) DNA microsatellites linked
to quantitative trait loci affecting antibody response and survival rate in meat-type chickens. Poult Sci, 80, 22-8
Yonash N., Leitner G., Waiman R., Heller E.D. & Cahaner A. (1996) Genetic differences and
heritability of antibody response to Escherichia coli vaccination in young broiler chicks. Poult Sci, 75, 683-90
Yoo B.H. & Sheldon B.L. (1992) Association of the major histocompatibility complex with
avian leukosis virus infection in chickens. Br Poult Sci, 33, 613-20 Young C.R., Deacon N.J., Ebringer A. & Davies D.A. (1976) Genetic control of the immune
response to ferritin in mice. J Immunogenet, 3, 199-205 Yuan, Q. & W. A. Walker (2004) Innate immunity of the gut: mucosal defense in health and
disease. J Pediatr Gastroenterol Nutr, 38, 463-73

187
Yunis R., Ben-David A., Heller E.D. & Cahaner A. (2002) Antibody responses and morbidity following infection with infectious bronchitis virus and challenge with Escherichia coli, in lines divergently selected on antibody response. Poult Sci, 81, 149-59
Zhang K., & Calabrese P. (2002) Haplotype block structure and its applications to association
studies: power and study designs. Am J Hum Genet, 71, 1386-94. Zhou H., Li H. & Lamont S.J. (2003) Genetic markers associated with antibody response
kinetics in adult chickens. Poult Sci, 82, 699-708

188
VITA
Tuoyu Geng was born in 1967 in Yangzhou, Jiangsu Province, China. He received his
B.S. degree in Animal Science in 1989 and M.S. degree in Animal breeding and Genetics in
1992 from Yangzhou University. He then joined the Institute of Poultry Science, Chinese
Academy of Agriculture Science as a research assistant. He was appointed as research associate
in 1993, research assistant professor in 1995, and research associate professor in 2001. He
moved to Blacksburg, VA and worked in Dr. Ed Smith’s Lab as a visiting scholar in 2002. He
was appointed as research associate in the next year. In the fall of 2005, he began his Ph.D. study
under the direction of Dr. Ed Smith in the Department of Animal and Poultry Sciences, Virginia
Tech. He earned a Ph.D. in Spring 2007. He is a member of Sigma Xi, the Scientific Research
Society.


