Embed Size (px)
Citation preview

Genotype × Environment Interaction and AMMI Analysis
for Heat Tolerance in Wheat
S. SAREEN1*, R. MUNJAL
2, N.B. SINGH3, B.N. SINGH
4, R.S. VERMA5, B.K. MEENA
1,
J. SHORAN1, A.K. SARIAL
6 and S.S. SINGH1
1Directorate of Wheat Research, Karnal 132001 (Haryana), India2Department of Plant Breeding & Genetics, CCSHAU, Hisar 125004 (Haryana), India
3CSAUAT, Kanpur 208002 (U.P.), India4NDUA&T, Kumarganj, Faizabad 224001 (U.P.), India
5GBPUA&T, Pantnagar 263145 (Uttarakhand), India6CCSHAU Campus Kaul 136021(Haryana), India
(Received 11 April 2011; accepted 8 June 2011)
Terminal heat, which is referred as increase in temperature during grain filling, is one of the
important stress factors for wheat production. Current estimates indicate that wheat crop
grown on around 13.5 m ha in India is affected by heat stress. In order to meet the challenges of
high temperature ahead of global warming, concerted efforts are needed to evaluate
germplasm for heat tolerance and identify and develop genotypes suitable for such stressed en-
vironments. The advanced wheat genotypes developed for stress and normal environments by
different research centers were evaluated across 7 locations representing varied agroclimatic
zones during 2007–08 and 2008–09 to study their adaptability for heat stress and non-stress
environments. The additive main effects and multiplicative interaction analysis for G × E in-
teractions revealed differences amongst locations to phenology and grain yield. Genotype RAJ
4083 developed for cultivation under late sown conditions in peninsular zone was also found
adaptable to timely sown conditions. Similarly, HD 2733 a cultivar of NEPZ timely sown con-
ditions and PBW 574 an advanced breeding line of NWPZ late sown conditions was found
adapted to Peninsular zone. The cultivar RAJ 3765 showed specific adaptability to Pantnagar
in NWPZ. Genotype NW 3069 developed for NEPZ timely sown conditions have shown
adaptability to number of locations; timely sown conditions at Karnal and Hisar in NWPZ and
Niphad in PZ. Likewise, WH 1022 developed for NEPZ late sown conditions exhibited spe-
cific adaptability to all timely sown locations in NWPZ.
Keywords: G × E interaction, adaptability, heat stress, grain yield, wheat (Triticum
aestivum L.)
Introduction
Terminal heat, which is referred as increase in temperature during grain filling, is one of
the important stress factors for wheat production. It is responsible for decline in wheat pro-
duction in many environments around the world covering 36 m ha (Hays et al. 2007). In
0133-3720/$20.00 © 2012 Akadémiai Kiadó, Budapest
Cereal Research Communications 40(2), pp. 267–276 (2012)DOI: 10.1556/CRC.40.2012.2.11
* Corresponding author; E-mail: [email protected]
South East Asia, a significant wheat growing area is affected by heat stress and majority of
this lies in Eastern Gangetic Plains, central and peninsular parts of India. Heat stress in
North Western parts of the Indian Gangetic Plains is though moderate but is considered
important due to the major contribution of this region in the total wheat production of the
country. Current estimates indicate that wheat crop grown on around 13.5 m ha in India is
affected by heat stress (Joshi et al. 2007). Both the proximity to the equator and the popu-
lar rice–wheat cropping systems, which involve late sowing of wheat are the major causes
of exposure of wheat in India and other neighboring countries to high temperatures during
grain filling (Rane et al. 2000). It is reported that the ‘cool period’ for wheat crop in India
is shrinking, while the threat of terminal heat stress is expanding (Rane et al. 2000; Joshi
et al. 2007). The global warming is likely further added to the rise in temperature (Lillemo
et al. 2005). Transitory or constantly high temperatures cause an array of morpho-anatom-
ical, physiological and biochemical changes in plants, which affect its growth and devel-
opment and may lead to a drastic reduction in yield. High temperatures (>30ºC) after
anthesis can decrease the rate of grain filling in wheat (Stone et al., 1995; Wardlaw and
Moncur 1995). During vegetative phase, it affects formation of productive tillers. Expo-
sure to very high temperature (>30ºC) even for short period have also been observed to re-
duce grain yield in wheat (Stone et al. 1995; Ferris et al. 1998). Such incidences of high
temperature are quite common in all wheat growing areas in India, particularly north west-
ern plains zone (NWPZ), north eastern plains zone (NEPZ), central zone (CZ) and penin-
sular zone (PZ). In order to meet the challenges of high temperature ahead of global warm-
ing, concerted efforts are needed to evaluate germplasm for heat tolerance and identify
and develop genotypes suitable for such stressed environments. The Directorate of Wheat
Research, Karnal, India coordinates the wheat research programme in the country. The ad-
vanced wheat genotypes developed for late sown (heat stress) and timely sown (normal)
environments by various research centers were evaluated across locations representing
varied agroclimatic zones. In this paper, we report the G × E interaction and adaptability
for heat stress and non-stress environments of these genotypes.
Materials and Methods
The materials comprised of thirty-six genotypes including advanced breeding lines and
cultivars of wheat developed at various centers under all India coordinated wheat im-
provement programme. Field trials were conducted over two years (2007–08, 2008–09)
under normal (timely) and late sown conditions at seven locations namely Faizabad,
Hisar, Kanpur, Karnal, Niphad, Pantnagar and Sagar representing different agroclimatic
zones of the country. Details of sowing dates and temperature regime during crop season
(November–April) are given in Table S1*. The experiment was laid out in 6 × 6 lattice
square design with two replications at each location. The plot size was 5.4 m2. The seed
rate was 100 kg ha –1, irrigation was applied as per requirement while fertilizer applica-
tions were followed as per recommended packages and practices of the location. Daily
Cereal Research Communications 40, 2012
268 SAREEN et al.: GxE and AMMI Analysis for Heat Tolerance
* Further details about the Electronic Supplementary Material (ESM) can be found at the end of the article.

mean maximum and mean minimum temperatures were recorded for characterization of
environments. Mean minimum and maximum temperatures before and after heading were
calculated by taking into consideration the minimum number of days to heading and maxi-
mum number of days to maturity at respective locations.
The data were recorded for grain yield (gm–2) when plants were fully dry. Data were
subjected to statistical analysis using IRRISTAT computer software. The multivariate ad-
ditive main effects and multiplicative interaction (AMMI) model (Gauch 1988) was used
to analyze data for G × E interaction and for classification of genotypes and environments.
AMMI uses ordinary ANOVA to analyse the main effects (additive part) and Principal
Component Analysis (PCA) to analyse the non additive residual left over by the ANOVA.
The genotype and an environment with the same sign on their respective first PCA axis
have positive interaction and if different, their interaction is negative. Genotypes or envi-
ronments with large PCA 1 scores, either positive or negative had large interactions,
whereas genotypes with PCA 1 score of zero or nearly zero had smaller interaction
(Crossa et al. 1990).
Results
Mean grain yield and heat tolerant genotypes
The genotypic mean grain yield (gm–2) under timely sown (normal) environment and late
sown (heat stress) environment in each location was recorded over two year’s trials. The
average over locations and years and reduction in percent under late over timely environ-
ment is presented in Fig. 1a. It varied from 304 to 406 gm–2 under normal and stress condi-
tions over years and locations. Genotype LOK 54 recorded highest grain yield (406 g)
over all environments and registered minimum reduction of 19% under late sown stress
conditions followed by LOK 1 and PBW 579 (21.4% each), HW 2004 (22.0%) and PBW
574 and HW 2045 (22.3% each) (Fig. 1b). These genotypes were considered heat tolerant
compared to others where reduction was to the extent of 37.7% in HD 2687 and 33.6% in
DBW 22. Of these, genotype LOK 1 and HW 2004 had low grain yield than the popula-
tion mean while HD 2687 and DBW 22 gave high grain yield under timely sown condi-
tions. Grain yield depends upon the interaction among genotype and environment.
Yearwise results of G × E interaction are presented below:
1st year
Genotype × environment interactions
The AMMI analysis showed that there were highly significant differences among the ge-
notypes, environments and G × E interaction. The G × E interaction component of varia-
tion was portioned and explained in four interaction principal component axes (IPCA). All
the IPCA axes were significant (Table 1). The first two IPCA axes, IPCA 1 and IPCA 2 ex-
plained 65.5% of the total interaction variance.
Biplot graphical analysis for IPCA 1 against the environment means (Fig. 2) revealed
that genotype RAJ 4083 had the highest positive IPCA score followed by LOK 54 and
Cereal Research Communications 40, 2012
SAREEN et al.: GxE and AMMI Analysis for Heat Tolerance 269

Cereal Research Communications 40, 2012
270 SAREEN et al.: GxE and AMMI Analysis for Heat Tolerance
Table 1. AMMI analysis of wheat genotypes over locations for 2007-08 and 2008-09
Analysis of variance for AMMI model
Source D.F.Mean sum of squares
2007–08 2008–09
Treatments 35 9083.96** 6522.37**
Locations 13 237909** 506358**
Treatment × sites 455 2405.16** 2607.5**
IPCA component 1 47 7137.72** 8072.29**
IPCA component 2 45 3478.17** 4698.42**
IPCA component 3 43 3187.45** 4154.75**
IPCA component 4 41 2391.8* 2901.19**
GXE residual 279 1316.25 1068.05
* significant at P < 0.05; **significant at P < 0.01
Figure 1a. Grain yield (GY) of different genotypes over locations and years under timely (TS)
and late sown (LS) environments
Figure 1b. Reduction (%) in grain yield of different genotypes over locations and years under
late sown environments
Red
uct
ion
(%)
ing
rain
yie
ld
Genotype
Genotype
Gra
iny
ield
(gm
–2)

HI 1544. The grain yield of these genotypes is higher than the grand mean. Genotypes WH
1022 and NW 2036 had high grain yield but negative IPCA 1 score. SONALIKA, VL 616,
HW 2004 and HS 277 had low grain yield and negative IPCA 1 score. The maximum grain
yield (509.6 gm–2) was recorded in timely sown Hisar environment followed by timely
sown Kanpur and Sagar location. The lowest grain yield was recorded in late sown
Pantnagar environment. The highest positive IPCA score was shown by timely sown
Sagar followed by late sown Niphad. Timely sown Niphad had positive interaction with
genotypes LOK 54, RAJ 4083 and HI 1544 and negative interaction with NW 2036 and
WH 1022. On the contrary, timely sown Hisar had highest negative IPCA 1 score and
hence, had negative interaction with LOK 54, RAJ 4083 and HI 1544 and positive interac-
tion with NW 2036 and WH 1022.
Genotypes RAJ 4101 and HW 5021 had IPCA score near zero and grain yield more
than the grand mean and hence, can be considered as stable. Genotypes LOK 54 and HI
Cereal Research Communications 40, 2012
SAREEN et al.: GxE and AMMI Analysis for Heat Tolerance 271
Figure 2. AMMI biplot graph for IPCA 1 and grain yield during first year.
Genotypes plotted as numerical numbers and environments as alphabets
Legend for Figures 2 – 5
1 COW(W)-1 10 LOK54 19 HW5021 28 PBW574 A Faizabad-T I Niphad-T
2 DBW14 11 HI1539 20 K0307 29 PBW575 B Faizabad-L J Niphad-L
3 DBW22 12 HI1544 21 K9107 30 PBW579 C Hisar-T K Pantnagar-T
4 HD2687 13 HS240 22 RAJ4101 31 RAJ3765 D Hisar-L L Pantnagar-L
5 HD2733 14 HS375 23 RAJ4037 32 RAJ4083 E Kanpur-T M Sagar-T
6 HD2781 15 WH1021 24 LOK1 33 VL 616 F Kanpur-L N Sagar-L
7 HD2824 16 WH147 25 NW2036 34 WH1022 G Karnal-T
8 SONALIKA 17 HW2004 26 NW3069 35 WH542 H Karnal-L
9 HS277 18 HW2045 27 NW(S) 2-4 36 PBW373
Mean
IPC
A1

1544 were adapted to timely sown Niphad environment, where as genotypes DBW 22,
HD 2824, WH 1021, NW 2036 and WH 1022 with negative IPCA score were adapted to
timely sown Faizabad, Karnal and Pantnagar locations.
The biplot graphical analysis for IPCA 2 (Fig. 3) showed that genotypes HS 375 and K
0307 had the highest positive IPCA 2 score but their mean grain yield was less than grand
mean. Genotypes RAJ 4037 and HI 1539 had high positive IPCA 2 score and grain yield
more than the grand mean. Besides, genotypes PBW 574, NW 3069, RAJ 4083, RAJ
3765, COW (W)-1 and HD 2733 had positive IPCA 2 score and higher grain yield. Envi-
ronments timely sown Faizabad, Niphad, Kanpur and late sown Hisar had high positive
IPCA scores. These environments had positive interaction with number of genotypes like
HI 1539, NW 3069 and RAJ 4083 and negative with DBW 22, HI 1544 and HW 5021. En-
vironments timely sown Hisar, Pantnagar and Karnal had negative IPCA 2 scores. Geno-
type PBW 579 had near zero value and mean higher than the grand mean where as geno-
type PBW 575 had mean grain yield at par with grand mean and hence, may be considered
as stable.
Classification of environments
The AMMI IPCA 1 divided all 14 environments into four groups: Group I comprised
timely sown Sagar, Faizabad, Niphad and late sown Sagar representing hot sites having
higher minimum (16.1ºC) and maximum (33.4ºC) temperatures during grain growth and
higher average temperature (21.3ºC) during cropping. Group II comprised late sown
Kanpur, Karnal and Pantnagar with negative IPCA score. These locations were hotter but
the mean maximum temperature during grain growth period was slightly less. In group III,
Hisar late was placed along with timely Faizabad, Hisar, Kanpur, Karnal and Pantnagar.
This group was characterized by mean maximum temperature during grain growth period
Cereal Research Communications 40, 2012
272 SAREEN et al.: GxE and AMMI Analysis for Heat Tolerance
Figure 3. AMMI biplot graph for IPCA 2 and grain yield during first year.
Genotypes plotted as numerical numbers and environments as alphabets
Mean
IPC
A2

around 30ºC. Group IV had Niphad timely sown only with high 7th week mean maximum
temperature (29.8ºC) but mean maximum temperature below 30ºC. All the timely sown
locations except Sagar and late sown Hisar gave higher grain yield while Sagar timely and
all late sown locations except Hisar late recorded lower yield.
2nd year
Genotype × environment interactions
The AMMI analysis for 2nd year also showed significant differences among the geno-
types, environments and G × E interaction. All the four IPCA axes were significant. The
first two IPCA axes, IPCA 1 and IPCA 2 explained 64.4% of the total interaction variance.
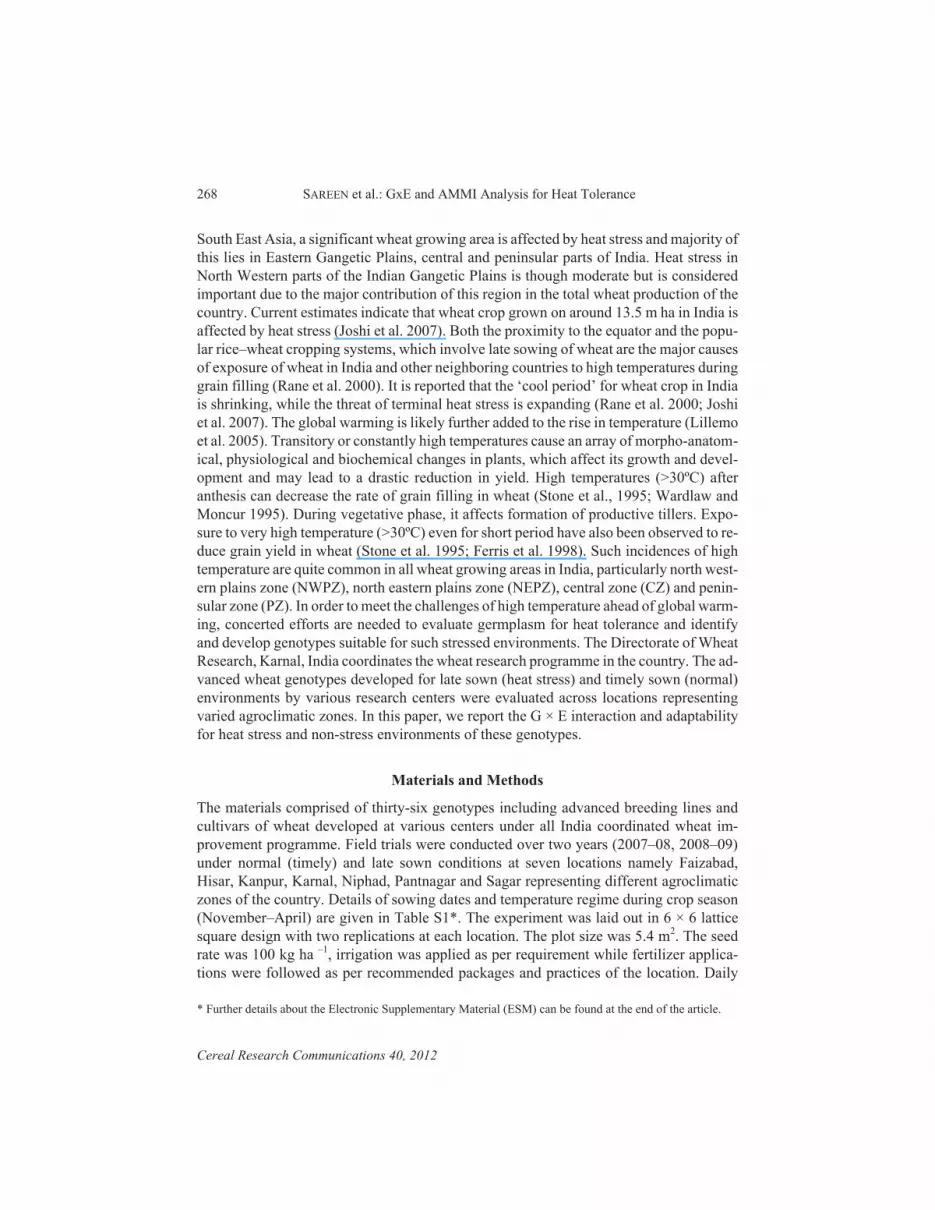
Biplot graphical analysis for IPCA 1 against the environment means (Fig. 4) revealed
that the genotype HW 2004 had the highest IPCA score followed by LOK 54, HS 277 and
WH 1022. The mean grain yield of these genotypes was higher than the grand mean. Ge-
notypes K 9107, HI 1544, HW 2045, HS 375, HS 240, HI 1539, RAJ 3765 and HD 2687
though had high grain yield but negative IPCA 1 score while NW 2036, WH 147 and
SONALIKA registered low grain yield with negative IPCA 1 score. The highest grain
yield (574.5 gm–2) was recorded in timely sown Sagar location followed by timely Hisar,
timely Kanpur, late Hisar and timely sown Pantnagar location. The lowest grain yield was
recorded in late sown Karnal site. The highest positive IPCA score was obtained in timely
sown Hisar followed by late Niphad and late sown Pantnagar environment. Environments
timely and late sown Hisar and timely sown Kanpur exhibited positive interaction with
three genotypes namely LOK 54, PBW 579 and WH 1022 and negative with equal num-
ber of genotypes viz; HD 2687, RAJ 3765 and HI 1539. On the contrary, timely sown
Sagar showed the highest negative IPCA 1 score followed by timely sown Pantnagar and
late Sagar and hence had negative interaction with LOK 54, PBW 579 and WH 1022 and
positive interaction with HD 2687, RAJ 3765 and HI 1539.
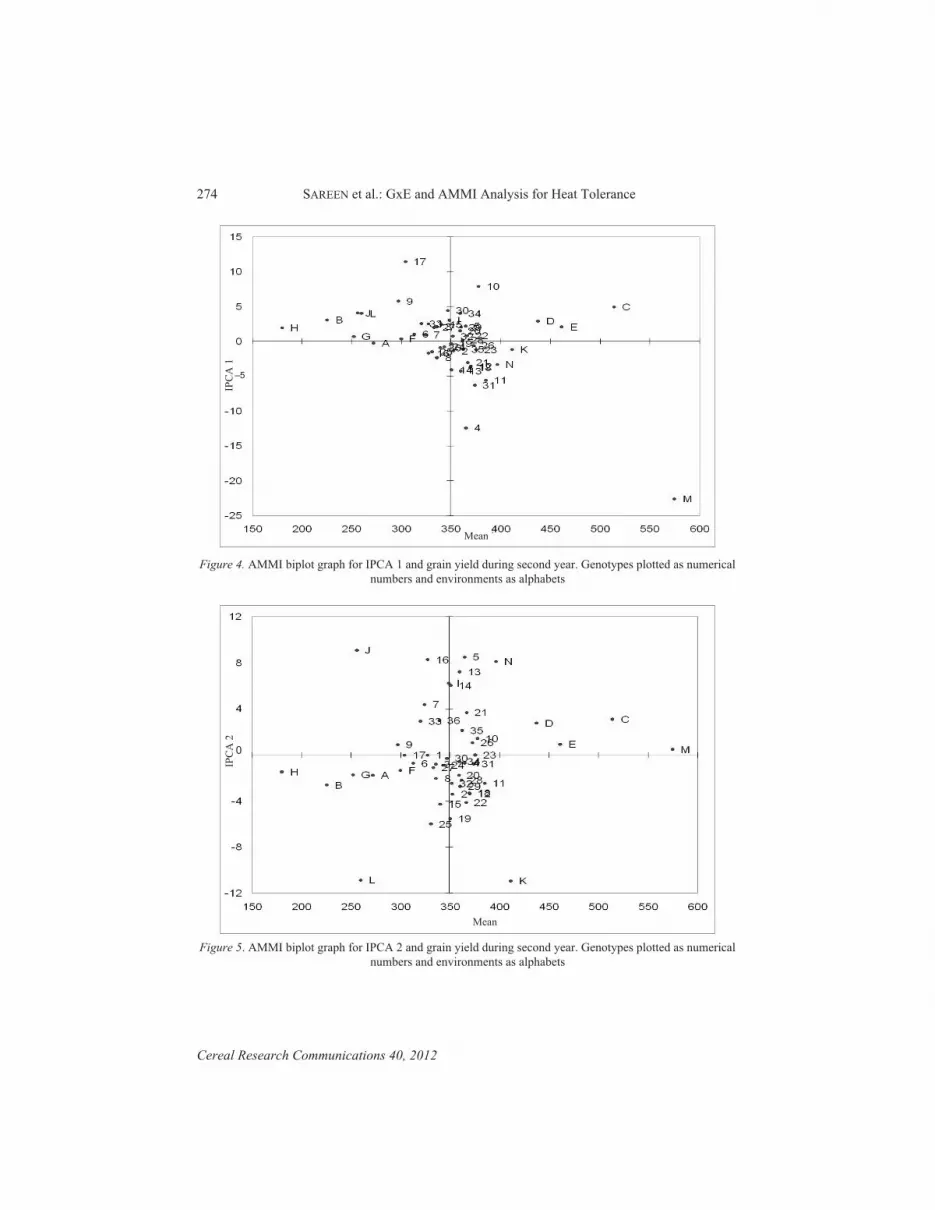
The biplot graphical analysis for IPCA 2 (Fig. 5) showed that genotype HD 2733 had
the highest IPCA 2 score followed by HS 240, HS 375 and K 9107. Environments timely
and late sown Niphad and late sown Sagar showed high positive IPCA scores. Timely and
late sown Hisar, timely Kanpur, timely and late Sagar and timely sown Niphad had posi-
tive interaction with HD 2733, HS 240, HS 375, K 9107, WH 542, LOK 54 and NW 3069
and negative with HW 5021 and RAJ 4101. Environments timely and late sown Pantnagar
had negative IPCA 2 scores. Genotype RAJ 4037 recorded zero IPCA score with mean
grain yield higher than the grand mean, hence identified to be stable. Genotype HW 2004
also had near zero IPCA score but its mean grain yield was less than the grand mean.
Classification of environments
The AMMI IPCA 2 divided all 14 environments into three groups: Group I comprised
timely and late sown Sagar and timely Pantnagar representing hot environments having
minimum (14.9ºC) and maximum (30.8ºC) temperatures during grain growth duration.
Group II comprised timely and late sown Faizabad, timely and late Karnal, timely and late
Niphad, late Kanpur and late sown Pantnagar. Both groups were represented by hot sites
Cereal Research Communications 40, 2012
SAREEN et al.: GxE and AMMI Analysis for Heat Tolerance 273
Cereal Research Communications 40, 2012
274 SAREEN et al.: GxE and AMMI Analysis for Heat Tolerance
Figure 4. AMMI biplot graph for IPCA 1 and grain yield during second year. Genotypes plotted as numerical
numbers and environments as alphabets
Figure 5. AMMI biplot graph for IPCA 2 and grain yield during second year. Genotypes plotted as numerical
numbers and environments as alphabets
–5
IPC
A1
Mean
Mean
0
IPC
A2

but group I had higher minimum temperature than group II. In group III timely and late
sown Hisar and timely Kanpur were clubbed having cooler temperatures. All the timely
sown environments except Sagar gave higher grain yield where as all late sown environ-
ments except Hisar produced lower grain yield.
Discussion
Genetic diversity for heat tolerance in cultivated wheat is well established. The patterns of
heat stress may vary widely among wheat growing regions indicating genotype by envi-
ronment interaction.
The criterion based on the magnitude of grain yield reduction of a genotype under nor-
mal and stress conditions led to identify LOK 54, LOK 1, PBW 579, HW 2004, PBW 574
and HW 2045 as heat tolerant and HD 2627 and DBW 22 as heat sensitive genotypes.
The AMMI analysis of genotypes, comprising heat tolerant and heat sensitive geno-
types revealed differences in response of locations to phenology and grain yield during
both the years of study. The two locations namely, Faizabad and Kanpur in north eastern
plains zone experienced less reduction in grain yield in second year. This was due to lower
temperatures during grain growth period in that year. However, the pre-heading tempera-
tures at these locations were higher. Two of the three locations namely, Hisar and Karnal
in NWPZ suffered more reduction in grain yield in second year of experimentation. It was
attributed to high temperatures through out growing season at Karnal where as at Hisar the
mean maximum temperature during seventh week of planting in second year was signifi-
cantly higher. At Pantnagar, mean maximum temperature during the seventh week of
planting during both years of experimentation was almost identical. Rane et al. (2007)
suggested that mean maximum temperature of seventh week after planting was positively
and significantly correlated with final grain yield of genotypes. Differences in tempera-
tures during pre-heading phase were mainly responsible for reduction in grain yield at
Sagar. The performance of genotypes was influenced by temperatures before as well as af-
ter heading. The superior performance of genotypes under hot environments was gov-
erned by tolerance at post-anthesis as well as pre-anthesis thermal stress. None of the envi-
ronment groups showed post-anthesis mean maximum temperature greater than 35ºC, al-
though most of these locations did experience severe temperatures during grain growth as
was evident from mean temperatures closer to 35ºC particularly at Sagar and Niphad. The
temperatures above 35ºC severely affect grain filling (Stone et al. 1995; Ferris et al. 1998).
In our studies also, minimum reduction (7.6%) in grain yield was recorded at Hisar and
maximum (40%) at Kanpur and Pantnagar during first year of crop experimentation. Hisar
experienced temperatures above 35ºC only during last week of crop maturity where as
Kanpur and Pantnagar registered near or above 35ºC temperatures throughout grain filling
period.
According to AMMI analysis for 2 consecutive years, genotypes LOK 54, RAJ 4083,
HD 2733, HI 1539 and PBW 574 were found adapted to Niphad (Peninsular zone) timely
sown conditions. Although genotypes LOK 54 and RAJ 4083 were developed for cultiva-
tion under timely and late sown conditions in peninsular zone, respectively yet, the find-
Cereal Research Communications 40, 2012
SAREEN et al.: GxE and AMMI Analysis for Heat Tolerance 275

ings revealed that RAJ 4083 could also be cultivated under timely sown conditions. Simi-
larly, HD 2733 a cultivar of NEPZ timely sown conditions and PBW 574 an advanced
breeding line of NWPZ late sown conditions could also be grown in Peninsular zone. Pen-
insular zone represented by Niphad was a warm location as compared to other locations
particularly in NWPZ. Therefore, the varieties developed for late sown conditions in
NWPZ might also perform well in this zone under timely sown conditions. The perfor-
mance of genotype PBW 574 was an evidence in this case. The cultivar RAJ 3765 was
adapted to Pantnagar timely sown conditions as both the genotype and environment (loca-
tion) had negative IPCA values consecutively for two years. Although RAJ 3765 is rec-
ommended for NWPZ and NEPZ under late and very late sown conditions, it showed spe-
cific adaptability to Pantnagar in NWPZ. The genotype NW 3069 was developed for
NEPZ timely sown conditions have shown adaptability to number of locations viz; timely
sown conditions at Karnal and Hisar in NWPZ and Niphad in PZ. Likewise, WH 1022 was
developed for NEPZ late sown conditions but had exhibited specific adaptability to all
timely sown locations in NWPZ.
References
Crossa, J., Gauch, H.G.J., Zobel, R.W. 1990. Additive main effects and multiplicative interaction analysis of two
international maize cultivar trials. Crop Sci. 30:493–500.
Ferris, R., Ellis, R., Wheeler, T.R., Hadley, P. 1998. Effect of high temperature stress at anthesis on grain yield
and biomass of field grown crops of wheat. Ann. Bot. (Lond.) 82:631–639.
Gauch, H.G. 1988. Model selection and validation for yield trials with intraction. Biometrics 44:705–715.
Hays, D., Mason, E., HwaDo, J., Menz, M., Reynolds, M. 2007. Expression of quantitative trait loci mapping
heat tolerance during reproductive development in wheat (T. aestivum). In: Buck, H.T., Nisi, J.E., Salomón,
N. (eds), Wheat Production in Stressed Environments. Springer, Netherlands, Amsterdam, pp. 373–382.
Joshi, A.K., Mishra, B., Chatrath, R., Ortiz Ferrara, G., Singh, R.P. 2007. Wheat improvement in India: Present
status, emerging challenges and future prospects. Euphytica 157:431–446.
Lillemo, M., van Ginkel, M., Trethowan, R.M., Hernandez, E., Crossa, J. 2005. Differential adaptation of
CIMMYT bread wheat to global high temperature environments. Crop Sci. 45:2443–2453.
Rane, J., Pannu, R.K., Sohu, V.S., Saini, R.S., Mishra, B., Shoran, J., Crossa, J., Vargas, M., Joshi, A.K. 2007.
Performance of yield and stability of advanced wheat genotypes under heat stress environments of the
Indo-Gangetic plains. Crop Sci. 47:1561–1573.
Rane, J., Shoran, J., Nagarajan, S. 2000. Heat stress environments and impact on wheat productivity in India:
Guestimate of losses. Indian Wheat Newsl. 6:5–6.
Stone, P.J., Savin, R., Wardlaw, I.F., Nicolas, M.E. 1995. The influence of recovery temperature on the effects of
a brief heat shock on wheat: I. Grain growth. Aust. J. Plant Physiol. 22:945–954.
Ward, J.H. Jr. 1963. Hierarchical grouping to optimize an objective function. J. Am. Stat. Assoc. 58:236–244.
Wardlaw, I.F., Moncur, L. 1995. The response of wheat to high temperature following anthesis: I. The rate and
duration of kernel filling. Aust. J. Plant Physiol. 22:391–397.
Electronic Supplementary Material (ESM)
Electronic Supplementary Material (ESM) associated with this article can be found at the
website of CRC at http://www.akademiai.com/content/120427/
Electronic Supplementary Table S1. Effect of salinity, inoculation with Azusprillium and molybdenum
fertilizer on yield components. carbohydrates and protein content of barley
Cereal Research Communications 40, 2012
276 SAREEN et al.: GxE and AMMI Analysis for Heat Tolerance


