Embed Size (px)
Citation preview
Genotyping of
Pseudomonas aeruginosa isolates from
pulmonary infections in non-cystic
fibrosis bronchiectasis patients
Thesis submitted in accordance with the requirements of the
University of Liverpool for the degree of Master of Philosophy by
Yasmin Kate Hilliam
October 2015
Abstract .............................................................................................................................. i
Acknowledgements ...........................................................................................................ii
Contributions .................................................................................................................... iii
Abbreviations .................................................................................................................... v
Introduction ...................................................................................................................... 1
1.1 Bronchiectasis .......................................................................................................... 1
1.1.1 Cystic fibrosis .................................................................................................... 2
1.1.2 Non-cystic fibrosis bronchiectasis .................................................................... 2
1.1.3 Lack of research into non-cystic fibrosis bronchiectasis .................................. 7
1.1.4 Prevalent microbial pathogens ......................................................................... 8
1.2 Pseudomonas aeruginosa ..................................................................................... 10
1.2.1 Pathogenicity in chronic lung infections ......................................................... 15
1.2.2 Epidemic (transmissible) strains of Pseudomonas aeruginosa ...................... 17
1.2.2.1 Antibiotic resistance among epidemic strains of Pseudomonas aeruginosa
.............................................................................................................................. 23
1.2.3 Hypermutable strains of Pseudomonas aeruginosa ....................................... 25
1.2.4 Genomic polymorphism in chronic Pseudomonas aeruginosa strains .......... 27
1.2.5 Genotyping of Pseudomonas aeruginosa ....................................................... 29
1.2.6 Whole genome sequencing of Pseudomonas aeruginosa ............................. 33
1.3 Aims ....................................................................................................................... 36
Methods and Materials .................................................................................................. 38
2.1 Collection and storage of isolates ......................................................................... 38
2.2 PCR amplification screening .................................................................................. 38
2.3 Clondiag/Alere Array Tube genotyping ................................................................. 40
2.3.1 Layout of the AT chip ...................................................................................... 45
2.3.2 Interpretation of the AT chip .......................................................................... 45
2.3.3 Hexadecimal code conversion ........................................................................ 46
2.4 Genomic DNA extraction for Illumina sequencing ................................................ 50
2.4.1 Quantification of genomic DNA by Qubit fluorometer .................................. 50
2.4.2 Quantification and purity testing of genomic DNA by NanoDrop
spectrophotometer.................................................................................................. 51
2.5 Whole genome sequencing ................................................................................... 52
2.5.1 Data acquisition .............................................................................................. 52
2.5.2 Genome assembly........................................................................................... 52
2.5.3 Core genome extraction ................................................................................. 52
2.5.4 Phylogeny ........................................................................................................ 53
2.5.5 Variant calling ................................................................................................. 53
2.6 eBURST algorithm .................................................................................................. 55
Longitudinal study of chronic Pseudomonas aeruginosa infections in non-cystic fibrosis
bronchiectasis patients .................................................................................................. 56
3.1 Introduction ........................................................................................................... 56
3.1.1 Maintenance of Pseudomonas aeruginosa strains in cystic fibrosis patients 56
3.1.2 Transmissible strains of Pseudomonas aeruginosa in CF patients ................. 59
3.1.2 Maintenance and transmission of Pseudomonas aeruginosa strains in non-
cystic fibrosis bronchiectasis patients ..................................................................... 61
3.2 Aims ....................................................................................................................... 63
3.3 Results ................................................................................................................... 63
3.3.1 Panel of isolates .............................................................................................. 63
3.3.2 Array Tube hexadecimal codes ....................................................................... 63
3.3.3 Array Tube accessory genome markers.......................................................... 64
3.3.4 Presence of highly prevalent Pseudomonas aeruginosa clones..................... 69
3.3.5 Population structure of non-cystic fibrosis bronchiectasis Pseudomonas
aeruginosa isolates .................................................................................................. 72
3.3.6 Poor hybridisation at exoS and exoU variable gene markers ......................... 76
3.3.7 Transmissible strains of Pseudomonas aeruginosa in non-cystic fibrosis
bronchiectasis patients ............................................................................................ 76
3.4 Discussion .............................................................................................................. 84
3.4.1 Maintenance of Pseudomonas aeruginosa strains in non-cystic fibrosis
bronchiectasis patients ............................................................................................ 84
3.4.2 Pseudomonas aeruginosa strains from non-cystic fibrosis bronchiectasis
patients in the context of the wider CF population ................................................ 87
3.5 Conclusions ............................................................................................................ 94
Use of genome sequencing to study the diversity of Pseudomonas aeruginosa isolates
from non-cystic fibrosis bronchiectasis patients .......................................................... 95
4.1 Introduction ........................................................................................................... 95
4.1.1 Diversity of Pseudomonas aeruginosa isolates in cystic fibrosis patients...... 95
4.1.2 Diversity of Pseudomonas aeruginosa isolates in non-cystic fibrosis
bronchiectasis patients .......................................................................................... 101
4.2 Aims ..................................................................................................................... 103
4.3 Results ................................................................................................................. 103
4.3.1 Panel of isolates ............................................................................................ 103
4.3.1.1 Multiple isolates from three patients to investigate within patient diversity
of Pseudomonas aeruginosa .............................................................................. 106
4.3.4 Distribution of non-cystic fibrosis bronchiectasis isolates among the general
population .............................................................................................................. 114
4.3.5 Distribution and population structure of isolates from non-cystic fibrosis
bronchiectasis patients in England and Wales ...................................................... 114
4.3.6 Evidence for multiple Pseudomonas aeruginosa strain types within non-cystic
fibrosis bronchiectasis patients ............................................................................. 118
4.3.7 Multilocus sequence typing of isolates ........................................................ 121
4.4 Discussion ............................................................................................................ 128
4.4.1 Diversity of Pseudomonas aeruginosa isolates from adult bronchiectasis
centres in England and Wales ................................................................................ 128
4.4.1.1 Transmissible strains of Pseudomonas aeruginosa in non-cystic fibrosis
bronchiectasis patients from England and Wales .............................................. 131
4.4.2 Diversity of Pseudomonas aeruginosa isolates from individual non-cystic
fibrosis bronchiectasis patients ............................................................................. 131
4.4.2.1 Diversity of multiple Pseudomonas aeruginosa isolates from three non-
cystic fibrosis bronchiectasis patients attending the Liverpool bronchiectasis
service ................................................................................................................ 133
4.5 Conclusions .......................................................................................................... 135
General Discussion ....................................................................................................... 136
Appendix ....................................................................................................................... 142
References .................................................................................................................... 197
i
Genotyping of Pseudomonas aeruginosa isolates from pulmonary infections in non-
cystic fibrosis bronchiectasis patients
Yasmin Kate Hilliam – October 2015
Abstract
Non-cystic fibrosis bronchiectasis (NCFBr) is a chronic, progressive respiratory
disease characterised by irreversible widening of the airways and thickening of the
bronchial walls. There have been large amounts of research into cystic fibrosis (CF) and
very little into NCFBr, despite its prevalence in the UK having been predicted to be >10
times that of CF. The leading cause of mortality in CF is chronic bacterial lung infection,
particularly with Pseudomonas aeruginosa. Transmissible strains of P. aeruginosa are
associated with increased morbidity and mortality in CF. Chronic P. aeruginosa infections
are also known to adversely affect the health of NCFBr patients although very little in-
depth research has been performed. This work aims to investigate the diversity of
populations of P. aeruginosa in NCFBr patients attending bronchiectasis services
throughout England and Wales. The maintenance of P. aeruginosa strains in long-term
infections in the lungs of NCFBr patients were investigated using an array tube
genotyping system. The majority (15) of the 20 patients studied were found to maintain
the same strain of P. aeruginosa throughout the course of infection. The population
structure of P. aeruginosa isolates from NCFBr patients was investigated using both the
array tube system and whole genome sequencing. The population of isolates from NCFBr
patients was found to be distributed evenly throughout the general population of P.
aeruginosa. Whole genome sequencing was also used to investigate the diversity of P.
aeruginosa isolates from 23 individual patients and it was shown that in the majority of
these (16) that all isolates were the same strain and closely related to one another. Only
one of the 157 NCFBr patients was found to harbour a transmissible strain of P.
aeruginosa which is a significantly lower prevalence than in CF. There is still a large
disparity between our knowledge regarding CF and NCFBr and so further research into
P. aeruginosa infections in NCFBr is required.

ii
Acknowledgements
I am incredibly grateful to have been given the chance to continue with my
studies and especially to have been able to do so with the support of a fantastic group
of people. The guidance offered by Jo Fothergill and Craig Winstanley throughout my
time in the laboratory and whilst writing this thesis has been invaluable and greatly
appreciated. In particular, I am thankful for Jo’s patience in teaching me a wide variety
of practical techniques in the time I have been under her supervision and her unfaltering
support, without which I would not have come away from my education with skills and
knowledge that I have today.
I am indebted (literally and figuratively) to my parents who have supported me
throughout the duration of my time at university and without whom none of this would
have been possible. Finally, my thanks go to Josh who has endured hours of travel on
British public transport systems to keep me company throughout my studies and who
suffered the majority of my whinging whilst writing this thesis without any complaint of
his own.
iii
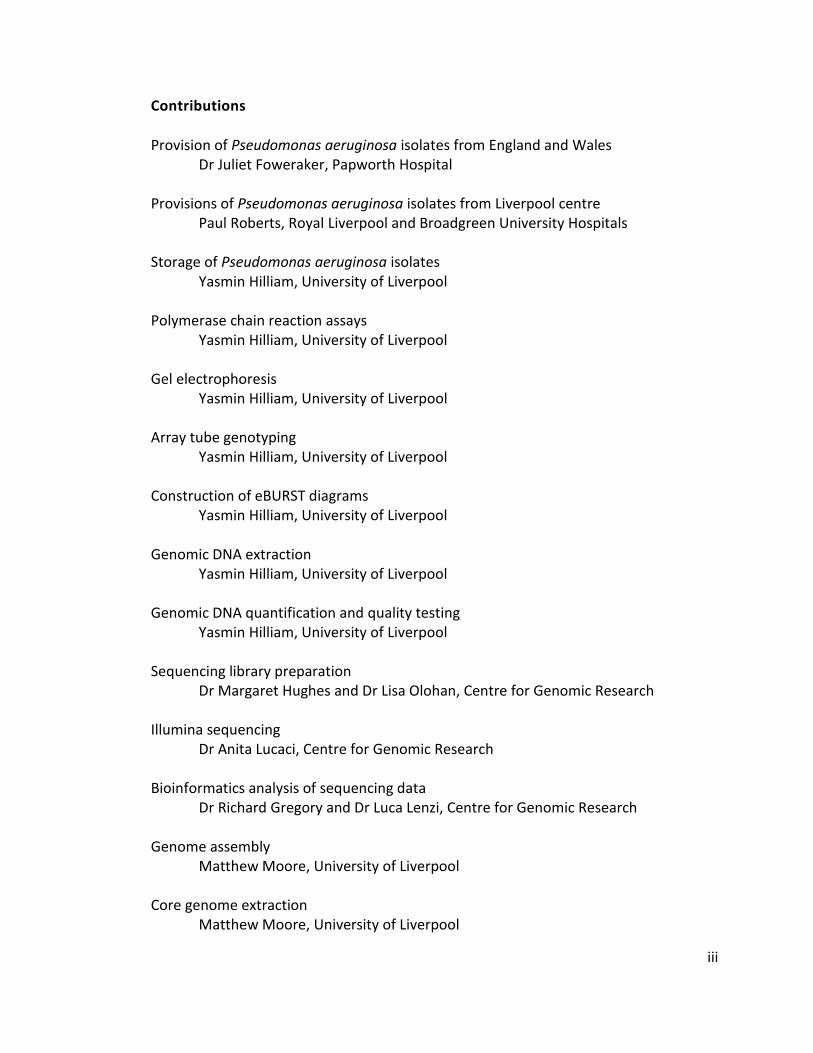
Contributions
Provision of Pseudomonas aeruginosa isolates from England and Wales Dr Juliet Foweraker, Papworth Hospital Provisions of Pseudomonas aeruginosa isolates from Liverpool centre Paul Roberts, Royal Liverpool and Broadgreen University Hospitals Storage of Pseudomonas aeruginosa isolates Yasmin Hilliam, University of Liverpool Polymerase chain reaction assays Yasmin Hilliam, University of Liverpool Gel electrophoresis Yasmin Hilliam, University of Liverpool Array tube genotyping Yasmin Hilliam, University of Liverpool Construction of eBURST diagrams Yasmin Hilliam, University of Liverpool Genomic DNA extraction Yasmin Hilliam, University of Liverpool Genomic DNA quantification and quality testing Yasmin Hilliam, University of Liverpool Sequencing library preparation Dr Margaret Hughes and Dr Lisa Olohan, Centre for Genomic Research Illumina sequencing Dr Anita Lucaci, Centre for Genomic Research Bioinformatics analysis of sequencing data Dr Richard Gregory and Dr Luca Lenzi, Centre for Genomic Research Genome assembly Matthew Moore, University of Liverpool Core genome extraction Matthew Moore, University of Liverpool

iv
Construction of phylogenetic tree Matthew Moore, University of Liverpool Variant calling Matthew Moore, University of Liverpool
v
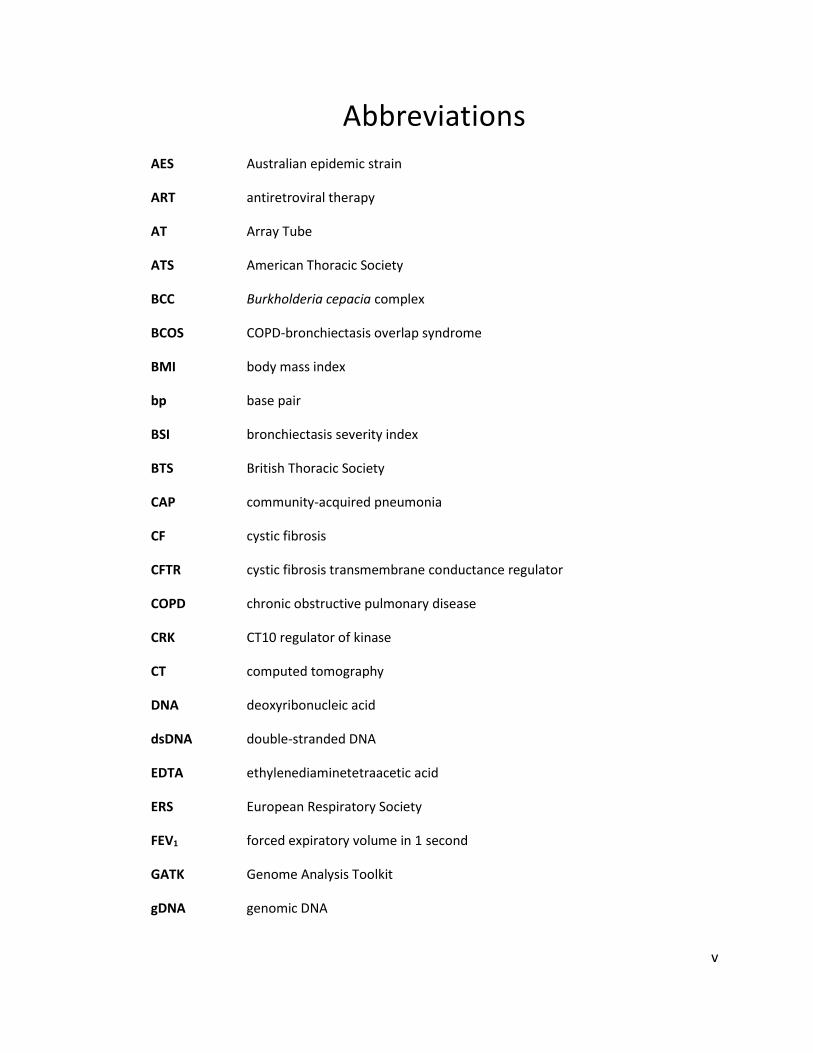
Abbreviations
AES Australian epidemic strain
ART antiretroviral therapy
AT Array Tube
ATS American Thoracic Society
BCC Burkholderia cepacia complex
BCOS COPD-bronchiectasis overlap syndrome
BMI body mass index
bp base pair
BSI bronchiectasis severity index
BTS British Thoracic Society
CAP community-acquired pneumonia
CF cystic fibrosis
CFTR cystic fibrosis transmembrane conductance regulator
COPD chronic obstructive pulmonary disease
CRK CT10 regulator of kinase
CT computed tomography
DNA deoxyribonucleic acid
dsDNA double-stranded DNA
EDTA ethylenediaminetetraacetic acid
ERS European Respiratory Society
FEV1 forced expiratory volume in 1 second
GATK Genome Analysis Toolkit
gDNA genomic DNA
vi
GER gastro-oesophageal reflux
HIV human immunodeficiency virus
HRCT high resolution computed tomography
HSL homoserine lactone
IPC International Pseudomonas aeruginosa Consortium
LB Luria broth
LES Liverpool epidemic strain
MES Manchester epidemic strain
MGEs mobile genetic elements
MIC minimum inhibitory concentration
MLST multilocus sequence typing
MLVA multiple-locus variable number tandem repeat analysis
MRC Medical Research Council
MRCA most recent common ancestor
MRSA methicillin-resistant Staphylococcus aureus
NCFBr non-cystic fibrosis bronchiectasis
NDK nucleoside diphosphate kinase
NGS next generation sequencing
NTHi nontypable Haemophilus influenzae
NTM non-tuberculosis mycobacterium
PCR polymerase chain reaction
PES Prairie Epidemic Strain
PFGE pulsed-field gel electrophoresis
QS quorum sensing
RAPD-PCR random amplified polymorphic DNA fingerprinting-PCR
vii
RGP regions of genomic plasticity
ST sequence type
T1SS type I secretion system
T2SS type II secretion system
T3SS type III secretion system
TB tuberculosis
TLR toll-like receptor
UV ultraviolet
VAP ventilator associated pneumonia
VNTR variable number tandem repeat
1
Chapter One
Introduction
1.1 Bronchiectasis
Bronchiectasis is a chronic and progressive respiratory disease with which
patients often suffer from a persistent cough, sputum production, and recurrent
microbial infections leading to exacerbations and further lung damage.
Bronchiectasis is defined by the British Thoracic Society (BTS) by the irreversible
dilation and damage to the bronchi (Pasteur et al. 2010) and is often also
characterised by thickening of the bronchial walls. Disease progression can occur
through damage to the lungs and airways which most often occurs during chronic
bacterial infection when the airways are constantly inflamed, but can occur due to
other factors such as smoking and particle inhalation. The causes of bronchiectasis
are wide ranging, including genetic disorders and environmental factors. The most
well characterised and intensively studied cause of bronchiectasis is cystic fibrosis
(CF). Other chronic conditions are also associated with bronchiectasis including
rheumatoid arthritis, inflammatory bowel disease, and gastro-oesophageal reflux
(GER) (De Soyza et al. 2013) however the effects of these conditions on the health of
bronchiectasis patients is little known due to lack of research into the condition.
Bronchiectasis is perceived by many, since the further development of antibiotic
treatments, to be a rare and easily managed disease, of little clinical importance (De
Soyza et al. 2013) although in recent times it is becoming clearer that this is not the
case. It is possible that research into bronchiectasis has been neglected due to belief
that the disease would disappear in developing countries alongside the decline of
diseases such as tuberculosis (Chalmers 2015). Accurate data on the numbers of
patients currently undergoing regular treatment for bronchiectasis are sparse; in the
USA the prevalence of adult bronchiectasis has been estimated at 52 in 100 000
people, with higher prevalence among women and older individuals (Weycker et al.
2005); however in the UK, in just nine centres, there are 5000 patients receiving
2
regular follow-up treatment for bronchiectasis (De Soyza et al. 2013) suggesting that
the true prevalence among adult populations may be even higher.
1.1.1 Cystic fibrosis
CF is perhaps the most well-known and best-understood cause of
bronchiectasis and is the most common life-threatening hereditary genetic disorder
among Caucasians. In 1990 the median survival age for CF patients was 31.9 years
but improvements in patient care and treatment have led to an increased median
survival age of 49.7 years in the most current five year period (ending in 2012)
(Stephenson et al. 2015). CF is an autosomal recessive condition in which a mutation
in the cystic fibrosis transmembrane conductance regulator (CFTR) gene leads to
improper transport of chloride ions. The most prevalent causative mutation is a
deletion of three base pairs in the CFTR gene which leads to the loss of a
phenylalanine residue at amino acid position 508, known as ΔF508 (Kerem et al.
1989; Riordan et al. 1989; Rommens et al. 1989). Despite chronic airway infections
being a hallmark of the condition, CF is defined as a multi-organ disease, affecting
the gastrointestinal tract, pancreas, and the reproductive tract as well as the
respiratory tract (Pauwels et al. 2012). Due to abnormal CFTR protein produced as a
result of the mutation in the CFTR gene, the airway mucus becomes thick and sticky
and is not easily cleared by cilial beating. Clearing of the mucus is crucial in preventing
airway infections and so build-up of mucus provides an ideal environment for
microbial pathogens to colonise. Antibiotics are often unable to properly diffuse in
the viscous mucus and so these infections are difficult to clear, leading to prolonged
inflammatory response by the immune system. This extended immune response
leads to damage and widening of the airways, leading to bronchiectasis.
1.1.2 Non-cystic fibrosis bronchiectasis
There are a range of underlying causes that can lead to development of non-
cystic fibrosis bronchiectasis (NCFBr), although it is estimated that in 25 – 50% of
cases a cause is not identified (http://www.blf.org.uk/page/bronchiectasis); this is
known as idiopathic bronchiectasis. Advances in diagnostics mean that patients with
CF are often diagnosed shortly after birth and healthcare regimens can be
3
implemented early on to extend life expectancy. Symptoms of NCFBr often do not
manifest until much later in life and are more difficult to definitively diagnose with
the average age of many NCFBr cohorts being between 60 and 70 years (Chalmers
2015). Post-infective bronchiectasis is often caused by severe childhood respiratory
infections such as pneumonia, whooping cough, and measles; however, vaccination
against childhood illnesses is expected to reduce post-infective bronchiectasis in
adults in the future (NHS Choices 2015). Immunodeficiency can also leave the lungs
vulnerable to damage by the inflammatory response. In the past, there was high
mortality in HIV-infected patients who presented with acute pulmonary infections
such as bacterial pneumonia, tuberculosis, and acute bronchitis but the arrival of
early antiretroviral therapy (ART), widespread prophylactic antibiotic treatment and
improvements in life expectancy have seen a significant reduction in the incidence of
life-threatening opportunistic infections, resulting in an increase in non-infectious
chronic respiratory disease among HIV-positive individuals, including chronic
obstructive pulmonary disease (COPD) and NCFBr (Calligaro & Gray 2015). There is
also evidence that aspiration of gastric reflux products may play a role in the
development on bronchiectasis, although the links between GER and CF have been
more extensively studied than the links between NCFBr and GER (Pauwels et al.
2012).
Problems often arise in epidemiological studies of NCFBr with acquiring
definitive diagnoses of the condition. NCFBr is most commonly diagnosed by the
presence of dilated bronchi apparent on a computed tomography (CT) scan, and this
is known as radiological bronchiectasis, but studies have shown that dilated bronchi
are commonplace among the healthy elderly population. A UK study of patients aged
>75 years vs. patients under the age of 55 identified bronchial dilation in 60% of the
patients aged 75 and over compared with presence in only 6% of the younger group
(Copley et al. 2009). This study included both smokers and non-smokers but revealed
no relationship between smoking status or history and bronchial dilation (Copley et
al. 2009). A further study examining CT scans of the lungs of elderly never-smokers
with no respiratory disease revealed that 19.1% of over 75’s had radiological
bronchiectasis (Winter et al. 2015). These data have led to the speculation that
4
bronchiectasis may, in part, be a sign of aging in the lungs; however other symptoms
generally expressed by NCFBr patients include chronic cough, sputum production
and respiratory tract infections. This has led to some clinicians to use the term
“clinically significant bronchiectasis” to refer to patients who present with the
symptoms listed above alongside radiological bronchiectasis (Chalmers 2015).
Similarities and overlap between similar pulmonary diseases also hinder
conclusive diagnosis of NCFBr. The overlap between bronchiectasis and COPD has
not been extensively studied and work carried out so far does not present a
conclusive assessment of risk of bronchiectasis and COPD comorbidity (Chalmers
2015). COPD is diagnosed on the basis of mostly-irreversible airflow obstruction
which is measured by spirometry and is therefore a physiological diagnosis.
Bronchiectasis is diagnosed by imaging (usually CT) which shows permanent airway
dilation and thickening of the airway walls which results in a structural diagnosis
(Hurst et al. 2015). Increasingly, COPD patients are given a CT scan as a part of
diagnosis or follow-up care and consequently there is an impact on the detection of
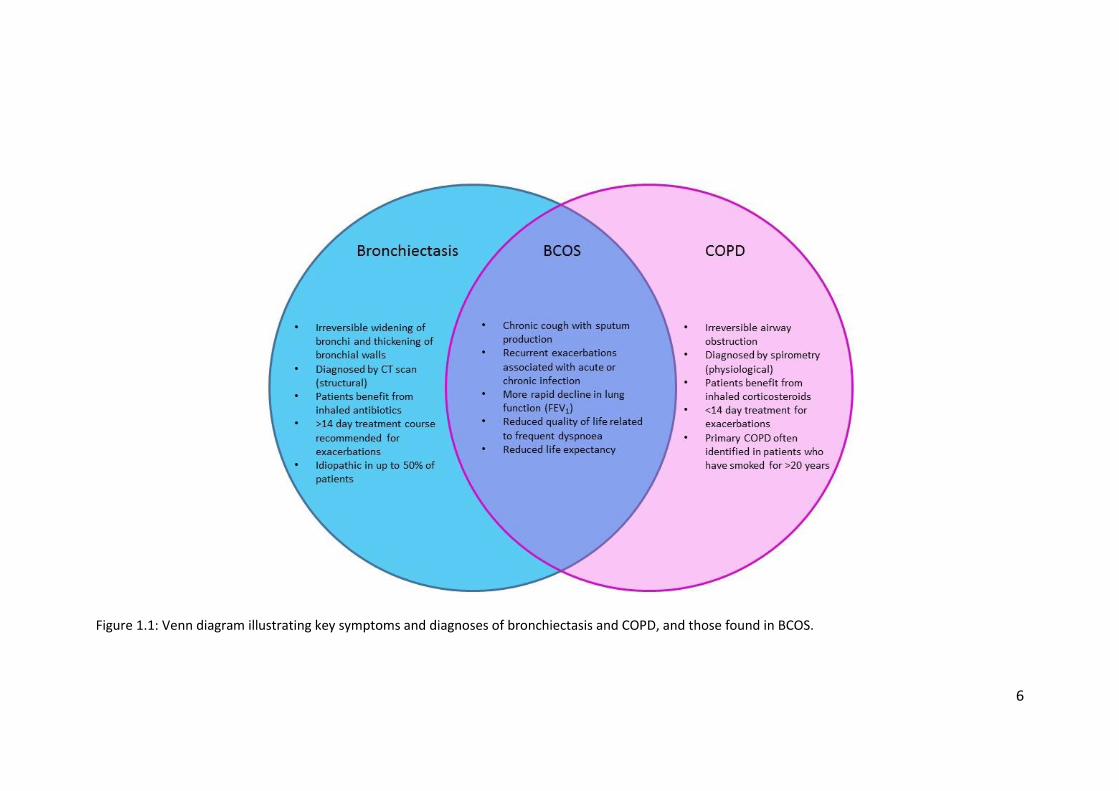
structural changes in the airways of COPD patients. The presence of symptoms of
both conditions (figure 1.1) has been given the name COPD-bronchiectasis overlap
syndrome (BCOS) and recommendations for the treatment of BCOS and
improvements in research have recently been made (Hurst et al. 2015). A small study
previously reported high frequencies of bronchiectasis among those diagnosed with
COPD. In a cohort of 201 patients with COPD the frequency of bronchiectasis was
reported at 57.6%, with higher mortality among those with bronchiectasis and COPD
(Martínez-García et al. 2013). However, this high frequency of bronchiectasis has not
been corroborated by larger-scale studies. In one study the frequency of
bronchiectasis among COPD patients was found to be no higher than that which
would be expected among the general population of otherwise-healthy individuals
due to the background frequency of bronchiectasis among the elderly (Agusti et al.
2010) and this was echoed by later research which found no higher incidence of
bronchiectasis in those with COPD than in those with no reported COPD diagnosis;
bronchiectasis was reported in 26% of patients with no known diagnosis of
pulmonary disease (Jairam et al. 2015). Research from the COPDGene study, which
5
investigated a large cohort of 3636 patients, reported the frequency of
bronchiectasis among COPD patients at 20.8% (Stewart et al. 2012). A more recent
study which focused on patients with high levels of exacerbation found only five
cases of bronchiectasis among 96 COPD patients (Uzun et al. 2014). These variations
in frequencies indicate that the research carried out into BCOS thus far is not robust
enough to allow predictions to be made about the frequency of bronchiectasis
among COPD patients, although it is probably that it occurs in a maximum of 20%
patients (Chalmers 2015).
In the US a research registry was founded in 2008 to give a centralised
database of NCFBr patients from clinical institutions across the country. The aim of
the registry is to encourage research collaborations and multi-centre clinical trials for
the treatment of NCFBr. The demographics of the registry are typical of NCFBr
patients; predominantly female (79%), white (91%), with an average age of 65 years
(Aksamit et al. 2012).
6
Figure 1.1: Venn diagram illustrating key symptoms and diagnoses of bronchiectasis and COPD, and those found in BCOS.
7
1.1.3 Lack of research into non-cystic fibrosis bronchiectasis
In the UK prevalence of NCFBr is much higher than that of CF with data
suggesting that, of the estimated 150 000 patients living with bronchiectasis (Quint
et al. 2012), only around 10 000 are due to CF. Despite this, there has been very
limited NCFBr research and there are currently no specific licenced drug therapies for
the condition (Pasteur et al. 2010). The world’s first national guidelines for NCFBr
diagnosis and treatment were developed in the UK in 2010 by the BTS. Research into
NCFBr has been limited partly by lack of funding but also by lack of carefully
phenotyped patients. With such a wide range of causes and severities of symptoms,
along with other conditions with similar symptoms (e.g. COPD), it can be difficult to
strictly categorise NCBFr patients. The BTS Guideline for NCFBr makes
recommendations for the diagnosis and treatment of NCFBr in both adults and
children (Pasteur et al. 2010). The report provides rigorous and detailed testing
guidelines for patients exhibiting symptoms of bronchiectasis. The report also
identified significant gaps in evidence at discovery (first translational gap) and clinical
interfaces (second translational gap) (Pasteur et al. 2010). In 2012 the BTS Quality
Standards for clinically significant bronchiectasis was published and is recommended
to be read alongside the Guideline for NCFBr. The Quality Standards report aims to
allow healthcare professionals to make the best decisions regarding diagnosis and
treatment based on the latest evidence and best practices. The document also aims
to help NCBFr patients and carers understand what services they should expect from
their healthcare provider (British Thoracic Society 2012).
In CF patients chronic bacterial infections in the lungs, particularly with
Pseudomonas aeruginosa, are significant contributors to morbidity and mortality
(Fothergill et al. 2010a). It has been demonstrated in many studies that there is an
association between P. aeruginosa infection and mortality, lowered lung function,
and worsening quality of life in NCFBr patients (Evans et al. 1996; Davies et al. 2006;
King et al. 2007; Loebinger et al. 2009). A more rapid decline in lung function
associated with P. aeruginosa infection was suggested by Evans et al. (1996) and
Davies et al. (2006) although this is not universally acknowledged. None of these
8
studies have proven, however, that the prognostic effect of P. aeruginosa infection
is as a direct consequence of infection rather than as a marker of existing disease
severity (Chalmers 2015).
1.1.4 Prevalent microbial pathogens
Due to the permanent inflammation and dilation of the airways of NCFBr
patients and the associated reduction in host defences, 64 – 79% of NCFBr patients
have chronic bacterial airway infections even when the patients are apparently
clinically stable (Pasteur et al. 2000; Angrill et al. 2002; King et al. 2007). Haemophilus
influenzae and P. aeruginosa are the most common pathogens affecting NCFBr
patients. Moraxella catarrhalis, Streptococcus pneumoniae and Staphylococcus
aureus are also often isolated from sputum samples, although Pasteur et al. (2000)
suggested that the presence of S. aureus among the lung microbiota may be
indicative of undiagnosed CF and advised that clinicians should follow S. aureus
isolation with genetic and sweat tests. Alongside bacterial pathogens, viruses and
fungi also play a pathogenic role in NCFBr patients. Common respiratory viruses (e.g.
human rhinovirus, respiratory syncytial virus, and influenza A and B) are detected
more frequently in patients suffering chronic respiratory diseases, such as COPD and
NCFBr, compared to healthy individuals (Mitchell et al. 2015) and that the prevalence
of viral infections in cases of NCFBr exacerbations is higher than in clinically stable
bronchiectasis (Gao et al. 2015). It has been shown that patients experiencing
exacerbations who tested positive for respiratory viruses by PCR assay also
experienced a greater increase in markers of systemic and airway inflammation when
compared with virus-negative patients experiencing exacerbations (Gao et al. 2015).
Research into the prevalence and effects of fungal infection in NCFBr has been
extremely limited and so much of our understanding of the role of fungi in chronic
lung conditions is based on work undertaken in the context of CF. Aspergillus spp.
and Candida albicans are known to persist frequently in the lungs of CF patients and
so recently the prevalence of these organisms has also been investigated in NCFBr.
In work undertaken by Máiz et al. (2015) it was shown that there is indeed a high
prevalence of persistence of both Aspergillus spp. and C. albicans in clinically stable
9
NCFBr patients. The persistence of Aspergillus spp. and C. albicans were shown to be
associated with daily sputum purulence and the administration of long-term
antibiotic treatment respectively. Long-term antibiotic treatment is generally only
utilised to treat chronic P. aeruginosa infection, as opposed to H. influenzae, and so
persistence of C. albicans is found to be associated with P. aeruginosa colonisation
in NCFBr patients (Máiz et al. 2015). P. aeruginosa has been shown to form dense
biofilms on the hyphae of C. albicans without binding to or killing the fungi (Hogan &
Kolter 2002). It is likely that the presence of bacteria, fungi, and viruses play a
combinatorial role in pathogenesis in NCFBr and so further research into microbial
pathogens is necessary.
H. influenzae strains can be categorised into one of two groups: typable and
nontypable. Typable isolates have a capsule and generally cause systemic infections,
such as bacteraemia and meningitis. Nontypable H. influenzae (NTHi) is
unencapsulated and often causes non-invasive mucosal infections, such as otitis
media, sinusitis, and conjunctivitis (Garmendia et al. 2014). In COPD colonisation with
NTHi is a marker of disease progression and of severe airflow obstruction and it is for
this reason that much of the research carried out into lower airway infections by NHTi
has been undertaken with regards to COPD (Garmendia et al. 2014). In a study by
McDonnell et al. (2015) H. influenzae was isolated from 89 (57.4%) of 155 COPD
patients, although only 51 (32.9%) met colonisation criteria. Of these 51, 14 patients
were still colonised at the data capture point. This data suggests that 37 patients
(74.5%) had cleared H. influenzae, opposed to the 34.0% of patients who cleared P.
aeruginosa (McDonnell et al. 2015).
NCFBr patients are frequently diagnosed with community-acquired
pneumonia (CAP), although there are currently no specific clinical recommendations
available (Polverino et al. 2015). It was found that S. pneumoniae was the most
common causative pathogen of CAP both among NCFBr patients and among other
CAP patients. Whilst these pneumococcal infections usually cause acute disease, they
can also be accompanied by chronic infection with P. aeruginosa and this was shown
to be common among NCFBr patients (Polverino et al. 2015).
10
Comprehensive taxonomic studies have defined several distinct, closely
related species of bacteria among those previously designated as “B. cepacia” on the
basis of phenotype alone (Vandamme et al. 1997). These seven distinct organisms (B.
cepacia genomovars I – VII) are collectively known as the B. cepacia complex.
Members of the Burkholderia cepacia complex (BCC) have been recognised as
important opportunistic pathogen among CF patients for many years, with a
significant proportion of infected patients succumbing rapidly to progressive
necrotising pneumonia (LiPuma et al. 2001). In many cases, BCC infection is
associated with poor outcomes following lung transplant and so many centres
consider BCC infection an absolute contraindication to receive transplant lungs.
However many CF patients are either transiently infected with BCC or can remain
colonised for years with no apparent adverse clinical effects (LiPuma et al. 2001).
Although infection with the BCC has been reported in patients with NCFBr (Ledson et
al. 1998) it is relatively uncommon. In a study by Carraro et al. (2014) the BCC was
identified in 14 patients of 47 (20 with bronchiectasis and 27 with CF). Of these 14
patients, 13 had CF showing that the BCC is more common among patients with CF
than in those with NCFBr (Carraro et al. 2014).
1.2 Pseudomonas aeruginosa
P. aeruginosa is a versatile Gram-negative bacterium that can live in a wide
range of niche environments and can opportunistically colonise susceptible
individuals to cause disease (Winsor et al. 2011). As well as being the most prevalent
life-threatening pathogen in CF patients (Govan et al. 2007), P. aeruginosa frequently
affects other immunocompromised individuals such as cancer and severe burn
patients and is a major cause of bacterial keratitis which can lead to blindness if
untreated (Winsor et al. 2011). It is notable that infection with P. aeruginosa is rare
among otherwise healthy individuals and is most likely encountered and rebuffed by
the body’s immune system on a regular basis due to its abundance in the natural
environment (Lyczak et al. 2000). P. aeruginosa is also a major cause of nosocomial
infections worldwide, and is responsible for ~10% of such infection in the European
Union (de Bentzmann & Plésiat 2011). The majority of these nosocomial infections
11
take the form of acute lung infections (pneumonia) in patients in intensive care units
(Lyczak et al. 2000). The ability of the organism to colonise such a wide variety of
environments and to cause a range of human diseases is now widely believed to be
due to a multitude of virulence factors which act in a combinatorial fashion to cause
injury to the host (Lee et al. 2006).
P. aeruginosa can cause both acute and chronic infections and has a wide
range of virulence factors which are important in pathogenicity in acute infections
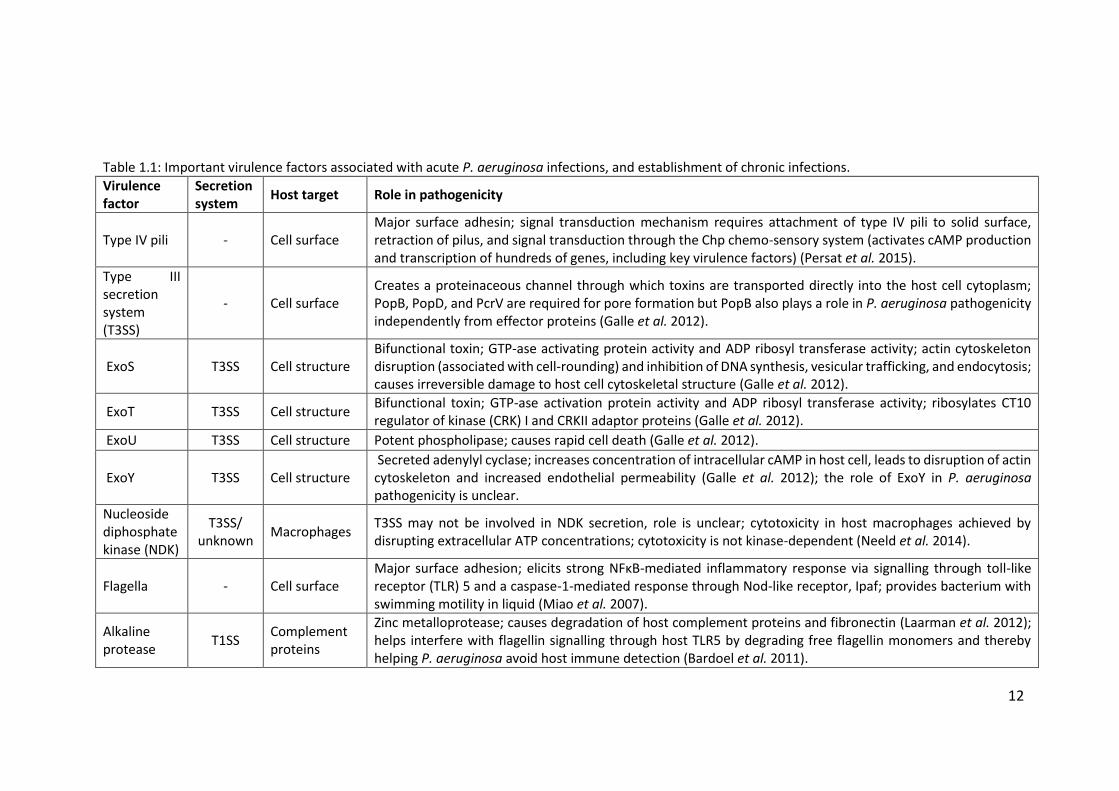
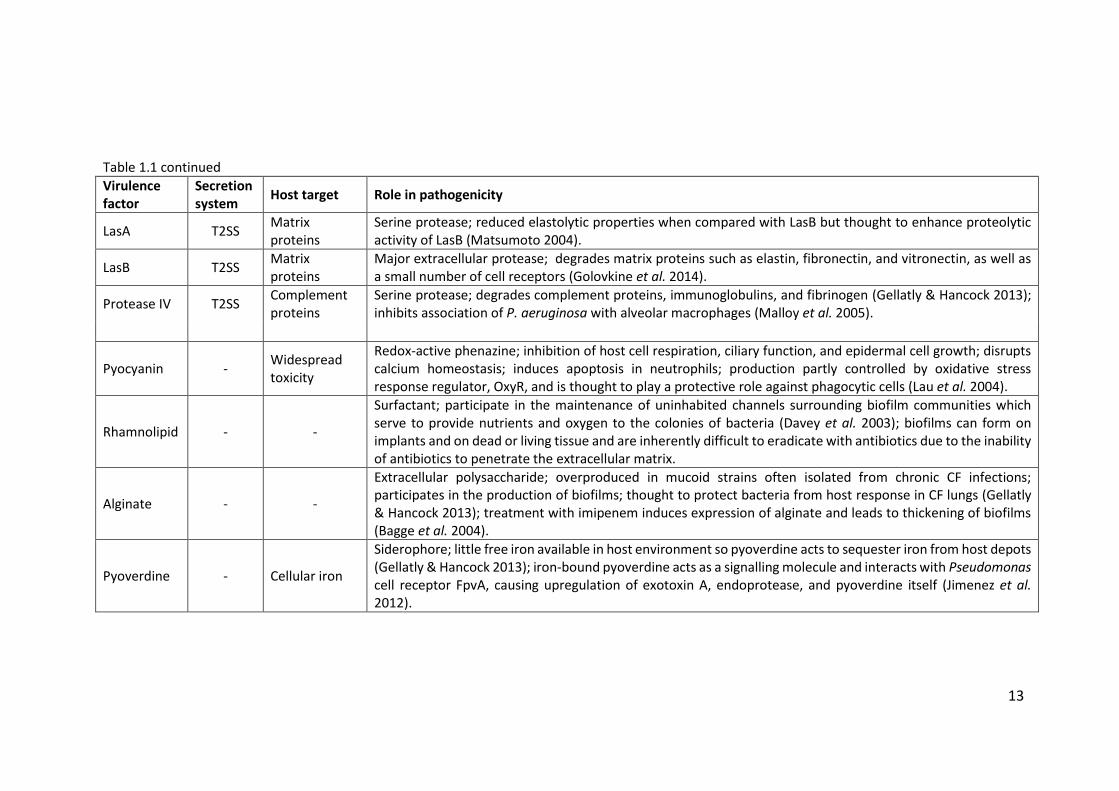
and also in establishing chronic infections. Table 1.1 shows some of the most
important virulence factors of P. aeruginosa and how they act upon host cells to
cause damage. Generally, only a small selection of bacterial species are recovered
from the wounds of burns victims, including: S. aureus, Klebsiella spp., P. aeruginosa,
and Enterobacter spp. (Bowen-Jones et al. 1990). Despite increasing awareness of
the dangers posed by bacterial infection and therefore the necessity for sterility in
healthcare environments, P. aeruginosa has been found to contaminate floors, bed
rails, and sinks in hospitals and this, along with the prevalence of P. aeruginosa in the
general environment, makes it a threat to the health of burns patients recovering in
hospitals (Chitkara & Feierabend 1981). It is quickly apparent that the external
defences of the immune system are compromised at the site of a burn wound but
due to the limited number of bacterial species which are recovered from infected
wounds it is likely that it is necessary for the bacteria to be able to adapt to take
advantage of the concerted impairment of many of the host defence mechanisms to
colonise a burn, as opposed to the presence of one or a few specific virulence factors
(Lyczak et al. 2000). P. aeruginosa is also one of the leading causes of ulcerative
keratitis of the cornea and is associated with users of extended-wear contact lenses.
The exact links between contact lens use and bacterial pathogenesis have not been
fully elucidated, though work has shown that the ocular mucus, which usually binds
bacterial cells and prevents adhesion to the corneal surface, can be altered by the
use of contact lenses and may therefore facilitate bacterial adhesion, along with
other virulence factors (Versura et al. 1987).
12
Table 1.1: Important virulence factors associated with acute P. aeruginosa infections, and establishment of chronic infections.
Virulence factor
Secretion system
Host target Role in pathogenicity
Type IV pili - Cell surface Major surface adhesin; signal transduction mechanism requires attachment of type IV pili to solid surface, retraction of pilus, and signal transduction through the Chp chemo-sensory system (activates cAMP production and transcription of hundreds of genes, including key virulence factors) (Persat et al. 2015).
Type III secretion system (T3SS)
- Cell surface Creates a proteinaceous channel through which toxins are transported directly into the host cell cytoplasm; PopB, PopD, and PcrV are required for pore formation but PopB also plays a role in P. aeruginosa pathogenicity independently from effector proteins (Galle et al. 2012).
ExoS T3SS Cell structure Bifunctional toxin; GTP-ase activating protein activity and ADP ribosyl transferase activity; actin cytoskeleton disruption (associated with cell-rounding) and inhibition of DNA synthesis, vesicular trafficking, and endocytosis; causes irreversible damage to host cell cytoskeletal structure (Galle et al. 2012).
ExoT T3SS Cell structure Bifunctional toxin; GTP-ase activation protein activity and ADP ribosyl transferase activity; ribosylates CT10 regulator of kinase (CRK) I and CRKII adaptor proteins (Galle et al. 2012).
ExoU T3SS Cell structure Potent phospholipase; causes rapid cell death (Galle et al. 2012).
ExoY T3SS Cell structure Secreted adenylyl cyclase; increases concentration of intracellular cAMP in host cell, leads to disruption of actin cytoskeleton and increased endothelial permeability (Galle et al. 2012); the role of ExoY in P. aeruginosa pathogenicity is unclear.
Nucleoside diphosphate kinase (NDK)
T3SS/ unknown
Macrophages T3SS may not be involved in NDK secretion, role is unclear; cytotoxicity in host macrophages achieved by disrupting extracellular ATP concentrations; cytotoxicity is not kinase-dependent (Neeld et al. 2014).
Flagella - Cell surface Major surface adhesion; elicits strong NFκB-mediated inflammatory response via signalling through toll-like receptor (TLR) 5 and a caspase-1-mediated response through Nod-like receptor, Ipaf; provides bacterium with swimming motility in liquid (Miao et al. 2007).
Alkaline protease
T1SS Complement proteins
Zinc metalloprotease; causes degradation of host complement proteins and fibronectin (Laarman et al. 2012); helps interfere with flagellin signalling through host TLR5 by degrading free flagellin monomers and thereby helping P. aeruginosa avoid host immune detection (Bardoel et al. 2011).
13
Table 1.1 continued
Virulence factor
Secretion system
Host target Role in pathogenicity
LasA T2SS Matrix proteins
Serine protease; reduced elastolytic properties when compared with LasB but thought to enhance proteolytic activity of LasB (Matsumoto 2004).
LasB T2SS Matrix proteins
Major extracellular protease; degrades matrix proteins such as elastin, fibronectin, and vitronectin, as well as a small number of cell receptors (Golovkine et al. 2014).
Protease IV T2SS Complement proteins
Serine protease; degrades complement proteins, immunoglobulins, and fibrinogen (Gellatly & Hancock 2013); inhibits association of P. aeruginosa with alveolar macrophages (Malloy et al. 2005).
Pyocyanin - Widespread toxicity
Redox-active phenazine; inhibition of host cell respiration, ciliary function, and epidermal cell growth; disrupts calcium homeostasis; induces apoptosis in neutrophils; production partly controlled by oxidative stress response regulator, OxyR, and is thought to play a protective role against phagocytic cells (Lau et al. 2004).
Rhamnolipid - -
Surfactant; participate in the maintenance of uninhabited channels surrounding biofilm communities which serve to provide nutrients and oxygen to the colonies of bacteria (Davey et al. 2003); biofilms can form on implants and on dead or living tissue and are inherently difficult to eradicate with antibiotics due to the inability of antibiotics to penetrate the extracellular matrix.
Alginate - -
Extracellular polysaccharide; overproduced in mucoid strains often isolated from chronic CF infections; participates in the production of biofilms; thought to protect bacteria from host response in CF lungs (Gellatly & Hancock 2013); treatment with imipenem induces expression of alginate and leads to thickening of biofilms (Bagge et al. 2004).
Pyoverdine - Cellular iron
Siderophore; little free iron available in host environment so pyoverdine acts to sequester iron from host depots (Gellatly & Hancock 2013); iron-bound pyoverdine acts as a signalling molecule and interacts with Pseudomonas cell receptor FpvA, causing upregulation of exotoxin A, endoprotease, and pyoverdine itself (Jimenez et al. 2012).
14
Whilst presenting the greatest threat in terms of morbidity and mortality to
CF patients, P. aeruginosa can also cause acute infections within the lungs of patients
generally in intensive care units in hospitals. Many of the virulence factors associated
with burn wound infections and keratitis are also implicated in acute infections of
the lungs. More specifically, the type III secretion system (T3SS), which delivers ExoS,
ExoT, and ExoU in mammalian cells, appears to play a major role in acute
pathogenicity in the lungs. It has been shown that immunisation against the type III
secretion-associated Pseudomonas V antigen protects animals from lung damage
during acute P. aeruginosa infection (Sawa et al. 1999).
When chronically infecting the lungs of CF patients P. aeruginosa presents
with a particular set of phenotypes: alterations in the secretion of mucoid
exopolysaccharide, exotoxins, proteases, and siderophores; conversion of
lipopolysaccharide from smooth to rough; and a loss of motility (Mahenthiralingam
et al. 1996). Often isolates from chronic lung infections are found to not produce O
antigen, pili, and flagella which are common virulence determinants (Jain et al. 2004).
These changes are thought to allow the bacterium to thrive in the CF lung
environment which is vastly different to the environmental conditions from which
unique strains of P. aeruginosa often originate.
P. aeruginosa has a large and versatile genome (6 – 7 Mbp) which allows the
bacteria to adapt quickly to a wide range of growth conditions. The pangenome of P.
aeruginosa is made up of a well conserved core genome and a highly variable
accessory genome and the organism’s ability to thrive in such a wide range of
environments is attributed to this adaptable accessory genome. The core genome is
defined as the genes always present in strains of P. aeruginosa, regardless of origin
(laboratory, clinical, or environmental) and that encode metabolic and pathogenic
factors observed in all strains of P. aeruginosa (Kung et al. 2010). Work by Wolfgang
et al. (2003) showed that between 96.1% and 97.7% of PAO1 genes were detected in
18 strains tested and that 93.4% of the 5549 nonredundant genes making up the
PAO1 genome were present in all 18 strains tested. The segments of accessory
genome that vary by strain are not randomly scattered throughout the genome and
15
often cluster around certain loci, which Mathee et al. (2008) described as regions of
genomic plasticity (RGP). The sequences present in these RGPs are commonly
referred to as genomic islets (<10 kbp) or islands (>10 kbp). The definition of what
constitutes a genomic island changes as new information comes to light but it is most
commonly used to refer to horizontally acquired genetic elements, present in the
chromosomes of some strains but absent from others (Kung et al. 2010). Analysis
also suggests that the genome lacks large amounts of gene replication, with many
more distinct gene families than other large bacterial genomes, and therefore that
selection for environmental versatility has enabled the expansion of the genome and
development of small paralogous gene families which encode specific, discrete
functions (Stover et al. 2000).
1.2.1 Pathogenicity in chronic lung infections
The morbidity of chronic lung infections is generally measured by recording
the decline in lung function of patients at each clinic visit. Lung function is measured
frequently by forced expiratory volume in 1 s (FEV1) according to European
Respiratory Society (ERS) and American Thoracic Society (ATS) standards (Brusasco
et al. 2005). The Medical Research Council (MRC) dyspnoea or breathlessness scale
is also used to assess patients’ health. The breathlessness scale does not quantify
breathlessness itself; it is a short questionnaire answered by the patient which
assigns a numerical value (between 1 and 5) to the disability caused by
breathlessness experienced. The dyspnoea scale correlates well with other
breathlessness scales, lung function measurements (such as FEV1), and direct
measurements of disability (such as walking distance) and is thus regularly used by
physicians assessing severity in conditions such as NCFBr and COPD (Stenton 2008).
Furthermore, the bronchiectasis severity index (BSI) specifically informs the status of
bronchiectasis patients and consists of 8 commonly measured clinical parameters
that reflect the age, body mass index (BMI), FEV1, MRC dyspnoea score, exacerbation
frequency, prior hospitalisations, chronic bacterial colonisation status, and the
presence of cystic bronchiectasis on high resolution CT (HRCT) (Chalmers et al. 2014).
16
Studies into the effects of P. aeruginosa infections in NCFBr patients have
been somewhat limited. It has been shown that patients who have, at some point,
cultured P. aeruginosa from a sputum sample have significantly worse predicted
FEV1% and increased hospital admission rates, although there has been shown to be
no significant associated increase in exacerbations or MRC dyspnoea scores
(McDonnell et al. 2015). Patients colonised with P. aeruginosa were up to 4 times
more likely to have reduced FEV1%, up to 10 times more likely to suffer from
polymicrobial colonisation, and experienced up to 12 times higher risk of mortality
compared to patients who had never cultured P. aeruginosa from a sputum sample.
Average decline in lung function, measured by FEV1, for patients with NCFBr is
currently understood to be ~50 ml per year (Nicotra et al. 1995; King et al. 2005;
Martínez-García et al. 2007) but colonisation with P. aeruginosa is shown to be
independently associated with accelerated decline in lung function, with an FEV1 loss
of 123.3 ml per year (Martínez-García et al. 2007). It was also noted that the levels
of antibiotic resistance among isolates were lower in NCFBr patients in comparison
to CF patients. From the patients in this study there were no panresistant strains
identified and only very few multiresistant strains, furthering support for the
separate and distinct disease classification of NCFBr from CF (McDonnell et al. 2015).
Previously it has been suggested that colonisation of NCFBr patients by P. aeruginosa
could act as an identifier for patients with an increased decline in lung function, since
P. aeruginosa selectively colonises those patients with poor lung function (Evans et
al. 1996) and it was shown by Davies et al. (2006) that P. aeruginosa colonisation of
NCFBr patients was in fact a marker of more severe airflow obstruction. However,
McDonnell et al. (2015) showed that as well as ~50% of patients with moderate
airflow obstruction suffering from P. aeruginosa colonisation, there were around
10% of patients with normal FEV1 volumes who were also colonised, which indicates
that P. aeruginosa may be an important pathogen across all stages of airflow
obstruction and requires careful observation.
17
1.2.2 Epidemic (transmissible) strains of Pseudomonas aeruginosa
Chronic infection with P. aeruginosa is well-documented as the leading cause
of morbidity and mortality in CF patients and in the past it was widely accepted that
the most common source of infection for these patients was by uniquely acquired
environmental strains (Fothergill et al. 2012). It has been known for some time that
CF siblings often share strains of P. aeruginosa that are directly related to one
another and are not a strain that is abundant in the environment that had been
acquired independently (Speert & Campbell 1987; Grothues et al. 1988; Renders et
al. 1997). A wider role for transmissible strains of P. aeruginosa among CF patients
emerged after a multi-resistant strain of P. aeruginosa was identified in a Danish CF
centre and was found to be harboured by a number of patients in this centre
(Pedersen et al. 1986). The number of patients colonised with this particular strain
of P. aeruginosa continued increasing after its initial identification until a segregation
policy, and stricter personal hygiene guidelines, were introduced to the hospital.
Thus, this strain of P. aeruginosa was identified as an epidemic strain. Further to this,
another antibiotic resistant strain of P. aeruginosa was found to be highly prevalent
among children with CF at a paediatric centre in Liverpool, UK (Cheng et al. 1996).
This strain was named as the Liverpool Epidemic Strain (LES) and was also later
identified among large numbers of patients at an adult CF centre also in Liverpool
(Panagea et al. 2003). In response to growing concern about the prevalence of
transmissible strains of P. aeruginosa among CF patients and the increased morbidity
and mortality experienced by patients colonised by an epidemic strain (Jones et al.
2002; Armstrong et al. 2003; Al-Aloul et al. 2003) a large scale study was carried out
across England and Wales to more fully characterise the epidemic strains present
among CF patients (Scott & Pitt 2004).
A nationwide study was carried out analysing 1225 isolates from CF patients
at 31 centres across the UK. A total of 849 individual patient isolates were analysed
by pulsed-field gel electrophoresis (PFGE) and initially compared against isolates
from the same centre in order to ascertain levels of transmission within centres. The
number of isolates sharing similar DNA patterns (≥80% similarity) compared with the
number of isolates with unique patterns was used to give a ratio which was, in turn,
18
used as a crude measure of diversity of patient strain populations within each centre.
The number of clustered isolates varied greatly between the 31 centres involved in
the study. Some hospitals showed a roughly equal number of strains in each category
(clustered vs. unique) but in five centres the clustered isolates outnumbered the
unique isolates, which indicated a higher occurrence of cross-infection between
patients in these centres (Scott & Pitt 2004). All 849 individual patient isolates were
compared to investigate transmission of strains between centres. Six clusters
containing 233 isolates were identified. The DNA patterns of these clusters were
compared with the representatives from previous published outbreaks: Liverpool,
Manchester, Melbourne, and clone C. A total of 93 isolates from 15 centres clustered
with the representatives of the LES; 11 isolates from three centres clustered with the
Manchester epidemic strain (MES); and 15 isolates from eight centres clustered with
the clone C genotype (Scott & Pitt 2004). The high incidence and widespread
frequency of these epidemic strains of P. aeruginosa was not expected, although this
and other data has since informed treatment and segregation of patients attending
CF clinics in the UK (The UK Cystic Fibrosis Trust Infection Control Group 2004).
19
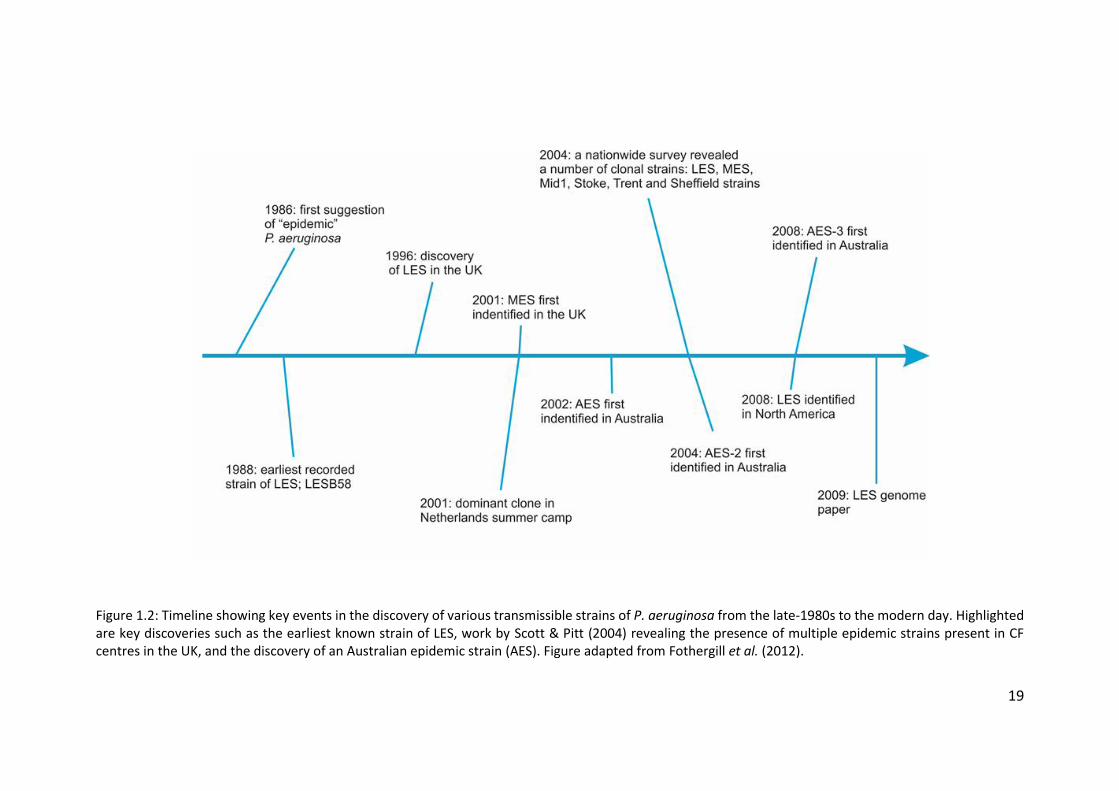
Figure 1.2: Timeline showing key events in the discovery of various transmissible strains of P. aeruginosa from the late-1980s to the modern day. Highlighted are key discoveries such as the earliest known strain of LES, work by Scott & Pitt (2004) revealing the presence of multiple epidemic strains present in CF centres in the UK, and the discovery of an Australian epidemic strain (AES). Figure adapted from Fothergill et al. (2012).
20
Three novel clusters were also identified. One of these was named Midlands
1 and contained 86 isolates; 66 of these came from one hospital (in the Midlands)
and isolates with this genotype were also found in 8 other centres. Another novel
cluster, named cluster 4, contained 12 isolates from four geographically distinct
centre. The final novel cluster was formed of ten isolates from one hospital (Trent)
and was named Trent. It was found that none of the UK CF P. aeruginosa isolates
clustered with the Melbourne genotype, now known as the Australian Epidemic
Strain-1 (AES-1) (Scott & Pitt 2004). Although a majority of CF patients were found to
harbour unique strains of P. aeruginosa, around one in five of those sampled were
infected by one of two transmissible genotypes. The LES accounted for 11% of the
isolates analysed in this study and was found in 48% of the 31 centres. The Midlands
1 strain was found to be the second most common genotype, accounting for 10% of
isolates sampled and present in 29% of centres. Despite being found in 14% of 154
patients in the Manchester CF centre (Jones et al. 2001) the Manchester genotype
was found in only 1% of patients in this study, and clone C was represented by 2% of
isolates (Scott & Pitt 2004). The most probable explanation for this distribution of
these genotypes among the isolates sampled is cross-infection with P. aeruginosa
among CF patients both within and between centres. This was an unexpected result,
as transmission between CF centres had not previously been reported. The antibiotic
susceptibilities of epidemic isolates were also investigated in this study and it was
found that there was considerable variation among isolates of the LES genotype:
some isolates showed susceptibility to all nine agents (amikacin, ceftazidime,
ciprofloxacin, gentamicin, imipenem, meropenem, piperacillin, tazobactam, and
colistin) whilst others exhibited resistance to all agents but colistin (Scott & Pitt
2004). There was also variation found among the antibiotic resistance profiles for the
Manchester and Midlands 1 strains, one of which showed resistance to colistin (Scott
& Pitt 2004). A more recent study has confirmed the LES as the most common clone
isolated from UK CF patients (Martin et al. 2013).
Outside of the UK there have been numerous reports of other epidemic
strains of P. aeruginosa. Several distinct epidemic strains have been found in both
adult and paediatric CF centres across Australia (figure 1.2). A strain now known as
21
the Australian epidemic strain-1 (AES-1), previously known as the Melbourne
genotype, was initially identified in a paediatric clinic in Melbourne (Armstrong et al.
2002). A survey of patients in Sydney found that a large number of patients were
infected with the same strain, which was initially named pulsotype-1 (Anthony et al.
2002) but was later discovered to also be AES-1 (Armstrong et al. 2003). AES-1 was
also found to be present in both adult and paediatric CF centres in Brisbane (O’Carroll
et al. 2004) although a second transmissible strain (AES-2) was found to be more
highly prevalent in the Brisbane centres (Syrmis et al. 2004). AES-2 is associated with
younger CF patients and with lowered spirometry scores and increased antibiotic
resistance when compared with other P. aeruginosa strains (O’Carroll et al. 2004).
Another transmissible strains, AES-3, was found to be most common among patients
in Tasmania and is associated with increased virulence in patients over 15 years of
age (Bradbury et al. 2008).
Denmark was the first country to report the presence of an epidemic strain
of P. aeruginosa among CF patients (Pedersen et al. 1986) and there has been further
work carried out into prevalent strains present among the population. Genetic
analysis of the dominant DK2 clone showed very little diversity among isolates
despite the highly variable conditions faced by the bacteria in the CF lung
environment (Yang et al. 2011), however only a small number of isolates underwent
analysis for this work and so further study is almost certainly required to begin to
fully understand the changes that occur in populations of P. aeruginosa during
infection in the CF lung. Evidence for epidemic strains of P. aeruginosa in the context
of summer camps for CF patients has been provided from Denmark, the Netherlands,
and Norway (Hoogkamp-Korstanje et al. 1995; Ojeniyi et al. 2000; Fluge et al. 2001).
Indeed, work by Ojeniyi et al. (2000) showed a cross-infection rate of 100% when 27
CF patients of mixed infection status attended a one-week winter holiday camp.
The LES was found to be present in patients attending CF clinics in Ontario,
Canada along with another, less–prevalent, previously-undescribed epidemic strain
of P. aeruginosa (Aaron et al. 2010). This study was the first to highlight the presence
of epidemic strains of P. aeruginosa being shared across continents, although there
have not been studies into the prevalence of LES, or other epidemic strains, in the
22
US. It is not possible to determine whether the LES originated in the UK or in Canada,
although there is previous evidence of international transmission of bacterial
pathogens between CF patients. More recently in Canada a novel clone, named the
Prairie Epidemic Strain (PES), with increased antibiotic resistance was found in 31
(29%) of 107 patients attending an adult CF centre in Alberta (Parkins et al. 2014). Of
these 107 patients there were 66 who had matched isolates from initial and final
centre visits. In 90% of these patients (60) a stable infection was maintained for a
mean period of 10.8 years, but five patients experienced strain displacement of their
unique P. aeruginosa strain by the PES within two years of transferring to the adult
CF centre (Parkins et al. 2014). The PES has been present in this cohort of patients
since at least 1987 and is unique to CF patients, having not been isolated from any of
the patients in a NCFBr control group. The strain also appears to cause chronic
infection during childhood and was not found in any patients who were diagnosed
with CF in adulthood (Parkins et al. 2014).
Transmissible strains have also been reported for other CF pathogens.
Epidemiological studies of B. cenocepacia isolates from CF patients in Edinburgh,
Scotland; Manchester; and Toronto, Canada in the early 1990s revealed the same
infecting strain of B. cenocepacia in patients from all 3 centres (LiPuma et al. 1990;
Govan et al. 1993). It was suspected that the index case was a patient from
Edinburgh, who acquired the infection in the late 1980s and travelled to Canada for
a summer camp with 12 other children from the UK in 1990. Subsequently, 11 of the
children from the UK and a number of Canadian children also in attendance at the
camp became infected with the same clonal strain of B. cenocepacia (Govan et al.
1993). Although CF summer camps have since been widely abandoned, it is possible
that the LES was transmitted between Canadian and UK patients at one such camp
in the late-1980s or early-1990s before the camps were shunned due to infection
control concerns. Conversely, a study by Speert et al. (2002) undertaken in CF centres
in British Columbia, Canada showed that the risk of cross-infection in these centres
was very low, and did not warrant segregation of patients beyond the Pseudomonas-
status based scheme already in place. Ontario and British Columbia are, however,
23
geographically distinct regions of a large country and what is typical for CF patients
in one province is by no means representative of the other.
Transmissibility is also an important issue with regards to infection control in
other bacterial species affecting CF patients. A study into non-tuberculosis
mycobacterium (NTM) Mycobacterium abscessus was prompted by increasing
numbers of CF patients becoming infected with the bacterium and concern that
person-to-person transmission may occur. Whole genome sequencing and antibiotic
susceptibility testing of 168 consecutive isolates from 31 patients attending a UK
adult CF centre was undertaken by Bryant et al. (2013). It was revealed that there
were two clustered outbreaks of near-identical isolates of M. abscessus subspecies
massiliense which differed by fewer than 10 bp. All patients had been exposed to
opportunities for interpatient transmission within the hospital and environmental
sampling was unable to identify a possible source of environmental acquisition
(Bryant et al. 2013). Isolates were found to have constitutive resistance to amikacin
and clarithromycin and the apparent transmissible nature of the strains means that
patients with no previous exposure to long-term macrolides or aminoglycosides were
also infected with resistant strains which has serious implications for treatment and
future healthcare (Bryant et al. 2013).
1.2.2.1 Antibiotic resistance among epidemic strains of Pseudomonas aeruginosa
The prevalence of epidemic strains among CF patients in centres across the
UK, especially that of the LES, has necessitated further investigation into the levels of
antibiotic resistance present in these populations. The LES is particularly aggressive
and well-adapted to the CF lung environment and it was hypothesised that these
features were likely due to changes in gene expression in LES isolates. This was tested
by comparison of two LES isolates (associated with chronic and acute infections) to
each other and to PAO1 under two different growth conditions (Salunkhe et al. 2005).
This study investigated the changes in gene expression for several groups of genes
associated with various functions of the cell. In both LES isolates the majority of
upregulated genes when grown in Luria broth (LB), compared to PAO1, were found
to be those previously reported to be regulated by quorum sensing (QS). The LES
24
isolate associated with the acute infection of a non-CF parent of a CF patient (LES431)
was found to express substantially elevated levels of mRNA transcripts associated
with known P. aeruginosa virulence genes including those encoding alkaline
protease, elastase, LasA protease, pyocyanin and others (Salunkhe et al. 2005).
Among the genes up-regulated in both LES431 and the chronic CF infection-
associated LES (LES400) compared to PAO1 were those associated with antimicrobial
susceptibility. Those genes affected included the ampC β-lactamase gene, the
MexAB-OprM and MexXY efflux pumps, and the pyochelin biosynthesis genes
(Salunkhe et al. 2005). Both LES400 and LES431 were less sensitive to β-lactams,
aminoglycosides, and quinolones although LES431 was more resistant to the β-
lactams piperacillin (in combination with the β-lactamase inhibitor tazocin) and
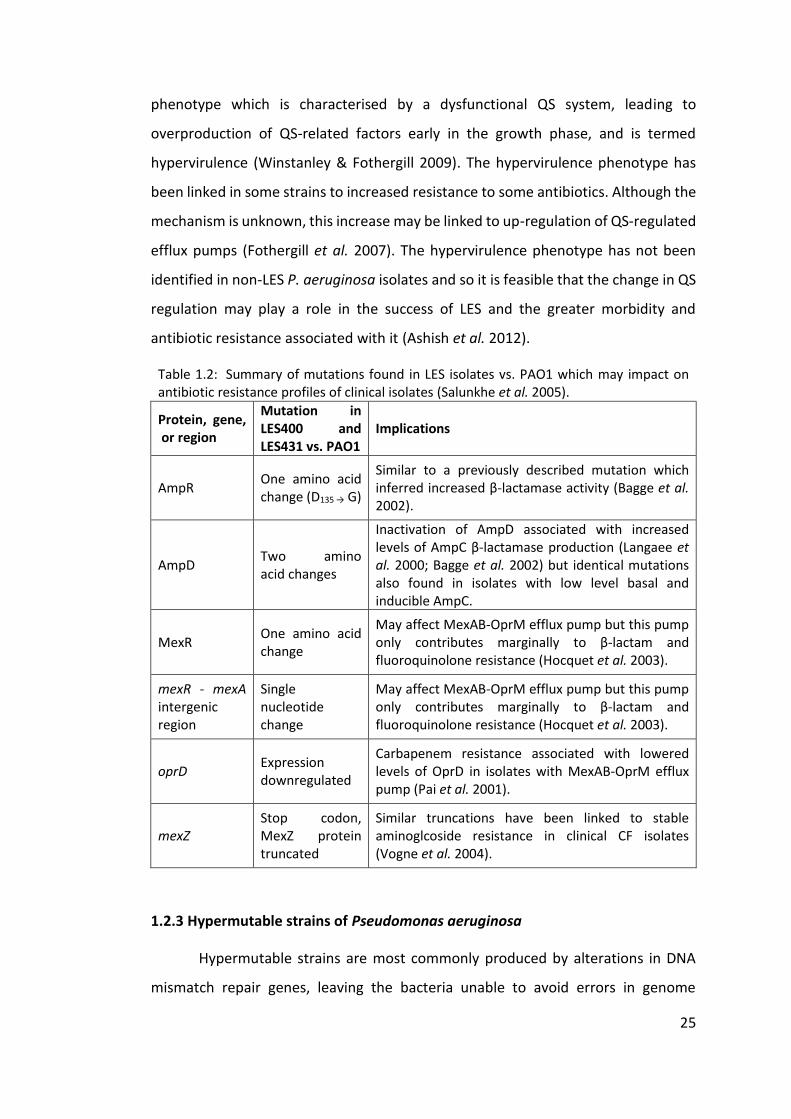
imipenem (Salunkhe et al. 2005). Table 1.2 summarises the changes to genes and
proteins in both LES isolates which were identified through the sequencing of genes
of interest.
It is clear from this work that LES isolates have a wide range of defences
against antimicrobial agents which, when considered alongside the significantly
worse prognosis for LES-positive CF patients (Al-Aloul et al. 2003), further
necessitates the segregation of patients by LES status as opposed to Pseudomonas
status only.
To examine the wider effects of antibiotic resistance of LES, the antibiotic
resistance profiles of LES and non-LES isolates from an adult CF centre in Liverpool,
UK were tested over a period of five years using the disc diffusion method which
incorporated tazobactam/piperacillin, meropenem, tobramycin, ciprofloxacin,
ceftazidime, and colistin (Ashish et al. 2012). Overall, the mean antibiotic resistance
of both groups of P. aeruginosa was shown to increase between 2004 and 2008 but
LES isolates had increased resistance to all antibiotics except colistin when compared
to the non-LES group. The non-LES group exhibited increased mean resistance to
ciprofloxacin, tobramycin, and colistin but the LES group showed increased mean
resistance to all six antibiotics. The relative numbers of resistant and panresistant
strains were also found to be significantly higher in the LES group (Ashish et al. 2012).
Many LES isolates (such as LES431) have been shown to exhibit an unusual QS
25
phenotype which is characterised by a dysfunctional QS system, leading to
overproduction of QS-related factors early in the growth phase, and is termed
hypervirulence (Winstanley & Fothergill 2009). The hypervirulence phenotype has
been linked in some strains to increased resistance to some antibiotics. Although the
mechanism is unknown, this increase may be linked to up-regulation of QS-regulated
efflux pumps (Fothergill et al. 2007). The hypervirulence phenotype has not been
identified in non-LES P. aeruginosa isolates and so it is feasible that the change in QS
regulation may play a role in the success of LES and the greater morbidity and
antibiotic resistance associated with it (Ashish et al. 2012).
Table 1.2: Summary of mutations found in LES isolates vs. PAO1 which may impact on antibiotic resistance profiles of clinical isolates (Salunkhe et al. 2005).
Protein, gene, or region
Mutation in LES400 and LES431 vs. PAO1
Implications
AmpR One amino acid change (D135 → G)
Similar to a previously described mutation which inferred increased β-lactamase activity (Bagge et al. 2002).
AmpD Two amino acid changes
Inactivation of AmpD associated with increased levels of AmpC β-lactamase production (Langaee et al. 2000; Bagge et al. 2002) but identical mutations also found in isolates with low level basal and inducible AmpC.
MexR One amino acid change
May affect MexAB-OprM efflux pump but this pump only contributes marginally to β-lactam and fluoroquinolone resistance (Hocquet et al. 2003).
mexR - mexA intergenic region
Single nucleotide change
May affect MexAB-OprM efflux pump but this pump only contributes marginally to β-lactam and fluoroquinolone resistance (Hocquet et al. 2003).
oprD Expression downregulated
Carbapenem resistance associated with lowered levels of OprD in isolates with MexAB-OprM efflux pump (Pai et al. 2001).
mexZ Stop codon, MexZ protein truncated
Similar truncations have been linked to stable aminoglcoside resistance in clinical CF isolates (Vogne et al. 2004).
1.2.3 Hypermutable strains of Pseudomonas aeruginosa
Hypermutable strains are most commonly produced by alterations in DNA
mismatch repair genes, leaving the bacteria unable to avoid errors in genome
26
replication and therefore greatly increasing the occurrence of mutations (Miller
1996). In isolates taken from both CF patients and from environmental sources it was
found that the most frequently affected gene is mutS (Oliver et al. 2002). Many
mutations acquired by hypermutators prove to be synonymous, offering little or no
selective advantage to the organism, or detrimental nonsynonymous mutations
which reduce fitness and lead to the death of organisms carrying the mutation. The
advantages held by hypermutators are that the increased rate of mutations increases
the chance of the organism acquiring a beneficial mutation which allows it to better
survive in its current environment. The heterogenous and often-changing
environment of the CF lung is therefore ideal for the selection of hypermutator
strains. Once adapted to an environment, a hypermutator strain is expected to revert
to a nonmutator type to prevent the accumulation of deleterious mutations in the
population; however, this is not always observed in CF patients (Oliver 2000). Of 30
CF patients, 11 were shown to harbour mutator strains of P. aeruginosa and in most
cases the same RAPD-PCR type strain was recovered from each patient over the
period of the study, indicating that the mutator strains evolved within the patients
(Oliver 2000).
Maciá et al. (2005) carried out research into hypermutator strains present in
both NCFBr and COPD patients, finding that the prevalence of these strains was high
among these patients. Of the isolates collected 53% were found to be hypermutable,
and hypermutable strains were found in 17 (57%) of the 30 patients. Eleven of these
patients harboured hypermutable strains with a defective mutS gene. There was
shown to be no evidence of interpatient transmission events; 32 different P.
aeruginosa clones were identified by PFGE, each present in individual patients. In 28
of the 30 patients a single clone was identified, however the remaining 2 patients
were found to be colonised with two different clones. In 10 patients two or more
morphologically distinct isolates were recovered but were proven to be of a single
clonal type by PFGE analysis. The presence of hypermutable strains in such a high
proportion of patients indicates that clonal strains of P. aeruginosa are likely to be
maintained in NCFBr patients for a number of years once established, as the
27
increased rate of spontaneous mutation allows near constant adaptation to the
variable environment within the lungs of NCFBr patients.
1.2.4 Genomic polymorphism in chronic Pseudomonas aeruginosa strains
There are many common mutations that have been shown to occur when P.
aeruginosa establishes a chronic infection within the lungs of patients with
suppurative lung conditions. Much work has been undertaken to investigate the role
of mutations in the QS systems of P. aeruginosa and their role in chronic infection,
particularly in the context of CF patients. QS circuits are complex and rely on
multicomponent communication to regulate a network of interactions which affect
the destiny of the cell. Communication among a population of bacterial cells occurs
via the secretion of the signalling molecules, homoserine lactones (HSLs), into the
external environment and, upon reaching a critical concentration, are detected by
surrounding bacterial cells which triggers a series of intracellular responses
(Winstanley & Fothergill 2009). The QS network of P. aeruginosa is of particular
interest due to its complexity, involving two interdependent LuxIR-type QS systems:
LasIR and RhlIR which interact with a quinolone signal along with numerous
regulators and sigma factors. QS regulation provides a method by which bacterial
pathogens are able to reduce early detection by the host by delaying the production
of virulence factors until the bacterial population reaches such a concentration so as
to be able to have a significant effect (Girard & Bloemberg 2008). However other
purposes for HSLs have been discovered: 3-O-C12-HSL produced by P. aeruginosa can
inhibit the filamentation of the fungus Candida albicans which can coinfect with P.
aeruginosa as an opportunistic pathogen (Hogan et al. 2004). 3-O-C12-HSL has also
been found to act as an antimicrobial agent against Gram-positive organisms
(Kaufmann et al. 2005) and long-chain HSLs have been found to function as
biosurfactants influencing bacterial swarming (Daniels et al. 2006). The QS systems
have been implicated in many of the classical features of chronic P. aeruginosa
infection, including that of biofilm formation. The formation of biolfilms is known to
contribute significantly to P. aeruginosa resistance to even the most aggressive
antibiotic therapies (Stewart & Costerton 2001). The direct involvement of the QS
28
system in biolfilm development has been a contentious issue for some time and
studies using las or rhl mutants do suggest a role for QS in the formation of biofilms
but variation between strains, changes in gene expression due to environment, and
putative interactions at any of the stages in biofilm formation have all hindered in
the definition of a clear role for QS mutations in chronic infection (Winstanley &
Fothergill 2009).
As well as common mutations that occur among isolates causing chronic lung
infections, there are also “fixed” mutations present in the genomes of many
transmissible strains of P. aeruginosa that generally offer some competitive
advantage to the bacterium in causing long-term lung infections. Whole genome
sequencing of seven clinical LES isolates was undertaken by Jeukens et al. (2014) in
order to compare the genomic variations between transmissible strains of P.
aeruginosa. Approximately 1/6 of the polymorphisms identified in the genomes of
the seven LES isolates were found in regulatory genes, and 29% of them were
predicted to have a high functional impact (Jeukens et al. 2014). Both exsA and fleR
were identified as frequently variable regulatory genes. ExsA is a transcriptional
regulator of the type III secretion system and was found to differ from LESB58 in four
isolates, each with a different amino acid substitution (LES431, LESB65, LESlike1, and
LESlike4). The LES is notably non-motile with no visible flagellum and so the
redundancy of the fleR gene, responsible for the expression of flagellum in motile
strains, allows for the occurrence of nonsynonymous deleterious mutations which
can become fixed in the genome. A nonsense mutation in fleR was shared by the
three UK LES isolates (LES400, LES431, and LESB65).. These UK isolates also shared a
14 bp deletion in the gltR regulatory gene which is necessary for glucose
transportation. Fixed mutations have also previously been identified in regulatory
genes in the DK2 transmissible lineage of P. aeruginosa (Yang et al. 2011). Mutations
in lasR, rpoN, and mucA (implicated in the mucoid phenotype) were identified in
these LES isolates and although they were not fixed mutations they are still likely to
have a functional effect on the proteins produced.
29
1.2.5 Genotyping of Pseudomonas aeruginosa
There are a large number of ways to genotype bacterial species, all with
varying discriminatory powers (table 1.3). Due to the plasticity of the P. aeruginosa
accessory genome, which includes prophages and genomic islands, the genomes of
individual strains can range between 5.2 and 7 Mbp in size (Tümmler 2006) and this
variation means that methods of varying degrees of discrimination need to be utilised
to correctly genotype P. aeruginosa isolates. Different methods are selected based
on the needs of the researcher but some of the most commonly used genotyping
methods for P. aeruginosa are: variable number tandem repeat (VNTR), PFGE,
random amplified polymorphic DNA PCR (RAPD-PCR), multilocus sequence typing
(MLST), and the Array Tube (AT).
PFGE was developed by Schwartz & Cantor (1984) as a method of
fractionating chromosomal DNA of Saccharomyces cerevisiae to produce a molecular
karyotype to facilitate the assignment of genes to yeast chromosomes. PFGE has
been considered the “gold standard” of identification for many bacterial species and
has a high resolution for distinction between strains but cannot be compared
between laboratories (Larché et al. 2012). RAPD-PCR was developed by Williams et
al. (1990) as a method by which genetic maps of inheritance could be constructed.
RAPD-PCR, as implied by the name, requires no specific knowledge of the sequences
to be amplified; the assay is based on the amplification of random DNA segments
with single primers with an arbitrary nucleotide sequence (Williams et al. 1990). In
some cases, multiple genotyping techniques are needed in order to confirm the
validity of results, or simply to achieve a greater depth of information. Both RAPD-
PCR and PFGE were used to investigate the relationship between the unusual
phenotype and genotype of chronic P. aeruginosa isolates, collected sequentially
from patients. A panel of eight 10-mer primer sequences chosen specifically to
identify P. aeruginosa were found to give reproducible polymorphisms suitable for
strain identification. A small selection of isolates from this study were also subjected
to analysis by PFGE after digestion with SpeI. This study systematically investigated
the relationship between the genotype of an infecting strain of P. aeruginosa and the
subsequent phenotypic changes observed during chronic infection in CF patients. In
30
general, the RAPD-PCR profiles of the sequential isolates remained stable, indicating
that the phenotypic changes were due to adaptation of the infecting strain to unique
conditions of the CF lung, as opposed to strain replacement (Mahenthiralingam et al.
1996). Similar work was carried out by Fothergill et al. (2010) in an attempt to identify
genuine LES isolates. The standard diagnostic PCR for LES consists of two multiplexed
sets of primers, PS21 and LESF9 (table 2.1), although there have been several cases
in which false positives and negatives have been identified which necessitated the
testing of these anomalous isolates. However, Fothergill et al. (2010) discovered that
PFGE, RAPD-, and BOX-PCR fingerprinting methods were unable to unequivocally
resolve which isolates were and which were not genuine LES. The nature of chronic
lung infections in CF patients may be partly responsible for the inability of these
techniques to fully resolve the identity of isolates. Guidelines on how to interpret
PFGE restriction patterns and thus infer relationships between isolates were put
forward by Tenover et al. (1995) but this method was suggested for use in analysing
sets of isolates for epidemiological studies of relatively short-term outbreaks (1 – 3
months) in community or hospital settings. Because of the genomic instability of P.
aeruginosa in the CF lung, it may be, therefore, that PFGE is not a suitable method
for examining relatedness in the context of long-term chronic infections that are
typical in CF patients. Further to this, the AT genotyping method was also
investigated for its efficacy in discriminating between strains of P. aeruginosa. The
AT system was developed by Wiehlmann et al. (2007) and relies on the amplification
of 58 targets for hybridisation with a chip embedded in the base of a 1.5 ml tube. The
markers are either single nucleotide polymorphisms (SNPs) or variable genes, the
former being used to form a hybridisation profile which is converted into a
hexadecimal code and can be directly compared against databases of other P.
aeruginosa strains. The variable gene markers can be used to investigate the
accessory genome of P. aeruginosa as the targets include virulence factors and
previously reported genomic islands. It has been previously reported that the AT
genotyping system is 99.9% accurate in discriminating between strains of P.
aeruginosa (Morales et al. 2004) and it was found by Fothergill et al. (2010) to be
very useful in resolving anomalous results from other genotyping methods.
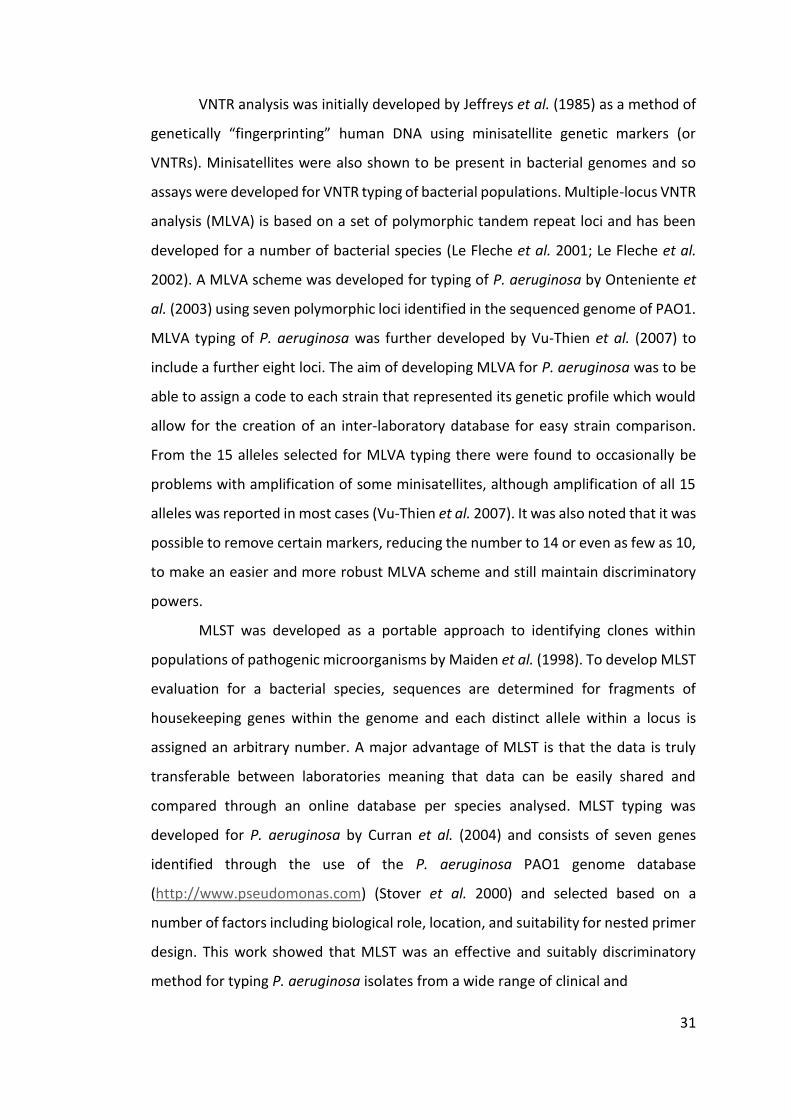
31
VNTR analysis was initially developed by Jeffreys et al. (1985) as a method of
genetically “fingerprinting” human DNA using minisatellite genetic markers (or
VNTRs). Minisatellites were also shown to be present in bacterial genomes and so
assays were developed for VNTR typing of bacterial populations. Multiple-locus VNTR
analysis (MLVA) is based on a set of polymorphic tandem repeat loci and has been
developed for a number of bacterial species (Le Fleche et al. 2001; Le Fleche et al.
2002). A MLVA scheme was developed for typing of P. aeruginosa by Onteniente et
al. (2003) using seven polymorphic loci identified in the sequenced genome of PAO1.
MLVA typing of P. aeruginosa was further developed by Vu-Thien et al. (2007) to
include a further eight loci. The aim of developing MLVA for P. aeruginosa was to be
able to assign a code to each strain that represented its genetic profile which would
allow for the creation of an inter-laboratory database for easy strain comparison.
From the 15 alleles selected for MLVA typing there were found to occasionally be
problems with amplification of some minisatellites, although amplification of all 15
alleles was reported in most cases (Vu-Thien et al. 2007). It was also noted that it was
possible to remove certain markers, reducing the number to 14 or even as few as 10,
to make an easier and more robust MLVA scheme and still maintain discriminatory
powers.
MLST was developed as a portable approach to identifying clones within
populations of pathogenic microorganisms by Maiden et al. (1998). To develop MLST
evaluation for a bacterial species, sequences are determined for fragments of
housekeeping genes within the genome and each distinct allele within a locus is
assigned an arbitrary number. A major advantage of MLST is that the data is truly
transferable between laboratories meaning that data can be easily shared and
compared through an online database per species analysed. MLST typing was
developed for P. aeruginosa by Curran et al. (2004) and consists of seven genes
identified through the use of the P. aeruginosa PAO1 genome database
(http://www.pseudomonas.com) (Stover et al. 2000) and selected based on a
number of factors including biological role, location, and suitability for nested primer
design. This work showed that MLST was an effective and suitably discriminatory
method for typing P. aeruginosa isolates from a wide range of clinical and
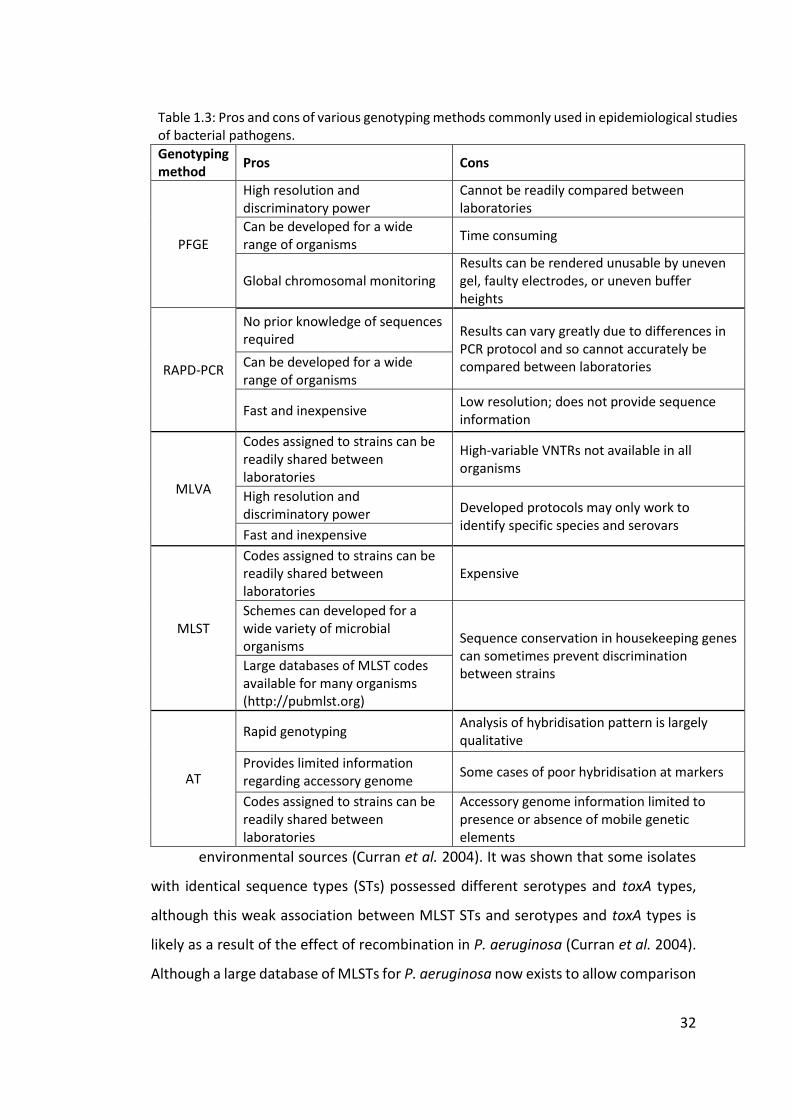
32
environmental sources (Curran et al. 2004). It was shown that some isolates
with identical sequence types (STs) possessed different serotypes and toxA types,
although this weak association between MLST STs and serotypes and toxA types is
likely as a result of the effect of recombination in P. aeruginosa (Curran et al. 2004).
Although a large database of MLSTs for P. aeruginosa now exists to allow comparison
Table 1.3: Pros and cons of various genotyping methods commonly used in epidemiological studies of bacterial pathogens.
Genotyping method
Pros Cons
PFGE
High resolution and discriminatory power
Cannot be readily compared between laboratories
Can be developed for a wide range of organisms
Time consuming
Global chromosomal monitoring Results can be rendered unusable by uneven gel, faulty electrodes, or uneven buffer heights
RAPD-PCR
No prior knowledge of sequences required
Results can vary greatly due to differences in PCR protocol and so cannot accurately be compared between laboratories Can be developed for a wide
range of organisms
Fast and inexpensive Low resolution; does not provide sequence information
MLVA
Codes assigned to strains can be readily shared between laboratories
High-variable VNTRs not available in all organisms
High resolution and discriminatory power Developed protocols may only work to
identify specific species and serovars Fast and inexpensive
MLST
Codes assigned to strains can be readily shared between laboratories
Expensive
Schemes can developed for a wide variety of microbial organisms
Sequence conservation in housekeeping genes can sometimes prevent discrimination between strains
Large databases of MLST codes available for many organisms (http://pubmlst.org)
AT
Rapid genotyping Analysis of hybridisation pattern is largely qualitative
Provides limited information regarding accessory genome
Some cases of poor hybridisation at markers
Codes assigned to strains can be readily shared between laboratories
Accessory genome information limited to presence or absence of mobile genetic elements
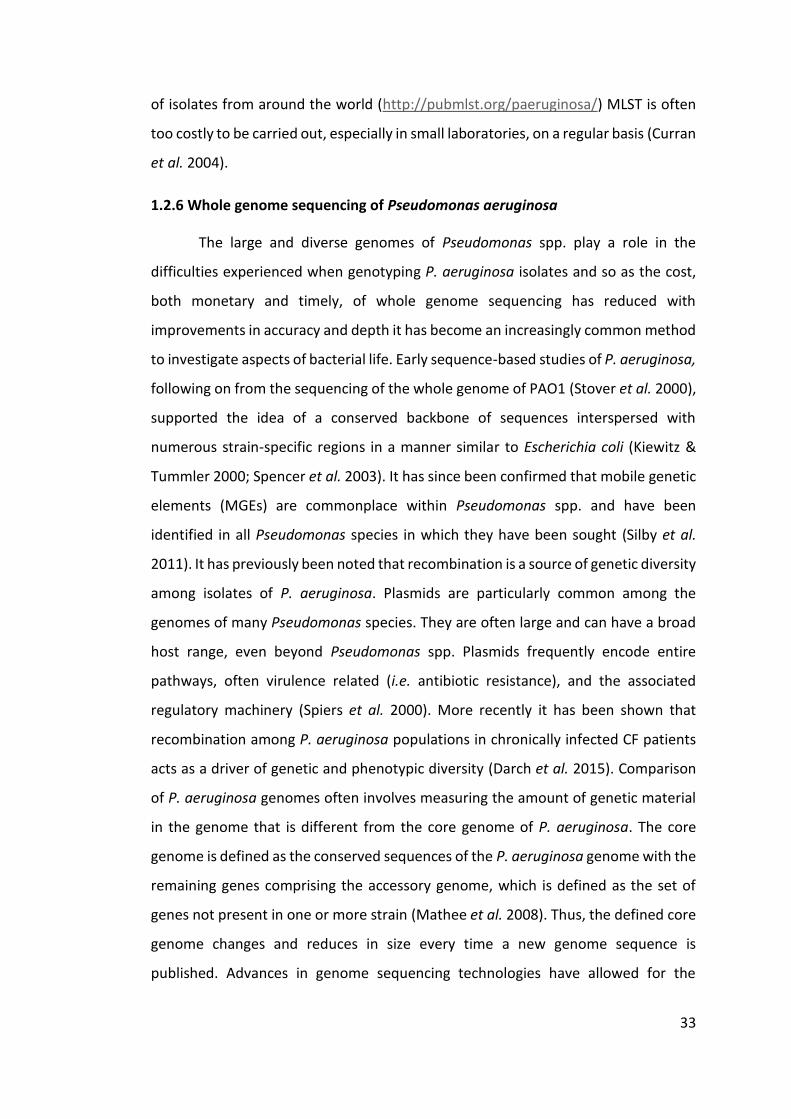
33
of isolates from around the world (http://pubmlst.org/paeruginosa/) MLST is often
too costly to be carried out, especially in small laboratories, on a regular basis (Curran
et al. 2004).
1.2.6 Whole genome sequencing of Pseudomonas aeruginosa
The large and diverse genomes of Pseudomonas spp. play a role in the
difficulties experienced when genotyping P. aeruginosa isolates and so as the cost,
both monetary and timely, of whole genome sequencing has reduced with
improvements in accuracy and depth it has become an increasingly common method
to investigate aspects of bacterial life. Early sequence-based studies of P. aeruginosa,
following on from the sequencing of the whole genome of PAO1 (Stover et al. 2000),
supported the idea of a conserved backbone of sequences interspersed with
numerous strain-specific regions in a manner similar to Escherichia coli (Kiewitz &
Tummler 2000; Spencer et al. 2003). It has since been confirmed that mobile genetic
elements (MGEs) are commonplace within Pseudomonas spp. and have been
identified in all Pseudomonas species in which they have been sought (Silby et al.
2011). It has previously been noted that recombination is a source of genetic diversity
among isolates of P. aeruginosa. Plasmids are particularly common among the
genomes of many Pseudomonas species. They are often large and can have a broad
host range, even beyond Pseudomonas spp. Plasmids frequently encode entire
pathways, often virulence related (i.e. antibiotic resistance), and the associated
regulatory machinery (Spiers et al. 2000). More recently it has been shown that
recombination among P. aeruginosa populations in chronically infected CF patients
acts as a driver of genetic and phenotypic diversity (Darch et al. 2015). Comparison
of P. aeruginosa genomes often involves measuring the amount of genetic material
in the genome that is different from the core genome of P. aeruginosa. The core
genome is defined as the conserved sequences of the P. aeruginosa genome with the
remaining genes comprising the accessory genome, which is defined as the set of
genes not present in one or more strain (Mathee et al. 2008). Thus, the defined core
genome changes and reduces in size every time a new genome sequence is
published. Advances in genome sequencing technologies have allowed for the
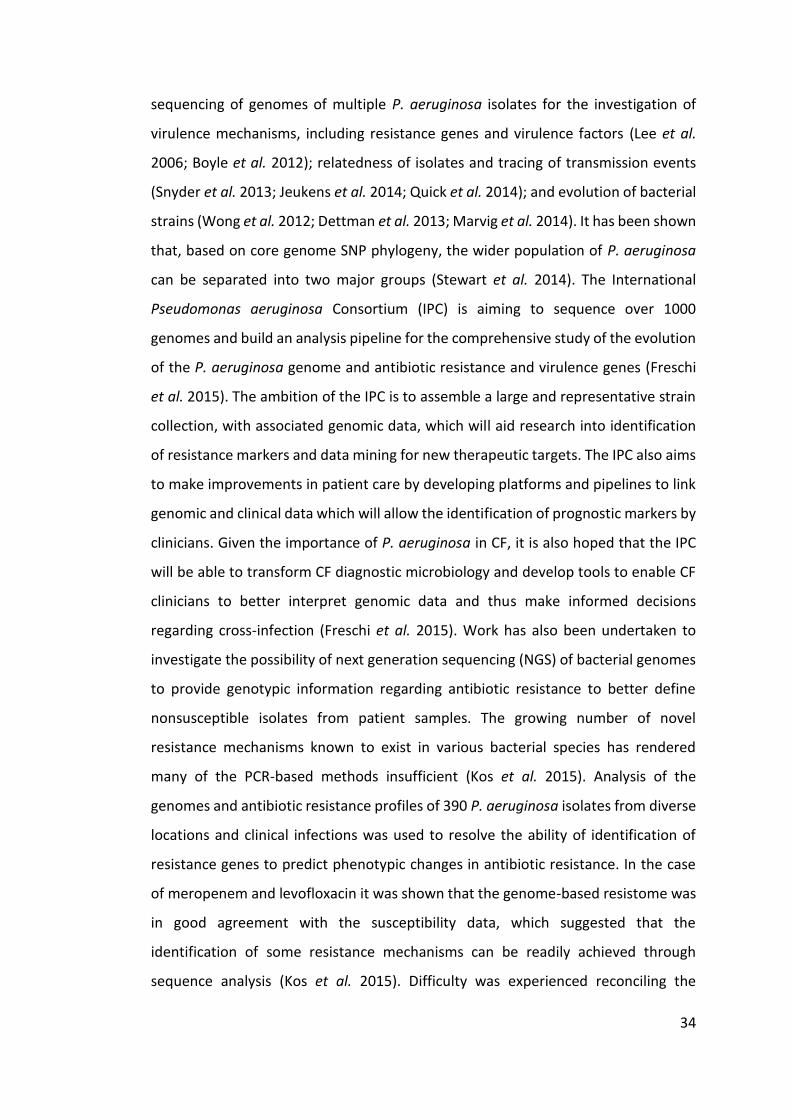
34
sequencing of genomes of multiple P. aeruginosa isolates for the investigation of
virulence mechanisms, including resistance genes and virulence factors (Lee et al.
2006; Boyle et al. 2012); relatedness of isolates and tracing of transmission events
(Snyder et al. 2013; Jeukens et al. 2014; Quick et al. 2014); and evolution of bacterial
strains (Wong et al. 2012; Dettman et al. 2013; Marvig et al. 2014). It has been shown
that, based on core genome SNP phylogeny, the wider population of P. aeruginosa
can be separated into two major groups (Stewart et al. 2014). The International
Pseudomonas aeruginosa Consortium (IPC) is aiming to sequence over 1000
genomes and build an analysis pipeline for the comprehensive study of the evolution
of the P. aeruginosa genome and antibiotic resistance and virulence genes (Freschi
et al. 2015). The ambition of the IPC is to assemble a large and representative strain
collection, with associated genomic data, which will aid research into identification
of resistance markers and data mining for new therapeutic targets. The IPC also aims
to make improvements in patient care by developing platforms and pipelines to link
genomic and clinical data which will allow the identification of prognostic markers by
clinicians. Given the importance of P. aeruginosa in CF, it is also hoped that the IPC
will be able to transform CF diagnostic microbiology and develop tools to enable CF
clinicians to better interpret genomic data and thus make informed decisions
regarding cross-infection (Freschi et al. 2015). Work has also been undertaken to
investigate the possibility of next generation sequencing (NGS) of bacterial genomes
to provide genotypic information regarding antibiotic resistance to better define
nonsusceptible isolates from patient samples. The growing number of novel
resistance mechanisms known to exist in various bacterial species has rendered
many of the PCR-based methods insufficient (Kos et al. 2015). Analysis of the
genomes and antibiotic resistance profiles of 390 P. aeruginosa isolates from diverse
locations and clinical infections was used to resolve the ability of identification of
resistance genes to predict phenotypic changes in antibiotic resistance. In the case
of meropenem and levofloxacin it was shown that the genome-based resistome was
in good agreement with the susceptibility data, which suggested that the
identification of some resistance mechanisms can be readily achieved through
sequence analysis (Kos et al. 2015). Difficulty was experienced reconciling the
35
susceptibility data for amikacin with resistome data and this may be due to the role
played by efflux pumps and their relative expression in aminoglycoside resistance.
One of the downfalls of whole genome sequencing in this context is its inability to
measure gene expression which is known to play a large role in antibiotic resistance
(Kos et al. 2015). Nonetheless this research highlights one of the many potential uses
of whole genome sequencing and could, in the future, be combined with techniques
such as transcriptome sequencing (RNA-Seq) to better predict resistance profiles
from genetic information (Kos et al. 2015).
Alongside the potential uses of whole genome sequencing in investigating
bacterial isolates in depth it has also been suggested that it could be used in future
as a diagnostic tool, allowing the rapid and accurate identification of bacterial species
and associated risk factors (i.e. antibiotic resistance) to allow the best possible
decision to be made with regards to patient health. As technological advances are
made and sequencing platforms become more compact and user-friendly it is likely
that increasing number of diagnostic laboratories will have access to sequencing
platforms, and that the technical requirements for their use will become comparable
to those required for diagnostic PCR (Török & Peacock 2012). At present, the depth
of information provided by whole genome sequencing is not warranted for use in the
majority of work undertaken in diagnostic microbiology, although there have already
been cases in which the benefits of sequencing could be beneficial to public health;
in particular, the outbreak of E. coli 0104:H4 in Germany in 2011. Investigators
sequenced four outbreak strains and two historical reference strains to create optical
maps of the strains within 62 h, demonstrating real-time use of diagnostic
sequencing to investigate an ongoing outbreak of disease (Mellmann et al. 2011). In
this context, sequencing may be useful for the rapid identification of multidrug-
resistant Gram-negative bacteria, such as P. aeruginosa, in nosocomial outbreaks.
Sequence data would allow diagnostic laboratories to identify an outbreak strain and
analyse the presence of antibiotic resistance genes present in the genome in order
to present the patient with an effective treatment for infection (Török & Peacock
2012). At present the greatest obstacle to rapid diagnostic sequencing is the lack of
automated interpretation software that can accurately translate sequence data to
36
provide the required information in a format that is accessible to microbiologists, as
opposed to bioinformaticians, and can be applied rapidly to a clinical situation (Török
& Peacock 2012).
1.3 Aims
The overall aim of this work is to further understanding of the importance of P.
aeruginosa infection in patients with NCFBr. The disease itself is grossly understudied
and it is only in recent years that the burden of NCFBr both on patients and on
healthcare systems has been fully realised. Research into P. aeruginosa infection in
CF patients has been extensive, though is by no means complete, and by comparison
the available information regarding chronic P. aeruginosa infections in NCFBr
patients is incredibly sparse. Very little is known about the retention of strains or the
presence of transmissible strains of P. aeruginosa among NCFBr patient populations
and this work aims to begin to resolve this. An understanding of the prevalence of
transmissible strains of P. aeruginosa among NCFBr patients is important in terms of
healthcare standards and is necessary to inform segregation policies in
bronchiectasis centres. It is also hoped that this work will act as a foundation for
others to continue research into P. aeruginosa infections in NCFBr patients,
particularly with regards to the long-term effects of chronic infection on both
patients and bacterial populations. It has been shown that antibiotic resistance
among P. aeruginosa isolates increases over the course of chronic infection in CF
patients (Ashish et al. 2012) and so future research into similar outcomes from NCFBr
patients should be undertaken given the current burden placed upon public
healthcare providers by increasing levels of antibiotic resistance.The specific aims of
this work are to:
1. Use AT genotyping to investigate the maintenance of P. aeruginosa
strains in chronic lung infections in NCFBr patients over an extended
period of time;

37
2. Compare the four digit AT codes to those in databases from previous
studies to place NCFBr P. aeruginosa isolates in the context of the
wider P. aeruginosa population;
3. Use whole genome sequencing to investigate the diversity and
population structure of P. aeruginosa isolates from NCFBr patients;
4. Use whole genome sequencing to investigate the heterogeneity of
P. aeruginosa populations within chronically infected individuals
with NCFBr.
38
Chapter Two
Methods and Materials
2.1 Collection and storage of isolates
The collection of UK-wide isolates were provided by Dr Juliet Foweraker
(Papworth Hospital) and isolates from Liverpool were provided by Paul Roberts
(Royal Liverpool University Hospital). A total of 408 isolates (appendix, table A1) were
collected from 16 adult bronchiectasis centres in the UK. The patients were adults
with confirmed bronchiectasis, with no known cystic fibrosis (CF), who regularly
attend clinics at the centres. Isolates were catalogued with the information provided
by the centre and stored at -80°C in 1 ml 5% (V/V) glycerol Luria broth (LB) (table 2.2).
In preparation for storage, isolates provided from frozen bead stocks at Royal
Liverpool and Broadgreen University Hospitals (RLBUHT) and from slopes from other
centres were plated on to Columbia agar (Oxoid) (table 2.2) and grown overnight at
37°C. Following overnight growth a sweep of each organism was taken with a 5 μl
inoculation loop and resuspended in 1 ml 5% (V/V) glycerol LB in a 1.5 ml Eppendorf
tube. Each tube was vortexed to homogenize the mixture before being labelled and
stored at -80°C.
2.2 PCR amplification screening
Polymerase chain reaction (PCR) screening was performed on all isolates in
order to confirm their identity as P. aeruginosa; screen for Liverpool Epidemic Strain
(LES), Midlands 1 and Manchester Epidemic Strain (MES) (Fothergill et al. 2008). To
prepare a crude DNA extract a sweep of colonies from overnight growth on Columbia
agar (Oxoid) at 37°C was suspended in 100 µl sterile distilled water and heated at
99°C for 5 min. Following centrifugation, 1 μl of supernatant was used in 25 μl
volumes containing 5 μl GoTaq buffer, 0.5 μl dNTPs (10 mM), 300 nM forward primer
per primer set, 300 nM reverse primer per primer set, 2 μl MgCl2 (25 mM), 0.1 μl
GoTaq 2G polymerase (5 u μl-1), and sterile distilled water to final volume of 25 μl.
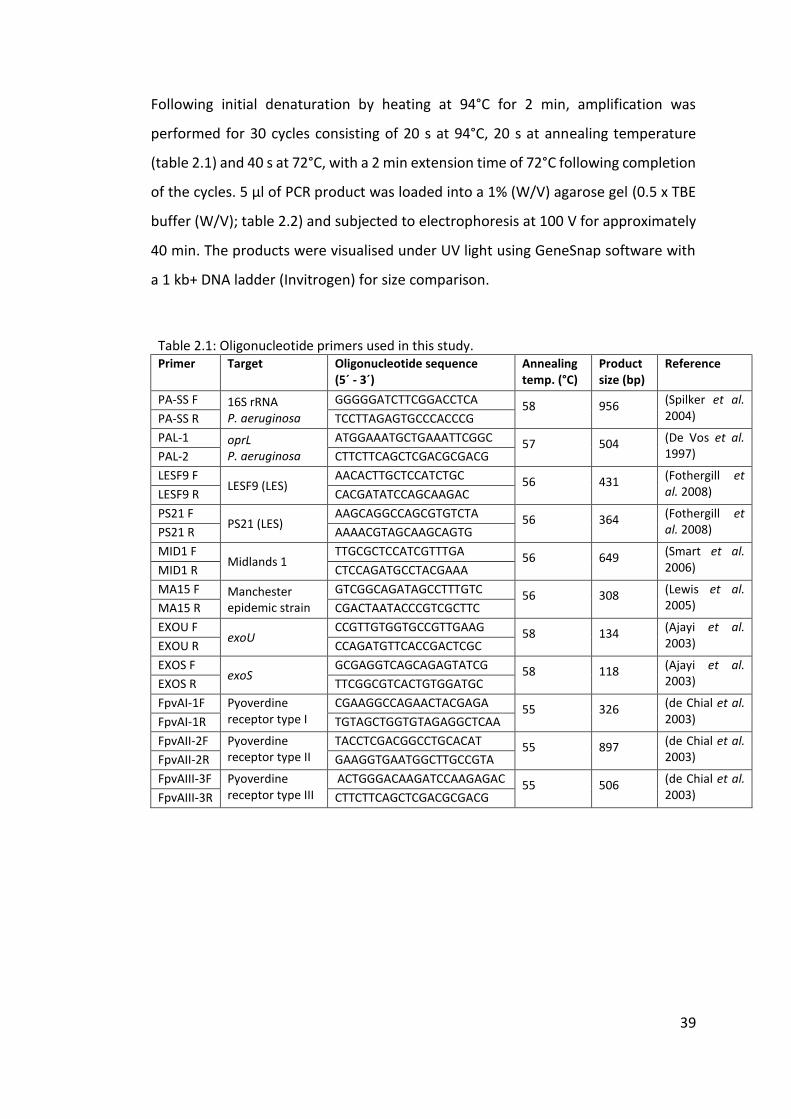
39
Following initial denaturation by heating at 94°C for 2 min, amplification was
performed for 30 cycles consisting of 20 s at 94°C, 20 s at annealing temperature
(table 2.1) and 40 s at 72°C, with a 2 min extension time of 72°C following completion
of the cycles. 5 μl of PCR product was loaded into a 1% (W/V) agarose gel (0.5 x TBE
buffer (W/V); table 2.2) and subjected to electrophoresis at 100 V for approximately
40 min. The products were visualised under UV light using GeneSnap software with
a 1 kb+ DNA ladder (Invitrogen) for size comparison.
Table 2.1: Oligonucleotide primers used in this study. Primer Target Oligonucleotide sequence
(5´ - 3´) Annealing temp. (°C)
Product size (bp)
Reference
PA-SS F 16S rRNA P. aeruginosa
GGGGGATCTTCGGACCTCA 58 956 (Spilker et al. 2004) PA-SS R TCCTTAGAGTGCCCACCCG
PAL-1 oprL P. aeruginosa
ATGGAAATGCTGAAATTCGGC 57 504 (De Vos et al. 1997) PAL-2 CTTCTTCAGCTCGACGCGACG
LESF9 F LESF9 (LES)
AACACTTGCTCCATCTGC 56 431 (Fothergill et al. 2008) LESF9 R CACGATATCCAGCAAGAC
PS21 F PS21 (LES)
AAGCAGGCCAGCGTGTCTA 56 364 (Fothergill et al. 2008) PS21 R AAAACGTAGCAAGCAGTG
MID1 F Midlands 1
TTGCGCTCCATCGTTTGA 56 649 (Smart et al. 2006) MID1 R CTCCAGATGCCTACGAAA
MA15 F Manchester epidemic strain
GTCGGCAGATAGCCTTTGTC 56 308 (Lewis et al. 2005) MA15 R CGACTAATACCCGTCGCTTC
EXOU F exoU
CCGTTGTGGTGCCGTTGAAG 58 134 (Ajayi et al. 2003) EXOU R CCAGATGTTCACCGACTCGC
EXOS F exoS
GCGAGGTCAGCAGAGTATCG 58 118 (Ajayi et al. 2003) EXOS R TTCGGCGTCACTGTGGATGC
FpvAI-1F Pyoverdine receptor type I
CGAAGGCCAGAACTACGAGA 55 326 (de Chial et al. 2003) FpvAI-1R TGTAGCTGGTGTAGAGGCTCAA
FpvAII-2F Pyoverdine receptor type II
TACCTCGACGGCCTGCACAT 55 897 (de Chial et al. 2003) FpvAII-2R GAAGGTGAATGGCTTGCCGTA
FpvAIII-3F Pyoverdine receptor type III
ACTGGGACAAGATCCAAGAGAC 55 506 (de Chial et al. 2003) FpvAIII-3R CTTCTTCAGCTCGACGCGACG
40
2.3 Clondiag/Alere Array Tube genotyping
Bacterial samples isolated as from single colonies were grown overnight at
37°C on Columbia agar (Oxoid) and a sweep of the organism collected using a 5 μl
inoculating loop and suspended in 1 ml sterile distilled water. Following
centrifugation at 13 000 rpm for 2 min the supernatant was removed and the pellet
resuspended in 200 μl sterile distilled water. The suspension was transferred to a 0.5
ml Eppendorf tube and heated at 99°C for 5 min. Following further 2 min
centrifugation at 13 000 rpm, 5 μl supernatant was added to a 5 μl Master Mix
containing 4.9 μl Labelling buffer and 0.1 μl biotin-dUTP Labelling enzyme.
Amplification was then carried out in a linear PCR programme which consisted of
initial denaturation at 96°C for 5 min and then 50 cycles of 62°C for 20 s, 72°C for 40
s and 60°C for 1 min. The linear PCR uses only one primer per target, instead of a pair,
which produces only single stranded products and thus limits the amount of
amplification and controls cross-contamination. The primers are all of a similar length
and the sequences and melting temperatures are shown in the appendix, table A2.
Before proceeding with hybridisation, the array tubes were washed twice in
hybridisation buffer for 5 min at 550 rpm. Amplified single stranded DNA (ssDNA)
was transferred to the AT and hybridisation completed by the addition of 90 μl
hybridisation buffer and incubation at 60°C for 1 h. The ssDNA/hybridisation buffer
mix was then carefully removed from the AT by pipetting. Care was taken to avoid
any contact between the pipette tip and the AT chip as any contact could damage
the probes.
The tubes were then washed 3 times with 500 μl AT wash buffer 1 to limit
non-specific hybridisation; once without mixing or incubation and twice incubated at
30°C for 5 min at 550 rpm. Following washing, 100 μl horseradish streptavidin-
peroxidase (HRP) solution was added to allow conjugation. Tetramethylbenzidine
(TMB) was then added to allow precipitation staining and complete the process. AT
images were acquired using an ATR 03 Colorimetric reader and AT-Iconclust software
(Alere Technologies, Jena). Figure 2.2 shows a simplified step-by-step protocol for AT
genotyping; a more detailed protocol can be obtained from the manufacturer (Alere

41
Technologies, Jena). Six control spots are present on the AT chip that bind directly to
HRP which allow indication of a correct test performance and aid in orientating the
image for analysis (figure 2.3).
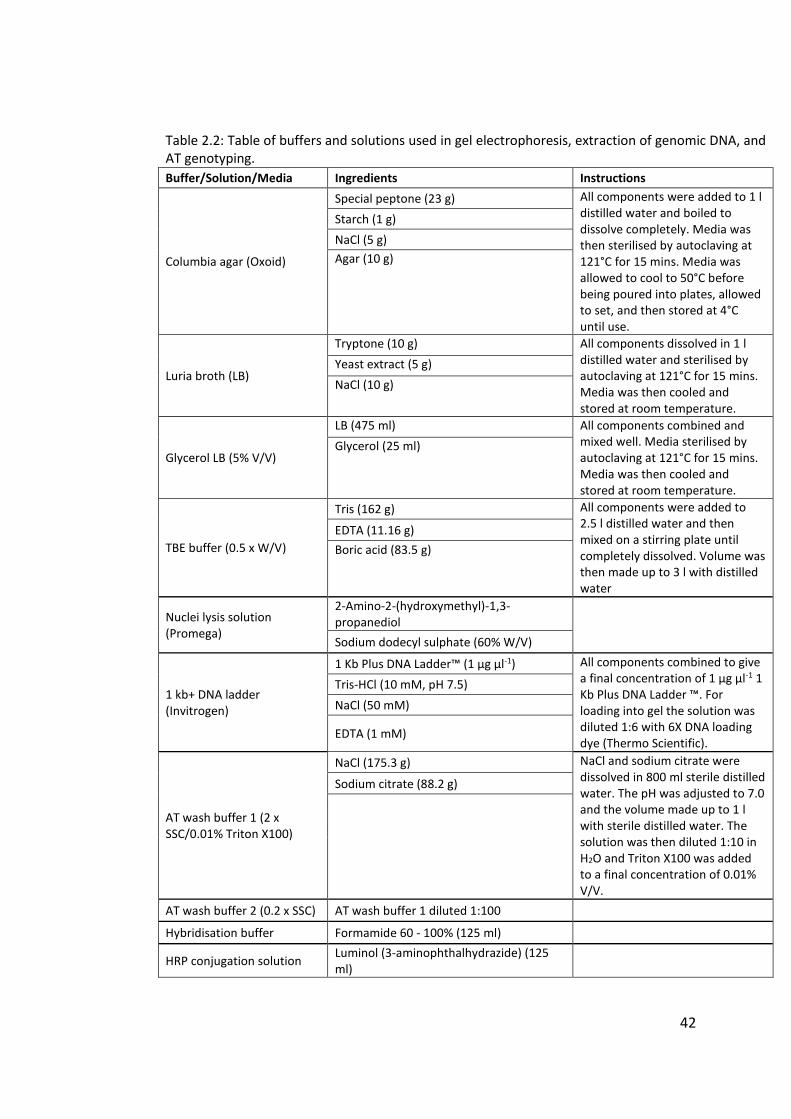
42
Table 2.2: Table of buffers and solutions used in gel electrophoresis, extraction of genomic DNA, and AT genotyping.
Buffer/Solution/Media Ingredients Instructions
Columbia agar (Oxoid)
Special peptone (23 g) All components were added to 1 l distilled water and boiled to dissolve completely. Media was then sterilised by autoclaving at 121°C for 15 mins. Media was allowed to cool to 50°C before being poured into plates, allowed to set, and then stored at 4°C until use.
Starch (1 g)
NaCl (5 g)
Agar (10 g)
Luria broth (LB)
Tryptone (10 g) All components dissolved in 1 l distilled water and sterilised by autoclaving at 121°C for 15 mins. Media was then cooled and stored at room temperature.
Yeast extract (5 g)
NaCl (10 g)
Glycerol LB (5% V/V)
LB (475 ml) All components combined and mixed well. Media sterilised by autoclaving at 121°C for 15 mins. Media was then cooled and stored at room temperature.
Glycerol (25 ml)
TBE buffer (0.5 x W/V)
Tris (162 g) All components were added to 2.5 l distilled water and then mixed on a stirring plate until completely dissolved. Volume was then made up to 3 l with distilled water
EDTA (11.16 g)
Boric acid (83.5 g)
Nuclei lysis solution (Promega)
2-Amino-2-(hydroxymethyl)-1,3-propanediol
Sodium dodecyl sulphate (60% W/V)
1 kb+ DNA ladder (Invitrogen)
1 Kb Plus DNA Ladder™ (1 µg µl-1) All components combined to give a final concentration of 1 µg µl-1 1 Kb Plus DNA Ladder ™. For loading into gel the solution was diluted 1:6 with 6X DNA loading dye (Thermo Scientific).
Tris-HCl (10 mM, pH 7.5)
NaCl (50 mM)
EDTA (1 mM)
AT wash buffer 1 (2 x SSC/0.01% Triton X100)
NaCl (175.3 g) NaCl and sodium citrate were dissolved in 800 ml sterile distilled water. The pH was adjusted to 7.0 and the volume made up to 1 l with sterile distilled water. The solution was then diluted 1:10 in H2O and Triton X100 was added to a final concentration of 0.01% V/V.
Sodium citrate (88.2 g)
AT wash buffer 2 (0.2 x SSC) AT wash buffer 1 diluted 1:100
Hybridisation buffer Formamide 60 - 100% (125 ml)
HRP conjugation solution Luminol (3-aminophthalhydrazide) (125 ml)
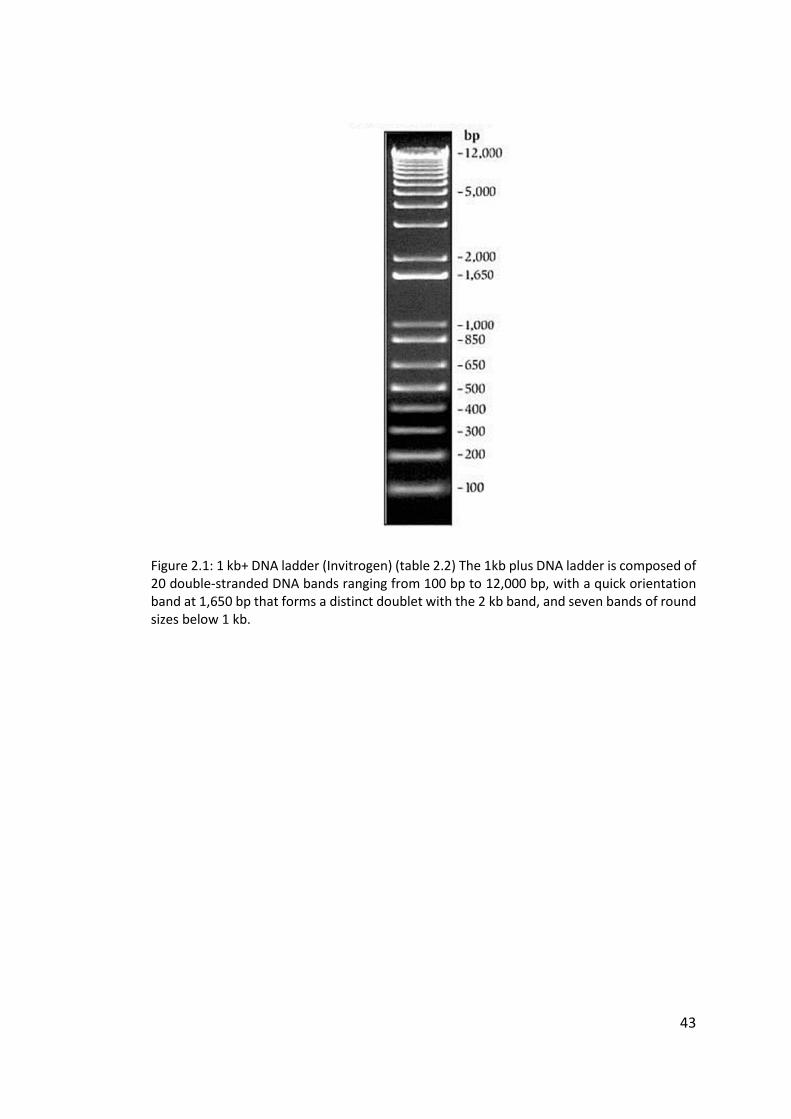
43
Figure 2.1: 1 kb+ DNA ladder (Invitrogen) (table 2.2) The 1kb plus DNA ladder is composed of 20 double-stranded DNA bands ranging from 100 bp to 12,000 bp, with a quick orientation band at 1,650 bp that forms a distinct doublet with the 2 kb band, and seven bands of round sizes below 1 kb.
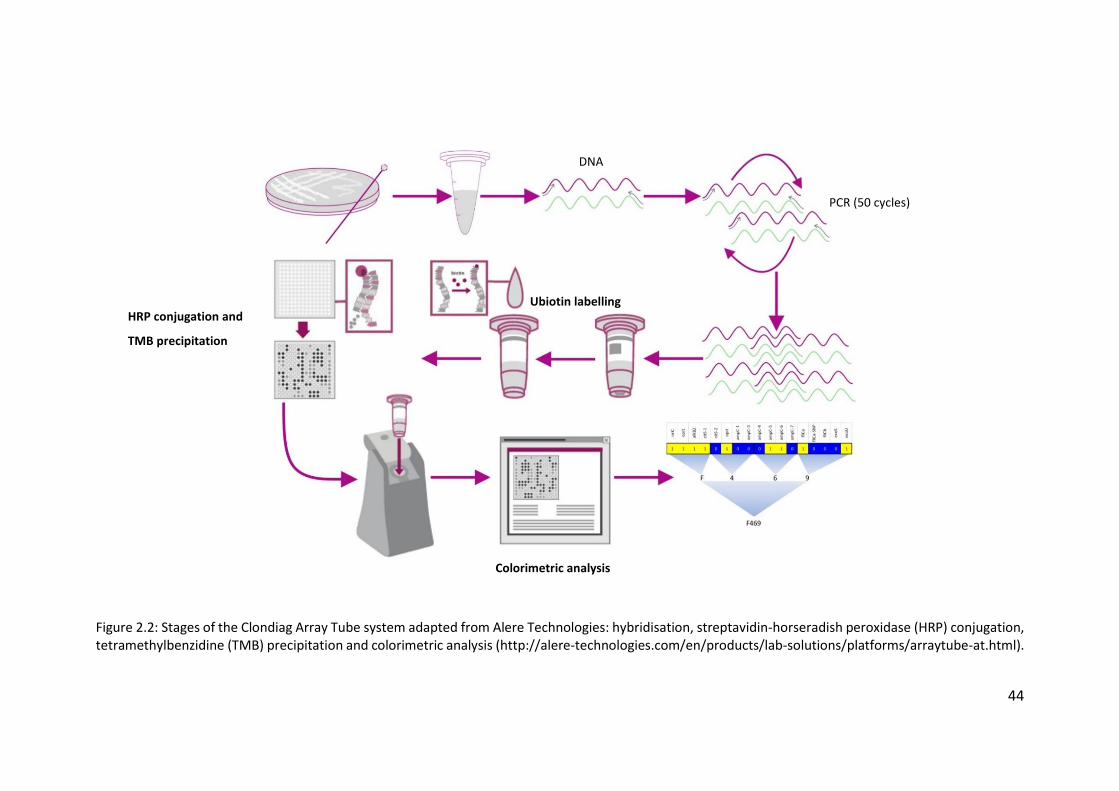
44
Figure 2.2: Stages of the Clondiag Array Tube system adapted from Alere Technologies: hybridisation, streptavidin-horseradish peroxidase (HRP) conjugation, tetramethylbenzidine (TMB) precipitation and colorimetric analysis (http://alere-technologies.com/en/products/lab-solutions/platforms/arraytube-at.html).
PCR (50 cycles)
Ubiotin labelling
Colorimetric analysis
DNA
HRP conjugation and
TMB precipitation
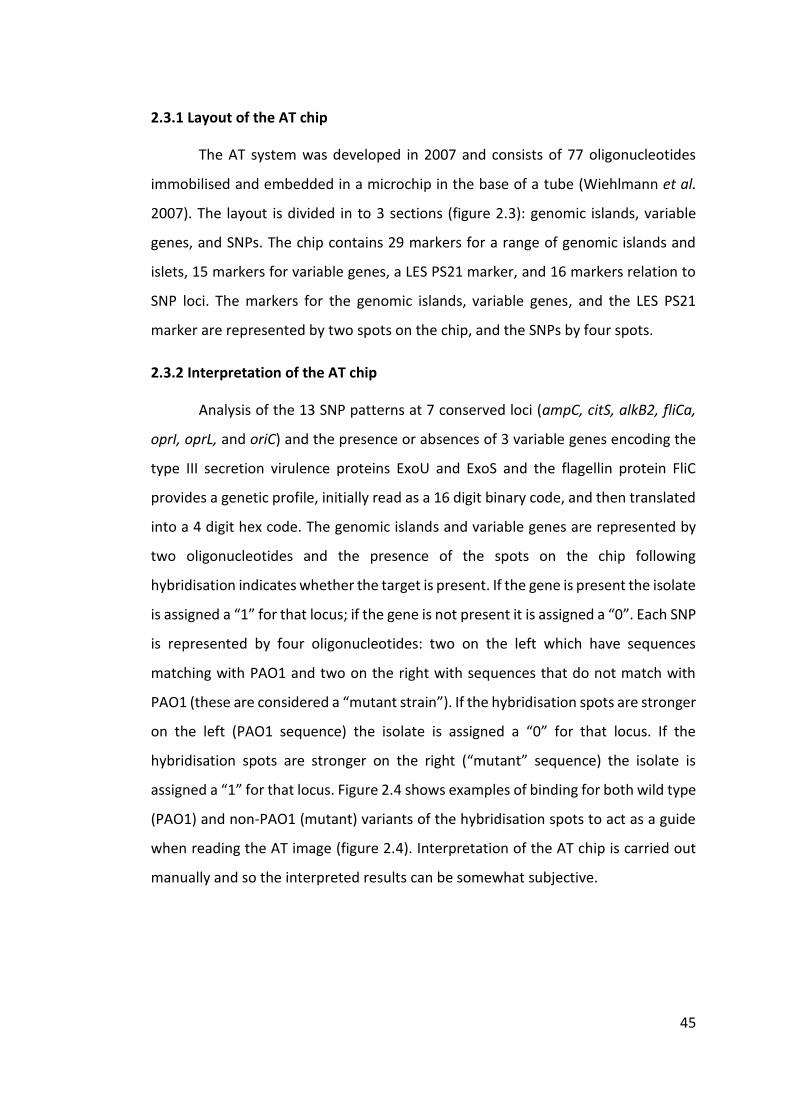
45
2.3.1 Layout of the AT chip
The AT system was developed in 2007 and consists of 77 oligonucleotides
immobilised and embedded in a microchip in the base of a tube (Wiehlmann et al.
2007). The layout is divided in to 3 sections (figure 2.3): genomic islands, variable
genes, and SNPs. The chip contains 29 markers for a range of genomic islands and
islets, 15 markers for variable genes, a LES PS21 marker, and 16 markers relation to
SNP loci. The markers for the genomic islands, variable genes, and the LES PS21
marker are represented by two spots on the chip, and the SNPs by four spots.
2.3.2 Interpretation of the AT chip
Analysis of the 13 SNP patterns at 7 conserved loci (ampC, citS, alkB2, fliCa,
oprI, oprL, and oriC) and the presence or absences of 3 variable genes encoding the
type III secretion virulence proteins ExoU and ExoS and the flagellin protein FliC
provides a genetic profile, initially read as a 16 digit binary code, and then translated
into a 4 digit hex code. The genomic islands and variable genes are represented by
two oligonucleotides and the presence of the spots on the chip following
hybridisation indicates whether the target is present. If the gene is present the isolate
is assigned a “1” for that locus; if the gene is not present it is assigned a “0”. Each SNP
is represented by four oligonucleotides: two on the left which have sequences
matching with PAO1 and two on the right with sequences that do not match with
PAO1 (these are considered a “mutant strain”). If the hybridisation spots are stronger
on the left (PAO1 sequence) the isolate is assigned a “0” for that locus. If the
hybridisation spots are stronger on the right (“mutant” sequence) the isolate is
assigned a “1” for that locus. Figure 2.4 shows examples of binding for both wild type
(PAO1) and non-PAO1 (mutant) variants of the hybridisation spots to act as a guide
when reading the AT image (figure 2.4). Interpretation of the AT chip is carried out
manually and so the interpreted results can be somewhat subjective.

46
2.3.3 Hexadecimal code conversion
The resulting hexadecimal binary code can then be converted to a 4 digit code
as shown in figure 2.5 and a genetic fingerprint is produced and assigned to the
strain. This code can then be compared to isolate information from several large,
previously described databases (Wiehlmann et al. 2007; Cramer et al. 2012; Shankar
et al. 2012; Hall et al. 2014; De Soyza et al. 2014). A combined dataset was created
including information from all 761 isolates from the previous databases. The
comparison allows for further information to be acquired about the strain in
question, in particular if it has previously been assigned a clone type and
environments from which isolates of the same strain type have been previously
collected.
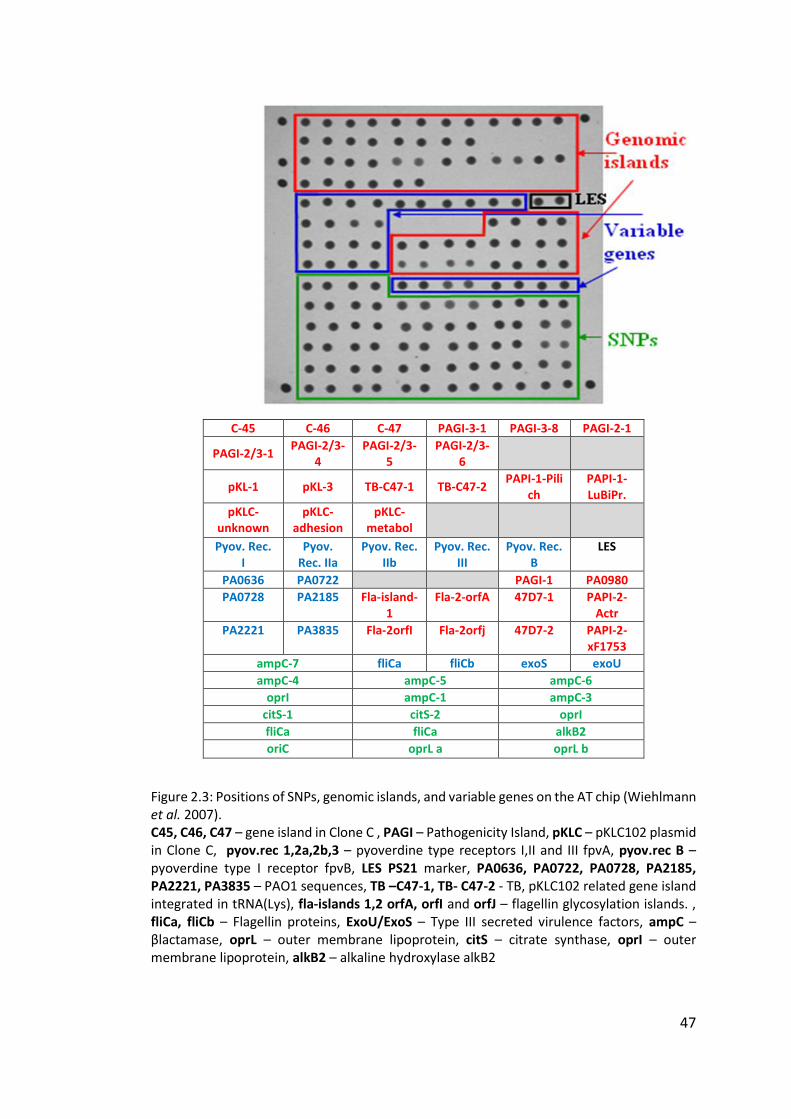
47
C-45 C-46 C-47 PAGI-3-1 PAGI-3-8 PAGI-2-1
PAGI-2/3-1 PAGI-2/3-
4 PAGI-2/3-
5 PAGI-2/3-
6
pKL-1 pKL-3 TB-C47-1 TB-C47-2 PAPI-1-Pili
ch PAPI-1-LuBiPr.
pKLC- unknown
pKLC-adhesion
pKLC- metabol
Pyov. Rec. I
Pyov. Rec. IIa
Pyov. Rec. IIb
Pyov. Rec. III
Pyov. Rec. B
LES
PA0636 PA0722 PAGI-1 PA0980
PA0728 PA2185 Fla-island-1
Fla-2-orfA 47D7-1 PAPI-2-Actr
PA2221 PA3835 Fla-2orfI Fla-2orfj 47D7-2 PAPI-2-xF1753
ampC-7 fliCa fliCb exoS exoU
ampC-4 ampC-5 ampC-6
oprI ampC-1 ampC-3
citS-1 citS-2 oprI
fliCa fliCa alkB2
oriC oprL a oprL b
Figure 2.3: Positions of SNPs, genomic islands, and variable genes on the AT chip (Wiehlmann et al. 2007). C45, C46, C47 – gene island in Clone C , PAGI – Pathogenicity Island, pKLC – pKLC102 plasmid in Clone C, pyov.rec 1,2a,2b,3 – pyoverdine type receptors I,II and III fpvA, pyov.rec B – pyoverdine type I receptor fpvB, LES PS21 marker, PA0636, PA0722, PA0728, PA2185, PA2221, PA3835 – PAO1 sequences, TB –C47-1, TB- C47-2 - TB, pKLC102 related gene island integrated in tRNA(Lys), fla-islands 1,2 orfA, orfI and orfJ – flagellin glycosylation islands. , fliCa, fliCb – Flagellin proteins, ExoU/ExoS – Type III secreted virulence factors, ampC – βlactamase, oprL – outer membrane lipoprotein, citS – citrate synthase, oprI – outer membrane lipoprotein, alkB2 – alkaline hydroxylase alkB2
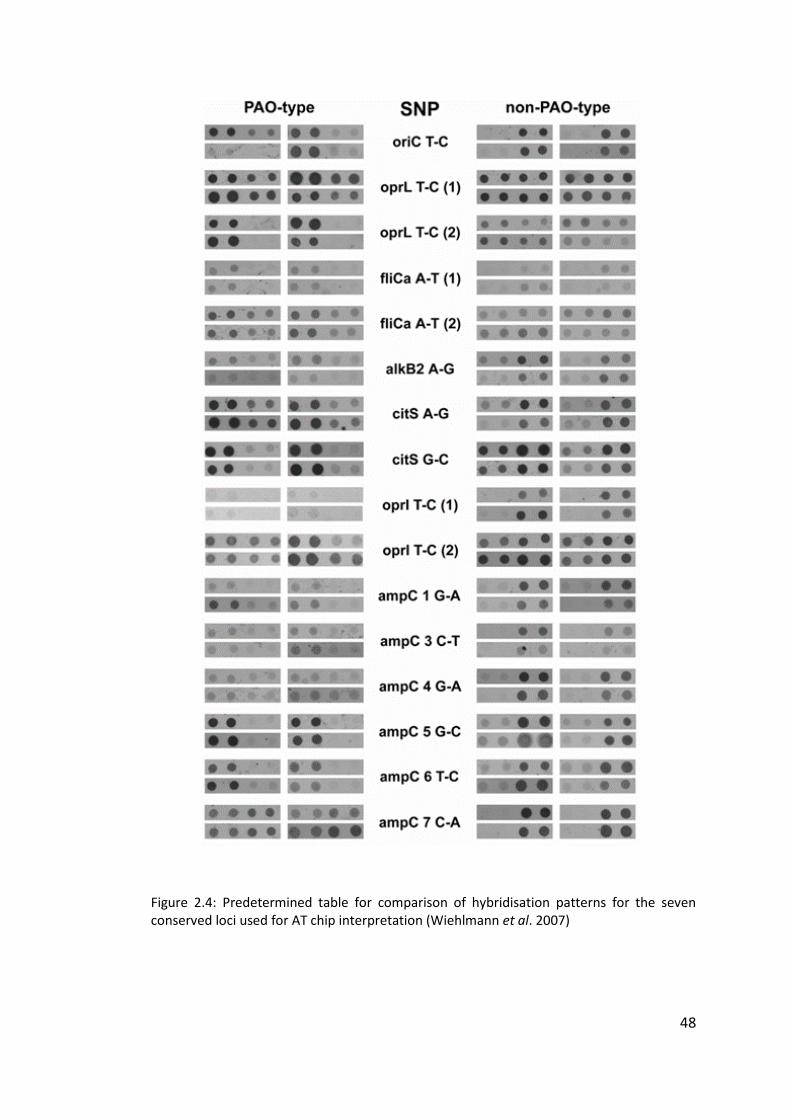
48
Figure 2.4: Predetermined table for comparison of hybridisation patterns for the seven conserved loci used for AT chip interpretation (Wiehlmann et al. 2007)
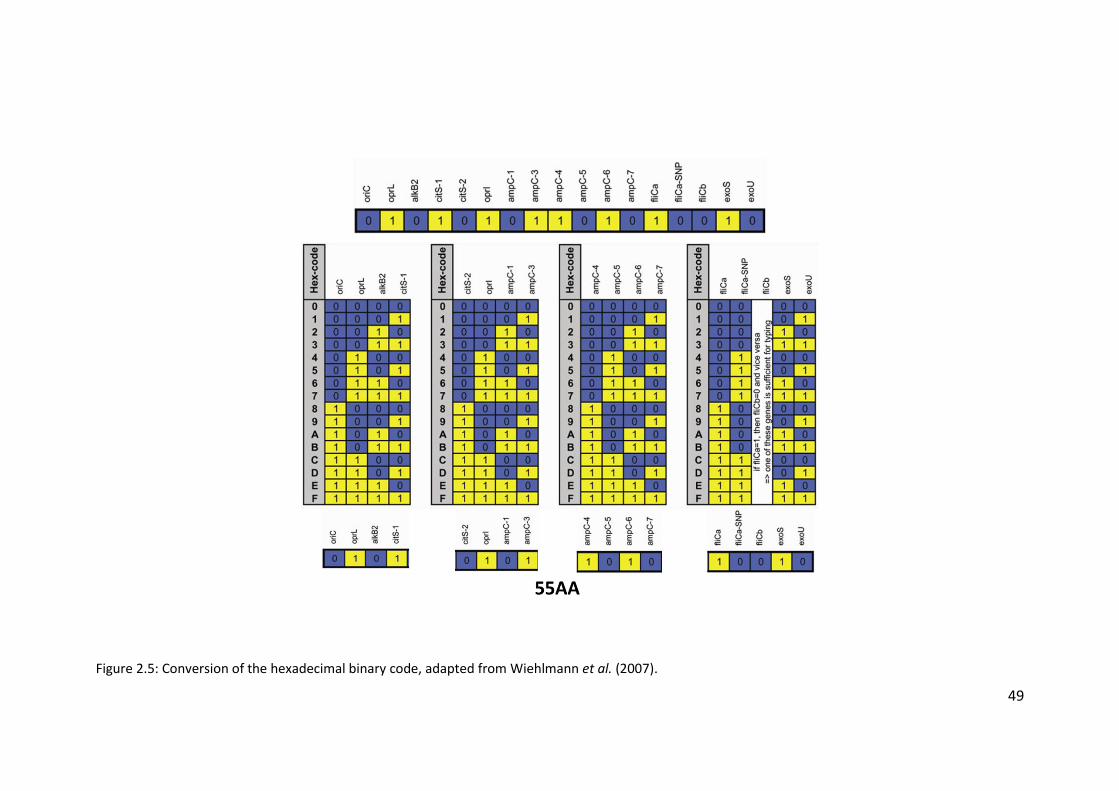
49
Figure 2.5: Conversion of the hexadecimal binary code, adapted from Wiehlmann et al. (2007).
50
2.4 Genomic DNA extraction for Illumina sequencing
A total of 191 isolates, isolated from single bacterial colonies, were selected
to undergo whole genome sequencing. Genomic DNA (gDNA) was extracted from
these isolates using a Promega Wizard Genomic DNA Purification Kit. The basic
protocol was followed, with some minor adjustments to improve yield and purity.
Asterisks indicate where the method used deviates from that provided by the
manufacturer.
A single colony was picked and grown overnight in 5 ml LB broth in a shaking
incubator at 37°C and 180 rpm. To pellet the cells, 1 ml overnight culture was
centrifuged for 2 min at 14 000 rpm and the supernatant discarded. Cells were lysed
by adding 600 μl Nuclei Lysis Solution and mixing gently. The tubes were then
incubated at 80°C for 5 min and then cooled on ice for a further 5 min*. Once cool 3
μl RNase A Solution (Promega) was added and gently mixed. The tubes were then
incubated at 37°C for 1 h and then cooled on ice for 5 min*. Protein was precipitated
by adding 400 μl Protein Precipitation Solution* and vortexing immediately. The
tubes were kept on ice for 5 min and then centrifuged at 14 000 rpm for 5 min*. The
supernatant was then transferred to a tube containing 600 μl room temperature
isopropanol and mixed by inverting the tube several times. Following centrifugation
at 14 000 rpm for 15 min* the supernatant was removed. Once dry, 600 μl room
temperature 70% ethanol (V/V) was added to each tube and the samples were
centrifuged at 14 000 rpm for 15 min*. The supernatant was then removed and the
tubes left to air dry completely. The DNA pellet was then rehydrated by adding 100
μl DEPC-treated water and storing overnight at 4°C.
2.4.1 Quantification of genomic DNA by Qubit fluorometer
Quantification of gDNA in samples was carried out using a Qubit 3.0
fluorometer and Qubit dsDNA broad range assay kit (Life Technologies). A working
solution was made using concentrated assay reagent and dilution buffer in a 1:200
dilution. 190 μl working solution was added to 10 μl of each of the two pre-diluted
standards for a total reaction volume of 200 μl. 2 μl sample was used per reaction,
51
and made up to a final volume of 200 μl with working solution. The tubes were
vortexed for 2 – 3 seconds and then incubated at room temperature for 2 min before
being inserted into the Qubit fluorometer to measure fluorescence. Samples were
required to contain >20 ng μl-1 gDNA in order to be sent for sequencing.
2.4.2 Quantification and purity testing of genomic DNA by NanoDrop
spectrophotometer
Further quantification and purity testing of gDNA in samples was carried out
using a NanoDrop 1000 spectrophotometer (Thermo Scientific). Extracted DNA had
previously been eluted in DEPC-treated water and so the same was used as a blank
for NanoDrop measurements. 2 μl DEPC-treated water was carefully pipetted on to
the lower measurement pedestal of the spectrophotometer and the sampling arm
then closed to form a liquid column to allow the machine to make a blank
measurement. 2 μl sample was pipetted in the same manner on to the lower
measurement pedestal of the machine and measurements made. Both the upper and
lower measurement pedestals were wiped clean with a soft clean tissue between
sample measurements.
NanoDrop measurements provide a wide range of information on the
absorbance of the sample but the measurements most highly relating to the purity
of the sample are the ratios of sample absorbance at 260/280 nm and 260/230 nm.
260/280 ratio of absorbance assesses purity of DNA present in the sample. A ratio of
~1.8 is generally accepted as “pure” for DNA samples. If the ratio is much lower than
1.8 it may indicate the presence of protein or other contaminants that absorb
strongly at 280 nm. 260/230 ratio of absorbance is a secondary measure of DNA
purity and 260/230 ratios for “pure” samples are often higher than the respective
260/280 ratios, often in the range of 1.8 – 2.2. A much lower ratio may indicate the
presence of co-purified contaminants.
52
2.5 Whole genome sequencing
2.5.1 Data acquisition
Following gDNA extraction and quantification, samples were sequenced and
analysed at the Centre for Genomic Research at the University of Liverpool. Shotgun
libraries were prepared from the normalised samples using TruSeq Nano library
preparation kit. Following library preparation, paired-end sequencing (2 x 100 bp)
was performed by multiplexing into one lane of the Illumina HiSeq platform and
sequenced with SBS V4 chemistry.
Following processing, the raw Fastq files were trimmed for the presence of
Illumina adapter sequences using Cutadapt version 1.2.1 (Martin 2011). The option
–O 3 was used to that the 3ʹ end of any reads which match the adapter sequence for
3 bp or more were trimmed. The reads were further trimmed using Sickle
(https://github.com/najoshi/sickle) version 1.200 with a minimum window quality
score of 20. Reads shorter than 10 bp after trimming were removed. If only one read
of a pair passed this filter, it was included in the R0 file, with files R1 and R2 containing
corresponding paired-end sequences.
2.5.2 Genome assembly
Genome assembly, core genome extraction, phylogenetic analysis, and
variant calling were performed by Matthew Moore (University of Liverpool). Quality
filtered and adapter trimmed short reads were de novo assembled and scaffolded
using SPAdes-3.5.0 (Bankevich et al. 2012). Genome assembly quality metrics such as
N50, largest contig, and overall number of contigs were produced using QUAST
(Gurevich et al. 2013). Pairwise comparisons between assembled genomes were
performed using progressiveMauve (Darling et al. 2004).
2.5.3 Core genome extraction
The core genome was extracted using Panseq (Laing et al. 2010) and was
defined as 500 bp fragments of all genomes in this study which matched with at least
85% similarity.
53
2.5.4 Phylogeny
A phylogenetic tree was approximated from core genome polymorphic sites,
not including gaps or ambiguous bases by maximum likelihood with inner node
bootstrap (n = 100) and 10 discrete gamma categories. All phylogenetic analyses
were performed using MEGA6 (Tamura et al. 2013) and visualised using the iTOL
software (Letunic & Bork 2007; Letunic & Bork 2011). Long branches were reduced
for clarity.
2.5.5 Variant calling
Short reads were mapped to a reference genome PAO1 (Stover et al. 2000)
using bwa-0.7.5 (Li & Durbin 2009) (-mem). Resulting sequence alignment map (.sam)
files were ordered, converted to binary alignment map (.bam) format, and duplicates
marked. The .bam files were de-duplicated using picardtools-1.8.5
(http://sourceforge.net/p/picard/wiki/Main_Page/) and variants called using GATK-
3.3 (McKenna et al. 2010) HaplotypeCaller module. All variants were filtered using
vcffilter (https://github.com/ekg/vcflib) and annotated using snpEff
(http://snpeff.sourceforge.net/SnpEff_manual.html).
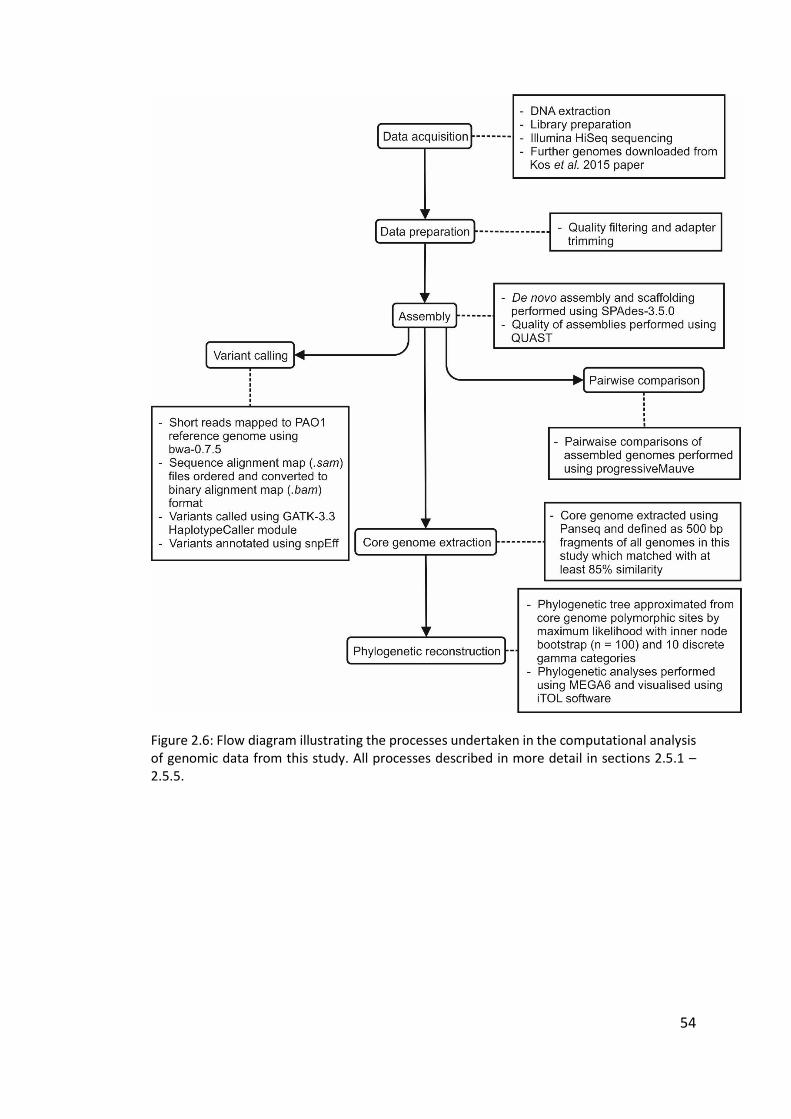
54
Figure 2.6: Flow diagram illustrating the processes undertaken in the computational analysis of genomic data from this study. All processes described in more detail in sections 2.5.1 – 2.5.5.
55
2.6 eBURST algorithm
The eBURST algorithm (http://eburst.mlst.net) was originally devised and
developed by Ed Feil from the University of Bath (Feil et al. 2004). An enhanced
version was later developed and integrated into the MLST websites (Spratt et al.
2004) and the latest version (eBURSTv3) has been developed with funding from the
Wellcome Trust, and is hosted by Imperial College London. The algorithm displays
the relationships between closely-related isolates within a bacterial population using
a simple model of bacterial evolution based on a founding or ancestral genotype that
diversifies to produce a cluster of related genotypes. The algorithm predicts descent
of genotypes from the ancestor and displays the output as a radial diagram. The
eBURST algorithm has mainly been applied to MLST data though in this case it has
been used to display the relationships between genotypes identified through AT
genotyping. For use with the AT genotypes, the profiles were converted to a tab
delineated text file and uploaded to the eBURST site. For analysis, the programme
was set to estimate the relatedness based on 16 loci, with a minimum of one identical
loci for group definition, a single locus variant (SLV) count of 0 for subgroup
definition, and number of re-samplings for bootstrap support set to 1000.
The data is divided into groups of sequence types (STs) that have a level of
similarity in their SNP profiles. Within a single group all STs must be an SLV of at least
one other ST in the group. The primary founder of any group is defined as the ST that
differs from the largest number of other STs at only a single locus. In the case of two
STs having the same number of SLVs, the one with the greater number of double
locus variants (DLVs) is selected as the founding member. More than one group can
be displayed, appearing as a cluster, in a single eBURST diagram along with any
unlinked STs. The eBURST diagram shows the patterns of descent within a group in a
radial fashion with lines connecting the founder to each of its SLVs, and lines
connecting these STs to other STs varying from them at only one locus. The size of
the node representing an ST indicates the relative abundance of that ST within the
population.
56
Chapter Three
Longitudinal study of chronic Pseudomonas aeruginosa infections in
non-cystic fibrosis bronchiectasis patients
3.1 Introduction
3.1.1 Maintenance of Pseudomonas aeruginosa strains in cystic fibrosis patients
Pulmonary infections are the biggest cause of morbidity and mortality in
cystic fibrosis (CF) patients. Throughout childhood patients may be infected with a
wide range of microbial pathogens, although colonisation by the most prevalent
pathogens tends to be age-related (figure 3.1): Staphylococcus aureus is acquired
during infancy, Haemophilus influenzae in the early years of development, and P.
aeruginosa in adolescence (Govan & Deretic 1996). Unless detected early and rapidly
treated with an aggressive course of antibiotics, P. aeruginosa infections persist
within CF patient lungs often for the rest of their life. Longitudinal studies of both
adult and paediatric CF patients have been previously carried out by many authors
(Şener et al. 2001; Leone et al. 2008; Burns et al. 2001; Jelsbak et al. 2007;
Mahenthiralingam et al. 1996) and have provided insights into transmission and
maintenance of P. aeruginosa strains between and within patients.
A study carried out by Jelsbak et al. (2007) using array tube (AT) genotyping
in a Danish CF clinic investigated diversity of 45 P. aeruginosa isolates taken from 7
patients diagnosed as chronically infected (defined as being infected for a period of
>12 years) over a period of 1 year. Amongst these 45 isolates only 5 different
genotypes were identified, with considerable clonal overlap between patients. The
group also carried out a long-term longitudinal study on 6 of the 7 patients which
57
revealed chronic infection as a dynamic process in which genotypes carried by
patients are periodically replaced by different clones. Two genotypes were found to
be particularly dominant, with one genotype found to have infected all six patients
at some point during the period of the study. The results of this study demonstrated
clearly that the two dominant clones among these patients were capable of inter-
patient transmission, and so it is likely that the clones have a strong selective
advantage in colonising the CF airway.
Leone et al. (2008) used pulsed-field gel electrophoresis (PFGE) and O
serotyping to analyse the genotypic characteristics of isolates from 55 adult CF
patients over a 5 year period. The discriminatory powers of PFGE and O serotyping
were determined to be too low to define the relationships between phenotypic and
genotypic characteristics of the isolates or to elucidate any possible transmission
events between patients in the centre; however the results of the study did suggest
long-term persistence of strains of P. aeruginosa in some patients. Hypermutable
strains, defined by an increase in frequency of spontaneous mutations (Oliver 2000),
were also revealed to be present in some instances, with variations in PFGE profiles
and antibiotic susceptibility.
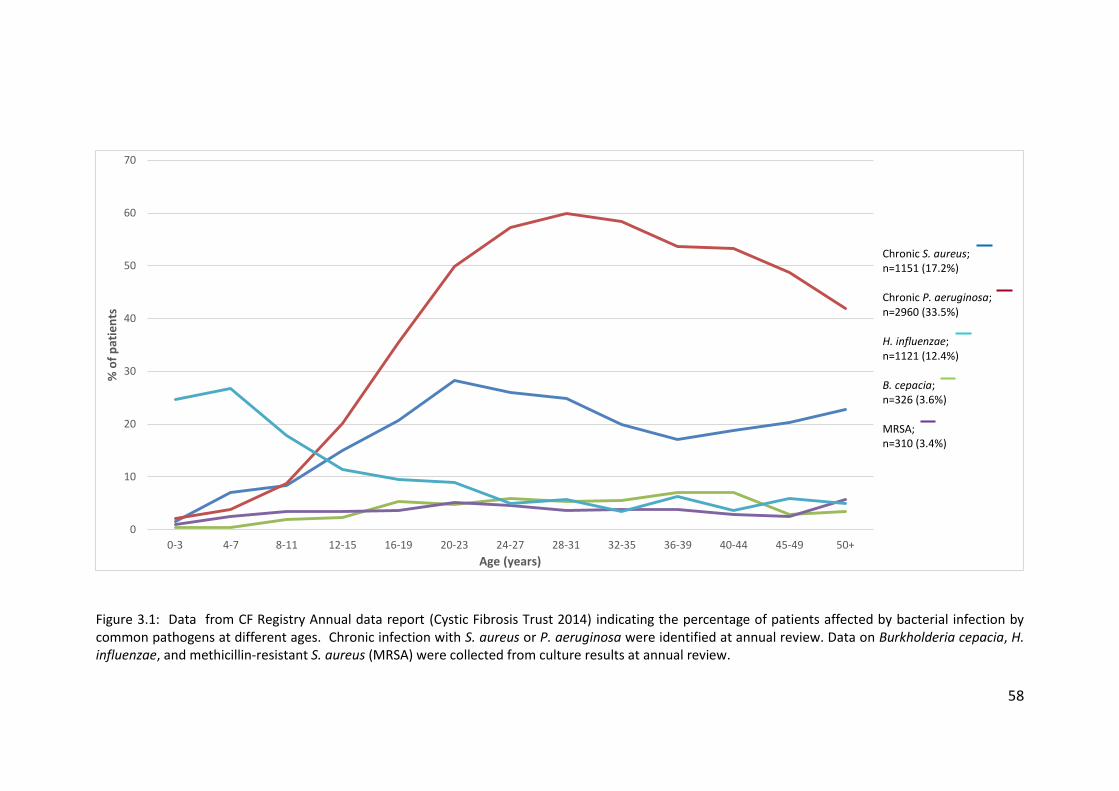
58
Figure 3.1: Data from CF Registry Annual data report (Cystic Fibrosis Trust 2014) indicating the percentage of patients affected by bacterial infection by common pathogens at different ages. Chronic infection with S. aureus or P. aeruginosa were identified at annual review. Data on Burkholderia cepacia, H. influenzae, and methicillin-resistant S. aureus (MRSA) were collected from culture results at annual review.
0
10
20
30
40
50
60
70
0-3 4-7 8-11 12-15 16-19 20-23 24-27 28-31 32-35 36-39 40-44 45-49 50+
% o
f p
atie
nts
Age (years)
Chronic S. aureus; n=1151 (17.2%) Chronic P. aeruginosa; n=2960 (33.5%) H. influenzae; n=1121 (12.4%) B. cepacia; n=326 (3.6%) MRSA; n=310 (3.4%)
59
Analysis of P. aeruginosa isolates from 20 CF patients over a period of 10 years
by Şener et al. (2001) used random amplified polymorphic DNA fingerprinting-PCR
(RAPD-PCR) in combination with phenotypic tests to further understand the
dynamics of P. aeruginosa populations in CF lung infections. The study revealed that
many patients were colonised with strains of varying phenotypes but sharing a
consistent genotype, although other patients were colonised with strains of varying
genotypes. From the 20 patients, 24 unique RAPD types were identified from RAPD-
PCR. Seven patients shared the same genotype, which Şener et al. (2001) speculated
may have originated in one of the patients, with the earliest strain being isolated in
May 1992, and spread to the others through close contact in CF clinic sessions. Of
these seven, six patients consistently harboured this same genotype during repeated
sampling over a 12 month period and one patient was also found to harbour a second
genotype in one sample. Of the 20 patients, 13 harboured a single persistent
colonising genotype; defined as the same genotype isolated from all specimens (at
least 5) from a patient collected over the study period. Nine patients also showed
transient colonisation with genotypes other than the persistent coloniser genotype.
Genotyping of sequential isolates from these patients revealed that each of the
patients was colonised with strains of a predominant RAPD type which remained
stable over a period of up to 6 years.
3.1.2 Transmissible strains of Pseudomonas aeruginosa in CF patients
Generally, it has been accepted that CF patients with chronic lung infections
acquire a strain of P. aeruginosa from the environment that, over time, becomes
adapted to living in the niche environments within the CF lung and that these strains
are usually unique to the patient in question (Fothergill et al. 2012). Phenotypic
typing systems have previously suggested that CF siblings in close contact with one
another often harbour the same P. aeruginosa strain, and it has been repeatedly
confirmed that a single strain cross-infects in these cases (Speert & Campbell 1987;
Grothues et al. 1988; Renders et al. 1997), as opposed to independent acquisition of
a clonal strain. Independent acquisition of strains can occur when certain strains are
naturally more abundant within the environment, hence increasing the likelihood
60
that multiple patients will acquire the same strain. Clone C, for example, is
distributed worldwide and clone C strains are highly prone to infecting CF patients in
several countries including the UK, Canada, and Germany (Römling et al. 2005)
although the mechanisms of acquisition of the strain are unclear, and may vary
completely from patient to patient.
Since the 1980s studies have suggested that unique environmental
acquisition may not exclusively be the method by which chronic P. aeruginosa
infections are acquired by CF patients. A strain of P. aeruginosa caused an epidemic
among patients attending a Danish CF centre early in 1983 and was described by
Pedersen et al. (1986). Later, Cheng et al. (1996) reported that a high proportion of
children in a single CF centre in Liverpool were colonised with a β-lactam resistant
epidemic strain of P. aeruginosa. It was determined by use of PFGE and flagellin
genotyping that 55 patients were infected with the same strain of P. aeruginosa, now
known as the Liverpool Epidemic Strain (LES). Several years later a study conducted
in an adult CF centre in Liverpool indicated that 63 out of 80 P. aeruginosa-positive
patients were infected with the LES (Panagea et al. 2003).
A nationwide study into the prevalence of transmissible strains of P.
aeruginosa was undertaken by (Scott & Pitt 2004). Strains with unique genotypes
were found to be harboured by at least 72% of all patients, although small clusters
of related strains were found to be present in some centres, indicating limited
transmission of local strains. The most prevalent strain was one indistinguishable
from the previously described LES which accounted for approximately 11% of patient
isolates from CF centres in England and Wales (Scott & Pitt 2004). The Midlands 1
strain was found to be harboured by 86 patients in 9 centres, and the Manchester
Epidemic Strain (MES) was found in 3 centres. Inter-patient transmission and
superinfection by strains of P. aeruginosa are now accepted as common methods of
infection among CF patients, yet lack of funding has impeded research into similar
transmission events in non-CF bronchiectasis (NCFBr) patients.
61
3.1.2 Maintenance and transmission of Pseudomonas aeruginosa strains in non-
cystic fibrosis bronchiectasis patients
Lack of research into the maintenance and transmission of P. aeruginosa
strains among NCFBr patients has meant that many key issues regarding patient care
that are addressed in CF guidelines, in particular the issue of segregation, have been
ignored in the British Thoracic Society (BTS) guidelines for NCFBr patients (Pasteur et
al. 2010). Work by De Soyza et al. (2014) was undertaken to investigate cross-
infection with P. aeruginosa among adult NCFBr patients attending a single centre. A
total of 56 isolates were selected for analysis; 50 from 40 NCFBr patients, collected
between 2008 and 2011, and 6 isolates from CF patients to be used a laboratory
controls. This was undertaken at an adult bronchiectasis service in the north-east of
England that is separate from the regional CF centre (situated 2 miles away). The
service was started in 2007 as a weekly specialist clinic, with no Pseudomonas-
specific clinic. 36 patients who regularly attended the bronchiectasis service were
randomly selected and paired longitudinal isolates were included from 10 patients
with a mean of 16 months between isolates (2 – 35 months). Single isolates were also
chosen from 4 NCFBr patients who did not attend the clinic and who had not been
hospitalised to act as potential patient controls. Two genotyping methods were used
in this study: AT genotyping (described in chapter 2) and variable number tandem
repeat (VNTR) analysis based on the number of DNA repeats at specified sites across
the genome at nine variable loci and comparison to a VNTR database.
De Soyza et al. (2014) found that the vast majority of the 36 NCFBr patients
harboured their own strains of P. aeruginosa. Four patients, 2 patients attending the
clinic and 2 from the non-hospitalised control group, had distinct variants of clone C,
which is found environmentally worldwide (Römling et al. 2005). Three pairs of
patients from the remaining 34 attending the adult NCFBr service were found to
harbour P. aeruginosa isolates which shared very similar profiles. For one pair of
patients the similarity was confirmed by PFGE of SpeI-digested genomic DNA; the
profile was unusual and the fact that the two patients shared a strain most likely
reflects inter-patient transmission. Mapping of the NCFBr isolates among a wider
population structure of P. aeruginosa isolates, based on AT genotype, demonstrated
62
that the NCFBr isolates were widely distributed and AT analysis found several
matches with known clone types in the AT database. Data from the longitudinally
paired isolates were compared and showed that in 9 of the 10 patients the first and
second isolates were indistinguishable by both AT and VNTR, which confirms
persistence of the initial strain. Longitudinal isolates from the final patient were
identified as identical by VNTR typing but not by AT type.
The key findings of this study were a lack of dominant clones of P. aeruginosa
among the NCFBr population, with many patients harbouring “unique” strains, and
little evidence of cross-infection among patients. Isolates from the NCFBr population
were widely distributed, with little to no distinct clustering. Clone C was found in 6%
of the NCFBr patients but is found widely in the environment; differences at several
loci in the VNTR profiles of these isolates suggests that the isolates were
independently acquired, as opposed to inter-patient transmission. Standard
infection control and prevention measures are less stringent in NCFBr clinics than in
CF clinics (De Soyza et al. 2014) and so the apparent absence of cross-infection by P.
aeruginosa is unlikely to be due to the standards of infection control practice in
NCFBr clinics.
63
3.2 Aims
The aims of this chapter are to:
1. Use AT genotyping to investigate the maintenance of P. aeruginosa
strains in chronic lung infections in NCFBr patients over periods of
up to 84 months;
2. Compare four digit AT codes to those in databases from previous
studies to place NCFBr P. aeruginosa isolates in the context of the
wider P. aeruginosa population.
3.3 Results
3.3.1 Panel of isolates
A collection of 48 isolates from 20 patients (table 3.1) regularly attending an
adult bronchiectasis centre, separate from the regional CF centre, in the north east
of England were selected based on the number of sequential isolates available for
each patient, and the period of time between the collection of the early and late
isolates. The minimum time period between collection of the early and late isolates
was 12 months, although the period between collection of early and intermediate
isolates was less than 12 months in some cases. The mean period between early and
late isolate was 40 months (range 17 – 84). A total of 40 isolates were subjected to
AT genotyping as part of this study, and the remaining 8 isolates (marked with an
asterisk in table 3.1) included were previously analysed by (De Soyza et al. 2014).
3.3.2 Array Tube hexadecimal codes
The captured AT images were read and converted as described in chapter 2
(appendix, table A3) and it was found that in 15 out of 20 patients, all isolates from
each patient had the same hexadecimal code (figure 3.2). Patient 11 had a total of 4
isolates with 3 different AT codes; the early and first intermediate isolates shared the
same code but the second intermediate and late isolates both had vastly different AT
codes. Patients 14 and 22 had no intermediate isolates and the early and late isolates
had very different AT codes in both patients. Patient 30 had an early isolate, two
64
intermediate isolates and a late isolate; the early and late isolates shared an AT code
and both the intermediate isolates shared a different AT code. The two codes varied
only in the presence or absence of the fliCa genomic island. Patient 32 had only early
and late isolates and the AT codes for the two isolates were very different.
3.3.3 Array Tube accessory genome markers
As well as the 17 core genome single nucleotide polymorphisms (SNPs) that
determine the genotype of isolates, the AT has markers for 41 genomic islands and
variable genes, including the PS21 marker for LES, which represent the accessory
genome. The hybridisation at markers for genomic islands and variable genes shows
presence or absence of the element in a particular isolate and the results were
determined as described in chapter 2 (appendix, table A4). However, isolates sharing
a core genotype may have variation in their accessory genomes. Figures 3.3a and
3.3b show AT images for isolates B21 and B22, both taken from patient 11. Both
isolates share genotype C40A (clone C) but also share the same hybridisation pattern
across the variable genes and genomic islands present on the AT chip. Conversely,
figures 3.4a and 3.4b show AT images for isolates B79 and B113, both taken from
patient 18, which also share a genotype (B420) but have variations in hybridisation
at some of the genomic islands and variable genes present on the AT chip. Faint
hybridisation is present at the markers for three genomic islands (C47, fla-island-1,
and 47D7-1) and one variable gene (PA2185) in isolate B79 but no hybridisation is
seen for these loci in isolate B113.
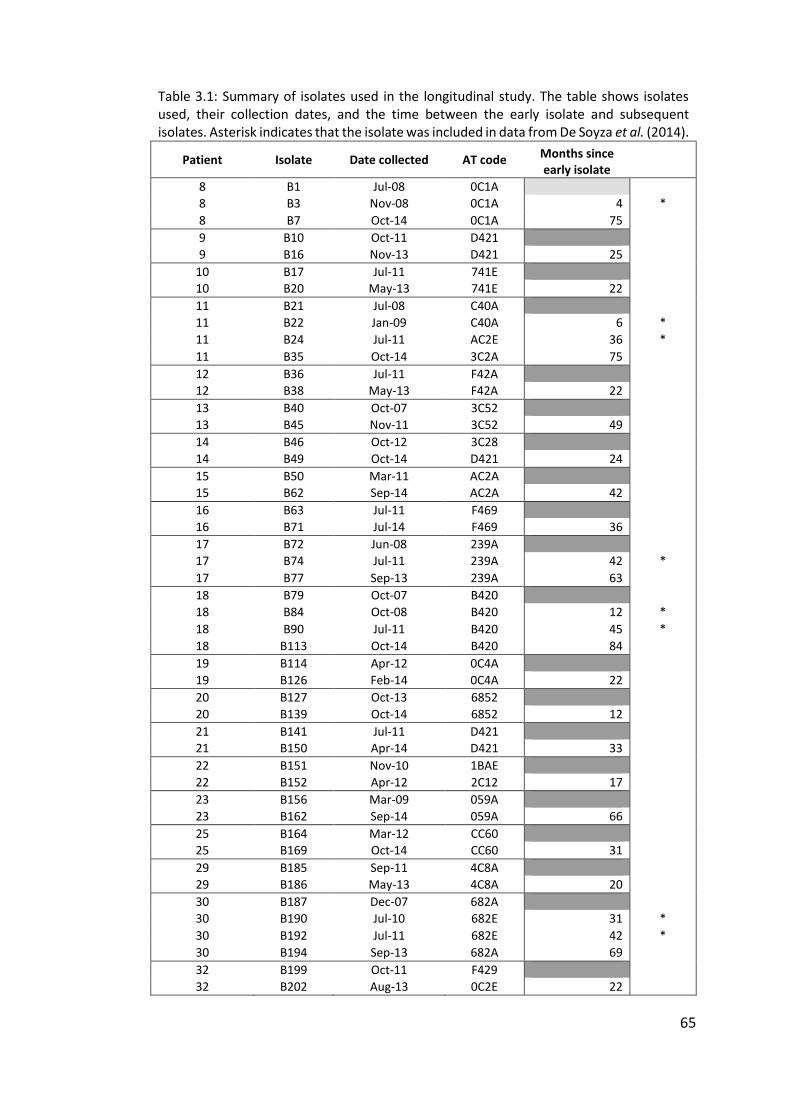
65
Table 3.1: Summary of isolates used in the longitudinal study. The table shows isolates used, their collection dates, and the time between the early isolate and subsequent isolates. Asterisk indicates that the isolate was included in data from De Soyza et al. (2014).
Patient Isolate Date collected AT code Months since early isolate
8 B1 Jul-08 0C1A
8 B3 Nov-08 0C1A 4 *
8 B7 Oct-14 0C1A 75
9 B10 Oct-11 D421
9 B16 Nov-13 D421 25
10 B17 Jul-11 741E
10 B20 May-13 741E 22
11 B21 Jul-08 C40A
11 B22 Jan-09 C40A 6 *
11 B24 Jul-11 AC2E 36 *
11 B35 Oct-14 3C2A 75
12 B36 Jul-11 F42A
12 B38 May-13 F42A 22
13 B40 Oct-07 3C52
13 B45 Nov-11 3C52 49
14 B46 Oct-12 3C28
14 B49 Oct-14 D421 24
15 B50 Mar-11 AC2A
15 B62 Sep-14 AC2A 42
16 B63 Jul-11 F469
16 B71 Jul-14 F469 36
17 B72 Jun-08 239A
17 B74 Jul-11 239A 42 *
17 B77 Sep-13 239A 63
18 B79 Oct-07 B420
18 B84 Oct-08 B420 12 *
18 B90 Jul-11 B420 45 *
18 B113 Oct-14 B420 84
19 B114 Apr-12 0C4A
19 B126 Feb-14 0C4A 22
20 B127 Oct-13 6852
20 B139 Oct-14 6852 12
21 B141 Jul-11 D421
21 B150 Apr-14 D421 33
22 B151 Nov-10 1BAE
22 B152 Apr-12 2C12 17
23 B156 Mar-09 059A
23 B162 Sep-14 059A 66
25 B164 Mar-12 CC60
25 B169 Oct-14 CC60 31
29 B185 Sep-11 4C8A
29 B186 May-13 4C8A 20
30 B187 Dec-07 682A
30 B190 Jul-10 682E 31 *
30 B192 Jul-11 682E 42 *
30 B194 Sep-13 682A 69
32 B199 Oct-11 F429
32 B202 Aug-13 0C2E 22
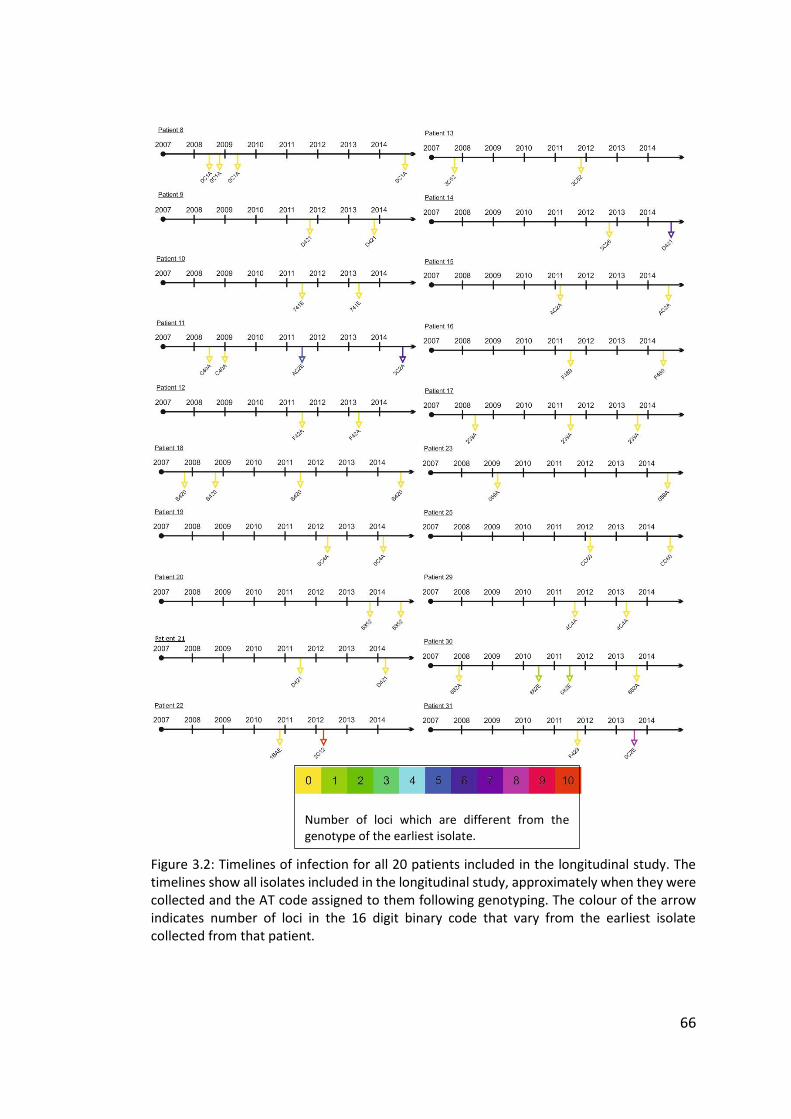
66
Figure 3.2: Timelines of infection for all 20 patients included in the longitudinal study. The timelines show all isolates included in the longitudinal study, approximately when they were collected and the AT code assigned to them following genotyping. The colour of the arrow indicates number of loci in the 16 digit binary code that vary from the earliest isolate collected from that patient.
Number of loci which are different from the genotype of the earliest isolate.
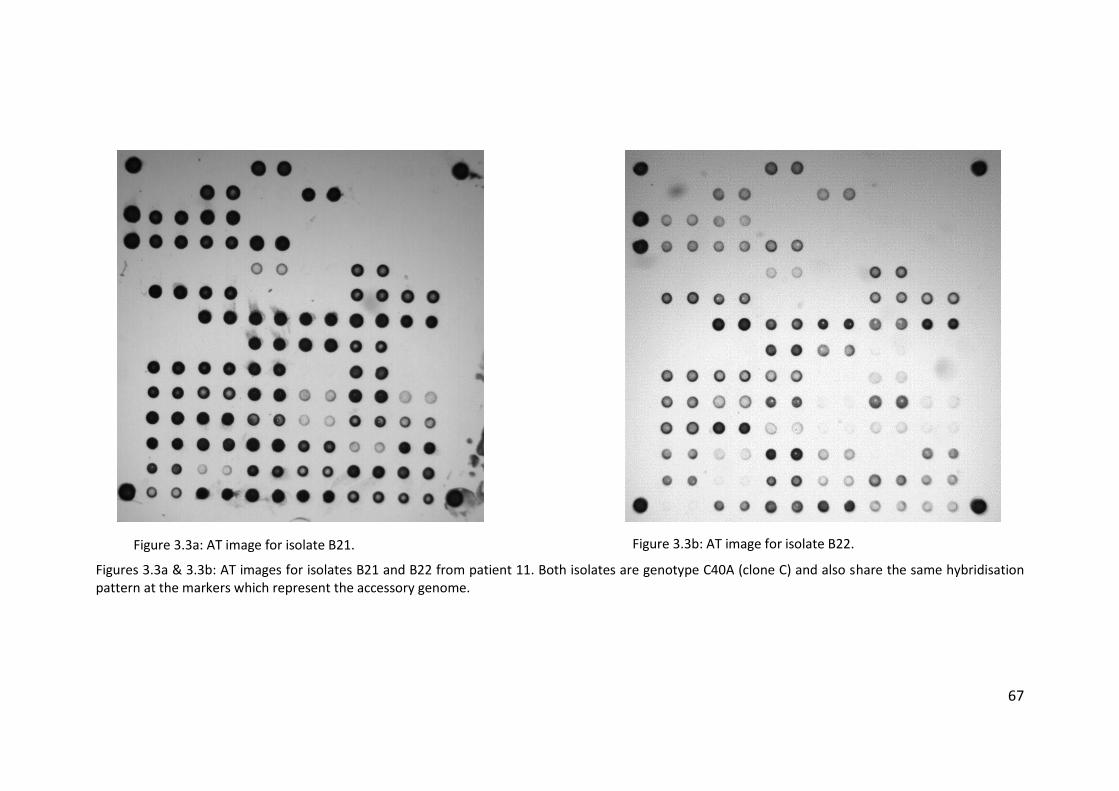
67
Figures 3.3a & 3.3b: AT images for isolates B21 and B22 from patient 11. Both isolates are genotype C40A (clone C) and also share the same hybridisation pattern at the markers which represent the accessory genome.
Figure 3.3a: AT image for isolate B21. Figure 3.3b: AT image for isolate B22.
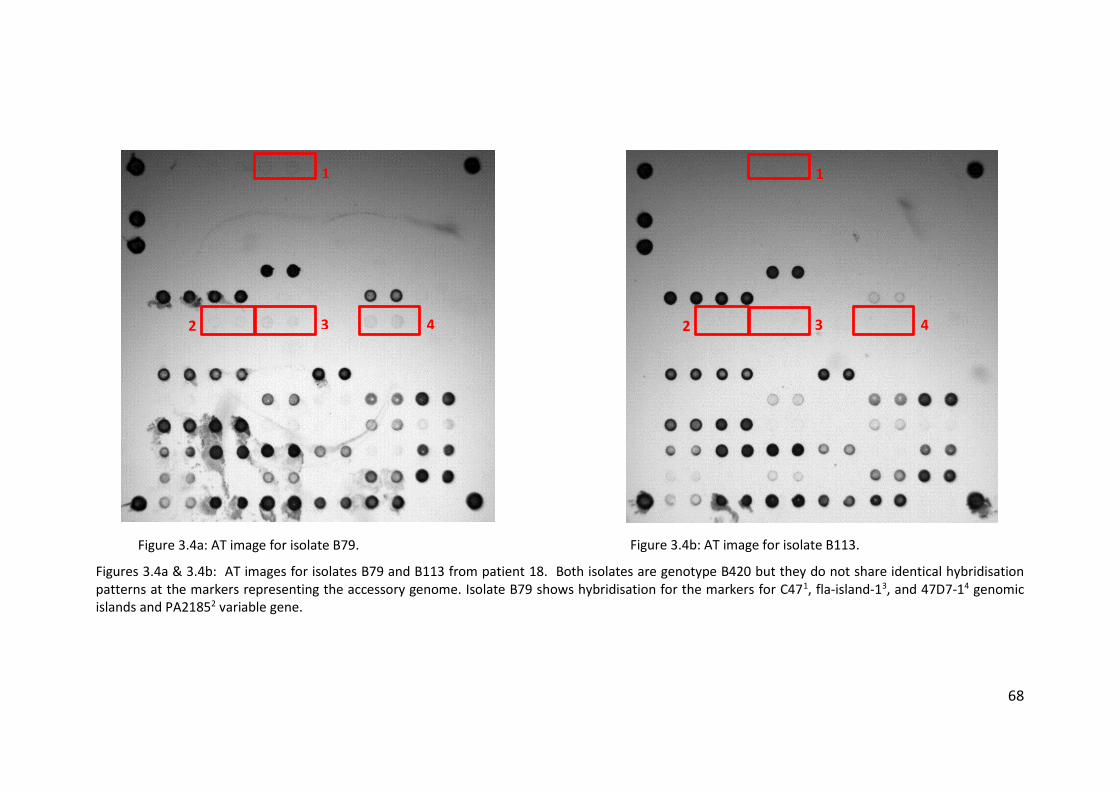
68
Figures 3.4a & 3.4b: AT images for isolates B79 and B113 from patient 18. Both isolates are genotype B420 but they do not share identical hybridisation patterns at the markers representing the accessory genome. Isolate B79 shows hybridisation for the markers for C471, fla-island-13, and 47D7-14 genomic islands and PA21852 variable gene.
1
3 2 4
Figure 3.4a: AT image for isolate B79. Figure 3.4b: AT image for isolate B113.
1
3 2 4
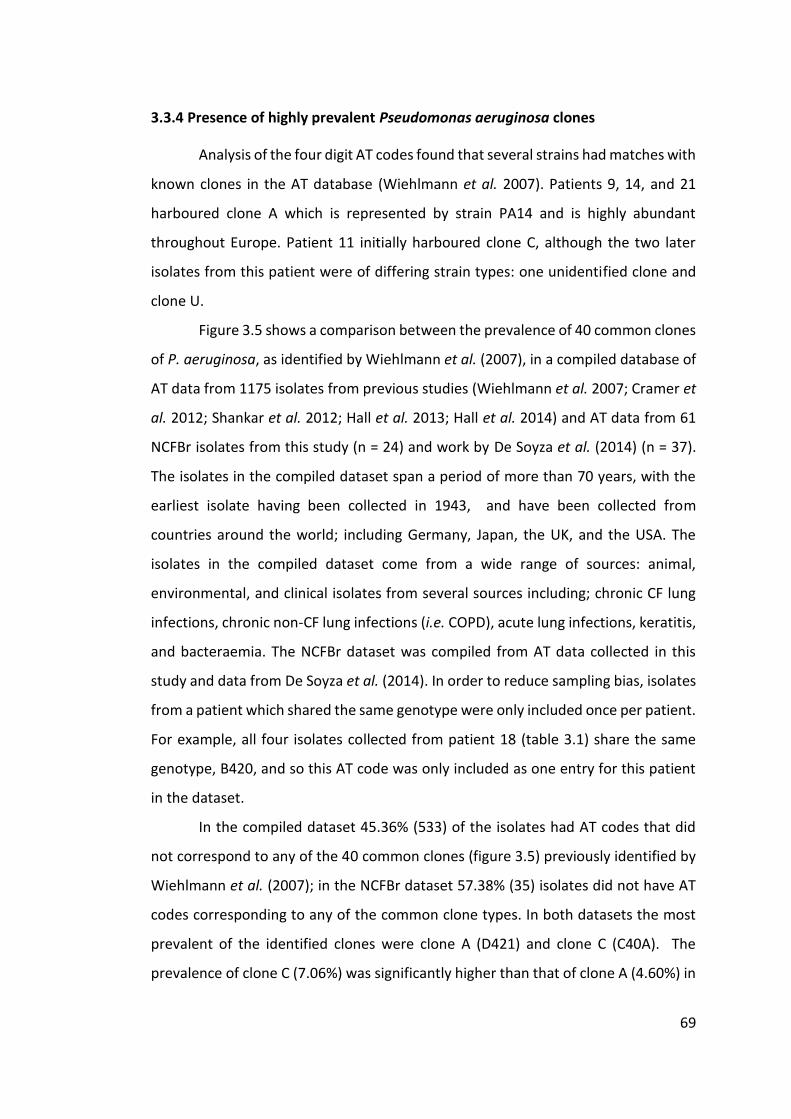
69
3.3.4 Presence of highly prevalent Pseudomonas aeruginosa clones
Analysis of the four digit AT codes found that several strains had matches with
known clones in the AT database (Wiehlmann et al. 2007). Patients 9, 14, and 21
harboured clone A which is represented by strain PA14 and is highly abundant
throughout Europe. Patient 11 initially harboured clone C, although the two later
isolates from this patient were of differing strain types: one unidentified clone and
clone U.
Figure 3.5 shows a comparison between the prevalence of 40 common clones
of P. aeruginosa, as identified by Wiehlmann et al. (2007), in a compiled database of
AT data from 1175 isolates from previous studies (Wiehlmann et al. 2007; Cramer et
al. 2012; Shankar et al. 2012; Hall et al. 2013; Hall et al. 2014) and AT data from 61
NCFBr isolates from this study (n = 24) and work by De Soyza et al. (2014) (n = 37).
The isolates in the compiled dataset span a period of more than 70 years, with the
earliest isolate having been collected in 1943, and have been collected from
countries around the world; including Germany, Japan, the UK, and the USA. The
isolates in the compiled dataset come from a wide range of sources: animal,
environmental, and clinical isolates from several sources including; chronic CF lung
infections, chronic non-CF lung infections (i.e. COPD), acute lung infections, keratitis,
and bacteraemia. The NCFBr dataset was compiled from AT data collected in this
study and data from De Soyza et al. (2014). In order to reduce sampling bias, isolates
from a patient which shared the same genotype were only included once per patient.
For example, all four isolates collected from patient 18 (table 3.1) share the same
genotype, B420, and so this AT code was only included as one entry for this patient
in the dataset.
In the compiled dataset 45.36% (533) of the isolates had AT codes that did
not correspond to any of the 40 common clones (figure 3.5) previously identified by
Wiehlmann et al. (2007); in the NCFBr dataset 57.38% (35) isolates did not have AT
codes corresponding to any of the common clone types. In both datasets the most
prevalent of the identified clones were clone A (D421) and clone C (C40A). The
prevalence of clone C (7.06%) was significantly higher than that of clone A (4.60%) in
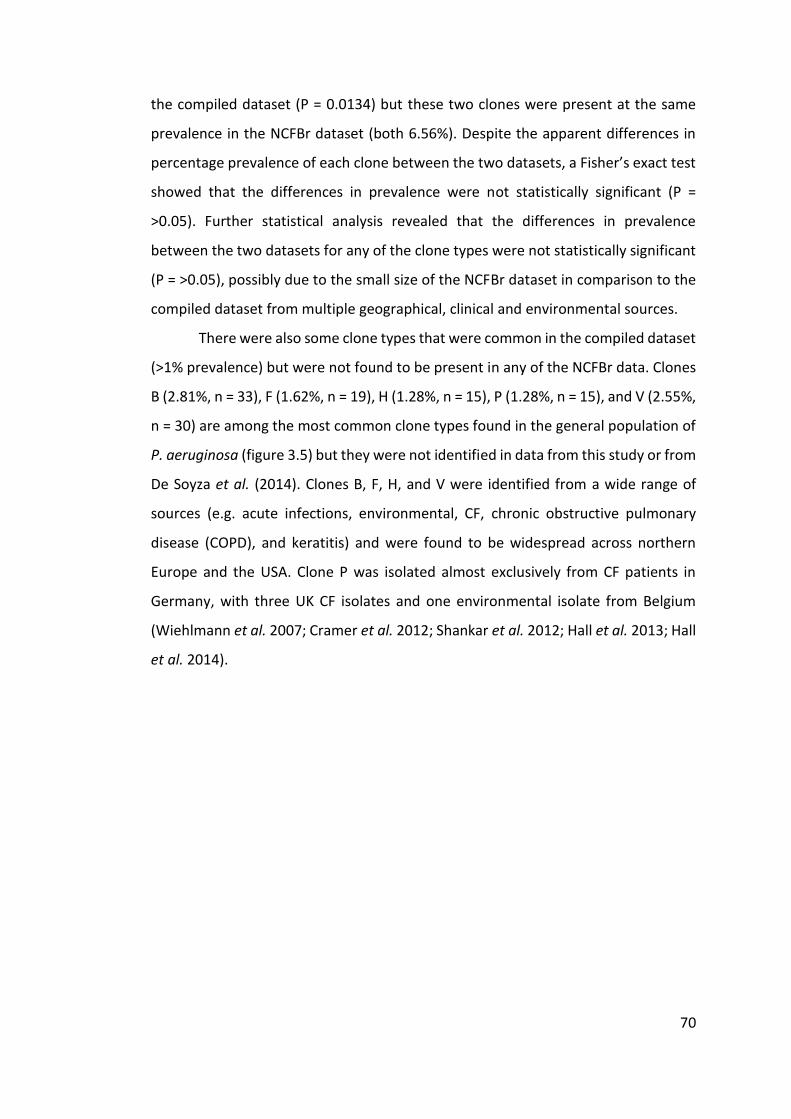
70
the compiled dataset (P = 0.0134) but these two clones were present at the same
prevalence in the NCFBr dataset (both 6.56%). Despite the apparent differences in
percentage prevalence of each clone between the two datasets, a Fisher’s exact test
showed that the differences in prevalence were not statistically significant (P =
>0.05). Further statistical analysis revealed that the differences in prevalence
between the two datasets for any of the clone types were not statistically significant
(P = >0.05), possibly due to the small size of the NCFBr dataset in comparison to the
compiled dataset from multiple geographical, clinical and environmental sources.
There were also some clone types that were common in the compiled dataset
(>1% prevalence) but were not found to be present in any of the NCFBr data. Clones
B (2.81%, n = 33), F (1.62%, n = 19), H (1.28%, n = 15), P (1.28%, n = 15), and V (2.55%,
n = 30) are among the most common clone types found in the general population of
P. aeruginosa (figure 3.5) but they were not identified in data from this study or from
De Soyza et al. (2014). Clones B, F, H, and V were identified from a wide range of
sources (e.g. acute infections, environmental, CF, chronic obstructive pulmonary
disease (COPD), and keratitis) and were found to be widespread across northern
Europe and the USA. Clone P was isolated almost exclusively from CF patients in
Germany, with three UK CF isolates and one environmental isolate from Belgium
(Wiehlmann et al. 2007; Cramer et al. 2012; Shankar et al. 2012; Hall et al. 2013; Hall
et al. 2014).
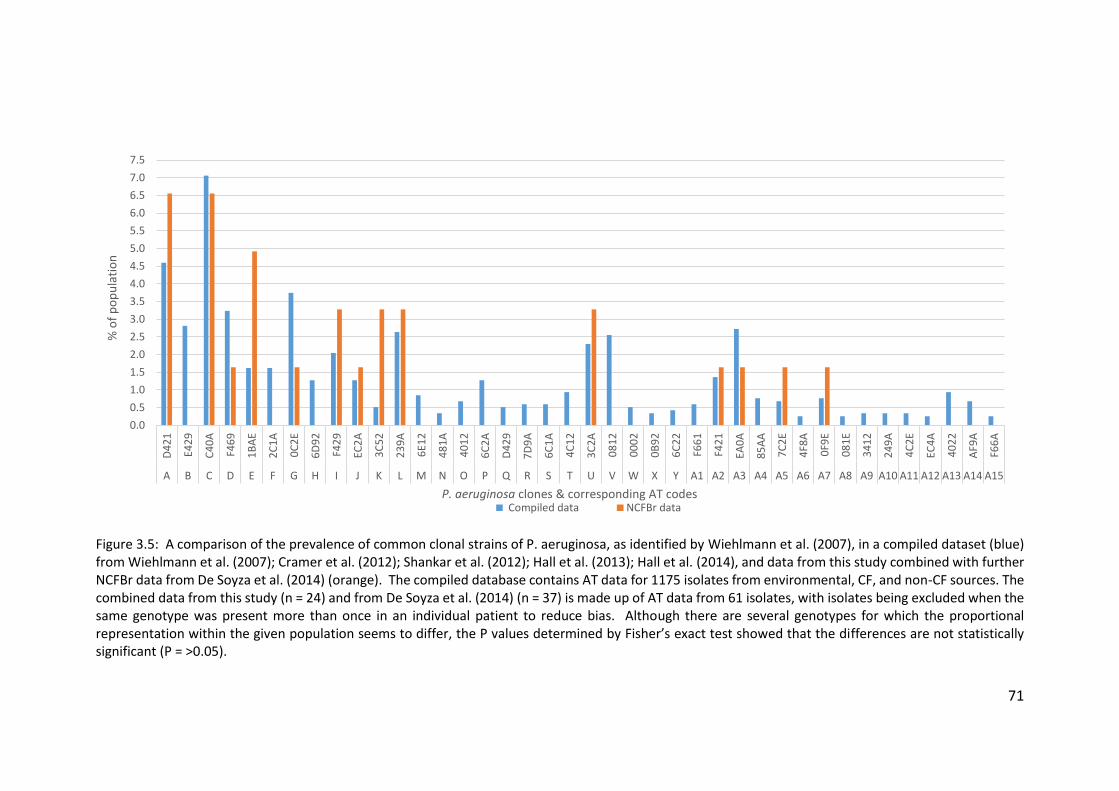
71
Figure 3.5: A comparison of the prevalence of common clonal strains of P. aeruginosa, as identified by Wiehlmann et al. (2007), in a compiled dataset (blue) from Wiehlmann et al. (2007); Cramer et al. (2012); Shankar et al. (2012); Hall et al. (2013); Hall et al. (2014), and data from this study combined with further NCFBr data from De Soyza et al. (2014) (orange). The compiled database contains AT data for 1175 isolates from environmental, CF, and non-CF sources. The combined data from this study (n = 24) and from De Soyza et al. (2014) (n = 37) is made up of AT data from 61 isolates, with isolates being excluded when the same genotype was present more than once in an individual patient to reduce bias. Although there are several genotypes for which the proportional representation within the given population seems to differ, the P values determined by Fisher’s exact test showed that the differences are not statistically significant (P = >0.05).
0.0
0.5
1.0
1.5
2.0
2.5
3.0
3.5
4.0
4.5
5.0
5.5
6.0
6.5
7.0
7.5D
42
1
E42
9
C4
0A
F46
9
1B
AE
2C
1A
0C
2E
6D
92
F42
9
EC2
A
3C
52
23
9A
6E1
2
48
1A
40
12
6C
2A
D4
29
7D
9A
6C
1A
4C
12
3C
2A
08
12
00
02
0B
92
6C
22
F66
1
F42
1
EA0
A
85
AA
7C
2E
4F8
A
0F9
E
08
1E
34
12
24
9A
4C
2E
EC4
A
40
22
AF9
A
F66
A
A B C D E F G H I J K L M N O P Q R S T U V W X Y A1 A2 A3 A4 A5 A6 A7 A8 A9 A10 A11 A12 A13 A14 A15
% o
f p
op
ula
tio
n
P. aeruginosa clones & corresponding AT codes Compiled data NCFBr data
72
3.3.5 Population structure of non-cystic fibrosis bronchiectasis Pseudomonas
aeruginosa isolates
The population of NCFBr isolates, from this study and De Soyza et al. (2014),
was analysed along with the wider population of P. aeruginosa isolates from the
compiled dataset (Wiehlmann et al. 2007; Cramer et al. 2012; Shankar et al. 2012;
Hall et al. 2013; Hall et al. 2014) using the eBURST algorithm (http://eburst.mlst.net)
to determine the distribution of isolates from NCFBr patients amongst the wider P.
aeruginosa population. The eBURST algorithm identifies mutually exclusive groups of
related genotypes within a population. Details of how the algorithm was used to map
the genotypes of these isolates can be found in chapter 2. Figure 3.6a shows the
distribution of AT genotypes of NCFBr isolates from this longitudinal study alone
among the wider population of isolates taken from environmental and other clinical
sources. Figure 3.6b shows the distribution of AT genotypes combining NCFBr isolate
data obtained in this study and from the earlier De Soyza et al. (2014) to provide a
fuller representation of the population structure of P. aeruginosa isolates from NCFBr
patients. Each node represents a defined strain type (ST) and lines between nodes
represent a single locus difference between two nodes. The size of each node
indicates the relative abundance of that particular genotype within the population.
The eBURST diagram consists of one large main cluster of nodes, with the remaining
smaller clusters (consisting 2 – 5 nodes) and single nodes distributed radially. All but
8 of the 40 common clones described by Wiehlmann et al. (2007) are found in the
main cluster of isolates (figure 3.7). As well as being well distributed among the main
cluster of nodes, several genotypes from NCFBr isolates are located individually or as
part of smaller clusters away from the main group (figures 3.6a & 3.6b). Hence, NCFBr
isolates are widely distributed amongst the general population of P. aeruginosa.
73
Figure 3.6a: eBURST diagram showing the distribution of P. aeruginosa genotypes identified in this study among the general population. eBURSTv3 (http://eburst.mlst.net), developed and hosted by Imperial College London (Feil et al. 2004; Spratt et al. 2004), was used.
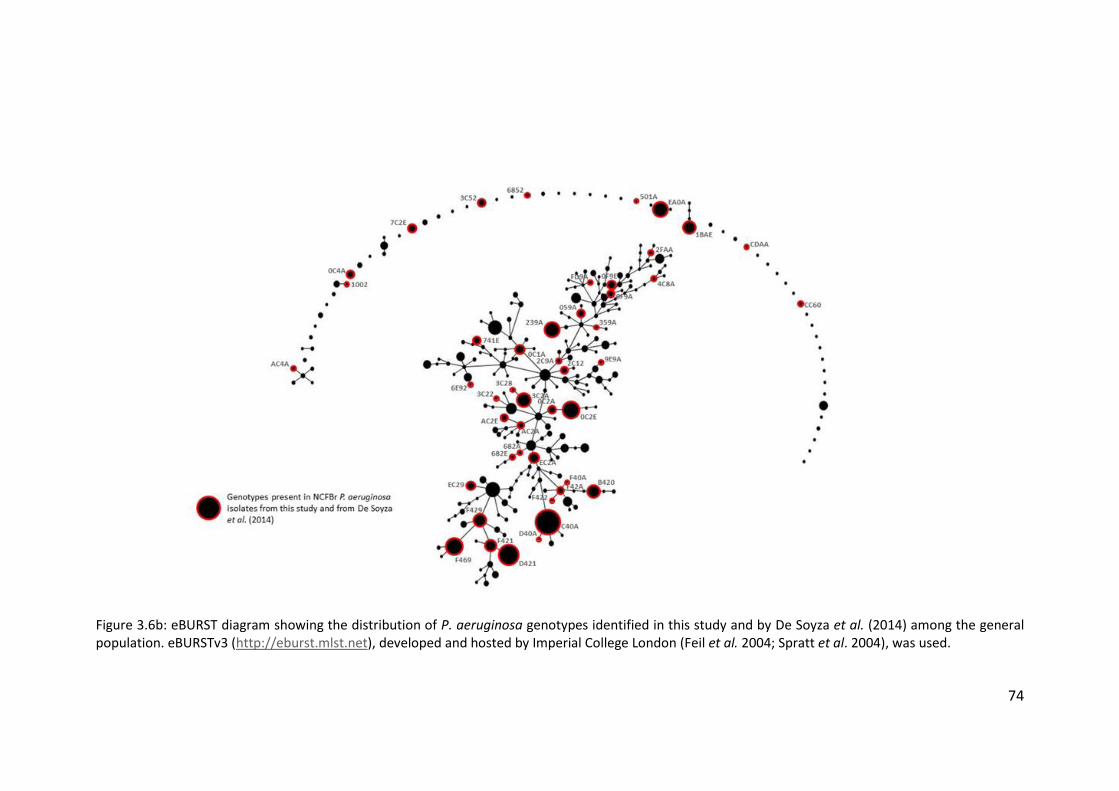
74
Figure 3.6b: eBURST diagram showing the distribution of P. aeruginosa genotypes identified in this study and by De Soyza et al. (2014) among the general population. eBURSTv3 (http://eburst.mlst.net), developed and hosted by Imperial College London (Feil et al. 2004; Spratt et al. 2004), was used.
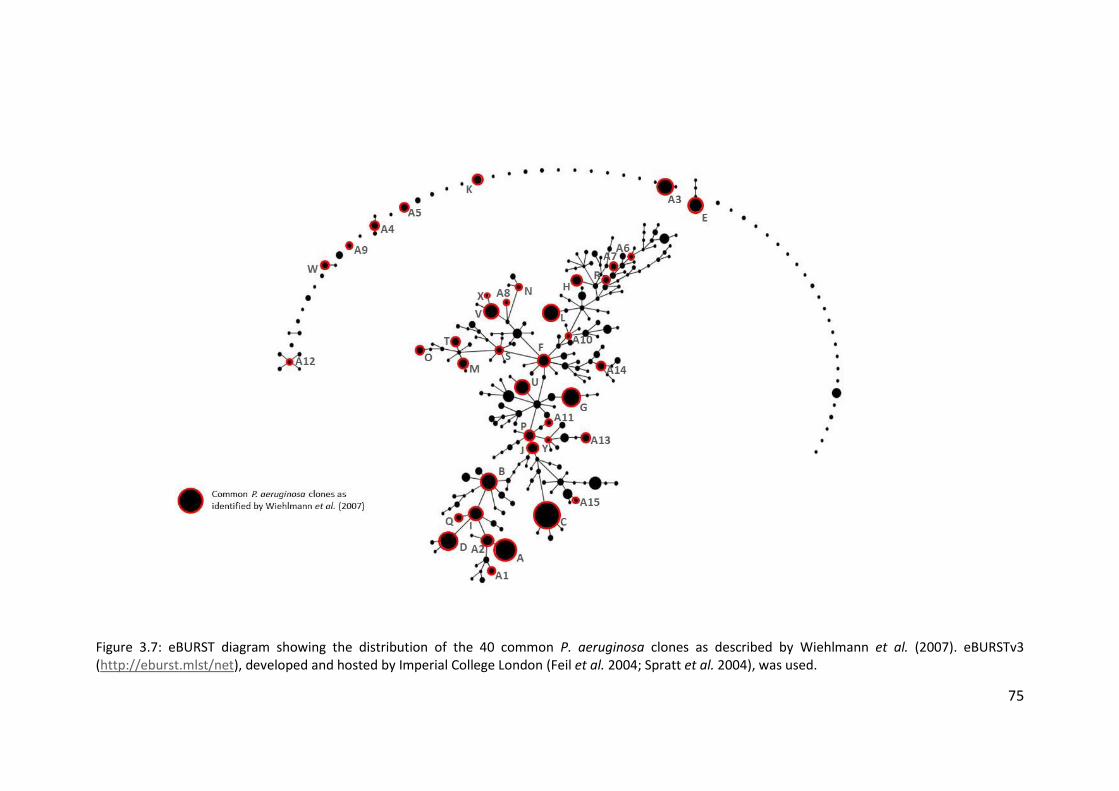
75
Figure 3.7: eBURST diagram showing the distribution of the 40 common P. aeruginosa clones as described by Wiehlmann et al. (2007). eBURSTv3 (http://eburst.mlst/net), developed and hosted by Imperial College London (Feil et al. 2004; Spratt et al. 2004), was used.
76
3.3.6 Poor hybridisation at exoS and exoU variable gene markers
It had been noted previously that one of the more serious limitations of the
AT system is poor hybridisation at some markers on the chip (Hall 2015, personal
communication), leaving interpretation of the results open to ambiguity. In
particular, hybridisation was frequently poor at the markers for exoS and exoU
variable genes. Figures 3.8a and 3.8b are AT images from isolates B164 and B169
(table 3.1) respectively. When the AT images were read initially, B164 was assigned
the code CC60 and B169 was assigned the code CC62; the difference in codes was
due to the variance in exoS hybridisation. In figure 3.8b there appears to be faint
hybridisation at the exoS marker although there is no hybridisation at either exoS or
exoU in figure 3.8a. A PCR assay was carried out using specific primer sets (table 2.1)
to determine the presence or absence of both variable genes. Gel electrophoresis
was performed on the PCR products and the results are shown in figure 3.9. Both
B164 and B169 were confirmed negative for both exoS and exoU, despite the original
decision that B169 was positive for exoS, which resulted in the two isolates appearing
to be of differing strain types. Similarly, isolates B1 and B7 were originally assigned
different AT codes (0C1C and 0C1A respectively). Figure 3.10a and 3.10b are AT
images for isolates B1 and B7 (table 3.1), in which there appears to be no
hybridisation at either exoS or exoU markers in figure 3.10a and faint hybridisation
at exoS marker in figure 3.10b. A PCR assay was also carried out on these isolates and
showed that both B1 and B7 were positive for exoS (figure 3.11). There were 8 other
isolates for which PCR assays were needed to determine the presence or absence of
the exoS and exoU variable genes (figures 3.12a & 3.12b).
3.3.7 Transmissible strains of Pseudomonas aeruginosa in non-cystic fibrosis
bronchiectasis patients
As part of the initial PCR screening of the panel of isolates (chapter 2.2), four
isolates taken from patient 10 tested positive for MID1, indicating that they were the
Midlands 1 strain of P. aeruginosa (figure 3.13). Two of these isolates were
subsequently selected as a pair of longitudinal isolates to undergo AT genotyping
(isolates B17 and B20). However, both isolates were assigned AT code 741E, which is

77
not consistent with the previously defined AT code for the Midlands 1 strain, 2C1A
(Wiehlmann et al. 2007). Hence, these were in fact false PCR-positives.
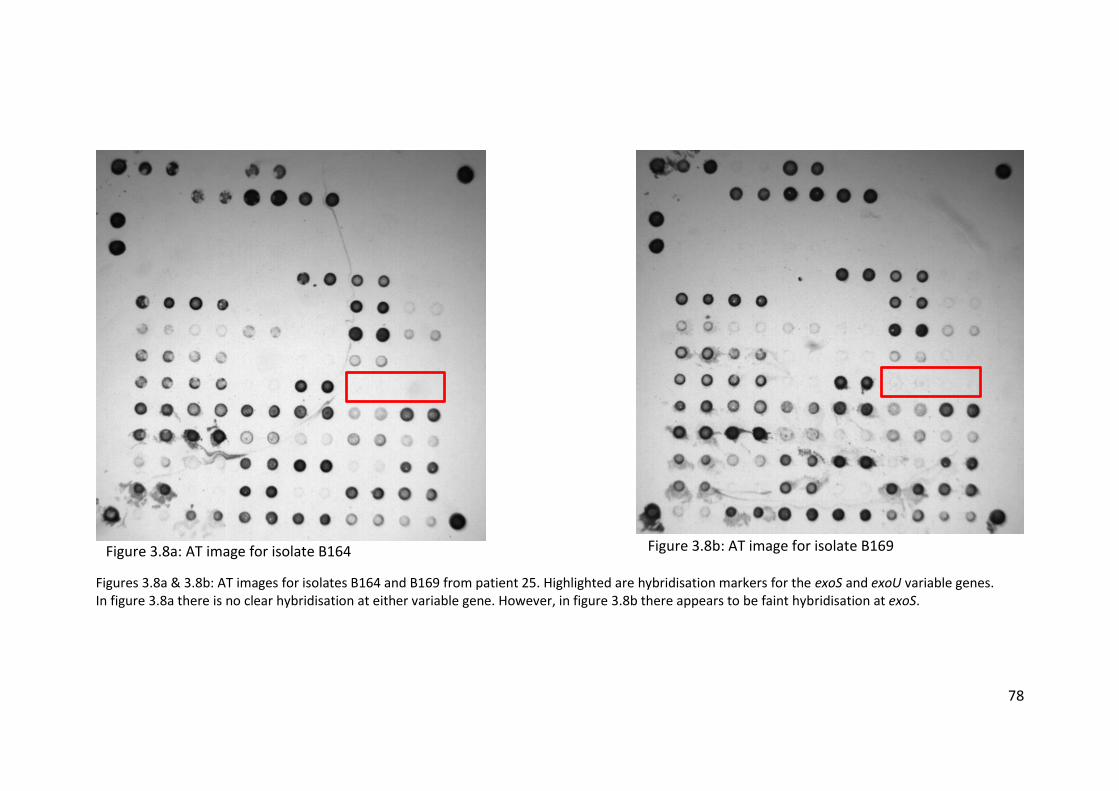
78
Figures 3.8a & 3.8b: AT images for isolates B164 and B169 from patient 25. Highlighted are hybridisation markers for the exoS and exoU variable genes. In figure 3.8a there is no clear hybridisation at either variable gene. However, in figure 3.8b there appears to be faint hybridisation at exoS.
Figure 3.8a: AT image for isolate B164 Figure 3.8b: AT image for isolate B169
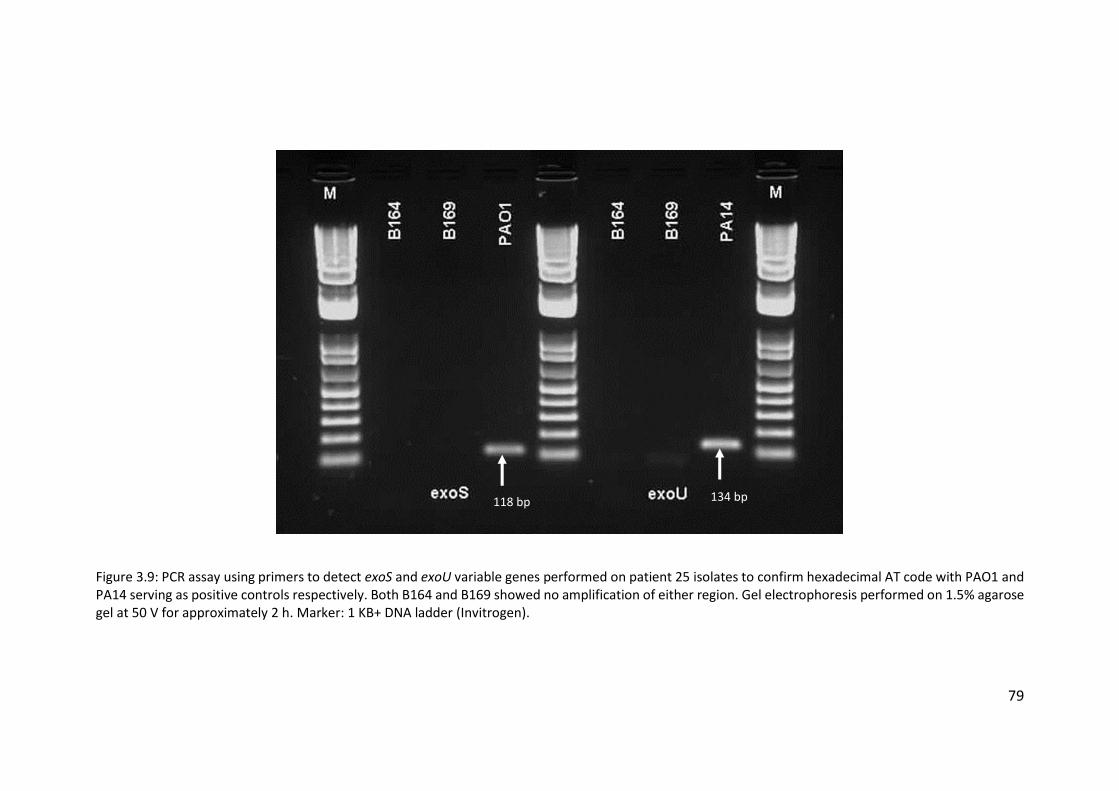
79
Figure 3.9: PCR assay using primers to detect exoS and exoU variable genes performed on patient 25 isolates to confirm hexadecimal AT code with PAO1 and PA14 serving as positive controls respectively. Both B164 and B169 showed no amplification of either region. Gel electrophoresis performed on 1.5% agarose gel at 50 V for approximately 2 h. Marker: 1 KB+ DNA ladder (Invitrogen).
118 bp 134 bp
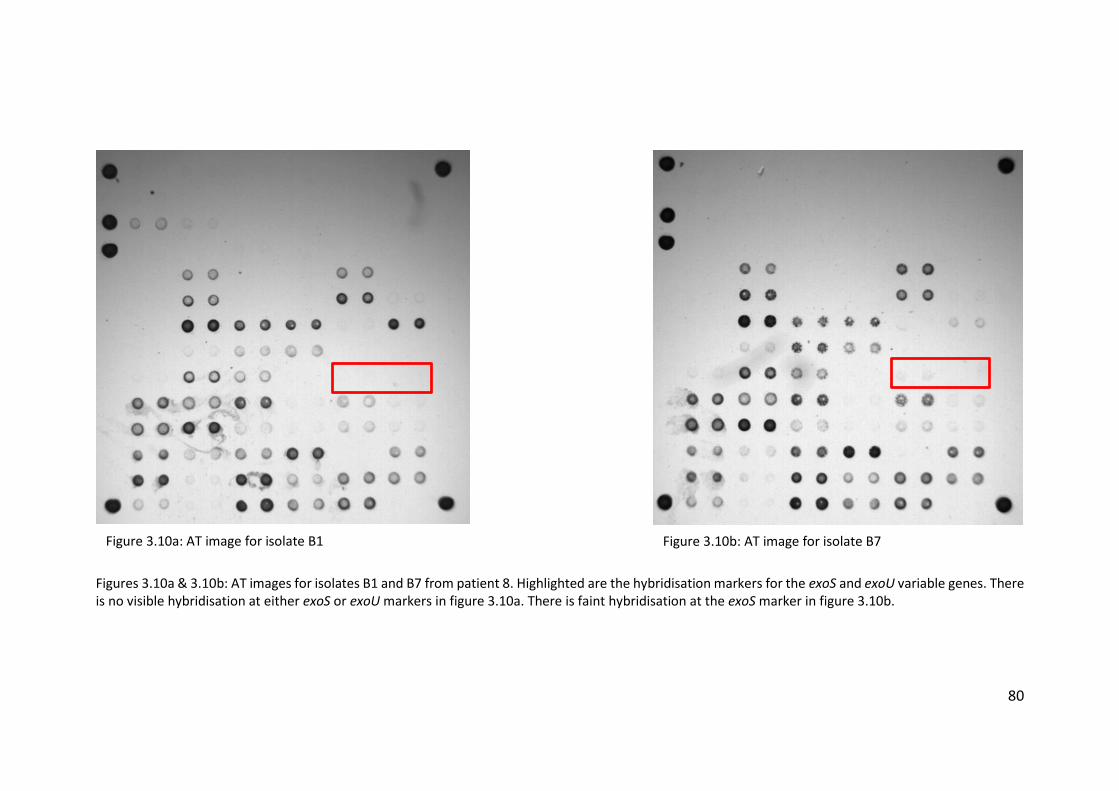
80
Figures 3.10a & 3.10b: AT images for isolates B1 and B7 from patient 8. Highlighted are the hybridisation markers for the exoS and exoU variable genes. There is no visible hybridisation at either exoS or exoU markers in figure 3.10a. There is faint hybridisation at the exoS marker in figure 3.10b.
Figure 3.10a: AT image for isolate B1 Figure 3.10b: AT image for isolate B7
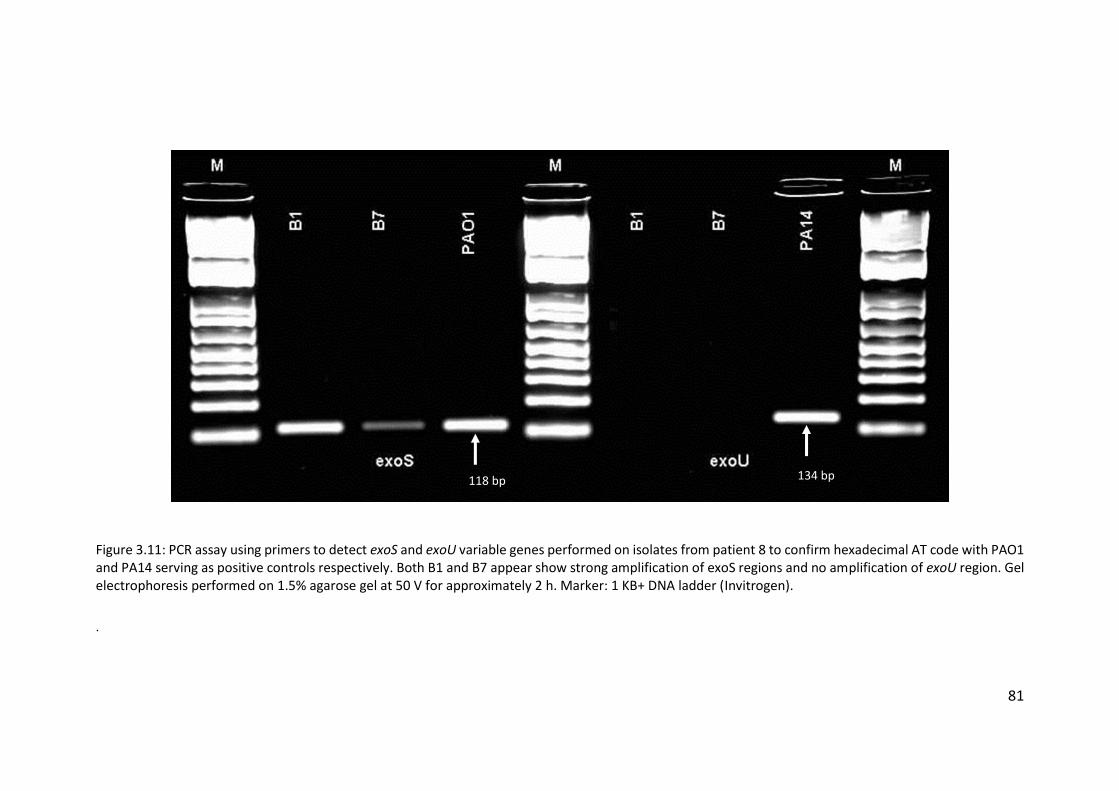
81
Figure 3.11: PCR assay using primers to detect exoS and exoU variable genes performed on isolates from patient 8 to confirm hexadecimal AT code with PAO1 and PA14 serving as positive controls respectively. Both B1 and B7 appear show strong amplification of exoS regions and no amplification of exoU region. Gel electrophoresis performed on 1.5% agarose gel at 50 V for approximately 2 h. Marker: 1 KB+ DNA ladder (Invitrogen).
.
118 bp 134 bp
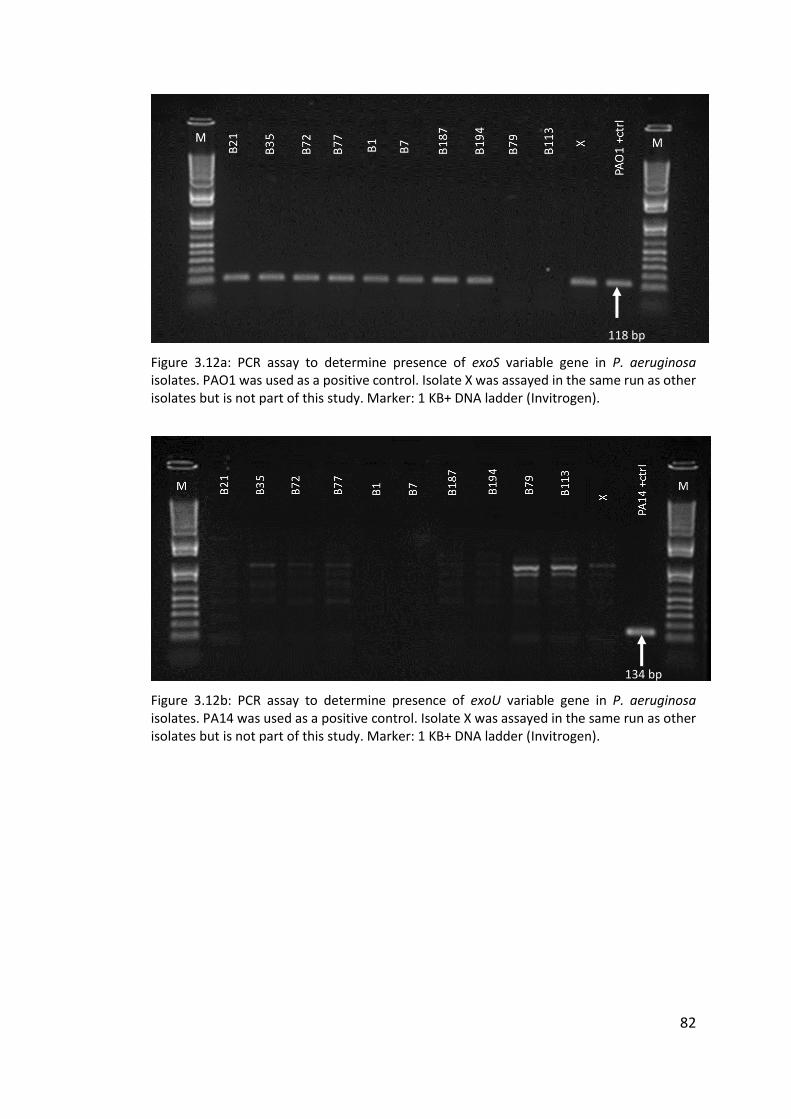
82
Figure 3.12a: PCR assay to determine presence of exoS variable gene in P. aeruginosa isolates. PAO1 was used as a positive control. Isolate X was assayed in the same run as other isolates but is not part of this study. Marker: 1 KB+ DNA ladder (Invitrogen).
Figure 3.12b: PCR assay to determine presence of exoU variable gene in P. aeruginosa isolates. PA14 was used as a positive control. Isolate X was assayed in the same run as other isolates but is not part of this study. Marker: 1 KB+ DNA ladder (Invitrogen).
118 bp
134 bp
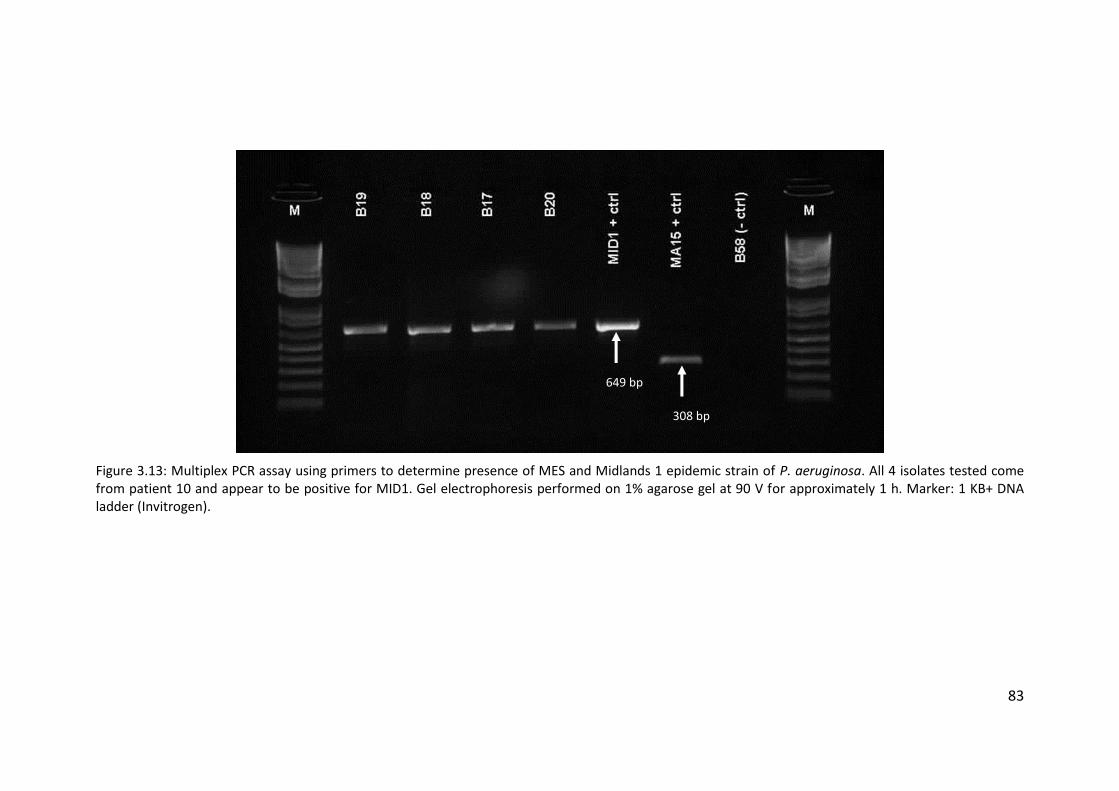
83
Figure 3.13: Multiplex PCR assay using primers to determine presence of MES and Midlands 1 epidemic strain of P. aeruginosa. All 4 isolates tested come from patient 10 and appear to be positive for MID1. Gel electrophoresis performed on 1% agarose gel at 90 V for approximately 1 h. Marker: 1 KB+ DNA ladder (Invitrogen).
649 bp
308 bp
84
3.4 Discussion
3.4.1 Maintenance of Pseudomonas aeruginosa strains in non-cystic fibrosis
bronchiectasis patients
There have previously been very few studies investigating populations of P.
aeruginosa among NCFBr patients. In fact, there have been very few long-term
studies investigating the progression of NCFBr as a disease. Studies that have been
performed (Wilson et al. 1997; Loebinger et al. 2009), though often not published in
recent years, implicate P. aeruginosa chronic infection in an increase in morbidity
and mortality. In early studies P. aeruginosa infection was shown to lead to increased
disease progression, with a more rapid decline in lung function (Evans et al. 1996;
Wilson et al. 1998), although the role of P. aeruginosa as a source or marker of
disease progression was unclear. The study by Loebinger et al. (2009) examined a
large number of variables in disease progression, and those that were determined
not to be independently predictive were discarded to provide a multivariate
modelling strategy to draw mechanistic conclusions from, as opposed to a predictive
tool for individual patients. By this method Loebinger et al. (2009) suggested that P.
aeruginosa infection in NCFBr patients was more likely to impact on survival than to
act as a marker of severity of disease. It is, therefore, important to understand the
population of P. aeruginosa within NCFBr patients in order to better understand
disease progression, given that there are many known mutations associated with
chronic infection in CF patients (Smith et al. 2006; Amiel et al. 2010; Bjarnsholt et al.
2010; Manos et al. 2013).
A small longitudinal study of isolates from NCFBr patients was undertaken by
De Soyza et al. (2014) as a part of a study investigating the occurrence of cross-
infection in NCFBr patients from a single adult clinic. Aside from this, there has been
no further study into the maintenance of strains of P. aeruginosa in chronically
infected NCFBr patients. This work builds upon the data from De Soyza et al. (2014)
to provide evidence of maintenance of clonal strains of P. aeruginosa in NCFBr
patients.
85
In 15 of the 20 patients from whom isolates were collected for this study, the
same strain of P. aeruginosa was maintained over a mean (range) period of 40
months (12 – 84 months), indicating that for the majority of patients infection with
the same strain can be maintained for considerable periods of time. Two of these
patients, 9 and 21 (table 3.1), were chronically infected with P. aeruginosa clone A
(D421). Isolates from patients 9 (B10 and B16) were not only categorised as the same
clonal type of P. aeruginosa by analysis of the SNPs and variable genes on the AT chip,
but they also shared an identical hybridisation pattern for the markers used to
represent the accessory genome (genomic islands and further variable genes).
Isolates B141 and B150 from patient 21 shared AT codes but varied in hybridisation
at the variable gene and genomic island markers. The early and late isolates for
patient 21 (B141 and B150 respectively) were collected 33 months apart. Although
the strain type appears to have been maintained, the data suggest that the accessory
genome of the strain has undergone some changes. The late isolate has lost a
genomic island and a variable gene that was present in the early isolate but also
appears to have gained a genomic island not present in the early isolate. These
changes in the accessory genome are most likely evidence of the occurrence of
horizontal gene transfer between P. aeruingosa strains within the lungs of the
patient. The early isolate (B141) was positive for both pyoverdine receptor types 3
and B variable genes (figure 2.2) whereas the late isolate (B150) is only positive for
pyoverdine receptor type B (Stover et al. 2000; de Chial et al. 2003). The late isolate
also exhibits no hybridisation at the fla-2 orfA and fla-2 orfJ genomic island markers,
which indicates a loss of the genomic island essential for glycosylation of flagellin
(Arora et al. 2004) and shows hybridisation at the C47 marker, which indicates the
presence of a strain-specific gene island into a tRNAGly gene (Larbig et al. 2002).
These apparent changes in the accessory genome could be explained in a
number of different ways. It is possible that the infecting strain population has
changed due to environmental factors driving adaptation and evolution of the P.
aeruginosa populations, as has been described in a number of CF studies (Thomas et
al. 2000; Ciofu et al. 2005; Smith et al. 2006; Fothergill et al. 2010a). This may be due
to new regimens of treatment, changes in patient lifestyle, other members of the
86
microbial community, host responses or other factors influencing the conditions
present in the lung environment in which the bacteria thrive. However, it has been
reported in CF that during chronic infections, P. aeruginosa populations diversify
both phenotypically and genomically (Mowat et al. 2011; Workentine et al. 2013;
Williams et al. 2015). It has been shown that genomic instability, in particular the
transfer of genetic material between strains, can lead to misleading results when
various genotyping methods are used (Fothergill et al. 2010a; Worby et al. 2014).
These observations also reflect the intra-population diversity that occurs in CF, with
accessory genome variations very common. It has been demonstrated in CF patients
that multiple divergent lineages of P. aeruginosa can co-exist within a single
chronically infected patient. Work by Williams et al. (2015) sought to investigate the
diversity of P. aeruginosa isolates within CF patients using whole genome sequencing
of 40 isolates from 9 patients. Initially, one patient was found to have two divergent
lineages (A and B) sharing a common ancestor. Lineage A was characterised by 55
shared SNPs, whilst lineage B shared 24 SNPs. A difference of 79 SNPs separated the
co-existing lineages, however only 42 SNPs separated the most recent common
ancestor (MRCA) from the earliest known LES (LESB58), used as a reference genome.
In addition to this patient, two divergent lineages were found to be present in a
further 6 of the 8 remaining patients, indicating that the plasticity of the P.
aeruginosa genome may regularly allow for in-patient diversity of chronic strains
(Williams et al. 2015). Hence, the observations in this study could reflect the fact that,
as in CF, P. aeruginosa populations in the NCFBr lung can diversify and exhibit
genomic instability. Due to the analysis of only a single isolate per patient, per time
point in this study it is not possible to confirm this explanation of accessory genome
variation from the data obtained.
One other patient (14) was also infected with P. aeruginosa clone A (D421),
although in this case clone A was only present in the late isolate collected 24 months
after the early isolate, and varied from the early isolate by 6 SNPs in the AT binary
code. The hybridisation of variable genes and genomic islands in this isolate (B49)
were notably different to those of any of the other four isolates with the D421 AT
code, indicating that these isolates were likely not shared among the patients and
87
were acquired environmentally, which is unsurprising given the prevalence of clone
A in the environment among the general population of P. aeruginosa (figure 3.14).
3.4.2 Pseudomonas aeruginosa strains from non-cystic fibrosis bronchiectasis
patients in the context of the wider CF population
There have been many attempts to elucidate the population structure of P.
aeruginosa in an attempt to better understand the acquisition of bacterial infection
and the pathogenicity of strains found in clinical isolates although there is a general
consensus that clinical isolates of P. aeruginosa are generally indistinguishable
genotypically, chemotaxically, and functionally from environmental isolates (Pirnay
et al. 2002). It was noted by Römling et al. (1994) that the major clone (C) identified
in CF patients (28%) was also present at a high frequency in aquatic environments
(21%). By use of outer membrane lipoprotein gene sequences (oprI, oprL, and oprD),
DNA fingerprinting, serotyping, and pyoverdine type Pirnay et al. (2002) concluded
that P. aeruginosa has an epidemic population structure, similar to that of Neisseria
meningitidis (Feil et al. 2001), comprised of a number of widespread clones
originating from a larger number of unrelated genotypes. These clones are abundant
and widespread throughout the natural environment, with no discernible correlation
between habitat or geographical location and clone type, and are therefore expected
to be prevalent in clinical isolates. Investigation into the population structure of P.
aeruginosa was later revisited by this group in 2009, using a wide range of traits to
analyse a network of relationships between 328 unrelated P. aeruginosa isolates.
This work confirmed the nonclonal epidemic population structure; providing a view
of a superficially clonal structure in which frequent recombination occurs and
successful epidemic clones occasionally arise (Pirnay et al. 2009).
Further work carried out by Cramer et al. (2012) also confirmed this
population structure among a large database of P. aeruginosa isolates from CF
centres, aquatic environments, patients with ventilator associated pneumonia (VAP),
keratitis, or patients with COPD. There was no evidence of a widespread
transmissible clone among CF patients, and the five most common clones found in
CF patients were found to be among the ten most common clones found in the
88
environment and in VAP, COPD, and keratitis (Cramer et al. 2012). Conversely it has
been demonstrated that certain genetic characteristics are implicated in the
adaptation of P. aeruginosa to cause corneal infections (Stewart et al. 2011; Shankar
et al. 2012). A set of 63 isolates underwent AT genotyping and were analysed by
Stewart et al. (2011). Using eBURSTv3 it was shown that the majority of keratitis
isolates were represented in a closely related sub-group of P. aeruginosa. Twitching
motility, due to type IV pili, in P. aeruginosa is associated with keratitis infection and
46% of isolates with the most common serotype found in keratitis (O11) were found
to carry a distinctive pilA which encodes the pilin of type IV pili. This indicates that
keratitis isolates are associated with specific characteristics and, therefore, that a
subpopulation of P. aeruginosa is adapted to cause corneal infection (Stewart et al.
2011). Work by Shankar et al. (2012) also investigated clustering of P. aeruginosa
isolates from keratitis infections. A total of 123 isolates were collected over two
different time periods (2003 – 2004 and 2009 – 2010) and analysed using the AT
genotyping system. When compared to a database of isolates from a non-ocular
origin it was discovered that 71% of the UK keratitis isolates clustered together, with
no major evidence for variations in the distribution of the clone types between the
two collections. The “core keratitis cluster” appeared to be related to the P.
aeruginosa eccB clonal complex which is associated with an adaptation to survive in
water, suggesting that adaptation to an aquatic environmental habitat is a key factor
in the ability of P. aeruginosa isolates to cause ocular infections (Shankar et al. 2012).
There appeared to be no such clustering or associations within this collection
of NCFBr isolates. The eBURST diagrams in figures 3.6b and 3.7 show the distribution
of genotypes found in NCFBr isolates and 40 common clone types (Wiehlmann et al.
2007) respectively among the general population of P. aeruginosa isolates from a
compiled dataset (Wiehlmann et al. 2007; Cramer et al. 2012; Shankar et al. 2012;
Hall et al. 2013; Hall et al. 2014; De Soyza et al. 2014). Comparison of the two
diagrams shows that the distribution of NCFBr isolates is similar to that of the
abundant and widely distributed clones described by Wiehlmann et al. (2007),
indicating that there are no widespread epidemic clones present in the NCFBr
population, much like the population of CF isolates. Figure 3.14 shows the sources
89
from which genotypes found in this study have previously been isolated. Many
genotypes have been isolated from multiple sources, both clinical and
environmental, although genotypes 059A, 0C4A, and AC2E have only previously been
isolated in patients with CF (figure 3.14). The 16 most common of the 40 clones
described by Wiehlmann et al. (2007) (those with a frequency of ≥1% in the compiled
dataset) were generally isolated from a wide range of sources, with a broad
geographical spread.
Some isolates with novel genotypes (meaning they had not previously been
described in the compiled dataset) were also present in this NCFBr data. Six
genotypes (3C28, 6852, CC60, 4C8A, 682A, and 682E) from isolates in five patients
had no matches with isolates previously identified by the AT genotyping method.
Genotypes 6852 and CC60 are represented in figure 3.6b as single nodes, distributed
radially away from the main cluster of genotypes whereas the remaining novel
genotypes are present in the main cluster. Genotype 3C28 is only present in the early
isolate of patient 14. The late isolate from this patient was collected 24 months later
and was identified as clone A (D421). It is possible that patient 14 acquired a unique
strain of P. aeruginosa (i.e. ST 3C28) independently from the environment which was
subsequently replaced by the common clone A. It is also possible that this patient
was continuously co-infected with both strains, but by sampling only one isolate per
patient per time point we are unable to determine the exactitudes of this patient’s
infection.
Clone P (6C2A) was almost exclusively found in CF patients from Germany and
the UK, with one isolate being collected from an environmental water source in
Belgium (Wiehlmann et al. 2007; Cramer et al. 2012; Shankar et al. 2012; Hall et al.
2013; Hall et al. 2014) but was not found to be present in the NCFBr data. Isolates of
this clone type were collected from CF patients at clinics in Hannover, Jena, and
Frankfurt between 1996 and 2001 (Wiehlmann et al. 2007), and from CF patients in
Liverpool, UK (Hall et al. 2013). Although there is no evidence of clustering of P.
aeruginosa isolates from CF patients, the limited sources from which this clone has
been previously isolated is interesting. It is possible that it does not fall within the
“core keratitis cluster” as described by Shankar et al. (2012) and so is not adapted to
90
cause ocular infection, and therefore is not recovered from keratitis patients. There
may also be sampling bias in the compiled dataset, in that many of the isolates were
collected in order to study P. aeruginosa populations within CF patients or clinics and
so the clone appears to be recovered more frequently from CF patients than the
environment. In the case of this study, isolates were collected from patients
attending only one bronchiectasis service which is geographically separate from the
regional CF centre. It is possible that in a study including a wider range of
bronchiectasis services, including some which share facilities with a CF service, that
this clone would also be recovered from NCFBr patients.
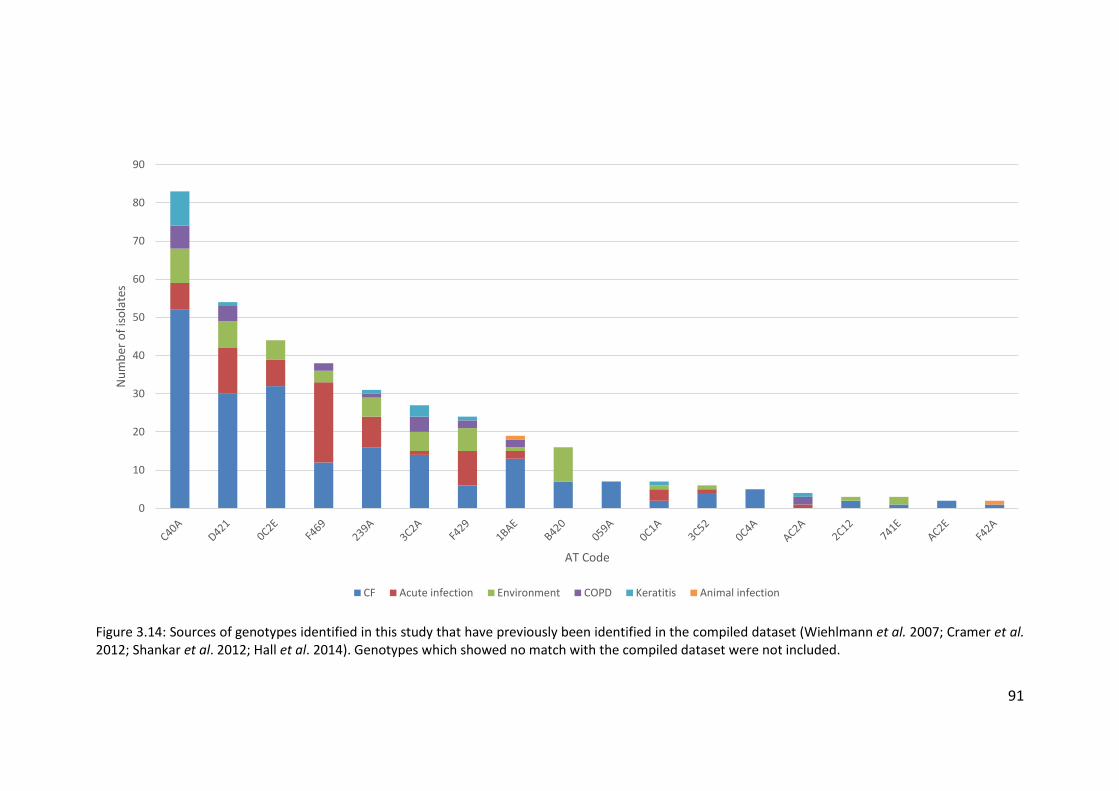
91
Figure 3.14: Sources of genotypes identified in this study that have previously been identified in the compiled dataset (Wiehlmann et al. 2007; Cramer et al. 2012; Shankar et al. 2012; Hall et al. 2014). Genotypes which showed no match with the compiled dataset were not included.
0
10
20
30
40
50
60
70
80
90
Nu
mb
er o
f is
ola
tes
AT Code
CF Acute infection Environment COPD Keratitis Animal infection
92
3.4.3 Epidemic strains of P. aeruginosa in NCFBr patients
Transmissible (epidemic) strains of P. aeruginosa have been a major concern
in CF units, and they can have severe consequences in terms of morbidity and
mortality. After the initial description of the LES by Cheng et al. (1996) further work
was carried out to investigate the possibility of superinfection by transmissible
strains of P. aeruginosa. Four adult patients who had previously been colonised with
unique strains of P. aeruginosa were studied after transferring from either a local
paediatric CF centre or a distant hospital CF clinic to the regional adult centre
(McCallum et al. 2001). Longitudinal monitoring of sputum samples from these
patients revealed that after inpatient stays they had become superinfected with the
strain referred to as AH (LES). In two of the four patients, after a number of months
only strain AH was cultured from sputum samples. In the case of the remaining two
patients other strains that had previously been isolated from sputum samples were
also present alongside strain AH (McCallum et al. 2001). Once it had been established
that superinfection by LES was a threat among mixed populations of P. aeruginosa-
positive individuals it became important to discover the effects of infection with an
epidemic strain on patient health and survival. It was shown by Al-Aloul et al. (2004)
that a group of CF patients infected with the LES experienced a greater deterioration
in pulmonary function and nutritional state than paired LES-negative patients.
Chronic infection with LES also led to an increased treatment burden on the affected
patients. Given that LES tends to be multiresistant to antipseudomonal antibiotics
this increased burden is important as it has been shown that the repeated use of
antibiotics to which the strain is susceptible are nephrotoxic and cause renal damage
in CF patients (Al-Aloul et al. 2002). Antibiotic resistance tends to increase in both
LES and other strains of P. aeruginosa over time in chronically infected patients,
although the LES has been found to exhibit significantly higher levels of resistance in
collected isolates (Ashish et al. 2012).
Very little is known about cross infection in relation to NCFBr patients
infected with P. aeruginosa. In this cohort of patients, no known UK CF transmissible
strains were found. As part of initial screening, all isolates were assayed by PCR for
LES, Midlands 1 (Scott & Pitt 2004), and Manchester epidemic strain (Jones et al.
93
2001) (table 2.1) and all 4 isolates collected from patient 10 tested positive for MID1,
the marker for the Midlands 1 transmissible strain (figure 3.13). However, the
Midlands 1 strain isolates assayed as part of work by Smart (2007) correspond to AT
code 0C1A whereas isolates B17 and B20 were assigned code 741E. The MID1
primers were designed using suppression subtractive hybridisation (SSH) by Smart et
al. (2006) as a diagnostic test for use in CF centres to rapidly identify patients with
epidemic strains of P. aeruginosa. Through the use of SSH, sequences from the
accessory genome of various P. aeruginosa strains were compared to identify
sequences unique to the Midlands 1 strain. The MID1 primers (table 2.1) target a
bacteriophage-related site-specific recombinase (Smart, Walshaw, et al. 2006). The
observations presented here suggest that the selection process used was not 100%
effective at ensuring that the target sequence was specific for the Midlands 1 strain.
This is the first reported example of a false PCR-positive for the Midlands 1 strain and
it suggests that there are other strains of P. aeruginosa that share this accessory
genome region. Work by Fothergill et al. (2010) investigated anomalous results of
PCR assays to detect LES isolates from CF patients. The diagnostic PCR for LES uses
two primer sets (table 2.1): PS21 and LESF9. Originally the PS21 marker was tested
alone as a marker for LES-positive isolates, but false positives were recognised (Lewis
et al. 2005; Smart, Walshaw, et al. 2006) and so the test was expanded to include the
LESF9 marker (Smart et al. 2006a; Fothergill et al. 2008). Fothergill et al. (2010)
identified four false positives and 11 false negatives for the PS21 marker from a panel
of 24 isolates. Analysis also revealed 10 false positives and one false negative for the
LESF9 marker (Fothergill, White, et al. 2010). There were also three false positives for
both PS21 and LESF9 markers. The large size of the P. aeruginosa genome and, in
particular, the plasticity of its accessory genome means that it is likely that
bacteriophage-related sequences are shared among more than one strain of the
bacteria, leading to false positives in the diagnostic PCR. The data presented here
further confirms the need for using more than one typing method in order to
unequivocally identify strains.

94
3.5 Conclusions
The main conclusions that can be drawn from this study are:
1. In the majority of NCFBr patients with chronic P. aeruginosa
infections, infecting strains of P. aeruginosa are maintained;
2. Strains of P. aeruginosa isolated from NCFBr patients are widely
distributed in much the same way as the general population.
95
Chapter Four
Use of genome sequencing to study the diversity of Pseudomonas aeruginosa
isolates from non-cystic fibrosis bronchiectasis patients
4.1 Introduction
4.1.1 Diversity of Pseudomonas aeruginosa isolates in cystic fibrosis patients
There have been many studies undertaken into the genetic diversity of P.
aeruginosa isolates in cystic fibrosis (CF) patients, using many different methods (Hall et
al. 2013), in order to establish the prevalence of certain strains of P. aeruginosa (Cramer
et al. 2012), investigate the methods by which the bacterial population adapts from an
environmental habitat to the lungs (Marvig et al. 2014), and the effects of selective
pressures, such as the administration of intravenous antibiotics, on P. aeruginosa
populations (Fothergill et al. 2010a). The diversity of P. aeruginosa populations can be
studied at different levels, such as within-patient, inter-patient, and both nationwide
and globally (Freschi et al. 2015), and using techniques of varying degrees of depth.
During chronic infection P. aeruginosa exhibits both adaptation and
diversification, and the mechanisms underlying many of the chronic-stage adaptations,
such as the switch to a mucoid phenotype and a loss of motility (Govan & Deretic 1996;
Goodman et al. 2004), have been well established. The acquisition of mutations in
important regulatory genes can happen rapidly following initial infection in the CF lung
environment (Wilder et al. 2009; Rau et al. 2010). The conditions experienced by
bacterial populations living within the CF lung environment are the drivers of these
mutations, which can confer a selective advantage in niche environments. Mutation
96
commonly occurs in the gene encoding the quorum sensing regulator LasR. In
comparison with wild type strains lasR mutants exhibit a significant metabolic shift with
decreased oxygen consumption and increased nitrate utilisation, both of which are
predicted to offer increased fitness in the nutrient conditions provided in CF lungs
(Hoffman et al. 2010). This shift by the lasR mutants also conferred increased resistance
to tobramycin and ciprofloxacin, both of which are commonly used in CF care. Selection
for resistance in these mutants in vitro did not require previous antibiotic treatment.
Increases in antibiotic resistance among strains of P. aeruginosa have been previously
reported, particularly among the Liverpool Epidemic Strain (LES) (Salunkhe et al. 2005;
Ashish et al. 2012) and among hypermutator strains that are commonly found in CF
patients (López-Causapé et al. 2013). To further investigate the genotypic changes
experienced by P. aeruginosa isolates inhabiting the CF lung the genomes of 12 isolates,
including 4 environmental isolates, underwent whole genome sequencing and
comparative genomic analysis (Stewart et al. 2014). Paired nonmucoid and mucoid
isolates from three separate patients were compared. Analysis revealed that two of
these three pairs were derived from the same strain and that the third pair was not,
suggesting that this patient may be suffering either a multi-strain infection or undergoing
a strain succession event (Stewart et al. 2014). One of the related pairs of isolates was
found to be near-isogenic but it was noted that the mucoid strain had a smaller genome
than that of its nonmucoid progenitor. Significant evidence for genome shrinkage during
bacterial adaptation to a host has previously been observed (Toft & Andersson 2010)
and it is possible that shrinkage occurred in the case of this pair of isolates. Notably the
mucoid isolate is lacking the filamentous phage PF1 and the exoY gene, due to a 65 kbp
deletion relative to its putative parental strain (Stewart et al. 2014). The core genomes
of 55 isolates, including the 12 sequenced isolates, were also analysed using a core
genome threshold of 55 and sequence identity of 90%. Only one isolate of these 55 was
found to be closely related to taxonomic outlier PA7 (Roy et al. 2010) and the remainder
fell into one of two major subgroups of P. aeruginosa known as group 1 and group 2
(Stewart et al. 2014). Group 1 was the larger of these two groups and contains notable
97
strains DK2, PAO1, LESB58, and PAK. Group 2 is significantly less populous than group 1
and contains PA14. Isolates from all sources, including CF sputum, were found to be well
represented in both groups but at present it is unclear whether group 1 isolates are
naturally more abundant than group 2 isolates or if a bias has been introduced due to
selection of strains for sequencing projects (Stewart et al. 2014).
Much of the previous work undertaken to investigate changes in P. aeruginosa
populations in CF patients has been designed to reveal the genetic changes over the
course of a longitudinal study, meaning that often only single isolates are taken per
patient and analysed at the cost of sampling depth. Evidence from phenotypic studies
has suggested that there is widespread heterogeneity among isolates from individual
patients (Mowat et al. 2011; Workentine et al. 2013) and so extensive sampling for
whole genome sequencing was undertaken to further understanding of the diversity of
P. aeruginosa isolates from CF patients. A total of 360 isolates were collected from 9
patients attending an adult CF centre in Liverpool, UK to undergo whole genome
sequencing in order to ascertain the diversity among 40 isolates per patient sputum
sample. The patients were all known to have been LES positive for a number of years
prior to the study (Williams et al. 2015). Isolates from all nine patients were analysed,
revealing that 7 of the 9 patients harboured coexisting, divergent lineages of the LES.
These divergent lineages were typically found to be more closely related to lineages
found in other patients than to each other. Other studies have also highlighted within-
population variation for P. aeruginosa during CF infections (Darch et al. 2015; Diaz
Caballero et al. 2015; Jorth et al. 2015). There are obvious clinically-relevant
consequences to this. It has been shown that conventional antimicrobial susceptibility
tests, which rely on a single isolate to represent infection, are not accurate predictors of
response to therapy (Smith et al. 2003) and this may be in part due to the apparent
diversity of isolates within chronically infected patients (Williams et al. 2015).
A study carried out in a Danish CF centre (Marvig et al. 2014) sought to further
understanding of how P. aeruginosa evolves during long-term infection in human hosts
by sequencing whole genomes of 474 isolates collected from the airways of 34 children
98
and young adults with CF (aged between 1.4 and 26.3 years). The collection of isolates
was intended to give insight into the longitudinal progression of the early stages of P.
aeruginosa infection and so the initial and several subsequent isolates from each patient
were selected for sequencing. From these 474 isolates 53 genetically distinct clonal
groups were identified. Genomes from isolates with the same clone type differed on
average by 122 single nucleotide polymorphisms (SNPs) (median: 9 SNPs, range: 0 – 1
333 SNPs). Genomes from isolates in different clonal complexes differed by >10 000
SNPs. 10 clone types were identified that were present in multiple patients. In 19 of
these patients the genomes of the isolates were found to be separated by at least 50
SNPs and, taking into account the average mutation rate of P. aeruginosa within patients
(2.6 SNPs/year) (Marvig et al. 2013), it was concluded that the presence of the same
clone type in these patients was unlikely to be due to recent or direct transmission
between the patients. Alternatively, the presence of these genetically distant clonal
isolates may be due to transmission from a patient not included in this study or as a
result of independent acquisition of a prevalent clone from the environment (Marvig et
al. 2014). In a few cases (5 patients) the difference between clonal isolates from different
patients were only a few SNPs (range = 0 – 29) which suggested the occurrence of recent
interpatient transmission events. Information on patient visits was retrieved and
confirmed that in all cases of suspected patient-to-patient transmission there were
overlaps in the patients’ time spent in the hospital. Heterogeneity of P. aeruginosa
within patients can mislead attempts to elucidate the direction and source of
transmission (Worby et al. 2014), although it is suspected in this case that the clone types
were transmitted from the older patients, in whom the clones were identified first, to
the younger patients.
The diversity of P. aeruginosa isolates among CF patients varies worldwide. Many
different studies, covering centres across various countries, have drawn conclusions
about the precautions necessary for infection control within their respective CF centres.
In one study in the UK the majority of patients were found to harbour their own unique
strains of P. aeruginosa although around one fifth of those sampled carried one of two
99
epidemic strains (LES and Midlands 1) (Scott & Pitt 2004). A third common genotype
previously identified in Germany (Dinesh et al. 2003), clone C, was also widespread in
UK CF centres. The LES accounted for 11% of isolates in this study and was found to be
present in 48% of centres surveyed. The Midlands 1 strain was also highly prevalent and
accounted for 10% isolates, being found in 29% of centres. The findings were unexpected
but provided strong evidence of cross-infection both within and between UK CF centres
(Martin et al. 2013). More recently whole genome sequencing has been used to further
understanding of the LES. The genomes of seven LES (UK) and LESlike (Canada) isolates
were sequenced in order to undertake comparative genomic analysis (Jeukens et al.
2014).In six of the seven isolates at least one large deletion (40 – 50 kbp) was revealed
in comparison to the LESB58 reference genome. These deletions were shown to
correspond to prophages which have been previously shown to increase the
competitiveness of LESB58 in chronic lung infections (Jeukens et al. 2014). A further 308
non-synonymous polymorphisms were identified, of which 28 were found to be
associated with virulence determinants and 52 with regulatory proteins. The majority of
the regulatory mutations were shown to be isolate-specific and 29% were predicted to
have a high functional impact implicating polymorphism in regulatory genes in variations
in phenotype between LES isolates (Jeukens et al. 2014).
Two separate studies were carried out in different provinces in Canada (Ontario
and British Columbia) and arrived at differing conclusions regarding the risk of
interpatient transmission. In Ontario 22% of 446 patients were found to be infected with
one of two transmissible strains. One strain (LES) was found to be present in 15% of
patients and the second strain, not previously identified as epidemic, was found in 7%
of patients; 3 patients (0.6%) were found to harbour both of these strains (Aaron et al.
2010). Conversely, in British Columbia there were 157 genotypes identified from isolates
collected and 123 of these were unique to individual patients. Only 34 types were shared
by two or more patients and these were proved to be epidemiologically linked only in
the case of 10 pairs of siblings and one unrelated pair of patients. It was concluded that
the risk of transmission of P. aeruginosa between CF patients in British Columbia was
100
low (Speert et al. 2002). However, Canada is a vast country and both provinces are large
(Ontario: >1 M km2; British Columbia: >900 K km2) and sparsely populated, and
separated by a distance of over 1000 km meaning that differences in CF patient
experience are not completely unexpected.
Patients in Australia underwent a large-scale study to investigate P. aeruginosa
populations across the country. More than 60% of patients sampled were found to
harbour a strain of P. aeruginosa indistinguishable from those found in at least one other
patient. Small areas of clustering were found among populations in small centres but
AUST-01 and AUST-02 strains were found to be highly prevalent across all centres; all 18
centres surveyed were found to have either one or both of these strains present (Kidd
et al. 2013). Greater than 40% of patients were found to be affected by either AUST-01
or AUST-02. Those harbouring AUST-01 attended healthcare facilities more frequently
than those patients infected with unique strains of P. aeruginosa which indicates that
certain genotypes are causing widespread cross-infection in centres across Australia
(Kidd et al. 2013). In the Netherlands a large study of two centres, serving 45% of the
Dutch CF population, revealed the prevalence of two P. aeruginosa sequence types
(ST406 and ST497) which were found in 15% and 5% respectively of the 265 patients
from whom P. aeruginosa was cultured (van Mansfeld et al. 2009). Neither of these
sequence types were genetically linked to previously described epidemic strains. Of the
patients surveyed, 60% were found to harbour a strain of P. aeruginosa also found in at
least two other patients (van Mansfeld et al. 2009).
In Belgium 163 P. aeruginosa genotypes were found from 213 patients across all
7 Belgian CF centres; 75% of these patients harboured only one genotype and 80% of
patients maintained the same genotype over a 1 year period. Limited clustering of
isolates was discovered and therefore it is unlikely that cross-infection is a common
occurrence among Belgian CF patients (Van daele et al. 2006). There was also no strong
evidence of nationwide cross-infection in New Zealand. DNA fingerprinting of 496 P.
aeruginosa isolates from 102 patients revealed only one cluster of related isolates that
was significantly more prevalent than expected in one centre. This cluster involved
101
isolates from 9 patients, 7 of whom attended the same centre. These 7 patients from
the same centre were also revealed to have had more interpatient contact with one
another than other patients, unconnected with the cluster, in the same centre. Analysis
showed that this clustering was likely due to healthcare-related transmission (Schmid et
al. 2008). Some previously-identified transmissible strains from the UK and Australia
were identified among patients who had previously lived in or visited these countries,
although there was no evidence of transmission from these patients to others (Schmid
et al. 2008).
Patient care standards for CF centres vary around the world and so, therefore,
does the population structure of P. aeruginosa among CF patients. In areas where
transmission within and between centres is a common occurrence (UK, Australia,
Ontario) it is necessary to implement segregation of patients based not only on their
Pseudomonas status, but also based on the strain identified from sputum samples.
However these measures can be costly and time-consuming to implement so areas
where inter-patient transmission is not a major health risk to CF patients it may be more
prudent to continue with current segregation measures.
The relatedness of CF P. aeruginosa isolates from within patients, within centres,
and between centres has been well studied; although further depth of study can always
be implemented. Inter-relatedness of P. aeruginosa isolates in non-CF bronchiectasis
(NCFBr), along with many aspects of the disease, remains underfunded and
understudied.
4.1.2 Diversity of Pseudomonas aeruginosa isolates in non-cystic fibrosis
bronchiectasis patients
Much of the research into P. aeruginosa populations has been carried out with
regards to CF patients, with little being done to resolve the population biology of
infection within other chronic lung diseases. Some work has been previously carried out
to investigate P. aeruginosa infections in chronic obstructive pulmonary disease (COPD).
P. aeruginosa infection is more likely to be associated with advanced COPD and is
102
associated with the symptoms of exacerbation, although infections in COPD follow one
of two possible patterns: (1) short-term colonisation followed by clearance or (2) long-
term persistence. Persistence of a strain of P. aeruginosa in COPD is associated with the
development of serum antibody response but this response, in turn, is not associated
with clearance of the infection (Rakhimova et al. 2009). In patients where the infection
persists P. aeruginosa is found to diversify, leading to co-existing isolates with varying
morphotypes and antibiotic susceptibilities(Martínez-Solano et al. 2008). Work by
Martínez-Solano et al.(2008) showed that chronic isolates from COPD patients had
similar phenotypic profiles to those from chronic CF infections, i.e. an increased
mutation rate, increased antibiotic resistance, reduced cytotoxicity, reduced motility,
and greater biofilm production. On the basis of these results it was suggested that P.
aeruginosa may cause chronic infections in COPD in much the same manner as in CF.
However, the data collected over a 10 year period by Rakhimova et al.(2009) showed
that a much lower percentage (17.9%) of the COPD population became chronically
infected with P. aeruginosa, versus 60% of CF patients (Cramer et al. 2012) and that the
majority of patients experienced short-term or sporadic infection with strains which
were sequentially replaced. Although the mechanisms of chronic infection in both COPD
and CF may be similar, due to the discrepancies in the rates of chronic infection it is
unlikely that the general population of P. aeruginosa isolates from COPD reflects the
population structure of CF isolates.
Epidemiological studies have been carried out into P. aeruginosa populations in
NCFBr, though often on a smaller scale than those undertaken in CF research. PCR
fingerprinting was been used to investigate the epidemiology of 64 P. aeruginosa
isolates collected from 17 patients over the course of a longitudinal study. Nine patients
were found to have maintained the initially acquired strain of P. aeruginosa over a period
of between 2 and 38 months. Two patients carried a single major strain which, over a
period of between 4 and 18 months, acquired minor variations in genotype. Five patients
lost their initially acquired strain within the first year of the study and underwent strain
103
replacement over a period of 2 – 22 months. One patient was found to be harbouring
two distinct strains of P. aeruginosa at once (Pujana et al. 1999).
The main conclusions of the previous chapter, in which the maintenance of P.
aeruginosa strains in NCFBr patients was investigated through the use of the array tube
(AT) genotyping system, were that the majority of NCFBr patients with chronic P.
aeruginosa infections maintained the same strain type over an extended period of time.
It was also shown using the AT genotyping data that the strains of P. aeruginosa isolated
from NCFBr patients are widely distributed in a similar population structure to that of
the general population of P. aeruginosa strains. The AT genotyping system rapidly
provides information on both the core and accessory genomes of P. aeruginosa isolates;
however this information is still limited. Many of the adaptations of P. aeruginosa to the
lung environment are provided by mutations in genes which cannot be detected by the
AT system and so the use of whole genome sequencing in this chapter allows
investigation of the diversity of P. aeruginosa isolates in far greater depth.
4.2 Aims
The aims of this chapter are to:
1. Use whole genome sequencing to investigate the diversity and
population structure of P. aeruginosa isolates from NCFBr patients
attending bronchiectasis services throughout England and Wales;
2. Use preliminary genomic analysis of whole genome sequences to
investigate the heterogeneity of P. aeruginosa populations within
chronically infected individuals with NCFBr.
4.3 Results
4.3.1 Panel of isolates
A collection of 191 isolates from 94 patients (appendix, table A5) attending 16
adult bronchiectasis centres throughout England and Wales were selected based on a
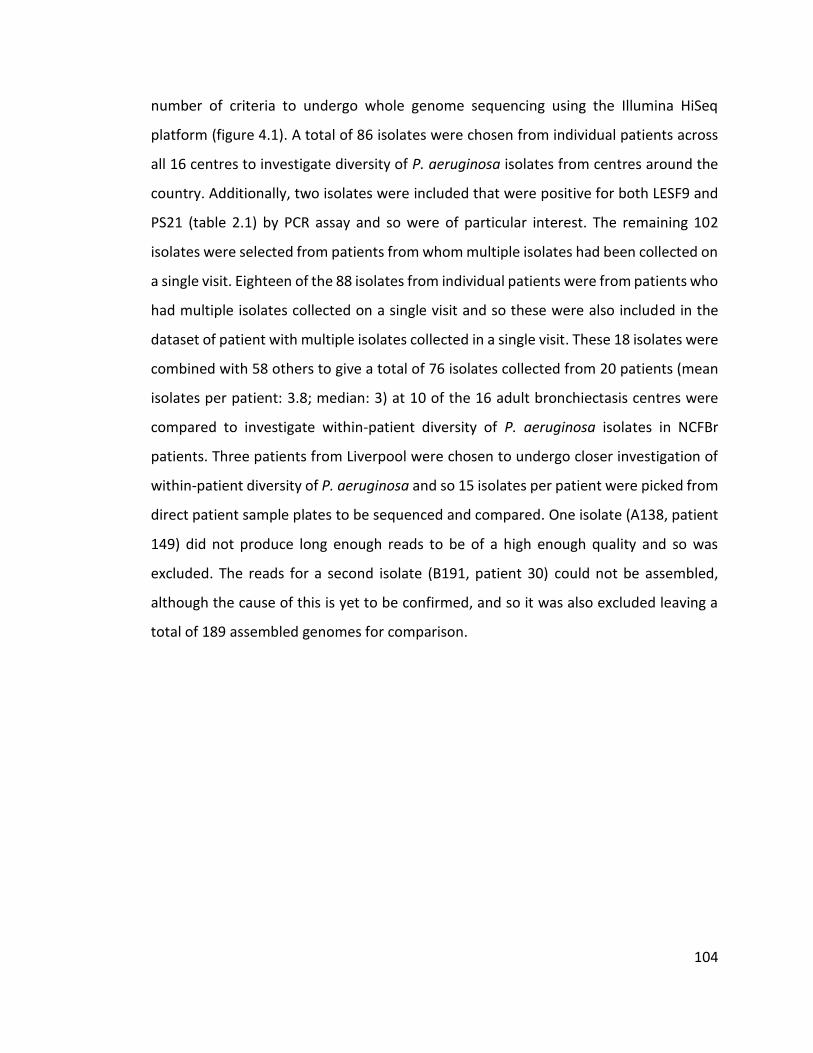
104
number of criteria to undergo whole genome sequencing using the Illumina HiSeq
platform (figure 4.1). A total of 86 isolates were chosen from individual patients across
all 16 centres to investigate diversity of P. aeruginosa isolates from centres around the
country. Additionally, two isolates were included that were positive for both LESF9 and
PS21 (table 2.1) by PCR assay and so were of particular interest. The remaining 102
isolates were selected from patients from whom multiple isolates had been collected on
a single visit. Eighteen of the 88 isolates from individual patients were from patients who
had multiple isolates collected on a single visit and so these were also included in the
dataset of patient with multiple isolates collected in a single visit. These 18 isolates were
combined with 58 others to give a total of 76 isolates collected from 20 patients (mean
isolates per patient: 3.8; median: 3) at 10 of the 16 adult bronchiectasis centres were
compared to investigate within-patient diversity of P. aeruginosa isolates in NCFBr
patients. Three patients from Liverpool were chosen to undergo closer investigation of
within-patient diversity of P. aeruginosa and so 15 isolates per patient were picked from
direct patient sample plates to be sequenced and compared. One isolate (A138, patient
149) did not produce long enough reads to be of a high enough quality and so was
excluded. The reads for a second isolate (B191, patient 30) could not be assembled,
although the cause of this is yet to be confirmed, and so it was also excluded leaving a
total of 189 assembled genomes for comparison.
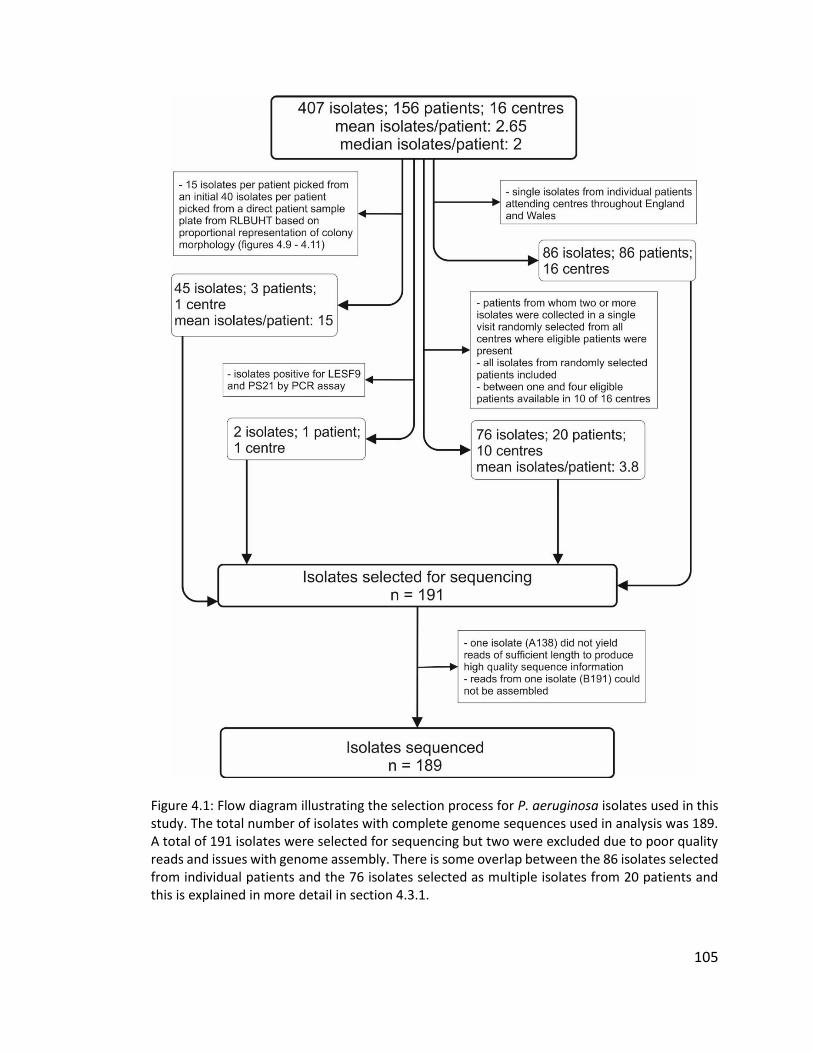
105
Figure 4.1: Flow diagram illustrating the selection process for P. aeruginosa isolates used in this study. The total number of isolates with complete genome sequences used in analysis was 189. A total of 191 isolates were selected for sequencing but two were excluded due to poor quality reads and issues with genome assembly. There is some overlap between the 86 isolates selected from individual patients and the 76 isolates selected as multiple isolates from 20 patients and this is explained in more detail in section 4.3.1.
106
4.3.1.1 Multiple isolates from three patients to investigate within patient diversity of
Pseudomonas aeruginosa
In order to investigate the possible heterogeneity of multiple isolates taken from
NCFBr patients further, isolates were picked from direct patient sample plates of three
patients attending the Liverpool adult bronchiectasis service. Patient 147 is known to
have been Pseudomonas-positive since at least 2004 and patient 148 since at least 2010.
The direct sample plate from patient 149 from which isolates were collected is the first
example of this patient culturing P. aeruginosa (2015). A summary of the isolates from
these patients is shown in table 4.1 along with the observed phenotype of the isolate
when grown on Columbia agar (Oxoid) and the ST assigned to each isolate. Isolates
collected from patient 147 were observed to have one of two phenotypes, broadly
described as “white” and “mucoid-1”, with white isolates growing in small, flat, white
colonies and mucoid-1 isolates growing in larger colonies with typical mucoid
appearance (figure 4.2). Isolates from patient 148 were also observed to have one of
two phenotypes, broadly described here as “mucoid-2” and “brown”. The mucoid-2
isolates exhibited blue-green pigmentation and had a typical mucoid appearance.
Isolates exhibiting the brown phenotype grew in small, brown colonies (figure 4.3). Only
one phenotype was observed for isolates from patient 149, also described as “brown”
and matching the description above (figure 4.4). The intention of recording observed
phenotypes was to compare variations in phenotype with possible genomic variation
between isolates. All 15 isolates from patient 147 were assigned ST17 and cluster closely
together on the phylogenetic tree (figure 4.6), along with four isolates from patient 148
and two isolates from patients in other centres. ST17 has been previously identified as
clone C and so multiple patients with isolates with this ST are unlikely to have
participated in patient-to-patient transmission as it is far more likely that the
environmentally abundant strain was acquired independently by these patients.
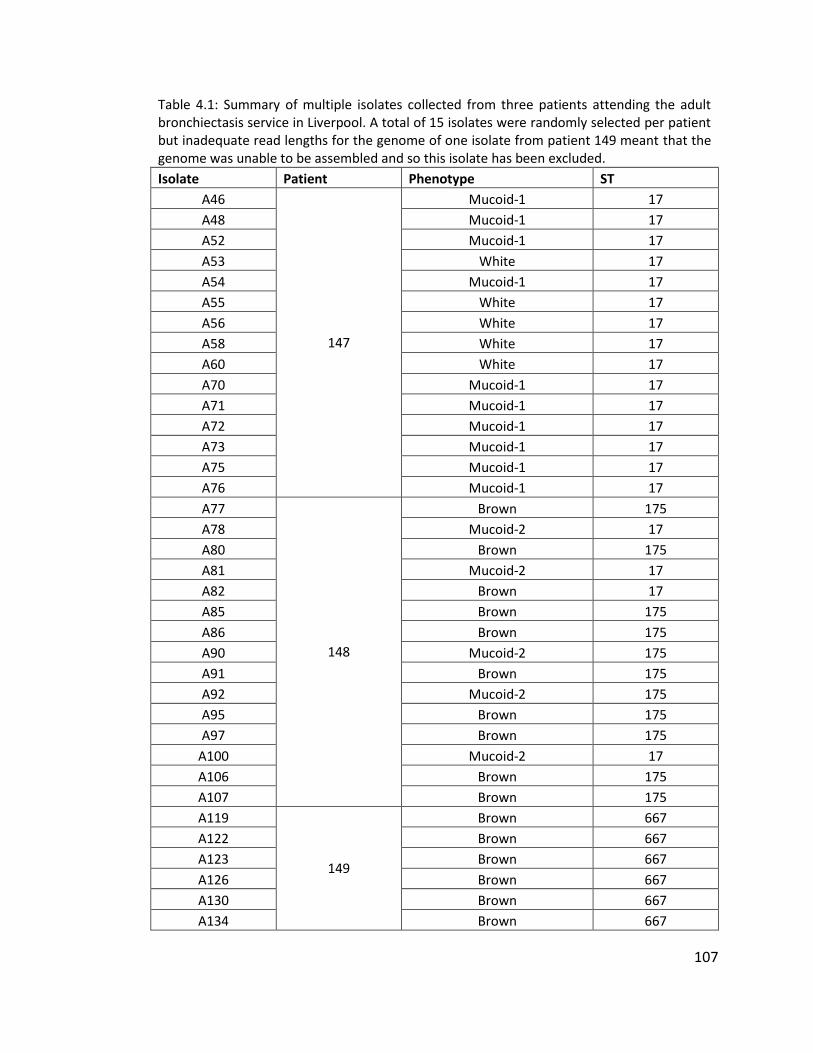
107
Table 4.1: Summary of multiple isolates collected from three patients attending the adult bronchiectasis service in Liverpool. A total of 15 isolates were randomly selected per patient but inadequate read lengths for the genome of one isolate from patient 149 meant that the genome was unable to be assembled and so this isolate has been excluded.
Isolate Patient Phenotype ST
A46
147
Mucoid-1 17
A48 Mucoid-1 17
A52 Mucoid-1 17
A53 White 17
A54 Mucoid-1 17
A55 White 17
A56 White 17
A58 White 17
A60 White 17
A70 Mucoid-1 17
A71 Mucoid-1 17
A72 Mucoid-1 17
A73 Mucoid-1 17
A75 Mucoid-1 17
A76 Mucoid-1 17
A77
148
Brown 175
A78 Mucoid-2 17
A80 Brown 175
A81 Mucoid-2 17
A82 Brown 17
A85 Brown 175
A86 Brown 175
A90 Mucoid-2 175
A91 Brown 175
A92 Mucoid-2 175
A95 Brown 175
A97 Brown 175
A100 Mucoid-2 17
A106 Brown 175
A107 Brown 175
A119
149
Brown 667
A122 Brown 667
A123 Brown 667
A126 Brown 667
A130 Brown 667
A134 Brown 667
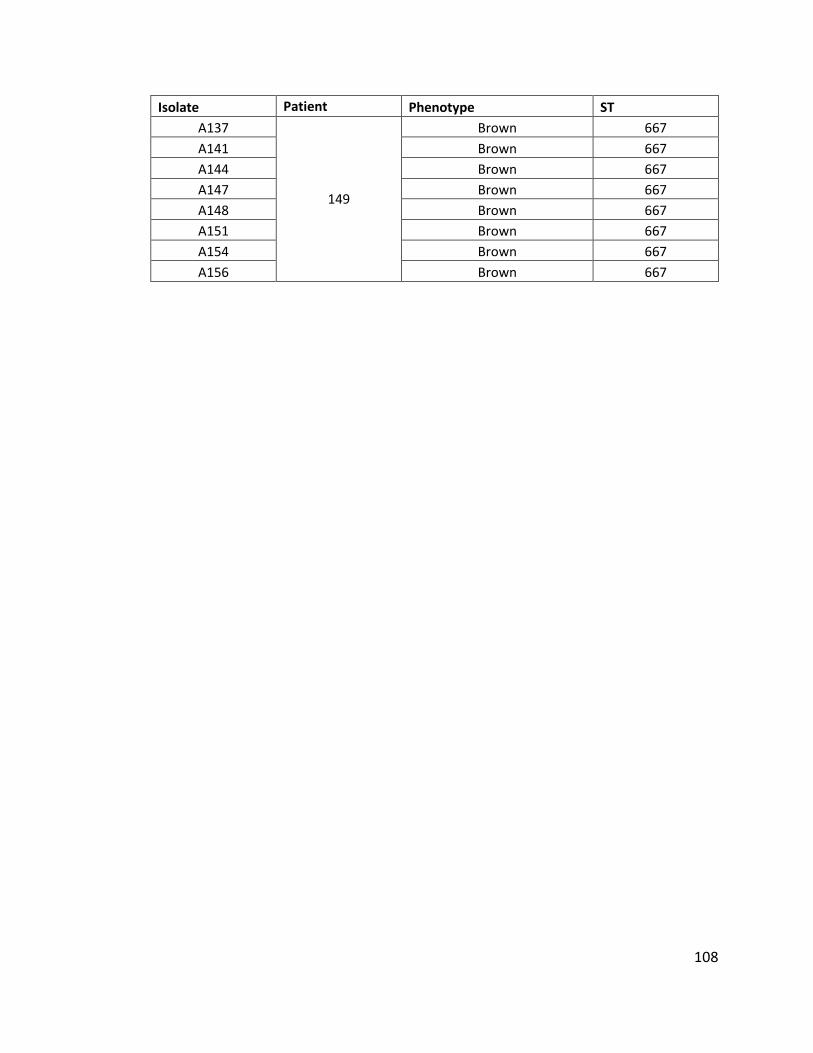
108
Isolate Patient Phenotype ST
A137
149
Brown 667
A141 Brown 667
A144 Brown 667
A147 Brown 667
A148 Brown 667
A151 Brown 667
A154 Brown 667
A156 Brown 667
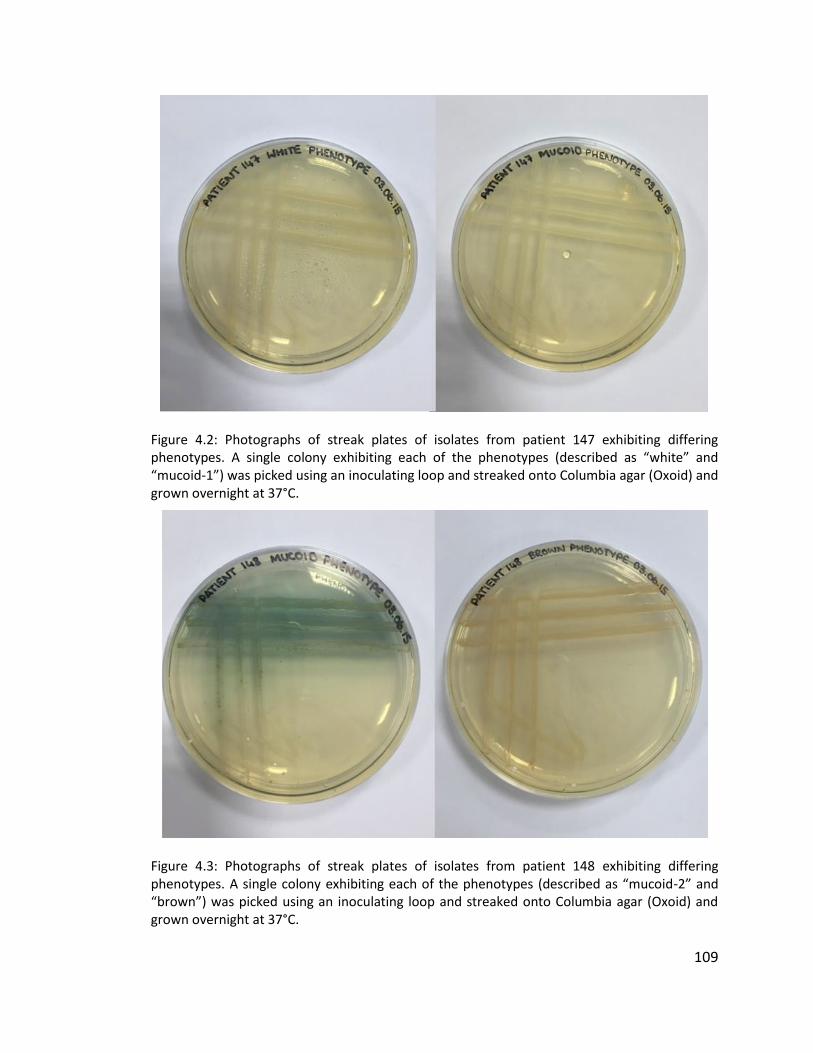
109
Figure 4.2: Photographs of streak plates of isolates from patient 147 exhibiting differing phenotypes. A single colony exhibiting each of the phenotypes (described as “white” and “mucoid-1”) was picked using an inoculating loop and streaked onto Columbia agar (Oxoid) and grown overnight at 37°C.
Figure 4.3: Photographs of streak plates of isolates from patient 148 exhibiting differing phenotypes. A single colony exhibiting each of the phenotypes (described as “mucoid-2” and “brown”) was picked using an inoculating loop and streaked onto Columbia agar (Oxoid) and grown overnight at 37°C.
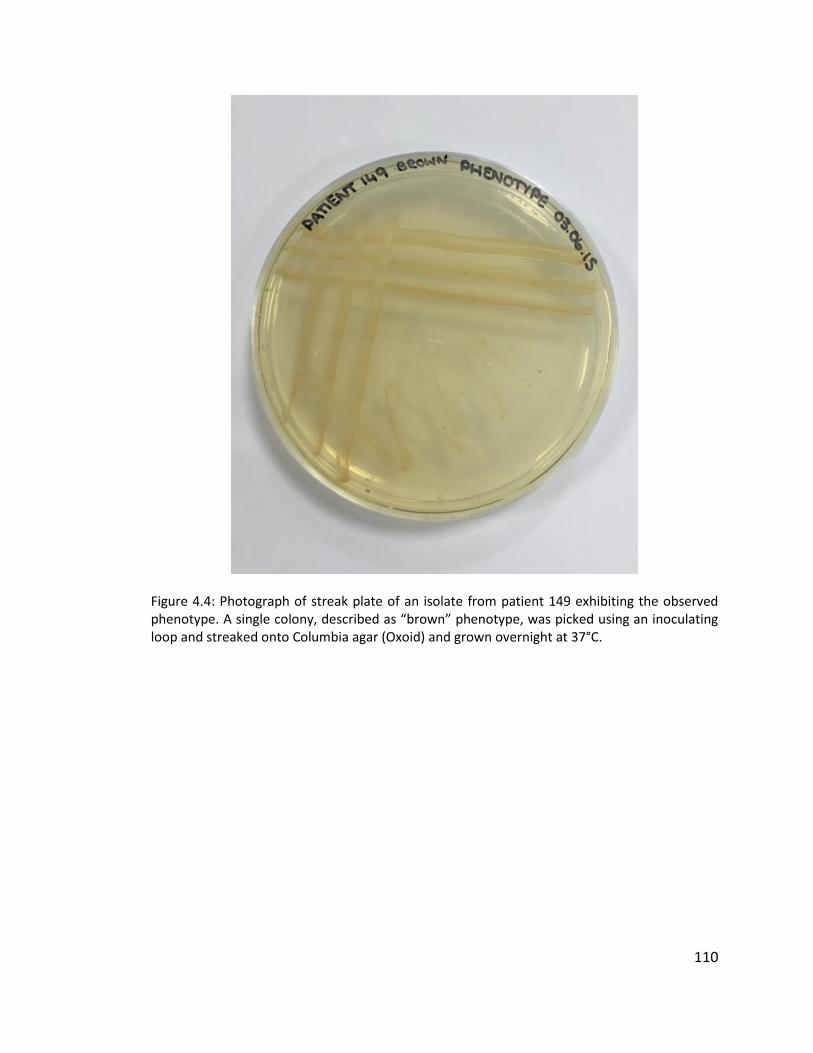
110
Figure 4.4: Photograph of streak plate of an isolate from patient 149 exhibiting the observed phenotype. A single colony, described as “brown” phenotype, was picked using an inoculating loop and streaked onto Columbia agar (Oxoid) and grown overnight at 37°C.
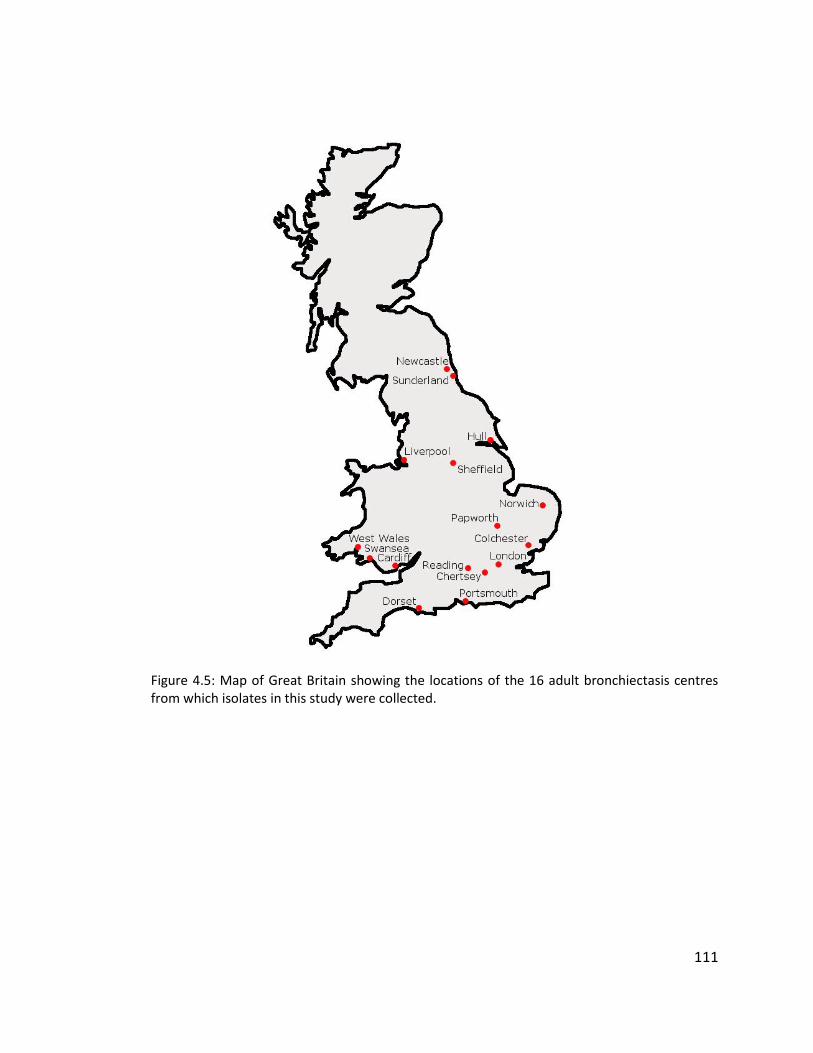
111
Figure 4.5: Map of Great Britain showing the locations of the 16 adult bronchiectasis centres from which isolates in this study were collected.
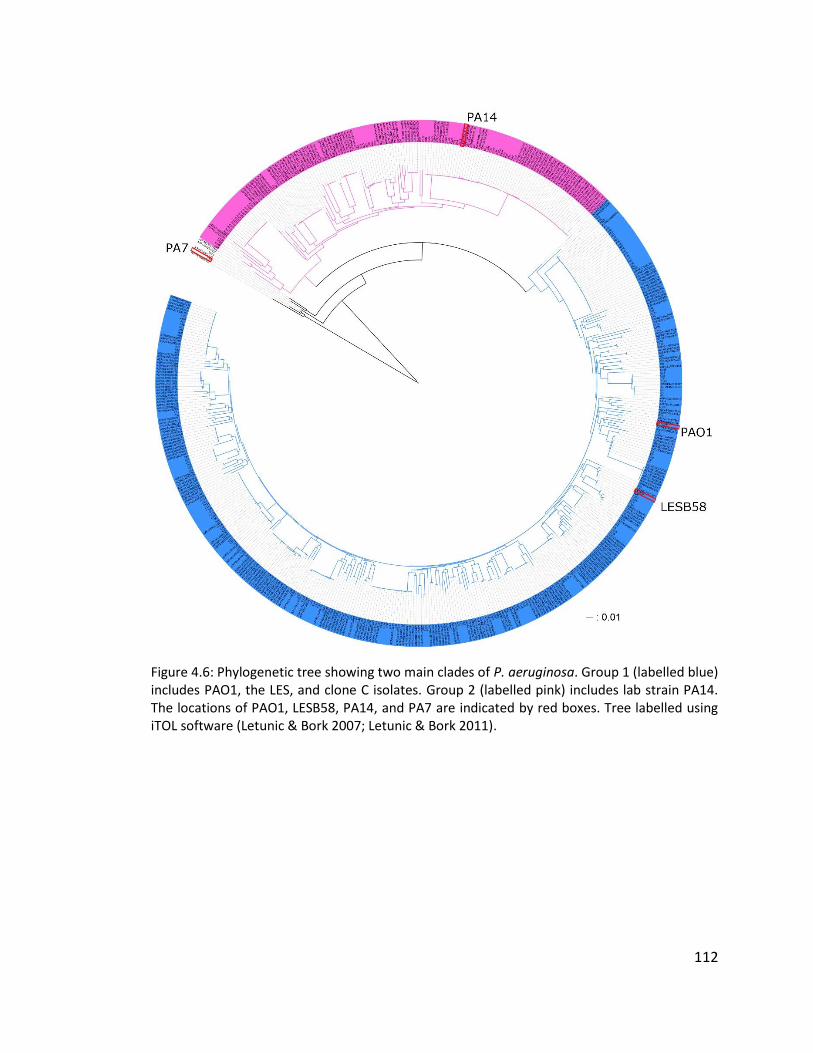
112
Figure 4.6: Phylogenetic tree showing two main clades of P. aeruginosa. Group 1 (labelled blue) includes PAO1, the LES, and clone C isolates. Group 2 (labelled pink) includes lab strain PA14. The locations of PAO1, LESB58, PA14, and PA7 are indicated by red boxes. Tree labelled using iTOL software (Letunic & Bork 2007; Letunic & Bork 2011).
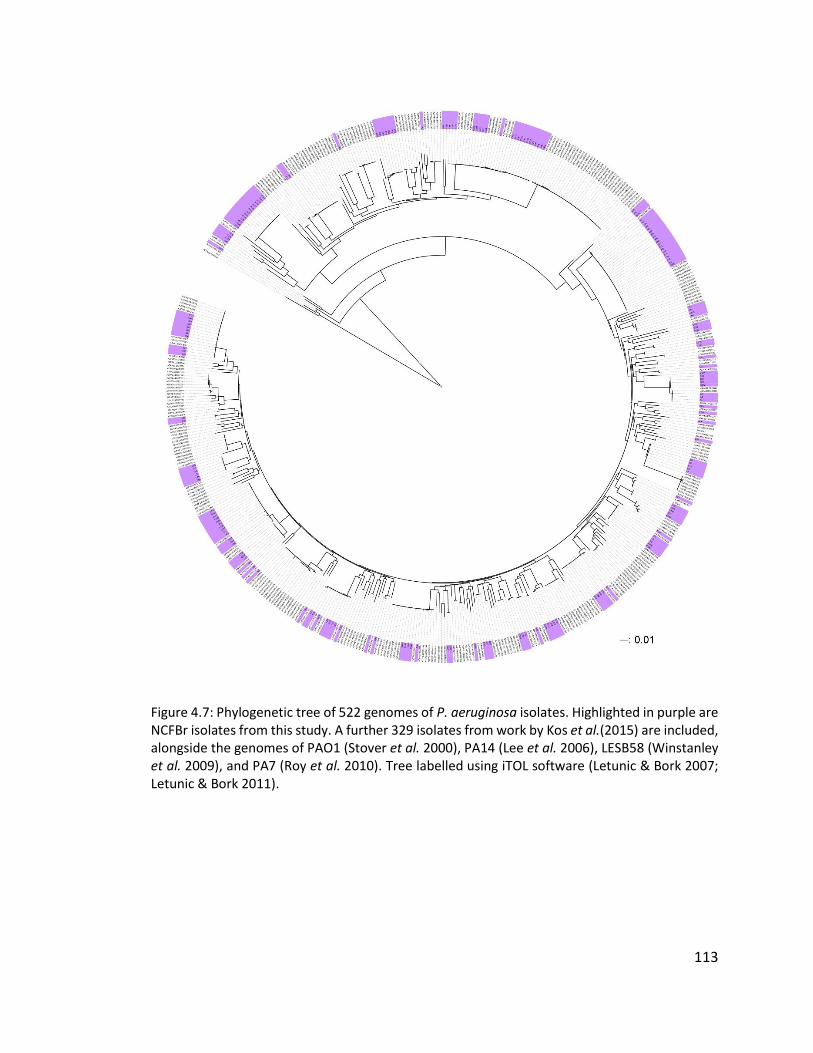
113
Figure 4.7: Phylogenetic tree of 522 genomes of P. aeruginosa isolates. Highlighted in purple are NCFBr isolates from this study. A further 329 isolates from work by Kos et al.(2015) are included, alongside the genomes of PAO1 (Stover et al. 2000), PA14 (Lee et al. 2006), LESB58 (Winstanley et al. 2009), and PA7 (Roy et al. 2010). Tree labelled using iTOL software (Letunic & Bork 2007; Letunic & Bork 2011).
114
4.3.4 Distribution of non-cystic fibrosis bronchiectasis isolates among the general
population
Figure 4.7 shows a core genome SNP phylogeny based on all 189 isolates from
this study, labelled in purple, distributed on a tree of P. aeruginosa isolates which
includes an additional 329 genomes from research into the P. aeruginosa resistome by
Kos et al.(2015), the genomes of laboratory strains PAO1 and PA14 (Stover et al. 2000;
Lee et al. 2006), LESB58 (Winstanley et al. 2009), and the taxonomic outlier PA7 (Roy et
al. 2010). Small groups of NCFBr isolate genomes appear to cluster together, but
generally they are widely distributed across the tree. Figure 4.6 shows two main clades
of isolates generally known as group 1, including PAO1, LES, and clone C, and group 2,
which includes PA14. P. aeruginosa strain PA7 is described as a taxonomic outlier (Roy
et al. 2010) and is shown as such in figure 4.6 as it falls within neither of the two main
clades.
4.3.5 Distribution and population structure of isolates from non-cystic fibrosis
bronchiectasis patients in England and Wales
Figure 4.8a shows the distribution of the 88 isolates selected from individual
patients at bronchiectasis centres in England and Wales, colour-coded by centre. The
isolates from all centres are widely distributed throughout the tree and there is little
evidence of extensive clustering of isolates from the same centre. This suggests that
transmission between patients in the same centre does not occur regularly, though the
sample sizes for each centre are relatively small. In nine of the 16 centres there are
examples of pairs of isolates clustering next to one another on the tree, though it is likely
that this is due to independent acquisition of strains from the environment, as opposed
to transmission events. Isolates from 12 of the 16 centres were present in both the group
1 and group 2 clades (figure 4.6) which indicates a large amount of genetic diversity.
Isolates from four centres (Reading, Cardiff, Norfolk & Norwich, and Sunderland) were
found to only be present in the group 1 clade, which also includes PAO1, LES, and clone
115
C. Given that the group 1 clade is much larger than the group 2 clade (figure 4.6) it is
unsurprising that some centres have isolates only from this group. There was only one
isolate from an individual patient available from the Cardiff centre, so although this
isolate can be compared in its relatedness to isolates from other centres it is not possible
to investigate the diversity of isolates within this centre.
A small number of isolates cluster together as part of a distinct branch in group
2 (figure 4.8.b). Isolates B199 (Newcastle) and C119 (Hull) appear closest together in this
part of the tree, and are apparently more closely related than C119 and C124 despite
both isolates being collected from patients in Hull. The remainder of the isolates that are
part of this group are from patient 149 (Liverpool). Isolate B113 (Newcastle) does not
appear as part of either of the main clades or as part of a cluster (figure 4.8b) and is the
closest of the NCFBr isolates to the taxonomic outlier PA7. However, further analysis of
B113 in comparison with PA7 with read mapping and genome analysis toolkit (GATK)
revealed that the two are not closely related, with a total difference of 262 039 SNPs and
18 305 indels between the two genomes.
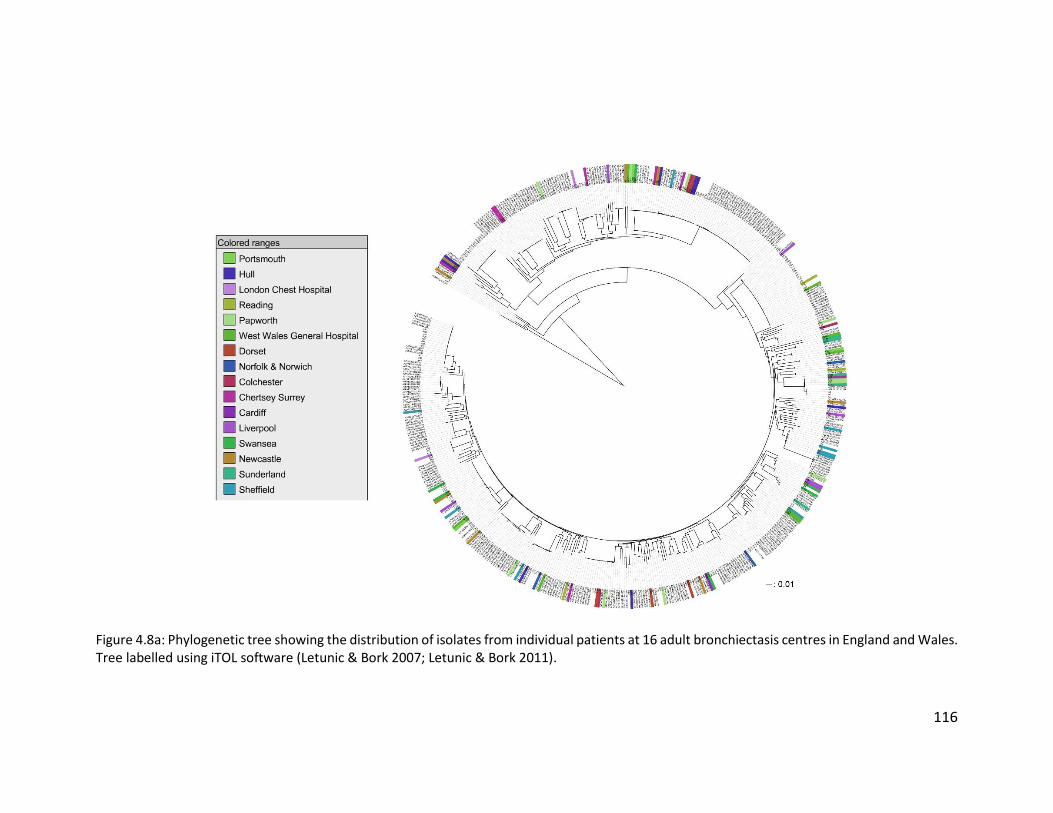
116
Figure 4.8a: Phylogenetic tree showing the distribution of isolates from individual patients at 16 adult bronchiectasis centres in England and Wales. Tree labelled using iTOL software (Letunic & Bork 2007; Letunic & Bork 2011).
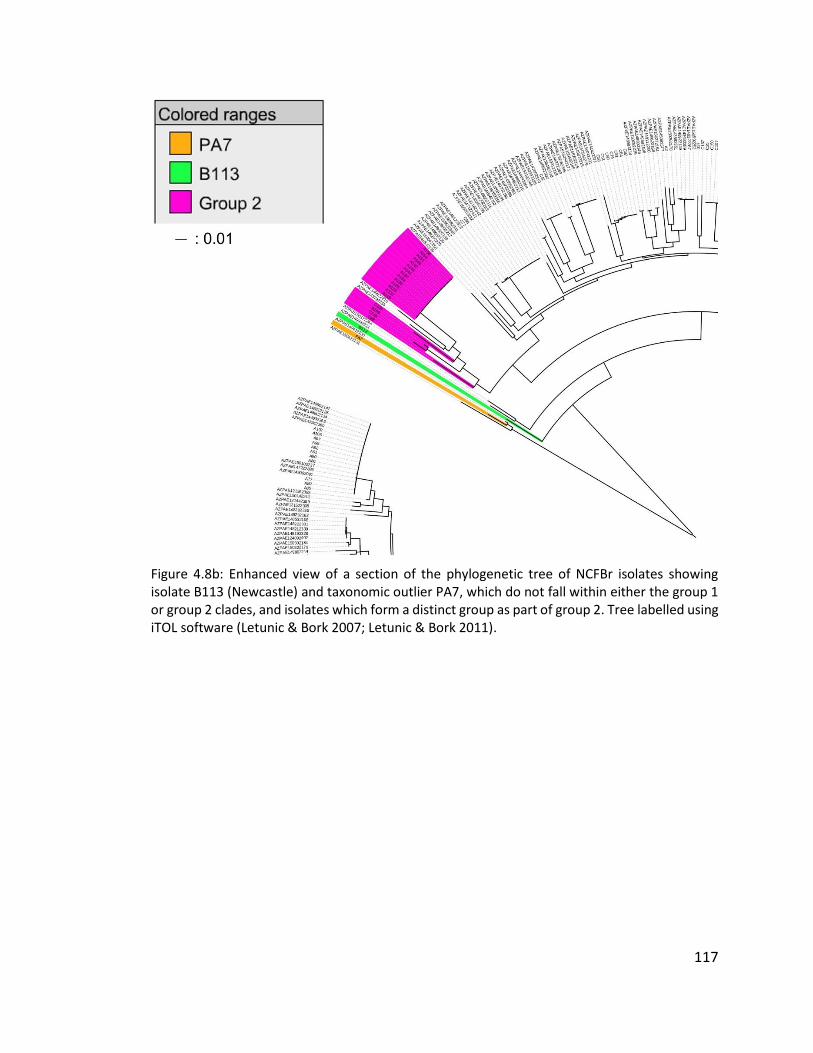
117
Figure 4.8b: Enhanced view of a section of the phylogenetic tree of NCFBr isolates showing isolate B113 (Newcastle) and taxonomic outlier PA7, which do not fall within either the group 1 or group 2 clades, and isolates which form a distinct group as part of group 2. Tree labelled using iTOL software (Letunic & Bork 2007; Letunic & Bork 2011).
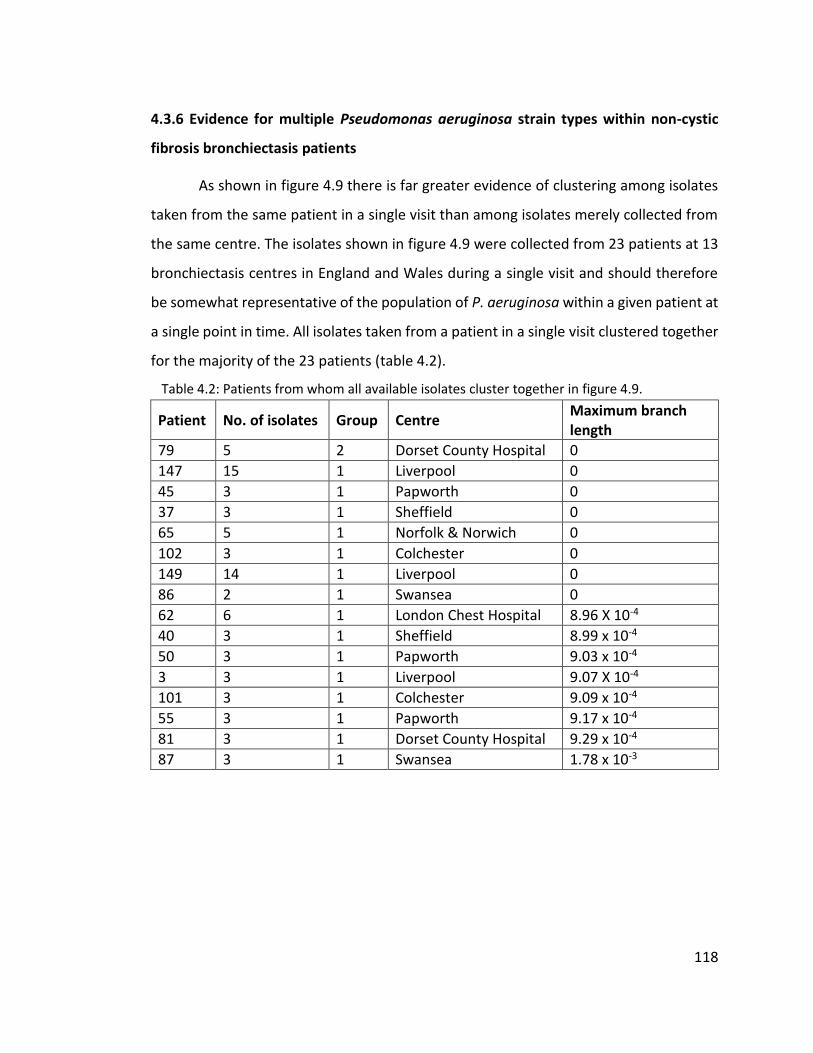
118
4.3.6 Evidence for multiple Pseudomonas aeruginosa strain types within non-cystic
fibrosis bronchiectasis patients
As shown in figure 4.9 there is far greater evidence of clustering among isolates
taken from the same patient in a single visit than among isolates merely collected from
the same centre. The isolates shown in figure 4.9 were collected from 23 patients at 13
bronchiectasis centres in England and Wales during a single visit and should therefore
be somewhat representative of the population of P. aeruginosa within a given patient at
a single point in time. All isolates taken from a patient in a single visit clustered together
for the majority of the 23 patients (table 4.2).
Table 4.2: Patients from whom all available isolates cluster together in figure 4.9.
Patient No. of isolates Group Centre Maximum branch length
79 5 2 Dorset County Hospital 0
147 15 1 Liverpool 0
45 3 1 Papworth 0
37 3 1 Sheffield 0
65 5 1 Norfolk & Norwich 0
102 3 1 Colchester 0
149 14 1 Liverpool 0
86 2 1 Swansea 0
62 6 1 London Chest Hospital 8.96 X 10⁻⁴
40 3 1 Sheffield 8.99 x 10⁻⁴
50 3 1 Papworth 9.03 x 10⁻⁴
3 3 1 Liverpool 9.07 X 10⁻⁴
101 3 1 Colchester 9.09 x 10⁻⁴
55 3 1 Papworth 9.17 x 10⁻⁴
81 3 1 Dorset County Hospital 9.29 x 10⁻⁴
87 3 1 Swansea 1.78 x 10⁻³
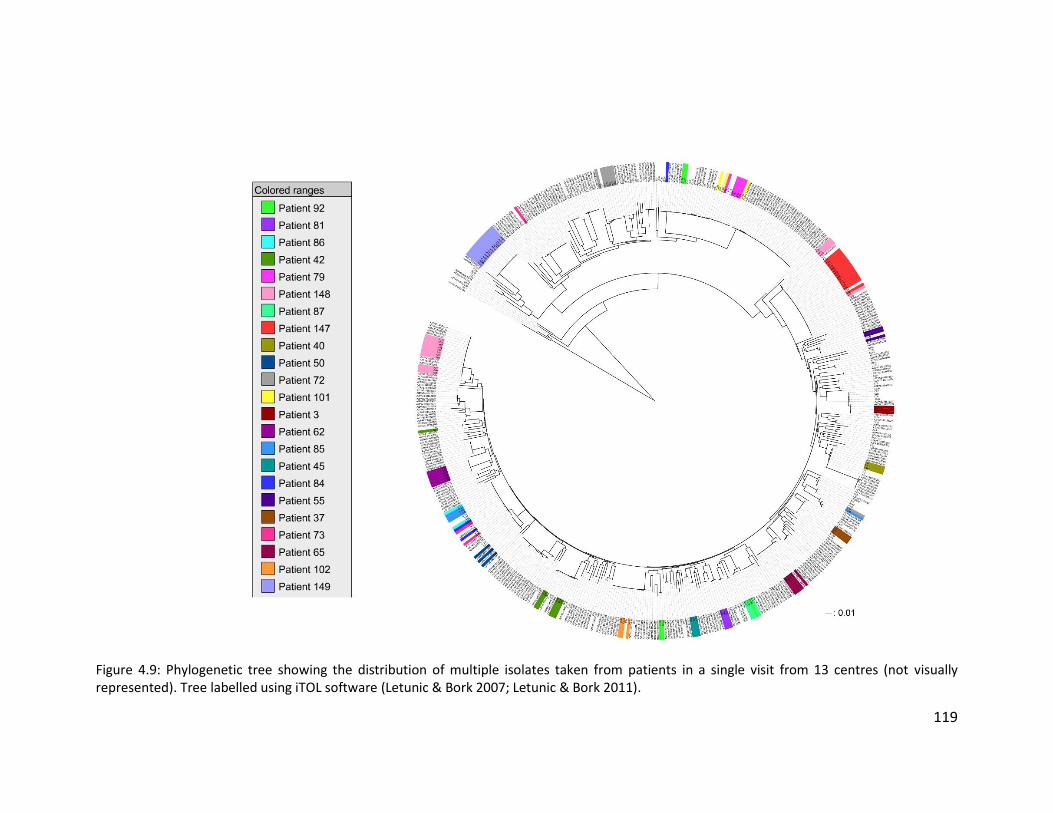
119
Figure 4.9: Phylogenetic tree showing the distribution of multiple isolates taken from patients in a single visit from 13 centres (not visually represented). Tree labelled using iTOL software (Letunic & Bork 2007; Letunic & Bork 2011).
120
Multiple isolates collected from 7 patients did not cluster together (figure 4.9). A
total of five isolates were collected from patient 92 (Hull) and these are dispersed across
the tree. Three of the isolates are part of the group 1 clade; two of these are closely
related (branch length: 0) but the third (C129) is separate and is more closely related to
three isolates from a patient from Swansea (patient 87). The remaining two isolates from
patient 92 are part of the PA14 clonal complex in group 2. Six isolates were collected
from patient 42 (Sheffield) and five of these cluster closely together; three of these have
a branch length of 0 and two are slightly further away from these on a branch with a
length of 1.75 x 10⁻³. The remaining isolate from patient 42 is located much further away
on the tree and is in fact more closely related to an isolate from another patient at
Sheffield (patient 41). A total of seven isolates were collected from patient 72 (Chertsey,
Surrey); six of these cluster relatively closely together in group 2, alongside an isolate
from a patient from the London Chest Hospital (patient 63). The final isolate from patient
72 is very distant from these first six isolates and is part of the group 1 clade; isolate C78
clusters with two isolates from two different patients from Swansea. Three isolates were
collected from patient 84 (Swansea); two of these isolates are closely related and a part
of group 1, though do not appear next to one another on the phylogenetic tree. The
remaining isolate is part of the PA14 clonal complex in group 2. Of the three isolates
collected from patient 73 (Chertsey, Surrey) two cluster closely together, although not
next to one another, in group 1 and the third falls in group 2, most closely related to a
single isolate from another patient from the same centre (patient 71). All four isolates
collected from patient 85 (Swansea) are found in the group 1 clade; three are closely
related and found next to one another, the final isolate is distantly related to these and
is most closely related to an isolate from another patient at the same centre and an
isolate from a patient from the Chertsey, Surrey centre.
Patient 148 was one of three patients from Liverpool from whom 15 isolates
were selected from a direct culture plate. Isolates from patients 147 and 149 cluster by
patient; all 15 isolates from patient 147 cluster together as part of group 1; all isolates
from patient 149 cluster together as part of group 2. Eleven isolates from patient 148
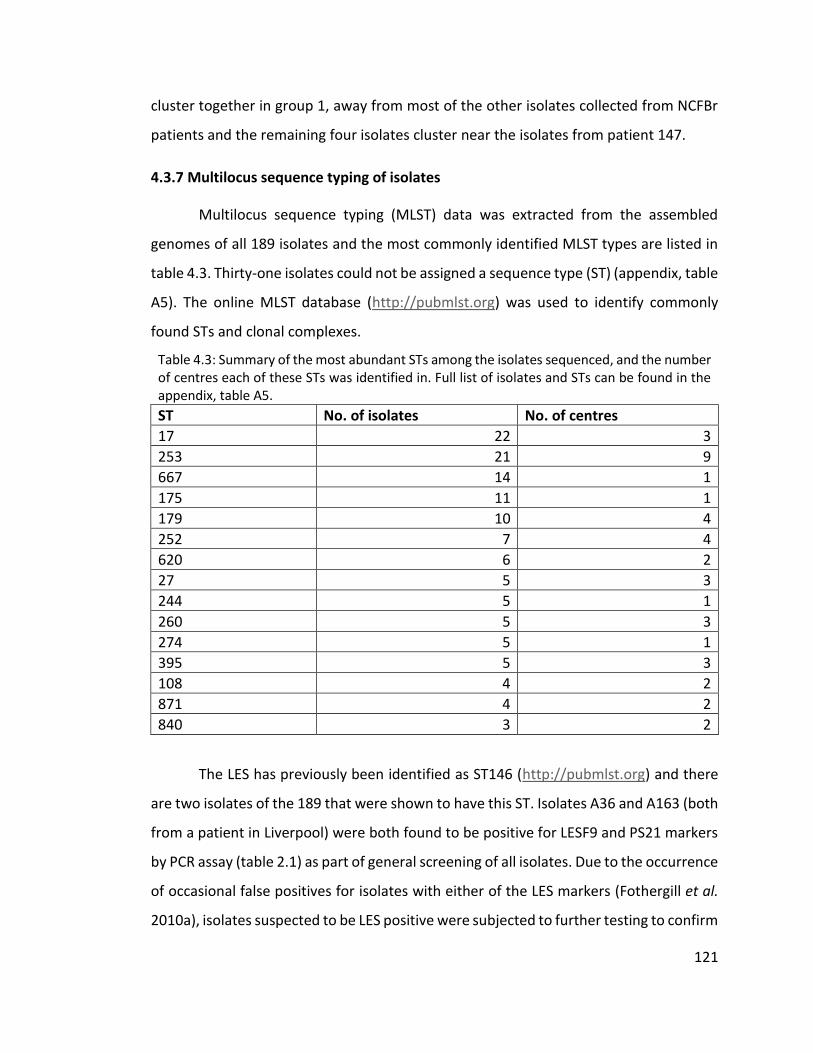
121
cluster together in group 1, away from most of the other isolates collected from NCFBr
patients and the remaining four isolates cluster near the isolates from patient 147.
4.3.7 Multilocus sequence typing of isolates
Multilocus sequence typing (MLST) data was extracted from the assembled
genomes of all 189 isolates and the most commonly identified MLST types are listed in
table 4.3. Thirty-one isolates could not be assigned a sequence type (ST) (appendix, table
A5). The online MLST database (http://pubmlst.org) was used to identify commonly
found STs and clonal complexes.
Table 4.3: Summary of the most abundant STs among the isolates sequenced, and the number of centres each of these STs was identified in. Full list of isolates and STs can be found in the appendix, table A5.
ST No. of isolates No. of centres
17 22 3
253 21 9
667 14 1
175 11 1
179 10 4
252 7 4
620 6 2
27 5 3
244 5 1
260 5 3
274 5 1
395 5 3
108 4 2
871 4 2
840 3 2
The LES has previously been identified as ST146 (http://pubmlst.org) and there
are two isolates of the 189 that were shown to have this ST. Isolates A36 and A163 (both
from a patient in Liverpool) were both found to be positive for LESF9 and PS21 markers
by PCR assay (table 2.1) as part of general screening of all isolates. Due to the occurrence
of occasional false positives for isolates with either of the LES markers (Fothergill et al.
2010a), isolates suspected to be LES positive were subjected to further testing to confirm
122
their status. This included a PCR assay for pyoverdine receptor (table 2.1). Isolate A36
was confirmed as LES as it was pyoverdine receptor type III positive (the rarest of the
three types). Isolate A163 was collected late in the work and so following the initial
positive result for both LES markers was submitted for whole genome sequencing as
means of confirmation. Both LES isolates (A36 and A163) were compared to LESB58 (high
quality, relevant reference genome) using GATK which revealed that both LES isolates
were closely related to LESB58. Isolate A36 differed from LESB58 by 109 SNPs and 22
indels, and isolate A163 differed from LESB58 by 113 SNPs and 25 indels. A36 and A163
shared 95 of these SNPs, whilst 14 were unique to A36 and 18 to A163.
Isolates from patients 79 and 101 cluster closely together despite being collected
from patients in Dorset and Colchester respectively. These isolates also cluster with a
number of isolates from other patients at 7 other centres and PA14 (figure 4.10). All
isolates on the highlighted branch of the tree in figure 4.10 have the ST253 assigned by
MLST of their genomes.
Clone C is commonly found in the environment and is associated with ST17, as
well as with ST142 and ST14 (Curran et al. 2004). A total of 22 isolates, from 5 patients
at 3 centres, were found to be ST17 (figure 4.11). All 15 isolates collected from patient
147 (Liverpool) were found to be ST17. Four isolates from patient 148, also from
Liverpool, were found to be ST17 but due to the prevalence of clone C in the
environment it is more probable that these patients acquired strains of P. aeruginosa
independently rather than this being an example of a transmission event. The remaining
11 isolates from patient 148 are all ST175 which has been identified on numerous
occasions from patients in France and Spain (http://pubmlst.org).
All 14 isolates collected from patient 149 (Liverpool) were shown to be ST667
which has not been previously identified in the PubMLST database (http://pubmlst.org).
The isolates cluster together as part of group 2 but are only distantly related to PA14
(figure 4.9). Figure 4.12 shows the other isolates from this study which cluster most
closely to the isolates from patient 149, along with the STs assigned to them by MLST.
Although the leaves appear relatively close to one another on the tree the branch

123
lengths indicate that the isolates are not closely related and are more likely to cluster
together due to genetic differences from the majority of other isolates on the tree.
Isolates C88 (Chertsey, Surrey) and C124 (Hull) were assigned STs 1251 and 1753
respectively and occupy their own branches on the tree. Despite not being assigned a
ST, isolate C119 (Hull) clusters closely with isolate B199 (Newcastle) which was
designated ST1182.
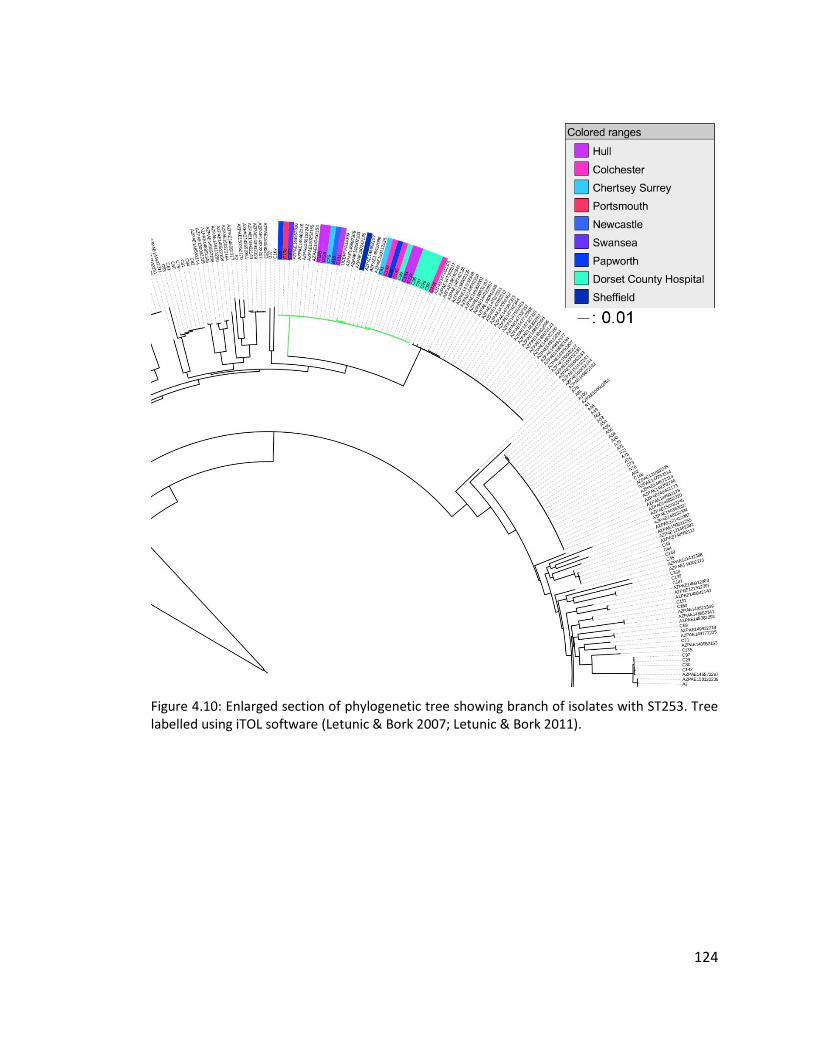
124
Figure 4.10: Enlarged section of phylogenetic tree showing branch of isolates with ST253. Tree labelled using iTOL software (Letunic & Bork 2007; Letunic & Bork 2011).
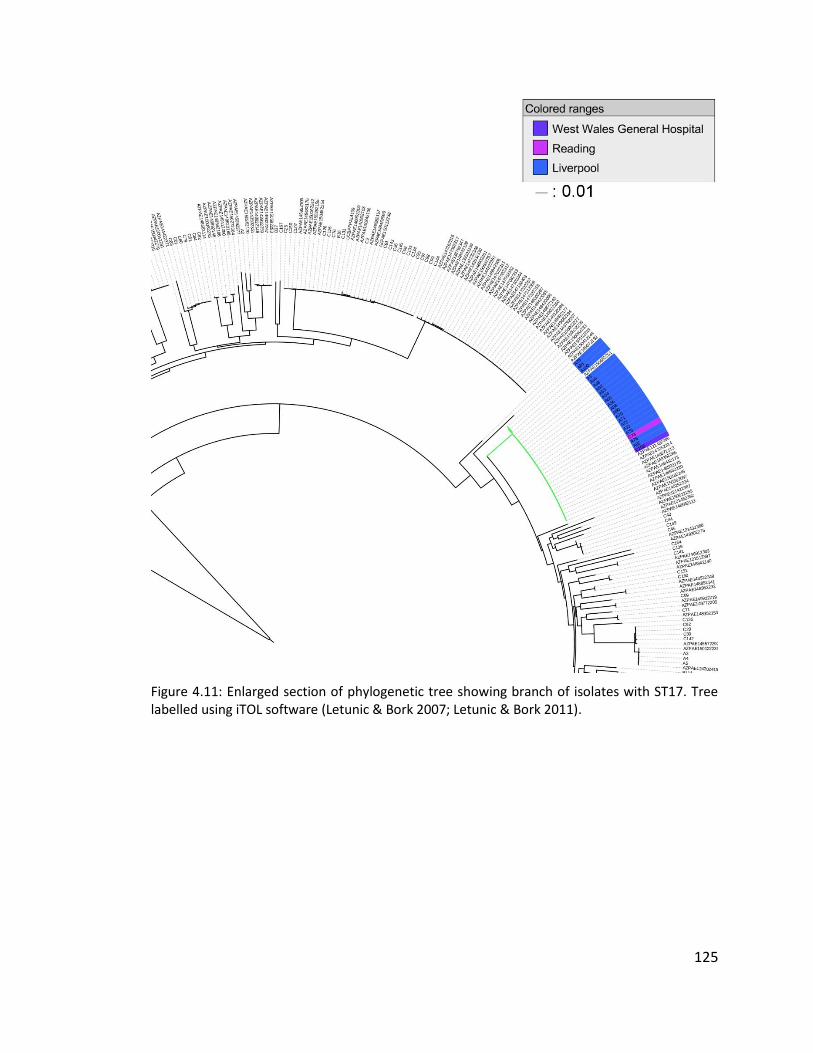
125
Figure 4.11: Enlarged section of phylogenetic tree showing branch of isolates with ST17. Tree labelled using iTOL software (Letunic & Bork 2007; Letunic & Bork 2011).
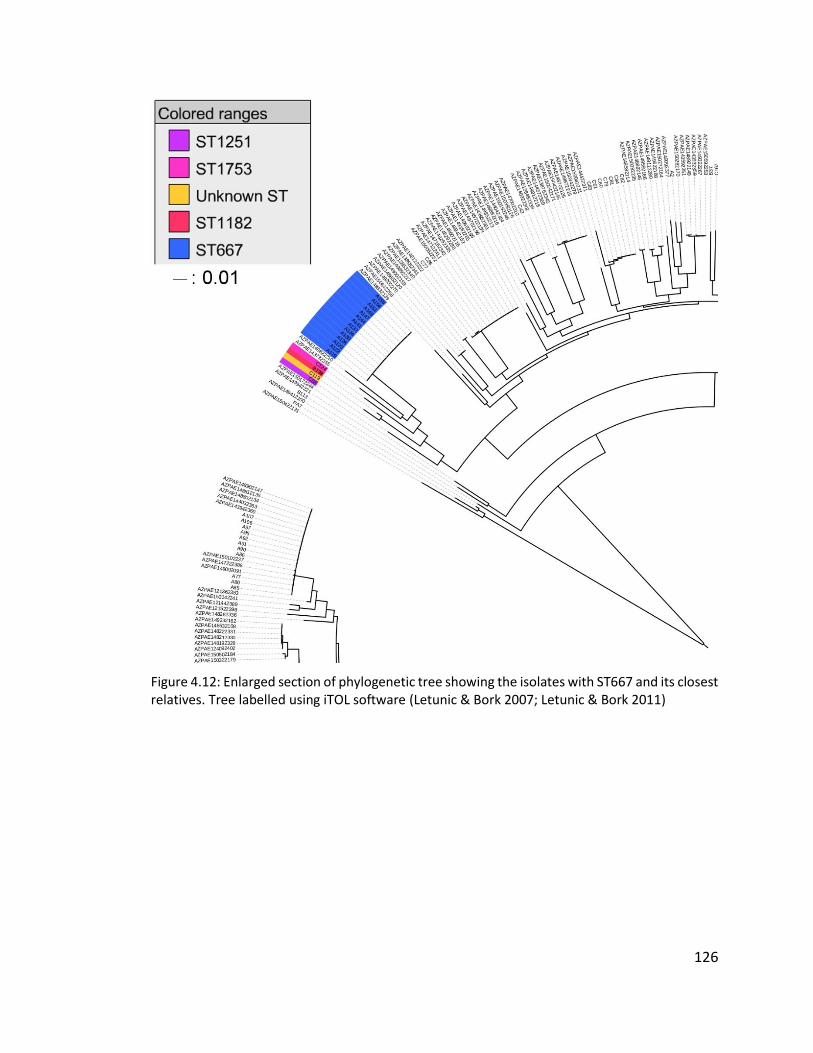
126
Figure 4.12: Enlarged section of phylogenetic tree showing the isolates with ST667 and its closest relatives. Tree labelled using iTOL software (Letunic & Bork 2007; Letunic & Bork 2011)
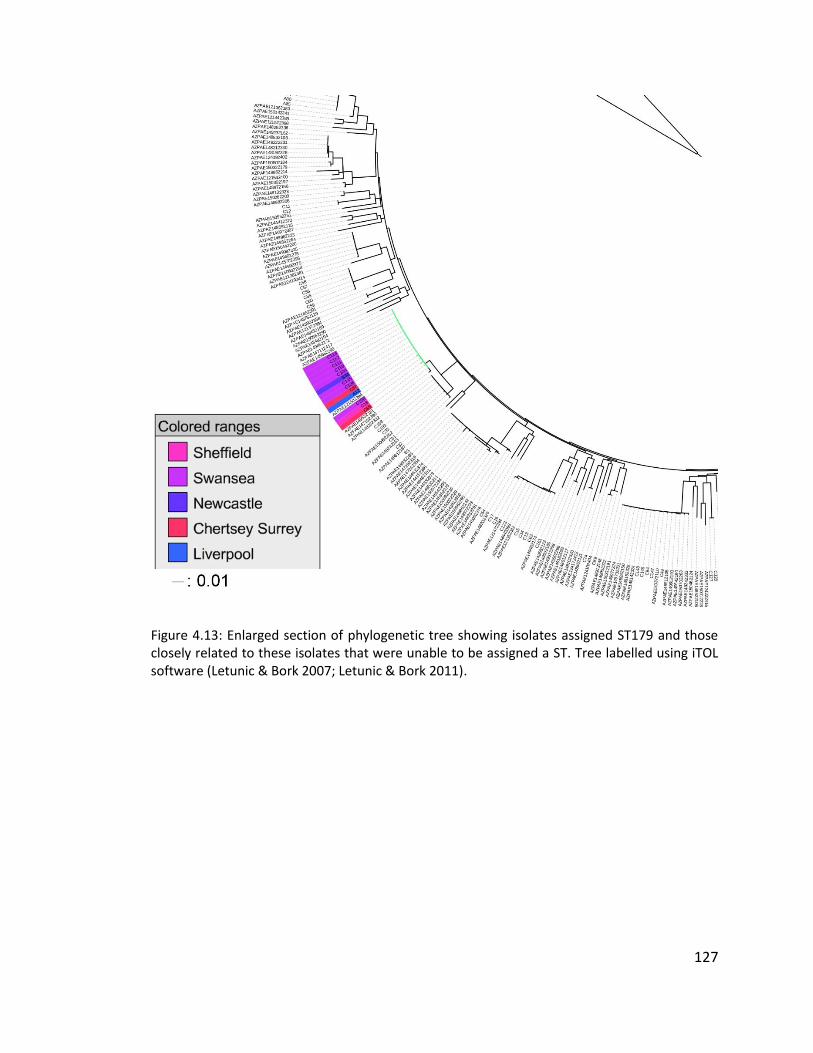
127
Figure 4.13: Enlarged section of phylogenetic tree showing isolates assigned ST179 and those closely related to these isolates that were unable to be assigned a ST. Tree labelled using iTOL software (Letunic & Bork 2007; Letunic & Bork 2011).
128
4.4 Discussion
4.4.1 Diversity of Pseudomonas aeruginosa isolates from adult bronchiectasis centres
in England and Wales
Little is known about the population structure of P. aeruginosa isolates from
NCFBr patients. Work has been previously undertaken to investigate the wider
population of P. aeruginosa isolates from patient infections across the UK, including
those in CF patients. Combinations of sequenced-based typing techniques have been
used to attempt to elucidate the population structure of P. aeruginosa. It is generally
agreed that P. aeruginosa has a non-clonal population structure punctuated by closely
related genotypes or clonal complexes (Pirnay et al. 2002; Pirnay et al. 2009; Curran et
al. 2004). Large-scale studies of population structure can be subject to bias, in that many
databases include over-sampling of isolates from highly studied regions or clinical
manifestations of P. aeruginosa (i.e. CF isolates) and so this is important to take into
consideration when making statements about the abundance or relatedness of strains.
In broad terms, strains of P. aeruginosa can be divided into three genetically distinct
groups: group 1, containing PAO1, LESB58, and clone C strains; group 2, containing PA14
clonal complex; and group 3, containing the taxonomic outlier PA7 (Stewart et al. 2014;
Freschi et al. 2015). Work by the International Pseudomonas aeruginosa Consortium
(IPC) suggests that group 1 strains are naturally more abundant than strains falling in
group 2 (Freschi et al. 2015) and this is reflected in the results of this work (figure 4.4).
Due to the clinical origin of isolates from this study and much of the IPC cohort (Freschi
et al. 2015) it is possible that sampling bias implies that the abundance of group 1
isolates is naturally higher, especially given that conflicting evidence has been provided
using the AT typing method by Wiehlmann et al.(2007).
Using the STs assigned to isolates and the P. aeruginosa MLST database
(http://pubmlst.org) it is possible to investigate the occurrence of commonly reported
strains within the NCFBr population in England and Wales. Within each of the two groups
129
there are several previously reported STs that have often been identified in multiple
countries around the world, and from varying sources. In general the NCFBr isolates in
group 1 do not form closely related clusters. Two STs with multiple isolates from
bronchiectasis centres around the UK were identified. A group of closely related isolates
were identified though closer examination of the phylogenetic tree in figure 4.8a. This
group consisted of 13 isolates, 10 of which had been assigned ST179; the remaining three
isolates could not be assigned a ST. Isolates previously assigned this ST in the P.
aeruginosa MLST database (http://pubmlst.org) have been collected mainly from
Canada and Australia but also from the UK and Spain, and mainly from sputum samples.
The isolates in this closely related group (figure 4.13) were collected from five different
centres, with the majority (eight) coming from the Swansea centre. These eight isolates
were collected from four different patients. The second closely related group of isolates
were assigned ST17 which has been previously associated with clone C isolates (Curran
et al. 2004). A total of 21 isolates were assigned ST17; 19 of these were isolated from
patients in Liverpool, and 15 were from one patient. The two remaining isolates were
collected from Reading and West Wales General hospital (figure 4.11). There have been
several other STs associated with clone C strains of P. aeruginosa but none of these were
identified among these NCFBr isolates (Curran et al. 2004).
Investigation of closely related isolates in group 2 (figure 4.10) reveals two main
clusters of closely related isolates which share a common ancestor, although one of
these groups is only populated with isolates from work by Kos et al.(2015). All NCFBr
isolates from the second group of closely related isolates were assigned ST253 which has
been previously identified as belonging to the PA14 clonal complex. Isolates assigned
ST253 have been found extensively throughout the environment and in human
infections in countries around the world, including the UK, France, Spain, Australia, and
Brazil (http://pubmlst.org). Another group of isolates was identified on a branch located
distantly from the PA14 clonal complex, though still as part of the group 2 clade. All
isolates from patient 149 were a part of this group having been assigned ST667. Four
other isolates were also located on this branch (figure 4.12) one of which was unable to
130
be assigned a ST. Although the isolates in this group appear on one branch of the tree
they are not closely related to one another. None of the three STs assigned to these
isolates were found to be particularly common in the PubMLST database; ST1251 was
previously identified in an isolate from a bronchial lavage in Spain, ST1753 had previously
been identified in a water isolate from France, and ST1182 was previously found in water
isolates from Australia and France, and in isolates from unnamed sources in China and
France (http://pubmlst.org).
The most common STs among NCFBr isolates are listed in table 4.2. Five isolates
from three patients attending the Sheffield bronchiectasis centre were assigned ST244
which has previously been identified across Europe, Asia, Australia, Africa, and South
America from a wide range of clinical and environmental sources (http://pubmlst.org).
A clade of isolates assigned ST395 were identified among the isolates collected by Kos et
al. (2015) and five isolates from three patients, attending three geographically separate
bronchiectasis centres were assigned this ST. Previously ST395 has been associated with
water sources (Slekovec et al. 2012) and it was suggested by Kos et al.(2015) that its
prevalence among clinical isolates implied that P. aeruginosa was easily acquired from
the environment in many diseases. There were, however, STs previously acknowledged
as being distributed worldwide and that were well represented among the clinical
isolates analysed by Kos et al.(2015) that were not assigned to any of the 189 NCFBr
isolates sequenced as part of this work. ST235 (serotype O:11)and ST111 (serotype O:12)
were commonly identified in work undertaken by Maatallah et al.(2011) and Woodford
et al. (2011) and have previously been described worldwide (http://pubmlst.org) but
were not identified among the NCFBr isolates. The widespread origins of isolates sharing
the most common STs identified among these NCFBr isolates, and their distribution
among the other isolates on the phylogenetic tree, implies that the population structure
of P. aeruginosa among NCFBr patients is nonclonal.
131
4.4.1.1 Transmissible strains of Pseudomonas aeruginosa in non-cystic fibrosis
bronchiectasis patients from England and Wales
Further work by Pirnay et al. (2009) into the population structure of P. aeruginosa
led to the conclusion that the nonclonal structure of the population is generally
punctuated by outbreaks of epidemic strains that are common in both the environment
and in clinical isolates. Various transmissible “epidemic” strains of P. aeruginosa have
been identified in the CF population in the UK (Scott & Pitt 2004) but the prevalence of
these strains among patients with NCFBr has not previously been investigated. Two
isolates from a patient attending the Liverpool bronchiectasis service were confirmed to
be LES positive. The LES was not found to be present in any other centres in England and
Wales and no other known UK epidemic strains (Midlands 1 or Manchester epidemic
strain) were identified among any patients. The two LES isolates recovered (A36 and
A163) were found to be closely related to one another but the strain is obviously not
widespread among NCFBr patients attending the Liverpool centre given its presence in
only one of 56 patients (appendix, table A1) surveyed from Liverpool. In total, the LES
accounted for fewer than 0.5% of the 408 NCFBr patient isolates sampled from 16
centres which is significantly lower than the prevalence of LES recorded among CF
patients in the UK (P = >0.0001) (Scott & Pitt 2004). The low frequency of LES and
absence of other known epidemic strains indicates that transmissible strains of P.
aeruginosa are not as great a cause for concern among NCFBr patients as in patients
with CF, although the prognostic implications of LES infections previously studied in CF
(Al-Aloul et al. 2003) should not be ignored in NCFBr patients.
4.4.2 Diversity of Pseudomonas aeruginosa isolates from individual non-cystic fibrosis
bronchiectasis patients
In the field of diagnostic microbiology it has been commonplace to use diagnostic
results from single bacterial isolates from patient samples to inform the appropriate
method of treatment and prognosis. However, more recently it has become apparent
than in the case of chronic lung infections, predominantly in CF, that a single isolate is
132
unlikely to be representative of the true nature of the infection. It has been noted that
different areas of the lung are likely to have different oxygen levels, available nutrients,
and varying microflora, and this may lead to large variations in both the phenotypic and
genotypic characteristics of isolates collected from patients (Jorth et al. 2015).
Sample sizes were small for many of the NCFBr patients from whom multiple
isolates were collected (mean isolates per patient: 5.2, median: 3) and so may still not
necessarily reflect the true diversity of the P. aeruginosa populations within the lungs of
individual patients. In the majority of patients (16 of 23) isolates collected in a single visit
were closely related, clustering together on the phylogenetic tree (figure 4.9) and
sharing a single ST. Of the seven patients whose isolates were not closely related, four
had isolates present in both group 1 and group 2 clades indicating a large amount of
genetic diversity between these isolates. Seven isolates were collected from patient 72
(Chertsey, Surrey) and six of these clustered closely together as part of the group 2 clade
in the phylogenetic tree (figure 4.9). Five of these isolates were assigned ST620 and the
remaining member of this cluster of isolates (C83) was unable to be assigned a ST. The
final isolate collected from patient 72 falls into the group 1 clade and was assigned
ST840. Both ST620 and ST840 were relatively uncommon in the PubMLST database
(http://pubmlst.org) and both have previously been identified in veterinary isolates from
Australia. Only one previous example of ST840 was recorded as an Australian canine
wound isolate, however this ST has also been assigned to two isolates from two patients
attending the Swansea bronchiectasis centre. Aside from these, the majority of STs
assigned to isolates which did not cluster together were STs that were relatively common
in the PubMLST database, many having been identified worldwide, which may indicate
that NCFBr patients are capable of harbouring more than one environmentally-acquired
strain of P. aeruginosa at any given time.
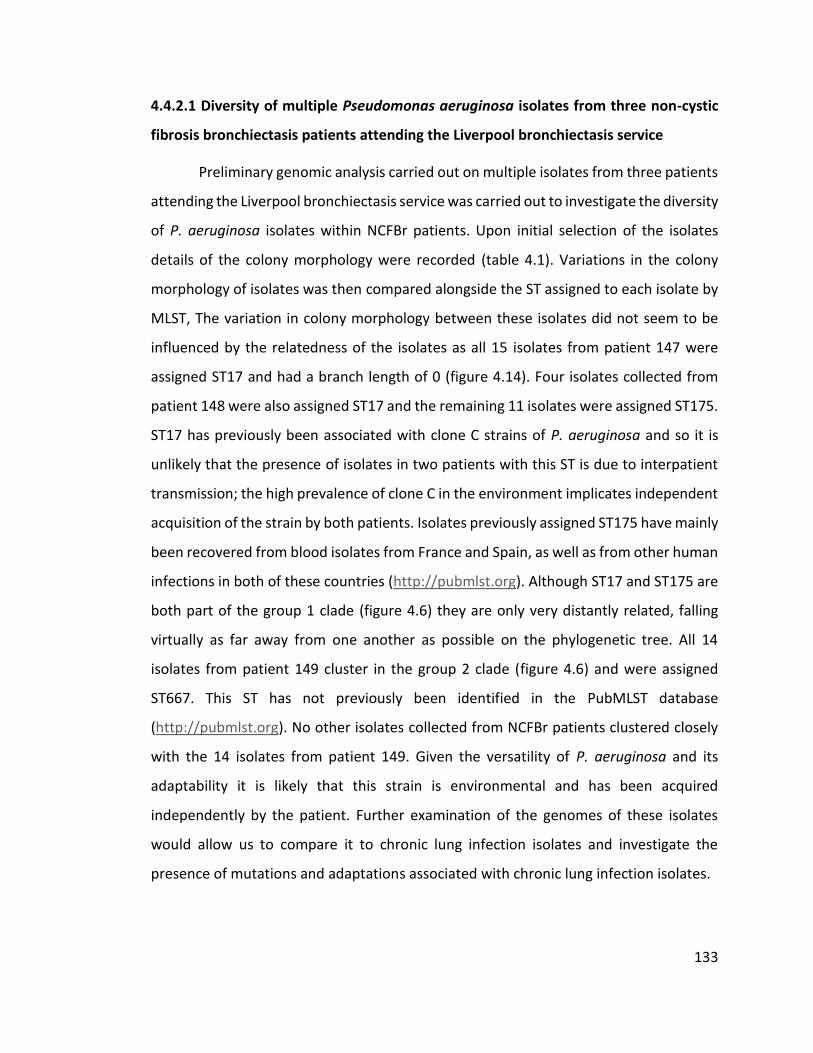
133
4.4.2.1 Diversity of multiple Pseudomonas aeruginosa isolates from three non-cystic
fibrosis bronchiectasis patients attending the Liverpool bronchiectasis service
Preliminary genomic analysis carried out on multiple isolates from three patients
attending the Liverpool bronchiectasis service was carried out to investigate the diversity
of P. aeruginosa isolates within NCFBr patients. Upon initial selection of the isolates
details of the colony morphology were recorded (table 4.1). Variations in the colony
morphology of isolates was then compared alongside the ST assigned to each isolate by
MLST, The variation in colony morphology between these isolates did not seem to be
influenced by the relatedness of the isolates as all 15 isolates from patient 147 were
assigned ST17 and had a branch length of 0 (figure 4.14). Four isolates collected from
patient 148 were also assigned ST17 and the remaining 11 isolates were assigned ST175.
ST17 has previously been associated with clone C strains of P. aeruginosa and so it is
unlikely that the presence of isolates in two patients with this ST is due to interpatient
transmission; the high prevalence of clone C in the environment implicates independent
acquisition of the strain by both patients. Isolates previously assigned ST175 have mainly
been recovered from blood isolates from France and Spain, as well as from other human
infections in both of these countries (http://pubmlst.org). Although ST17 and ST175 are
both part of the group 1 clade (figure 4.6) they are only very distantly related, falling
virtually as far away from one another as possible on the phylogenetic tree. All 14
isolates from patient 149 cluster in the group 2 clade (figure 4.6) and were assigned
ST667. This ST has not previously been identified in the PubMLST database
(http://pubmlst.org). No other isolates collected from NCFBr patients clustered closely
with the 14 isolates from patient 149. Given the versatility of P. aeruginosa and its
adaptability it is likely that this strain is environmental and has been acquired
independently by the patient. Further examination of the genomes of these isolates
would allow us to compare it to chronic lung infection isolates and investigate the
presence of mutations and adaptations associated with chronic lung infection isolates.
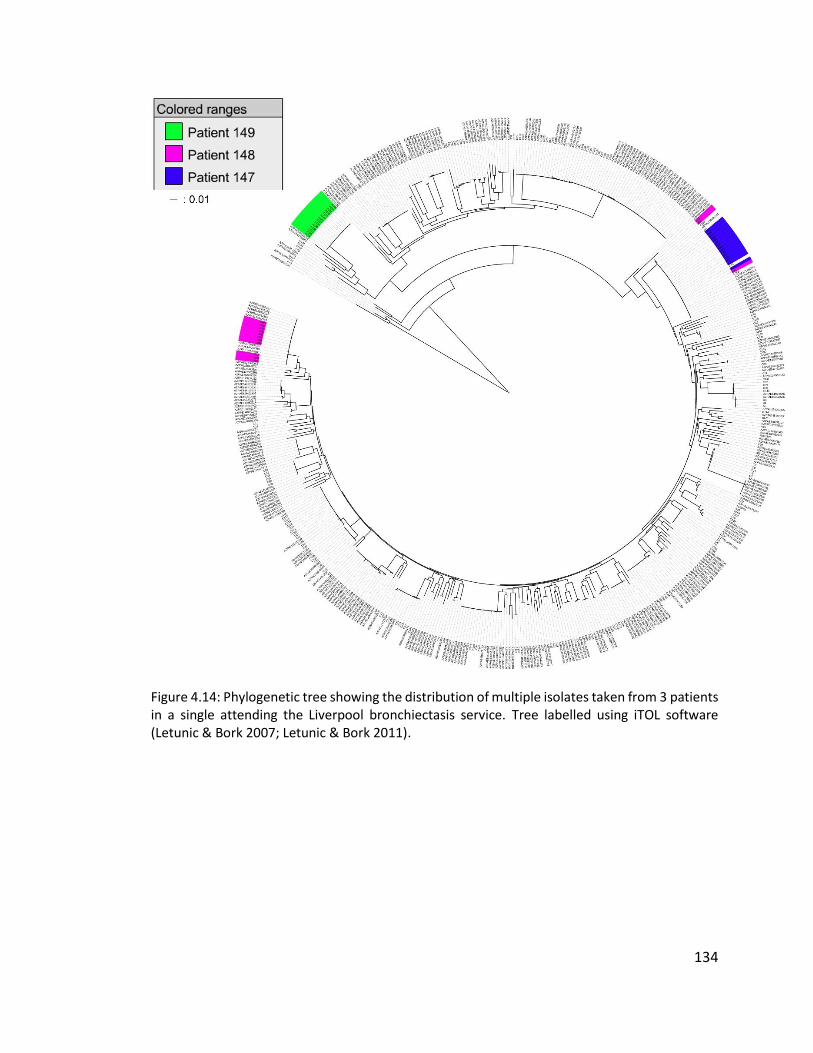
134
Figure 4.14: Phylogenetic tree showing the distribution of multiple isolates taken from 3 patients in a single attending the Liverpool bronchiectasis service. Tree labelled using iTOL software (Letunic & Bork 2007; Letunic & Bork 2011).

135
4.5 Conclusions
The main conclusions that can be drawn from this study are:
1. In bronchiectasis centres throughout England and Wales there is little
evidence of geographical clustering or transmissible epidemic strains of
P. aeruginosa;
2. In the majority of NCFBr patients there is only one infecting strain of P.
aeruginosa at a given time, though there is evidence for multiple strain
infections in some cases.
136
Chapter Five
General Discussion
The previous chapters have discussed in detail the current understanding of non-
cystic fibrosis bronchiectasis (NCFBr) as a disease and the implications of P. aeruginosa
infections in patients suffering the condition. It is clear that there is a fundamental lack
of focused research into NCFBr both in terms of the disease itself and the microbial
infections associated with it, particularly when compared with cystic fibrosis (CF).
Bronchiectasis has been considered in recent years to be easily treatable and of
little clinical significance, possibly due to a belief that the disease would gradually fall
into decline in developing countries alongside other pulmonary diseases, such as
tuberculosis (TB) (Chalmers 2015). There are several known causes of bronchiectasis
including: CF; childhood infection, most commonly pneumonia leading to post-infective
bronchiectasis; and particle inhalation (NHS Choices 2015). It is estimated, however, that
in 25 – 50% of NCFBr cases a cause is never identified and this is known as idiopathic
bronchiectasis (http://www.blf.org.uk/page/bronchiectasis). Conversely, CF is an easily
defined disease due to its genetic aetiology and has rightfully garnered public and
scientific attention due to the significantly reduced quality of life and life expectancy
experienced by sufferers. In the UK more than 10 000 people are affected by CF
(http://www.cysticfibrosis.org.uk/about-cf). However, in just nine centres in the UK
there are 5000 patients undergoing regular follow-up treatment for NCFBr (De Soyza et
al. 2013) suggesting a much higher prevalence than CF, and higher incidence than
previously believed. In CF patients chronic lung infection with P. aeruginosa is the
leading cause of morbidity and mortality (Fothergill et al. 2010a) and many studies have
demonstrated an association between chronic P. aeruginosa infection and increased
mortality, lowered lung function, and worsened quality of life in NCFBr patients (Evans
137
et al. 1996; Davies et al. 2006; King et al. 2007; Loebinger et al. 2009). However it has
not been conclusively shown that P. aeruginosa is the cause of a worsening prognosis in
NCFBr patients instead of merely a marker of existing disease severity (Chalmers 2015).
The uncertainty surrounding the role of P. aeruginosa in NCFBr has been the basis for
this study.
The main focus of this work has been to reveal more information about the
population structure of P. aeruginosa in NCFBr patients in a manner similar to work that
has already been undertaken with regards to CF. Once colonised with P. aeruginosa CF
patients generally carry the infection for life and often maintain the same strain of the
bacteria throughout the course of infection (Şener et al. 2001; Leone et al. 2008)
although more recently it has been acknowledged that transmissible “epidemic” strains
can superinfect patients and displace the established strain (McCallum et al. 2001).
Previously there has only been a very small amount of work undertaken to investigate
the maintenance of strains of P. aeruginosa in the lungs of NCFBr patients and the
possibility of transmissible strains. The work undertaken by De Soyza et al. (2014)
investigated the incidence of transmission of P. aeruginosa between NCFBr patients in a
single centre, as well as including paired longitudinal isolates from 10 patients. The
majority of patients were shown to harbour unique strains of P. aeruginosa and both
isolates from nine of the 10 patients with paired isolates were found to be
indistinguishable by both array tube (AT) and variable number tandem repeat (VNTR)
typing. The work described in chapter three aimed to build on the previous research by
De Soyza et al. (2014) through the use of AT genotyping of longitudinal NCFBr isolates.
In the majority of the 20 patients from whom isolates were collected the strain type was
maintained for the period spanned by this study. Use of the AT system allows for rapid
identification of isolates and provides information regarding the accessory genome.
Assigning each isolate a four digit AT code also allows for the use of the eBURST
algorithm (Feil et al. 2004; Spratt et al. 2004) to examine the distribution and population
structure of P. aeruginosa isolates from NCFBr patients. There was shown to be no
clustering of isolates collected from NCFBr patients and the strains identified were
138
widely distributed throughout the general population, although common clones were
found to be more prevalent. This is in line with work carried out previously which has
defined the population structure of P. aeruginosa as nonclonal though punctuated by
closely related clonal complexes, such as clone C (Pirnay et al. 2002; Pirnay et al. 2009;
Curran et al. 2004). The main limitation of the AT system is its lack of depth. The
immobilised oligonucleotides in the AT chip only represent a very limited number of
sequences from the large and versatile genome of P. aeruginosa and the dichotomy of
PAO1- vs. non-PAO1-type sequences necessary for analysis of the AT data does not
accurately portray the diversity of P. aeruginosa genotypes. Whilst some information
regarding the accessory genome of isolates can be shown, it mainly concerns the
presence or absence of mobile genetic elements and cannot provide information
regarding single nucleotide polymorphisms (SNPs) or indels which can differentiate
closely related isolates. With the ever-decreasing cost of whole genome sequencing it is
likely that the AT system will cease to be used in research in favour of the increased the
depth of information acquired by whole genome sequencing.
The work undertaken in chapter three focused only on patients from one
bronchiectasis centre in the north-east of England, and so to achieve a broader
understanding of the population of P. aeruginosa among NCFBr patients the work
described in chapter four included isolates from 16 bronchiectasis services in England
and Wales. Whole genome sequencing provides a much greater depth of study and has
previously been used in studies of P. aeruginosa to investigate virulence mechanisms,
including antibiotic resistance genes and virulence factors (Lee et al. 2006; Boyle et al.
2012); the relatedness of isolates and possible transmission events (Snyder et al. 2013;
Jeukens et al. 2014; Quick et al. 2014); and the evolution of infectious bacterial strains
(Wong et al. 2012; Dettman et al. 2013; Marvig et al. 2014). The collection of isolates
from this study were compiled into a phylogenetic tree with isolates from work by Kos
et al. (2015) in order to place them in the context of the general P. aeruginosa
population. Similarly to the results in chapter three, the NCFBr isolates were not found
to cluster extensively and were distributed throughout the phylogenetic tree. The results
139
reflected work by Stewart et al. (2014) and Freschi et al. (2015) which showed two
distinct subgroups of P. aeruginosa within the population, termed group 1 and group 2,
with a third sparsely populated group containing taxonomic outlier PA7 (Roy et al. 2010).
Strains from group 1, including PAO1, clone C strains, LESB58, and PAK, have been
suggested to be naturally more abundant than strains from group 2, which includes
PA14. However, it has also been suggested that this apparent disparity between group
1 and group 2 isolates may be introduced due to selection bias, given that the data used
to compile these phylogenetic trees are largely from clinical sources (Freschi et al. 2015).
The International Pseudomonas aeruginosa Consortium (IPC) aims to compile a database
of over 1000 P. aeruginosa genomes to allow easily accessible and user-friendly
comparisons of genomic data and so as the number of environmental isolates in the
dataset increases there may be a shift in the abundance of group 2 isolates. Chapter four
also included work undertaken to investigate the possible heterogeneity of multiple
isolates taken from NCFBr patients in a single visit to a bronchiectasis centre. In the
majority of patients all isolates taken in a single visit were found to cluster closely
together and shared a single sequence type (ST) assigned by multilocus sequence typing
(MLST), indicating that typically NCFBr patients do not experience multi-strain infections
of P. aeruginosa. Further analysis of the STs assigned to isolates showed that many were
strains commonly identified worldwide, both in the environment and in clinical isolates,
demonstrating that there are not strains directly associated with NCFBr pulmonary
infections. The sample sizes for multiple isolates from NCFBr patients were small (mean
isolates per patient: 5.2, median: 3) and so any further research to confirm that these
results are typical would be better served by larger sample sizes. It has been shown in
CF patients that coexisting, divergent strains of P. aeruginosa can infect the lungs
(Williams et al. 2015) but sample sizes of 40 isolates per sputum sample from each
patient were used in this work and so further investigation into heterogeneity of P.
aeruginosa infections in NCFBr patients would be better served on this scale. On a
smaller scale, it would be beneficial to further investigate the isolates collected from
patients 147 and 149 (patients attending Liverpool bronchiectasis service) from whom a
140
larger number of isolates were collected from a single visit. In the case of both patients
all isolates clustered closely together on the larger phylogenetic tree but construction of
a core genome from the isolates from each patient would allow for a higher resolution
investigation of relatedness between the isolates. Patient 147 has been known to have
been colonised with P. aeruginosa for >10 years, whereas the isolates collected from
patient 149 are the first Pseudomonas-positive culture from this patient. Given the
known diversification of P. aeruginosa within the lungs of CF patients over time (Williams
et al. 2015) it would be expected that there would be greater heterogeneity between
the isolates collected from patient 147 than in patient 149. Further analysis of these
isolates would allow for a greater comparison between the behaviour of P. aeruginosa
in the lungs of CF patients vs. NCFBr.
There was also very little evidence of transmissible strains of P. aeruginosa
among NCFBr patients. After the emergence of epidemic strains of P. aeruginosa among
CF patients work was undertaken to investigate the prevalence of these strains in the
UK. The Liverpool Epidemic Strain (LES) was found to account for 11% of the patient
isolates collected from CF sufferers in the UK (Scott & Pitt 2004). Among this cohort of
NCFBr patients only one patient was found to be infected with the LES. The patient was
attending the Liverpool bronchiectasis service and no other epidemic strains were
identified in this or any other centre. Although the lungs of NCFBr and CF patients
provide similar conditions for bacterial growth the disparity between the prevalence of
transmissible strains among CF patients and NCFBr patients may imply that there are
subtle differences in the host environment which mean that these epidemic strains are
more suited to life in the CF lung as opposed to in the lungs of those suffering other
chronic lung conditions. Further work should continue to be undertaken using larger
sample sizes across UK centres to investigate evidence of transmissible strains of P.
aeruginosa among the NCFBr population, as only a small sample of the predicted NCFBr
patients in the UK have been included in this work.
The genomic analysis undertaken in this work has largely been preliminary, and
has not fully explored the fine detail offered by the availability of whole genomes. With
141
regards to CF there have been large amounts of work undertaken to investigate the
specific mutations acquired by P. aeruginosa in chronic lung infections, including
changes in lasR, mucA, and mutS, (Marvig et al. 2013; Jeukens et al. 2014; Marvig et al.
2014) and so further investigation into the presence of similar mutations in isolates from
NCFBr patients would allow a more direct comparison between infections in both
diseases. Although the isolates collected from NCFBr patients have been compared
alongside a panel of other P. aeruginosa isolates (Kos et al. 2015) it is also important to
understand their place within the larger, general P. aeruginosa population. Further work
to place NCFBr isolates in the context of the wider population would allow any common
strains among NCFBr patients to be identified and observed with regards to patient
health.
It is only recently that the world’s first national guidelines for the diagnosis and
treatment of NCFBr were developed in the UK by the British Thoracic Society (BTS)
(Pasteur et al. 2010) and so the amount of research being undertaken to better
understand the disease and its implications on both patients and health services is
gradually increasing. It is hoped by many that the development of cheaper, quicker, and
more user-friendly sequencing platforms will allow whole genome sequencing to play a
role in the future of diagnostic microbiology (Török & Peacock 2012) as well as bringing
greater depth to clinical research. As well as striving to develop a better understanding
of NCFBr as a disease, research must continue to progress into the implications of
bacterial infections in chronic lung conditions.
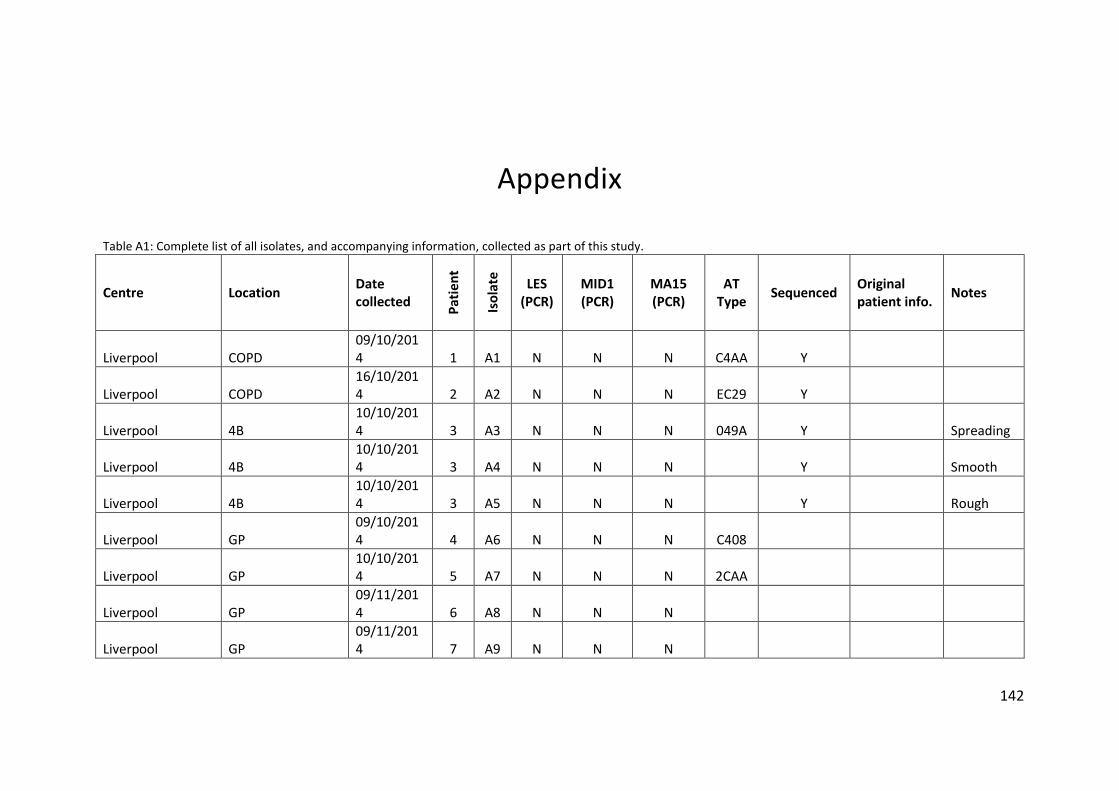
142
Appendix
Table A1: Complete list of all isolates, and accompanying information, collected as part of this study.
Centre Location Date collected
Pat
ien
t
Iso
late
LES (PCR)
MID1 (PCR)
MA15 (PCR)
AT Type
Sequenced Original patient info.
Notes
Liverpool COPD 09/10/2014 1 A1 N N N C4AA Y
Liverpool COPD 16/10/2014 2 A2 N N N EC29 Y
Liverpool 4B 10/10/2014 3 A3 N N N 049A Y Spreading
Liverpool 4B 10/10/2014 3 A4 N N N Y Smooth
Liverpool 4B 10/10/2014 3 A5 N N N Y Rough
Liverpool GP 09/10/2014 4 A6 N N N C408
Liverpool GP 10/10/2014 5 A7 N N N 2CAA
Liverpool GP 09/11/2014 6 A8 N N N
Liverpool GP 09/11/2014 7 A9 N N N
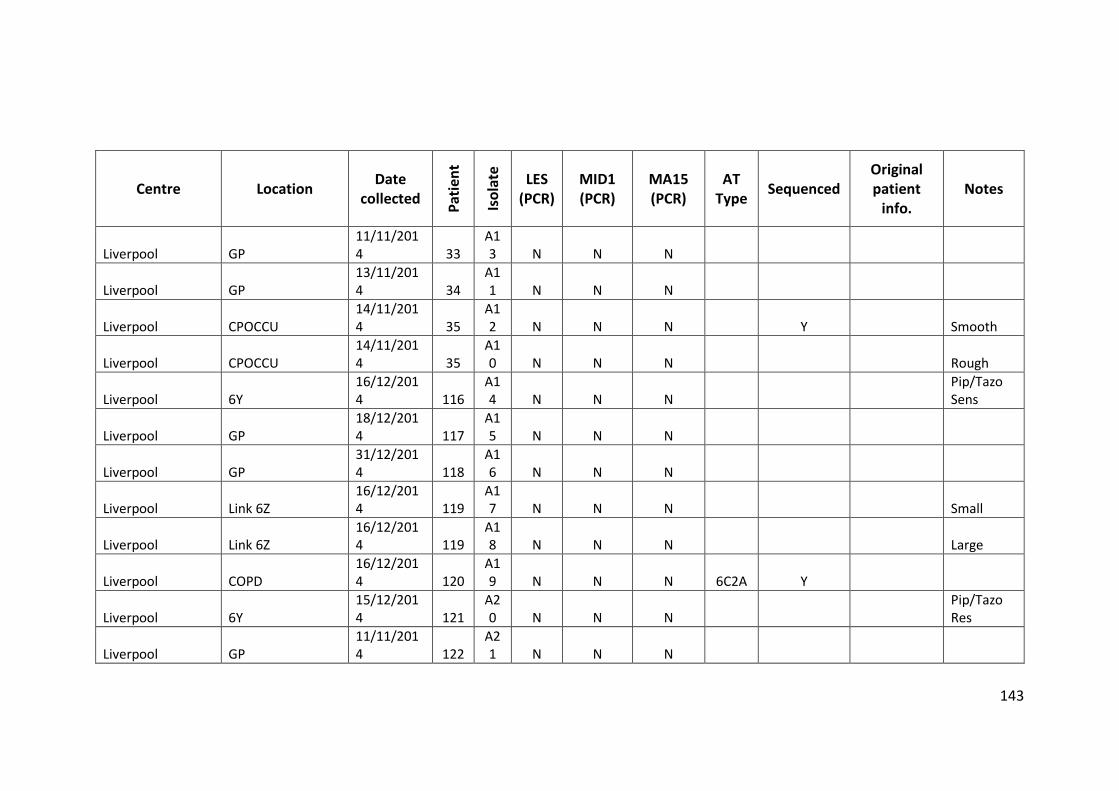
143
Centre Location Date
collected
Pat
ien
t
Iso
late
LES (PCR)
MID1 (PCR)
MA15 (PCR)
AT Type
Sequenced
Original patient
info. Notes
Liverpool GP 11/11/2014 33
A13 N N N
Liverpool GP 13/11/2014 34
A11 N N N
Liverpool CPOCCU 14/11/2014 35
A12 N N N Y Smooth
Liverpool CPOCCU 14/11/2014 35
A10 N N N Rough
Liverpool 6Y 16/12/2014 116
A14 N N N
Pip/Tazo Sens
Liverpool GP 18/12/2014 117
A15 N N N
Liverpool GP 31/12/2014 118
A16 N N N
Liverpool Link 6Z 16/12/2014 119
A17 N N N Small
Liverpool Link 6Z 16/12/2014 119
A18 N N N Large
Liverpool COPD 16/12/2014 120
A19 N N N 6C2A Y
Liverpool 6Y 15/12/2014 121
A20 N N N
Pip/Tazo Res
Liverpool GP 11/11/2014 122
A21 N N N
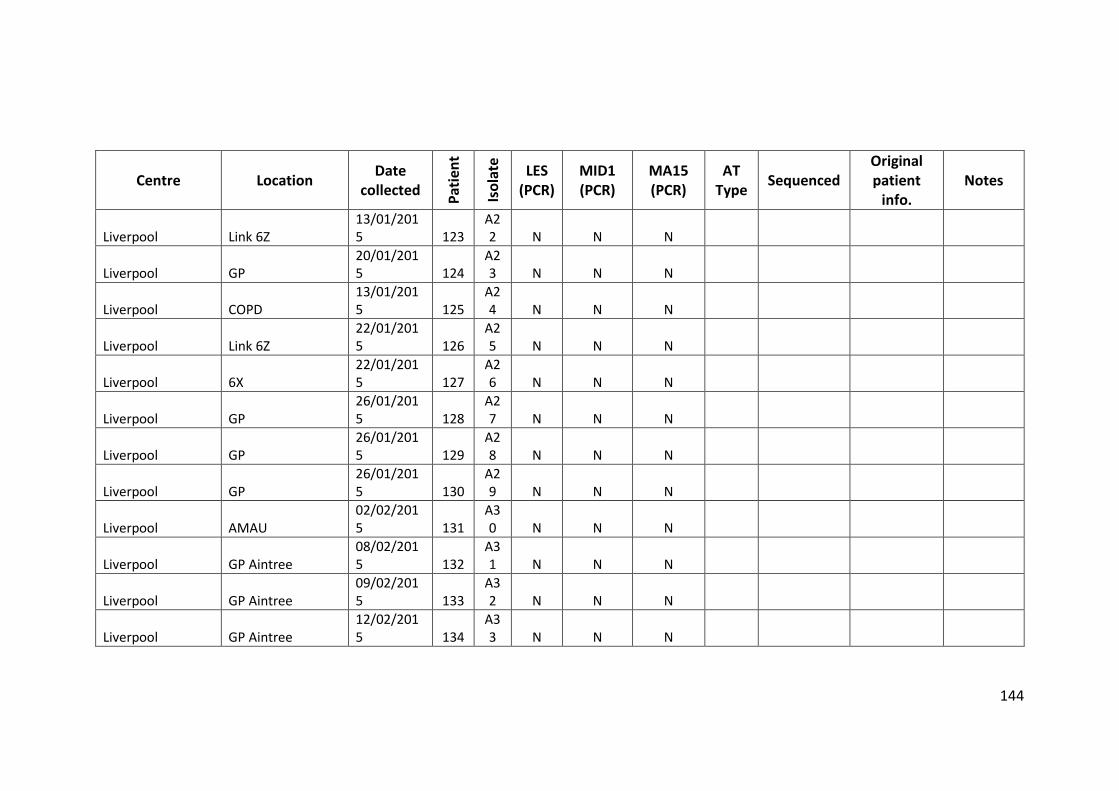
144
Centre Location Date
collected
Pat
ien
t
Iso
late
LES (PCR)
MID1 (PCR)
MA15 (PCR)
AT Type
Sequenced
Original patient
info. Notes
Liverpool Link 6Z 13/01/2015 123
A22 N N N
Liverpool GP 20/01/2015 124
A23 N N N
Liverpool COPD 13/01/2015 125
A24 N N N
Liverpool Link 6Z 22/01/2015 126
A25 N N N
Liverpool 6X 22/01/2015 127
A26 N N N
Liverpool GP 26/01/2015 128
A27 N N N
Liverpool GP 26/01/2015 129
A28 N N N
Liverpool GP 26/01/2015 130
A29 N N N
Liverpool AMAU 02/02/2015 131
A30 N N N
Liverpool GP Aintree 08/02/2015 132
A31 N N N
Liverpool GP Aintree 09/02/2015 133
A32 N N N
Liverpool GP Aintree 12/02/2015 134
A33 N N N
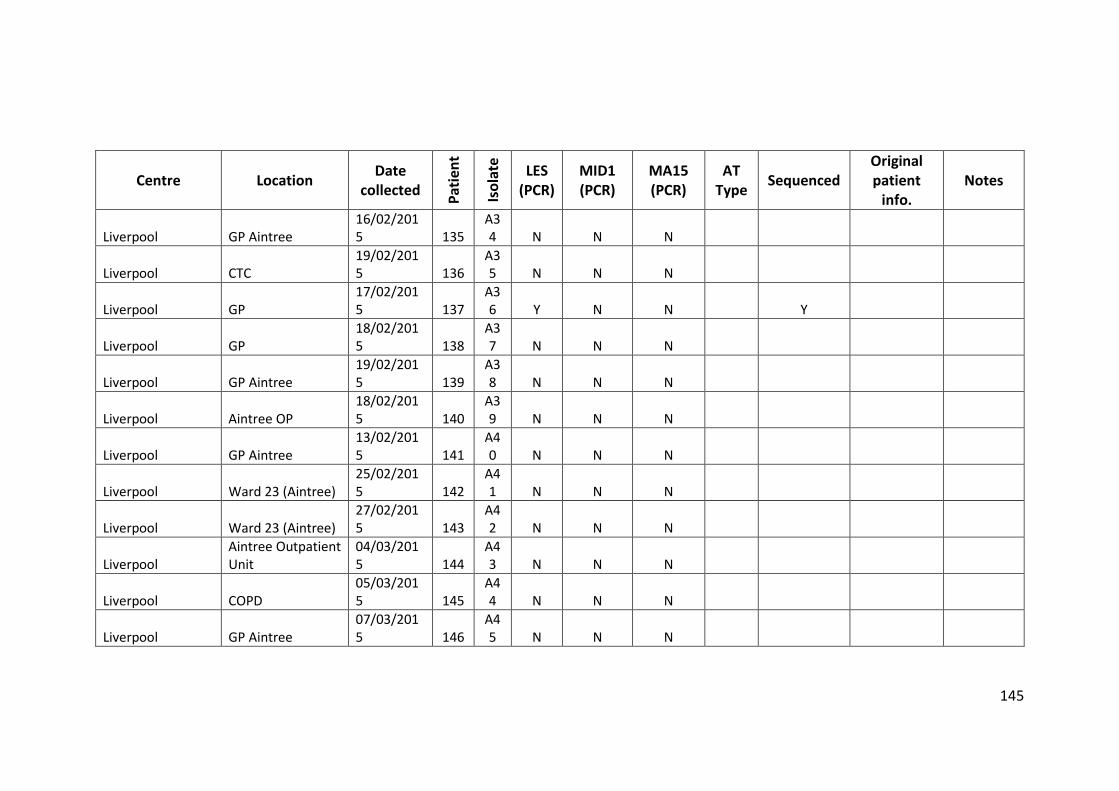
145
Centre Location Date
collected
Pat
ien
t
Iso
late
LES (PCR)
MID1 (PCR)
MA15 (PCR)
AT Type
Sequenced
Original patient
info. Notes
Liverpool GP Aintree 16/02/2015 135
A34 N N N
Liverpool CTC 19/02/2015 136
A35 N N N
Liverpool GP 17/02/2015 137
A36 Y N N Y
Liverpool GP 18/02/2015 138
A37 N N N
Liverpool GP Aintree 19/02/2015 139
A38 N N N
Liverpool Aintree OP 18/02/2015 140
A39 N N N
Liverpool GP Aintree 13/02/2015 141
A40 N N N
Liverpool Ward 23 (Aintree) 25/02/2015 142
A41 N N N
Liverpool Ward 23 (Aintree) 27/02/2015 143
A42 N N N
Liverpool Aintree Outpatient Unit
04/03/2015 144
A43 N N N
Liverpool COPD 05/03/2015 145
A44 N N N
Liverpool GP Aintree 07/03/2015 146
A45 N N N
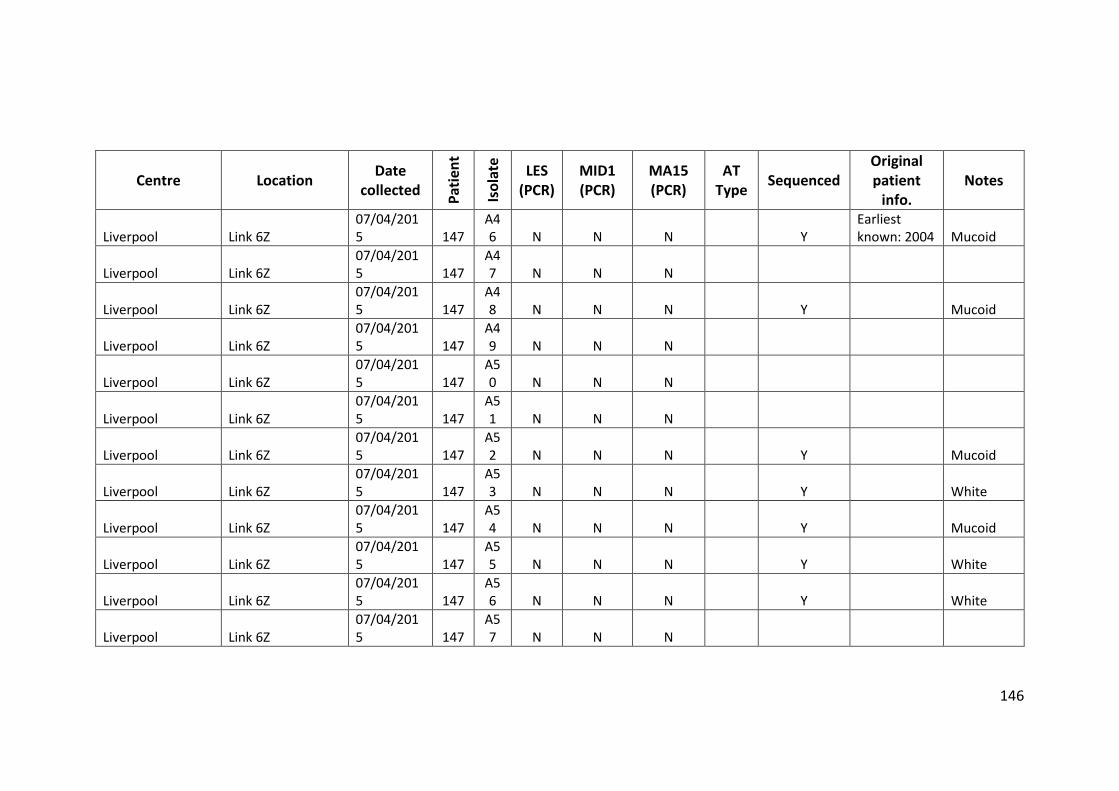
146
Centre Location Date
collected
Pat
ien
t
Iso
late
LES (PCR)
MID1 (PCR)
MA15 (PCR)
AT Type
Sequenced
Original patient
info. Notes
Liverpool Link 6Z 07/04/2015 147
A46 N N N Y
Earliest known: 2004 Mucoid
Liverpool Link 6Z 07/04/2015 147
A47 N N N
Liverpool Link 6Z 07/04/2015 147
A48 N N N Y Mucoid
Liverpool Link 6Z 07/04/2015 147
A49 N N N
Liverpool Link 6Z 07/04/2015 147
A50 N N N
Liverpool Link 6Z 07/04/2015 147
A51 N N N
Liverpool Link 6Z 07/04/2015 147
A52 N N N Y Mucoid
Liverpool Link 6Z 07/04/2015 147
A53 N N N Y White
Liverpool Link 6Z 07/04/2015 147
A54 N N N Y Mucoid
Liverpool Link 6Z 07/04/2015 147
A55 N N N Y White
Liverpool Link 6Z 07/04/2015 147
A56 N N N Y White
Liverpool Link 6Z 07/04/2015 147
A57 N N N

147
Centre Location Date
collected
Pat
ien
t
Iso
late
LES (PCR)
MID1 (PCR)
MA15 (PCR)
AT Type
Sequenced
Original patient
info. Notes
Liverpool Link 6Z 07/04/2015 147
A58 N N N Y White
Liverpool Link 6Z 07/04/2015 147
A59 N N N
Liverpool Link 6Z 07/04/2015 147
A60 N N N Y White
Liverpool Link 6Z 07/04/2015 147
A61 N N N
Liverpool Link 6Z 07/04/2015 147
A62 N N N
Liverpool Link 6Z 07/04/2015 147
A63 N N N
Liverpool Link 6Z 07/04/2015 147
A64 N N N
Liverpool Link 6Z 07/04/2015 147
A65 N N N
Liverpool Link 6Z 07/04/2015 147
A66 N N N
Liverpool Link 6Z 07/04/2015 147
A67 N N N
Liverpool Link 6Z 07/04/2015 147
A68 N N N
Liverpool Link 6Z 07/04/2015 147
A69 N N N
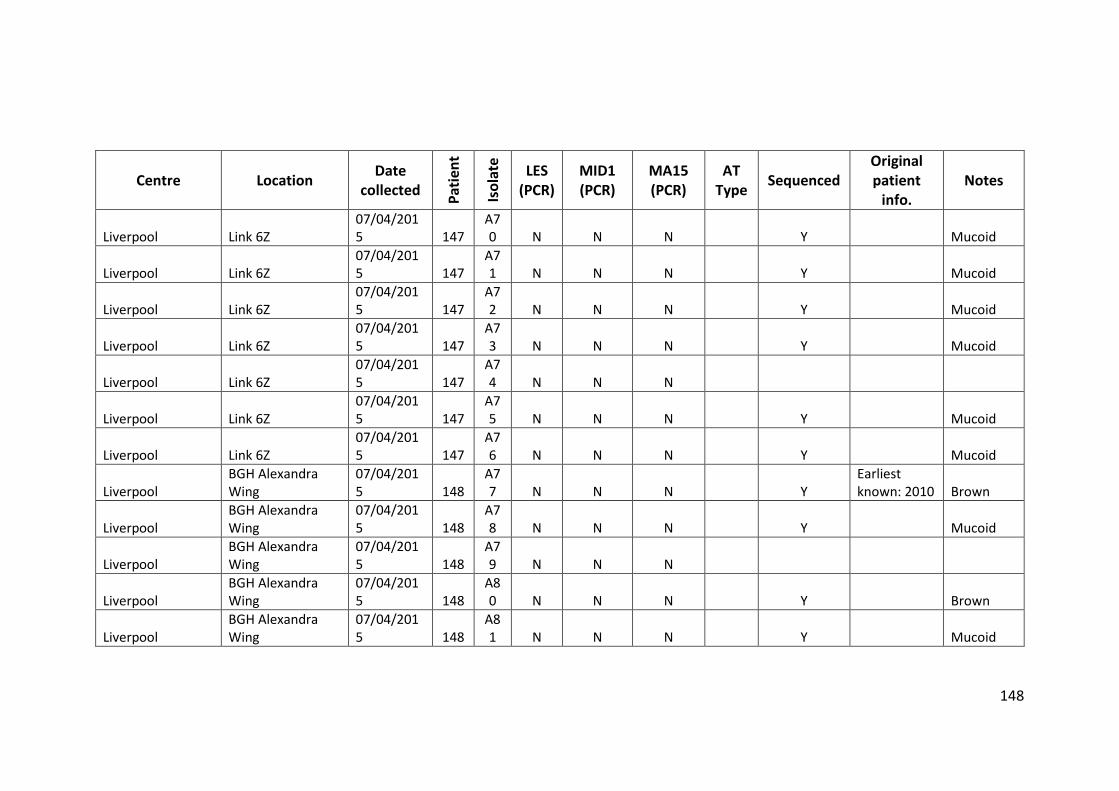
148
Centre Location Date
collected
Pat
ien
t
Iso
late
LES (PCR)
MID1 (PCR)
MA15 (PCR)
AT Type
Sequenced
Original patient
info. Notes
Liverpool Link 6Z 07/04/2015 147
A70 N N N Y Mucoid
Liverpool Link 6Z 07/04/2015 147
A71 N N N Y Mucoid
Liverpool Link 6Z 07/04/2015 147
A72 N N N Y Mucoid
Liverpool Link 6Z 07/04/2015 147
A73 N N N Y Mucoid
Liverpool Link 6Z 07/04/2015 147
A74 N N N
Liverpool Link 6Z 07/04/2015 147
A75 N N N Y Mucoid
Liverpool Link 6Z 07/04/2015 147
A76 N N N Y Mucoid
Liverpool BGH Alexandra Wing
07/04/2015 148
A77 N N N Y
Earliest known: 2010 Brown
Liverpool BGH Alexandra Wing
07/04/2015 148
A78 N N N Y Mucoid
Liverpool BGH Alexandra Wing
07/04/2015 148
A79 N N N
Liverpool BGH Alexandra Wing
07/04/2015 148
A80 N N N Y Brown
Liverpool BGH Alexandra Wing
07/04/2015 148
A81 N N N Y Mucoid
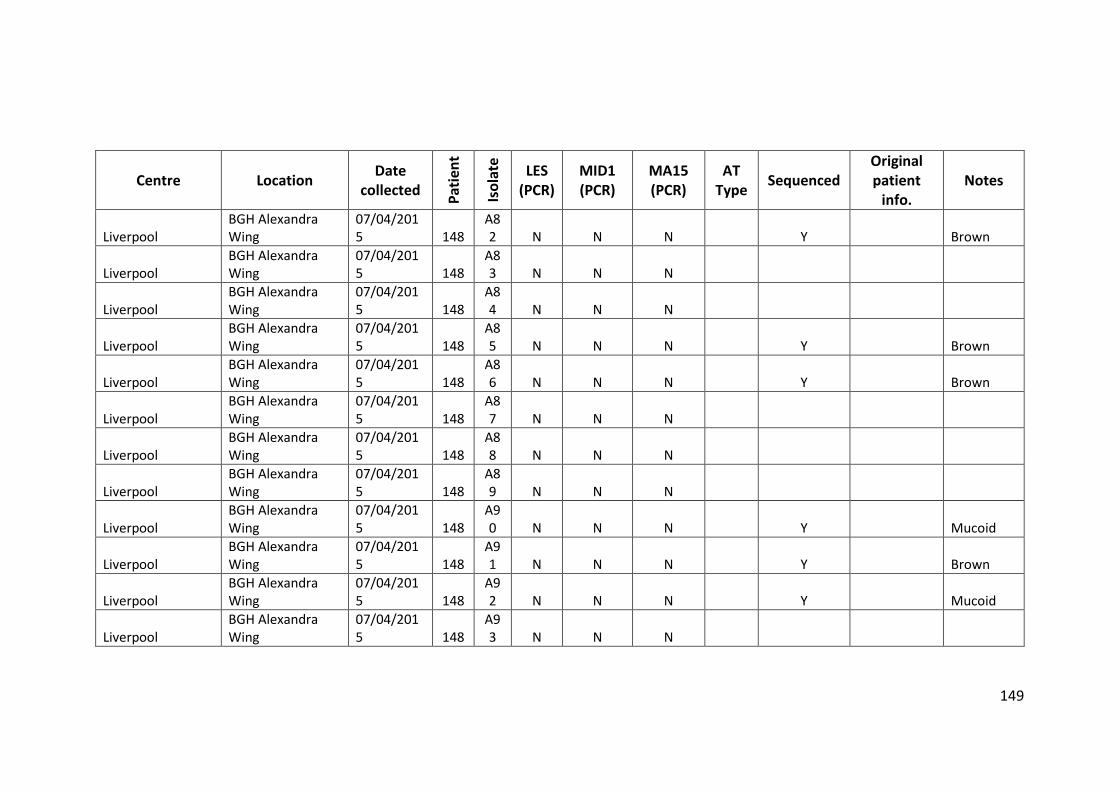
149
Centre Location Date
collected
Pat
ien
t
Iso
late
LES (PCR)
MID1 (PCR)
MA15 (PCR)
AT Type
Sequenced
Original patient
info. Notes
Liverpool BGH Alexandra Wing
07/04/2015 148
A82 N N N Y Brown
Liverpool BGH Alexandra Wing
07/04/2015 148
A83 N N N
Liverpool BGH Alexandra Wing
07/04/2015 148
A84 N N N
Liverpool BGH Alexandra Wing
07/04/2015 148
A85 N N N Y Brown
Liverpool BGH Alexandra Wing
07/04/2015 148
A86 N N N Y Brown
Liverpool BGH Alexandra Wing
07/04/2015 148
A87 N N N
Liverpool BGH Alexandra Wing
07/04/2015 148
A88 N N N
Liverpool BGH Alexandra Wing
07/04/2015 148
A89 N N N
Liverpool BGH Alexandra Wing
07/04/2015 148
A90 N N N Y Mucoid
Liverpool BGH Alexandra Wing
07/04/2015 148
A91 N N N Y Brown
Liverpool BGH Alexandra Wing
07/04/2015 148
A92 N N N Y Mucoid
Liverpool BGH Alexandra Wing
07/04/2015 148
A93 N N N
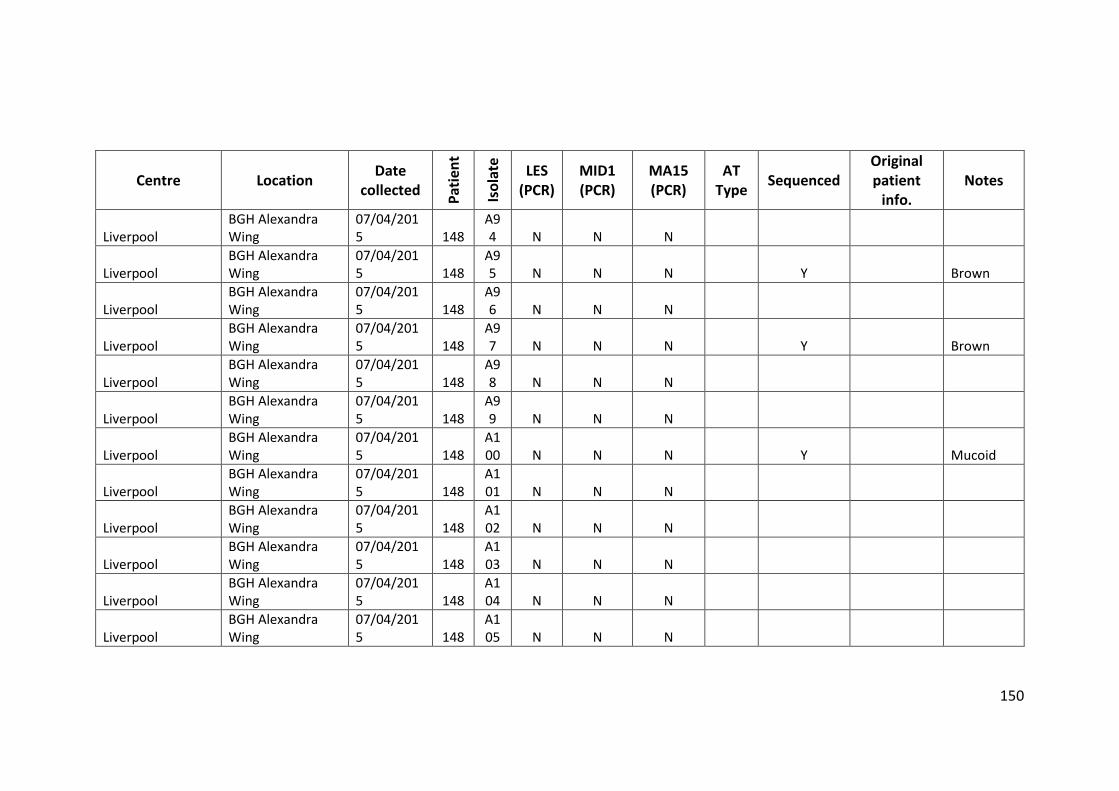
150
Centre Location Date
collected
Pat
ien
t
Iso
late
LES (PCR)
MID1 (PCR)
MA15 (PCR)
AT Type
Sequenced
Original patient
info. Notes
Liverpool BGH Alexandra Wing
07/04/2015 148
A94 N N N
Liverpool BGH Alexandra Wing
07/04/2015 148
A95 N N N Y Brown
Liverpool BGH Alexandra Wing
07/04/2015 148
A96 N N N
Liverpool BGH Alexandra Wing
07/04/2015 148
A97 N N N Y Brown
Liverpool BGH Alexandra Wing
07/04/2015 148
A98 N N N
Liverpool BGH Alexandra Wing
07/04/2015 148
A99 N N N
Liverpool BGH Alexandra Wing
07/04/2015 148
A100 N N N Y Mucoid
Liverpool BGH Alexandra Wing
07/04/2015 148
A101 N N N
Liverpool BGH Alexandra Wing
07/04/2015 148
A102 N N N
Liverpool BGH Alexandra Wing
07/04/2015 148
A103 N N N
Liverpool BGH Alexandra Wing
07/04/2015 148
A104 N N N
Liverpool BGH Alexandra Wing
07/04/2015 148
A105 N N N
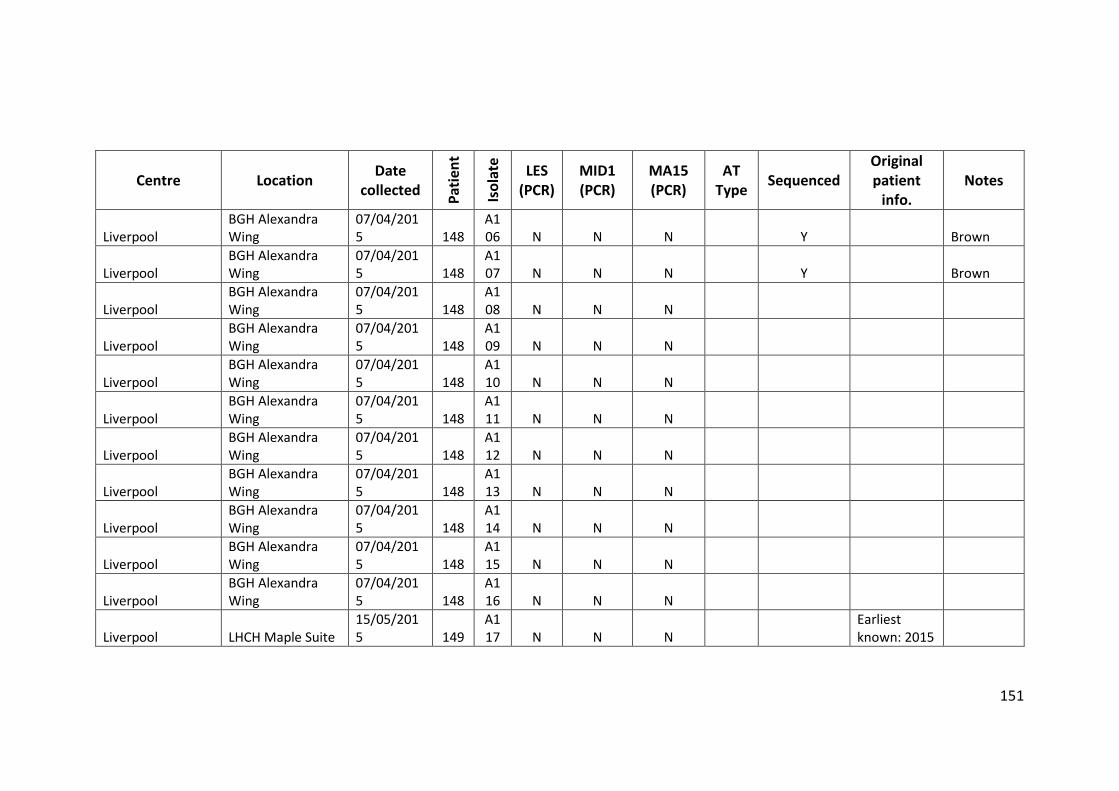
151
Centre Location Date
collected
Pat
ien
t
Iso
late
LES (PCR)
MID1 (PCR)
MA15 (PCR)
AT Type
Sequenced
Original patient
info. Notes
Liverpool BGH Alexandra Wing
07/04/2015 148
A106 N N N Y Brown
Liverpool BGH Alexandra Wing
07/04/2015 148
A107 N N N Y Brown
Liverpool BGH Alexandra Wing
07/04/2015 148
A108 N N N
Liverpool BGH Alexandra Wing
07/04/2015 148
A109 N N N
Liverpool BGH Alexandra Wing
07/04/2015 148
A110 N N N
Liverpool BGH Alexandra Wing
07/04/2015 148
A111 N N N
Liverpool BGH Alexandra Wing
07/04/2015 148
A112 N N N
Liverpool BGH Alexandra Wing
07/04/2015 148
A113 N N N
Liverpool BGH Alexandra Wing
07/04/2015 148
A114 N N N
Liverpool BGH Alexandra Wing
07/04/2015 148
A115 N N N
Liverpool BGH Alexandra Wing
07/04/2015 148
A116 N N N
Liverpool LHCH Maple Suite 15/05/2015 149
A117 N N N
Earliest known: 2015
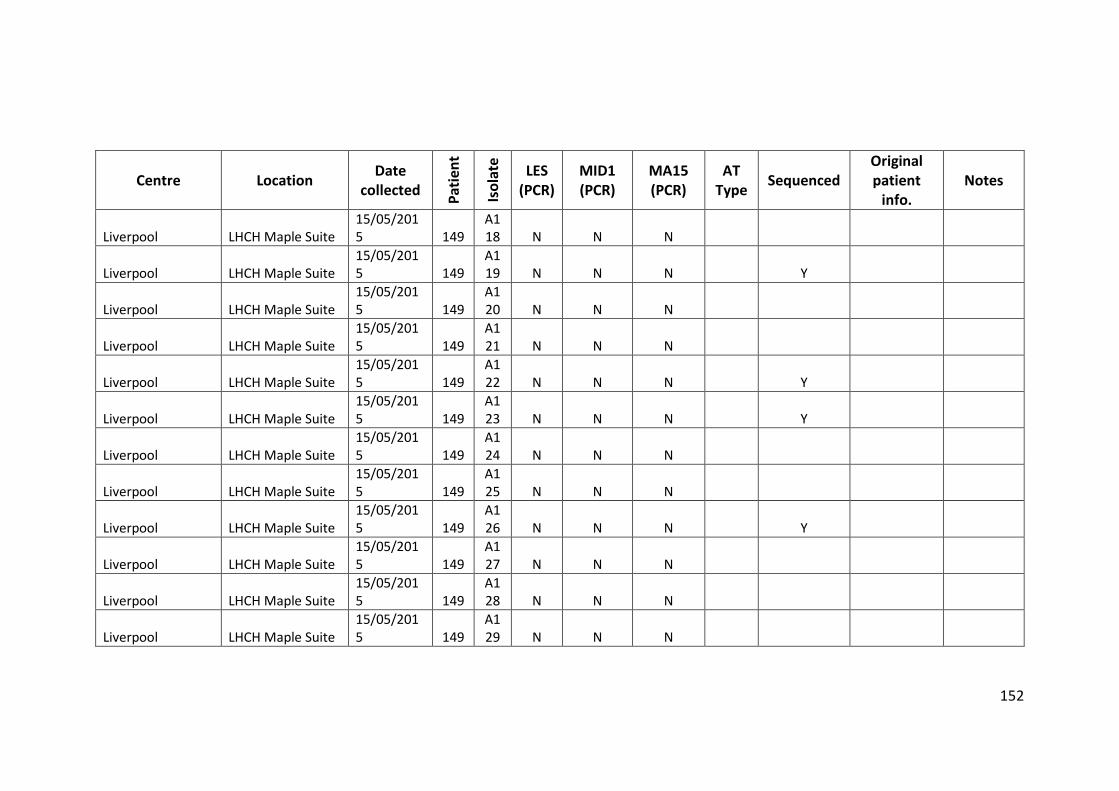
152
Centre Location Date
collected
Pat
ien
t
Iso
late
LES (PCR)
MID1 (PCR)
MA15 (PCR)
AT Type
Sequenced
Original patient
info. Notes
Liverpool LHCH Maple Suite 15/05/2015 149
A118 N N N
Liverpool LHCH Maple Suite 15/05/2015 149
A119 N N N Y
Liverpool LHCH Maple Suite 15/05/2015 149
A120 N N N
Liverpool LHCH Maple Suite 15/05/2015 149
A121 N N N
Liverpool LHCH Maple Suite 15/05/2015 149
A122 N N N Y
Liverpool LHCH Maple Suite 15/05/2015 149
A123 N N N Y
Liverpool LHCH Maple Suite 15/05/2015 149
A124 N N N
Liverpool LHCH Maple Suite 15/05/2015 149
A125 N N N
Liverpool LHCH Maple Suite 15/05/2015 149
A126 N N N Y
Liverpool LHCH Maple Suite 15/05/2015 149
A127 N N N
Liverpool LHCH Maple Suite 15/05/2015 149
A128 N N N
Liverpool LHCH Maple Suite 15/05/2015 149
A129 N N N

153
Centre Location Date
collected
Pat
ien
t
Iso
late
LES (PCR)
MID1 (PCR)
MA15 (PCR)
AT Type
Sequenced
Original patient
info. Notes
Liverpool LHCH Maple Suite 15/05/2015 149
A130 N N N Y
Liverpool LHCH Maple Suite 15/05/2015 149
A131 N N N
Liverpool LHCH Maple Suite 15/05/2015 149
A132 N N N
Liverpool LHCH Maple Suite 15/05/2015 149
A133 N N N
Liverpool LHCH Maple Suite 15/05/2015 149
A134 N N N Y
Liverpool LHCH Maple Suite 15/05/2015 149
A135 N N N
Liverpool LHCH Maple Suite 15/05/2015 149
A136 N N N
Liverpool LHCH Maple Suite 15/05/2015 149
A137 N N N Y
Liverpool LHCH Maple Suite 15/05/2015 149
A138 N N N Y
Liverpool LHCH Maple Suite 15/05/2015 149
A139 N N N
Liverpool LHCH Maple Suite 15/05/2015 149
A140 N N N
Liverpool LHCH Maple Suite 15/05/2015 149
A141 N N N Y

154
Centre Location Date
collected
Pat
ien
t
Iso
late
LES (PCR)
MID1 (PCR)
MA15 (PCR)
AT Type
Sequenced
Original patient
info. Notes
Liverpool LHCH Maple Suite 15/05/2015 149
A142 N N N
Liverpool LHCH Maple Suite 15/05/2015 149
A143 N N N
Liverpool LHCH Maple Suite 15/05/2015 149
A144 N N N Y
Liverpool LHCH Maple Suite 15/05/2015 149
A145 N N N
Liverpool LHCH Maple Suite 15/05/2015 149
A146 N N N
Liverpool LHCH Maple Suite 15/05/2015 149
A147 N N N Y
Liverpool LHCH Maple Suite 15/05/2015 149
A148 N N N Y
Liverpool LHCH Maple Suite 15/05/2015 149
A149 N N N
Liverpool LHCH Maple Suite 15/05/2015 149
A150 N N N
Liverpool LHCH Maple Suite 15/05/2015 149
A151 N N N Y
Liverpool LHCH Maple Suite 15/05/2015 149
A152 N N N
Liverpool LHCH Maple Suite 15/05/2015 149
A153 N N N
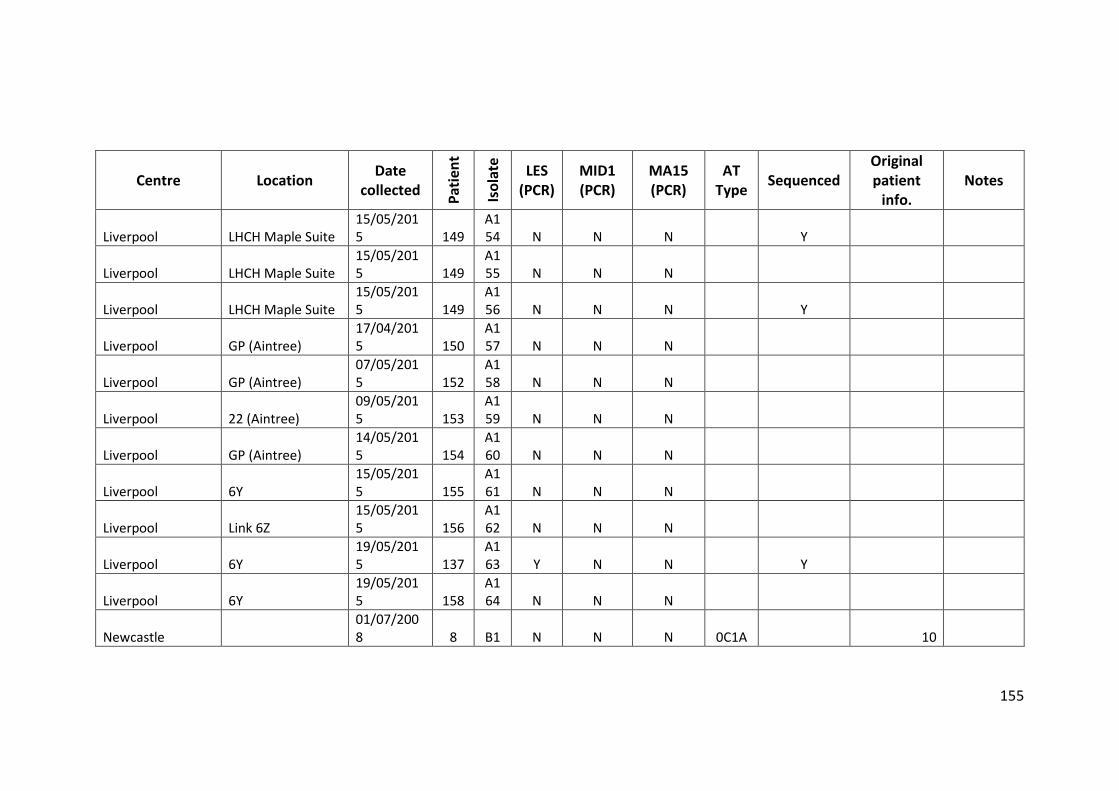
155
Centre Location Date
collected
Pat
ien
t
Iso
late
LES (PCR)
MID1 (PCR)
MA15 (PCR)
AT Type
Sequenced
Original patient
info. Notes
Liverpool LHCH Maple Suite 15/05/2015 149
A154 N N N Y
Liverpool LHCH Maple Suite 15/05/2015 149
A155 N N N
Liverpool LHCH Maple Suite 15/05/2015 149
A156 N N N Y
Liverpool GP (Aintree) 17/04/2015 150
A157 N N N
Liverpool GP (Aintree) 07/05/2015 152
A158 N N N
Liverpool 22 (Aintree) 09/05/2015 153
A159 N N N
Liverpool GP (Aintree) 14/05/2015 154
A160 N N N
Liverpool 6Y 15/05/2015 155
A161 N N N
Liverpool Link 6Z 15/05/2015 156
A162 N N N
Liverpool 6Y 19/05/2015 137
A163 Y N N Y
Liverpool 6Y 19/05/2015 158
A164 N N N
Newcastle 01/07/2008 8 B1 N N N 0C1A 10
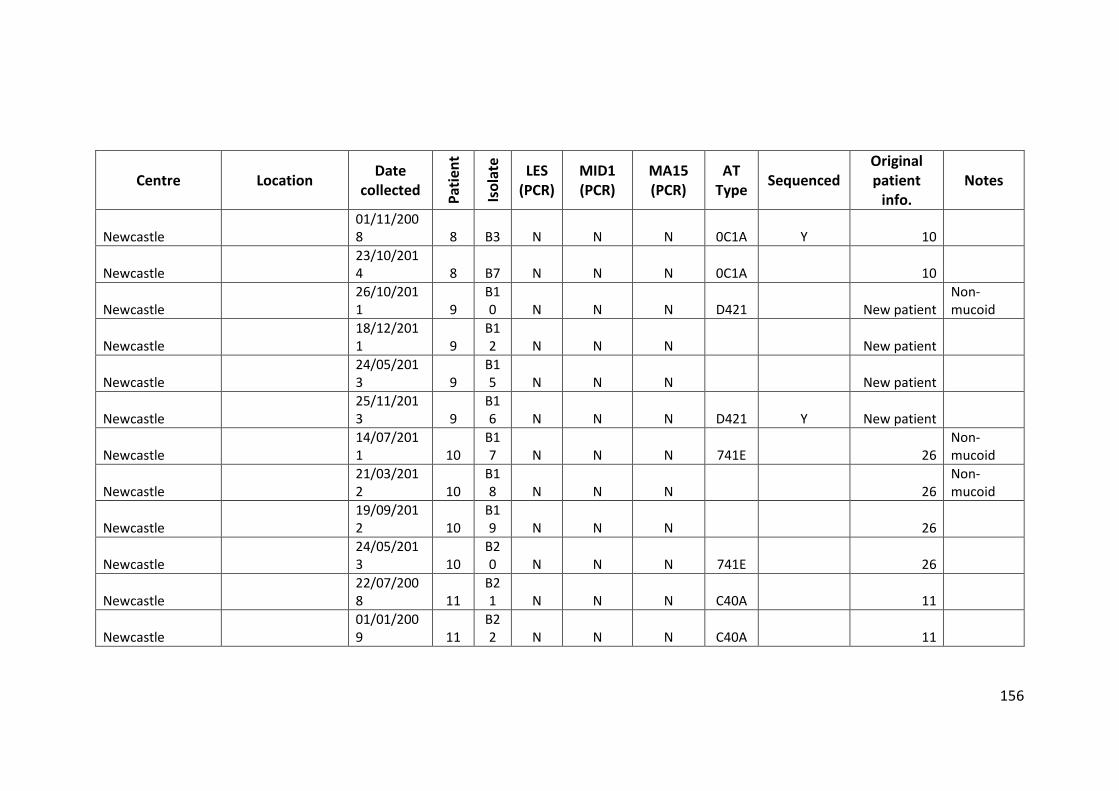
156
Centre Location Date
collected
Pat
ien
t
Iso
late
LES (PCR)
MID1 (PCR)
MA15 (PCR)
AT Type
Sequenced
Original patient
info. Notes
Newcastle 01/11/2008 8 B3 N N N 0C1A Y 10
Newcastle 23/10/2014 8 B7 N N N 0C1A 10
Newcastle 26/10/2011 9
B10 N N N D421 New patient
Non-mucoid
Newcastle 18/12/2011 9
B12 N N N New patient
Newcastle 24/05/2013 9
B15 N N N New patient
Newcastle 25/11/2013 9
B16 N N N D421 Y New patient
Newcastle 14/07/2011 10
B17 N N N 741E 26
Non-mucoid
Newcastle 21/03/2012 10
B18 N N N 26
Non-mucoid
Newcastle 19/09/2012 10
B19 N N N 26
Newcastle 24/05/2013 10
B20 N N N 741E 26
Newcastle 22/07/2008 11
B21 N N N C40A 11
Newcastle 01/01/2009 11
B22 N N N C40A 11
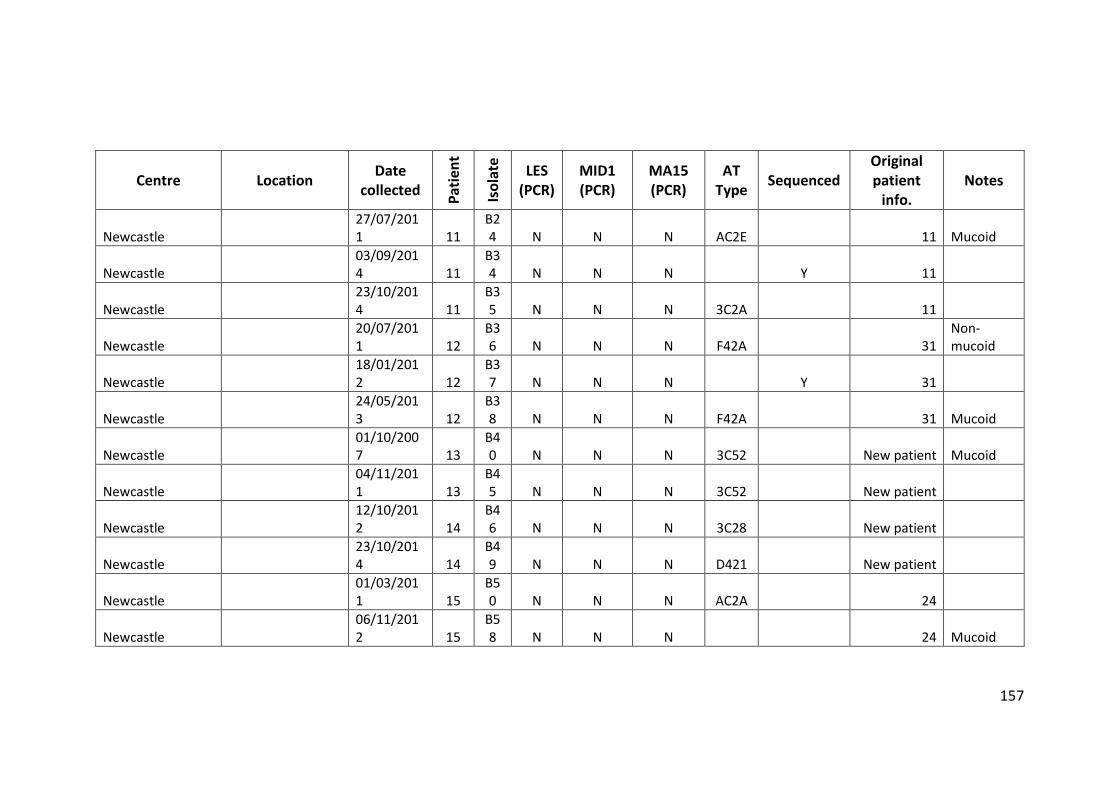
157
Centre Location Date
collected
Pat
ien
t
Iso
late
LES (PCR)
MID1 (PCR)
MA15 (PCR)
AT Type
Sequenced
Original patient
info. Notes
Newcastle 27/07/2011 11
B24 N N N AC2E 11 Mucoid
Newcastle 03/09/2014 11
B34 N N N Y 11
Newcastle 23/10/2014 11
B35 N N N 3C2A 11
Newcastle 20/07/2011 12
B36 N N N F42A 31
Non-mucoid
Newcastle 18/01/2012 12
B37 N N N Y 31
Newcastle 24/05/2013 12
B38 N N N F42A 31 Mucoid
Newcastle 01/10/2007 13
B40 N N N 3C52 New patient Mucoid
Newcastle 04/11/2011 13
B45 N N N 3C52 New patient
Newcastle 12/10/2012 14
B46 N N N 3C28 New patient
Newcastle 23/10/2014 14
B49 N N N D421 New patient
Newcastle 01/03/2011 15
B50 N N N AC2A 24
Newcastle 06/11/2012 15
B58 N N N 24 Mucoid
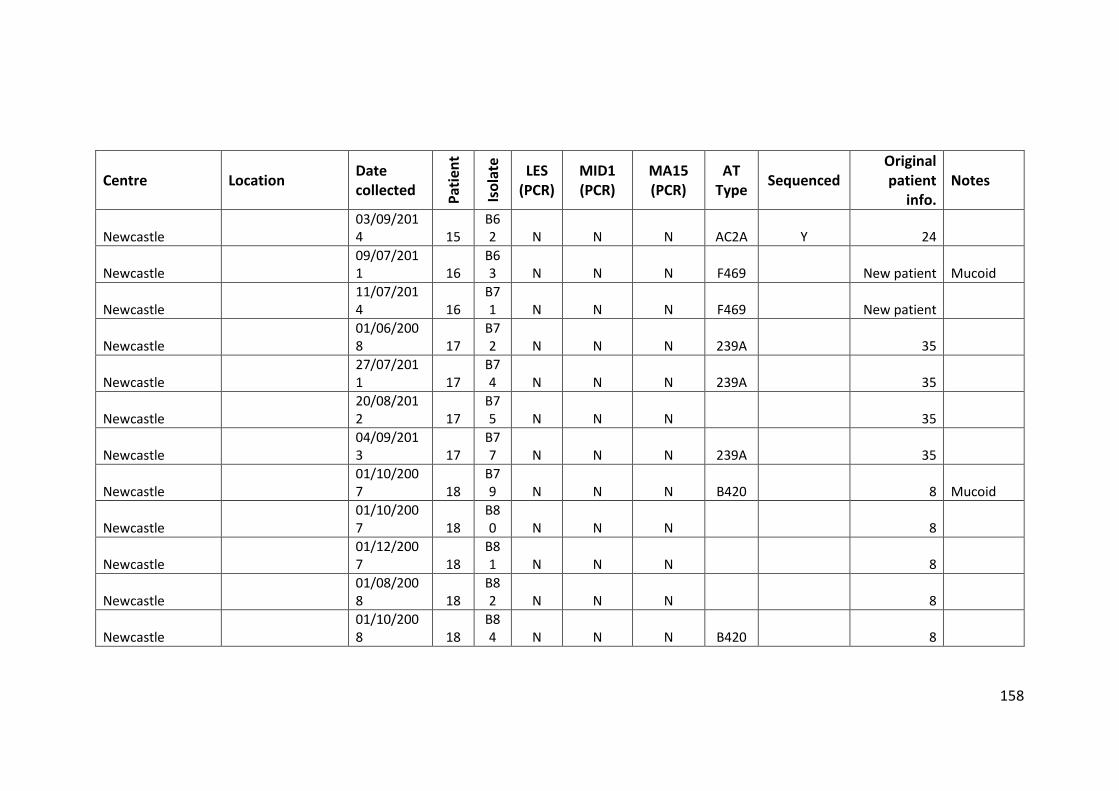
158
Centre Location Date collected
Pat
ien
t
Iso
late
LES (PCR)
MID1 (PCR)
MA15 (PCR)
AT Type
Sequenced
Original patient
info. Notes
Newcastle 03/09/2014 15
B62 N N N AC2A Y 24
Newcastle 09/07/2011 16
B63 N N N F469 New patient Mucoid
Newcastle 11/07/2014 16
B71 N N N F469 New patient
Newcastle 01/06/2008 17
B72 N N N 239A 35
Newcastle 27/07/2011 17
B74 N N N 239A 35
Newcastle 20/08/2012 17
B75 N N N 35
Newcastle 04/09/2013 17
B77 N N N 239A 35
Newcastle 01/10/2007 18
B79 N N N B420 8 Mucoid
Newcastle 01/10/2007 18
B80 N N N 8
Newcastle 01/12/2007 18
B81 N N N 8
Newcastle 01/08/2008 18
B82 N N N 8
Newcastle 01/10/2008 18
B84 N N N B420 8
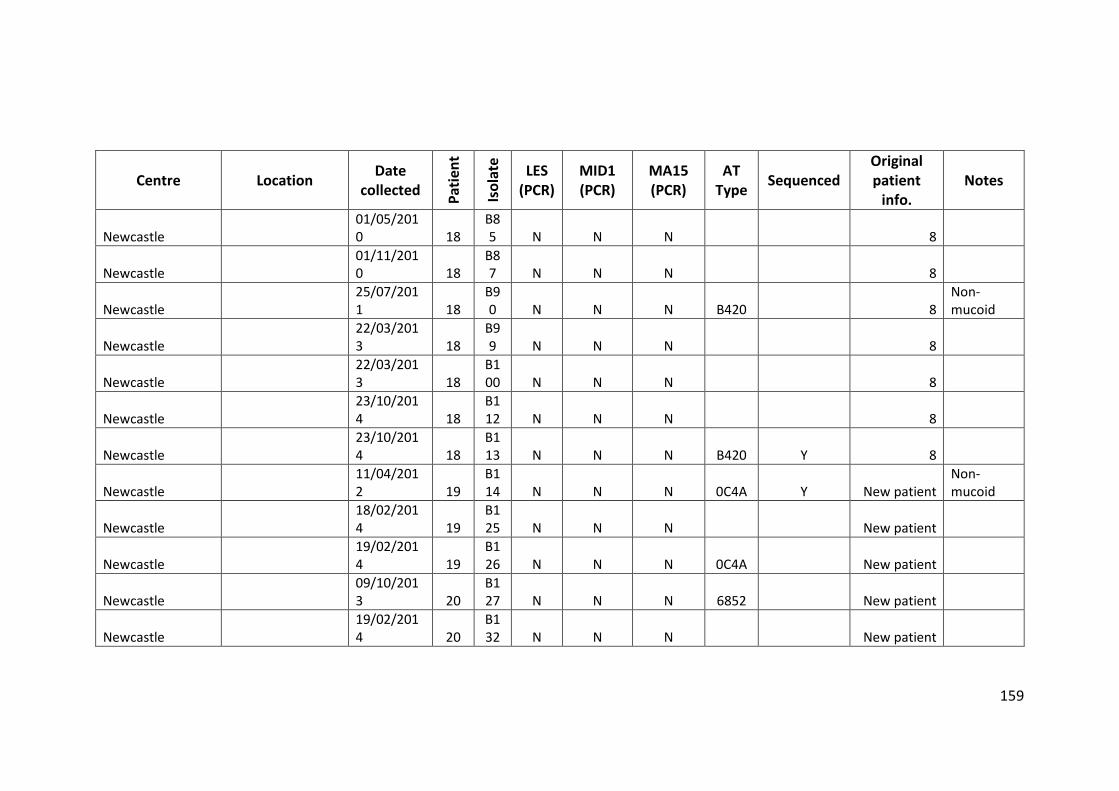
159
Centre Location Date
collected
Pat
ien
t
Iso
late
LES (PCR)
MID1 (PCR)
MA15 (PCR)
AT Type
Sequenced
Original patient
info. Notes
Newcastle 01/05/2010 18
B85 N N N 8
Newcastle 01/11/2010 18
B87 N N N 8
Newcastle 25/07/2011 18
B90 N N N B420 8
Non-mucoid
Newcastle 22/03/2013 18
B99 N N N 8
Newcastle 22/03/2013 18
B100 N N N 8
Newcastle 23/10/2014 18
B112 N N N 8
Newcastle 23/10/2014 18
B113 N N N B420 Y 8
Newcastle 11/04/2012 19
B114 N N N 0C4A Y New patient
Non-mucoid
Newcastle 18/02/2014 19
B125 N N N New patient
Newcastle 19/02/2014 19
B126 N N N 0C4A New patient
Newcastle 09/10/2013 20
B127 N N N 6852 New patient
Newcastle 19/02/2014 20
B132 N N N New patient
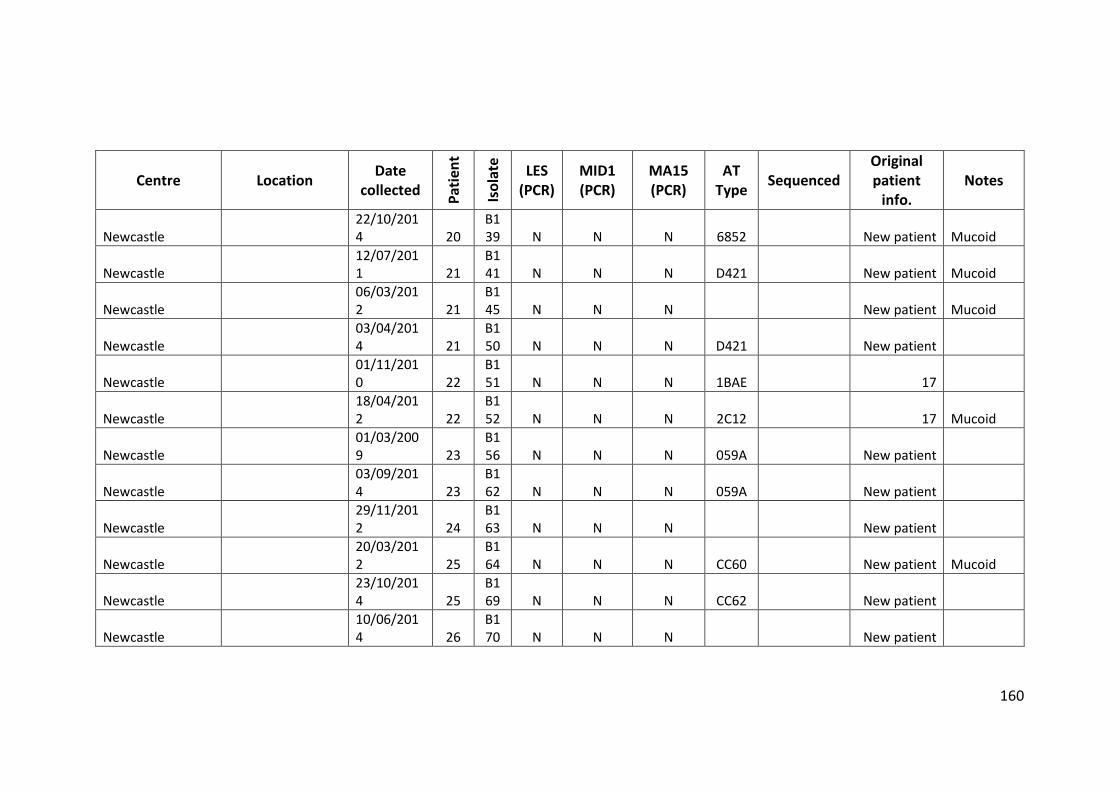
160
Centre Location Date
collected
Pat
ien
t
Iso
late
LES (PCR)
MID1 (PCR)
MA15 (PCR)
AT Type
Sequenced
Original patient
info. Notes
Newcastle 22/10/2014 20
B139 N N N 6852 New patient Mucoid
Newcastle 12/07/2011 21
B141 N N N D421 New patient Mucoid
Newcastle 06/03/2012 21
B145 N N N New patient Mucoid
Newcastle 03/04/2014 21
B150 N N N D421 New patient
Newcastle 01/11/2010 22
B151 N N N 1BAE 17
Newcastle 18/04/2012 22
B152 N N N 2C12 17 Mucoid
Newcastle 01/03/2009 23
B156 N N N 059A New patient
Newcastle 03/09/2014 23
B162 N N N 059A New patient
Newcastle 29/11/2012 24
B163 N N N New patient
Newcastle 20/03/2012 25
B164 N N N CC60 New patient Mucoid
Newcastle 23/10/2014 25
B169 N N N CC62 New patient
Newcastle 10/06/2014 26
B170 N N N New patient
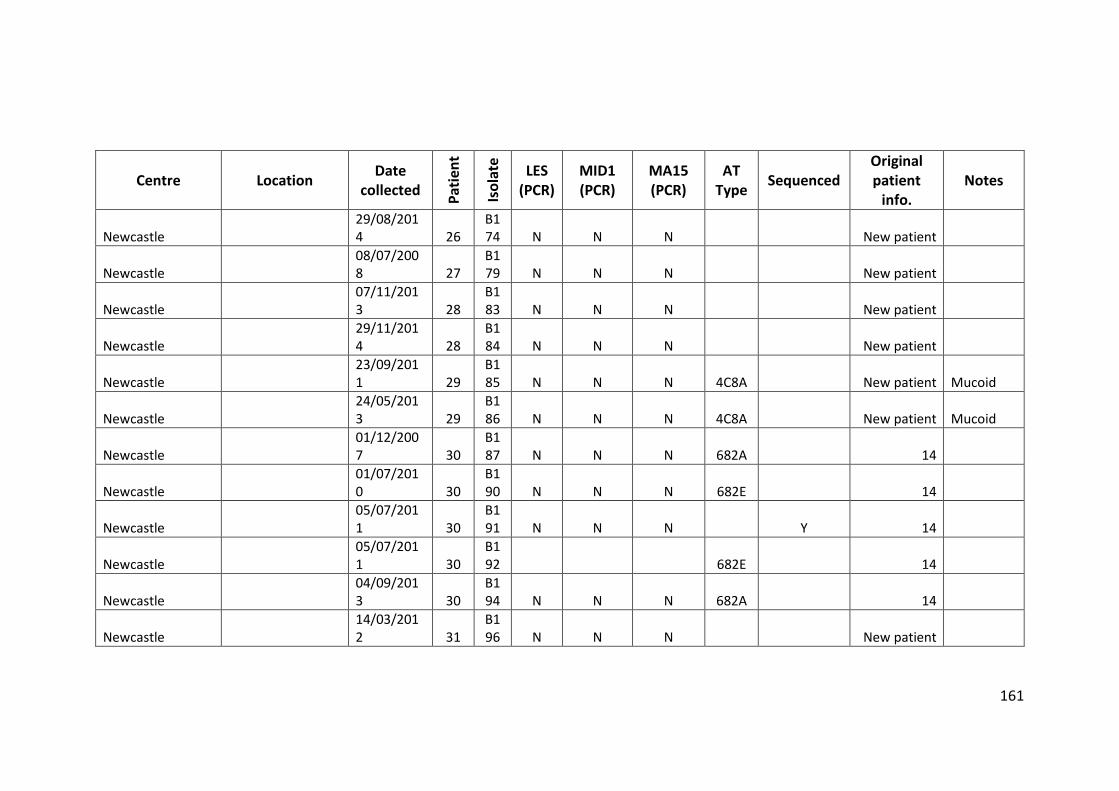
161
Centre Location Date
collected
Pat
ien
t
Iso
late
LES (PCR)
MID1 (PCR)
MA15 (PCR)
AT Type
Sequenced
Original patient
info. Notes
Newcastle 29/08/2014 26
B174 N N N New patient
Newcastle 08/07/2008 27
B179 N N N New patient
Newcastle 07/11/2013 28
B183 N N N New patient
Newcastle 29/11/2014 28
B184 N N N New patient
Newcastle 23/09/2011 29
B185 N N N 4C8A New patient Mucoid
Newcastle 24/05/2013 29
B186 N N N 4C8A New patient Mucoid
Newcastle 01/12/2007 30
B187 N N N 682A 14
Newcastle 01/07/2010 30
B190 N N N 682E 14
Newcastle 05/07/2011 30
B191 N N N Y 14
Newcastle 05/07/2011 30
B192 682E 14
Newcastle 04/09/2013 30
B194 N N N 682A 14
Newcastle 14/03/2012 31
B196 N N N New patient
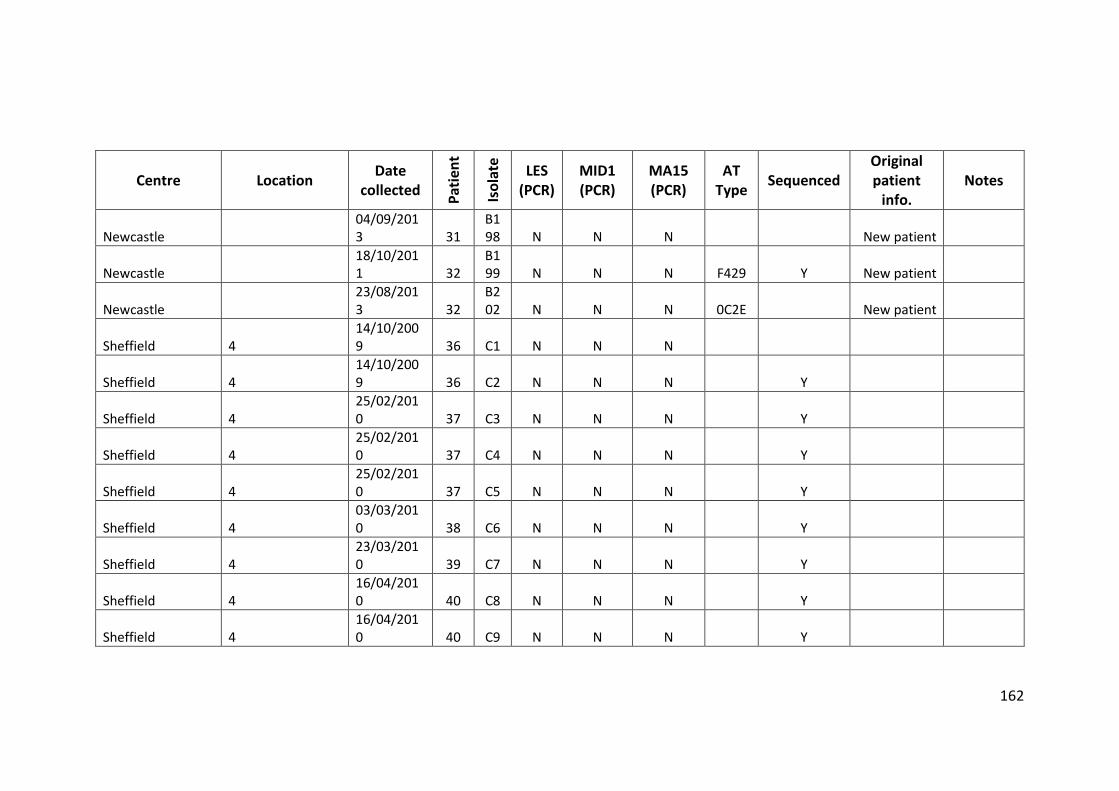
162
Centre Location Date
collected
Pat
ien
t
Iso
late
LES (PCR)
MID1 (PCR)
MA15 (PCR)
AT Type
Sequenced
Original patient
info. Notes
Newcastle 04/09/2013 31
B198 N N N New patient
Newcastle 18/10/2011 32
B199 N N N F429 Y New patient
Newcastle 23/08/2013 32
B202 N N N 0C2E New patient
Sheffield 4 14/10/2009 36 C1 N N N
Sheffield 4 14/10/2009 36 C2 N N N Y
Sheffield 4 25/02/2010 37 C3 N N N Y
Sheffield 4 25/02/2010 37 C4 N N N Y
Sheffield 4 25/02/2010 37 C5 N N N Y
Sheffield 4 03/03/2010 38 C6 N N N Y
Sheffield 4 23/03/2010 39 C7 N N N Y
Sheffield 4 16/04/2010 40 C8 N N N Y
Sheffield 4 16/04/2010 40 C9 N N N Y
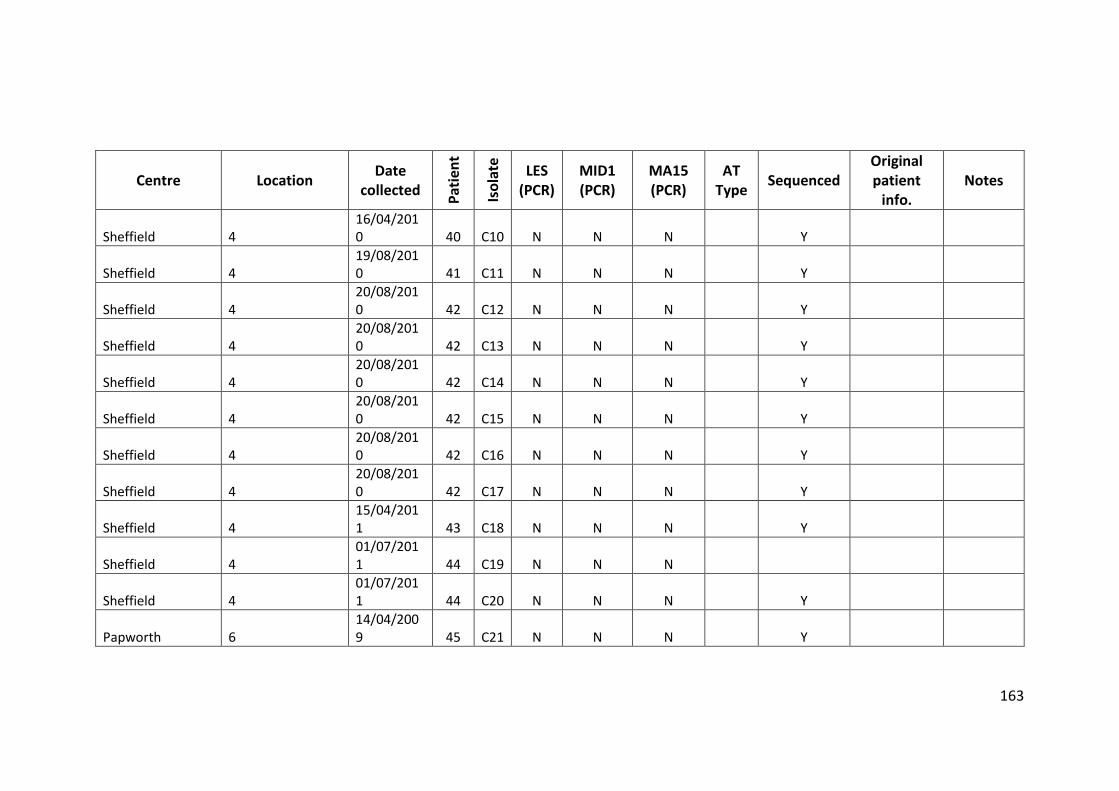
163
Centre Location Date
collected
Pat
ien
t
Iso
late
LES (PCR)
MID1 (PCR)
MA15 (PCR)
AT Type
Sequenced
Original patient
info. Notes
Sheffield 4 16/04/2010 40 C10 N N N Y
Sheffield 4 19/08/2010 41 C11 N N N Y
Sheffield 4 20/08/2010 42 C12 N N N Y
Sheffield 4 20/08/2010 42 C13 N N N Y
Sheffield 4 20/08/2010 42 C14 N N N Y
Sheffield 4 20/08/2010 42 C15 N N N Y
Sheffield 4 20/08/2010 42 C16 N N N Y
Sheffield 4 20/08/2010 42 C17 N N N Y
Sheffield 4 15/04/2011 43 C18 N N N Y
Sheffield 4 01/07/2011 44 C19 N N N
Sheffield 4 01/07/2011 44 C20 N N N Y
Papworth 6 14/04/2009 45 C21 N N N Y
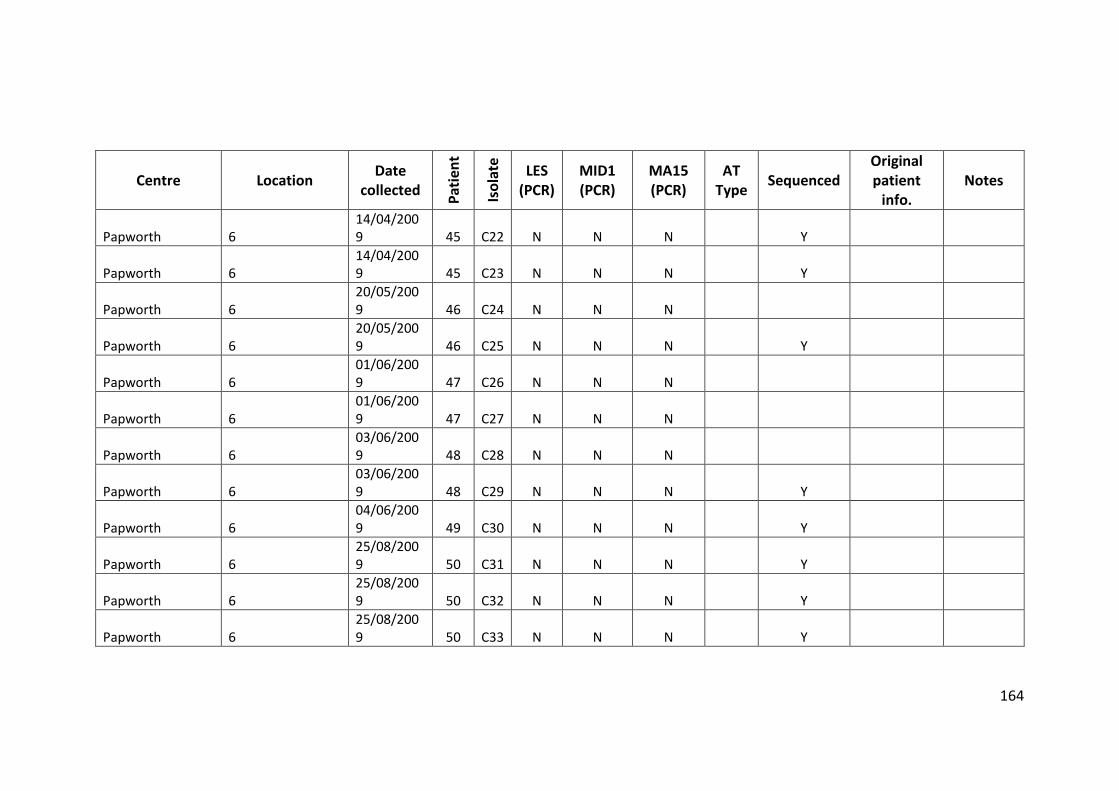
164
Centre Location Date
collected
Pat
ien
t
Iso
late
LES (PCR)
MID1 (PCR)
MA15 (PCR)
AT Type
Sequenced
Original patient
info. Notes
Papworth 6 14/04/2009 45 C22 N N N Y
Papworth 6 14/04/2009 45 C23 N N N Y
Papworth 6 20/05/2009 46 C24 N N N
Papworth 6 20/05/2009 46 C25 N N N Y
Papworth 6 01/06/2009 47 C26 N N N
Papworth 6 01/06/2009 47 C27 N N N
Papworth 6 03/06/2009 48 C28 N N N
Papworth 6 03/06/2009 48 C29 N N N Y
Papworth 6 04/06/2009 49 C30 N N N Y
Papworth 6 25/08/2009 50 C31 N N N Y
Papworth 6 25/08/2009 50 C32 N N N Y
Papworth 6 25/08/2009 50 C33 N N N Y
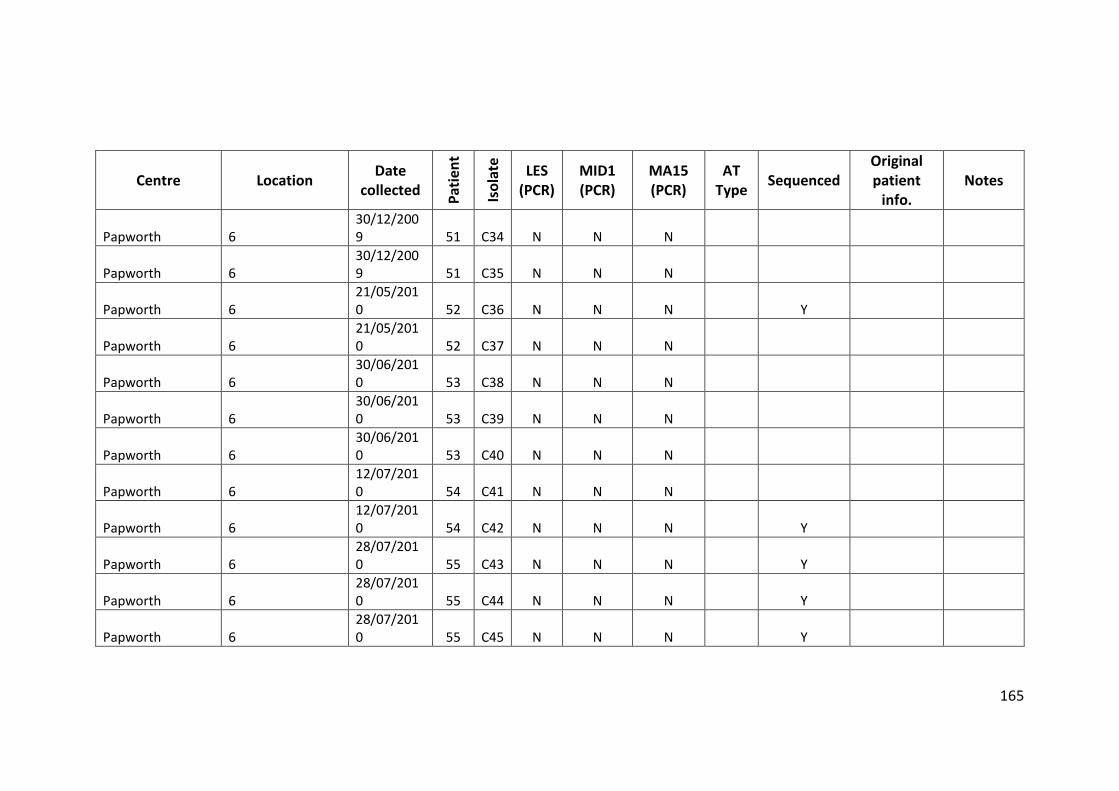
165
Centre Location Date
collected
Pat
ien
t
Iso
late
LES (PCR)
MID1 (PCR)
MA15 (PCR)
AT Type
Sequenced
Original patient
info. Notes
Papworth 6 30/12/2009 51 C34 N N N
Papworth 6 30/12/2009 51 C35 N N N
Papworth 6 21/05/2010 52 C36 N N N Y
Papworth 6 21/05/2010 52 C37 N N N
Papworth 6 30/06/2010 53 C38 N N N
Papworth 6 30/06/2010 53 C39 N N N
Papworth 6 30/06/2010 53 C40 N N N
Papworth 6 12/07/2010 54 C41 N N N
Papworth 6 12/07/2010 54 C42 N N N Y
Papworth 6 28/07/2010 55 C43 N N N Y
Papworth 6 28/07/2010 55 C44 N N N Y
Papworth 6 28/07/2010 55 C45 N N N Y
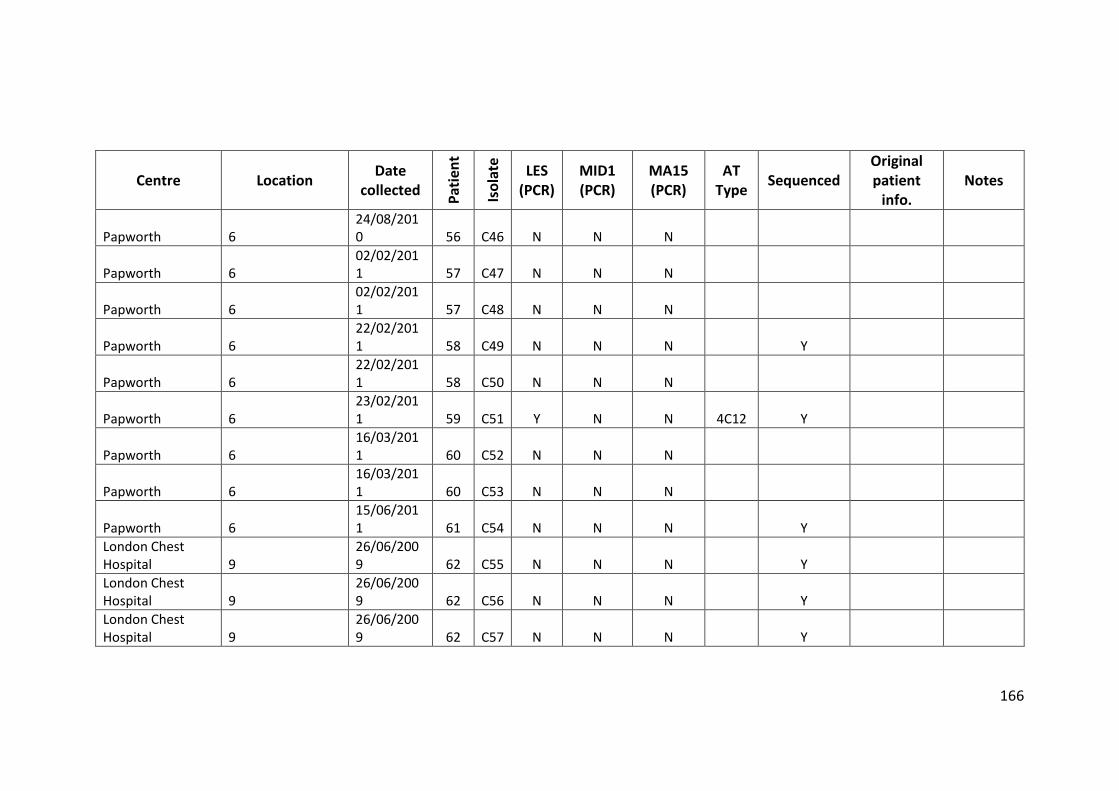
166
Centre Location Date
collected
Pat
ien
t
Iso
late
LES (PCR)
MID1 (PCR)
MA15 (PCR)
AT Type
Sequenced
Original patient
info. Notes
Papworth 6 24/08/2010 56 C46 N N N
Papworth 6 02/02/2011 57 C47 N N N
Papworth 6 02/02/2011 57 C48 N N N
Papworth 6 22/02/2011 58 C49 N N N Y
Papworth 6 22/02/2011 58 C50 N N N
Papworth 6 23/02/2011 59 C51 Y N N 4C12 Y
Papworth 6 16/03/2011 60 C52 N N N
Papworth 6 16/03/2011 60 C53 N N N
Papworth 6 15/06/2011 61 C54 N N N Y
London Chest Hospital 9
26/06/2009 62 C55 N N N Y
London Chest Hospital 9
26/06/2009 62 C56 N N N Y
London Chest Hospital 9
26/06/2009 62 C57 N N N Y
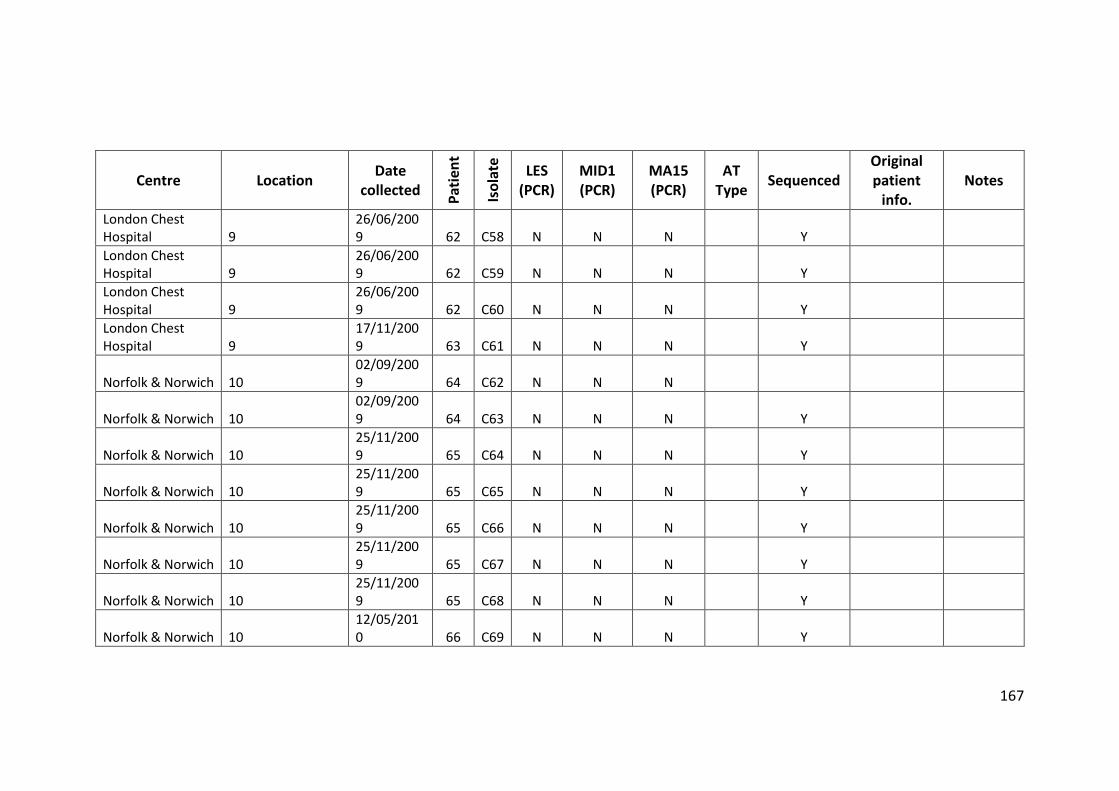
167
Centre Location Date
collected
Pat
ien
t
Iso
late
LES (PCR)
MID1 (PCR)
MA15 (PCR)
AT Type
Sequenced
Original patient
info. Notes
London Chest Hospital 9
26/06/2009 62 C58 N N N Y
London Chest Hospital 9
26/06/2009 62 C59 N N N Y
London Chest Hospital 9
26/06/2009 62 C60 N N N Y
London Chest Hospital 9
17/11/2009 63 C61 N N N Y
Norfolk & Norwich 10 02/09/2009 64 C62 N N N
Norfolk & Norwich 10 02/09/2009 64 C63 N N N Y
Norfolk & Norwich 10 25/11/2009 65 C64 N N N Y
Norfolk & Norwich 10 25/11/2009 65 C65 N N N Y
Norfolk & Norwich 10 25/11/2009 65 C66 N N N Y
Norfolk & Norwich 10 25/11/2009 65 C67 N N N Y
Norfolk & Norwich 10 25/11/2009 65 C68 N N N Y
Norfolk & Norwich 10 12/05/2010 66 C69 N N N Y
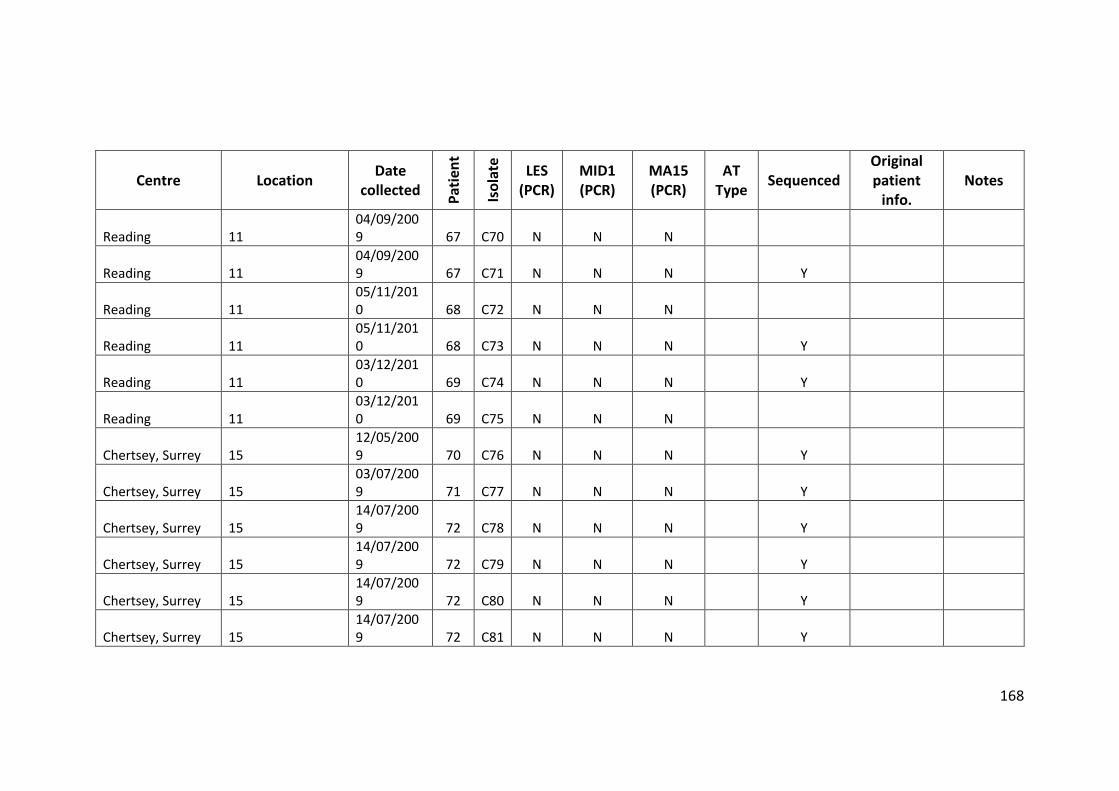
168
Centre Location Date
collected
Pat
ien
t
Iso
late
LES (PCR)
MID1 (PCR)
MA15 (PCR)
AT Type
Sequenced
Original patient
info. Notes
Reading 11 04/09/2009 67 C70 N N N
Reading 11 04/09/2009 67 C71 N N N Y
Reading 11 05/11/2010 68 C72 N N N
Reading 11 05/11/2010 68 C73 N N N Y
Reading 11 03/12/2010 69 C74 N N N Y
Reading 11 03/12/2010 69 C75 N N N
Chertsey, Surrey 15 12/05/2009 70 C76 N N N Y
Chertsey, Surrey 15 03/07/2009 71 C77 N N N Y
Chertsey, Surrey 15 14/07/2009 72 C78 N N N Y
Chertsey, Surrey 15 14/07/2009 72 C79 N N N Y
Chertsey, Surrey 15 14/07/2009 72 C80 N N N Y
Chertsey, Surrey 15 14/07/2009 72 C81 N N N Y
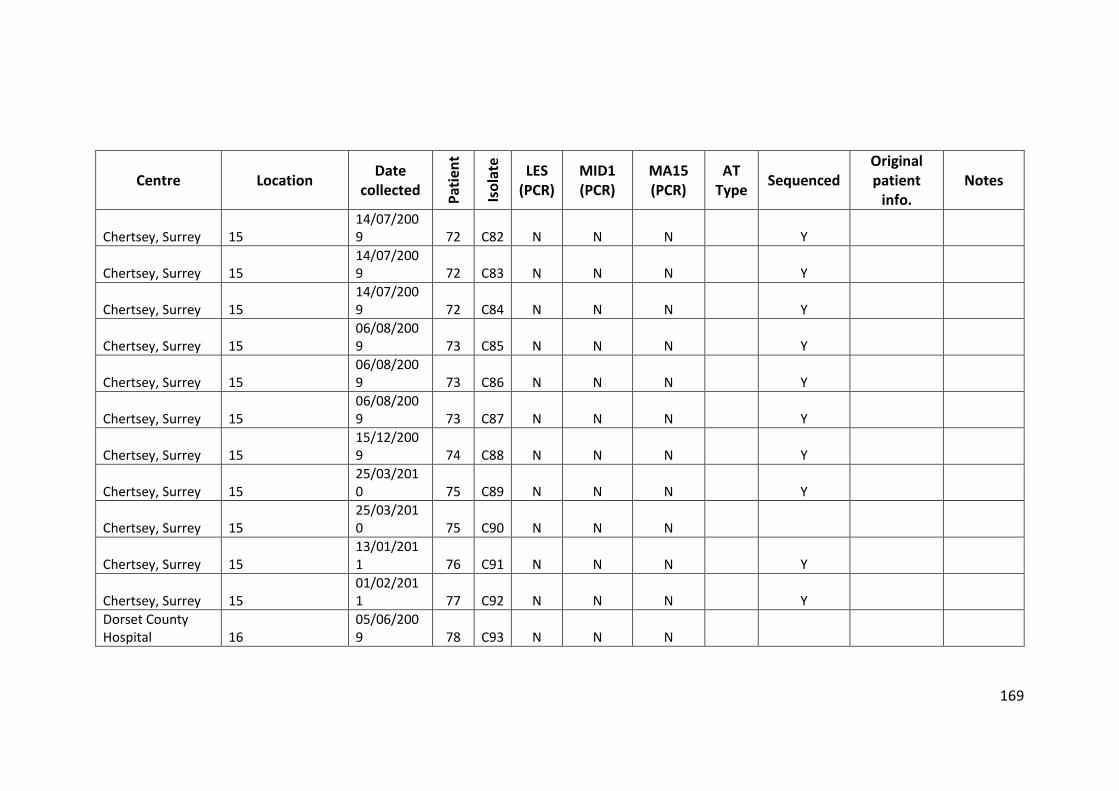
169
Centre Location Date
collected
Pat
ien
t
Iso
late
LES (PCR)
MID1 (PCR)
MA15 (PCR)
AT Type
Sequenced
Original patient
info. Notes
Chertsey, Surrey 15 14/07/2009 72 C82 N N N Y
Chertsey, Surrey 15 14/07/2009 72 C83 N N N Y
Chertsey, Surrey 15 14/07/2009 72 C84 N N N Y
Chertsey, Surrey 15 06/08/2009 73 C85 N N N Y
Chertsey, Surrey 15 06/08/2009 73 C86 N N N Y
Chertsey, Surrey 15 06/08/2009 73 C87 N N N Y
Chertsey, Surrey 15 15/12/2009 74 C88 N N N Y
Chertsey, Surrey 15 25/03/2010 75 C89 N N N Y
Chertsey, Surrey 15 25/03/2010 75 C90 N N N
Chertsey, Surrey 15 13/01/2011 76 C91 N N N Y
Chertsey, Surrey 15 01/02/2011 77 C92 N N N Y
Dorset County Hospital 16
05/06/2009 78 C93 N N N
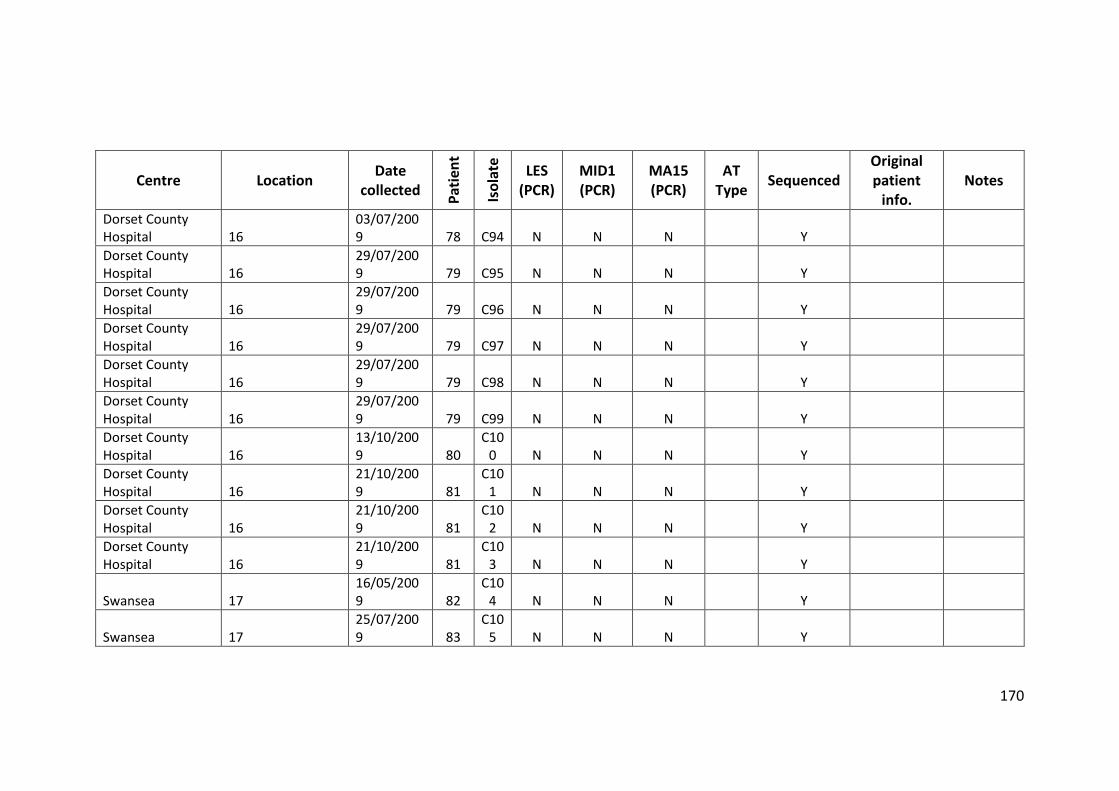
170
Centre Location Date
collected
Pat
ien
t
Iso
late
LES (PCR)
MID1 (PCR)
MA15 (PCR)
AT Type
Sequenced
Original patient
info. Notes
Dorset County Hospital 16
03/07/2009 78 C94 N N N Y
Dorset County Hospital 16
29/07/2009 79 C95 N N N Y
Dorset County Hospital 16
29/07/2009 79 C96 N N N Y
Dorset County Hospital 16
29/07/2009 79 C97 N N N Y
Dorset County Hospital 16
29/07/2009 79 C98 N N N Y
Dorset County Hospital 16
29/07/2009 79 C99 N N N Y
Dorset County Hospital 16
13/10/2009 80
C100 N N N Y
Dorset County Hospital 16
21/10/2009 81
C101 N N N Y
Dorset County Hospital 16
21/10/2009 81
C102 N N N Y
Dorset County Hospital 16
21/10/2009 81
C103 N N N Y
Swansea 17 16/05/2009 82
C104 N N N Y
Swansea 17 25/07/2009 83
C105 N N N Y
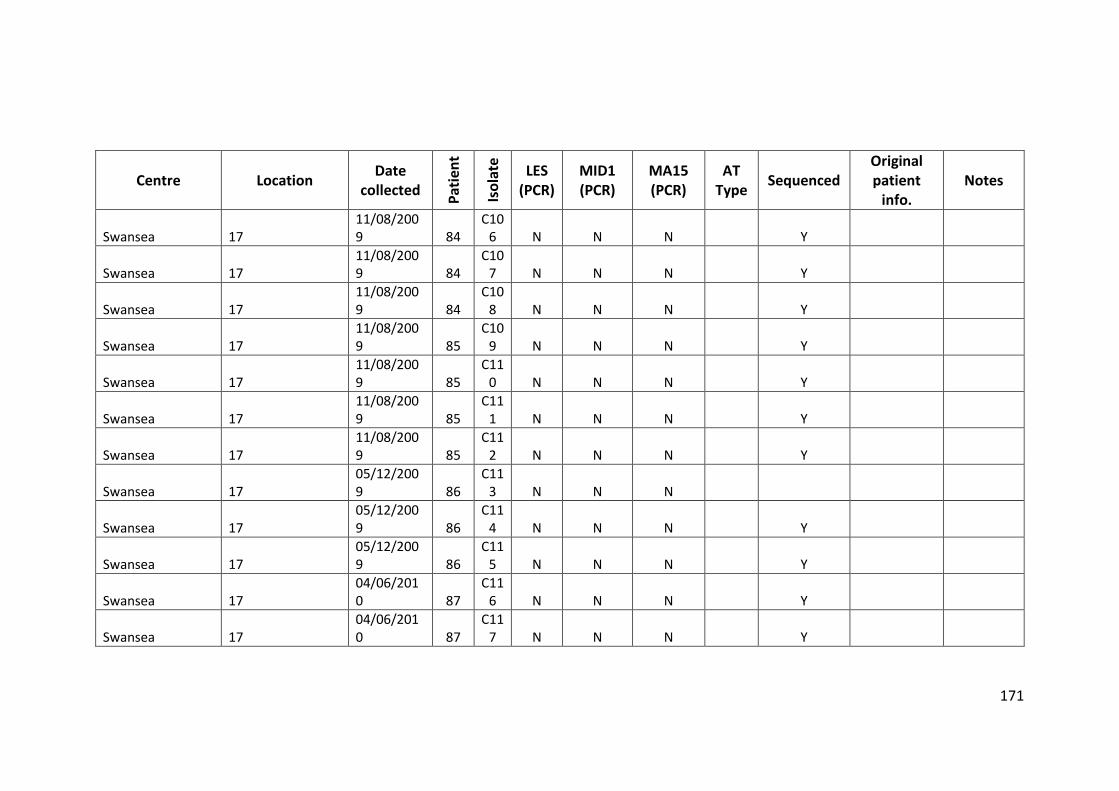
171
Centre Location Date
collected
Pat
ien
t
Iso
late
LES (PCR)
MID1 (PCR)
MA15 (PCR)
AT Type
Sequenced
Original patient
info. Notes
Swansea 17 11/08/2009 84
C106 N N N Y
Swansea 17 11/08/2009 84
C107 N N N Y
Swansea 17 11/08/2009 84
C108 N N N Y
Swansea 17 11/08/2009 85
C109 N N N Y
Swansea 17 11/08/2009 85
C110 N N N Y
Swansea 17 11/08/2009 85
C111 N N N Y
Swansea 17 11/08/2009 85
C112 N N N Y
Swansea 17 05/12/2009 86
C113 N N N
Swansea 17 05/12/2009 86
C114 N N N Y
Swansea 17 05/12/2009 86
C115 N N N Y
Swansea 17 04/06/2010 87
C116 N N N Y
Swansea 17 04/06/2010 87
C117 N N N Y
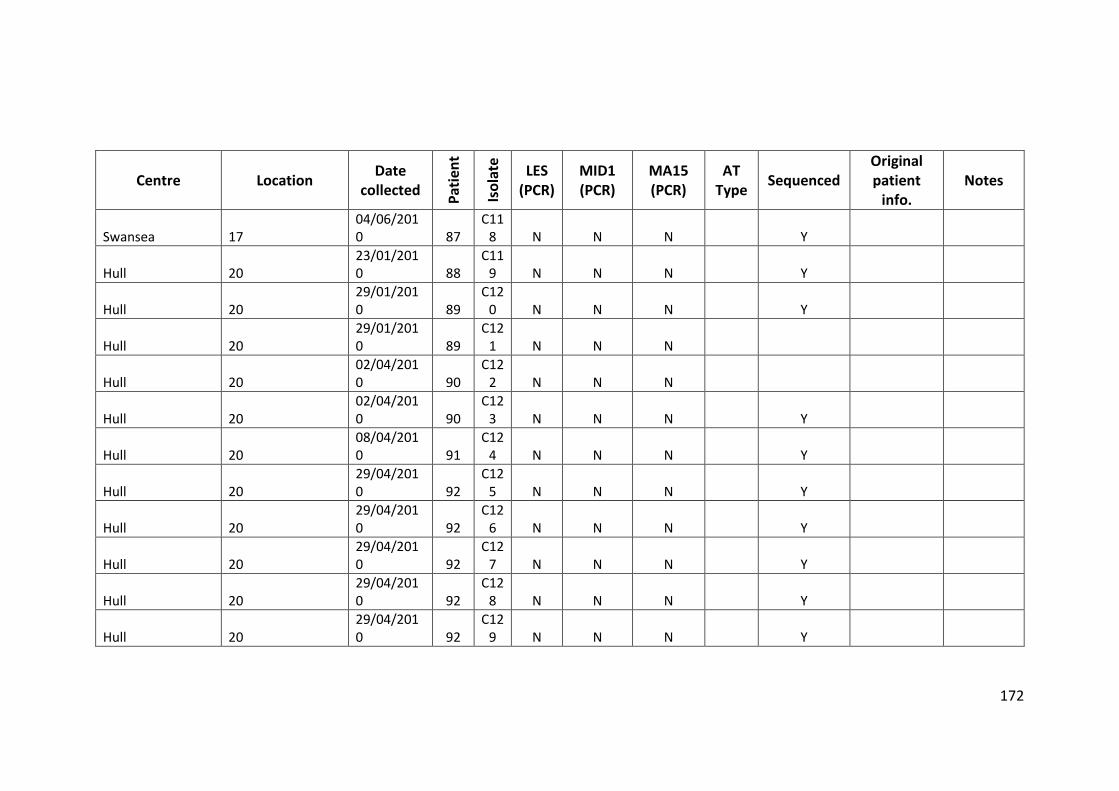
172
Centre Location Date
collected
Pat
ien
t
Iso
late
LES (PCR)
MID1 (PCR)
MA15 (PCR)
AT Type
Sequenced
Original patient
info. Notes
Swansea 17 04/06/2010 87
C118 N N N Y
Hull 20 23/01/2010 88
C119 N N N Y
Hull 20 29/01/2010 89
C120 N N N Y
Hull 20 29/01/2010 89
C121 N N N
Hull 20 02/04/2010 90
C122 N N N
Hull 20 02/04/2010 90
C123 N N N Y
Hull 20 08/04/2010 91
C124 N N N Y
Hull 20 29/04/2010 92
C125 N N N Y
Hull 20 29/04/2010 92
C126 N N N Y
Hull 20 29/04/2010 92
C127 N N N Y
Hull 20 29/04/2010 92
C128 N N N Y
Hull 20 29/04/2010 92
C129 N N N Y
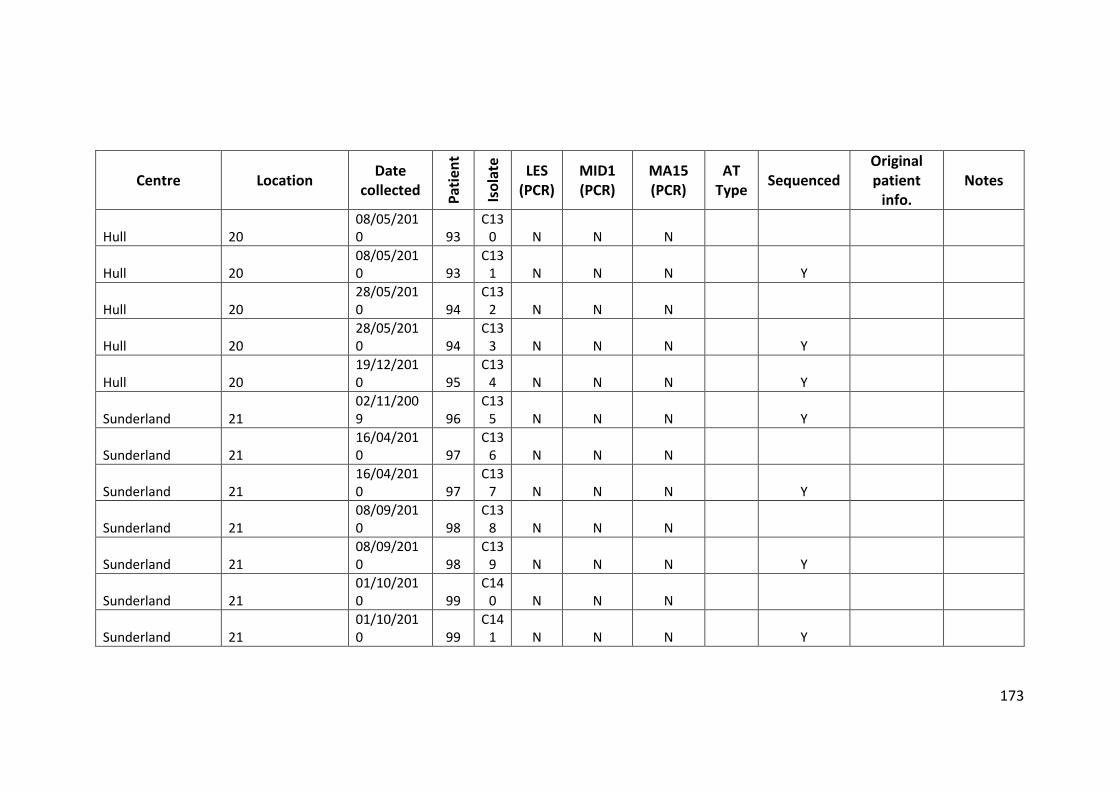
173
Centre Location Date
collected
Pat
ien
t
Iso
late
LES (PCR)
MID1 (PCR)
MA15 (PCR)
AT Type
Sequenced
Original patient
info. Notes
Hull 20 08/05/2010 93
C130 N N N
Hull 20 08/05/2010 93
C131 N N N Y
Hull 20 28/05/2010 94
C132 N N N
Hull 20 28/05/2010 94
C133 N N N Y
Hull 20 19/12/2010 95
C134 N N N Y
Sunderland 21 02/11/2009 96
C135 N N N Y
Sunderland 21 16/04/2010 97
C136 N N N
Sunderland 21 16/04/2010 97
C137 N N N Y
Sunderland 21 08/09/2010 98
C138 N N N
Sunderland 21 08/09/2010 98
C139 N N N Y
Sunderland 21 01/10/2010 99
C140 N N N
Sunderland 21 01/10/2010 99
C141 N N N Y

174
Centre Location Date
collected
Pat
ien
t
Iso
late
LES (PCR)
MID1 (PCR)
MA15 (PCR)
AT Type
Sequenced
Original patient
info. Notes
Sunderland 21 11/02/2011 100
C142 N N N Y
Colchester 22 08/07/2010 101
C143 N N N Y
Colchester 22 08/07/2010 101
C144 N N N Y
Colchester 22 08/07/2010 101
C145 N N N Y
Colchester 23 25/06/2010 102
C146 N N N Y
Colchester 23 25/06/2010 102
C147 N N N Y
Colchester 23 25/06/2010 102
C148 N N N Y
Colchester 23 22/03/2011 103
C149 N N N Y
Portsmouth 25 27/08/2010 104
C150 N N N Y
Portsmouth 25 03/03/2011 105
C151 N N N Y
Portsmouth 25 03/03/2011 105
C152 N N N
Portsmouth 25 07/04/2011 106
C153 N N N Y
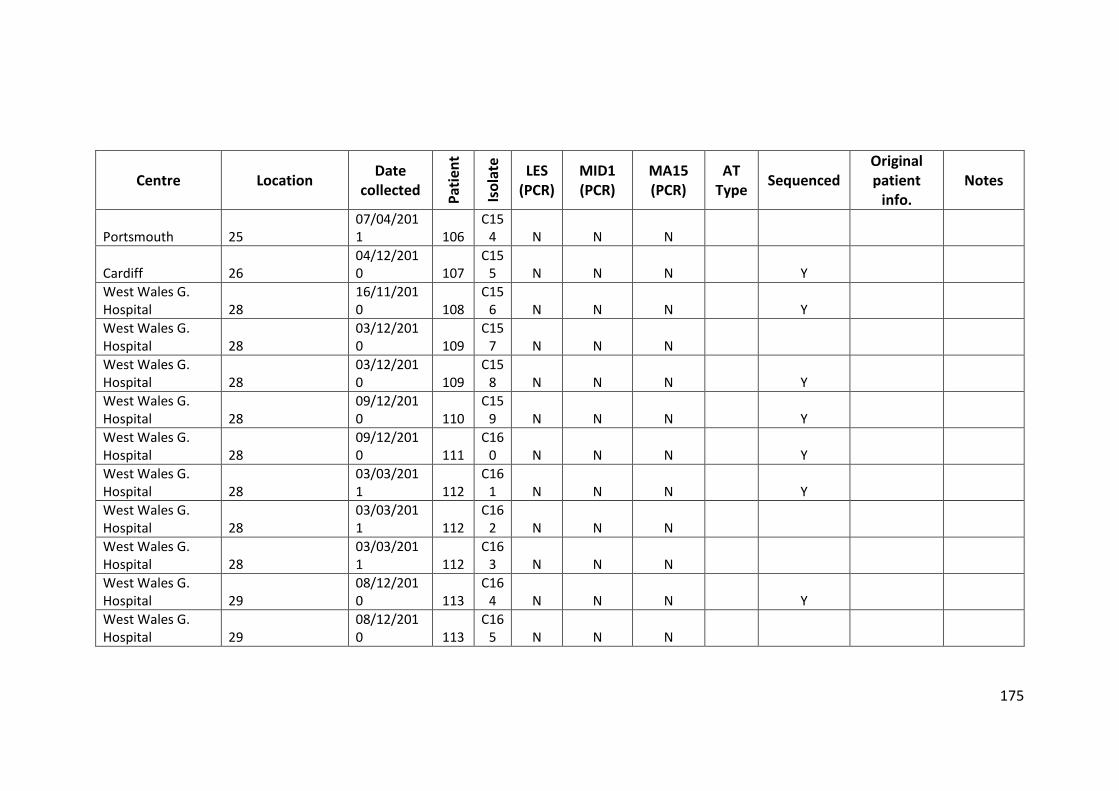
175
Centre Location Date
collected
Pat
ien
t
Iso
late
LES (PCR)
MID1 (PCR)
MA15 (PCR)
AT Type
Sequenced
Original patient
info. Notes
Portsmouth 25 07/04/2011 106
C154 N N N
Cardiff 26 04/12/2010 107
C155 N N N Y
West Wales G. Hospital 28
16/11/2010 108
C156 N N N Y
West Wales G. Hospital 28
03/12/2010 109
C157 N N N
West Wales G. Hospital 28
03/12/2010 109
C158 N N N Y
West Wales G. Hospital 28
09/12/2010 110
C159 N N N Y
West Wales G. Hospital 28
09/12/2010 111
C160 N N N Y
West Wales G. Hospital 28
03/03/2011 112
C161 N N N Y
West Wales G. Hospital 28
03/03/2011 112
C162 N N N
West Wales G. Hospital 28
03/03/2011 112
C163 N N N
West Wales G. Hospital 29
08/12/2010 113
C164 N N N Y
West Wales G. Hospital 29
08/12/2010 113
C165 N N N

176
Centre Location Date
collected
Pat
ien
t
Iso
late
LES (PCR)
MID1 (PCR)
MA15 (PCR)
AT Type
Sequenced
Original patient
info. Notes
West Wales G. Hospital 29
21/04/2011 114
C166 N N N
West Wales G. Hospital 29
21/04/2011 114
C167 N N N Y
West Wales G. Hospital 29
21/12/2010 115
C168 N N N Y
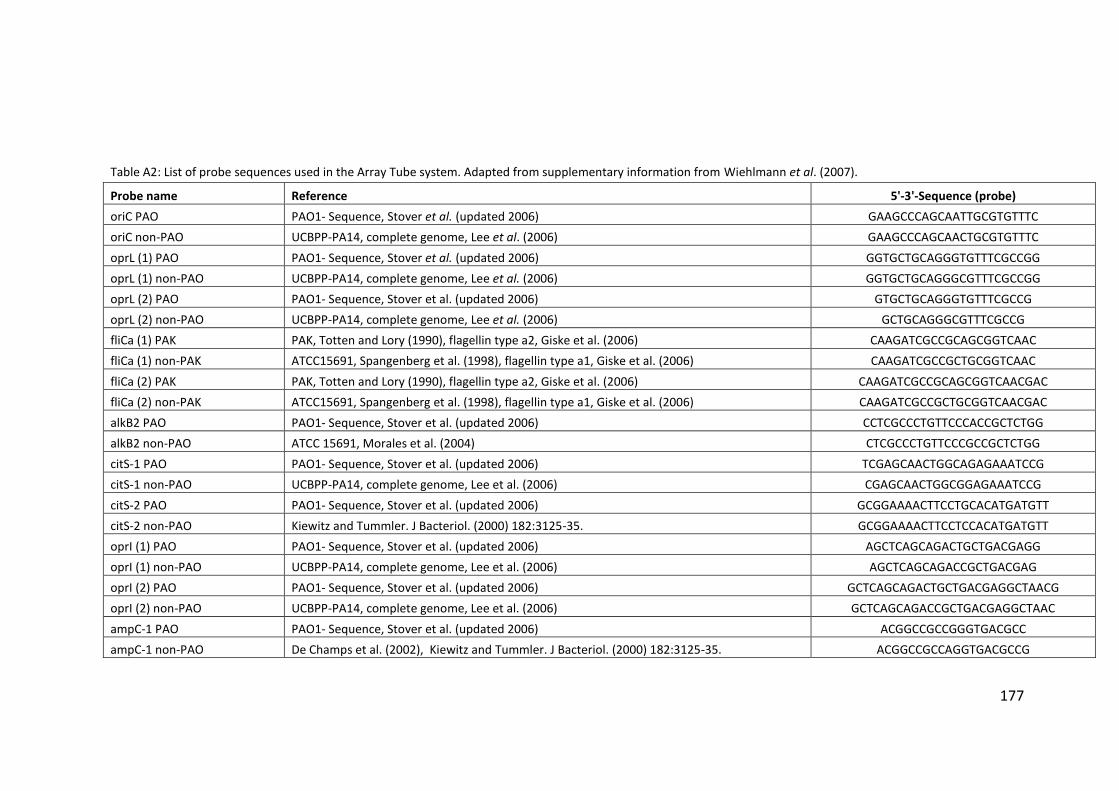
177
Table A2: List of probe sequences used in the Array Tube system. Adapted from supplementary information from Wiehlmann et al. (2007).
Probe name Reference 5'-3'-Sequence (probe)
oriC PAO PAO1- Sequence, Stover et al. (updated 2006) GAAGCCCAGCAATTGCGTGTTTC
oriC non-PAO UCBPP-PA14, complete genome, Lee et al. (2006) GAAGCCCAGCAACTGCGTGTTTC
oprL (1) PAO PAO1- Sequence, Stover et al. (updated 2006) GGTGCTGCAGGGTGTTTCGCCGG
oprL (1) non-PAO UCBPP-PA14, complete genome, Lee et al. (2006) GGTGCTGCAGGGCGTTTCGCCGG
oprL (2) PAO PAO1- Sequence, Stover et al. (updated 2006) GTGCTGCAGGGTGTTTCGCCG
oprL (2) non-PAO UCBPP-PA14, complete genome, Lee et al. (2006) GCTGCAGGGCGTTTCGCCG
fliCa (1) PAK PAK, Totten and Lory (1990), flagellin type a2, Giske et al. (2006) CAAGATCGCCGCAGCGGTCAAC
fliCa (1) non-PAK ATCC15691, Spangenberg et al. (1998), flagellin type a1, Giske et al. (2006) CAAGATCGCCGCTGCGGTCAAC
fliCa (2) PAK PAK, Totten and Lory (1990), flagellin type a2, Giske et al. (2006) CAAGATCGCCGCAGCGGTCAACGAC
fliCa (2) non-PAK ATCC15691, Spangenberg et al. (1998), flagellin type a1, Giske et al. (2006) CAAGATCGCCGCTGCGGTCAACGAC
alkB2 PAO PAO1- Sequence, Stover et al. (updated 2006) CCTCGCCCTGTTCCCACCGCTCTGG
alkB2 non-PAO ATCC 15691, Morales et al. (2004) CTCGCCCTGTTCCCGCCGCTCTGG
citS-1 PAO PAO1- Sequence, Stover et al. (updated 2006) TCGAGCAACTGGCAGAGAAATCCG
citS-1 non-PAO UCBPP-PA14, complete genome, Lee et al. (2006) CGAGCAACTGGCGGAGAAATCCG
citS-2 PAO PAO1- Sequence, Stover et al. (updated 2006) GCGGAAAACTTCCTGCACATGATGTT
citS-2 non-PAO Kiewitz and Tummler. J Bacteriol. (2000) 182:3125-35. GCGGAAAACTTCCTCCACATGATGTT
oprI (1) PAO PAO1- Sequence, Stover et al. (updated 2006) AGCTCAGCAGACTGCTGACGAGG
oprI (1) non-PAO UCBPP-PA14, complete genome, Lee et al. (2006) AGCTCAGCAGACCGCTGACGAG
oprI (2) PAO PAO1- Sequence, Stover et al. (updated 2006) GCTCAGCAGACTGCTGACGAGGCTAACG
oprI (2) non-PAO UCBPP-PA14, complete genome, Lee et al. (2006) GCTCAGCAGACCGCTGACGAGGCTAAC
ampC-1 PAO PAO1- Sequence, Stover et al. (updated 2006) ACGGCCGCCGGGTGACGCC
ampC-1 non-PAO De Champs et al. (2002), Kiewitz and Tummler. J Bacteriol. (2000) 182:3125-35. ACGGCCGCCAGGTGACGCCG
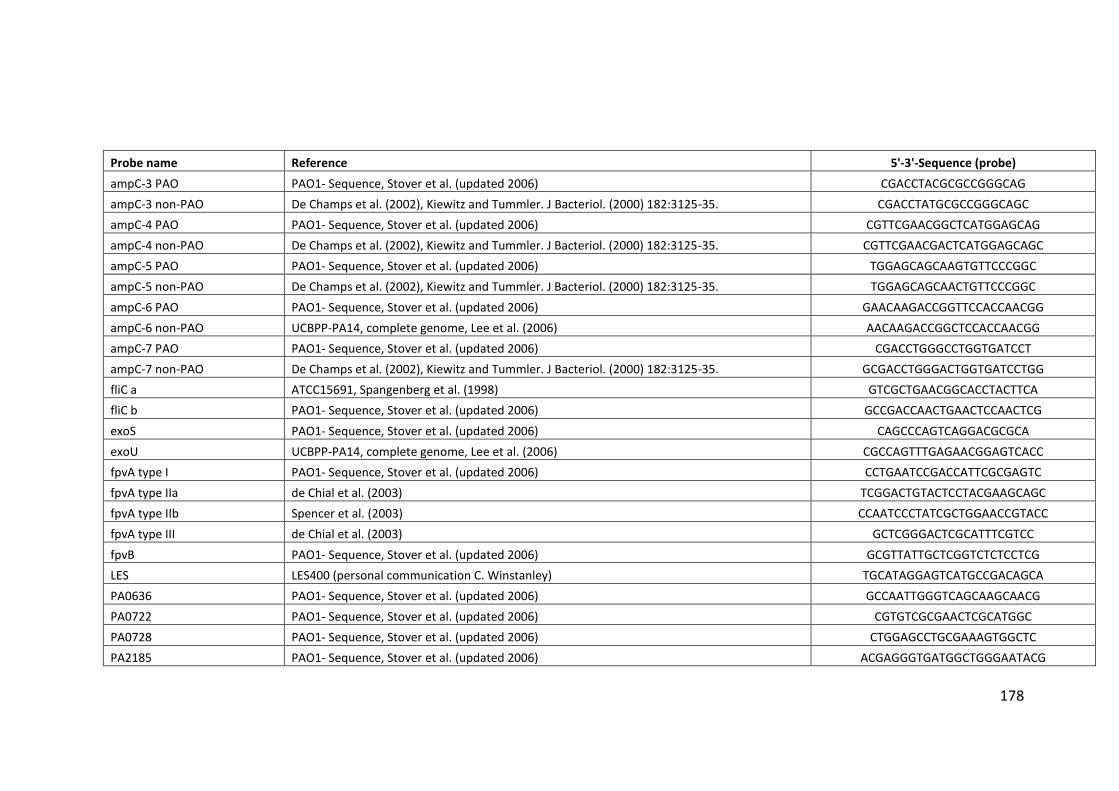
178
Probe name Reference 5'-3'-Sequence (probe)
ampC-3 PAO PAO1- Sequence, Stover et al. (updated 2006) CGACCTACGCGCCGGGCAG
ampC-3 non-PAO De Champs et al. (2002), Kiewitz and Tummler. J Bacteriol. (2000) 182:3125-35. CGACCTATGCGCCGGGCAGC
ampC-4 PAO PAO1- Sequence, Stover et al. (updated 2006) CGTTCGAACGGCTCATGGAGCAG
ampC-4 non-PAO De Champs et al. (2002), Kiewitz and Tummler. J Bacteriol. (2000) 182:3125-35. CGTTCGAACGACTCATGGAGCAGC
ampC-5 PAO PAO1- Sequence, Stover et al. (updated 2006) TGGAGCAGCAAGTGTTCCCGGC
ampC-5 non-PAO De Champs et al. (2002), Kiewitz and Tummler. J Bacteriol. (2000) 182:3125-35. TGGAGCAGCAACTGTTCCCGGC
ampC-6 PAO PAO1- Sequence, Stover et al. (updated 2006) GAACAAGACCGGTTCCACCAACGG
ampC-6 non-PAO UCBPP-PA14, complete genome, Lee et al. (2006) AACAAGACCGGCTCCACCAACGG
ampC-7 PAO PAO1- Sequence, Stover et al. (updated 2006) CGACCTGGGCCTGGTGATCCT
ampC-7 non-PAO De Champs et al. (2002), Kiewitz and Tummler. J Bacteriol. (2000) 182:3125-35. GCGACCTGGGACTGGTGATCCTGG
fliC a ATCC15691, Spangenberg et al. (1998) GTCGCTGAACGGCACCTACTTCA
fliC b PAO1- Sequence, Stover et al. (updated 2006) GCCGACCAACTGAACTCCAACTCG
exoS PAO1- Sequence, Stover et al. (updated 2006) CAGCCCAGTCAGGACGCGCA
exoU UCBPP-PA14, complete genome, Lee et al. (2006) CGCCAGTTTGAGAACGGAGTCACC
fpvA type I PAO1- Sequence, Stover et al. (updated 2006) CCTGAATCCGACCATTCGCGAGTC
fpvA type IIa de Chial et al. (2003) TCGGACTGTACTCCTACGAAGCAGC
fpvA type IIb Spencer et al. (2003) CCAATCCCTATCGCTGGAACCGTACC
fpvA type III de Chial et al. (2003) GCTCGGGACTCGCATTTCGTCC
fpvB PAO1- Sequence, Stover et al. (updated 2006) GCGTTATTGCTCGGTCTCTCCTCG
LES LES400 (personal communication C. Winstanley) TGCATAGGAGTCATGCCGACAGCA
PA0636 PAO1- Sequence, Stover et al. (updated 2006) GCCAATTGGGTCAGCAAGCAACG
PA0722 PAO1- Sequence, Stover et al. (updated 2006) CGTGTCGCGAACTCGCATGGC
PA0728 PAO1- Sequence, Stover et al. (updated 2006) CTGGAGCCTGCGAAAGTGGCTC
PA2185 PAO1- Sequence, Stover et al. (updated 2006) ACGAGGGTGATGGCTGGGAATACG
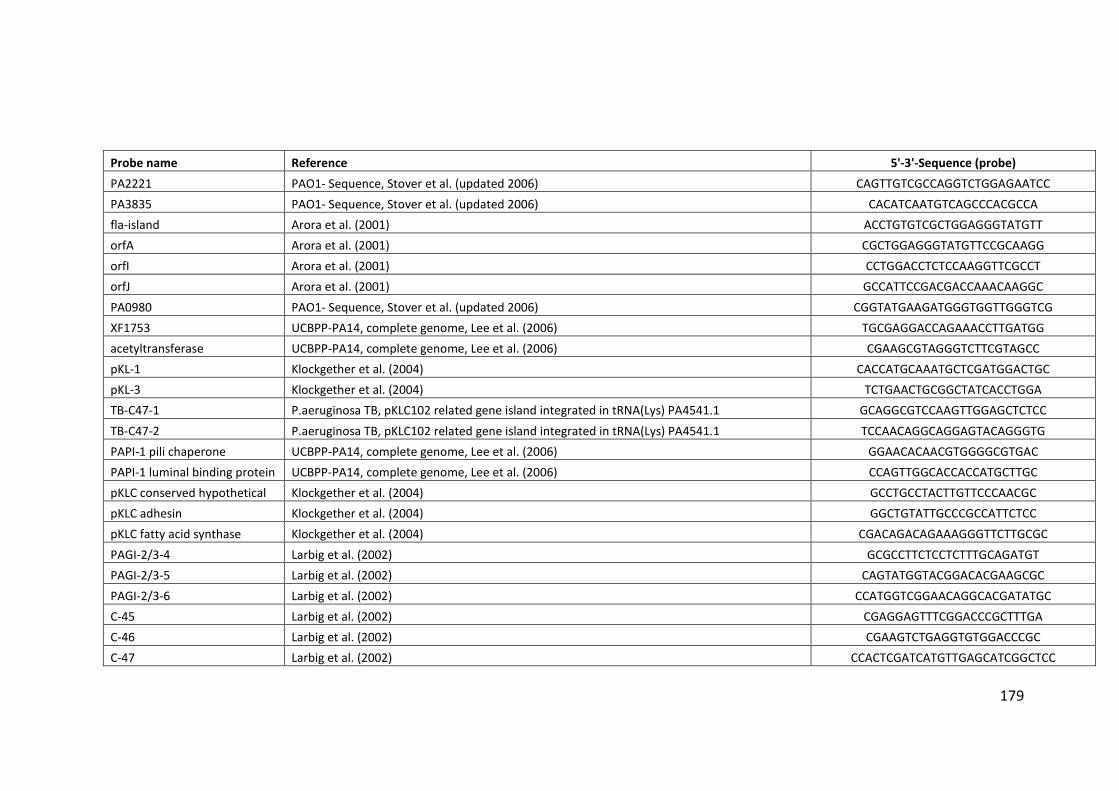
179
Probe name Reference 5'-3'-Sequence (probe)
PA2221 PAO1- Sequence, Stover et al. (updated 2006) CAGTTGTCGCCAGGTCTGGAGAATCC
PA3835 PAO1- Sequence, Stover et al. (updated 2006) CACATCAATGTCAGCCCACGCCA
fla-island Arora et al. (2001) ACCTGTGTCGCTGGAGGGTATGTT
orfA Arora et al. (2001) CGCTGGAGGGTATGTTCCGCAAGG
orfI Arora et al. (2001) CCTGGACCTCTCCAAGGTTCGCCT
orfJ Arora et al. (2001) GCCATTCCGACGACCAAACAAGGC
PA0980 PAO1- Sequence, Stover et al. (updated 2006) CGGTATGAAGATGGGTGGTTGGGTCG
XF1753 UCBPP-PA14, complete genome, Lee et al. (2006) TGCGAGGACCAGAAACCTTGATGG
acetyltransferase UCBPP-PA14, complete genome, Lee et al. (2006) CGAAGCGTAGGGTCTTCGTAGCC
pKL-1 Klockgether et al. (2004) CACCATGCAAATGCTCGATGGACTGC
pKL-3 Klockgether et al. (2004) TCTGAACTGCGGCTATCACCTGGA
TB-C47-1 P.aeruginosa TB, pKLC102 related gene island integrated in tRNA(Lys) PA4541.1 GCAGGCGTCCAAGTTGGAGCTCTCC
TB-C47-2 P.aeruginosa TB, pKLC102 related gene island integrated in tRNA(Lys) PA4541.1 TCCAACAGGCAGGAGTACAGGGTG
PAPI-1 pili chaperone UCBPP-PA14, complete genome, Lee et al. (2006) GGAACACAACGTGGGGCGTGAC
PAPI-1 luminal binding protein UCBPP-PA14, complete genome, Lee et al. (2006) CCAGTTGGCACCACCATGCTTGC
pKLC conserved hypothetical Klockgether et al. (2004) GCCTGCCTACTTGTTCCCAACGC
pKLC adhesin Klockgether et al. (2004) GGCTGTATTGCCCGCCATTCTCC
pKLC fatty acid synthase Klockgether et al. (2004) CGACAGACAGAAAGGGTTCTTGCGC
PAGI-2/3-4 Larbig et al. (2002) GCGCCTTCTCCTCTTTGCAGATGT
PAGI-2/3-5 Larbig et al. (2002) CAGTATGGTACGGACACGAAGCGC
PAGI-2/3-6 Larbig et al. (2002) CCATGGTCGGAACAGGCACGATATGC
C-45 Larbig et al. (2002) CGAGGAGTTTCGGACCCGCTTTGA
C-46 Larbig et al. (2002) CGAAGTCTGAGGTGTGGACCCGC
C-47 Larbig et al. (2002) CCACTCGATCATGTTGAGCATCGGCTCC
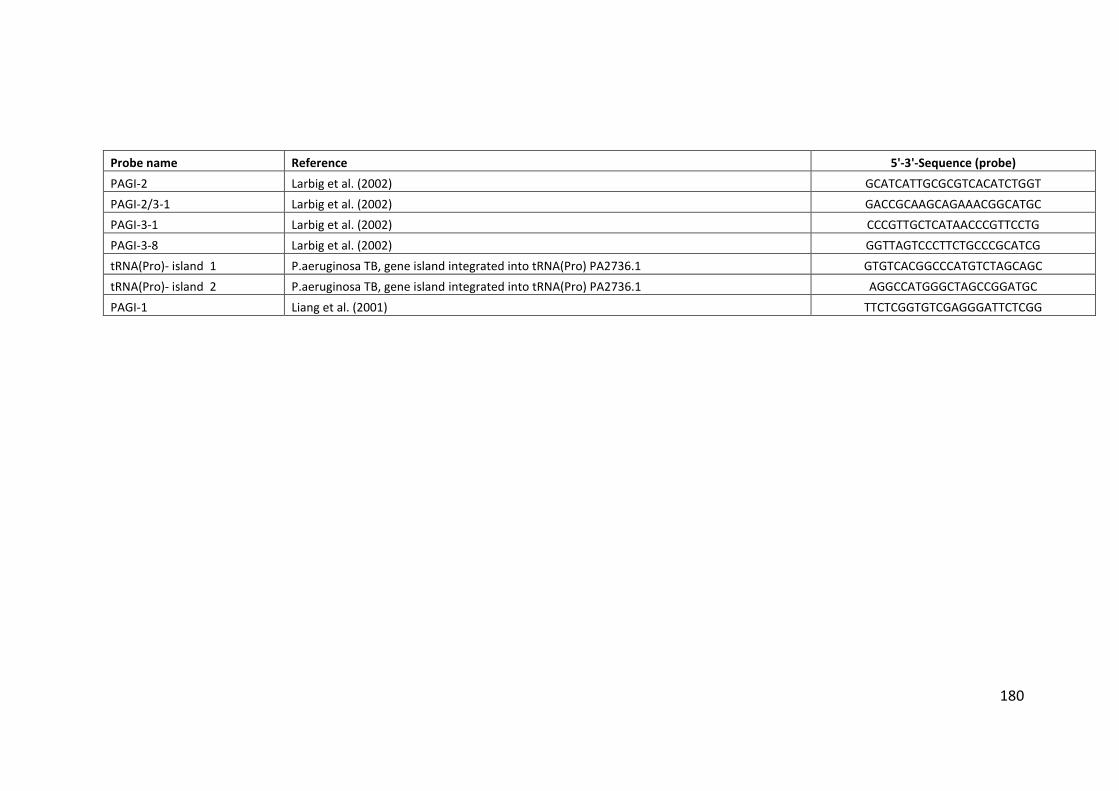
180
Probe name Reference 5'-3'-Sequence (probe)
PAGI-2 Larbig et al. (2002) GCATCATTGCGCGTCACATCTGGT
PAGI-2/3-1 Larbig et al. (2002) GACCGCAAGCAGAAACGGCATGC
PAGI-3-1 Larbig et al. (2002) CCCGTTGCTCATAACCCGTTCCTG
PAGI-3-8 Larbig et al. (2002) GGTTAGTCCCTTCTGCCCGCATCG
tRNA(Pro)- island 1 P.aeruginosa TB, gene island integrated into tRNA(Pro) PA2736.1 GTGTCACGGCCCATGTCTAGCAGC
tRNA(Pro)- island 2 P.aeruginosa TB, gene island integrated into tRNA(Pro) PA2736.1 AGGCCATGGGCTAGCCGGATGC
PAGI-1 Liang et al. (2001) TTCTCGGTGTCGAGGGATTCTCGG
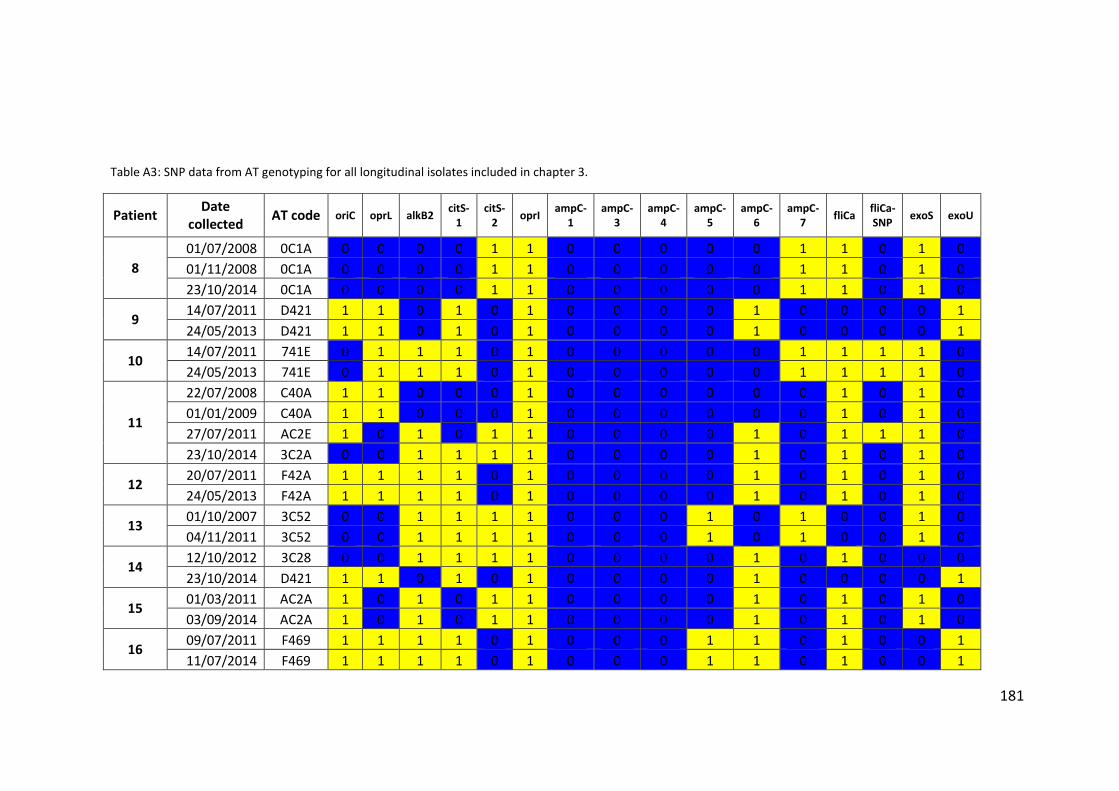
181
Table A3: SNP data from AT genotyping for all longitudinal isolates included in chapter 3.
Patient Date
collected AT code oriC oprL alkB2
citS-1
citS-2
oprI ampC-
1 ampC-
3 ampC-
4 ampC-
5 ampC-
6 ampC-
7 fliCa
fliCa-SNP
exoS exoU
8
01/07/2008 0C1A 0 0 0 0 1 1 0 0 0 0 0 1 1 0 1 0
01/11/2008 0C1A 0 0 0 0 1 1 0 0 0 0 0 1 1 0 1 0
23/10/2014 0C1A 0 0 0 0 1 1 0 0 0 0 0 1 1 0 1 0
9 14/07/2011 D421 1 1 0 1 0 1 0 0 0 0 1 0 0 0 0 1
24/05/2013 D421 1 1 0 1 0 1 0 0 0 0 1 0 0 0 0 1
10 14/07/2011 741E 0 1 1 1 0 1 0 0 0 0 0 1 1 1 1 0
24/05/2013 741E 0 1 1 1 0 1 0 0 0 0 0 1 1 1 1 0
11
22/07/2008 C40A 1 1 0 0 0 1 0 0 0 0 0 0 1 0 1 0
01/01/2009 C40A 1 1 0 0 0 1 0 0 0 0 0 0 1 0 1 0
27/07/2011 AC2E 1 0 1 0 1 1 0 0 0 0 1 0 1 1 1 0
23/10/2014 3C2A 0 0 1 1 1 1 0 0 0 0 1 0 1 0 1 0
12 20/07/2011 F42A 1 1 1 1 0 1 0 0 0 0 1 0 1 0 1 0
24/05/2013 F42A 1 1 1 1 0 1 0 0 0 0 1 0 1 0 1 0
13 01/10/2007 3C52 0 0 1 1 1 1 0 0 0 1 0 1 0 0 1 0
04/11/2011 3C52 0 0 1 1 1 1 0 0 0 1 0 1 0 0 1 0
14 12/10/2012 3C28 0 0 1 1 1 1 0 0 0 0 1 0 1 0 0 0
23/10/2014 D421 1 1 0 1 0 1 0 0 0 0 1 0 0 0 0 1
15 01/03/2011 AC2A 1 0 1 0 1 1 0 0 0 0 1 0 1 0 1 0
03/09/2014 AC2A 1 0 1 0 1 1 0 0 0 0 1 0 1 0 1 0
16 09/07/2011 F469 1 1 1 1 0 1 0 0 0 1 1 0 1 0 0 1
11/07/2014 F469 1 1 1 1 0 1 0 0 0 1 1 0 1 0 0 1
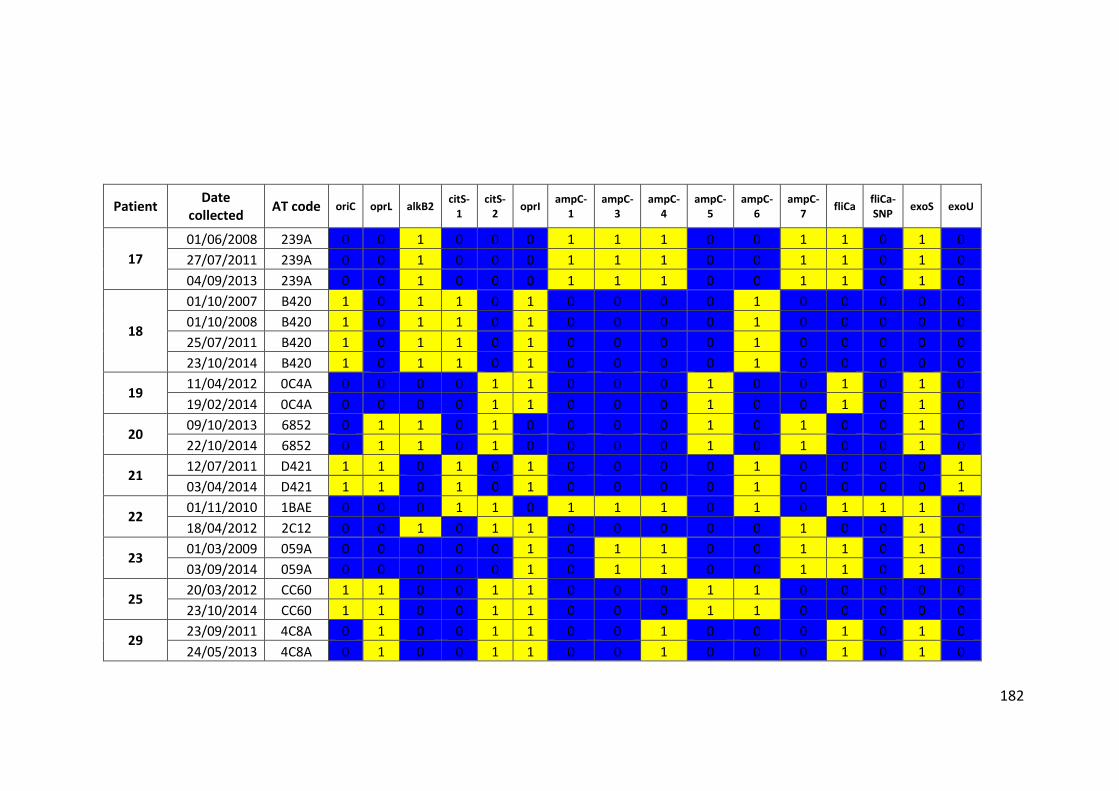
182
Patient Date
collected AT code oriC oprL alkB2
citS-1
citS-2
oprI ampC-
1 ampC-
3 ampC-
4 ampC-
5 ampC-
6 ampC-
7 fliCa
fliCa-SNP
exoS exoU
17
01/06/2008 239A 0 0 1 0 0 0 1 1 1 0 0 1 1 0 1 0
27/07/2011 239A 0 0 1 0 0 0 1 1 1 0 0 1 1 0 1 0
04/09/2013 239A 0 0 1 0 0 0 1 1 1 0 0 1 1 0 1 0
18
01/10/2007 B420 1 0 1 1 0 1 0 0 0 0 1 0 0 0 0 0
01/10/2008 B420 1 0 1 1 0 1 0 0 0 0 1 0 0 0 0 0
25/07/2011 B420 1 0 1 1 0 1 0 0 0 0 1 0 0 0 0 0
23/10/2014 B420 1 0 1 1 0 1 0 0 0 0 1 0 0 0 0 0
19 11/04/2012 0C4A 0 0 0 0 1 1 0 0 0 1 0 0 1 0 1 0
19/02/2014 0C4A 0 0 0 0 1 1 0 0 0 1 0 0 1 0 1 0
20 09/10/2013 6852 0 1 1 0 1 0 0 0 0 1 0 1 0 0 1 0
22/10/2014 6852 0 1 1 0 1 0 0 0 0 1 0 1 0 0 1 0
21 12/07/2011 D421 1 1 0 1 0 1 0 0 0 0 1 0 0 0 0 1
03/04/2014 D421 1 1 0 1 0 1 0 0 0 0 1 0 0 0 0 1
22 01/11/2010 1BAE 0 0 0 1 1 0 1 1 1 0 1 0 1 1 1 0
18/04/2012 2C12 0 0 1 0 1 1 0 0 0 0 0 1 0 0 1 0
23 01/03/2009 059A 0 0 0 0 0 1 0 1 1 0 0 1 1 0 1 0
03/09/2014 059A 0 0 0 0 0 1 0 1 1 0 0 1 1 0 1 0
25 20/03/2012 CC60 1 1 0 0 1 1 0 0 0 1 1 0 0 0 0 0
23/10/2014 CC60 1 1 0 0 1 1 0 0 0 1 1 0 0 0 0 0
29 23/09/2011 4C8A 0 1 0 0 1 1 0 0 1 0 0 0 1 0 1 0
24/05/2013 4C8A 0 1 0 0 1 1 0 0 1 0 0 0 1 0 1 0
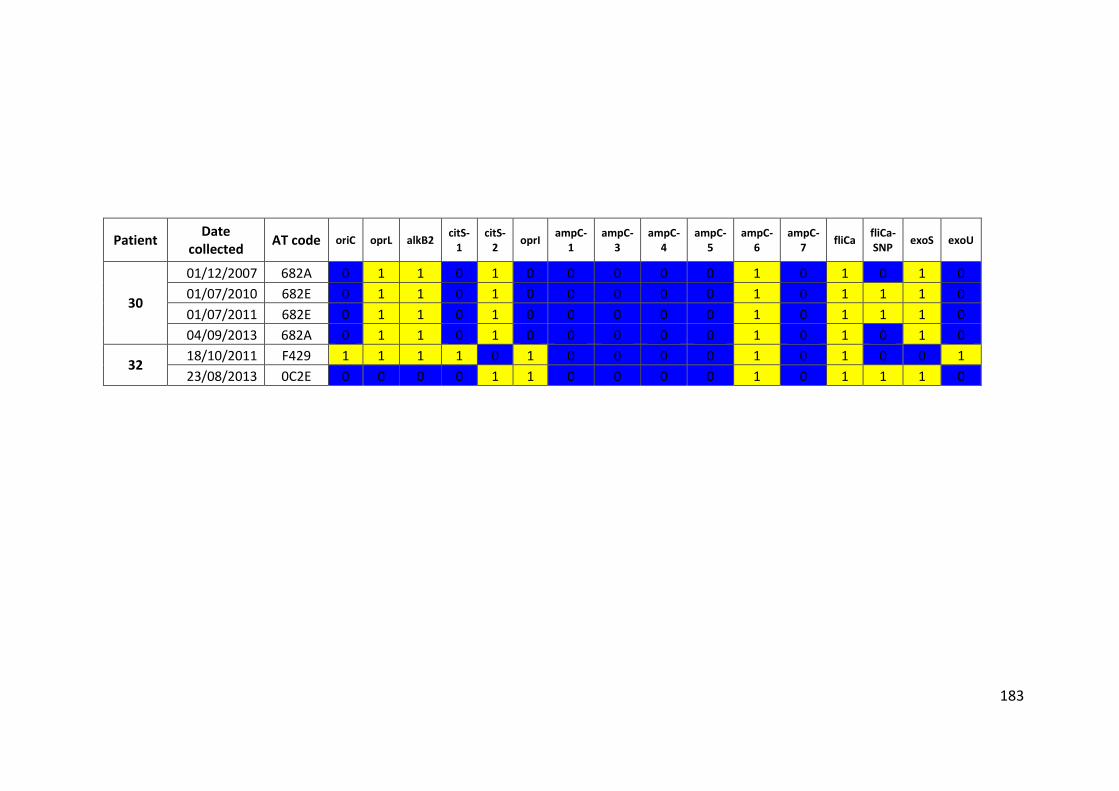
183
Patient Date
collected AT code oriC oprL alkB2
citS-1
citS-2
oprI ampC-
1 ampC-
3 ampC-
4 ampC-
5 ampC-
6 ampC-
7 fliCa
fliCa-SNP
exoS exoU
30
01/12/2007 682A 0 1 1 0 1 0 0 0 0 0 1 0 1 0 1 0
01/07/2010 682E 0 1 1 0 1 0 0 0 0 0 1 0 1 1 1 0
01/07/2011 682E 0 1 1 0 1 0 0 0 0 0 1 0 1 1 1 0
04/09/2013 682A 0 1 1 0 1 0 0 0 0 0 1 0 1 0 1 0
32 18/10/2011 F429 1 1 1 1 0 1 0 0 0 0 1 0 1 0 0 1
23/08/2013 0C2E 0 0 0 0 1 1 0 0 0 0 1 0 1 1 1 0
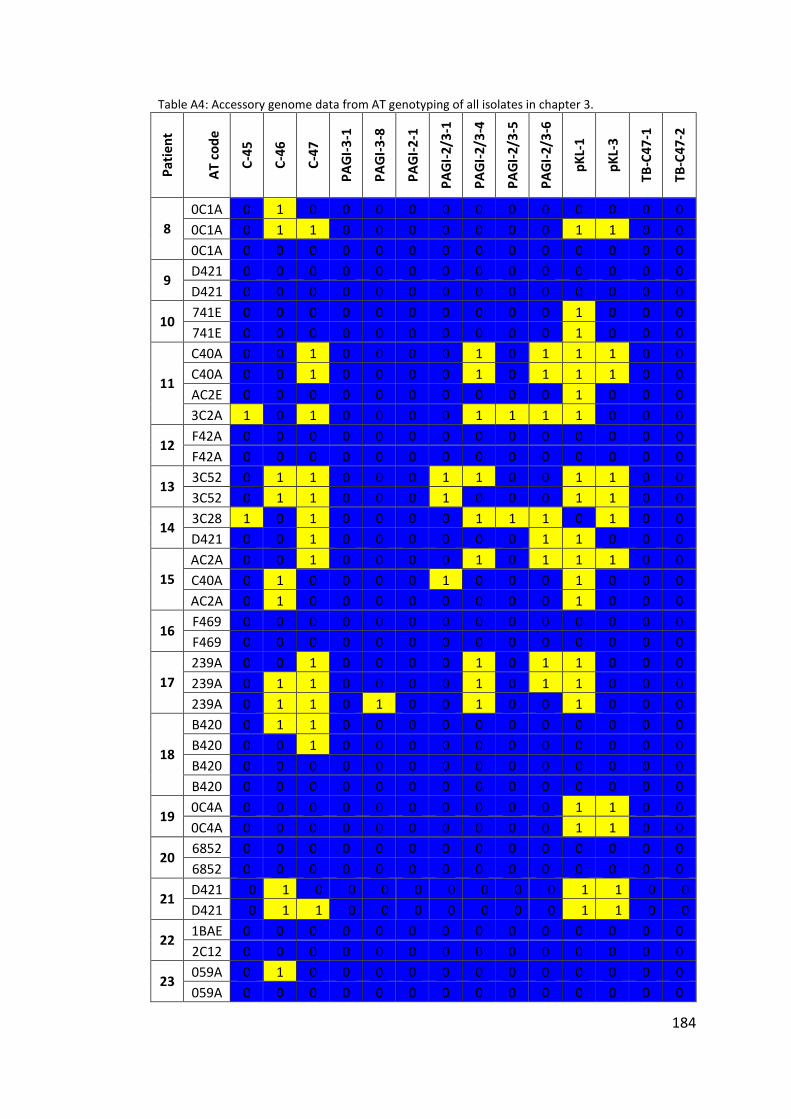
184
Table A4: Accessory genome data from AT genotyping of all isolates in chapter 3.
Pat
ien
t
AT
co
de
C-4
5
C-4
6
C-4
7
PA
GI-
3-1
PA
GI-
3-8
PA
GI-
2-1
PA
GI-
2/3
-1
PA
GI-
2/3
-4
PA
GI-
2/3
-5
PA
GI-
2/3
-6
pK
L-1
pK
L-3
TB
-C4
7-1
TB
-C4
7-2
8
0C1A 0 1 0 0 0 0 0 0 0 0 0 0 0 0
0C1A 0 1 1 0 0 0 0 0 0 0 1 1 0 0
0C1A 0 0 0 0 0 0 0 0 0 0 0 0 0 0
9 D421 0 0 0 0 0 0 0 0 0 0 0 0 0 0
D421 0 0 0 0 0 0 0 0 0 0 0 0 0 0
10 741E 0 0 0 0 0 0 0 0 0 0 1 0 0 0
741E 0 0 0 0 0 0 0 0 0 0 1 0 0 0
11
C40A 0 0 1 0 0 0 0 1 0 1 1 1 0 0
C40A 0 0 1 0 0 0 0 1 0 1 1 1 0 0
AC2E 0 0 0 0 0 0 0 0 0 0 1 0 0 0
3C2A 1 0 1 0 0 0 0 1 1 1 1 0 0 0
12 F42A 0 0 0 0 0 0 0 0 0 0 0 0 0 0
F42A 0 0 0 0 0 0 0 0 0 0 0 0 0 0
13 3C52 0 1 1 0 0 0 1 1 0 0 1 1 0 0
3C52 0 1 1 0 0 0 1 0 0 0 1 1 0 0
14 3C28 1 0 1 0 0 0 0 1 1 1 0 1 0 0
D421 0 0 1 0 0 0 0 0 0 1 1 0 0 0
15
AC2A 0 0 1 0 0 0 0 1 0 1 1 1 0 0
C40A 0 1 0 0 0 0 1 0 0 0 1 0 0 0
AC2A 0 1 0 0 0 0 0 0 0 0 1 0 0 0
16 F469 0 0 0 0 0 0 0 0 0 0 0 0 0 0
F469 0 0 0 0 0 0 0 0 0 0 0 0 0 0
17
239A 0 0 1 0 0 0 0 1 0 1 1 0 0 0
239A 0 1 1 0 0 0 0 1 0 1 1 0 0 0
239A 0 1 1 0 1 0 0 1 0 0 1 0 0 0
18
B420 0 1 1 0 0 0 0 0 0 0 0 0 0 0
B420 0 0 1 0 0 0 0 0 0 0 0 0 0 0
B420 0 0 0 0 0 0 0 0 0 0 0 0 0 0
B420 0 0 0 0 0 0 0 0 0 0 0 0 0 0
19 0C4A 0 0 0 0 0 0 0 0 0 0 1 1 0 0
0C4A 0 0 0 0 0 0 0 0 0 0 1 1 0 0
20 6852 0 0 0 0 0 0 0 0 0 0 0 0 0 0
6852 0 0 0 0 0 0 0 0 0 0 0 0 0 0
21 D421 0 1 0 0 0 0 0 0 0 0 1 1 0 0
D421 0 1 1 0 0 0 0 0 0 0 1 1 0 0
22 1BAE 0 0 0 0 0 0 0 0 0 0 0 0 0 0
2C12 0 0 0 0 0 0 0 0 0 0 0 0 0 0
23 059A 0 1 0 0 0 0 0 0 0 0 0 0 0 0
059A 0 0 0 0 0 0 0 0 0 0 0 0 0 0
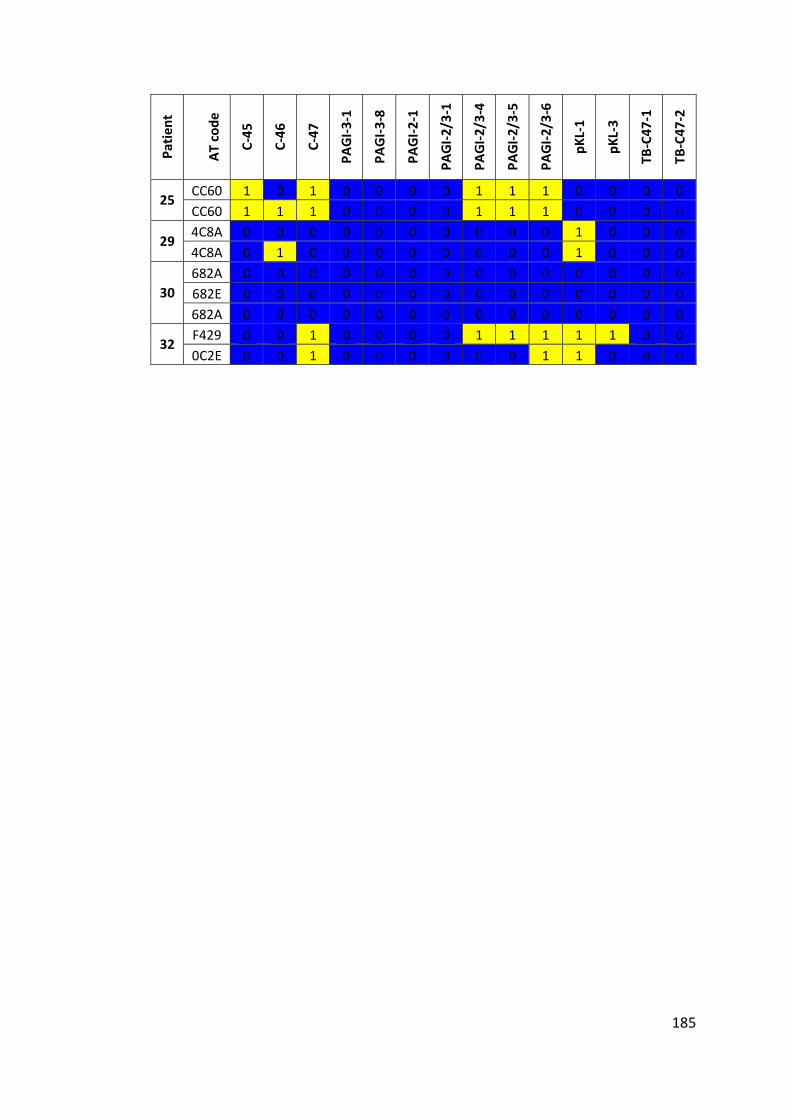
185
Pat
ien
t
AT
co
de
C-4
5
C-4
6
C-4
7
PA
GI-
3-1
PA
GI-
3-8
PA
GI-
2-1
PA
GI-
2/3
-1
PA
GI-
2/3
-4
PA
GI-
2/3
-5
PA
GI-
2/3
-6
pK
L-1
pK
L-3
TB
-C4
7-1
TB
-C4
7-2
25 CC60 1 0 1 0 0 0 0 1 1 1 0 0 0 0
CC60 1 1 1 0 0 0 0 1 1 1 0 0 0 0
29 4C8A 0 0 0 0 0 0 0 0 0 0 1 0 0 0
4C8A 0 1 0 0 0 0 0 0 0 0 1 0 0 0
30
682A 0 0 0 0 0 0 0 0 0 0 0 0 0 0
682E 0 0 0 0 0 0 0 0 0 0 0 0 0 0
682A 0 0 0 0 0 0 0 0 0 0 0 0 0 0
32 F429 0 0 1 0 0 0 0 1 1 1 1 1 0 0
0C2E 0 0 1 0 0 0 0 0 0 1 1 0 0 0
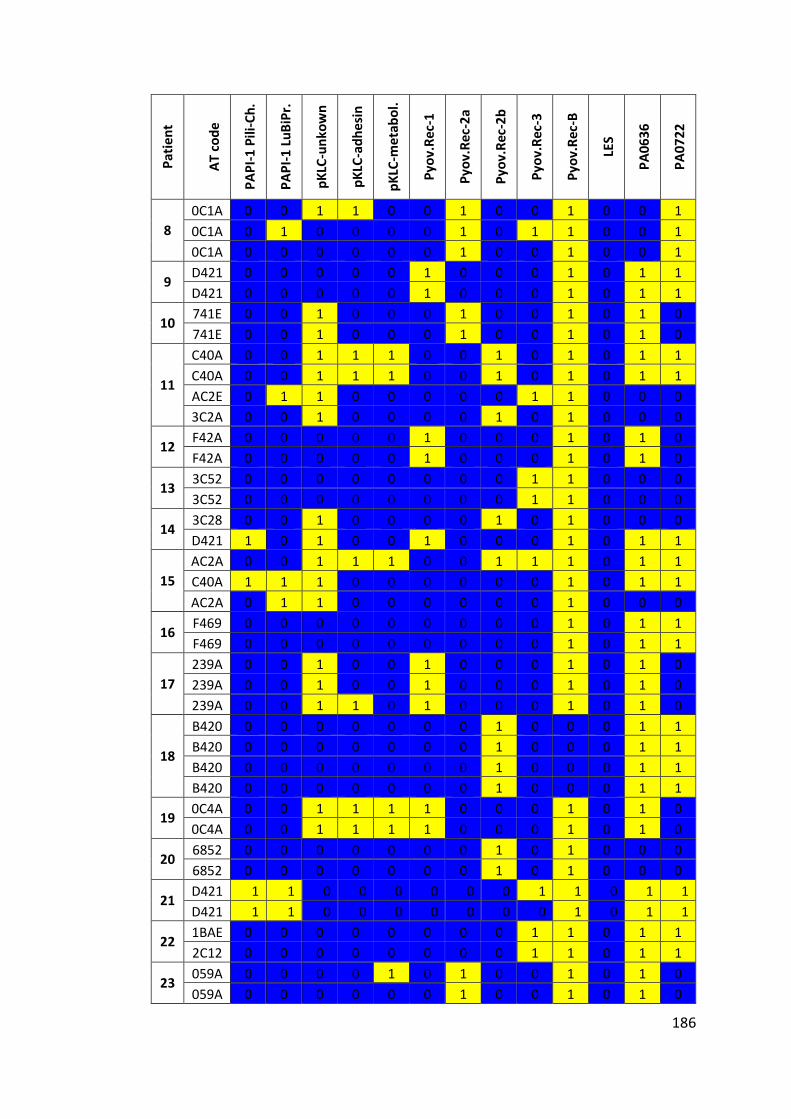
186
Pat
ien
t
AT
co
de
PA
PI-
1 P
ili-C
h.
PA
PI-
1 L
uB
iPr.
pK
LC-u
nko
wn
pK
LC-a
dh
esin
pK
LC-m
eta
bo
l.
Pyo
v.R
ec-1
Pyo
v.R
ec-2
a
Pyo
v.R
ec-2
b
Pyo
v.R
ec-3
Pyo
v.R
ec-B
LES
PA
06
36
PA
07
22
8
0C1A 0 0 1 1 0 0 1 0 0 1 0 0 1
0C1A 0 1 0 0 0 0 1 0 1 1 0 0 1
0C1A 0 0 0 0 0 0 1 0 0 1 0 0 1
9 D421 0 0 0 0 0 1 0 0 0 1 0 1 1
D421 0 0 0 0 0 1 0 0 0 1 0 1 1
10 741E 0 0 1 0 0 0 1 0 0 1 0 1 0
741E 0 0 1 0 0 0 1 0 0 1 0 1 0
11
C40A 0 0 1 1 1 0 0 1 0 1 0 1 1
C40A 0 0 1 1 1 0 0 1 0 1 0 1 1
AC2E 0 1 1 0 0 0 0 0 1 1 0 0 0
3C2A 0 0 1 0 0 0 0 1 0 1 0 0 0
12 F42A 0 0 0 0 0 1 0 0 0 1 0 1 0
F42A 0 0 0 0 0 1 0 0 0 1 0 1 0
13 3C52 0 0 0 0 0 0 0 0 1 1 0 0 0
3C52 0 0 0 0 0 0 0 0 1 1 0 0 0
14 3C28 0 0 1 0 0 0 0 1 0 1 0 0 0
D421 1 0 1 0 0 1 0 0 0 1 0 1 1
15
AC2A 0 0 1 1 1 0 0 1 1 1 0 1 1
C40A 1 1 1 0 0 0 0 0 0 1 0 1 1
AC2A 0 1 1 0 0 0 0 0 0 1 0 0 0
16 F469 0 0 0 0 0 0 0 0 0 1 0 1 1
F469 0 0 0 0 0 0 0 0 0 1 0 1 1
17
239A 0 0 1 0 0 1 0 0 0 1 0 1 0
239A 0 0 1 0 0 1 0 0 0 1 0 1 0
239A 0 0 1 1 0 1 0 0 0 1 0 1 0
18
B420 0 0 0 0 0 0 0 1 0 0 0 1 1
B420 0 0 0 0 0 0 0 1 0 0 0 1 1
B420 0 0 0 0 0 0 0 1 0 0 0 1 1
B420 0 0 0 0 0 0 0 1 0 0 0 1 1
19 0C4A 0 0 1 1 1 1 0 0 0 1 0 1 0
0C4A 0 0 1 1 1 1 0 0 0 1 0 1 0
20 6852 0 0 0 0 0 0 0 1 0 1 0 0 0
6852 0 0 0 0 0 0 0 1 0 1 0 0 0
21 D421 1 1 0 0 0 0 0 0 1 1 0 1 1
D421 1 1 0 0 0 0 0 0 0 1 0 1 1
22 1BAE 0 0 0 0 0 0 0 0 1 1 0 1 1
2C12 0 0 0 0 0 0 0 0 1 1 0 1 1
23 059A 0 0 0 0 1 0 1 0 0 1 0 1 0
059A 0 0 0 0 0 0 1 0 0 1 0 1 0
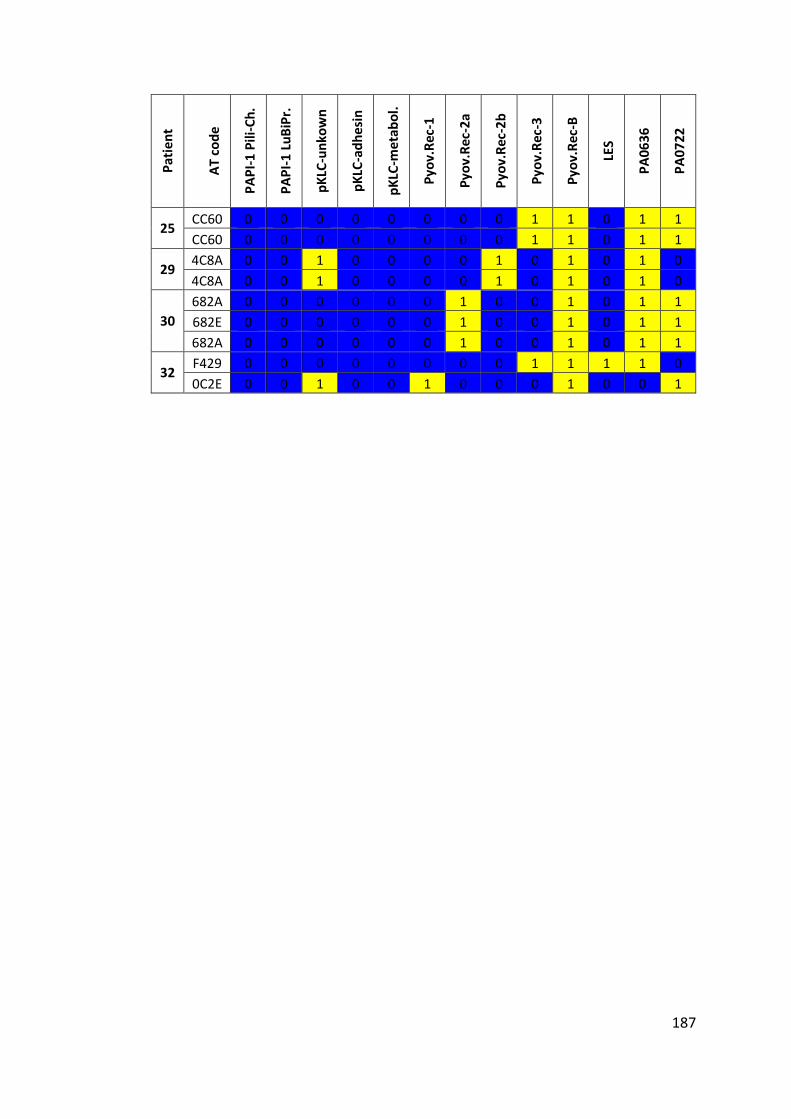
187
Pat
ien
t
AT
cod
e
PA
PI-
1 P
ili-C
h.
PA
PI-
1 L
uB
iPr.
pK
LC-u
nko
wn
pK
LC-a
dh
esin
pK
LC-m
eta
bo
l.
Pyo
v.R
ec-1
Pyo
v.R
ec-2
a
Pyo
v.R
ec-2
b
Pyo
v.R
ec-3
Pyo
v.R
ec-B
LES
PA
06
36
PA
07
22
25 CC60 0 0 0 0 0 0 0 0 1 1 0 1 1
CC60 0 0 0 0 0 0 0 0 1 1 0 1 1
29 4C8A 0 0 1 0 0 0 0 1 0 1 0 1 0
4C8A 0 0 1 0 0 0 0 1 0 1 0 1 0
30
682A 0 0 0 0 0 0 1 0 0 1 0 1 1
682E 0 0 0 0 0 0 1 0 0 1 0 1 1
682A 0 0 0 0 0 0 1 0 0 1 0 1 1
32 F429 0 0 0 0 0 0 0 0 1 1 1 1 0
0C2E 0 0 1 0 0 1 0 0 0 1 0 0 1
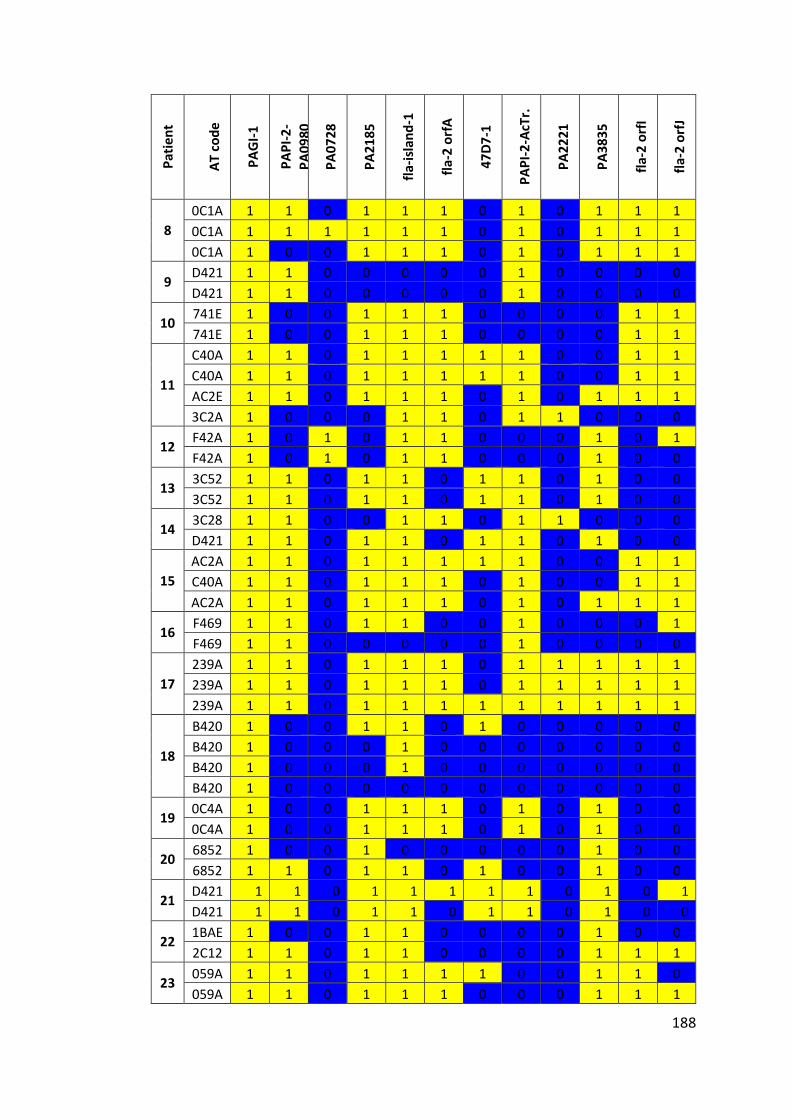
188
Pat
ien
t
AT
co
de
PA
GI-
1
PA
PI-
2-
PA
09
80
PA
07
28
PA
21
85
fla-
isla
nd
-1
fla-
2 o
rfA
47
D7
-1
PA
PI-
2-A
cTr.
PA
22
21
PA
38
35
fla-
2 o
rfI
fla-
2 o
rfJ
8
0C1A 1 1 0 1 1 1 0 1 0 1 1 1
0C1A 1 1 1 1 1 1 0 1 0 1 1 1
0C1A 1 0 0 1 1 1 0 1 0 1 1 1
9 D421 1 1 0 0 0 0 0 1 0 0 0 0
D421 1 1 0 0 0 0 0 1 0 0 0 0
10 741E 1 0 0 1 1 1 0 0 0 0 1 1
741E 1 0 0 1 1 1 0 0 0 0 1 1
11
C40A 1 1 0 1 1 1 1 1 0 0 1 1
C40A 1 1 0 1 1 1 1 1 0 0 1 1
AC2E 1 1 0 1 1 1 0 1 0 1 1 1
3C2A 1 0 0 0 1 1 0 1 1 0 0 0
12 F42A 1 0 1 0 1 1 0 0 0 1 0 1
F42A 1 0 1 0 1 1 0 0 0 1 0 0
13 3C52 1 1 0 1 1 0 1 1 0 1 0 0
3C52 1 1 0 1 1 0 1 1 0 1 0 0
14 3C28 1 1 0 0 1 1 0 1 1 0 0 0
D421 1 1 0 1 1 0 1 1 0 1 0 0
15
AC2A 1 1 0 1 1 1 1 1 0 0 1 1
C40A 1 1 0 1 1 1 0 1 0 0 1 1
AC2A 1 1 0 1 1 1 0 1 0 1 1 1
16 F469 1 1 0 1 1 0 0 1 0 0 0 1
F469 1 1 0 0 0 0 0 1 0 0 0 0
17
239A 1 1 0 1 1 1 0 1 1 1 1 1
239A 1 1 0 1 1 1 0 1 1 1 1 1
239A 1 1 0 1 1 1 1 1 1 1 1 1
18
B420 1 0 0 1 1 0 1 0 0 0 0 0
B420 1 0 0 0 1 0 0 0 0 0 0 0
B420 1 0 0 0 1 0 0 0 0 0 0 0
B420 1 0 0 0 0 0 0 0 0 0 0 0
19 0C4A 1 0 0 1 1 1 0 1 0 1 0 0
0C4A 1 0 0 1 1 1 0 1 0 1 0 0
20 6852 1 0 0 1 0 0 0 0 0 1 0 0
6852 1 1 0 1 1 0 1 0 0 1 0 0
21 D421 1 1 0 1 1 1 1 1 0 1 0 1
D421 1 1 0 1 1 0 1 1 0 1 0 0
22 1BAE 1 0 0 1 1 0 0 0 0 1 0 0
2C12 1 1 0 1 1 0 0 0 0 1 1 1
23 059A 1 1 0 1 1 1 1 0 0 1 1 0
059A 1 1 0 1 1 1 0 0 0 1 1 1
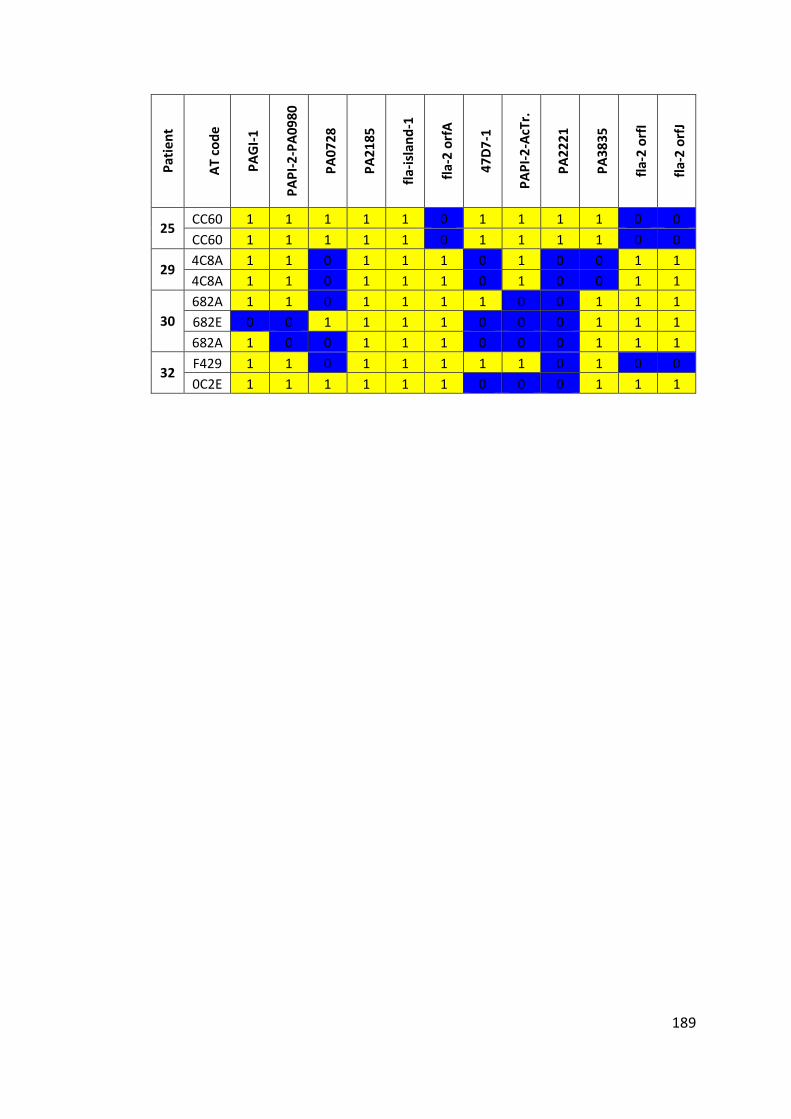
189
Pat
ien
t
AT
co
de
PA
GI-
1
PA
PI-
2-P
A0
98
0
PA
07
28
PA
21
85
fla-
isla
nd
-1
fla-
2 o
rfA
47
D7
-1
PA
PI-
2-A
cTr.
PA
22
21
PA
38
35
fla-
2 o
rfI
fla-
2 o
rfJ
25 CC60 1 1 1 1 1 0 1 1 1 1 0 0
CC60 1 1 1 1 1 0 1 1 1 1 0 0
29 4C8A 1 1 0 1 1 1 0 1 0 0 1 1
4C8A 1 1 0 1 1 1 0 1 0 0 1 1
30
682A 1 1 0 1 1 1 1 0 0 1 1 1
682E 0 0 1 1 1 1 0 0 0 1 1 1
682A 1 0 0 1 1 1 0 0 0 1 1 1
32 F429 1 1 0 1 1 1 1 1 0 1 0 0
0C2E 1 1 1 1 1 1 0 0 0 1 1 1
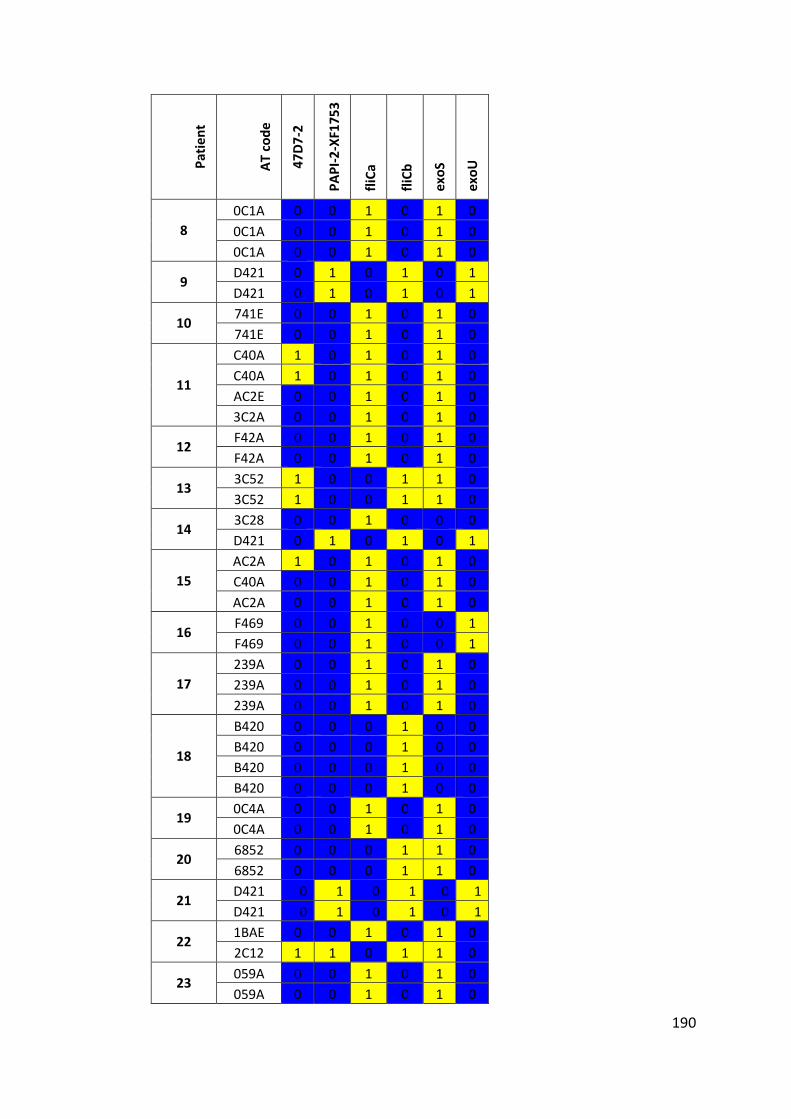
190
Pat
ien
t
AT
co
de
47
D7
-2
PA
PI-
2-X
F17
53
fliC
a
fliC
b
exo
S
exo
U
8
0C1A 0 0 1 0 1 0
0C1A 0 0 1 0 1 0
0C1A 0 0 1 0 1 0
9 D421 0 1 0 1 0 1
D421 0 1 0 1 0 1
10 741E 0 0 1 0 1 0
741E 0 0 1 0 1 0
11
C40A 1 0 1 0 1 0
C40A 1 0 1 0 1 0
AC2E 0 0 1 0 1 0
3C2A 0 0 1 0 1 0
12 F42A 0 0 1 0 1 0
F42A 0 0 1 0 1 0
13 3C52 1 0 0 1 1 0
3C52 1 0 0 1 1 0
14 3C28 0 0 1 0 0 0
D421 0 1 0 1 0 1
15
AC2A 1 0 1 0 1 0
C40A 0 0 1 0 1 0
AC2A 0 0 1 0 1 0
16 F469 0 0 1 0 0 1
F469 0 0 1 0 0 1
17
239A 0 0 1 0 1 0
239A 0 0 1 0 1 0
239A 0 0 1 0 1 0
18
B420 0 0 0 1 0 0
B420 0 0 0 1 0 0
B420 0 0 0 1 0 0
B420 0 0 0 1 0 0
19 0C4A 0 0 1 0 1 0
0C4A 0 0 1 0 1 0
20 6852 0 0 0 1 1 0
6852 0 0 0 1 1 0
21 D421 0 1 0 1 0 1
D421 0 1 0 1 0 1
22 1BAE 0 0 1 0 1 0
2C12 1 1 0 1 1 0
23 059A 0 0 1 0 1 0
059A 0 0 1 0 1 0
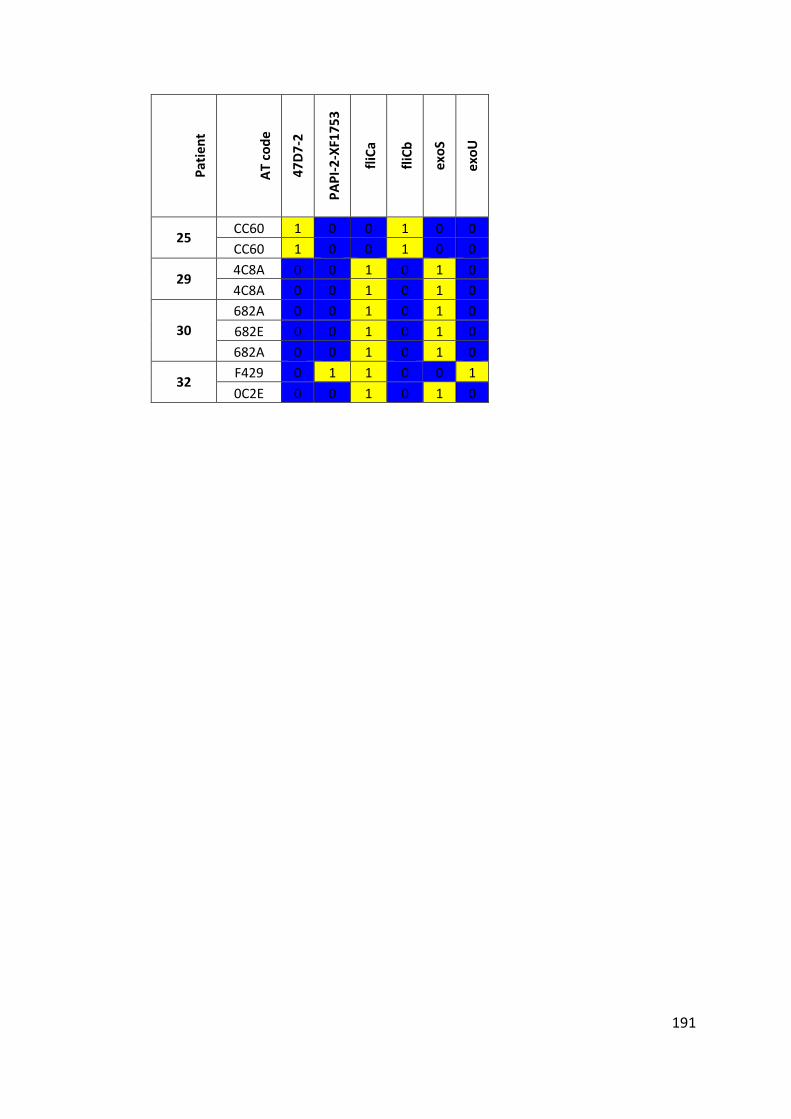
191
Pat
ien
t
AT
co
de
47
D7
-2
PA
PI-
2-X
F17
53
fliC
a
fliC
b
exo
S
exo
U
25 CC60 1 0 0 1 0 0
CC60 1 0 0 1 0 0
29 4C8A 0 0 1 0 1 0
4C8A 0 0 1 0 1 0
30
682A 0 0 1 0 1 0
682E 0 0 1 0 1 0
682A 0 0 1 0 1 0
32 F429 0 1 1 0 0 1
0C2E 0 0 1 0 1 0
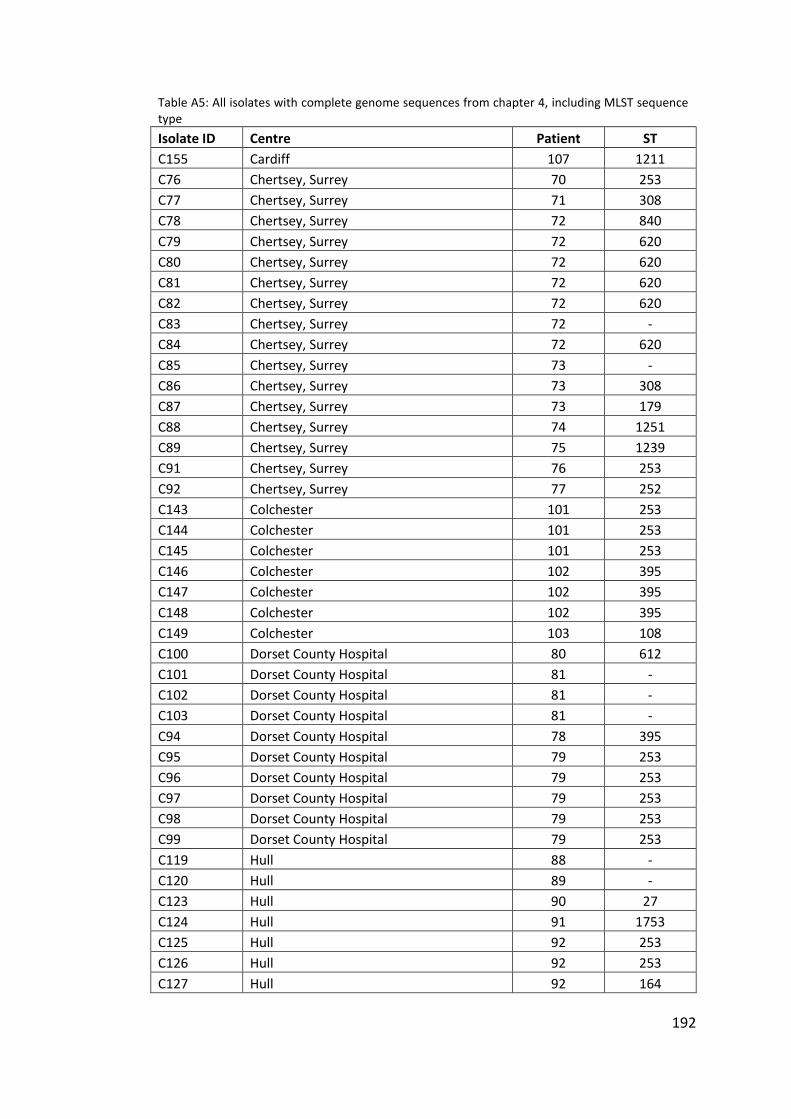
192
Table A5: All isolates with complete genome sequences from chapter 4, including MLST sequence type
Isolate ID Centre Patient ST
C155 Cardiff 107 1211
C76 Chertsey, Surrey 70 253
C77 Chertsey, Surrey 71 308
C78 Chertsey, Surrey 72 840
C79 Chertsey, Surrey 72 620
C80 Chertsey, Surrey 72 620
C81 Chertsey, Surrey 72 620
C82 Chertsey, Surrey 72 620
C83 Chertsey, Surrey 72 -
C84 Chertsey, Surrey 72 620
C85 Chertsey, Surrey 73 -
C86 Chertsey, Surrey 73 308
C87 Chertsey, Surrey 73 179
C88 Chertsey, Surrey 74 1251
C89 Chertsey, Surrey 75 1239
C91 Chertsey, Surrey 76 253
C92 Chertsey, Surrey 77 252
C143 Colchester 101 253
C144 Colchester 101 253
C145 Colchester 101 253
C146 Colchester 102 395
C147 Colchester 102 395
C148 Colchester 102 395
C149 Colchester 103 108
C100 Dorset County Hospital 80 612
C101 Dorset County Hospital 81 -
C102 Dorset County Hospital 81 -
C103 Dorset County Hospital 81 -
C94 Dorset County Hospital 78 395
C95 Dorset County Hospital 79 253
C96 Dorset County Hospital 79 253
C97 Dorset County Hospital 79 253
C98 Dorset County Hospital 79 253
C99 Dorset County Hospital 79 253
C119 Hull 88 -
C120 Hull 89 -
C123 Hull 90 27
C124 Hull 91 1753
C125 Hull 92 253
C126 Hull 92 253
C127 Hull 92 164
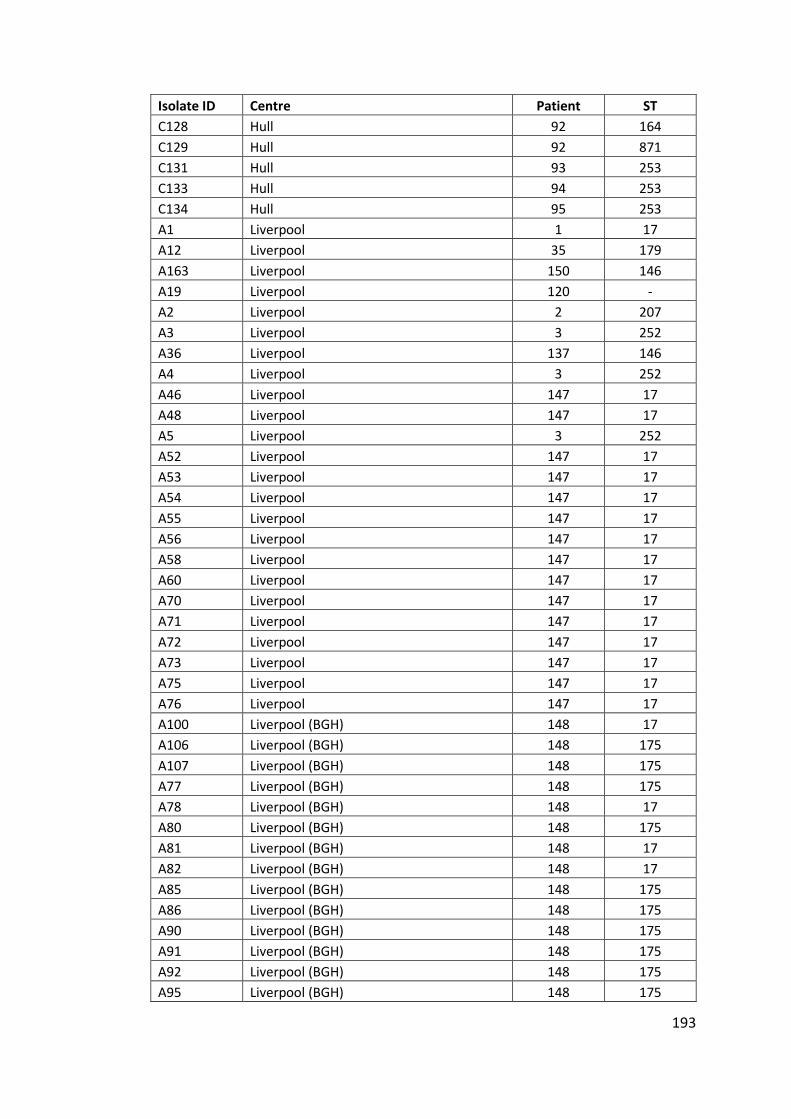
193
Isolate ID Centre Patient ST
C128 Hull 92 164
C129 Hull 92 871
C131 Hull 93 253
C133 Hull 94 253
C134 Hull 95 253
A1 Liverpool 1 17
A12 Liverpool 35 179
A163 Liverpool 150 146
A19 Liverpool 120 -
A2 Liverpool 2 207
A3 Liverpool 3 252
A36 Liverpool 137 146
A4 Liverpool 3 252
A46 Liverpool 147 17
A48 Liverpool 147 17
A5 Liverpool 3 252
A52 Liverpool 147 17
A53 Liverpool 147 17
A54 Liverpool 147 17
A55 Liverpool 147 17
A56 Liverpool 147 17
A58 Liverpool 147 17
A60 Liverpool 147 17
A70 Liverpool 147 17
A71 Liverpool 147 17
A72 Liverpool 147 17
A73 Liverpool 147 17
A75 Liverpool 147 17
A76 Liverpool 147 17
A100 Liverpool (BGH) 148 17
A106 Liverpool (BGH) 148 175
A107 Liverpool (BGH) 148 175
A77 Liverpool (BGH) 148 175
A78 Liverpool (BGH) 148 17
A80 Liverpool (BGH) 148 175
A81 Liverpool (BGH) 148 17
A82 Liverpool (BGH) 148 17
A85 Liverpool (BGH) 148 175
A86 Liverpool (BGH) 148 175
A90 Liverpool (BGH) 148 175
A91 Liverpool (BGH) 148 175
A92 Liverpool (BGH) 148 175
A95 Liverpool (BGH) 148 175
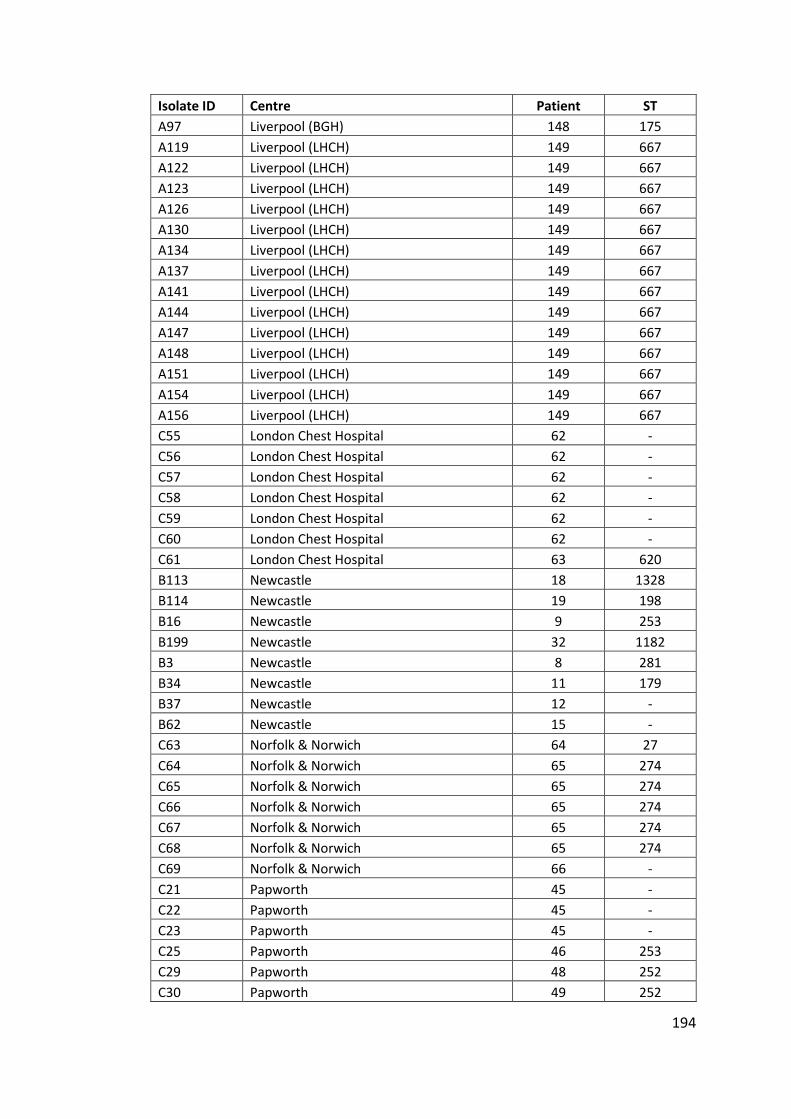
194
Isolate ID Centre Patient ST
A97 Liverpool (BGH) 148 175
A119 Liverpool (LHCH) 149 667
A122 Liverpool (LHCH) 149 667
A123 Liverpool (LHCH) 149 667
A126 Liverpool (LHCH) 149 667
A130 Liverpool (LHCH) 149 667
A134 Liverpool (LHCH) 149 667
A137 Liverpool (LHCH) 149 667
A141 Liverpool (LHCH) 149 667
A144 Liverpool (LHCH) 149 667
A147 Liverpool (LHCH) 149 667
A148 Liverpool (LHCH) 149 667
A151 Liverpool (LHCH) 149 667
A154 Liverpool (LHCH) 149 667
A156 Liverpool (LHCH) 149 667
C55 London Chest Hospital 62 -
C56 London Chest Hospital 62 -
C57 London Chest Hospital 62 -
C58 London Chest Hospital 62 -
C59 London Chest Hospital 62 -
C60 London Chest Hospital 62 -
C61 London Chest Hospital 63 620
B113 Newcastle 18 1328
B114 Newcastle 19 198
B16 Newcastle 9 253
B199 Newcastle 32 1182
B3 Newcastle 8 281
B34 Newcastle 11 179
B37 Newcastle 12 -
B62 Newcastle 15 -
C63 Norfolk & Norwich 64 27
C64 Norfolk & Norwich 65 274
C65 Norfolk & Norwich 65 274
C66 Norfolk & Norwich 65 274
C67 Norfolk & Norwich 65 274
C68 Norfolk & Norwich 65 274
C69 Norfolk & Norwich 66 -
C21 Papworth 45 -
C22 Papworth 45 -
C23 Papworth 45 -
C25 Papworth 46 253
C29 Papworth 48 252
C30 Papworth 49 252
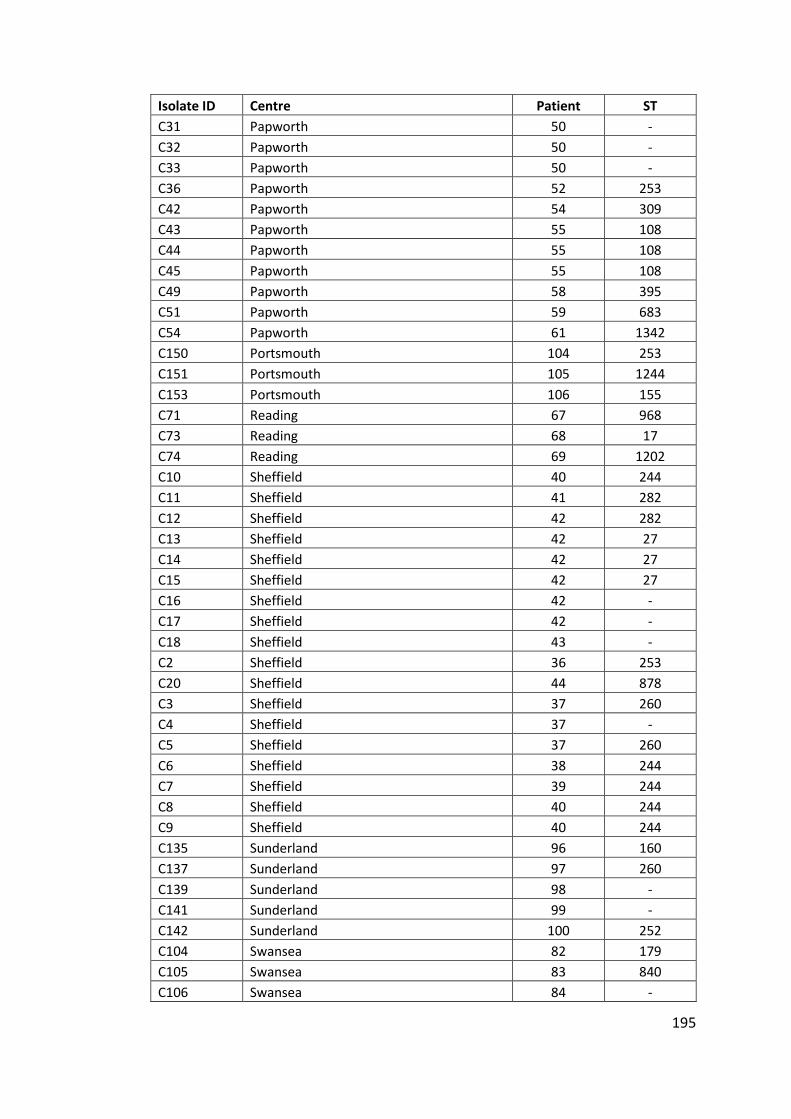
195
Isolate ID Centre Patient ST
C31 Papworth 50 -
C32 Papworth 50 -
C33 Papworth 50 -
C36 Papworth 52 253
C42 Papworth 54 309
C43 Papworth 55 108
C44 Papworth 55 108
C45 Papworth 55 108
C49 Papworth 58 395
C51 Papworth 59 683
C54 Papworth 61 1342
C150 Portsmouth 104 253
C151 Portsmouth 105 1244
C153 Portsmouth 106 155
C71 Reading 67 968
C73 Reading 68 17
C74 Reading 69 1202
C10 Sheffield 40 244
C11 Sheffield 41 282
C12 Sheffield 42 282
C13 Sheffield 42 27
C14 Sheffield 42 27
C15 Sheffield 42 27
C16 Sheffield 42 -
C17 Sheffield 42 -
C18 Sheffield 43 -
C2 Sheffield 36 253
C20 Sheffield 44 878
C3 Sheffield 37 260
C4 Sheffield 37 -
C5 Sheffield 37 260
C6 Sheffield 38 244
C7 Sheffield 39 244
C8 Sheffield 40 244
C9 Sheffield 40 244
C135 Sunderland 96 160
C137 Sunderland 97 260
C139 Sunderland 98 -
C141 Sunderland 99 -
C142 Sunderland 100 252
C104 Swansea 82 179
C105 Swansea 83 840
C106 Swansea 84 -
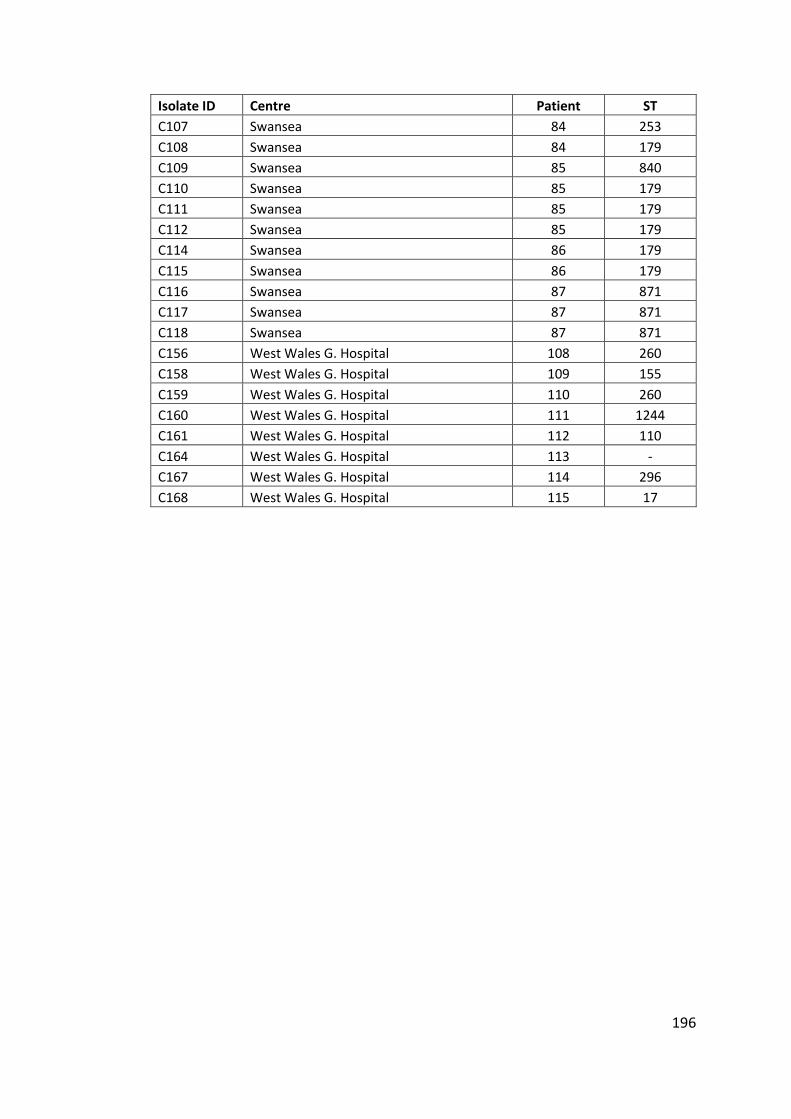
196
Isolate ID Centre Patient ST
C107 Swansea 84 253
C108 Swansea 84 179
C109 Swansea 85 840
C110 Swansea 85 179
C111 Swansea 85 179
C112 Swansea 85 179
C114 Swansea 86 179
C115 Swansea 86 179
C116 Swansea 87 871
C117 Swansea 87 871
C118 Swansea 87 871
C156 West Wales G. Hospital 108 260
C158 West Wales G. Hospital 109 155
C159 West Wales G. Hospital 110 260
C160 West Wales G. Hospital 111 1244
C161 West Wales G. Hospital 112 110
C164 West Wales G. Hospital 113 -
C167 West Wales G. Hospital 114 296
C168 West Wales G. Hospital 115 17
197
References
Aaron, S.D. et al., 2010. Infection with transmissible strains of Pseudomonas
aeruginosa and clinical outcomes in adults with cystic fibrosis. The Journal of the
American Medical Association, 304(19), pp.2145 – 2153.
Agusti, A. et al., 2010. Characterisation of COPD heterogeneity in the ECLIPSE cohort.
Respiratory Research, 11, p.122.
Ajayi, T. et al., 2003. Single-nucleotide-polymorphism mapping of the Pseudomonas
aeruginosa type III secretion toxins for development of a diagnostic multiplex
PCR system. Journal of Clinical Microbiology, 41(8), pp.3526–31.
Aksamit, T.R. et al., 2012. The Bronchiectasis Research Registry: A Collaborative
Research Cohort For Non-Cystic Fibrosis Bronchiectasis (ATS Journals). American
Thoracic Society International Conference Meetings Abstracts.
Al-Aloul, M. et al., 2003. Increased morbidity associated with chronic infection by an
epidemic Pseudomonas aeruginosa strain in CF patients. Thorax, 59(4), pp.334–
336.
Al-Aloul, M., Govin, B. & Stockton, P.A., 2002. Antibiotic related renal impairment in
adult cystic fibrosis patients. Thorax.
Amiel, E. et al., 2010. Pseudomonas aeruginosa evasion of phagocytosis is mediated
by loss of swimming motility and is independent of flagellum expression.
Infection and Immunity, 78(7), pp.2937–45.
Angrill, J. et al., 2002. Bacterial colonisation in patients with bronchiectasis:
microbiological pattern and risk factors. Thorax, 57(1), pp.15–9.
Anthony, M. et al., 2002. Genetic Analysis of Pseudomonas aeruginosa Isolates from
the Sputa of Australian Adult Cystic Fibrosis Patients. Journal of Clinical
Microbiology, 40(8), pp.2772–2778.
Armstrong, D. et al., 2003. Evidence for Spread of a Clonal Strain of Pseudomonas
aeruginosa among Cystic Fibrosis Clinics. Journal of Clinical Microbiology, 41(5),
pp.2266–2267.
Armstrong, D.S. et al., 2002. Detection of a widespread clone of Pseudomonas
aeruginosa in a pediatric cystic fibrosis clinic. American Journal of Respiratory
and Critical Care Medicine, 166(7), pp.983–7.
Arora, S.K. et al., 2004. Sequence Polymorphism in the Glycosylation Island and
Flagellins of Pseudomonas aeruginosa. Journal of Bacteriology, 186(7), pp.2115–
2122.
Ashish, A. et al., 2012. Increasing resistance of the Liverpool Epidemic Strain (LES) of
Pseudomonas aeruginosa (Psa) to antibiotics in cystic fibrosis (CF)--a cause for
concern? Journal of Cystic Fibrosis, 11(3), pp.173–9.
198
Bagge, N. et al., 2002. Constitutive High Expression of Chromosomal -Lactamase in
Pseudomonas aeruginosa Caused by a New Insertion Sequence (IS1669) Located
in ampD. Antimicrobial Agents and Chemotherapy, 46(11), pp.3406–3411.
Bagge, N. et al., 2004. Pseudomonas aeruginosa Biofilms Exposed to Imipenem
Exhibit Changes in Global Gene Expression and -Lactamase and Alginate
Production. Antimicrobial Agents and Chemotherapy, 48(4), pp.1175–1187.
Bankevich, A. et al., 2012. SPAdes: a new genome assembly algorithm and its
applications to single-cell sequencing. Journal of Computational Biology, 19(5),
pp.455–77.
Bardoel, B.W. et al., 2011. Pseudomonas evades immune recognition of flagellin in
both mammals and plants. PLoS Pathogens, 7(8), p.e1002206.
de Bentzmann, S. & Plésiat, P., 2011. The Pseudomonas aeruginosa opportunistic
pathogen and human infections. Environmental Microbiology, 13(7), pp.1655–
65.
Bjarnsholt, T. et al., 2010. Quorum sensing and virulence of Pseudomonas aeruginosa
during lung infection of cystic fibrosis patients. PLoS ONE, 5(4), p.e10115.
Bowen-Jones, J.R., Coovadia, Y.M. & Bowen-Jones, E.J., 1990. Infection control in a
third world burn facility. Burns, 16(6), pp.445–448.
Boyle, B. et al., 2012. Complete genome sequences of three Pseudomonas
aeruginosa isolates with phenotypes of polymyxin B adaptation and inducible
resistance. Journal of Bacteriology, 194(2), pp.529–30.
Bradbury, R., Champion, A. & Reid, D.W., 2008. Poor clinical outcomes associated
with a multi-drug resistant clonal strain of Pseudomonas aeruginosa in the
Tasmanian cystic fibrosis population. Respirology, 13(6), pp.886–92.
British Thoracic Society, 2012. Quality Standards for clinically significant
bronchiectasis in adults,
Brusasco, V., Crapo, R. & Viegi, G., 2005. Coming together: the ATS/ERS consensus on
clinical pulmonary function testing. European Respiratory Journal, 26(1), pp.1–
2.
Bryant, J.M. et al., 2013. Whole-genome sequencing to identify transmission of
Mycobacterium abscessus between patients with cystic fibrosis: a retrospective
cohort study. Lancet, 381(9877), pp.1551–60.
Burns, J.L. et al., 2001. Longitudinal assessment of Pseudomonas aeruginosa in young
children with cystic fibrosis. The Journal of Infectious Diseases, 183(3), pp.444–
52.
Calligaro, G.L. & Gray, D.M., 2015. Lung function abnormalities in HIV-infected adults
and children. Respirology, 20(1), pp.24–32.
199
Carraro, D.S. et al., 2014. Study of Burkholderia Cepacia Complex Strains in Lung
Transplant Patients: Analysis of Genomovar and Mortality Impact. The Journal
of Heart and Lung Transplantation, 33(4), p.S182.
Chalmers, J.D., 2015. Bronchiectasis in adults: epidemiology, assessment of severity
and prognosis. Current Pulmonology Reports, 4(3), pp.142–151.
Chalmers, J.D. et al., 2014. The bronchiectasis severity index. An international
derivation and validation study. American Journal of Respiratory and Critical
Care Medicine, 189(5), pp.576–85.
Cheng, K. et al., 1996. Spread of beta-lactam-resistant Pseudomonas aeruginosa in a
cystic fibrosis clinic. Lancet, 348(9028), pp.639–42.
de Chial, M. et al., 2003. Identification of type II and type III pyoverdine receptors
from Pseudomonas aeruginosa. Microbiology, 149(4), pp.821–831.
Chitkara, Y.K. & Feierabend, T.C., 1981. Endogenous and exogenous infection with
Pseudomonas aeruginosa in a burns unit. International Surgery, 66(3), pp.237–
40.
Ciofu, O. et al., 2005. Occurrence of hypermutable Pseudomonas aeruginosa in cystic
fibrosis patients is associated with the oxidative stress caused by chronic lung
inflammation. Antimicrobial Agents and Chemotherapy, 49(6), pp.2276–82.
Copley, S.J. et al., 2009. Lung morphology in the elderly: comparative CT study of
subjects over 75 years old versus those under 55 years old. Radiology, 251(2),
pp.566–73.
Cramer, N. et al., 2012. Molecular epidemiology of chronic Pseudomonas aeruginosa
airway infections in cystic fibrosis. PLoS ONE, 7(11), p.e50731.
Curran, B. et al., 2004. Development of a multilocus sequence typing scheme for the
opportunistic pathogen Pseudomonas aeruginosa. Journal of Clinical
Microbiology, 42(12), pp.5644–9.
Cystic Fibrosis Trust, 2014. UK Cystic Fibrosis Registry Annual data report 2013,
Van daele, S. et al., 2006. Survey of Pseudomonas aeruginosa genotypes in colonised
cystic fibrosis patients. European Respiratory Journal, 28(4), pp.740 – 747.
Daniels, R. et al., 2006. Quorum signal molecules as biosurfactants affecting
swarming in Rhizobium etli. Proceedings of the National Academy of Sciences of
the United States of America, 103(40), pp.14965–70.
Darch, S.E. et al., 2015. Recombination is a key driver of genomic and phenotypic
diversity in a Pseudomonas aeruginosa population during cystic fibrosis
infection. Scientific Reports, 5, p.7649.
Darling, A.C.E. et al., 2004. Mauve: multiple alignment of conserved genomic
sequence with rearrangements. Genome Research, 14(7), pp.1394–403.
200
Davey, M.E., Caiazza, N.C. & O’Toole, G.A., 2003. Rhamnolipid Surfactant Production
Affects Biofilm Architecture in Pseudomonas aeruginosa PAO1. Journal of
Bacteriology, 185(3), pp.1027–1036.
Davies, G. et al., 2006. The effect of Pseudomonas aeruginosa on pulmonary function
in patients with bronchiectasis. European Respiratory Journal, 28(5), pp.974–9.
Dettman, J.R. et al., 2013. Evolutionary genomics of epidemic and nonepidemic
strains of Pseudomonas aeruginosa. Proceedings of the National Academy of
Sciences of the United States of America, 110(52), pp.21065–70.
Diaz Caballero, J. et al., 2015. Selective Sweeps and Parallel Pathoadaptation Drive
Pseudomonas aeruginosa Evolution in the Cystic Fibrosis Lung. mBio, 6(5),
pp.e00981–15–.
Dinesh, S.D. et al., 2003. European-wide distribution of Pseudomonas aeruginosa
clone C. Clinical Microbiology and Infection, 9(12), pp.1228 – 1233.
Evans, S.A. et al., 1996. Lung function in bronchiectasis: the influence of
Pseudomonas aeruginosa. European Respiratory Journal, 9(8), pp.1601–1604.
Feil, E.J. et al., 2004. eBURST: inferring patterns of evolutionary descent among
clusters of related bacterial genotypes from multilocus sequence typing data.
Journal of Bacteriology, 186(5), pp.1518–30.
Feil, E.J. et al., 2001. Recombination within natural populations of pathogenic
bacteria: short-term empirical estimates and long-term phylogenetic
consequences. Proceedings of the National Academy of Sciences of the United
States of America, 98(1), pp.182–7.
Le Fleche, P. et al., 2001. A tandem repeats database for bacterial genomes:
application to the genotyping of Yersinia pestis and Bacillus anthracis. BMC
Microbiology, 1(1), p.2.
Le Fleche, P. et al., 2002. High resolution, on-line identification of strains from the
Mycobacterium tuberculosis complex based on tandem repeat typing. BMC
Microbiology, 2(1), p.37.
Fluge, G. et al., 2001. Typing of Pseudomonas aeruginosa strains in Norwegian cystic
fibrosis patients. Clinical Microbiology and Infection, 7(5), pp.238–243.
Fothergill, J.L. et al., 2008. Diagnostic multiplex PCR assay for the identification of the
Liverpool, Midlands 1 and Manchester CF epidemic strains of Pseudomonas
aeruginosa. Journal of Cystic Fibrosis, 7(3), pp.258–61.
Fothergill, J.L., Mowat, E., et al., 2010. Fluctuations in phenotypes and genotypes
within populations of Pseudomonas aeruginosa in the cystic fibrosis lung during
pulmonary exacerbations. Journal of Medical Microbiology, 59(Pt 4), pp.472–81.
Fothergill, J.L., White, J., et al., 2010. Impact of Pseudomonas aeruginosa genomic
instability on the application of typing methods for chronic cystic fibrosis
infections. Journal of Clinical Microbiology, 48(6), pp.2053–9.
201
Fothergill, J.L. et al., 2007. Widespread pyocyanin over-production among isolates of
a cystic fibrosis epidemic strain. BMC Microbiology, 7(1), p.45.
Fothergill, J.L., Walshaw, M.J. & Winstanley, C., 2012. Transmissible strains of
Pseudomonas aeruginosa in cystic fibrosis lung infections. European Respiratory
Journal, 40(1), pp.227–38.
Freschi, L. et al., 2015. Clinical utilization of genomics data produced by the
international Pseudomonas aeruginosa consortium. Frontiers in Microbiology,
6.
Galle, M. et al., 2012. The Pseudomonas aeruginosa type III secretion system has an
exotoxin S/T/Y independent pathogenic role during acute lung infection. PLoS
ONE, 7(7), p.e41547.
Gao, Y. et al., 2015. The role of viral infection in pulmonary exacerbations of
bronchiectasis in adults: a prospective study. Chest, 147(6), pp.1635–43.
Garmendia, J. et al., 2014. Characterization of nontypable Haemophilus influenzae
isolates recovered from adult patients with underlying chronic lung disease
reveals genotypic and phenotypic traits associated with persistent infection.
PLoS ONE, 9(5), p.e97020.
Gellatly, S.L. & Hancock, R.E.W., 2013. Pseudomonas aeruginosa: new insights into
pathogenesis and host defenses. Pathogens and Disease, 67(3), pp.159–73.
Girard, G. & Bloemberg, G. V., 2008. Central role of quorum sensing in regulating the
production of pathogenicity factors in Pseudomonas aeruginosa. Future
Microbiology, 3(1), pp.97–106.
Golovkine, G. et al., 2014. VE-cadherin cleavage by LasB protease from Pseudomonas
aeruginosa facilitates type III secretion system toxicity in endothelial cells. PLoS
Pathogens, 10(3), p.e1003939.
Goodman, A.L. et al., 2004. A signaling network reciprocally regulates genes
associated with acute infection and chronic persistence in Pseudomonas
aeruginosa. Developmental Cell, 7(5), pp.745–54.
Govan, J.R.W. et al., 1993. Evidence for transmission of Pseudomonas cepacia by
social contact in cystic fibrosis. Lancet, 342(8862), pp.15–19.
Govan, J.R.W., Brown, A.R. & Jones, A.M., 2007. Evolving epidemiology of
Pseudomonas aeruginosa and the Burkholderia cepacia complex in cystic
fibrosis lung infection. Future Microbiology, 2(2), pp.153–64.
Govan, J.R.W. & Deretic, V., 1996. Microbial Pathogenesis in Cystic Fibrosis: Mucoid
Pseudomonas aeruginosa and Burkholderia cepacia. Microbiological Reviews.
Grothues, D. et al., 1988. Genome fingerprinting of Pseudomonas aeruginosa
indicates colonization of cystic fibrosis siblings with closely related strains.
Journal of Clinical Microbiology, 26(10), pp.1973–1977.
202
Gurevich, A. et al., 2013. QUAST: quality assessment tool for genome assemblies.
Bioinformatics, 29(8), pp.1072–5.
Hall, A.J. et al., 2013. Intraclonal genetic diversity amongst cystic fibrosis and keratitis
isolates of Pseudomonas aeruginosa. Journal of Medical Microbiology, 62(Pt 2),
pp.208–16.
Hall, A.J. et al., 2014. Turnover of strains and intraclonal variation amongst
Pseudomonas aeruginosa isolates from paediatric CF patients. Diagnostic
Microbiology and Infectious Disease, 80(4), pp.324–6.
Hocquet, D. et al., 2003. Genetic and Phenotypic Variations of a Resistant
Pseudomonas aeruginosa Epidemic Clone. Antimicrobial Agents and
Chemotherapy, 47(6), pp.1887–1894.
Hoffman, L.R. et al., 2010. Nutrient availability as a mechanism for selection of
antibiotic tolerant Pseudomonas aeruginosa within the CF airway. PLoS
Pathogens, 6(1), p.e1000712.
Hogan, D.A. & Kolter, R., 2002. Pseudomonas-Candida interactions: an ecological role
for virulence factors. Science, 296(5576), pp.2229–32.
Hogan, D.A., Vik, Å. & Kolter, R., 2004. A Pseudomonas aeruginosa quorum-sensing
molecule influences Candida albicans morphology. Molecular Microbiology,
54(5), pp.1212 – 1223.
Hoogkamp-Korstanje, J.A. et al., 1995. Risk of cross-colonization and infection by
Pseudomonas aeruginosa in a holiday camp for cystic fibrosis patients. Journal
of Clinical Microbiology, 33(3), pp.572–575.
Hurst, J.R., Elborn, J.S. & De Soyza, A., 2015. COPD-bronchiectasis overlap syndrome.
The European Respiratory Journal, 45(2), pp.310–3.
Jain, M. et al., 2004. Type III secretion phenotypes of Pseudomonas aeruginosa
strains change during infection of individuals with cystic fibrosis. Journal of
Clinical Microbiology, 42(11), pp.5229–37.
Jairam, P.M. et al., 2015. Incidental findings on chest CT imaging are associated with
increased COPD exacerbations and mortality. Thorax, 70(8), pp.725–31.
Jeffreys, A.J., Wilson, V. & Thein, S.L., 1985. Individual-specific “fingerprints” of
human DNA. Nature, 316(6023), pp.76–79.
Jelsbak, L. et al., 2007. Molecular epidemiology and dynamics of Pseudomonas
aeruginosa populations in lungs of cystic fibrosis patients. Infection and
Immunity, 75(5), pp.2214–24.
Jeukens, J. et al., 2014. Comparative genomics of isolates of a Pseudomonas
aeruginosa epidemic strain associated with chronic lung infections of cystic
fibrosis patients. PLoS ONE, 9(2), p.e87611.
203
Jimenez, P.N. et al., 2012. The multiple signaling systems regulating virulence in
Pseudomonas aeruginosa. Microbiology and Molecular Biology Reviews, 76(1),
pp.46–65.
Jones, A.M. et al., 2002. Increased treatment requirements of patients with cystic
fibrosis who harbour a highly transmissible strain of Pseudomonas aeruginosa.
Thorax, 57(11), pp.924–925.
Jones, A.M. et al., 2001. Spread of a multiresistant strain of Pseudomonas aeruginosa
in an adult cystic fibrosis clinic. Lancet, 358(9281), pp.557–558.
Jorth, P. et al., 2015. Regional Isolation Drives Bacterial Diversification within Cystic
Fibrosis Lungs. Cell Host & Microbe, 18(3), pp.307–319.
Kaufmann, G.F. et al., 2005. Revisiting quorum sensing: Discovery of additional
chemical and biological functions for 3-oxo-N-acylhomoserine lactones.
Proceedings of the National Academy of Sciences of the United States of
America, 102(2), pp.309–14.
Kerem, B. et al., 1989. Identification of the cystic fibrosis gene: genetic analysis.
Science, 245(4922), pp.1073–80.
Kidd, T.J. et al., 2013. Shared Pseudomonas aeruginosa genotypes are common in
Australian cystic fibrosis centres. European Respiratory Journal, 41(5), pp.1091
– 1100.
Kiewitz, C. & Tummler, B., 2000. Sequence Diversity of Pseudomonas aeruginosa:
Impact on Population Structure and Genome Evolution. Journal of Bacteriology,
182(11), pp.3125–3135.
King, P.T. et al., 2007. Microbiologic follow-up study in adult bronchiectasis.
Respiratory Medicine, 101(8), pp.1633–8.
King, P.T. et al., 2005. Outcome in adult bronchiectasis. COPD, 2(1), pp.27–34.
Kos, V.N. et al., 2015. The resistome of Pseudomonas aeruginosa in relationship to
phenotypic susceptibility. Antimicrobial Agents and Chemotherapy, 59(1),
pp.427–36.
Kung, V.L., Ozer, E.A. & Hauser, A.R., 2010. The accessory genome of Pseudomonas
aeruginosa. Microbiology and Molecular Biology Reviews, 74(4), pp.621–41.
Laarman, A.J. et al., 2012. Pseudomonas aeruginosa alkaline protease blocks
complement activation via the classical and lectin pathways. Journal of
Immunology, 188(1), pp.386–93.
Laing, C. et al., 2010. Pan-genome sequence analysis using Panseq: an online tool for
the rapid analysis of core and accessory genomic regions. BMC Bioinformatics,
11(1), p.461.
204
Langaee, T.Y., Gagnon, L. & Huletsky, A., 2000. Inactivation of the ampD Gene in
Pseudomonas aeruginosa Leads to Moderate-Basal-Level and Hyperinducible
AmpC beta -Lactamase Expression. Antimicrobial Agents and Chemotherapy,
44(3), pp.583–589.
Larbig, K.D. et al., 2002. Gene Islands Integrated into tRNAGly Genes Confer Genome
Diversity on a Pseudomonas aeruginosa Clone. Journal of Bacteriology, 184(23),
pp.6665–6680.
Larché, J. et al., 2012. Rapid identification of international multidrug-resistant
Pseudomonas aeruginosa clones by multiple-locus variable number of tandem
repeats analysis and investigation of their susceptibility to lytic bacteriophages.
Antimicrobial Agents and Chemotherapy, 56(12), pp.6175–80.
Lau, G.W. et al., 2004. Pseudomonas aeruginosa pyocyanin is critical for lung
infection in mice. Infection and Immunity, 72(7), pp.4275–8.
Ledson, M.J., Gallagher, M.J. & Walshaw, M.J., 1998. Chronic Burkholderia cepacia
bronchiectasis in a non-cystic fibrosis individual. Thorax, 53(5), pp.430–432.
Lee, D.G. et al., 2006. Genomic analysis reveals that Pseudomonas aeruginosa
virulence is combinatorial. Genome Biology, 7(10), p.R90.
Leone, I. et al., 2008. Phenotypic and genotypic characterization of Pseudomonas
aeruginosa from cystic fibrosis patients. European Journal of Clinical
Microbiology & Infectious Diseases, 27(11), pp.1093–9.
Letunic, I. & Bork, P., 2007. Interactive Tree Of Life (iTOL): an online tool for
phylogenetic tree display and annotation. Bioinformatics, 23(1), pp.127–8.
Letunic, I. & Bork, P., 2011. Interactive Tree Of Life v2: online annotation and display
of phylogenetic trees made easy. Nucleic Acids Research, 39(Web Server issue),
pp.W475–8.
Lewis, D.A. et al., 2005. Identification of DNA markers for a transmissible
Pseudomonas aeruginosa cystic fibrosis strain. American Journal of Respiratory
Cell and Molecular Biology, 33(1), pp.56–64.
Li, H. & Durbin, R., 2009. Fast and accurate short read alignment with Burrows-
Wheeler transform. Bioinformatics, 25(14), pp.1754–60.
LiPuma, J.J. et al., 2001. Disproportionate distribution of Burkholderia cepacia
complex species and transmissibility markers in cystic fibrosis. American Journal
of Respiratory and Critical Care Medicine, 164(1), pp.92–6.
LiPuma, J.J. et al., 1990. Person-to-person transmission of Pseudomonas cepacia
between patients with cystic fibrosis. Lancet, 336(8723), pp.1094–1096.
Loebinger, M.R. et al., 2009. Mortality in bronchiectasis: a long-term study assessing
the factors influencing survival. European Respiratory Journal, 34(4), pp.843–9.
205
López-Causapé, C. et al., 2013. Clonal dissemination, emergence of mutator lineages
and antibiotic resistance evolution in Pseudomonas aeruginosa cystic fibrosis
chronic lung infection. PLoS ONE, 8(8), p.e71001.
Lyczak, J.B., Cannon, C.L. & Pier, G.B., 2000. Establishment of Pseudomonas
aeruginosa infection: lessons from a versatile opportunist. Microbes and
Infection, 2(9), pp.1051–1060.
Maatallah, M. et al., 2011. Population Structure of Pseudomonas aeruginosa from
Five Mediterranean Countries: Evidence for Frequent Recombination and
Epidemic Occurrence of CC235 R. J. Redfield, ed. PLoS ONE, 6(10), p.e25617.
Maciá, M.D. et al., 2005. Hypermutation is a key factor in development of multiple-
antimicrobial resistance in Pseudomonas aeruginosa strains causing chronic
lung infections. Antimicrobial Agents and Chemotherapy, 49(8), pp.3382–6.
Mahenthiralingam, E. et al., 1996. Random amplified polymorphic DNA typing of
Pseudomonas aeruginosa isolates recovered from patients with cystic fibrosis.
Journal of Clinical Microbiology, 34(5), pp.1129–1135.
Maiden, M.C. et al., 1998. Multilocus sequence typing: a portable approach to the
identification of clones within populations of pathogenic microorganisms.
Proceedings of the National Academy of Sciences of the United States of
America, 95(6), pp.3140–5.
Máiz, L. et al., 2015. Prevalence and factors associated with isolation of Aspergillus
and Candida from sputum in patients with non-cystic fibrosis bronchiectasis.
Respiration; International Review of Thoracic Diseases, 89(5), pp.396–403.
Malloy, J.L. et al., 2005. Pseudomonas aeruginosa protease IV degrades surfactant
proteins and inhibits surfactant host defense and biophysical functions.
American Journal of Physiology - Lung Cellular and Molecular Physiology, 288(2),
pp.L409–18.
Manos, J. et al., 2013. Virulence factor expression patterns in Pseudomonas
aeruginosa strains from infants with cystic fibrosis. European Journal of Clinical
Microbiology & Infectious Diseases, 32(12), pp.1583–92.
van Mansfeld, R. et al., 2009. Pseudomonas aeruginosa genotype prevalence in Dutch
cystic fibrosis patients and age dependency of colonization by various P.
aeruginosa sequence types. Journal of Clinical Microbiology, 47(12), pp.4096 –
4101.
Martin, K. et al., 2013. Clusters of genetically similar isolates of Pseudomonas
aeruginosa from multiple hospitals in the UK. Journal of Medical Microbiology,
62(Pt 7), pp.988–1000.
Martin, M., 2011. Cutadapt removes adapter sequences from high-throughput
sequencing reads. EMBnet.journal, 17(1), p.10.
206
Martínez-García, M. et al., 2013. Prognostic value of bronchiectasis in patients with
moderate-to-severe chronic obstructive pulmonary disease. American Journal
of Respiratory and Critical Care Medicine, 187(8), pp.823–31.
Martínez-García, M.A. et al., 2007. Factors associated with lung function decline in
adult patients with stable non-cystic fibrosis bronchiectasis. Chest, 132(5),
pp.1565–72.
Martínez-Solano, L. et al., 2008. Chronic Pseudomonas aeruginosa infection in
chronic obstructive pulmonary disease. Clinical Infectious Diseases, 47(12),
pp.1526–33.
Marvig, R.L. et al., 2014. Convergent evolution and adaptation of Pseudomonas
aeruginosa within patients with cystic fibrosis. Nature Genetics, 47(1), pp.57–
64.
Marvig, R.L. et al., 2013. Genome analysis of a transmissible lineage of Pseudomonas
aeruginosa reveals pathoadaptive mutations and distinct evolutionary paths of
hypermutators. PLoS Genetics, 9(9), p.e1003741.
Mathee, K. et al., 2008. Dynamics of Pseudomonas aeruginosa genome evolution.
Proceedings of the National Academy of Sciences of the United States of
America, 105(8), pp.3100–5.
Matsumoto, K., 2004. Role of bacterial proteases in pseudomonal and serratial
keratitis. Biological Chemistry, 385(11), pp.1007–16.
McCallum, S.J. et al., 2001. Superinfection with a transmissible strain of
Pseudomonas aeruginosa in adults with cystic fibrosis chronically colonised by
P aeruginosa. Lancet, 358(9281), pp.558–560.
McDonnell, M.J. et al., 2015. Non cystic fibrosis bronchiectasis: A longitudinal
retrospective observational cohort study of Pseudomonas persistence and
resistance. Respiratory Medicine, 109(6), pp.716–26.
McKenna, A. et al., 2010. The Genome Analysis Toolkit: a MapReduce framework for
analyzing next-generation DNA sequencing data. Genome Research, 20(9),
pp.1297–303.
Mellmann, A. et al., 2011. Prospective genomic characterization of the German
enterohemorrhagic Escherichia coli O104:H4 outbreak by rapid next generation
sequencing technology. PLoS ONE, 6(7), p.e22751.
Miao, E.A. et al., 2007. TLR5 and Ipaf: dual sensors of bacterial flagellin in the innate
immune system. Seminars in Immunopathology, 29(3), pp.275–88.
Miller, J.H., 1996. Spontaneous mutators in bacteria: insights into pathways of
mutagenesis and repair. Annual Review of Microbiology, 50, pp.625–43.
Mitchell, A. et al., 2015. Respiratory viruses can be isolated and identified from
exhaled breath. European Respiratory Journal, 46(59), p.PA5033.
207
Morales, G. et al., 2004. Structure of Pseudomonas aeruginosa populations analyzed
by single nucleotide polymorphism and pulsed-field gel electrophoresis
genotyping. Journal of Bacteriology, 186(13), pp.4228–37.
Mowat, E. et al., 2011. Pseudomonas aeruginosa population diversity and turnover
in cystic fibrosis chronic infections. American Journal of Respiratory and Critical
Care Medicine, 183(12), pp.1674–9.
Neeld, D. et al., 2014. Pseudomonas aeruginosa injects NDK into host cells through a
type III secretion system. Microbiology, 160(Pt 7), pp.1417–26.
NHS Choices, 2015. Bronchiectasis - Causes - NHS Choices.
Nicotra, M.B. et al., 1995. Clinical, pathophysiologic, and microbiologic
characterization of bronchiectasis in an aging cohort. Chest, 108(4), pp.955–61.
O’Carroll, M.R. et al., 2004. Clonal strains of Pseudomonas aeruginosa in paediatric
and adult cystic fibrosis units. European Respiratory Journal, 24(1), pp.101–106.
Ojeniyi, B., Frederiksen, B. & Høiby, N., 2000. Pseudomonas aeruginosa cross-
infection among patients with cystic fibrosis during a winter camp. Pediatric
Pulmonology, 29(3), pp.177–81.
Oliver, A., 2000. High Frequency of Hypermutable Pseudomonas aeruginosa in Cystic
Fibrosis Lung Infection. Science, 288(5469), pp.1251–1253.
Oliver, A., Baquero, F. & Blazquez, J., 2002. The mismatch repair system (mutS, mutL
and uvrD genes) in Pseudomonas aeruginosa: molecular characterization of
naturally occurring mutants. Molecular Microbiology, 43(6), pp.1641–1650.
Onteniente, L. et al., 2003. Evaluation of the Polymorphisms Associated with Tandem
Repeats for Pseudomonas aeruginosa Strain Typing. Journal of Clinical
Microbiology, 41(11), pp.4991–4997.
Pai, H. et al., 2001. Carbapenem resistance mechanisms in Pseudomonas aeruginosa
clinical isolates. Antimicrobial Agents and Chemotherapy, 45(2), pp.480–4.
Panagea, S. et al., 2003. PCR-Based Detection of a Cystic Fibrosis Epidemic Strain of
Pseudomonas aeruginosa. Molecular Diagnosis, 7(3), pp.195–200.
Parkins, M.D. et al., 2014. Twenty-five-year outbreak of Pseudomonas aeruginosa
infecting individuals with cystic fibrosis: identification of the prairie epidemic
strain. Journal of Clinical Microbiology, 52(4), pp.1127–35.
Pasteur, M.C. et al., 2000. An investigation into causative factors in patients with
bronchiectasis. American Journal of Respiratory and Critical Care Medicine,
162(4 Pt 1), pp.1277–84.
Pasteur, M.C., Bilton, D. & Hill, A.T., 2010. British Thoracic Society guideline for non-
CF bronchiectasis. Thorax, 65 Suppl 1(Suppl_1), pp.i1–58.
Pauwels, A., Sifrim, D. & Dupont, L.J., 2012. Gastroesophageal Reflux in Cystic Fibrosis
and Non-CF Bronchiectasis. In K. C. Meyer & G. Raghu, eds. Gastroesophageal
Reflux and the Lung. Springer, pp. 153 – 174.
208
Pedersen, S.S. et al., 1986. An epidemic spread of multiresistant Pseudomonas
aeruginosa in a cystic fibrosis centre. Journal of Antimicrobial Chemotherapy,
17(4), pp.505–516.
Persat, A. et al., 2015. Type IV pili mechanochemically regulate virulence factors in
Pseudomonas aeruginosa. Proceedings of the National Academy of Sciences of
the United States of America, 112(24), pp.7563–8.
Pirnay, J.P. et al., 2002. Pseudomonas aeruginosa displays an epidemic population
structure. Environmental Microbiology, 4(12), pp.898–911.
Pirnay, J.P. et al., 2009. Pseudomonas aeruginosa population structure revisited. PLoS
ONE, 4(11), p.e7740.
Polverino, E. et al., 2015. Microbiology and outcomes of community acquired
pneumonia in non cystic-fibrosis bronchiectasis patients. Journal of Infection,
71(1), pp.28–36.
Pujana, I. et al., 1999. Epidemiological Analysis of Sequential Pseudomonas
aeruginosa Isolates from Chronic Bronchiectasis Patients without Cystic
Fibrosis. Journal of Clinical Microbiology, 37(6), pp.2071–2073.
Quick, J. et al., 2014. Seeking the source of Pseudomonas aeruginosa infections in a
recently opened hospital: an observational study using whole-genome
sequencing. BMJ Open, 4(11), pp.e006278–e006278.
Quint, J.K. et al., 2012. Time Trends in Incidence and Prevalence of Bronchiectasis in
the UK. Thorax, 67.
Rakhimova, E. et al., 2009. Pseudomonas aeruginosa population biology in chronic
obstructive pulmonary disease. The Journal of Infectious Diseases, 200(12),
pp.1928–35.
Rau, M.H. et al., 2010. Early adaptive developments of Pseudomonas aeruginosa
after the transition from life in the environment to persistent colonization in the
airways of human cystic fibrosis hosts. Environmental Microbiology, 12(6),
pp.1643–58.
Renders, N.H. et al., 1997. Exchange of Pseudomonas aeruginosa strains among cystic
fibrosis siblings. Research in Microbiology, 148(5), pp.447–54.
Riordan, J.R. et al., 1989. Identification of the cystic fibrosis gene: cloning and
characterization of complementary DNA. Science, 245(4922), pp.1066–73.
Römling, U. et al., 1994. A major Pseudomonas aeruginosa clone common to patients
and aquatic habitats. Applied and Environmental Microbiology, 60(6), pp.1734–
8.
Römling, U. et al., 2005. Worldwide distribution of Pseudomonas aeruginosa clone C
strains in the aquatic environment and cystic fibrosis patients. Environmental
Microbiology, 7(7), pp.1029–38.
209
Rommens, J.M. et al., 1989. Identification of the cystic fibrosis gene: chromosome
walking and jumping. Science, 245(4922), pp.1059–65.
Roy, P.H. et al., 2010. Complete genome sequence of the multiresistant taxonomic
outlier Pseudomonas aeruginosa PA7. PLoS ONE, 5(1), p.e8842.
Salunkhe, P. et al., 2005. A cystic fibrosis epidemic strain of Pseudomonas aeruginosa
displays enhanced virulence and antimicrobial resistance. Journal of
Bacteriology, 187(14), pp.4908–20.
Sawa, T. et al., 1999. Active and passive immunization with the Pseudomonas V
antigen protects against type III intoxication and lung injury. Nature Medicine,
5(4), pp.392–398.
Schmid, J. et al., 2008. Pseudomonas aeruginosa transmission is infrequent in New
Zealand cystic fibrosis clinics. European Respiratory Journal, 32(6), pp.1583 –
1590.
Schwartz, D.C. & Cantor, C.R., 1984. Separation of yeast chromosome-sized DNAs by
pulsed field gradient gel electrophoresis. Cell, 37(1), pp.67–75.
Scott, F.W. & Pitt, T.L., 2004. Identification and characterization of transmissible
Pseudomonas aeruginosa strains in cystic fibrosis patients in England and Wales.
Journal of Medical Microbiology, 53(7), pp.609–615.
Sener, B. et al., 2001. Epidemiology of chronic infections in cystic fibrosis.
International Journal of Medical Microbiology, 291(5), pp.387–393.
Shankar, J. et al., 2012. Genotypic analysis of UK keratitis-associated Pseudomonas
aeruginosa suggests adaptation to environmental water as a key component in
the development of eye infections. FEMS Microbiology Letters, 334(2), pp.79–
86.
Silby, M.W. et al., 2011. Pseudomonas genomes: diverse and adaptable. FEMS
Microbiology Reviews, 35(4), pp.652–80.
Slekovec, C. et al., 2012. Tracking down antibiotic-resistant Pseudomonas aeruginosa
isolates in a wastewater network. PLoS ONE, 7(12), p.e49300.
Smart, C.H.M., Scott, F.W., et al., 2006. Development of a diagnostic test for the
Midlands 1 cystic fibrosis epidemic strain of Pseudomonas aeruginosa. Journal
of Medical Microbiology, 55(Pt 8), pp.1085–91.
Smart, C.H.M., 2007. Genetic studies of cystic fibrosis epidemic strains of
Pseudomonas aeruginosa. University of Liverpool.
Smart, C.H.M., Walshaw, M.J., et al., 2006. Use of suppression subtractive
hybridization to examine the accessory genome of the Liverpool cystic fibrosis
epidemic strain of Pseudomonas aeruginosa. Journal of Medical Microbiology,
55(Pt 6), pp.677–88.
210
Smith, A.L. et al., 2003. Susceptibility Testing of Pseudomonas aeruginosa Isolates
and Clinical Response to Parenteral Antibiotic Administration. Chest, 123(5),
p.1495.
Smith, E.E. et al., 2006. Genetic adaptation by Pseudomonas aeruginosa to the
airways of cystic fibrosis patients. Proceedings of the National Academy of
Sciences of the United States of America, 103(22), pp.8487–92.
Snyder, L.A. et al., 2013. Epidemiological investigation of Pseudomonas aeruginosa
isolates from a six-year-long hospital outbreak using high-throughput whole
genome sequencing. Eurosurveillance, 18(42).
De Soyza, A. et al., 2014. Molecular epidemiological analysis suggests cross-infection
with Pseudomonas aeruginosa is rare in non-cystic fibrosis bronchiectasis.
European Respiratory Journal, 43(3), pp.900–3.
De Soyza, A., Brown, J. & Loebinger, M.R., 2013. Research priorities in bronchiectasis.
Thorax, 68(7), pp.695–6.
Speert, D.P. et al., 2002. Epidemiology of Pseudomonas aeruginosa in cystic fibrosis
in British Columbia, Canada. American Journal of Respiratory and Critical Care
Medicine, 166(7).
Speert, D.P. & Campbell, M.E., 1987. Hospital epidemiology of Pseudomonas
aeruginosa from patients with cystic fibrosis. Journal of Hospital Infection, 9(1),
pp.11–21.
Spencer, D.H. et al., 2003. Whole-Genome Sequence Variation among Multiple
Isolates of Pseudomonas aeruginosa. Journal of Bacteriology, 185(4), pp.1316–
1325.
Spiers, A.J., Buckling, A. & Rainey, P.B., 2000. The causes of Pseudomonas diversity.
Microbiology, 146(10), pp.2345–50.
Spilker, T. et al., 2004. PCR-based assay for differentiation of Pseudomonas
aeruginosa from other Pseudomonas species recovered from cystic fibrosis
patients. Journal of Clinical Microbiology, 42(5), pp.2074–9.
Spratt, B.G. et al., 2004. Displaying the relatedness among isolates of bacterial
species -- the eBURST approach. FEMS Microbiology Letters, 241(2), pp.129–34.
Stenton, C., 2008. The MRC breathlessness scale. Occupational Medicine, 58(3),
pp.226–7.
Stephenson, A.L. et al., 2015. A contemporary survival analysis of individuals with
cystic fibrosis: a cohort study. The European Respiratory Journal, 45(3), pp.670–
9.
Stewart, J.L. et al., 2012. Clinical impact of CT radiological feature of bronchiectasis
in the COPDgene cohort. American Journal of Respiratory and Critical Care
Medicine, 185.
211
Stewart, L. et al., 2014. Draft genomes of 12 host-adapted and environmental isolates
of Pseudomonas aeruginosa and their positions in the core genome phylogeny.
Pathogens and Disease, 71(1), pp.20–5.
Stewart, P.S. & Costerton, W.J., 2001. Antibiotic resistance of bacteria in biofilms. The
Lancet, 358(9276), pp.135–138.
Stewart, R.M.K. et al., 2011. Genetic characterization indicates that a specific
subpopulation of Pseudomonas aeruginosa is associated with keratitis
infections. Journal of Clinical Microbiology, 49(3), pp.993–1003.
Stover, C.K. et al., 2000. Complete genome sequence of Pseudomonas aeruginosa
PAO1, an opportunistic pathogen. Nature, 406(6799), pp.959–64.
Syrmis, M.W. et al., 2004. Rapid genotyping of Pseudomonas aeruginosa isolates
harboured by adult and paediatric patients with cystic fibrosis using repetitive-
element-based PCR assays. Journal of Medical Microbiology, 53(Pt 11),
pp.1089–96.
Tamura, K. et al., 2013. MEGA6: Molecular Evolutionary Genetics Analysis version
6.0. Molecular Biology and Evolution, 30(12), pp.2725–9.
Tenover, F.C. et al., 1995. Interpreting chromosomal DNA restriction patterns
produced by pulsed-field gel electrophoresis: criteria for bacterial strain typing.
Journal of Clinical Microbiology, 33(9), pp.2233–9.
The UK Cystic Fibrosis Trust Infection Control Group, 2004. Pseudomonas aeruginosa
infection in people with cystic fibrosis. Suggestions for Prevention and Infection
Control,
Thomas, S.R. et al., 2000. Increased sputum amino acid concentrations and
auxotrophy of Pseudomonas aeruginosa in severe cystic fibrosis lung disease.
Thorax, 55(9), pp.795–797.
Toft, C. & Andersson, S.G.E., 2010. Evolutionary microbial genomics: insights into
bacterial host adaptation. Nature Reviews Genetics, 11(7), pp.465–75.
Török, M.E. & Peacock, S.J., 2012. Rapid whole-genome sequencing of bacterial
pathogens in the clinical microbiology laboratory--pipe dream or reality? The
Journal of Antimicrobial Chemotherapy, 67(10), pp.2307–8.
Tümmler, B., 2006. Clonal variations in Pseudomonas aeruginosa. In Pseudomonas.
pp. 35 – 68.
Uzun, S. et al., 2014. Azithromycin maintenance treatment in patients with frequent
exacerbations of chronic obstructive pulmonary disease (COLUMBUS): a
randomised, double-blind, placebo-controlled trial. The Lancet Respiratory
Medicine, 2(5), pp.361–8.
Vandamme, P. et al., 1997. Occurrence of multiple genomovars of Burkholderia
cepacia in cystic fibrosis patients and proposal of Burkholderia multivorans sp.
nov. International Journal of Systematic Bacteriology, 47(4), pp.1188–200.
212
Versura, P. et al., 1987. Detection of mucus glycoconjugates in human conjunctiva by
using the lectin colloidal gold technique in TEM. Acta Ophthalmologica, 64(4),
pp.445–450.
Vogne, C. et al., 2004. Role of the Multidrug Efflux System MexXY in the Emergence
of Moderate Resistance to Aminoglycosides among Pseudomonas aeruginosa
Isolates from Patients with Cystic Fibrosis. Antimicrobial Agents and
Chemotherapy, 48(5), pp.1676–1680.
De Vos, D. et al., 1997. Direct detection and identification of Pseudomonas
aeruginosa in clinical samples such as skin biopsy specimens and expectorations
by multiplex PCR based on two outer membrane lipoprotein genes, oprI and
oprL. Journal of Clinical Microbiology, 35(6), pp.1295–9.
Vu-Thien, H. et al., 2007. Multiple-locus variable-number tandem-repeat analysis for
longitudinal survey of sources of Pseudomonas aeruginosa infection in cystic
fibrosis patients. Journal of Clinical Microbiology, 45(10), pp.3175–83.
Weycker, D. et al., 2005. Prevalence and Economic Burden of Bronchiectasis. Clinical
Pulmonary Medicine, 12(4), pp.205–209.
Wiehlmann, L. et al., 2007. Population structure of Pseudomonas aeruginosa.
Proceedings of the National Academy of Sciences of the United States of
America, 104(19), pp.8101–6.
Wilder, C.N., Allada, G. & Schuster, M., 2009. Instantaneous within-patient diversity
of Pseudomonas aeruginosa quorum-sensing populations from cystic fibrosis
lung infections. Infection and Immunity, 77(12), pp.5631–9.
Williams, D. et al., 2015. Divergent, Coexisting Pseudomonas aeruginosa Lineages in
Chronic Cystic Fibrosis Lung Infections. American Journal of Respiratory and
Critical Care Medicine, 191(7), pp.775–85.
Williams, J.G.K. et al., 1990. DNA polymorphisms amplified by arbitrary primers are
useful as genetic markers. Nucleic Acids Research, 18(22), pp.6531–6535.
Wilson, C.B. et al., 1997. Effect of sputum bacteriology on the quality of life of
patients with bronchiectasis. European Respiratory Journal, 10(8), pp.1754–
1760.
Wilson, C.B. et al., 1998. Systemic markers of inflammation in stable bronchiectasis.
European Respiratory Journal, 12(4), pp.820–824.
Winsor, G.L. et al., 2011. Pseudomonas Genome Database: improved comparative
analysis and population genomics capability for Pseudomonas genomes. Nucleic
Acids Research, 39(Database issue), pp.D596–600.
Winstanley, C. et al., 2009. Newly introduced genomic prophage islands are critical
determinants of in vivo competitiveness in the Liverpool Epidemic Strain of
Pseudomonas aeruginosa. Genome Research, 19(1), pp.12–23.
213
Winstanley, C. & Fothergill, J.L., 2009. The role of quorum sensing in chronic cystic
fibrosis Pseudomonas aeruginosa infections. FEMS Microbiology Letters, 290(1),
pp.1–9.
Winter, D.H. et al., 2015. Aging of the lungs in asymptomatic lifelong nonsmokers:
findings on HRCT. Lung, 193(2), pp.283–90.
Wolfgang, M.C. et al., 2003. Conservation of genome content and virulence
determinants among clinical and environmental isolates of Pseudomonas
aeruginosa. Proceedings of the National Academy of Sciences of the United
States of America, 100(14), pp.8484–9.
Wong, A., Rodrigue, N. & Kassen, R., 2012. Genomics of adaptation during
experimental evolution of the opportunistic pathogen Pseudomonas
aeruginosa. PLoS Genetics, 8(9), p.e1002928.
Woodford, N., Turton, J.F. & Livermore, D.M., 2011. Multiresistant Gram-negative
bacteria: the role of high-risk clones in the dissemination of antibiotic resistance.
FEMS Microbiology Reviews, 35(5), pp.736–55.
Worby, C.J., Lipsitch, M. & Hanage, W.P., 2014. Within-host bacterial diversity
hinders accurate reconstruction of transmission networks from genomic
distance data. PLoS Computational Biology, 10(3), p.e1003549.
Workentine, M.L. et al., 2013. Phenotypic heterogeneity of Pseudomonas aeruginosa
populations in a cystic fibrosis patient. PLoS ONE, 8(4), p.e60225.
Yang, L. et al., 2011. Evolutionary dynamics of bacteria in a human host environment.
Proceedings of the National Academy of Sciences of the United States of
America, 108(18), pp.7481–6.


