Embed Size (px)
Citation preview

Blood Cells, Molecules, and Diseases 46 (2011) 151–158
Contents lists available at ScienceDirect
Blood Cells, Molecules, and Diseases
j ourna l homepage: www.e lsev ie r.com/ locate /ybcmd
Genotyping the factor VIII intron 22 inversion locus using fluorescentin situ hybridization☆
Campbell R. Sheen a, Margaret A. McDonald b, Peter M. George a, Mark P. Smith c, Christine M. Morris b,⁎a Molecular Pathology Laboratory, Canterbury Health Laboratories, Christchurch, New Zealandb Cancer Genetics Research Group, Department of Pathology, University of Otago Christchurch, New Zealandc Haematology Service, Canterbury District Health Board, Christchurch, New Zealand
☆ Contributions: C.R.S., P.M.G., M.P.S. and C.M.M. desigpatient samples; C.R.S. and M.M. performed experimanalyzed results; C.R.S. and C.M.M. prepared the manus⁎ Corresponding author. Cancer Genetics Research Gr
University of Otago Christchurch, PO Box 4345, Christchu364 0009.
E-mail address: [email protected] (C.M. M
1079-9796/$ – see front matter © 2010 Elsevier Inc. Aldoi:10.1016/j.bcmd.2010.12.002
a b s t r a c t
a r t i c l e i n f oArticle history:Submitted 29 October 2010Revised 24 November 2010Available online 6 January 2011
(Communicated by U. Seligsohn, Ph. D.,29 November 2010)
Keywords:Fluorescent in situ hybridizationHemophilia AF8Intron 22 inversionMolecular diagnosis
The factor VIII intron 22 inversion is the most common cause of hemophilia A, accounting for approximately40% of all severe cases of the disease. Southern hybridization and multiplex long distance PCR are the mostcommonly used techniques to detect the inversion in a diagnostic setting, although both have significantlimitations. Here we describe our experience establishing a multicolor fluorescent in situ hybridization (FISH)based assay as an alternative to existing methods for genetic diagnosis of the inversion. Our assay wasdesigned to apply three differentially labelled BAC DNA probes that when hybridized to interphase nucleiwould exhibit signal patterns that are consistent with the normal or the inversion locus. When the FISH assaywas applied to five normal and five inversion male samples, the correct genotype was assignable withpb0.001 for all samples. When applied to carrier female samples the assay could not assign a genotype to allfemale samples, probably due to a lower proportion of informative nuclei in female samples caused by theadded complexity of a second X chromosome. Despite this complication, these pilot findings show that theassay performs favourably compared to the commonly used methods.
ned the study; M.P.S. obtainedents; C.R.S., M.M and C.M.M.cript.oup, Department of Pathology,rch, New Zealand. Fax: +64 3
orris).
l rights reserved.
© 2010 Elsevier Inc. All rights reserved.
Introduction
Hemophilia A is an X-linked recessive disorder of impairedcoagulation that affects 1 in 10000 males. It is caused by mutationsof the factor VIII gene (F8), which is located in band Xq28 at the tip ofthe long arm of the X chromosome. The F8 intron 22 inversion is themost common cause of hemophilia A and is responsible for 42% ofsevere cases of the disease [1]. It is caused by intrachromosomalrecombination between a 9.5 kb region in intron 22 (int22h1) of F8and one of two further copies of this region (called int22h2 andint22h3), located ~500 kb and ~600 kb telomeric of the intrageniccopy, respectively [2,3]. Approximately 82% of inversions occurbetween int22h1 and int22h3 (type 1) and 15% are between int22h1and int22h2 (type 2), with the remainder described as atypical type[1].
Identification of the intron 22 inversion is diagnostically impor-tant, and various assays have been introduced for this purpose.Southern hybridization was first applied by Lakich et al. [2]. This
method is robust and sensitive, but requires a high level of technicalexpertise, is time consuming and labour intensive, and typically usesradioisotopes [4]. These issues were partially resolved by a longdistance polymerase chain reaction (LD-PCR) based assay [5]. Thismultiplex PCR technique amplifies different sized productscorresponding to the normal and inversion alleles. While this assayis more rapid, requires less starting material and eliminatesradioisotope exposure, it is not as reliable as the Southern blotapproach [4]. The size of the products (10, 11 and 12 kb), combinedwith a large GC-rich region and the multiplex nature of the assaymake it technically challenging. Other methods have been described,although none are in widespread use [6,7].
Fluorescent in situ hybridization (FISH) is a molecular cytogenetictool used widely for the detection of structural and numericalabnormalities of chromosomes in a cell nucleus [8,9]. Multicolorapplications allow characterization of a broad range of geneticaberrations that are not easily detected by traditional cytogenetictechniques, Southern hybridization or PCR [10–12]. The target DNA,usually chromosomes in metaphase or interphase nuclei spread on aglass slide, is hybridized with DNA fragments of interest (probes) thathave a fluorescent dye or reporter molecular incorporated. Onceunbound probe is washed away and a DNA counterstain is applied, thecytogenetic location of the probes can be observed using fluorescencemicroscopy.
At metaphase, cell chromatin is condensed and forms microscop-ically discrete and recognizable chromosomes. However, resolution of
152 C.R. Sheen et al. / Blood Cells, Molecules, and Diseases 46 (2011) 151–158
probes at metaphase after FISH is limited to N1 megabase (Mb) [9,13].In contrast, the chromatin of interphase nuclei is relaxed anduncondensed which makes FISH on interphase nuclei useful forhigher-resolution ordering of sequences that are located close to eachother. By using different fluorescent dyes and hybridizing multipleprobes simultaneously, the relative position of the probes can bedetermined. Multicolor interphase FISH allows resolution of probesthat are separated by as little as 50 kb [14], and probe order remainslinear up to approximately 2 Mb [15].
Here we describe the application of interphase FISH to detection ofthe intron 22 inversion. This pilot study shows that the method isrobust and reliable for discriminating between the normal andinversion genotype in male samples and, with refinements, may besimilarly useful for female samples.
Methods
Assay design and probe selection
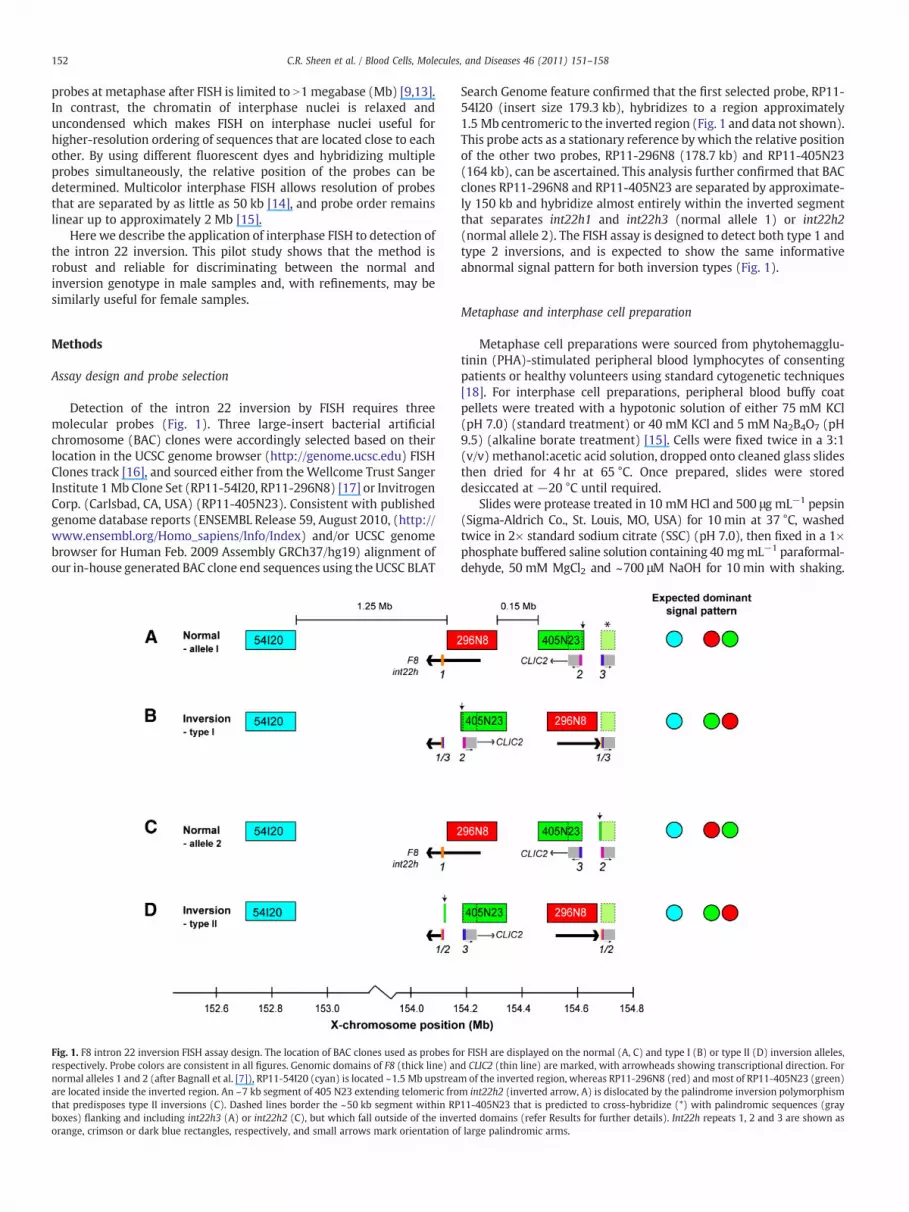
Detection of the intron 22 inversion by FISH requires threemolecular probes (Fig. 1). Three large-insert bacterial artificialchromosome (BAC) clones were accordingly selected based on theirlocation in the UCSC genome browser (http://genome.ucsc.edu) FISHClones track [16], and sourced either from the Wellcome Trust SangerInstitute 1 Mb Clone Set (RP11-54I20, RP11-296N8) [17] or InvitrogenCorp. (Carlsbad, CA, USA) (RP11-405N23). Consistent with publishedgenome database reports (ENSEMBL Release 59, August 2010, (http://www.ensembl.org/Homo_sapiens/Info/Index) and/or UCSC genomebrowser for Human Feb. 2009 Assembly GRCh37/hg19) alignment ofour in-house generated BAC clone end sequences using the UCSC BLAT
Fig. 1. F8 intron 22 inversion FISH assay design. The location of BAC clones used as probes forespectively. Probe colors are consistent in all figures. Genomic domains of F8 (thick line) annormal alleles 1 and 2 (after Bagnall et al. [7]), RP11-54I20 (cyan) is located ~1.5 Mb upstreaare located inside the inverted region. An ~7 kb segment of 405 N23 extending telomeric frothat predisposes type II inversions (C). Dashed lines border the ~50 kb segment within RPboxes) flanking and including int22h3 (A) or int22h2 (C), but which fall outside of the inveorange, crimson or dark blue rectangles, respectively, and small arrows mark orientation o
Search Genome feature confirmed that the first selected probe, RP11-54I20 (insert size 179.3 kb), hybridizes to a region approximately1.5 Mb centromeric to the inverted region (Fig. 1 and data not shown).This probe acts as a stationary reference by which the relative positionof the other two probes, RP11-296N8 (178.7 kb) and RP11-405N23(164 kb), can be ascertained. This analysis further confirmed that BACclones RP11-296N8 and RP11-405N23 are separated by approximate-ly 150 kb and hybridize almost entirely within the inverted segmentthat separates int22h1 and int22h3 (normal allele 1) or int22h2(normal allele 2). The FISH assay is designed to detect both type 1 andtype 2 inversions, and is expected to show the same informativeabnormal signal pattern for both inversion types (Fig. 1).
Metaphase and interphase cell preparation
Metaphase cell preparations were sourced from phytohemagglu-tinin (PHA)-stimulated peripheral blood lymphocytes of consentingpatients or healthy volunteers using standard cytogenetic techniques[18]. For interphase cell preparations, peripheral blood buffy coatpellets were treated with a hypotonic solution of either 75 mM KCl(pH 7.0) (standard treatment) or 40 mM KCl and 5 mM Na2B4O7 (pH9.5) (alkaline borate treatment) [15]. Cells were fixed twice in a 3:1(v/v) methanol:acetic acid solution, dropped onto cleaned glass slidesthen dried for 4 hr at 65 °C. Once prepared, slides were storeddesiccated at −20 °C until required.
Slides were protease treated in 10 mMHCl and 500 μg mL−1 pepsin(Sigma-Aldrich Co., St. Louis, MO, USA) for 10 min at 37 °C, washedtwice in 2× standard sodium citrate (SSC) (pH 7.0), then fixed in a 1×phosphate buffered saline solution containing 40 mgmL−1 paraformal-dehyde, 50 mM MgCl2 and ~700 μM NaOH for 10 min with shaking.
r FISH are displayed on the normal (A, C) and type I (B) or type II (D) inversion alleles,d CLIC2 (thin line) are marked, with arrowheads showing transcriptional direction. Form of the inverted region, whereas RP11-296N8 (red) and most of RP11-405N23 (green)m int22h2 (inverted arrow, A) is dislocated by the palindrome inversion polymorphism11-405N23 that is predicted to cross-hybridize (*) with palindromic sequences (grayrted domains (refer Results for further details). Int22h repeats 1, 2 and 3 are shown asf large palindromic arms.

Table 1Signal patterns after FISH of BAC clones to interphase cells of a healthy female control.
Number of signals RP11-54I20 RP11-296N8 RP11-405N23
0 0 1 11 3 4 52 89 86 933 8 9 14+ 3 0 0Ambiguousa 1 0 0Total nuclei analyzed 104 100 100Sensitivityb 86.4% 86% 93%Informative nucleic 85.6% 86% 93%
a The single ambiguous result observed with RP11-54I20 was due to fusion of twonuclei.
b Defined as the percentage of analysable nuclei showing the expected two signals.c Defined as the percentage of all nuclei analyzed showing two signals.
153C.R. Sheen et al. / Blood Cells, Molecules, and Diseases 46 (2011) 151–158
Slides werewashedwith 2× SSC (pH 7.0) then dehydrated in a series of70%, 80% and 95% (v/v) ethanol solutions before air drying.
FISH probe preparation
BAC DNA was extracted from Luria–Bertani (LB) liquid culturescontaining 10 μg mL−1 chloramphenicol, using a Plasmid Maxi kit(Qiagen GmbH, Hilden, Germany) according to the manufacturer'sinstructions. After extraction, BAC DNA concentration was deter-mined using a ND-1000 UV-visible spectrophotometer (NanoDropTechnologies LLC, Wilmington, DE) and BACs were end-sequencedwith T7 and SP6 primers using BigDye Terminator v.3.1 chemistry(Applied Biosystems, Foster City, CA, USA) to confirm identity. Avolume equivalent to 600 ng BAC DNA was combined with randomoctamer primers (Invitrogen Corp, Carlsbad, CA) then denatured at99 °C for 10 min. Labelling reactions contained the denatured DNA/primer mix, 1× dNTPmix (0.12 mM each of dATP, dGTP and dCTP and0.06 mMdTTP), 1.5 μL of either Alexa-488-5-dUTP, Alexa-594-5-dUTP(Invitrogen) or diethylaminocoumarin-5-dUTP (Perkin Elmer Life andAnalytical Sciences Inc, Waltham, MA, USA) and 24 U exo-Klenowfragment (Invitrogen) in a final volume of 50 μL. Following incubationfor 18 hr at 37 °C, 8 mU of deoxyribonuclease I (Invitrogen) wasadded and the reaction mix was incubated at 16 °C for 23–35 minthen terminated with 5 μL of 0.5 M EDTA. Following purification withSephadex G50 resin (GE Healthcare, Chalfont St. Giles, UK), the size ofthe DNA fragments was determined by agarose gel electrophoresis,with a maximum fragment size of 1000 bp considered sufficientlydigested for use as a probe. Probe concentration and dye incorpora-tion efficiency were determined using a ND-1000 spectrophotometeras above. Probes were stored at−20 °C protected from light until use.
Hybridization and removal of unbound probe
Labelled probe DNA (0.5–1 μg) wasmixedwith 20 μg of Cot-1 DNA(Invitrogen) and 26 μg herring sperm DNA andwas precipitated usingethanol/ammonium acetate. The DNA pellet was dissolved in 6 μL TEbefore adding 14 μL of hybridization buffer (14% dextran sulphate (w/v), 2.9×SSC/58 mM NaH2PO4 (pH 6.0), 71% formamide (v/v)). Aftervortexing for 15 min at 37 °C, the probe mixture was placed on a pre-treated slide and overlaid with a 20 mm×20 mm siliconized coverslipin a DakoCytomation Hybridizer (DakoCytomation A/S, Glostrup,Denmark). The slide was heated to 78 °C for 5 min, incubated at 37 °Cfor 18–20 hr, then the coverslip was removed and the slide waswashed for 2 min at 72 °C in 0.4× SSC/0.3% tert-octylphenoxypoly(oxyethylene)ethanol (IGEPAL) (v/v), then 1 min in 2× SSC/0.1%IGEPAL (v/v) before air-drying in the dark. DNA was counterstainedwith a glycerol suspension of 4′,6-diamidino-2-phenylindole (DAPI)with antifade and covered with a 40 mm × 22 mm cover slip. Slideswere stored in a sealed, dark container at 4 °C.
FISH analysis
Fluorescent images of metaphase nuclear spreads were capturedunder oil-immersion at 100× magnification with an AxioVision.Z1universal research microscope (Carl Zeiss AG, Jena, Germany) fittedwith an AxioCam MRm camera and AxioVision v.4.6.3 software (CarlZeiss). Images were captured through filters selective for DAPI,AlexaFluor-488, AlexaFluor-594 or diethylaminocoumarin fluorescentdyes. At least 10 metaphase spreads prepared from PHA stimulatedlymphocytes of a normal female were captured for each of the threeBAC probes, after which chromosomal location of signals wasdetermined according to the pseudo-Giemsa banding pattern ofinverted greyscale DAPI images.
Fluorescent images of interphase nuclei were captured under oilimmersion at 100× magnification with a BX51 Research fluorescentmicroscope (Olympus Corporation, Tokyo, Japan) and Isis v.5.1.7
software (MetaSystems GmbH, Altlussheim, Germany). Images weretaken through filters selective for the respective dyes and counter-stain. Probe order for each image was recorded separately by twoanalysts who were blinded to the genotype of the sample. Images forwhich the two analysts recorded a different probe order werereanalyzed and if still inconsistent, were omitted from the statisticalanalysis. Interphase nuclei diameters were measured using the CarlZeiss AxioVision.Z1 microscope and imaging software describedabove.
Results
Validation of probe binding sites and signal number
The BAC clones RP11-54I20, RP11-296N8 and RP11-405N23 werelabelled with diethylaminocoumarin-5-dUTP (cyan), Alexa-594-5-dUTP (red) and Alexa-488-5-dUTP (green) respectively. The chro-mosomal location of these probes was verified by hybridizing each inturn to PHA-stimulated peripheral blood lymphocytes from a healthyfemale control. Ten to 12 consecutive analysable metaphase spreadswere examined and for each probe, the number and chromosomallocation of signals was recorded. Sensitivity (the proportion ofanalysable cells that displayed a signal on at least one chromatid ofone or both chromosomes at band Xq28) and specificity (theproportion of cells displaying signals at Xq28 and no other site)were calculated for each probe. All metaphase spreads analyzed forprobes RP11-54I20 and RP11-405N23 showed signals at Xq28 on bothhomologues (sensitivity and specificity 100%), whereas nine out of 10spreads analyzed for RP11-296N8 exhibited two signals at thischromosomal location with the remaining metaphase showing onlyone signal (sensitivity 95%, specificity 100%) (data not shown).
The number of signals on each of at least 100 consecutiveinterphase nuclei was also examined using the same slide prepara-tions. For all probes, at least 86% of interphase nuclei that wereanalyzed exhibited the expected two signals (range 86%–93%)(Table 1).
Consistent with known sensitivity limitations of routine diagnosticFISH assays using direct-labelled fluorescent probes [19], cross-hybridization between the ~50 kb segment within BAC 405N23 thatshares homology with recently reported near-identical invertedsequence palindromes located upstream of int22h2 and downstreamof int22h3 [20] did not seem to confound this analysis under theapplied experimental conditions (Fig. 1 and data not shown).
Optimizing peripheral blood cell nuclei preparations for rapid interphaseFISH
In addition to providing cells at metaphase, PHA stimulation alsoincreases the diameter of peripheral blood lymphocyte interphasenuclei. While this is important for the application we propose here,

154 C.R. Sheen et al. / Blood Cells, Molecules, and Diseases 46 (2011) 151–158
where three closely juxtaposed probes must be clearly resolvable,PHA stimulation is labour intensive, costly and takes at least threedays, so was deemed unsuitable for routine analysis of the intron 22inversion in this diagnostic setting. To remove these complications,FISH was attempted on directly harvested peripheral blood buffy coatinterphase cells that had been prepared according to the standardhypotonic and fixation treatments. This method produced smallnuclei and because the three probes could not be resolved in anacceptable proportion of cells was not a viable alternative fordiagnostic application (data not shown). An adaptation of the directharvest method, using an alkaline sodium borate hypotonic solution[15], was subsequently applied in an attempt to generate nuclei withincreased diameter but still without the time or expense of cellculture. Efficacy of alkaline borate treatment was initially assessed bycomparing the mean diameter of at least 100 interphase nucleiprepared by the standard hypotonic, alkaline borate hypotonic andPHA-stimulation methods. The mean diameter of cells (± s.e.m.)obtained by these methods was 11.7 μm±0.2, 17.9 μm±0.7 and21.2 μm±0.8 respectively (Fig. 2). The borate treatment methodgenerated significantly larger nuclei than standard hypotonic treat-ment (pb0.0001 by t-test with unequal variances) although the meandiameter was still smaller than those derived by PHA stimulation(pb0.005 by t-test with equal variances). In all subsequent FISHexperiments, interphase nuclei were prepared using the boratehypotonic technique.
Male F8 intron 22 inversion analysis
Samples were obtained from five affected males previouslyconfirmed as hemizygous for the intron 22 inversion by LD-PCR,and five healthy unrelated male controls. Following direct harvestwith borate treatment, interphase cell preparations were hybridizedwith all three differently labelled BAC probes, washed to removeunbound probe then counterstained with DAPI. For each control oraffected sample, at least 50 nuclei that exhibited a visible signal foreach of the three probes were photographed and analyzed indepen-dently by two analysts who were blinded to the genotype of thespecimen. Scoring criteria was defined as exhibiting a blue-red-green(BRG, normal) or blue-green-red (BGR, inversion) pattern (Fig. 1).Representative images of the normal and inversion patterns areshown in Figs. 3A and 3B respectively. An aberrant GBR pattern
Fig. 2. Scatter plot showing the effect of different slide preparation methods oninterphase nucleus diameter. Data shown correspond to direct harvest with standardhypotonic treatment (DHS), direct harvest with borate hypotonic treatment (DHB) andPHA-stimulated cell preparations.
observed in some cells (Fig. 3C) was presumed to be an artefact as itdoes not represent either the normal or the inversion genotype,although the possibility that this is a biologically relevant configura-tion cannot be excluded. In addition to clear signal alignmentsreferenced above, recurring ambiguous patterns were also observed,including split or overlapping signals and triangular signal configura-tions (Fig. 3D–F). Nuclei that were assigned a different probe patternby the two analysts were re-examined by both observers and if resultswere still inconsistent, these cells were omitted from the analysis.Patterns classified as normal or inversion were considered informa-tive while other patterns (GBR, ambiguous or inconsistent betweenanalysts) were omitted from statistical analysis.
Results for normal controls and affected male positive controls aresummarized in Table 2. A scatter plot of the percentages of nucleishowing the normal probe patterns for each sample is also shown inFig. 4. A z-test statistic (z = 2
ffiffiffi
np
× f−0:5ð Þ, where n is the number ofinformative nuclei and f is the proportion of nuclei exhibiting thenormal pattern [14], was calculated and compared with normaldistribution tables to obtain p-values. The p-values were used todetermine the statistical significance of the observed ratio of probepatterns. A z-test statistic greater than 2.58 or less than −2.58indicated a normal genotype or inversion genotype with pb0.01respectively.
The FISH assay assigned a genotype to all males with pb0.001 andin each case was consistent with the result determined by LD-PCR(Table 2 and data not shown). There was no significant differencebetween the sensitivity of the assay for normal and affected males(means±s.e.m. were 76.5% ±1.5 and 75.6%±1.18, respectively;pN0.05 by t-test assuming unequal variances), nor was there asignificant difference in the percentage of informative cells in thenormal (71.8%±2.6) and affected male (72.7%±4.0) groups (pN0.05by t-test assuming equal variances).
Female F8 intron 22 inversion analysis
Samples were obtained from five carrier females who werepreviously confirmed as heterozygous for the intron 22 inversion byLD-PCR and five healthy unrelated female controls. Experiments wereperformed as for males above. At least 50 interphase nuclei thatdisplayed two visible signals for each of the three probes wereanalyzed in each case. Scoring criteria was defined as exhibiting eithera BRG/BRG (normal) or BRG/BGR (carrier) probe order (Fig. 3G, Hrespectively). In nine out of 10 cases a small proportion of cellsshowed a homozygous inversion pattern characteristic of an affectedfemale (Fig. 3I; Table 3). However, a homozygote for the intron 22inversion would exhibit a severe phenotype. As no hemophilia Asymptoms were observed in any of the subjects, this pattern wasclassified as non-informative in this situation. As observed in theanalysis of male nuclei, some nuclei exhibited the artefact GBR andother ambiguous signal configurations, which were also excludedfrom the statistical analysis. The mean percentage of non-informativenuclei for females (51.9%±2.1) was approximately twice thatobserved in male specimens (27.8%±2.3), which was a statisticallysignificant difference (pb0.0001 by t-test assuming equal variances).This is largely because one ambiguous or GBR pattern is sufficient for afemale nucleus to be classified as non-informative, as well as the factthat two signal patterns in proximity can often be interpreted inmultiple ways.
Results for normal and carrier female controls are summarized inTable 3 and a scatter plot of the percentages of probe patterns for allsamples is shown in Fig. 5. Test statistics were calculated for femalesas described for male samples. The FISH assay was able to assign agenotype to all carrier females, with pb0.05 for CF3 and CF5, andpb0.01 for CF1, CF2 and CF4. In each case, this was consistent with thegenotype reported by LD-PCR (data not shown). Sensitivity for carrierfemales (72.4%±3.8) was similar to normal and affected males

Fig. 3. Fluorescence microscopy images of representative male (A-F) and female (G-I) interphase nuclei showing observed probe patterns. (A) Normal male signal pattern (BRG),(B) intron 22 inversion signal pattern (BGR), (C) non-genotypic GBR artefact signal pattern and (D-F) common ambiguous signal patterns. (D) shows the three probes forming a nearequilateral triangle, (E) shows all three probes overlapping, (F) shows a split red signal flanking the green signal, (G) homozygous normal female signal pattern (BRG/BRG), (H)heterozygous carrier signal pattern (BRG/BGR) and (I) homozygous inversion affected signal pattern (BGR/BGR). None of the samples in this study were from affected females.
Table 2Summary of signal patterns observed in interphase nuclei from males with normal intron 22 genotype or abnormal intron 22 inversion affected genotype.
Samplea Normal (BRG)b Inversion (BGR) %informative cellsnormal (NM) oraffected (AM)c
p GBR Ambd Inconse % cells informative Total
NM1 49 14 77.8 b0.001 3 14 5 74.1 85NM2 30 10 75.0 b0.001 4 21 0 61.5 65NM3 40 9 81.6 b0.001 1 15 0 75.4 65NM4 31 10 75.6 b0.001 2 13 0 73.2 56NM5 32 12 72.7 b0.001 1 14 0 74.6 59Sensitivity 76.5%Informative 71.8%AM1 14 44 75.9 b0.001 4 16 6 69.0 84AM2 13 37 74.0 b0.001 1 9 2 80.6 62AM3 10 36 78.3 b0.001 3 25 0 62.2 74AM4 14 36 72.0 b0.001 2 5 3 83.3 60AM5 18 63 77.8 b0.001 2 30 6 68.1 119Sensitivity 75.6%Informative 72.7%
a NM1–5, normal male samples 1–5; AM1–5, intron 22 inversion affected male samples 1–5.b B, blue; R, red; G, green.c Informative cells are defined as clearly displaying either the normal (BRG) or inversion (BGR) pattern.d Amb, ambiguous signal pattern.e Incons, inconsistent interpretation between two analysts.
155C.R. Sheen et al. / Blood Cells, Molecules, and Diseases 46 (2011) 151–158

Fig. 4. Distribution of genotypes for normal and affected males. The chart showsclusters of normal (black) and affected (grey) males exhibiting approximately 70–80%of the expected pattern. The proportion of cells that do not display the normal genotypeexhibits the inversion pattern by definition. *pb0.001.
Fig. 5. Distribution of genotypes for normal (black) and carrier females (grey). Theproportion of cells that do not display the normal genotype exhibits the carrier patternby definition. * pb0.01, ‡ pb0.05.
156 C.R. Sheen et al. / Blood Cells, Molecules, and Diseases 46 (2011) 151–158
(pN0.05 by t-test assuming equal variances), but was significantlylower for normal females (55.9%±2.7; pb0.01 by t-test assumingequal variances). None of the normal females could be designated agenotype with a significant level of confidence and all but one had apN0.2 (Table 3). The possibility that this was due to a greaterpropensity for a normal chromosome to display an inversion patternartefact over an inversion chromosome to display the normal patternartefact was examined in the carrier female group. If a tendency forone aberrant pattern to form over another existed, then carrierfemales would be expected to exhibit a significantly greater pro-portion of homozygous inversion than homozygous normal nuclei. Nosignificant difference was observed between the proportion of carrierfemale nuclei that were reported as normal or affected, out of allnuclei showing two interpretable probe patterns (pN0.1 by pairedtwo sample t-test for means). There is therefore no tendency for oneartefact pattern to form over the other.
Discussion
Southern hybridization and LD-PCR are the two most commonlyused methods for detection of the intron 22 inversion. Issues relatingto reproducibility and robustness in the latter were somewhatresolved by Hanrahan et al. in a recent paper [21]. Other methodshave also recently been developed, including an inverse PCR method[6] and a second, more discriminant LD-PCR method [7]. Neither ofthese is in wide use and Southern hybridization and LD-PCR remainthe gold standard methods. The FISH assay described here comparesfavorably to these genotyping methods, at least for male nuclei. FISHcan be comfortably carried out from receipt of blood sample to result
Table 3Summary of signal patterns observed in interphase nuclei from females with normal intron
Samplea Norm(BRG/BRG)b
Carrier(BRG/BGR)c
%informativecells normal (NF)or carrier (CF)d
p Affected(BGR/BGR)e
One am
NormB
NF1 20 15 57.1 N0.2 0 12NF2 21 16 56.8 N0.2 1 19NF3 20 14 58.8 b0.2 2 12NF4 16 10 61.5 b0.1 3 7NF5 15 18 45.5 N0.2 2 9Sensitivity 55.9%InformativeCF1 4 21 16.0 b0.001 5 6CF2 9 23 28.1 b0.001 7 9CF3 9 17 34.6 b0.05 2 9CF4 5 17 22.7 b0.001 4 7CF5 8 14 36.4 b0.05 5 4Sensitivity 72.4%Informative
a NF1-NF5, normal female samples 1–5; CF1-CF5, carrier female samples 1–5.b Norm, homozygous normal pattern: B, blue; R, red; G, green.c Heterozygous carrier pattern.d Informative cells are defined as clearly displaying either the homozygous normal (BRGe Homozygous inversion, affected pattern.f Inv, intron 22 inversion BGR pattern.g Amb, ambiguous signal pattern.h Incons, inconsistent interpretation between two analysts.
within a period of three days—slide preparation on the first day, slidepre-treatment and probe hybridization on the second day and slidewashing, mounting and analysis by microscopy on day three. This isslightly quicker than the PCR based methods, which require threedays after extraction of genomic DNA, and much quicker thanSouthern hybridization, which takes over one week.
Assay validation
Our three-color FISH assay was designed to work as rapidly aspossible and combine the robustness of the Southern hybridizationwith a similar time from sample to result as the PCR based methods.The method was evaluated following examination of all samples in aneffort to minimize bias. In retrospect, it is apparent that the number ofnuclei counted for females was insufficient for comprehensivevalidation. However, given the strong proof of principle in malenuclei and the data presented, we expect that the assay will besimilarly effective given the minor adjustment of doubling nuclearcounts in female nuclei.
While there are many published protocols for individual FISHassays, (for example [22]), comprehensive guidelines for preclinicalvalidation of FISH assays in general have only recently been published,by Wiktor et al. [23]. These guidelines involve four stages—familiarization, pilot study, clinical evaluation and precision, in largepart coincide with the protocols applied for this study.
The familiarization stage involves hybridization to normal culturedlymphocytes to determine the analytic sensitivity and specificity ofthe probes in metaphase and interphase nuclei. Wiktor et al.recommend analysis of 20 metaphase and 50 interphase nuclei from
22 genotype or abnormal intron 22 inversion heterozygous carrier genotype.
biguous pattern + One GBR pattern + Inconsh % cellsinformative
Total
RG InvBGRf GBR Ambg NormBRG InvBGR GBR
6 0 0 1 7 0 1 56.5 624 2 6 1 2 1 6 46.8 794 1 1 0 2 0 3 57.6 594 1 3 1 1 1 8 47.3 555 2 2 0 5 0 3 54.1 61
52.5%7 3 1 0 1 0 7 45.5 556 1 2 1 0 1 15 43.2 743 0 1 2 4 0 4 51.0 519 1 0 6 0 0 7 39.3 566 1 9 1 2 0 5 40.0 55
43.8%
/BRG) or heterozygous carrier (BRG/BGR) pattern.

157C.R. Sheen et al. / Blood Cells, Molecules, and Diseases 46 (2011) 151–158
five normal controls. While this is in excess of the 10 metaphase and100 interphase nuclei examined for each probe in this study, ourresults clearly display a high degree of sensitivity and specificity.Analytical sensitivity is defined as the percentage of chromosometargets or interphase nuclei that show the expected pattern. Thiscorresponds to the percentage of Xq28 sites showing signals inmetaphase nuclei, which was 100% for RP11-54I20 and RP11-405N23,and 95% for RP11-296N8. Analytic specificity for metaphase chromo-somes is defined as the percentage of detected signals located at Xq28and it was observed that all three probes were completely specific forXq28. Wiktor et al. recommend specificity of at least 98% for probesused in diagnostic FISH and all three probes used here meet thiscriterion. Analytic sensitivity for interphase nuclei is the percentagethat exhibit the expected pattern, which in the case of each individualprobewas two signals only in each interphase nucleus. Sensitivity waslower for interphase nuclei than for metaphase, but this is expected asinterphase sensitivity is compromised by overlapping and splitsignals, signal intensity and other technical factors [23]. Analyticspecificity for each probe cannot be calculated for interphase nuclei.
The pilot study phase requires application of the assay to fivenormal and five abnormal specimens from the tissue for which theassay is intended. This phase also establishes the scoring criteria,analytic sensitivity and specificity, number of cells to be analyzed, cut-off values, proportion of informative nuclei and performance of theassay. It is recommended by Wiktor et al. that scoring criteria beestablished by reviewing published reports that use a similar probestrategy. Only three such published reports were found and in allcases required a straight line between the three probes at eachchromosomal locus for the nucleus to be considered suitable forscoring [24–26]. The percentage of informative nuclei is anotherimportant consideration in evaluation of the assay, and these valueswere similar between the normal and F8 intron 22 inversion groupsfor each sex, but were significantly lower for females than for males.
Analytic sensitivity of the assay is essentially represented by thepercentage of cells with the expected signal pattern in the normal orintron 22 inversion genotype groups. Sensitivity in this context waslower than for interphase analysis with individual probes on controlpreparations, primarily due to the positional as well as quantitativenature of the assay. Both male groups and the carrier female groupshowed similar levels of sensitivity, but this was significantly less forthe normal female group.
Defining cut-off values for normal F8 versus intron 22 inversiongenotype assignments
We applied the z-test statistic to calculate cut-off values for thepercentage of scoreable interphase nuclei required to assign a genotypeat a given level of confidence for a given number of nuclei. For eachmalecase the p-value was b0.001, indicating that the number of male cellscounted was sufficient. The minimum number of informative nucleiacross the control and affected male groups was 40 and the meanproportion of informative cells was 76.1%. Thus, approximately 55nuclei need to be photographed to meet the minimum requirement of40 informative nuclei. With a sample of this size, the proportion ofinformative nuclei exhibiting signal patterns consistent with eithernormal or inverted F8 intron 22 configurationmust be b29.6% or N70.4%to assign the patient a genotype with a p-valueb0.01. A sample withmore counted cells that fallswithin either of thesewindowswould havea greater statistical significance.
We photographed and analyzed at least 50 interphase nuclei in ourassessment studies, an arbitrary number of cells which provedsufficient for both control and affected male samples. However, thecombination of a proportion of non-informative nuclei for femalesthat was twice that of males, the lack of an assignable genotype for allnormal females, and two affected females with 0.01bpb0.05, meansthat at least twice asmany nuclei must be photographed and analyzed
in future work. This should yield approximately the same number ofscoreable nuclei as for a male sample and thus cut-off values may bedefined in females as for males. Given that all the carrier females andfour out of the five normal females displayed more cells with theexpected genotype than the non-expected genotype, analysis of agreater number of nuclei will likely increase the confidence of thecarrier result and we expect that some degree of confidence for thenormal females will also be observed.
The experimental clinical sensitivity and specificity are estimatesof the accuracy of the test and defined as the percentage of correctlyidentified true negatives and true positives, respectively. For males,both values were 100%, while for females sensitivity was 0% andspecificity was 60% at pb0.01 and 100% at pb0.05. A more accurategauge of the clinical sensitivity would require a larger study group.Correlation with the gold standard method of LD-PCR determines theaccuracy of the test and in all cases where a result was obtained withpb0.05 the result was consistent with that obtained by LD-PCR, whichindicates that the assay is highly accurate but limited by the relativelyhigh proportion of specimens with no assignable genotype, especiallyfor normal females. The percentage of informative specimens was100% for males, but only 50% for females. It is important to note that inno case was an incorrect genotype assigned.
In the analysis presented here, signal patterns consistent with theaffected female genotype were considered non-informative as none ofthe females analyzed displayed any hemophilia symptoms. If themethodwere to be applied to a female hemophiliac then the statisticalanalysis could be adapted to compare the expected versus observedsignal patterns of a homozygous normal genotype with those of aheterozygous carrier genotype, then a carrier genotype with that of ahomozygous inversion genotype.
Artefact FISH signal patterns
When FISH is applied for the detection of genomic rearrangements insomatic disorders, such asmalignancy, amixture of normal and abnormalcells is expected. However, a germ-line rearrangement such as the intron22 inversion would not be expected to exhibit such mosaicism. Whilemosaicism is relatively common in hemophilia A [27], each of the affectedmales had a factor VIII activity level less than 1% of normal. Any mosaicswould havemitigated symptoms and factor VIII activity levels in excess of1% somosaicism is not probable here. Indeed, when FISH is carried out onuncultured cells the percentage of nuclei with the expected pattern isalways less than 100% [28], as interphase chromatin is not uniformlycompacted and regional differences in folding exist [29]. An inherentproblem in interphasemapping is that chromatin fibres are arranged in athree-dimensional hemisphere on the slide and are prone to form loopsthatmay produce aberrant probe orders [30]. These changes in chromatinfolding can produce order change artefacts and it is possible that the GBRpattern observed in this study, which does not correspond to a genotypicsignal sequence, illustrates this. Our analysis has shown that based onobservations of normal and carrier female cells, there appears to be nosignificant difference in the tendency of the normal pattern to form theinversion pattern over the converse.
X-chromosome inactivation (XCI) is an additional factor potentiallycontributing to the results obtained for our carrier female cohort. XCI is aprocess that silences transcriptional activity of one X in every XX femalesomatic cell, and is a recognised mechanism for mammalian dosagecompensation of X-linked genes [31]. Recent light and electronmicroscopy studies of the inactive X (Xi) in human and mouse femalefibroblasts have demonstrated a unique ultrastructure containingcondensed, large-scale chromatin fibers and domains clearly distinctfrom those observed in euchromatic or constitutive heterochromatinregions [32]. We speculate that such compaction of the Xi may, in turn,alter DNA conformation around the F8 locus to the extent that a higherproportion of X-chromosomes analysed from female subjects showartefact or ambiguous signal patterns aswehave shownhere using locus-

158 C.R. Sheen et al. / Blood Cells, Molecules, and Diseases 46 (2011) 151–158
specificmulticolor FISH. Furtherexperimentalwork is required to confirmthis possibility.
A search of the NCBI PubMed database revealed only three otherpapers utilizing FISH for inversion detection. Osborne et al. reported asimilar method to detect a polymorphic inversion associated withWilliams–Beuren syndrome [24] and Kimberley et al. used interphaseFISH to determine if inversion of 8p was involved in Kabuki syndrome[25]. However, neither paper reported data on the relative proportions ofsignal patterns or artefacts. Flomen et al. describe a more complex assaywith five signals to detect a polymorphic inversion in combinationwith acopy number variant involving part of the α7 cholinergic nicotinicreceptor geneCHRNA7 on chromosome15 [26]. The increased complexityof this assay predictably results in lower proportions of informative nucleithan was observed in our assay to the extent that the authors reportedcounting as many as 150 nuclei to obtain a reliable genotype. We furthernote that whereas recent technological advances have generated a greatincrease in discovery of copy number variants, the contribution of small-scale inversions to structural diversity in the genome has not beenexamined to such a great extent. Methods typically involve bioinformaticanalysis of genome data, so applying the same FISH-based approachdescribed here, and in the aforementioned publications, may providevalidation of inversions predicted by informational methods [33,34].
In this report, we describe the establishment of a FISH assay fordetection of the F8 intron 22 inversion. When applied to male samples,the assay is robust and faster than the commonly used LD-PCR andSouthern hybridization methods. All of the 10 analyzed males had thecorrect genotype assigned. The added complexity of a nucleus with twosignal patterns resulted in a lower proportion of informative nuclei forfemale samples, which contributed to a gender-specific reduction in thestatistical significance of assay results. However, this complication maybe overcome by increasing the number of nuclei analysed.
In families of hemophilia A patients with factor VIII intron 22inversion, accurate determination of the carrier status for all thepotential carriers is usually based on inversion analysis. In view of thehigh percentage of artefacts detected by FISH in female samples,especially in normal females, it is clear that carrier detection cannot bebased at this stage on FISH alone, but must be combined with othermethods. Increasing the number of nuclei analysed might contributeto a substantial increase in the proportion of informative nuclei butthat would need confirmation by PCR or Southern hybridization.
Conflict of interest disclosure
The authors declare no competing financial interests.
Acknowledgments
This study was supported by a Bayer Haemophilia Award SpecialProject Grant and by the Cancer Society of New Zealand. C.R.S was therecipient of a Bright Futures Enterprise Scholarship from the NewZealand Tertiary Education Commission. We wish to acknowledge thetechnical assistance and advice of LoganWalker, Sheryl Gough and SoYoung Moon (Cancer Genetics Research Group, University of OtagoChristchurch, New Zealand) in establishing the FISH assay andElisabeth Wells (Department of Public Health and General Practice,University of Otago, Christchurch) for advice regarding statisticalanalysis. We also acknowledge Vickie Hanrahan (Molecular Pathol-ogy, Canterbury Health Laboratories, Christchurch, New Zealand) andAlison Inder (Clinical Haematology Services, Christchurch Hospital,New Zealand) for assistance with patient and carrier genotypes.
References
[1] S.E. Antonarakis, J.P. Rossiter, M. Young, et al., Factor VIII gene inversions in severehemophilia A: results of an international consortium study, Blood 86 (1995)2206–2212.
[2] D. Lakich, H.H. Kazazian Jr., S.E. Antonarakis, J. Gitschier, Inversions disrupting thefactor VIII gene are a common cause of severe haemophilia A, Nat. Genet. 5 (1993)236–241.
[3] J.A. Naylor, D. Buck, P. Green, et al., Investigation of the factor VIII intron 22repeated region (int22h) and the associated inversion junctions, Hum. Mol.Genet. 4 (1995) 1217–1224.
[4] H. Polakova, I. Zmetakova, L. Kadasi, Long distance PCR in detection of inversionmutations of F8C gene in hemophilia A patients, Gen. Physiol. Biophys. 22 (2003)243–253.
[5] Q. Liu, G. Nozari, S.S. Sommer, Single-tube polymerase chain reaction for rapiddiagnosis of the inversion hotspot of mutation in hemophilia A, Blood 92 (1998)1458–1459.
[6] L.C. Rossetti, C.P. Radic, I.B. Larripa, C.D. De Brasi, Genotyping the hemophiliainversion hotspot by use of inverse PCR, Clin. Chem. 51 (2005) 1154–1158.
[7] R.D. Bagnall, F. Giannelli, P.M. Green, Int22h-related inversions causing hemo-philia A: a novel insight into their origin and a newmore discriminant PCR test fortheir detection, J. Thromb. Haemost. 4 (2006) 591–598.
[8] M.R. Speicher, N.P. Carter, The new cytogenetics: blurring the boundaries withmolecular biology, Nat. Rev. Genet. 6 (2005) 782–792.
[9] B.J. Trask, Human cytogenetics: 46 chromosomes, 46 years and counting, Nat. Rev.Genet. 3 (2002) 769–778.
[10] H.U.Weier, K.M. Greulich-Bode, Y. Ito, R.A. Lersch, J. Fung, FISH in cancer diagnosisand prognostication: from cause to course of disease, Expert Rev. Mol. Diagn. 2(2002) 109–119.
[11] G.J. van Ommen, M.H. Breuning, A.K. Raap, FISH in genome research andmolecular diagnostics, Curr. Opin. Genet. Dev. 5 (1995) 304–308.
[12] T. Ried, A. Baldini, T.C. Rand, D.C. Ward, Simultaneous visualization of sevendifferent DNA probes by in situ hybridization using combinatorial fluorescenceand digital imaging microscopy, Proc. Natl. Acad. Sci. USA. 89 (1992) 1388–1392.
[13] W. King, J. Proffitt, L. Morrison, et al., The role of fluorescence in situ hybridizationtechnologies in molecular diagnostics and disease management, Mol. Diagn. 5(2000) 309–319.
[14] B.J. Trask, H. Massa, S. Kenwrick, J. Gitschier, Mapping of human chromosomeXq28 by two-color fluorescence in situ hybridization of DNA sequences tointerphase cell nuclei, Am. J. Hum. Genet. 48 (1991) 1–15.
[15] H. Yokota, G. van den Engh, M. Mostert, B.J. Trask, Treatment of cells with alkalineborate buffer extends the capability of interphase FISH mapping, Genomics 25(1995) 485–491.
[16] V.G. Cheung, N. Nowak, W. Jang, et al., Integration of cytogenetic landmarks intothe draft sequence of the human genome, Nature 409 (2001) 953–958.
[17] H. Fiegler, P. Carr, E.J. Douglas, et al., DNA microarrays for comparative genomichybridization based on DOP-PCR amplification of BAC and PAC clones, GenesChromosom. Cancer 36 (2003) 361–374.
[18] D.E. Rooney, B.H. Czepulkowski, Human Cytogenetics: Constitutional Analysis: APractical Approach, Oxford University Press, Third Ed., 2001
[19] J. Bayani, J.A. Squire, Fluorescence in situ hybridization (FISH), in: J.S. Bonifacino,M. Dasso, J.B. Harford, J. Lippincott-Schwartz, K. Yamada (Eds.), Curr Protoc CellBiol, Unit 22.4, John Wiley & Sons Inc., New York, 2004.
[20] C.D. De Brasi, D.J. Bowen, Molecular characteristics of the intron 22 homologs ofthe coagulation factor VIII gene: an update, 6 (2008) 1822-1824
[21] N.L. Kilian, V. Pospisil, V. Hanrahan, Haemophilia A, factor VIII intron 22 inversionscreening using subcycling-PCR, Thromb. Haemost. 95 (2006) 746.
[22] N. Cohen, I. Novikov, I. Hardan, et al., Standardization criteria for the detection ofBCR/ABL fusion in interphase nuclei of chronic myelogenous leukemia patients byfluorescence in situ hybridization, Cancer Genet. Cytogenet. 123 (2000) 102–108.
[23] A.E. Wiktor, D.L. Van Dyke, P.J. Stupca, et al., Preclinical validation of fluorescencein situ hybridization assays for clinical practice, Genet. Med. 8 (2006) 16–23.
[24] L.R. Osborne, M. Li, B. Pober, et al., A 1.5 million-base pair inversion polymorphismin families with Williams–Beuren syndrome, Nat. Genet. 29 (2001) 321–325.
[25] K.W. Kimberley, C.A. Morris, H.H. Hobart, BAC-FISH refutes report of an 8p22–8p23.1 inversion or duplication in 8 patients with Kabuki syndrome, BMC Med.Genet. 7 (2006) 46.
[26] R.H. Flomen, A.F. Davies, M. Di Forti, et al., The copy number variant involving partof the alpha7 nicotinic receptor gene contains a polymorphic inversion, Eur. J.Hum. Genet. 1 (2008).
[27] M. Leuer, J. Oldenburg, J.M. Lavergne, et al., Somatic mosaicism in hemophilia A: afairly common event, Am. J. Hum. Genet. 69 (2001) 75–87.
[28] P. Ruangvutilert, J.D. Delhanty, C.H. Rodeck, J.C. Harper, Relative efficiency of FISHon metaphase and interphase nuclei from non-mosaic trisomic or triploidfibroblast cultures, Prenat. Diagn. 20 (2000) 159–162.
[29] H. Yokota, M.J. Singer, G.J. van den Engh, B.J. Trask, Regional differences in thecompaction of chromatin in human G0/G1 interphase nuclei, Chromosome Res. 5(1997) 157–166.
[30] B.G. Beatty, H.Q. Heng, GeneMapping by Fluorescence In Situ Hybridization, in: R.A.Meyers (Ed.), Encyclopedia of Molecular Cell Biology and Molecular Medicine,Wiley-VCH Verlag GmbH & Co., Weinheim, 2004, pp. 137–171.
[31] M.F. Lyon, Gene action in the X-chromosome of the mouse (Mus musculus L.),Nature 190 (1961) 372–373.
[32] A. Rego, P.B. Sinclair, W. Tao, I. Kireev, A.S. Belmont, The facultative heterochro-matin of the inactive X chromosome has a distinctive condensed ultrastructure,J. Cell Sci. 121 (2008) 1119–1127.
[33] V. Bansal, A. Bashir, V. Bafna, Evidence for large inversion polymorphisms in thehuman genome from HapMap data, Genome Res. 17 (2007) 219–230.
[34] L. Feuk, J.R. MacDonald, T. Tang, et al., Discovery of human inversionpolymorphisms by comparative analysis of human and chimpanzee DNAsequence assemblies, PLoS Genet. 1 (2005) e56.


