Embed Size (px)
Citation preview
Journal of Natural Sciences Research www.iiste.org
ISSN 2224-3186 (Paper) ISSN 2225-0921 (Online)
Vol.6, No.6, 2016
99
Geological Mapping, Petrography and Ground Magnetic Survey
in Gidan Doya, Lokoja, North Central, Nigeria
Chiazor Stephen Ngozi-Chika* Opeyemi Stephen Olayemi Ifeanyi Obihan Abraham Onugba
Department of Earth Sciences, Salem University, P.M.B. 1060, Lokoja, Nigeria
Abstract
The geological mapping, petrographic and ground magnetic Survey in Gidan-Doya, Lokoja, North Central,
Nigeria was carried out. The geomagnetic data were acquired along 8 traverses using 3 axes MCL6 Proton
Precession Magnetometer and Magnetic Susceptibility Meter. The data were processed using Surfer 11 software,
corrected for variations in geomagnetic fields as well as upward continuation and residual magnetic field. The
anomaly patterns identified in the upward continued map revealed distinct structural zones. The North Eastern
and South Western zones have the maximum magnetic intensity values ranging from 700 nT to 1100 nT
suggesting shallow basement while the North Western zone is characterized by relatively low magnetic intensity
values ranging from -300 nT to 700 nT suggesting a deeper basement. The direct measurement of magnetic
susceptibility varies between 0.36 x 10⁻³
SI to 39.00 x 10⁻³
SI. The contour map shows the relative thickness of
the overburden to be between 15 to 40 m. The study concludes that magnetic potential of the survey area is
controlled principally by the subsurface structures, thickness of the overburden and mineral composition. The
faults, fractures, and lithological contacts provide channels for mineralization fluids and flow of underground
water. Petrographic study shows that the area is dominated by Migmatite and granite. The major minerals
include feldspar, quartz and biotite, while magnetite, ilmenite and hematite occur as accessory minerals.
Keywords: Magnetic Susceptibility, Petrography, Paramagnetic, Structures, Residual magnetic map and shallow
Basins
1. Introduction
The petrographic study and magnetic survey in this particular study is aimed at geological mapping, outlining the
structural framework of the study area, delineate subsurface features and estimate the depths. The result will
make possible the demarcation of subsurface structures that might be controlling the area groundwater flow and
moreover serve as guidance for future survey for groundwater development and aid the evaluation of mineral
potential of the area and assist in the programme of geological mapping of the area by revealing the existence of
many subsurface structures. The values of magnetic susceptibility depend on the grain size, the presence of
minute crystal lattice, such as dislocations, lattice vacancies, impurities and an amount of iron ore in a sample.
Magnetic susceptibility analyses found various applications in different fields of geophysics including
geophysical prospecting, mineral exploration, palaeomagnetism, archaeology, rock magnetism and
environmental magnetism (Oniku et al., 2008). There is inadequate magnetic data to supplement geologic
mapping and is very useful in subsurface studies of various terrains in geological mapping and estimation to
depth. The speed at which the magnetic measurements can be made and the low cost of operation are additional
justification for its wide acceptance. The method is very suitable for locating buried magnetic ore bodies because
of their magnetic susceptibility. The analysis of these measurements can reveal both vertically and laterally,
meaningful information on the geological structures beneath Dobrin (1976). Kumbor et al., (2013) did the total
field aeromagnetic anomalies over Lokoja and environs in order to map geologic structures and estimate the
depth. Magnetic survey is a well-known technique for petrographic differentiation of the basement and its ability
to highlight structural features like faults, fracture zones and rock contacts. These features are reflected
significantly in the intensities of observed magnetic anomalies and trend patterns; consequently, magnetic
method has been extensively employed in the Nigerian basement complex (Amigun et al, 2012).
The magnetic properties describe the behavior of any substance under the influence of magnetic field. The
magnetic properties of rocks arise from the magnetic properties of the constituent mineral grains and crystals.
Typically, only a small fraction of the rock consists of magnetic minerals, and hence this small portion
determines the magnetic properties and the magnetization of the rock as a whole. The magnetic properties within
a rock type can be quite variable (Carmichael, 1989) depending on chemical in homogenity, depositional and/or
crystallization, and post-deformational conditions.

Journal of Natural Sciences Research www.iiste.org
ISSN 2224-3186 (Paper) ISSN 2225-0921 (Online)
Vol.6, No.6, 2016
100
2. The Study Area
The study area lies between the northing coordinates 853455N and 852059N and easting coordinates 249081E
and 251044E in Gidan-Doya, Lokoja, north-central Nigeria (Figs.1 and 2). The geology of the area is underlain
by N-S trending Precambrian Basement Complex of Southwestern Nigeria (Fig 1). The Basement Complex is
one of the three major litho-stratigraphic components of the geology of Nigeria. It forms a part of the Pan-
African mobile belt and lies between the West African and Congo cratons and the Tuareg shield (Black, 1980;
Grant et al., 1969). The basement complex is intruded by the Younger Granites (Mesozoic calc-alkaline ring
complexes) of the Jos Plateau and unconformably overlain by Cretaceous to Recent sediments. The Nigerian
Basement Complex was affected by the Pan-African (600 ± 150 Ma) orogeny and occupies the reactivated
region which resulted from plate collision between the passive continental margin of the West African craton
and the active Pharusian continental margin (Burke and Dewey, 1972). The Basement rocks are believed to be
the results of at least four major orogenic cycles of deformation, metamorphism and remobilization
corresponding to the Liberian (2,800 ± 200 Ma), the Eburnean (2,000 ± 200 Ma), the Kibaran (1,100 ± 200 Ma),
and the Pan-African cycles (600 ± 150 Ma). The first three cycles were characterized by intense deformation and
isoclinals folding accompanied by regional metamorphism, which was further followed by extensive
migmatization. The Pan-African deformation was accompanied by regional syntectonic granites and gneisses.
Late tectonic emplacement of granites and granodiorites and associated contact metamorphism accompanied the
end stages of this last deformation. The end of the orogeny was marked by faulting and fracturing (Gandu et
al.,1986).Within the Basement Complex of Nigeria, four major units are distinguishable, namely: migmatite-
gneiss-quartzite complex, schist belts, Pan-African granitoids, and undeformed acid and basic dykes (Dada,
2006). The geology of the area is made up of Basement Complex rocks which include migmatite gneiss (augen
gneiss or porphyroblastic granite and biotite gneiss) intruded by the NE-SW trending pegmatite dykes and
covered by the Cretaceous – Recent coarse-medium grained sands to the East forming the bank of River Niger.
Jones and Hockey (1964). Grant et al (1972), Odigi et al (1993), Pearce and Gale (1977) have regionally
describe the rocks in the area.
Fig. 1. Geologic map of Nigeria showing the study area (Modified after Obaje, 2009)
Journal of Natural Sciences Research www.iiste.org
ISSN 2224-3186 (Paper) ISSN 2225-0921 (Online)
Vol.6, No.6, 2016
101
3. Data Analysis
3.1. Geological Mapping and Petrographic Survey
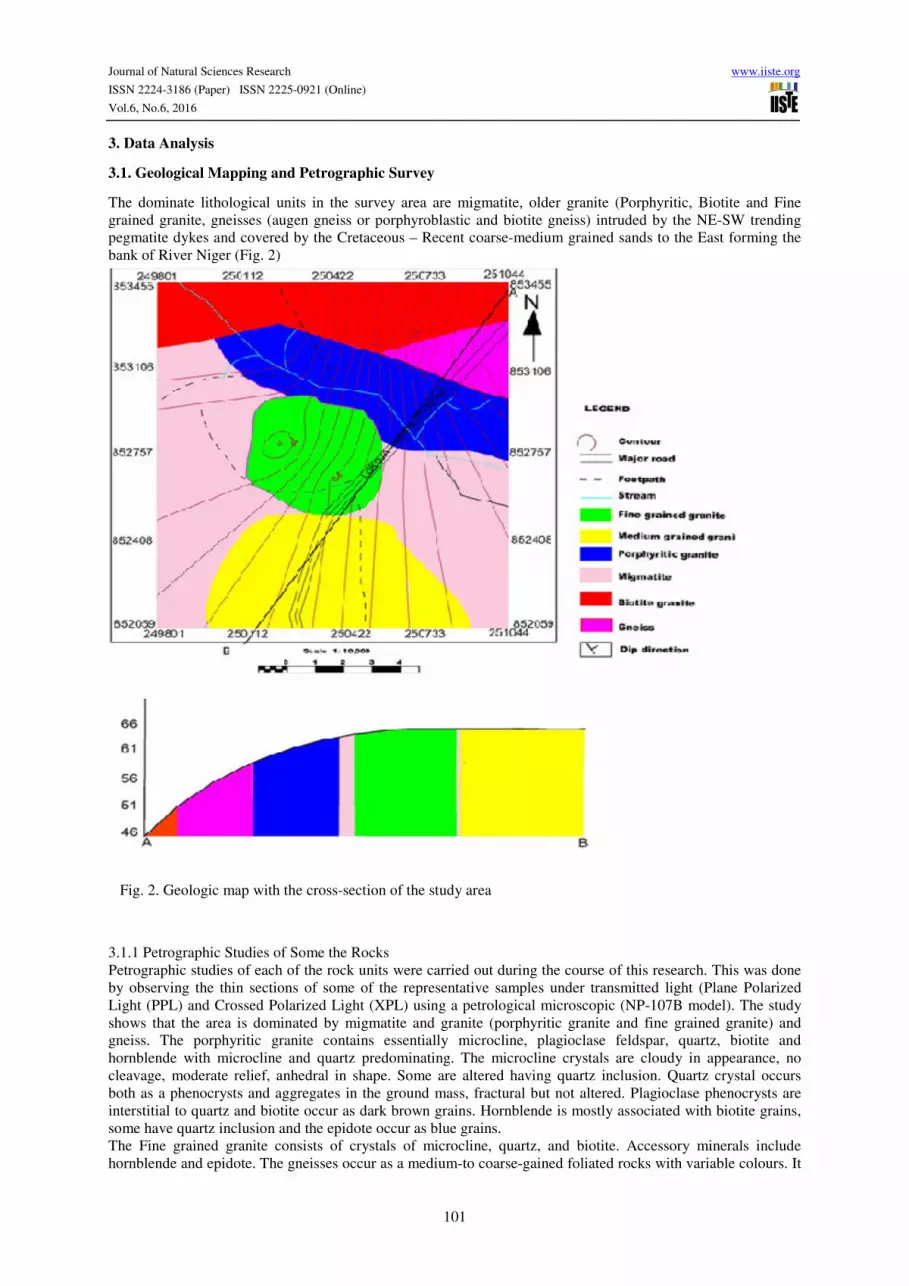
The dominate lithological units in the survey area are migmatite, older granite (Porphyritic, Biotite and Fine
grained granite, gneisses (augen gneiss or porphyroblastic and biotite gneiss) intruded by the NE-SW trending
pegmatite dykes and covered by the Cretaceous – Recent coarse-medium grained sands to the East forming the
bank of River Niger (Fig. 2)
Fig. 2. Geologic map with the cross-section of the study area
3.1.1 Petrographic Studies of Some the Rocks
Petrographic studies of each of the rock units were carried out during the course of this research. This was done
by observing the thin sections of some of the representative samples under transmitted light (Plane Polarized
Light (PPL) and Crossed Polarized Light (XPL) using a petrological microscopic (NP-107B model). The study
shows that the area is dominated by migmatite and granite (porphyritic granite and fine grained granite) and
gneiss. The porphyritic granite contains essentially microcline, plagioclase feldspar, quartz, biotite and
hornblende with microcline and quartz predominating. The microcline crystals are cloudy in appearance, no
cleavage, moderate relief, anhedral in shape. Some are altered having quartz inclusion. Quartz crystal occurs
both as a phenocrysts and aggregates in the ground mass, fractural but not altered. Plagioclase phenocrysts are
interstitial to quartz and biotite occur as dark brown grains. Hornblende is mostly associated with biotite grains,
some have quartz inclusion and the epidote occur as blue grains.
The Fine grained granite consists of crystals of microcline, quartz, and biotite. Accessory minerals include
hornblende and epidote. The gneisses occur as a medium-to coarse-gained foliated rocks with variable colours. It

Journal of Natural Sciences Research www.iiste.org
ISSN 2224-3186 (Paper) ISSN 2225-0921 (Online)
Vol.6, No.6, 2016
102
contains porphyry of feldspar crystals in large amounts, the crystal is about 2-3 cm in length. It is highly banded
with ferromagnesian minerals representing the dark bands. The dark bands contain hornblende and biotite while
the light bands are made up of quartz and feldspar. In hand specimen the rock consists of quartz, feldspar and
biotite. Under the microscope, the rock shows variable grains of minerals closely packed showing preferred
orientation.
The Migmatites are dark and light in colour and comprised leucocratic (leucosome) and melanocratic
(melanosome) fractions. The melanocratic fraction is the metamorphic host rock while the leucocratic fraction is
the metasomatic acid injection. The rock displayed a migmatitic texture marked by the development of foliations
and lineations. The foliations are defined by the parallel arrangement of dark and light coloured minerals while
the lineations are defined by low, sub parallel ribs and furrows on the cleavage surface of the rocks.
The mineral grains have been highly deformed and occur as sub-anhedral to anhedral deformed grains. Hand
specimen of the rock shows the presence of hornblende, plagioclase, biotite and quartz. Under the microscope,
the rocks show euhedral and anhedral crystals of dark and light coloured minerals. The dark coloured minerals
are hornblende and biotite while plagioclase and quartz are the light coloured minerals. The orientation of the
dark and light coloured minerals defines the foliations and lineations in the rock. The rock shows a coarse
grained texture due to the development of the mineral gains into well-defined crystals though some have been
deformed. The rock shows light coloured bands with a granoblastic texture and this composed of plagioclase and
quartz. It also consists of dark coloured bands of short prismatic crystals of hornblende and biotite. Hornblende
occurs as xenoblastic crystals, green in colour and shows pleochroism form yellowish green to dark green. It
shows a high relief and two directions of cleavage which are lacking in some crystals. Where cleavage is
lacking, minor fractures are displayed in their place. Plagioclase occurs as large crystals, colourless and anhedral
in shape. The crystals are well developed with characteristic polysynthetic twining. It shows a moderate relief;
poor cleavage traces and is non pleochroic. Biotite occurs as brownish coloured crystals, within the hornblende.
It is anhedral in shape, exhibits pleochrosim characterized by a dark pleochroic haloes, a very high relief and one
direction of cleavage. Quartz occurs as a colourless mineral with inclusions of unidentified minerals with a low
relief, no cleavage and lacks twining. It is tubular and anhedral in shape. It shows no pleochroism and exhibits a
high interference colour of yellow to brown.
3.2 Magnetic Surveys
The magnetic data in the study area were acquired along eight traverses TR1, TR2, TR3, TR4, TR5, TR6, TR7
and TR8. These traverses run almost in the NE-SW direction (Fig. 3). The magnetic measurements were made
with a 3 axes MCL6 Proton Precession magnetometer at a nominal station spacing of 50m. This instrument
measures the Earth’s total magnetic field in gamma (nanotesla). One hundred and sixty magnetic stations were
occupied along the eigh traverses. The changes in magnetometer reading with time caused by the time-dependent
variation of diurnal variation were taken into consideration. A base station established at the start of the magnetic
survey was re-occupied at regular time interval of 2 hours to monitor the drift (diurnal variation) for drift
correction purpose. The survey direction and station locations were determined using Garmin GPS model.
Coordinates were recorded in the UTM zone 31N. Furthermore, Geomagnetic Reference Field (IGRF) from the
corrected magnetic data was done using the IGRF model obtained from http://www.ngdc.noaa.gov.

Journal of Natural Sciences Research www.iiste.org
ISSN 2224-3186 (Paper) ISSN 2225-0921 (Online)
Vol.6, No.6, 2016
103
Fig. 3. Geophysical layouts
3.3 Data Processing
The visual interpolation method, which is the method of digitizing on Grid layout, was used to obtain the data
from field intensity ground magnetic maps covering the study area. Geo software was used to import the data set.
This program was written to pick all the data points row by row, calculate the longitude and latitude using base
values already supplied. The output is in the form of columns of x, y, z where x, y and z represent longitude,
latitude and magnetic value respectively. The results obtained were fed into a contouring package called
“SURFER 11
3.3.1 Production of Regional and Residual Maps
The residual magnetic field of the study area was produced by subtracting the regional field from the total
magnetic field using the Polynomial fitting method (Fig. 8). The computer program Surfer 11 was used to derive
the residual magnetic values by subtracting values of regional field (34, 000 nT) from the total magnetic field
values to produce the residual magnetic map and the regional map.
3.3.2 Upward Continuation
Upward continuation is used in order to simplify the appearance of regional magnetic maps by suppressing the
effects due to local features (Bonde et al., 2014). This is a mathematical technique that project data taken at an
elevation to a higher elevation. The effect is that short wavelength features are smoothed out because one is

Journal of Natural Sciences Research www.iiste.org
ISSN 2224-3186 (Paper) ISSN 2225-0921 (Online)
Vol.6, No.6, 2016
104
moving away from the anomaly. Also upward continuation tends to accentuate anomalies caused by deep
sources at the expense of anomalies caused by shallow sources (Mekonnen, 2004).
Fig. 4: Upward Continuity map within the Study Area
The contour map of the residual magnetic field after carrying out upward continuity analysis to a depth of about
10m. It is evident that the area lies within the basement complex with the rocks at near surface (Fig. 4). The
‘green’ section indicates that the rocks of the basement complex are undulating. Also the red portions indicate
that most of the rocks are visible as outcrops within the survey area.
4. Results and Analysis
4.1 Data Analysis
The analytical interpretation of the profile lines was achieved by plotting residual magnetic field against
distance. Magnetic data were acquired from 20 sampling point at a distance of about 50m each. Magnetic lows
were observed from the beginning of the profile to a distance of 620m, this indicates a reasonable thickness of
the overburden. From 620-700m, magnetic highs were observed indicating an intrusive body with high magnetic
intensity. The drop in magnetic field towards the end of the profile may suggest the presence of fault. (Fig. 5 is a
typical correlation of the survey area.
In profile 2, magnetic low of about -30nT between 700-800M, reflects a magnetically quite zone; a sharp
decrease at about 760m is an indication of a magnetic anomaly (Fig. 6). The variation in profile 3 indicate that
the basement is undulating. At a distance of about 650m, the sudden rise and fall in the magnetic intensity may
be due to the presence of a fault within the basement. The overburden is thin towards the beginning of the profile
(Fig. 7)

Journal of Natural Sciences Research www.iiste.org
ISSN 2224-3186 (Paper) ISSN 2225-0921 (Online)
Vol.6, No.6, 2016
105
Fig. 5. Magnetic profile along profile 1 with the corresponding geomagnetic section
Fig. 6. Magnetic profile along profile 2 with the corresponding geomagnetic section

Journal of Natural Sciences Research www.iiste.org
ISSN 2224-3186 (Paper) ISSN 2225-0921 (Online)
Vol.6, No.6, 2016
106
Fig. 7. Magnetic profile along profile 3 with the corresponding geomagnetic section
4.2. Contour Map Interpretation:
Contour map of the residual magnetic field was used in the presentation of the magnetic data of this area (Fig. 8).
From the contour map, four major magnetic trends are visible. At portion ‘A’ the residual magnetic field has a
low value of about -700nT to -100nT. This portion of the area indicates low magnetic field and hence suggest
that the depth to basement is high. Also having low magnetic field of negative values indicates the present of
void space or loose soil within the area. At portion ‘B’ and ‘D’, a linear trend of magnetic field values of about
300nT to 1000nT is clearly delineated. This linear feature may be a buried magnetic body or the granitic rocks of
the basement complex, which is also visible as out crops within the area. At portion ‘C’ layering in-between ‘B’
and ‘D’ has trough-like morphology with batches of high magnetic anomalies within it, reflecting a depression
layering between two rocks of the basement complexes (Fig. 8).

Journal of Natural Sciences Research www.iiste.org
ISSN 2224-3186 (Paper) ISSN 2225-0921 (Online)
Vol.6, No.6, 2016
107
Fig. 8: Residual magnetic field of the Study Area
4.3 Graphical Interpretation
The graphical approach use to analyze the magnetic susceptibility measured within the area ranges from 0.36 x
10-3
SI to 39.0 x 10⁻³
SI with an average value of 9.64 x 10⁻³
SI (Figs. 9, 10, 11, 12 and 13)
Fig. 9. Frequency Histogram of Porphyritic Granite

Journal of Natural Sciences Research www.iiste.org
ISSN 2224-3186 (Paper) ISSN 2225-0921 (Online)
Vol.6, No.6, 2016
108
Fig.10: Frequency Histogram of the Fine grained Granite Fig.11: Frequency Histogram of the Migmatite
Fig. 12. Frequency Histogram of Quartzofeldspathic veins Fig.13. Frequency Histogram of Gneiss
Fig. 14. Graphical representation of the magnetic susceptibility values
The figures above show the frequency histograms of various lithology in the survey area. Generally, they are
roughly symmetrical and relatively scattered distributions. Fine grained granites and gneiss have higher relative
datasets. The rocks have complicated distributions reflecting variations in composition. Porphyritic granites have
broader distributions, and alteration may lead to several subsets. Migmatite also have the highest distribution
when compared to other dataset within the study area. The boulders of gneiss and granite encountered during the

Journal of Natural Sciences Research www.iiste.org
ISSN 2224-3186 (Paper) ISSN 2225-0921 (Online)
Vol.6, No.6, 2016
109
exercise had low susceptibility due to weathering away of ferromagnesian minerals of otherwise higher
susceptibility.
The various magnetic susceptibility in terms of mean value and error bars (ranging magnetic values)
characterizing the scatter (Fig. 14). The mean values are represented by the dots on the range for each
corresponding rock types. The susceptibilities of the boulders of gneiss and granites, reworked migmatite and
fine grained granite are in the order of 10 while gneiss is in the order of 20 (Fig. 14 ). On the other hand, the
susceptibility of the other rock type is highly variable.
5. Conclusion
The research work have revealed that the survey area is dominated by migmatite, granites and gneiss. The major
minerals include feldspar, quartz and biotite, while magnetite, ilmenite and hematite occur as accessory minerals.
The magnetic susceptibility measured within the area ranges from 0.36 x 10⁻³
SI to 39.0 x 10⁻³
SI with an average
value of 9.64 x 10⁻³
SI. The susceptibilities of the boulders of gneiss and granites, reworked migmatite and fine
grained granite are in the order of 10 while gneiss is in the order of 20. The magnetic signal from the survey
areal show that the basement is undulating with series of depression and of major fault zones, fractures or any
other geological features that exhibit low values.
The residual magnetic field (RMF) map is divided into two main sections with minor elevations scattered within
the eastern side of the survey area. The northeastern part characterized by low magnetic intensity values
indicated by purple colour. The center of the map is dominated with low magnetic intensity (-100 nT to -700
nT). The high values can be inferred to be the continuation of the dyke which the coloration could be caused due
to the surface exposure of the rocks and other magnetic sources. In general, high magnetic values arise from
igneous and crystalline basement rocks, whereas low magnetic values are usually from sedimentary rocks or
altered basement rocks.
Acknowledgement
This research has benefitted from constructive criticisms of the wider house and anonymous reviewers. We
would not forget to thank our host, the Salem University, for providing an enabling environment within which
we were able to carry out the work
References
Amigun, J.O., and Ako, B.D., (2009). Rock Density- A Tool for Mineral Prospection: A case Study of
Ajabanoko Iron Ore Deposit, Okene S.W. Nigeria. The Pacific Journal of Science and Technology, 10, 733-744.
Black, R. (1980). Precambrian of the West Africa, Episodes, 4, 3-8.
Bonde, D. S., Udensi, E.E., and Momoh, M., (2014). Delineation of Magnetic Zones of Sokoto Basin, in
Northwestern Nigeria, using Aeromagnetic Data. Research Invents: International Journal of Engineering and
Science, 4, Issue 1, 37-45.
Burke, K.C., Dewey, J.F. (1972). Orogeny in Africa, In: African Geology, T.F.J. Dessauvagie and A.J.
Whiteman (eds.), Univ. Ibadan, 583-608.
Carmichael, R. S., (1989). Practical Handbook of Physical Properties of Rocks and Minerals, CRC Press, Boca
Raton, Ann Arbor, Boston, 62 p
Dada, S. S. (2006). Crust Forming Ages and Proterozoic Crustal Evolution in Nigeria: Re-appraisal of Current
Interpretations, Precambrian Research, 65-74.
Dobrin, M. B., (1976). Introduction to Geophysical Prospecting (3rd
ed.): New York, McGraw-Hill, 630 p.
Gandu, A.H, Ojo, S.B., Ajakaye, D.E. (1986). A Gravity Study of the Precambrian in the Malufashi Area of
Kaduna State, Nigeria. Tectonophysics 126, 181-191.

Journal of Natural Sciences Research www.iiste.org
ISSN 2224-3186 (Paper) ISSN 2225-0921 (Online)
Vol.6, No.6, 2016
110
Grant, K., Rex, D. C, Burke, K. C., Freeth, S. J. (1969). The geological sequence and geochronology of old
basement rocks from Ibadan, Nigeria, Am. Fac. Sci. Clermom E-Fd 41. Geomineral, Fasc. 19, 84.
Ikumbor. E.B., Onwuemesi, A.G., Anakwuba, E.K., Chinwuko, A.I., Usman, A.O., and Okwonko, C.C., (2013).
Spectral Analysis of Aeromagnetic Data over Part of the Southern- Bida Basin, West-Central Nigeria.
Internation Journal of Fundamental Physical Sciences (IJFPF), 3 (2), 27-31. Retrieved from http: //fundamental
journals.org/ijfps/index.html.
Jones, H. A. and Hockey, R. D. (1964). The Geology of part of south western Nigeria. Geol Survey Bull 31:2
Mekonnen, T. K., (2004). Interpretation and Geodatabase of Dukes using Aeromagnetic data of Zimbabwe and
Mozambique. M. Sc. Thesis, International Institute for Geoinformation science and Earth Observation,
Enschede, the Netherlands. Retrieved from: http://www.slideserve.com/phila/partners
Odigi, M. I., Ezepue, M. C, Onyeagocha, A. C. (1993). Geochemical evolutionof pan African Magmatic rocks of
the Basement complex S.W Nigeria. J. Afri. Earth. Sci. 17:541-552
Oniku, S. A., Osazuwa, I. B. and Meludu O. C. (2008). Preliminary Report on Magnetic Susceptibility
Measurements on Rocks within the Zaria Granite Batholith, Nigeria: Geofizika, 25 (2), 204-212.
Pearce, J. A. and Gale G. H. (1977). Identification of ore Deposition Environment from Trace Elements in
Volcanic Processes in ore Genesis Inst. Min and Metal and Geol soc. London.


