Embed Size (px)
Citation preview
18th Aug’20
REP-070
Mahnoor [email protected]+92-21-35309119
Glass Industry – Tariq Glass Limited (TGL)Timely expansion to reinstate market share
Executive Summary
We initiate coverage on Tariq Glass Ltd (TGL) with a DCF-based TP of PKR113/share offering an upside of 40% from its lastclosing alongside an attractive dividend yield of 5%. We have a BUY call on the scrip with a TSR of 45%. Our stance isunderpinned by 1) lower interest rates, 2) improvement in construction spending, 3) reduction in fuel cost and 4) expansion of floatglass plant by 500tons/day. TGL trades at a FY21/22E PE of PKR 8.42/4.85 respectively.
Demand for float glass, mostly used for glass buildings, doors and windows, has grown at a 5yr CAGR of 5% between FY14-19catered by 2 main players TGL and Ghani Glass Ltd (GHGL) and imports
The market for glassware is informal in nature and has various small-scale producers. The market is led by TGL with a wideproduct portfolio and high quality standards
TGL took a hefty debt of PKR5.6bn for its float glass unit-2 expansion project leading to a higher finance cost which is likely toremain low due to the sharp cut in policy rate on 625bps by SBP since Mar’20 (interest cost saving: PKR 3.23/share)
Fuel cost comprises of 35% of the cost of production. TGL’s furnace can be fired through four fuels (LNG, Furnace Oil, Keroseneand LPG). Recent decline in furnace oil and LNG prices are likely to improve profitability. We anticipated the fuel cost /ton to fallby 3% in FY21 and by 5% in FY22
Despite being second to GHGL in the float glass market, TGL is poised to gain market share as “Unit-2” becomes operational.The expansion is stated to improve capacity from 550 tpd to 1050 tpd, thereby allowing TGL to expand its share from 31% inFY19 to achieve its historical peak of 40% in our view
Key Risks
• Lower than expected selling prices
• Higher than expected fuel cost
• More than estimated USD/PKR devaluation
• High dependency on a single supplier (ICI Pakistan) for Soda-ash(key raw material) may be risky incase of uncertain market changes and
supply-shocks
2
Industry Overview
Glass Industry is one of the most firm and comparatively less volatile industries inPakistan with a cyclical nature. The industry caters to the needs of three segmentsmainly including pharmaceuticals, food and beverages and construction (primarilyfloat glass)
Demand for float glass is closely linked with construction. It is mostly used at theend of the construction process mainly for windows and doors. Apart fromconstruction, urbanization also plays an important role in demand for glass as theuse of glass in buildings has increased overtime
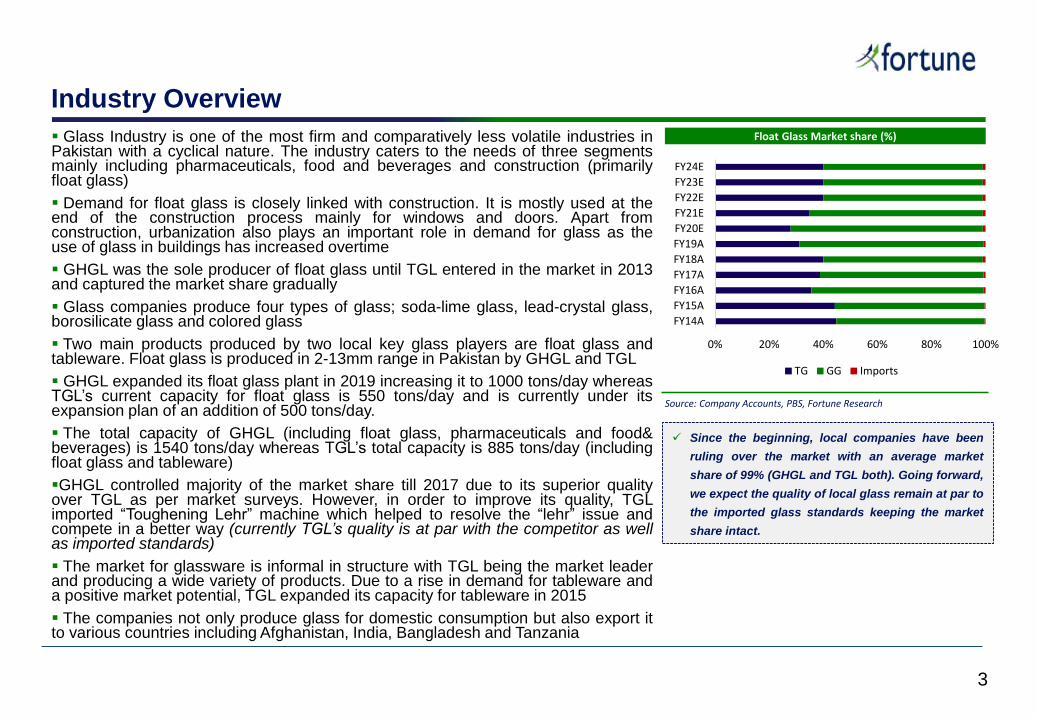
GHGL was the sole producer of float glass until TGL entered in the market in 2013and captured the market share gradually
Glass companies produce four types of glass; soda-lime glass, lead-crystal glass,borosilicate glass and colored glass
Two main products produced by two local key glass players are float glass andtableware. Float glass is produced in 2-13mm range in Pakistan by GHGL and TGL
GHGL expanded its float glass plant in 2019 increasing it to 1000 tons/day whereasTGL’s current capacity for float glass is 550 tons/day and is currently under itsexpansion plan of an addition of 500 tons/day.
The total capacity of GHGL (including float glass, pharmaceuticals and food&beverages) is 1540 tons/day whereas TGL’s total capacity is 885 tons/day (includingfloat glass and tableware)
GHGL controlled majority of the market share till 2017 due to its superior qualityover TGL as per market surveys. However, in order to improve its quality, TGLimported “Toughening Lehr” machine which helped to resolve the “lehr” issue andcompete in a better way (currently TGL’s quality is at par with the competitor as wellas imported standards)
The market for glassware is informal in structure with TGL being the market leaderand producing a wide variety of products. Due to a rise in demand for tableware anda positive market potential, TGL expanded its capacity for tableware in 2015
The companies not only produce glass for domestic consumption but also export itto various countries including Afghanistan, India, Bangladesh and Tanzania
Since the beginning, local companies have been
ruling over the market with an average market
share of 99% (GHGL and TGL both). Going forward,
we expect the quality of local glass remain at par to
the imported glass standards keeping the market
share intact.
Source: Company Accounts, PBS, Fortune Research
Float Glass Market share (%)
0% 20% 40% 60% 80% 100%
FY14A
FY15A
FY16A
FY17A
FY18A
FY19A
FY20E
FY21E
FY22E
FY23E
FY24E
TG GG Imports
3
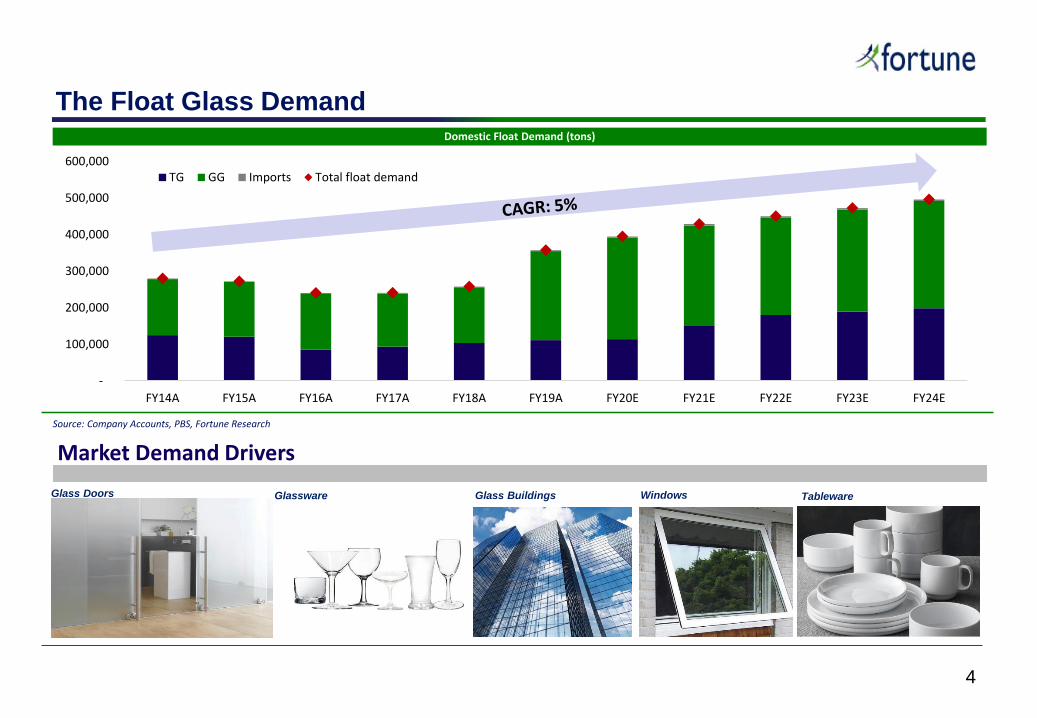
The Float Glass Demand
Glass Doors
Source: Company Accounts, PBS, Fortune Research
Domestic Float Demand (tons)
-
100,000
200,000
300,000
400,000
500,000
600,000
FY14A FY15A FY16A FY17A FY18A FY19A FY20E FY21E FY22E FY23E FY24E
TG GG Imports Total float demand
Market Demand Drivers
Glassware Glass Buildings Windows Tableware
4
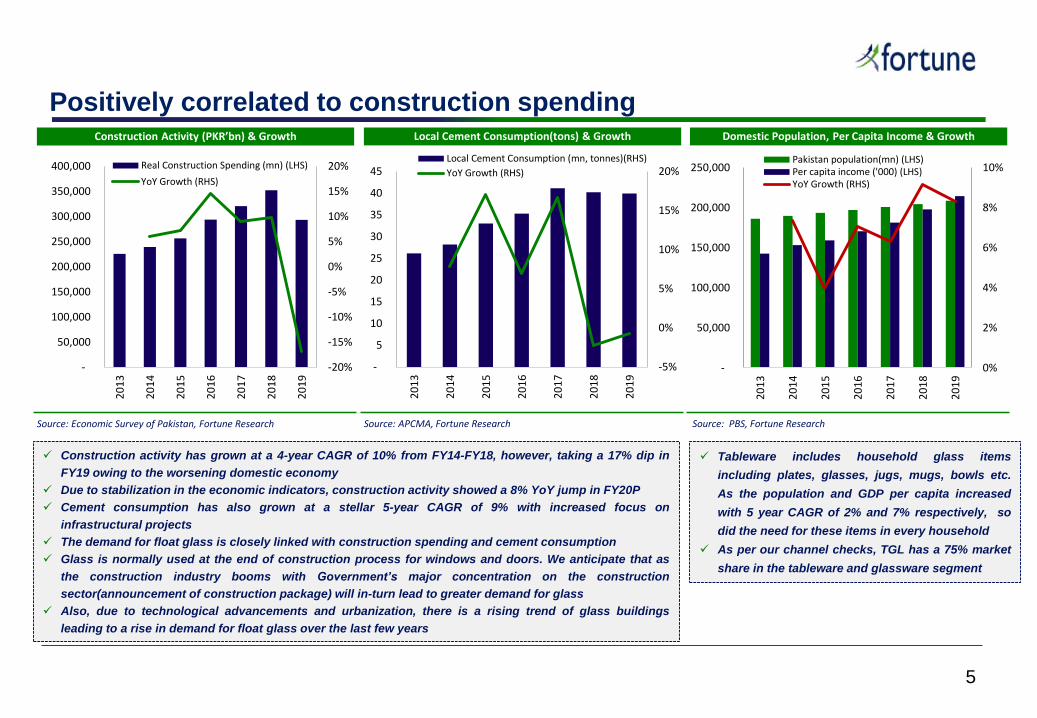
Positively correlated to construction spending
Construction activity has grown at a 4-year CAGR of 10% from FY14-FY18, however, taking a 17% dip in
FY19 owing to the worsening domestic economy
Due to stabilization in the economic indicators, construction activity showed a 8% YoY jump in FY20P
Cement consumption has also grown at a stellar 5-year CAGR of 9% with increased focus on
infrastructural projects
The demand for float glass is closely linked with construction spending and cement consumption
Glass is normally used at the end of construction process for windows and doors. We anticipate that as
the construction industry booms with Government’s major concentration on the construction
sector(announcement of construction package) will in-turn lead to greater demand for glass
Also, due to technological advancements and urbanization, there is a rising trend of glass buildings
leading to a rise in demand for float glass over the last few years
Tableware includes household glass items
including plates, glasses, jugs, mugs, bowls etc.
As the population and GDP per capita increased
with 5 year CAGR of 2% and 7% respectively, so
did the need for these items in every household
As per our channel checks, TGL has a 75% market
share in the tableware and glassware segment
Source: Economic Survey of Pakistan, Fortune Research
Construction Activity (PKR’bn) & Growth
Source: APCMA, Fortune Research
Local Cement Consumption(tons) & Growth
Source: PBS, Fortune Research
Domestic Population, Per Capita Income & Growth
-20%
-15%
-10%
-5%
0%
5%
10%
15%
20%
-
50,000
100,000
150,000
200,000
250,000
300,000
350,000
400,000
20
13
20
14
20
15
20
16
20
17
20
18
20
19
Real Construction Spending (mn) (LHS)
YoY Growth (RHS)
-5%
0%
5%
10%
15%
20%
-
5
10
15
20
25
30
35
40
45
20
13
20
14
20
15
20
16
20
17
20
18
20
19
Local Cement Consumption (mn, tonnes)(RHS)
YoY Growth (RHS)
0%
2%
4%
6%
8%
10%
-
50,000
100,000
150,000
200,000
250,000
20
13
20
14
20
15
20
16
20
17
20
18
20
19
Pakistan population(mn) (LHS)Per capita income ('000) (LHS)YoY Growth (RHS)
5
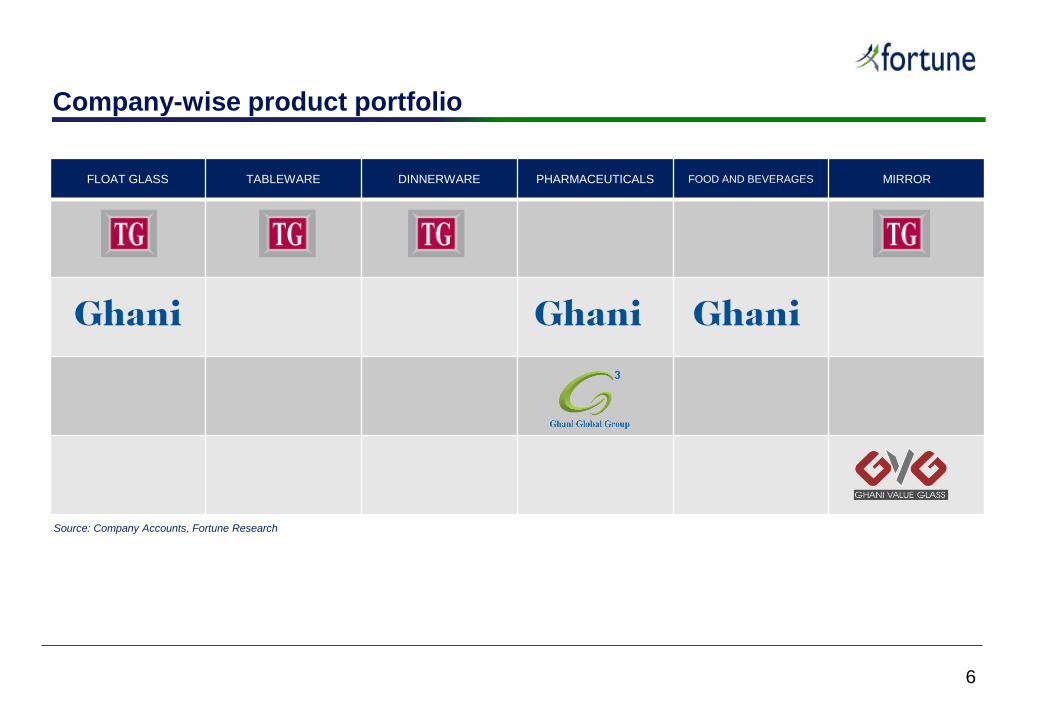
FLOAT GLASS TABLEWARE DINNERWARE PHARMACEUTICALS FOOD AND BEVERAGES MIRROR
Company-wise product portfolio
Source: Company Accounts, Fortune Research
6
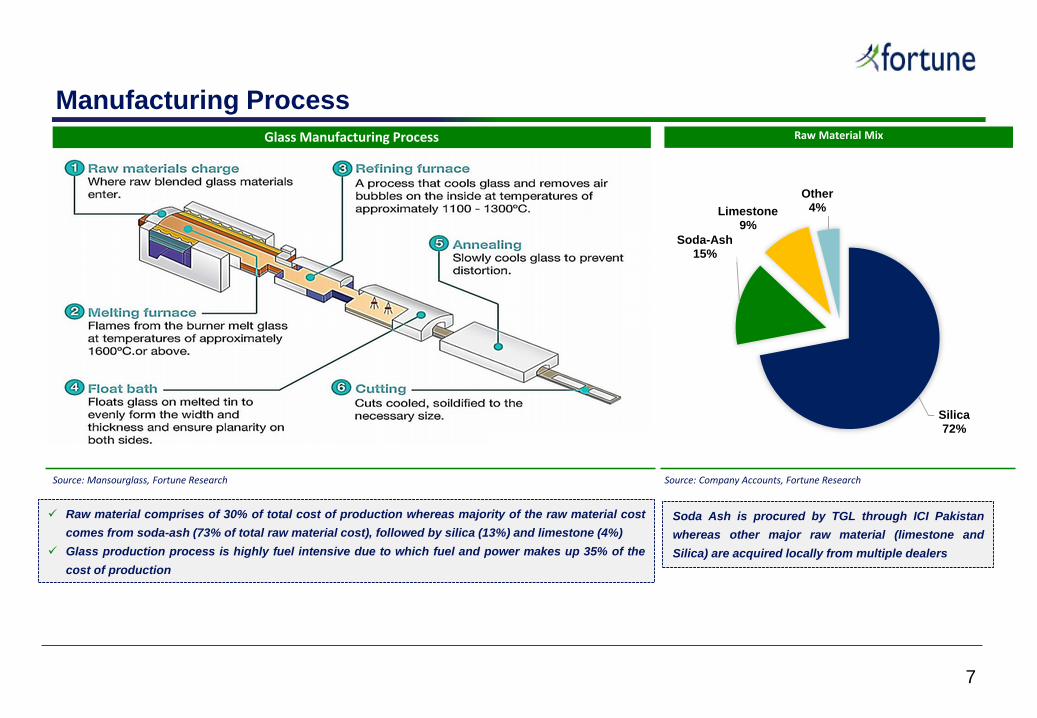
Manufacturing Process
Soda Ash is procured by TGL through ICI Pakistan
whereas other major raw material (limestone and
Silica) are acquired locally from multiple dealers
Raw material comprises of 30% of total cost of production whereas majority of the raw material cost
comes from soda-ash (73% of total raw material cost), followed by silica (13%) and limestone (4%)
Glass production process is highly fuel intensive due to which fuel and power makes up 35% of the
cost of production
Source: Company Accounts, Fortune Research
Raw Material Mix
Silica72%
Soda-Ash15%
Limestone9%
Other4%
Source: Mansourglass, Fortune Research
Glass Manufacturing Process
7
Tariq Glass Limited – Expanding to maintain the market share
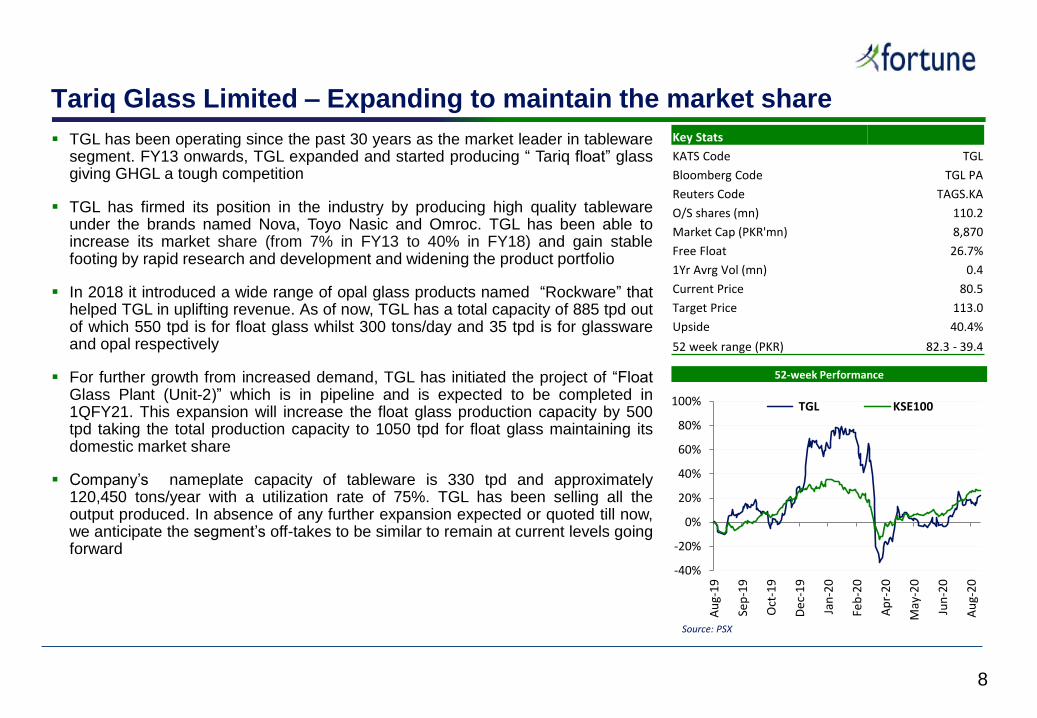
TGL has been operating since the past 30 years as the market leader in tablewaresegment. FY13 onwards, TGL expanded and started producing “ Tariq float” glassgiving GHGL a tough competition
TGL has firmed its position in the industry by producing high quality tablewareunder the brands named Nova, Toyo Nasic and Omroc. TGL has been able toincrease its market share (from 7% in FY13 to 40% in FY18) and gain stablefooting by rapid research and development and widening the product portfolio
In 2018 it introduced a wide range of opal glass products named “Rockware” thathelped TGL in uplifting revenue. As of now, TGL has a total capacity of 885 tpd outof which 550 tpd is for float glass whilst 300 tons/day and 35 tpd is for glasswareand opal respectively
For further growth from increased demand, TGL has initiated the project of “FloatGlass Plant (Unit-2)” which is in pipeline and is expected to be completed in1QFY21. This expansion will increase the float glass production capacity by 500tpd taking the total production capacity to 1050 tpd for float glass maintaining itsdomestic market share
Company’s nameplate capacity of tableware is 330 tpd and approximately120,450 tons/year with a utilization rate of 75%. TGL has been selling all theoutput produced. In absence of any further expansion expected or quoted till now,we anticipate the segment’s off-takes to be similar to remain at current levels goingforward
52-week Performance
8
-40%
-20%
0%
20%
40%
60%
80%
100%
Au
g-1
9
Sep
-19
Oct
-19
De
c-1
9
Jan
-20
Feb
-20
Ap
r-2
0
May
-20
Jun
-20
Au
g-2
0
TGL KSE100
Key Stats
KATS Code TGL
Bloomberg Code TGL PA
Reuters Code TAGS.KA
O/S shares (mn) 110.2
Market Cap (PKR'mn) 8,870
Free Float 26.7%
1Yr Avrg Vol (mn) 0.4
Current Price 80.5
Target Price 113.0
Upside 40.4%
52 week range (PKR) 82.3 - 39.4
Source: PSX
TGL - Positive Outlook warrants For BUY
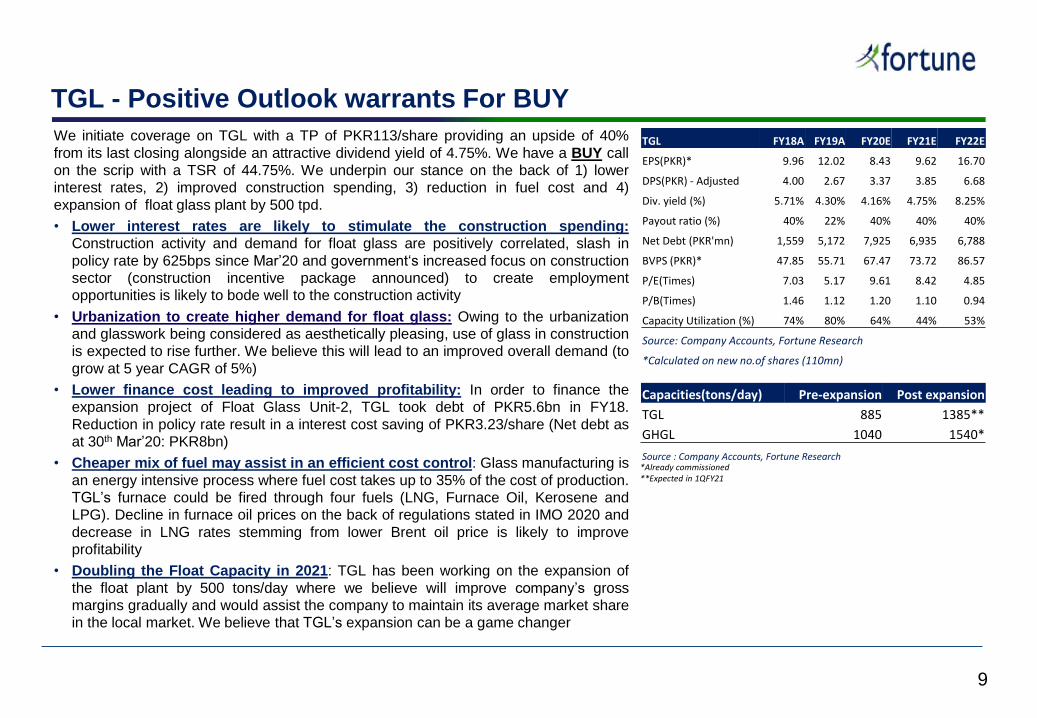
We initiate coverage on TGL with a TP of PKR113/share providing an upside of 40%
from its last closing alongside an attractive dividend yield of 4.75%. We have a BUY call
on the scrip with a TSR of 44.75%. We underpin our stance on the back of 1) lower
interest rates, 2) improved construction spending, 3) reduction in fuel cost and 4)
expansion of float glass plant by 500 tpd.
• Lower interest rates are likely to stimulate the construction spending:
Construction activity and demand for float glass are positively correlated, slash in
policy rate by 625bps since Mar’20 and government‘s increased focus on construction
sector (construction incentive package announced) to create employment
opportunities is likely to bode well to the construction activity
• Urbanization to create higher demand for float glass: Owing to the urbanization
and glasswork being considered as aesthetically pleasing, use of glass in construction
is expected to rise further. We believe this will lead to an improved overall demand (to
grow at 5 year CAGR of 5%)
• Lower finance cost leading to improved profitability: In order to finance the
expansion project of Float Glass Unit-2, TGL took debt of PKR5.6bn in FY18.
Reduction in policy rate result in a interest cost saving of PKR3.23/share (Net debt as
at 30th Mar’20: PKR8bn)
• Cheaper mix of fuel may assist in an efficient cost control: Glass manufacturing is
an energy intensive process where fuel cost takes up to 35% of the cost of production.
TGL’s furnace could be fired through four fuels (LNG, Furnace Oil, Kerosene and
LPG). Decline in furnace oil prices on the back of regulations stated in IMO 2020 and
decrease in LNG rates stemming from lower Brent oil price is likely to improve
profitability
• Doubling the Float Capacity in 2021: TGL has been working on the expansion of
the float plant by 500 tons/day where we believe will improve company’s gross
margins gradually and would assist the company to maintain its average market share
in the local market. We believe that TGL’s expansion can be a game changer
TGL FY18A FY19A FY20E FY21E FY22E
EPS(PKR)* 9.96 12.02 8.43 9.62 16.70
DPS(PKR) - Adjusted 4.00 2.67 3.37 3.85 6.68
Div. yield (%) 5.71% 4.30% 4.16% 4.75% 8.25%
Payout ratio (%) 40% 22% 40% 40% 40%
Net Debt (PKR'mn) 1,559 5,172 7,925 6,935 6,788
BVPS (PKR)* 47.85 55.71 67.47 73.72 86.57
P/E(Times) 7.03 5.17 9.61 8.42 4.85
P/B(Times) 1.46 1.12 1.20 1.10 0.94
Capacity Utilization (%) 74% 80% 64% 44% 53%
Source: Company Accounts, Fortune Research
*Calculated on new no.of shares (110mn)
Capacities(tons/day) Pre-expansion Post expansion
TGL 885 1385**
GHGL 1040 1540*
Source : Company Accounts, Fortune Research *Already commissioned**Expected in 1QFY21
9
Source: Company Accounts, Fortune Research
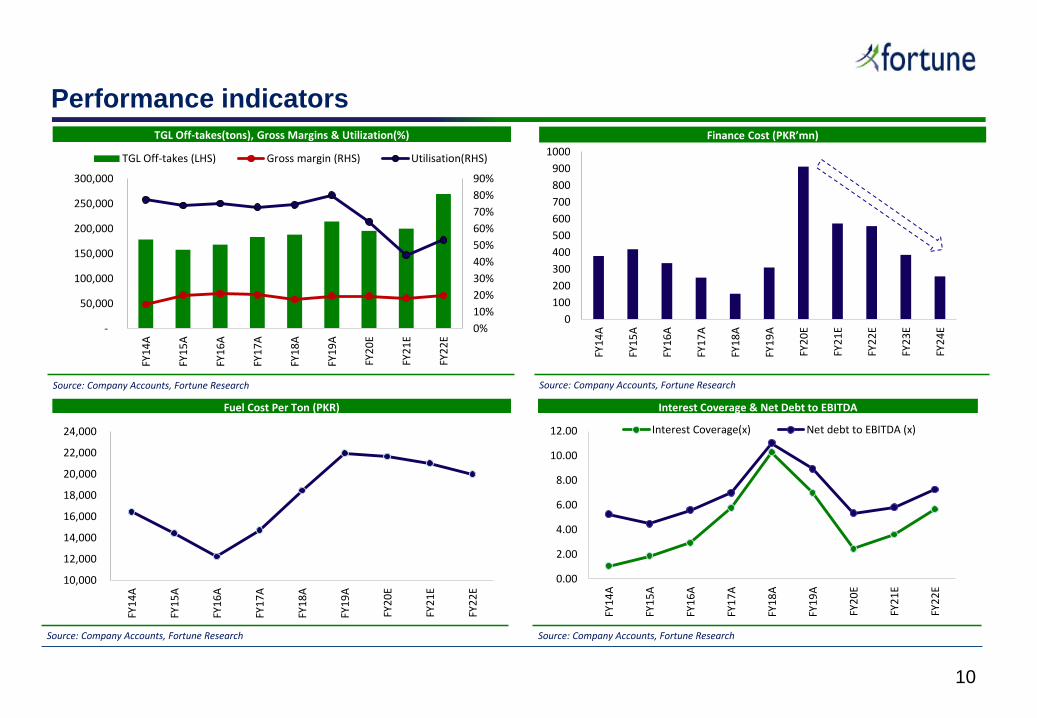
Interest Coverage & Net Debt to EBITDA
0.00
2.00
4.00
6.00
8.00
10.00
12.00
FY1
4A
FY1
5A
FY1
6A
FY1
7A
FY1
8A
FY1
9A
FY2
0E
FY2
1E
FY2
2E
Interest Coverage(x) Net debt to EBITDA (x)
Source: Company Accounts, Fortune Research
Finance Cost (PKR’mn)
0
100
200
300
400
500
600
700
800
900
1000
FY1
4A
FY1
5A
FY1
6A
FY1
7A
FY1
8A
FY1
9A
FY2
0E
FY2
1E
FY2
2E
FY2
3E
FY2
4E
Source: Company Accounts, Fortune Research
TGL Off-takes(tons), Gross Margins & Utilization(%)
0%
10%
20%
30%
40%
50%
60%
70%
80%
90%
-
50,000
100,000
150,000
200,000
250,000
300,000
FY1
4A
FY1
5A
FY1
6A
FY1
7A
FY1
8A
FY1
9A
FY2
0E
FY2
1E
FY2
2E
TGL Off-takes (LHS) Gross margin (RHS) Utilisation(RHS)
Source: Company Accounts, Fortune Research
Fuel Cost Per Ton (PKR)
10,000
12,000
14,000
16,000
18,000
20,000
22,000
24,000
FY1
4A
FY1
5A
FY1
6A
FY1
7A
FY1
8A
FY1
9A
FY2
0E
FY2
1E
FY2
2E
10
Performance indicators
Valuation and Sensitivities
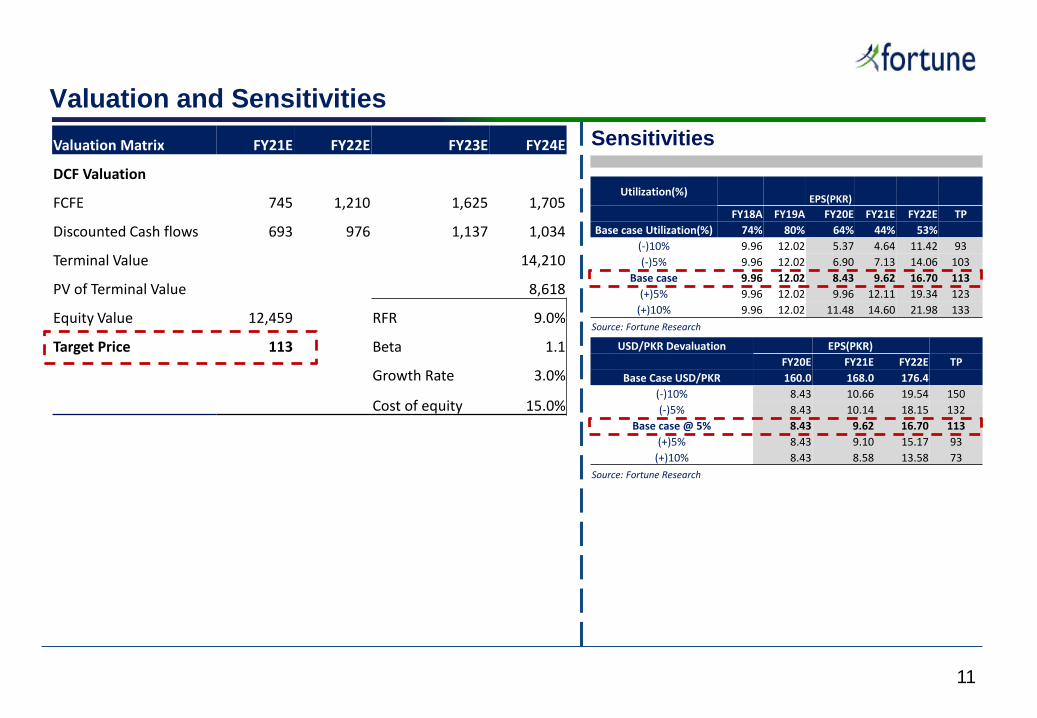
Valuation Matrix FY21E FY22E FY23E FY24E
DCF Valuation
FCFE 745 1,210 1,625 1,705
Discounted Cash flows 693 976 1,137 1,034
Terminal Value 14,210
PV of Terminal Value 8,618
Equity Value 12,459 RFR 9.0%
Target Price 113 Beta 1.1
Growth Rate 3.0%
Cost of equity 15.0%
Sensitivities
Utilization(%)EPS(PKR)
FY18A FY19A FY20E FY21E FY22E TP
Base case Utilization(%) 74% 80% 64% 44% 53%
(-)10% 9.96 12.02 5.37 4.64 11.42 93
(-)5% 9.96 12.02 6.90 7.13 14.06 103
Base case 9.96 12.02 8.43 9.62 16.70 113
(+)5% 9.96 12.02 9.96 12.11 19.34 123
(+)10% 9.96 12.02 11.48 14.60 21.98 133
Source: Fortune Research
USD/PKR Devaluation EPS(PKR)
FY20E FY21E FY22E TP
Base Case USD/PKR 160.0 168.0 176.4
(-)10% 8.43 10.66 19.54 150
(-)5% 8.43 10.14 18.15 132
Base case @ 5% 8.43 9.62 16.70 113
(+)5% 8.43 9.10 15.17 93
(+)10% 8.43 8.58 13.58 73
Source: Fortune Research
11
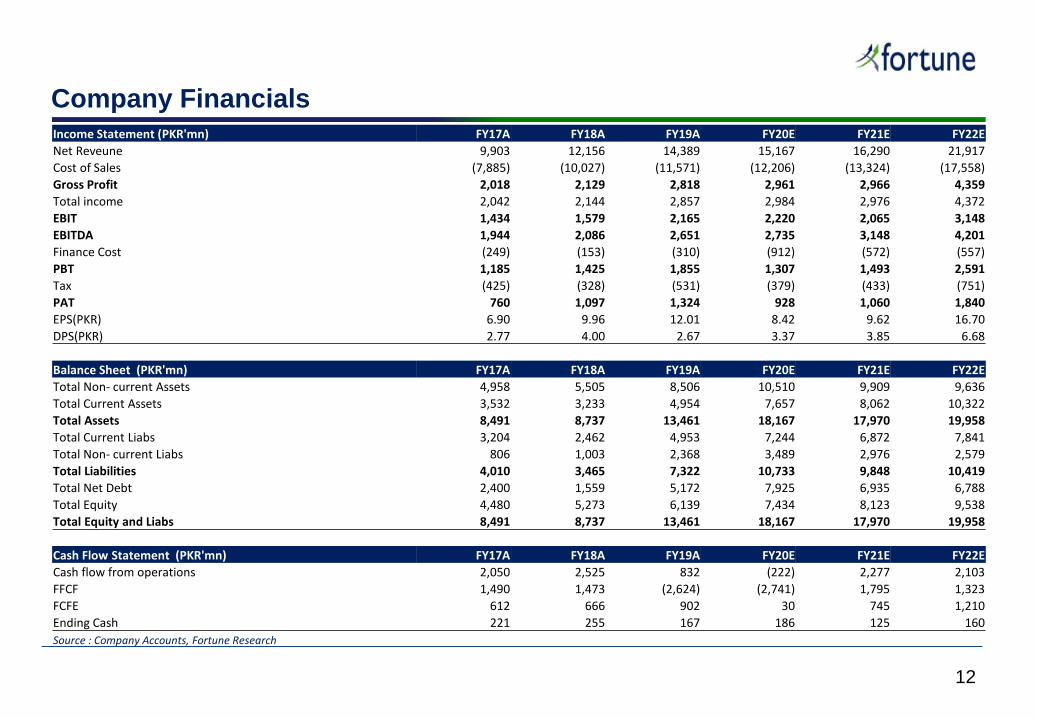
Company FinancialsIncome Statement (PKR'mn) FY17A FY18A FY19A FY20E FY21E FY22E
Net Reveune 9,903 12,156 14,389 15,167 16,290 21,917
Cost of Sales (7,885) (10,027) (11,571) (12,206) (13,324) (17,558)
Gross Profit 2,018 2,129 2,818 2,961 2,966 4,359
Total income 2,042 2,144 2,857 2,984 2,976 4,372
EBIT 1,434 1,579 2,165 2,220 2,065 3,148
EBITDA 1,944 2,086 2,651 2,735 3,148 4,201
Finance Cost (249) (153) (310) (912) (572) (557)
PBT 1,185 1,425 1,855 1,307 1,493 2,591
Tax (425) (328) (531) (379) (433) (751)
PAT 760 1,097 1,324 928 1,060 1,840
EPS(PKR) 6.90 9.96 12.01 8.42 9.62 16.70
DPS(PKR) 2.77 4.00 2.67 3.37 3.85 6.68
Balance Sheet (PKR'mn) FY17A FY18A FY19A FY20E FY21E FY22E
Total Non- current Assets 4,958 5,505 8,506 10,510 9,909 9,636
Total Current Assets 3,532 3,233 4,954 7,657 8,062 10,322
Total Assets 8,491 8,737 13,461 18,167 17,970 19,958
Total Current Liabs 3,204 2,462 4,953 7,244 6,872 7,841
Total Non- current Liabs 806 1,003 2,368 3,489 2,976 2,579
Total Liabilities 4,010 3,465 7,322 10,733 9,848 10,419
Total Net Debt 2,400 1,559 5,172 7,925 6,935 6,788
Total Equity 4,480 5,273 6,139 7,434 8,123 9,538
Total Equity and Liabs 8,491 8,737 13,461 18,167 17,970 19,958
Cash Flow Statement (PKR'mn) FY17A FY18A FY19A FY20E FY21E FY22E
Cash flow from operations 2,050 2,525 832 (222) 2,277 2,103
FFCF 1,490 1,473 (2,624) (2,741) 1,795 1,323
FCFE 612 666 902 30 745 1,210
Ending Cash 221 255 167 186 125 160
Source : Company Accounts, Fortune Research
12
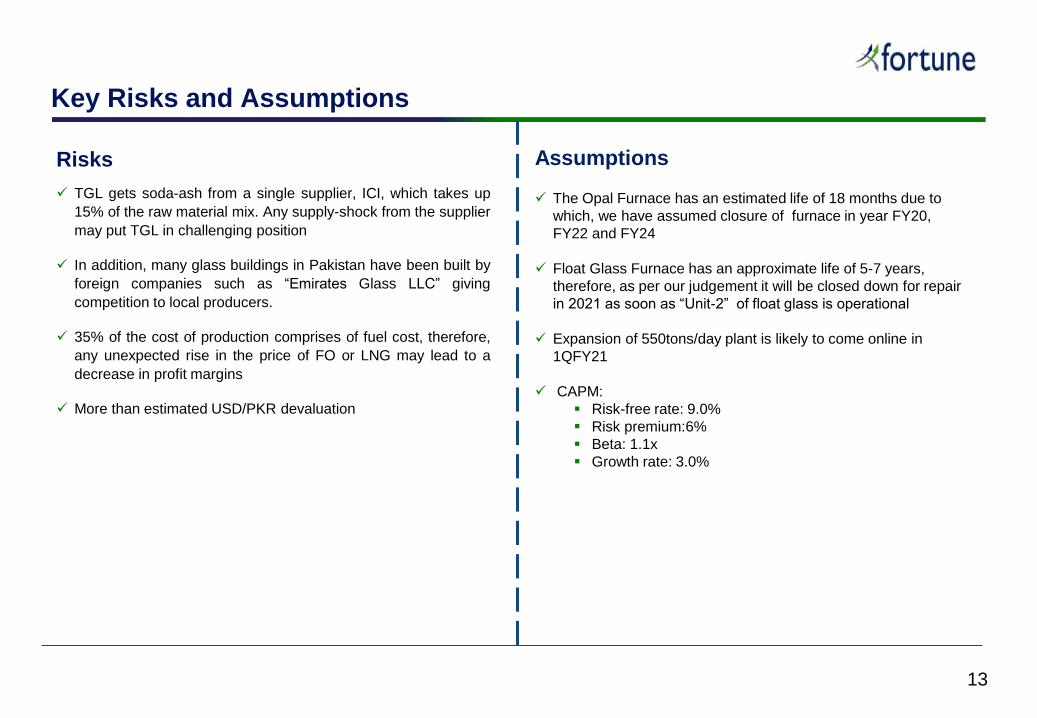
Key Risks and Assumptions
Risks
TGL gets soda-ash from a single supplier, ICI, which takes up
15% of the raw material mix. Any supply-shock from the supplier
may put TGL in challenging position
In addition, many glass buildings in Pakistan have been built by
foreign companies such as “Emirates Glass LLC” giving
competition to local producers.
35% of the cost of production comprises of fuel cost, therefore,
any unexpected rise in the price of FO or LNG may lead to a
decrease in profit margins
More than estimated USD/PKR devaluation
Assumptions
The Opal Furnace has an estimated life of 18 months due to
which, we have assumed closure of furnace in year FY20,
FY22 and FY24
Float Glass Furnace has an approximate life of 5-7 years,
therefore, as per our judgement it will be closed down for repair
in 2021 as soon as “Unit-2” of float glass is operational
Expansion of 550tons/day plant is likely to come online in
1QFY21
CAPM:
Risk-free rate: 9.0%
Risk premium:6%
Beta: 1.1x
Growth rate: 3.0%
13
14
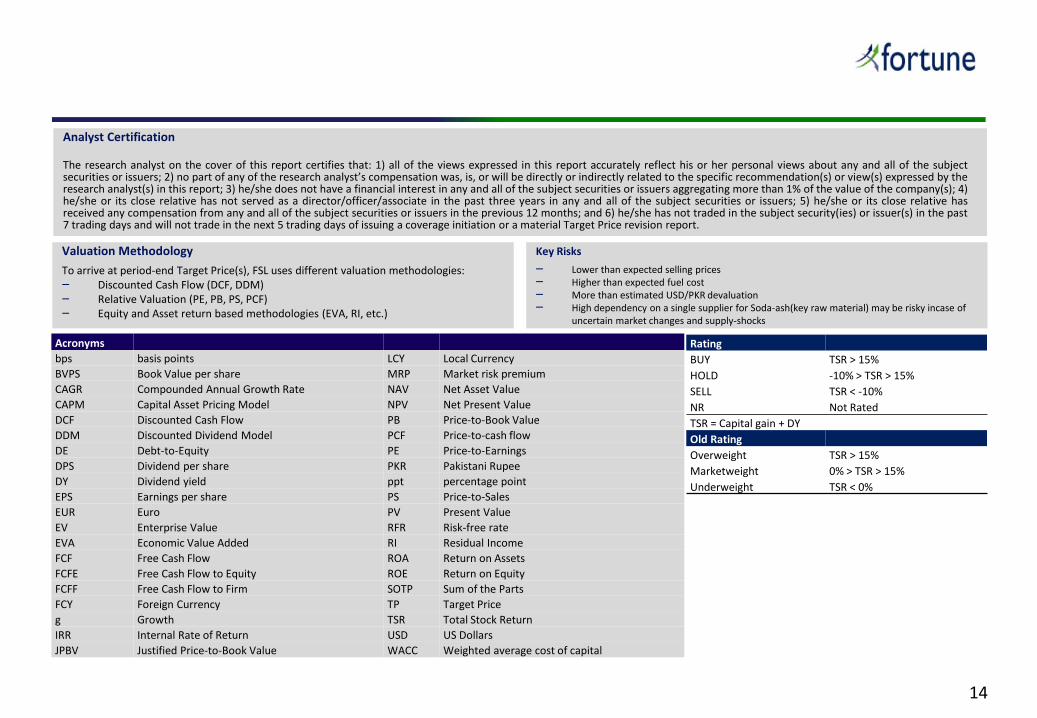
Analyst Certification
The research analyst on the cover of this report certifies that: 1) all of the views expressed in this report accurately reflect his or her personal views about any and all of the subjectsecurities or issuers; 2) no part of any of the research analyst’s compensation was, is, or will be directly or indirectly related to the specific recommendation(s) or view(s) expressed by theresearch analyst(s) in this report; 3) he/she does not have a financial interest in any and all of the subject securities or issuers aggregating more than 1% of the value of the company(s); 4)he/she or its close relative has not served as a director/officer/associate in the past three years in any and all of the subject securities or issuers; 5) he/she or its close relative hasreceived any compensation from any and all of the subject securities or issuers in the previous 12 months; and 6) he/she has not traded in the subject security(ies) or issuer(s) in the past7 trading days and will not trade in the next 5 trading days of issuing a coverage initiation or a material Target Price revision report.
Valuation Methodology
To arrive at period-end Target Price(s), FSL uses different valuation methodologies:‒ Discounted Cash Flow (DCF, DDM)‒ Relative Valuation (PE, PB, PS, PCF)‒ Equity and Asset return based methodologies (EVA, RI, etc.)
Acronyms
bps basis points LCY Local Currency
BVPS Book Value per share MRP Market risk premium
CAGR Compounded Annual Growth Rate NAV Net Asset Value
CAPM Capital Asset Pricing Model NPV Net Present Value
DCF Discounted Cash Flow PB Price-to-Book Value
DDM Discounted Dividend Model PCF Price-to-cash flow
DE Debt-to-Equity PE Price-to-Earnings
DPS Dividend per share PKR Pakistani Rupee
DY Dividend yield ppt percentage point
EPS Earnings per share PS Price-to-Sales
EUR Euro PV Present Value
EV Enterprise Value RFR Risk-free rate
EVA Economic Value Added RI Residual Income
FCF Free Cash Flow ROA Return on Assets
FCFE Free Cash Flow to Equity ROE Return on Equity
FCFF Free Cash Flow to Firm SOTP Sum of the Parts
FCY Foreign Currency TP Target Price
g Growth TSR Total Stock Return
IRR Internal Rate of Return USD US Dollars
JPBV Justified Price-to-Book Value WACC Weighted average cost of capital
Rating
BUY TSR > 15%
HOLD -10% > TSR > 15%
SELL TSR < -10%
NR Not Rated
TSR = Capital gain + DY
Old Rating
Overweight TSR > 15%
Marketweight 0% > TSR > 15%
Underweight TSR < 0%
Key Risks
‒ Lower than expected selling prices‒ Higher than expected fuel cost‒ More than estimated USD/PKR devaluation ‒ High dependency on a single supplier for Soda-ash(key raw material) may be risky incase of
uncertain market changes and supply-shocks
15
Disclosure
The investment recommendation(s) take into account both risk and expected return. FSL based the long-term Target Price estimate on fundamental analysis of thesubject security(ies)’s future prospects, after having taken perceived risks into consideration. FSL have conducted extensive research to arrive at the investmentrecommendation(s) and target price(s) for the subject security (ies). Readers should understand that financial projection(s), target price estimate(s) and statement(s)regarding future prospects may or may not be realized. Forward looking statement(s), opinion(s) and estimate(s) included in this report constitute FSL’s judgment as ofthis date and are subject to change without prior notice. The target price(s) stated in reports on company update(s), initiation(s) and corporate action adjustment(s) ofstocks listed on the PSX are on a 12-month basis. All other reports on PSX-listed securities, such as scoops, sector or company commentaries, do not include, denote, orimply any changes to target price(s).
Disclaimer
The research report prepared by Fortune Securities Limited (hereinafter referred as FSL) are based on public information and the report is for information purposesonly and does not constitute nor it is intended as an offer or solicitation for the purchase or sale of security(ies) or other financial instruments. FSL makes every effortto use reliable, comprehensive information, but it makes no representation that the information contained herein is accurate or complete. Facts and views presentedin this report have not been reviewed by and may not reflect information known to professionals in other business areas of FSL or any of its associated entities. FSL hasestablished information barriers between business groups and associations maintaining complete independence of this research report. This report is not intended toprovide personal investment advice nor does it provide individually tailored investment advice. This report does not take into account the specific investmentobjectives, financial situation/financial circumstances and the particular needs of any specific person. Investors should seek financial advice regarding theappropriateness of investing in financial instruments and implementing investment strategies discussed or recommended in this report and should understand thatstatements regarding future prospects may not be realized. FSL recommends that investors independently evaluate particular investments and strategies and itencourages investors to seek the advice of a financial advisor.
FSL has taken all reasonable care to ensure that the information contained herein is accurate, up to date, and complies with all Pakistani legislations. However, noliability can be accepted for any errors or omissions, or for any loss resulting from the use of the information provided as any data and research material providedahead of an investment decision are for information purposes only. We shall not be liable for any errors in the provision of this information, or for any actions taken inreliance thereon.
Copyright and confidentiality
No part of this document may be reproduced without the written permission of FSL. The information within this research report must not be disclosed to any otherperson if and until FSL has made the information publicly available.
Research Team
Research Team
Syed Arif ur Rehman
Director Research & Business Development
+92 213 5309113
Arvind Anand
Deputy Head of Research
+92 213 5309119
Hasnain Murtaza
Research Analyst
+92 213 5309119
Wajid Rizvi
Head of Research
+92 213 5309086
Mahnoor Shafqat
Research Analyst
+92 213 5309119
Kishan Sidi
Database Manager
+92 213 5309119
Muqeet Naeem
Research Analyst
+92 213 5309119
16