Embed Size (px)
Citation preview

DISCLOSURE APPENDIX CONTAINS ANALYST CERTIFICATIONS AND THE STATUS OF NON US ANALYSTS. FOR OTHER IMPORTANT DISCLOSURES, visit www.credit-suisse.com/researchdisclosures or call +1 (877) 291-2683 US Disclosure: Credit Suisse does and seeks to do business with companies covered in its research reports. As a result, investors should be aware that the Firm may have a conflict of interest that could affect the objectivity of this report. Investors should consider this report as only a single factor in making their investment decision.
CREDIT SUISSE SECURITIES RESEARCH & ANALYTICS BEYOND INFORMATION™
Client-Driven Solutions, Insights, and Access
23 November 2012
Europe
Equity Research
Macro
Global Equity Strategy STRATEGY
Growth: on the way to 'Nifty Fifty'
■ We believe growth as a style will continue to outperform: falling real bonds yields should have re-rated long duration assets more than has occurred – and we believe real bond yields will fall further, as QE is stepped up by the BoJ and the ECB. Excess liquidity re-rates growth stocks. Lastly, global nominal GDP growth is set to remain well below trend. The issue is valuation: the relative 12-month forward P/E of our simple growth style is at a 9% premium to its norm; quality growth is slightly more expensive (15% above its norm). Growth stocks on aggregate still only trade on a P/E of 15x, compared to peak valuations of 50x (in 1973 and 1999). Quality growth only tends to underperform if there is a sharp fall in junk bond yields (unlikely) or a sharp rise in economic indicators (we think only small rise is likely).
■ The best performing quant style for growth has been Credit Suisse HOLT®’s eCAP superior (effectively, high and stable profitability) combined with superior asset growth and asset turns. This combined style has achieved 5% outperformance pa over the past 10 years (Capita, Assa Abloy, Diageo, Intertek qualify).
■ Stocks and themes: We screen for growth stocks using three measures: quant screens (HOLT® and ours), our analysts’ picks and structural themes (CSERGROW). The following stocks qualify as growth under at least two of these methodologies, are attractively priced (on P/E relatives, free-cash flow yield or HOLT®) and are Outperform-rated: Dufry, SAB Miller, SAP, Sonova, WPP, Swatch, Capita, RyanAir, Assa Abloy, ICH, Pru, Moneysupermarket.com in Europe and Qualcomm, Google and Mead Johnson Nutrition in the US. Our favoured growth themes: software (SAP, TDC); the emerging market consumer (Swatch, SAB, Diageo, YUM); underleveraged banks in underleveraged countries (Sberbank); specific plays on the internet (GOOG and Moneysupermarket.com); global travel (ICH, STAR, Dufry); global trade (Intertek, UPS); energy efficiency (Schneider, JCI); lower car emissions (Johnson Matthey, BWA); ageing in emerging markets (Hikma); water (Halma; PLL); industrial automation (Schneider, ROK); specific oilfield services (Amec).
Figure 1: Growth outperforms as real bond yields fall
-1.2%
-0.7%
-0.2%
0.3%
0.8%
1.3%
1.8%
2.3%
2.8%
3.3%86
88
90
92
94
96
98
100
102
104
106
108
110
112
2003 2004 2005 2006 2007 2008 2009 2010 2011 2012
MSCI European growth index, relative to the market
US 10-year TIPS yield, inverted, rhs
Source: Thomson Reuters, Credit Suisse research
Research Analysts
Andrew Garthwaite
44 20 7883 6477
Marina Pronina
44 20 7883 6476
Mark Richards
44 20 7883 6484
Sebastian Raedler
44 20 7888 7554
Robert Griffiths
44 20 7883 8885
Nicolas Wylenzek
44 20 7883 6480

23 November 2012
Global Equity Strategy 2
Table of contents Why focus on growth? 3
(1) Growth as a style is a play on low real interest rates 3 (2) A sluggish recovery puts a premium on growth 4 (3) Excess liquidity 5 (4) Other performance drivers remain supportive 5 (5) Market breadth is narrowing – a feature of a growth-led market 6
Continue to focus on quality growth 7 Valuation of quality growth is high – but recall the ‘Nifty Fifty’ 9
Which growth indices have performed best? 12 How to play growth? 13
Our aggregate screen 13 1) Quant approach 15 2) Analyst judgment 18 3) Thematic approach 20
Growth themes 22 1) Branded GEM consumer plays 22 2) Industrial Automation 28 3) Global trade 34 4) Global travel 38 5) Water 41 6) Underleveraged banks in underleveraged countries 43 7) Labour-intensive oilfield services 44 8) Energy efficiency 47 9) Reducing car emissions 50 10) Specific plays on the internet – in particular, e-financial services 51 11) Ageing in emerging markets 54 12) Software 60
A sector perspective 64 Appendix 66
Appendix 1: Growth as a style 66 Appendix 2: Sector valuations in Europe and the US 67 Appendix 3: Outperform rated NJA growth stocks and quality growth 69 Appendix 4: Full list of companies that our analysts identified as growth in Europe and
the US 70

23 November 2012
Global Equity Strategy 3
Why focus on growth? (1) Growth as a style is a play on low real
interest rates
The more real bond yields fall, the more longer duration assets – and, therefore, growth
stocks – re-rate relative to shorter duration assets.
Figure 2: Growth stocks have more potential upside if the
discount rate falls
Figure 3: Growth tends to outperform as real interest
rates fall
0%
20%
40%
60%
80%
100%
120%
140%
160%
180%
5% 4% 3% 2% 1% 0%
High grow th (=5%) stock
Low grow th (=2%) stock
Bond y ield
Discount rate falls
% change in the
fair v alue of:
-1.2%
-0.7%
-0.2%
0.3%
0.8%
1.3%
1.8%
2.3%
2.8%
3.3%86
88
90
92
94
96
98
100
102
104
106
108
110
112
2003 2004 2005 2006 2007 2008 2009 2010 2011 2012
MSCI European growth index, relative to the market
US 10-year TIPS yield, inverted, rhs
Source: Credit Suisse research Source: Thomson Reuters, Credit Suisse research
We continue to believe that the main solution to the developed market debt crisis is for real
interest rates to fall even further – from the current minus 80bps to between minus 1.5% to
minus 2%. Only at this level on our calculations can developed markets both stabilise
government debt to GDP and unemployment (for details, see our report Synchronised QE
and how to play it, Sep 12).
Over the course of 2013, we believe that QE will become more aggressive:
■ The Fed is likely to expand their balance sheet by $85bn a month from mid-December
compared to just $36bn a month since QE3 started;
■ The BoJ is likely to become more aggressive under a likely LDP-led administration
following the December election (with the LDP likely to present a BoJ Act, committing
the BoJ to a 2% inflation goal);
■ The ECB is likely to expand its balance sheet once the OMT is activated.
As central banks’ balance sheets expand, real bond yields will fall. Recently, if anything,
growth as a style has performed worse than the fall in real bond yields would have
suggested (we show the performance of the US growth style in the Appendix).

23 November 2012
Global Equity Strategy 4
Figure 4: Low real interest rates improve the funding of
government debt.
Figure 5: Real interest rates stayed negative for nearly
two decades in the 1940s/50s… and financial repression
lasted until the end of Bretton Woods
-6%
-5%
-4%
-3%
-2%
-1%
0%
1%
2%
3%
4%
0% 2% 4% 6% 8%
Rea
l bon
d yi
eld
Required fiscal tightening, % of GDP
US 10Y real bond yield required to keep USgovernment debt to GDP stable (at 3% trendgrowth rate)
Government to GDP ratio stable if:
Primary balance % GDP = Debt/GDP *(bond yield - trend growth rate)
At current BY
0%
20%
40%
60%
80%
100%
120%
140%
-15%
-10%
-5%
0%
5%
10%
15%
1925 1935 1945 1955 1965 1975 1985 1995 2005
US real Bond yield
US Government debt to GDP, rhs
Source: Thomson Reuters, Credit Suisse research Source: Thomson Reuters, Credit Suisse research
(2) A sluggish recovery puts a premium on
growth
As Figure 6 shows, the recovery in US GDP has been far more muted than in previous
cycles. Three years after the recovery started, US real GDP is only 2.2% above the
previous peak. This compares to an average of 11.2% above previous peak at the same
point in previous post recession periods. In nominal terms, global GDP growth is running
just below 5%, compared to a 10 year CAGR of 7%. Such a scarcity of growth should
result in a premium on companies that can generate it.
23 November 2012
Global Equity Strategy 5
(3) Excess liquidity
Excess liquidity is rising and that has historically tended to support the valuation of growth
stocks.
Figure 6: The recovery has been considerably more
sluggish then past recoveries have been at a similar stage
Figure 7: Excess liquidity tends to support a re-rating of
growth stocks
0%
2%
4%
6%
8%
10%
12%
14%
16%
18%
20%
1957 1960 1970 1973 1980 1981 1990 2001 2007
US post-recession recovery in real GDP (relative to previous peak,three years after the trough or at cycle peak)
-10%
-5%
0%
5%
10%
15%
20%
25%
1.2
1.4
1.6
1.8
2.0
2.2
2.4
2.6
1991 1994 1997 2000 2003 2006 2009 2012
12m fwd P/E, Credit Suisse European high growth / low growth, 1-yr lag
Global excess liquidity, rhs
Source: Thomson Reuters, Credit Suisse research Source: Thomson Reuters, Credit Suisse research
(4) Other performance drivers remain supportive
Growth as a style tends to outperform the market unless economic lead indicators rise
sharply (typically ISM new orders needs to be above 57 for growth to underperform) or
high yield bond spreads narrow sharply, neither of which we expect to occur in coming
months.
Figure 8: The growth style only underperforms if
economic indicators rise sharply…
Figure 9: … or credit spreads narrow sharply
20
30
40
50
60
70
80-12%
-7%
-2%
3%
8%
13%
18%
1992 1994 1996 1998 2000 2002 2004 2006 2008 2010 2012
MSCI growth, price relative, y/y%
US ISM new orders, rhs, inverted
0
2
4
6
8
10
12
14
16
18
20
-10%
-7%
-4%
-1%
2%
5%
8%
11%
14%
1992 1994 1996 1998 2000 2002 2004 2006 2008 2010 2012
MSCI growth, price relative, y/y%
High yield bond spreads, rhs, % pts
Source: Thomson Reuters, Credit Suisse research Source: Thomson Reuters, Credit Suisse research

23 November 2012
Global Equity Strategy 6
(5) Market breadth is narrowing – a feature of a
growth-led market
A feature of the late 1990s was that the market rose against the backdrop of a weak
advance / decline line – i.e. the market was driven by a narrow set of strong performers.
There are signs of this happening again.
Figure 10: There are signs that – as in the late 1990s – the market is driven by a narrow
set of strong performers
-40
-30
-20
-10
0
10
20
30
-12%
-10%
-8%
-6%
-4%
-2%
0%
2%
4%
6%
8%
1997 1998 1999 2000 2001 2002 2003 2004 2005 2006 2007 2008 2009 2010 2011 2012
6m rolling advance/decline line, %
S&P500 deviation from 130 day average, % (rhs)
Declining market breadth
Source: Thomson Reuters, Credit Suisse research

23 November 2012
Global Equity Strategy 7
Continue to focus on quality growth We also continue with our preference for quality growth. Performance drivers are very
similar to those of the conventional growth style (yet, the magnitude of quality growth
performance is greater), with periods of sustained underperformance only tending to occur
when lead indicators rise sharply or high yield spreads narrow.
Figure 11: High quality growth tends to underperform
only if lead indicators rise sharply…
Figure 12: … or credit spreads narrow sharply
20
30
40
50
60
70
80-30%
-20%
-10%
0%
10%
20%
30%
40%
50%
60%
70%
1992 1994 1996 1998 2000 2002 2004 2006 2008 2010 2012
High quality growth / low quality growth, y/y%
US ISM new orders, rhs, inverted
0
5
10
15
20
25
-30%
-20%
-10%
0%
10%
20%
30%
40%
50%
60%
70%
1992 1994 1996 1998 2000 2002 2004 2006 2008 2010 2012
High quality growth / low quality growth, y/y%
US high yield spreads, rhs
Source: Thomson Reuters, Credit Suisse research Source: Thomson Reuters, Credit Suisse research
The reason for this is that:
■ Low quality companies tend to have abnormally high operational leverage (by
definition, they have higher fixed costs than their to peers);
■ Lower quality companies tend to have higher financial leverage ratios, owing to inferior
profitability.
We expect only a modest upside surprise to economic growth expectations in 2013 – and
see only little scope for the absolute cost of junk bond debt to fall (given the convexity
problem that the economic circumstances that allow junk bond spreads to fall – i.e. better
economic growth – are likely to lead to a significant rise in 10-year bond yields).
Lastly, the relative price momentum of high quality growth companies is at the bottom-end
of its historical range. However, earnings momentum has fallen in line with the market,
although at least it is not weaker than for the market overall.

23 November 2012
Global Equity Strategy 8
Figure 13: European high quality growth appears
oversold
Figure 14: Earnings momentum of European high quality
growth has fallen in line with the market
-20%
-15%
-10%
-5%
0%
5%
10%
15%
20%
25%
1992 1994 1996 1998 2000 2002 2004 2006 2008 2010 2012
European High Quality Growth %dev from 6mma, rel to
European market
Average (+/1 SD)
-20%
-15%
-10%
-5%
0%
5%
10%
15%
20%
25%
30%
1993 1996 1999 2002 2005 2008 2012
European High Quality Growth 3m breadth
Rel European market
Source: Thomson Reuters, Credit Suisse research Source: Thomson Reuters, Credit Suisse research
23 November 2012
Global Equity Strategy 9
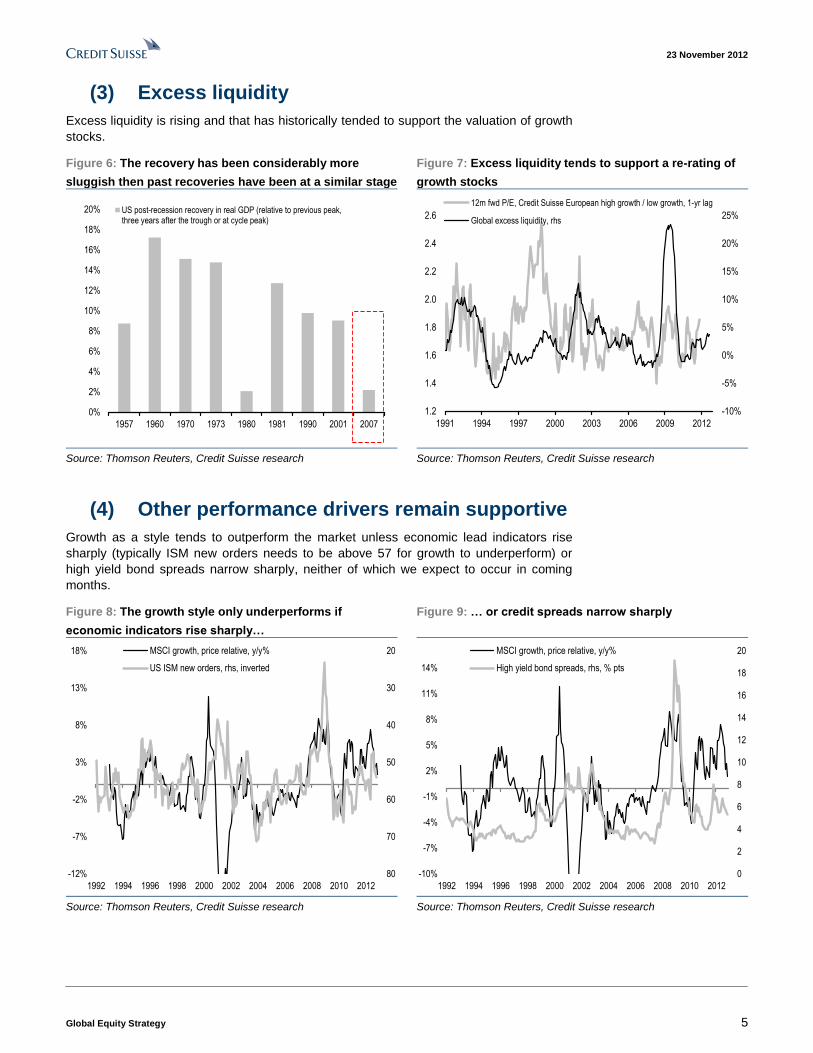
Valuation of quality growth is high – but recall the
‘Nifty Fifty’
The biggest pushback we have received from clients on our preference for growth is that
valuation levels are problematic. However, on our analysis, actual valuation may not be as
high as perceived. We look at three growth indices:
a) MSCI growth indices
According data provided by MSCI, their European growth index is trading on a trailing
reported P/E of 15.2x, compared to a European market multiple of 13.0x. This 17%
premium compares to a historical average premium of 23% (using data starting in 2006).
The MSCI growth index is constructed using the long- and short-term forward EPS growth,
trailing 12-month implied growth (which is equal to the RoE*dividend cover) and 5-year
historical EPS and sales growth.
b) Credit Suisse prospective growth
Our proprietary style of looking at the companies that have the best (top quintile)
combination of FY1, FY2 and long-term consensus growth expectations (on a sector
neutral basis) appears only slightly expensive relative to the market. At 21.2x, it is at a
95% 12-month forward P/E premium to the market compared to a post-1991 average of
79%; Figure 16).
Figure 15: MSCI growth is trading on a P/E relative below
its recent average (this uses 12 month trailing)
Figure 16: Our prospective growth style looks only
modestly expensive relative to the market
1.05
1.1
1.15
1.2
1.25
1.3
1.35
1.4
1.45
2005 2006 2007 2008 2009 2010 2011 2012
Trailing PE of Europe MSCI growth versus market
1.2
1.4
1.6
1.8
2.0
2.2
2.4
1991 1993 1995 1997 1999 2001 2003 2005 2007 2009 2011
12m fwd P/E of CS high prospective growth relative tothe market
Source: Thomson Reuters, Credit Suisse research Source: Thomson Reuters, Credit Suisse research
c) Credit Suisse quality growth
The third measure we look at is quality growth, which we define as companies that have
had a CFROI® above 8% for five consecutive years, have a limited decay in profitability,
low CFROI volatility and 5-year asset growth above 5% (we show a screen of these
companies later in the publication). All but the last of these criteria are key inputs into
HOLT®’s eCAP style which can be tracked on Bloomberg (HTERECAP in Europe and
HTUSECAP in the US).
Quality growth stocks do look quite expensive, trading on a 12-month forward P/E of 14.9x
(a premium to the market of 48%), compared with a post-1991 average of 15.5x (a 29%
premium). We show in the Appendix that dividend yield and price-to-book relatives are
similarly stretched. However, in absolute terms, the P/Es are not demanding.

23 November 2012
Global Equity Strategy 10
Figure 17: High quality growth companies appear
expensive relative to the market
Figure 18: In absolute terms, high quality growth stocks
do not appear expensive
0.6
0.8
1.0
1.2
1.4
1.6
1.8
1990 1993 1997 2001 2004 2008 2012
12m fwd P/E of European high quality growthcompanies relative to MSCI Europe
5
10
15
20
25
1990 1993 1997 2001 2004 2008 2012
Eur High Quality Growth
MSCI Europe
12m fwd P/E
Source: Thomson Reuters, Credit Suisse research Source: Thomson Reuters, Credit Suisse research
We believe that the current environment of abnormally loose monetary policy leads to the
survival of low quality companies that would normally be forced into bankruptcy. This is
because there is little pressure on excess capacity to exit, as the opportunity cost of
servicing an NPL is zero in a zero interest rate environment. An example of this is the UK
where the proportion of loss-making corporates is close to the high-end of the historical
range, but insolvencies are at the low-end (i.e. loss-making companies are not being
forced to shut down). This condition of ‘zombie capitalism’ is likely to maintain depressed
returns in the low-quality segments of the market. This means that the denominator of a
relative valuation calculation is abnormally depressed.
Figure 19: Abnormally loose monetary policy has led to the persistence of loss-making
companies and hence low quality is abnormally poor
0
5
10
15
20
25
30
35
0
5
10
15
20
25
30
35
1984 1986 1988 1990 1992 1994 1996 1998 2000 2002 2004 2006 2008 2010 2012
Loss-making companies, % of total private non-financial companies
Company liquidations, rhs, 000s
Source: Bank of England, Credit Suisse research

23 November 2012
Global Equity Strategy 11
Remember the ‘Nifty Fifty’
We remind investors of the valuation of tech in the 1998-2000 period (12m fwd P/E of US
tech got to 48x) and the ‘Nifty Fifty’ bubble in the early 1970s (where the median PE of
high-quality large-cap stocks got to 52x).
Figure 20: US tech reached a PE of 48x in 1998 – three
times the valuation of the market
Figure 21: The ‘Nifty 50’ stocks reached a multiple of 52x
in the early 1970s
0.8
1
1.2
1.4
1.6
1.8
2
2.2
2.4
1996 1998 2000 2002 2004 2006 2008 2010 2012
US tech, 12m fwd PErelative to market
Stock PE in January 1973
Walt Disney 188
Intl.Flavors & Frag. 78.2
Mcdonalds 72.5
Baxter Intl. 71.8
Avon Products 68.3
Johnson & Johnson 65.2
Xerox 51.7
Coca Cola 50.2
Eli Lilly 49.8
Merck & Co. 48.4
Schlumberger 46.4
Procter & Gamble 43.5
American Express 39.5
Median 51.7
Average 67.2
Market 18.3
Source: Thomson Reuters, Credit Suisse research Source: Thomson Reuters, Credit Suisse research
What is striking is that on the screens of growth stocks shown in the next few pages there
are lots of companies with powerful growth stories – but which are nonetheless trading
below 20x.
Below we compare the earnings yield of growth to the government bond yield: in 1973 the
earnings yield of the ‘Nifty Fifty’ stocks was just 29% of the US Treasury 10-year yield; at
the peak of the tech bubble, the tech sector had an earnings yield of about a third of the
US Treasury yield. Currently, quality growth stocks, as defined above, offer an earnings
yield that is more than four times the US Treasury yield.
Figure 22: Quality growth is cheaper relative to bonds that in previous market bubbles
Earnings yield10-yr US Treasury
yieldEY / BY ratio
Nifty Fity in 1973 1.9 6.5 29.4%
US tech in 2000 2.1 6.3 33.6%
Current quality growth 6.7 1.5 436.2% Source: Thomson Reuters, Credit Suisse research

23 November 2012
Global Equity Strategy 12
Which growth indices have performed best? We show the performance of the various growth indices discussed in this report. The best
performing growth basket over the last decade has been the stocks that meet HOLT’s
eCAP criteria and have more than 10% asset growth and asset turns in the top 40% of the
market. So far in 2012, the best performing growth style has been the HOLT eCAP basket
with an additional filter for stocks with more than 5% asset growth.
Figure 23: HOLT eCAP plus growth and asset turns is the
best performing growth style over the last decade
Figure 24: HOLT eCAP and growth has been the best
performing growth style in 2012
9.7%
7.9%
7.1% 6.8%
5.7%
4.8%
0%
2%
4%
6%
8%
10%
HOLT eCAP+ >10%
growth + top40% asset
turns
HOLT quality(eCAP)
HOLT eCAP+ >5%growth
Highprospective
growth
MSCIEuropegrowth
MSCIEurope
Annualised price performance last 10 years
20.0%
17.5%16.7% 16.7%
13.3%
11.4%
0%
5%
10%
15%
20%
HOLT eCAP+ >5%growth
HOLTquality(eCAP)
Highprospective
growth
HOLT eCAP+ >10%
growth + top40% asset
turns
MSCIEuropegrowth
MSCIEurope
Annualised performance, 2012 YTD
Source: Thomson Reuters, Credit Suisse HOLT, Credit Suisse
research
Source: Thomson Reuters, Credit Suisse HOLT, Credit Suisse
research
We believe that superior asset turns are a key ingredient underpinning quality growth. A
company with abnormally high margins is likely to attract competitors into its business area.
If a company has low margins, but high asset turns (because, for example, of the
efficiency of its supply chain), then it is harder for a competitor to move in.

23 November 2012
Global Equity Strategy 13
How to play growth? Our aggregate screen
We employ three methods to identify growth stocks:
■ The quant approach: we use two quant screens: (a) looking at conventional growth
(historical and projected sales and EPS growth) and (b) HOLT metrics of high and
stable CFROI and reasonable asset growth;
■ Analyst opinion: we have asked our analysts to highlight the stocks with the best
growth outlook over the next five years.
■ Themes: we look for stocks with exposure to what we believe are the most promising
growth themes.
Below, we show a screen of the European stocks that are highlighted by at least two of
these methodologies.
Figure 25: European stocks highlighted as growth by two or more of our methodologies (sorted by cheapness on Holt
price to best)
Name Themes QuantsAnalyst
judgementAbs
rel to
Industry
rel to mkt %
above/below
average
Abs
rel to mkt %
above/below
average
FCY DY
Price, %
change to
best
3m EPS 3m Sales Credit Suisse
rating
SAP P P P 16.5 121% -32% 5.4 -42% 3.6 1.5 58.2 -0.6 1.6 2.3 58.8 Outperform
Sonova N P P P 18.3 142% -10% 4.4 -22% 4.3 1.4 42.8 0.7 0.2 2.4 100.6 Outperform
Wpp P P P 10.5 76% -18% 1.5 -86% 8.8 3.4 7.8 -1.2 -1.8 2.0 825.0 Outperform
Lvmh P P P 16.4 105% 3% 2.9 -10% 4.1 2.3 -1.2 -1.2 1.8 2.0 129.0 Outperform
Fresenius Med.Care P P P 16.3 126% 2% 2.6 19% 4.5 1.4 -11.3 -1.9 -1.1 2.4 51.6 Outperform
Burberry Group P P P 17.5 112% 35% 6.3 45% 4.4 2.1 -13.8 -6.2 -4.4 2.5 1,233.0 Outperform
Diageo P P P 16.7 103% 47% 8.1 71% 4.2 2.5 -14.6 0.7 -1.5 2.1 1,846.0 Outperform
Intertek Group P P P 19.9 127% 60% 8.8 -51% 3.0 1.4 -20.1 2.0 1.7 2.8 2,898.0 Outperform
Pernod-Ricard P P P 15.4 95% 46% 2.0 14% 4.3 1.9 -22.5 -2.7 0.4 2.7 84.9 Outperform
Saipem P P P 14.2 133% 18% 3.3 28% 6.2 2.1 -33.6 -2.9 1.5 2.1 32.5 Outperform
Dufry 'R' P P 10.5 63% -7% 3.7 46% 9.2 0.0 67.9 -2.9 -0.8 2.0 124.3 Outperform
Petrofac P P 12.3 116% 11% 7.1 27% -0.2 2.5 56.5 -0.7 -1.7 2.3 1,590.0 Outperform
Rotork P P 19.5 169% 54% 9.0 80% 4.0 1.9 19.0 0.6 1.6 2.8 2,426.0 Outperform
Capita P P 13.2 84% -41% 8.6 -36% 4.8 3.2 17.5 0.7 1.0 2.7 722.5 Outperform
The Swatch Group
'B'
P P 14.0 89% -52% 2.8 23% 4.0 1.7 9.0 1.8 0.9 2.3 432.2 Outperform
Johnson Matthey P P 13.7 107% 28% 3.2 40% na 2.5 8.0 -5.4 -4.2 2.6 2,190.0 Outperform
Halma P P 15.1 146% 35% 4.0 21% 5.3 2.4 7.2 -1.0 -1.0 2.9 419.5 Outperform
Aker Solutions P P 10.8 102% 29% 2.7 -10% -4.3 3.0 0.0 4.1 5.8 1.9 104.7 Outperform
Atlas Copco 'A' P P 14.7 127% 61% 7.1 120% 4.2 3.3 -3.0 -0.8 -1.3 2.9 167.6 Outperform
Amec P P 11.8 111% 19% 2.6 -17% 4.1 3.1 -3.5 -2.8 5.5 2.3 1,022.0 Outperform
Moneysupermarket
Com Gp.
P P 14.3 105% 34% 4.4 98% 5.4 3.7 -5.5 3.4 0.5 2.3 153.5 Outperform
Sabmiller P P 16.7 103% 50% 1.7 -11% 5.5 2.3 -13.5 0.5 0.8 2.6 2,633.0 Outperform
Hikma
Pharmaceuticals
P P 16.7 135% 25% 2.9 14% na 1.2 -14.4 -0.4 0.2 2.2 738.0 Outperform
Eutelsat
Communications
P P 15.0 108% 6% 3.1 7% 1.9 4.2 -18.2 -1.7 -0.1 2.3 23.6 Outperform
Petroleum Geo
Services
P P 11.6 110% -72% 2.1 -55% 2.8 1.4 -21.2 26.8 3.4 1.9 97.7 Outperform
Assa Abloy 'B' P P 14.7 127% -6% 3.5 5% 4.7 2.4 -24.1 -1.5 -1.7 2.9 231.9 Outperform
Deutsche Post P P 11.5 85% 42% 1.7 -19% 8.0 4.6 -26.5 0.1 1.1 1.9 15.3 Outperform
Coloplast 'B' P P 19.8 153% 24% 11.8 89% 4.3 1.4 -27.8 0.2 0.3 3.1 1,311.0 Outperform
Ryanair Holdings P P 13.2 98% -10% 2.0 -31% 9.6 8.8 -28.9 -3.2 -0.6 2.2 4.6 Outperform
Prudential P P 11.4 118% 7% 2.4 -18% 5.9 3.1 -33.8 0.6 1.4 2.2 880.0 Outperform
Kuehne+Nagel Intl. P P 20.3 151% 70% 5.7 66% 4.3 3.3 -36.7 -1.7 0.2 2.6 113.8 Outperform
Ictl.Htls.Gp. P P 15.7 94% 44% 8.1 -51% 6.1 2.6 -40.4 -1.1 0.1 2.6 1,650.0 Outperform
Easyjet P P 10.0 74% -12% 1.6 15% 7.1 1.9 -44.2 11.5 0.1 2.3 682.0 Outperform
Chr Hansen Holding P P 21.4 166% 45% 5.1 49% na 1.9 -50.4 2.0 0.5 2.7 187.3 Outperform
Share price,
local
currency (21
Nov)
-----P/E (12m fwd) ------ 2012e Momentum, %------ P/B ------- HOLT2012e, %Screening MethodologyConsensus
recommendation
(1=Buy; 5=Sell)
Source: MSCI, IBES, Factset, Thomson Reuters, Credit Suisse HOLT, Credit Suisse research
Of these, SAP, Sonova and WPP are highlighted by all three screening criteria and look
cheap on HOLT. The following stocks are cheap on P/E relatives and feature on at least
two of our growth screens: SAP, Sonova, WPP, Petroleum Geo, Assa Abloy, Ryanair,
Dufry, Capita, Swatch and EasyJet. Additionally, we can see almost all the names have
FCF above 4%.
Credit Suisse has set up a sector-neutral Delta One basket, CSERGROW, that offers
exposure to our preferred European growth names.
We show the corresponding screen for the US. Of these, Qualcomm, Google, Mead
Johnson Nutrition are highlighted by all three screening criteria as well as being cheap on
HOLT. Credit Suisse has also set up a sector-neutral Delta One basket for these US
growth names(CSUSGROW).

23 November 2012
Global Equity Strategy 14
Figure 26: US stocks highlighted as growth by two or more of our methodologies
Name Themes QuantsAnalyst
judgementAbs
rel to
Industry
rel to mkt %
above/below
average
Abs
rel to mkt %
above/below
average
FCY DY
Price, %
change to
best
3m EPS 3m Sales Credit Suisse
rating
Google 'A' P P P 15.0 110% -26% 3.8 -29% 5.9 0.0 35.1 -7.9 -3.1 1.9 665.9 Outperform
Mead Johnson
Nutrition
P P P 19.0 119% 18% -73.9 na 2.9 1.8 9.9 -2.8 -4.3 2.2 66.1 Outperform
Yum! Brands P P P 19.7 117% 62% 18.2 -22% 4.0 1.7 -31.5 -0.1 -0.7 2.0 73.5 Outperform
Salesforce.Com P P P 76.9 563% 16% 12.7 23% 2.6 0.0 -66.9 1.1 0.3 2.1 158.8 Outperform
Broadcom 'A' P P 11.1 79% -69% 2.6 -54% 7.0 1.3 110.3 -2.1 -1.6 1.8 31.2 Outperform
Qualcomm P P 14.3 138% -39% 3.7 -18% 5.5 1.6 93.1 -0.3 -0.4 1.9 62.1 Outperform
Emc P P 13.1 126% -47% 2.7 -40% 8.8 0.0 85.1 -2.4 -1.8 1.7 24.4 Outperform
Apple P P 11.2 107% -58% 7.0 116% 8.1 1.7 82.1 -10.7 -2.7 1.7 561.7 Outperform
Unitedhealth Gp. P P 10.2 79% -15% 2.1 -26% 11.2 1.4 61.7 5.3 -0.2 1.8 53.5 Outperform
Mastercard P P 18.6 137% 26% 10.2 44% 4.3 0.2 57.9 -0.5 -2.5 1.9 479.4 Outperform
Eli Lilly P P 13.1 105% -14% 4.2 -44% 7.8 4.0 54.8 2.2 -0.9 2.7 47.4 Outperform
Ihs 'A' P P 19.0 121% 8% 4.2 27% 5.0 0.0 54.7 -3.8 -3.2 2.2 89.2 Outperform
Teradata P P 20.1 147% 38% 7.1 40% 4.6 0.0 37.2 3.6 -1.7 2.1 61.2 Outperform
Priceline.Com P P 17.4 104% -34% 12.3 23% 4.7 0.0 34.1 -3.1 -4.3 2.1 639.6 Outperform
Allergan P P 19.5 157% 7% 5.3 -10% -4.8 0.2 31.1 0.3 -0.9 1.9 90.9 Outperform
Biogen Idec P P 19.2 116% -45% 5.2 10% 4.3 0.0 14.1 5.9 1.7 2.2 147.4 Outperform
Nielsen Holdings Nv P P 14.4 92% 17% 2.3 13% 5.8 0.0 3.5 2.9 -1.1 2.1 28.1 Outperform
Ralph Lauren Cl.A P P 18.6 119% 56% 4.1 63% 5.0 0.8 -2.5 -0.7 -1.4 2.4 156.5 Outperform
Rockwell
Automation
P P 13.6 117% 41% 6.1 73% 5.3 2.4 -3.8 -3.2 -2.7 2.2 77.4 Outperform
Dollar Tree P P 14.3 86% -5% 6.8 39% 4.3 0.0 -14.8 0.1 -0.9 2.3 41.5 Outperform
Amazon.Com P P 142.3 850% 163% 13.6 -58% 1.5 0.0 -18.1 -97.1 -1.9 2.0 238.0 Outperform
Vmware P P 27.7 203% -14% 7.9 -2% 4.8 0.0 -23.2 4.6 0.2 2.3 88.1 Outperform
Family Dollar Stores P P 15.1 90% 13% 5.9 70% 1.5 1.3 -35.8 2.5 2.5 2.4 68.8 Outperform
Las Vegas Sands P P 17.5 104% -44% 4.3 -35% 5.6 2.3 -38.7 -14.4 -5.4 2.1 43.7 Outperform
Starbucks P P 22.9 136% -9% 8.6 57% 2.7 1.2 -39.1 -5.3 -1.1 2.0 50.5 Outperform
Starwood Htls.&
Rsts. Worldwide
P P 19.8 118% 14% 3.4 41% 4.6 2.0 -45.4 4.9 0.1 2.2 52.6 Outperform
Heartware
International
P P -32.1 nm na 9.4 54% na 0.0 -63.5 nm 3.1 2.1 81.6 Outperform
Volcano P P 62.6 484% -11% 4.5 30% 0.8 0.0 -65.8 -16.7 -1.8 1.9 26.9 Outperform
Netsuite P P 208.0 1523% 171% 33.8 154% 0.9 0.0 -91.1 13.8 2.2 2.8 60.1 Outperform
Screening MethodologyConsensus
recommendation
(1=Buy; 5=Sell)
Share price,
local
currency (21
Nov)
-----P/E (12m fwd) ------ 2012e Momentum, %------ P/B ------- HOLT2012e, %
Source: MSCI, IBES, Factset, Thomson Reuters, Credit Suisse HOLT, Credit Suisse research

23 November 2012
Global Equity Strategy 15
We discuss our three screening methodologies in more detail below:
1) Quant approach
a) Conventional growth. We screen for stocks with the following characteristics:
■ Above market median sales and EPS growth between 2007 and 2012;
■ Above market median projected sales and EPS growth between 2012 and 2014 on
Credit Suisse and consensus estimates;
■ Above average projected long-term consensus EPS growth;
■ Outperform-rated by Credit Suisse analysts.
In Europe, this highlights the following stocks in the screen below.
Figure 27: Outperform rated European growth stocks ranked by upside potential on HOLT
Stoxx 600 median 1% 10% 5% 4% 2% 10% 5% 5% 8.6
Company
2007-12 2012-14 2007-12 2012-14 2007-12 2012-14 2007-12 2012-14
Sap (Xet) 14% 15% 10% 11% 14% 15% 10% 11% 11.1 58 16.0 143% -14% 57.7 Outperform
Petrofac 23% 16% 22% 8% 29% 14% 22% 8% 14.4 56 11.5 103% -24% 1,574.0 Outperform
Sonova N 2% 19% 9% 9% 6% 13% 11% 8% 14.9 43 18.5 166% -5% 100.6 Outperform
Fresenius (Xet) 16% 14% 11% 9% 15% 11% 11% 8% 13.5 1 14.4 130% 3% 84.4 Outperform
Lvmh 9% 11% 11% 9% 11% 11% 11% 8% 10.9 -1 15.9 143% -2% 129.0 Outperform
Amec 24% 11% 12% 5% 24% 15% 11% 8% 15.7 -4 11.2 100% -15% 1,024.0 Outperform
Air Liquide 6% 10% 5% 10% 7% 10% 5% 7% 7.9 -7 16.2 146% 6% 93.4 Outperform
Experian 7% 12% 6% 7% 7% 14% 7% 9% 11.8 -7 17.5 157% 18% 1,025.0 Outperform
Fresenius Med.Care (Xet) 10% 14% 7% 8% 9% 11% 7% 8% 8.8 -11 16.5 148% 4% 51.5 Outperform
Burberry Group 16% 11% 17% 11% 21% 14% 18% 10% 10.3 -14 16.3 147% 4% 1,247.0 Outperform
Hikma Pharmaceuticals 42% 21% 20% 13% 9% 22% 20% 11% 20.3 -14 16.4 147% -5% 739.0 Outperform
Diageo 11% 13% 8% 6% 13% 12% 9% 7% 10.4 -15 16.7 150% 22% 1,848.5 Outperform
Adidas (Xet) 7% 13% 8% 7% 7% 18% 8% 7% 13.5 -18 14.1 127% 13% 64.8 Outperform
Intertek Group 22% 17% 22% 8% 21% 13% 22% 8% 14.6 -20 19.6 176% 30% 2,876.0 Outperform
Coloplast 'B' 22% 19% 7% 7% 34% 11% 6% 6% 14.1 -28 20.3 183% 13% 1,303.0 Outperform
Ryanair Holdings 6% 11% 14% 9% 6% 12% 16% 6% 9.8 -29 12.1 109% -19% 4.7 Outperform
Saipem 13% 13% 8% 6% 12% 13% 7% 6% 13.3 -34 12.9 116% -10% 32.7 Outperform
Easyjet 11% 10% 17% 5% 9% 11% 17% 6% 17.1 -44 10.0 90% -29% 692.0 Outperform
Sales CAGRRel
Share price,
local
currency
(20 Nov)
CS ratingHOLT price
to best (%)
Analyst estimates
EPS CAGR Sales CAGR
IBES estimates
EPS CAGRRel mkt,
devn from
average
Long-term
EPS growth
12m fwd PE
Abs
Source: MSCI, IBES, Thomson Reuters, Credit Suisse HOLT, Credit Suisse research
We show the same screen for the US.
Figure 28: Outperform rated US growth stocks ranked by upside potential on HOLT
S&P 500 median 5% 11% 5% 5% 6% 12% 5% 5% 10.3
Company
2007-12 2012-14 2007-12 2012-14 2007-12 2012-14 2007-12 2012-14
Microsoft 14% 14% 8% 12% 14% 12% 9% 8% 10.0 83 8.9 71% -35% 26.71 Outperform
Apple 62% 25% 45% 27% 66% 16% 52% 15% 20.5 82 10.2 82% -58% 561.15 Outperform
Prec.Castparts 14% 18% 6% 16% 17% 15% 9% 11% 14.2 62 15.8 127% 19% 176.76 Outperform
Mastercard 24% 17% 13% 12% 31% 17% 13% 12% 18.5 58 18.1 146% 1% 477.57 Outperform
Google 'A' 21% 18% 26% 19% 21% 18% 29% 19% 13.5 35 14.4 115% -38% 669.97 Outperform
Priceline.Com 50% 16% 30% 18% 50% 20% 30% 18% 19.9 34 17.1 137% -6% 635.58 Outperform
Allergan 14% 14% 8% 8% 14% 13% 8% 8% 12.5 31 19.1 153% -4% 91.15 Outperform
V F 12% 13% 9% 6% 12% 14% 9% 9% 13.0 19 14.1 113% 27% 157.57 Outperform
Cognizant Tech.Sltn.'A' 24% 18% 28% 17% 24% 15% 28% 15% 19.0 9 16.5 132% -32% 65.34 Outperform
Union Pacific 19% 13% 5% 7% 19% 14% 5% 7% 15.2 4 12.9 104% 2% 120.03 Outperform
Ralph Lauren Cl.A 12% 14% 10% 6% 16% 15% 11% 10% 14.0 -3 17.6 141% 21% 156.51 Outperform
O Reilly Automotive 23% 13% 20% 6% 23% 15% 20% 6% 16.6 -11 16.7 134% 10% 91.37 Outperform
Ww Grainger 16% 13% 7% 7% 16% 14% 7% 9% 15.2 -13 15.9 127% 9% 191.54 Outperform
Dollar Tree 27% 19% 11% 9% 32% 15% 13% 9% 19.0 -15 14.4 115% 5% 41.61 Outperform
Quanta Services 12% 20% 19% 9% 12% 18% 19% 9% 17.8 -16 15.8 127% -29% 25.14 Outperform
Yum! Brands 14% 15% 6% 8% 14% 14% 6% 10% 13.4 -31 19.7 158% 32% 72.39 Outperform
Family Dollar Stores 16% 17% 6% 11% 21% 16% 9% 9% 15.0 -36 15.0 121% 6% 68.89 Outperform
Starbucks 16% 26% 7% 13% 20% 21% 10% 12% 18.0 -39 21.7 174% -11% 50.05 Outperform
Salesforce.Com 38% 24% 35% 31% 46% 30% 44% 24% 27.0 -67 73.8 592% -23% 145.90 Outperform
CS ratingHOLT price
to best (%)
Analyst estimates
EPS CAGR Sales CAGR
IBES estimates
EPS CAGRRel mkt,
devn from
average
Long-term
EPS growth
12m fwd PE
Sales CAGRRel
Share price,
local
currency
(20 Nov)Abs
Source: MSCI, IBES, Thomson Reuters, Credit Suisse HOLT, Credit Suisse research

23 November 2012
Global Equity Strategy 16
We show the screen for non-Japan Asian stocks in the Appendix.
b) Quality growth. We incorporate HOLT’s eCAP metrics to screen for companies with:
■ CFROI above 8% for five consecutive years;
■ CFROI trend (no more than a 10% decline in CFROI in any one of the last five years);
■ 5-year asset growth above 5%;
■ Low CFROI volatility.
We highlight those stocks that also have asset turns in the top 40% of the market, since
higher asset turns has led to outperformance among our growth styles over the last
decade.
Figure 29: Outperform rated European quality growth stocks ranked by upside potential on HOLT; circled stocks have
asset turns in the top 40% of the market
NameCFROI Median - Five
Year
5-yr asset
growthAbs rel to Industry
rel to mkt %
above/below
average
Abs
rel to mkt %
above/below
average
FCY DY
Price, %
change to
best
3m EPS 3m Sales Credit Suisse
rating
Shire 17.3 14.9 13.0 105% -37% 4.9 26% 13.4 0.6 98.0 3.6 -0.5 1.9 1,759.0 Outperform
Imperial Tobacco Gp. 66.2 18.3 11.0 80% 26% 3.1 -90% 8.3 4.4 66.9 -1.4 -0.1 2.2 2,428.0 Outperform
Sap 19.7 7.5 16.5 121% -32% 5.4 -42% 3.6 1.5 58.2 -0.6 1.6 2.3 57.7 Outperform
Petrofac 29.3 19.3 12.3 116% 11% 7.1 27% -0.2 2.5 56.5 -0.7 -1.7 2.3 1,574.0 Outperform
Vivendi 14.8 8.0 8.0 66% -33% 1.1 -37% 11.2 6.3 56.2 -1.9 0.2 2.2 16.1 Outperform
Novartis 'R' 12.3 7.5 11.6 93% -11% 2.2 -26% 7.7 4.0 56.0 -3.1 -1.5 2.3 55.5 Outperform
Sonova N 23.7 7.7 18.3 142% -10% 4.4 -22% 4.3 1.4 42.8 0.7 0.2 2.4 100.6 Outperform
Smiths Group 18.0 7.7 10.9 94% 32% 4.3 -13% 3.6 3.6 25.1 -2.6 0.6 2.7 1,050.0 Outperform
Capita 42.0 5.9 13.2 84% -41% 8.6 -36% 4.8 3.2 17.5 0.7 1.0 2.7 719.0 Outperform
Wpp 25.6 5.7 10.5 76% -18% 1.5 -86% 8.8 3.4 7.8 -1.2 -1.8 2.0 814.0 Outperform
Fresenius 14.1 8.7 14.6 113% 9% 2.3 -22% 8.1 1.2 1.1 0.7 1.3 2.2 84.4 Outperform
Lvmh 12.6 9.1 16.4 105% 3% 2.9 -10% 4.1 2.3 -1.2 -1.2 1.8 2.0 129.0 Outperform
Atlas Copco 'A' 21.1 7.7 14.7 127% 61% 7.1 120% 4.2 3.3 -3.0 -0.8 -1.3 2.9 168.1 Outperform
Fresenius Med.Care 13.9 7.5 16.3 126% 2% 2.6 19% 4.5 1.4 -11.3 -1.9 -1.1 2.4 51.5 Outperform
Burberry Group 15.2 19.8 17.5 112% 35% 6.3 45% 4.4 2.1 -13.8 -6.2 -4.4 2.5 1,247.0 Outperform
Diageo 24.8 6.8 16.7 103% 47% 8.1 71% 4.2 2.5 -14.6 0.7 -1.5 2.1 1,848.5 Outperform
Eutelsat
Communications
10.8 7.9 15.0 108% 6% 3.1 7% 1.9 4.2 -18.2 -1.7 -0.1 2.3 23.1 Outperform
Intertek Group 20.4 20.0 19.9 127% 60% 8.8 -51% 3.0 1.4 -20.1 2.0 1.7 2.8 2,876.0 Outperform
Pearson 13.0 6.5 13.8 100% -7% 1.7 -58% 7.2 3.6 -21.5 -1.2 -0.1 2.8 1,196.0 Outperform
Pernod-Ricard 16.8 6.1 15.4 95% 46% 2.0 14% 4.3 1.9 -22.5 -2.7 0.4 2.7 85.0 Outperform
Assa Abloy 'B' 18.8 5.0 14.7 127% -6% 3.5 5% 4.7 2.4 -24.1 -1.5 -1.7 2.9 232.0 Outperform
Coloplast 'B' 12.0 6.1 19.8 153% 24% 11.8 89% 4.3 1.4 -27.8 0.2 0.3 3.1 1,303.0 Outperform
Consensus
recommendation
(1=Buy; 5=Sell)
Share price,
local currency
(20 Nov)
-----P/E (12m fwd) ------ 2012e Momentum, %------ P/B ------- HOLT2012e, %
Source: MSCI, IBES, Factset, Thomson Reuters, Credit Suisse HOLT, Credit Suisse research

23 November 2012
Global Equity Strategy 17
Figure 30: Outperform rated US quality growth stocks with upside on HOLT, ranked by upside potential on HOLT;
circled stocks have asset turns in the top 40% of the market
NameCFROI Median - Five
Year 5-yr asset growth Abs rel to Industry
rel to mkt %
above/below
average
Abs
rel to mkt %
above/below
average
FCY DY
Price, %
change to
best
3m EPS 3m Sales Credit Suisse
rating
Broadcom 'A' 14.5 12.7 11.1 79% -69% 2.6 -54% 7.0 1.3 110.3 -2.1 -1.6 1.8 31.1 Outperform
Transdigm Group 41.5 23.3 17.4 151% 46% 8.5 126% 4.9 1.6 109.8 1.0 -0.2 2.3 131.1 Outperform
Freeport-Mcmor.Cpr.& Gd. 18.5 31.5 8.6 75% -28% 2.4 -90% 3.9 3.1 104.0 -7.3 -4.2 1.8 38.3 Outperform
F5 Networks 19.7 12.5 16.1 155% -51% 5.9 9% 6.5 0.0 96.8 -1.5 -0.6 2.2 87.5 Outperform
Qualcomm Inc 19.4 13.0 14.3 138% -39% 3.7 -18% 5.5 1.6 93.1 -0.3 -0.4 1.9 62.1 Outperform
Oracle Corp 25.4 20.6 11.3 83% -40% 3.5 -56% 8.5 0.8 86.7 -0.1 -1.7 2.1 30.2 Outperform
Emc 14.8 6.8 13.1 126% -47% 2.7 -40% 8.8 0.0 85.1 -2.4 -1.8 1.7 24.2 Outperform
Microsoft 27.6 12.1 9.7 71% -50% 3.7 -43% 11.3 2.9 83.1 -6.3 -1.2 1.9 26.7 Outperform
Deere 12.8 6.4 10.4 90% -6% 5.1 78% 4.7 2.0 68.6 -5.2 -2.3 2.4 86.0 Outperform
Check Point Sftw.Techs. 23.6 8.9 13.2 97% -33% 3.0 -58% 8.2 0.0 62.7 -0.6 -1.1 2.0 45.2 Outperform
Precision Castparts Corp 23.7 8.5 15.8 136% 45% 3.0 42% 4.5 0.1 61.8 -2.3 -1.6 1.9 176.8 Outperform
Unitedhealth Gp. 30.5 5.9 10.2 79% -15% 2.1 -26% 11.2 1.4 61.7 5.3 -0.2 1.8 53.1 Outperform
Mastercard 34.9 9.3 18.6 137% 26% 10.2 44% 4.3 0.2 57.9 -0.5 -2.5 1.9 477.6 Outperform
Eli Lilly 11.5 5.7 13.1 105% -14% 4.2 -44% 7.8 4.0 54.8 2.2 -0.9 2.7 47.2 Outperform
Ihs 'A' 48.8 10.3 19.0 121% 8% 4.2 27% 5.0 0.0 54.7 -3.8 -3.2 2.2 89.1 Outperform
General Dynamics 19.2 6.3 9.4 81% -12% 1.9 -25% 11.4 2.9 48.7 -1.6 -0.9 2.3 63.8 Outperform
Stryker Corp 13.6 9.3 12.3 95% -34% 2.6 -49% 6.3 1.6 40.2 -1.0 -0.7 2.2 53.6 Outperform
Thermo Fisher Scientific
Inc
25.7 7.3 11.5 79% -12% 1.5 -4% 6.6 0.8 38.9 1.3 0.3 1.7 61.8 Outperform
Stanley Black & Decker Inc 16.0 17.5 11.8 102% 12% 1.7 -37% 8.2 2.6 33.3 -6.6 -1.2 2.1 70.1 Outperform
Allergan 15.2 11.6 19.5 157% 7% 5.3 -10% -4.8 0.2 31.1 0.3 -0.9 1.9 91.2 Outperform
Bed Bath & Beyond 10.1 8.1 11.5 69% -38% 3.4 -33% 7.3 0.0 25.6 -1.0 0.3 2.1 58.5 Outperform
Parker-Hannifin Corp 14.3 5.1 11.8 102% 12% 2.4 23% 7.3 2.1 23.8 -20.8 -6.4 2.4 79.7 Outperform
Activision Blizzard 16.5 24.8 10.5 77% -39% 1.2 -86% 6.9 1.6 22.0 3.3 2.0 1.7 11.2 Outperform
Cvs Caremark 12.3 9.8 12.4 95% -7% 1.6 -36% 8.6 1.4 18.8 1.4 0.0 1.8 45.6 Outperform
V F 16.8 7.0 14.5 93% 53% 3.9 87% 4.4 1.9 18.8 1.1 -0.9 1.9 157.6 Outperform
Biogen Idec 16.9 8.7 19.2 116% -45% 5.2 10% 4.3 0.0 14.1 5.9 1.7 2.2 148.2 Outperform
Life Technologies 20.5 21.5 11.4 78% -36% 1.9 6% 8.4 0.0 13.9 -1.0 -1.1 2.2 48.9 Outperform
Merck & Co. 11.5 13.3 12.4 100% -1% 2.6 -55% 8.1 3.7 12.2 -0.4 -0.3 2.2 43.6 Outperform
Mead Johnson Nutrition 31.9 10.8 19.0 119% 18% -73.9 na 2.9 1.8 9.9 -2.8 -4.3 2.2 66.1 Outperform
Flowserve 14.9 7.9 13.4 116% 31% 3.3 42% 4.6 1.0 6.9 -1.4 -0.5 1.8 139.3 Outperform
Nielsen Holdings Nv 38.3 7.1 14.4 92% 17% 2.3 13% 5.8 0.0 3.5 2.9 -1.1 2.1 27.6 Outperform
Consensus
recommendation
(1=Buy; 5=Sell)
Share price,
local currency
(20 Nov)
-----P/E (12m fwd) ------ 2012e Momentum, %------ P/B ------- HOLT2012e, %
Source: MSCI, IBES, Factset, Thomson Reuters, Credit Suisse HOLT, Credit Suisse research
We show the screen for Non-Japan Asian stocks in the Appendix.

23 November 2012
Global Equity Strategy 18
2) Analyst judgment
We have asked our analysts in Europe, the US and Japan to identify stocks with above-
market projected sales growth over the next five years (our threshold is 6% annual
growth), growth superior to the sector and translating into EPS growth of at least 8% p.a.
The details are in the Appendix, which shows two screens for each region (one with the
analysts’ top picks and the other highlighting those companies that trade on a P/E below
the market or have upside potential on HOLT).
European stocks
Of the stocks highlighted by our European analysts, the following are either cheap on
HOLT or on P/E relative to the market and have an outperform- or neutral-rating by Credit
Suisse analysts.
Figure 31: European growth stocks, as identified by our analysts, that look cheap on HOLT or on P/E relative
and rated Outperform or Neutral by our analysts
Name Abs rel to Industry
rel to mkt %
above/below
average
Abs
rel to mkt %
above/below
average
FCY DY
Price, %
change to
best
3m EPS 3m Sales Credit Suisse rating
Aberdeen Asset Man. 13.2 130% 13% 3.7 63% 8.0 3.2 90.1 2.7 1.2 2.1 333.6 Outperform
Sberbank Of Russia 5.7 59% -23% 1.6 20% na 3.1 69.3 10.0 5.7 1.7 87.9 Outperform
SAP 16.5 121% -32% 5.4 -42% 3.6 1.5 58.2 -0.6 1.6 2.3 58.8 Outperform
Spectris 12.3 118% 21% 3.5 -68% 6.9 2.1 56.8 -2.3 -1.7 2.2 1,819.0 Outperform
Perform Group 24.7 179% 26% 0.2 58% na 0.0 48.4 0.5 1.6 1.8 397.0 Outperform
Sonova N 18.3 142% -10% 4.4 -22% 4.3 1.4 42.8 0.7 0.2 2.4 100.6 Outperform
Richemont 14.9 96% 133% 3.5 69% 3.0 1.1 25.4 5.2 2.9 2.4 68.6 Neutral
Rotork 19.5 169% 54% 9.0 80% 4.0 1.9 19.0 0.6 1.6 2.8 2,426.0 Outperform
Capita 13.2 84% -41% 8.6 -36% 4.8 3.2 17.5 0.7 1.0 2.7 722.5 Outperform
The Swatch Group 'B' 14.0 89% -52% 2.8 23% 4.0 1.7 9.0 1.8 0.9 2.3 432.2 Outperform
Paddy Power 20.8 124% 62% 12.0 99% 5.5 2.0 8.3 -0.2 3.3 2.9 57.3 Outperform
Johnson Matthey 13.7 107% 28% 3.2 40% na 2.5 8.0 -5.4 -4.2 2.6 2,190.0 Outperform
Wpp 10.5 76% -18% 1.5 -86% 8.8 3.4 7.8 -1.2 -1.8 2.0 825.0 Outperform
Halma 15.1 146% 35% 4.0 21% 5.3 2.4 7.2 -1.0 -1.0 2.9 419.5 Outperform
Compass Group 14.9 89% 28% 3.8 43% 4.8 3.1 3.5 -1.4 -0.3 2.5 699.5 Outperform
William Demant Hldg. 18.5 143% -5% 8.7 -64% 4.2 0.0 3.2 -6.5 -0.4 3.3 463.6 Neutral
Subsea 7 12.6 119% -25% 1.3 -46% 4.2 1.9 -4.4 10.5 -0.9 2.0 128.7 Neutral
Petroleum Geo Services 11.6 110% -72% 2.1 -55% 2.8 1.4 -21.2 26.8 3.4 1.9 97.7 Outperform
Vienna Insurance Group
A9.5 98% -23% 1.0 -54% 6.3 3.6 -21.2 -3.5 2.3 2.3 34.2 Neutral
Assa Abloy 'B' 14.7 127% -6% 3.5 5% 4.7 2.4 -24.1 -1.5 -1.7 2.9 231.9 Outperform
Ryanair Holdings 13.2 98% -10% 2.0 -31% 9.6 8.8 -28.9 -3.2 -0.6 2.2 4.6 Outperform
Easyjet 10.0 74% -12% 1.6 15% 7.1 1.9 -44.2 11.5 0.1 2.3 682.0 Outperform
Consensus
recommendation
(1=Buy; 5=Sell)
Share price,
local currency
(21 Nov)
-----P/E (12m fwd) ------ 2012e Momentum, %------ P/B ------- HOLT2012e, %
Source: MSCI, IBES, Thomson Reuters, Credit Suisse HOLT, Credit Suisse research
US stocks
Of the stocks highlighted by our US analysts, the following are either cheap on HOLT or
on P/E relative to the market and have an Outperform or Neutral rating by Credit Suisse
analysts.

23 November 2012
Global Equity Strategy 19
Figure 32: US growth stocks, as identified by our analysts, that are cheap on HOLT or on P/E relative
and rated Outperform or Neutral by our analysts
Name Abs rel to Industry
rel to mkt %
above/below
average
Abs
rel to mkt %
above/below
average
FCY DY
Price, %
change to
best
3m EPS 3m Sales Credit Suisse
rating
Celgene 13.3 80% -72% 5.8 -60% 5.4 0.0 220.1 2.0 1.2 1.8 77.9 Neutral
Broadcom 'A' 11.1 79% -69% 2.6 -54% 7.0 1.3 110.3 -2.1 -1.6 1.8 31.2 Outperform
F5 Networks 16.1 155% -51% 5.9 9% 6.5 0.0 96.8 -1.5 -0.6 2.2 90.1 Outperform
Qualcomm 14.3 138% -39% 3.7 -18% 5.5 1.6 93.1 -0.3 -0.4 1.9 62.1 Outperform
Oracle 11.3 83% -40% 3.5 -56% 8.5 0.8 86.7 -0.1 -1.7 2.1 30.4 Outperform
Emc 13.1 126% -47% 2.7 -40% 8.8 0.0 85.1 -2.4 -1.8 1.7 24.4 Outperform
Apple 11.2 107% -58% 7.0 116% 8.1 1.7 82.1 -10.7 -2.7 1.7 561.7 Outperform
Gilead Sciences 15.5 93% -64% 7.5 6% 5.5 0.0 82.0 1.9 3.2 1.7 75.6 Neutral
Mellanox 19.2 185% 23% 7.2 162% 4.9 0.0 71.3 12.2 0.9 2.2 84.4 Neutral
Check Point Sftw.Techs. 13.2 97% -33% 3.0 -58% 8.2 0.0 62.7 -0.6 -1.1 2.0 45.5 Outperform
Mastercard 18.6 137% 26% 10.2 44% 4.3 0.2 57.9 -0.5 -2.5 1.9 479.4 Outperform
Danaher 15.0 130% 0% 2.1 -23% 7.8 0.2 56.6 -3.6 -2.2 1.8 53.0 Neutral
Ihs 'A' 19.0 121% 8% 4.2 27% 5.0 0.0 54.7 -3.8 -3.2 2.2 89.2 Outperform
Salix Pharms. 12.6 102% -71% 4.2 4% 4.7 0.0 37.9 10.7 -0.6 2.1 41.4 Outperform
Teradata 20.1 147% 38% 7.1 40% 4.6 0.0 37.2 3.6 -1.7 2.1 61.2 Outperform
Google 'A' 15.0 110% -26% 3.8 -29% 5.9 0.0 35.1 -7.9 -3.1 1.9 665.9 Outperform
Priceline.Com 17.4 104% -34% 12.3 23% 4.7 0.0 34.1 -3.1 -4.3 2.1 639.6 Outperform
Allergan 19.5 157% 7% 5.3 -10% -4.8 0.2 31.1 0.3 -0.9 1.9 90.9 Outperform
Biogen Idec 19.2 116% -45% 5.2 10% 4.3 0.0 14.1 5.9 1.7 2.2 147.4 Outperform
Mercadolibre 28.1 206% -17% 15.9 16% 3.0 0.5 11.2 4.4 -1.3 2.5 75.4 Neutral
Jazz Pharmaceuticals 9.9 80% -74% 11.9 -47% na 0.0 10.6 3.0 1.9 1.4 52.0 Outperform
Mead Johnson Nutrition 19.0 119% 18% -73.9 na 2.9 1.8 9.9 -2.8 -4.3 2.2 66.1 Outperform
Eog Res. 21.1 199% 27% 2.5 2% -4.4 0.6 6.4 12.4 2.0 1.9 118.1 Neutral
Watson Pharms. 10.8 87% -22% 3.1 28% 7.7 0.0 4.3 1.3 2.4 1.8 85.3 Outperform
Nielsen Holdings Nv 14.4 92% 17% 2.3 13% 5.8 0.0 3.5 2.9 -1.1 2.1 28.1 Outperform
Visa 'A' 19.4 142% 32% 4.4 75% 4.4 0.7 1.5 3.3 1.0 1.9 146.7 Outperform
Hexcel 14.2 123% -40% 3.1 -75% -1.7 0.0 -4.0 2.8 -1.7 2.1 25.1 Outperform
Carmax 17.8 106% -31% 3.0 43% 1.9 0.0 -14.1 -2.5 0.4 1.9 34.6 Outperform
Dollar Tree 14.3 86% -5% 6.8 39% 4.3 0.0 -14.8 0.1 -0.9 2.3 41.5 Outperform
Noble Energy 15.5 146% -13% 2.3 11% -6.1 0.9 -15.0 -16.7 -4.9 2.0 95.3 Outperform
Linear Tech. 17.4 124% -16% 10.1 -35% 7.3 3.1 -19.2 -18.0 -9.0 2.7 31.9 Outperform
Anadarko Petroleum 16.8 158% -26% 1.9 -2% 2.4 0.5 -19.9 -3.5 -3.1 1.6 72.5 Outperform
Vmware 27.7 203% -14% 7.9 -2% 4.8 0.0 -23.2 4.6 0.2 2.3 88.1 Outperform
Zumiez 12.1 72% -46% 2.4 -40% 3.6 0.0 -25.1 -5.4 -0.9 2.3 20.3 Neutral
Las Vegas Sands 17.5 104% -44% 4.3 -35% 5.6 2.3 -38.7 -14.4 -5.4 2.1 43.7 Outperform
Starbucks 22.9 136% -9% 8.6 57% 2.7 1.2 -39.1 -5.3 -1.1 2.0 50.5 Outperform
Chipotle Mexn.Grill 25.6 153% -5% 7.9 45% 2.9 0.0 -40.0 0.0 -1.6 2.6 275.5 Neutral
Fusion-Io 50.1 482% -19% 4.9 -1% 0.3 0.0 -63.6 47.1 9.3 2.4 24.1 Outperform
Volcano 62.6 484% -11% 4.5 30% 0.8 0.0 -65.8 -16.7 -1.8 1.9 26.9 Outperform
Consensus
recommendation
(1=Buy; 5=Sell)
Share price,
local currency
(21 Nov)
-----P/E (12m fwd) ------ 2012e Momentum, %------ P/B ------- HOLT2012e, %
Source: MSCI, IBES, Factset, Thomson Reuters, Credit Suisse HOLT, Credit Suisse research
We show the full list of companies highlighted by our analysts as growth stocks in Europe
and the US in the screens in the Appendix.
23 November 2012
Global Equity Strategy 20
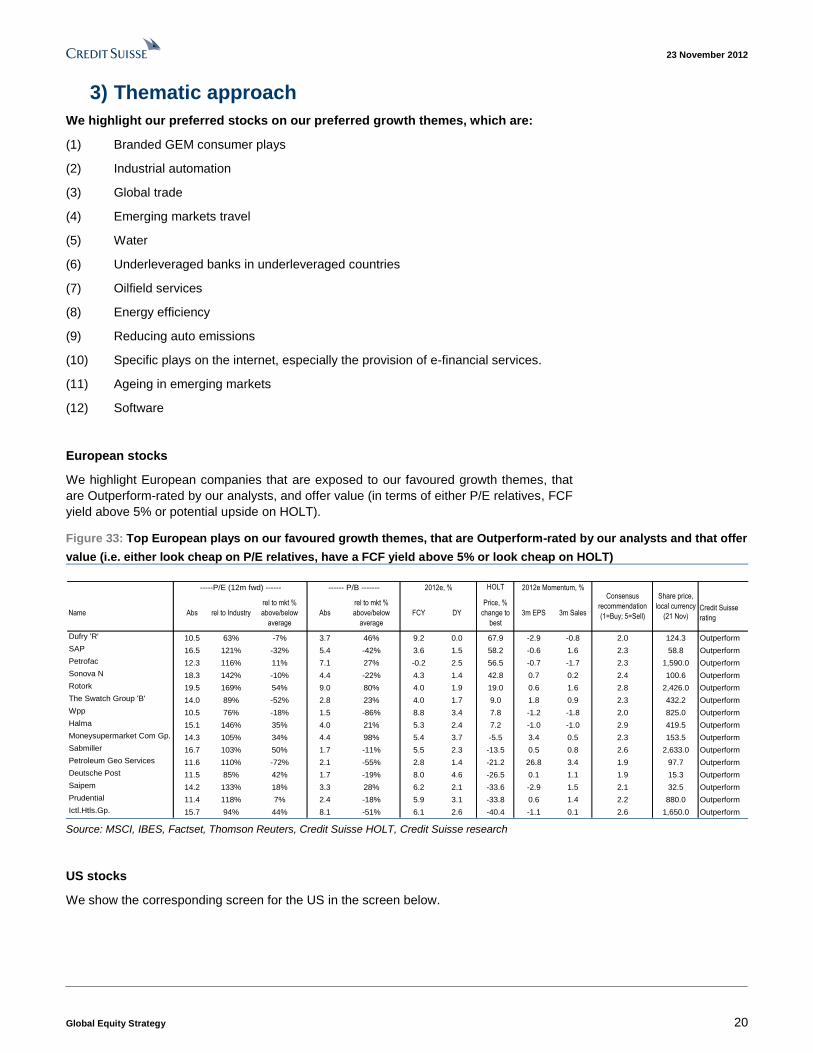
3) Thematic approach
We highlight our preferred stocks on our preferred growth themes, which are:
(1) Branded GEM consumer plays
(2) Industrial automation
(3) Global trade
(4) Emerging markets travel
(5) Water
(6) Underleveraged banks in underleveraged countries
(7) Oilfield services
(8) Energy efficiency
(9) Reducing auto emissions
(10) Specific plays on the internet, especially the provision of e-financial services.
(11) Ageing in emerging markets
(12) Software
European stocks
We highlight European companies that are exposed to our favoured growth themes, that
are Outperform-rated by our analysts, and offer value (in terms of either P/E relatives, FCF
yield above 5% or potential upside on HOLT).
Figure 33: Top European plays on our favoured growth themes, that are Outperform-rated by our analysts and that offer
value (i.e. either look cheap on P/E relatives, have a FCF yield above 5% or look cheap on HOLT)
Name Abs rel to Industry
rel to mkt %
above/below
average
Abs
rel to mkt %
above/below
average
FCY DY
Price, %
change to
best
3m EPS 3m Sales Credit Suisse
rating
Dufry 'R' 10.5 63% -7% 3.7 46% 9.2 0.0 67.9 -2.9 -0.8 2.0 124.3 Outperform
SAP 16.5 121% -32% 5.4 -42% 3.6 1.5 58.2 -0.6 1.6 2.3 58.8 Outperform
Petrofac 12.3 116% 11% 7.1 27% -0.2 2.5 56.5 -0.7 -1.7 2.3 1,590.0 Outperform
Sonova N 18.3 142% -10% 4.4 -22% 4.3 1.4 42.8 0.7 0.2 2.4 100.6 Outperform
Rotork 19.5 169% 54% 9.0 80% 4.0 1.9 19.0 0.6 1.6 2.8 2,426.0 Outperform
The Swatch Group 'B' 14.0 89% -52% 2.8 23% 4.0 1.7 9.0 1.8 0.9 2.3 432.2 Outperform
Wpp 10.5 76% -18% 1.5 -86% 8.8 3.4 7.8 -1.2 -1.8 2.0 825.0 Outperform
Halma 15.1 146% 35% 4.0 21% 5.3 2.4 7.2 -1.0 -1.0 2.9 419.5 Outperform
Moneysupermarket Com Gp. 14.3 105% 34% 4.4 98% 5.4 3.7 -5.5 3.4 0.5 2.3 153.5 Outperform
Sabmiller 16.7 103% 50% 1.7 -11% 5.5 2.3 -13.5 0.5 0.8 2.6 2,633.0 Outperform
Petroleum Geo Services 11.6 110% -72% 2.1 -55% 2.8 1.4 -21.2 26.8 3.4 1.9 97.7 Outperform
Deutsche Post 11.5 85% 42% 1.7 -19% 8.0 4.6 -26.5 0.1 1.1 1.9 15.3 Outperform
Saipem 14.2 133% 18% 3.3 28% 6.2 2.1 -33.6 -2.9 1.5 2.1 32.5 Outperform
Prudential 11.4 118% 7% 2.4 -18% 5.9 3.1 -33.8 0.6 1.4 2.2 880.0 Outperform
Ictl.Htls.Gp. 15.7 94% 44% 8.1 -51% 6.1 2.6 -40.4 -1.1 0.1 2.6 1,650.0 Outperform
Consensus
recommendation
(1=Buy; 5=Sell)
Share price,
local currency
(21 Nov)
-----P/E (12m fwd) ------ 2012e Momentum, %------ P/B ------- HOLT2012e, %
Source: MSCI, IBES, Factset, Thomson Reuters, Credit Suisse HOLT, Credit Suisse research
US stocks
We show the corresponding screen for the US in the screen below.

23 November 2012
Global Equity Strategy 21
Figure 34: Top US plays on our favoured growth themes, that are Outperform-rated by our analysts and that offer value
(i.e. either look cheap on P/E relatives, have a FCF yield above 5% or look cheap on HOLT)
Name Abs rel to Industry
rel to mkt %
above/below
average
Abs
rel to mkt %
above/below
average
FCY DY
Price, %
change to
best
3m EPS 3m Sales Credit Suisse
rating
Oracle 11.3 83% -40% 3.5 -56% 8.5 0.8 86.7 -0.1 -1.7 2.1 30.4 Outperform
Cigna 8.6 67% 5% 2.0 3% 13.2 0.1 63.2 3.9 -3.5 1.9 52.0 Outperform
Unitedhealth Gp. 10.2 79% -15% 2.1 -26% 11.2 1.4 61.7 5.3 -0.2 1.8 53.5 Outperform
Eli Lilly 13.1 105% -14% 4.2 -44% 7.8 4.0 54.8 2.2 -0.9 2.7 47.4 Outperform
Halliburton 10.5 99% -27% 2.2 -31% -2.2 1.1 38.6 -6.1 0.2 1.9 31.7 Outperform
Google 'A' 15.0 110% -26% 3.8 -29% 5.9 0.0 35.1 -7.9 -3.1 1.9 665.9 Outperform
Emerson Electric 13.6 118% 2% 3.5 2% 7.1 3.2 16.3 -1.5 -2.0 2.3 48.6 Outperform
Mead Johnson Nutrition 19.0 119% 18% -73.9 na 2.9 1.8 9.9 -2.8 -4.3 2.2 66.1 Outperform
Mindray Med.Intl.Spn. Adr.'A'
1:117.1 118% -5% 3.4 -29% na 1.2 8.2 2.6 1.2 2.1 33.8 Outperform
Johnson Controls 9.4 117% -5% 1.6 -12% 9.4 2.6 1.9 -11.8 -4.3 2.5 26.8 Outperform
Rockwell Automation 13.6 117% 41% 6.1 73% 5.3 2.4 -3.8 -3.2 -2.7 2.2 77.4 Outperform
United Parcel Ser.'B' 14.5 107% -7% 10.1 62% 6.3 3.1 -6.1 -4.9 -2.8 2.3 71.4 Outperform
Vmware 27.7 203% -14% 7.9 -2% 4.8 0.0 -23.2 4.6 0.2 2.3 88.1 Outperform
Las Vegas Sands 17.5 104% -44% 4.3 -35% 5.6 2.3 -38.7 -14.4 -5.4 2.1 43.7 Outperform
Volcano 62.6 484% -11% 4.5 30% 0.8 0.0 -65.8 -16.7 -1.8 1.9 26.9 Outperform
Consensus
recommendation
(1=Buy; 5=Sell)
Share price,
local currency
(21 Nov)
-----P/E (12m fwd) ------ 2012e Momentum, %------ P/B ------- HOLT2012e, %
Source: MSCI, IBES, Factset, Thomson Reuters, Credit Suisse HOLT, Credit Suisse research
We consider each theme in more detail.

23 November 2012
Global Equity Strategy 22
Growth themes 1) Branded GEM consumer plays
In our view, the GEM consumer story remains simple and compelling. We have been
overweight this theme for now five years!
The BRIC consumer share of GDP remains abnormally low and the Chinese consumer
share of GDP is still just half that of the US and Japan.
Figure 35: Emerging markets have a low consumption
share of GDP
Figure 36: In particular, China’s consumption share of
GDP is less than half the US levels
40%
45%
50%
55%
60%
65%
1997 2000 2003 2006 2009 2012
G7 consumption share of GDP
BRIC consumption share of GDP
Consumption, Share of GDP
30%
35%
40%
45%
50%
55%
60%
65%
70%
75%
1995 1996 1998 1999 2000 2002 2003 2005 2006 2007 2009 2010 2012
China United States
Source: Thomson Reuters, Credit Suisse research Source: Thomson Reuters, Credit Suisse research
We think that the consumer share of GEM GDP is set to rise, partly as a result of
currency appreciation and partly on account of policy. Discretionary consumption looks set
to rise faster than total consumption (with on average a third of income in emerging
markets being spent on non-discretionary items, according to the World Bank). Hence,
under our central case, discretionary consumption will be 9% in real terms and just under
14% in nominal terms (with a currency that near term is unlikely to depreciate).
Figure 37: If China grows by 7% per year in real terms between now and 2020, then consumption would likely grow by
10%, and discretionary spending by 13%
GDP
2011 15y max
Brazil 3.5% 60% 65% 4.3% 64% 65% 4.6% 9.1%
China 7.0% 32% 42% 10.1% 52% 65% 12.5% 15.5%
India 6.5% 57% 65% 7.8% 55% 60% 8.7% 12.8%
Russia 3.0% 50% 56% 4.1% 59% 65% 5.2% 11.7%
BRIC 6.1% 43% 50% 7.9% 56% 64% 9.2% 13.7%
Developed
countries2.4% 65% 74%
Implied
nominal growth
CountryConsumption share of GDP
Consumption
Implied real
growth
Implied real
growth 2007 2020E
Real trend
growth
Discretionary consumption (% of total)
Source: Thomson Reuters, Credit Suisse research

23 November 2012
Global Equity Strategy 23
When GDP per capita in the developed world was at the same level as it is in the
emerging markets currently, real consumption growth averaged nearly 5%, with the
highest growth being in communication, transport and education.
Figure 38: Current GDP pc in GEM is $7,000. When France, US and Japan had GDP pc at
this level, the highest growth was seen in communication, transport and education
4.6%
10.4%9.7%
7.2%6.8%
6.2% 6.2%
5.4%4.6% 4.3%
3.0%
0%
2%
4%
6%
8%
10%
12%
PC
E
Com
mun
icat
ion
Tra
nspo
rtat
ion
Edu
catio
n
Rec
reat
ion
Hou
sing
Fin
anci
al s
ervs
Hea
lthca
re
Hse
hld
& P
ers
Goo
ds Util
ities
Foo
d &
bev
Ave
rage
ann
ual g
row
th in
rea
l ter
ms
as G
DP
per
cap
ita
rises
from
c.U
S$7
,400
to U
S$9
,800
in th
e U
S, J
apan
an
d F
ranc
e
Source: Credit Suisse research
The key drivers of GEM consumption are higher wage growth (compounding at c.10% p.a)
and a fall in the savings ratio. In the case of China, the savings ratio is still c.40%. This is
set to fall, as there are moves towards a more state-sponsored social security system that
diminishes the need for individuals to save for old age or ill health.
We can see the resilience of the consumer if we look at the example of Chinese exports to
the US (which seem to follow ISM) against Chinese retail sales, which have clearly
decoupled.
Figure 39: Chinese retail sales are decoupling from those
in the US…
Figure 40: …while Asian exports have followed the US
cycle
-11%
-6%
-1%
4%
9%
14%
19%
24%
2002 2004 2006 2008 2010 2012
US
China
Retail sales yoy, 3mma
15
25
35
45
55
65
75
-30
-20
-10
0
10
20
30
40
50
1992 1996 2000 2004 2008 2012
Asian exports to US, yoy, 3mma, 6m lag
US ISM new orders, rhs
Source: Thomson Reuters, Credit Suisse research Source: Thomson Reuters, Credit Suisse research

23 November 2012
Global Equity Strategy 24
Finally, we believe currency appreciation is likely in many of the emerging markets.
This is largely driven by increased QE in the developed world. This in turn drives money to
those regions where there is an interest and a growth premium as well as undervalued
currencies. This points to the emerging markets. Currency appreciation helps the
consumer at the expense of exporters (the price of exports rises, while the price of imports
falls and thus discretionary consumption growth improves). This is also critical because in
recent years as we can see below the currencies have been a modest headwind.
Figure 41: Changes in EM currencies against the Euro
Source: Company data, Credit Suisse estimates
Indirect plays
Over the past five years, the emerging market business of the indirect plays (using food
producers and household products sector) has grown at 10% a year. This is growth!
Figure 42: Average emerging markets growth for the food producers and household
products companies* (quarterly 2007-2012) is close to 10%
0%
2%
4%
6%
8%
10%
12%
14%
16%
Q107
Q207
Q307
Q407
Q108
Q208
Q308
Q408
Q109
Q209
Q309
Q409
Q110
Q210
Q310
Q410
Q111
Q211
Q311
Q411
Q112
Q212
Q312
Source: Company data, Credit Suisse Consumer Staples Research Team. *Average Emerging Markets
growth based on Nestle, Unilever, Henkel, Kraft, Coke, Colgate, L’Oreal, Danone, Reckitt

23 November 2012
Global Equity Strategy 25
For the indirect plays we look at stocks with above–market projected average sales growth
over the next five years (our threshold is 6% annual growth), with growth superior to the
sector, translating into EPS growth of at least 8% p.a, and which our analysts believe are
growth. We also want these stocks to have at least 20% of revenues from GEM. This
highlights the following companies:
Figure 43: European stocks that are plays on the emerging markets consumer with at least 20% of revenues from GEM,
that our analysts identified as Growth
Name% Sales from
GEM
% Sales from
NJA
% Sales from
ChinaAbs rel to Industry
rel to mkt %
above/below
average
Abs
rel to mkt %
above/below
average
FCY DY
Price, %
change to
best
3m EPS 3m Sales Credit Suisse rating
Sabmiller 71% 8% n.a 16.7 103% 50% 1.7 -11% 5.5 2.3 -13.5 0.5 0.8 2.6 2,633.0 Outperform
Prudential 60% 60% n.a 11.4 118% 7% 2.4 -18% 5.9 3.1 -33.8 0.6 1.4 2.2 880.0 Outperform
The Swatch Group 'B' 50% 47% 37% 14.0 89% -52% 2.8 23% 4.0 1.7 9.0 1.8 0.9 2.3 432.2 Outperform
Diageo 45% 13% n.a 16.7 103% 47% 8.1 71% 4.2 2.5 -14.6 0.7 -1.5 2.1 1,846.0 Outperform
Pernod-Ricard 45% 27% n.a 15.4 95% 46% 2.0 14% 4.3 1.9 -22.5 -2.7 0.4 2.7 84.9 Outperform
Richemont 41% 34% 26% 14.9 96% 133% 3.5 69% 3.0 1.1 25.4 5.2 2.9 2.4 68.6 Neutral
Chr Hansen Holding 40% 10% 2% 21.4 166% 45% 5.1 49% na 1.9 -50.4 2.0 0.5 2.7 187.3 Outperform
Lvmh 35% 23% 14% 16.4 105% 3% 2.9 -10% 4.1 2.3 -1.2 -1.2 1.8 2.0 129.0 Outperform
Burberry Group 30% na n.a 17.5 112% 35% 6.3 45% 4.4 2.1 -13.8 -6.2 -4.4 2.5 1,233.0 Outperform
Wpp 25% 11% 6% 10.5 76% -18% 1.5 -86% 8.8 3.4 7.8 -1.2 -1.8 2.0 825.0 Outperform
Boss (Hugo) 17% 7% 7% 15.4 99% 29% 10.9 137% 4.1 4.1 -18.8 -4.5 0.0 2.0 79.2 Neutral
Consensus
recommendation
(1=Buy; 5=Sell)
Share price, local
currency (21 Nov)
-----P/E (12m fwd) ------ 2012e Momentum, %------ P/B ------- HOLT2012e, %
Source: MSCI, IBES, Factset, Thomson Reuters, Credit Suisse HOLT, Credit Suisse estimates
Of these, the following look cheap on HOLT or have an FCF yield above 5%: SAB Miller,
Swatch, Richemont, and WPP.
We show the same screen for the US below. Of these, the following look cheap on HOLT
or have an FCF yield above 5%: Las Vegas Sands, and Mead Johnson.
Figure 44: US stocks that are plays on the emerging markets consumer with at least 20% of revenues from GEM, that
our analysts identified as Growth
Name% Sales from
GEM
% Sales from
NJA
% Sales from
ChinaAbs rel to Industry
rel to mkt %
above/below
average
Abs
rel to mkt %
above/below
average
FCY DY
Price, %
change to
best
3m EPS 3m Sales Credit Suisse
rating
Las Vegas Sands 73% 73% 73% 17.5 104% -44% 4.3 -35% 5.6 2.3 -38.7 -14.4 -5.4 2.1 43.4 Outperform
Mead Johnson Nutrition 58% na n.a 19.0 119% 18% -73.9 na 2.9 1.8 9.9 -2.8 -4.3 2.2 66.8 Outperform
Yum! Brands 32% 32% 21% 19.7 117% 62% 18.2 -22% 4.0 1.7 -31.5 -0.1 -0.7 2.0 73.3 Outperform
Nike 'B' 24% 14% 9% 16.9 108% 23% 4.2 22% 5.4 1.5 -11.2 1.3 -0.4 2.4 96.3 Neutral
Consensus
recommendation
(1=Buy; 5=Sell)
Share price,
local currency
(21 Nov)
-----P/E (12m fwd) ------ 2012e Momentum, %------ P/B ------- HOLT2012e, %
Source: MSCI, IBES, Factset, Thomson Reuters, Credit Suisse HOLT, Credit Suisse estimates
There are three particular areas we would highlight as plays on the GEM consumer:
■ SAB Miller: the 2013E FCF yield is 5.5% (on our analyst’s calculations); yet we see
long-term sales growth of c7% and EPS growth potential of close to 13% CAGR. In its
core growth markets of Latam and Africa, SAB has strong positions with an average
market share of around 90% and 70%, respectively. According to our analyst, Sanjeet
Aujla, its future growth is driven by its own pace of category development and
penetration, and is less at risk from competitive threats affecting other businesses
given high barriers to entry in these markets. As our analyst points out, the percentage
of income spent on beer rises until GDP per capita hits c$20K (implying that in this
case beer volumes should grow at a higher rate than GDP). SAB has a wide set of
price points and, thus, is able to exploit the premium beer market and at the low end.
Its price points are increasingly competitive against the informal alcohol sector,
according to our analyst.
We can see from the charts below that beer and international spirits per capita
consumption tends to go up as GDP per capita rises.

23 November 2012
Global Equity Strategy 26
Figure 45: Beer per capita consumption goes up as GDP
per capita rises…
Figure 46: …and so does international spirits per capita
consumption
R² = 0.3789
0
20
40
60
80
100
120
140
160
0 20000 40000 60000 80000 100000
GDP per capita
PC
C
R² = 0.3243
0.0
0.5
1.0
1.5
2.0
2.5
3.0
3.5
4.0
4.5
5.0
0 20000 40000 60000 80000 100000
GDP per capita
PC
C
Source: Company data, Credit Suisse Consumer Staples Research
team
Source: Company data, Credit Suisse Consumer Staples Research
team
■ Diageo: the world leader in international premium spirits. Within a growing global
spirits market, premium end offers the fastest growth at the expense of local cheap
liquor, according to our analyst Charlie Mills. 45% of Diageo sales come from
emerging markets.
■ Swatch: more than Richemont, it tends to sell into wholesale channels, which offer
less advantageous pricing than retailers. Yet, on a tactical basis, our analysts see the
medium-price segment in Asia holding up better than the high-end segment. Strong
tourist purchases in Europe should be a key mitigating factor. Swatch looks well
placed to capitalise on the stabilisation of macro indicators in China, which accounts
for about 35% of group sales. In the medium term, its best-in-class supply chain
capabilities and gradual reduction in supply of movements (i.e. watch parts) to external
parties should result in lower investment requirements than peers to support growth of
mechanical watches for brands such as Longines or Tissot. Its balance sheet remains
strong and valuation is among the cheapest in the European luxury space, according
to our analyst Rogerio Fujimori. Its FCF yield is well above its peers’.
Figure 47: Swiss watch survey is improving yoy Figure 48: HK watch & jewellery sales appear to have
troughed
-100
-80
-60
-40
-20
0
20
40
60
80
100
-40%
-20%
0%
20%
40%
60%
80%
1998 2000 2002 2004 2006 2008 2010 2012
Swatch price relative (euros), y/y%
Swiss watch manufacturers survey,Production compared to prev. year, rhs
-40%
-20%
0%
20%
40%
60%
80%
100%
-20%
-10%
0%
10%
20%
30%
40%
50%
2006 2007 2008 2009 2010 2011 2012
HK watch and jewellery volume sales, y/y%
Swatch price relative (euros), y/y%
Source: Company data, Credit Suisse Luxury Goods Research Team Source: Company data, Credit Suisse Luxury Goods Research team

23 November 2012
Global Equity Strategy 27
Clearly, there is an issue of valuation in absolute terms – but we would point out that, on a
sum of the parts basis, the indirect GEM plays look attractively valued relative to the direct
plays.
Figure 49: Developed market consumer stocks with emerging market exposure are trading cheaply relative to their foreign-listed subsidiaries
Source: Company data, Credit Suisse estimates

23 November 2012
Global Equity Strategy 28
2) Industrial Automation
We believe there are four main drivers of this theme:
a) Rising wage pressures in emerging markets
Strong wage pressure in emerging markets means that their cost advantage is shrinking
and the incentives for automation in both developed and developing countries are
increasing.
Figure 50: Dwindling Supply of Manual Labor (China) Figure 51: Hourly Manufacturing Labor Costs in China)
-80
-60
-40
-20
0
20
40
60
80
100
1990 1995 2000 2005 2010 2015 2020 2025 2030 2035 2040 2045 2050
Mill
ion
pers
ons Population aged between 15-19 minus population
aged between 50- 54 and new college students.
10%
12%
14%
16%
18%
20%
22%
24%
2003 2004 2005 2006 2007 2008 2009 2010 2011 2012
China: hourly manufacturing wage growth, yoy
Source: Company data, Credit Suisse China Strategy Team Source: Credit Suisse US Capital Goods team,
Credit Suisse research
China in particular seems to have hit a ‘Lewis Turning Point’, which is the point at which
the excess low cost labour force is exhausted, leading to increased wage inflation. The 19-
24 year old age group is peaking this year, with the broader labour force estimated to peak
in 2015. A rise in social security related costs is also likely to happen over time (the costs
falling probably on the employer) again raising the relative cost of labour.
Company comments about Asian labour price inflation have proliferated, with ITW, Metso
and NTN recently flagging increased wage inflation, according to our European Capital
Goods team.
Figure 52: After hitting the ‘Lewis Turning Point’, other Asian export-led countries
experienced higher inflation and lower trend growth (but still good growth)
Japan
(1960-1972)
Korea
(1982-96)
China
(1997-2009)
GDP: Average 8.9% 8.5% 9.6%
CPI: Average 5.6% 5.2% 1.3%
CPI: Maximum 13.1% 11.1% 4.8%
CPI: Minimum 3.6% 2.3% -1.5%
Source: Company data, Credit Suisse research, Credit Suisse US Capital Goods team
b) Robot density in emerging markets is low
The robot density (industrial robots per manufacturing employees) in emerging markets is
only a fraction of the penetration seen in developed economies. In emerging markets
(which account for 50% of global manufacturing output), there are only 7 industrial robots
per 10,000 manufacturing employees, against 149 for the developed markets, or just 5%
of the density of developed markets. Non-Japan Asia accounts for 35% of the world’s
manufacturing output, but only has a robot density of 11.

23 November 2012
Global Equity Strategy 29
Figure 53: Robot density for select countries (2011),
Robots per 10,000 manufacturing employees
Figure 54: Robot density by region (2002 vs. 2011),
Robots per 10,000 manufacturing employees
Country
Employees
(mn)
Output
($bn)
Output per head
($)
Robot
Density
U.S. 14 1,732 121,931 130
China 99 1,612 16,281 7
Point
China has
7x as many
manufacturing
workers
China and
the U.S. produce
the same
output
US has 7.5x
higher output
per head
US has 18.5x the
number
of robots
per head
Source: Company data, Credit Suisse US Capital Goods team Source: Company data, Credit Suisse US Capital Goods team
There is already evidence of an accelerating move towards automation even among
emerging markets companies that have long benefited from the abundant supply of cheap
labour. Foxconn, for example, one of the world’s largest maker of electronic components,
has recently announced that it would replace a part of its 1m workforce with robots (New
York Times, 18 August 2012). This suggests to us that automation may be at an inflection
point in China.
Figure 55: The industrial robot density ‘S’ curve
(base year = 1974 for Japan, 1999 for China)
Robots per 10,000 manufacturing employees
Figure 56: The automated machine tool ‘S’ curve
(Share of Machine Tools Shipped with Numerical
Controls); (base year = 1970 for Japan, 2000 for China)
0
50
100
150
200
250
300
350
T+0 T+3 T+6 T+9 T+12 T+15 T+18 T+21 T+24 T+27 T+30 T+33
Japan Robot Density
China Robot Density
0
50,000
100,000
150,000
200,000
250,000
300,000
350,000
400,000
450,000
T+0 T+3 T+6 T+9 T+12 T+15 T+18 T+21 T+24 T+27 T+30 T+33
Japan China
Source: Company data, Credit Suisse Capital Goods team Source: Company data, Credit Suisse estimates, Credit Suisse
Capital Goods team

23 November 2012
Global Equity Strategy 30
c) Reduced outsourcing in developed markets leads to more automation in
developed markets
There are a number of factors at work, which are likely to significantly reduce the rate of
outsourcing to other countries:
■ Rising wage inflation in emerging markets. A report by the Boston Consulting
Group (Made in America, Again, August 2011) suggested that by 2015, wage rates in
Chinese cities such as Shanghai and Tianjin will be only about 30% below those in
low-cost US states. Since wage rates account for 20% to 30% of a product’s total cost,
manufacturing in China will be only 10% to 15% cheaper than in the US; clearly,
reducing the attractiveness of outsourcing.
■ Rising indirect cost of labour in developed markets (e.g. increased social security
payments) increases the labour costs relative to capital and thus the attractiveness of
substituting labour with machines.
■ Moving production closer to the consumer. Technologies like 3D printing increase
the benefits of bringing production closer to the consumer, giving companies
increased flexibility. This allows the production process to be quickly adapted to
changes in demand (e.g. the European clothing retailer Inditex’s business model). In
addition, the recent weakness in global growth has led to increased protectionist
pressures in several countries. The WTO noted in a report in May 2012 that over the
previous 6 months the G20 countries introduced 124 new restrictive measures
affecting about 1% of world imports. This further incentivises companies to produce
close to the consumer to prevent tariffs and restrictions.
Furthermore, the Obama administration is committed to support this trend, with the
president lobbying during his recent election campaign “to bring jobs back home”,
promising tax breaks as an incentive (FT, 9 July 2012).
d) Improvement in technology increases the degree of precisions and that in
turn enables more efficient and better use of automation
Valuation and cyclicality
Global automation stocks look cheap on P/E and P/B relative, with both ratios close to a
four year low.

23 November 2012
Global Equity Strategy 31
Figure 57: Global automation looks cheap on 12m fwd PE
relative…
Figure 58: …as well as P/B relative
70%
80%
90%
100%
110%
120%
130%
140%
150%
160%
170%
2002 2004 2006 2008 2010 2012
Cap gds stocks with automation exposure 12m fwd P/E rel Market
Average (+/- 1SD)
125%
140%
155%
170%
185%
200%
2002 2004 2006 2008 2010 2012
Cap gds stocks with automation
exposure P/B rel MarketAverage
Source: Thomson Reuters, Credit Suisse research Source: Thomson Reuters, Credit Suisse research
Earnings momentum and price momentum both look neutral.
Figure 59: Earnings momentum is neutral… Figure 60: … as is price momentum
-40%
-30%
-20%
-10%
0%
10%
20%
30%
1990 1992 1994 1996 1998 2000 2002 2004 2006 2008 2010 2012
Cap gds stocks w ith automation ex posure 3m breadthRel Market
-20%
-15%
-10%
-5%
0%
5%
10%
15%
20%
1990 1992 1994 1996 1998 2000 2002 2004 2006 2008 2010 2012
Cap gds stocks w ith automation ex posure %dev from 6mma,
rel to MarketAv erage (+/1 SD)
Source: Thomson Reuters, Credit Suisse research Source: Thomson Reuters, Credit Suisse research
Automation is clearly a cyclical play, but it is slightly more defensive than capital goods in
general.

23 November 2012
Global Equity Strategy 32
Figure 61: Automation is a cyclical sector, but less cyclical than the cap goods sector in
general
-0.6
-0.5
-0.4
-0.3
-0.2
-0.1
0.0
0.1
0.2
0.3
0.4
Div
Fin
S/C
on&
S/C
on E
q
Con
s D
ur/A
pp
Met
& M
in
Cap
Gds
Tch
H/W
/Eq
Aut
o &
Com
po
Cap
gds
with
aut
omat
ion
Pap
/For
Prd
Ban
ks
S/W
& S
vs
Che
mic
als
Rea
l Est
ate
Ret
ailin
g
Insu
ranc
e
Med
ia
Con
Mat
Con
s S
vs
Ene
rgy
Com
l/Pro
f S
vs
Tra
nspt
H/C
Eq/
Svs
Tob
acco
T/C
m S
vs
Bev
erag
es
H/H
Per
s P
rd
Fd
Prd
Fd/
Sta
ples
Rtl
Util
ities
Ph/
Bio
L S
ci
Global sectors correlation w ith ISM
Source: Thomson Reuters, Credit Suisse research
Stock picks
In the screen below, we highlight companies exposed to industrial or factory automation,
rather than process automation. That is, companies which produce equipment for the
automation of discrete processes that today are mainly performed by human workers,
rather than the flow processes (such as refining) that are already mainly performed by
machines.
There are a number of categories of industrial automation products and services, but they
can be split into two main classes: the actuation-type products such as robots, motors,
drives, machine tools (supplied by companies such as Fanuc, Yaskawa, THK) and those
focused on the ‘brains’ guiding the products (supplied by companies such as Rockwell
Automation and Schneider). Some companies provide both (Siemens (rated Outperform)
and Mitsubishi Electric (rated Neutral)).
We show a list of stocks exposed to this theme in the screen below. Of these, Schneider
(Neutral), Emerson Electric (Outperform) and Mitsubishi Electric (Neutral) have upside
potential on HOLT.
Figure 62: Global capital goods companies with exposure to automation
Name% exposure to
automationAbs rel to Industry
rel to mkt %
above/below
average
Abs
rel to mkt %
above/below
average
FCY DY
Price, %
change to
best
3m
EP
S
3m
Sa
les
Share price,
local currency
(21 Nov)
Credit Suisse
rating
Rockwell Automation 100% 13.6 117% 41% 6.1 73% 5.28 2.38 -3.8 -3.2 -2.7 2.2 77.9 Outperform
Keyence Corporation(C) 95% 19.4 187% -18% 2.0 -40% 0.07 0.28 -39.3 1.0 2.7 2.9 22,060.0 Neutral
Smc Corporation(C) 90% 14.1 122% -38% 1.5 -35% 0.30 1.07 -23.8 -6.2 -4.0 2.5 13,260.0 Neutral
Abb Limited 52% 12.1 105% 4% 2.7 -83% 6.05 3.85 65.3 -5.6 -2.7 2.1 17.0 Not Rated
Emerson Electric Co 50% 13.6 118% 2% 3.5 2% 7.14 3.17 16.3 -1.5 -2.0 2.3 48.5 Outperform
Yaskawa Electric Corporation(C) 50% 16.5 159% -35% 1.5 -43% 2.21 1.58 -47.0 -24.2 -3.9 2.7 639.0 Outperform
Thk Co., Ltd.(C) 40% 15.2 132% -42% 1.0 -53% na 1.49 -33.4 -34.8 -7.0 2.6 1,397.0 Outperform
Fanuc Corporation(C) 40% 18.0 156% -23% 2.7 25% 3.43 1.53 -37.7 -10.2 -6.7 2.8 13,830.0 Neutral
Nabtesco Corporation(C) 30% 13.5 117% 5% 2.1 14% na 2.23 -41.8 -20.3 -6.5 2.7 1,633.0 Neutral
Schneider Electric Sa 25% 12.1 104% 1% 1.7 4% 5.77 3.49 43.5 -0.8 -0.3 2.8 51.3 Neutral
Mitsubishi Electric Corporation(C) 22% 9.7 84% -61% 1.1 -33% 12.51 1.93 30.7 -8.8 -2.0 2.4 626.0 Neutral
Consensus
recommendation
(1=Buy; 5=Sell)
-----P/E (12m fwd) ------ Momentum------ P/B ------- HOLTYield (2012e)
Source: MSCI, IBES, Thomson Reuters, Credit Suisse HOLT, Credit Suisse research
For more details on automation, please have a look at an extensive analysis done by our
global capital goods team Global Industrial Automation - The next growth phase, dated 14
August 2012. In addition, Credit Suisse offers a sector-neutral Delta One basket,

23 November 2012
Global Equity Strategy 33
CSERATMN, that represents 26 global cyclicals, largely within the capital goods and
technology space, with high exposure to this theme.

23 November 2012
Global Equity Strategy 34
3) Global trade
Over the past 40 years, global trade has risen around 1.3x as fast as global GDP (the
CAGR of global trade has been 8% in nominal terms, compared with 6% nominal GDP
growth).
Figure 63: Global trade is equivalent to around 25% of
global GDP, up from 7% in 1970
Figure 64: In 2012, global trade growth has been weaker
than the historical relationship with global GDP would
have suggested
8%
10%
12%
14%
16%
18%
20%
22%
24%
26%
1972 1976 1980 1984 1988 1992 1996 2000 2004 2008 2012
Global trade, % of global GDP
2012
y = 3.58x - 0.07R² = 0.71
-15%
-10%
-5%
0%
5%
10%
15%
20%
-1% 0% 1% 2% 3% 4% 5% 6%
Tra
de g
row
th, v
olum
es
Global GDP growth
Source: Thomson Reuters, Credit Suisse research Source: IMF, Credit Suisse research
We think that this is set to continue, driven by the following factors:
■ There are still significant cost advantages of producing in emerging markets, which
leads to more outsourcing (despite the increase in emerging market wages);
Figure 65: Domestic prices in emerging markets continue
to be considerably below those in the US
Figure 66: Manufacturing unit labour costs in the
emerging markets are still relatively low
30%
35%
40%
45%
50%
55%
60%
65%
70%
75%
1980 1983 1986 1989 1992 1995 1998 2001 2004 2007 2010
Emerging markets
Non-Japan Asia
Domestic price (cost) relative to the US, in %
Source: Thomson Reuters, Credit Suisse research Source: Thomson Reuters, Credit Suisse EEMEA Equity Strategy
team
■ Trade benefits from the continuing decline in tariffs in the major economies.

23 November 2012
Global Equity Strategy 35
Figure 67: Tariff rates continue to decrease in the major
economies
Figure 68: container shipping rates are up only 20% and
are likely to fall further despite the rise in fuel costs
2
4
6
8
10
12
14
1989 1991 1993 1995 1997 1999 2001 2003 2005 2007 2009 2011
Median tariff rate applied tomanufactured goods in majoreconomies, %
70
120
170
220
270
320
370
420
470
520
Mar-03 Mar-05 Mar-07 Mar-09 Mar-11
Oil price
Container shipping rates
2003 = 100
Source: Thomson Reuters, Credit Suisse research Source: Thomson Reuters, Credit Suisse research
■ The rise in energy prices has not translated into an increase in shipping costs: oil
prices are up by 350% over the past decade, while container shipping rates have risen
by only 20%. Furthermore, our analysts expect rates to fall in 2013, as supply looks
set to increase by up to 10%, and this should keep the cost of transporting low.
■ The emergence of the GEM consumer should lead to more developed market
companies selling into emerging markets, thus turning global trade into a two-way
affair, away from a model in which emerging markets merely function as a production
location for developed market consumption.
This year however trade volumes have been flat over the past 12 months. This is much
weaker than should have been the case. This weakness is due to the following factors, in
our view:
■ The rebalancing within Europe: the current account balance in peripheral Europe
has turned into surplus for the first time in a decade, as peripheral countries have
stopped importing, most likely as a consequence of the capital flight seen earlier this
year (capital flight from Spain over the past year has been 32% of GDP, for instance).
This weakness in demand has not been offset by increased imports in core Europe.
Consequently, Euro-area imports are down year-to-date by 7% compared to the same
period in 2011, while they are up in most other regions (and the annualised import
growth in the rest of the world, at 14%, is above the10-year average of 17%).

23 November 2012
Global Equity Strategy 36
Figure 69: Capital flight in the periphery earlier this year… Figure 70: … has led to considerable import weakness in
the Euro-area, which explains most of the softness in
global imports
-35%
-30%
-25%
-20%
-15%
-10%
-5%
0%
5%
10%
15%
Apr-07 Apr-08 Apr-09 Apr-10 Apr-11 Apr-12
3 month annualised change in Target 2 balance, % GDP
Periphery inc. Italy
Periphery ex. Italy
September data annualised
Periphery ex. Italy
Periphery inc. Italy
-10%
-5%
0%
5%
10%
15%
Latin
Am
eric
a
Japa
n
NJA
GE
M
Wor
ld e
x E
urop
e
Afr
ica
Chi
na US
Wor
ld
UK
Eas
tern
Eur
ope
Eur
o-ar
ea
Import growth, ytd over the same period last year
Source: Bank of Spain, Bank of Portugal, Bank of Italy, Central Bank
of Ireland, Bank of Greece, Thomson Reuters, Credit Suisse research
Source: Thomson Reuters, Credit Suisse research
■ The reduction in trade finance, as Euro-area banks deleverage (and, in particular,
shed dollar-denominated assets);
Figure 71: Global ex EU import growth has been in line
with the historical average
Figure 72: Euro-area banks have significantly reduced
their exposure to trade finance
-30%
-20%
-10%
0%
10%
20%
30%
2000 2002 2004 2006 2008 2010 2012
World World ex EU
Global import growth, nominal
Source: Thomson Reuters, Credit Suisse research Source: IIF
Overall, we believe that the rebalancing in Europe is likely to be the main reason for weak
trade growth this year. While we believe that growth in the Euro-area will be sluggish, we
think some of the sharp trade moves that we have seen should normalise, given that the
capital outflows that have most likely triggered it have now begun to reverse, owing to the
change in ECB policy. Hence, we would agree with IMF projections suggesting that global
trade volumes will continue to grow at around 1.3x the rate of global real GDP over the
next five years.

23 November 2012
Global Equity Strategy 37
The following areas should benefit from continued strong growth in global trade:
■ Testing/verification benefit from increasing global trade volume, the increased
sophistication and complexity of global supply chains (which creates demand for more
independent verification and certification) as well as tighter regulation and safety
standards. We highlight Intertek, SGS and Bureau Veritas.
■ Freight forwarding: over the past 10 years, both sea and air freight forwarding have
grown more than global GDP (8% and 3%, respectively, compared with average GDP
growth of 2.5%) – and our analysts expect this to continue. Within this area, we think
air freight is particularly interesting, given that it should benefit disproportionately from
a possible rebound in global trade. Furthermore, it is helped by the outsourcing
moving to high-value-added products (with a low weight). On the downside, though, it
will be negatively affected as, structurally, air is losing market share to shipping, due to
the latter’s cost advantage. We would highlight Kühne + Nagel and Panalpina in
Europe as well as Expeditors in the US. Cargo-focused airlines should again benefit
from growth in air freight (EVA Airways, Cathay Pacific, China Airlines and Asiana Air).
■ Express, the premium segment of the air freight business, should benefit from the
structural growth outlook in the emerging markets, where penetration for these
services is still low. It should also benefit from the rebound in trade volumes we
forecast, given the just-in-time nature of the service (i.e. if demand surprises on the
upside, time-sensitive delivery would grow in importance). Lastly, the industry has an
oligopolistic structure, with four main players (FedEx, UPS, TNT Express and DHL, a
part of Deutsche Post) dominating the intercontinental trade lanes.
Figure 73: Plays on global trade
Name Abs rel to Industry
rel to mkt %
above/below
average
Abs
rel to mkt %
above/below
average
FCY DY
Price, %
change to
best
3m EPS 3m Sales Credit Suisse
rating
Cathay Pacific Airways 16.2 120% 8% 1.0 -17% 2.6 0.9 14.4 -53.8 0.6 2.5 13.9 Outperform
United Parcel Ser.'B' 14.5 107% -7% 10.1 62% 6.3 3.1 -6.1 -4.9 -2.8 2.3 71.4 Outperform
Eva Airways 12.1 90% -48% 1.5 28% na 0.4 -15.6 -28.9 -0.4 2.8 16.3 Outperform
Dsv 'B' 13.1 97% 24% 4.7 54% 8.7 0.9 -18.6 -1.1 -1.3 2.4 133.0 Neutral
Intertek Group 19.9 127% 60% 8.8 -51% 3.0 1.4 -20.1 2.0 1.7 2.8 2,898.0 Outperform
Expeditor Intl.Of Wash. 19.7 146% -1% 3.9 -22% 4.6 1.5 -21.0 -8.5 -5.6 2.4 36.8 Neutral
Bureau Veritas Intl. 20.2 128% 70% 8.6 5% 3.9 1.7 -26.3 0.8 1.0 3.0 83.6 Neutral
Deutsche Post 11.5 85% 42% 1.7 -19% 8.0 4.6 -26.5 0.1 1.1 1.9 15.3 Outperform
Sgs 'N' 21.4 136% 51% 7.6 77% 2.2 3.1 -31.2 -2.2 0.0 2.8 2,012.0 Neutral
Fedex 13.0 97% 7% 2.0 1% 1.5 0.6 -35.8 -14.5 -1.4 1.8 87.7 Neutral
Kuehne+Nagel Intl. 20.3 151% 70% 5.7 66% 4.3 3.3 -36.7 -1.7 0.2 2.6 113.8 Outperform
Tnt Express 22.9 170% 40% 1.6 15% 1.6 1.1 -38.5 -5.9 -0.9 3.1 7.2 Neutral
Consensus
recommendation
(1=Buy; 5=Sell)
Share price,
local currency
(21 Nov)
-----P/E (12m fwd) ------ 2012e Momentum, %------ P/B ------- HOLT2012e, %
Source: MSCI, IBES, Thomson Reuters, Credit Suisse HOLT, Credit Suisse estimates

23 November 2012
Global Equity Strategy 38
4) Global travel
As emerging market consumers grow richer, they are likely to travel more. World Bank
data suggest that the beta of the growth in flights per capita to growth in income per capita
is around 2x (i.e. if GDP per capita increases by 10%, flights per person should be
expected to increase by 20%). Projections from the IMF and the UN suggest that GDP per
capita in the emerging markets could increase by 5% per year over the next five years,
suggesting an increase in flights per capita of around 10% per year.
Figure 74: Flights per capita tend to increase by twice as
much as income per capita
Figure 75: When developed countries were at the same
level of development as emerging markets are today,
transportation was among the fastest-growing areas of
consumer spending
0%
2%
4%
6%
8%
10%
12%
14%
16%
18%
Wor
ld
US
EU
Chi
na
Bra
zil
Indi
aGDP per capita Flights per capita
Average annual growth since 1980
7.5%
12.8%11.5% 11.4%
10.3%
7.4%6.5%
4.5% 4.4% 3.8%
0%
2%
4%
6%
8%
10%
12%
14%
PC
E
Com
mun
icat
ion
Tra
nspo
rtat
ion
Hou
sing
Rec
reat
ion
Hea
lthca
re
Fin
anci
alse
rvic
es
HH
util
ities
Foo
d &
beve
rage
s
Edu
catio
n
Average annual growth in real terms as GDP per capita rose from c.US$7,000 to US$9,000 in the US, Japan and France
Source: World Bank Source: Credit Suisse Thematic research
Furthermore, when developed markets were at roughly the level of development of
emerging markets today, transportation was the fastest growth area within consumer
spending after telecommunication, growing on average by around 12% per year in real
terms, compared with real consumer spending growth of around 8%.
We note that in its long-term market outlook (2012–32) Boeing forecasts Asia’s passenger
air traffic to grow at an average annual rate of 6.4% over the next 20 years. In addition, the
International Civil Aviation Organization forecasts annual growth of 5.9% in global
passenger traffic until 2014. Lastly, the Emerging Consumer Survey 2012, published by
our Thematic research team in January 2012, also points to strong growth in travel
intentions in emerging markets.
We highlight the following as potential beneficiaries of strong structural growth of global
(and especially emerging market) travel:
■ Beneficiaries of the growth in Asian tourism: AirAsia (South East Asia’s largest
low-cost carrier), Air China (the domestic Chinese carrier with the biggest exposure to
international outbound routes), China Eastern Airlines, China Southern Airlines,
Cathay Pacific, Garuda Indonesia and MAHB.
■ Up-market hotels benefit from the increased travel budgets of the growing emerging
market middle class in two ways. First, they increasingly push into domestic markets,
deriving a growing share of revenues from the fast-growing emerging market hotel
segment; secondly, they benefit from outbound travel by emerging market (especially
Chinese) consumers, visiting developing markets, especially if these countries
ultimately allow their currencies to strengthen, benefiting consumers’ purchasing

23 November 2012
Global Equity Strategy 39
power. Furthermore, the business is protected by high barriers to entry in the top-end
luxury hotel space (i.e. shortage of sites in inner city areas). We would highlight M&C
(benefits from presence in gateway cities) and Intercontinental (pushing into domestic
markets), as well as Starwood (the US hotel stocks with the largest GEM exposure). In
addition, Shangri-La has developed a strong presence in China.
We admit that revenue per available room (RevPAR) fell by more than 20% in the last
month. However, Tim Ramskill, from our European travel & leisure team, highlights that
operators believe this reflects short-term political disruption rather than any structural
issues and therefore the long-term dynamics are unaltered. Thus we think this weakness
provides a buying opportunity.
Figure 76: Asian revenue per available room fell in the last 2 months but our analyst, Tim
Ramskill, believes this will reverse quickly as the structural growth story remains intact
(35.0)
(30.0)
(25.0)
(20.0)
(15.0)
(10.0)
(5.0)
0.0
5.0
10.0
15.0
20.0
25.0
30.0
Jan-
05
Jul-0
5
Jan-
06
Jul-0
6
Jan-
07
Jul-0
7
Jan-
08
Jul-0
8
Jan-
09
Jul-0
9
Jan-
10
Jul-1
0
Jan-
11
Jul-1
1
Jan-
12
Jul-1
2
Occupancy Year on Year change %
Average Daily Rate Year on Year change %
RevPAR Year on Year change %
Source: Credit Suisse Travel & Leisure Equity Research team
■ Duty free is another sector likely to benefit from growth in global travel volumes. The
world’s biggest travel retailer is Dufry, which currently holds about 8% of global market
share and derives 70% of its revenue from emerging markets.
Valuation
Global travel looks slightly expensive on 12m fwd PE relative to global. However, relative
to its average over the past 4 years, the valuation appears less stretched.

23 November 2012
Global Equity Strategy 40
Figure 77: Global travel looks slightly expensive on P/E relative over a 10-year period but
not if we just look at the past 4 years
90%
100%
110%
120%
130%
140%
150%
160%
170%
2007 2008 2009 2010 2011 2012
Global travel stocks 12m fwd P/E rel World
Average (+/- 1SD)
Source: Thomson Reuters, Credit Suisse research
Stock picks
We highlight plays on this theme in the screen below.
Figure 78: Beneficiaries of the strong structural growth of global travel
Name GEM sales Absrel to
Industry
rel to mkt %
above/below
average
Abs
rel to mkt %
above/below
average
FCY DY
Price, %
change to
best
3m
EP
S
3m
Sa
les
Share price,
local
currency (20
Nov)
Credit Suisse
rating
Malaysia Airports Holdings
Bhd
100% 17.8 132% 73% 1.8 75% -14.38 2.96 -28.4 -3.4 -4.2 1.8 5.7 Outperform
Intercontinental Hotels
Group Plc
34% 15.7 94% 44% 8.1 -51% 6.15 2.60 -40.4 -1.1 0.1 2.6 1,633.0 Outperform
Starwood Hotels&Resorts
Wrld
15% 19.8 118% 14% 3.4 41% 4.62 1.97 -45.4 4.9 0.1 2.2 52.4 Outperform
Airasia Berhad 100% 9.1 67% -10% 2.1 3% -31.86 1.24 49.5 -6.3 1.9 2.1 2.9 Outperform
Air China Limited 100% 9.8 73% -7% 1.3 -26% na 1.44 -38.3 -18.0 -0.6 2.2 5.1 Outperform
Shangri-La Asia 100% 27.6 164% 85% 1.1 14% 1.02 1.32 -17.4 -18.8 0.7 3.0 15.1 Not Rated
China Southern Airlines Co
Ltd
100% 9.5 71% -54% 0.9 -10% -16.10 1.37 -78.2 -27.9 0.2 2.1 3.4 Outperform
Cathay Pacific Airways
Limited
78% 16.2 120% 8% 1.0 -17% 2.58 0.90 14.4 -53.8 0.6 2.5 13.9 Outperform
Dufry Ag 70% 10.5 63% -7% 3.7 46% 9.24 0.00 67.9 -2.9 -0.8 2.0 125.6 Not Rated
Garuda Indo.(Persero) 70% 12.3 91% 16% 2.1 33% -7.10 0.0% -113.1 -22.9 -0.2 1.6 690.0 Outperform
Millennium & Copthorne
Hotels Plc
48% 13.3 79% 4% 0.7 -1% 13.85 2.81 24.8 1.2 -1.5 2.3 464.6 Neutral
Consensus
recommendation
(1=Buy; 5=Sell)
-----P/E (12m fwd) ------ Momentum------ P/B ------- HOLTYield (2012e)
Source: MSCI, IBES, Fact set, Thomson Reuters, Credit Suisse HOLT, Credit Suisse estimates

23 November 2012
Global Equity Strategy 41
5) Water
For many parts of the world, the supply and demand imbalance in water provision appears
set to deteriorate. The UN estimate that by 2025, 21.4% of the global population (or 1.8
billion people) will face absolute water scarcity (defined as annual water supply below 500
cubic metres per person), up from 17% (1.2 billion people) in 2010. Contributing factors
include: (i) a growing world population and (ii) the tendency of water demand per capita to
increase as real incomes grow (partly because industrial processes become more water
intensive and partly because urbanisation brings with it more water-intensive sewage and
bathing systems). Meanwhile, the supply of freshwater water remains relatively static.
Desalination has clearly augmented supply in certain areas, but this source remains
relatively small in the global context and is only available to coastal areas. Essentially to
date, supply grows arithematically while demand growing geometrically for water.
Figure 52: Global water use and population Figure 53: Water prices have increased sharply relative to
headline inflation across most markets
0
500
1000
1500
2000
2500
3000
3500
4000
4500
1900 1920 1940 1960 1980 2000
Wat
er u
se, k
m c
ubed
p.a
.
0.0
2.0
4.0
6.0
8.0
10.0
12.0
14.0
16.0
18.0
Wor
ld p
opul
atio
n (b
n)
World water use
Global population
0.8
1.0
1.2
1.4
1.6
1.8
2.0
2.2
2.4
1972 1977 1982 1987 1992 1997 2002 2007 2012
US CPI water rel. to overall CPI index
Canada CPI water rel. to overall CPI index
Source: FAO Aquastat, UN, Credit Suisse research Source: Thomson Reuters, Credit Suisse research
There are two obvious consequences of this supply/demand imbalance:
(1) Prices have risen: When we investigate the prices paid by consumers for their water
supply within national CPI indices, we find that without exception water prices have
outstripped headline inflation. Over the past 10 years, the consumer price of water has
risen by an average of 6% in the US, more than double the average increase in overall
consumer prices, at 2.5%. Even in countries that are relatively water rich (e.g.
Canada) the price of water has outstripped headline inflation by an average of 4.6
percentage points over the past 10 years (6.5% CAGR, compared to 1.9% for
headline inflation).
(2) There is substantial pent-up demand for investment to alleviate water shortages and
supply/demand imbalances. We find that global investment in water has generally
been disappointing over the last few years. It has lagged required investment levels as
detailed by the US Environmental Protection Agency and fallen short of expectations
across many of the emerging economies.
China has faced significant localised water shortages over the past several years and
the authorities’ response has been a CAGR in water investment of 20% since 2004.
Investment is likely to remain strong in this area - the government aims to launch 60
large hydro plants before 2015 (as reported by Reuters, 18 November 2012). Middle
East and North African markets have also prioritised water infrastructure investment
given similar acute water shortages.
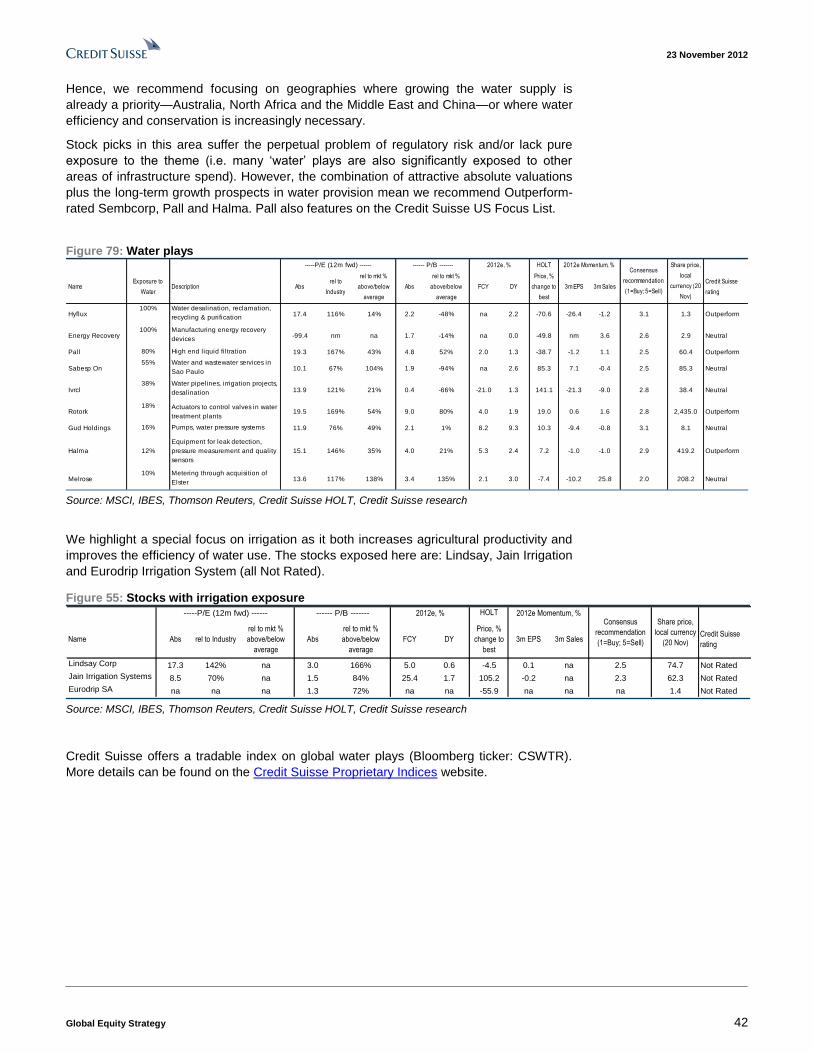
23 November 2012
Global Equity Strategy 42
Hence, we recommend focusing on geographies where growing the water supply is
already a priority—Australia, North Africa and the Middle East and China—or where water
efficiency and conservation is increasingly necessary.
Stock picks in this area suffer the perpetual problem of regulatory risk and/or lack pure
exposure to the theme (i.e. many ‘water’ plays are also significantly exposed to other
areas of infrastructure spend). However, the combination of attractive absolute valuations
plus the long-term growth prospects in water provision mean we recommend Outperform-
rated Sembcorp, Pall and Halma. Pall also features on the Credit Suisse US Focus List.
Figure 79: Water plays
NameExposure to
WaterDescription Abs
rel to
Industry
rel to mkt %
above/below
average
Abs
rel to mkt %
above/below
average
FCY DY
Price, %
change to
best
3m EPS 3m Sales Credit Suisse
rating
Hyflux100% Water desalination, reclamation,
recycling & purification17.4 116% 14% 2.2 -48% na 2.2 -70.6 -26.4 -1.2 3.1 1.3 Outperform
Energy Recovery100% Manufacturing energy recovery
devices-99.4 nm na 1.7 -14% na 0.0 -49.8 nm 3.6 2.6 2.9 Neutral
Pall 80% High end liquid fi ltration 19.3 167% 43% 4.8 52% 2.0 1.3 -38.7 -1.2 1.1 2.5 60.4 Outperform
Sabesp On55% Water and wastewater services in
Sao Paulo10.1 67% 104% 1.9 -94% na 2.6 85.3 7.1 -0.4 2.5 85.3 Neutral
Ivrcl38% Water pipelines, irrigation projects,
desalination 13.9 121% 21% 0.4 -66% -21.0 1.3 141.1 -21.3 -9.0 2.8 38.4 Neutral
Rotork18% Actuators to control valves in water
treatment plants19.5 169% 54% 9.0 80% 4.0 1.9 19.0 0.6 1.6 2.8 2,435.0 Outperform
Gud Holdings 16% Pumps, water pressure systems 11.9 76% 49% 2.1 1% 8.2 9.3 10.3 -9.4 -0.8 3.1 8.1 Neutral
Halma 12%
Equipment for leak detection,
pressure measurement and quality
sensors
15.1 146% 35% 4.0 21% 5.3 2.4 7.2 -1.0 -1.0 2.9 419.2 Outperform
Melrose10% Metering through acquisition of
Elster13.6 117% 138% 3.4 135% 2.1 3.0 -7.4 -10.2 25.8 2.0 208.2 Neutral
Consensus
recommendation
(1=Buy; 5=Sell)
Share price,
local
currency (20
Nov)
-----P/E (12m fwd) ------ 2012e Momentum, %------ P/B ------- HOLT2012e, %
Source: MSCI, IBES, Thomson Reuters, Credit Suisse HOLT, Credit Suisse research
We highlight a special focus on irrigation as it both increases agricultural productivity and
improves the efficiency of water use. The stocks exposed here are: Lindsay, Jain Irrigation
and Eurodrip Irrigation System (all Not Rated).
Figure 55: Stocks with irrigation exposure
Name Abs rel to Industry
rel to mkt %
above/below
average
Abs
rel to mkt %
above/below
average
FCY DY
Price, %
change to
best
3m EPS 3m Sales Credit Suisse
rating
Lindsay Corp 17.3 142% na 3.0 166% 5.0 0.6 -4.5 0.1 na 2.5 74.7 Not Rated
Jain Irrigation Systems
Limited8.5 70% na 1.5 84% 25.4 1.7 105.2 -0.2 na 2.3 62.3 Not Rated
Eurodrip SA na na na 1.3 72% na na -55.9 na na na 1.4 Not Rated
Consensus
recommendation
(1=Buy; 5=Sell)
Share price,
local currency
(20 Nov)
-----P/E (12m fwd) ------ 2012e Momentum, %------ P/B ------- HOLT2012e, %
Source: MSCI, IBES, Thomson Reuters, Credit Suisse HOLT, Credit Suisse research
Credit Suisse offers a tradable index on global water plays (Bloomberg ticker: CSWTR).
More details can be found on the Credit Suisse Proprietary Indices website.

23 November 2012
Global Equity Strategy 43
6) Underleveraged banks in underleveraged
countries
We continue to believe that within banks the most attractive plays are those based in
countries where both aggregate leverage and financial product penetration rates are
relatively low. Low levels of private sector debt offer the prospect of profitable lending
growth, while low levels of government debt ensure that the risks to economic growth (and
by extension loan quality) from a period of harsh austerity are limited.
Net foreign assets is another critical component of macro risk, because if a country has
borrowed externally to finance its debt, then the risk associated with that country is
accordingly higher.
We construct a simple scorecard of emerging economies, ranking highly those countries
with low levels of private and government debt, high net external assets, low historical loan
growth rates (the lower the growth in credit, then again the better the asset quality) and
low financial product penetration (as proxied by life policies as a percentage of GDP).
Weighing these factors, Russia, Indonesia, the Philippines, and Mexico rank highly.
Figure 80: The Philippines, Chile, Russia and Mexico rank top on our scorecard of underleveraged economies
CountryPrivate credit, % of
GDP
Government debt,
% of GDP
Net external assets,
% of GDP
5-y loan
growth
Life premia, % of
GDP
GDP per capita,
USD
Weight 35% 20% 20% 5% 20%
Russia 51% 9.2% 1.1% 44% 0.0% 13,560 1
Indonesia 31% 20% -41% 23% 0.9% 3,690 2
Philippines 33% 49% -5.3% 4.0% 1.0% 2,450 3
Mexico 25% 39% -35% 15% 0.9% 10,050 4
Chile 61% 10% -4.9% 17% 2.3% 14,260 5
Egypt 31% 80% -19% 11% 0.4% 3,020 6
Turkey 54% 39% -44% 36% 0.2% 10,420 7
Overall
Rank
Note: A high value is considered positive for Net external assets; A low value is considered positive for private credit, government debt, loan growth and life premia.
Source: Thomson Reuters, Credit Suisse research
Our preference is for banks within these economies with relatively low leverage (as
proxied by an asset-to-equity ratio). We would highlight the following names which are all
either Outperform-rated or Neutral-rated by Credit Suisse analysts: Bank Negara,
Sberbank, Bank Central Asia, Bank Mandiri, Metropolitan Bank & Trust and Bank Rakyat.
Using valuation criteria, it is Sberbank and Negara who look cheap on P/E and P/TB.
Figure 81: Underleveraged banks in underleveraged countries
Company Country Market cap(USD) TA/TE Loans / deposits 12m fwd P/E Price / PPP P / tang bookPrice to
book
Share price local
currency (19 Nov)Recommendations
Bank Negara Indonesia Indonesia 7,101 8.5 78% 9.3 7.6 1.7 1.8 3,625.0 Outperform
Sberbank Russian Federation 62,680 8.3 107% 5.8 4.1 1.3 1.6 87.4 Outperform
G.F. Inbursa Mexico 18,072 3.8 125% 27.5 13.7 2.9 3.3 34.0 Neutral
Bank Central Asia Indonesia 20,932 8.6 69% 15.4 13.4 4.1 4.8 8,850.0 Outperform
Bank of Philippine Islands Philippines 7,277 9.8 71% 17.3 14.0 3.2 3.4 88.5 Neutral
Bank Mandiri (Persero) Indonesia 20,170 8.7 82% 12.0 9.4 2.6 3.2 8,500.0 Outperform
Metropolitan Bank & Trust Philippines 5,016 9.1 75% 13.6 10.0 1.9 2.0 95.0 Outperform
Bank Rakyat Indonesia Indonesia 18,025 8.4 81% 9.4 7.6 2.7 3.5 7,200.0 Outperform
Security Bank Corporation Philippines 2,014 6.2 75% 11.9 14.3 2.6 2.7 161.0 Neutral Source: MSCI, IBES, Thomson Reuters, Factset, Credit Suisse HOLT, Credit Suisse estimates

23 November 2012
Global Equity Strategy 44
7) Labour-intensive oilfield services
There are three main drivers of the call on OFS as growth:
1) Oil price stays above levels to leave high cost projects economic: We
believe that the oil price is unlikely to fall below $90 pb- the level requires to make
high cost marginal conventional projects economic and these high cost marginal
projects are in the opinion of the oil team needed to meet demand at c90mbd.
Figure 82: Oil production cost curve
0
20
40
60
80
100
120
75 80 85 90 95 100
Global Total hydrocarbon liquids produced-millions of barrels per day
16%
RO
CE
Bre
nt
pri
ce $
per
bo
e
Exceptional /
NOC
Traditional
Unconventional
Frontier
Brazil Presalt
Angola Deep Water
GOM Paleogene
Less efficient oil sands
More efficient oil sands
Less efficient GTL
Biofuels
GOM Miocene
Russia greenfield
Uneconomic
More efficient GTL
Source: Thomson Reuters, Credit Suisse research
Furthermore, we would point out:
■ The 5 year forward price has been a good predictor long term of spot prices and is
currently $91/bbl.
■ The budget break-even for Saudi Arabia and Russia is rising. Our energy-commodities
research head, Jan Stuart, expects the budget break even of Saudi to rise to $115-
130/bbl by 2015, depending on production. In Russia, the government budget
breakeven point is set to rise to $125/bbl next year. Essentially this means that even if
prices were to fall below $80-$90pb, there would be a very significant response to cut
back on production to support the price. Furthermore, most of global spare capacity is
controlled by Saudi Arabia (c2mbd), making its production policy one of the single
most important factors influencing the oil price.
■ On the supply side, prices remain supported by restricted access to resources (Saudi
Arabia, Venezuela, Russia,), political instability (Iraq, Nigeria, Libya, Iran, Sudan,
Yemen) and more restrictive or protective sovereign oil policy (Brazil) and production
is falling in mature oil fields (with 3% of global oil supply capacity being lost every year
due to natural decline).
■ Although Chinese oil demand has grown by an average of 2.7% over the past 30
years (compared with 0.4% in the US), oil consumption per capita in China is still only
a tenth of the US level while steel consumption per capita is 1.5x the US level.

23 November 2012
Global Equity Strategy 45
2) Oil companies set to increase capex significantly further.
Given the current level of the oil price, we would expect capex to rise from its current level,
as illustrated below.
Figure 83: Oil majors’ profitability continues to be high Figure 84: Capex to sales of global IOCs
Source: Company data, Credit Suisse estimates Source: Company data, Credit Suisse estimates
3) On our calculations, the oilfield service stocks have a beta of around 1.6x to
the market (and thus sell off when the market sells off, as investors anticipate
that weaker economic growth will lead to a fall in the oil price) – but ironically a
beta of only 0.7x versus the oil price. This means, in periods of equity market
weakness, the structural growth story of the oilfield service stocks is being
‘undervalued’ by the market.
Figure 85: Global OFS beta with oil price is about 0.7x, while the beta with markets is
about 1.6x
-0.5
0.0
0.5
1.0
1.5
2.0
1999 2001 2003 2005 2007 2009 2012
Global OFS, 12m rolling beta w ith crude oilWith w orld market
Source: Thomson Reuters, Credit Suisse research
European OFS companies trade on a P/E relative to the market close to their historical
average levels (they are trading at a 7% premium to the market, compared with an
average premium of 13%), while US OFS companies are almost one standard deviation
cheap.

23 November 2012
Global Equity Strategy 46
Figure 86: 12m fwd P/E relative of European OFS Figure 87: 12m fwd P/E relative of US OFS
40%
60%
80%
100%
120%
140%
160%
180%
200%
1990 1993 1997 2001 2004 2008 2012
European OFS 12m fw d P/E rel Europe market: 107%
Av erage (+/- 1SD)
35%
60%
85%
110%
135%
160%
185%
210%
1990 1993 1997 2001 2004 2008 2012
US OFS 12m fw d P/E rel
US marketAv erage (+/- 1SD)
Source: Thomson Reuters, Credit Suisse research Source: Thomson Reuters, Credit Suisse research
Stock picks
We show our analysts’ top picks among the global oilfield services stocks below. Our
analysts especially like firms in the labour intensive part of the cycle, which are Amec,
Petrofac and PGS.
Figure 88: Global Outperform rated OFS picks
Name Abs rel to Industry
rel to mkt %
above/below
average
Abs
rel to mkt %
above/below
average
FCY DY
Price, %
change to
best
3m EPS 3m Sales Credit Suisse rating
Halliburton 10.5 99% -27% 2.2 -31% -2.2 1.1 38.6 -6.1 0.2 1.9 31.7 Outperform
Amec 11.8 111% 19% 2.6 -17% 4.1 3.1 -3.5 -2.8 5.5 2.3 1,024.0 Outperform
Petrofac 12.3 116% 11% 7.1 27% -0.2 2.5 56.5 -0.7 -1.7 2.3 1,574.0 Outperform
Saipem 14.2 133% 18% 3.3 28% 6.2 2.1 -33.6 -2.9 1.5 2.1 32.7 Outperform
Aker Solutions 10.8 102% 29% 2.7 -10% -4.3 3.0 0.0 4.1 5.8 1.9 106.1 Outperform
Petroleum Geo
Services11.6 110% -72% 2.1 -55% 2.8 1.4 -21.2 26.8 3.4 1.9 97.5 Outperform
Consensus
recommendation
(1=Buy; 5=Sell)
Share price,
local currency
(20 Nov)
-----P/E (12m fwd) ------ 2012e Momentum, %------ P/B ------- HOLT2012e, %
Source: MSCI, IBES, Factset, Thomson Reuters, Credit Suisse HOLT, Credit Suisse research

23 November 2012
Global Equity Strategy 47
8) Energy efficiency
There are two trends which, in our view, are likely to make this an area of structural
growth.
■ We think the price of power/energy is set to remain high, benefiting products
that enhance energy efficiency;
We think that the oil price, as discussed in the section on oilfield services, is unlikely to fall
significantly below $90 per barrel.
The European Union has a stated goal of increasing the share of renewable energy in
gross final energy consumption, from its current share of 12.5% to 20% by 2020. As the
International Energy Agency notes, “economic barriers” to greater use of renewable
energy remain, barriers which would only be overcome by a higher power price.
Electricity production is likely to be abnormally high cost because the low-cost areas
(particularly coal and nuclear) are being increasingly shut down by governments for a
combination of environmental and safety reasons and replaced by much higher-cost
renewables. This in turn pushes up the price of electricity.
The BDI (the German industry federation) estimates that the price of electricity is likely to
rise c20% by 2020 as a result. Our European utility team highlight the cost of renewable
subsidies—as defined by the excess of renewable remuneration above the baseload
power price—has risen to c€32bn p.a. across the five largest EU power markets: and that
the PDV of charges that the consumer will incur is c€422bn (c74%) through higher bills.
This equates to c5% of GDP!
Figure 89: The European Union has a target to increase the share of renewable energy in
final energy consumption from 12.5% currently to 20% by 2020
6.0
8.0
10.0
12.0
14.0
16.0
18.0
20.0
1990 1992 1994 1996 1998 2000 2002 2004 2006 2008 2010
Electricity generated from renewable sources (%)
Share of renewable energy in gross final energy consumption (%)
Source: Eurostat, Credit Suisse research
■ Regulation is likely to force even more improvements in energy efficiency
■ In the long run, Carbon emission prices must rise.
We would note that the carbon price has fallen by around 60% over the past four years as
the slowdown in economic activity has reduced industrial emissions more than widely
expected, contributing to a further oversupply of carbon allowances. However, to boost
energy efficiency production processes, the European Commission seems determined to
support the price of carbon.

23 November 2012
Global Equity Strategy 48
The EC has already announced that the sale of 900 million additional carbon allowances
will be delayed—this was previously to take place in 2013–15, and in a recent report (The
state of the European carbon market in 2012, released on 14 November 2012), the EC put
forward six proposals to address the supply/demand imbalance including the possible
cancellation of a large number of allowances, or the withdrawal of a proportion of permits
when the price falls below a certain, albeit unspecified, level.
As our European Utilities team notes the outlook for the carbon price is consequently
uncertain in the near term, but it seems clear that the European regulators of the carbon
market are ultimately determined to push it higher in order to drive energy efficiency, even
if their policy approach is still to be finalised. Additionally, we would note that even in the
US the idea of taxing carbon as a source of raising revenue is gaining traction.
Growth areas to focus on:
Our Capital Goods analysts expect that sales in the energy-efficiency space have a beta
of 2x GDP over the next three years. They highlight the following growth areas:
■ Smart building technology where the localised controls and monitoring allow
building managers to adjust the heating and lighting requirements to the needs of the
local environment. Solution packages offered by companies such as Schneider are
now able to achieve energy savings of 20–30% with payback periods of 1–3 years.
Company plays: In Europe, Schneider’s buildings division is 7% of sales which is
directly associated with building efficiency. However, most products sold into buildings
(via divisions other than the Buildings division) are energy efficiency related, and of
group sales, 9% is to residential buildings and 30% to non-residential. In the US, our
analysts would highlight Honeywell and JCI, and in Japan Daikin.
■ In data centres, electricity accounts for c10% of operating costs. Hence, there is great
interest in technologies which reduce energy consumption. Innovations include 'in
rack' cooling for servers which reduce the energy used to cool the whole data centre
environment and the use of direct current (DC) electricity to reduce energy losses
related to voltage transformation in an AC system.
Company plays: Schneider’s IT division is 13% of group sales and the key end market
for this division is data centres. In the US, our analysts would highlight Emerson and
Eaton.
■ Solid state lighting where the replacement of incandescent lighting technologies with
LED solutions offers potential energy savings of over 80%.
Company plays: In Europe, LED is 20% of Philips’ lighting sales or 7% of group sales.
In the US, our analysts would highlight CREE.
Based on these growth areas, we highlight our analysts’ preferred plays on energy
efficiency below.

23 November 2012
Global Equity Strategy 49
Figure 90: US and European plays on energy efficiency within the industrials universe
Name
% revenue from
energy
efficiency
technology
Absrel to
Industry
rel to mkt %
above/below
average
Abs
rel to mkt %
above/below
average
FCY DY
Price, %
change to
best
3m EPS 3m Sales Credit Suisse
rating
Schneider Electric 52% 12.1 104% 1% 1.7 4% 5.8 3.5 43.5 -0.8 -0.3 2.8 51.6 Neutral
Eaton n/a 11.2 97% 21% 2.2 8% 6.1 3.1 32.9 -4.8 -5.8 2.0 50.7 Neutral
Emerson Electric n/a 13.6 118% 2% 3.5 2% 7.1 3.2 16.3 -1.5 -2.0 2.3 48.6 Outperform
Honeywell Intl. n/a 12.7 110% 10% 4.5 33% 6.2 2.4 10.4 -0.4 -1.4 2.0 60.6 Neutral
Philips
Eltn.Koninklijke
7% 13.0 113% 19% 1.6 2% 7.5 3.7 5.6 -1.1 3.6 2.6 19.9 Neutral
Johnson Controls n/a 9.4 117% -5% 1.6 -12% 9.4 2.6 1.9 -11.8 -4.3 2.5 26.8 Outperform
Daikin Industries n/a 11.8 102% -44% 1.3 -34% 5.4 1.7 -1.5 -7.9 -1.3 2.5 2,575.0 Neutral
Cree n/a 22.4 160% -21% 1.4 -51% 3.1 0.0 -8.4 -9.3 -5.3 2.3 30.9 Neutral
Consensus
recommendation
(1=Buy; 5=Sell)
Share price,
local
currency (21
Nov)
-----P/E (12m fwd) ------ 2012e Momentum, %------ P/B ------- HOLT2012e, %
Source: MSCI, IBES, Thomson Reuters, Credit Suisse HOLT, Credit Suisse estimates

23 November 2012
Global Equity Strategy 50
9) Reducing car emissions
Closely related to the theme of energy efficiency within industrial processes is the theme
of greater energy efficiency within the auto industry. We think this will become much more
important as urbanisation rates increase and cars per capita rise in emerging markets. In
China, for example, cars per capita are only around one fifth of US levels, while in India
cars per capita are around 2% of US levels.
The impact of emissions legislation on the auto industry
Our Autos team highlights that the European Commission is capping emission at 130g of
CO2/km by 2015 and 95g/km by 2020. These targets represent reductions of 18% and
40%, respectively, compared with the 2007 fleet average of 158.7g/km.
We also believe the average age of the auto fleet cannot get much higher in the US (it is
already at a 17-year high of 11 years); replacement demand alone would underpin US car
sales at 12.5m.
Our Autos team have previously highlighted that within the autos universe, products
relating to fuel efficiency account for 100% of BorgWarner revenues, 70% of those of
ElringKlinger and 30% of those of Continental.
Our European Chemicals team highlights that increasing emissions legislation on
petrochemical car engines, primarily within Europe and China, should drive demand for
next-generation automotive technology. Our analysts highlight both Umicore and Johnson
Matthey as being potential beneficiaries of this theme, with Umicore focusing on the
production of electric vehicles and Johnson Matthey more focused on fuel cells.
Umicore: About 35% of revenues come from the manufacture of catalysts to reduce
emissions from light-duty vehicles. A further 20% of revenues come from the Energy
materials division which produces electric battery materials for cars and other energy-
related materials. In addition, Umicore has built the first full-scale EV battery recycling
plant.
Johnson Matthey: 70% of JMAT’s revenues come from catalyst technology, of which
around 80% is from auto catalysts (70% car and 30% truck markets) and 20% from
stationary catalysts used in industrial processes. Johnson Matthey is also investing in fuel
cell catalyst technology for zero-emission vehicles (a venture which our analysts point out
is currently loss making).
Figure 91: Plays on reduced auto industry emission norms
Name
% revenue from
energy
efficiency
technology
Absrel to
Industry
rel to mkt %
above/below
average
Abs
rel to mkt %
above/below
average
FCY DY
Price, %
change to
best
3m EPS 3m Sales Credit Suisse
rating
Continental 30% 7.4 92% -8% 2.2 37% 5.9 2.4 97.9 8.5 -0.1 2.2 80.0 Outperform
Borgwarner 100% 11.9 149% 27% 3.0 88% 5.8 0.0 26.8 -7.1 -6.9 2.2 63.7 Neutral
Johnson Matthey 70% 13.7 107% 28% 3.2 40% na 2.5 8.0 -5.4 -4.2 2.6 2,190.0 Outperform
Umicore 55% 14.9 131% 47% 2.7 75% 3.6 2.6 -14.4 -4.0 -2.3 2.7 39.4 Neutral
Consensus
recommendation
(1=Buy; 5=Sell)
Share price,
local
currency (21
Nov)
-----P/E (12m fwd) ------ 2012e Momentum, %------ P/B ------- HOLT2012e, %
Source: MSCI, IBES, Thomson Reuters, Credit Suisse HOLT, Credit Suisse estimates

23 November 2012
Global Equity Strategy 51
10) Specific plays on the internet – in
particular, e-financial services
The idea of the internet emerging as a growth theme may be nearly 15 years old, but we
believe that there remain growth opportunities.
Internet retail sales have seen a CAGR of 18% in the US over the past decade and 23% in
the UK since the ONS began to track the data five years ago.
Despite this strong growth, US internet sales still only accounted for 5.1% of total retail
sales in the second quarter of this year (the latest for which we have data). In the UK,
internet sales accounted for 8.8% of all retail sales in September. Were US internet sales
to rise to account for the same proportion of total retail sales as that in the UK, it would
imply a further 72% rise from their current level.
Figure 92: Annual internet sales growth has stabilised at
around 10–15% in the UK and US…
Figure 93: …leading internet retail sales to account for a
steadily growing share of total retail sales
-10%
0%
10%
20%
30%
40%
50%
60%
70%
80%
2000 2001 2002 2003 2004 2005 2006 2007 2008 2009 2010 2011 2012
US internet retail sales % chg Y/Y
UK internet retail sales % chg Y/Y
0
1
2
3
4
5
6
7
8
9
10
2000 2001 2002 2003 2004 2005 2006 2007 2008 2009 2010 2011 2012
US internet retail sales % total
UK internet retail sales % total
Source: Thomson Reuters, Credit Suisse research Source: Thomson Reuters, Credit Suisse research
In certain categories in the UK, most notably music & video and books and electricals, the
internet has very high penetration rates, accounting for 70%, 40% and 33% of total sales
in each of these categories, respectively. In the remaining categories of goods, however,
penetration rates are at most 10% of total sales, suggesting scope for rates to rise across
the board.

23 November 2012
Global Equity Strategy 52
Figure 94: Music, books and electricals stand out in terms of internet penetration; the
other categories lag notably behind
% of sales online 2006 2007 2008 2009 2010 2011
Music & Video 18.2 25.8 36.0 47.7 59.9 69.9
Books 18.1 19.6 23.2 28.3 35.1 39.3
Electricals 11.8 15.3 19.4 23.8 27.9 32.7
Clothing & footw ear 3.2 4.2 5.7 7.1 8.7 10.6
Homew ares 5.9 7.7 8.3 8.7 9.0 9.7
DIY & Gardening 4.0 4.9 5.2 5.2 5.5 5.4
Furniture & floorcov erings 2.7 3.8 3.9 4.1 4.2 5.0
Food & grocery 1.9 2.5 3.0 3.4 3.9 4.4
Health & beauty 1.8 2.2 2.7 3.2 3.7 4.3
Other markets 3.7 4.8 5.8 8.0 9.8 11.6
Total retail 3.8 4.9 6.0 7.0 8.1 9.3 Source: Verdict Research
There are three particular general plays we have on the internet:
Google, the leader in online advertising. Our US Consumer Internet research team, led by
Stephen Ju, believes that the core global search market can sustain 12–13% compound
annual volume growth over the next five years. Our analysts also highlight the
comprehensive mobile presence being built by Google, placing it at the centre of the
mobile internet ecosystem. They believe that Google is poised to materially grow its share
in online display advertising, which should add an estimated 100bps to annual revenue
growth, in their view. As a result of these factors, they forecast revenue growth in the mid-
to-high teens on a compound annual rate over the next five years.
Amazon: Our US Consumer Internet analysts also have an Outperform rating on Amazon.
They see scope for margin expansion as digital media and web services account for a
large proportion of the company’s sales. They also highlight the prospect of further
fulfilment productivity gains, with new fulfilment centres having opened over the past two
years enabling the company to generate cost savings by having additional facilities closer
to end customers. As a result, they consider Amazon a long-term core holding, given its
growth prospects in e-commerce and its long-term strategic orientation.
This theme, and the greater use of parcels it entails, reinforces the case for the logistic
plays, discussed in more detail in our section on global trade. We continue to see UPS as
a preferred play on this theme owing to their legacy businesses.
Moneysupermarket.com: An additional area we would highlight is financial
disintermediation. We believe that regulation will continue to drive more price visibility in
the financial services industry and this will not only expose the high fees that are hidden
when products are bought via traditional aggregators (such as insurance companies), but
should also increase the comfort level with buying a product via the internet.
The data below show the significant potential for growth which remains within certain
categories of online financial products in the UK. In the case of car insurance, online
providers already capture 80% of the churn in the motor insurance market, a significantly
higher proportion than in any other category. In other relatively high-churn categories,
such as home insurance and loans, less than 50% of new or switched policies are
captured online, implying significant growth potential. Growth in the online share of new or
switched home insurance policies and loan sales has been 11% and 18%, respectively, on
a CAGR basis between 2009 and 2011.

23 November 2012
Global Equity Strategy 53
Figure 95: UK financial product sales via the internet
Channel Market New/Switchers Policy churn Online new/switchers % new/switchers Online new/switchers
policies policies/yr rate (%) policies/yr captured online CAGR % 09-11
(millions) (millions) (million)
Motor insurance 24.0 10.3 43% 8.2 80% 9.0%
Home insurance 18.0 4.3 24% 2.0 47% 10.7%
Trav el insurance 20.0 11.4 57% - - -
Sav ings 63.0 9.3 15% 2.5 27% 16.9%
Credit Cards 33.0 4.5 14% 2.2 49% 8.4%
Loans 5.0 1.0 20% 0.3 30% 18.4%
Energy 31.0 5.7 18% 1.3 23% 2.9% Source: Moneysupermarket.com, Credit Suisse research
We would focus on moneysupermarket.com. Our European Media team believes that
13.4x 2013E P/E, just an 8% premium to the wider European media sector, is too cheap
for a company likely to continue to grow significantly quicker than the wider European
media sector owing to its exposure to structurally intact internet-based revenues.
Figure 96: Internet retailing and services plays
Name Abs rel to Industry
rel to mkt %
above/below
average
Abs
rel to mkt %
above/below
average
FCY DY
Price, %
change to
best
3m EPS 3m Sales Credit Suisse
rating
Amazon.Com 142.3 850% 163% 13.6 -58% 1.5 0.0 -18.1 -97.1 -1.9 2.0 233.8 Outperform
Moneysupermarket
Com Gp.14.3 105% 34% 4.4 98% 5.4 3.7 -5.5 3.4 0.5 2.3 155.2 Outperform
Google 'A' 15.0 110% -26% 3.8 -29% 5.9 0.0 35.1 -7.9 -3.1 1.9 670.0 Outperform
Fedex 13.0 97% 7% 2.0 1% 1.5 0.6 -35.8 -14.5 -1.4 1.8 87.4 Neutral
United Parcel Ser.'B' 14.5 107% -7% 10.1 62% 6.3 3.1 -6.1 -4.9 -2.8 2.3 71.3 Outperform
Consensus
recommendation
(1=Buy; 5=Sell)
Share price,
local currency
(20 Nov)
-----P/E (12m fwd) ------ 2012e Momentum, %------ P/B ------- HOLT2012e, %
Source: MSCI, IBES, Thomson Reuters, Credit Suisse HOLT, Credit Suisse estimates
23 November 2012
Global Equity Strategy 54
11) Ageing in emerging markets
The segment of the emerging market population aged over 65 is forecast by the UN to
grow by 4.5% a year until 2020, compared with a 2.3% growth rate in developed markets.
We would highlight healthcare as a key beneficiary, given that the proportion of household
expenditure spent on healthcare for the over 65s is 79% higher than for the 55–64 age
group.
Figure 97: Developing markets 65+ age group is set to
grow at twice the rate of developed markets
Figure 98: Spending on healthcare rises sharply once
people start to age
0
2
4
6
8
10
12
14
16
18
20
2010 2015 2020
More developed regions Less developed regions
% of population aged 65 or over
4.5% CAGR
2.3% CAGR
0
2
4
6
8
10
12
14
16
45–54 55–64 65 and over 65–74 75 and over
Percentage of US Total Household Expenditures Spent on Healthcare by Age - 2008
Source: UN, Federal Interagency Forum on Ageing Related Statistics,
Credit Suisse Demographics Research
Source: UN, Federal Interagency Forum on Ageing Related Statistics,
Credit Suisse Demographics Research
Even as the population ages, healthcare spending as a percentage of GDP tends to be
low within emerging markets, even adjusted for the lower level of per capita income.
Figure 99: Healthcare spending is low as a % of GDP in emerging markets given GDP per
capita
Australia (67,983, 9.1)
AustriaBelgium
Canada
Chile Czech Republic
Denmark
Estonia
Finland
FranceGermany
Greece
Hungary Iceland
Ireland
Israel
Italy Japan
KoreaMexico
Netherlands
New Zealand
Norway (99,316, 9.4)
Poland
Portugal
Slovak Republic
Slovenia
Spain Sweden
Switzerland (77,840, 11.4)
Turkey
UK
US
Middle East& North Africa4
6
8
10
12
14
16
10,000 15,000 20,000 25,000 30,000 35,000 40,000 45,000 50,000 55,000 60,000
GDP PC, USD
Hea
lth
care
exp
end
itu
re, %
of
2011
Source: OECD, IMF, Credit Suisse research

23 November 2012
Global Equity Strategy 55
Big cap pharma exposure
Of the big cap European and US pharma companies, Sanofi and Novartis have the
highest proportion of sales from emerging markets. IMS Health estimates that emerging
markets will double their spending on drugs, adding $150bn of sales by 2015, with 20% of
this increase coming from branded drugs. Figure 101 shows a reasonable correlation
between Credit Suisse’s estimate of 2012–15 average annual EPS growth and the 2012e
P/E of large cap pharma companies.
Figure 100: Sanofi and Novartis have the highest
proportion of sales from emerging markets
Figure 101: P/E (x) vs growth scatter of global pharma
28%
24%23% 23%
22%
20% 20%19%
17%
12%
5%
10%
15%
20%
25%
30%
San
ofi
Nov
artis
GS
K
Mer
ck
Pfiz
er
Abb
ott
Roc
he
AZ
N
J&J
Lilly
% of sales from emerging mkts
SASY.PAPFE
BAYGn.DE
NOVOb.CO
MRK
LLY
BMY
NOVN.VX
ROG.VX ABT
GSK.L
JNJ
AZN.L
5
7
9
11
13
15
17
19
21
23
25
-5% 0% 5% 10% 15% 20%
PE
201
2e
EPS growth 2012-15e
Source: IMS Health 2010 data Source: Thomson Reuters, Credit Suisse
For big cap pharma, we highlight that margins within emerging markets tend to be higher
than might initially be assumed by investors. Typically, pricing is lower (with sales
concentrated in generic drugs), but so are the R&D and other associated costs (because it
tends to be the more mature drugs that are sold in emerging markets). GSK reported that
actual core operating margins in emerging markets and Asia Pacific are around 32% (as
reported in Q2 12), admittedly lower than the 50% margin for its European business, but
not as low as some investors may presume.
We believe the legacy business of big cap drugs is ex-growth. Branded drug prices in the
US are nearly double those in Europe. This is unsustainable when drugs account for 10%
of US healthcare spending and US healthcare spending is 16% of GDP, and Medicare is
due to go into deficit in 2020. In addition, big cap drug companies have the problem of
patent expiries only just being offset by new products, as R&D efficiency has continued to
fall. Above all, the sector is still highly reliant on government spending, with 45% of
revenue in the US from governments and close to 80% in Europe.

23 November 2012
Global Equity Strategy 56
Figure 102: Branded drug prices in the US are double
those of the Europe
Figure 103: R&D efficiency has been on a downtrend for a
long time
0
0.2
0.4
0.6
0.8
1
1.2U
S
Ger
man
y
Sw
itz
Can
ada
Sw
eden
Fra
nce
Italy
UK
Bra
nd d
rug
pric
e in
dexe
d to
US
pric
es
2005 2010
0.5
1.0
1.5
2.0
2.5
3.0
3.5
1985 1989 1993 1997 2001 2005 2009
0%
2%
4%
6%
8%
10%
12%
14%
16%
18%
R&D as % of sales ( no lag) EU majorUS major
Sal
es/c
apita
lised
R&
D (
lines
) R&
D as %
of sales (bars)
HOLT Pharma R&D returns. Sales/Capitalised R&D w ith 4 y r lag. Index of
returns falls from >U$2 per R&D dollar inv ested to U$1.3
Source: The Patented Medicine Prices Review Board, Credit Suisse
research
Source: Credit Suisse Pharma research team
Diabetes
We believe diabetes will be a key area of focus in the emerging markets. It is a disease
area which is widely expected to grow significantly with the increasing prevalence of
obesity in emerging markets; according to Sanofi, obesity has tripled in China since 2002.
Our analysts believe that diabetes drug sales could grow by 7% a year (2011–2016E).
Sanofi had 17% of pharmaceutical sales from diabetes drugs in 2011, Novo Nordisk has
70% of sales and Eli Lily has 20% of sales.
Generics
We also continue to favour the generic story, with IMS Health forecasting 4–5% p.a.
growth for generic drug sales through to 2015. The drivers are: i) patent expiries; ii)
emerging market growth, with 80% of the incremental sales in emerging markets by 2015
expected to come from generic drugs (c$120bn); iii) increased penetration in Europe and
Japan (given that the penetration rate of generics in many European countries is below
30%, compared with 70% in the US).

23 November 2012
Global Equity Strategy 57
Figure 104: Most Western European countries have very
low generic penetration rates
Figure 105: Healthcare spend as a % of GDP
0%
10%
20%
30%
40%
50%
60%
70%
80%
Pol
and
US
Ger
man
y
UK
Tur
key
Net
herla
nds
Sw
eden
Hun
gary
Aus
tral
ia
Fra
nce
Japa
n
Spa
in
Bra
zil
Bel
gium Ita
ly
Por
tuga
l
Irel
and
New
Zea
land
Generic utilisation by volume
-1
1
3
5
7
9
11
13
15
17
ME
NA
BR
IC
Me
xico
Ko
rea
Jap
an UK
Italy
Ge
rman
y
Sw
itze
rlan
d
Fra
nce US
Healthcare spending, % of GDP
Source: Company data, Credit Suisse US Specialty Pharma research
team
Source: World Bank
Our South African Healthcare analyst, Mark Wadley, highlights Hikma as a growth stock
for the following reasons:
Geographic footprint that dominates the MENA region – a very low penetration rate as
above in terms of both drugs and healthcare as a percentage of GDP. Not only is
consumption of pharmaceutical products (prescription and OTC) increasing, but also the
type of drug spend is changing to more chronic and lifestyle-related illnesses, which
reflects the ageing of the population. For Hikma, for instance, we have seen the group
moving from having had a drug portfolio mostly made up of anti-infective drugs to one
which is now more balanced (and which includes chronic medications). MENA makes up
c60% of revenue and c65% EBIT for the group.
Acquisitions –the group has also being growing by acquiring businesses within the
MENA region. While Hikma now has a footprint across the whole of the MENA region, it is
still sub-scale (has small market share positions) in some of the large MENA markets like
Egypt and Saudi Arabia. We think the company may still look to acquire / consolidate
within some of these countries, which should continue to drive further growth.
In addition to those parts of health care benefiting from exposure to emerging markets, we
would highlight the following further growth themes in the sector:
Healthcare equipment
Innovation, favourable demographics and emerging markets are important growth drivers
for healthcare equipment and service companies. In certain market segments, primarily
with reimbursed products, price competition has intensified recently and is likely to stay
intense in light of healthcare reform work and likely more government austerity measures.
Yet, price pressure is lower in market segments where products are mainly privately
funded.
In this context, we highlight the hearing device sector, which has two key advantages. First,
c10% of the population within the developed world have a hearing problem, while only
roughly a fifth of those patients currently use a hearing device, thereby leaving substantial
room for patient growth. Second, c90% of sales are funded by private individuals and thus

23 November 2012
Global Equity Strategy 58
the direct public funding exposure is limited. Our analysts would highlight Sonova, in
particular.
We also highlight Fresenius Medical Care. We see attractive growth prospects as the
company benefits from the increasing prevalence of end-stage renal disease in the US,
but also globally, and the corresponding patient growth in dialysis care. Mid-term, we also
see substantial margin expansion opportunities by reducing drug expenses.
Therapeutic medical equipment
Therapeutic medical equipment has the highest 10-year growth rate of any of the
healthcare-related components of US consumer spending, with a 10yr CAGR of 6.5%
(currently 7.8%). Credit Suisse’s US healthcare equipment team highlights Volcano and
Heartware (number 1 and number 2 players in their respective markets) as their preferred
Outperform-rated growth stocks, with projected 10%+ revenue growth in the next five
years.
Outsourcing healthcare
Our US Managed Health Care team believes that Managed Care Organisations (MCOs)
will take advantage of increasing public-private partnerships in Medicare, Medicaid and
Dual Eligibles. MCOs stand between the buyers and the providers of healthcare. Of the
$2.8trn in annual health spending in the US, 71% is addressable by MCOs and of that,
penetration is c60%. With major healthcare reform provisions taking place beginning in
2014, coverage will be expanded to those who are currently uninsured, which is estimated
by the team to add 14m new customers (30m by 2022) to the Medicaid and Health
Insurance Exchange markets.
Their top pick in Managed Care is Cigna (CI) and they also rate UnitedHealth (UNH)
Outperform.
Stock screen
We show a screen with selected health care growth stocks below.
Figure 106: Healthcare growth plays
Name Abs rel to Industry
rel to mkt %
above/below
average
Abs
rel to mkt %
above/below
average
FCY DY
Price, %
change to
best
3m EPS 3m Sales Credit Suisse
rating
Sanofi 11.1 90% -26% 1.6 -64% 8.5 4.0 19.5 3.0 0.8 2.1 68.1 Neutral
Novo Nordisk 'B' 20.9 169% 34% 13.7 207% 3.5 1.8 -19.5 5.1 3.6 2.4 907.0 Neutral
Eli Lilly 13.1 105% -14% 4.2 -44% 7.8 4.0 54.8 2.2 -0.9 2.7 47.4 Outperform
Hikma Pharmaceuticals 16.7 135% 25% 2.9 14% na 1.2 -14.4 -0.4 0.2 2.2 738.0 Outperform
Sonova N 18.3 142% -10% 4.4 -22% 4.3 1.4 42.8 0.7 0.2 2.4 100.6 Outperform
Fresenius Med.Care 16.3 126% 2% 2.6 19% 4.5 1.4 -11.3 -1.9 -1.1 2.4 51.6 Outperform
Volcano 62.6 484% -11% 4.5 30% 0.8 0.0 -65.8 -16.7 -1.8 1.9 26.9 Outperform
Heartware International -32.1 nm na 9.4 54% na 0.0 -63.5 nm 3.1 2.1 81.6 Outperform
St.Jude Medical 10.7 83% -30% 2.8 -26% 8.5 2.3 93.3 0.1 -1.3 2.4 31.4 Neutral
Cigna 8.6 67% 5% 2.0 3% 13.2 0.1 63.2 3.9 -3.5 1.9 52.0 Outperform
Unitedhealth Gp. 10.2 79% -15% 2.1 -26% 11.2 1.4 61.7 5.3 -0.2 1.8 53.5 Outperform
Consensus
recommendation
(1=Buy; 5=Sell)
Share price,
local currency
(21 Nov)
-----P/E (12m fwd) ------ 2012e Momentum, %------ P/B ------- HOLT2012e, %
Source: MSCI, IBES, Thomson Reuters, Credit Suisse HOLT, Credit Suisse research
Direct Asian plays on an ageing emerging market population
Below, we show those companies that according to the Credit Suisse Asian equity
research department are best placed to take advantage of an ageing emerging market
population.

23 November 2012
Global Equity Strategy 59
Figure 107: Stocks that could benefit from an ageing emerging market population
Name Abs rel to Industry
rel to mkt %
above/below
average
Abs
rel to mkt %
above/below
average
FCY DY
Price, %
change to
best
3m E
PS
3m S
ales
Consensus
(buy less holds
& sells)
Credit Suisse
rating
China Life Insurance
Co Ltd17.7 182% 10% 2.6 -13% na 1.12 -49.9 -29.4 -4.0 2.7 22.4 Neutral
Ping An Insurance
(Group) Company Of 13.8 142% -20% 2.8 -17% na 1.00 -43.6 -2.4 -4.1 2.2 58.2 Outperform
Sinopharm Group Co 21.4 166% -5% 3.3 -5% na 0.98 -24.2 0.0 3.3 2.0 24.5 Outperform
Mindray Medical Intl 17.1 118% -5% 3.4 -29% na 1.21 8.2 2.6 1.2 2.1 33.4 Outperform
Aia Group Ltd 17.6 182% 51% 2.3 35% na 1.20 -32.9 0.6 -8.4 2.0 30.3 Outperform
Prudential Plc 11.4 118% 7% 2.4 -18% 5.89 3.07 -33.8 0.6 1.4 2.2 889.0 Outperform
Share price,
local currency
(20 Nov)
-----P/E (12m fwd) ------ Momentum------ P/B ------- HOLTYield (2011e)
Source: MSCI, IBES, Thomson Reuters, Credit Suisse HOLT, Credit Suisse estimates

23 November 2012
Global Equity Strategy 60
12) Software
Software has been our largest sector overweight since July 2009 and we believe it is a
growth sector for the following reasons:
■ Software has enjoyed particularly high sales and EPS growth rates over the last
5 years.
Figure 108: Five-year CAGR of EPS growth versus sales growth
Utilities
Transpt TobaccoTech H/W
T/Cm Sv s
Softw are
Semis
Retail
Pharm
Pap/For
Met & Min
Media
MarketHH Prd
H/C Eq/Sv sFd/Drug Rtl
Fd PrdEnergy
Hot & Lei
Cons DurCon Mat (-45%, -7.3%)Comm/Prof
Chem
Cap Gds
Bev erages
Autos-18%
-14%
-10%
-6%
-2%
2%
6%
10%
14%
-15% -10% -5% 0% 5% 10% 15% 20%
US sectors CAGR, last 5 years
EPS
Sal
es
Source: Thomson Reuters, Credit Suisse research
Sales growth on top-down data has been close to 16% over the past 17 years.
Figure 109: US software yoy sales growth versus the
market since 1995
Figure 110: US software sector CAGR sales (1995-2012E):
15.5%, among the highest within tech
-10
-5
0
5
10
15
20
25
30
1995 1997 1998 2000 2001 2003 2004 2005 2007 2008 2010 2011 2012
Softw are Market
US sector sales grow th, YoY, %
45.8
15.5
11.09.6 8.9
2.5
4.5
0
10
20
30
40
50
Int
S/W/Sv s
Softw are Comp &
Per
Semis IT Comms
Eq
Off Eltro
US sectors, sales CAGR, 1995-2012, %
Market = 8.1
Source: Thomson Reuters, Credit Suisse research Source: Thomson Reuters, Credit Suisse research
■ The tech share of GDP is still low, with tech accounting for 34% of total business
investment against a trend line that suggests it ought to be closer to 41%.

23 November 2012
Global Equity Strategy 61
Figure 111: The net tech share of GDP is still low Figure 112: Tech spending is below trend
-0.5%
0.0%
0.5%
1.0%
1.5%
2.0%
1929 1943 1957 1970 1984 1998 2011
US Net tech inv estment, % of GDP
5%
10%
15%
20%
25%
30%
35%
40%
45%
1961 1969 1978 1986 1995 2003 2012
US Tech spending, % total non-res.inv estment
Trend
Source: Thomson Reuters, Credit Suisse research Source: Thomson Reuters, Credit Suisse research
■ Data (total global IP traffic) is likely to see growth of 29% per year over the next
five years, according to Cisco VNI (Visual Networking Index).
Our US software analyst, Philip Winslow, particularly stresses the innovation of Big Data
(the number of devices is likely to triple over the next four years, according to our tech
team) and Fast Data (the ability to analyse unstructured data, owing to the move away
from HDD to NAND and Flash storage, where response times fall exponentially, allowing a
significant increase in the number of applications).
Figure 113: Mobile traffic to grow at 52% CAGR over 2011-
2017E
Figure 114: Devices shipments for tablets and
smartphones (2011-2015E)
0
1,000
2,000
3,000
4,000
5,000
6,000
7,000
2011 2012 2013 2014 2015 2016
Data - Mobile PCs / Tablets Data - Mobile Phones Voice
Pet
aByt
es p
er m
onth
473
674
8501,003
1,12566
110
170
247
328
0
200
400
600
800
1,000
1,200
1,400
1,600
2011 2012 2013 2014 2015
Tablets Smartphones
Dev
ice
ship
men
ts (
mn)
Source: Company data, Ericsson Traffic and Market Report, Credit
Suisse Tech Team research
Source: Company data, Ericsson Traffic and Market Report, Credit
Suisse Tech Team research
■ Software has high barriers to entry caused by:
(i) A high cost of switching to alternative systems;
(ii) Significant after-market sales (in SAP’s case it is around half of revenue, according to
our analysts);

23 November 2012
Global Equity Strategy 62
(iii) A high ratio of R&D to sales.
Figure 115: High barriers to entry in tech and software
especially
Figure 116: SAP's Q3 2012 revenue split shows more than
50% of sales are from maintenance
Market
Softw are
Semis
Office Elec
IT Serv ices
Internet
Sw &Sv s
Elec Equip
ComputersComm Equip
Utilities
Telecoms
Materials
IT
Industrials
Health Care
Energy
Cons Sv s
Cons Dis
2%
4%
6%
8%
10%
12%
14%
16%
18%
20%
22%
0% 20% 40% 60% 80% 100%
Capitalized R&D as % of sales
2011
e C
FR
OI
26%
53%
2%
19%
0%
10%
20%
30%
40%
50%
60%
Software revenue Support revenue Cloudsubscriptions and
support
Professionalservices and other
Source: Credit Suisse HOLT, Credit Suisse research Source: Company data, Credit Suisse Software Research Team
■ Software companies have strong balance sheets – which adds to their
defensiveness (on top its high barriers to entry);
Figure 117: Software has the lowest leverage among global sectors
-20%
0%
20%
40%
60%
80%
100%
120%
Util
ities
Aut
os
Tel
ecom
s
Tra
nspo
rt
Cap
Goo
ds
Med
ia
Met
& M
in
Bev
erag
es
Foo
d R
tl
Com
ml S
vs
Hea
lthca
re
Ene
rgy
Fd
Pro
ds
Hot
els
& L
ei
Tob
acco
H/H
& P
er P
rod
Ret
ail
Con
s D
ur &
App
Pha
rma
Tec
h H
/W
Sem
is
S/W
& S
vs
Global sectors net debt to market cap
Non-financials
Source: Thomson Reuters, Credit Suisse research
■ Software is also cyclical, with c80% of revenue coming from corporate discretionary
spend. Thus, we regard software as a sector that is defensive, growth and cyclical!
■ The valuations of the software sector as a whole continue, from a global point of
view, to look clearly cheap.

23 November 2012
Global Equity Strategy 63
Figure 118: Global software price-to-book relative is one
standard deviation below average ...
Figure 119: ... and 1.7 standard deviations cheap on 12-
month forward P/E relative
160%
180%
200%
220%
240%
260%
280%
300%
320%
340%
2001 2002 2004 2006 2008 2010 2012
Global Softw are: P/B rel to market
Av erage (+/- 1 sd)
85%
105%
125%
145%
165%
185%
205%
225%
245%
1995 1998 2000 2003 2006 2009 2012
Global Softw are: 12m fw d
P/E rel to marketAv erage x bubble
Source: Thomson Reuters, Credit Suisse research Source: Thomson Reuters, Credit Suisse research
Below we show software companies that our analysts in Europe and the US highlight as
growth stocks. Of these, the following have FCF above 5% and look cheap on HOLT:
Oracle, Microsoft and Check Point.
Figure 120: European and US Software companies that our analysts highlight as growth
Name Abs rel to Industry
rel to mkt %
above/below
average
Abs
rel to mkt %
above/below
average
FCY DY
Price, %
change to
best
3m EPS 3m Sales Credit Suisse
rating
Oracle 11.3 83% -40% 3.5 -56% 8.5 0.8 86.7 -0.1 -1.7 2.1 30.4 Outperform
Check Point Sftw.Techs. 13.2 97% -33% 3.0 -58% 8.2 0.0 62.7 -0.6 -1.1 2.0 45.5 Outperform
SAP 16.5 121% -32% 5.4 -42% 3.6 1.5 58.2 -0.6 1.6 2.3 58.8 Outperform
Teradata 20.1 147% 38% 7.1 40% 4.6 0.0 37.2 3.6 -1.7 2.1 61.2 Outperform
Vmware 27.7 203% -14% 7.9 -2% 4.8 0.0 -23.2 4.6 0.2 2.3 88.1 Outperform
Dassault Systemes 21.6 158% 3% 4.9 -33% 4.5 0.9 -23.5 2.3 1.8 2.7 83.5 Neutral
Salesforce.Com 76.9 563% 16% 12.7 23% 2.6 0.0 -66.9 1.1 0.3 2.1 158.8 Outperform
Netsuite 208.0 1523% 171% 33.8 154% 0.9 0.0 -91.1 13.8 2.2 2.8 60.1 Outperform
Consensus
recommendation
(1=Buy; 5=Sell)
Share price,
local currency
(21 Nov)
-----P/E (12m fwd) ------ 2012e Momentum, %------ P/B ------- HOLT2012e, %
Source: MSCI, IBES, Factset, Thomson Reuters, Credit Suisse HOLT, Credit Suisse research

23 November 2012
Global Equity Strategy 64
A sector perspective We screen for sectors that have high delivered and forecast earnings and sales growth –
but remain attractive on our valuation scorecard. In Europe, household and personal
products, beverages, tobacco and pharma have the highest combination of sales and
earnings growth (last five years and next three years). Paper, construction and banks have
the lowest growth score.
Figure 121: Scorecard of European sectors on historic and prospective sales and
earnings growth European
sector 2007-11 2012e-14e CAGR z-score 2007-11 2012e-14e CAGR z-score
H/H Pers Prd 12.2 7.5 10.4 0.6 13.9 2.8 9.6 1.8 1.2
Beverages 13.1 11.4 12.5 0.9 5.9 6.9 6.3 1.0 0.9
Tobacco 5.7 8.1 6.6 0.1 14.2 2.7 9.8 1.8 0.9
Pharma 9.6 5.9 8.2 0.3 11.1 2.9 8.0 1.4 0.8
Semis 31.9 8.6 22.6 2.4 -2.8 1.6 -1.2 -0.8 0.8
Comm. Svs 14.8 11.2 13.4 1.1 1.8 5.6 3.2 0.2 0.7
S/W & Svs 12.5 11.2 12.0 0.9 1.0 8.5 3.7 0.4 0.6
H/C Eq/Svs 12.4 11.8 12.1 0.9 1.7 6.9 3.6 0.3 0.6
Autos 16.4 16.7 16.5 1.5 -2.4 6.8 0.9 -0.3 0.6
Met & Min 4.8 0.7 3.2 -0.4 12.8 2.8 9.0 1.6 0.6
Chemicals 9.2 7.1 8.4 0.3 3.2 5.2 3.9 0.4 0.4
Energy 2.0 5.4 3.2 -0.4 8.7 -0.1 5.3 0.7 0.2
Fd Prd 2.9 8.1 4.8 -0.2 2.1 7.1 3.9 0.4 0.1
Insurance 3.3 15.8 7.8 0.2 0.8 3.9 2.0 0.0 0.1
Cap Gds 4.2 8.8 5.9 0.0 1.6 4.0 2.5 0.1 0.0
Fd/Stpl Rtl 4.1 5.7 4.7 -0.2 1.9 4.5 2.9 0.2 0.0
Cons Dur 7.5 12.2 9.2 0.5 -4.7 8.1 -0.1 -0.5 0.0
Utilities -2.7 3.8 -0.3 -0.9 8.3 1.9 5.9 0.9 0.0
Transpt 2.2 16.2 7.2 0.2 -3.6 5.1 -0.4 -0.6 -0.2
Telecoms 2.4 4.6 3.3 -0.4 1.1 -0.5 0.5 -0.4 -0.4
Media 11.6 7.5 10.0 0.6 -8.3 3.6 -4.0 -1.5 -0.4
Retailing 8.2 11.1 9.3 0.5 -10.8 4.6 -5.3 -1.8 -0.6
Div Fin -9.0 11.7 -1.8 -1.2 1.2 1.0 1.1 -0.2 -0.7
Real Estate -6.8 4.2 -2.8 -1.3 1.1 2.6 1.7 -0.1 -0.7
Cons Svs 6.8 8.9 7.6 0.2 -10.5 4.5 -5.2 -1.7 -0.8
Tech H/w -3.9 6.0 -0.3 -0.9 0.2 -2.6 -0.8 -0.7 -0.8
Banks -13.5 13.4 -4.3 -1.5 0.9 1.4 1.1 -0.2 -0.9
Cons Mat -28.2 31.0 -10.0 -2.4 -1.4 5.3 1.1 -0.3 -1.3
Pap/For Prd -4.3 2.1 -2.0 -1.2 -10.2 0.8 -6.3 -2.0 -1.6
EPS growth Sales growth average z-
score
Source: Thomson Reuters, Credit Suisse research
We then plot this growth score against the sector’s valuation score (a combination of P/E,
P/B, dividend yield and HOLT; see Appendix for the details of the scorecard). On this
basis, pharma, premium autos and software appear undervalued, while paper and
telecoms are in the low growth segment with unappealing valuations.
We show the analysis for US sectors in the Appendix. Household and personal products,
and beverages appear to have undervalued growth.

23 November 2012
Global Equity Strategy 65
Figure 122: Pharma, autos and software feature in the segment of high growth and
attractive valuation
H/H Pers Prd
Beverages
Tobacco
Pharma
Semis
Comm. Svs
S/W & Svs
H/C Eq/Svs
Autos
Met & Min
Chemicals
Energy
Fd Prd
Insurance
Cap Gds
Fd/Stpl Rtl
Cons Dur
Utilities
Transpt
Telecoms
Media
Retailing
Div Fin
Real Estate
Cons Svs
Tech H/wBanks
Cons Mat
Pap/For Prd
-2.0
-1.5
-1.0
-0.5
0.0
0.5
1.0
1.5
-1.6 -1.2 -0.8 -0.4 0.0 0.4 0.8 1.2
Val
uatio
n z-
scor
e
Growth z-score
High growth / attractive valuation
Source: Thomson Reuters, Credit Suisse research

23 November 2012
Global Equity Strategy 66
Appendix Appendix 1: Growth as a style
Figure 123: US growth tends to outperform as real interest rates fall
-1.0%
-0.5%
0.0%
0.5%
1.0%
1.5%
2.0%
2.5%
3.0%
86
91
96
101
106
111
2003 2004 2005 2006 2007 2008 2009 2010 2011 2012
MSCI US growth index, relative to the market US 10-year TIPS yield, inverted, rhs
Source: Thomson Reuters, Credit Suisse research
Figure 124: Quality growth dividend yield Figure 125: Quality growth price to book
0.55
0.65
0.75
0.85
0.95
1.05
1.15
1.25
1.35
1990 1993 1997 2001 2004 2008 2012
Eur high quality dividend yield relative to the market
1.4
1.6
1.8
2
2.2
2.4
2.6
2.8
3
3.2
3.4
1990 1993 1997 2001 2004 2008 2012
Eur high quality price to book relative to the market
Source: Thomson Reuters, Credit Suisse research Source: Thomson Reuters, Credit Suisse research

23 November 2012
Global Equity Strategy 67
Appendix 2: Sector valuations in Europe and the US
Figure 126: European valuation scorecard – cheapest sector is at the top Eco PE CFROI HOLT score
Absolute Relative z-score Absolute Relative z-score Absolute Relative z-score z-score z-score z-score
Pulp & Paper 10.5 97% 0.2 0.6 43% 1.5 6.5% 167% 1.5 0.6 3.5 2.1 1.3
Utilities 10.0 93% 0.4 1.1 76% 1.5 6.6% 169% 1.2 0.9 3.1 2.0 1.3
Telecoms 9.2 86% 0.1 1.4 92% -0.3 8.3% 212% 2.0 0.8 4.8 2.8 1.2
Food Retail 10.3 95% 1.0 1.5 98% 1.5 4.2% 109% 1.2 0.5 -1.2 -0.3 1.1
Energy 8.4 78% 1.2 1.3 89% 1.8 4.5% 116% -0.1 0.1 2.3 1.2 1.0
Insurance 8.4 77% 0.4 0.9 62% 0.7 5.0% 128% 1.1 0.9 -0.4 0.3 0.6
Pharmaceuticals 11.7 108% 0.5 3.4 232% -0.6 3.8% 99% 0.8 -0.1 1.5 0.7 0.5
Automobiles 6.7 62% 0.2 1.0 67% -0.3 3.5% 90% 0.5 1.0 1.5 1.3 0.4
Software 15.5 144% 0.7 4.0 271% 0.3 1.6% 40% 0.4 0.9 -0.6 0.1 0.4
Banks 8.9 83% 0.0 0.7 47% 1.4 4.0% 101% -0.9 0.1 1.1 0.6 0.3
Technology Hardware 22.6 209% -3.0 1.3 88% 1.9 4.2% 106% 1.3 0.3 1.2 0.8 0.2
Metals and Mining 10.2 94% -0.8 1.3 86% 0.6 3.2% 81% 0.0 0.1 1.5 0.8 0.2
Diversified Financials 9.3 86% -0.7 0.8 52% 1.8 2.4% 61% -1.3 0.9 0.3 0.6 0.1
Media 12.0 111% 0.6 2.8 187% -0.3 3.6% 92% -0.1 0.6 -0.4 0.1 0.1
Semiconductors 21.2 197% 0.0 3.3 220% -2.4 1.5% 37% 1.4 1.0 0.3 0.7 -0.1
Household Products 16.7 155% 0.1 3.2 218% 0.1 2.4% 62% 0.6 -0.7 -2.5 -1.6 -0.2
Capital Goods 12.0 111% -0.4 2.2 147% -1.6 3.5% 89% 0.7 0.9 -0.7 0.1 -0.3
Real Estate 16.7 154% -0.4 1.0 67% -1.6 5.4% 138% 0.8 0.4 -3.1 -1.4 -0.3
Healthcare Equip 17.0 157% -0.6 3.0 204% -1.0 1.3% 34% -0.6 0.6 -0.3 0.2 -0.5
Construction Materials 13.8 128% -1.8 0.9 61% 1.1 2.2% 57% -1.5 -1.7 0.8 -0.4 -0.6
Transport 13.0 120% -0.6 1.5 101% -0.3 3.2% 81% -0.3 -0.9 -1.9 -1.4 -0.6
Tobacco 13.4 124% -0.9 6.4 433% -1.6 4.1% 104% -0.6 1.4 -0.5 0.5 -0.7
Chemicals 12.7 117% -0.8 2.3 154% -1.7 2.9% 74% -0.9 1.0 -0.4 0.3 -0.8
Consumer Durables 14.7 136% -0.7 2.9 195% -1.7 1.8% 46% -1.2 0.1 -1.3 -0.6 -1.1
Food Producers 16.8 155% -1.4 3.6 241% -1.5 3.1% 79% -0.5 -0.7 -1.2 -0.9 -1.1
Hotels & Leisure 15.0 139% -1.6 2.8 191% -2.0 3.4% 88% -1.4 -0.1 0.4 0.1 -1.2
Commercial Services 15.6 144% -1.4 4.5 306% -2.1 2.3% 60% -1.1 0.0 -0.7 -0.4 -1.3
Beverages 16.3 151% -1.6 3.3 225% -2.3 2.0% 52% -1.6 -1.0 -2.1 -1.6 -1.8
Retailing 15.9 148% -1.5 3.5 238% -2.8 3.2% 81% -1.4 -0.5 -3.1 -1.8 -1.9
Total Z-
Score
A high z-score indicates the sector is cheap on all metrics
Pan Europe Sectors12m fwd P/E P/B Div yield
Source: Thomson Reuters, Credit Suisse HOLT, Credit Suisse estimates
Figure 127: US valuation scorecard – cheapest sector is at the top Eco PE CFROI HOLT Score
Absolute Relative Z-Score Absolute Relative Z-Score Absolute Relative Z-Score Z-Score Z-Score Z-Score
Technology Hardware 9.7 80% 1.3 2.8 128% 0.5 1.9% 82% 3.0 1.2 0.4 0.8 1.4
Semiconductors 12.3 102% 0.5 2.1 99% 1.0 3.1% 138% 2.0 1.0 0.7 0.9 1.1
Software 12.6 105% 1.3 4.1 192% 0.4 1.2% 53% 1.5 1.1 0.8 1.0 1.0
Pharmaceuticals 12.6 104% 0.4 3.1 144% 0.8 2.6% 114% 0.1 0.2 4.5 2.4 0.9
Food Retail 12.6 105% 0.3 2.5 118% 0.5 2.1% 92% 1.2 0.8 1.9 1.3 0.8
Metals and Mining 9.2 77% 0.4 1.4 67% 0.4 3.2% 140% 1.2 0.8 0.7 0.8 0.7
Div. Financials 9.2 76% 0.3 0.9 39% 1.7 1.6% 71% -0.8 1.4 1.0 1.2 0.6
Healthcare Equip 11.2 93% 0.5 2.4 113% -0.3 1.3% 56% 0.8 1.1 0.8 1.0 0.5
Insurance 9.2 77% 0.1 0.9 42% 1.4 1.6% 72% -0.9 1.2 1.1 1.1 0.4
Energy 10.5 87% 0.4 1.8 82% 0.7 2.2% 98% -0.7 0.0 1.6 0.8 0.3
Banks 8.9 74% 0.2 1.1 52% 0.8 2.6% 115% -0.9 1.6 -0.3 0.7 0.2
Capital Goods 12.0 99% 0.4 2.6 121% -0.4 2.5% 109% -0.2 1.1 0.8 1.0 0.2
Commercial Services 15.0 124% -1.2 2.2 100% 1.3 2.4% 106% 0.8 0.8 -1.4 -0.3 0.2
Food Producers 14.7 122% -1.3 2.2 101% 1.1 3.0% 132% -0.3 0.1 2.0 1.1 0.1
Beverages 15.8 131% 0.1 4.4 204% 1.1 2.0% 90% -0.5 -0.5 -1.0 -0.7 0.0
Media 13.3 110% 1.1 2.7 125% -1.9 1.4% 60% 1.0 0.6 -1.4 -0.4 0.0
H/H Pers Prd 16.0 133% -1.0 4.1 190% 0.4 3.1% 136% 0.7 0.1 -1.8 -0.8 -0.2
Automobiles 7.9 65% 0.1 2.1 95% -0.1 1.3% 58% -1.3 0.4 -0.1 0.1 -0.3
Transport 12.1 100% -0.1 3.2 146% -1.7 2.2% 96% 1.0 0.8 -2.8 -1.0 -0.5
Utilities 13.1 109% -1.3 1.5 68% -0.6 4.4% 194% -0.7 -0.4 1.9 0.8 -0.5
Pulp & Paper 11.2 93% 0.3 2.1 97% -2.5 3.4% 150% -0.1 0.6 -0.5 0.1 -0.5
Telecoms 16.9 141% -2.1 2.2 102% -0.8 4.7% 208% 0.6 0.7 -1.6 -0.5 -0.7
Chemicals 13.0 108% -0.8 3.3 151% -1.1 2.4% 105% -0.9 1.0 -1.2 -0.1 -0.7
Real Estate 29.6 246% 0.2 2.4 111% -1.3 3.9% 175% -0.6 0.0 -2.3 -1.1 -0.7
Hotels & Leisure 16.5 137% -1.2 4.4 201% -1.8 2.4% 106% 1.3 0.6 -3.5 -1.5 -0.8
Construction Materials 64.9 539% -0.5 2.0 92% 0.1 0.8% 34% -2.8 -0.7 -1.6 -1.2 -1.1
Tobacco 13.7 114% -1.5 49.8 2300% -3.0 4.5% 199% -0.8 1.1 -1.2 -0.1 -1.3
Consumer Durables 15.0 125% -1.2 3.5 162% -2.7 1.6% 72% -1.0 0.0 -2.0 -1.0 -1.5
Retailing 17.2 143% -2.0 4.3 200% -2.4 1.2% 52% 0.0 -0.3 -3.0 -1.6 -1.5
Total Z-
Score
Sectors are ranked with cheapest at the to the most expensive at the bottom
US sectors12m fwd P/E P/B Div yield
Source: Thomson Reuters, Credit Suisse HOLT, Credit Suisse estimates
23 November 2012
Global Equity Strategy 68
Figure 128: Scorecard of US sectors on historical and prospective sales and earnings
growth European
sector 2007-11 2012e-14e CAGR z-score 2007-11 2012e-14e CAGR z-score
H/H Pers Prd 12.2 7.5 10.4 0.6 13.9 2.8 9.6 1.8 1.2
Beverages 13.1 11.4 12.5 0.9 5.9 6.9 6.3 1.0 0.9
Tobacco 5.7 8.1 6.6 0.1 14.2 2.7 9.8 1.8 0.9
Pharma 9.6 5.9 8.2 0.3 11.1 2.9 8.0 1.4 0.8
Semis 31.9 8.6 22.6 2.4 -2.8 1.6 -1.2 -0.8 0.8
Comm. Svs 14.8 11.2 13.4 1.1 1.8 5.6 3.2 0.2 0.7
S/W & Svs 12.5 11.2 12.0 0.9 1.0 8.5 3.7 0.4 0.6
H/C Eq/Svs 12.4 11.8 12.1 0.9 1.7 6.9 3.6 0.3 0.6
Autos 16.4 16.7 16.5 1.5 -2.4 6.8 0.9 -0.3 0.6
Met & Min 4.8 0.7 3.2 -0.4 12.8 2.8 9.0 1.6 0.6
Chemicals 9.2 7.1 8.4 0.3 3.2 5.2 3.9 0.4 0.4
Energy 2.0 5.4 3.2 -0.4 8.7 -0.1 5.3 0.7 0.2
Fd Prd 2.9 8.1 4.8 -0.2 2.1 7.1 3.9 0.4 0.1
Insurance 3.3 15.8 7.8 0.2 0.8 3.9 2.0 0.0 0.1
Cap Gds 4.2 8.8 5.9 0.0 1.6 4.0 2.5 0.1 0.0
Fd/Stpl Rtl 4.1 5.7 4.7 -0.2 1.9 4.5 2.9 0.2 0.0
Cons Dur 7.5 12.2 9.2 0.5 -4.7 8.1 -0.1 -0.5 0.0
Utilities -2.7 3.8 -0.3 -0.9 8.3 1.9 5.9 0.9 0.0
Transpt 2.2 16.2 7.2 0.2 -3.6 5.1 -0.4 -0.6 -0.2
Telecoms 2.4 4.6 3.3 -0.4 1.1 -0.5 0.5 -0.4 -0.4
Media 11.6 7.5 10.0 0.6 -8.3 3.6 -4.0 -1.5 -0.4
Retailing 8.2 11.1 9.3 0.5 -10.8 4.6 -5.3 -1.8 -0.6
Div Fin -9.0 11.7 -1.8 -1.2 1.2 1.0 1.1 -0.2 -0.7
Real Estate -6.8 4.2 -2.8 -1.3 1.1 2.6 1.7 -0.1 -0.7
Cons Svs 6.8 8.9 7.6 0.2 -10.5 4.5 -5.2 -1.7 -0.8
Tech H/w -3.9 6.0 -0.3 -0.9 0.2 -2.6 -0.8 -0.7 -0.8
Banks -13.5 13.4 -4.3 -1.5 0.9 1.4 1.1 -0.2 -0.9
Cons Mat -28.2 31.0 -10.0 -2.4 -1.4 5.3 1.1 -0.3 -1.3
Pap/For Prd -4.3 2.1 -2.0 -1.2 -10.2 0.8 -6.3 -2.0 -1.6
EPS growth Sales growth average z-
score
Source: Thomson Reuters, Credit Suisse HOLT, Credit Suisse estimates
Figure 129: US sectors: household and personal products and beverages feature in the
segment of high growth and attractive valuation
H/H Pers Prd
Beverages
Tobacco
Pharma
Semis
Comm. Svs
S/W & Svs
H/C Eq/Svs
Autos
Met & Min
Chemicals
Energy
Fd Prd
Insurance
Cap Gds
Fd/Stpl RtlCons Dur
Utilities
Transpt
Telecoms
Media
Retailing
Div Fin
Real Estate
Cons Svs
Tech H/wBanks
Cons Mat
Pap/For Prd
-1.6
-1.2
-0.8
-0.4
0
0.4
0.8
1.2
-1.9 -1.5 -1.1 -0.7 -0.3 0.1 0.5 0.9 1.3 1.7
Val
uatio
n z-
scor
e
Growth z-score
High growth / attractive valuation
Source: Thomson Reuters, Credit Suisse research

23 November 2012
Global Equity Strategy 69
Appendix 3: Outperform rated NJA growth stocks
and quality growth
Figure 130: Outperform-rated NJA growth stocks ranked by upside potential on HOLT
Name
Forecast CFROI
versus 3yr Hist.
Median
CFROI Median - Five
Year 5-yr asset growth Abs rel to Industry
rel to mkt %
above/below
average
Abs
rel to mkt %
above/below
average
FCY DY
Price, %
change to
best
3m EPS 3m Sales Credit Suisse
rating
Hyundai Mobis -3.2 19.6 20.5 6.9 86% -52% 1.9 35% 3.8 0.7 131.2 -1.7 1.3 1.7 267,500.0 Outperform
Cnooc -3.9 15.8 12.8 9.0 85% 13% 2.3 0% 4.6 2.7 101.4 -4.1 1.0 2.5 16.0 Outperform
United Tractors 0.3 11.9 18.6 12.7 109% 27% 3.0 -32% 3.1 2.9 97.5 -10.9 -7.4 2.8 19,600.0 Outperform
Hcl Technologies 5.5 16.8 12.2 12.9 94% -4% 4.3 7% 4.3 1.6 90.8 19.0 3.8 2.1 616.2 Outperform
Kweichow Moutai 'A' 10.7 30.8 26.0 13.9 86% -39% 10.3 55% na 1.7 88.7 5.9 6.4 1.3 214.1 Outperform
Hindustan Zinc -4.6 17.6 17.8 8.8 77% 42% 2.2 27% 7.9 1.9 81.5 2.8 -2.4 2.0 133.9 Outperform
China Mobile -1.3 12.0 10.6 11.2 93% -19% 2.2 -39% 6.7 3.9 78.2 -2.0 -0.9 2.7 85.2 Outperform
Luzhou Lao Jiao 'A' 10.4 42.6 8.9 10.4 64% -65% 7.7 33% na 3.5 67.4 6.0 9.4 1.3 33.1 Outperform
Samsung Engineering -1.5 22.5 24.3 9.4 81% 3% 4.0 54% na 2.3 55.0 -8.2 -0.2 2.0 145,000.0 Outperform
China Shenhua En.Co.'H' 0.4 11.7 12.6 10.9 103% 1% 2.4 -15% 3.4 3.3 51.9 -2.3 -0.1 2.0 30.8 Outperform
Astra International 1.6 14.5 12.4 14.7 183% 18% 5.3 13% 2.6 2.7 36.3 -0.6 0.3 2.1 7,800.0 Outperform
Coal India -0.3 13.0 5.4 12.3 116% 13% 5.5 7% 5.9 2.6 19.7 -0.7 -0.1 2.2 351.5 Outperform
Tata Consultancy Svs. -0.9 30.1 18.4 17.9 131% 24% 8.8 7% 3.5 1.5 19.2 0.8 1.3 2.4 1,261.5 Outperform
Shanxi Xinghuacun Fen Wine
Fac. 'A'
9.0 16.9 11.5 20.8 128% -2% 15.7 160% -2.0 0.8 9.5 10.5 5.6 1.5 35.7 Outperform
Sembcorp Industries -4.0 13.7 6.0 11.2 97% 4% 2.3 13% na 3.3 7.6 1.2 0.9 1.7 4.8 Outperform
Singapore Telecom -2.7 9.6 5.8 12.9 106% 8% 2.2 -34% 6.3 5.1 2.1 -3.1 -0.1 3.0 3.2 Outperform
Digi.Com 3.1 15.5 9.1 23.1 191% 8% 28.3 336% 5.1 4.9 0.8 -0.6 0.2 3.3 4.8 Outperform
Lg Chem -5.2 12.6 10.3 11.2 87% 91% 2.2 42% 2.1 1.3 -5.9 -9.8 -2.7 1.7 300,000.0 Outperform
Kangwon Land -6.4 17.9 8.6 13.8 82% 60% 2.5 -4% 9.7 3.3 -12.6 -4.8 -2.7 2.0 28,100.0 Outperform
Itc -0.7 19.0 6.8 26.8 196% 77% 11.4 110% 2.2 1.9 -47.2 1.3 0.7 2.0 282.0 Outperform
Consensus
recommendation
(1=Buy; 5=Sell)
Share price,
local currency
(19 Nov)
-----P/E (12m fwd) ------ 2012e Momentum, %------ P/B ------- HOLT2012e, %
Source: MSCI, IBES, Thomson Reuters, Credit Suisse HOLT, Credit Suisse estimates
Figure 131: Outperform-rated NJA quality growth stocks with potential upside on HOLT, ranked by upside potential on
HOLT MSCI NJA median 5% 14% 15% 9% 6% 13% 14% 10% 10.9
Company
2007-12 2012-14 2007-12 2012-14 2007-12 2012-14 2007-12 2012-14
Shimao Property Holdings 19% 17% 29% 16% 11% 17% 29% 14% 11.8 38 7.7 69% -9% 15.2 Outperform
Astra International 24% 26% 22% 15% 24% 15% 21% 14% 12.3 36 14.3 129% 52% 7,800.0 Outperform
Tencent Holdings 52% 35% 63% 31% 51% 26% 62% 28% 23.3 34 23.0 209% -6% 246.0 Outperform
Largan Precision 11% 21% 25% 18% 11% 25% 24% 20% 11.1 28 15.8 143% 8% 694.0 Outperform
Lupin 23% 19% 28% 24% 28% 17% 35% 15% 20.1 26 19.7 178% 38% 562.1 Outperform
Ncsoft 24% 68% 17% 21% 25% 60% 19% 23% 27.5 -3 12.2 111% -27% 156,000.0 Outperform
Ayala Land 15% 21% 16% 18% 14% 20% 17% 20% 18.3 -11 29.2 264% 15% 23.3 Outperform
Hyundai Engr.& Con. 16% 23% 18% 13% 13% 23% 17% 13% 8.1 -16 10.0 90% -4% 63,000.0 Outperform
Olam International 9% 48% 26% 14% 19% 28% 29% 15% 18.8 -24 9.6 87% -44% 1.7 Outperform
Belle International Hdg. 18% 16% 24% 16% 18% 17% 24% 16% 16.7 -29 17.7 160% -9% 14.8 Outperform
Godrej Consumer Products 27% 16% 39% 26% 29% 23% 46% 20% 22.0 -31 26.8 243% 48% 677.9 Outperform
Hengan Intl.Gp. 26% 23% 28% 22% 25% 20% 28% 20% 24.7 -44 20.7 187% 9% 70.2 Outperform
Tingyi Cymn.Isle.Hldg. 18% 32% 25% 18% 18% 20% 24% 18% 23.2 -53 28.4 257% 24% 23.0 Outperform
Lg Hhld.& Hlth.Care 34% 19% 28% 9% 32% 20% 18% 12% 20.0 -63 27.2 246% 67% 641,000.0 Outperform
Rel mkt,
devn from
average
Long-term
EPS growth
12m fwd PE
Abs Rel
Share price,
local
currency
(19 Nov)
CS ratingHOLT price
to best (%)
Analyst estimates
EPS CAGR Sales CAGR
IBES estimates
EPS CAGR Sales CAGR
Source: MSCI, IBES, Thomson Reuters, Credit Suisse HOLT, Credit Suisse estimates

23 November 2012
Global Equity Strategy 70
Appendix 4: Full list of companies that our analysts
identified as growth in Europe and the US
Figure 132: European growth stocks (as selected by our analysts) – Outperform or Neutral rated
Name Abs rel to Industry
rel to mkt %
above/below
average
Abs
rel to mkt %
above/below
average
FCY DY
Price, %
change to
best
3m EPS 3m Sales Credit Suisse rating
Unibail-Rodamco 17.1 81% 17% 1.4 10% 6.0 4.8 na 1.0 3.9 2.9 169.0 Outperform
Edenred 22.2 141% 40% -5.0 na 5.0 3.3 na -1.4 -1.7 2.5 23.8 Neutral
Aberdeen Asset Man. 13.2 130% 13% 3.7 63% 8.0 3.2 90.1 2.7 1.2 2.1 333.6 Outperform
Sberbank Of Russia 5.7 59% -23% 1.6 20% na 3.1 69.3 10.0 5.7 1.7 87.9 Outperform
SAP 16.5 121% -32% 5.4 -42% 3.6 1.5 58.2 -0.6 1.6 2.3 58.8 Outperform
Spectris 12.3 118% 21% 3.5 -68% 6.9 2.1 56.8 -2.3 -1.7 2.2 1,819.0 Outperform
Perform Group 24.7 179% 26% 0.2 58% na 0.0 48.4 0.5 1.6 1.8 397.0 Outperform
Sonova N 18.3 142% -10% 4.4 -22% 4.3 1.4 42.8 0.7 0.2 2.4 100.6 Outperform
Richemont 14.9 96% 133% 3.5 69% 3.0 1.1 25.4 5.2 2.9 2.4 68.6 Neutral
Rotork 19.5 169% 54% 9.0 80% 4.0 1.9 19.0 0.6 1.6 2.8 2,426.0 Outperform
Capita 13.2 84% -41% 8.6 -36% 4.8 3.2 17.5 0.7 1.0 2.7 722.5 Outperform
The Swatch Group 'B' 14.0 89% -52% 2.8 23% 4.0 1.7 9.0 1.8 0.9 2.3 432.2 Outperform
Paddy Power 20.8 124% 62% 12.0 99% 5.5 2.0 8.3 -0.2 3.3 2.9 57.3 Outperform
Johnson Matthey 13.7 107% 28% 3.2 40% na 2.5 8.0 -5.4 -4.2 2.6 2,190.0 Outperform
Wpp 10.5 76% -18% 1.5 -86% 8.8 3.4 7.8 -1.2 -1.8 2.0 825.0 Outperform
Halma 15.1 146% 35% 4.0 21% 5.3 2.4 7.2 -1.0 -1.0 2.9 419.5 Outperform
Compass Group 14.9 89% 28% 3.8 43% 4.8 3.1 3.5 -1.4 -0.3 2.5 699.5 Outperform
William Demant Hldg. 18.5 143% -5% 8.7 -64% 4.2 0.0 3.2 -6.5 -0.4 3.3 463.6 Neutral
Aker Solutions 10.8 102% 29% 2.7 -10% -4.3 3.0 0.0 4.1 5.8 1.9 104.7 Outperform
Lvmh 16.4 105% 3% 2.9 -10% 4.1 2.3 -1.2 -1.2 1.8 2.0 129.0 Outperform
Partners Group Holding 17.4 171% 49% 8.8 22% na 3.0 -2.7 -3.1 0.3 2.6 192.9 Neutral
Atlas Copco 'A' 14.7 127% 61% 7.1 120% 4.2 3.3 -3.0 -0.8 -1.3 2.9 167.6 Outperform
Subsea 7 12.6 119% -25% 1.3 -46% 4.2 1.9 -4.4 10.5 -0.9 2.0 128.7 Neutral
Hammerson 23.0 108% 28% 0.9 21% 4.1 3.6 -4.9 1.7 0.3 2.5 461.5 Outperform
Moneysupermarket
Com Gp.14.3 105% 34% 4.4 98% 5.4 3.7 -5.5 3.4 0.5 2.3 153.5 Outperform
Fresenius Med.Care 16.3 126% 2% 2.6 19% 4.5 1.4 -11.3 -1.9 -1.1 2.4 51.6 Outperform
Sabmiller 16.7 103% 50% 1.7 -11% 5.5 2.3 -13.5 0.5 0.8 2.6 2,633.0 Outperform
Burberry Group 17.5 112% 35% 6.3 45% 4.4 2.1 -13.8 -6.2 -4.4 2.5 1,233.0 Outperform
Umicore 14.9 131% 47% 2.7 75% 3.6 2.6 -14.4 -4.0 -2.3 2.7 39.4 Neutral
Diageo 16.7 103% 47% 8.1 71% 4.2 2.5 -14.6 0.7 -1.5 2.1 1,846.0 Outperform
Eutelsat
Communications15.0 108% 6% 3.1 7% 1.9 4.2 -18.2 -1.7 -0.1 2.3 23.6 Outperform
Boss (Hugo) 15.4 99% 29% 10.9 137% 4.1 4.1 -18.8 -4.5 0.0 2.0 79.2 Neutral
Novo Nordisk 'B' 20.9 169% 34% 13.7 207% 3.5 1.8 -19.5 5.1 3.6 2.4 907.0 Neutral
Intertek Group 19.9 127% 60% 8.8 -51% 3.0 1.4 -20.1 2.0 1.7 2.8 2,898.0 Outperform
Spirax-Sarco 15.1 131% 41% 3.8 36% 4.9 2.7 -20.2 -4.9 -1.1 2.6 2,147.0 Neutral
Petroleum Geo
Services11.6 110% -72% 2.1 -55% 2.8 1.4 -21.2 26.8 3.4 1.9 97.7 Outperform
Vienna Insurance
Group A9.5 98% -23% 1.0 -54% 6.3 3.6 -21.2 -3.5 2.3 2.3 34.2 Neutral
Pernod-Ricard 15.4 95% 46% 2.0 14% 4.3 1.9 -22.5 -2.7 0.4 2.7 84.9 Outperform
Dassault Systemes 21.6 158% 3% 4.9 -33% 4.5 0.9 -23.5 2.3 1.8 2.7 83.5 Neutral
Assa Abloy 'B' 14.7 127% -6% 3.5 5% 4.7 2.4 -24.1 -1.5 -1.7 2.9 231.9 Outperform
Aggreko 19.8 126% 45% 9.5 111% 1.5 1.1 -26.0 -3.5 -3.3 2.3 2,153.0 Neutral
Deutsche Post 11.5 85% 42% 1.7 -19% 8.0 4.6 -26.5 0.1 1.1 1.9 15.3 Outperform
Coloplast 'B' 19.8 153% 24% 11.8 89% 4.3 1.4 -27.8 0.2 0.3 3.1 1,311.0 Outperform
Ryanair Holdings 13.2 98% -10% 2.0 -31% 9.6 8.8 -28.9 -3.2 -0.6 2.2 4.6 Outperform
Sgs 'N' 21.4 136% 51% 7.6 77% 2.2 3.1 -31.2 -2.2 0.0 2.8 2,012.0 Neutral
Saipem 14.2 133% 18% 3.3 28% 6.2 2.1 -33.6 -2.9 1.5 2.1 32.5 Outperform
Prudential 11.4 118% 7% 2.4 -18% 5.9 3.1 -33.8 0.6 1.4 2.2 880.0 Outperform
Whitbread 15.4 92% 87% 3.4 129% 6.4 2.3 -34.1 1.4 1.4 2.6 2,361.0 Neutral
Kuehne+Nagel Intl. 20.3 151% 70% 5.7 66% 4.3 3.3 -36.7 -1.7 0.2 2.6 113.8 Outperform
St.James'S Place 16.6 171% 60% 2.9 4% na 2.6 -38.1 -0.7 -2.6 2.3 396.9 Neutral
Reed Elsevier 11.9 86% 6% 6.5 17% 8.4 3.8 -40.3 1.2 -0.3 2.2 607.5 Neutral
Ictl.Htls.Gp. 15.7 94% 44% 8.1 -51% 6.1 2.6 -40.4 -1.1 0.1 2.6 1,650.0 Outperform
Easyjet 10.0 74% -12% 1.6 15% 7.1 1.9 -44.2 11.5 0.1 2.3 682.0 Outperform
Chr Hansen Holding 21.4 166% 45% 5.1 49% na 1.9 -50.4 2.0 0.5 2.7 187.3 Outperform
Domino'S Pizza Group 22.1 132% 47% 15.0 16% 4.8 2.7 -62.8 -1.3 -12.7 2.5 525.0 Neutral
Consensus
recommendation
(1=Buy; 5=Sell)
Share price,
local currency
(21 Nov)
-----P/E (12m fwd) ------ 2012e Momentum, %------ P/B ------- HOLT2012e, %
Source: MSCI, IBES, Factset, Thomson Reuters, Credit Suisse HOLT, Credit Suisse research

23 November 2012
Global Equity Strategy 71
And below we show the same for the US.
Figure 133: US growth stocks (as selected by our analysts) – Outperform or Neutral rated
Name Abs rel to Industry
rel to mkt %
above/below
average
Abs
rel to mkt %
above/below
average
FCY DY
Price, %
change to
best
3m EPS 3m Sales Credit Suisse
rating
Luxfer na na na na na na na na na na na 11.3 Outperform
Manchester United Cl.A 29.7 177% 21% na na 0.8 0.0 na na na 2.0 13.2 Outperform
Celgene 13.3 80% -72% 5.8 -60% 5.4 0.0 220.1 2.0 1.2 1.8 77.9 Neutral
Broadcom 'A' 11.1 79% -69% 2.6 -54% 7.0 1.3 110.3 -2.1 -1.6 1.8 31.2 Outperform
F5 Networks 16.1 155% -51% 5.9 9% 6.5 0.0 96.8 -1.5 -0.6 2.2 90.1 Outperform
Qualcomm 14.3 138% -39% 3.7 -18% 5.5 1.6 93.1 -0.3 -0.4 1.9 62.1 Outperform
Oracle 11.3 83% -40% 3.5 -56% 8.5 0.8 86.7 -0.1 -1.7 2.1 30.4 Outperform
Emc 13.1 126% -47% 2.7 -40% 8.8 0.0 85.1 -2.4 -1.8 1.7 24.4 Outperform
Apple 11.2 107% -58% 7.0 116% 8.1 1.7 82.1 -10.7 -2.7 1.7 561.7 Outperform
Gilead Sciences 15.5 93% -64% 7.5 6% 5.5 0.0 82.0 1.9 3.2 1.7 75.6 Neutral
Mellanox 19.2 185% 23% 7.2 162% 4.9 0.0 71.3 12.2 0.9 2.2 84.4 Neutral
Check Point Sftw.Techs. 13.2 97% -33% 3.0 -58% 8.2 0.0 62.7 -0.6 -1.1 2.0 45.5 Outperform
Mastercard 18.6 137% 26% 10.2 44% 4.3 0.2 57.9 -0.5 -2.5 1.9 479.4 Outperform
Danaher 15.0 130% 0% 2.1 -23% 7.8 0.2 56.6 -3.6 -2.2 1.8 53.0 Neutral
Ihs 'A' 19.0 121% 8% 4.2 27% 5.0 0.0 54.7 -3.8 -3.2 2.2 89.2 Outperform
Salix Pharms. 12.6 102% -71% 4.2 4% 4.7 0.0 37.9 10.7 -0.6 2.1 41.4 Outperform
Teradata 20.1 147% 38% 7.1 40% 4.6 0.0 37.2 3.6 -1.7 2.1 61.2 Outperform
Google 'A' 15.0 110% -26% 3.8 -29% 5.9 0.0 35.1 -7.9 -3.1 1.9 665.9 Outperform
Priceline.Com 17.4 104% -34% 12.3 23% 4.7 0.0 34.1 -3.1 -4.3 2.1 639.6 Outperform
Allergan 19.5 157% 7% 5.3 -10% -4.8 0.2 31.1 0.3 -0.9 1.9 90.9 Outperform
Biogen Idec 19.2 116% -45% 5.2 10% 4.3 0.0 14.1 5.9 1.7 2.2 147.4 Outperform
Mercadolibre 28.1 206% -17% 15.9 16% 3.0 0.5 11.2 4.4 -1.3 2.5 75.4 Neutral
Jazz Pharmaceuticals 9.9 80% -74% 11.9 -47% na 0.0 10.6 3.0 1.9 1.4 52.0 Outperform
Mead Johnson Nutrition 19.0 119% 18% -73.9 na 2.9 1.8 9.9 -2.8 -4.3 2.2 66.1 Outperform
Eog Res. 21.1 199% 27% 2.5 2% -4.4 0.6 6.4 12.4 2.0 1.9 118.1 Neutral
Watson Pharms. 10.8 87% -22% 3.1 28% 7.7 0.0 4.3 1.3 2.4 1.8 85.3 Outperform
Nielsen Holdings Nv 14.4 92% 17% 2.3 13% 5.8 0.0 3.5 2.9 -1.1 2.1 28.1 Outperform
Visa 'A' 19.4 142% 32% 4.4 75% 4.4 0.7 1.5 3.3 1.0 1.9 146.7 Outperform
Fmc Technologies 17.4 164% 20% 6.8 42% -4.2 0.0 -0.7 -10.3 -0.6 2.3 41.0 Neutral
Cabela'S 14.4 86% 41% 2.6 76% 5.9 0.0 -0.8 3.4 0.9 2.1 46.5 Outperform
Ralph Lauren Cl.A 18.6 119% 56% 4.1 63% 5.0 0.8 -2.5 -0.7 -1.4 2.4 156.5 Outperform
Rockwell Automation 13.6 117% 41% 6.1 73% 5.3 2.4 -3.8 -3.2 -2.7 2.2 77.4 Outperform
Hexcel 14.2 123% -40% 3.1 -75% -1.7 0.0 -4.0 2.8 -1.7 2.1 25.1 Outperform
Gardner Denver 13.6 117% 39% 2.8 63% 7.2 0.2 -6.2 0.2 -4.4 2.5 68.3 Outperform
Fmc 13.7 107% 89% 6.1 91% 3.1 0.6 -6.9 -0.2 0.6 2.3 53.9 Outperform
Cytec Inds. 15.0 116% 46% 1.9 -5% na 0.8 -7.0 -33.1 -38.6 2.6 67.5 Outperform
Nike 'B' 16.9 108% 23% 4.2 22% 5.4 1.5 -11.2 1.3 -0.4 2.4 95.6 Neutral
Mondelez International Inc na na na na na na na -11.7 na na na 25.4 Outperform
Costco Wholesale 21.0 161% 31% 3.4 28% 4.4 1.1 -13.4 3.0 0.7 2.3 96.7 Outperform
Carmax 17.8 106% -31% 3.0 43% 1.9 0.0 -14.1 -2.5 0.4 1.9 34.6 Outperform
Dollar Tree 14.3 86% -5% 6.8 39% 4.3 0.0 -14.8 0.1 -0.9 2.3 41.5 Outperform
Noble Energy 15.5 146% -13% 2.3 11% -6.1 0.9 -15.0 -16.7 -4.9 2.0 95.3 Outperform
Amazon.Com 142.3 850% 163% 13.6 -58% 1.5 0.0 -18.1 -97.1 -1.9 2.0 238.0 Outperform
Linear Tech. 17.4 124% -16% 10.1 -35% 7.3 3.1 -19.2 -18.0 -9.0 2.7 31.9 Outperform
Dollar General 14.9 89% 27% 3.5 39% 4.0 0.0 -19.3 1.8 -0.1 1.8 48.0 Neutral
Anadarko Petroleum 16.8 158% -26% 1.9 -2% 2.4 0.5 -19.9 -3.5 -3.1 1.6 72.5 Outperform
Acme Packet 35.0 337% 41% 2.6 -42% 3.1 0.0 -20.8 -34.7 -8.1 2.9 18.3 Outperform
Vmware 27.7 203% -14% 7.9 -2% 4.8 0.0 -23.2 4.6 0.2 2.3 88.1 Outperform
Zumiez 12.1 72% -46% 2.4 -40% 3.6 0.0 -25.1 -5.4 -0.9 2.3 20.3 Neutral
Yum! Brands 19.7 117% 62% 18.2 -22% 4.0 1.7 -31.5 -0.1 -0.7 2.0 73.5 Outperform
Nxp Semiconductors 10.6 102% 46% 5.6 28% 9.1 0.0 -32.8 -2.6 2.2 2.0 23.4 Outperform
Edwards Lifesciences 27.7 214% 63% 7.5 111% 2.5 0.0 -33.6 -3.7 -3.3 2.3 83.7 Neutral
Lululemon Athletica 32.2 206% 14% 16.7 59% 2.1 0.0 -35.5 12.7 0.7 2.2 70.0 Outperform
Family Dollar Stores 15.1 90% 13% 5.9 70% 1.5 1.3 -35.8 2.5 2.5 2.4 68.8 Outperform
Ignite Restaurant Group 15.8 94% 4% na na -0.5 0.0 -36.1 -14.0 -1.5 1.8 12.9 Outperform
Affiliated Managers 14.4 141% 36% 3.5 34% na 0.0 -37.2 3.3 -1.2 1.9 126.7 Outperform
Las Vegas Sands 17.5 104% -44% 4.3 -35% 5.6 2.3 -38.7 -14.4 -5.4 2.1 43.7 Outperform
Starbucks 22.9 136% -9% 8.6 57% 2.7 1.2 -39.1 -5.3 -1.1 2.0 50.5 Outperform
Itc Holdings 16.3 108% 1% 3.2 24% -9.8 1.9 -39.7 3.1 0.7 2.3 77.2 Neutral
Urban Outfitters 19.7 118% 35% 5.0 42% 2.9 0.0 -40.0 8.6 0.1 2.4 37.4 Neutral
Chipotle Mexn.Grill 25.6 153% -5% 7.9 45% 2.9 0.0 -40.0 0.0 -1.6 2.6 275.5 Neutral
Panera Bread 'A' 24.1 144% 25% 7.6 134% 3.1 0.0 -40.8 3.3 1.9 2.4 161.3 Outperform
Starwood Htls.& Rsts.
Worldwide19.8 118% 14% 3.4 41% 4.6 2.0 -45.4 4.9 0.1 2.2 52.6 Outperform
Under Armour 'A' 35.7 229% 30% 8.8 53% 1.7 0.0 -48.4 1.7 0.9 2.6 52.3 Neutral
Tumi Holdings 27.5 162% 31% na na 2.5 0.0 -49.4 6.4 1.1 1.6 21.6 Outperform
Verisk Analytics Cl.A 22.0 140% 39% -82.7 na 2.8 0.0 -50.8 1.1 1.3 2.2 48.4 Outperform
Whole Foods Market 32.4 249% 58% 5.8 67% 2.4 0.6 -58.3 2.1 0.2 2.1 92.1 Neutral
Heartware International -32.1 nm na 9.4 54% na 0.0 -63.5 nm 3.1 2.1 81.6 Outperform
Fusion-Io 50.1 482% -19% 4.9 -1% 0.3 0.0 -63.6 47.1 9.3 2.4 24.1 Outperform
Volcano 62.6 484% -11% 4.5 30% 0.8 0.0 -65.8 -16.7 -1.8 1.9 26.9 Outperform
Salesforce.Com 76.9 563% 16% 12.7 23% 2.6 0.0 -66.9 1.1 0.3 2.1 158.8 Outperform
Marriott Intl.'A' 18.6 111% 24% -15.7 na 7.1 1.2 -74.1 0.7 0.5 2.3 34.8 Outperform
Five Below 52.0 311% 24% na na 0.8 0.0 -77.2 na na 2.6 28.8 Neutral
Netsuite 208.0 1523% 171% 33.8 154% 0.9 0.0 -91.1 13.8 2.2 2.8 60.1 Outperform
Consensus
recommendation
(1=Buy; 5=Sell)
Share price,
local currency
(21 Nov)
-----P/E (12m fwd) ------ 2012e Momentum, %------ P/B ------- HOLT2012e, %
Source: MSCI, IBES, Factset, Thomson Reuters, Credit Suisse HOLT, Credit Suisse research

23 November 2012
Global Equity Strategy 72
Companies Mentioned (Price as of 22-Nov-2012)
Luzhou Laojiao (000568.SZ, Rmb32.18) Hyundai E&C (000720.KS, W63,200, OUTPERFORM, TP W78,000) Hyundai Mobis (012330.KS, W263,500, OUTPERFORM, TP W402,000) Asiana Airlines (020560.KS, W5,980, UNDERPERFORM, TP W6,750) Samsung Engineering Co Ltd (028050.KS, W145,500, OUTPERFORM, TP W210,000) Cathay Pacific (0293.HK, HK$13.96) Tingyi (0322.HK, HK$21.7) Kangwon Land Inc. (035250.KS, W27,800, OUTPERFORM, TP W32,000) NC Soft (036570.KS, W159,500, OUTPERFORM[V], TP W275,000) LG Household & Healthcare (051900.KS, W659,000, OUTPERFORM, TP W745,000) LG Chem Ltd. (051910.KS, W296,500, OUTPERFORM[V], TP W432,000) China Eastern Airlines (0670.HK, HK$2.66) Tencent Holdings (0700.HK, HK$259.6) Air China (0753.HK, HK$5.13) Shimao Property Holdings Ltd (0813.HK, HK$15.38) CNOOC Ltd (0883.HK, HK$16.36) China Mobile Limited (0941.HK, HK$88.2) Lenovo Group Ltd (0992.HK, HK$6.99) Hengan International (1044.HK, HK$69.9) China Southern Airlines (1055.HK, HK$3.41) China Shenhua Energy Company Limited (1088.HK, HK$31.75) Sinopharm Group Co (1099.HK, HK$24.7) AIA Group (1299.HK, HK$30.45) Belle International Holdings Ltd (1880.HK, HK$15.14) Ping An (2318.HK, HK$58.8) Taiwan Semiconductor Manufacturing (2330.TW, NT$91.3) Foxconn Technology Corp (2354.TW, NT$93.6) Asustek (2357.TW, NT$314.0) China Airlines (2610.TW, NT$11.0) EVA Air (2618.TW, NT$16.3) China Life (2628.HK, HK$22.5) Largan Precision (3008.TW, NT$692.0) Moutai (600519.SS, Rmb217.29) Shanxi Xinghuacun Fen Wine (600809.SS, Rmb36.76) Nabtesco Corporation (6268.T, ¥1,641) SMC (6273.T, ¥13,640) NTN (6472.T, ¥172) THK (6481.T, ¥1,454) Toshiba (6502.T, ¥290) Mitsubishi Electric (6503.T, ¥647) Yaskawa Electric Corporation (6506.T, ¥664) Keyence (6861.T, ¥21,950) Fanuc (6954.T, ¥14,000) Apple Inc (AAPL.OQ, $561.7) ABB (ABBN.VX, SFr17.16) Abbott Laboratories (ABT.N, $63.33) Aberdeen Asset Managers (ADN.L, 333.6p) Activision Blizzard, Inc (ATVI.OQ, $11.35) Adidas AG (ADSGn.F, €65.0) Aggreko (AGGK.L, 2153.0p) Allergan Inc. (AGN.N, $90.92) AirAsia (AIRA.KL, RM2.85) Air Liquide (AIRP.PA, €93.22) Aker Solutions (AKSO.OL, k104.7) Ayala Land (ALI.PS, P23.1) Alesco Corporation (ALS.AX, A$1.91) AMEC (AMEC.L, 1022.0p) Affiliated Managers Group (AMG.N, $126.74) American Express Co. (AXP.N, $55.98) Amgen Inc. (AMGN.OQ, $86.65) Amazon com Inc. (AMZN.OQ, $238.03) Anadarko Petroleum Corp. (APC.N, $72.51) Acme Packet Inc. (APKT.OQ, $18.27) Astra International (ASII.JK, Rp7,750) ASML Holding N.V. (ASML.AS, €42.98) Assa Abloy (ASSAb.ST, Skr231.9) Atlas Copco (ATCOa.ST, Skr167.6) Activision Blizzard, Inc (ATVI.OQ, $11.35) American Express Co. (AXP.N, $55.98) AstraZeneca (AZN.L, 2841.5p) Boeing (BA.N, $73.15) Bayer (BAYGn.DE, €67.75) Bed Bath & Beyond (BBBY.OQ, $58.95) Bank Central Asia (BBCA.JK, Rp8,900) Bank Negara Indonesia (BBNI.JK, Rp3,575) Bank Rakyat Indonesia (BBRI.JK, Rp7,100) Biogen Idec (BIIB.OQ, $147.36) Bank Mandiri (Persero) (BMRI.JK, Rp8,600) BMW (BMWG.F, €66.19) Bristol Myers Squibb Co. (BMY.N, $32.41) Hugo Boss (BOSSn.DE, €79.21) Bank of Philippine Islands (BPI.PS, P90.0)

23 November 2012
Global Equity Strategy 73
Burberry Group (BRBY.L, 1233.0p) Broadcom Corp. (BRCM.OQ, $31.19) Bureau Veritas (BVI.PA, €83.61) BorgWarner, Inc. (BWA.N, $63.72) Cabelas (CAB.N, $46.53) Cameron International Corp. (CAM.N, $53.12) Celgene Corp. (CELG.OQ, $77.86) Compagnie Financiere Richemont SA (CFR.VX, SFr68.55) Check Point Software Technologies Ltd. (CHKP.OQ, $45.5) Christian Hansen Holding (CHRH.CO, Dkr187.3) Cobalt International Energy (CIE.N, $21.68) Chipotle Mexican (CMG.N, $275.46) Cigna Corp. (CI.N, $52.01) Coal India (COAL.BO, Rs354.75) Colgate-Palmolive India (COLG.BO, Rs1330.7) Coloplast B (COLOb.CO, Dkr1311.0) Continental (CONG.DE, €80.03) Costco Wholesale Corporation (COST.OQ, $96.74) Compass (CPG.L, 699.5p) Capita (CPI.L, 722.5p) Cree (CREE.OQ, $30.85) Salesforce.com Inc. (CRM.N, $158.78) Cisco Systems Inc. (CSCO.OQ, $18.48) Cognizant Technology Solutions Corp. (CTSH.OQ, $65.51) CVS Caremark Corporation (CVS.N, $45.74) Cytec (CYT.N, $67.46) Daikin Industries (6367.T, ¥2,480) Danone (DANO.PA, €48.94) Dassault Systemes (DAST.PA, €83.5) Deere & Co. (DE.N, $82.83) Dollar General (DG.N, $48.0) Diageo (DGE.L, 1846.0p) Danaher Corporation (DHR.N, $53.04) Walt Disney Company (DIS.N, $48.68) Discovery Communications, Inc. (DISCA.OQ, $57.38) Dollar Tree (DLTR.OQ, $41.47) Domino’s Pizza Group (DOM.L, 525.0p) Deutsche Post DHL (DPWGn.DE, €15.26) DiGi.Com (DSOM.KL, RM4.77) DSV (DSV.CO, Dkr133.0) Dufry (DUFN.S, SFr124.3) Edenred (EDEN.PA, €23.82) Eli Lilly & Co. (LLY.N, $47.42) EMC Corp (EMC.N, $24.35) Emerson (EMR.N, $48.55) EOG Resources (EOG.N, $118.14) Energy Recovery Inc. (ERII.OQ, $2.91) Eutelsat Communications (ETL.PA, €23.58) Eaton Corporation (ETN.N, $50.73) Edwards LifeSciences Corp. (EW.N, $83.7) Expeditors International of Washington (EXPD.OQ, $36.8) Experian (EXPN.L, 1020.0p) EasyJet (EZJ.L, 682.0p) Freeport-McMoRan Copper & Gold (FCX.N, $38.27) Family Dollar (FDO.N, $68.83) FedEx Corporation (FDX.N, $87.65) F5 Networks (FFIV.OQ, $90.05) Fusion-io (FIO.N, $24.11) Five Below, Inc. (FIVE.OQ, $28.77) Flowserve Corp. (FLS.N, $138.16) FMC Corporation (FMC.N, $53.88) Fresenius Medical Care AG & Co. (FMEG.DE, €51.55) Fresenius (FREG.DE, €84.25) FMC Technologies, Inc. (FTI.N, $41.0) General Dynamics Corporation (GD.N, $64.36) Gardner Denver, Inc. (GDI.N, $68.31) G.F. Inbursa (GFINBURO.MX, $34.91) PT Garuda Indonesia Tbk (GIAA.JK, Rp700) Gilead Sciences Inc. (GILD.OQ, $75.55) Godrej Consumer Products Ltd (GOCP.BO, Rs669.95) Google, Inc. (GOOG.OQ, $665.87) GlaxoSmithKline plc (GSK.L, 1334.5p) G.U.D. Holdings (GUD.AX, A$8.09) WW Grainger Inc. (GWW.N, $190.39) Halliburton (HAL.N, $31.7) HCL Technologies (HCLT.BO, Rs627.0) Hikma Pharmaceuticals Plc (HIK.L, 738.0p) Halma (HLMA.L, 419.5p) Hammerson Property (HMSO.L, 461.5p) Honeywell International Inc. (HON.N, $60.59) Starwood Hotels & Resorts Worldwide (HOT.N, $52.64) Hargreaves Lansdown (HRGV.L, 770.5p) Hermes International (HRMS.PA, €232.0) HeartWare International Inc (HTWR.OQ, $81.64)

23 November 2012
Global Equity Strategy 74
Hexcel Corporation (HXL.N, $25.1) Hyflux Ltd (HYFL.SI, S$1.3) Hindustan Zinc Limited (HZNC.BO, Rs132.75) Intercontinental Hotels (IHG.L, 1650.0p) IHS (IHS.N, $89.16) Imperial Tobacco (IMT.L, 2472.0p) Intel Corp. (INTC.OQ, $19.36) Ignite Restaurant Group (IRG.OQ, $12.92) ITC Ltd (ITC.BO, Rs288.95) ITC Holdings Corp (ITC.N, $77.15) Intertek (ITRK.L, 2898.0p) Illinois Tool Works, Inc. (ITW.N, $59.77) IVRCL Infrastructures and Projects Ltd (IVRC.BO, Rs39.7) Jazz Pharmaceuticals (JAZZ.OQ, $52.02) Johnson Controls (JCI.N, $26.76) Johnson Matthey (JMAT.L, 2190.0p) Johnson & Johnson (JNJ.N, $69.59) KLA-Tencor Corp. (KLAC.OQ, $44.13) CarMax Inc. (KMX.N, $34.62) Kuehne + Nagel (KNIN.VX, SFr113.8) Kraft Foods Group (KRFT.OQ, $44.51) Life Technologies Corporation (LIFE.OQ, $49.22) Linear Technology Corp. (LLTC.OQ, $31.9) Eli Lilly & Co. (LLY.N, $47.42) lululemon athletica Inc. (LULU.OQ, $69.98) Lupin Ltd (LUPN.BO, Rs564.45) LVMH (LVMH.PA, €129.0) Las Vegas Sands Corp. (LVS.N, $43.72) Luxfer (LXFR.N, $11.33) MasterCard Inc. (MA.N, $479.43) Malaysia Airports (MAHB.KL, RM5.53) Manchester United (MANU.N, $13.15) Metropolitan Bank & Trust (MBT.PS, P95.0) McDonald's Corp (MCD.N, $86.01) Mondelez (MDLZ.OQ, $25.41) MercadoLibre Inc. (MELI.OQ, $75.4) Metso (MEO1V.HE, €27.7) Mead Johnson Nutrition Co. (MJN.N, $66.12) Millennium & Copthorne (MLC.L, 461.0p) Mellanox Technologies Ltd. (MLNX.OQ, $84.41) Moneysupermarket.com (MONY.L, 153.5p) Mindray Medical International Ltd (MR.N, $33.77) Merck & Co., Inc. (MRK.N, $43.89) Microsoft Corporation (MSFT.OQ, $26.95) NetSuite Inc. (N.N, $60.09) Noble Energy (NBL.N, $95.31) Nestle (NESN.VX, SFr59.25) NiSource Inc. (NI.N, $23.93) Nike Inc. (NKE.N, $95.6) Nielsen Holdings (NLSN.N, $28.05) Novartis (NOVN.VX, SFr55.65) Novo Nordisk A/S (NOVOb.CO, Dkr907.0) NXP Semiconductors N.V. (NXPI.OQ, $23.35) Melrose (NYN.L, 209.5p) Olam (OLAM.SI, S$1.68) Oracle Corporation (ORCL.OQ, $30.39) L'Oreal (OREP.PA, €102.95) O'Reilly Automotive, Inc. (ORLY.OQ, $91.55) Paddy Power (PAP.I, €57.3) Priceline.com (PCLN.OQ, $639.58) Precision Castparts (PCP.N, $176.92) Perform Group Plc (PER.L, 397.0p) Pernod-Ricard (PERP.PA, €84.94) Petrofac (PFC.L, 1590.0p) Pfizer (PFE.N, $24.35) Partners Group (PGHN.S, SFr192.9) Petroleum Geo Services (PGS.OL, k97.65) Parker Hannifin Corporation (PH.N, $80.1) Philips (PHG.AS, €19.88) Pall Corporation (PLL.N, $60.52) Panera Bread (PNRA.OQ, $161.28) Prudential (PRU.L, 880.0p) Pearson (PSON.L, 1182.0p) Quanta Services (PWR.N, $25.2) Panalpina (PWTN.S, SFr86.35) QUALCOMM Inc. (QCOM.OQ, $62.14) Reckitt Benckiser (RB.L, 3845.0p) Reed Elsevier PLC (REL.L, 607.5p) Robinsons Land Corporation (RLC.PS, P18.26) Roche (ROG.VX, SFr177.7) Rockwell Automation (ROK.N, $77.4) Rotork plc (ROR.L, 2426.0p) Ryanair (RYA.I, €4.58) SABMiller (SAB.L, 2633.0p)
23 November 2012
Global Equity Strategy 75
SAP (SAPG.F, €58.83) Sanofi (SASY.PA, €68.08) Sberbank (SBER.MM, Rbl87.86) Sabesp (SBSP3.SA, R$80.54) Starbucks (SBUX.OQ, $50.51) Schlumberger (SLB.N, $70.21) Schneider (SCHN.PA, €51.64) Sembcorp Industries Limited (SCIL.SI, S$4.98) Security Bank Corporation (SECB.PS, P164.0) SGS Surveillance (SGSN.VX, SFr2012.0) Shire Pharmaceuticals (SHP.L, 1787.0p) Siemens (SIEGn.DE, €77.6) St. James's Place (SJP.L, 396.9p) Standard Life (SL.L, 308.4p) Schlumberger (SLB.N, $70.21) Salix Pharmaceuticals, Ltd (SLXP.OQ, $41.43) Smiths Group (SMIN.L, 1052.0p) Sonova Holding (SOON.VX, SFr100.6) Saipem (SPMI.MI, €32.52) Spirax Sarco (SPX.L, 2147.0p) Singapore Telecom (STEL.SI, S$3.14) St Jude Medical (STJ.N, $31.37) Subsea 7 S.A. (SUBC.OL, k128.7) Stanley Black & Decker, Inc. (SWK.N, $70.03) SPECTRIS (SXS.L, 1819.0p) Stryker Corporation (SYK.N, $53.5) Tata Consultancy Services (TCS.BO, Rs1278.1) Teradata Corp (TDC.N, $61.18) TransDigm (TDG.N, $131.52) Technip (TECF.PA, €86.12) Thoratec Corp. (THOR.OQ, $37.24) Thermo Fisher Scientific Inc (TMO.N, $61.16) TNT Express (TNTE.AS, €7.2) Tumi Holdings (TUMI.N, $21.6) Under Armour, Inc. (UA.N, $52.34) Swatch Group (UHR.VX, SFr432.2) Umicore (UMI.BR, €39.36) Unibail Rodamco (UNBP.PA, €168.95) United Health Group (UNH.N, $53.53) Union Pacific (UNP.N, $120.04) United Tractors (UNTR.JK, Rp19,400) Unilever (UNc.AS, €28.44) United Parcel Service Inc. (UPS.N, $71.4) United Technologies Corp (UTX.N, $77.33) Urban Outfitters (URBN.OQ, $37.35) Visa Inc. (V.N, $146.66) VF Corporation (VFC.N, $156.83) Vienna Insurance Group (VIGR.VI, €34.21) Vivendi (VIV.PA, €16.36) VMware Inc. (VMW.N, $88.06) Volcano Corporation (VOLC.OQ, $26.9) Verisk Analytics (VRSK.OQ, $48.36) Verizon (VZ.N, $43.16) William Demant (WDH.CO, Dkr463.6) Whole Foods Market (WFM.OQ, $92.07) Watson Pharmaceuticals (WPI.N, $85.26) WPP (WPP.L, 825.0p) Whitbread (WTB.L, 2361.0p) Xerox (XRX.N, $6.46) Yum! Brands, Inc. (YUM.N, $73.53) Zumiez (ZUMZ.OQ, $20.3)
Disclosure Appendix
Important Global Disclosures
The analysts identified in this report each certify, with respect to the companies or securities that the individual analyzes, that (1) the views expressed in this report accurately reflect his or her personal views about all of the subject companies and securities and (2) no part of his or her compensation was, is or will be directly or indirectly related to the specific recommendations or views expressed in this report.

23 November 2012
Global Equity Strategy 76
Price and Rating History for Hyundai E&C (000720.KS)
000720.KS Closing Price Target Price
Date (W) (W) Rating
03-Feb-10 62,700 67,000 N
27-Apr-10 58,200 64,000
27-Jul-10 62,600 67,000
29-Sep-10 73,500 75,000
25-Oct-10 76,400 81,000
18-Nov-10 59,800 77,000 O
05-Jan-11 80,000 86,000
07-Feb-11 89,700 92,000 N
02-May-11 90,900 90,000
01-Aug-11 85,500 87,000
05-Oct-11 52,200 65,000
28-Oct-11 72,800 70,000
26-Mar-12 83,500 87,000
30-Apr-12 71,400 81,000
03-Jul-12 66,600 88,000 O
27-Jul-12 58,200 81,000
29-Oct-12 63,900 78,000
* Asterisk signifies initiation or assumption of coverage.
N EU T RA L
O U T PERFO RM
Price and Rating History for Hyundai Mobis (012330.KS)
012330.KS Closing Price Target Price
Date (W) (W) Rating
28-Apr-10 179,500 206,000 O
02-Aug-10 222,000 237,000
05-Nov-10 282,000 327,000
28-Jan-11 276,000 372,000
29-Jul-11 380,000 490,600
28-Oct-11 344,000 473,000
27-Jan-12 303,000 430,000
30-Apr-12 307,500 456,000
26-Oct-12 277,000 402,000
* Asterisk signifies initiation or assumption of coverage.
O U T PERFO RM
Price and Rating History for Asiana Airlines (020560.KS)
020560.KS Closing Price Target Price
Date (W) (W) Rating
19-Oct-10 9,650 12,200 O *
15-Jun-12 6,880 8,010 *
22-Aug-12 7,790 6,750 U
* Asterisk signifies initiation or assumption of coverage.
O U T PERFO RM
U N D ERPERFO RM

23 November 2012
Global Equity Strategy 77
Price and Rating History for Samsung Engineering Co Ltd (028050.KS)
028050.KS Closing Price Target Price
Date (W) (W) Rating
29-Jan-10 113,500 120,000 N
22-Jul-10 123,500 150,000 O
29-Sep-10 151,000 170,000
26-Nov-10 183,500 200,000
31-Jan-11 197,000 220,000
20-Apr-11 228,500 250,000
26-Jul-11 259,000 300,000
04-Aug-11 229,000 270,000
05-Oct-11 200,000 250,000
24-Oct-11 237,500 300,000
19-Jan-12 219,000 290,000
24-Apr-12 222,500 270,000
03-Jul-12 185,500 240,000
26-Oct-12 145,500 210,000
* Asterisk signifies initiation or assumption of coverage.
N EU T RA L
O U T PERFO RM
Price and Rating History for Kangwon Land Inc. (035250.KS)
035250.KS Closing Price Target Price
Date (W) (W) Rating
27-Jan-10 15,700 18,000 O
08-Feb-10 15,450 19,000
10-May-10 16,650 20,000
22-Jun-10 19,000 22,000
09-Aug-10 21,400 25,000
08-Nov-10 26,400 28,000 N
14-Feb-11 24,500 25,000
18-Nov-12 26,400 32,000 O
* Asterisk signifies initiation or assumption of coverage. O U T PERFO RM
N EU T RA L
Price and Rating History for NC Soft (036570.KS)
036570.KS Closing Price Target Price
Date (W) (W) Rating
24-May-10 181,000 250,000 O
05-Nov-10 264,000 330,000
12-Jul-11 309,000 400,000
15-Nov-11 336,000 435,000
12-Jan-12 277,000 390,000
23-Jul-12 212,500 320,000
08-Nov-12 185,500 275,000
* Asterisk signifies initiation or assumption of coverage.
O U T PERFO RM

23 November 2012
Global Equity Strategy 78
Price and Rating History for LG Household & Healthcare (051900.KS)
051900.KS Closing Price Target Price
Date (W) (W) Rating
01-Dec-09 278,500 350,000 O
08-Jun-10 335,500 350,000 N
06-Oct-10 406,000 440,000
01-Nov-10 395,000 440,000 O
26-Jan-11 404,500 480,000
26-Jul-11 474,000 540,000
27-Oct-11 532,000 600,000
24-Apr-12 578,000 680,000
24-Oct-12 653,000 745,000
* Asterisk signifies initiation or assumption of coverage.
O U T PERFO RM
N EU T RA L
Price and Rating History for LG Chem Ltd. (051910.KS)
051910.KS Closing Price Target Price
Date (W) (W) Rating
23-Jun-10 314,000 380,000 O
06-Dec-10 385,000 450,000
08-Apr-11 479,000 570,000
20-Apr-11 549,000 600,000
21-Oct-11 343,000 530,000
27-Mar-12 358,000 490,000
19-Apr-12 347,500 465,000
22-Oct-12 323,000 432,000
* Asterisk signifies initiation or assumption of coverage. O U T PERFO RM
The analyst(s) responsible for preparing this research report received Compensation that is based upon various factors including Credit Suisse's total revenues, a portion of which are generated by Credit Suisse's investment banking activities
As of October 2, 2012 Analysts’ stock rating are defined as follows :
Outperform (O) :The stock’s total return is expected to outperform the relevant benchmark* by at least 10-15% or more, (depending on perceived risk) over the next 12 months.
Neutral (N) :The stock's total return is expected to be in line with the relevant benchmark* (range of ±10-15%) over the next 12 months.
Underperform (U) :The stock's total return is expected to underperform the relevant benchmark* by 10-15% or more over the next 12 months.
*Relevant benchmark by region: As of 2nd October 2012, U.S. and Canadian as well as European ratings are based on a stock’s t otal return relative to the analyst's coverage universe which consists of all companies covered by the analyst within the relevant sector, with Outperforms representing the most attractive, Neutrals the less attractive, and Underperforms the least attractive investment opportunities. For Latin American, Japanese, and non -Japan Asia stocks, ratings are based on a stock’s total return relative to the average total return of the relevant country or regional benchmark; Australia, New Zeala nd are, and prior to 2nd October 2012 U.S. and Canadian ratings were based on (1) a stock’s absolute total return potential to its current share price and (2) the relative attractiveness of a stock’s total return potential within an analyst’s coverage universe. For Australian and New Zealand stocks, 12 -month rolling yield is incorporated in the absolute total return calculation and a 15% and a 7.5% threshold replace the 10-15% level in the Outperform and Underperform stock rating definitions, respectively. The 15% and 7.5% thresholds replace the +10-15% and -10-15% levels in the Neutral stock rating definition, respectively.
Restricted (R) :In certain circumstances, Credit Suisse policy and/or applicable law and regulations preclude certain types of communications, including an investment recommendation, during the course of Credit Suisse's engagement in an investment banking transaction and in certain other circumstances.
Volatility Indicator [V]:A stock is defined as volatile if the stock price has moved up or down by 20% or more in a month in at least 8 of the past 24 months or the analyst expects significant volatility going forward.
Analysts' sector weightings are distinct from analysts’ stock ratings and are based on the analyst’s expectations for the fundamentals and/or valuation of the sector* relative to the group’s historic fundamentals and/or valuation::
Overweight:The analyst's expectation for the sector's fundamentals and/or valuation is favorable over the next 12 months.
Market Weight:The analyst's expectation for the sector's fundamentals and/or valuation is neutral over the next 12 months.
Underweight:The analyst's expectation for the sector's fundamentals and/or valuation is cautious over the next 12 months.
*An analyst's coverage sector consists of all companies covered by the analyst within the relevant sector. An analyst may cover multiple sectors.

23 November 2012
Global Equity Strategy 79
Credit Suisse's distribution of stock ratings (and banking clients) is:
Global Ratings Distribution
Rating Versus universe(%) Of which banking clients (%)
Outperform/Buy* 42% (52% banking clients)
Neutral/Hold* 40% (48% banking clients)
Underperform/Sell* 15% (41% banking clients)
Restricted 3%
*For purposes of the NYSE and NASD ratings distribution disclosure requirements, our stock ratings of Outperform, Neutral, an d Underperform most closely correspond to Buy, Hold, and Sell, respectively; however, the meanings are not the same, as our stock ratings are determined on a relative basis. (Please refer to definitions above.) An investor's decision to buy or sell a security should be based on investment objectives, current holdin gs, and other individual factors.
Credit Suisse’s policy is to update research reports as it deems appropriate, based on developments with the subject company, the sector or the market that may have a material impact on the research views or opinions stated herein.
Credit Suisse's policy is only to publish investment research that is impartial, independent, clear, fair and not misleading. For more detail please refer to Credit Suisse's Policies for Managing Conflicts of Interest in connection with Investment Research: http://www.csfb.com/research and analytics/disclaimer/managing_conflicts_disclaimer.html
Credit Suisse does not provide any tax advice. Any statement herein regarding any US federal tax is not intended or written to be used, and cannot be used, by any taxpayer for the purposes of avoiding any penalties.
Please refer to the firm's disclosure website at www.credit-suisse.com/researchdisclosures for the definitions of abbreviations typically used in the target price method and risk sections.
See the Companies Mentioned section for full company names
The subject company (051900.KS, 051910.KS, 000720.KS, 028050.KS, 020560.KS, RYA.I, 0883.HK, EXPN.L, 0700.HK, GDI.N, GWW.N, 0941.HK, 0293.HK, BRBY.L, AIRA.KL, OLAM.SI, ALI.PS, FFIV.OQ, TUMI.N, DGE.L, BVI.PA, NXPI.OQ, PCLN.OQ, 2628.HK, BMRI.JK, ERII.OQ, VIV.PA, HZNC.BO, JNJ.N, 1299.HK, AAPL.OQ, CONG.DE, 000568.SZ, CPG.L, TNTE.AS, BPI.PS, 0322.HK, GIAA.JK, SCHN.PA, BAYGn.DE, HYFL.SI, SLXP.OQ, ATCOa.ST, 1044.HK, SIEGn.DE, MJN.N, SPMI.MI, PRU.L, UNH.N, SGSN.VX, SECB.PS, LVS.N, MBT.PS, BBNI.JK, ADSGn.F, BMWG.F, 2610.TW, DUFN.S, BRCM.OQ, 2354.TW, UNBP.PA, LLY.N, HTWR.OQ, DPWGn.DE, LVMH.PA, HRGV.L, KLAC.OQ, MLC.L, HRMS.PA, HLMA.L, EZJ.L, FIO.N, CSCO.OQ, DSOM.KL, SAB.L, WPI.N, PWTN.S, MONY.L, SHP.L, ROG.VX, GFINBURO.MX, SBER.MM, SAPG.F, 2357.TW, IMT.L, 6273.T, DOM.L, ETL.PA, TCS.BO, AZN.L, DISCA.OQ, XRX.N, NOVN.VX, BBBY.OQ, PSON.L, 1099.HK, 1088.HK, 0753.HK, ABBN.VX, MEO1V.HE, 2330.TW, 1880.HK, GOOG.OQ, MAHB.KL, FMEG.DE, GSK.L, HCLT.BO, FDX.N, LLTC.OQ, FDO.N, CELG.OQ, APKT.OQ, EXPD.OQ, CTSH.OQ, ADN.L, PGHN.S, BIIB.OQ, FREG.DE, FCX.N, BBCA.JK, PHG.AS, SMIN.L, SL.L, CFR.VX, BBRI.JK, 0992.HK, MR.N, 2318.HK, MLNX.OQ, DE.N, EOG.N, DG.N, MSFT.OQ, SYK.N, TMO.N, PWR.N, PFE.N, EW.N, CVS.N, GD.N, NI.N, VZ.N, MANU.N, EMC.N, ABT.N, EMR.N, IHS.N, NKE.N, RLC.PS, HXL.N, BA.N, REL.L, CHKP.OQ, DHR.N, SWK.N, AGN.N, UNP.N, AXP.N, CREE.OQ, DIS.N, CYT.N, CIE.N, INTC.OQ, UPS.N, COST.OQ, HAL.N, GILD.OQ, CMG.N, AMZN.OQ, BMY.N, ITW.N, FLS.N, NBL.N, TDG.N, CAM.N, MDLZ.OQ, HON.N, SLB.N, HOT.N, ITC.N, ETN.N, VFC.N, FIVE.OQ, 6502.T, URBN.OQ, AMGN.OQ, MRK.N, MCD.N, MELI.OQ, IRG.OQ, APC.N, ORCL.OQ, 6861.T, THOR.OQ, SOON.VX, TDC.N, STEL.SI, AMG.N, KRFT.OQ, NESN.VX, DANO.PA, CI.N, AXP.N, SLB.N, LLY.N, UTX.N, 6367.T, CHRH.CO) currently is, or was during the 12-month period preceding the date of distribution of this report, a client of Credit Suisse.
Credit Suisse provided investment banking services to the subject company (051900.KS, 051910.KS, 000720.KS, 0883.HK, EXPN.L, 0700.HK, 0941.HK, AIRA.KL, OLAM.SI, TUMI.N, DGE.L, NXPI.OQ, 2628.HK, BMRI.JK, ERII.OQ, VIV.PA, HZNC.BO, JNJ.N, 1299.HK, CONG.DE, 000568.SZ, CPG.L, TNTE.AS, GIAA.JK, SCHN.PA, SIEGn.DE, MJN.N, PRU.L, UNH.N, LVS.N, BBNI.JK, BMWG.F, DUFN.S, LLY.N, LVMH.PA, FIO.N, CSCO.OQ, DSOM.KL, SAB.L, MONY.L, SBER.MM, IMT.L, DOM.L, ETL.PA, AZN.L, DISCA.OQ, XRX.N, NOVN.VX, PSON.L, 1099.HK, ABBN.VX, MEO1V.HE, 1880.HK, GOOG.OQ, MAHB.KL, GSK.L, CELG.OQ, CTSH.OQ, ADN.L, PGHN.S, BIIB.OQ, FREG.DE, BBCA.JK, PHG.AS, BBRI.JK, 0992.HK, MR.N, MLNX.OQ, DE.N, EOG.N, MSFT.OQ, PFE.N, CVS.N, GD.N, NI.N, VZ.N, MANU.N, EMC.N, BA.N, CHKP.OQ, SWK.N, UNP.N, AXP.N, DIS.N, CIE.N, INTC.OQ, HAL.N, GILD.OQ, CMG.N, AMZN.OQ, BMY.N, NBL.N, TDG.N, CAM.N, MDLZ.OQ, SLB.N, HOT.N, ETN.N, FIVE.OQ, 6502.T, AMGN.OQ, MRK.N, MCD.N, IRG.OQ, APC.N, ORCL.OQ, THOR.OQ, SOON.VX, STEL.SI, KRFT.OQ, NESN.VX, AXP.N, SLB.N, LLY.N, UTX.N, CHRH.CO) within the past 12 months.
Credit Suisse provided non-investment banking services to the subject company (020560.KS, RYA.I, 0700.HK, 0293.HK, DGE.L, 2628.HK, BMRI.JK, VIV.PA, AAPL.OQ, CONG.DE, CPG.L, BAYGn.DE, ATCOa.ST, SIEGn.DE, PRU.L, SECB.PS, MBT.PS, BBNI.JK, ADSGn.F, BMWG.F, 2610.TW, BRCM.OQ, LLY.N, DPWGn.DE, LVMH.PA, HRGV.L, HRMS.PA, EZJ.L, CSCO.OQ, SHP.L, ROG.VX, GFINBURO.MX, IMT.L, 6273.T, TCS.BO, AZN.L, DISCA.OQ, NOVN.VX, PSON.L, ABBN.VX, FMEG.DE, GSK.L, FDX.N, FDO.N, ADN.L, PGHN.S, BBCA.JK, SMIN.L, SL.L, CFR.VX, 0992.HK, 2318.HK, DE.N, EOG.N, MSFT.OQ, TMO.N, PFE.N, CVS.N, VZ.N, EMC.N, EMR.N, BA.N, CHKP.OQ, AXP.N, DIS.N, INTC.OQ, HAL.N, BMY.N, NBL.N, HON.N, HOT.N, ITC.N, AMGN.OQ, MRK.N, MCD.N, APC.N, 6861.T, AMG.N, NESN.VX, DANO.PA, CI.N, AXP.N, LLY.N) within the past 12 months
Credit Suisse has managed or co-managed a public offering of securities for the subject company (000720.KS, 0883.HK, 0700.HK, OLAM.SI, TUMI.N, DGE.L, 2628.HK, 1299.HK, CONG.DE, SIEGn.DE, PRU.L, UNH.N, BBNI.JK, BMWG.F, DUFN.S, LVMH.PA, DSOM.KL, SBER.MM, DOM.L, ETL.PA, DISCA.OQ, XRX.N, ABBN.VX, MAHB.KL, GSK.L, ADN.L, PGHN.S, BBCA.JK, PHG.AS, 0992.HK, DE.N, EOG.N, MANU.N, SWK.N, UNP.N, AXP.N, DIS.N, CIE.N, BMY.N, TDG.N, MDLZ.OQ, HOT.N, FIVE.OQ, AMGN.OQ, IRG.OQ, STEL.SI, KRFT.OQ, NESN.VX, AXP.N, CHRH.CO) within the past 12 months.

23 November 2012
Global Equity Strategy 80
Credit Suisse has received investment banking related compensation from the subject company (051900.KS, 051910.KS, 000720.KS, 0883.HK, EXPN.L, 0700.HK, 0941.HK, AIRA.KL, OLAM.SI, TUMI.N, DGE.L, NXPI.OQ, 2628.HK, BMRI.JK, ERII.OQ, VIV.PA, HZNC.BO, JNJ.N, 1299.HK, CONG.DE, 000568.SZ, CPG.L, TNTE.AS, GIAA.JK, SCHN.PA, SIEGn.DE, MJN.N, PRU.L, UNH.N, LVS.N, BBNI.JK, BMWG.F, DUFN.S, LLY.N, LVMH.PA, FIO.N, CSCO.OQ, DSOM.KL, SAB.L, MONY.L, SBER.MM, IMT.L, DOM.L, ETL.PA, AZN.L, DISCA.OQ, XRX.N, NOVN.VX, PSON.L, 1099.HK, ABBN.VX, MEO1V.HE, 1880.HK, GOOG.OQ, MAHB.KL, GSK.L, CELG.OQ, CTSH.OQ, ADN.L, PGHN.S, BIIB.OQ, FREG.DE, BBCA.JK, PHG.AS, BBRI.JK, 0992.HK, MR.N, MLNX.OQ, DE.N, EOG.N, MSFT.OQ, PFE.N, CVS.N, GD.N, NI.N, VZ.N, MANU.N, EMC.N, BA.N, CHKP.OQ, SWK.N, UNP.N, AXP.N, DIS.N, CIE.N, INTC.OQ, HAL.N, GILD.OQ, CMG.N, AMZN.OQ, BMY.N, NBL.N, TDG.N, CAM.N, MDLZ.OQ, SLB.N, HOT.N, ETN.N, FIVE.OQ, 6502.T, AMGN.OQ, MRK.N, MCD.N, IRG.OQ, APC.N, ORCL.OQ, THOR.OQ, SOON.VX, STEL.SI, KRFT.OQ, NESN.VX, AXP.N, SLB.N, LLY.N, UTX.N, CHRH.CO) within the past 12 months
Credit Suisse expects to receive or intends to seek investment banking related compensation from the subject company (051900.KS, 036570.KS, 051910.KS, 000720.KS, 028050.KS, 020560.KS, 0883.HK, EXPN.L, 0700.HK, GDI.N, GWW.N, 0941.HK, 0293.HK, BRBY.L, DLTR.OQ, AIRA.KL, OLAM.SI, ALI.PS, FFIV.OQ, TUMI.N, DGE.L, BVI.PA, NXPI.OQ, PCLN.OQ, 2628.HK, BMRI.JK, ERII.OQ, VIV.PA, PERP.PA, HZNC.BO, JNJ.N, 1299.HK, AAPL.OQ, CONG.DE, 000568.SZ, CPG.L, BPI.PS, 0322.HK, GIAA.JK, SCHN.PA, BAYGn.DE, HYFL.SI, EDEN.PA, SLXP.OQ, 1044.HK, SIEGn.DE, BWA.N, MJN.N, SPMI.MI, PRU.L, UNH.N, SGSN.VX, SECB.PS, COAL.BO, LVS.N, MBT.PS, BBNI.JK, ADSGn.F, BMWG.F, 2610.TW, DUFN.S, BRCM.OQ, UNBP.PA, LLY.N, HTWR.OQ, DPWGn.DE, LVMH.PA, KLAC.OQ, IVRC.BO, MLC.L, HLMA.L, FIO.N, CSCO.OQ, DSOM.KL, SAB.L, HMSO.L, WPI.N, PWTN.S, MONY.L, LUPN.BO, UNTR.JK, KMX.N, GFINBURO.MX, SBER.MM, SAPG.F, 2357.TW, IMT.L, 6273.T, DOM.L, ETL.PA, TCS.BO, AZN.L, DISCA.OQ, XRX.N, NOVN.VX, BBBY.OQ, VRSK.OQ, PSON.L, 1099.HK, 1088.HK, 0753.HK, ABBN.VX, MEO1V.HE, 1880.HK, GOOG.OQ, MAHB.KL, GSK.L, HCLT.BO, 1055.HK, FDX.N, LLTC.OQ, FDO.N, CELG.OQ, APKT.OQ, VIGR.VI, AKSO.OL, CTSH.OQ, ADN.L, PGHN.S, BIIB.OQ, FREG.DE, FCX.N, BBCA.JK, SBUX.OQ, QCOM.OQ, PHG.AS, 3008.TW, SL.L, ZUMZ.OQ, CFR.VX, BBRI.JK, 0992.HK, MR.N, UMI.BR, 2318.HK, MLNX.OQ, JCI.N, DE.N, EOG.N, FTI.N, MSFT.OQ, SYK.N, TMO.N, PWR.N, PFE.N, EW.N, LULU.OQ, CVS.N, GD.N, NI.N, VZ.N, MANU.N, EMC.N, ABT.N, EMR.N, IHS.N, NKE.N, RLC.PS, HXL.N, BA.N, STJ.N, REL.L, CHKP.OQ, DHR.N, SWK.N, AGN.N, UNP.N, AXP.N, CREE.OQ, DIS.N, CYT.N, CIE.N, PLL.N, INTC.OQ, UPS.N, COST.OQ, WFM.OQ, HAL.N, GILD.OQ, ATVI.OQ, VOLC.OQ, CMG.N, AMZN.OQ, FMC.N, BMY.N, ITW.N, PH.N, FLS.N, NBL.N, TDG.N, CAM.N, MDLZ.OQ, HON.N, CAB.N, PCP.N, SLB.N, HOT.N, ITC.N, YUM.N, ETN.N, VFC.N, FIVE.OQ, 6502.T, 6503.T, URBN.OQ, AMGN.OQ, MRK.N, MCD.N, MELI.OQ, IRG.OQ, APC.N, ORCL.OQ, THOR.OQ, CRM.N, SOON.VX, TDC.N, STEL.SI, AMG.N, UA.N, KRFT.OQ, NESN.VX, COLG.BO, CI.N, ATVI.OQ, AXP.N, SLB.N, LLY.N, UTX.N, 6367.T, CHRH.CO) within the next 3 months.
Credit Suisse has received compensation for products and services other than investment banking services from the subject company (020560.KS, RYA.I, 0700.HK, 0293.HK, DGE.L, 2628.HK, BMRI.JK, VIV.PA, AAPL.OQ, CONG.DE, CPG.L, BAYGn.DE, ATCOa.ST, SIEGn.DE, PRU.L, SECB.PS, MBT.PS, BBNI.JK, ADSGn.F, BMWG.F, 2610.TW, BRCM.OQ, LLY.N, DPWGn.DE, LVMH.PA, HRGV.L, HRMS.PA, EZJ.L, CSCO.OQ, SHP.L, ROG.VX, GFINBURO.MX, IMT.L, 6273.T, TCS.BO, AZN.L, DISCA.OQ, NOVN.VX, PSON.L, ABBN.VX, FMEG.DE, GSK.L, FDX.N, FDO.N, ADN.L, PGHN.S, BBCA.JK, SMIN.L, SL.L, CFR.VX, 0992.HK, 2318.HK, DE.N, EOG.N, MSFT.OQ, TMO.N, PFE.N, CVS.N, VZ.N, EMC.N, EMR.N, BA.N, CHKP.OQ, AXP.N, DIS.N, INTC.OQ, HAL.N, BMY.N, NBL.N, HON.N, HOT.N, ITC.N, AMGN.OQ, MRK.N, MCD.N, APC.N, 6861.T, AMG.N, NESN.VX, DANO.PA, CI.N, AXP.N, LLY.N) within the past 12 months
As of the date of this report, Credit Suisse makes a market in the following subject companies (NLSN.N, GDI.N, GWW.N, DLTR.OQ, FFIV.OQ, TUMI.N, NXPI.OQ, PCLN.OQ, ERII.OQ, JNJ.N, AAPL.OQ, SLXP.OQ, BWA.N, MJN.N, VMW.N, UNH.N, LVS.N, BRCM.OQ, ORLY.OQ, LLY.N, HTWR.OQ, KLAC.OQ, PNRA.OQ, LXFR.N, FIO.N, CSCO.OQ, WPI.N, KMX.N, DISCA.OQ, XRX.N, BBBY.OQ, VRSK.OQ, GOOG.OQ, FDX.N, LLTC.OQ, FDO.N, CELG.OQ, APKT.OQ, EXPD.OQ, CTSH.OQ, BIIB.OQ, FCX.N, SBUX.OQ, QCOM.OQ, ZUMZ.OQ, MR.N, MLNX.OQ, JCI.N, DE.N, EOG.N, DG.N, FTI.N, MSFT.OQ, ROK.N, SYK.N, TMO.N, PWR.N, PFE.N, EW.N, LULU.OQ, CVS.N, GD.N, NI.N, VZ.N, MANU.N, EMC.N, ABT.N, EMR.N, IHS.N, NKE.N, HXL.N, BA.N, STJ.N, CHKP.OQ, DHR.N, SWK.N, AGN.N, UNP.N, AXP.N, CREE.OQ, DIS.N, CYT.N, CIE.N, PLL.N, INTC.OQ, UPS.N, COST.OQ, MA.N, WFM.OQ, HAL.N, GILD.OQ, ATVI.OQ, VOLC.OQ, CMG.N, AMZN.OQ, FMC.N, BMY.N, ITW.N, PH.N, FLS.N, NBL.N, TDG.N, CAM.N, MDLZ.OQ, HON.N, CAB.N, PCP.N, SLB.N, HOT.N, ITC.N, YUM.N, ETN.N, VFC.N, FIVE.OQ, 6502.T, URBN.OQ, AMGN.OQ, MRK.N, MCD.N, MELI.OQ, LIFE.OQ, IRG.OQ, JAZZ.OQ, APC.N, ORCL.OQ, THOR.OQ, CRM.N, TDC.N, V.N, AMG.N, UA.N, KRFT.OQ, CI.N, N.N, ATVI.OQ, AXP.N, SLB.N, LLY.N, UTX.N).
Credit Suisse may have interest in (AIRA.KL, DSOM.KL, MAHB.KL)
As of the end of the preceding month, Credit Suisse beneficially own 1% or more of a class of common equity securities of (051910.KS, RYA.I, EXPN.L, 2628.HK, AMEC.L, VIV.PA, JMAT.L, CPG.L, SASY.PA, TNTE.AS, PGS.OL, BAYGn.DE, SIEGn.DE, PRU.L, DUFN.S, 2354.TW, UNBP.PA, EZJ.L, HMSO.L, MONY.L, SHP.L, SAPG.F, 2357.TW, IMT.L, NOVN.VX, 1099.HK, 1088.HK, ABBN.VX, 2330.TW, WPP.L, PHG.AS, SMIN.L, 3008.TW, 2318.HK, CHKP.OQ, ASML.AS, SOON.VX, NESN.VX, DANO.PA).
Credit Suisse has a material conflict of interest with the subject company (0883.HK). Credit Suisse is acting as financial advisor to both CNOOC Ltd. and SINOPEC on the acquisition of Marathon Oil Corporation's 20% interest in Block 32, offshore Angola.
Credit Suisse has a material conflict of interest with the subject company (0293.HK). Jack So, a Senior Advisor of Credit Suisse, is an Independent Non-Executive Director of Cathay Pacific Airways Limited.
Credit Suisse has a material conflict of interest with the subject company (FFIV.OQ). As of the date of this report, an analyst involved in the preparation of this report has a long position in the common equity of F5 Networks.
Credit Suisse has a material conflict of interest with the subject company (DUFN.S). Credit Suisse has acted as Joint Bookrunner in the CHF 294m accelerated bookbuild of primary shares in Dufry. Proceeds from the capital increase will be used to finance the acqusition of 51% of Folli Follie?s Travel Retail Business.

23 November 2012
Global Equity Strategy 81
Credit Suisse has a material conflict of interest with the subject company (SHP.L). Susan Kilsby, an employee of Credit-Suisse, is a member of the Board of Directors of Shire PLC.
Credit Suisse has a material conflict of interest with the subject company (KNIN.VX). .
Credit Suisse has a material conflict of interest with the subject company (VRSK.OQ). Credit Suisse has a material conflict of interest with the subject company (VRSK). As of the date of this report, an analyst involved in the preparation of this report has the following material conflict of interest with the subject company (VRSK). An analyst or a member of the analyst's household has a long position in the common stock of Verisk Analytics.
Credit Suisse has a material conflict of interest with the subject company (GSK.L). Credit Suisse Securities (USA) LLC is acting as an advisor to Human Genome Sciences, Inc. (HGSI) in an announced potential transaction with Glaxo SmithKline (GSK).
Credit Suisse has a material conflict of interest with the subject company (PFE.N). A Credit Suisse analyst involved in the preparation of this report has a (long/short) position in the common stock of PFE.
Credit Suisse has a material conflict of interest with the subject company (GILD.OQ). A Credit Suisse analyst involved in the preparation of this report has a long position in the common stock of GILD.
Credit Suisse has a material conflict of interest with the subject company (CAM.N). Credit Suisse Securities (USA) LLC is acting as financial advisor to Cameron in connection with its announced joint venture with Schlumberger.
Credit Suisse has a material conflict of interest with the subject company (UTX.N). Credit Suisse Securities (USA) LLC is acting as an advisor to Goodrich (GR) in a potential transaction with United Technologies Corp.
Credit Suisse has a material conflict of interest with the subject company (6502.T). Credit Suisse Securities (USA) LLC is acting as an advisor to Landis+Gyr on the announced acquisition by Toshiba Corporation. This acquisition remains subject to regulatory approvals and other customary closing conditions.
As of the date of this report, an analyst involved in the preparation of this report has the following material conflict of interest with the subject company (FFIV.OQ). As of the date of this report, an analyst involved in the preparation of this report has a long position in the common equity of F5 Networks.
Important Regional Disclosures
Singapore recipients should contact a Singapore financial adviser for any matters arising from this research report.
The analyst(s) involved in the preparation of this report have not visited the material operations of the subject company (051900.KS, 036570.KS, 012330.KS, 051910.KS, 000720.KS, 028050.KS, 020560.KS, 035250.KS, RYA.I, NLSN.N, 0883.HK, EXPN.L, 0700.HK, GDI.N, GWW.N, 0941.HK, 0293.HK, ASSAb.ST, BRBY.L, 0670.HK, DLTR.OQ, AIRA.KL, OLAM.SI, ALI.PS, FFIV.OQ, TUMI.N, DAST.PA, DGE.L, BVI.PA, NXPI.OQ, PCLN.OQ, 2628.HK, AMEC.L, BMRI.JK, ERII.OQ, VIV.PA, PERP.PA, ALS.AX, HZNC.BO, JNJ.N, 0813.HK, 1299.HK, 2618.TW, JMAT.L, WTB.L, ITC.BO, CONG.DE, 000568.SZ, SBSP3.SA, CPI.L, CPG.L, 6481.T, SASY.PA, ASII.JK, TNTE.AS, BPI.PS, 0322.HK, GIAA.JK, PGS.OL, SCHN.PA, BAYGn.DE, GOCP.BO, HYFL.SI, PER.L, EDEN.PA, SLXP.OQ, ATCOa.ST, 1044.HK, SIEGn.DE, BWA.N, MJN.N, SPMI.MI, AIRP.PA, PRU.L, VMW.N, UNH.N, SGSN.VX, SECB.PS, COAL.BO, SUBC.OL, LVS.N, MBT.PS, BBNI.JK, ADSGn.F, BMWG.F, 2610.TW, ITRK.L, DUFN.S, HIK.L, BRCM.OQ, ORLY.OQ, 2354.TW, UNBP.PA, LLY.N, HTWR.OQ, BOSSn.DE, DPWGn.DE, SJP.L, LVMH.PA, HRGV.L, KLAC.OQ, IVRC.BO, PNRA.OQ, LXFR.N, MLC.L, HRMS.PA, HLMA.L, EZJ.L, FIO.N, CSCO.OQ, DSOM.KL, SAB.L, SCIL.SI, AGGK.L, HMSO.L, WPI.N, PWTN.S, MONY.L, TECF.PA, LUPN.BO, WDH.CO, UHR.VX, SHP.L, ROG.VX, UNTR.JK, KMX.N, GFINBURO.MX, SXS.L, SBER.MM, SAPG.F, 2357.TW, IMT.L, KNIN.VX, ROR.L, 6273.T, DOM.L, ETL.PA, TCS.BO, AZN.L, DISCA.OQ, XRX.N, NOVN.VX, BBBY.OQ, VRSK.OQ, 6954.T, PSON.L, 1099.HK, IHG.L, 1088.HK, 0753.HK, 600809.SS, ABBN.VX, MEO1V.HE, 2330.TW, 6268.T, 1880.HK, GOOG.OQ, MAHB.KL, FMEG.DE, GSK.L, PFC.L, HCLT.BO, 1055.HK, FDX.N, WPP.L, LLTC.OQ, 6506.T, FDO.N, CELG.OQ, GUD.AX, APKT.OQ, VIGR.VI, EXPD.OQ, AKSO.OL, CTSH.OQ, ADN.L, PGHN.S, BIIB.OQ, FREG.DE, NOVOb.CO, FCX.N, BBCA.JK, SBUX.OQ, QCOM.OQ, PHG.AS, SMIN.L, 3008.TW, SL.L, ZUMZ.OQ, 600519.SS, COLOb.CO, PAP.I, CFR.VX, BBRI.JK, SPX.L, 0992.HK, MR.N, NYN.L, UMI.BR, 2318.HK, MLNX.OQ, JCI.N, DE.N, EOG.N, DG.N, FTI.N, MSFT.OQ, ROK.N, SYK.N, TMO.N, PWR.N, PFE.N, EW.N, LULU.OQ, CVS.N, GD.N, NI.N, VZ.N, MANU.N, 6472.T, EMC.N, ABT.N, EMR.N, IHS.N, NKE.N, RLC.PS, HXL.N, BA.N, STJ.N, REL.L, CHKP.OQ, DHR.N, AGN.N, UNP.N, AXP.N, CREE.OQ, DIS.N, CYT.N, CIE.N, PLL.N, INTC.OQ, UPS.N, COST.OQ, MA.N, WFM.OQ, HAL.N, GILD.OQ, ATVI.OQ, VOLC.OQ, CMG.N, AMZN.OQ, FMC.N, BMY.N, ITW.N, PH.N, FLS.N, NBL.N, TDG.N, CAM.N, MDLZ.OQ, HON.N, CAB.N, PCP.N, SLB.N, HOT.N, ITC.N, YUM.N, ETN.N, VFC.N, FIVE.OQ, 6502.T, 6503.T, URBN.OQ, AMGN.OQ, MRK.N, MCD.N, MELI.OQ, LIFE.OQ, IRG.OQ, JAZZ.OQ, APC.N, ORCL.OQ, ASML.AS, 6861.T, THOR.OQ, CRM.N, SOON.VX, TDC.N, STEL.SI, V.N, AMG.N, UA.N, KRFT.OQ, DSV.CO, NESN.VX, OREP.PA, DANO.PA, UNc.AS, RB.L, COLG.BO, CI.N, N.N, ATVI.OQ, AXP.N, SLB.N, LLY.N, UTX.N, 6367.T, CHRH.CO) within the past 12 months
An analyst involved in the preparation of this report has visited certain material operations of the subject company (AAPL.OQ, SWK.N) within the past 12 months
The travel expenses of the analyst in connection with such visits were not paid or reimbursed by the subject company, other than de minimus local travel expenses.
Restrictions on certain Canadian securities are indicated by the following abbreviations: NVS--Non-Voting shares; RVS--Restricted Voting Shares; SVS--Subordinate Voting Shares.
Individuals receiving this report from a Canadian investment dealer that is not affiliated with Credit Suisse should be advised that this report may not contain regulatory disclosures the non-affiliated Canadian investment dealer would be required to make if this were its own report.

23 November 2012
Global Equity Strategy 82
For Credit Suisse Securities (Canada), Inc.'s policies and procedures regarding the dissemination of equity research, please visit http://www.csfb.com/legal_terms/canada_research_policy.shtml.
The following disclosed European company/ies have estimates that comply with IFRS: (RYA.I, EXPN.L, ASSAb.ST, DAST.PA, DGE.L, VIV.PA, PERP.PA, JMAT.L, CONG.DE, CPG.L, SASY.PA, SCHN.PA, ATCOa.ST, SIEGn.DE, SPMI.MI, PRU.L, SGSN.VX, ADSGn.F, BMWG.F, ITRK.L, DUFN.S, HIK.L, BOSSn.DE, DPWGn.DE, MLC.L, HLMA.L, EZJ.L, SAB.L, HMSO.L, PWTN.S, TECF.PA, WDH.CO, SBER.MM, SAPG.F, IMT.L, KNIN.VX, AZN.L, PSON.L, IHG.L, ABBN.VX, MEO1V.HE, FMEG.DE, PFC.L, WPP.L, VIGR.VI, ADN.L, PGHN.S, FREG.DE, PHG.AS, SMIN.L, SL.L, SPX.L, REL.L, BMY.N, ASML.AS, SOON.VX, NESN.VX, OREP.PA, DANO.PA, UNc.AS, RB.L).
As of the end of the preceding month, the subject company (SWK.N) beneficially owned 5% or more of the total issued share capital of Credit Suisse Group.
As of the date of this report, Credit Suisse acts as a market maker or liquidity provider in the equities securities that are the subject of this report.
Principal is not guaranteed in the case of equities because equity prices are variable.
Commission is the commission rate or the amount agreed with a customer when setting up an account or at any time after that.
To the extent this is a report authored in whole or in part by a non-U.S. analyst and is made available in the U.S., the following are important disclosures regarding any non-U.S. analyst contributors: The non-U.S. research analysts listed below (if any) are not registered/qualified as research analysts with FINRA. The non-U.S. research analysts listed below may not be associated persons of CSSU and therefore may not be subject to the NASD Rule 2711 and NYSE Rule 472 restrictions on communications with a subject company, public appearances and trading securities held by a research analyst account.
Credit Suisse Securities (Europe) Limited. Andrew Garthwaite ; Marina Pronina ; Mark Richards ; Robert Griffiths ; Sebastian Raedler ; Nicolas Wylenzek
Important MSCI Disclosures
The MSCI sourced information is the exclusive property of Morgan Stanley Capital International Inc. (MSCI). Without prior written permission of MSCI, this information and any other MSCI intellectual property may not be reproduced, re-disseminated or used to create and financial products, including any indices. This information is provided on an "as is" basis. The user assumes the entire risk of any use made of this information. MSCI, its affiliates and any third party involved in, or related to, computing or compiling the information hereby expressly disclaim all warranties of originality, accuracy, completeness, merchantability or fitness for a particular purpose with respect to any of this information. Without limiting any of the foregoing, in no event shall MSCI, any of its affiliates or any third party involved in, or related to, computing or compiling the information have any liability for any damages of any kind. MSCI, Morgan Stanley Capital International and the MSCI indexes are services marks of MSCI and its affiliates.
The Global Industry Classification Standard (GICS) was developed by and is the exclusive property of Morgan Stanley Capital International Inc. and Standard & Poor’s. GICS is a service mark of MSCI and S&P and has been licensed for use by Credit Suisse.
Important Credit Suisse HOLT Disclosures
With respect to the analysis in this report based on the Credit Suisse HOLT methodology, Credit Suisse certifies that (1) the views expressed in this report accurately reflect the Credit Suisse HOLT methodology and (2) no part of the Firm’s compensation was, is, or will be directly related to the specific views disclosed in this report
The Credit Suisse HOLT methodology does not assign ratings to a security. It is an analytical tool that involves use of a set of proprietary quantitative algorithms and warranted value calculations, collectively called the Credit Suisse HOLT valuation model, that are consistently applied to all the companies included in its database. Third-part data (including consensus earnings estimates) are systematically translated into a number of default algorithms available in the Credit Suisse HOLT valuation model. The source financial statement, pricing, and earnings data provided by outside data vendors are subject to quality control and may also be adjusted to more closely measure the underlying economics of firm performance. The adjustments provide consistency when analyzing a single company across time, or analyzing multiple companies across industries or national borders. The default scenario that is produced by the Credit Suisse HOLT valuation model establishes the baseline valuation for a security, and a user then may adjust the default variables to produce alternative scenarios, any of which could occur.
Additional information about the Credit Suisse HOLT methodology is available on request.
The Credit Suisse HOLT methodology does not assign a price target to a security. The default scenario that is produced by the Credit Suisse HOLT valuation model establishes a warranted price for a security, and as the third-party data are updated, the warranted price may also change. The default variable may also be adjusted to produce alternative warranted prices, any of which could occur.
CFROI®, HOLT, HOLTfolio, ValueSearch, AggreGator, Signal Flag and “Powered by HOLT” are trademarks or service marks or registered trademarks or registered service marks of Credit Suisse or its affiliates in the United States and other countries. HOLT is a corporate performance and valuation advisory service of Credit Suisse.
For Credit Suisse disclosure information on other companies mentioned in this report, please visit the website at www.credit-suisse.com/researchdisclosures or call +1 (877) 291-2683.

23 November 2012
Global Equity Strategy 83
References in this report to Credit Suisse include all of the subsidiaries and affiliates of Credit Suisse operating under its investment banking division. For more information on our structure, please use the following link: https://www.credit-suisse.com/who_we_are/en/.This report may contain material that is not directed to, or intended for distribution to or use by, any person or entity who is a citizen or resident of or located in any locality, state, country or other jurisdiction where such distribution, publication, availability or use would be contrary to law or regulation or which would subject Credit Suisse AG or its affiliates ("CS") to any registration or licensing requirement within such jurisdiction. All material presented in this report, unless specifically indicated otherwise, is under copyright to CS. None of the material, nor its content, nor any copy of it, may be altered in any way, transmitted to, copied or distributed to any other party, without the prior express written permission of CS. All trademarks, service marks and logos used in this report are trademarks or service marks or registered trademarks or service marks of CS or its affiliates. The information, tools and material presented in this report are provided to you for information purposes only and are not to be used or considered as an offer or the solicitation of an offer to sell or to buy or subscribe for securities or other financial instruments. CS may not have taken any steps to ensure that the securities referred to in this report are suitable for any particular investor. CS will not treat recipients of this report as its customers by virtue of their receiving this report. The investments and services contained or referred to in this report may not be suitable for you and it is recommended that you consult an independent investment advisor if you are in doubt about such investments or investment services. Nothing in this report constitutes investment, legal, accounting or tax advice, or a representation that any investment or strategy is suitable or appropriate to your individual circumstances, or otherwise constitutes a personal recommendation to you. CS does not advise on the tax consequences of investments and you are advised to contact an independent tax adviser. Please note in particular that the bases and levels of taxation may change. Information and opinions presented in this report have been obtained or derived from sources believed by CS to be reliable, but CS makes no representation as to their accuracy or completeness. CS accepts no liability for loss arising from the use of the material presented in this report, except that this exclusion of liability does not apply to the extent that such liability arises under specific statutes or regulations applicable to CS. This report is not to be relied upon in substitution for the exercise of independent judgment. CS may have issued, and may in the future issue, other communications that are inconsistent with, and reach different conclusions from, the information presented in this report. Those communications reflect the different assumptions, views and analytical methods of the analysts who prepared them and CS is under no obligation to ensure that such other communications are brought to the attention of any recipient of this report. CS may, to the extent permitted by law, participate or invest in financing transactions with the issuer(s) of the securities referred to in this report, perform services for or solicit business from such issuers, and/or have a position or holding, or other material interest, or effect transactions, in such securities or options thereon, or other investments related thereto. In addition, it may make markets in the securities mentioned in the material presented in this report. CS may have, within the last three years, served as manager or co-manager of a public offering of securities for, or currently may make a primary market in issues of, any or all of the entities mentioned in this report or may be providing, or have provided within the previous 12 months, significant advice or investment services in relation to the investment concerned or a related investment. Additional information is, subject to duties of confidentiality, available on request. Some investments referred to in this report will be offered solely by a single entity and in the case of some investments solely by CS, or an associate of CS or CS may be the only market maker in such investments. Past performance should not be taken as an indication or guarantee of future performance, and no representation or warranty, express or implied, is made regarding future performance. Information, opinions and estimates contained in this report reflect a judgment at its original date of publication by CS and are subject to change without notice. The price, value of and income from any of the securities or financial instruments mentioned in this report can fall as well as rise. The value of securities and financial instruments is subject to exchange rate fluctuation that may have a positive or adverse effect on the price or income of such securities or financial instruments. Investors in securities such as ADR's, the values of which are influenced by currency volatility, effectively assume this risk. Structured securities are complex instruments, typically involve a high degree of risk and are intended for sale only to sophisticated investors who are capable of understanding and assuming the risks involved. The market value of any structured security may be affected by changes in economic, financial and political factors (including, but not limited to, spot and forward interest and exchange rates), time to maturity, market conditions and volatility, and the credit quality of any issuer or reference issuer. Any investor interested in purchasing a structured product should conduct their own investigation and analysis of the product and consult with their own professional advisers as to the risks involved in making such a purchase. Some investments discussed in this report may have a high level of volatility. High volatility investments may experience sudden and large falls in their value causing losses when that investment is realised. Those losses may equal your original investment. Indeed, in the case of some investments the potential losses may exceed the amount of initial investment and, in such circumstances, you may be required to pay more money to support those losses. Income yields from investments may fluctuate and, in consequence, initial capital paid to make the investment may be used as part of that income yield. Some investments may not be readily realisable and it may be difficult to sell or realise those investments, similarly it may prove difficult for you to obtain reliable information about the value, or risks, to which such an investment is exposed. This report may provide the addresses of, or contain hyperlinks to, websites. Except to the extent to which the report refers to website material of CS, CS has not reviewed any such site and takes no responsibility for the content contained therein. Such address or hyperlink (including addresses or hyperlinks to CS's own website material) is provided solely for your convenience and information and the content of any such website does not in any way form part of this document. Accessing such website or following such link through this report or CS's website shall be at your own risk. This report is issued and distributed in Europe (except Switzerland) by Credit Suisse Securities (Europe) Limited, One Cabot Square, London E14 4QJ, England, which is regulated in the United Kingdom by The Financial Services Authority ("FSA"). This report is being distributed in Germany by Credit Suisse Securities (Europe) This report is being distributed in the United States and Canada by Credit Suisse Securities (USA) LLC; in Switzerland by Credit Suisse AG; in Brazil by Banco de Investimentos Credit Suisse (Brasil) S.A or its affiliates; in Mexico by Banco Credit Suisse (México), S.A. (transactions related to the securities mentioned in this report will only be effected in compliance with applicable regulation); in Japan by Credit Suisse Securities (Japan) Limited, Financial Instruments Firm, Director-General of Kanto Local Finance Bureau (Kinsho) No. 66, a member of Japan Securities Dealers Association, The Financial Futures Association of Japan, Japan Investment Advisers Association, Type II Financial Instruments Firms Association; elsewhere in Asia/ Pacific by whichever of the following is the appropriately authorised entity in the relevant jurisdiction: Credit Suisse (Hong Kong) Limited, Credit Suisse Equities (Australia) Limited, Credit Suisse Securities (Thailand) Limited, Credit Suisse Securities (Malaysia) Sdn Bhd, Credit Suisse AG, Singapore Branch, Credit Suisse Securities (India) Private Limited regulated by the Securities and Exchange Board of India (registration Nos. INB230970637; INF230970637; INB010970631; INF010970631), having registered address at 9th Floor, Ceejay House,Dr.A.B. Road, Worli, Mumbai - 18, India, T- +91-22 6777 3777, Credit Suisse Securities (Europe) Limited, Seoul Branch, Credit Suisse AG, Taipei Securities Branch, PT Credit Suisse Securities Indonesia, Credit Suisse Securities (Philippines ) Inc., and elsewhere in the world by the relevant authorised affiliate of the above. Research on Taiwanese securities produced by Credit Suisse AG, Taipei Securities Branch has been prepared by a registered Senior Business Person. Research provided to residents of Malaysia is authorised by the Head of Research for Credit Suisse Securities (Malaysia) Sdn Bhd, to whom they should direct any queries on +603 2723 2020. This research may not conform to Canadian disclosure requirements. In jurisdictions where CS is not already registered or licensed to trade in securities, transactions will only be effected in accordance with applicable securities legislation, which will vary from jurisdiction to jurisdiction and may require that the trade be made in accordance with applicable exemptions from registration or licensing requirements. Non-U.S. customers wishing to effect a transaction should contact a CS entity in their local jurisdiction unless governing law permits otherwise. U.S. customers wishing to effect a transaction should do so only by contacting a representative at Credit Suisse Securities (USA) LLC in the U.S. Please note that this research was originally prepared and issued by CS for distribution to their market professional and institutional investor customers. Recipients who are not market professional or institutional investor customers of CS should seek the advice of their independent financial advisor prior to taking any investment decision based on this report or for any necessary explanation of its contents. This research may relate to investments or services of a person outside of the UK or to other matters which are not regulated by the FSA or in respect of which the protections of the FSA for private customers and/or the UK compensation scheme may not be available, and further details as to where this may be the case are available upon request in respect of this report. CS may provide various services to US municipal entities or obligated persons ("municipalities"), including suggesting individual transactions or trades and entering into such transactions. Any services CS provides to municipalities are not viewed as "advice" within the meaning of Section 975 of the Dodd-Frank Wall Street Reform and Consumer Protection Act. CS is providing any such services and related information solely on an arm's length basis and not as an advisor or fiduciary to the municipality. In connection with the provision of the any such services, there is no agreement, direct or indirect, between any municipality (including the officials, management, employees or agents thereof) and CS for CS to provide advice to the municipality. Municipalities should consult with their financial, accounting and legal advisors regarding any such services provided by CS. In addition, CS is not acting for direct or indirect compensation to solicit the municipality on behalf of an unaffiliated broker, dealer, municipal securities dealer, municipal advisor, or investment adviser for the purpose of obtaining or retaining an engagement by the municipality for or in connection with Municipal Financial Products, the issuance of municipal securities, or of an investment adviser to provide investment advisory services to or on behalf of the municipality. If this report is being distributed by a financial institution other than Credit Suisse AG, or its affiliates, that financial institution is solely responsible for distribution. Clients of that institution should contact that institution to effect a transaction in the securities mentioned in this report or require further information. This report does not constitute investment advice by Credit Suisse to the clients of the distributing financial institution, and neither Credit Suisse AG, its affiliates, and their respective officers, directors and employees accept any liability whatsoever for any direct or consequential loss arising from their use of this report or its content. Principal is not guaranteed. Commission is the commission rate or the amount agreed with a customer when setting up an account or at any time after that.
Copyright © 2012 CREDIT SUISSE AG and/or its affiliates. All rights reserved.
Investment principal on bonds can be eroded depending on sale price or market price. In addition, there are bonds on which investment principal can be eroded due to changes in redemption amounts. Care is required when investing in such instruments.
When you purchase non-listed Japanese fixed income securities (Japanese government bonds, Japanese municipal bonds, Japanese government guaranteed bonds, Japanese corporate bonds) from CS as a seller, you will be requested to pay the purchase price only.