Embed Size (px)
Citation preview
1
IR Contacts
Email: [email protected] Site: www.voegol.com.br/ir Tel: +55 (11) 2128-4700 Leonardo Pereira Chief Financial and Investor Relations Officer
Rodrigo Alves Head of Investor Relations
Guilherme Lima Investor Relations
Raquel Kim Investor Relations
2Q09 Earnings Results Webcast Wednesday August 12, 2009 English 10:00 a.m. (US EST) 11:00 a.m. (Brasília) Tel.: +1 (973) 935-8893 Replay: +1 (706) 645-9291 Code: 20966854 Live Webcast: www.voegol.com.br/ir Portuguese 11:30 a.m. (US EST) 12:30 a.m. (Brasília) Tel.: +55 (11) 2188-0188 Replay: +55 (11) 2188-0188 Code: GOL Live Webcast: www.voegol.com.br/ri
GOL Announces Net Income of R$354mm in 2Q09
Operating income totals R$90mm, with a margin of 6.5%
São Paulo, August 11, 2009 – GOL Linhas Aéreas Inteligentes S.A. (Bovespa: GOLL4 and NYSE: GOL), the
largest low-cost and low-fare airline in Latin America, announces today its results for the second quarter of
2009 (2Q09). The following financial and operating information, unless otherwise indicated, is presented in
accordance with International Financial Reporting Standards (IFRS) and in Brazilian Reais (R$) , and all
comparisons are with the second quarter of 2008 (2Q08) and first quarter of 2009 (1Q09) . The definitions of
financial and airline industry terms used in this release are available in the “glossary” section at the end of this document .
Operating and Financial Highlights
GOL’s 2Q09 operating result (EBIT) was positive and totaled
R$89.9mm, with an operating margin of 6.5%,versus a operating loss of
R$295.3mm and a negative margin of 20.2% in 2Q08 and totaled R$105.1mm
with a margin of 6.9% in 1Q09. Despite the second quarter is the less favorable
of the year due seazonality, the Company achieved positive operating result for
the fourth consecutive quarter.
EBITDAR margin stood at 18.6% (R$258.8mm), versus a negative
7.8% in 2Q08 (a negative EBITDAR of R$114.4mm) and a positive margin of
23.7% (R$359.3mm) in 1Q09.
GOL posted a 2Q09 net income of R$353.7mm, with a net margin of
25.4%, versus a net loss of R$166.5mm in 2Q08 and net income of R$61.4mm
in 1Q09.
Operating costs and expenses totaled R$1,304.1mm in 2Q09, 25.9%
down on 2Q08, due to: (i) the operating synergies, thanks to the merger of
GOL and VRG’s operations as of 4Q08, especially in the sales & advertising
and maintenance, materials & repairs lines, (ii) the reduction in the average jet
fuel price, partially offset by the period exchange devaluation. In comparison
with 1Q09, operating costs and expenses fell by 7.6%, thanks to the average
Dollar devaluation against to the Real of 10.3% and also by the capture of
operational synergies.
On June 30, GOL entered into a partnership with Bradesco and Banco
do Brasil for the issue and management of co-branded credit cards,
enabling the banks to issue credit cards under the SMILES brand. As part of
the agreement, GOL will receive around R$255.0mm (R$104mm of which
already received in June 2009) from the sales of SMILES miles to the two
institutions, the banks’ right to access and use its database and a share in the
revenue generated by the cards.
Highlights(R$MM) 2Q09 2Q08 Chg.% 1Q09 %Chg.
Net Revenue 1,394.0 1,464.9 -4.8% 1,517.0 -8.1%
Operating Expenses (1,304.1) (1,760.1) -25.9% (1,411.9) -7.6%
Operating Income (EBIT) 89.9 (295.3) nm 105.1 -14.4%
Operating Margin 6.5% -20.2% +26.6 pp 6.9% -0.5 pp
EBITDAR 258.8 (114.4) nm 359.3 -28.0%
EBITDAR Margin 18.6% -7.8% +26.4 pp 23.7% -5.1 pp
Net Income 353.7 (166.5) nm 61.4 475.7%
2
GOL is continuing to restructure its cash and cash equivalents, which
totaled R$613.7 mm in 2Q09, 55.5% up on the R$394.6mm recorded in the
previous quarter. The Company intends to achieve a balance of at least
R$800mm by the end of 2009 and R$1.2 billion by the close of 2010,
representing approximately 13% and 19%, respectively, of last -12-month net
revenue. The increase was due to a series of initiatives implemented by the
Company with this in mind, including the capital increase announced in March
2009 and completed during the second quarter, the debenture issue and the
partnership involving the co-branded SMILES cards.
In line with its strategy of combining the renovation of its fleet with the
disciplined growth of its seat supply, GOL concluded the following operating
agreements and initiatives:
Agreement with Boeing to reschedule the delivery of 20 Boeing 737 Next
Generation aircraft from between 2010 and 2012 to between 2010 and
2014.
Sub-leasing of two 737-800s to a European airline, with return scheduled
for October 2009.
Replacement of a 767-300 with a 737-800 in April, leaving six wide-body
aircraft currently out of commission, two of which are currently under sub-
leasing negotiations (sub-lease and wet-lease).
Delivery of three 737-800NG’s (two of which SFPs) as part of the 737 -700
and 737-800 fleet standardization, which aims to replace all remaining
737-300s in 2009.
As a result of the above, GOL closed the quarter with an operational fleet
of 110 operational aircraft and a total fleet of 124 aircraft comparing to 107 and
120 in 1Q09, respectively. The Company estimates to reach the end of 2009
with 108 aircraft in its operating fleet.
During the quarter, GOL signed two important code share agreements,
the first with AirFrance-KLM in April and the second with American Airlines in
July. The agreements are part of GOL’s strategy of seeking partnerships with
the most important airlines in the long-haul segment, thereby generating more
value for its clients, who can use their SMILES miles to travel to the most varied
destinations around the world, while at the same time encouraging clients of the
partner companies to fly with GOL.
In April, GOL strenghtened its e-commerce platform by introducing car
rental and insurance sales with GOL ticket purchase, creating new opportunities
of sales and ancillary revenue.
Also in April, the Company launched Gollog Express, a new GOLLOG
product line designed to meet growing demand in the express cargo market,
offering door-to-door deliveries with previously defined deadlines. Express
delivery services are currently experiencing the largest growth rates in the
cargo transport segment.
GOL’s cash and cash
equivalents closed 2Q09 at
R$613.7mm, on-schedule for the
end-of-year target of at least
R$800.0mm.
The code share agreements with
American Airlines and Air
France-KLM will generate value
for GOL clients, who will be able
to exchange their SMILES miles
for trips to various destinations
around the world.
3
Management Comments
GOL’s 2Q09 performance reflects its strategic focus on generating consistent
operating results, based on a differentiated value proposition for its clients, in
turn based on high frequencies on routes between the main domestic airports,
underpinned by punctuality and regularity, and a modern standardized fleet of
Boeing 737s.
The exemplary quality of GOL’s services is complemented by the benefits of
SMILES, Latin America’s biggest loyalty program with more than 6.2mm clients,
which is currently being revitalized, and of VOEFACIL, virtual credit card that
boost sales to passengers who are not credit card holders. GOL also has one of
the most extensive e-commerce platforms in Brazil, which recently began
offering such ancillary products as insurance and car rentals in addition to its
ticket sales.
The Company’s first-half performance still reflected the successful consolidation
of GOL’s and VARIG’s assets at the end of 2008 , resulting in better service
quality, improved revenue and cost management. One important indicator of
these activities was the generation of positive operational cash flow for the
fourth successive quarter and GOL’s confirmation among those airlines with the
lowest operating costs in the world.
In the coming quarters, the Company will keep the challenge of continuously
improve quality, punctuality and regularity, reducing operating costs and
manage capacity while at the same time raising the aircraft utilization rate as
much as possible. That will assure a solid improve of the quality of its operating
results and financial indicators.
Operating Performance
Industry
In the second-quarter and first-half of 2009, domestic flight demand in the
Brazilian market, measured by revenue passenger kilometers (domestic RPK)
increased by 1.8% and 3.1%, respectively, over the same periods last year.
Despite this statistical growth, however, the Company believes that real demand
growth remained flat in the first six months, due to the increased of low-fare
seats supply and introductory fares by new entrants during the semester. The
expected GOL’s annual growth for 2009 of between 2% and 4%, should only
take place in the second half, when yields should remain stable yields, perhaps
even falling slightly below the 2008 average.
Domestic-market supply in 2Q09, measured by available seat kilometers
(domestic ASK) increased by 10.3% over 2Q08, representing an average load
factor of 62.5%.
In the international market, demand and supply increased 0.2% and 3.7%
respectively, leading to a load factor of 65.5%, while in consolidated terms,
demand in the Brazilian market increased by 1.4% and supply climbed by 8.4%,
with a load factor of 63.3% in 2Q09.
First-half results show that
GOL’s strategic plan is on-target.
4
Historically, the second quarter is seasonally unfavorable for the Brazilian
airline industry since it is the only one without a vacation and tourism high
season, being dominated by business passengers.
GOL
GOL’s domestic RPK fell 8.8% year-over-year in 2Q09, chiefly due to: (i)
improved yield management; (ii) the unification of the route network; (iii) the
reduction in the average aircraft utilization rate; and (iv) lower GDP growth rate
during the first half of 2009.
Domestic demand moved up by 1.1% over 1Q09, as a result of the increasing
penetration of the business segment due to the SMILES program and the new
fare packages launched in April, which ensure a better positioning in the low
season.
In the international market, demand fell by 47.9% over 2Q08 mainly due to the
discontinuation of long-haul routes in 3Q08. In relation to the previous quarter,
RPK fell by 11.2% due to the lack of a vacation high season period (the
Company’s international network is more geared towards tourism) .
Consolidated RPK fell 16.0% over 2Q08 and by 0.4% over 1Q09.
The average aircraft utilization rate recorded an 11.4% year-over-year decline,
from 12.8 hours/day in 2Q08 to 11.3 hours/day in 2Q09, primarily reflecting the
Company’s strategic decision to: (i) manage capacity; (ii) the close of long-haul
routes, which reduced ASK supply, especially in the international market, and
the average stage length decrease by 8.5% over 2Q08; and (iii) the new
Brazilian regulatory framework, which became effective as of March 2008,
requires that aircraft remain grounded for a minimum period between arrivals
and departures. In comparison with 1Q09, the average aircraft utilization rate
remained flat at 11.3 hours/day.
Since June, GOL has continued to manage its operating capacity, aiming to
dilute operating costs per ASK in the coming quarters and the average aircraft
utilization rate began to move up, reaching 12 hours/day in June.
These factors were partially offset by the year-over-year reduction in the
average fleet from 109.3 to 108.2 operational aircraft, due to the interim
withdrawal of operational Boeing 767-300s that were previously used on the
discontinued long-haul flights. In comparison with 1Q09, the average
operational fleet edged up by 0.9%, due to the process of replacing the 737-
300s with 737-800s and 737-700s.
As a result, the Company reduced its ASK by 9.8%, from R$10,677mm in 2Q08
to R$ 9,635mm in 2Q09. In comparison with 1Q09, ASK moved up by 0.9%,
chiefly reflecting the increase in the average operational fleet in 1Q09.
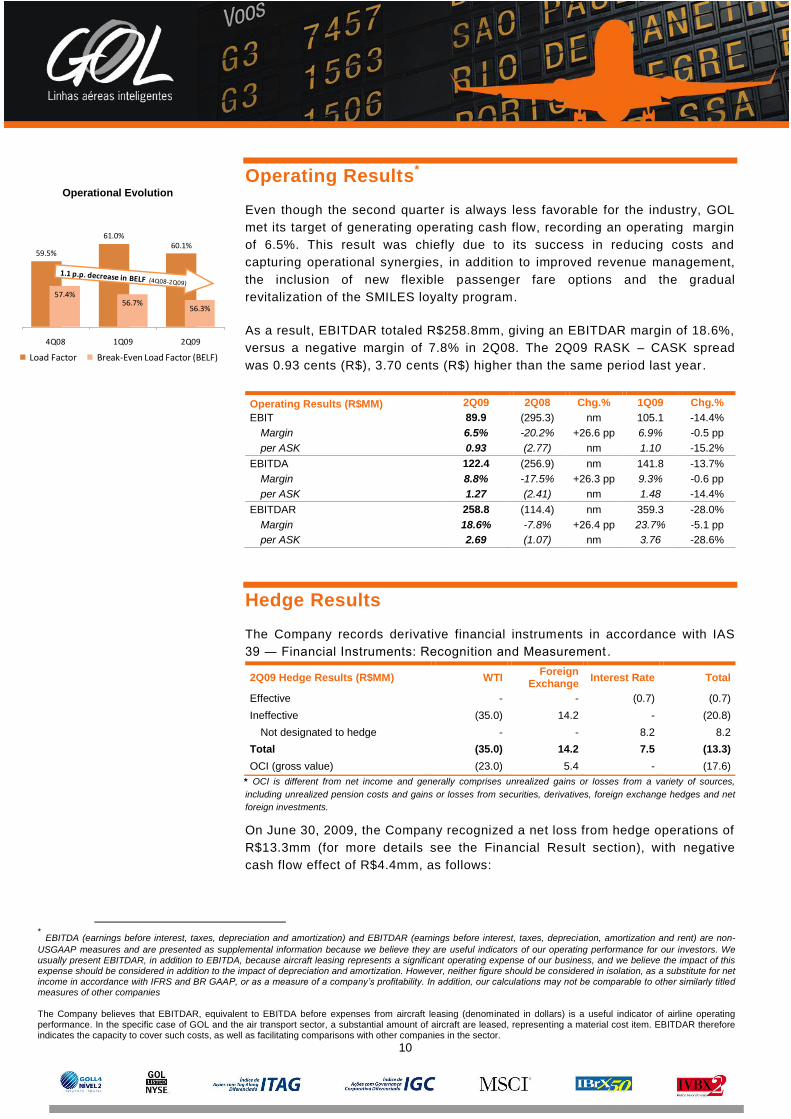
Given this scenario, GOL’s 2Q09 load factor stood at 60.1%, 3.8 percentage
points higher than the 56.3% break-even load factor reached in the same
period, despite the fact that the low season is concentrated in the second
quarter.
Second-quarter operating
results were positively
impacted by improved yield
management following the
consolidation of GOL’s and
VRG’s operations in 4Q08.
5
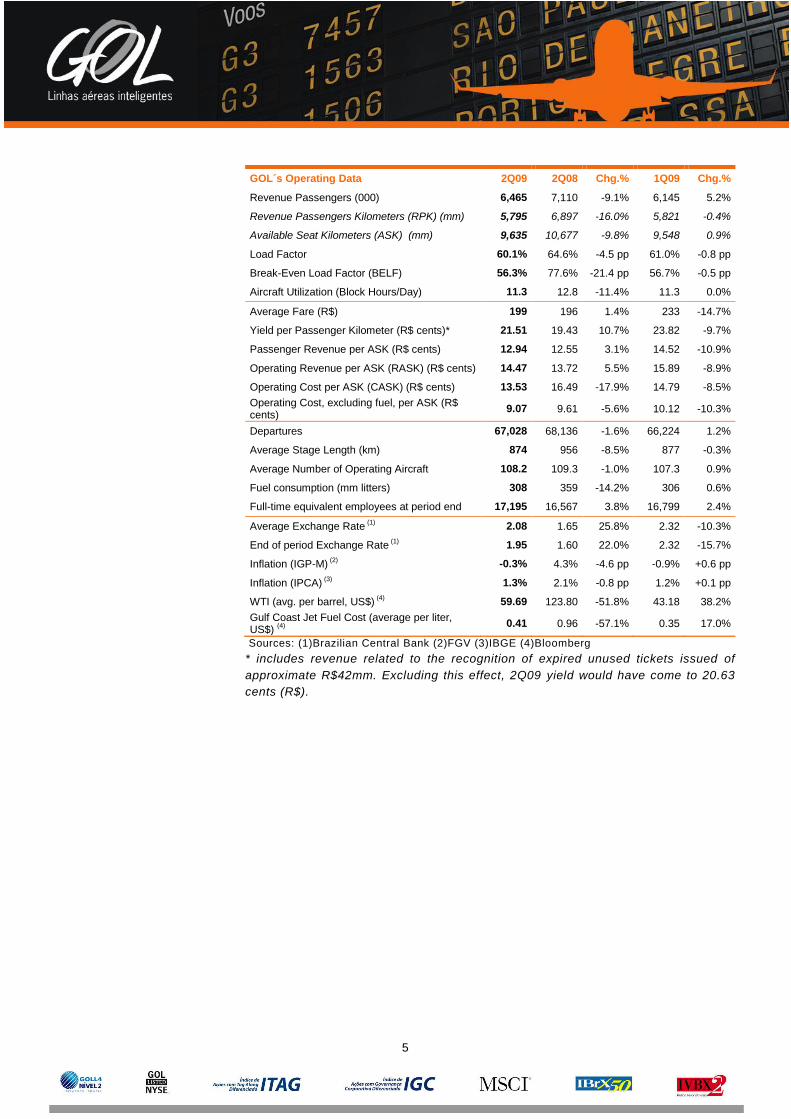
GOL´s Operating Data 2Q09 2Q08 Chg.% 1Q09 Chg.%
Revenue Passengers (000) 6,465 7,110 -9.1% 6,145 5.2%
Revenue Passengers Kilometers (RPK) (mm) 5,795 6,897 -16.0% 5,821 -0.4%
Available Seat Kilometers (ASK) (mm) 9,635 10,677 -9.8% 9,548 0.9%
Load Factor 60.1% 64.6% -4.5 pp 61.0% -0.8 pp
Break-Even Load Factor (BELF) 56.3% 77.6% -21.4 pp 56.7% -0.5 pp
Aircraft Utilization (Block Hours/Day) 11.3 12.8 -11.4% 11.3 0.0%
Average Fare (R$) 199 196 1.4% 233 -14.7%
Yield per Passenger Kilometer (R$ cents)* 21.51 19.43 10.7% 23.82 -9.7%
Passenger Revenue per ASK (R$ cents) 12.94 12.55 3.1% 14.52 -10.9%
Operating Revenue per ASK (RASK) (R$ cents) 14.47 13.72 5.5% 15.89 -8.9%
Operating Cost per ASK (CASK) (R$ cents) 13.53 16.49 -17.9% 14.79 -8.5%
Operating Cost, excluding fuel, per ASK (R$ cents)
9.07 9.61 -5.6% 10.12 -10.3%
Departures 67,028 68,136 -1.6% 66,224 1.2%
Average Stage Length (km) 874 956 -8.5% 877 -0.3%
Average Number of Operating Aircraft 108.2 109.3 -1.0% 107.3 0.9%
Fuel consumption (mm litters) 308 359 -14.2% 306 0.6%
Full-time equivalent employees at period end 17,195 16,567 3.8% 16,799 2.4%
Average Exchange Rate (1)
2.08 1.65 25.8% 2.32 -10.3%
End of period Exchange Rate (1)
1.95 1.60 22.0% 2.32 -15.7%
Inflation (IGP-M) (2)
-0.3% 4.3% -4.6 pp -0.9% +0.6 pp
Inflation (IPCA) (3)
1.3% 2.1% -0.8 pp 1.2% +0.1 pp
WTI (avg. per barrel, US$) (4)
59.69 123.80 -51.8% 43.18 38.2%
Gulf Coast Jet Fuel Cost (average per liter, US$)
(4)
0.41 0.96 -57.1% 0.35 17.0%
Sources: (1)Brazilian Central Bank (2)FGV (3)IBGE (4)Bloomberg
* includes revenue related to the recognition of expired unused tickets issued of
approximate R$42mm. Excluding this effect, 2Q09 yield would have come to 20.63
cents (R$).
6
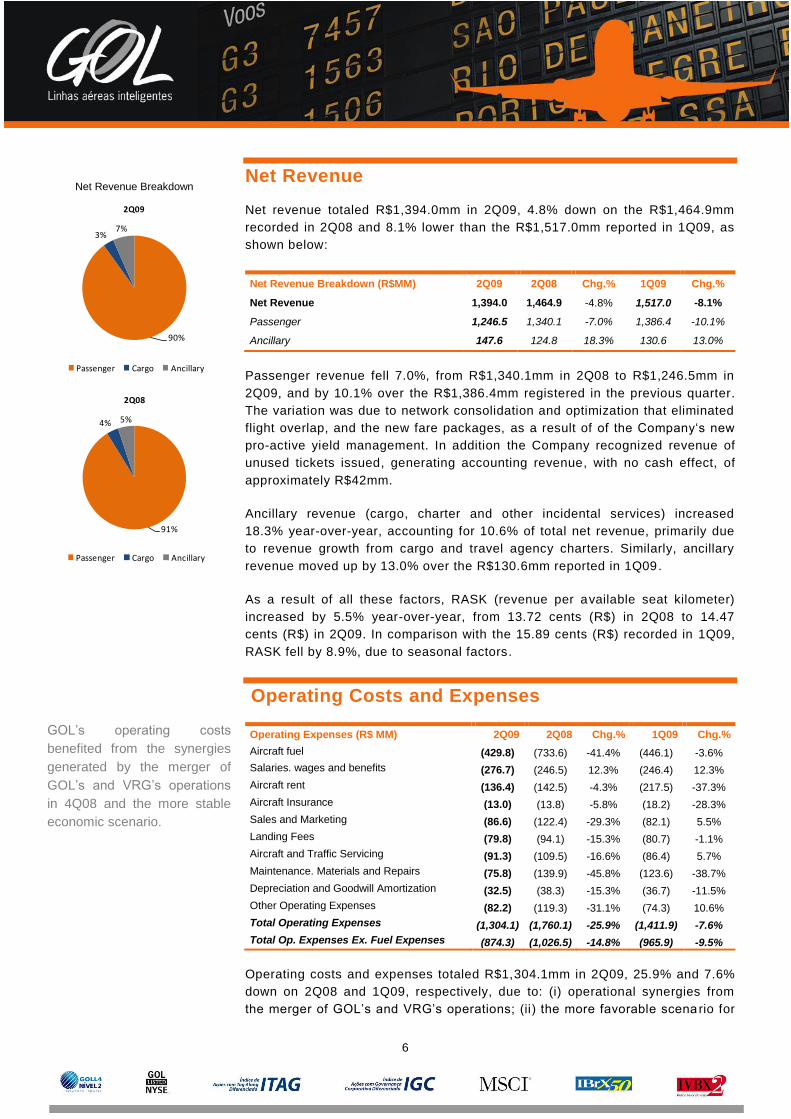
Net Revenue
Net revenue totaled R$1,394.0mm in 2Q09, 4.8% down on the R$1,464.9mm
recorded in 2Q08 and 8.1% lower than the R$1,517.0mm reported in 1Q09, as
shown below:
Net Revenue Breakdown (R$MM) 2Q09 2Q08 Chg.% 1Q09 Chg.%
Net Revenue 1,394.0 1,464.9 -4.8% 1,517.0 -8.1%
Passenger 1,246.5 1,340.1 -7.0% 1,386.4 -10.1%
Ancillary 147.6 124.8 18.3% 130.6 13.0%
Passenger revenue fell 7.0%, from R$1,340.1mm in 2Q08 to R$1,246.5mm in
2Q09, and by 10.1% over the R$1,386.4mm registered in the previous quarter.
The variation was due to network consolidation and optimization that eliminated
flight overlap, and the new fare packages, as a result of of the Company‘s new
pro-active yield management. In addition the Company recognized revenue of
unused tickets issued, generating accounting revenue, with no cash effect, of
approximately R$42mm.
Ancillary revenue (cargo, charter and other incidental services) increased
18.3% year-over-year, accounting for 10.6% of total net revenue, primarily due
to revenue growth from cargo and travel agency charters. Similarly, ancillary
revenue moved up by 13.0% over the R$130.6mm reported in 1Q09.
As a result of all these factors, RASK (revenue per available seat kilometer)
increased by 5.5% year-over-year, from 13.72 cents (R$) in 2Q08 to 14.47
cents (R$) in 2Q09. In comparison with the 15.89 cents (R$) recorded in 1Q09,
RASK fell by 8.9%, due to seasonal factors.
Operating Costs and Expenses
Operating Expenses (R$ MM) 2Q09 2Q08 Chg.% 1Q09 Chg.%
Aircraft fuel (429.8) (733.6) -41.4% (446.1) -3.6%
Salaries. wages and benefits (276.7) (246.5) 12.3% (246.4) 12.3%
Aircraft rent (136.4) (142.5) -4.3% (217.5) -37.3%
Aircraft Insurance (13.0) (13.8) -5.8% (18.2) -28.3%
Sales and Marketing (86.6) (122.4) -29.3% (82.1) 5.5%
Landing Fees (79.8) (94.1) -15.3% (80.7) -1.1%
Aircraft and Traffic Servicing (91.3) (109.5) -16.6% (86.4) 5.7%
Maintenance. Materials and Repairs (75.8) (139.9) -45.8% (123.6) -38.7%
Depreciation and Goodwill Amortization (32.5) (38.3) -15.3% (36.7) -11.5%
Other Operating Expenses (82.2) (119.3) -31.1% (74.3) 10.6%
Total Operating Expenses (1,304.1) (1,760.1) -25.9% (1,411.9) -7.6%
Total Op. Expenses Ex. Fuel Expenses (874.3) (1,026.5) -14.8% (965.9) -9.5%
Operating costs and expenses totaled R$1,304.1mm in 2Q09, 25.9% and 7.6%
down on 2Q08 and 1Q09, respectively, due to: (i) operational synergies from
the merger of GOL’s and VRG’s operations; (ii) the more favorable scena rio for
GOL’s operating costs
benefited from the synergies
generated by the merger of
GOL’s and VRG’s operations
in 4Q08 and the more stable
economic scenario.
Net Revenue Breakdown
90%
3%7%
2Q09
Passenger Cargo Ancillary
91%
4% 5%
2Q08
Passenger Cargo Ancillary
7
those variables outside the Company’s control (exchange rate and jet fuel); and
(iii) the reduction in aircraft leasing.
Operating Expenses per ASK 2Q09 2Q08 Chg.% 1Q09 Chg.%
Aircraft fuel (4.46) (6.87) -35.1% (4.67) -4.5%
Salaries, wages and benefits (2.87) (2.31) 24.4% (2.58) 11.3%
Aircraft rent (1.42) (1.33) 6.1% (2.28) -37.8%
Aircraft Insurance (0.14) (0.13) 4.3% (0.19) -29.0%
Sales and Marketing (0.90) (1.15) -21.6% (0.86) 4.5%
Landing Fees (0.83) (0.88) -6.1% (0.84) -2.0%
Aircraft and Traffic Servicing (0.95) (1.03) -7.5% (0.90) 4.8%
Maintenance, Materials and Repairs (0.79) (1.31) -40.0% (1.29) -39.2%
Depreciation and Goodwill Amortization (0.34) (0.36) -6.2% (0.38) -12.3%
Other Operating Expenses (0.85) (1.12) -23.7% (0.78) 9.6%
CASK (13.53) (16.49) -17.9% (14.79) -8.5%
CASK Excluding Fuel Expenses (9.07) (9.61) -5.6% (10.12) -10.3%
* Operating costs and expenses divided by ASK expressed in cents (R$) (CASK).
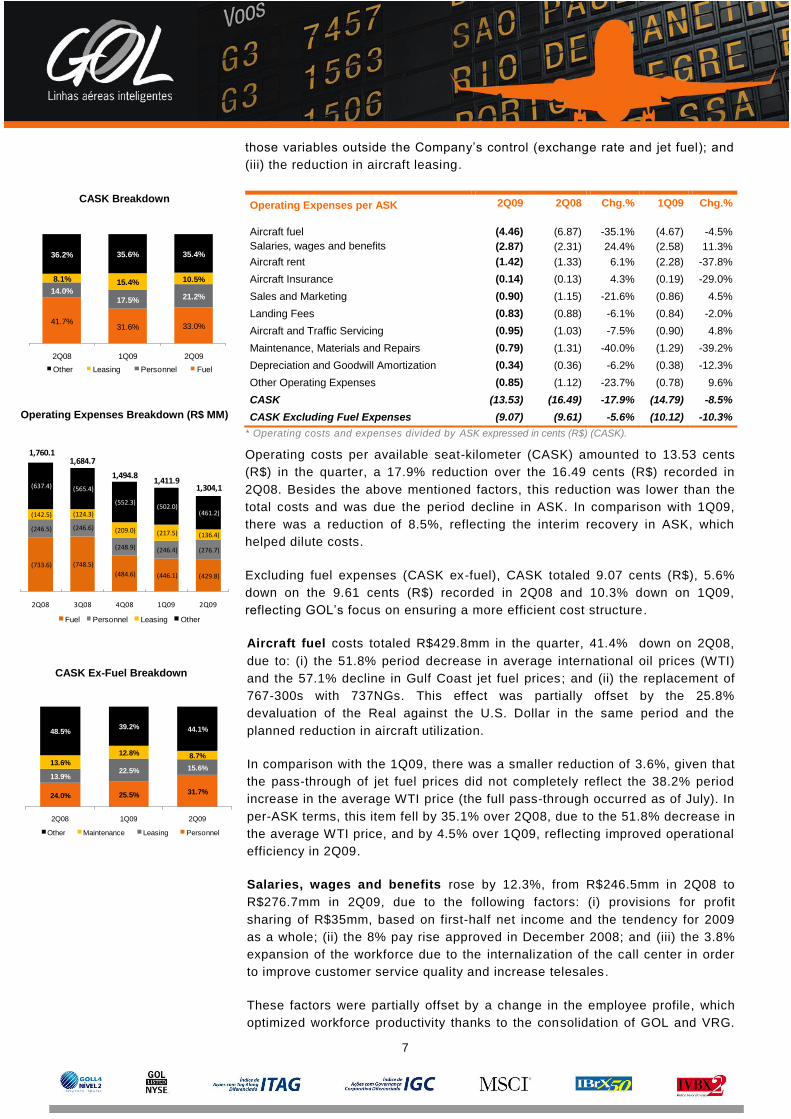
Operating costs per available seat-kilometer (CASK) amounted to 13.53 cents
(R$) in the quarter, a 17.9% reduction over the 16.49 cents (R$) recorded in
2Q08. Besides the above mentioned factors, this reduction was lower than the
total costs and was due the period decline in ASK. In comparison with 1Q09,
there was a reduction of 8.5%, reflecting the interim recovery in ASK, which
helped dilute costs.
Excluding fuel expenses (CASK ex-fuel), CASK totaled 9.07 cents (R$), 5.6%
down on the 9.61 cents (R$) recorded in 2Q08 and 10.3% down on 1Q09,
reflecting GOL’s focus on ensuring a more efficient cost structure.
Aircraft fuel costs totaled R$429.8mm in the quarter, 41.4% down on 2Q08,
due to: (i) the 51.8% period decrease in average international oil prices (WTI)
and the 57.1% decline in Gulf Coast jet fuel prices; and (ii) the replacement of
767-300s with 737NGs. This effect was partially offset by the 25.8%
devaluation of the Real against the U.S. Dollar in the same period and the
planned reduction in aircraft utilization.
In comparison with the 1Q09, there was a smaller reduction of 3.6%, given that
the pass-through of jet fuel prices did not completely reflect the 38.2% period
increase in the average WTI price (the full pass-through occurred as of July). In
per-ASK terms, this item fell by 35.1% over 2Q08, due to the 51.8% decrease in
the average WTI price, and by 4.5% over 1Q09, reflecting improved operational
efficiency in 2Q09.
Salaries, wages and benefits rose by 12.3%, from R$246.5mm in 2Q08 to
R$276.7mm in 2Q09, due to the following factors: (i) provisions for profit
sharing of R$35mm, based on first-half net income and the tendency for 2009
as a whole; (ii) the 8% pay rise approved in December 2008; and (iii) the 3.8%
expansion of the workforce due to the internalization of the call center in order
to improve customer service quality and increase telesales.
These factors were partially offset by a change in the employee profile, which
optimized workforce productivity thanks to the consolidation of GOL and VRG.
Operating Expenses Breakdown (R$ MM)
(429.8)(446.1)(484.6)
(748.5)(733.6)
(276.7)(246.4)(248.9)
(246.6)(246.5)(136.4)(217.5)(209.0)
(124.3)(142.5) (461.2)(502.0)
(552.3)
(565.4)(637.4)
2Q09 1Q09 4Q083Q082Q08
Fuel Personnel Leasing Other
1,760.1
1,304,1
1,494.81,411.9
1,684.7
CASK Ex-Fuel Breakdown
24.0% 25.5% 31.7%
13.9%22.5% 15.6%
13.6%
12.8% 8.7%
48.5%39.2% 44.1%
2Q08 1Q09 2Q09
Other Maintenance Leasing Personnel
CASK Breakdown
41.7%31.6% 33.0%
14.0%17.5% 21.2%
8.1% 15.4% 10.5%
36.2% 35.6% 35.4%
2Q08 1Q09 2Q09
Other Leasing Personnel Fuel
8
For the same reasons, salaries, wages and benefits increased by 12.3% over
1Q09. In per ASK terms, these expenses rose by 24.4% over 2Q08, due to the
reduction in aircraft utilization, and by 11.3% over 1Q09 for the same reasons
mentioned above.
Aircraft leasing costs totaled R$136.4mm, 4.3% and 37.3% down, respectively,
on 2Q08 and 1Q09, due to: (i) the impact of the reduction in interest rates on
floating-rate leasing contracts; (ii) negotiation with lessors redistributing
contractual amounts; (iii) return of one B767-300, replaced by a B737-800, with
a lower leasing value in absolute terms. These factors were partially offset by
the 25.8% upturn in the average exchange rate and the increase in the average
fleet.
In comparison with 1Q09, operational leasing fell 37.3% due to the above-
mentioned renegotiations, triggered by the 10.3% period reduction in the
average exchange rate. In per-ASK terms, the above effects were reversed,
resulting in a 6.1% increase over 2Q08 and a 37.8% reduction over 1Q09.
In comparison with 1Q09, operational leasing fell 37.3% due to the above-
mentioned renegotiations, triggered by the 10.3% period reduction in the
average exchange rate. In per-ASK terms, the above effects were reversed,
resulting in a 6.1% increase over 2Q08 and a 37.8% reduction over 1Q09.
Aircraft insurance costs fell by 5.8%, from R$13.8mm in 2Q08 to R$13.0mm in
2Q09 due to contract renegotiations and the reduction in the average age of the
fleet. In comparison with 1Q09, the reduction came to 28.3%, due to a seasonal
effect, given that fleet insurance renewal is paid in the first four months of each
year. Each additional aircraft received by the Company is insured by
compounding the difference in value between policies (in case of replacement).
In per-ASK terms, there was a 4.3% upturn over 2Q08, due to the reduction in
the average aircraft utilization rate, and a 29.0% decline over 1Q09 due to the
same factors mentioned above.
Sales and marketing expenses decreased by 29.3%, from R$122.4mm in
2Q08 to R$86.6mm in 2Q09, reflecting gains in operational synergies from the
companies integrated as of 4Q08, which led to a reduction in marketing
expenses and the effective integration of reservation systems in 1Q09. The
integration provided customers with a faster, more efficient ticket purchase
process and reduced sales expenses. In relation to 1Q09, there was a 5.5%
increase in marketing expenses. In per-ASK terms, these expenses fell 21.6%
over 2Q08 and climbed by 4.5% over 1Q09.
Landing fees totaled R$79.8mm in 2Q09, 15.3% lower than the R$94.1mm
recorded in 2Q08, reflecting the network repositioning, which led to more
landings in national airports, and 1.1% less than in 1Q09. In per -ASK terms,
these fees fell 6.1% year-over-year and 2.0% quarter-over-quarter.
Aircraft and traffic servicing expenses totaled R$91.3mm, 16.6% less than in
2Q08, chiefly due to: (i) a reduction in handling services following the
elimination of intercontinental flights and the end of operations with 767 -300
aircraft, which typically incurred higher handling and catering costs; and (i i) the
decline in third-party services related to VRG’s operations, which are now
9
handled by integrated systems and/or GOL’s personnel (e.g. the call center).
When compared to 1Q09, these expenses moved up by 5.7%, due to higher
handling costs caused by the increased number of arrivals and departures. In
per-ASK terms, these costs fell by 7.5% over 2Q08 and increased by 4.5% over
1Q09.
Maintenance, materials and repairs totaled R$75.8mm, versus R$139.9mm in
2Q08, due to reduced maintenance and the renovation and unification of the
fleet, with the replacement of 737-300s and 767-300s by 737-800s and 737-
700s. In relation to 1Q09, there was also a reduction in maintenance by 38.7%
due to non-recurring expenses in the first quarter, when the Company carried
out programmed maintenance of 23 motors and maintenance of six 737-300s
aircrafts returned. In per-ASK terms, these expenses fell by 40.0% and 39.2%
over 2Q08 and 1Q09 respectively.
Depreciation expenses fell by 15.3%, from R$38.3mm in 2Q08 to R$32.5mm
in 2Q09, due to the change in the average working life of the aircraft from 20 to
25 years in the 2Q09 financial statements in order to bring them into line with
international standards. This accounting change was also the main reason for
the 11.5% reduction over 1Q09. In per-ASK terms, depreciation fell 6.2% year-
over-year and 12.3% quarter-over-quarter.
Other operating expenses (mainly comprising accommodation, crew travel and
accommodation, direct passenger expenses, equipment leasing and general
and administrative expenses) totaled R$82.2mm in 2Q09, 31.1% down on
2Q08, mainly due to lower expenses from ground transportation,
accommodation and flight interruptions due to the unification of the operating
subsidiary. In relation to 1Q09, these expenses climbed by 10.6% due to higher
travel and accommodation expenses, reflecting the increased number of
departures and the upturn in the operational fleet.
10
Operating Results*
Even though the second quarter is always less favorable for the industry, GOL
met its target of generating operating cash flow, recording an operating margin
of 6.5%. This result was chiefly due to its success in reducing costs and
capturing operational synergies, in addition to improved revenue management,
the inclusion of new flexible passenger fare options and the gradual
revitalization of the SMILES loyalty program.
As a result, EBITDAR totaled R$258.8mm, giving an EBITDAR margin of 18.6%,
versus a negative margin of 7.8% in 2Q08. The 2Q09 RASK – CASK spread
was 0.93 cents (R$), 3.70 cents (R$) higher than the same period last year.
Operating Results (R$MM) 2Q09 2Q08 Chg.% 1Q09 Chg.%
EBIT 89.9 (295.3) nm 105.1 -14.4%
Margin 6.5% -20.2% +26.6 pp 6.9% -0.5 pp
per ASK 0.93 (2.77) nm 1.10 -15.2%
EBITDA 122.4 (256.9) nm 141.8 -13.7%
Margin 8.8% -17.5% +26.3 pp 9.3% -0.6 pp
per ASK 1.27 (2.41) nm 1.48 -14.4%
EBITDAR 258.8 (114.4) nm 359.3 -28.0%
Margin 18.6% -7.8% +26.4 pp 23.7% -5.1 pp
per ASK 2.69 (1.07) nm 3.76 -28.6%
Hedge Results
The Company records derivative financial instruments in accordance with IAS
39 ― Financial Instruments: Recognition and Measurement .
2Q09 Hedge Results (R$MM) WTI Foreign
Exchange Interest Rate Total
Effective - - (0.7) (0.7)
Ineffective (35.0) 14.2 - (20.8)
Not designated to hedge - - 8.2 8.2
Total (35.0) 14.2 7.5 (13.3)
OCI (gross value) (23.0) 5.4 - (17.6)
* OCI is different from net income and generally comprises unrealized gains or losses from a variety of sources,
including unrealized pension costs and gains or losses from securities, derivatives, foreign exchange hedges and net
foreign investments.
On June 30, 2009, the Company recognized a net loss from hedge operations of
R$13.3mm (for more details see the Financial Result section), with negative
cash flow effect of R$4.4mm, as follows:
* EBITDA (earnings before interest, taxes, depreciation and amortization) and EBITDAR (earnings before interest, taxes, depreciation, amortization and rent) are non-
USGAAP measures and are presented as supplemental information because we believe they are useful indicators of our operating performance for our investors. We usually present EBITDAR, in addition to EBITDA, because aircraft leasing represents a significant operating expense of our business, and we believe the impact of this expense should be considered in addition to the impact of depreciation and amortization. However, neither figure should be considered in isolation, as a substitute for net income in accordance with IFRS and BR GAAP, or as a measure of a company’s profitability. In addition, our calculations may not be comparable to other similarly titled measures of other companies The Company believes that EBITDAR, equivalent to EBITDA before expenses from aircraft leasing (denominated in dollars) is a useful indicator of airline operating performance. In the specific case of GOL and the air transport sector, a substantial amount of aircraft are leased, representing a material cost item. EBITDAR therefore indicates the capacity to cover such costs, as well as facilitating comparisons with other companies in the sector.
Operational Evolution
59.5%
61.0%60.1%
57.4%56.7%
56.3%
4Q08 1Q09 2Q09
Load Factor Break-Even Load Factor (BELF)
11
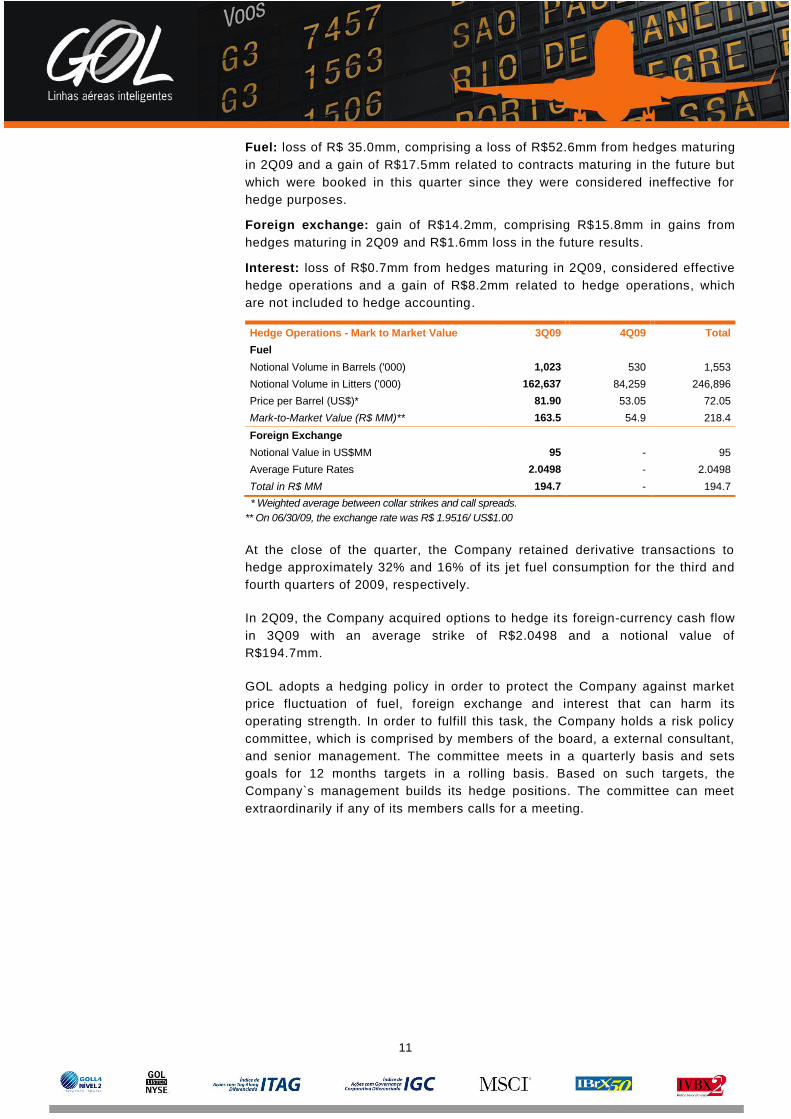
Fuel: loss of R$ 35.0mm, comprising a loss of R$52.6mm from hedges maturing
in 2Q09 and a gain of R$17.5mm related to contracts maturing in the future but
which were booked in this quarter since they were considered ineffective for
hedge purposes.
Foreign exchange: gain of R$14.2mm, comprising R$15.8mm in gains from
hedges maturing in 2Q09 and R$1.6mm loss in the future results.
Interest: loss of R$0.7mm from hedges maturing in 2Q09, considered effective
hedge operations and a gain of R$8.2mm related to hedge operations, which
are not included to hedge accounting.
Hedge Operations - Mark to Market Value 3Q09 4Q09 Total
Fuel
Notional Volume in Barrels ('000) 1,023 530 1,553
Notional Volume in Litters ('000) 162,637 84,259 246,896
Price per Barrel (US$)* 81.90 53.05 72.05
Mark-to-Market Value (R$ MM)** 163.5 54.9 218.4
Foreign Exchange
Notional Value in US$MM 95 - 95
Average Future Rates 2.0498 - 2.0498
Total in R$ MM 194.7 - 194.7
* Weighted average between collar strikes and call spreads.
** On 06/30/09, the exchange rate was R$ 1.9516/ US$1.00
At the close of the quarter, the Company retained derivative transactions to
hedge approximately 32% and 16% of its jet fuel consumption for the third and
fourth quarters of 2009, respectively.
In 2Q09, the Company acquired options to hedge its foreign-currency cash flow
in 3Q09 with an average strike of R$2.0498 and a notional value of
R$194.7mm.
GOL adopts a hedging policy in order to protect the Company against market
price fluctuation of fuel, foreign exchange and interest that can harm its
operating strength. In order to fulfill this task, the Company holds a risk policy
committee, which is comprised by members of the board, a external consultant,
and senior management. The committee meets in a quarterly basis and sets
goals for 12 months targets in a rolling basis. Based on such targets, the
Company`s management builds its hedge positions. The committee can meet
extraordinarily if any of its members calls for a meeting.
12
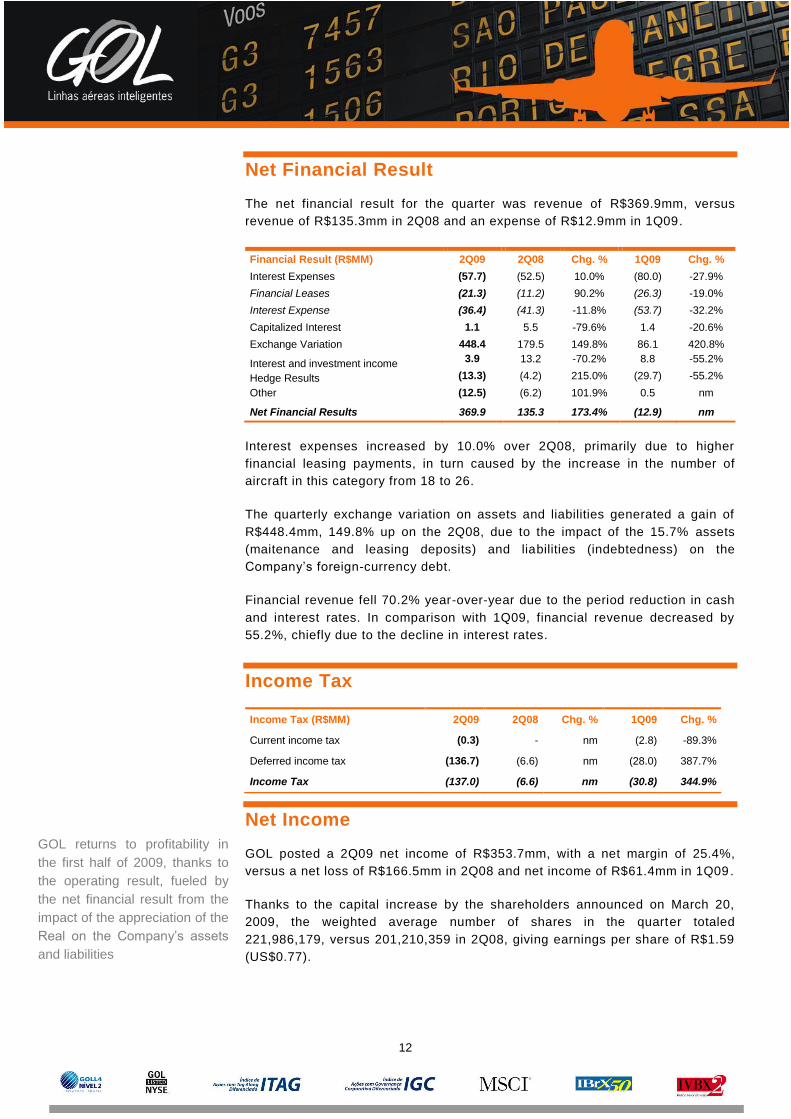
Net Financial Result
The net financial result for the quarter was revenue of R$369.9mm, versus
revenue of R$135.3mm in 2Q08 and an expense of R$12.9mm in 1Q09.
Financial Result (R$MM) 2Q09 2Q08 Chg. % 1Q09 Chg. %
Interest Expenses (57.7) (52.5) 10.0% (80.0) -27.9%
Financial Leases (21.3) (11.2) 90.2% (26.3) -19.0%
Interest Expense (36.4) (41.3) -11.8% (53.7) -32.2%
Capitalized Interest 1.1 5.5 -79.6% 1.4 -20.6%
Exchange Variation 448.4 179.5 149.8% 86.1 420.8%
Interest and investment income 3.9 13.2 -70.2% 8.8 -55.2%
Hedge Results (13.3) (4.2) 215.0% (29.7) -55.2%
Other (12.5) (6.2) 101.9% 0.5 nm
Net Financial Results 369.9 135.3 173.4% (12.9) nm
Interest expenses increased by 10.0% over 2Q08, primarily due to higher
financial leasing payments, in turn caused by the increase in the number of
aircraft in this category from 18 to 26.
The quarterly exchange variation on assets and liabilities generated a gain of
R$448.4mm, 149.8% up on the 2Q08, due to the impact of the 15.7% assets
(maitenance and leasing deposits) and liabilities (indebtedness) on the
Company’s foreign-currency debt.
Financial revenue fell 70.2% year-over-year due to the period reduction in cash
and interest rates. In comparison with 1Q09, financial revenue decreased by
55.2%, chiefly due to the decline in interest rates.
Income Tax
Income Tax (R$MM) 2Q09 2Q08 Chg. % 1Q09 Chg. %
Current income tax (0.3) - nm (2.8) -89.3%
Deferred income tax (136.7) (6.6) nm (28.0) 387.7%
Income Tax (137.0) (6.6) nm (30.8) 344.9%
Net Income
GOL posted a 2Q09 net income of R$353.7mm, with a net margin of 25.4%,
versus a net loss of R$166.5mm in 2Q08 and net income of R$61.4mm in 1Q09.
Thanks to the capital increase by the shareholders announced on March 20,
2009, the weighted average number of shares in the quarter totaled
221,986,179, versus 201,210,359 in 2Q08, giving earnings per share of R$1.59
(US$0.77).
GOL returns to profitability in
the first half of 2009, thanks to
the operating result, fueled by
the net financial result from the
impact of the appreciation of the
Real on the Company’s assets
and liabilities
13
Liquidity and Indebtedness
On June 30, 2009, the Company’s total liquidity came to R$3,013.6mm, 245.8%
higher than short-term debt of R$871.4 mm (R$21.8 mm in accrued interest,
R$236.5mm in financial debt, and R$613.2 mm in aircraft financing).
Total Liquidity (R$MM) 2Q09 1Q09 Chg. % 4Q08 Chg. %
Reais 1,147.6 721.2 59.1% 936.5 22.5%
Cash and Cash Equivalents 613.7 394.6 55.5% 591.6 3.7%
Short Term Receivables 533.9 326.6 63.5% 344.9 54.8%
Foreign Currency 1,865.9 1,725.1 8.2% 1,702.5 9.6%
Aircraft Acquisition Prepayment
953.5 957.9 -0.5% 957.2 -0.4%
Deposits 912.4 767.2 18.9 745.3 22.4%
Total Liquidity 3,013.6 2,446.4 23.2% 2,639.1 14.2%
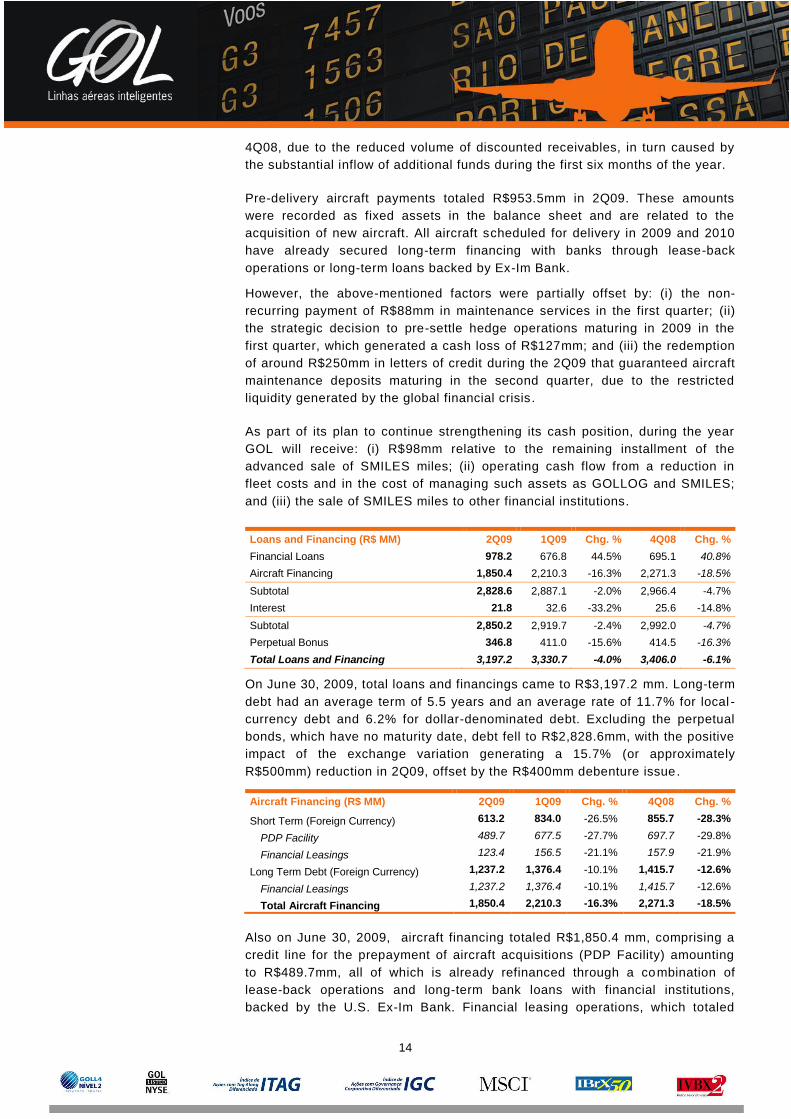
Cash and cash equivalents closed the quarter at R$613.7mm (cash balance of
R$183.7mm, plus R$416.8mm in immediate liquidity assets and R$13.2mm in
restricted cash), 3.7% up on the end of 2008 and 55.5% more than the close of
1Q09.
The main factors behind the improved liquidity were: (i) positive operating cash
flow for the fourth consecutive quarter; (ii) the conclusion of a R$ 203.5mm
capital increase announced in March 2009 (R$103.5mm capitalized on the
1Q09) through the issue of subscription rights to the Company’s shareholders,
which was virtually 100% subscribed by the controlling shareholders; (iii) a
R$400mm debenture issue, partially guaranteed by receivables of R$250mm, at
126.5% of the CDI rate, with monthly amortizations as of the seventh month of
the contract until final maturity in May 2011; (iv) the signing of a partnership
agreement on June 29 2009 with Bradesco and Banco do Brasil involving the
creation of a co-branded SMILES credit card, for which the Company will
receive R$255mm (R$104mm received in June) for the advanced sale of miles
to the two institutions, rental of access to the SMILES database, a share of card
revenue and other factors.
Maitenance and leasing deposits are related to contractual obligations with
lessors and are booked under the long term and short term assets. These
deposits guarantees the Company’s obligations regarding maintenance of a
portion of its leased fleet as well as financial and operational lease payments.
During the 2Q09, these deposits totaled R$912.4 million, 18,2% higher than
1Q09 and 22.4% above 2Q08, mainly due to the substitution of R$230 million in
letter of credits by cash. Such letters of credit where deposited as guarantee
and came due during the first half of the year, when the global financial crisis
struck most of the credit markets worldwide and reflected in a lack of credit
lines amongst the major banks worldwide.
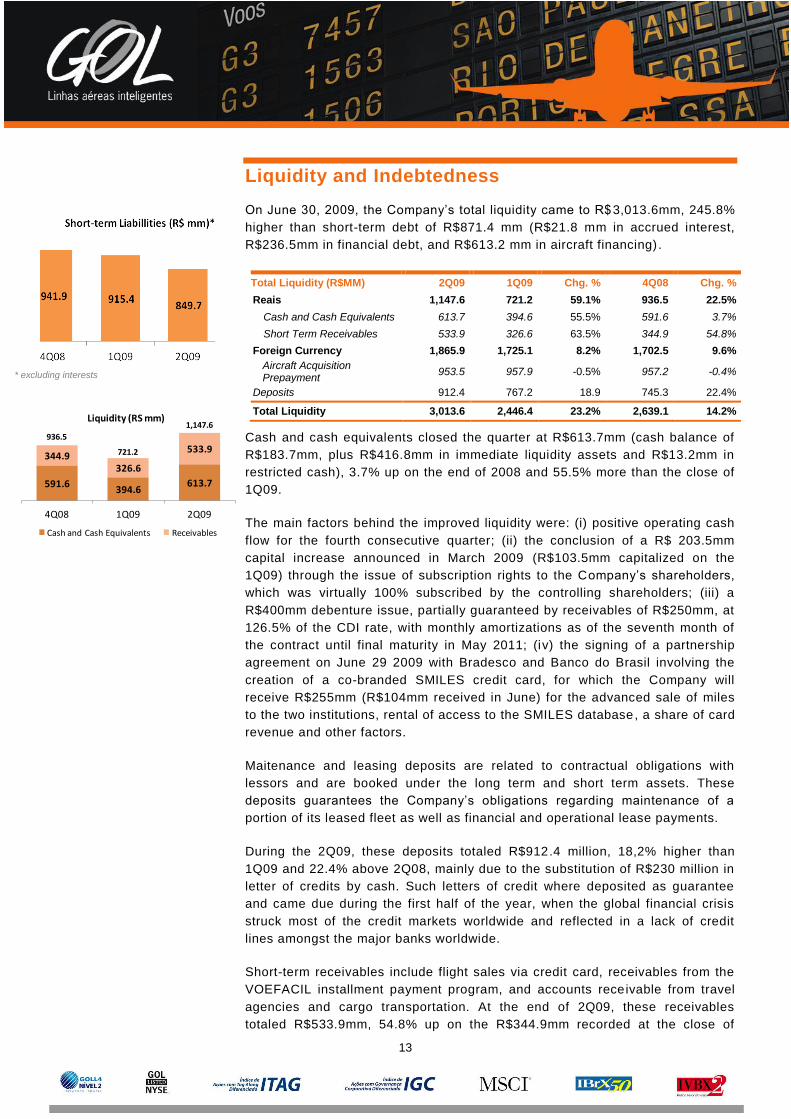
Short-term receivables include flight sales via credit card, receivables from the
VOEFACIL installment payment program, and accounts receivable from travel
agencies and cargo transportation. At the end of 2Q09, these receivables
totaled R$533.9mm, 54.8% up on the R$344.9mm recorded at the close of
* excluding interests
591.6394.6
613.7
344.9326.6
533.9
4Q08 1Q09 2Q09
Liquidity (RS mm)
Cash and Cash Equivalents Receivables
936.5
721.2
1,147.6
14
4Q08, due to the reduced volume of discounted receivables, in turn caused by
the substantial inflow of additional funds during the first six months of the year.
Pre-delivery aircraft payments totaled R$953.5mm in 2Q09. These amounts
were recorded as fixed assets in the balance sheet and are related to the
acquisition of new aircraft. All aircraft scheduled for delivery in 2009 and 2010
have already secured long-term financing with banks through lease-back
operations or long-term loans backed by Ex-Im Bank.
However, the above-mentioned factors were partially offset by: (i) the non-
recurring payment of R$88mm in maintenance services in the first quarter; (ii)
the strategic decision to pre-settle hedge operations maturing in 2009 in the
first quarter, which generated a cash loss of R$127mm; and (iii) the redemption
of around R$250mm in letters of credit during the 2Q09 that guaranteed aircraft
maintenance deposits maturing in the second quarter, due to the restricted
liquidity generated by the global financial crisis.
As part of its plan to continue strengthening its cash position, during the year
GOL will receive: (i) R$98mm relative to the remaining installment of the
advanced sale of SMILES miles; (ii) operating cash flow from a reduction in
fleet costs and in the cost of managing such assets as GOLLOG and SMILES;
and (iii) the sale of SMILES miles to other financial institutions.
Loans and Financing (R$ MM) 2Q09 1Q09 Chg. % 4Q08 Chg. %
Financial Loans 978.2 676.8 44.5% 695.1 40.8%
Aircraft Financing 1,850.4 2,210.3 -16.3% 2,271.3 -18.5%
Subtotal 2,828.6 2,887.1 -2.0% 2,966.4 -4.7%
Interest 21.8 32.6 -33.2% 25.6 -14.8%
Subtotal 2,850.2 2,919.7 -2.4% 2,992.0 -4.7%
Perpetual Bonus 346.8 411.0 -15.6% 414.5 -16.3%
Total Loans and Financing 3,197.2 3,330.7 -4.0% 3,406.0 -6.1%
On June 30, 2009, total loans and financings came to R$3,197.2 mm. Long-term
debt had an average term of 5.5 years and an average rate of 11.7% for local -
currency debt and 6.2% for dollar-denominated debt. Excluding the perpetual
bonds, which have no maturity date, debt fell to R$2,828.6mm, with the positive
impact of the exchange variation generating a 15.7% (or approximately
R$500mm) reduction in 2Q09, offset by the R$400mm debenture issue.
Aircraft Financing (R$ MM) 2Q09 1Q09 Chg. % 4Q08 Chg. %
Short Term (Foreign Currency) 613.2 834.0 -26.5% 855.7 -28.3%
PDP Facility 489.7 677.5 -27.7% 697.7 -29.8%
Financial Leasings 123.4 156.5 -21.1% 157.9 -21.9%
Long Term Debt (Foreign Currency) 1,237.2 1,376.4 -10.1% 1,415.7 -12.6%
Financial Leasings 1,237.2 1,376.4 -10.1% 1,415.7 -12.6%
Total Aircraft Financing 1,850.4 2,210.3 -16.3% 2,271.3 -18.5%
Also on June 30, 2009, aircraft financing totaled R$1,850.4 mm, comprising a
credit line for the prepayment of aircraft acquisitions (PDP Facility) amounting
to R$489.7mm, all of which is already refinanced through a combination of
lease-back operations and long-term bank loans with financial institutions,
backed by the U.S. Ex-Im Bank. Financial leasing operations, which totaled
15
R$1,360.6mm, are financial expenses paid monthly to the aircraft lessors with
the Company’s own operating cash flow.
.
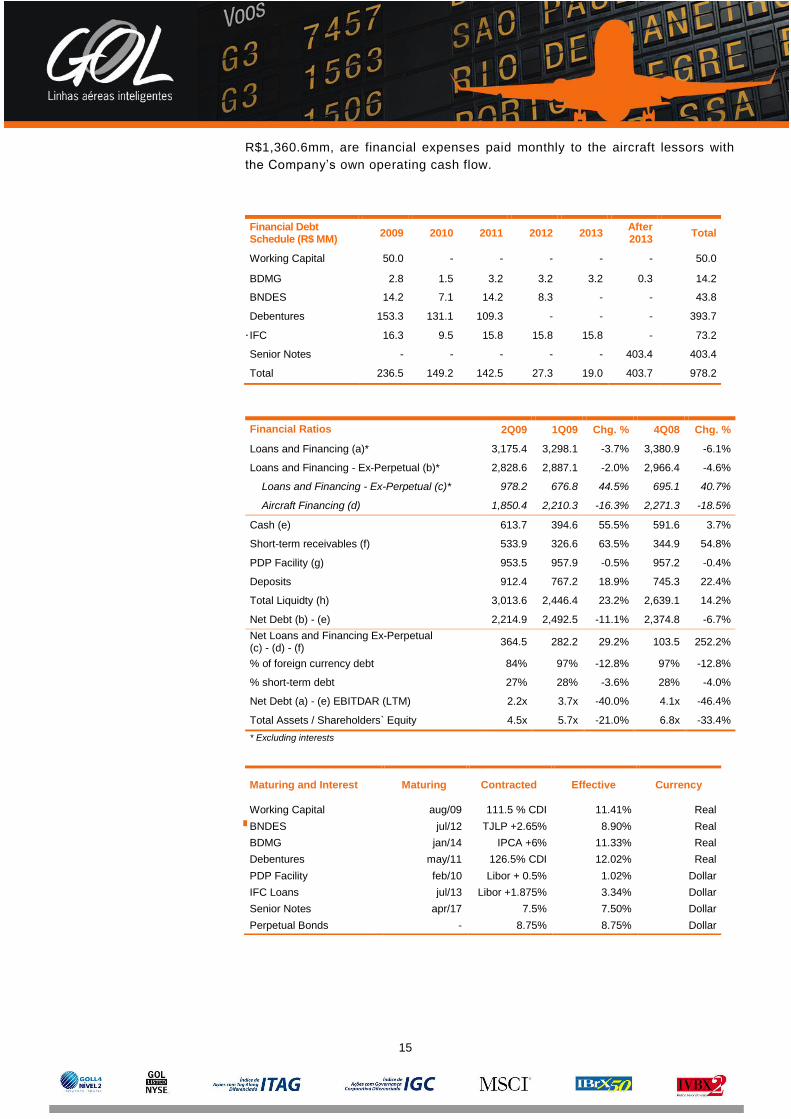
Financial Ratios 2Q09 1Q09 Chg. % 4Q08 Chg. %
Loans and Financing (a)* 3,175.4 3,298.1 -3.7% 3,380.9 -6.1%
Loans and Financing - Ex-Perpetual (b)* 2,828.6 2,887.1 -2.0% 2,966.4 -4.6%
Loans and Financing - Ex-Perpetual (c)* 978.2 676.8 44.5% 695.1 40.7%
Aircraft Financing (d) 1,850.4 2,210.3 -16.3% 2,271.3 -18.5%
Cash (e) 613.7 394.6 55.5% 591.6 3.7%
Short-term receivables (f) 533.9 326.6 63.5% 344.9 54.8%
PDP Facility (g) 953.5 957.9 -0.5% 957.2 -0.4%
Deposits 912.4 767.2 18.9% 745.3 22.4%
Total Liquidty (h) 3,013.6 2,446.4 23.2% 2,639.1 14.2%
Net Debt (b) - (e) 2,214.9 2,492.5 -11.1% 2,374.8 -6.7%
Net Loans and Financing Ex-Perpetual (c) - (d) - (f)
364.5 282.2 29.2% 103.5 252.2%
% of foreign currency debt 84% 97% -12.8% 97% -12.8%
% short-term debt 27% 28% -3.6% 28% -4.0%
Net Debt (a) - (e) EBITDAR (LTM) 2.2x 3.7x -40.0% 4.1x -46.4%
Total Assets / Shareholders` Equity 4.5x 5.7x -21.0% 6.8x -33.4%
* Excluding interests
Financial Debt Schedule (R$ MM)
2009 2010 2011 2012 2013 After 2013
Total
Working Capital 50.0 - - - - - 50.0
BDMG 2.8 1.5 3.2 3.2 3.2 0.3 14.2
BNDES 14.2 7.1 14.2 8.3 - - 43.8
Debentures 153.3 131.1 109.3 - - - 393.7
IFC 16.3 9.5 15.8 15.8 15.8 - 73.2
Senior Notes - - - - - 403.4 403.4
Total 236.5 149.2 142.5 27.3 19.0 403.7 978.2
Maturing and Interest Maturing Contracted Effective Currency
Working Capital aug/09 111.5 % CDI 11.41% Real
BNDES jul/12 TJLP +2.65% 8.90% Real
BDMG jan/14 IPCA +6% 11.33% Real
Debentures may/11 126.5% CDI 12.02% Real
PDP Facility feb/10 Libor + 0.5% 1.02% Dollar
IFC Loans jul/13 Libor +1.875% 3.34% Dollar
Senior Notes apr/17 7.5% 7.50% Dollar
Perpetual Bonds - 8.75% 8.75% Dollar
16
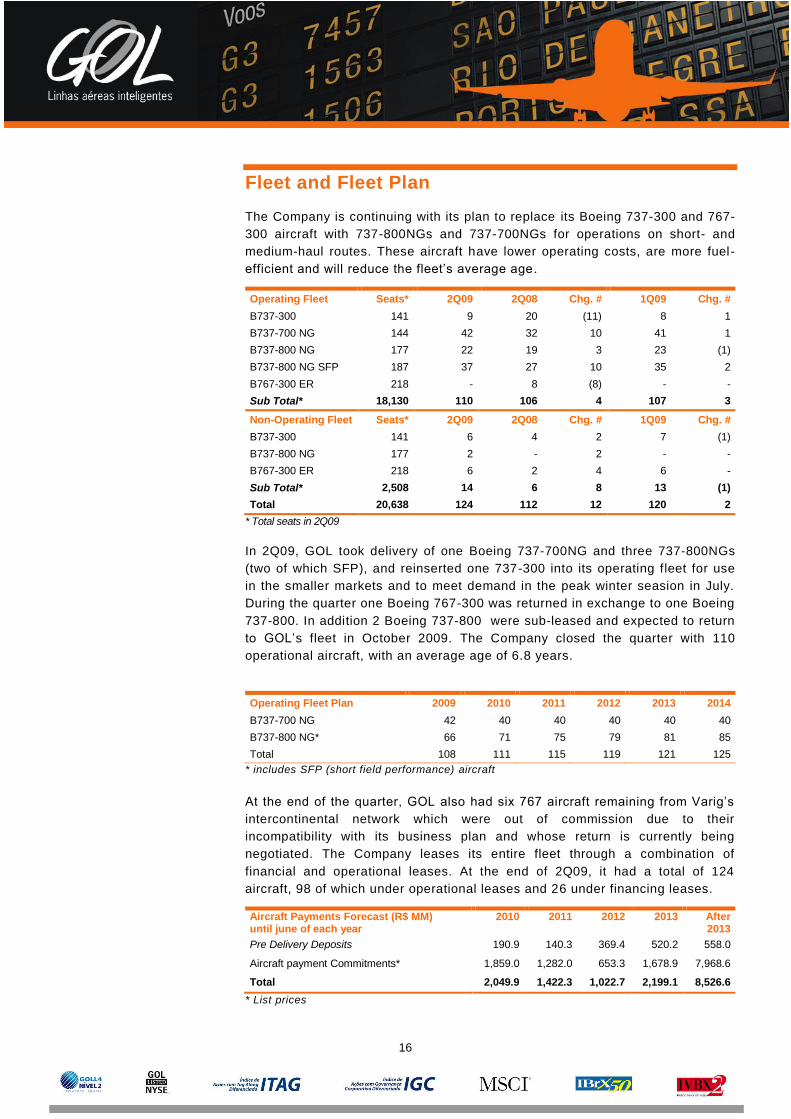
Fleet and Fleet Plan
The Company is continuing with its plan to replace its Boeing 737-300 and 767-
300 aircraft with 737-800NGs and 737-700NGs for operations on short- and
medium-haul routes. These aircraft have lower operating costs, are more fuel-
efficient and will reduce the fleet’s average age .
Operating Fleet Seats* 2Q09 2Q08 Chg. # 1Q09 Chg. #
B737-300 141 9 20 (11) 8 1
B737-700 NG 144 42 32 10 41 1
B737-800 NG 177 22 19 3 23 (1)
B737-800 NG SFP 187 37 27 10 35 2
B767-300 ER 218 - 8 (8) - -
Sub Total* 18,130 110 106 4 107 3
Non-Operating Fleet Seats* 2Q09 2Q08 Chg. # 1Q09 Chg. #
B737-300 141 6 4 2 7 (1)
B737-800 NG 177 2 - 2 - -
B767-300 ER 218 6 2 4 6 -
Sub Total* 2,508 14 6 8 13 (1)
Total 20,638 124 112 12 120 2
* Total seats in 2Q09
In 2Q09, GOL took delivery of one Boeing 737-700NG and three 737-800NGs
(two of which SFP), and reinserted one 737-300 into its operating fleet for use
in the smaller markets and to meet demand in the peak winter seasion in July.
During the quarter one Boeing 767-300 was returned in exchange to one Boeing
737-800. In addition 2 Boeing 737-800 were sub-leased and expected to return
to GOL’s fleet in October 2009. The Company closed the quarter with 110
operational aircraft, with an average age of 6.8 years.
Operating Fleet Plan 2009 2010 2011 2012 2013 2014
B737-700 NG 42 40 40 40 40 40
B737-800 NG* 66 71 75 79 81 85
Total 108 111 115 119 121 125
* includes SFP (short field performance) aircraft
At the end of the quarter, GOL also had six 767 aircraft remaining from Varig’s
intercontinental network which were out of commission due to their
incompatibility with its business plan and whose return is currently being
negotiated. The Company leases its entire fleet through a combination of
financial and operational leases. At the end of 2Q09, it had a total of 124
aircraft, 98 of which under operational leases and 26 under financing leases.
Aircraft Payments Forecast (R$ MM) until june of each year
2010 2011 2012 2013 After 2013
Pre Delivery Deposits 190.9 140.3 369.4 520.2 558.0
Aircraft payment Commitments* 1,859.0 1,282.0 653.3 1,678.9 7,968.6
Total 2,049.9 1,422.3 1,022.7 2,199.1 8,526.6
* List prices
17
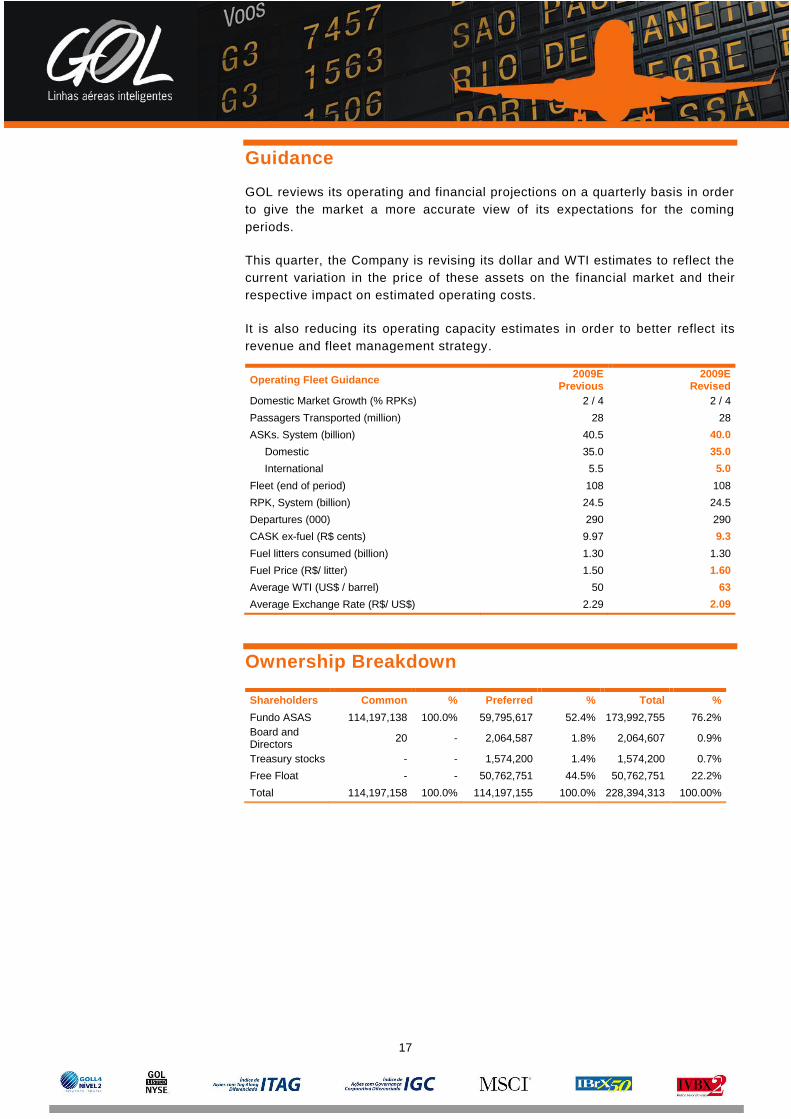
Guidance
GOL reviews its operating and financial projections on a quarterly basis in order
to give the market a more accurate view of its expectations for the coming
periods.
This quarter, the Company is revising its dollar and WTI estimates to reflect the
current variation in the price of these assets on the financial market and their
respective impact on estimated operating costs.
It is also reducing its operating capacity estimates in order to better reflect its
revenue and fleet management strategy.
Operating Fleet Guidance 2009E
Previous 2009E
Revised
Domestic Market Growth (% RPKs) 2 / 4 2 / 4
Passagers Transported (million) 28 28
ASKs. System (billion) 40.5 40.0
Domestic 35.0 35.0
International 5.5 5.0
Fleet (end of period) 108 108
RPK, System (billion) 24.5 24.5
Departures (000) 290 290
CASK ex-fuel (R$ cents) 9.97 9.3
Fuel litters consumed (billion) 1.30 1.30
Fuel Price (R$/ litter) 1.50 1.60
Average WTI (US$ / barrel) 50 63
Average Exchange Rate (R$/ US$) 2.29 2.09
Ownership Breakdown
Shareholders Common % Preferred % Total %
Fundo ASAS 114,197,138 100.0% 59,795,617 52.4% 173,992,755 76.2%
Board and Directors
20 - 2,064,587 1.8% 2,064,607 0.9%
Treasury stocks - - 1,574,200 1.4% 1,574,200 0.7%
Free Float - - 50,762,751 44.5% 50,762,751 22.2%
Total 114,197,158 100.0% 114,197,155 100.0% 228,394,313 100.00%
18
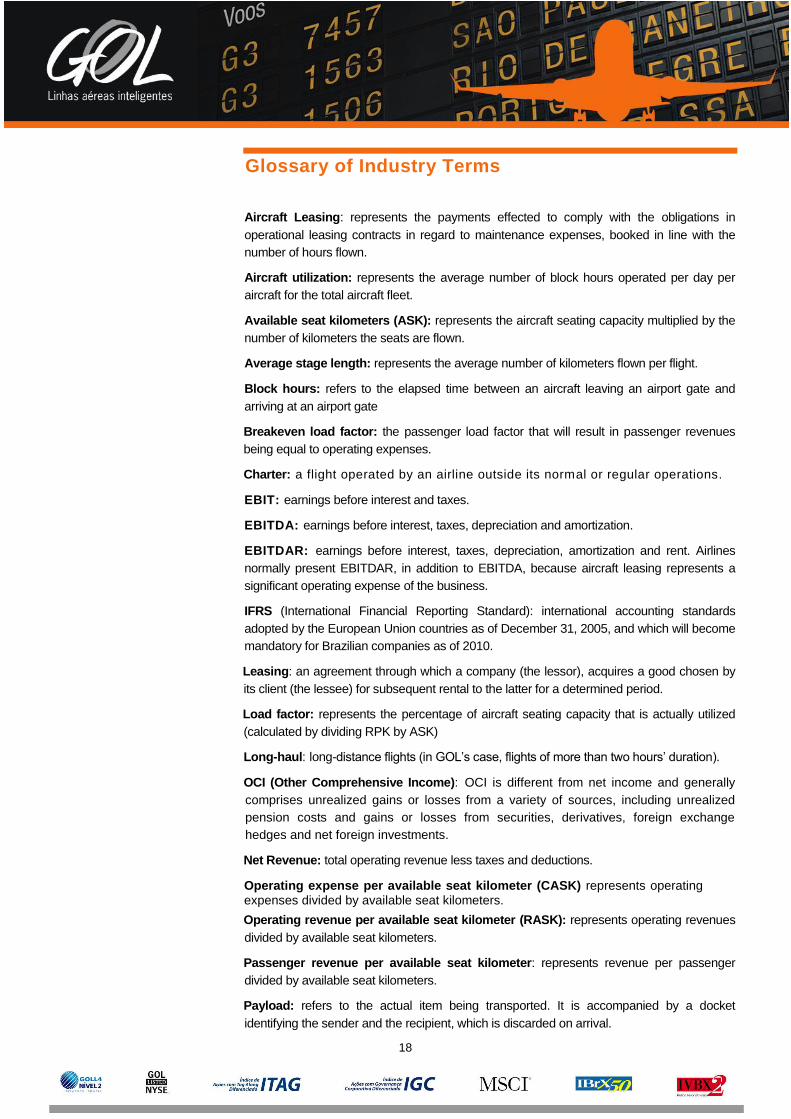
Glossary of Industry Terms
Aircraft Leasing: represents the payments effected to comply with the obligations in
operational leasing contracts in regard to maintenance expenses, booked in line with the
number of hours flown.
Aircraft utilization: represents the average number of block hours operated per day per
aircraft for the total aircraft fleet.
Available seat kilometers (ASK): represents the aircraft seating capacity multiplied by the
number of kilometers the seats are flown.
Average stage length: represents the average number of kilometers flown per flight.
Block hours: refers to the elapsed time between an aircraft leaving an airport gate and
arriving at an airport gate
Breakeven load factor: the passenger load factor that will result in passenger revenues
being equal to operating expenses.
Charter: a flight operated by an airline outside its normal or regular operations.
EBIT: earnings before interest and taxes.
EBITDA: earnings before interest, taxes, depreciation and amortization.
EBITDAR: earnings before interest, taxes, depreciation, amortization and rent. Airlines
normally present EBITDAR, in addition to EBITDA, because aircraft leasing represents a
significant operating expense of the business.
IFRS (International Financial Reporting Standard): international accounting standards
adopted by the European Union countries as of December 31, 2005, and which will become
mandatory for Brazilian companies as of 2010.
Leasing: an agreement through which a company (the lessor), acquires a good chosen by
its client (the lessee) for subsequent rental to the latter for a determined period.
Load factor: represents the percentage of aircraft seating capacity that is actually utilized
(calculated by dividing RPK by ASK)
Long-haul: long-distance flights (in GOL’s case, flights of more than two hours’ duration).
OCI (Other Comprehensive Income): OCI is different from net income and generally
comprises unrealized gains or losses from a variety of sources, including unrealized
pension costs and gains or losses from securities, derivatives, foreign exchange
hedges and net foreign investments.
Net Revenue: total operating revenue less taxes and deductions.
Operating expense per available seat kilometer (CASK) represents operating expenses divided by available seat kilometers.
Operating revenue per available seat kilometer (RASK): represents operating revenues
divided by available seat kilometers.
Passenger revenue per available seat kilometer: represents revenue per passenger
divided by available seat kilometers.
Payload: refers to the actual item being transported. It is accompanied by a docket
identifying the sender and the recipient, which is discarded on arrival.
19
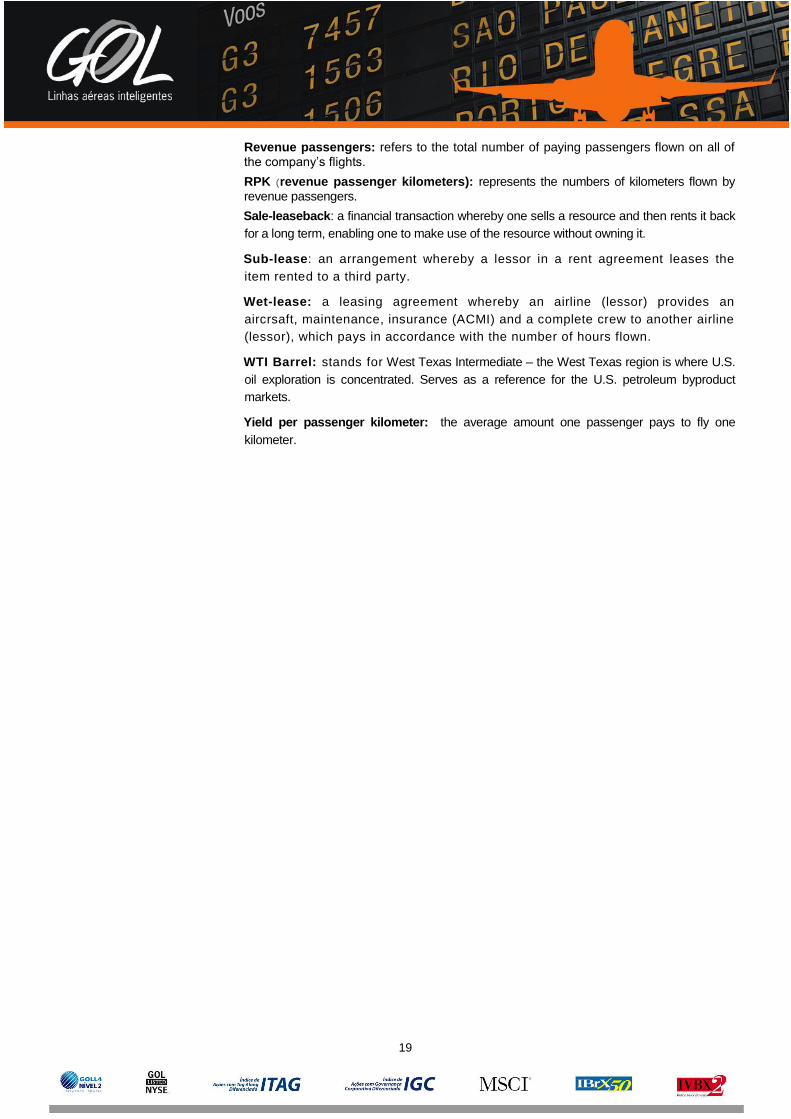
Revenue passengers: refers to the total number of paying passengers flown on all of the company’s flights.
RPK (revenue passenger kilometers): represents the numbers of kilometers flown by revenue passengers.
Sale-leaseback: a financial transaction whereby one sells a resource and then rents it back
for a long term, enabling one to make use of the resource without owning it.
Sub-lease: an arrangement whereby a lessor in a rent agreement leases the
item rented to a third party.
Wet-lease: a leasing agreement whereby an airline (lessor) provides an
aircrsaft, maintenance, insurance (ACMI) and a complete crew to another airline
(lessor), which pays in accordance with the number of hours flown.
WTI Barrel: stands for West Texas Intermediate – the West Texas region is where U.S.
oil exploration is concentrated. Serves as a reference for the U.S. petroleum byproduct
markets.
Yield per passenger kilometer: the average amount one passenger pays to fly one
kilometer.
20
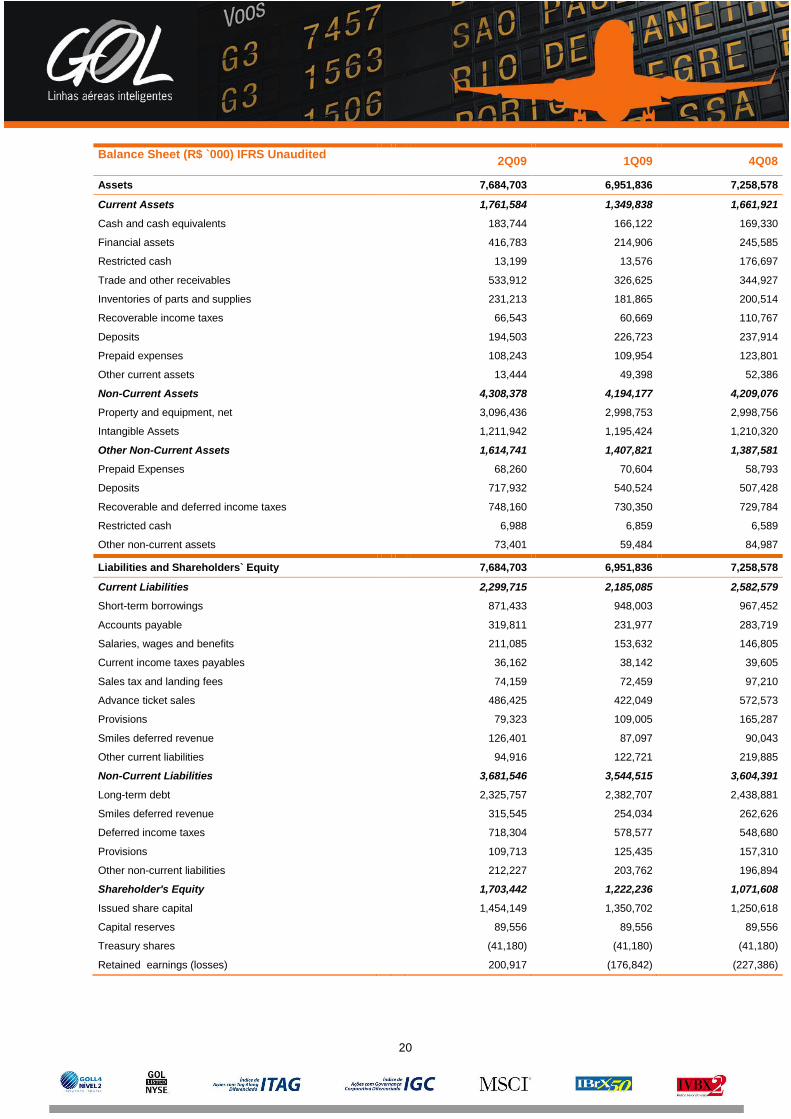
Balance Sheet (R$ `000) IFRS Unaudited
2Q09 1Q09 4Q08
Assets
7,684,703 6,951,836 7,258,578
Current Assets
1,761,584 1,349,838 1,661,921
Cash and cash equivalents
183,744 166,122 169,330
Financial assets
416,783 214,906 245,585
Restricted cash
13,199 13,576 176,697
Trade and other receivables
533,912 326,625 344,927
Inventories of parts and supplies
231,213 181,865 200,514
Recoverable income taxes
66,543 60,669 110,767
Deposits
194,503 226,723 237,914
Prepaid expenses
108,243 109,954 123,801
Other current assets
13,444 49,398 52,386
Non-Current Assets
4,308,378 4,194,177 4,209,076
Property and equipment, net
3,096,436 2,998,753 2,998,756
Intangible Assets
1,211,942 1,195,424 1,210,320
Other Non-Current Assets
1,614,741 1,407,821 1,387,581
Prepaid Expenses
68,260 70,604 58,793
Deposits
717,932 540,524 507,428
Recoverable and deferred income taxes
748,160 730,350 729,784
Restricted cash
6,988 6,859 6,589
Other non-current assets
73,401 59,484 84,987
Liabilities and Shareholders` Equity
7,684,703 6,951,836 7,258,578
Current Liabilities
2,299,715 2,185,085 2,582,579
Short-term borrowings
871,433 948,003 967,452
Accounts payable
319,811 231,977 283,719
Salaries, wages and benefits
211,085 153,632 146,805
Current income taxes payables
36,162 38,142 39,605
Sales tax and landing fees
74,159 72,459 97,210
Advance ticket sales
486,425 422,049 572,573
Provisions
79,323 109,005 165,287
Smiles deferred revenue
126,401 87,097 90,043
Other current liabilities
94,916 122,721 219,885
Non-Current Liabilities
3,681,546 3,544,515 3,604,391
Long-term debt
2,325,757 2,382,707 2,438,881
Smiles deferred revenue
315,545 254,034 262,626
Deferred income taxes
718,304 578,577 548,680
Provisions
109,713 125,435 157,310
Other non-current liabilities
212,227 203,762 196,894
Shareholder's Equity
1,703,442 1,222,236 1,071,608
Issued share capital
1,454,149 1,350,702 1,250,618
Capital reserves
89,556 89,556 89,556
Treasury shares
(41,180) (41,180) (41,180)
Retained earnings (losses) 200,917 (176,842) (227,386)
21
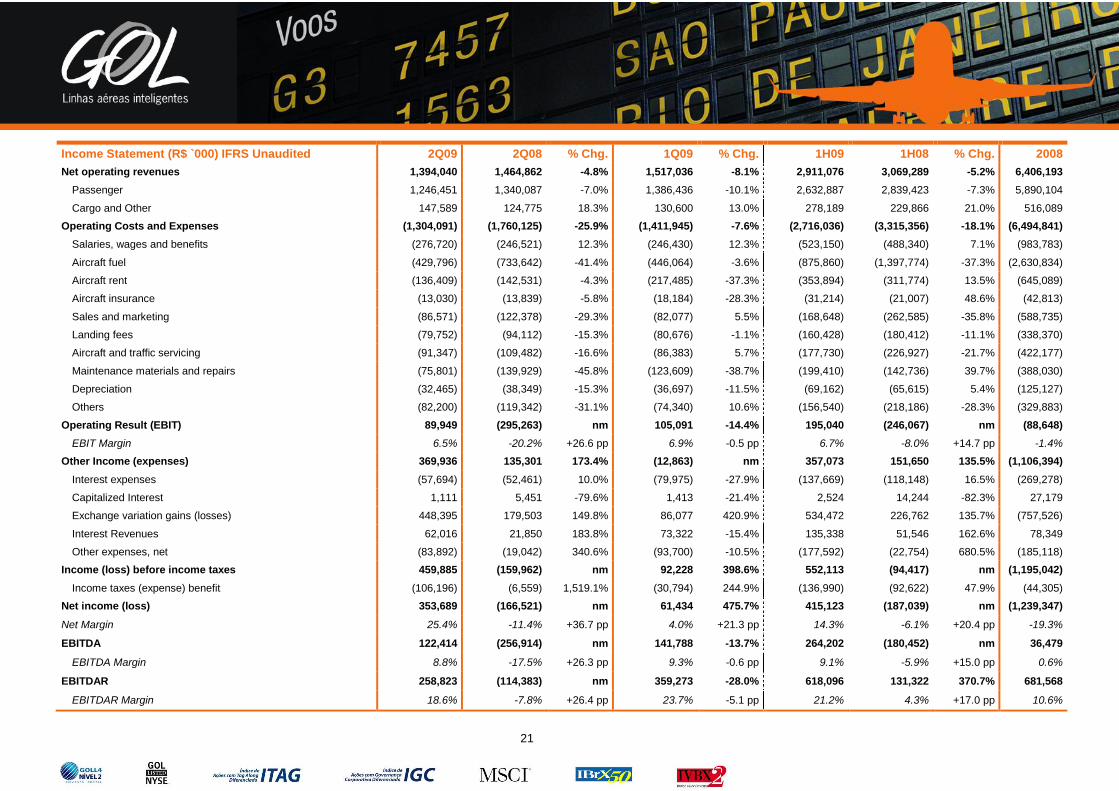
Income Statement (R$ `000) IFRS Unaudited 2Q09 2Q08 % Chg. 1Q09 % Chg. 1H09 1H08 % Chg. 2008
Net operating revenues 1,394,040 1,464,862 -4.8% 1,517,036 -8.1% 2,911,076 3,069,289 -5.2% 6,406,193
Passenger 1,246,451 1,340,087 -7.0% 1,386,436 -10.1% 2,632,887 2,839,423 -7.3% 5,890,104
Cargo and Other 147,589 124,775 18.3% 130,600 13.0% 278,189 229,866 21.0% 516,089
Operating Costs and Expenses (1,304,091) (1,760,125) -25.9% (1,411,945) -7.6% (2,716,036) (3,315,356) -18.1% (6,494,841)
Salaries, wages and benefits (276,720) (246,521) 12.3% (246,430) 12.3% (523,150) (488,340) 7.1% (983,783)
Aircraft fuel (429,796) (733,642) -41.4% (446,064) -3.6% (875,860) (1,397,774) -37.3% (2,630,834)
Aircraft rent (136,409) (142,531) -4.3% (217,485) -37.3% (353,894) (311,774) 13.5% (645,089)
Aircraft insurance (13,030) (13,839) -5.8% (18,184) -28.3% (31,214) (21,007) 48.6% (42,813)
Sales and marketing (86,571) (122,378) -29.3% (82,077) 5.5% (168,648) (262,585) -35.8% (588,735)
Landing fees (79,752) (94,112) -15.3% (80,676) -1.1% (160,428) (180,412) -11.1% (338,370)
Aircraft and traffic servicing (91,347) (109,482) -16.6% (86,383) 5.7% (177,730) (226,927) -21.7% (422,177)
Maintenance materials and repairs (75,801) (139,929) -45.8% (123,609) -38.7% (199,410) (142,736) 39.7% (388,030)
Depreciation (32,465) (38,349) -15.3% (36,697) -11.5% (69,162) (65,615) 5.4% (125,127)
Others (82,200) (119,342) -31.1% (74,340) 10.6% (156,540) (218,186) -28.3% (329,883)
Operating Result (EBIT) 89,949 (295,263) nm 105,091 -14.4% 195,040 (246,067) nm (88,648)
EBIT Margin 6.5% -20.2% +26.6 pp 6.9% -0.5 pp 6.7% -8.0% +14.7 pp -1.4%
Other Income (expenses) 369,936 135,301 173.4% (12,863) nm 357,073 151,650 135.5% (1,106,394)
Interest expenses (57,694) (52,461) 10.0% (79,975) -27.9% (137,669) (118,148) 16.5% (269,278)
Capitalized Interest 1,111 5,451 -79.6% 1,413 -21.4% 2,524 14,244 -82.3% 27,179
Exchange variation gains (losses) 448,395 179,503 149.8% 86,077 420.9% 534,472 226,762 135.7% (757,526)
Interest Revenues 62,016 21,850 183.8% 73,322 -15.4% 135,338 51,546 162.6% 78,349
Other expenses, net (83,892) (19,042) 340.6% (93,700) -10.5% (177,592) (22,754) 680.5% (185,118)
Income (loss) before income taxes 459,885 (159,962) nm 92,228 398.6% 552,113 (94,417) nm (1,195,042)
Income taxes (expense) benefit (106,196) (6,559) 1,519.1% (30,794) 244.9% (136,990) (92,622) 47.9% (44,305)
Net income (loss) 353,689 (166,521) nm 61,434 475.7% 415,123 (187,039) nm (1,239,347)
Net Margin 25.4% -11.4% +36.7 pp 4.0% +21.3 pp 14.3% -6.1% +20.4 pp -19.3%
EBITDA 122,414 (256,914) nm 141,788 -13.7% 264,202 (180,452) nm 36,479
EBITDA Margin 8.8% -17.5% +26.3 pp 9.3% -0.6 pp 9.1% -5.9% +15.0 pp 0.6%
EBITDAR 258,823 (114,383) nm 359,273 -28.0% 618,096 131,322 370.7% 681,568
EBITDAR Margin 18.6% -7.8% +26.4 pp 23.7% -5.1 pp 21.2% 4.3% +17.0 pp 10.6%
22
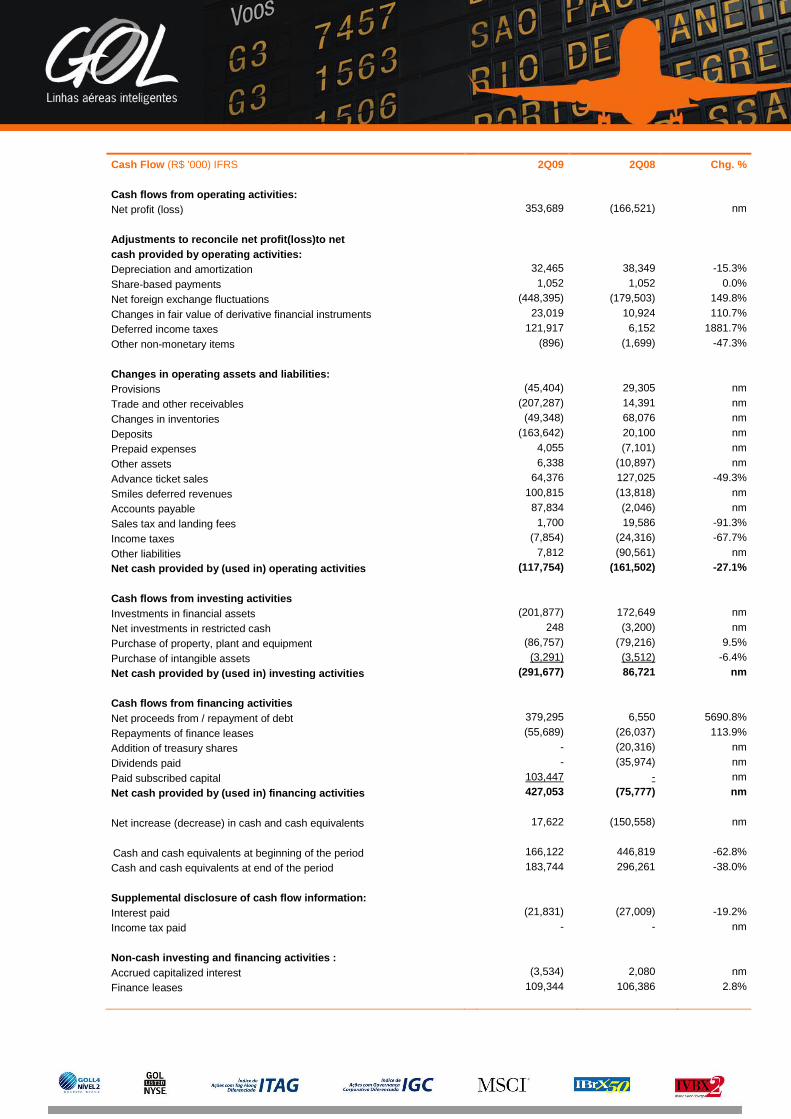
Cash Flow (R$ '000) IFRS 2Q09 2Q08 Chg. %
Cash flows from operating activities: Net profit (loss)
353,689 (166,521) nm
Adjustments to reconcile net profit(loss)to net cash provided by operating activities: Depreciation and amortization
32,465 38,349 -15.3%
Share-based payments 1,052 1,052 0.0%
Net foreign exchange fluctuations (448,395) (179,503) 149.8%
Changes in fair value of derivative financial instruments 23,019 10,924 110.7%
Deferred income taxes 121,917 6,152 1881.7%
Other non-monetary items (896) (1,699) -47.3%
Changes in operating assets and liabilities: Provisions
(45,404) 29,305 nm
Trade and other receivables (207,287) 14,391 nm
Changes in inventories (49,348) 68,076 nm
Deposits (163,642) 20,100 nm
Prepaid expenses 4,055 (7,101) nm
Other assets 6,338 (10,897) nm
Advance ticket sales 64,376 127,025 -49.3%
Smiles deferred revenues 100,815 (13,818) nm
Accounts payable 87,834 (2,046) nm
Sales tax and landing fees 1,700 19,586 -91.3%
Income taxes (7,854) (24,316) -67.7%
Other liabilities 7,812 (90,561) nm
Net cash provided by (used in) operating activities (117,754) (161,502) -27.1%
Cash flows from investing activities Investments in financial assets
(201,877) 172,649 nm
Net investments in restricted cash 248 (3,200) nm
Purchase of property, plant and equipment (86,757) (79,216) 9.5%
Purchase of intangible assets (3,291) (3,512) -6.4%
Net cash provided by (used in) investing activities (291,677) 86,721 nm
Cash flows from financing activities Net proceeds from / repayment of debt
379,295 6,550 5690.8%
Repayments of finance leases (55,689) (26,037) 113.9%
Addition of treasury shares - (20,316) nm
Dividends paid - (35,974) nm
Paid subscribed capital 103,447 - nm
Net cash provided by (used in) financing activities 427,053 (75,777) nm
Net increase (decrease) in cash and cash equivalents 17,622 (150,558) nm
Cash and cash equivalents at beginning of the period 166,122 446,819 -62.8%
Cash and cash equivalents at end of the period 183,744 296,261 -38.0%
Supplemental disclosure of cash flow information: Interest paid
(21,831) (27,009) -19.2%
Income tax paid - - nm
Non-cash investing and financing activities : Accrued capitalized interest
(3,534) 2,080 nm
Finance leases 109,344 106,386 2.8%
23
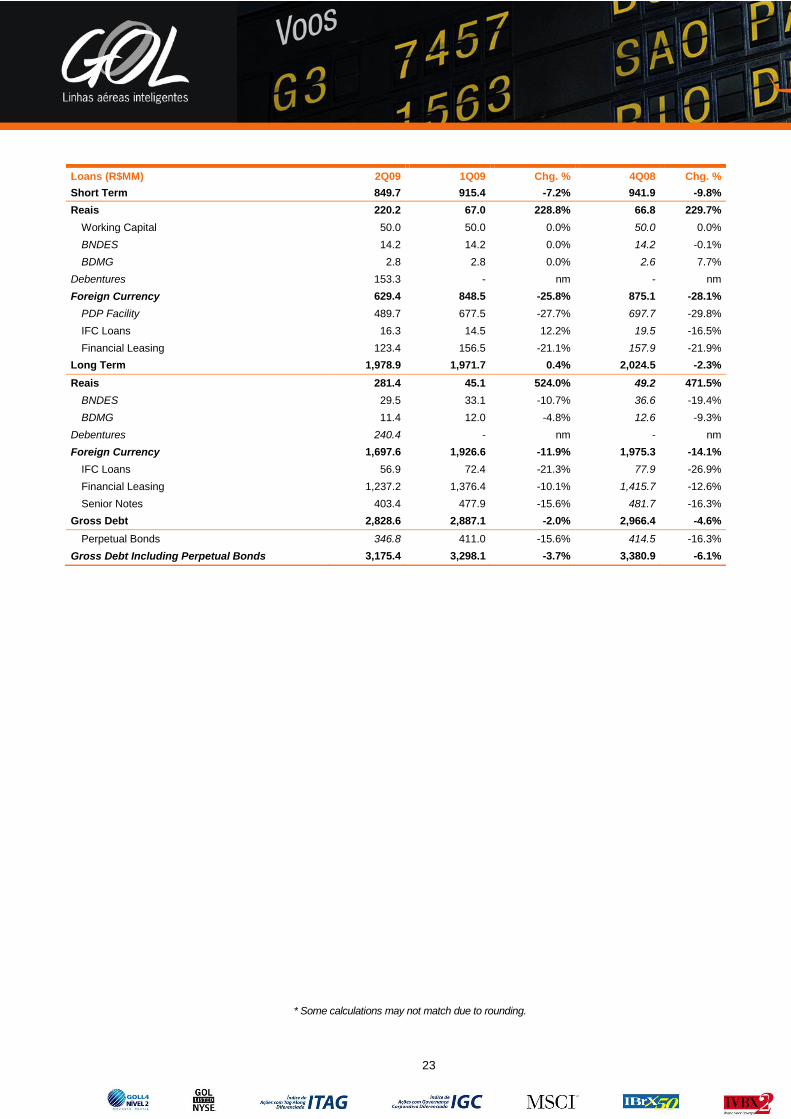
Loans (R$MM) 2Q09 1Q09 Chg. % 4Q08 Chg. %
Short Term 849.7 915.4 -7.2% 941.9 -9.8%
Reais 220.2 67.0 228.8% 66.8 229.7%
Working Capital 50.0 50.0 0.0% 50.0 0.0%
BNDES 14.2 14.2 0.0% 14.2 -0.1%
BDMG 2.8 2.8 0.0% 2.6 7.7%
Debentures 153.3 - nm - nm
Foreign Currency 629.4 848.5 -25.8% 875.1 -28.1%
PDP Facility 489.7 677.5 -27.7% 697.7 -29.8%
IFC Loans 16.3 14.5 12.2% 19.5 -16.5%
Financial Leasing 123.4 156.5 -21.1% 157.9 -21.9%
Long Term 1,978.9 1,971.7 0.4% 2,024.5 -2.3%
Reais 281.4 45.1 524.0% 49.2 471.5%
BNDES 29.5 33.1 -10.7% 36.6 -19.4%
BDMG 11.4 12.0 -4.8% 12.6 -9.3%
Debentures 240.4 - nm - nm
Foreign Currency 1,697.6 1,926.6 -11.9% 1,975.3 -14.1%
IFC Loans 56.9 72.4 -21.3% 77.9 -26.9%
Financial Leasing 1,237.2 1,376.4 -10.1% 1,415.7 -12.6%
Senior Notes 403.4 477.9 -15.6% 481.7 -16.3%
Gross Debt 2,828.6 2,887.1 -2.0% 2,966.4 -4.6%
Perpetual Bonds 346.8 411.0 -15.6% 414.5 -16.3%
Gross Debt Including Perpetual Bonds 3,175.4 3,298.1 -3.7% 3,380.9 -6.1%
* Some calculations may not match due to rounding.
24
CONTACT:
Investor Relations Leonardo Pereira - CFO and IRO
Rodrigo Alves – Head of IR Phone.: (55 11) 2128-4700 E-mail: [email protected] Website: www.voegol.com.br/ir
Twitter: twitter.com\GOLinvest Corporate Communication Phone.: (55 11) 2128-4413 c [email protected]
Media Relations FSB Comunicações (Brazil) Carolina Stefanini e Érica Arruda Phone.: (55 11) 3061-9596 (55 11) 2128-4420 [email protected] or [email protected] Edelman (U.S and Europe): M. Smith e N. Dean Phone.: 1 (212) 704-8196 / 704-4484 [email protected] or [email protected]
About GOL Linhas Aéreas Inteligentes S.A.
GOL Linhas Aéreas Inteligentes S.A. (NYSE: GOL and Bovespa: GOLL4),
the largest low-cost and low-fare airline in Latin America, offers around 800
daily flights to 49 destinations that connect all the important cities in Brazil
and nine major destinations in South America. The Company operates a
young, modern fleet of Boeing 737 Next Generation aircraft, the safest and
most comfortable of its class, with high aircraft utilization and efficiency
levels. The Company’s service is recognized as the best value proposition in
the market.
This release contains forward-looking statements relating to the prospects of the
business, estimates for operating and financial results, and those related to growth
prospects of GOL. These are merely projections and, as such, are based exclusively
on the expectations of GOL’s management concerning the future of the business and
its continued access to capital to fund the Company’s business plan. Such forward-
looking statements depend, substantially, on changes in market conditions and risks
disclosed in GOL’s filed disclosure documents and are, therefore, subject to change
without prior notice.


