Embed Size (px)
Citation preview

GOVERNANCE AND OWNERSHIP STRUCTURE IN CHILEAN 111Revista ABANTE, Vol. 1, Nº 1, pp. 111-139 (abril 1998)
GOVERNANCE AND OWNERSHIP STRUCTURE INCHILEAN ECONOMIC GROUPS *
NICOLÁS MAJLUF**
NUREYA ABARCA ***
DARÍO RODRÍGUEZ****
LUIS ARTURO FUENTES*****
ABSTRACT
The purpose of this paper is to present a descriptive analysis of eco-nomic groups in Chile. It classifies the economic groups operating inthe country, according to their ownership and governance patterns,describing typical ownership structures and concentration. From a gov-ernance perspective, groups in Chile are multi-layered structures. Someadditional characteristics of groups are provided: i.e. diversification,size, ownership control and dispersion within the group, boards inter-locking, and foreign participation in joint ventures with local groups.The Chilean structuring of groups is partly compared with the solutionsimplemented in Japan, Germany, England and the United States.
RESUMEN
El propósito de este trabajo es presentar un análisis descriptivo de losgrupos económicos en Chile. Se clasifican aquellos grupos económicosque operan en el país, de acuerdo a sus patrones de propiedad y auto-ridad, describiendo las típicas estructuras de propiedad y concentra-ción. Desde la perspectiva de su autoridad, los grupos en Chile poseenestructuras con múltiples capas. Se presentan algunas característicasadicionales de los grupos, p. ej., diversificación, tamaño, control de susautoridades y dispersión dentro del grupo, consejos de administraciónque se entrelazan y participación foránea en joint ventures con grupos
* This paper is based on Luis Arturo Fuentes, “Los Principales Grupos Económicos en Chile:Comparación con las Estructuras de Propiedad en Otros Países”, Memoria para optar al título deIngeniero Civil de Industrias con Mención en Química, Pontificia Universidad Católica de Chile,Escuela de Ingeniería, Santiago, Chile, 1995. This thesis work is part of a research project on themanagement practices in Chile, partly financed by FONDECYT, a Chilean Government fund forsupporting research in the sciences and technology. The project was conducted by professors Majluf,Abarca and Rodríguez.
The authors acknowledge the valuable comments and suggestions of Matko Koljatic.** School of Engineering, Pontificia Universidad Católica de Chile.*** School of Business, Pontificia Universidad Católica de Chile.**** Institute of Sociology, Pontificia Universidad Católica de Chile.***** School of Engineering, Pontificia Universidad Católica de Chile.

112 REVISTA ABANTE, VOL. 1, Nº 1
locales. La estructura de los grupos chilenos se compara en parte conlas soluciones puestas en prácticas en Japón, Alemania, Inglaterra ylos Estados Unidos.
Most economic groups operating in Chile in the 90´s, either emerged or weregreatly transformed by one of the two major waves of privatization; the first onefrom 1974 to 1979 and the second one from 1984 to 19891. Groups are usuallyformed by a variety of business units, whose majority ownership and managementare frequently in the hands of a family, though more recently some new groupshave emerged, controlled by owners-managers (Dahse, 1983; Lagos, 1965; Lüders,1992).
The legal definition of an Economic Group in the Chilean Law states that2:“An economic group is a set of companies which present such a sort of relationshipsand linkages in their property, management, administration or credit responsibilities,that there is ground to believe that the economic and financial decisions of thosecompanies are guided by or subordinated to the shared interest of the group, orthat there are common financial risks in the credits obtained or in the financialinstruments they issue”. For more definitions of economic groups, see Leff (1978),Sanfuentes (1984), Dahse (1979).
In an official document of the Chilean SEC3, 58 significant economic groupsare identified, as defined in the legal codes. This work posits that Chilean groupsmay be classified into three categories:
a) Family-owned groups.As its name indicates, these groups are owned and managed by one family.
The most important among them and their flagship companies (in parenthesis)are:• Angelini (Copec, a diversified conglomerate in wood and pulp, fishing, fuel
distribution, electric generation and distribution, coal and services);• Luksic (Madeco, a copper manufacturer; CCU, beers and soft drinks; Banco
Santiago, in the financial sector; Lucchetti, in food products, and many othersin the copper mining and telecommunications industries);
• Matte (CMPC, wood, pulp and paper; and Bicecorp, in the banking sector).Other important groups are: Corp Group (Bancosorno4, banking); Claro
(CSAV, sea freight); Elecmetal, (foundry); Cristalchile, (in glass, wine andbroadcasting); Cruzat (Cruz Blanca, a conglomerate based on a health insurancecompany), Errázuriz (mainly in supermarkets and car dealership), Larraín (mainlyin food, wine and furniture); and Said (Coca-Cola bottler, banking, and real estate).
1 Hachette, D.; Lüders, R. Privatization in Chile, An Economic Appraisal. ICS Press, San Fran-cisco, California.
2 Artículo 96, Título XV, Ley 18045 Mercado de Valores (Free Translation).3 Superintendencia de Valores y Seguros (SVS), Circular No. 1162, June 27, 1994.4 They have recently sold Bancosorno to Banco Santander, and acquired a controlling interest in
Banco Concepción.

GOVERNANCE AND OWNERSHIP STRUCTURE IN CHILEAN 113
In terms of their evolution, most family groups have roots in entrepreneurs(or their descendants) who have been active in the Chilean business scene forseveral decades. The dominant family groups present today have grown rapidlysince the 80´s, thanks to the fast economic development of the country in the pastdecade and also via fusion, mergers and the acquisition of bankrupt companieswhich were in the hands of Banks after the economic crisis of 1982.b) Management Buy Outs (MBOs)
These are groups of companies which were state owned, and later privatizedand at present are currently controlled and run by their former executives, whohold the dual role of shareholders and managers. Most important among themare:• Naviera (CCNI, the second largest sea freight company in the country),• Pathfinder (Masisa, in wood panels; and Iansa, in agribusiness)• Sigdo Koppers (originally an engineering and construction company, whose
owners hold now a broad portfolio of different businesses in home appliances,car dealership, explosives and electricity distribution).
• CAP (formerly the government-owned steel company).These groups have a shorter history than family groups, most originating in
the first wave of privatizations of the late 70´s. A key element in the formationof these groups was the privatization of state-owned companies (by the conversionof severance payment rights of executives and employees into equity shares) andthe “capitalismo popular”5 mechanism whereby employees and executives receivedfinancial support (from the government) to purchase shares of their companiesbeing privatized. In order to give these companies governance, the governmentgave control of the companies to their executives, which they retain today.
c) MBOs, with significant pension fund (AFP) shareholding.These are groups run and controlled by their former managers, in which AFP´s
have significant but minority shareholding positions. Among these groups, thefollowing conglomerates must be singled out:• Enersis, which holds a portfolio of companies that includes Endesa, the largest
power and electricity generator in Chile, Chilectra, the largest electricitydistribution company, and Manso de Velasco, a large real estate developer.
• Chilgener (mainly concentrated in power and electricity generation in Chileand abroad).
• Soquimich (in the nitrate industry).The origin and evolution of these groups is similar to the MBO groups, except
for the fact that pension funds have taken important ownership positions as newequity was required for these groups to grow.
5 “Popular capitalism” was one of several incentive mechanisms devised by the Chilean governmentto inject capital in to financial institutions in 1986. Please refer to Hachette and Lüders (1992) forfurther reference.

114 REVISTA ABANTE, VOL. 1, Nº 1
I. Ownership Concentration in Chile
Ownership concentration of companies traded in the Chilean Stock Exchangesappears unusually high, when compared with companies traded in the StockExchanges of the developed world. This concentration is twofold: a fewshareholders hold a significant portion of stocks in these companies and also controla significant number of companies. A first indication of this phenomenon is shownin Table I, which compares the percentage share of property owned by the largestshareholder in a sample of the largest companies in five countries. In Chile, thelargest shareholders control 40% of shares, almost twice the level in Germany(22%), and significantly above the levels in Japan (7%), the USA and the UK(5%). Although the figures might be questionable because of the small samplesize, the differences are striking.
TABLE IPERCENTAGE OF PROPERTY HELD BY LARGEST SHAREHOLDER
IN SELECTED COUNTRIES
Percentage of Property Sample size (1)
Chile 40 10Japan 7 13Germany 22 9USA-UK 5 9
Sources: Own elaboration. Sources used are:Chile: Annual Reports of the ten largest privately-held companies.Japan: Diamond’s Japan Business Directory, Diamond Lead Co., Ltd., June 1993.Germany: Deutsche Börsen Annual Report 1993; Rund um die Börse, Commerzbank, 1994.USA-UK: Information provided by Technimetrics, Inc., New York; and London Stock ExchangeYearbook, 1993-1994.(1) Sample of largest firms in each country.
The high concentration of control in Chilean firms is also evident in Table II,which indicates the percentage share of property in the hands of different categoriesof shareholders, when considering all the companies in the stock market in eachcountry. The largest shareholders in Chile control over 60% of the total shares ofcompanies traded in the Stock Exchange. This level of concentration does not ap-pear in the USA nor in the UK. In Japan and Germany, the controlling group isincluded under the headings “Companies” and “Banks”, but even adding togetherall shares in those categories, the resulting figure is below the 60% found in Chile.
A third proxy indicator of property concentration is the trading of shares inthe Chilean Stock Exchanges. Table III shows the ratio of total transactions ofshares, in a given year, to total market value at the end of the same year. Chileshows a low ratio (6.2%) when compared with the USA (46%) and the UK (61%).A possible explanation for this low trading level is that controlling groups do nottrade their shares, and as seen before, theirs is a large fraction of the totaloutstanding shares of listed companies.

GOVERNANCE AND OWNERSHIP STRUCTURE IN CHILEAN 115
A. Research methodology and sample selection
Given the apparently high ownership concentration at corporations traded inthe Chilean stock market, the selected methodology for this research is to analyzea sample of the most important economic groups in the country. Table IV ranksthe Chilean economic groups, (excluding state controlled companies and those
TABLE IIPERCENTAGE OF PROPERTY HELD BY DIFFERENT SHAREHOLDER
CATEGORIES IN SELECTED COUNTRIES
Categories of Chile Japan Germany UK USAInvestors
Companies (1)64.2 60.6 26.9 28.6 39.6 46.3 0.0 0.0 0.0 0.0Banks 0.0 0.0 18.5 15.1 6.9 9.8 0.0 0.0 0.0 0.0Overseas 0.7 2.9 6.4 6.3 21.3 16.6 3.6 12.5 4.3 4.5Institutional 6.4 12.5 11.7 12.3 3.1 4.7 50.8 58.1 26.2 37.2Private (2) 28.7 24.0 27.6 21.0 29.1 22.6 28.6 21.4 69.5 53.4Others 0.0 0.0 8.9 16.7 0.0 0.0 17.0 8.0 0.0 4.9Years 90 93 83 93 83 92 83 93 82 92
Source: Own elaboration. Sources used are:Chile: Bolsa de Comercio de Santiago, Análisis y Antecedentes Financieros, 1990, 1993, 1994; and,Bolsa de Comercio de Santiago, Información Relevante 1994.Other countries: The Economist, “Survey on Corporate Governance: Watching the Boss”, Jan. 29,1994.(1) In Chile “Companies” represents the 12 largest investors, published in the list of shareholders bythe Santiago Stock Exchange, excluding from this group Institutional and Overseas Investors.(2) In Chile “Private” represents all other investors not included among the 12 largest.
TABLE IIISHARE TURNOVER IN SELECTED COUNTRIES
Chile Japan Germany UK USASantiago Tokyo Frankfurt London New York
1993 1991 1991 1992 1992
Total Market Value (1) 45,195 3,018,565 361,675 943,192 3,789,032# of Registered Corp.–National 244 1,641 405 1,848 1,969–Overseas 0 125 359 514 120Turnover–Million US$ per year 2,799 827,096 272,546 576,548 1,741,511–as % of Total MV 6.2 27.4 75.4 61.1 46.0
Source: Own elaboration. Sources used are:Chile: Bolsa de Comercio de Santiago, Información Relevante 1994.Other countries: Tokyo Stock Exchange Fact Book, 1993; Deutsche Börsen Annual Report 1993; andLondon Stock Exchange Yearbook, 1993-1994.(1) Total MV in US$ million at the end of each year

116 REVISTA ABANTE, VOL. 1, Nº 1
operating exclusively in the financial sector), by size, in terms of total marketvalue of their listed companies at the end of 1994. The seventeen groups in tableIV represent a combined 62% of total market value in the Santiago Stock Exchange,although this figure does not necessarily reflect wealth concentration, since itoverestimates the actual equity in the hands of the groups6.
The groups selected for deeper analysis are the three most important familygroups, namely Angelini, Luksic, and Matte, together with two of the largestemerging groups formed as a result of MBOs, Pathfinder, and Sigdo Koppers.The MBOs with an important participation of pension funds are not studied indepth in this paper. Nonetheless, a comparison is provided between the groups inthe sample and Chilgener (a firm where pension funds own the majority interest).
The listed companies conforming the five groups included in this study, accountfor around 30% of the total market value of firms traded in Chile. Chilgenercontributes 2.3% to this total. The degree of representation of the five groups isappreciated in Table V, which shows that these groups control 42 out of the 150largest companies in the country, while the other 12 groups in Table IV control26 additional companies.
II. Results: Ownership and Governancestructures of the selected groups
This section presents the main findings of this research. A summary with thebasic characteristics of the ownership and control structure of the five economicgroups in the sample is shown in Exhibits 1 through 5. The information includedis:– A diagram showing the investment companies (represented by rectangles) and
the holding companies (represented by a rounded figure). These are linkedby arrows, with a figure indicating the percentage of shares of holdingcompanies owned by each one of the investment companies. Participation offoreign firms in joint ventures with local groups are also indicated in thediagram, where applicable.
– Box A provides a description of the holding companies and their correspondingindustry. This section in the diagram shows total equity (in US$ million, asan indicator of size) and the level of control (as measured by the ownershippercentage in the hands of the group). Also, it shows the number of subsidiariesin each holding company (as an indicator of their size and complexity), andthe number of investors owning shares in each holding company (which is anindicator of ownership dispersion within the group).
6 There are some duplications and omissions in these figures, because listed subsidiaries are alsoimpacting the market value of the main companies, and unlisted firms are not always consolidated.This problem implies that these figures are not necessarily a reflection of wealth concentration sinceit overestimates the actual equity in the hands of the groups, because there is a pyramidal effect dueto double accounting, such as when company A owns a proportion of company B, thus the equity ofA includes the equity of B.

GOVERNANCE AND OWNERSHIP STRUCTURE IN CHILEAN 117
TABLE IVTHE MOST IMPORTANT ECONOMIC GROUPS IN CHILE IN THE INDUSTRIAL
AND UTILITY SECTORS.
Economic Group Market Value (MV) % of Total # of firms Category(5)(US$ million) (1) MV (2) (3) (4) 1 2 3
Groups in the sampleAngelini 8,426.8 12.4 42 86 xLuksic 3,844.3 5.7 51 93 xMatte 5,232.2 7.7 43 69 xPathfinder 1,764.7 2.6 10 18 xSigdo Koppers 825.8 1.2 19 37 xSample total 20,093.8 29.6 165 301Other important groupsPizarreño 315.4 0.5 9 xAbumohor 576.4 0.8 16 xClaro 1,385.2 2.0 16 xCruzat 465.9 0.7 21 xErrázuriz 181.7 0.3 24 xLarraín 347.3 0.5 10 xSaid 1,672.5 2.5 19 xCap 1,112.4 1.6 20 xNavieras 195.1 0.3 13 xChilgener 1,536.2 2.3 n.a. xEnersis 13,496.1 19.9 37 xSoquimich 587.8 0.9 n.a. xOther groups total 21,872.0 32.3Overall total 41,965.8 61.9Total Market Value 67,734.5 100.0
(1) Total market value of group- controlled firms that are traded in the Santiago Stock Exchange, asof 12/31/94. The original values in Chilean pesos have been converted at the rate of C$ 402.92 perUS dollar.(2) The market value of the firm as % of the total market value of firms traded in the Santiago StockExchange.(3) The most important firms in the group as reported by Estrategia, a daily business paper, in theAugust 94 - May 95 period.(4) Total number of firms included in Figures 1 through 5(5) Categories are:1 Family-owned groups2 Emerging groups formed as a result of Management Buy Outs3 Emerging groups formed as a result of Management Buy Outs, in which Pension Funds are importantshareholders
TABLE VECONOMIC GROUP CONTROL OF THE 150 LARGEST COMPANIES IN CHILE (1)
Economic Group Number of firms controlled
The 5 groups in the sample 42The other 12 groups in Table 4 26Other National 49Other International 21Chilean Government 12Total 150
(1) See Appendix for a list of the 150 largest companies in Chile

118 REVISTA ABANTE, VOL. 1, Nº 1
– Box B shows the size of the Board (number of board seats) and the percentageof these positions controlled by the group. This is an indicator of the manage-ment responsibilities in the hands of the group.
– Box C shows the interlocking of boards in terms of the total number of boardseats controlled by the group and the number of members of the group whohave these positions. The indicator “board positions per group member” is aproxy for board interlocking; the higher the indicator, the stronger theinterlocking of the board.The analysis of these exhibits suggest several propositions about ownership
and governance, listed below:
a) Groups have a multi-layered structure.- The “family owned” and “MBOs”groups under analysis show a three tiered structure: “investment companies” whichcontrol “holding companies”, which in turn control “subsidiaries”.
The first tier is composed of privately held corporations which we have labeledthe “investment companies”. These “investment companies” are the legal ownersof the group’s shares of the “holding companies”. Each group has its own parti-cular arrangement of relationships among the “investment companies”, and betweenthese and the “holding companies”. For example, the Angelini and the Matte groupshave a rather intricate knitting of their “investment companies”; while the Luksicgroup has an almost one to one relationship between the “investment” and the“holding” companies. The other interesting case is the Sigdo Koppers group, wherethe seven principal owners have formed seven independent “investment companies”,sharing the ownership of “holding companies”. Table VI summarizes the averagenumber of “investment companies” which own shares of the “holding companies”of each group.
TABLE VI.AVERAGE NUMBER OF “INVESTMENT COMPANIES”
OWNING SHARES OF “HOLDING COMPANIES”
Group Average number of “investment companies”
Angelini 4.8Luksic 1.3Matte 6.5Pathfinder 1.5Sigdo Koppers 7.0
Source: Exhibits 1 through 5; column “investors” in Box A.
The second tier is formed by the “holding companies” in each group. Moreoften than not these are focused on a rather narrow industrial sector as shown inExhibits 1 through 5. For example, CMPC of the Matte group is concentrated inwood, pulp and paper. The only exception is Copec, in the Angelini group, whichis a diversified conglomerate, in the fuel, electricity, forestry, mining, fishing, andservices industries. The majority of these “holding companies” are “opencorporations”, traded in the Chilean Stock Exchange.

GOVERNANCE AND OWNERSHIP STRUCTURE IN CHILEAN 119
The third tier corresponds to the “subsidiaries”, equivalent in concept toStrategic Business Units (SBU´s), which depend from the “holding companies”.As examples of what happens in this tier, Exhibits 6 and 7 display the total arrayof “subsidiaries” of the two largest “holding companies”: Copec (Angelini group),with 54 subsidiaries and CMPC (Matte group), with 34 subsidiaries. The generalnorm is that “subsidiaries” are fully owned by the holding companies. Table VIIshows the maximum number of subsidiaries in a holding company for each group,as an indication of their size and complexity.
TABLE VIIMAXIMUM NUMBER OF SUBSIDIARIES IN A HOLDING COMPANY
Group Maximum number of subsidiaries
Angelini 54Luksic 31Matte 34Pathfinder 8Sigdo Koppers 7
Source: Exhibits 1 through 5; column “subsidiaries” in Box A.
b) Groups show a varied diversification pattern.- Although the holdingcompanies generally focus on a single industry and groups are a rather diversifiedaggregation of companies in several industries, the levels of diversification arequite different from one group to another. An indicator of relative diversificationwas built with the information provided about the total equity in Box A of Exhibits1 through 5, in terms of a “specialization ratio”. This indicator is defined as theratio of the largest investment in one industry to the total equity of the companiesin the group. Table VIII shows this indicator for the five groups. It can be seenthat out of the three major family-owned groups, the Matte group is heavilyconcentrated (92.2%) in the wood, pulp and paper industry; Angelini has a high,but lower, level of concentration in the same industry (61,7%); whereas the Luksicgroup is broadly diversified in a variety of industries(22.3%). With regard to theother two groups in the sample, both are rather diversified, with “specializationratios” slightly below 50%.
TABLE VIIISPECIALIZATION RATIO OF THE GROUPS IN THE SAMPLE
(largest investment in one industry / total equity of the companies in the group)
Group Specialization ratio (%)
Angelini 61.7Luksic 22.3Matte 92.2Pathfinder 47.5Sigdo Koppers 45.9
Source: Exhibits 1 through 5, column “equity” in Box A.

120 REVISTA ABANTE, VOL. 1, Nº 1
c) “Holding companies” are tightly controlled.- Groups maintain a controllinginterest in “holding companies”. As shown in Table IX, the percentage of sharesheld by the groups is over 50% in all cases, except the Pathfinder group.
TABLE IXAVERAGE PERCENTAGE OF SHARES CONTROLLED BY THE GROUPS
Group Percentage (%)
Angelini 60.4Luksic 60.3Matte 53.1Pathfinder 48.9Sigdo Koppers 52.9
Source: Exhibits 1 through 5, column “%” in Box A.
A possible explanation for this finding relates to voting rights at shareholdersmeetings; since normally there are no “preferred” shares, ownership of 50% ofshares is required to establish control.
d) High group control of the Boards in “holding companies”.- As a directconsequence of the ownership concentration reported in the previous paragraph,from a “governance” perspective the five groups exert significant power inappointing Board members. Table X summarizes the total number of positionscontrolled by each group, in the Boards of holding companies. It may be seenthat groups have very high representation, controlling 121 out of 141 seats (86%)in the Boards of “holding companies”. The other members represent “strategicpartners” incorporated in “joint ventures”.
TABLE XBOARD POSITIONS CONTROLLED BY THE GROUP
Group Board positions Positions controlled by the group
Angelini (1) 29 27Luksic (2) 40 38Matte (3) 16 13Pathfinder (4) 17 13Sigdo Koppers (5) 39 30Total 141 121
Source: Exhibits 1 through 5; Box B.The board positions not controlled by the groups are in the hands of strategic partners:(1) Carter Holt Harvey (New Zealand) and Matte family.(2) Paulaner (Germany)(3) Rothschild (United Kingdom)(4) Pilkington (United Kingdom); other information is not available.(5) Austin Power (USA); other information is not available.
GOVERNANCE AND OWNERSHIP STRUCTURE IN CHILEAN 121
e) High repetition of Board membership.- A second interesting perspective ongovernance relates to “interlocking of Boards”, that refers to the fact that thesame individuals act in more than one Board in representation of the owners. Theindicator “board positions per group member” is used in this work to indicate the“concentration of membership at the Board level” of individuals working for thegroups. Table XI summarizes this information for the five groups in the sample.
Family-owned groups show a low parameter for this indicator, ranging between1.2 and 1.3, meaning that, on average, five different individuals are appointed insix boards. The situation is different in the two emerging groups included in thesample: in the Pathfinder group, each individual is a member of two Boards andin the Sigdo Koppers group, each individual is a member of three Boards. Webelieve this indicator shows that emerging groups are more closely controlled bythe owners, who participate much more actively in the day-to-day affairs of firms.The lower level of repetition of the same individuals in Boards in the family-owned groups may be reflecting the large number of companies owned.
TABLE XIREPETITION OF BOARD MEMBERS
Group Board positions per group member
Angelini 1.2Luksic 1.2Matte 1.3Pathfinder 1.9Sigdo Koppers 3.3
Source: Exhibits 1 through 5; Box C.
The above indicator could also be the result of the intention to promoterelationships among companies owned, via “interlocking” of Boards. However,this conclusion requires additional research on the purpose of this governanceissue by the group owners.
f) Groups have established “strategic alliances” and “joint ventures” withforeign firms.- The participation of foreign firms may be observed in any one of thethree tiers previously described (i.e. “investments companies, holding companies,and subsidiaries”). We did not find a general rule regarding the association of Chileanand foreign firms. Each joint venture represents a peculiar solution, agreed upon bythe partners, depending on the particular competitive setting.– The Angelini group is associated with Carter Holt Harvey (New Zealand) in
its most important investment company (Inversiones y Desarrollo Los Andes,which controls Copec) and directly in a holding company in the fishing industry(Pesquera I-G Mar). CHH participates in the board of this last company, butit is not present in the Copec Board, as a result of a shareholders agreement(which is being impeached in court by International Paper, since the acquisitionof CHH by this American company).

122 REVISTA ABANTE, VOL. 1, Nº 1
– The Luksic group is associated with Paulaner (Germany) in the investmentcompany that holds CCU (a company in the beverage industry, mainly beerand soft drinks), and they have representatives in the board. In the bankingsector, the Luksic group is associated with Banco Centro-Hispano (from Spain),at the level of “investment companies”, and with the Hong Kong & ShanghaiBanking Corporation at the level of one of the “holding companies” in thisindustry (Banco O’Higgins).
– The Matte group is associated with Rothschild (from the UK) in Bicecorp,their holding company in the banking sector, which controls 2 or 3 out of the9 positions in the board. Also, this is the only group in the sample which isassociated with a foreign company at the level of a subsidiary. CMPC partnerswith P&G (from the USA) in PROSAN, a company manufacturing sanitaryproducts.
– The Pathfinder group is associated with Pilkington (from the UK.) in VidriosLirquén, its holding company in the glass industry. This is the only case inthe sample in which the foreign company is the main shareholder, althoughit is managed by the Chilean partner.
– The Sigdo Koppers group is associated with Austin Power (USA) in Enaex,its holding corporation in mining explosives and with several automobilemanufacturers, in car dealerships.
g) Cross holdings among groups in the sample are not significant.- Generallyspeaking, groups do not share ownership of companies. The exceptions to thisfinding are:– The Angelini group owns through Copec an 8.25% of CCU, one of the hol-
ding companies of the Luksic group.– The Matte group participates, through different investment companies, with
6.77% in Copec, the main holding company of the Angelini group. It controlsone position in the Board of Directors.There are also a few cases of joint ventures among the Angelini and Matte
groups at the level of their subsidiaries. These two groups share the property andcontrol of three companies in the financial sector (AFP Summa, Seguros El Robleand Seguros El Raulí) and one in the electricity distribution sector (HidroeléctricaEl Melocotón).
III. Compared ownership and governance structures between ChileanEconomic groups and selected countries
The pre-war structure of Japanese Zaibatsus is very similar to the currentstructure of Chilean groups. Exhibit 8 shows the three tiers which include the“investment companies”, the “holding companies”, and the “subsidiaries” dependingfrom them. After the war, the Zaibatsus were forced to restructure to promotecompetition, giving way to the current Japanese Keiretsus. Essentially, “investmentcompanies” at the top of the old Zaibatsus hierarchy were eliminated, creating

GOVERNANCE AND OWNERSHIP STRUCTURE IN CHILEAN 123
instead a dense network of relationships among the main holding companies. Thesehave cross-property and interlocking Board memberships, which, in this newarrangement, are fundamental components for achieving the required coordinationamong firms. Keiretsus are thus different from the model prevailing in Chileaneconomic groups in the 90´s.
In Germany, there are also three tiers in the ownership structure of groups,but the top level is represented by banks and institutional investors, instead of byfamily or management owned “investment companies”. This model is againdifferent from the one prevailing in Chile. The large number of Mittelstand 7
companies related with banks, do not constitute a group in the Chilean sense.These companies are family-owned businesses which partly rely on banks fortheir financing. Banks have obtained in exchange a certain number of shares asan escrow, which grant them economic rights and a seat in the Supervisory Boardof those companies. This also explains the small size of the German StockExchange in relation with other developed countries, as seen in Table III, becausecompanies rely chiefly on banks for their financing. Similar to the Japanese case,German companies have a fair amount of cross-property, though it is not as denseand intertwined as in Japan. The ownership of Chilean companies follows a verydifferent model, because they do not have circular links (firm “A” owning sharesof firm “B” and vice versa).
Although there are differences between the ownership of firms in Chile, Japan,and Germany, they have in common a few characteristics, mainly when comparedwith the United Kingdom and the United States: there is a strong linkage betweenowners and managers; ownership is rather concentrated; and there is a long-termcommitment between the owners and their companies, which is made explicit inthe low turnover of shares in these countries8. In fact, economic groups in theUnited Kingdom and the United States have their property broadly dispersed.Institutional and private investors are the dominant shareholders (Table II) but donot participate actively in the management of firms, at least when compared withthe cases of Chile, Japan, and Germany.
This separation between ownership and management in the UK and the USAcountries has been broadly studied. The “Agency Theory” refers to the set ofcontracts that owners must define to provide managers the proper incentives tomaximize company value while seeking their own well-being (Jensen and Meckling,1979; Fama and Jensen, 1983; Fama 1980). Financial models ussually assumethat managers look for the well-being of thei shareholders, as a matter of fact.Naturally, this will not always be the case, because managers have their own goals,
7 The medium-sized companies which form the backbone of German industry8 Table 3 shows the following turnover figures:–6.2% for Chile, which is explained by the absence of transactions by the controlling group–27.4 % for Japan, which though larger than in Chile, is partly explained by transactions inside
the groups.–75.4 % for Germany, a misleading figure for three reasons: the size of the Stock Exchange is
small in relation to the size of the economy, the majority shareholders do not trade their shares, themain transactions are among foreign funds, which are very active in trading.

124 REVISTA ABANTE, VOL. 1, Nº 1
which not necessarily are the same as those of shareholders. In the UK and theUSA, this conflict of interest is regulated by a set of contracts between ownersand managers. But this is not a perfect solution, because it is difficult to design,and to enforce contracts that will align the behavior of managers with the interestof shareholders. In Chile, this problem is not apparent, because owners are almostalways directly in charge of their firms, either as managers or as influentialmembers of the Boards. Probably, the structure of economic groups in Chile ispartly explained by the need to maintain close control of the entire businessportfolio.
IV. The ownership and governance structures of the new emerging groupsresulting from MBOs, in which pension funds (AFP´s) are important
shareholders: the case of Chilgener
Firms like Enersis, Chilgener and Soquimich do not seem to follow the abovedescribed patterns for the groups in the sample. These companies represent analternative approach to ownership in Chile, that resembles more closely what isobserved in the U.S. and the UK. In this work, no detailed analysis of this issueis provided. We have analyzed the ownership and governance structure ofChilgener, as a way to contrast the situation observed in the groups in the sample,with that of Chilean firms not clearly linked to a controlling group. The case ofChilgener is very particular, because it is clearly controlled by the pension funds,which have delegated the management responsibilities to a group of professionalmanagers. The other two firms included in Table IV in which pension funds havean important equity holding (Enersis and Soquimich) do have clearly controllinggroups that are not institutional investors.
Chilgener is a publicly traded corporation, mainly in the business of powerand electricity generation. Table XII indicates the main characteristics of Chilgenerin terms of the investment committed in different industries, the percentageownership, and the number of subsidiaries in each one of them.
TABLE XIIDESCRIPTION OF CHILGENER
Industry % of ownership Chilgener’s Equity No. of subsidiaries
Power & Electricity 68.7 988.1 12Shipping 30.1 59.1 5Natural Gas & Fuel 15.0 4.0 2Total 63.3 1,051.2 19
Source: Own elaboration from data in the 1995 annual report. Peruvian companies are notsignificant, therefore they are not included in the table. The original value in Chilean pesos havebeen converted at the rate of C$406.91 per US dollar.

GOVERNANCE AND OWNERSHIP STRUCTURE IN CHILEAN 125
The above Table shows that Chilgener is a holding company highlyconcentrated in the power and electricity sector, with investments in Chile andabroad (mainly Argentina). The total number of subsidiaries is 19 some of themdepending directly from Chilgener, while others are linked to companies in whichChilgener has some stake. Some notable differences in ownership and governancestructures with other groups are evident from the analysis of this company.
a) Chilgener shows only two levels in its multi-layered structure. The firsttier is missing, because there are no investment companies owning a controllingshare of the corporation. This ownership and governance layer is replaced byinstitutional investors (mainly pension funds) and foreign shareholders (throughADRs). All the largest shareholders identified in the 1995 annual report (a totalof 11) fall in the categories above and hold a combined total of 64.3% of shares.The largest of pension funds (Provida) owns an 8.46% of the company. This is aclearly different situation from the one observed in the five groups in the sample,which have a well known controlling investor. The other two tiers do not differsubstantially from the groups in the sample.
b) The diversification of Chilgener is lower than in the other groups. Asalready indicated, Chilgener is a highly focused company. The total investment inthe power and electricity sectors, in Chile and Argentina, is US$ 988.1, which,when compared with a total investment of US$ 1051.2, yields a 94.0%specialization ratio. Chilgener is a much more specialized group than the onesincluded in the sample, because it is not a collection of holding companies as isthe case of the groups studied.
c) The relationship between ownership and management in Chilgener. Ascommented before, the ownership structure of Chilgener more closely resemblesthe situation in the United States and the United Kingdom, where property ismore broadly dispersed and the owners delegate their management responsibilitiesto a professional group of managers.
It is not possible to establish, at this point, whether Chilgener is going tomaintain its current structure in the future, or whether, with time, it will evolvein the direction of the other groups, as one group takes control of the company.
V. Final Remarks
The Chilean model for structuring ownership and governance of groups ofcompanies, may not have a general validity since they could be a consequence ofthe legal framework, management practices, and specifc historical and politicalevents, among other factors. This is probably also the case with the German,Japanese, English, and American solutions, which have been referred to in thiswork. In Chile’s company ownership is highly concentrated, when compared tothe world’s most developed capital markets. Future research may compare theChilean situation to comparable countries in other areas of the world, such asGreece and Turkey in Europe, Malaysia and Thailand in Asia, and Colombia,Peru and Mexico in Latin America, for example.
126 REVISTA ABANTE, VOL. 1, Nº 1
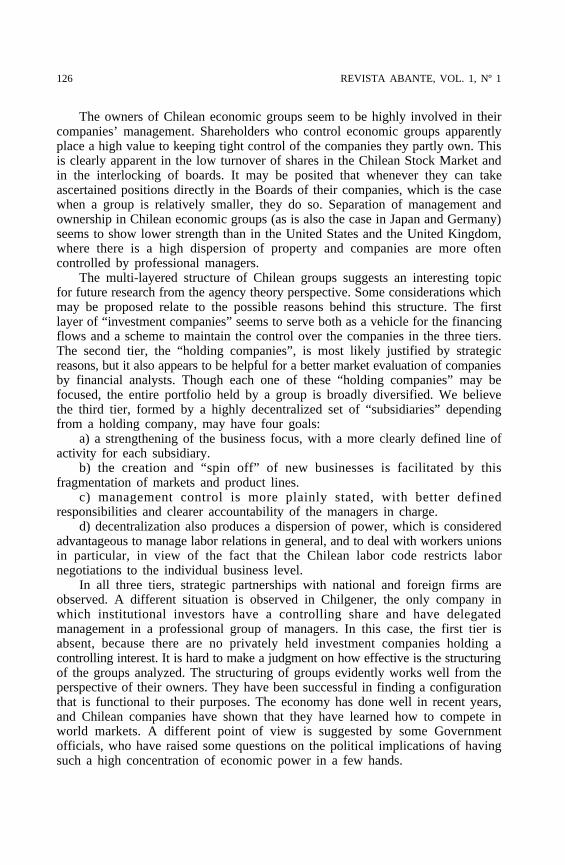
The owners of Chilean economic groups seem to be highly involved in theircompanies’ management. Shareholders who control economic groups apparentlyplace a high value to keeping tight control of the companies they partly own. Thisis clearly apparent in the low turnover of shares in the Chilean Stock Market andin the interlocking of boards. It may be posited that whenever they can takeascertained positions directly in the Boards of their companies, which is the casewhen a group is relatively smaller, they do so. Separation of management andownership in Chilean economic groups (as is also the case in Japan and Germany)seems to show lower strength than in the United States and the United Kingdom,where there is a high dispersion of property and companies are more oftencontrolled by professional managers.
The multi-layered structure of Chilean groups suggests an interesting topicfor future research from the agency theory perspective. Some considerations whichmay be proposed relate to the possible reasons behind this structure. The firstlayer of “investment companies” seems to serve both as a vehicle for the financingflows and a scheme to maintain the control over the companies in the three tiers.The second tier, the “holding companies”, is most likely justified by strategicreasons, but it also appears to be helpful for a better market evaluation of companiesby financial analysts. Though each one of these “holding companies” may befocused, the entire portfolio held by a group is broadly diversified. We believethe third tier, formed by a highly decentralized set of “subsidiaries” dependingfrom a holding company, may have four goals:
a) a strengthening of the business focus, with a more clearly defined line ofactivity for each subsidiary.
b) the creation and “spin off” of new businesses is facilitated by thisfragmentation of markets and product lines.
c) management control is more plainly stated, with better definedresponsibilities and clearer accountability of the managers in charge.
d) decentralization also produces a dispersion of power, which is consideredadvantageous to manage labor relations in general, and to deal with workers unionsin particular, in view of the fact that the Chilean labor code restricts labornegotiations to the individual business level.
In all three tiers, strategic partnerships with national and foreign firms areobserved. A different situation is observed in Chilgener, the only company inwhich institutional investors have a controlling share and have delegatedmanagement in a professional group of managers. In this case, the first tier isabsent, because there are no privately held investment companies holding acontrolling interest. It is hard to make a judgment on how effective is the structuringof the groups analyzed. The structuring of groups evidently works well from theperspective of their owners. They have been successful in finding a configurationthat is functional to their purposes. The economy has done well in recent years,and Chilean companies have shown that they have learned how to compete inworld markets. A different point of view is suggested by some Governmentofficials, who have raised some questions on the political implications of havingsuch a high concentration of economic power in a few hands.

GOVERNANCE AND OWNERSHIP STRUCTURE IN CHILEAN 127
It is not clear from the current state of affairs in terms of economic groupownership and governance in Chile what model is going to prevail in the future:either the high concentration and close control of companies observed in the groupsin the sample, or the delegation of management, as in the case of Chilgener.However, the experience of more developed capital markets suggests that levelsof concentration in ownership should decrease with time in Chile, even in familygroups and MBOs.
Finally, although there are many factors that may be affecting the structure ofownership -like the legal enviroment9, tax incentives, strategic partnerships, andothers- one can not ignore that the solution observed may be the result of historicalpatterns and cultural traits deeply ingrained in the Chilean management andentrepreneurial culture. One such example is the need for strong leadership, whichis peculiar in the “paternalistic” approach to interpersonal relationships oftenobserved in Chile10.
References
Dahse, Fernando (1979), El mapa de la extrema riqueza (Editorial Aconcagua, Santiago de Chile.Dahse, Fernando (1983), El poder de los grupos económicos nacionales, documento Flacso Nº 18,
Santiago de Chile.Fama, Eugene F. and Jensen, Michael C. (1983), Separation of ownership and control. Journal of Law
and Economics, 26, 301-325.Fama, Eugene F. (1980), Agency Problems and the theory of the firm. Journal of Political Economy,
88, 288-307.Hachette, Dominique y Lüders, Rolf (1992), La privatización en Chile (Centro Internacional para el
Desarrollo Económico CINDE), Santiago de Chile.Jensen, Michael C. and Meckling, W. H. (1979) Rights and productive functions: an application to
labor-managed firms and codetermination. Journal of Business, 52, 469-506.Lagos, Ricardo (1965), La concentración del poder económico, su teoría y la realidad chilena (Edi-
torial del Pacífico), Santiago de Chile.La Porta, Rafael, Florencio López-de-Silanes, Andrés Shleifer and Robert W. Vishny (1996), “Law
and Finance”, NBER Working Paper 5661.La Porta, Rafael, Florencio López-de-Silanes, Andrés Shleifer and Robert W. Vishny (1996), “Legal
Determinants of External Finance”, NBER Working Paper 5879.Leff, Nathaniel (1978), Industrial organization and entrepreneurship in developing countries: the
economic groups, Economic Development and Cultural Change, vol. 26 Nº 4, julio, EstadosUnidos.
Lüders, Rolf (1992), El estado empresario en Chile, las bases de su desarrollo hasta 1973, y laprivatización durante el régimen militar, en Wisecarver, Daniel: capítulo II, El modelo económi-co chileno, (Centro Internacional para el Desarrollo Económico CINDE), Santiago de Chile.
Majluf, Nicolás; Abarca, Nureya y Rodríguez, Darío (1996), Bases para la Formulación de un Mo-delo Chileno de Gestión Estratégica de Empresas, Informe Final, Proyecto Fondecyt 1940664,Conicyt, Santiago, Chile.
Sanfuentes, Andrés (1984), Los grupos económicos: control y políticas, colección Estudios CIEPLANNº 15, pp. 131-170, Santiago de Chile.
9 See, for example, La Porta et al.10 Nicolás Majluf, Nureya Abarca, and Darío Rodrguez, “Bases para la Formulación de un Mo-
delo Chileno de Gestión Estratégica de Empresas”, Informe Final, Proyecto Fondecyt 1940664, Conicyt,Santiago, Chile, March 1996.

128 REVISTA ABANTE, VOL. 1, Nº 1
9 I n v e s t m e n t C o m p a n i e s
A n t a r c h i l e I n v . S o c o r o m a
I n v . L á s c a r
F o r e s t a l C h o l g u á n I n v .
S i e m e l
P e s q u e r a E p e r v a
I n v . y D e s a r r o l l o L o s A n d e s
C o p e c P e s q u e r a I - G M a r
C a r t e r H o l t H a r v e y , N Z
I n v e s t m e n t c o m p a n i e s
H o l d i n g c o m p a n i e s
P e r c e n t a g e o f o w n e r s h i p
FIGURE 1ANGELINI GROUP
Box A. Characterization of the Main Holding Companies
%(1) Equity (2) Subsidiaries InvestorsCopec Fuel 60.1 140.1 54 1
Electricity 183.2Forestry 1,931.9Mining 45.8Fishing 156.3Services 169.7Investments 67.4
2,694.4
Cholguán Forestry, 67.3 213.9 5 6wood panels
Inv. Siemel Insurance 68.6 69.5 6 5P. Eperva Fishing 53.4 186.2 4 7
60.4 3,164.0
Box B. Size and Control of the Boards Box C. Interlocking of Boards
Nr.directors Nrr. controlled Total seats in the boards 29Copec 9 8 (89%) Total seats controlled by the group 27Cholguán 5 5 (100%) Group members sitting in the board 23Inv. Siemel 5 5 (100%) Board seats per group member 1.2P. Eperva 5 5 (100%)P. I-G Mar 5 4 (75%)Total 29 27
(1) Percentage of ownership(2) in US$ million end 1994Director = member of the boardSource: Annual Reports 1994

GOVERNANCE AND OWNERSHIP STRUCTURE IN CHILEAN 129
Box A. Characterization of the Main Holding Companies
%(1) Equity (2) Subsidiaries InvestorsCCU Beverages 66.7 354.7 16 1Lucchetti Food 77.5 53.7 12 1Madeco Manufact. 56.0 276.6 31 3B. Santiago Banking 25.0 313.3 7 1O’Higgins Banking 77.9 322.1 7 1Antofagasta Mining 72.7 267.1 6 1Holdings Railways ____ ______
60.3 1587.5
Box B. Size and Control of the Boards Box C. Interlocking of Boards
Nr.directors Nr. controlled Total seats in the boards 40CCU 9 7 (78%) Total seats controlled by the group 38Lucchetti 7 7 (100%) Group members sitting in the board 31Madeco 6 6 (100%) Board seats per group member 1.2B. Santiago 9 –O’Higgins 11 11 (100%)Antofagasta 7 7 (100%)HoldingsTotal 40 38
(1)&(2) See notes on figure 1Source: Annual Reports 1994
FIGURE 2LUKSIC GROUP
Inv. Pta.Chacaya
O’HigginsCentralHispano
AntofagastaHoldings plc.
Bco. deSantiago
Bco.O’Higgins

130 REVISTA ABANTE, VOL. 1, Nº 1
Box A. Characterization of the Main Holding Companies
%(1) Equity (2) Subsidiaries InvestorsCMPC Wood, pulp & paper 53.6 2,095.4 34 6Bicecorp Banking 47.3 177.5 8 7
53.1 2,272.9
Box B. Size and Control of the Boards Box C. Interlocking of Boards
Nr.directors Nr. controlled Total seats in the boards 16CMPC 7 7 (100%) Total seats controlled by the group 13Bicecorp 9 6 (67%) Group members sitting in the board 10Total 16 13 Board seats per group member 1.3
(1)&(2) See notes on figure 1Source: Annual Reports 1994
FIGURE 3MATTE GROUP
(3 companies) Inv. Industr.Colina, Lo Valdés, San José

GOVERNANCE AND OWNERSHIP STRUCTURE IN CHILEAN 131
Box A. Characterization of the Main Holding Companies
%(1) Equity (2) Subsidiaries InvestorsMasisa Wood panels 45.3 267.2 8 2V. Lirquen Glass 48.0 54.1 0 2Iansa Agroindustry 48.0 216.0 2 1Texviña Textiles 97.2 24.7 0 l
48.9 562.0
Box B. Size and Control of the Boards Box C. Interlocking of Boards
Nr.directors Nr. controlled Total seats in the boards 17Masisa 5 3 (60%) Total seats controlled by the group 13V. Lirquén 6 – Group members sitting in the board 7Iansa 7 5 (71%) Board seats per group member 1.9Texviña 5 5 (100%)Total 17 13
(1)&(2) See notes on figure 1Source: Annual Reports 1994
FIGURE 4PATHFINDER GROUP

132 REVISTA ABANTE, VOL. 1, Nº 1
Box A. Characterization of the Main Holding Companies
%(1) Equity (2) Subsidiaries InvestorsCTI Home appliances 44.5 98.7 7 7EMEC Electricity 75.6 21.3 3 7Itala Vehicles distribution 60.0 6.0 2 7I&C S.K. Engineering 70.0 19.2 3 7SK Com. Machinery distrib. 60.0 16.0 5 7Enaex Mining explosives 50.0 54.0 4 7
52.9 215.2
Box B. Size and Control of the Boards Box C. Interlocking of Boards
Nr.directors Nr. controlled Total seats in the boards 39CTI 7 5 (71%) Total seats controlled by the group 30Emec 5 5 (100%) Group members sitting in the board 9Itala 6 5 (83%) Board seats per group member 3.3I&C S.K. 6 6 (100%)SK Com. 6 4 (67%)Enaex 9 5 (56%)Total 39 30
(1)&(2) See notes on figure 1Source: Annual Reports 1994
FIGURE 5SIGDO KOPPERS GROUP

GOVERNANCE AND OWNERSHIP STRUCTURE IN CHILEAN 133
CO
PE
C
Cla
psa
Aba
stib
le
Pet
role
um
Cop
ecC
anal S
erco
m
Tra
nsco
m
Cía
. Tur
ism
ode
Chi
le Ade
s
AD
C
AD
G
Gas
Nat
ural
Gas
Nat
ural
Pro
ducc
ión
Inv.
Déc
ada
12
Bos
ques
Ara
uco
For
. Cel
co
CP
FB
iofo
rest
Agr
ícol
aTo
lhua
ca
For
. Val
divi
a
AB
CIn
vers
.AB
Cco
mer
cial
Cel
lulo
saA
rauc
o
Pto
. Lirq
uén
Cop
ec A
rauc
o C
R
For
esta
lA
rauc
o
Ara
uco
Gen
erac
.
Ase
rr.
Ara
uco
Por
tuar
iaA
rauc
o
For
. Chi
le
Pes
q.I-
G M
ar
Pes
q.M
araz
ul Cor
pesc
a
Sol
y M
ar
Aer
opes
ca
Pat
ag.
Prid
e
Sip
alsy
c
SA
P
Cía
. de
conc
esio
nes
Min
era
T. F
uego
Min
era
Can
-Can
Cía
. Sal
es
Hid
roel
ec.
Gua
cold
a
Cía
. Car
bón
Mag
alla
nes
ST
S
Fro
ntel
Sae
saC
ocar
Son
acol
Cop
ecM
obil
Sia
v
Cop
ecIn
tern
atio
nal
Hid
roel
éctr
ica
Mel
ocot
ón
Edi
ficio
D. C
resc
ente
Soc
inve
r
1
2
6697
,8
5050 10
0
1236
,112
36,1
99,9
99
2
98
99,9
8440
6016
15,7
9,8
7,6
1325
2525
25
9999
99
97,9
96,6
3,4
595
55 99
43,1
52,2
3
99,9
20,1
99
99,9
99
45
50,2
15,7
98,8
40
99,9 20
70
99,9
99
55 60 50 52
15,5
19,7
99,8
83 60
13,7
93,1
45
48 50
33,3
100
25 50 24
Less
than
1%
FIG
UR
E 6
CO
PE
C’S
AR
RA
Y O
F S
UB
SID
IAR
IES

134 REVISTA ABANTE, VOL. 1, Nº 1
Inve
rsio
nes
CM
PC
Env
ases
Impr
esos
CM
PC
Cap
. Rie
sgo
ED
IPA
C
GR
AF
EX
PR
OP
A
Inm
obili
aria
Gra
njas
AU
ST
RA
L
CM
PC
Inte
rnac
.
SO
RE
PA
Mue
llaje
Sn.
Vic
ente
PR
OT
ISA
PR
OS
AN
Cel
ulos
a de
lP
acífi
co
For
esta
lR
enai
co
For
esta
lM
inin
co
PIN
AR
ES
Ase
rrad
eros
Min
inco
S.A
.
SE
FO
RE
Com
erc.
de
Cel
ulos
a
Con
trol
ador
aP
laga
s F
or.
INF
OR
SA
CR
EC
EX
For
esta
lR
ío V
erga
ra
Mon
teve
rde
PA
PE
LEX
SU
MM
A
Seg
uros
El R
oble
Seg
uros
El R
aulí
CH
IMO
LSA
CA
RE
NA
Mel
ocot
ón
For
esta
lA
ngol
BIC
EC
OR
P
Less
than
1%
CM
PC
99,9
9
99,9
99,9
99,9
99,9
99,9
99,9
99,9
99,9
0,1
0,1
0,1
0,1
0,1
0,1
0,1
99,9
0,1
0,1
0,1
0,01
2
0,00
1
99,9
0,3
99,9
0,1
50
99,9
981
,95
99
99,7
1 2,5
97,5
50
0,01
99,9
9
46,5
2
18,4
6
97,1
3
4,86
2,87
0,00
1
99,9
99
60
5,8
40
50
25,9
24,3
5
24,3
5
40,8
6
50 25 50 8,6
FIG
UR
E 7
CM
PC
’s A
RR
AY
OF
SU
BS
IDIA
RIE
S

GOVERNANCE AND OWNERSHIP STRUCTURE IN CHILEAN 135
Subsidiaries
Corporations
Investment company
Zaibatsu family
KeiretsuZaibatsu
FIGURE 8STRUCTURE OF THE JAPANESE GROUPS

136 REVISTA ABANTE, VOL. 1, Nº 1
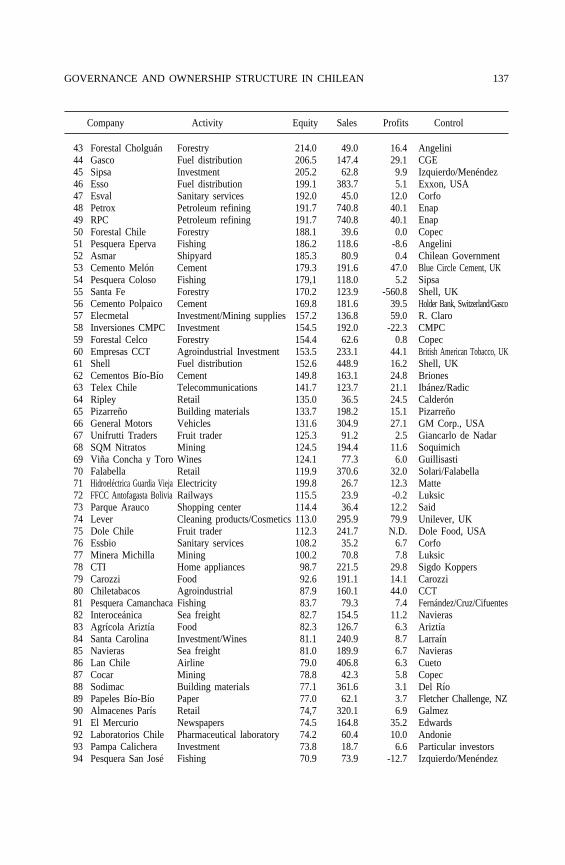
APPENDIXTHE 150 LARGEST CHILEAN COMPANIES IN 1994
(Figures in US$ million as of end 1994)
Company Activity Equity Sales Profits Control
1 Copec Forestry / Energy 2,694.4 2393.0 315.8 Angelini/CHH2 Endesa Electricity 2,562.0 735.5 374.9 Enersis3 Codelco Mining 2,443.6 2993.4 391.9 Chilean Government4 CMPC Forestry 2,095.4 964.7 90.0 Matte5 Celulosa Arauco Forestry 1,774.1 521.7 174.5 Copec6 CTC Telecommunications 1,476.2 1023.3 249.4 Telefónica de España7 Forestal Arauco Forestry 1,198.9 303.7 46.6 Copec9 Minera Escondida Mining 1,132.0 1458.0 419.0 BHP, Australia9 Enersis Investment/Electricity 954.5 852.4 170.9 Institutional investors
Management10 Chilgener Electricity 931.1 263.9 74.7 Institutional Investors11 Colbún Machicura Electricity 859.8 123.6 54.5 Corfo12 Minera Valparaíso Investment/Energy 734.7 65.1 63.8 Matte13 Enap Petroleum 732.1 1657.7 101.2 Chilean Government14 Bosques Arauco Forestry 589.2 163.7 33.6 Copec15 Inforsa Forestry 489.8 88.6 1.7 CMPC16 Metro Transport 467.8 55.4 27.6 Corfo17 Soquimich Holding/Mining 466.2 313.9 23.3 Particular &
Institutional investors18 Chilectra Electricity 440.3 543.9 75.9 Enersis19 CAP Steel/Forestry 438.2 486.3 15.2 Management20 Emos Sanitary services 403.4 141.3 53.2 Corfo21 Celulosa del Pacífico Pulp 402.3 181.3 -416.1 CMPC22 Forestal Mininco Forestry 379.8 207.7 5.0 CMPC23 Emporchi Seaport administration 367.5 80.1 13.8 Chilean Government24 CCU Beverages 354.7 323.1 77.5 Luksic
Paulaner, Germany25 CGE Electricity 341.2 357.0 53.8 Claro Vial/Del
Real Correa26 Pehuenche Electricity 336.5 129.9 87.1 Endesa27 Vapores Sea freight 327.6 657.8 30.7 R. Claro28 Edelnor Electricity 326.3 96.8 22.0Southern Electric, USA29 Andina Beverages 316.7 386.8 54.0 Said30 Entel Telecommunications 285.9 245.3 46.8 Chilquinta31 Madeco Metal manufacturing 276.6 389.6 33.0 Luksic32 Enami Mining 268.1 841.4 17.4 Chilean Government33 Masisa Wood panels 267.2 110.2 18.9 Pathfinder34 Universidad Católica Education 263.3 45.5 2.0 Catholic Church35 Super Pollo Food 239.8 217.6 32.4 Vial36 Cristales Chile Glass/Investment 233.7 66.2 26.7 R. Claro37 Mantos Blancos Mining 233.5 129.0 5.4 Anglo American
Corp. South Africa38 Chilquinta Electricity 233.0 119.1 18.0 Fernández León/Sipsa39 Nestlé Food 229.4 356.9 27.1 Nestlé, Switzerland40 Pesq. Iquique-
Guanaye (IGMAR) Fishing 217.3 122.4 -9.2 Angelini41 Iansa Agroindustrial 216.0 439.4 47.3 Pathfinder42 Minera del Pacífico Mining 215.6 194.7 1.1 CAP
GOVERNANCE AND OWNERSHIP STRUCTURE IN CHILEAN 137
43 Forestal Cholguán Forestry 214.0 49.0 16.4 Angelini44 Gasco Fuel distribution 206.5 147.4 29.1 CGE45 Sipsa Investment 205.2 62.8 9.9 Izquierdo/Menéndez46 Esso Fuel distribution 199.1 383.7 5.1 Exxon, USA47 Esval Sanitary services 192.0 45.0 12.0 Corfo48 Petrox Petroleum refining 191.7 740.8 40.1 Enap49 RPC Petroleum refining 191.7 740.8 40.1 Enap50 Forestal Chile Forestry 188.1 39.6 0.0 Copec51 Pesquera Eperva Fishing 186.2 118.6 -8.6 Angelini52 Asmar Shipyard 185.3 80.9 0.4 Chilean Government53 Cemento Melón Cement 179.3 191.6 47.0Blue Circle Cement, UK54 Pesquera Coloso Fishing 179,1 118.0 5.2 Sipsa55 Santa Fe Forestry 170.2 123.9 -560.8 Shell, UK56 Cemento Polpaico Cement 169.8 181.6 39.5Holder Bank, Switzerland/Gasco57 Elecmetal Investment/Mining supplies 157.2 136.8 59.0 R. Claro58 Inversiones CMPC Investment 154.5 192.0 -22.3 CMPC59 Forestal Celco Forestry 154.4 62.6 0.8 Copec60 Empresas CCT Agroindustrial Investment 153.5 233.1 44.1British American Tobacco, UK61 Shell Fuel distribution 152.6 448.9 16.2 Shell, UK62 Cementos Bío-Bío Cement 149.8 163.1 24.8 Briones63 Telex Chile Telecommunications 141.7 123.7 21.1 Ibánez/Radic64 Ripley Retail 135.0 36.5 24.5 Calderón65 Pizarreño Building materials 133.7 198.2 15.1 Pizarreño66 General Motors Vehicles 131.6 304.9 27.1 GM Corp., USA67 Unifrutti Traders Fruit trader 125.3 91.2 2.5 Giancarlo de Nadar68 SQM Nitratos Mining 124.5 194.4 11.6 Soquimich69 Viña Concha y Toro Wines 124.1 77.3 6.0 Guillisasti70 Falabella Retail 119.9 370.6 32.0 Solari/Falabella71 Hidroeléctrica Guardia ViejaElectricity 199.8 26.7 12.3 Matte72 FFCC Antofagasta BoliviaRailways 115.5 23.9 -0.2 Luksic73 Parque Arauco Shopping center 114.4 36.4 12.2 Said74 Lever Cleaning products/Cosmetics 113.0 295.9 79.9 Unilever, UK75 Dole Chile Fruit trader 112.3 241.7 N.D. Dole Food, USA76 Essbio Sanitary services 108.2 35.2 6.7 Corfo77 Minera Michilla Mining 100.2 70.8 7.8 Luksic78 CTI Home appliances 98.7 221.5 29.8 Sigdo Koppers79 Carozzi Food 92.6 191.1 14.1 Carozzi80 Chiletabacos Agroindustrial 87.9 160.1 44.0 CCT81 Pesquera CamanchacaFishing 83.7 79.3 7.4 Fernández/Cruz/Cifuentes82 Interoceánica Sea freight 82.7 154.5 11.2 Navieras83 Agrícola Ariztía Food 82.3 126.7 6.3 Ariztía
84 Santa Carolina Investment/Wines 81.1 240.9 8.7 Larraín 85 Navieras Sea freight 81.0 189.9 6.7 Navieras 86 Lan Chile Airline 79.0 406.8 6.3 Cueto 87 Cocar Mining 78.8 42.3 5.8 Copec 88 Sodimac Building materials 77.1 361.6 3.1 Del Río 89 Papeles Bío-Bío Paper 77.0 62.1 3.7Fletcher Challenge, NZ 90 Almacenes París Retail 74,7 320.1 6.9 Galmez 91 El Mercurio Newspapers 74.5 164.8 35.2 Edwards 92 Laboratorios Chile Pharmaceutical laboratory 74.2 60.4 10.0 Andonie 93 Pampa Calichera Investment 73.8 18.7 6.6 Particular investors 94 Pesquera San José Fishing 70.9 73.9 -12.7 Izquierdo/Menéndez
Company Activity Equity Sales Profits Control

138 REVISTA ABANTE, VOL. 1, Nº 1
95 Minera Los PelambresMining 70.7 40.3 7.4 Luksic 96 Ecusa Bottler 70.2 74.8 -32.8 CCU 97 Forestal Millalemu Forestry 69.5 38.5 -12.1 CAP 98 Textil Pollak Textiles 66.9 84.8 0.0 Manfred Brauchle 99 Home Center Retail/Building materials 66.7 352.2 5.3 Sodimac100 CNT Telefónica del SurTelecommunications 66.6 64.6 14.0 VTR101 Maderas Cholguán Wood panels 65.4 32.5 6.7 Angelini102 Inmob. Manso de VelascoReal estate 64.7 34.3 8.2 Enersis103 Santa Isabel Supermarkets 63.5 316.0 8.8 Elberg104 Molymet Molybdenum 63.2 95.7 15.4 Aboughazaleh105 Calderón ConfeccionesClothes 62.9 139.2 11.3 Calderón106 Jumbo Supermarkets 61.9 67.9 5.9 Paulmann107 Sintex Chemicals 61.7 86.9 8.2108 Oxiquim Chemicals 60.7 80.1 10.4 Sintex109 Malloa Agroindustrial 60.0 70.1 0.5 CCT110 Sonda Computers/Services 59.8 59.3 11.6 Navarro/Digital111 Fósforos Investment/Matches 59.7 45.0 8.4 Cardoen112 Cruz Blanca Investment/Health insurance 59.3 12.9 22.2 Cruzat113 Alimar Fishing 58.4 41.1 4.2 Izquierdo/Menéndez114 Seguravita Investment 57.8 144.4 14.7115 Soprole Food 56.2 214.5 12.0116 CTC Transmisiones RegTelecommunications 56.2 22.5 -15.6 CTC117 Leasing Andino Leasing 54.9 72.9 10.7 Banco de Chile118 Vidrios Lirquén Glass 54.1 40.3 4.3 Pathfinder119 Enaex Explosives 54.0 79.4 12.2 Sigdo Koppers120 Santa Rita Wine 53.8 50.7 2.4 R. Claro121 Comercial KaufmannVehicle distribution 53.7 126.4 4.3 Kauffmann122 Lucchetti Investment/Food 53.7 168.3 5.4 Luksic123 Forestal Bío-Bío Forestry 53.0 19.1 1.4Fletcher Challenge, NZ124 Ind.Nacional del CementoCement 52.9 50.8 9.6 Cementos Bío-Bío125 Lord Cochrane Magazines 52.8 87.3 1.2RR Donneley & Sons, USA126 Gildemeister Vehicle distribution 52.6 106.4 -98.6 Finning Ltd.127 UTC (United Trading) Fruit trader 52.5 84.2 -7.7 Quintal Uruguay128 Clínica Alemana Health care 52.3 42.2 0.0129 Puerto de Lirquén Seaport 51.0 25.5 10.2 Matte130 Inmobiliaria Unimarc Real estate 50.8 296.6 5.0 Errázuriz131 Sopraval Food 49.6 45.3 3.7 Allende132 Trupán Forestry 49.5 20.0 -12.6 Angelini133 ABC Retail 49.4 148.9 3.6 Copec134 Pesquera Itata Fishing 48.9 28.3 4.2 Sarquis135 Banmédica Investment/Health insurance 48.8 169.1 2.8 Fernández León136 Manufacturas Sumar Textiles 47.9 59.3 -2.3 Fdo. Sumar137 Aserraderos Mininco Forestry 46.2 61.0 -5.5 CMPC138 Pacífico V Investment 45.8 28.6 4.5139 Coresa Metal cans 45.3 89.7 7.4 Abumohor/Vial140 Cerámicas Cordillera Building materials 45.3 25.0 1.8 Pizarreño141 Pucobre Mining 44.9 28.6 11.2 Pacífico V142 Agua Lo Castillo Sanitary services 44.7 21.0 5.9 Goycoolea143 Chilesat Telecommunications 43.1 72.8 17.2 Telex-Chile144 Good Year Tires 42.7 127.8 6.6 GM Corp., USA145 Pisco Capel Beverages 42.6 71.9146 Forestal Copihue Forestry 42.3 50.5 3.6 Citigor Holdings147 Emel Electricity 42.2 81.9 10.6 Ilharreborde
Company Activity Equity Sales Profits Control

GOVERNANCE AND OWNERSHIP STRUCTURE IN CHILEAN 139
148 Occidental Chemicals 42.0 40.4 4.8Occidental Petroleum, USA149 Saesa Electricity 41.8 34.4 8.1 Copec150 Oro Blanco Investment 41.7 18.7 3.5 Norte Grande SA
• Corfo Holding 1,782.9 4.5 129.0 Chilean Government(1993 data in currency at the end of that year)
Source: Own elaboration from The Chile Top 500, Published by the South Pacific Mail SRL.
Company Activity Equity Sales Profits Control


