Embed Size (px)
Citation preview
VISUALIZATION IN COMPUTING
Graphical Configuration Programming
The structural description, construction and evolution of software systems using graphics
Jeff Kramer, Jeff Magee, and Keng Ng
Imperial College of Science and Technology
oftware systems can be succinctly described, constructed, and man- aged in terms of their software con-
f ig~rat ion.’-~ This configuration consists of the set of software components that implement system functionality, plus their control and communication interconnec- tions. Program modules are defined and constructed to provide well-defined inter- faces, giving the information and calls provided to or required from other mod- ules. The program is then configured by creating and interconnecting instances of these software modules.
The specification of the system configu- ration provides a conveniently abstract form in which to define and comprehend programs, and it can also be used to gener- ate the executable program. Evolutionary changes to the program are reflected as changes to the program structure, either by the addition of further modules or by the use of modified versions of selected mod- ules. “Configuration programming,” the term we use to describe programming at the configuration level, thus provides a clear and flexible means for program defi- nition, construction, modification, and comprehension. Configuration program-
This workstation integrates the textual
and graphical information required for
configuration programming. Its
editing, monitoring, layout, and control
facilities are applied dynamically to
operational systems.
ming is closely related to the ideas of programming-in-the-large and the use of a module interconnection language outlined by DeRemer and Kron.’ Configuration
refers here to system structure, not to ver- sion control.
Configuration programming is particu- larly appropriate for distributed process- ing, where the software components may reside on different machines. The configu- ration specification can both describe the structure of the required system and spec- ify the allocation of components to ma- chines. The operational system is then managed by monitoring the status of sys- tem components and extending or chang- ing the system configuration. Such changes may involve modifying existing functions or introducing new functions to incorporate new technology, improve implementation techniques, or provide system redundancy. It is certainly advanta- geous for configuration management to dynamically support change to the system without interrupting processing elsewhere on the system.
The Conic en~ironment ,~ developed by the Distributed Systems Group at Imperial College, supports configuration program- ming for distributed and concurrent pro- grams. The environment supports two languages, one for programming individ- ual task modules (processes) with well-
October 1989 0018-9162/89/1000-0053$01.00 0 1989 IEEE 53
alarm
patient i bed
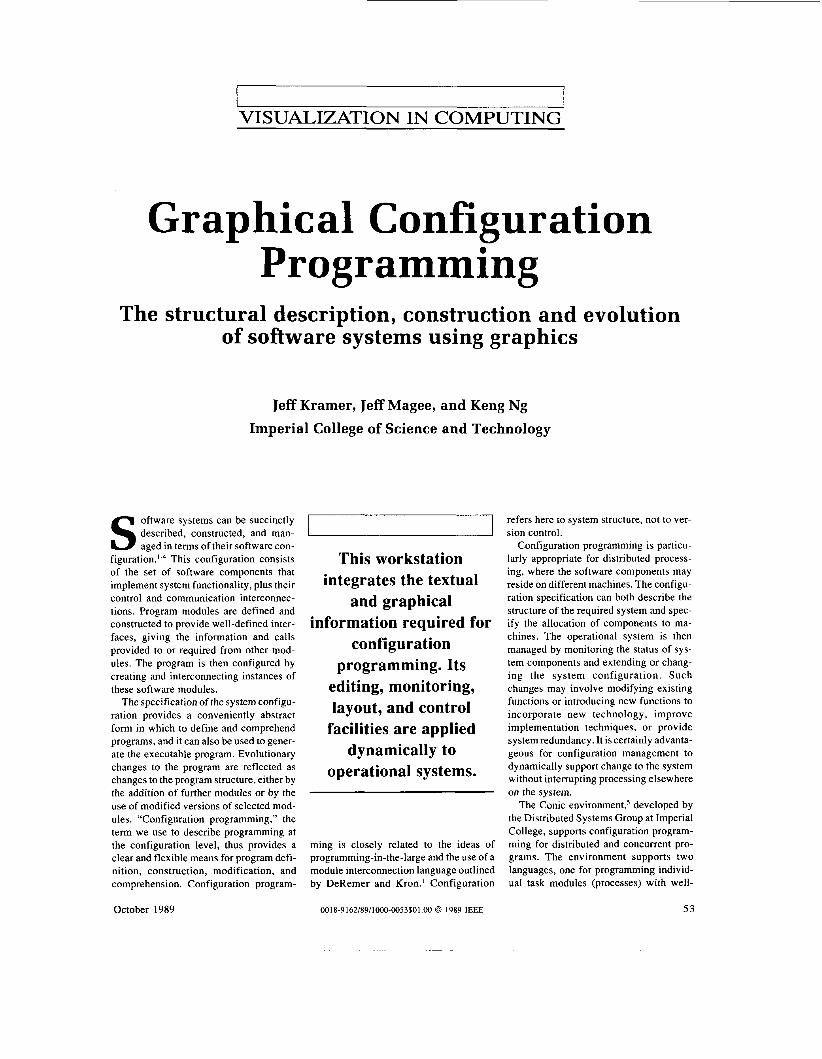
group module patient; use monmsg: bedtype, alarmstype; exitport a1arm:alarmstype; entryport bedxignaltype reply bedtype; 1 - The module periodically reads sensors attached to a patient. Readings outside preset ranges cause alarm messages to be sent to the exitport alarm. A request message received on the entryport bed returns the current readings and ranges. 1
end
Figure 1. The patient module.
alarm1 bed 1 &I;:; 1 nurse ~ bed2
bed3
alarm4 bed4
alarm5 bed5
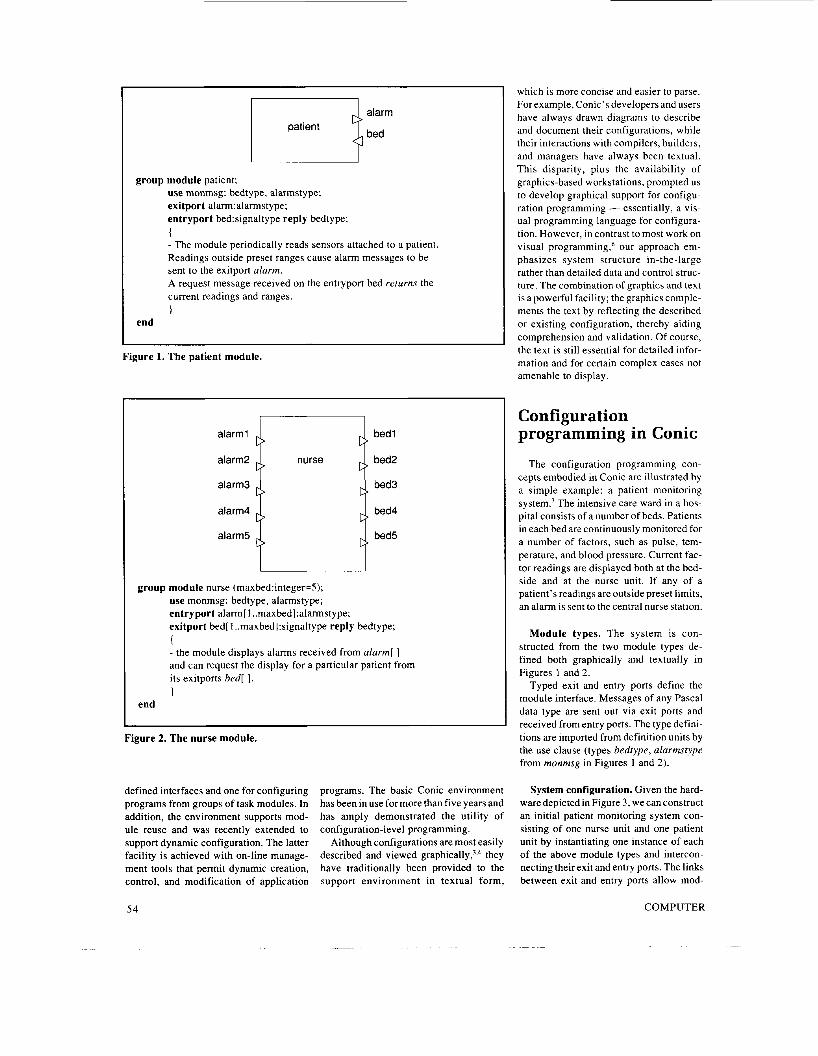
group module nurse (maxbed:integer=5); use monmsg: bedtype, alarmstype; entry port alarm[ 1 ..maxbed]:alarmstype; exitport bed[ 1 ..maxbed]:signaltype reply bedtype; ( - the module displays alarms received from alarm[ ] and can request the display for a particular patient from its exitports bed[ 1. 1
end
Figure 2. The nurse module.
defined interfaces and one for configuring programs from groups of task modules. In addition, the environment supports mod- ule reuse and was recently extended to support dynamic configuration. The latter facility is achieved with on-line manage- ment tools that permit dynamic creation, control, and modification of application
programs. The basic Conic environment has been in use for more than five years and has amply demonstrated the utility of configuration-level programming.
Although configurations are most easily described and viewed g raph i~a l ly ,~ .~ they have traditionally been provided to the support environment in textual form,
which is more concise and easier to parse. For example, Conic’s developers and users have always drawn diagrams to describe and document their configurations, while their interactions with compilers, builders, and managers have always been textual. This disparity, plus the availability of graphics-based workstations, prompted us to develop graphical support for configu- ration programming - essentially, a vis- ual programming language for configura- tion. However, in contrast to most work on visual programming,6 our approach em- phasizes system structure in-the-large rather than detailed data and control struc- ture. The combination of graphics and text is a powerful facility; the graphics comple- ments the text by reflecting the described or existing configuration, thereby aiding comprehension and validation. Of course, the text is still essential for detailed infor- mation and for certain complex cases not amenable to display.
Configuration programming in Conic
The configuration programming con- cepts embodied in Conic are illustrated by a simple example: a patient monitoring system.’ The intensive care ward in a hos- pital consists of a number of beds. Patients in each bed are continuously monitored for a number of factors, such as pulse, tem- perature, and blood pressure. Current fac- tor readings are displayed both at the bed- side and at the nurse unit. If any of a patient’s readings are outside preset limits, an alarm is sent to the central nurse station.
Module types. The system is con- structed from the two module types de- fined both graphically and textually in Figures 1 and 2 .
Typed exit and entry ports define the module interface. Messages of any Pascal data type are sent out via exit ports and received from entry ports. The type defini- tions are imported from definition units by the use clause (types bedtype, alarmstype from monmsg in Figures 1 and 2).
System configuration. Given the hard- ware depicted in Figure 3, we can construct an initial patient monitoring system con- sisting of one nurse unit and one patient unit by instantiating one instance of each of the above module types and intercon- necting their exit and entry ports. The links between exit and entry ports allow mod-
54 COMPUTER
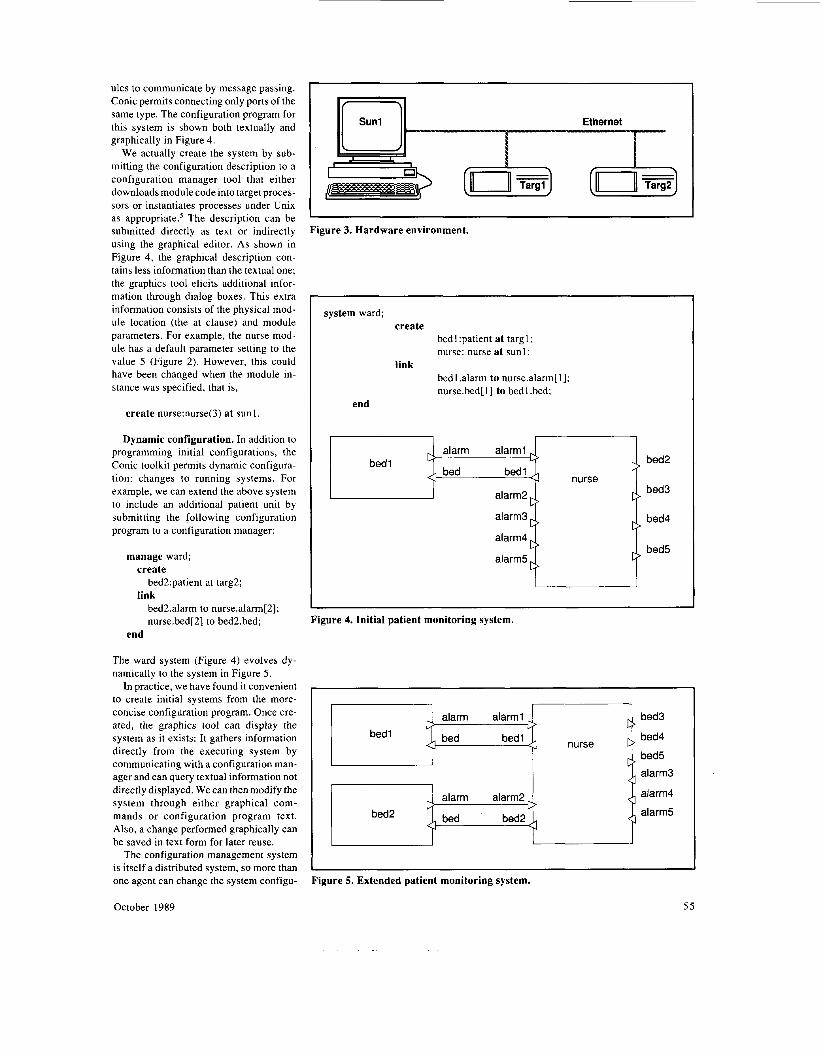
ules to communicate by message passing. Conic permits connecting only ports of the same type. The configuration program for this system is shown both textually and graphically in Figure 4.
We actually create the system by sub- mitting the configuration description to a configuration manager. tool that either downloads module code into target proces- sors or instantiates processes under Unix as a p p r ~ p r i a t e . ~ The description can be submitted directly as text or indirectly using the graphical editor. As shown in Figure 4, the graphical description con- tains less information than the textual one; the graphics tool elicits additional infor- mation through dialog boxes. This extra information consists of the physical mod- ule location (the at clause) and module parameters. For example, the nurse mod- ule has a default parameter setting to the value 5 (Figure 2). However, this could have been changed when the module in- stance was specified, that is,
create nurse:nurse(3) at sunl.
Dynamic configuration. In addition to programming initial configurations, the Conic toolkit permits dynamic configura- tion: changes to running systems. For example, we can extend the above system to include an additional patient unit by submitting the following configuration program to a configuration manager:
manage ward; create
link bed2:patient at targ2;
bed2.alarm to nurse .alarm [ 21 ; nurse.bed[2] to bed2.bed;
end
The ward system (Figure 4) evolves dy- namically to the system in Figure 5.
In practice, we have found it convenient to create initial systems from the more- concise configuration program. Once cre- ated, the graphics tool can display the system as it exists: It gathers information directly from the executing system by communicating with a configuration man- ager and can query textual information not directly displayed. We can then modify the system through either graphical com- mands or configuration program text. Also, a change performed graphically can be saved in text form for later reuse.
The configuration management system is itself a distributed system, so more than one agent can change the system configu-
(*) (-*) Figure 3. Hardware environment.
system ward; create
bed1:patient at targl; nurse: nurse at sun 1 ;
bed1 .alarm to nurse.alarm[ 11; nurse.bed[l] to bedl.bed;
link
end
I bedl t-f 4 bed2
bed3 nurse
alarm2
alarm3
alarm4
alarm5
bed4
bed5
I I
Figure 4. Initial patient monitoring system.
I I I 1
;darn a l a r u l i i bed3
bed 1 bed4 nurse U 4 bed5 I
I 4 alarm3
alarm alarm2
bed2
alarm4
alarm5
I I
Figure 5. Extended patient monitoring system.
October 1989 5 5
alarm
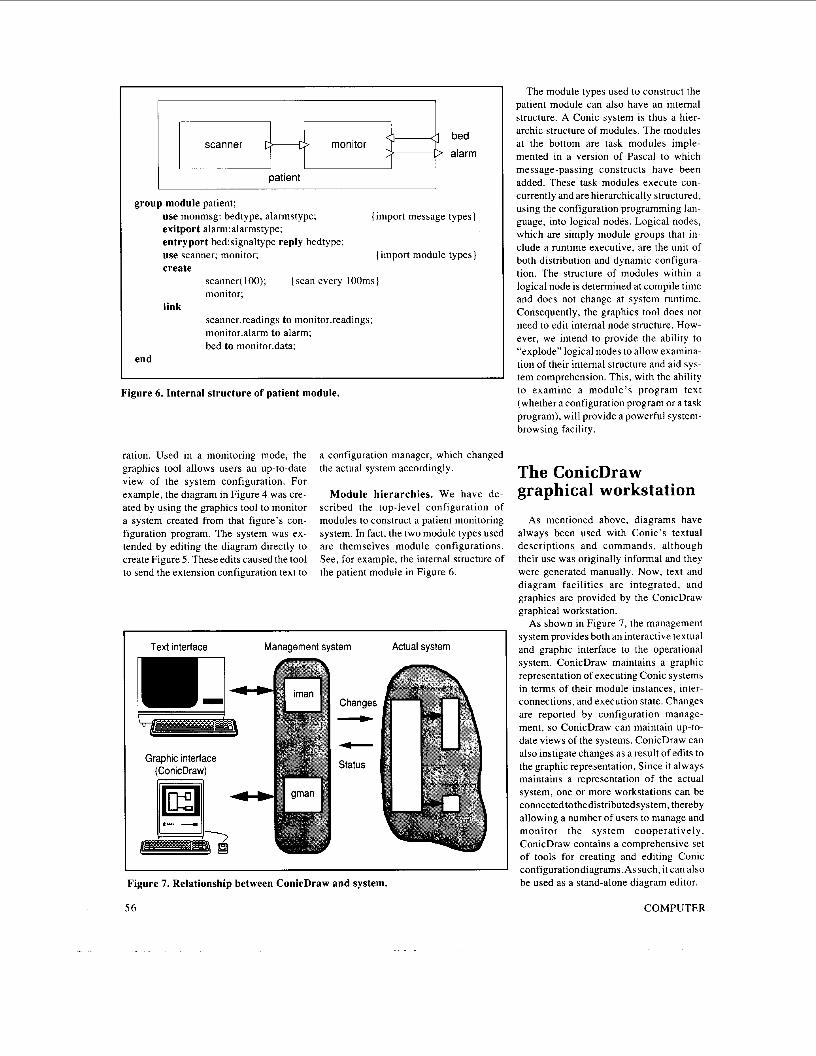
I patient I group module patient;
use monmsg: bedtype, alarmstype; exitport a1arm:alarmstype; entry port bed:signaltype reply bedtype; use scanner; monitor; create
{import message types
{import module types
scanner(100); [scan every 100ms] monitor;
scanner.readings to monitor.readings; monitor.alarm to alarm; bed to monitor.data;
link
end
Figure 6. Internal structure of patient module.
ration. Used in a monitoring mode, the graphics tool allows users an up-to-date view of the system configuration. For example, the diagram in Figure 4 was cre- ated by using the graphics tool to monitor a system created from that figure’s con- figuration program. The system was ex- tended by editing the diagram directly to create Figure 5 . These edits caused the tool
a configuration manager, which changed the actual system accordingly.
Module hierarchies. We have de- scribed the top-level configuration of modules to construct a patient monitoring system. In fact, the two module types used are themselves module configurations. See, for example, the internal structure of
to send the extension configuration text to the patient module in Figure 6.
Text interface Management system Actual system
Changes - - Status
Figure 7. Relationship between ConicDraw and system.
56
The module types used to construct the patient module can also have an internal structure. A Conic system is thus a hier- archic structure of modules. The modules at the bottom are task modules imple- mented in a version of Pascal to which message-passing constructs have been added. These task modules execute con- currently and are hierarchically structured, using the configuration programming lan- guage, into logical nodes. Logical nodes, which are simply module groups that in- clude a runtime executive, are the unit of both distribution and dynamic configura- tion. The structure of modules within a logical node is determined at compile time and does not change at system runtime. Consequently, the graphics tool does not need to edit internal node structure. How- ever, we intend to provide the ability to “explode” logical nodes to allow examina- tion of their internal structure and aid sys- tem comprehension. This, with the ability to examine a module’s program text (whether a configuration program or a task program), will provide a powerful system- browsing facility.
The ConicDraw graphical workstation
As mentioned above, diagrams have always been used with Conic’s textual descriptions and commands, although their use was originally informal and they were generated manually. Now, text and diagram facilities are integrated, and graphics are provided by the ConicDraw graphical workstation.
As shown in Figure 7, the management system provides both an interactive textual and graphic interface to the operational system. ConicDraw maintains a graphic representation of executing Conic systems in terms of their module instances, inter- connections, and execution state. Changes are reported by configuration manage- ment, so ConicDraw can maintain up-to- date views of the systems. ConicDraw can also instigate changes as a result of edits to the graphic representation. Since it always maintains a representation of the actual system, one or more workstations can be connectedtothedistributedsystem, thereby allowing a number of users to manage and monitor the system cooperatively. ConicDraw contains a comprehensive set of tools for creating and editing Conic configurationdiagrams. As such, it can also be used as a stand-alone diagram editor.
COMPUTER
We chose an Apple Macintosh as the implementation hardware because of its comprehensive support for graphic-inter- face programming and because we had experience with it from a previous project. The Macintosh communicates via a serial RS-232 communication link with the dis- tributed system (running on Sun, VAX, and VME 68000 machines connected by Ethernet). This serial link limits response times and may be replaced by a direct Macintosh-to-Ethernet connection.
In the following sections, we describe ConicDraw’s main facilities and discuss issues raised by its implementation.
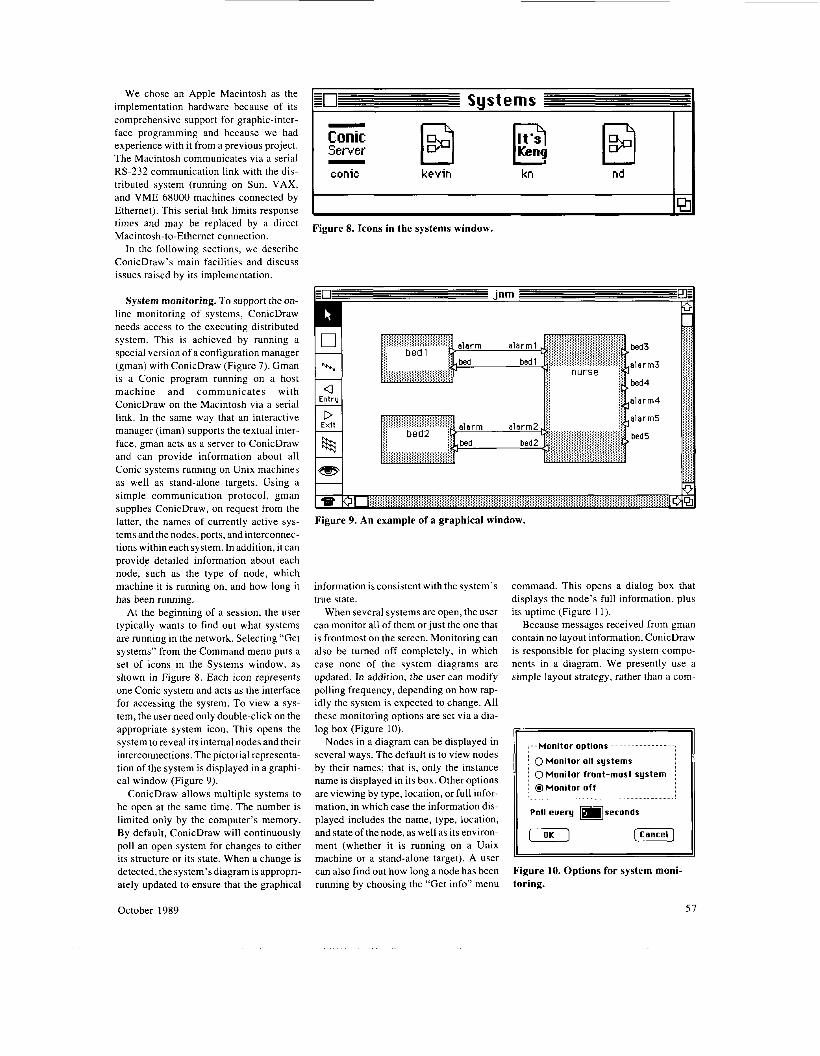
System monitoring. To support the on- line monitoring of systems, ConicDraw needs access to the executing distributed system. This is achieved by running a special version of a configuration manager (gman) with ConicDraw (Figure 7). Gman is a Conic program running on a host machine and communicates with ConicDraw on the Macintosh via a serial link. In the same way that an interactive manager (iman) supports the textual inter- face, gman acts as a server to ConicDraw and can provide information about all Conic systems running on Unix machines as well as stand-alone targets. Using a simple communication protocol, gman supplies ConicDraw, on request from the latter, the names of currently active sys- tems and the nodes, ports, and interconnec- tions within each system. In addition, it can provide detailed information about each node, such as the type of node, which machine it is running on, and how long it has been running.
At the beginning of a session, the user typically wants to find out what systems are running in the network. Selecting “Get systems” from the Command menu puts a set of icons in the Systems window, as shown in Figure 8. Each icon represents one Conic system and acts as the interface for accessing the system. To view a sys- tem, the user need only double-click on the appropriate system icon. This opens the system to reveal its internal nodes and their interconnections. The pictorial representa- tion of the system is displayed in a graphi- cal window (Figure 9).
ConicDraw allows multiple systems to be open at the same time. The number is limited only by the computer’s memory. By default, ConicDraw will continuously poll an open system for changes to either its structure or its state. When a change is detected, the system’s diagram is appropri- ately updated to ensure that the graphical
Conic Sewer -
k w i n I =mi=
pj kn
B nd
Figure 8. Icons in the systems window.
bed3
alarm3
bed4
alarm4
alarm5
bed5
Figure 9. An example of a graphical window.
information is consistent with the system’s true state.
When several systems are open, the user can monitor all of them or just the one that is frontmost on the screen. Monitoring can also be turned off completely, in which case none of the system diagrams are updated. In addition, the user can modify polling frequency, depending on how rap- idly the system is expected to change. All these monitoring options are set via a dia- log box (Figure 10).
Nodes in a diagram can be displayed in several ways. The default is to view nodes by their names; that is, only the instance name is displayed in its box. Other options are viewing by type, location, or full infor- mation, in which case the information dis- played includes the name, type, location, and state of the node, as well as its environ- ment (whether it is running on a Unix machine or a stand-alone target). A user can also find out how long a node has been running by choosing the “Get info” menu
command. This opens a dialog box that displays the node’s full information, plus its uptime (Figure 11).
Because messages received from gman contain no layout information, ConicDraw is responsible for placing system compo- nents in a diagram. We presently use a simple layout strategy, rather than a com-
.......Monitor options ....................................
! 0 Moni tor all systems
i 0 Moni tor front-most system
I @I Moni tor o f f : ..................................................................................... i
Poll every m s e c o n d s
[Cancel)
Figure 10. Options for system moni- toring.
October 1989 57
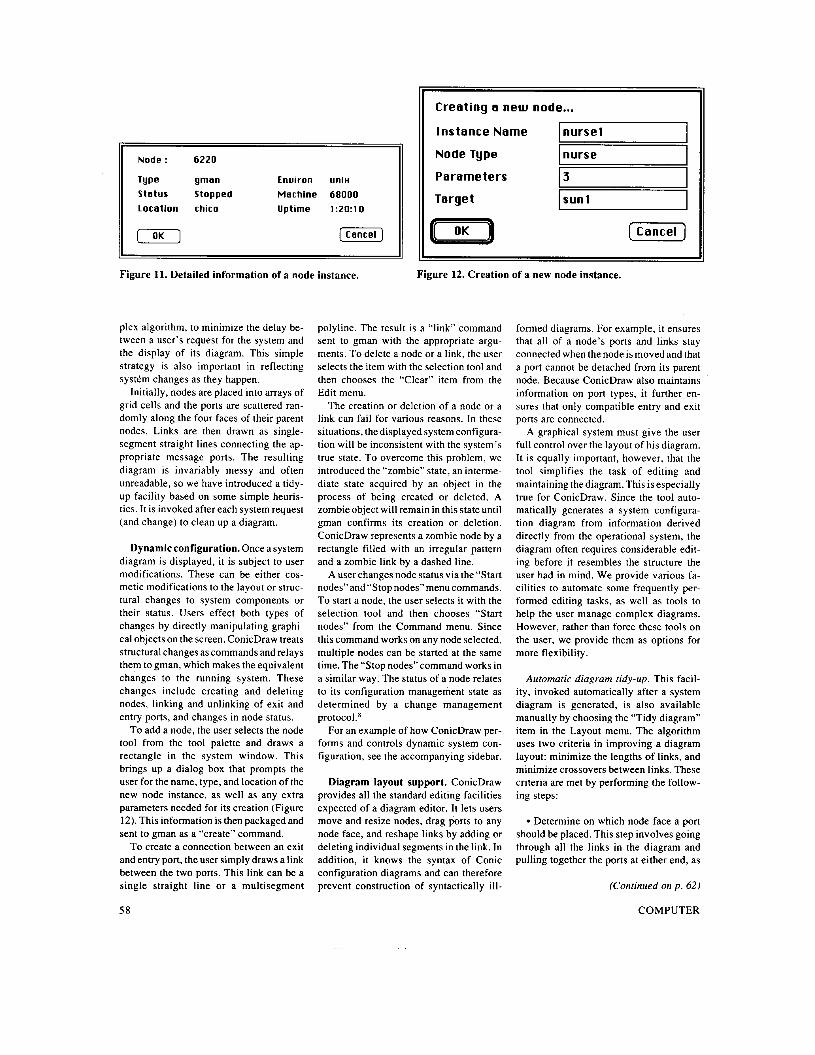
Enuiron uniH Status Stopped Machine 68000 Location chico Uptime 1 :20:10
Instance Name
Node Type
Parameters
Tarqet
II
nurse1
nurse
3
sun1
(Cancel)
Creating a new node...
[OK) [Cancel]
Figure 11. Detailed information of a node instance. Figure 12. Creation of a new node instance.
plex algorithm, to minimize the delay be- tween a user’s request for the system and the display of its diagram. This simple strategy is also important in reflecting systCm changes as they happen.
Initially, nodes are placed into arrays of grid cells and the ports are scattered ran- domly along the four faces of their parent nodes. Links are then drawn as single- segment straight lines connecting the ap- propriate message ports. The resulting diagram is invariably messy and often unreadable, so we have introduced a tidy- up facility based on some simple heuris- tics. It is invoked after each system request (and change) to clean up a diagram.
Dynamic configuration. Once a system diagram is displayed, i t is subject to user modifications. These can be either cos- metic modifications to the layout or struc- tural changes to system components or their status. Users effect both types of changes by directly manipulating graphi- cal objects on the screen. ConicDraw treats structural changes as commands and relays them to gman, which makes the equivalent changes to the running system. These changes include creating and deleting nodes, linking and unlinking of exit and entry ports, and changes in node status.
To add a node, the user selects the node tool from the tool palette and draws a rectangle in the system window. This brings up a dialog box that prompts the user for the name, type, and location of the new node instance, as well as any extra parameters needed for its creation (Figure 12). This information is then packaged and sent to gman as a “create” command.
To create a connection between an exit and entry port, the user simply draws a link between the two ports. This link can be a single straight line or a multisegment
polyline. The result is a “link” command sent to gman with the appropriate argu- ments. To delete a node or a link, the user selects the item with the selection tool and then chooses the “Clear” item from the Edit menu.
The creation or deletion of a node or a link can fail for various reasons. In these situations, the displayed system configura- tion will be inconsistent with the system’s true state. To overcome this problem, we introduced the “zombie” state, an interme- diate state acquired by an object in the process of being created or deleted. A zombie object will remain in this state until gman confirms its creation or deletion. ConicDraw represents a zombie node by a rectangle filled with an irregular pattern and a zombie link by a dashed line.
A user changes node status via the “Start nodes” and “Stop nodes”menu commands. To start a node, the user selects it with the selection tool and then chooses “Start nodes” from the Command menu. Since this command works on any node selected, multiple nodes can be started at the same time. The “Stop nodes”command works in a similar way. The status of a node relates to its configuration management state as determined by a change management protocol.R
For an example of how ConicDraw per- forms and controls dynamic system con- figuration, see the accompanying sidebar.
Diagram layout support. ConicDraw provides all the standard editing facilities expected of a diagram editor. It lets users move and resize nodes, drag ports to any node face, and reshape links by adding or deleting individual segments in the link. In addition, it knows the syntax of Conic configuration diagrams and can therefore prevent construction of syntactically ill-
formed diagrams. For example, it ensures that all of a node’s ports and links stay connected when the node is moved and that a port cannot be detached from its parent node. Because ConicDraw also maintains information on port types, it further en- sures that only compatible entry and exit ports are connected.
A graphical system must give the user full control over the layout of his diagram. It is equally important, however, that the tool simplifies the task of editing and maintaining the diagram. This is especially true for ConicDraw. Since the tool auto- matically generates a system configura- tion diagram from information derived directly from the operational system, the diagram often requires considerable edit- ing before it resembles the structure the user had in mind. We provide various fa- cilities to automate some frequently per- formed editing tasks, as well as tools to help the user manage complex diagrams. However, rather than force these tools on the user, we provide them as options for more flexibility.
Automatic diagram tidy-up. This facil- ity, invoked automatically after a system diagram is generated, is also available manually by choosing the “Tidy diagram” item in the Layout menu. The algorithm uses two criteria in improving a diagram layout: minimize the lengths of links, and minimize crossovers between links. These criteria are met by performing the follow- ing steps:
Determine on which node face a port should be placed. This step involves going through all the links in the diagram and pulling together the ports at either end, as
(Continued on p . 62)
5 8 COMPUTER
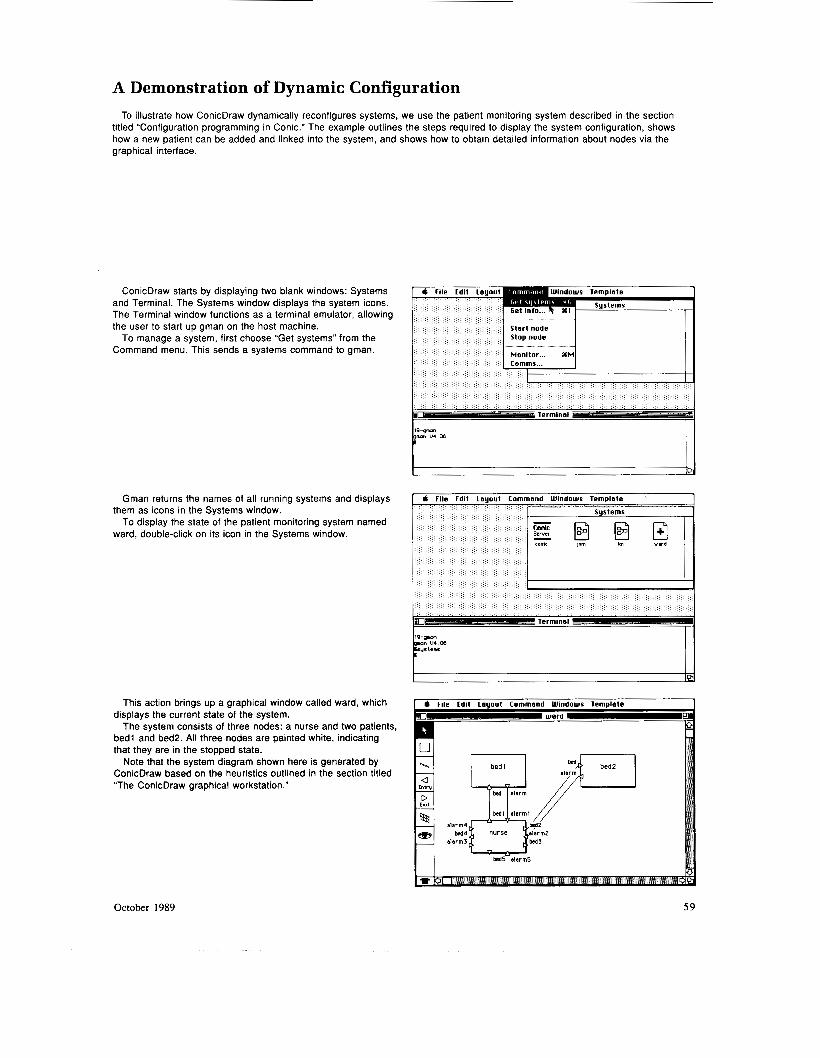
A Demonstration of Dynamic Configuration To illustrate how ConicDraw dynamically reconfigures systems, we use the patient monitoring system described in the section
titled “Configuration programming in Conic.” The example outlines the steps required to display the system configuration, shows how a new patient can be added and linked into the system, and shows how to obtain detailed information about nodes via the graphical interface.
ConicDraw starts by displaying two blank windows: Systems and Terminal. The Systems window displays the system icons. The Terminal window functions as a terminal emulator, allowing the user to start up gman on the host machine.
To manage a system, first choose “Get systems” from the Command menu. This sends a systems command to gman.
19-gnan m m W Ob b I I
Gman returns the names of all running systems and displays
To display the state of the patient monitoring system named them as icons in the Systems window.
ward, double-click on its icon in the Systems window.
This action brings up a graphical window called ward, which
The system consists of three nodes: a nurse and two patients, displays the current state of the system.
bed1 and bed2. All three nodes are painted white, indicating that they are in the stopped state.
Note that the system diagram shown here is generated by ConicDraw based on the heuristics outlined in the section titled “The ConicDraw graphical workstation.”
’ & file tdit Layout Command Windows Template ward L ! d
alarm4 bsdz bed4 alarm2
alarm3 bed3
bed5 alarm5
October 1989 5 9
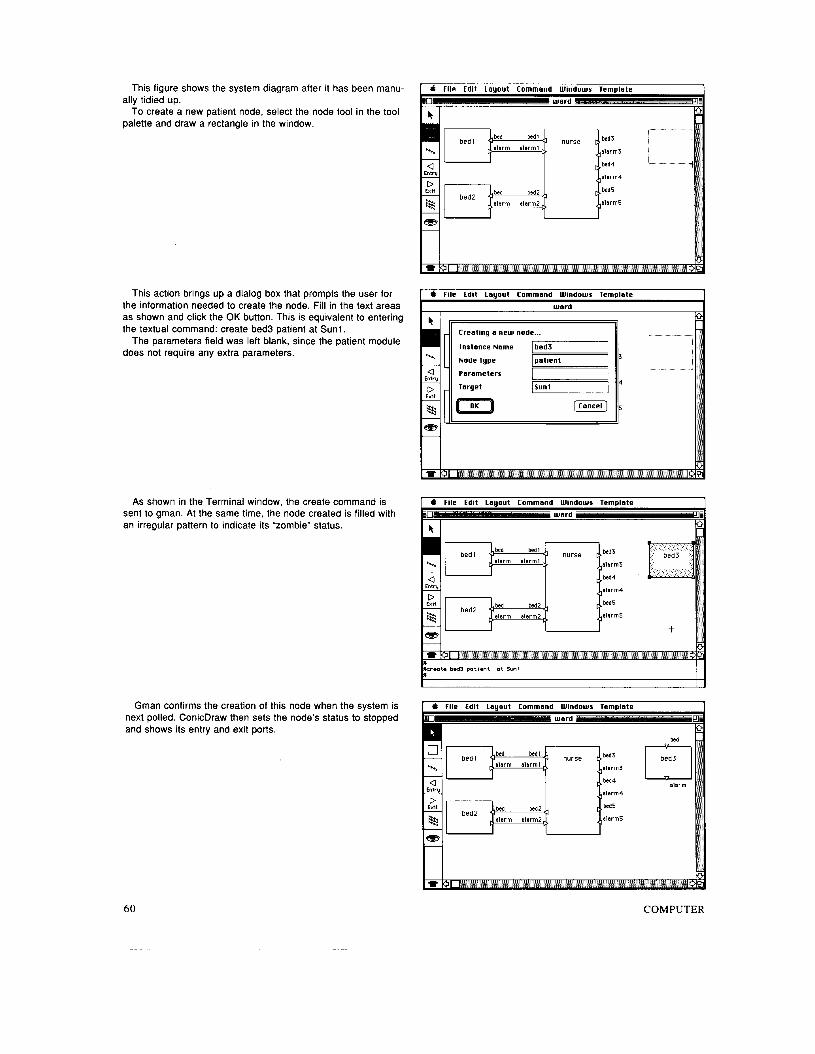
This figure shows the system diagram after it has been manu-
To create a new patient node, select the node tool in the tool ally tidied up.
palette and draw a rectangle in the window.
This action brings up a dialog box that prompts the user for the information needed to create the node. Fill in the text areas as shown and click the OK button. This is equivalent to entering the textual command: create bed3 patient at Sunl.
The parameters field was left blank, since the patient module does not require any extra parameters.
As shown in the Terminal window, the create command is sent to gman. At the same time, the node created is filled with an irregular pattern to indicate its “zombie” status.
Gman confirms the creation of this node when the system is next polled. ConicDraw then sets the node’s status to stopped and shows its entry and exit ports.
I & File Edit Lauout Command Windows Temolate 1 zn- ward -p~--hi----. .
4
ne0 3
alarm)
tea4 + alarm4
teas
alarm5
n
Instance Name
n
bed3
alarm3
bed4
alarm4
bad5
alarm5
bed 4
alarm4
bed5
alarm5 bed2
U alarm
rl 60 COMPUTER
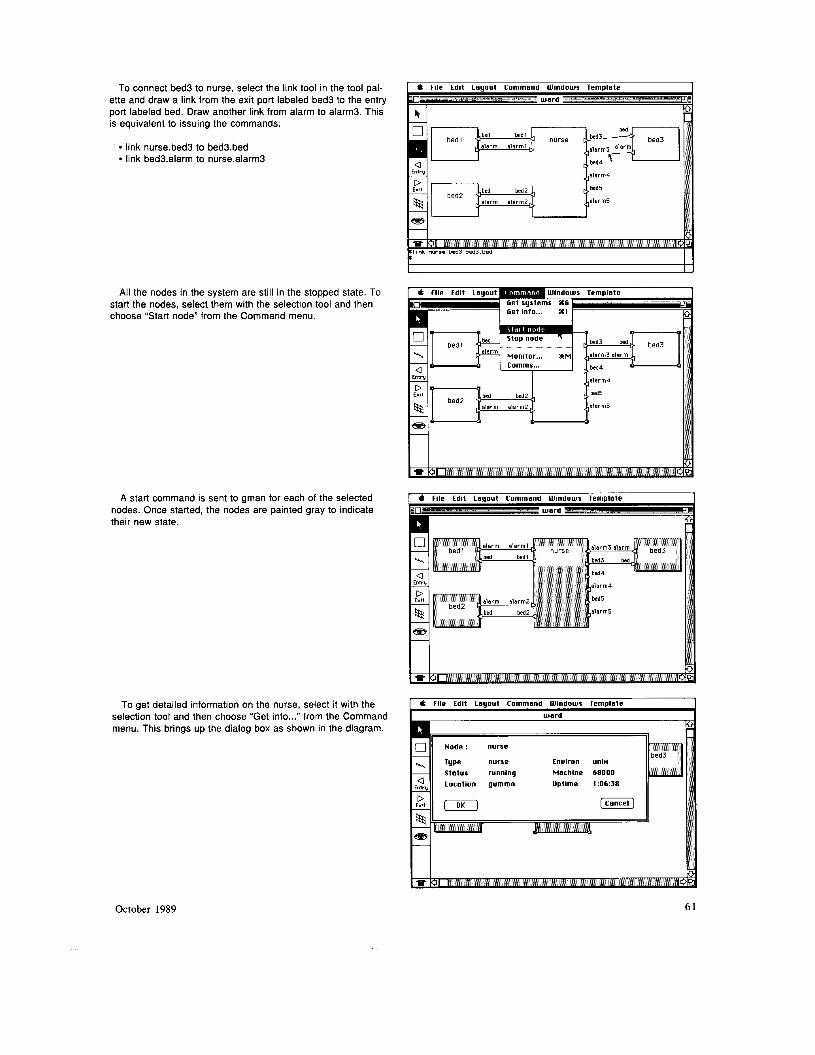
To connect bed3 to nurse, select the link tool in the tool pal- ette and draw a link from the exit port labeled bed3 to the entry port labeled bed. Draw another link from alarm to alarm3. This is equivalent to issuing the commands:
link nurse.bed3 to bed3.bed link bed3.alarm to nurse.alarm3
All the nodes in the system are still in the stopped state. To start the nodes, select them with the selection tool and then choose "Start node" from the Command menu.
A start command is sent to gman for each of the selected nodes. Once started, the nodes are painted gray to indicate their new state.
To get detailed information on the nurse, select it with th selection tool and then choose "Get info ..." from the Command menu. This brings up the dialog box as shown in the diagram.
& File Edit Layout Command Windows Template
10- ward ___j___ EIS
a la rm4 F r b e d 2 1 alarm alarm2 alarm5
Get info... %I
M F i b e d bed2 1 ibed5 alarm alarm2 a larm5 II
I I U a- n u & File Edit Layout Command Windows Template
m- - ward P 'IF
n I I
ype nurse Enuiron unim tatus running Machine 68000
ocation gummo Uptime 1 :06:38
October 1989 61
~ _ _ _ _ _ r=+z F+i”.q I Before tidy-up After tidy-up
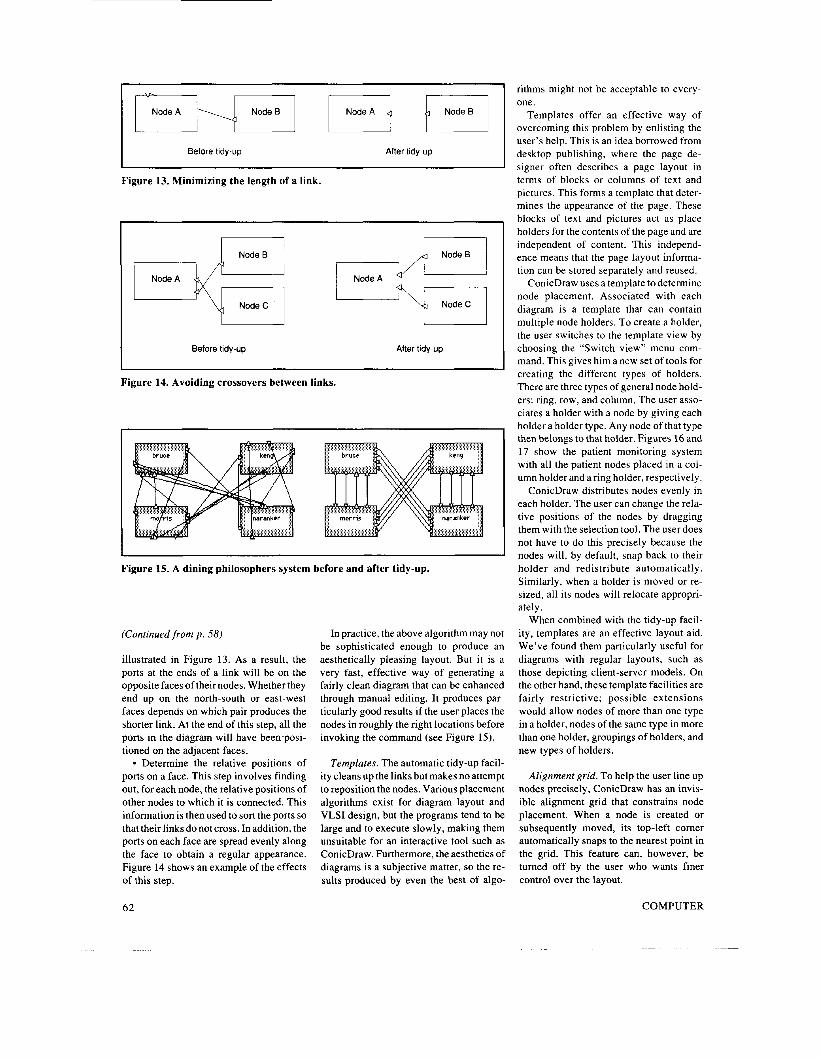
Figure 13. Minimizing the length of a link.
Before tidy-up After tidy-up
Figure 14. Avoiding crossovers between links.
I I
~~
Figure 15. A dining philosophers system before and after tidy-up.
(Continued from p . 58)
illustrated in Figure 13. As a result, the ports at the ends of a link will be on the opposite faces of their nodes. Whether they end up on the north-south or east-west faces depends on which pair produces the shorter link. At the end of this step, all the ports in the diagram will have been-posi- tioned on the adjacent faces.
Determine the relative positions of ports on a face. This step involves finding out, for each node, the relative positions of other nodes to which it is connected. This information is then used to sort the ports so that their links do not cross. In addition, the ports on each face are spread evenly along the face to obtain a regular appearance. Figure 14 shows an example of the effects of this step.
In practice, the above algorithm may not be sophisticated enough to produce an aesthetically pleasing layout. But it is a very fast, effective way of generating a fairly clean diagram that can be enhanced through manual editing. It produces par- ticularly good results if the user places the nodes in roughly the right locations before invoking the command (see Figure 15).
Templates. The automatic tidy-up facil- ity cleans up the links but makes no attempt to reposition the nodes. Various placement algorithms exist for diagram layout and VLSI design, but the programs tend to be large and to execute slowly, making them unsuitable for an interactive tool such as ConicDraw. Furthermore, the aesthetics of diagrams is a subjective matter, so the re- sults produced by even the best of algo-
rithms might not be acceptable to every- one.
Templates offer an effective way of overcoming this problem by enlisting the user’s help. This is an idea borrowed from desktop publishing, where the page de- signer often describes a page layout in terms of blocks or columns of text and pictures. This forms a template that deter- mines the appearance of the page. These blocks of text and pictures act as place holders for the contents of the page and are independent of content. This independ- ence means that the page layout informa- tion can be stored separately and reused.
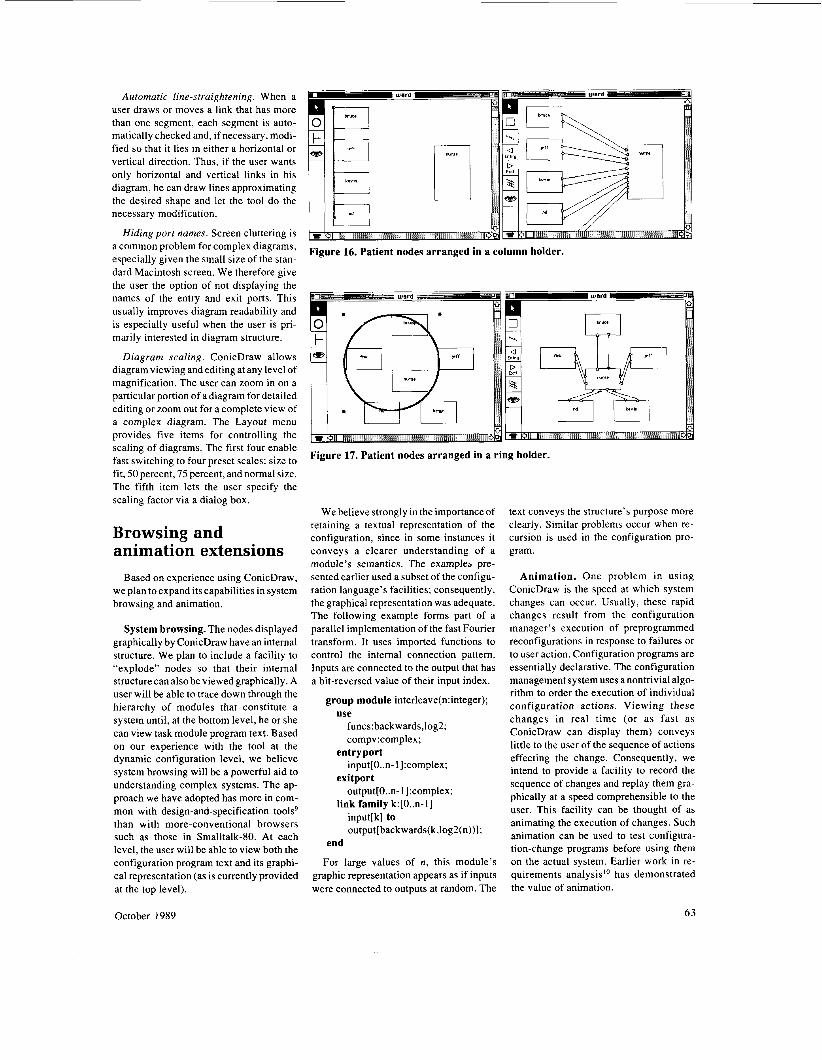
ConicDraw uses a template to determine node placement. Associated with each diagram is a template that can contain multiple node holders. To create a holder, the user switches to the template view by choosing the “Switch view” menu com- mand. This gives him a new set of tools for creating the different types of holders. There are three types of general node hold- ers: ring, row, and column. The user asso- ciates a holder with a node by giving each holder a holder type. Any node of that type then belongs to that holder. Figures 16 and 17 show the patient monitoring system with all the patient nodes placed in a col- umn holder and aring holder, respectively.
ConicDraw distributes nodes evenly in each holder. The user can change the rela- tive positions of the nodes by dragging them with the selection tool. The user does not have to do this precisely because the nodes will, by default, snap back to their holder and redistribute automatically. Similarly, when a holder is moved or re- sized, all its nodes will relocate appropri- ately.
When combined with the tidy-up facil- ity, templates are an effective layout aid. We’ve found them particularly useful for diagrams with regular layouts, such as those depicting client-server models. On the other hand, these template facilities are fairly restrictive; possible extensions would allow nodes of more than one type in a holder, nodes of the same type in more than one holder, groupings of holders, and new types of holders.
Alignment grid. To help the user line up nodes precisely, ConicDraw has an invis- ible alignment grid that constrains node placement. When a node is created or subsequently moved, its top-left comer automatically snaps to the nearest point in the grid. This feature can, however, be turned off by the user who wants finer control over the layout.
62 COMPUTER
Automatic line-straightening. When a user draws or moves a link that has more than one segment, each segment is auto- matically checked and, if necessary, modi- fied so that it lies in either a horizontal or vertical direction. Thus, if the user wants only horizontal and vertical links in his diagram, he can draw lines approximating the desired shape and let the tool do the necessary modification.
Hiding port names. Screen cluttering is a common problem for complex diagrams, especially given the small size of the stan- dard Macintosh screen. We therefore give the user the option of not displaying the names of the entry and exit ports. This usually improves diagram readability and is especially useful when the user is pri- marily interested in diagram structure.
Diagram scaling. ConicDraw allows diagram viewing and editing at any level of magnification. The user can zoom in on a particular portion of a diagram for detailed editing or zoom out for a complete view of a complex diagram. The Layout menu provides five items for controlling the scaling of diagrams. The first four enable fast switching to four preset scales: size to fit, 50 percent, 75 percent, andnormal size. The fifth item lets the user specify the scaling factor via a dialog box.
Browsing and animation extensions
Based on experience using ConicDraw, we plan to expand its capabilities in system browsing and animation.
System browsing. The nodes displayed graphically by ConicDraw have an internal structure. We plan to include a facility to “explode” nodes so that their internal structure can also be viewed graphically. A user will be able to trace down through the hierarchy of modules that constitute a system until, at the bottom level, he or she can view task module program text. Based on our experience with the tool at the dynamic configuration level, we believe system browsing will be a powerful aid to understanding complex systems. The ap- proach we have adopted has more in com- mon with design-and-specification tools’ than with more-conventional browsers such as those in Smalltalk-80. At each level, the user will be able to view both the configuration program text and its graphi- cal representation (as is currently provided at the top level).
Fil IIH =\\ I I
Figure 16. Patient nodes arranged in a column holder.
KN
M
Figure 17. Patient nodes arranged in a ring holder.
w
We believe strongly in the importance of retaining a textual representation of the configuration, since in some instances it conveys a clearer understanding of a module’s semantics. The examples pre- sented earlier used a subset of the configu- ration language’s facilities; consequently, the graphical representation was adequate. The following example forms part of a parallel implementation of the fast Fourier transform. It uses imported functions to control the internal connection pattern. Inputs are connected to the output that has a bit-reversed value of their input index.
group module interleave(n:integer); use
funcs: backwards,log2; compv:complex;
input[O..n-l]:complex;
output[O. .n- 1 ]:complex;
input[k] to output[backwards(k,log2(n))];
entry port
exitport
link family k: [O..n- 11
end
For large values of n, this module’s graphic representation appears as if inputs were connected to outputs at random. The
text conveys the structure’s purpose more clearly. Similar problems occur when re- cursion is used in the configuration pro- gram.
Animation. One problem in using ConicDraw is the speed at which system changes can occur. Usually, these rapid changes result from the configuration manager’s execution of preprogrammed reconfigurations in response to failures or to user action. Configuration programs are essentially declarative. The configuration management system uses a nontrivial algo- rithm to order the execution of individual configuration actions. Viewing these changes in real time (or as fast as ConicDraw can display them) conveys little to the user of the sequence of actions effecting the change. Consequently, we intend to provide a facility to record the sequence of changes and replay them gra- phically at a speed comprehensible to the user. This facility can be thought of as animating the execution of changes. Such animation can be used to test configura- tion-change programs before using them on the actual system. Earlier work in re- quirements analysis” has demonstrated the value of animation.
October 1989 63

C onfiguration programming pro- vides a clear and flexible means for program definition, construction,
and management. Its advantages have been recognized for both conventional software development, as in the use of interface specifications in the Inscape en- vironment,” and in distributed systems such as Conic and, more recently, Durra.’* Graphical support is particularly appropri- ate for the structural information used in configuration specifications. Stile” also applies graphics to configuration, but it fo- cuses on design and development rather than system construction and management.
Our experience shows that ConicDraw is a powerful aid to understanding and constructing configuration programs. While textual programs have the advan- tage of conciseness and clarity in express- ing complex structures, graphics offer a more accessible human interface. The abil- ity to translate between the two forms of- fers the best of both worlds. U
Acknowledgments We would like to acknowledge the advice
and expertise of Naranker Dulay and Kevin Twidle for their support in implementing and
interacting with the configuration managers. They also contributed, along with Morris Slo- man, to useful discussions on graphical con- figuration programming. The referees made a substantial contribution to the clarity and pres- entation of this article
This work was partially supported by the SERC (Science and Research Council) ACME (Application of Computers to Manufacturing Engineering) Directorate under grant GEE 62394.
References 1. F. DeRemer and H.H. Kron, “Program-
ming-in-the-Large versus Programming- in-the-Small,” IEEE Trans. Software Eng., Vol. SE-2, No. 2, June 1976, pp. 114.121.
2. J.A. Goguen, “Reusing and Interconnect- ing Software Components,” Computer, Vol. 9, No. 2, Feb. 1986, pp. 16-28.
3. T.J. LeBlanc and S.A. Friedberg, “HPC: A Model of Structure and Change in Distrib- uted Systems,” IEEE Trans. Computers, Vol. C-34, No. 12, Dec. 1985, pp. 1,114- 1,128.
4. J. Kramer and J. Magee, “Dynamic Con- figuration for Distributed Systems,” IEEE Trans. Software Eng., Vol. SE-1 1, No. 4, Apr. 1985, pp. 424-436.
5 . J. Magee, J. Kramer, and M. Sloman, “Constructing Distributed Systems in
Conic,” IEEE Trans. Software Eng., Vol. SE-15, No. 6, June 1989, pp. 663-675.
6. S.K. Chang, “Visual Languages: A Tutorial and Survey,” Visualization in Program- ming: Lecture Notes in Computer Science 282, Springer-Verlag. pp. 1-23.
7. W.P. Myers, G.F. Myers, and L.C. Con- stantine, “Structured Design,’’ IBM Sys. J . , Vol. 13, No. 2, 1974, pp. 115-139.
8. J. Kramer and J. Magee, “A Model for Change Management,” Proc. IEEE Work- shop Future Trends of Distributed Comput- ing Systems in the 1990s, 1988, pp. 286- 295.
9. M. Stephens and K. Whitehead, “The Ana- lyst - A Workstation for Analysis and Design,” Proc. Eighth Int’l Conf. Software Eng., CS Press, Los Alamitos, Calif., Order No. 620 (microfiche only), 1985, pp. 364- 369.
IO. J. Kramer and K. Ng, “Animation of Re- quirements Specifications,” Software Prac- tice & Experience, Vol. 18, No. 8, Aug. 1988, pp. 749-774.
11. D.E. Perry, “Software Interconnection Models,” Proc. Ninth Int’l Conf. Software Eng., CS Press, Los Alamitos, Calif., Order NO. 767, 1987, pp. 61-69.
12. M.R. Barbacci, C.B. Weinstock, and J.M. Wing, “Programming at the Processor-
IJCNN-90-WASH-DC INTERNATIONAL JOINT CONFERENCE ON NEURAL NETWORKS
January 15-19, 1990 Omni Shoreham Hotel, Washington,D.C.
Tutorials, Exhibits, Special Interest Group Meetings (SIG); Technical Sessions of invited and contri- buted papers on Applications, Neural and Cognitive Sciences and Theory; including special sessions on Self-organizing Neural Architectures and Evolu- tionary Issues.
Featuring Plenary Speeches by Nobel Laureates Leon Cooper, Gerald Edelman, David Hubel and INNS President, Bernard Widrow.
Presentation of research perspectives from Japan, Europe, and the U.S.
F o r more in f ormution please contact: Deverman & Associates
4233 Spring Street, “99 La Mesa, California U.S.A. 92041 800 a.m.-4:30 p.m. PST FAX (619) 462-0121 (619) 462-6800
INNS T H E INSTITUTE OF
ELECTRICAL AND ELECrRoNICs INTERNATIONAL
NEURAL NETWORK ENGINE E RS. I NC SOC,ETY
Memory-Switch Level,” Proc. 10th Int’l Conf. Software Eng., CS Press, Los Alamitos, Calif,, Order No. 849, 1988, pp. 19-28.
13. M.P. Stovsky and B.W. Weide, “Stile: A Graphical Design and Development Environment,” Digest Cornpcon Spring 87, CS Press, Los Alamitos, Calif., Order No. 764, pp. 247-250
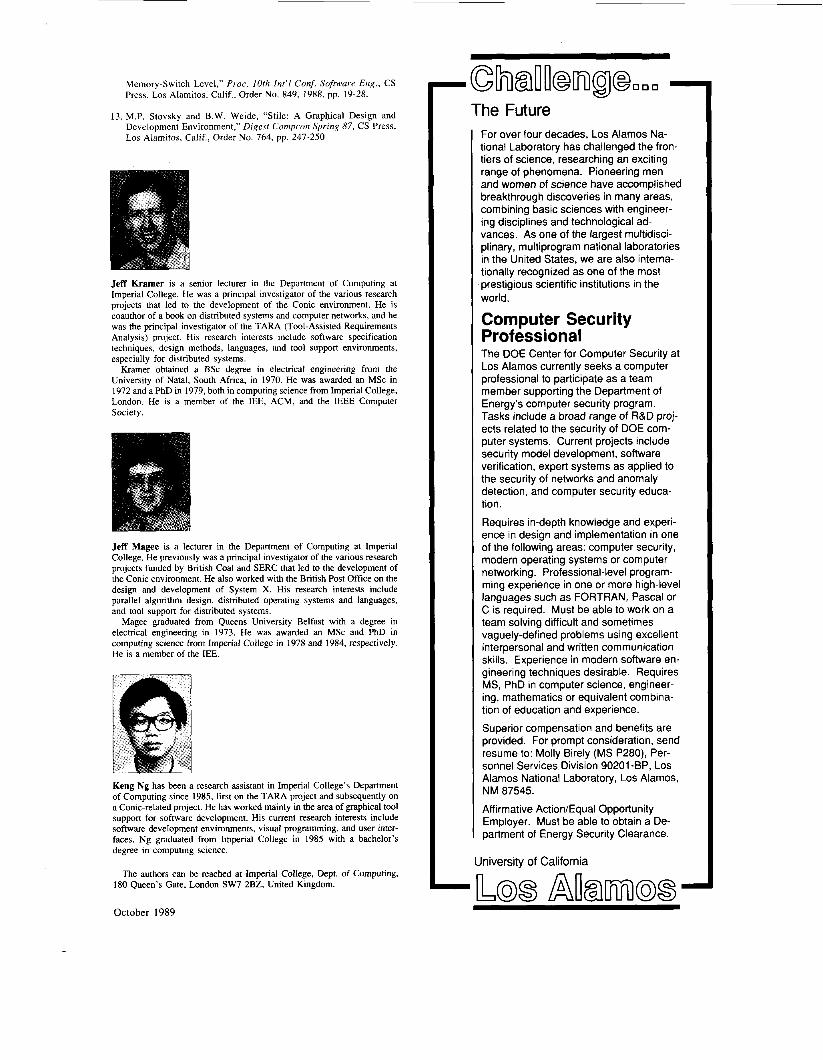
Jeff Kramer is a senior lecturer in the Department of Computing at Imperial College. He was a principal investigator of the various research projects that led to the development of the Conic environment. He is coauthor of a book on distributed systems and computer networks, and he was the principal investigator of the TARA (Tool-Assisted Requirements Analysis) project. His research interests include software specification techniques, design methods, languages, and tool support environments, especially for distributed systems.
Kramer obtained a BSc degree in electrical engineering from the University of Natal, South Africa, in 1970. He was awarded an MSc in 1972 and a PhD in 1979, both in computing science from Imperial College, London. He is a member of the IEE, ACM, and the IEEE Computer Society.
Jeff Magee is a lecturer in the Department of Computing at Imperial College. He previously was a principal investigator of the various research projects funded by British Coal and SERC that led to the development of the Conic environment. He also worked with the British Post Office on the design and development of System X. His research interests include parallel algorithm design, distributed operating systems and languages, and tool support for distributed systems.
Magee graduated from Queens University Belfast with a degree in electrical engineering in 1973. He was awarded an MSc and PhD in computing science from Imperial College in 1978 and 1984, respectively. He is a member of the IEE.
Keng Ng has been a research assistant in Imperial College’s Department of Computing since 1985, first on the TARA project and subsequently on a Conic-related project. He has worked mainly in the area of graphical tool support for software development. His current research interests include software development environments, visual programming, and user inter- faces. Ng graduated from Imperial College in 1985 with a bachelor’s degree in computing science.
The authors can be reached at Imperial College, Dept. of Computing, 180 Queen’s Gate, London SW7 2BZ, United Kingdom.
-he Future For over four decades, Los Alamos Na- tional Laboratory has challenged the fron- tiers of science, researching an exciting range of phenomena. Pioneering men and women of science have accomplished breakthrough discoveries in many areas, combining basic sciences with engineer- ing disciplines and technological ad- vances. As one of the largest multidisci- plinary, multiprogram national laboratories in the United States, we are also interna- tionally recognized as one of the most prestigious scientific institutions in the world.
Computer Security Professional The DOE Center for Computer Security at Los Alamos currently seeks a computer professional to participate as a team member supporting the Department of Energy’s computer security program. Tasks include a broad range of R&D proj- ects related to the security of DOE com- puter systems. Current projects include security model development, software verification, expert systems as applied to the security of networks and anomaly detection, and computer security educa- tion.
Requires in-depth knowledge and experi- ence in design and implementation in one of the following areas: computer security, modern operating systems or computer networking. Professional-level program- ming experience in one or more high-level languages such as FORTRAN, Pascal or C is required. Must be able to work on a team solving difficult and sometimes vaguely-defined problems using excellent interpersonal and written communication skills. Experience in modern software en- gineering techniques desirable. Requires MS, PhD in computer science, engineer- ing, mathematics or equivalent combina- tion of education and experience.
Superior compensation and benefits are provided. For prompt consideration, send resume to: Molly Birely (MS P280), Per- sonnel Services Division 90201 -BP, Los Alamos National Laboratory, Los Alamos, NM 87545.
Affirmative Action/Equal Opportunity Employer. Must be able to obtain a De- partment of Energy Security Clearance.
University of California
October 1989


