Embed Size (px)
Citation preview

GREEN-MAC-LCCP�: Life-CycleClimate Performance Metric forMobile Air ConditioningTechnology ChoiceStella Papasavvaa and Stephen O. Andersenba General Motors Research & Development Center, Now Stella Papasavva Consulting, Royal Oak,MI 48073; [email protected] (for correspondence)b U.S. Environmental Protection Agency, Now Institute for Governance & Sustainable Development (IGSD), Washington DC, 20007
Published online 16 June 2010 in Wiley Online Library (wileyonlinelibrary.com). DOI 10.1002/ep.10465
Most refrigerants used today are potent chlorofluor-ocarbon (CFC), hydrochlorofluorocarbon (HCFC),and hydrofluorocarbon (HFC), greenhouse gases(GHG) that can contribute significantly to anthropo-genic climate change and stratospheric ozone deple-tion. In a business-as-usual scenario, HFC emissionsin 2050 have been predicted to be equivalent to9–19% (CO2-eq. basis) of projected global CO2 emis-sions. This percentage increases to 28–45% if pro-jected CO2 emissions result in a 450-ppm CO2 stabili-zation scenario. Half of current direct HFC emissionsare from mobile air conditioning (MAC) and alterna-tive refrigerants with lower global warming potential(GWP) should have higher energy efficiency. The Eu-ropean f-Gas Directive phases out the use of refriger-ants with GWP > 150, including HFC-134a (GWP 51430) from MACs by 2017. Life-Cycle Climate Per-formance (LCCP) identifies environmentally superiortechnology to minimize GHG emissions from refriger-ation and air conditioning applications. The compre-hensive LCCP model, GREEN-MAC-LCCPq focuses onthe current choice among alternative refrigerants thatmeet the f-Gas requirement starting in 2011. UsingGREEN-MAC-LCCPq we estimate that the current
MAC technology based on HFC-134a refrigerantdemands additional fuel during vehicle A/C opera-tion in the: USA by 7%, in the EU by 7%, in Japan by9%, in India by 15–20%, and in China by 7–10%depending on the humidity. We compare these datawith the projected LCCP CO2-eq. savings by the year2017 when HFC-134a will be replaced by a low GWPalternative (GWP < 150) according to the f-Gas rule.We find that refrigerant HFO-1234yf has the potentialto reduce global LCCP CO2-eq. greenhouse gas emis-sions by about 7% in 2017, whereas greenhouse gasemissions from air conditioning systems using R-744(carbon dioxide) refrigerants are estimated to beabout 2% greater, compared to the current HFC-134aMAC baseline systems. � 2010 American Institute ofChemical Engineers Environ Prog, 30: 234–247, 2011Keywords: mobile air conditioning, HFC, industrial
ecologylife cycle analysis, refrigerant, greenhouse gases
INTRODUCTION
For many years, chlorofluorocarbons (CFCs) wereutilized extensively by society in a variety of applica-tions including refrigeration, air conditioning, andenergy-efficient insulation, precision, and cleaningengineering components. Most refrigerants usedtoday are CFCs, hydrochlorofluorocarbon (HCFC),and hydrofluorocarbon (HFCs), and all are potentgreenhouse gases. The exceptions are ammonia re-frigerant (R-717) used in low-temperature applica-tions such as food-freezing and industrial cold storage
Present address of Stella Papasavva: 3035 Sylvan Drive, Royal Oak,MI 48073.Present address of Stephen O. Andersen: Montreal Protocol Co-
Chair Technology & Economic Assessment Panel, 2317 North RoadBarnard, VT 05031-0257.� 2010 American Institute of Chemical Engineers
234 July 2011 Environmental Progress & Sustainable Energy (Vol.30, No.2) DOI 10.1002/ep

and hydrocarbons (R-290 and R-600a) used in smallappliance applications such as domestic refrigeratorsand retail refrigerated beverage cabinets and in indus-trial and commercial refrigeration and air condition-ing markets where HFCs are restricted. Until 1990,the nonflammable, low-toxicity refrigerant of choicefor automobile air conditioning was CFC-12 becauseof its desirable engineering and thermodynamic prop-erties and low price.
However, beginning in 1974 atmospheric scientistsMolina and Rowland [1] warned that CFCs coulddeplete the stratospheric ozone layer that protects theEarth against ultraviolet radiation that causes skincancer, cataracts, suppresses the human immune sys-tem and destroys agricultural and natural ecosystems.In 1987, in response to the growing evidence of CFCsharming the ozone layer, 27 nations signed the Mon-treal Protocol [2]. The original Protocol required just a50% reduction in CFC production and use but wasultimately strengthened to require a complete phase-out of CFCs use in 1996 by industrialized countriesand for the rest of the world in 2010. By 1990, globalautomobile manufacturers had announced theirchoice of HFC-134a and a strategy to complete thetransition in newly-manufactured cars by 1994.Today, the Montreal Protocol membership includesall 196 countries, earning it the distinction of beingthe only treaty on any topic with full country partici-pation.
The Montreal Protocol is regarded as the modelfor successful global environmental treaties because
of its success in phasing out 97% of ozone-depletingsubstances and for its pioneering agreement of devel-oping countries to accept binding commitments inexchange for modest financing of market transforma-tion to ozone-safe technology. Figure 1 illustrates thesignificance of the Montreal Protocol implementationin reducing the ozone depleting substances (ODS)concentration in the stratosphere [3]. Despite the orig-inal focus of the Montreal Protocol to protect theozone layer, it made an extraordinary contribution forreducing global warming because the new automo-tive refrigerant had a significantly lower global warm-ing potential (GWP) (10,900 for CFC-12 vs. 1,430 forHFC-134a), because systems were improved to bettercontain the refrigerant, and because servicing wastransformed with refrigerant recovery and recycle.Compared to business-as-usual CFC-12 systems,improved HFC-134a systems reduce the impact ofMAC by an order of magnitude or more [4].
The IPCC/TEAP Special Report on Safeguardingthe Ozone Layer and the Global Climate System:Issues Related to Hydrofluorocarbons and Perfluoro-carbons, 2005, is the first integrated assessment of theefforts to protect the atmosphere through the Mon-treal Protocol and the UN Framework Convention onClimate Change and its Kyoto Protocol, significantbecause the Kyoto Protocol does not include ODSgreenhouse gases in its basket of controlled substan-ces and the Montreal Protocol at that time did notwork explicitly to protect the climate. Two years later,a team of scientists quantified the climate change that
Figure 1. Impact of Montreal Protocol Implementation in reducing ODS concentrations from the atmosphere.[Color figure can be viewed in the online issue, which is available at wileyonlinelibrary.com.]
Environmental Progress & Sustainable Energy (Vol.30, No.2) DOI 10.1002/ep July 2011 235
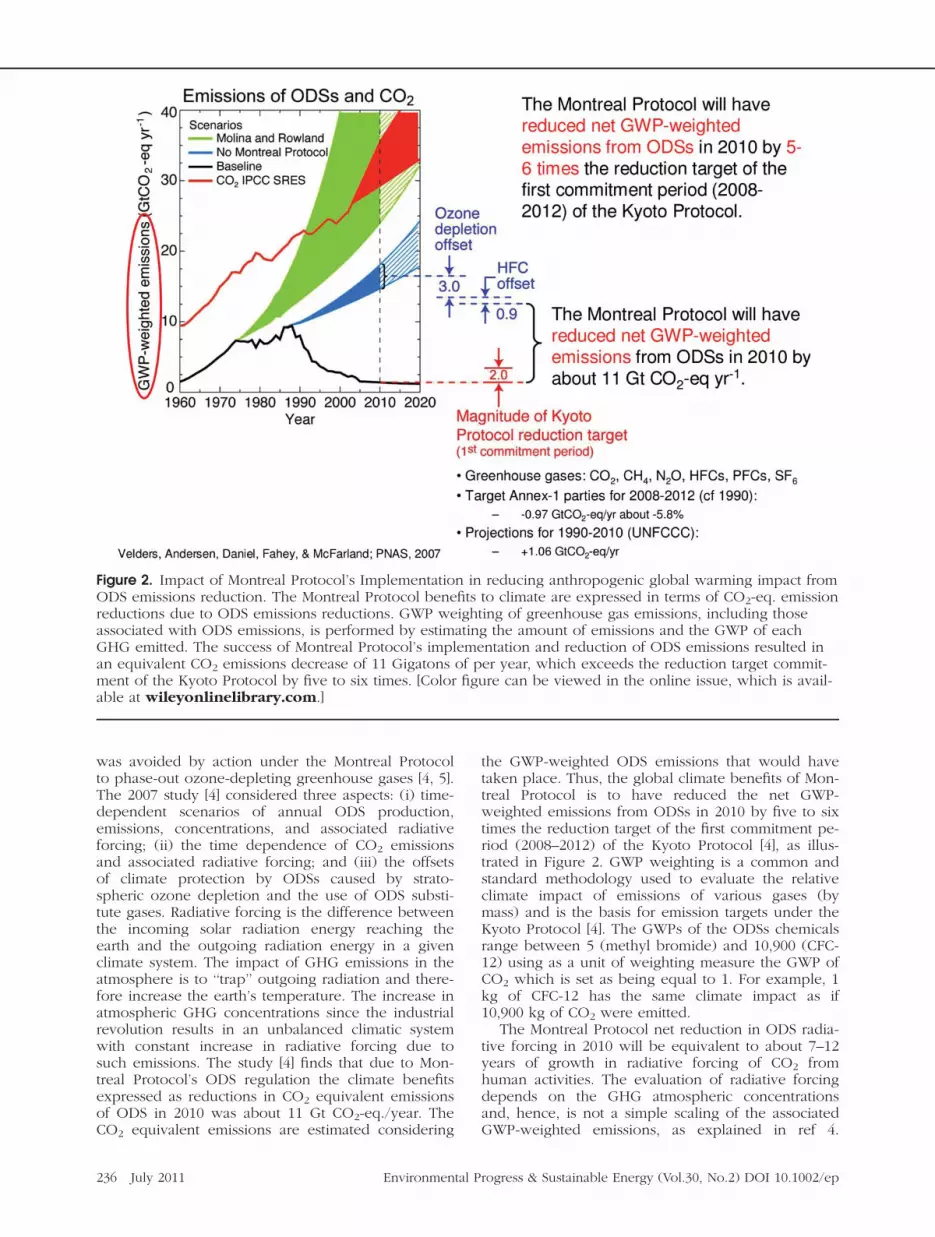
was avoided by action under the Montreal Protocolto phase-out ozone-depleting greenhouse gases [4, 5].The 2007 study [4] considered three aspects: (i) time-dependent scenarios of annual ODS production,emissions, concentrations, and associated radiativeforcing; (ii) the time dependence of CO2 emissionsand associated radiative forcing; and (iii) the offsetsof climate protection by ODSs caused by strato-spheric ozone depletion and the use of ODS substi-tute gases. Radiative forcing is the difference betweenthe incoming solar radiation energy reaching theearth and the outgoing radiation energy in a givenclimate system. The impact of GHG emissions in theatmosphere is to ‘‘trap’’ outgoing radiation and there-fore increase the earth’s temperature. The increase inatmospheric GHG concentrations since the industrialrevolution results in an unbalanced climatic systemwith constant increase in radiative forcing due tosuch emissions. The study [4] finds that due to Mon-treal Protocol’s ODS regulation the climate benefitsexpressed as reductions in CO2 equivalent emissionsof ODS in 2010 was about 11 Gt CO2-eq./year. TheCO2 equivalent emissions are estimated considering
the GWP-weighted ODS emissions that would havetaken place. Thus, the global climate benefits of Mon-treal Protocol is to have reduced the net GWP-weighted emissions from ODSs in 2010 by five to sixtimes the reduction target of the first commitment pe-riod (2008–2012) of the Kyoto Protocol [4], as illus-trated in Figure 2. GWP weighting is a common andstandard methodology used to evaluate the relativeclimate impact of emissions of various gases (bymass) and is the basis for emission targets under theKyoto Protocol [4]. The GWPs of the ODSs chemicalsrange between 5 (methyl bromide) and 10,900 (CFC-12) using as a unit of weighting measure the GWP ofCO2 which is set as being equal to 1. For example, 1kg of CFC-12 has the same climate impact as if10,900 kg of CO2 were emitted.
The Montreal Protocol net reduction in ODS radia-tive forcing in 2010 will be equivalent to about 7–12years of growth in radiative forcing of CO2 fromhuman activities. The evaluation of radiative forcingdepends on the GHG atmospheric concentrationsand, hence, is not a simple scaling of the associatedGWP-weighted emissions, as explained in ref 4.
Figure 2. Impact of Montreal Protocol’s Implementation in reducing anthropogenic global warming impact fromODS emissions reduction. The Montreal Protocol benefits to climate are expressed in terms of CO2-eq. emissionreductions due to ODS emissions reductions. GWP weighting of greenhouse gas emissions, including thoseassociated with ODS emissions, is performed by estimating the amount of emissions and the GWP of eachGHG emitted. The success of Montreal Protocol’s implementation and reduction of ODS emissions resulted inan equivalent CO2 emissions decrease of 11 Gigatons of per year, which exceeds the reduction target commit-ment of the Kyoto Protocol by five to six times. [Color figure can be viewed in the online issue, which is avail-able at wileyonlinelibrary.com.]
236 July 2011 Environmental Progress & Sustainable Energy (Vol.30, No.2) DOI 10.1002/ep
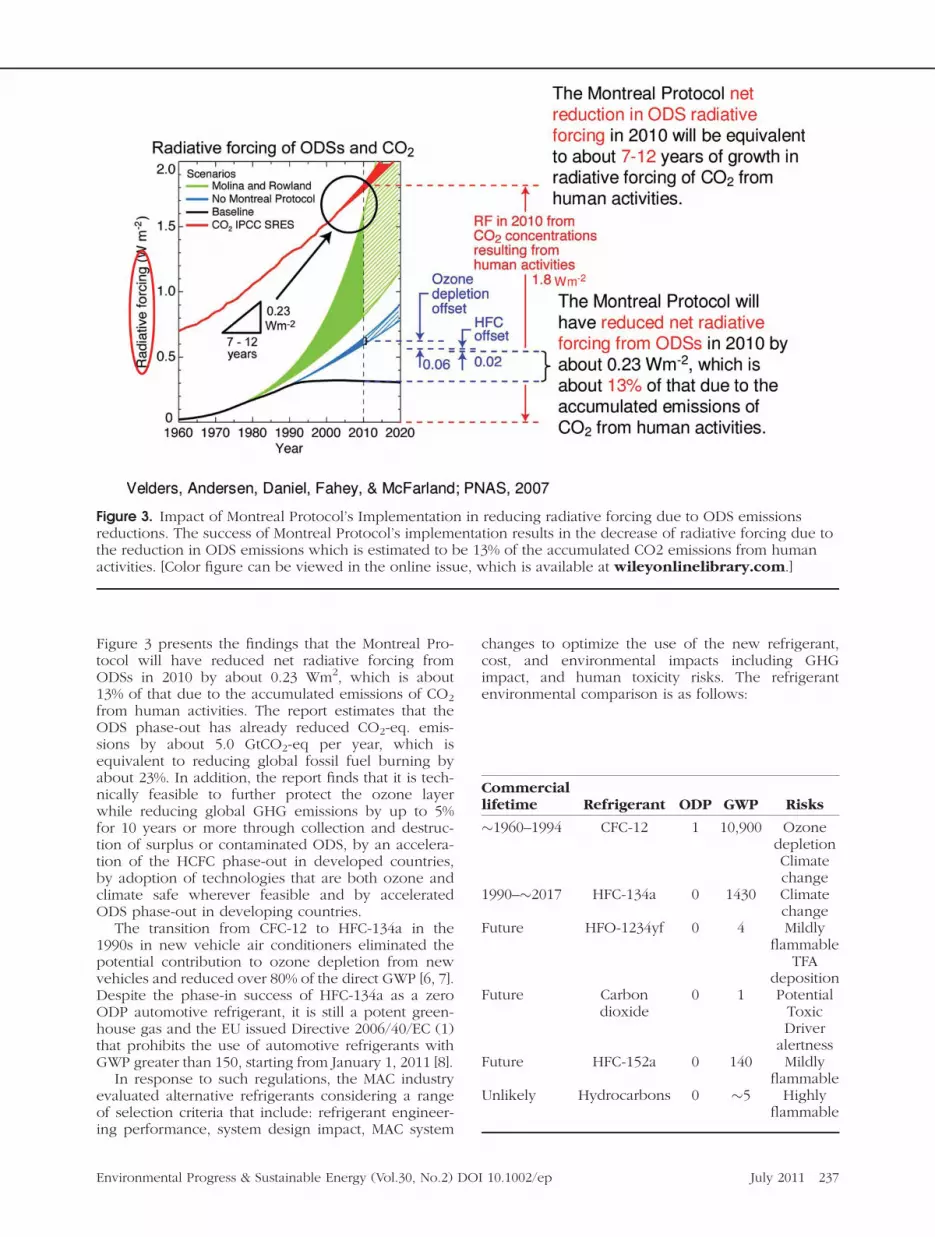
Figure 3 presents the findings that the Montreal Pro-tocol will have reduced net radiative forcing fromODSs in 2010 by about 0.23 Wm2, which is about13% of that due to the accumulated emissions of CO2
from human activities. The report estimates that theODS phase-out has already reduced CO2-eq. emis-sions by about 5.0 GtCO2-eq per year, which isequivalent to reducing global fossil fuel burning byabout 23%. In addition, the report finds that it is tech-nically feasible to further protect the ozone layerwhile reducing global GHG emissions by up to 5%for 10 years or more through collection and destruc-tion of surplus or contaminated ODS, by an accelera-tion of the HCFC phase-out in developed countries,by adoption of technologies that are both ozone andclimate safe wherever feasible and by acceleratedODS phase-out in developing countries.
The transition from CFC-12 to HFC-134a in the1990s in new vehicle air conditioners eliminated thepotential contribution to ozone depletion from newvehicles and reduced over 80% of the direct GWP [6, 7].Despite the phase-in success of HFC-134a as a zeroODP automotive refrigerant, it is still a potent green-house gas and the EU issued Directive 2006/40/EC (1)that prohibits the use of automotive refrigerants withGWP greater than 150, starting from January 1, 2011 [8].
In response to such regulations, the MAC industryevaluated alternative refrigerants considering a rangeof selection criteria that include: refrigerant engineer-ing performance, system design impact, MAC system
changes to optimize the use of the new refrigerant,cost, and environmental impacts including GHGimpact, and human toxicity risks. The refrigerantenvironmental comparison is as follows:
Figure 3. Impact of Montreal Protocol’s Implementation in reducing radiative forcing due to ODS emissionsreductions. The success of Montreal Protocol’s implementation results in the decrease of radiative forcing due tothe reduction in ODS emissions which is estimated to be 13% of the accumulated CO2 emissions from humanactivities. [Color figure can be viewed in the online issue, which is available at wileyonlinelibrary.com.]
Commerciallifetime Refrigerant ODP GWP Risks
�1960–1994 CFC-12 1 10,900 OzonedepletionClimatechange
1990–�2017 HFC-134a 0 1430 Climatechange
Future HFO-1234yf 0 4 Mildlyflammable
TFAdeposition
Future Carbondioxide
0 1 PotentialToxicDriver
alertnessFuture HFC-152a 0 140 Mildly
flammableUnlikely Hydrocarbons 0 �5 Highly
flammable
Environmental Progress & Sustainable Energy (Vol.30, No.2) DOI 10.1002/ep July 2011 237

Although European f-gas Directive targets directrefrigerant global warming emissions by focusing ona minimum 10-fold decrease in GWP values of newrefrigerants, a maximum environmental benefit to cli-mate can be realized only when a systems approachtakes into consideration both the direct climateimpact of alternative refrigerants due to their leaksinto the atmosphere and also the additional indirectclimate impacts from the incremental fuel consump-tion to operate the MAC systems.
The Global Refrigerants Energy & Environmental-Mobile Air Conditioning-Life Cycle Climate Perform-ance (GREEN-MAC-LCCP)� model is the tool thatevaluates the climate impacts of alternative refriger-ants. The premise of this tool is to provide a superiorbasis for engineers and policy makers to make wisedecisions of alternative competing technologies. Carssold in both developed and developing countries areequipped with MACs. In 2008, the global fleet in thedeveloped countries was equipped with MACs on av-erage by 95% and that in the developing countries by80%. It is expected that by 2020 about 95% of theentire global fleet will have MACs as standard equip-ment. Driving customer preferences, in terms of totalvehicle-travel-miles (VTMs), and various climatic con-ditions have a significant impact on the additionalfuel consumption during MAC operation throughoutthe year.
Using GREEN-MAC-LCCP�, we estimate that MACsaccounts for 7–20% of additional fuel consumptionrunning with HFC-134a. Similar conclusions werealso found in a previous study that was based onlyon thermal comfort modeling and the desire of carpassengers to turn on the air conditioning duringdriving throughout the year [9].
THE HISTORY OF REFRIGERANT CHOICE FOR VEHICLEAIR CONDITIONERS
When mechanical refrigeration became available inthe 1920s, entrepreneurs rapidly commercialized sys-tems with a wide variety of refrigerants, includingcarbon dioxide, water, ammonia, isobutane, sulfurdioxide, and methyl chloride (carbon dioxide, water,ammonia, and isobutane have recently been ‘‘redis-covered’’ and designated by proponents as ‘‘naturalrefrigerants’’). Mechanical refrigeration was vastlysuperior to ice, which was increasingly contaminatedand did not always assure safe temperatures for foodrefrigeration. However, leaks of the most commonrefrigerants of the 1920s-sulfur dioxide and ammonia-typically required rapid evacuation of homes andbuildings. People who came into contact with those
substances suffered from vomiting, burning eyes, andpainful breathing. Accidents with sulfur dioxide andammonia rarely resulted in death, but accidents withmethyl chloride refrigerant were frequently fatal [2].In 1928, Thomas Midgley, working with Albert Henneand Robert McNary at General Motors Research Labo-ratory, invented CFCs [10]. CFCs proved to be non-flammable, nonexplosive, noncorrosive, low toxicity,and odorless chemicals with vapor pressures andheats of vaporization that made them very goodrefrigerants. General motors patented the family ofCFCs and formed a joint stock company with DuPontto manufacture and market them [2]. Soon, CFCs andHCFCs rapidly replaced ice and toxic and flammablerefrigerants in most applications.
Automobile air conditioning was commercializedfirst in the United States and at an increasing pacehas achieved high market penetration in all marketsworldwide. By 1995, 2000, and 2008, vehicle air con-ditioning was standard equipment on almost all carssold in the United States, Europe, and India respec-tively. Table 1 and Figure 4 show that the vehiclefleet is rapidly growing, particularly in developingcountries, and that air conditioning will soon bestandard equipment on all four-wheel cars sold in allmarkets [11, 12]. The data clearly shows that automo-tive A/C penetration around the world follows asteep growth.
CFC-12 was the refrigerant of choice for new ve-hicle air conditioning which became widely avail-able in the 1960s. Then, in 1974, Mario Molina andF. Sherwood Rowland-building on the work of manyscientists including Paul Crutzen who shared their1995 Nobel Prize-warned that CFCs deplete the strat-ospheric ozone layer that protects life on earth fromharmful ultraviolet radiation [13]. In the next twodecades, the Molina-Rowland hypothesis was scien-tifically verified; the 1987 Montreal Protocol wassigned, ratified, and entered into force; and CFC,HCFC, and other ODS production was scheduled tobe halted in developed countries and eventually indeveloping countries [2]. When the Montreal Proto-col was agreed in 1987, there was no time to waitfor new technology. Stratospheric ozone depletionthreatened life on earth with skin cancer, cataracts,suppression of the immune system, destruction ofagricultural and natural ecosystems and other unima-ginable consequences. ODS replacements had to befound immediately. Hydrocarbon natural refrigerantswere quickly proposed to replace CFCs, but the typ-ical leak rates and service venting practices wouldhave been unsafe. Additionally, no one knew for
Table 1. Market penetration of mobile air conditioning in world regions.
North America Europe Japan India China and other
First vehicles 1940s 1950s 1950s 1950s 1970sCommercial Success 1950s 1960s 1960s 1970s 1980sHigh market penetration 1970s 1980s 1980s 2000s 2000sStandard Equipment 1990s 1990s 1990s 2010 2010
238 July 2011 Environmental Progress & Sustainable Energy (Vol.30, No.2) DOI 10.1002/ep

sure how quickly technology could be implementedto mitigate flammability. Other natural refrigerantswere proposed, but they required further study andtechnological innovation. Meanwhile, the fluorocar-bon chemical industry and their refrigerant custom-ers moved rapidly to market existing HCFC-22 andHCFC-142b to replace CFCs, to commercialize HFC-134a to replace CFC-12, and to commercializeHCFC-123 to replace CFC-11. HFC-134a and HCFC-123 had been identified decades earlier andpatented in the 1970s [2]. By the time Lorentzen andPettersen [14] filed for their first modern patent forcarbon dioxide MAC systems in 1989 (granted in1993), this technology was too late to capture anyof the market for the CFC phase-out. Major industrysupport hastened the transition from CFC to HFCrefrigerants. The MAC sector was first in 1988 toagree to recover and recycle refrigerant and was thefirst in 1990 to announce plans to replace CFC-12with HFC-134a [2]. The early MAC commitment toHFC-134a gave chemical manufacturers the confi-dence to invest in full scale production, even beforetoxicity testing and government approval was com-pleted [15]. HFC-134a was quickly embraced byother refrigeration and air conditioning applicationsbecause it was similar to CFC-12, nonflammable,nontoxic, proven compatible with specific lubricants,competitively priced and widely available. Coca-Cola, the world’s largest customer for refrigeratorcases and vending machines, also made an earlyworldwide commitment to HFC-134a, which encour-aged their suppliers in both developed and develop-ing countries to take ozone layer protection seri-ously and to move quickly with the CFC-12 phase-out [15, 16].
1995 AND CONTINUING: NATURAL REFRIGERANTSSTAGE A COME-BACK
Natural refrigerants staged a come-back in the1990s. In 1992, Greenpeace inspired European gov-ernment, industry, and consumer support for the useof hydrocarbons in domestic refrigerators [16]. Within1 year a hydrocarbon domestic refrigerator was intro-duced in Germany, and it rapidly penetrated andexpanded across the market. Soon hydrocarbonrefrigerators gained market dominance in Europe andpenetrated markets in Asia, including Japan. Mean-while, suppliers of equipment using ammonia as anatural refrigerant recaptured market share fromHCFC cold storage and food freezing. They alsomade limited progress in applying ammonia to com-mercial refrigeration and air conditioning using sec-ondary loops for safety. At the same time, Europeanresearchers with the support of European vehiclemanufacturers-particularly the German automobilemanufacturers-pursued carbon dioxide for use in mo-bile air conditioners [17].
Despite their comeback, natural refrigerants stillfaced stiff competition at the turn of the millennium.Although companies in developed countries hadhalted the use of CFC refrigerants in new equipmentby 2000, there were still plenty of CFC refrigerantsaround. Refrigerant stockpiles and recycling providedan ample CFC supply for service of CFC equipment,as did a conspicuous illegal trade in Europe andNorth America. Some equipment was retrofit fromCFCs to HCFCs or to HFCs, but new equipment pro-vided energy savings that made retrofit financiallyand environmentally unattractive by comparison. InAustralia and elsewhere, some MACS were retrofit touse hydrocarbon despite the opposition of vehicle
Figure 4. Historic data of A/C penetration in different world regions. [Color figure can be viewed in the onlineissue, which is available at wileyonlinelibrary.com.]
Environmental Progress & Sustainable Energy (Vol.30, No.2) DOI 10.1002/ep July 2011 239

manufacturers and service associations (and despitethe findings by the US EPA that CFC MAC systems areunsuitable for retrofit to hydrocarbons because ofhigh leak rates, potentially unreliable aging parts, andthe absence of systems to mitigate fire risk) [IPCC,2005 p. 310]. HCFC refrigerants were also pervasivein 2000 because Montreal Protocol controls on HCFCwere years away and most countries had not sched-uled aggressive early phase-out. Today, natural refrig-erants compete favorably against fluorocarbon refrig-erants in refrigerators and other small refrigeratedappliances, in industrial and commercial refrigerationand air conditioning in markets where HFCs are re-stricted, and in an increasing variety of applicationsand systems. Refrigerants proposed to replace thosescheduled for phase-out under the Montreal Protocolmust undergo EPA Significant New Alternatives Pro-gram (SNAP) review (U.S. EPA, 2006). The US EPAhas listed R-152a (HFC-152a) as acceptable and isnow in the final stage of evaluating R-1234yf and car-bon dioxide. No vehicle manufacturer has expressedan interest in hydrocarbon refrigerants.
LIFE CYCLE CLIMATE PERFORMANCE: EVOLUTION AND HISTORY
During the shift away from CFCs policy makers,public interest organizations, and companies workedhard to select alternatives and substitutes with thelowest possible environmental impact. In additionalto the direct impact due to refrigerant emissions, peo-ple started to relate the indirect effects to climate dueto the greenhouse gases emitted from the fuel com-bustion to run the equipment. The first comprehen-sive analysis to quantify both the direct and indirecteffects of CFCs and their proposed substitutes wasdone by the Alternative Fluorocarbons EnvironmentalAcceptability Study (AFEAS) and the U.S. Departmentof Energy in the early 1990s. The study estimates thetotal equivalent CO2 emissions from alternatives andsubstitutes to CFCs [18] considering: (a) the GWP ofCFCs when released into the atmosphere, so calledGWP (direct) contribution, and (b) their indirectimpact, GWP (indirect), expressed as the totalamount of CO2 released from the operation of theappliance during its lifetime. The AFEAS study intro-duced the concept of Total Equivalent WarmingImpact (TEWI), which is a metric that accounts forthe sum of the direct refrigerant and indirect GWPcontributions of any CFC, HFC, or HCFC [18, 19]. TheTEWI is expressed by Eq. 1:
TEWI ¼ GWP ðDirectÞ þ GWP ðIndirectÞ (1)
In 1997, Papasavva and Moomaw [20] advancedand expanded the TEWI concept into the Life CycleWarming Impact (LCWI) term, as expressed by Eq. 2:
LCWI ¼ TEWI þ GWP ðtransportÞþ GWP ðchemical productionÞ
þ GWP ðatmospheric breakdown productsÞ ð2Þ
Comprehensive LCA was promoted by Stephen O.Andersen in the 1999 report of the Montreal Protocol
Technology and Economic Assessment Panel (TEAP).TEAP coined the phrase ‘‘Life Cycle Climate Perform-ance (LCCP).’’ Although LCWI and LCCP were intro-duced as the most complete and comprehensive met-rics to guide policy decision, there were no engineer-ing models available. In 2003, Papasavva and Hill [21]at General Motors developed their first LCCP model,that in 2005 became the basis for the SAE Interna-tional Internal Climate Control Committee workinggroup they chaired with the goal of developing anddisseminating the model for public use. The LCCPharmonization activity was opened to the entire auto-motive industry in 2006 with strong participation ofSAE International, VDA (German Association of theAutomotive Industry), and JAMA. Papasavva and Hill,with a global team of 50 world experts from 32industry, governmental and nongovernmental organi-zations, national laboratories, and academia-perfectedand continuously improved their GM LCCP model,with input and data from automobile manufacturersand suppliers and by including state-of-the-art cabincomfort conditions using modeling results obtainedfrom the NREL [22]. GREEN-MAC-LCCP� uses globallyharmonized data and assumptions, and provides amore realistic application of the engineering dataobtained from bench tests because it applies them tovarious driving cycle engine conditions.
GREEN-MAC-LCCP� is the first life cycle analysistool available that was developed based on inputdata harmonized by the industry [23]. It has beenglobally peer reviewed by the international expertsand approved. Because of its transparency, flexibility,accuracy in predicting the life cycle GHG impact ofalternative refrigerants and user friendly interface ithas become the global standard methodology forassessing the climate impact of MAC systems and thestandard document, SAE J2766, is now also available[24]. SAE J2766 is likely to be the global standard formeasuring climate performance for vehicle AC regula-tions and possibly for quantifying GHG emissions incarbon trading. The model is hosted on the USEPAClimate Protection Partnership Division website,which sponsors the Mobile Air Conditioning ClimateProtection Partnership, (www.epa.gov/cppd/mac)and it is free for access and public use.
GREEN-MAC-LCCP�—MODEL FRAMEWORK
The GREEN-MAC-LCCP� model is a sophisticatedaccounting of the expected life-cycle climate impacts,of any MAC system. The model consists of manyinterlinked spreadsheets of data required to run themodel and it estimates the LCCP CO2-eq. emissionsassociated with the production, use and disposal ofalternative refrigerants and MAC components. Most ofthe input data are fixed based on the harmonizationprocess. This prevents manipulation of the modelingprocess to influence results to benefit a particulartechnology and makes sure that comparisons are fair.Only a small amount of input data is required to runthe model, which are unique to each refrigerant suchas its GWP value, its system efficiency etc. The modelaccounts for all the direct and indirect emissions ofany MAC system using Eq. 3:
240 July 2011 Environmental Progress & Sustainable Energy (Vol.30, No.2) DOI 10.1002/ep
LCCP ¼ GWP½Direct from MAC leaks�þ GWP½Direct from additional sources :
ðatmospheric reaction products of refrigerantÞþ ðmanufacturing, transport& service leakageÞþ ðEOL refrigerant emissionsÞ�þ GWP½Indirect from MAC operation�þ GWP½Indirect from additional sources :
ðchemical production of refrigerant and transportÞþ ðMAC manufacturing& its vehicle assemblyÞ
þ ðEOL recycling processesÞ� ð3Þ
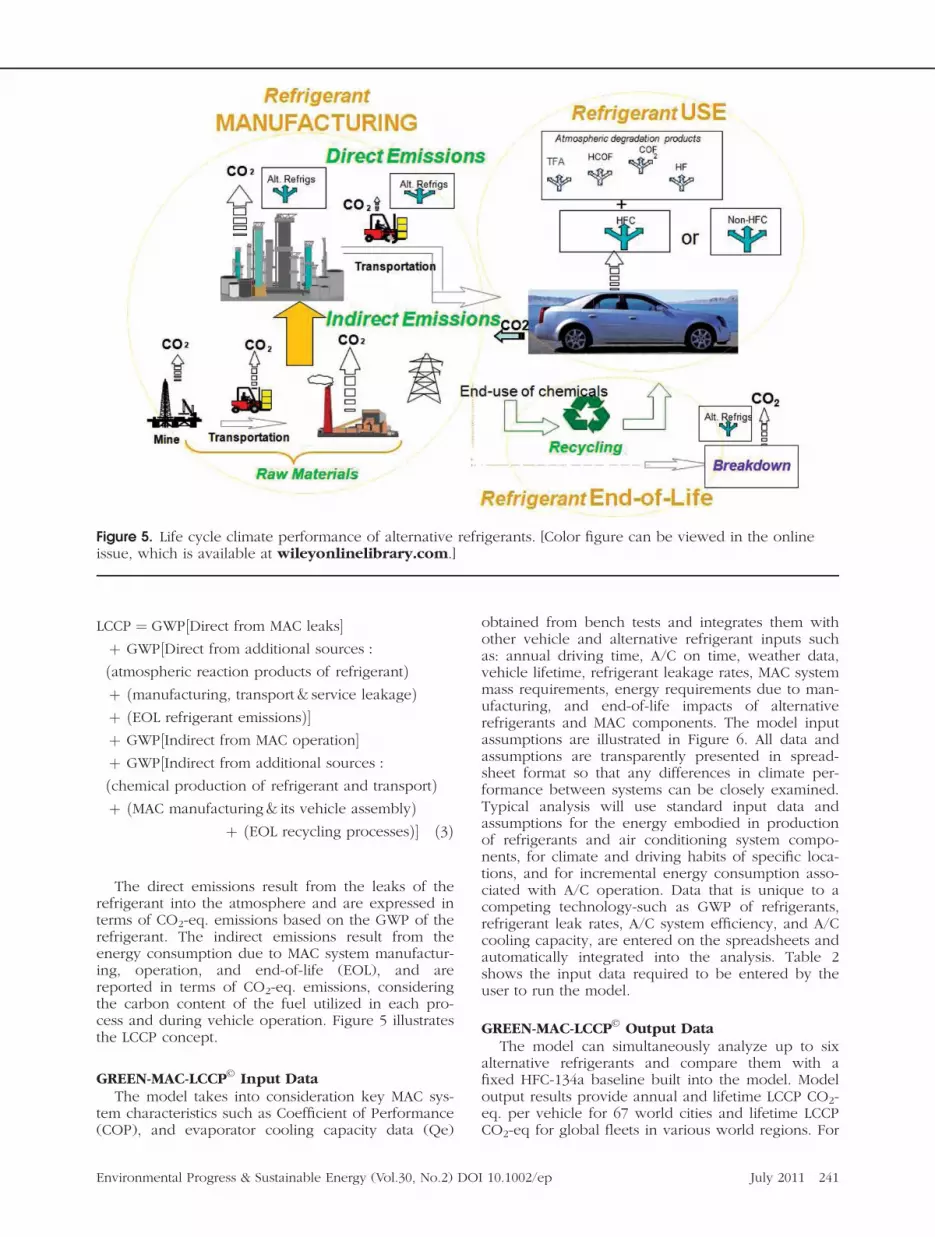
The direct emissions result from the leaks of therefrigerant into the atmosphere and are expressed interms of CO2-eq. emissions based on the GWP of therefrigerant. The indirect emissions result from theenergy consumption due to MAC system manufactur-ing, operation, and end-of-life (EOL), and arereported in terms of CO2-eq. emissions, consideringthe carbon content of the fuel utilized in each pro-cess and during vehicle operation. Figure 5 illustratesthe LCCP concept.
GREEN-MAC-LCCP� Input DataThe model takes into consideration key MAC sys-
tem characteristics such as Coefficient of Performance(COP), and evaporator cooling capacity data (Qe)
obtained from bench tests and integrates them withother vehicle and alternative refrigerant inputs suchas: annual driving time, A/C on time, weather data,vehicle lifetime, refrigerant leakage rates, MAC systemmass requirements, energy requirements due to man-ufacturing, and end-of-life impacts of alternativerefrigerants and MAC components. The model inputassumptions are illustrated in Figure 6. All data andassumptions are transparently presented in spread-sheet format so that any differences in climate per-formance between systems can be closely examined.Typical analysis will use standard input data andassumptions for the energy embodied in productionof refrigerants and air conditioning system compo-nents, for climate and driving habits of specific loca-tions, and for incremental energy consumption asso-ciated with A/C operation. Data that is unique to acompeting technology-such as GWP of refrigerants,refrigerant leak rates, A/C system efficiency, and A/Ccooling capacity, are entered on the spreadsheets andautomatically integrated into the analysis. Table 2shows the input data required to be entered by theuser to run the model.
GREEN-MAC-LCCP� Output DataThe model can simultaneously analyze up to six
alternative refrigerants and compare them with afixed HFC-134a baseline built into the model. Modeloutput results provide annual and lifetime LCCP CO2-eq. per vehicle for 67 world cities and lifetime LCCPCO2-eq for global fleets in various world regions. For
Figure 5. Life cycle climate performance of alternative refrigerants. [Color figure can be viewed in the onlineissue, which is available at wileyonlinelibrary.com.]
Environmental Progress & Sustainable Energy (Vol.30, No.2) DOI 10.1002/ep July 2011 241

each city, the user can select among three differenttype of vehicles, small, midsize, SUV, and four alter-native fuels, gasoline, diesel, ethanol, and methanol.The model is also flexible to analyze LCCP GHGemissions from global fleets running with A/C on, atany given year during 2008–2017. The model allowsthe user to enter COP and evaporator coolingcapacity data obtained by any laboratory bench-testexperimental set-up. A global OEM effort [25] cameto consensus that bench-test results are the most reli-able source for A/C system energy consumption. Thisglobal effort was established and conducted throughthe auspices of the SAE Strategic Alliance (SSA), andthe SAE ICCC starting in 2001. The MAC industryexperts, who have established the global bench-test-ing of alternative refrigerants, have also participatedin the LCCP harmonization activity.
The GREEN-MAC-LCCP� team welcomes new dataand will continue to improve the model. However,based on the extensive process that has been con-ducted to obtain the best possible framework anddata for this model, we are confident that the currentversion of the GREEN-MAC-LCCP� model is the bestavailable tool for evaluating lifecycle greenhouse gasemissions from MACs.
GREEN-MAC-LCCP�—RESULTS AND DISCUSSION
GREEN-MAC-LCCP�-Version 3b is implemented toestimate the LCCP CO2-eq. emissions of those pro-posed alternative refrigerants that are currently con-sidered by MAC industry worldwide as potential via-ble options, R-1234yf (also referenced by chemistsas HFC-1234yf, or HFO-1234yf and soon to be com-mercially referred to as R-1234), and R-744 and wecompare these results with those obtained with thebaseline R-134a MAC systems. We run the modelconsidering the global vehicle fleet consisting ofsmall vehicles (like the Opel Corsa type vehicle), inyear 2017. The projected vehicle registration data in2017 are estimated using 2008 available vehicleregistration data and projected vehicle sales for eachyear during 2008 and 2017 [26, 27]. Projected state-wide vehicle registrations are estimated using therecursion Eq. 4:
Vehicleiþ 1 ¼ Vehiclei þ Salesiþ 1 � Scrapi (4)
where Vehiclei11 and Vehiclei are statewide registra-tions in CYi11 and i respectively, Salesi11 are state-wide projected car and truck sales [26] in CYi11 andScrapi is the number of vehicles scrapped in CY i.
Figure 6. GREEN-MAC-LCCP� model input assumptions. Note: SUV stands for sport utility vehicle. The enginetypes, L4, V6, and V8, indicate the number of cylinders found in each engine. For example V6 is a V-shapedengine with six cylinders. [Color figure can be viewed in the online issue, which is available atwileyonlinelibrary.com.]
242 July 2011 Environmental Progress & Sustainable Energy (Vol.30, No.2) DOI 10.1002/ep

Table 2. Input data required to be introduced by the user into the model.
Input worksheetname in GREEN-MAC-LCCP� model Variable data Fixed data
Manufacturinginput sheet
1. Energy and CO2-equivalent emissionsto manufacture, recycle, andtransport the refrigerant
1. Life cycle analysis energy andCO2 emissions for manufacturingeach material found per MAC component
2. Mass of refrigerant leakageduring transportation
2. End-of-life CO2 emissions associatedwith recycling or disposal of eachMAC component
3. Material composition of eachMAC component (% rate of total mass)
4. Global warming potential (GWP)of atmospheric reaction products
5. Global warming potential (GWP)of refrigerant
6. Average leakage ratio to HFC-134a7. Refrigerant recycling during service8. Mass for each MAC component,
refrigerant charge mass,and lubricant mass
Leakage input sheet 1. Estimated loss before service 1. Regular leak emissions2. % Do-it-yourself 2. Irregular leak emissions
3. Number of services4. Refrigerant loss per service for
professional service5. Refrigerant loss from cylinder
heels for professional service6. Refrigerant loss per service for
DIYer service7. Refrigerant loss from can heels
for DIYer service8. End-of-life refrigerant emissions
without refrigerant capture9. End-of-life refrigerant emissions
with refrigerant capture10. Refrigerant emissions from
vehicle assembly
Capacity & COPinput sheets
1. Capacity and COP data from benchtests at 900, 1500, 2500, 4000 engineRPMs for T 5 158C, T 5 258C,T 5 358C, T 5 458C
1. Idle conditions weighting factor
2. COP and capacity data obtainedaccording to the test matrix includedin the model
2. Weighting factors for evaporatorconditions at T 5 38C and T 5 108C,evaporator outlet temperature
Drive-cycleinput sheet
1. Engine to compressor ratio 1. Alternator efficiency2. Engine RPMs from vehicle drive
cycle tests2. Belt efficiency3. Alternator/engine ratio4. Incremental engine efficiency
Fan power Fan power at each ambient temperatureincluded in the model at various speeds
Fuel data 1. Fuel consumption per unit mass2. Fuel heating value3. Fuel CO2 emissions per liter
fuel consumed
Environmental Progress & Sustainable Energy (Vol.30, No.2) DOI 10.1002/ep July 2011 243

Equation 4 is initiated with 2008 registration dataand we have assumed a 5% average scrap rate forthe US [11].
We consider the requirements of the f-Gas EU reg-ulation, which prohibits the use of HFC-134a in allnew type vehicles produced in 2011 and in allvehicles starting 2017 in the European Union.Because of the lack of specific vehicle data by newvehicle type produced between 2011 and 2017, andto maximize the benefits of the f-Gas regulation weassume that around the world all new vehicle salesbetween 2011 and 2017 are equipped with the newlow GWP alternative refrigerant. Thus, the total vehi-cle fleet in 2017 will have a mix of vehicles equippedwith HFC-134a produced before 2011 and vehiclesequipped with the new alternative refrigerant pro-duced and sold around the world beginning January1, 2011.
The results indicate that R-1234 is a better alterna-tive to R-744 when applied worldwide. The R-744system with today’s technology is less efficient thanthe existing HFC-134a baseline systems when oper-ated in warmer climates of Asia and South America.In the cooler climates of Northern Europe, both R-1234 and R-744 are better than HFC-134a. However,the largest vehicle growth in the 2010s will take placein China and India where the climatic conditions areusually warmer on average than North America orEurope, as illustrated in Figure 7. As a result, the cur-
rent R-744 technology is not favorable to reduce CO2-eq. emissions in the future but the R-1234 as a drop-in refrigerant replacement shows benefits. We esti-mate that R-1234 has the potential to reduce CO2-eq.emissions by about 7% in 2017 compared to the base-line, whereas R-744 is associated with slightly higherby about 2% emissions as compared to the currentHFC-134a baseline systems. These results are pre-sented in Figure 8.
The LCCP results presented in Figure 8 are basedon proprietary bench test results for COP and Qethat represent a small vehicle. We have also con-ducted an LCCP assessment of various alternativeMAC technologies for a midsize sedan [28] and founda similar trend as that shown in Figure 8. Thus, thetype of the vehicle does not affect the choice ofrefrigerants assuming current technology. Theseresults indicate that a chemical compound with lowGWP must also demonstrate desirable thermody-namic properties to exhibit the maximum benefits tothe environment. In [27], we also provide results ofvarious sensitivity analyses performed with respect tovarious vehicle electronic climate control settings,impact of internal heat exchanger, increase of refrig-erant leak rates, and impact of vehicle size to LCCPCO2-eq. emissions. As expected, the results indicatean increase in the absolute LCCP CO2-equivalentemissions for each city as the vehicle gets bigger.The impact of vehicle controls that adjust vehicle
Table 2. (Continued).
Input worksheetname in GREEN-MAC-LCCP� model Variable data Fixed data
Climate data 1. % Drive time at ambient during6 a.m.–24 p.m. for each city
2. Annual average temperature per city3. Driving distance per city4. Driving time per city5. Vehicle lifetime per city6. % time A/C is on per each bin
included in the model and pereach city—manual A/C system
7. % time A/C is on per each binincluded in the model and per eachcity—automatic A/C system
8. Solar conditions per each city andper temperature bin includedin the model
9. Relative Humidity per each cityand per temperature bin includedin the model
10. Relative humidity correction usingRelative humidity data from testsand city conditions
Global vehicleregistrations
1. Vehicle scrap rate2. Vehicle sales3. Vehicle registrations4. % A/C penetration per city
244 July 2011 Environmental Progress & Sustainable Energy (Vol.30, No.2) DOI 10.1002/ep

comfort at a cooler or warming cabin temperatureshow a great sensitivity in the results as expecteddue to more fuel consumption to keep the vehiclecabin at a cooler temperatures.
We have also conducted a comparative study withFiat automotive [29] that compares the majority of themodel input parameters shown in Table 2, with thoseconsidered by Fiat’s modeling approach using MACfuel consumption obtained from vehicle laboratorytesting facilities. It is noteworthy to mention that allclimate and driving input data as well as the refriger-ant leak rates are in excellent agreement between thetwo methods. A more detailed discussion of the out-put results is provided in [29].
We have also recently participated in a study thataddresses the atmospheric impact of R-1234 in termsof its atmospheric reactivity as a response to concernsof ground ozone and trifluoroacetic acid formation[27, 30], using emission inventory data estimated fromGREEN-MAC-LCCP�. The results of this study indicate
Figure 8. Comparison of LCCP CO2-eq emissions of alternative refrigerants in 2017 in various world regions.The results are based on a small, Opel Corsa type vehicle, equipped with a four cylinder gasoline engine, andassuming that the entire global fleet is running with small cars. The LCCP CO2-eq emissions are estimated byconsidering that each vehicle is equipped with HFC-134a MACs for vehicles in the fleet prior to 2011 and allnew vehicles produced after 2011 have the New MAC refrigerant system. [Color figure can be viewed in theonline issue, which is available at wileyonlinelibrary.com.]
Figure 7. Total midsize vehicle registrations in variousworld regions in 2008 and 2017. The 2008 vehicleregistrations are from [11]. The extrapolated vehicleregistrations for 2017 are estimated as explained inthe paper using data from [11, 26]. [Color figure canbe viewed in the online issue, which is available atwileyonlinelibrary.com.]
Environmental Progress & Sustainable Energy (Vol.30, No.2) DOI 10.1002/ep July 2011 245

that the additional formation of tropospheric ozone(smog) does not exceed 1% that formed from con-ventional vehicle exhaust emissions, which is easilyoffset by improved AC fuel efficiency. Automobile airconditioning HFO-1234yf emissions are predicted toproduce concentrations of TFA in Eastern U.S. rainfallat least two to five times the values currentlyobserved from all sources, natural and man-madewith peak concentrations in rainfall 80 times lowerthan the lowest level considered safe for the mostsensitive aquatic organisms [30]. TFA deposition canbe reduced by better containment of refrigerants andreduced emissions at service and vehicle end-of-liferecycling.
Although the LCCP CO2-eq emissions obtainedwith the current version of the model are encourag-ing, the model can be further enhanced with betterdata when become available. The authors will con-tinue to work on further model enhancements aswell as on more comparative studies similar to thoseconducted with Fiat automotive.
CONCLUSIONS
Despite the original focus of the Montreal Protocolto protect the ozone layer, its positive impact wasobserved beyond the stratosphere because of itsimpact to reducing global warming.
The GREEN-MAC-LCCP� model is the first globallyharmonized life cycle climate performance modelthat was developed to analyze the global warmingimpact of alternative refrigerants proposed as replace-ments to HFC-134a that is subject to the EC regula-tory ban beginning in 2011.
The results obtained by running the model usingbench test engineering data of COP and capacityfor various alternative refrigerants, indicate that R-1234 has the potential to reduce CO2-eq. emissionsby 7% in 2017 compared to the baseline, whereasR-744 is associated with slightly higher by 2% emis-sions as compared to the current HFC-134a baselinesystems.
ACKNOWLEDGMENTS
We are grateful for the comments, suggestions andfeedback received by William R. Hill Technical Fellowat General Motors HVAC, Elvis Hoffpauir PresidentMACS Worldwide, and Kristen Taddonio, Climate Pro-tection Partnerships Division U.S. EPA. This articleconveys the views of the authors and does not neces-sarily reflect the views of General Motors or the U.S.Environmental Protection Agency where they werepreviously employed.
NOMENCLATUREARCRP Alternate Refrigerant Cooperative
Research ProgramCFC chlorofluorocarbonCO2-eq. carbon dioxide equivalent emissionsCOP coefficient of performanceEU European UnionGHG greenhouse gasesGWP global warming potentialHFC hydrofluorocarbonsHFC-152a 1,1-difluoroethane, CH3CHF2
HFO-1234yf 2,3,3,3-tetrafluoropropene,CF3CF 5 CH2
ICCC Interior Climate Control CommitteeJAMA Japan Automobile Manufacturers
AssociationLCA life cycle analysisLCCP life-cycle climate performanceMAC mobile air conditioningNREL National Renewable Energy LaboratoryODS ozone depleting substancesR744 carbon dioxide refrigerant, CO2SAE Society of Automotive EngineersSUV sport utility vehicleTEWI total equivalent warming impactUSEPA Unites States Environmental Protection AgencyVDA Verband der Automobilindustrie
LITERATURE CITED
1. Molina, M.J., & Rowland, F.S. (1974). Stratosphericsink for chlorofluorinemethane: Chlorine atom-catalyzed destruction of ozone, Nature, 249, 810–812.
2. Andersen, S.O., & Sarma, K.M. (2002). Protectingthe ozone layer, London: Earthscan.
3. WMO (World Meteorological Organization).(2007). Scientific assessment of ozone depletion:2006, global ozone research and monitoring pro-ject (572 p), Report No. 50, Geneva, Switzerland.
4. Velders, G.J.M., Andersen, S.O., Daniel, J.S.,Fahey, D.W., & McFarland, M. (2007). The impor-tance of the Montreal Protocol in protecting cli-mate, Proceedings of National Academy of Sci-ence USA, 104, 4814–4819.
5. Velders, G.J.M., Fahey, D.W., Daniel, J.S., McFar-land, M., & Andersen, S.O. (2009). The large con-tribution of projected HFC emissions to future cli-mate forcing, Proceedings of National Academyof Science USA, 106, 10949–10954.
6. Solomon, S., Qin, D., Manning, M., Chen, Z.,Marquis, M., Averyt, K.B., Tignor, M., & Miller,H.L. (2007). IPCC Fourth Assessment Report, WG,Technical Summary, Cambridge University Press,United Kingdom and New York, NY. http://www.ipcc.ch/pdf/assessment-report/ar4/wg1/art4-wg1-spm.pdf.
7. Metz, B., Kuijpers, L., Solomon, S., Andersen,S.O., Davidson, O., Pons, J., de Jager, D., Keistin,T., Manning, M., & Meyer, L. (Eds.) (2005). IPCC/TEAP special report on safeguarding the ozonelayer and the global climate system: issues relatedto hydrofluorocarbons and perfluorocarbons,IPCC, London, UK: Cambridge University Press.
8. The European Parliament and the Council of theEuropean Union. (2006). Directive 2006/40/EC ofthe European Parliament and the Council of 17May 2006 relating to emissions from air-condi-tioning systems in motor vehicles and amendingCouncil Directive 70/156/EEC, Official Journal ofthe European Union, http://www.alliance-CO2-solutions.org/docs/Directive_200640EC.pdf.Last accessed February 2010.
9. Rugh, J., Hovland, V., & Andersen, S.O. (2004). Signif-icant fuel savings and emission reductions by improv-ing vehicle air conditioning. Presentation at the 15th
246 July 2011 Environmental Progress & Sustainable Energy (Vol.30, No.2) DOI 10.1002/ep
Annual Earth Technologies Forum and Mobile AirConditioning Summit, Washington, DC, April 15.
10. Kauffman, G.B. (1989). Midgley: saint or serpent?,Chemtech Magazine, 12, 717–725.
11. Ward’s Automotive Data, http://wardsauto.com/,Last accessed February 2010.
12. Chaney, L., Thundiyil, K., Chidambaram, S., &Abbi, P.Y. (2007). Fuel savings and emissionsreductions from next generation mobile air con-ditioning technology (MAC) in India, VTMS8 Pa-per, May 2007.
13. Rowland, F.S. (1997). Stratospheric ozone deple-tion: identifying the problem and the solution,ASHRAE Journal, 39, 29–31.
14. Lorentzen, G., & Pettersen, J. (1993). A new, effi-cient and environmentally benign system for carair-conditioning, International Journal of Refriger-ation, 16, 4–12.
15. Andersen, S., & Morehouse, T. (1997). The ozonechallenge: industry and government learned towork together to protect the environment, ASH-RAE Journal, 39, 29–31.
16. Greenpeace. (2006). Accomplishments in Canadaand around the globe, http://www.greenpeace.ca/e/about/history.php, Last accessed 17 Janu-ary 2005.
17. Andersen, S., & Zaelke, D. (2003). Industry ge-nius: inventions and people protecting the cli-mate and fragile ozone layer (pp. 53–79), UK:Greenleaf; and Intergovernmental Panel on Cli-mate Change. (2005). Safeguarding the ozonelayer and the global climate system (305 p),United Kingdom: Cambridge University Press.
18. Fischer, S.K., Hughes, P.J., Fairchild, P.D., Kusik,C.L., Dieckmann, J.T., McMahon, E.M., & Hobday,N. (1991). Energy and global warming impacts ofCFC alternative technologies, Arlington, VA: U.S.Department of Energy and AFEAS.
19. Personal Communication with Fischer at OakRidge, 1991.
20. Papasavva, S., & Moomaw, W.R. (1998). Life-cycleglobal warming impact of CFC-substitutes for re-frigeration, Journal of Industrial Ecology, 1, 71–91.
21. Hill, R.W., & Papasavva, S. (2005). Life cycle anal-ysis framework; a comparison of HFC-134a, HFC-134a enhanced, HFC-152a, R744, R744 enhanced,
and R290 automotive refrigerant systems, SAETechnical Series, Paper 2005–01-1511.
22. Johnson, V.H. (2002). Fuel used for vehicle airconditioning: a state-by-state thermal comfort-based approach, SAE Technical Series, Paper2002–01-1957.
23. Papasavva, S., Hill, R.W., & Brown, O.R. (2008).GREEN-MAC-LCCP�: A tool for assessing lifecycle greenhouse emissions of alternative refrig-erants, SAE Technical Series Paper 2008-01-0829.
24. Society of Automotive Engineers (SAE), InteriorClimate Control Committee (ICCC) Standard.(2009). Life cycle analysis to estimate the CO2-equivalent emissions from MAC operation, SAEJ2766, February.
25. SAE Alternate Refrigerant Cooperative ResearchProgram, Phase I March (2004). http://www.sae.org/standardsdev/tsb/cooperative/altsummary-ph1.pdf. Last accessed February2010.
26. Global Insight Data. http://www.globalinsight.com/ProductsServices/ProductDetail900.htm.Last accessed January 2009
27. Papasavva, S., Luecken, D.J., Waterland, R.L.,Taddonio, K.N., & Andersen, S.O. (2009).Estimated 2017 Refrigerant Emissions of 2,3,3,3-tetrafluoropropene (HFC-1234yf) in the UnitedStates resulting from automobile air conditioning,Environment Science and Technology, 43, 9252–9259.
28. Papasavva, S., Hill, W.R., & Andersen, S.O.(2010). GREEN-MAC-LCCP�: a tool for assessingthe life cycle climate performance of MAC systems,Environment Science Technology, submitted.
29. Papasavva, S., Monforte, R., & Hill, W.R. (2010).Comparison of GREEN-MAC-LCCP� based Indi-rect CO2-eq. Emissions from MACs and vehiclemeasured data, SAE Technical Series, Paper 2010-01-1208.
30. Luecken, D.J., Waterland, R.L., Papasavva, S.,Taddonio, K.N., Hutzell, W.T., Rugh, J.P., &Andersen, S.O. (2010). Ozone and TFA impactsin North America from degradation of 2,3,3,3-tet-rafluoropropene (HFO-1234yf), a potential green-house gas replacement, Environment Science andTechnology, 44, 343–348.
Environmental Progress & Sustainable Energy (Vol.30, No.2) DOI 10.1002/ep July 2011 247